Attached files
| file | filename |
|---|---|
| 8-K - FORM 8-K - Howmet Aerospace Inc. | d8k.htm |
| EX-99.1 - TRANSCRIPT OF ALCOA INC. FIRST QUARTER 2010 EARNINGS CALL - Howmet Aerospace Inc. | dex991.htm |
 Alcoa
Logo Alcoa Logo
1
st
Quarter 2010 Earnings Conference
April 12, 2010
1
Exhibit
99.2 |
 Alcoa
Logo Forward-Looking Statements
Today’s
discussion
may
include
“forward-looking
statements”
within
the
meaning
of
the
Private
Securities
Litigation
Reform
Act
of
1995.
Such
statements relate to future events and expectations and involve known
and unknown risks and uncertainties. Alcoa’s actual results or actions
may differ materially from those projected in the forward-looking
statements. For a summary of the specific risk factors that could cause
results to differ materially from those expressed in the forward-looking
statements, please refer to Alcoa’s Form 10-K for the year ended
December 31, 2009, and other reports filed with the Securities and
Exchange Commission.
2 |
 Alcoa
Logo Alcoa Logo
Chuck McLane
Executive Vice President and Chief Financial Officer
3 |
 Alcoa
Logo 1
st
Quarter 2010
Financial Overview
Continued benefits from Cash Sustainability Initiatives
COGS % Sales of 82.1%, SGA % Sales of 4.9%
EBITDA
of
$596
million
–
highest
since
Q3’08
Loss
from
continuing
operations
of
$194
million,
or
$0.19
per
share
–
Restructuring
and
special
items
total
$295
million,
or
$0.29
per
share
–
Net loss of $201 million, or $0.20 per share
Realized aluminum price up 8%; realized alumina price up 13%
Debt
to
Capital
of
38.1%,
down
60
basis
points
–
Total debt reduced to $9.75 billion; Cash on hand of $1.3 billion
4 |
 Alcoa
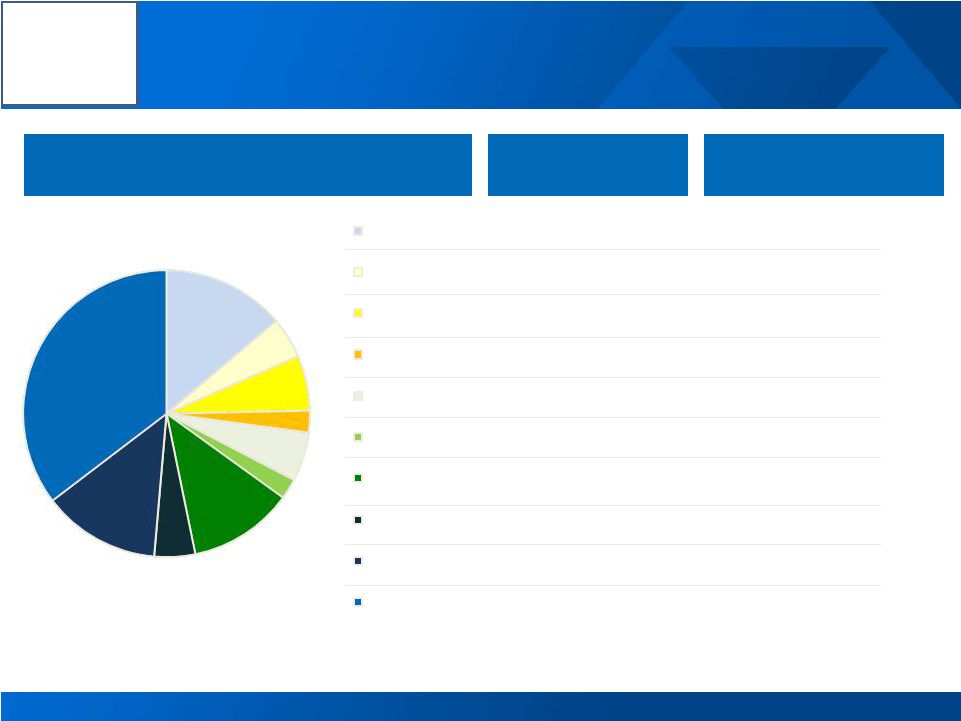
Logo Revenue Change by Market
0%
5%
(6%)
39%
34%
(21%)
(32%)
1%
(16%)
(10%)
(22%)
40%
(6%)
18%
58%
(36%)
(24%)
(18%)
48%
102%
1Q’10 Third Party Revenue
Sequential
Change
Year-Over-Year
Change
5
14%
5%
6%
2%
6%
2%
12%
5%
13%
35%
Aerospace
Automotive
B&C
Comm. Transport
Industrial Products
IGT
Packaging
Distribution/Other
Alumina
Primary Metals |
 Alcoa
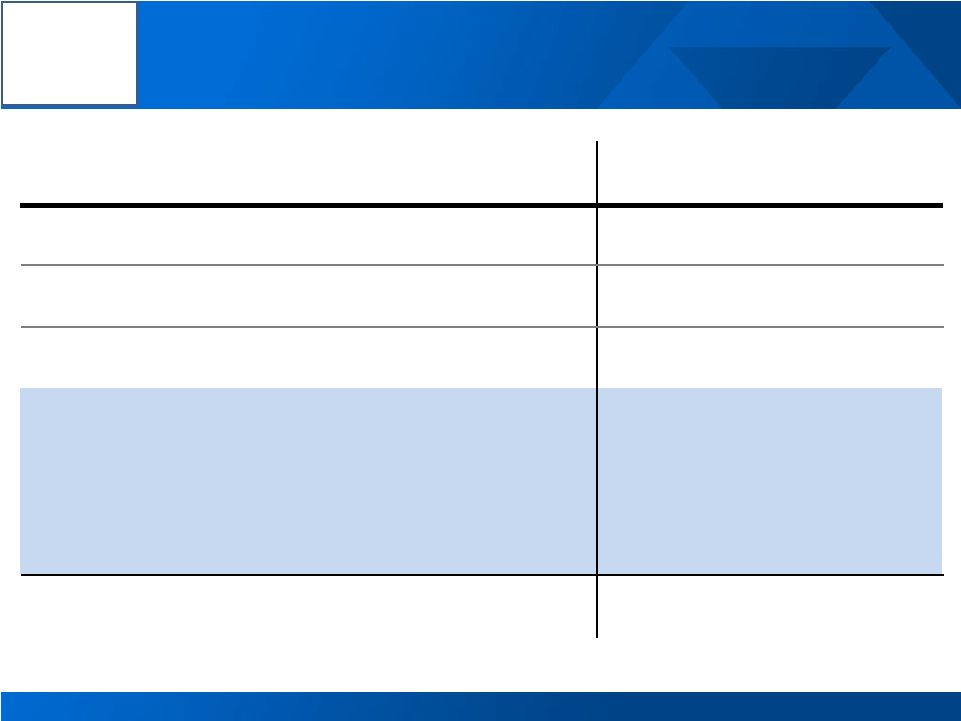
Logo Sequential Income Statement Summary
6
$ Millions
4Q’09
1Q’10
Change
Sales
$5,433
$4,887
($546)
Cost of Goods Sold
$4,905
$4,013
($892)
COGS % Sales
90.3%
82.1%
(8.2 % pts.)
Selling,
General Administrative, Other
$291
$239
($52)
SGA % Sales
5.4%
4.9%
(0.5 % pts.)
Restructuring and Other Charges
$69
$187
$118
Effective Tax Rate
34.8%
(95.5%)
N/A
Income (Loss) from Continuing Operations
($266)
($194)
$72
Income (Loss) from Discontinued Operations
($11)
($7)
$4 |
 Alcoa
Logo 7
1
st
Quarter Restructuring and Special Items
*Restructuring Related includes ($119) million of restructuring in the corporate
segment and ($5) million of closure related inventory in COGS in the Alumina
and Primary metal segments
$ Millions
After-Tax & Non-
Controlling Interests
Earnings
Per Share
Income Statement
Classification
Segment
Restructuring Related*
($124)
($0.12)
--
--
Discrete Tax Items
($112)
($0.11)
Taxes
Corporate
Special Items:
($59)
($0.06)
--
--
Mark
-to-Market Power Contracts
($31)
($0.03)
Other Income/Expense
Corporate
Power Outages
($17)
($0.02)
Revenue &
Cost
of Goods Sold
Alumina/Primary
Environmental Accrual
($11)
($0.01)
Cost of Goods Sold
Corporate
Total
($295)
($0.29) |
 Alcoa
Logo 1
st
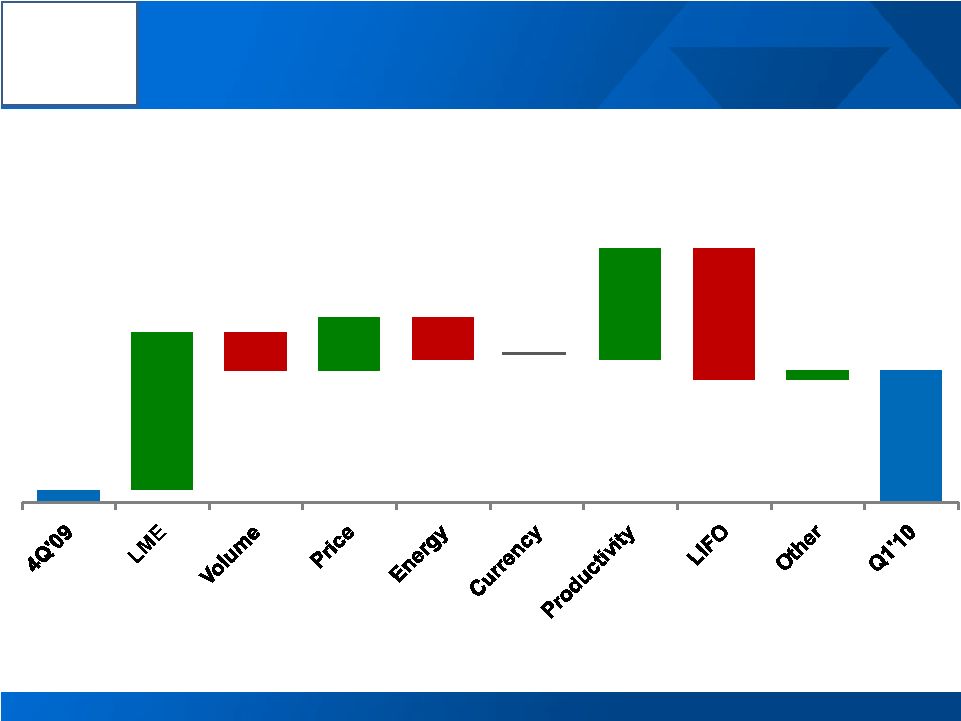
Quarter 2010 vs. 4th
Quarter 2009
Earnings Bridge
8
See appendix for reconciliation
$9
$121
($30)
$41
($33)
$0
$86
($101)
$8
$101
Income (Loss) from Continuing Operations excluding Restructuring & Other Special Items
($ millions) |
 Alcoa
Logo Sensitivity Summary
9
+/-
$100/MT = +/-
$200 million
LME Aluminum Annual Net Income Sensitivity
Currency Annual Net Income Sensitivity
+/-
10% versus USD
Australian $
+/-
$75 million
Brazilian $
+/-
$50 million
Euro €
+/-
$40 million
Canadian $
+/-
$35 million |
 Alcoa
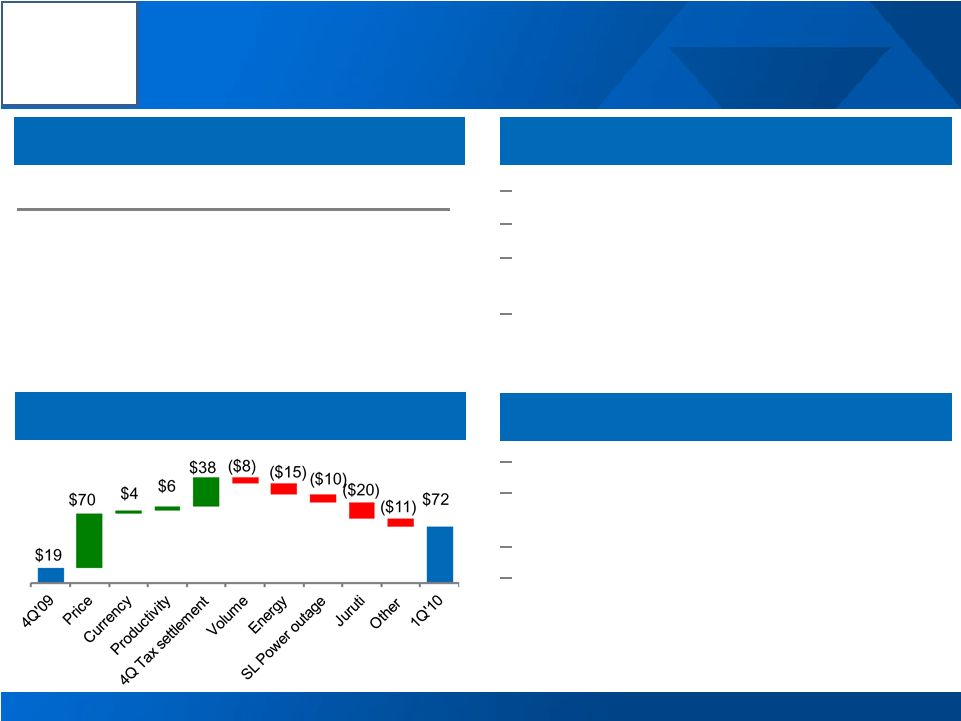
Logo Alumina
1
st
Quarter Highlights
2
nd
Quarter Outlook
1
st
Quarter Business Conditions
10
1Q 09
4Q 09
1Q 10
Production (kmt)
3,445
3,897
3,866
3
rd
Party Shipments (kmt)
1,737
2,716
2,126
3
rd
Party Revenue ($MM)
430
760
638
ATOI ($MM)
35
19
72
Realized 3rd party Alumina price up 13%
Cash sustainability initiative benefits
Sao Luis power outage negatively impacted cost by
$10 million
Higher
Juruti
costs
of
$20
million
Pricing to follow two month lag on LME
Continued benefits from cash sustainability
initiatives
Potential labor disruptions in Australia
Production projected to increase by 100 KMT
1
st
Quarter Performance Bridge
$ Millions |
 Alcoa
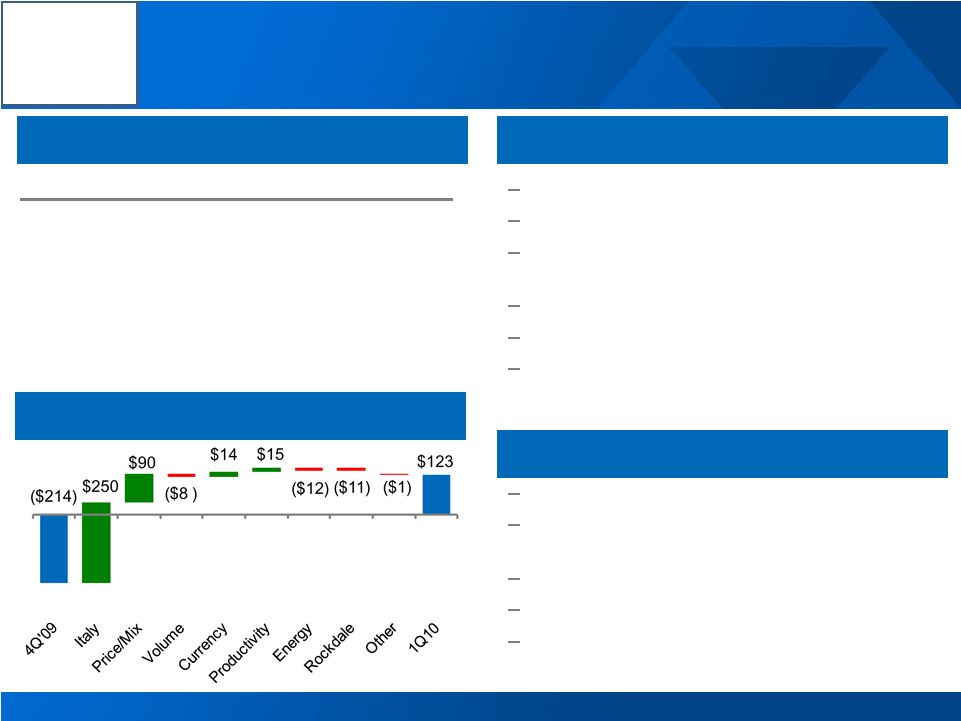
Logo Primary Metals
1
st
Quarter Highlights
1
st
Quarter Business Conditions
2
nd
Quarter Outlook
11
1Q 09
4Q 09
1Q 10
Production (kmt)
880
897
889
3
rd
Party Shipments (kmt)
683
878
695
3
rd
Party Revenue ($MM)
844
1,900
1,702
3
rd
Party Price ($/MT)
1,567
2,155
2,331
ATOI ($MM)
(212)
(214)
123
Realized pricing up 8%
Positive currency impact of $14 million
Non-recurrence of Q4 ‘09 non-cash charge
related to Italy power decision
Productivity improvement of $15 million
Higher power costs, particularly in Italy
Rockdale outage negatively affected quarter by
$ 11 million
Pricing to follow 15-day lag
Continued benefits from cash sustainability
initiatives
Rockdale power station running below capacity
US labor negotiations
Production equal to first quarter
1
st
Quarter Performance Bridge
$ Millions |
 Alcoa
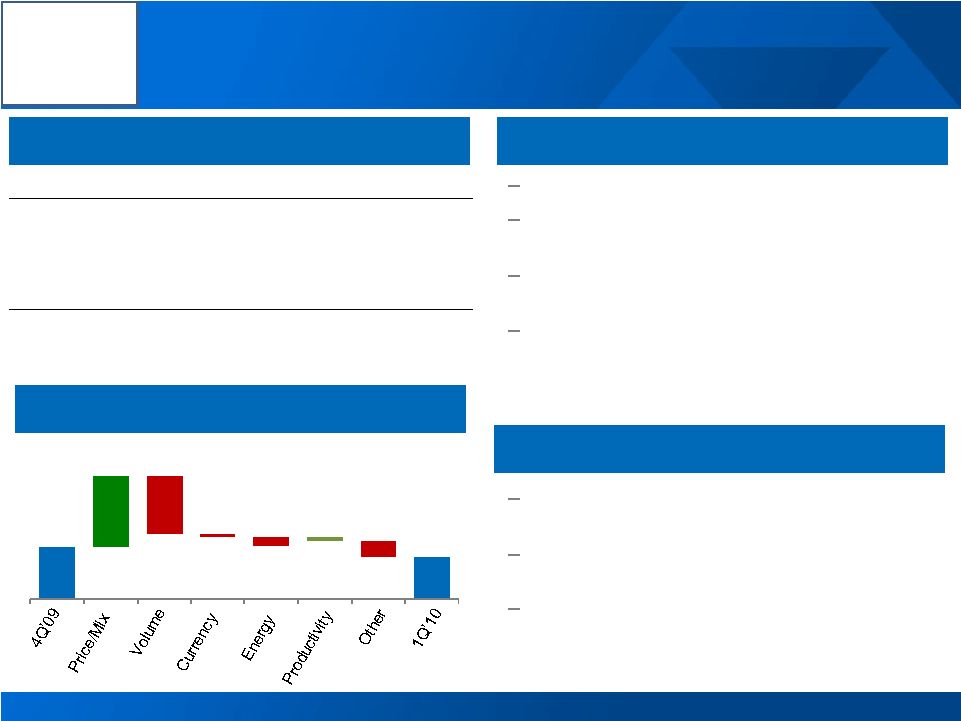
Logo Flat Rolled Products
12
2
Quarter
Outlook
1
Quarter
Business
Conditions
1
Quarter
Highlights
ATOI $ Millions
1Q 09
4Q 09
1Q 10
Global Rolled Products,
excl Russia, China & Other
3
63
47
Russia, China & Other
(64)
(26)
(17)
Total ATOI
(61)
37
30
Improved mix and pricing across every region
Decision to curtail sales in RPD drove lower
volumes
Gains from cash sustainability initiatives –
overhead reduction of 8% sequentially
Higher energy costs in North America and Russia
Continued benefits from cash sustainability
initiatives
Modest improvement in aerospace and industrial
markets
North American RPD volumes remain at low
levels
1
Quarter
Performance
Bridge
$ Millions
st
st
st
nd
$37
$50
( $41)
($2)
( $6)
$3
($11)
$30 |
 Alcoa
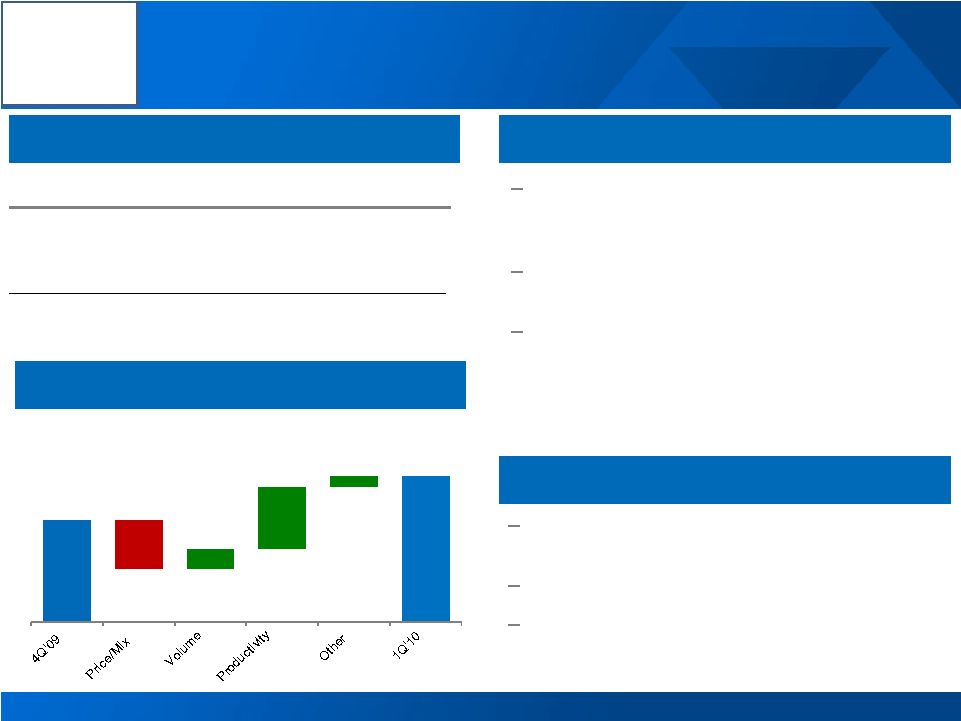
Logo Engineered Products and Solutions
1
st
Quarter Business Conditions
2
nd
Quarter Outlook
1
st
Quarter Highlights
13
ATOI % Sales equal to year ago quarter despite
$200M decline in sales driven by strong
performance in cash sustainability initiatives
Volume improvements in Commercial Transport
and Industrial Products markets
Continued downward pressure in IGT and
Building and Construction markets
Continued benefits from cash sustainability
initiatives
Market conditions show slight improvement
Aerospace destocking slowly coming to an end
$ Millions
1Q 09
4Q 09
1Q 10
3
rd
Party Revenue
1,270
1,097
1,074
ATOI
95
57
81
ATOI % of Revenue
7.5%
5.2%
7.5%
1
st
Quarter Performance Bridge
$ Millions
$57
($26)
$12
$34
$6
$81 |
 Alcoa
Logo 1
st
Quarter 2010 Cash Flow Overview
14
See appendix for free cash flow reconciliation
($ Millions)
1Q'09
4Q'09
1Q'10
Net Loss
(487)
($268)
($179)
DD&A
283
369
358
Change in Working Capital
351
522
(336)
Pension Contributions
(34)
(26)
(22)
Taxes / Other Adjustments
(384)
527
378
Cash From Operations
(271)
$1,124
$199
Dividends to Shareholders
(137)
(30)
(32)
Change in Debt
(305)
(286)
(42)
Dividends to Noncontrolling Interest
(77)
(47)
(72)
Contributions from Noncontrolling Interest
159
153
27
Other Financing Activities
863
0
(61)
Cash From Financing Activities
503
($210)
($180)
Capital Expenditures
(471)
(363)
(221)
Other Investing Activities
607
(137)
13
Cash From Investing Activities
136
(500)
(208) |
 We
Are Focused on Achieving Our 2010 Goals 15
Procurement reduction of $2.5 billion
Overhead reduction of $500 million
Capital expenditures of $1.25 billion
Days Working Capital reduction of 2 days
Driving Positive Free Cash Flow |
 Alcoa
Logo Alcoa Logo
Klaus Kleinfeld
President and Chief Executive Officer
16 |
 Alcoa
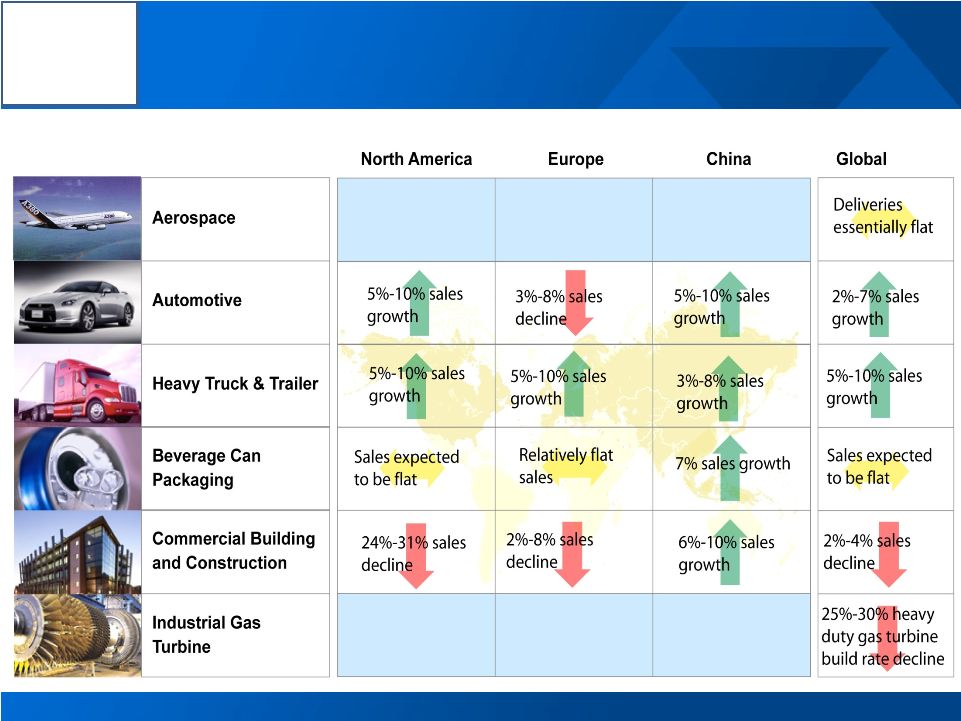
Logo Market Conditions in 2010
Alcoa End Markets: Current Assessment of 2010 vs. 2009 Conditions
Source: Alcoa analysis
17 |
 Alcoa
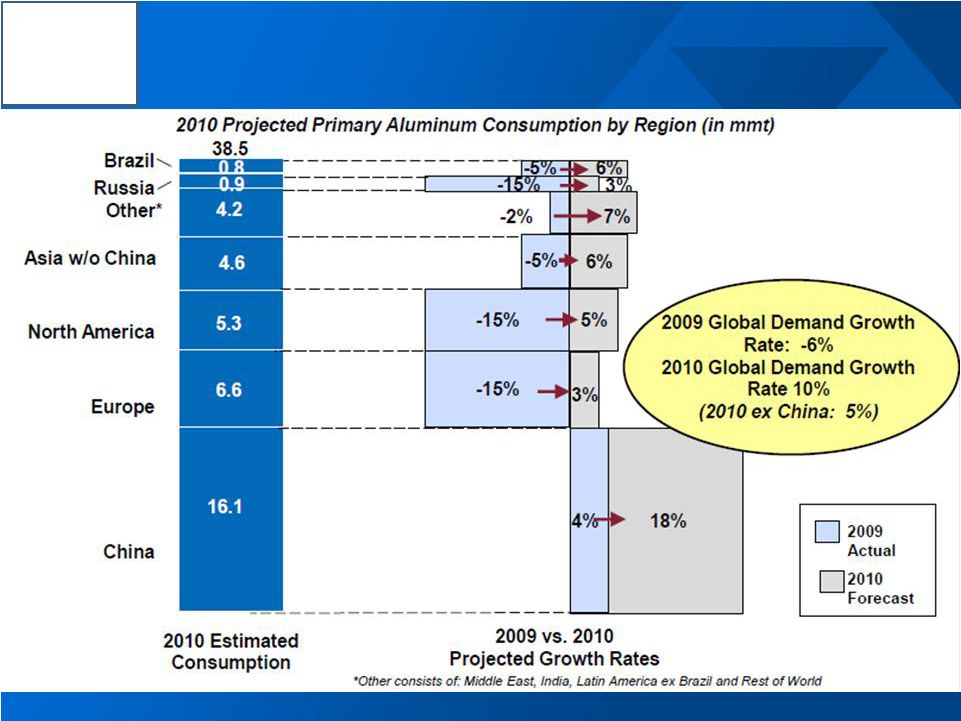
Logo Global Physical Demand to Rise 10% in 2010
18 |
 Alcoa
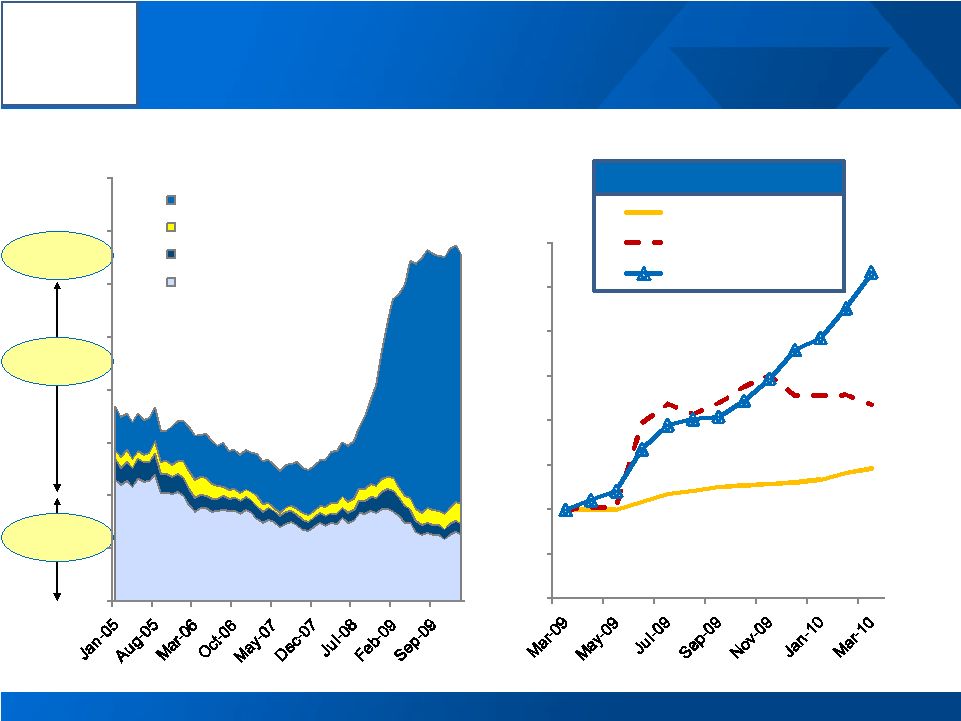
Logo Inventories Flat As Stable Demand Drives Premiums Higher
Source: Bloomberg, IAI
Global inventory days of consumption and regional premiums
45%
118%
266%
66 days of
consumption
LME at 47
days
Non-LME at
19 days
$135 / MT
$136 / MT
$124 / MT
19
0
10
20
30
40
50
60
70
80
LME
Shanghai
Japan Port
Producer
0%
50%
100%
150%
200%
250%
300%
350%
400%
Midwest
Japan
Europe
Regional Premium (1-Year Change) |
 Alcoa
Logo 2010 Annualized Run Rate
23,150
2010 Restarts or Curtailments
(365)
2010 Brown/Greenfield Expansion
745
Total Supply
23,530
Demand
(22,500)
Exports to China, Net
(200)
Net Surplus
830
China
Western World
2010 Primary Aluminum Surplus Is Manageable
(in kmt)
2010 Annualized Run Rate
16,100
2010 Restarts or Curtailments
0
2010 Brown//Greenfield Expansion
200
Total Supply
16,300
Demand
(16,100)
Imports from West, Net
200
Net Surplus
400
Source: Alcoa estimates, Brook Hunt, CRU, CNIA, IAI
20
Surplus
Surplus |
 Alcoa
Logo 2010E Alumina Supply / Demand Balance (in kmt)
Source: Alcoa estimates, CRU, CNIA, IAI
2010 Global Alumina in Balance
China
Western World
21
2010 Annualized Run Rate
27,000
Imports from Western World
5,400
Supply
32,400
Demand
(32,400)
(Deficit) / Surplus
0
2010 Annualized Run Rate
51,000
Exports to China
(5,400)
Supply
45,600
Demand
(45,400)
(Deficit) / Surplus
200
Balanced |
 Alcoa
Logo 72
62
44
48
68
75
110
104
81
20
49
1,549
1,447
1,350
1,433
1,719
1,900
2,570
2,641
2,572
1,664
2,136
2000
2001
2002
2003
2004
2005
2006
2007
2008
2009
Q1'10
0
20,000
40,000
60,000
80,000
100,000
Cumulative Production KMT
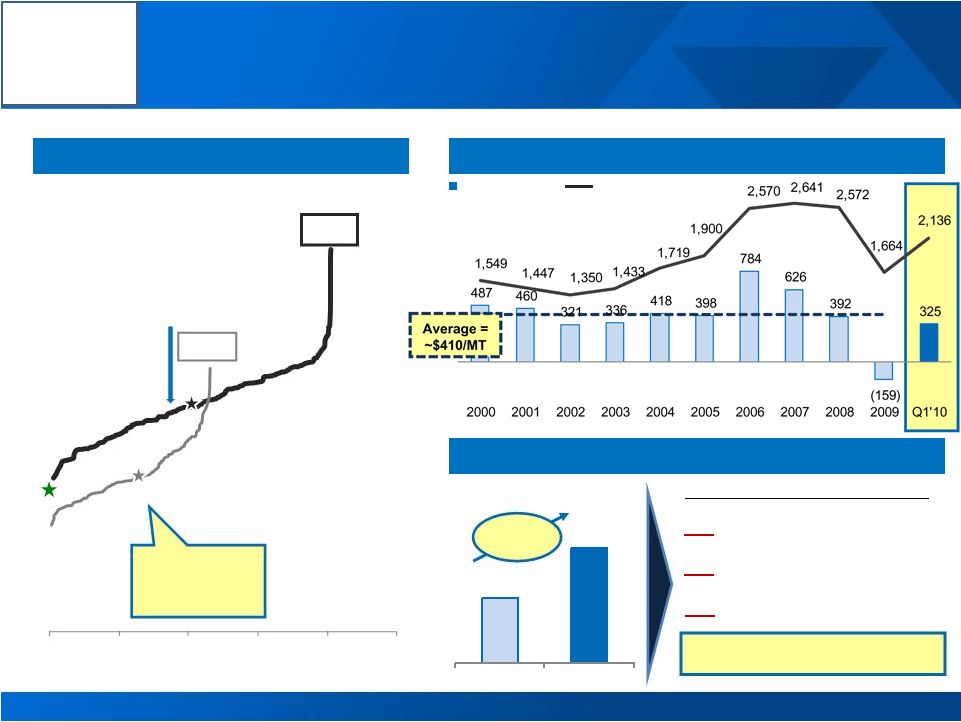
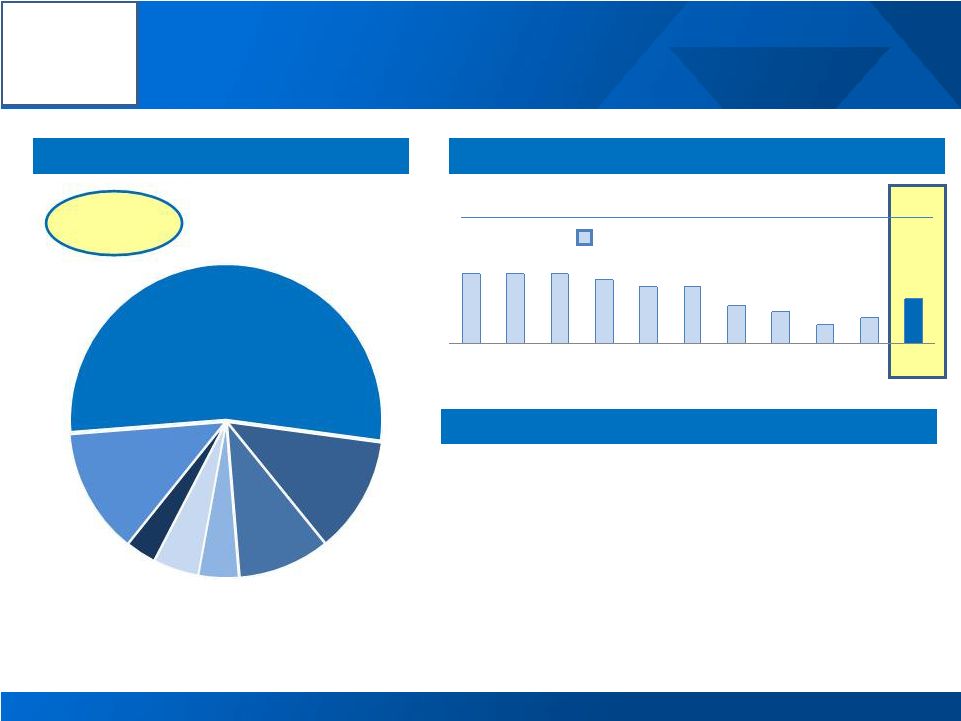
Significant Value Creation From The Alumina Leader
Alumina financial and strategic overview
Global Refining Cost Curve
LME
EBITDA/MT
Ma’aden
1st Percentile
Online 2014
EBITDA per Metric Ton
22
Source : CRU; Alcoa Analysis
50
th
Percentile = $232/MT
~50% increase
in midpoint
since 2000
Average =
~$70/MT
50
th
Percentile = $140MT
[Alcoa Logo]
Alcoa
25
th
Percentile
2000
2009
Tight Market, Rising Cost = Higher Alumina % LME
Alcoa
3
rd
Party
Alumina
Sales
%
LME
2000
2001
2002
2003
2004
2005
2006
2007
2008
2009
2010 |
 Streamlined Primary Metals Poised to Drive EBITDA
Primary Metals financial and strategic overview
Global Primary Cost Curve
EBITDA per Metric Ton
LME
EBITDA/MT
23
Future Capacity Growth Challenged
Aluminum Demand (MMT)
Requires 2.3 MMT per Year
3x
Ma’aden Smelters per Year
4x
Sao Luis Expansions per Year
20
New Gas Turbines per Year
50 Percentile = $1,755/MT
50 Percentile = $1,183/MT
2009
Ma’aden
1st Percentile
Online 2013
45 Percentile
Source : CRU; Alcoa Analysis
0
10,000
20,000
30,000
40,000
50,000
Cumulative Production KMT
38.5
68.0
2010
2018
~50% increase
in midpoint
since 2000
6%
CAGR
~$30 Billion per Year
2000
Alcoa Logo
th
th
th
[Alcoa Logo]
Alcoa |
 Alcoa
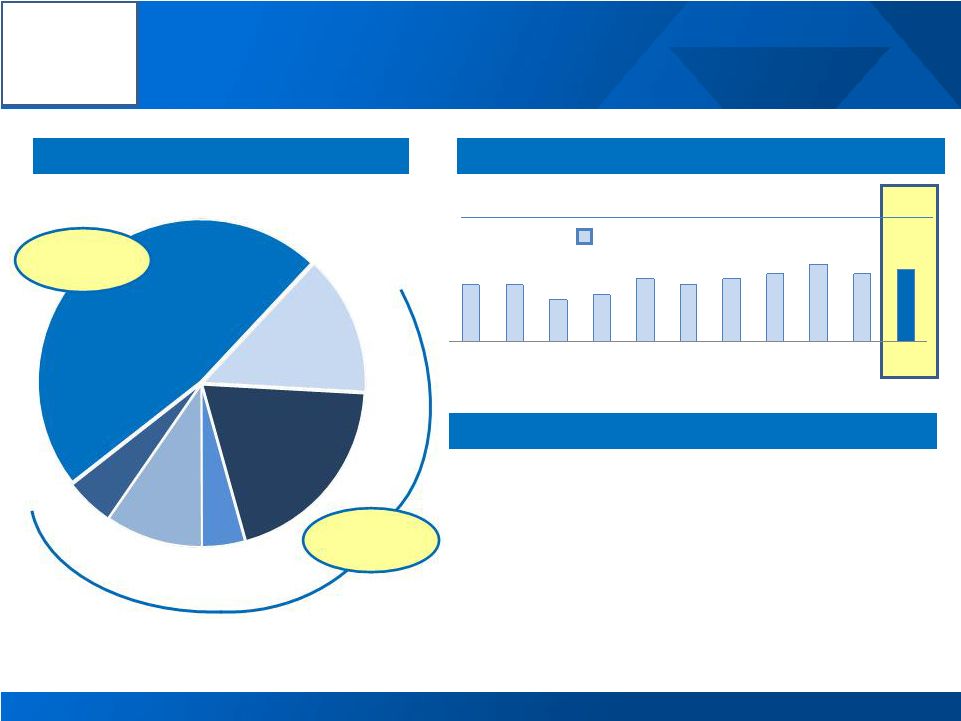
Logo Rolled Products Positioned to Substantially Improve Returns
–
Russian can sheet mill fully operational in 2010
–
China Bohai
mill on schedule for full ramp-up by 2011
–
Lowest
conversion
cost
Ma’aden
mill
on-line
in
2013
–
Strengthened positions in aerospace, can sheet,
lithographic sheet
–
Exited global foil business
–
Headcount reduced by 5,000 FTEs since 2008
–
Overhead $140 million lower than 2008
Global Flat Rolled Products financial and strategic overview
2009 3
rd
Party Sales by Market
Segment EBITDA & EBITDA % Sales
Strategic Position
24
573
541
495
479
531
620
536
498
254
224
107
EBITDA $Millions
EBITDA % Sales
11%
11%
11%
10%
9%
9%
6%
5%
3%
4%
7%
2000
2001
2002
2003
2004
2005
2006
2007
2008
2009
Q1'10
Distribution
10%
Automotive
4%
B&C
5%
Commercial
Transport
3%
Industrial
/Other
13%
Aerospace
12%
Packaging
53%
75%
Utilization |
 Alcoa
Logo EPS Strong Platform for Profitable Growth
–
Focused the portfolio on strategic segments
–
85% of sales are from #1 or #2 market leaders
–
$440 million of productivity improvement in 2009
–
Aerospace destocking is improving
–
Significant profit accelerators for the future
–
787/A380
–
Joint Strike Fighter
–
Heavy Truck market recovery
–
Rapidly integrated 2 fastener acquisitions
Engineered Products & Solutions financial and strategic overview
2009 3
rd
Party Sales by Market
Segment EBITDA & EBITDA % Sales
Strategic Position
25
368
436
287
356
495
536
676
783
922
630
152
EBITDA $Millions
EBITDA % Sales
11%
11%
8%
9%
12%
11%
12%
13%
15%
13%
14%
2000
2001
2002
2003
2004
2005
2006
2007
2008
2009
Q1'10
Aerospace
47%
IGT
14%
B&C
20%
Commercial
Transport
4%
Automotive
10%
Other
5%
70%
Utilization
65%
Utilization |
 Alcoa
Logo Aggressively Pursuing 2010 Operational Targets
26
Procurement
Overhead
$500
Total Capex*
$1,250
Working Capital
35
2010 Cash Sustainability Operational Targets and Actual Performance
$ Millions
$127
$281
42
$ Millions
$ Millions
Days Working Capital
$2,500
$505
2010
YTD
2010
Target
2010
YTD
2010
Target
2010
YTD
2010
Target
2010
YTD
2010
Target
*Total Capex includes investments in Ma’aden project
|
 Alcoa
Logo Alcoa Driving Near-term and Long-term Shareholder Value
27
–
End-markets improving
–
Aluminum
demand
to
rise
10%
in 2010
–
Global alumina
supply/demand in balance
–
Global primary metal surplus
of 12 days
–
Overhead cost reduction
target of $500 million
–
Procurement cost reduction
target of $2.5 billion
–
Divested underperforming
businesses
–
Strengthened balance sheet
Environment Stabilized
Exceeding Goals
Growing Profitably
–
Global alumina leader
leveraging lowest cost
production base
–
Global aluminum leader
reducing cost position
–
Alcoa Rolled Products leading
profitability revitalization
–
EPS expanding market
leadership and competitive
distance
Momentum
Execution
Growth |
 Alcoa
Logo Matthew E. Garth
Director, Investor Relations
A
390 Park Avenue
New York, NY 10022-4608
Telephone: (212) 836-2674
www.alcoa.com
Additional Information
28 |
 Alcoa
Logo A
Alcoa Logo |
 Alcoa
Logo Effective Tax Rate
Effective tax rate, excluding discrete tax items is a non-GAAP financial measure.
Management believes that the Effective tax rate, excluding discrete tax items is
meaningful to investors because it provides a view of Alcoa’s operational tax rate.
30
$ Millions
1Q’09
(Loss) income from continuing operations before income taxes
($88)
Provision for income taxes
$84
Effective
tax
rate
as
reported
(95.5%)
Discrete
tax
provisions:
Medicare Part D
-
$79
Transaction-related and other items
-
$33
Subtotal -
Discrete tax (benefits) provisions
$112
(Benefit)
Provision
for
income
taxes
excluding
discrete
tax
(benefits)
provisions
($28)
Effective tax rate excluding discrete tax (benefits) provisions
31.8% |
 Alcoa
Logo Reconciliation of ATOI to Consolidated Net (Loss) Income
Attributable to Alcoa
31
(in millions)
1Q09
2Q09
3Q09
4Q09
2009
1Q10
Total segment ATOI
$
(143)
$
(132)
$
142
$ (101)
$
(234)
$ 306
Unallocated amounts (net of tax):
Impact of LIFO
29
39
80
87
235
(14)
Interest income
1
8
(1)
4
12
3
Interest expense
(74)
(75)
(78)
(79)
(306)
(77)
Noncontrolling interests
(10)
5
(47)
(9)
(61)
(22)
Corporate expense
(71)
(70)
(71)
(92)
(304)
(67)
Restructuring and other charges
(46)
(56)
(3)
(50)
(155)
(122)
Discontinued operations
(17)
(142)
4
(11)
(166)
(7)
Other
(166)
(31)
51
(26)
(172)
(201)
Consolidated net (loss) income attributable to
Alcoa
$ (497)
$ (454)
$ 77
$ (277)
$ (1,151)
$ (201)
|
 Alcoa
Logo Reconciliation of Alcoa EBITDA
32
(in millions)
Quarter ended
March 31,
2010
Net loss attributable to Alcoa
$ (201)
Add:
Net income attributable to noncontrolling interests
22
Loss from discontinued operations
7
Provision for income taxes
84
Other expenses, net
21
Interest expense
118
Restructuring and other charges
187
Provision for depreciation, depletion, and
amortization
358
Earnings before interest, taxes, and depreciation
and amortization (EBITDA)
$ 596
Alcoa’s definition of EBITDA is net margin plus an add-back for depreciation, depletion, and
amortization. Net margin is equivalent to Sales minus the following items: Cost of goods
sold; Selling, general administrative, and other expenses; Research and development expenses;
and Provision for depreciation, depletion, and amortization. EBITDA is a non- GAAP
financial measure. Management believes that this measure is meaningful to investors because EBITDA provides
additional information with respect to Alcoa’s operating performance and the Company’s
ability to meet its financial obligations. The EBITDA presented may not be comparable to
similarly titled measures of other companies. |
 Alcoa
Logo Reconciliation of Adjusted Income
33
(in millions)
Quarter ended
December 31,
2009
March 31,
2010
Net
loss attributable
to Alcoa
$ (277)
$ (201)
Loss
from
discontinued
operations
(11)
(7)
Loss
from continuing
operations
attributable to Alcoa
(266)
(194)
Restructuring and
other charges
49
119
Discrete tax items*
(82)
112
Special items**
308
64
Income
from
continuing
operations
attributable to Alcoa
–
as adjusted
$
9
$ 101
Income from continuing operations attributable to Alcoa – as adjusted is a non-GAAP
financial measure. Management believes that this measure is meaningful to investors because
management reviews the operating results of Alcoa excluding the impacts of restructuring and other
charges, discrete tax items, and special items. There can be no assurances that
additional restructuring and other charges, discrete tax items, and special items will not occur in
future periods. To compensate for this limitation, management believes that it is
appropriate to consider both Loss from continuing operations attributable to Alcoa determined under
GAAP as well as Income from continuing operations attributable to Alcoa – as
adjusted.
* Discrete tax items include the following: charges for a change in the tax treatment of federal
subsidies received related to prescription drug benefits provided under certain retiree health benefit plans ($79),
unbenefitted losses in Russia, China, and Italy ($22) (will be offset in future 2010 quarters),
interest due to the IRS related to a previously deferred gain associated with the 2007 formation of the former soft
alloy extrusions joint venture ($6), and a change in the anticipated sale structure of the
Transportation Products Europe business ($5) for the quarter ended March 31, 2010; and a benefit for the reorganization
of an equity investment in Canada (-$71), a charge for the write-off of deferred tax assets
related to operations in Italy ($41), a benefit for a tax rate change in Iceland (-$31), and a benefit for the reversal of a
valuation allowance on net operating losses in Norway (-$21) for the quarter ended December 31,
2009. ** Special items include the following: charges related to unfavorable mark-to-market changes
in derivative contracts ($31), power outages at the Rockdale, TX and São Luís, Brazil facilities ($17), an additional
environmental accrual for the Grasse River remediation in Massena, NY ($11), and the write off of
inventory related to the permanent closures of certain U.S. facilities ($5) for the quarter ended March 31, 2010;
and charges related to a recent European Commission’s ruling on electricity pricing for smelters
in Italy ($250), a tax settlement related to an equity investment in Brazil ($24), an estimated loss on excess
power at our Intalco smelter ($19), and an environmental accrual for smelters in Italy ($15) for the
quarter ended December 31, 2009. |
 Alcoa
Logo Reconciliation of Alumina EBITDA
34
($ in millions)
2000
2001
2002
2003
2004
2005
2006
2007
2008
2009
1Q10
Alumina
After-tax operating
income (ATOI)
$ 585
$ 471
$ 315
$ 415
$ 632
$ 682
$ 1,050
$ 956
$ 727
$
112
$ 72
Add:
Depreciation,
depletion, and
amortization
163
144
139
147
153
172
192
267
268
292
92
Equity (income)
loss
(3)
(1)
(1)
–
(1)
–
2
(1)
(7)
(8)
(2)
Income taxes
279
184
130
161
240
246
428
340
277
(22)
27
Other
(12)
(17)
(14)
(55)
(46)
(8)
(6)
2
(26)
(92)
1
Earnings
before
interest, taxes,
depreciation, and
amortization
(EBITDA)
$
1,012
$
781
$
569
$
668
$
978
$
1,092
$
1,666
$
1,564
$
1,239
$
282
$
190
Production
(thousand metric
tons) (kmt)
13,968
12,527
13,027
13,841
14,343
14,598
15,128
15,084
15,256
14,265
3,866
EBITDA/Production
($ per metric ton)
72
62
44
48
68
75
110
104
81
20
49
Alcoa’s definition of EBITDA is net margin plus an add-back for depreciation, depletion, and
amortization. Net margin is equivalent to Sales minus the following items: Cost of goods
sold; Selling, general administrative, and other expenses; Research and development expenses; and
Provision for depreciation, depletion, and amortization. The Other line in the table
above includes gains/losses on asset sales and other nonoperating items. EBITDA is a non-GAAP financial measure. Management believes that this measure is meaningful to
investors because EBITDA provides additional information with respect to Alcoa’s operating
performance and the Company’s ability to meet its financial obligations. The EBITDA
presented may not be comparable to similarly titled measures of other companies.
|
 Alcoa
Logo Reconciliation of Primary Metals EBITDA
35
($ in millions)
2000
2001
2002
2003
2004
2005
2006
2007
2008
2009
1Q10
Primary Metals
After-tax operating
income (ATOI)
$ 1,000
$ 905
$ 650
$ 657
$ 808
$ 822
$ 1,760
$ 1,445
$ 931
$ (612)
$ 123
Add:
Depreciation,
depletion, and
amortization
311
327
300
310
326
368
395
410
503
560
147
Equity (income)
loss
(50)
(52)
(44)
(55)
(58)
12
(82)
(57)
(2)
26
–
Income taxes
505
434
266
256
314
307
726
542
172
(365)
18
Other
(41)
(8)
(47)
12
20
(96)
(13)
(27)
(32)
(176)
1
Earnings before
interest, taxes,
depreciation, and
amortization
(EBITDA)
$ 1,725
$
1,606
$
1,125
$
1,180
$
1,410
$
1,413
$ 2,786
$ 2,313
$
1,572
$ (567)
$
289
Production
(thousand metric
tons) (kmt)
3,539
3,488
3,500
3,508
3,376
3,554
3,552
3,693
4,007
3,564
889
EBITDA/Production
($ per metric ton)
487
460
321
336
418
398
784
626
392
(159)
325
Alcoa’s definition of EBITDA is net margin plus an add-back for depreciation, depletion, and
amortization. Net margin is equivalent to Sales minus the following items: Cost of goods
sold; Selling, general administrative, and other expenses; Research and development expenses; and
Provision for depreciation, depletion, and amortization. The Other line in the table
above includes gains/losses on asset sales and other nonoperating items. EBITDA is a non-GAAP financial measure. Management believes that this measure is meaningful to
investors because EBITDA provides additional information with respect to Alcoa’s operating
performance and the Company’s ability to meet its financial obligations. The EBITDA
presented may not be comparable to similarly titled measures of other companies.
|
 Alcoa
Logo Reconciliation of Flat-Rolled Products EBITDA
36
($ in millions)
2000
2001
2002
2003
2004
2005
2006
2007
2008
2009
1Q10
Flat-Rolled
Products
After-tax operating
income (ATOI)
$ 296
$ 253
$ 225
$ 222
$ 254
$ 278
$ 233
$ 178
$
(3)
$ (49)
$ 30
Add:
Depreciation,
depletion, and
amortization
153
167
184
190
200
220
223
227
216
227
59
Equity (income)
loss
(3)
2
4
1
1
–
2
–
–
–
–
Income taxes
126
124
90
71
75
121
58
92
35
48
18
Other
1
(5)
(8)
(5)
1
1
20
1
6
(2)
–
Earnings before
interest, taxes,
depreciation, and
amortization
(EBITDA)
$ 573
$
541
$
495
$
479
$
531
$
620
$ 536
$ 498
$
254
$ 224
$
107
Total sales
$ 5,167
$ 4,868
$ 4,571
$ 4,768
$ 6,042
$ 7,081
$ 8,610
$ 9,597
$ 9,184
$ 6,182
$ 1,481
EBITDA/Total
sales
11%
11%
11%
10%
9%
9%
6%
5%
3%
4%
7%
Alcoa’s definition of EBITDA is net margin plus an add-back for depreciation, depletion, and
amortization. Net margin is equivalent to Sales minus the following items: Cost of goods sold;
Selling, general administrative, and other expenses; Research and development expenses; and Provision for depreciation, depletion, and
amortization. The Other line in the table above includes gains/losses on asset sales and other
nonoperating items. EBITDA is a non-GAAP financial measure. Management believes that this
measure is meaningful to investors because EBITDA provides additional information with respect to Alcoa’s operating performance
and the Company’s ability to meet its financial obligations. The EBITDA presented may not be
comparable to similarly titled measures of other companies. |
 Alcoa
Logo Reconciliation of Engineered Products and Solutions EBITDA
37
($ in millions)
2000
2001
2002
2003
2004
2005
2006
2007
2008
2009
1Q10
Engineered
Products
and
Solutions
After-tax operating
income (ATOI)
$ 125
$ 189
$ 63
$ 124
$ 156
$ 271
$ 365
$ 435
$ 533
$ 315
$ 81
Add:
Depreciation,
depletion, and
amortization
165
186
150
166
168
160
152
163
165
177
41
Equity (income)
loss
(1)
–
–
–
–
–
6
–
–
(2)
(1)
Income taxes
79
61
39
55
65
116
155
192
222
139
31
Other
–
–
35
11
106
(11)
(2)
(7)
2
1
–
Earnings before
interest, taxes,
depreciation, and
amortization
(EBITDA)
$ 368
$
436
$
287
$
356
$
495
$
536
$ 676
$ 783
$
922
$ 630
$
152
Total sales
$ 3,386
$ 4,141
$ 3,492
$ 3,905
$ 4,283
$ 4,773
$ 5,428
$ 5,834
$ 6,199
$ 4,689
$ 1,074
EBITDA/Total
sales
11%
11%
8%
9%
12%
11%
12%
13%
15%
13%
14%
Alcoa’s definition of EBITDA is net margin plus an add-back for depreciation, depletion, and
amortization. Net margin is equivalent to Sales minus the following items: Cost of goods
sold; Selling, general administrative, and other expenses; Research and development expenses; and Provision for depreciation, depletion, and amortization. The
Other line in the table above includes gains/losses on asset sales and other nonoperating items.
EBITDA is a non-GAAP financial measure. Management believes that this measure is
meaningful to investors because EBITDA provides additional information with respect to Alcoa’s operating performance and the Company’s ability to meet its
financial obligations. The EBITDA presented may not be comparable to
similarly titled measures of other companies. |