Attached files
| file | filename |
|---|---|
| EX-32.2 - QNB CORP | v179417_ex32-2.htm |
| EX-31.1 - QNB CORP | v179417_ex31-1.htm |
| EX-31.2 - QNB CORP | v179417_ex31-2.htm |
| EX-23.1 - QNB CORP | v179417_ex23-1.htm |
| EX-32.1 - QNB CORP | v179417_ex32-1.htm |
UNITED
STATES
SECURITIES
AND EXCHANGE COMMISSION
Washington,
D.C. 20549
Form
10-K
|
x
|
ANNUAL
REPORT PURSUANT TO SECTION 13 OR 15(d) OF THE SECURITIES EXCHANGE ACT OF
1934
for
the fiscal year ended December
31, 2009
|
|
o
|
TRANSITION
REPORT PURSUANT TO SECTION 13 OR 15(d) OF THE SECURITIES EXCHANGE ACT OF
1934
for
the transition period from ________________
to ________________ .
|
Commission
file number 0-17706

(Exact
name of registrant as specified in its charter)
|
Pennsylvania
|
23-2318082
|
|
State
or other jurisdiction of
|
(I.R.S.
Employer Identification No.)
|
|
incorporation
or organization
|
|
|
15
North Third Street, Quakertown, PA
|
18951-9005
|
|
(Address
of principal executive offices)
|
(Zip
Code)
|
Registrant’s telephone number, including area
code: (215)
538-5600
|
Securities
registered pursuant to Section 12(b) of the Act: None.
|
Name
of each exchange on which registered
|
|
N/A
|
Securities
registered pursuant to Section 12(g) of the Act:
|
Title of
class
|
||
|
Common
Stock, $.625 par value
|
Indicate
by check mark if the registrant is a well-known seasoned issuer, as defined in
Rule 405 of the Securities Act.
YES o NO þ
Indicate
by check mark if the registrant is not required to file reports pursuant to
Section 13 or Section 15(d) of the Act.
YES
o NO þ
Indicate by check mark whether the
registrant (1) has filed all reports required to be filed by Section
13 or 15(d) of the Securities Exchange Act of 1934 during the preceding 12
months (or for such shorter period that the registrant was required to file such
reports), and (2) has been subject to such filing requirements for the past 90
days.
YES þ NO o
Indicate by check mark whether the
registrant has submitted electronically and posted on its corporate
Website, if any, every Interactive Data File required to be submitted and posted
pursuant to Rule 405 of Regulation S-T (232.405 of this chapter) curing the
preceding 12 months (or for such shorter period that the registrant was required
to submit and post such files.
YES o NO o
Indicate by check mark if disclosure of
delinquent filers pursuant to Item 405 of Regulation S-K is not contained
herein, and will not be contained, to the best of registrant’s knowledge, in
definitive proxy or information statements incorporated by reference in Part III
of this Form 10-K or any amendment to this Form 10-K o
Indicate by check mark whether the
registrant is a large accelerated filer, an accelerated filer, a non-accelerated
filer, or a smaller reporting company. See definitions of “large accelerated
filer”, “accelerated filer” and “smaller reporting company” in Rule 12b-2 of the
Exchange Act.
Large
accelerated filer o
Accelerated filer o Non-accelerated
filer o Smaller
reporting company þ
Indicate by check mark whether the
Registrant is a shell company (as defined in Rule 12b-2 of the Exchange
Act).
YES o NO þ
As of February 28, 2010, 3,094,445
shares of common stock of the registrant were outstanding. As of June
30, 2009, the aggregate market value of the common stock of the registrant held
by nonaffiliates was approximately $44,319,000 based upon the average bid and
asked prices of the common stock as reported on the OTC BB.
DOCUMENTS
INCORPORATED BY REFERENCE
Portions of registrant’s Proxy
Statement for the annual meeting of its shareholders to be held May
18, 2010 are incorporated by reference in Part III of this report.
FORM
10-K INDEX
|
PART
I
|
PAGE
|
||||
|
Item
1
|
Business
|
3 | |||
|
Item
1A
|
Risk
Factors
|
10 | |||
|
Item
1B
|
Unresolved
Staff Comments
|
15 | |||
|
Item
2
|
Properties
|
15 | |||
|
Item
3
|
Legal
Proceedings
|
15 | |||
|
Item
4
|
[Removed
and Reserved]
|
15 | |||
|
PART
II
|
|||||
|
Item
5
|
Market
for Registrant’s Common Equity, Related Stockholder Matters and Issuer
Purchases of Equity Securities
|
16 | |||
|
Item
6
|
Selected
Financial Data and Other Data
|
18 | |||
|
Item
7
|
Management’s
Discussion and Analysis of Financial Condition and
Results of Operations
|
18 | |||
|
|
|||||
|
Item
7A
|
Quantitative
and Qualitative Disclosures about Market Risk
|
46 | |||
|
Item
8
|
Financial
Statements and Supplementary Data
|
48 | |||
|
Item
9
|
Changes
in and Disagreements with Accountants on Accounting and Financial
Disclosure
|
78 | |||
|
Item
9A(T)
|
Controls
and Procedures
|
78 | |||
|
Item
9B
|
Other
Information
|
78 | |||
|
PART
III
|
|||||
|
Item
10
|
Directors,
Executive Officers and Corporate Governance
|
79 | |||
|
Item
11
|
Executive
Compensation
|
79 | |||
|
Item
12
|
Security
Ownership of Certain Beneficial Owners and Management and Related
Stockholder Matters
|
79 | |||
|
Item
13
|
Certain
Relationships and Related Transactions, and Director
Independence
|
80 | |||
|
Item
14
|
Principal
Accounting Fees and Services
|
80
|
|||
|
PART
IV
|
|||||
|
Item
15
|
Exhibits
and Financial Statement Schedules
|
81
|
|||
2
PART
I
FORWARD-LOOKING
STATEMENTS
In
addition to historical information, this document contains forward-looking
statements. Forward-looking statements are typically identified by words or
phrases such as “believe,” “expect,” “anticipate,” “intend,” “estimate,”
“project” and variations of such words and similar expressions, or future or
conditional verbs such as “will,” “would,” “should,” “could,” “may” or similar
expressions. The U.S. Private Securities Litigation Reform Act of 1995 provides
a safe harbor in regard to the inclusion of forward-looking statements in
this document and documents incorporated by reference.
Shareholders
should note that many factors, some of which are discussed elsewhere in this
document and in the documents that are incorporated by reference, could affect
the future financial results of QNB Corp. and its subsidiary and could cause
those results to differ materially from those expressed in the forward-looking
statements contained or incorporated by reference in this document. These
factors include, but are not limited to, the following:
|
·
|
Volatility
in interest rates and shape of the yield
curve;
|
|
·
|
Credit
risk;
|
|
·
|
Liquidity
risk;
|
|
·
|
Operating,
legal and regulatory risks;
|
|
·
|
Economic,
political and competitive forces affecting QNB Corp.’s line of
business;
|
|
·
|
The
risk that the Federal Deposit Insurance Corporation (FDIC) could levy
additional insurance assessments on all insured institutions
in order
to replenish the Deposit Insurance Fund based on the level of bank
failures in the future; and
|
|
·
|
The
risk that the analysis of these risks and forces could be incorrect,
and/or that the strategies developed to address them could be
unsuccessful.
|
QNB Corp.
(herein referred to as QNB or the Company) cautions that these forward-looking
statements are subject to numerous assumptions, risks and uncertainties, all of
which change over time, and QNB assumes no duty to update forward-looking
statements. Management cautions readers not to place undue reliance
on any forward-looking statements. These statements speak only as of the date of
this Annual Report on Form 10-K, even if subsequently made available by QNB on
its website or otherwise, and they advise readers that various factors,
including those described above, could affect QNB’s financial performance and
could cause actual results or circumstances for future periods to differ
materially from those anticipated or projected. Except as required by
law, QNB does not undertake, and specifically disclaims any obligation, to
publicly release any revisions to any forward-looking statements to reflect the
occurrence of anticipated or unanticipated events or circumstances after the
date of such statements.
ITEM
1. BUSINESS
Overview
QNB was
incorporated under the laws of the Commonwealth of Pennsylvania on June 4, 1984.
QNB is registered with the Board of Governors of the Federal Reserve System as a
bank holding company under the Bank Holding Company Act of 1956 and conducts its
business through its wholly-owned subsidiary, QNB Bank (the Bank).
Prior to
December 28, 2007, the Bank was a national banking association organized in 1877
as Quakertown National Bank and was chartered under the National Banking Act and
was subject to Federal and state laws applicable to national banks. Effective
December 28, 2007, the Bank became a Pennsylvania chartered commercial bank and
changed its name to QNB Bank. The Bank’s principal office is located in
Quakertown, Bucks County, Pennsylvania. The Bank also operates eight other
full-service community banking offices in Bucks, Montgomery and Lehigh counties
in southeastern Pennsylvania.
3
The Bank
is engaged in the general commercial banking business and provides a full range
of banking services to its customers. These banking services consist of, among
other things, attracting deposits and using these funds in making commercial
loans, residential mortgage loans, consumer loans, and purchasing investment
securities. These deposits are in the form of time, demand and
savings accounts. Time deposits include certificates of deposit and individual
retirement accounts. The Bank’s demand and savings accounts include
money market accounts, interest-bearing demand accounts including a high-yield
checking account, club accounts, traditional statement savings accounts, and a
new high-yield online savings account.
At
December 31, 2009, QNB had total assets of $762,426,000, total loans of
$449,421,000, total deposits of $634,103,000 and total shareholders’ equity of
$56,426,000. For the year ended December 31, 2009, QNB reported net income of
$4,227,000 compared to net income for the year ended December 31, 2008 of
$5,753,000.
At
February 28, 2010, the Bank had 147 full-time employees and 30 part-time
employees. The Bank’s employees have a customer-oriented philosophy, a strong
commitment to service and a “sincere interest” in their customers’ success. They
maintain close contact with both the residents and local business people in the
communities in which they serve, responding to changes in market
conditions and customer requests in a timely manner.
Competition
and Market Area
The
banking business is highly competitive, and the profitability of QNB depends
principally upon the Bank’s ability to compete in its market
area. QNB faces intense competition within its market, both in making
loans and attracting deposits. The upper Bucks, southern Lehigh, and
northern Montgomery counties have a high concentration of financial
institutions, including large national and regional banks, community banks,
savings institutions and credit unions. Some of QNB’s competitors
offer products and services that QNB currently does not offer, such as
traditional trust services and full-service insurance. In addition,
as a result of consolidation in the banking industry, some of QNB’s competitors
may enjoy advantages such as greater financial resources, a wider geographic
presence, more favorable pricing alternatives and lower origination and
operating costs. However, QNB has been able to compete effectively with other
financial institutions by emphasizing the establishment of long-term
relationships and customer loyalty. A strong focus on small-business solutions,
providing fast local decision-making on loans, exceptional personal customer
service and technology solutions, including internet-banking and electronic bill
pay, also enable QNB to compete successfully.
Competition
for loans and deposits comes principally from commercial banks, savings
institutions, credit unions and non-bank financial service
providers. Factors in successfully competing for deposits include
providing excellent customer service, convenient locations and hours of
operation, attractive rates, low fees, and alternative delivery systems. One
such delivery system is a courier service offered to businesses to assist in
their daily banking needs without having to leave their workplace. Successful
loan origination tends to depend on being responsive and flexible to the
customers’ needs, as well as the interest rate and terms of the loan. While many
competitors within the Bank’s primary market have substantially higher legal
lending limits, QNB often has the ability, through loan participations, to meet
the larger lending needs of its customers.
QNB’s
success is dependent to a significant degree on economic conditions in
southeastern Pennsylvania, especially upper Bucks, southern Lehigh and northern
Montgomery counties, which it defines as its primary market. The
banking industry is affected by general economic conditions, including the
effects of recession, unemployment, declining real estate values, inflation,
trends in the national and global economies, and other factors beyond QNB’s
control.
MONETARY
POLICY AND ECONOMIC CONDITIONS
The
business of financial institutions is affected not only by general economic
conditions, but also by the policies of various governmental regulatory
agencies, including the Federal Reserve Board. The Federal Reserve Board
regulates money, credit conditions and interest rates to influence general
economic conditions primarily through open market operations in U.S. government
securities, changes in the discount rate on bank borrowings and changes in the
reserve requirements against depository institutions’ deposits. These policies
and regulations significantly affect the overall growth and distribution of
loans, investments and deposits, as well as the interest rates charged on loans
and the interest rates paid on deposits.
The
monetary policies of the Federal Reserve Board have had a significant effect on
the operating results of financial institutions in the past and are expected to
continue to have significant effects in the future. In view of the changing
conditions in the economy and the money markets in addition to the activities of
monetary and fiscal authorities, the prediction of future changes in interest
rates, credit availability or deposit levels is very challenging.
4
The
recession, which economists suggest began in October 2007, became a major force
over the past two years in the United States of America (U.S.) and around the
world. In the U.S., the Government provided support for financial institutions
that requested it in order to strengthen capital, increase liquidity and ease
the credit markets. In the U.S., these actions provided capital for some banks
and other financial institutions and generally increased regulations and
oversight on virtually all banks. QNB has not requested or received any capital
provided by the U.S. Government under these programs.
SUPERVISION
AND REGULATION
Banks and
bank holding companies operate in a highly regulated environment and are
regularly examined by Federal and state regulatory authorities. Federal statutes
that apply to QNB and its subsidiary include the Gramm-Leach-Bliley Act (GLBA),
the Bank Holding Company Act of 1956 (BHCA), the Federal Reserve Act and the
Federal Deposit Insurance Act (FDIA). In general, these statutes
regulate the corporate governance of the Bank and eligible business activities
of QNB, certain merger and acquisition restrictions, intercompany transactions,
such as loans and dividends, and capital adequacy, among other restrictions.
Other corporate governance requirements are imposed on QNB by Federal laws,
including the Sarbanes-Oxley Act, described later.
The
Company is under the jurisdiction of the Securities and Exchange Commission and
of state securities commissions for matters relating to the offering and sale of
its securities. In addition, the Company is subject to the Securities and
Exchange Commission’s rules and regulations relating to periodic reporting,
proxy solicitation and insider trading.
To the
extent that the following information describes statutory or regulatory
provisions, it is qualified in its entirety by references to the particular
statutory or regulatory provisions themselves. Proposals to change banking laws
and regulations are frequently introduced in Congress, the state legislatures,
and before the various bank regulatory agencies. QNB cannot determine the
likelihood of passage or timing of any such proposals or legislation or the
impact they may have on QNB and its subsidiary. A change in law, regulations or
regulatory policy may have a material effect on QNB and its
subsidiary.
Bank
Holding Company Regulation
QNB is
registered as a bank holding company and is subject to the regulations of the
Board of Governors of the Federal Reserve System (the Federal Reserve) under the
BHCA. In addition, QNB Corp., as a Pennsylvania business corporation, is also
subject to the provisions of Section 115 of the Pennsylvania Banking Code of
1965 and the Pennsylvania Business Corporation Law of 1988, as
amended.
Bank
holding companies are required to file periodic reports with, and are subject to
examination by, the Federal Reserve. The Federal Reserve’s
regulations require a bank holding company to serve as a source of financial and
managerial strength to its subsidiary banks. As a result, the Federal
Reserve, pursuant to its “source of strength” regulations, may require QNB to
commit its resources to provide adequate capital funds to the Bank during
periods of financial distress or adversity.
Federal
Reserve approval may be required before QNB may begin to engage in any
non-banking activity and before any non-banking business may be acquired by
QNB.
Regulatory
Restrictions on Dividends
Dividend
payments made by the Bank to the Company are subject to the Pennsylvania Banking
Code, The Federal Deposit Insurance Act, and the regulations of the FDIC. Under
the Banking Code, no dividends may be paid except from “accumulated net
earnings” (generally retained earnings). The Federal Reserve Board and the FDIC
have formal and informal policies which provide that insured banks and bank
holding companies should generally pay dividends only out of current operating
earnings, with some exceptions. Under the FDIA, the Bank is
prohibited from paying any dividends, making other distributions or paying any
management fees if, after such payment, it would fail to satisfy its minimum
capital requirements. The Pennsylvania Banking Code restricts the
availability of capital funds for payment of dividends by the Bank to its
additional paid-in capital (surplus). See also “Supervision and Regulation –
Bank Regulation”.
In
addition to the dividend restrictions described above, the banking regulators
have the authority to prohibit or to limit the payment of dividends by the Bank
if, in the banking regulator’s opinion, payment of a dividend would constitute
an unsafe or unsound practice in light of the financial condition of the
Bank.
5
Under
Pennsylvania law, QNB may not pay a dividend, if, after giving effect thereto,
it would be unable to pay its debts as they become due in the usual course of
business and, after giving effect to the dividend, the total assets of QNB would
be less than the sum of its total liabilities plus the amount that would be
needed, if QNB were to be dissolved at the time of distribution, to satisfy the
preferential rights upon dissolution of shareholders whose rights are superior
to those receiving the dividend.
It is
also the policy of the Federal Reserve that a bank holding company generally
only pay dividends on common stock out of net income available to common
shareholders over the past year and only if the prospective rate of earnings
retention appears consistent with a bank holding company’s capital needs, asset
quality, and overall financial condition. In the current financial
and economic environment, the Federal Reserve has indicated that bank holding
companies should carefully review their dividend policy and has discouraged
dividend pay-out ratios at the 100% level unless both asset quality and
capital are very strong. A bank holding company also should not
maintain a dividend level that places undue pressure on the capital of such
institution’s subsidiaries, or that may undermine the bank holding company’s
ability to serve as a source of strength for such subsidiaries.
Under
these policies and subject to the restrictions applicable to the Bank, to remain
“well-capitalized,” the Bank had approximately $4,671,000 available for payment
of dividends to the Company at December 31, 2009.
Capital
Adequacy
Bank
holding companies are required to comply with the Federal Reserve’s risk-based
capital guidelines. The required minimum ratio of total capital to
risk-weighted assets (including certain off-balance sheet activities, such as
standby letters of credit) is 8%. At least half of total capital must be Tier 1
capital. Tier 1 capital consists principally of common shareholders’ equity,
plus retained earnings, less certain intangible assets. The remainder of total
capital may consist of the allowance for loan losses, which is considered Tier 2
capital. At December 31, 2009, QNB’s Tier 1 capital and total capital (Tier 1
and Tier 2 combined) ratios were 10.30% and 11.51%, respectively.
In
addition to the risk-based capital guidelines, the Federal Reserve requires a
bank holding company to maintain a minimum leverage ratio. This requires a
minimum level of Tier 1 capital (as determined under the risk-based capital
rules) to average total consolidated assets of 4% for those bank holding
companies that have the highest regulatory examination ratings and are not
contemplating or experiencing significant growth or expansion. The Federal
Reserve expects all other bank holding companies to maintain a ratio of at
least 1% to 2% above the stated minimum. At December 31, 2009, QNB’s leverage
ratio was 7.34%.
Pursuant
to the prompt corrective action provisions of the FDIA, the Federal banking
agencies have specified, by regulation, the levels at which an insured
institution is considered well capitalized, adequately capitalized,
undercapitalized, significantly undercapitalized, or critically
undercapitalized. Under these regulations, an institution is considered well
capitalized if it satisfies each of the following requirements:
|
·
|
Total
risk-based capital ratio of 10% or
more,
|
|
·
|
Tier
1 risk-based capital ratio of 6% or
more,
|
|
·
|
Leverage
ratio of 5% or more, and
|
|
·
|
Not
subject to any order or written directive to meet and maintain a specific
capital level
|
At
December 31, 2009, the Bank qualified as well capitalized under these regulatory
standards. See Note 20 of the Notes to Consolidated Financial Statements
included at Item 8 of this Report.
Bank
Regulation
As a
Pennsylvania chartered, insured commercial bank, the Bank is subject to
extensive regulation and examination by the Pennsylvania Department of Banking
(the Department) and by the FDIC, which insures its deposits to the maximum
extent permitted by law.
The
Federal and state laws and regulations applicable to banks regulate, among other
things, the scope of their business, their investments, the reserves required to
be kept against deposits, the timing of the availability of deposited funds, the
nature and amount of collateral for certain loans, the activities of a bank with
respect to mergers and consolidations, and the establishment of
branches. Pennsylvania law permits statewide
branching. The laws and regulations governing the Bank generally have
been promulgated to protect depositors and not for the purpose of protecting
QNB’s shareholders. This regulatory structure also gives the Federal
and state banking agencies extensive discretion in connection with their
supervisory and enforcement activities and examination policies, including
policies with respect to the classification of assets and the establishment of
adequate loan loss reserves for regulatory purposes. Any change in
such regulation, whether by the Department, the FDIC or the United States
Congress, could have a material impact on the Company, the Bank and their
operations.
6
As a
subsidiary bank of a bank holding company, the Bank is subject to certain
restrictions imposed by the Federal Reserve Act on extensions of credit to QNB,
on investments in the stock or other securities of QNB, and on taking such stock
or securities as collateral for loans.
FDIC
Insurance Assessments
The
Bank’s deposits are insured to applicable limits by the FDIC. The Bank is
subject to deposit insurance assessments by the FDIC based on the risk
classification of the Bank. In February 2006, deposit insurance modernization
legislation was enacted. Effective March 31, 2006, the law merged the Bank
Insurance Fund (BIF) and the Savings Association Insurance Fund (SAIF) into a
single Deposit Insurance Fund (DIF), increased deposit insurance coverage for
IRAs to $250,000, provided for the future increase of deposit insurance on all
accounts by authorizing the FDIC to index the coverage to the rate of inflation,
authorized the FDIC to set the reserve ratio of the combined DIF at a level
between 1.15% and 1.50%, and permitted the FDIC to establish assessments to be
paid by insured banks. On October 3, 2008, in response to the ongoing economic
crisis affecting the financial services industry, the Emergency Economic
Stabilization Act of 2008 was enacted which raised the basic limit on FDIC
coverage from $100,000 to $250,000 per depositor. This legislation has been
extended and provides that the basic deposit insurance limit will return to
$100,000 after December 31, 2013. On January 1, 2014 the standard
insurance amount will return to $100,000 per depositor for all amounts except
IRA’s and certain other retirement accounts, which will remain at $250,000 per
depositor.
The FDIC
has adopted a risk-based premium system that provides for quarterly assessments
based on an insured institution’s ranking in one of four risk categories based
on their examination ratings and capital ratios. Well-capitalized institutions
with the CAMELS ratings of 1 or 2 are grouped in Risk Category I. Deposit
insurance premiums are billed quarterly and in arrears. For the quarter
beginning January 1, 2009, the FDIC raised the base annual assessment rate for
institutions in Risk Category I to between 12 and 14 basis points while the base
annual assessment rates for institutions in Risk Categories II, III and IV were
increased to 17, 35 and 50 basis points, respectively. For the
quarter beginning April 1, 2009 the FDIC set the base annual assessment rate for
institutions in Risk Category I to between 12 and 16 basis points and the base
annual assessment rates for institutions in Risk Categories II, III and IV at
22, 32 and 45 basis points, respectively. An institution’s assessment
rate could be adjusted for several factors: ratio of its long-term unsecured
debt to deposits, ratio of certain amounts of Tier 1 capital to adjusted assets,
high levels of brokered deposits, high levels of asset growth (other than
through acquisitions) and a ratio of brokered deposits to deposits in excess of
10%. An institution’s base assessment rate would also be increased if an
institution’s ratio of secured liabilities (including FHLB advances and
repurchase agreements) to deposits exceeds 25%.
On May
22, 2009, the FDIC Board of Directors took further action to strengthen the DIF
by adopting a final rule imposing a special assessment on insured institutions
of 5 basis points on June 30, 2009 (payable at the end of September 2009). The
amount of this special assessment for QNB was $332,000. On September 29, 2009,
the FDIC adopted an Amended Restoration Plan to allow the DIF to return to a
reserve ratio of 1.15% within eight years as mandated by statute, and
simultaneously adopted higher annual risk-based assessment rates effective
January 1, 2011. In 2009 the DIF’s liquid assets have been used to protect
depositors of failed institutions. Because of bank failures and projected bank
failures, the FDIC determined it needs to have more liquidity to protect
depositors. Pursuant to this Amended Plan being adopted, the FDIC amended
its assessment regulations to require all institutions to prepay, on December
30, 2009, their estimated risk-based assessments for the fourth quarter of 2009,
and for all of 2010, 2011, and 2012, as estimated by the FDIC. The assessment
paid by the Bank was $3,407,000 and the amount related to 2010 through 2012 is
currently in a prepaid asset account. It will be expensed monthly during the
years of 2010 through 2012 based on actual FDIC assessment rate calculations.
In 2006
when the FDIC approved the reinstatement of regular insurance assessments
effective January 1, 2007, it also provided a credit to institutions that had
paid assessments in the past to be used to offset their regular insurance
assessments in future years. The credit for the Bank was $340,000, of which
$210,000 and $130,000 was utilized in 2007 and 2008, respectively, to offset
quarterly assessments. For the years ended December 31, 2009 and 2008, the Bank
recorded $1,151,000 and $216,000, respectively, in FDIC deposit insurance
premium expense.
In
addition, all insured institutions of the FDIC are required to pay assessments
to fund interest payments on Financing Corporation (FICO) bonds. The Financing
Corporation was created by Congress to issue bonds to finance the resolution of
failed thrift institutions. Prior to 1997, only thrift institutions were subject
to assessments to raise funds to pay the FICO bonds; however, beginning in 2000,
commercial banks and thrifts are subject to the same assessment for FICO bonds.
The FDIC has the authority to set the Financing Corporation assessment rate
every quarter. The expense for 2009 and 2008 recorded by QNB was $60,000 and
$57,000, respectively. These assessments will continue until the Financing
Corporation bonds mature in 2017.
7
FDIC
Temporary Liquidity Guarantee Program
On
October 13, 2008, the FDIC established a Temporary Liquidity Guarantee Program
under which the FDIC will fully guarantee all non-interest bearing transaction
accounts until December 31, 2009 (the “Transaction Account Guarantee Program”)
and certain senior unsecured debt of insured depository institutions or their
qualified holding companies issued between October 14, 2008 and June 30, 2009
(the “Debt Guarantee Program”). The Transaction Account Guarantee Program
is currently set to expire on June 30, 2010. In March 2009, the FDIC
extended the Debt Program until October 31, 2009. Further, for any senior debt
issued on or after April 1, 2009, the Debt Program will extend the FDIC
guarantee until December 31, 2012. The FDIC also adopted new surcharges on
debt issued under the Debt Program that have a maturity of one year or more and
are issued on or after April 1, 2009. These surcharges will be deposited in the
DIF.
All
eligible institutions participated in the program without cost for the first 30
days of the program. After November 12, 2008, institutions were assessed at the
rate of 10 basis points for transaction account balances in excess of $250,000
and at the rate of between 50 and 100 basis points of the amount of debt issued.
Included in the FDIC insurance premium expense noted above are premiums related
to this program of $7,000. Beginning in January 2010, institutions that did not
opt out of the Transaction Account Guarantee Program will pay an increased
assessment rate of 15 basis points for transaction account balances in excess of
$250,000. QNB continues to participate in the Transaction Account Guarantee
Program, but opted out of participation in the Debt Guarantee Program. Although
the transaction account guarantee program was originally scheduled to expire on
December 31, 2009, the FDIC implemented a final rule, effective as of October 1,
2009, extending the transaction account guarantee program by six months until
June 30, 2010 (subject to the option of participating institutions to opt out of
such six-month extension). QNB did not choose to opt out of the six-month
extension.
Federal
Home Loan Bank System
The Bank
is a member of the Federal Home Loan Bank of Pittsburgh (FHLB), which is one of
12 regional Federal Home Loan Banks. Each Federal Home Loan Bank serves as a
reserve or central bank for members within its assigned region. It is funded
primarily from funds deposited by member institutions and proceeds from the sale
of consolidated obligations of the Federal Home Loan Bank System. It makes loans
to members (i.e. advances) in accordance with policies and procedures
established by the board of directors of the Federal Home Loan Bank. At December
31, 2009, the Bank had $10 million in FHLB advances outstanding which matured
and were repaid in January 2010.
As a
member, the Bank is required to purchase and maintain stock in the FHLB in an
amount equal to the greater of 1% of its aggregate unpaid residential mortgage
loans, home purchase contracts or similar obligations at the beginning of each
year or 5% of its outstanding advances from the FHLB. At December 31, 2009, the
Bank had $2,279,000 in stock of the FHLB which was well in excess of the amount
needed to be in compliance with this requirement.
In
December 2008, the FHLB notified member banks that it was suspending dividend
payments and the repurchase of capital stock to preserve capital. Management’s
determination of whether these investments are impaired is based on their
assessment of the ultimate recoverability of their cost rather than by
recognizing temporary declines in value. The determination of whether a decline
affects the ultimate recoverability of their cost is influenced by criteria such
as (1) the significance of the decline in net assets of the FHLB as compared to
the capital stock amount for the FHLB and the length of time this situation has
persisted, (2) commitments by the FHLB to make payments required by law or
regulation and the level of such payments in relation to the operating
performance of the FHLB, and (3) the impact of legislative and regulatory
changes on institutions and, accordingly, on the customer base of the FHLB.
Management believes no impairment charge is necessary related to the FHLB
restricted stock as of December 31, 2009.
Emergency
Economic Stabilization Act of 2008
On
October 3, 2008, the Emergency Economic Stabilization Act of 2008 (EESA) was
signed into law. EESA, among other measures, authorizes the U.S. Treasury to
purchase from financial institutions and their holding companies up to $700
billion in mortgage loans, mortgage-related securities and certain other
financial instruments, including debt and equity securities issued by financial
institutions and their holding companies, under a troubled asset relief program,
or “TARP.” The purpose of TARP is to restore confidence and stability to the
U.S. banking system and to encourage financial institutions to increase their
lending to customers and to each other. Under the TARP Capital Purchase Program,
the U.S. Treasury purchased equity securities from participating institutions.
EESA also temporarily increased federal deposit insurance on most deposit
accounts from $100,000 to $250,000. This temporary increase is scheduled to
expire on December 31, 2013.
8
Incentive
Compensation
On
October 22, 2009, the Federal Reserve issued a comprehensive proposal on
incentive compensation policies (the “Incentive Compensation Proposal”) intended
to ensure that the incentive compensation policies of banking organizations do
not undermine the safety and soundness of such organizations by encouraging
excessive risk-taking. The Incentive Compensation Proposal, which covers all
employees that have the ability to materially affect the risk profile of an
organization, either individually or as part of a group, is based upon the key
principles that a banking organization’s incentive compensation arrangements
should (i) provide incentives that do not encourage risk-taking beyond the
organization’s ability to effectively identify and manage risks, (ii) be
compatible with effective internal controls and risk management, and (iii) be
supported by strong corporate governance, including active and effective
oversight by the organization’s board of directors. Any deficiencies in
compensation practices that are identified may be incorporated into the
organization’s supervisory ratings, which can affect its ability to make
acquisitions or perform other actions. The Incentive Compensation Proposal
provides that enforcement actions may be taken against a banking organization if
its incentive compensation arrangements or related risk-management control or
governance processes pose a risk to the organization’s safety and soundness and
the organization is not taking prompt and effective measures to correct the
deficiencies. In addition, on January 12, 2010, the FDIC announced that it would
seek public comment on whether banks with compensation plans that encourage
risky behavior should be charged higher deposit assessment rates than such banks
would otherwise be charged.
The scope
and content of the U.S. banking regulators’ policies on executive compensation
are continuing to develop and are likely to continue evolving in the near
future. It cannot be determined at this time whether compliance with such
policies will adversely affect the ability of QNB and the Bank to hire, retain
and motivate their key employees.
Community
Reinvestment Act
Under the
Community Reinvestment Act (CRA), as amended, the FDIC is required to assess all
financial institutions that it regulates to determine whether these institutions
are meeting the credit needs of the communities that they serve. The
act focuses specifically on low and moderate income neighborhoods. An
institution’s record is considered during the evaluation of any application made
by such institutions for, among other things:
|
·
|
Approval
of a branch or other deposit
facility;
|
|
·
|
An
office relocation or a merger;
and
|
|
·
|
Any
acquisition of bank
shares.
|
The CRA,
as amended, also requires that the regulatory agency make publicly available the
evaluation of the Bank’s record of meeting the credit needs of its entire
community, including low and moderate income neighborhoods. This
evaluation includes a descriptive rating of either outstanding, satisfactory,
needs to improve, or substantial noncompliance, and a statement describing the
basis for the rating. The Bank’s most recent CRA rating was
satisfactory.
USA
Patriot Act
The USA
Patriot Act strengthens the anti-money laundering provisions of the Bank Secrecy
Act. The Act requires financial institutions to establish certain
procedures to be able to identify and verify the identity of its customers.
Specifically the Bank must have procedures in place to:
|
·
|
Verify
the identity of persons applying to open an
account;
|
|
·
|
Ensure
adequate maintenance of the records used to verify a person’s identity;
and
|
|
·
|
Determine
whether a person is on any U.S. governmental agency list of known or
suspected terrorists or a terrorist
organization.
|
Check
21
In
October 2003, the Check Clearing for the 21st Century Act, also known as Check
21, became law. Check 21 gives “substitute checks,” such as a digital image of a
check and copies made from that image, the same legal standing as the original
paper check. Some major provisions of Check 21 include:
|
·
|
Allowing
check truncation without making it
mandatory;
|
|
·
|
Demanding
that every financial institution communicate to accountholders in writing
a description of its substitute check processing program and their rights
under the law;
|
|
·
|
Legalizing
substitutions for and replacements of paper checks without agreement from
consumers;
|
|
·
|
Retaining
in place the previously mandated electronic collection and return of
checks between financial institutions only when individual agreements are
in place;
|
|
·
|
Requiring
that when accountholders request verification, financial institutions
produce the original check (or a copy that accurately represents the
original) and demonstrate that the account debit was accurate and valid;
and
|
9
|
·
|
Requiring
recrediting of funds to an individual’s account on the next business day
after a consumer proves the financial institution has
erred.
|
Sarbanes-Oxley
Act of 2002
The
Sarbanes-Oxley Act is intended to bolster public confidence in the nation’s
capital markets by imposing new duties and penalties for non-compliance on
public companies and their executives, directors, auditors, attorneys and
securities analysts. Some of the more significant aspects of the Act
include:
|
·
|
Corporate
Responsibility for Financial Reports - requires Chief Executive Officers
(CEOs) and Chief Financial Officers (CFOs) to certify certain matters
relating to a company’s financial records and accounting and internal
controls.
|
|
|
·
|
Management
Assessment of Internal Controls - requires auditors to certify the
company’s underlying controls and processes that are used to compile the
financial results for companies that are accelerated
filers.
|
|
·
|
Real-time
Issuer Disclosures - requires that companies provide real-time disclosures
of any events that may affect its stock price or financial performance,
generally within a 48-hour
period.
|
|
·
|
Criminal
Penalties for Altering Documents - provides severe penalties for “whoever
knowingly alters, destroys, mutilates” any record or document with intent
to impede an investigation. Penalties include monetary fines and prison
time.
|
The Act
also imposes requirements for corporate governance, auditor independence,
accounting standards, audit committee member independence and increased
authority, executive compensation, insider loans and whistleblower protection.
As a result of the Act, QNB adopted a Code of Business Conduct and Ethics
applicable to its CEO, CFO and Controller, which meets the requirements of the
Act, to supplement its long-standing Code of Ethics, which applies to all
directors and employees.
QNB’s
Code of Business Conduct and Ethics can be found on the Bank’s website at
www.qnb.com.
Additional
Information
QNB’s
principal executive offices are located at 320 West Broad Street, Quakertown,
Pennsylvania. Its telephone number is (215) 538-5600.
This
annual report, including the exhibits and schedules filed as part of the annual
report on Form 10-K, may be inspected at the public reference facility
maintained by the Securities and Exchange Commission (SEC) at its public
reference room at 450 Fifth Street, NW, Washington, DC 20549 and copies of all,
or any part thereof, may be obtained from that office upon payment of the
prescribed fees. You may call the SEC at 1-800-SEC-0330 for further
information on the operation of the public reference room, and you can request
copies of the documents upon payment of a duplicating fee by writing to the
SEC. In addition, the SEC maintains a website that contains reports,
proxy and information statements and other information regarding registrants,
including QNB, that file electronically with the SEC which can be accessed at
www.sec.gov.
QNB also
makes its periodic and current reports available, free of charge, on its
website, www.qnb.com, as soon as reasonably practicable after such material is
electronically filed with the SEC. Information available on the
website is not a part of, and should not be incorporated into, this annual
report on Form 10-K.
ITEM
1A. RISK FACTORS
The
following discusses risks that management believes are specific to our business
and could have a negative impact on QNB’s financial performance. When
analyzing an investment in QNB, the risks and uncertainties described below,
together with all of the other information included or incorporated by reference
in this report, should be carefully considered. This list should not be viewed
as comprehensive and may not include all risks that may affect the financial
performance of QNB.
Economic
and Market Risk
As
discussed in the section “Supervision and Regulation,” the Board of Governors of
the Federal Reserve System, the U.S. Congress, the U.S. Treasury, the FDIC, the
SEC and others have taken numerous actions to address the current liquidity and
credit crisis that has followed the subprime meltdown that commenced in 2007.
These measures include homeowner relief that encourage loan restructuring and
modification; the establishment of significant liquidity and credit facilities
for financial institutions and investment banks; the lowering of the Federal
funds rate; emergency action against short selling practices; a temporary
guaranty program for money market funds; the establishment of a commercial paper
funding facility to provide back-stop liquidity to commercial paper issuers; and
coordinated international efforts to address illiquidity and other weaknesses in
the banking sector.
10
The
purpose of these legislative and regulatory actions is to stabilize the U.S.
banking system. EESA and the other regulatory initiatives described above may
not have their desired effects. If the volatility in the markets continues and
economic conditions fail to improve or worsen, our business, financial
condition, results of operations and cash flows could be materially and
adversely affected.
Dramatic
declines in the U.S. housing market over the past two years, with decreasing
home prices and increasing delinquencies and foreclosures, may have a negative
impact on the credit performance of mortgage, consumer, commercial and
construction loan portfolios resulting in significant write-downs of assets by
many financial institutions. In addition, the values of real estate collateral
supporting many loans have declined and may continue to decline. General
downward economic trends, reduced availability of commercial credit and
increasing unemployment may negatively impact the credit performance of
commercial and consumer credit, resulting in additional write-downs.
Concerns
over the stability of the financial markets and the economy have resulted in
decreased lending by some financial institutions to their customers and to each
other. This market turmoil and tightening of credit has led to increased
commercial and consumer deficiencies, lack of customer confidence, increased
market volatility and widespread reduction in general business activity. The
resulting economic pressure on consumers and businesses and the lack of
confidence in the financial markets may adversely affect our business, financial
condition, results of operations and stock price. A worsening of these
conditions would likely exacerbate the adverse effects of these difficult market
conditions on us and others in the industry. In particular, we may face the
following risks in connection with these events:
|
·
|
We
expect to face increased regulation of our industry. Compliance with such
regulation may increase our costs and limit our ability to pursue business
opportunities.
|
|
·
|
Our
ability to assess the creditworthiness of customers and to estimate the
losses inherent in our credit exposure is made more complex by these
difficult market and economic
conditions.
|
|
·
|
We
also may be required to pay even higher FDIC premiums than the recently
increased level, because financial institution failures resulting from the
depressed market conditions have depleted and may continue to deplete the
deposit insurance fund and reduce its ratio of reserves to insured
deposits.
|
|
·
|
Our
ability to borrow from other financial institutions or the FHLB could be
adversely affected by further disruptions in the capital markets or other
events.
|
|
·
|
We
may experience increases in foreclosures, delinquencies and customer
bankruptcies.
|
Interest
Rate Risk
QNB’s
profitability is largely a function of the spread between the interest rates
earned on earning assets and the interest rates paid on deposits and other
interest-bearing liabilities. Like most financial institutions, QNB’s
net interest income and margin will be affected by general economic conditions
and other factors, including fiscal and monetary policies of the Federal
Government, that influence market interest rates and QNB’s ability to respond to
changes in such rates. At any given time, QNB’s assets and liabilities may be
such that they are affected differently by a change in interest rates. As a
result, an increase or decrease in rates, the length of loan terms or the mix of
adjustable- and fixed-rate loans or investment securities in QNB’s portfolio
could have a positive or negative effect on its net income, capital and
liquidity. Although management believes it has implemented strategies and
guidelines to reduce the potential effects of adverse changes in interest rates
on results of operations, any substantial and prolonged change in market
interest rates could affect operating results negatively.
The yield
curve for the various maturities of U.S. Treasury securities provides a
fundamental barometer that gauges the prevailing interest rate profile and,
simultaneously, acts as a guidepost for current loan and deposit pricing
constraints. The slope of the yield curve is driven primarily by expectations
for future interest rate increases and inflationary trends. A normal yield curve
has a slope that reflects lower costs for shorter-term financial instruments,
accompanied by increases in costs for longer term instruments all along the
maturity continuum.
Short-term
interest rates are highly influenced by the monetary policy of the Federal
Reserve. The Federal Open Market Committee, a committee of the Federal Reserve,
targets the Federal funds rate, the overnight rate at which banks borrow or lend
excess funds between financial institutions. This rate serves as a benchmark for
the overnight money costs, and correspondingly influences the pricing of a
significant portion of a bank’s deposit funding sources. Intermediate and
longer-term interest rates, unlike the Federal funds rate, are more directly
influenced by external market forces, including perceptions about future
interest rates and inflation. These trends, in turn, influence the pricing on
mid- and long-term loan commitments as well as deposits and bank borrowings that
have scheduled maturities.
11
Generally
speaking, a yield curve with a higher degree of slope provides more opportunity
to increase the spread between earning asset yields and funding costs. It should
be emphasized that while the yield curve is a critical benchmark in setting
prices for various monetary assets and liabilities in banks, its influence is
not exerted in a vacuum. Credit risk, market risk, competitive issues, and
other factors must all be considered in the pricing of financial
instruments.
A steep
or highly-sloped yield curve may be a precursor of higher interest rates or
elevated inflation in the future, while a flat yield curve may be characteristic
of a Federal Reserve policy designed to calm an overheated economy by tightening
credit availability via increases in short-term rates. If other rates along the
maturity spectrum do not rise correspondingly, the yield curve can be expected
to flatten. This scenario may reflect an economic outlook that has little or no
expectation of higher future interest rates or higher rates of inflation. For
banks, the presence of a flat yield curve for a prolonged or sustained period
could measurably lower expectations for expanding the net interest
margin.
An
inverted yield curve is the opposite of a normal yield curve and is
characterized by short-term rates that are higher than longer-term rates. The
presence of an inverted yield curve is considered to be an anomaly that is
almost counterintuitive to the core business of banking. Inverted yield curves
do not typically exist for more than a short period of time. In past economic
cycles, the presence of an inverted yield curve has frequently foreshadowed a
recession. The recent recession may suppress future asset growth trends and/or
increase the influence of other forms of risk, such as credit risk, which could
hamper opportunities for revenue expansion and earnings growth in the near
term.
Credit
Risk
As a
lender, QNB is exposed to the risk that its borrowers may be unable to repay
their loans and that the current market value of any collateral securing the
payment of their loans may not be sufficient to assure repayment in
full. Credit losses are inherent in the lending business and could
have a material adverse effect on the operating results of
QNB. Adverse changes in the economy or business conditions, either
nationally or in QNB’s market areas, could increase credit-related losses and
expenses and/or limit growth. Substantially all of QNB’s loans are to businesses
and individuals in its limited geographic area and any economic decline in this
market could impact QNB adversely. QNB makes various assumptions and judgments
about the collectability of its loan portfolio and provides an allowance for
loan losses based on a number of factors. If these assumptions are
incorrect, the allowance for loan losses may not be sufficient to cover losses
and may cause QNB to increase the allowance in the future by increasing the
provision for loan losses, thereby having an adverse effect on operating
results. QNB has adopted underwriting and credit monitoring procedures and
credit policies that management believes are appropriate to control these risks;
however, such policies and procedures may not prevent unexpected losses that
could have a material adverse affect on QNB’s financial condition or results of
operations.
Competition
The
financial services industry is highly competitive with competition for
attracting and retaining deposits and making loans coming from other banks and
savings institutions, credit unions, mutual fund companies, insurance companies
and other non-bank businesses. Many of QNB’s competitors are much larger in
terms of total assets and market capitalization, have a higher lending limit,
have greater access to capital and funding, and offer a broader array of
financial products and services. In light of this, QNB’s ability to continue to
compete effectively is dependent upon its ability to maintain and build
relationships by delivering top quality service.
At
December 31, 2009, our lending limit per borrower was approximately $8,615,000.
Accordingly, the size of loans that we may offer to potential borrowers (without
participation by other lenders) is less than the size of loans that many of our
competitors with larger capitalization are able to offer. Our legal lending
limit also impacts the efficiency of our lending operation because it tends to
lower our average loan size, which means we have to generate a higher number of
transactions to achieve the same portfolio volume. We may engage in loan
participations with other banks for loans in excess of our legal lending limit.
However, there can be no assurance that such participations will be available or
on terms which are favorable to us and our customers.
Impairment
Risk
QNB
regularly purchases U.S. Government and U.S. Government agency debt securities,
U.S. Government agency issued mortgage-backed securities or collateralized
mortgage obligation securities, corporate debt securities and equity
securities. QNB is exposed to the risk that the issuers of these
securities may experience significant deterioration in credit quality which
could impact the market value of the issue. QNB periodically
evaluates its investments to determine if market value declines are
other-than-temporary. Once a decline is determined to be
other-than-temporary, the value of the security is reduced and a corresponding
charge to earnings is recognized for the credit related portion of the
impairment.
12
The Bank
holds eight pooled trust preferred securities with an amortized cost of
$4,073,000 and a fair value as of December 31, 2009 of $1,008,000. All of the
trust preferred securities are available-for-sale securities and are carried at
fair value. Currently, the market for these securities is not active and markets
for similar securities also are not active. The inactivity was evidenced first
by a significant widening of the bid-ask spread in the brokered markets in which
pooled trust preferred securities trade and then by a significant decrease in
the volume of trades relative to historical levels. The new issue market is also
inactive as no new pooled trust preferred securities have been issued since
2007. There are currently very few market participants who are willing and or
able to transact for these securities. The market values for these securities
are very depressed relative to historical levels. These securities are comprised
mainly of securities issued by banks, and to a lesser degree, insurance
companies. The Bank owns the mezzanine tranches of these securities.
On a
quarterly basis, we evaluate our debt securities for other-than-temporary
impairment (OTTI), which involves the use of a third-party valuation firm to
assist management with the valuation. When evaluating these investments a credit
related portion and a non-credit related portion of OTTI are determined. All of
the pooled trust preferred collateralized debt obligations held by QNB are rated
lower than AA and are measured for OTTI within the scope of ASC 325 (formerly
known as EITF 99-20-1). QNB performs a discounted cash flow analysis on all of
its impaired debt securities to determine if the amortized cost basis of an
impaired security will be recovered. In determining whether a credit loss
exists, QNB uses its best estimate of the present value of cash flows expected
to be collected from the debt security and discounts them at the effective yield
implicit in the security at the date of acquisition. The discounted cash flow
analysis is considered to be the primary evidence when determining whether
credit related other-than-temporary impairment exists. The credit related
portion is recognized in earnings and represents the expected shortfall in
future cash flows. The non-credit related portion is recognized in other
comprehensive income and represents the difference between the fair value of the
security and the amount of credit related impairment. During 2009, $1,002,000 in
OTTI charges representing credit impairment were recognized on our investment in
pooled trust preferred collateralized debt obligations.
The
Company’s investment in marketable equity securities primarily consists of
investments in large cap stock companies. These equity securities are analyzed
for impairment on an ongoing basis. As a result of declines in equity values
during 2009, $521,000 of other-than-temporary impairment charges were taken in
2009. QNB had four equity securities with unrealized losses of $14,000 at
December 31, 2009. The severity and duration of the impairment is
consistent with current stock market developments. Management believes these
equity securities in an unrealized loss position will recover in the foreseeable
future. QNB evaluated the near-term prospects of the issuers in relation to the
severity and duration of the impairment. Based on that evaluation and the
Company’s ability and intent to hold those securities for a reasonable period of
time sufficient for a forecasted recovery of fair value, the Company does not
consider these equity securities to be other-than-temporarily impaired.
The Bank
is a member of the FHLB and is required to purchase and maintain stock in the
FHLB in an amount equal to the greater of 1% of its aggregate unpaid residential
mortgage loans, home purchase contracts or similar obligations at the beginning
of each year or 5% of its outstanding advances from the FHLB. At December 31,
2009, the Bank had $2,279,000 in stock of the FHLB which was in compliance with
this requirement. These equity securities are restricted in that they can only
be sold back to the respective institutions or another member institution at
par. Therefore, they are less liquid than other tradable equity securities,
their fair value is equal to amortized cost, and no impairment write-downs have
been recorded on these securities.
In
December 2008, the FHLB of Pittsburgh notified member banks that it was
suspending dividend payments and the repurchase of capital stock to preserve
capital. Management’s determination of whether these investments are impaired is
based on their assessment of the ultimate recoverability of their cost rather
than by recognizing temporary declines in value. The determination of whether a
decline affects the ultimate recoverability of their cost is influenced by
criteria such as (1) the significance of the decline in net assets of the FHLB
as compared to the capital stock amount for the FHLB and the length of time this
situation has persisted, (2) commitments by the FHLB to make payments required
by law or regulation and the level of such payments in relation to the operating
performance of the FHLB, and (3) the impact of legislative and regulatory
changes on institutions and, accordingly, on the customer base of the FHLB.
After evaluating all of these considerations, management believes the par value
of its shares will be recovered and no impairment charge is necessary related to
such restricted stock as of December 31, 2009. Future evaluations of the above
mentioned factors could result in QNB recognizing an impairment charge.
Third-Party
Risk
Third
parties provide key components of the business infrastructure such as Internet
connections and network access. Any disruption in Internet, network access or
other voice or data communication services provided by these third parties or
any failure of these third parties to handle current or higher volumes of use
could affect adversely the ability to deliver products and services to clients
and otherwise to conduct business. Technological or financial difficulties of a
third-party service provider could affect adversely the business to the extent
those difficulties result in the interruption or discontinuation of services
provided by that party.
13
Technology
Risk
The
market for financial services is increasingly affected by advances in
technology, including developments in telecommunications, data processing,
computers, automation, Internet-based banking and telebanking. Our ability to
compete successfully in our markets may depend on the extent to which we are
able to exploit such technological changes. However, we can provide no assurance
that we will be able to properly or timely anticipate or implement such
technologies or properly train our staff to use such technologies. Any failure
to adapt to new technologies could adversely affect our business, financial
condition or operating results.
Changes
in accounting standards
Our
accounting policies and methods are fundamental to how we record and report our
financial condition and results of operations. From time to time the Financial
Accounting Standards Board (FASB) changes the financial accounting and reporting
standards that govern the preparation of our financial statements. These changes
can be hard to predict and can materially impact how we record and report our
financial condition and results of operations. In some cases, we could be
required to apply a new or revised standard retroactively, resulting in our
restating prior period financial statements.
Government
Regulation and Supervision
The
banking industry is heavily regulated under both Federal and state
law. Banking regulations, designed primarily for the safety of
depositors, may limit a financial institution’s growth and the return to its
investors, by restricting such activities as the payment of dividends, mergers
with or acquisitions by other institutions, expansion of branch offices and the
offering of securities. QNB is also subject to capitalization guidelines
established by Federal law and could be subject to enforcement actions to the
extent that its subsidiary bank is found, by regulatory examiners, to be
undercapitalized. It is difficult to predict what changes, if any,
will be made to existing Federal and state legislation and regulations or the
effect that such changes may have on QNB’s future business and earnings
prospects. Any substantial changes to applicable laws or regulations could
subject QNB to additional costs, limit the types of financial services and
products it may offer, and inhibit its ability to compete with other financial
service providers.
FDIC
Insurance Premiums
Since
2008, higher levels of bank failures have dramatically increased the claims
against the deposit insurance fund. In addition, the FDIC instituted two
temporary programs to further insure customer deposits at FDIC insured banks:
deposit accounts are now insured up to $250,000 per customer (up from $100,000)
and noninterest-bearing transactional accounts are fully insured (unlimited
coverage). These programs have placed additional stress on the deposit insurance
fund. In order to maintain a strong funding position and restore reserve
ratios of the deposit insurance fund, the FDIC has increased assessment rates of
insured institutions. In addition, on November 12, 2009, the FDIC adopted a rule
requiring banks to prepay three years of estimated deposit insurance premiums.
The Company is generally unable to control the amount of premiums that the Bank
is required to pay for FDIC insurance. If there are additional bank failures, or
the cost of resolving prior failures exceeds expectations, the Bank may be
required to pay even higher FDIC premiums than the recently increased levels.
These announced increases and any future increases or required prepayments of
FDIC insurance premiums may adversely impact the Company’s earnings and
financial condition.
Internal
Controls and Procedures
Management
diligently reviews and updates its internal controls, disclosure controls and
procedures, and corporate governance policies and procedures. Our
disclosure controls and procedures are designed to reasonably assure that
information required to be disclosed by QNB in reports filed or submitted under
the Exchange Act is accumulated and communicated to management, and recorded,
processed, summarized, and reported within the time periods specified in the
SEC’s rules and forms. Management believes that any disclosure controls and
procedures or internal controls and procedures, no matter how well conceived and
operated, can provide only reasonable, not absolute, assurance that the
objectives of the control system are met. Any undetected circumvention of these
controls could have a material adverse impact on QNB’s financial condition and
results of operations.
These
inherent limitations include the realities that judgments in decision-making can
be faulty, and that breakdowns can occur because of simple error or mistake.
Additionally, controls can be circumvented by the individual acts of some
persons, by collusion of two or more people or by an unauthorized override of
the controls. Accordingly, because of the inherent limitations in our control
system, misstatements due to error or fraud may occur and not be
detected.
Attracting
and Retaining Skilled Personnel
Our
success depends upon the ability to attract and retain highly motivated,
well-qualified personnel. We face significant competition in the recruitment of
qualified employees. Our ability to execute our business strategy and provide
high quality service may suffer if we are unable to recruit or retain a
sufficient number of qualified employees or if the costs of employee
compensation or benefits increase substantially. QNB currently has employment
agreements and change of control agreements with two of its senior
officers.
14
ITEM
1B. UNRESOLVED STAFF COMMENTS
None.
ITEM
2. PROPERTIES
QNB Bank
and QNB Corp.’s principal office is located at 15 North Third Street,
Quakertown, Pennsylvania. QNB Bank conducts business from its principal office
and eight other retail offices located in upper Bucks, southern Lehigh, and
northern Montgomery counties in Pennsylvania. QNB Bank owns its principal
office, two retail locations, its operations facility and a computer facility.
QNB Bank leases its remaining six retail properties, as well as a parcel of land
which will be the new location of the Wescosville branch once construction is
completed. The leases on the properties generally contain renewal options. In
management’s opinion, these properties are in good condition and are currently
adequate for QNB’s purposes.
The
following table details QNB Bank’s properties:
Location
|
Quakertown,
PA
|
-
|
Downtown
Office
|
Owned
|
|
15 North Third Street
|
|||
|
Quakertown,
PA
|
-
|
Towne
Bank Center
|
Owned
|
|
320-322 West Broad Street
|
|||
|
Quakertown,
PA
|
-
|
Computer
Center
|
Owned
|
|
121 West Broad Street
|
|||
|
Quakertown,
PA
|
-
|
Country
Square Office
|
Leased
|
|
240 South West End Boulevard
|
|||
|
Quakertown,
PA
|
-
|
Quakertown
Commons Branch
|
Leased
|
|
901 South West End Boulevard
|
|||
|
Dublin,
PA
|
-
|
Dublin
Branch
|
Leased
|
|
161 North Main Street
|
|||
|
Pennsburg,
PA
|
-
|
Pennsburg
Square Branch
|
Leased |
|
410-420 Pottstown Avenue
|
|||
| Coopersburg, PA | - |
Coopersburg
Branch
|
Owned
|
|
51 South Third Street
|
|
Perkasie,
PA
|
-
|
Perkasie
Branch
|
Owned
|
|
607 Chestnut Street
|
|||
|
Souderton,
PA
|
-
|
Souderton
Branch
|
Leased
|
|
750 Route 113
|
|||
|
Wescosville,
PA
|
-
|
Wescosville
Branch
|
Leased |
|
1042 Mill Creek Road
|
|||
|
Wescosville,
PA
|
-
|
Wescosville
Land for Permanent Branch
950 Mill Creek
Road
|
Leased |
ITEM
3. LEGAL PROCEEDINGS
Although
there is currently no material litigation to which QNB is the subject, future
litigation that arises during the normal course of QNB’s business could be
material and have a negative impact on QNB’s earnings. Future
litigation also could adversely impact the reputation of QNB in the communities
that it serves.
ITEM
4. [REMOVED AND RESERVED]
15
PART
II
ITEM
5. MARKET FOR THE REGISTRANT’S COMMON EQUITY, RELATED STOCKHOLDER MATTERS AND
ISSUER PURCHASES OF EQUITY SECURITIES
Stock
Information
QNB
common stock is quoted on the over-the-counter bulletin board (OTCBB). QNB had
approximately 1,200 shareholders of record as of February 28, 2010.
The
following table sets forth the high and low bid and ask stock prices for QNB
common stock on a quarterly basis during 2009 and 2008. These prices reflect
inter-dealer prices, without retail mark-up, mark-down or commission and may not
necessarily represent actual transactions.
|
Cash
|
||||||||||||||||||||
|
High
|
Low
|
Dividend
|
||||||||||||||||||
|
Bid
|
Ask
|
Bid
|
Ask
|
Per Share
|
||||||||||||||||
|
2009
|
||||||||||||||||||||
|
First
Quarter
|
$ | 18.00 | $ | 20.00 | $ | 15.55 | $ | 16.00 | $ | 0.24 | ||||||||||
|
Second
Quarter
|
18.40 | 19.30 | 16.25 | 16.85 | 0.24 | |||||||||||||||
|
Third
Quarter
|
17.06 | 18.25 | 16.05 | 16.15 | 0.24 | |||||||||||||||
|
Fourth
Quarter
|
18.00 | 18.90 | 16.20 | 16.50 | 0.24 | |||||||||||||||
|
2008
|
||||||||||||||||||||
|
First
Quarter
|
$ | 24.00 | $ | 25.00 | $ | 19.25 | $ | 19.90 | $ | 0.23 | ||||||||||
|
Second
Quarter
|
22.00 | 23.00 | 19.25 | 19.65 | 0.23 | |||||||||||||||
|
Third
Quarter
|
20.00 | 21.70 | 16.05 | 16.75 | 0.23 | |||||||||||||||
|
Fourth
Quarter
|
19.50 | 20.50 | 15.50 | 16.15 | 0.23 | |||||||||||||||
QNB has
traditionally paid quarterly cash dividends on the last Friday of each
quarter. The Company expects to continue the practice of paying
quarterly cash dividends to its shareholders; however, future dividends are
dependent upon future earnings, financial condition, appropriate legal
restrictions, and other factors relevant at the time the board of directors
considers declaring a dividend. Certain laws restrict the amount of dividends
that may be paid to shareholders in any given year. See “Capital
Adequacy” found on page 43 of this Form 10-K filing, and Note 20 of the Notes to
Consolidated Financial Statements, found on page 76 of this Form 10-K filing,
for the information that discusses and quantifies this regulatory
restriction.
The
following table provides information on repurchases by QNB of its common stock
in each month of the quarter ended December 31, 2009.
|
Total
Number
|
Average
|
Total
Number of Shares Purchased
as
Part of
|
Maximum
Number
of
Shares
that
may
yet
be
|
|||||||||||||
|
of
Shares
|
Price
Paid
|
Publicly
Announced |
Purchased
Under
|
|||||||||||||
|
Period
|
Purchased
|
per
Share
|
Plan
|
the
Plan
|
||||||||||||
|
October
1, 2009 through October 31, 2009
|
– | N/A | – | 42,117 | ||||||||||||
|
November
1, 2009 through November 30, 2009
|
– | N/A | – | 42,117 | ||||||||||||
|
December
1, 2009 through December 31, 2009
|
– | N/A | – | 42,117 | ||||||||||||
|
(1)
|
Transactions
are reported as of settlement dates.
|
|
|
(2)
|
QNB’s
current stock repurchase plan was approved by its Board of Directors and
announced on January 24, 2008 and subsequently increased on February 9,
2009.
|
|
(3)
|
The
number of shares approved for repurchase under QNB’s current stock
repurchase plan is 100,000 as of the filing of this Form
10-K.
|
|
(4)
|
QNB’s
current stock repurchase plan has no expiration
date.
|
|
(5)
|
QNB
has no stock repurchase plan that it has determined to terminate or under
which it does not intend to make further
purchases.
|
16
Stock
Performance Graph
Set forth
below is a performance graph comparing the yearly cumulative total shareholder
return on QNB’s common stock with:
|
·
|
the yearly cumulative total shareholder return on stocks
included in the NASDAQ Market Index, a broad market
index;
|
|
|
·
|
the
yearly cumulative total shareholder return on the SNL $500M to $1B Bank
Index, a group encompassing publicly traded banking companies trading on
the NYSE, AMEX, or NASDAQ with assets between $500 million and $1
billion;
|
|
·
|
the yearly cumulative total shareholder return
on the SNL Mid-Atlantic Bank Index, a group encompassing publicly traded
banking companies trading on the NYSE, AMEX, or NASDAQ headquartered in
Delaware, District of Columbia, Maryland, New Jersey, New York,
Pennsylvania, and Puerto
Rico.
|
All of
these cumulative total returns are computed assuming the reinvestment of
dividends at the frequency with which dividends were paid during the applicable
years.
QNB
Corp.
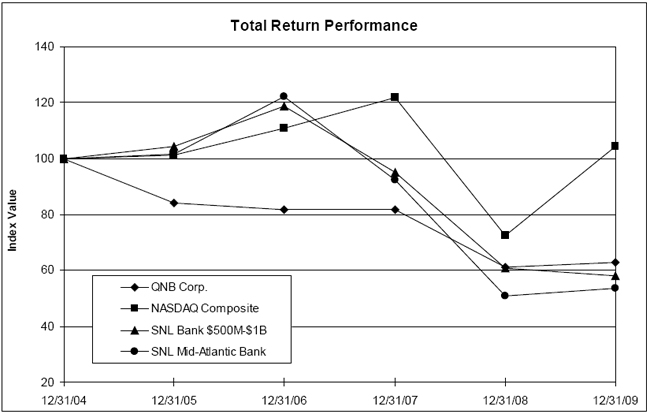
|
Period
Ending
|
||||||||||||||||||||||||
|
Index
|
12/31/04
|
12/31/05
|
12/31/06
|
12/31/07
|
12/31/08
|
12/31/09
|
||||||||||||||||||
|
QNB
Corp.
|
100.00 | 83.99 | 81.88 | 81.61 | 61.18 | 62.79 | ||||||||||||||||||
|
NASDAQ
Composite
|
100.00 | 101.37 | 111.03 | 121.92 | 72.49 | 104.31 | ||||||||||||||||||
|
SNL
$500M-$1B Bank Index
|
100.00 | 104.29 | 118.61 | 95.04 | 60.90 | 58.00 | ||||||||||||||||||
|
SNL
Mid-Atlantic Bank Index
|
100.00 | 101.77 | 122.14 | 92.37 | 50.88 | 53.56 | ||||||||||||||||||
|
Source
: SNL Financial LC, Charlottesville, VA
|
||||||||||||||||||||||||
17
ITEM
6. SELECTED
FINANCIAL AND OTHER DATA (in thousands, except share and per share
data)
|
Year
Ended December 31,
|
2009
|
2008
|
2007
|
2006
|
2005
|
|||||||||||||||
|
Income
and Expense
|
||||||||||||||||||||
|
Interest
income
|
$ | 35,368 | $ | 35,285 | $ | 35,305 | $ | 32,002 | $ | 28,272 | ||||||||||
|
Interest
expense
|
13,667 | 15,319 | 17,738 | 15,906 | 11,988 | |||||||||||||||
|
Net
interest income
|
21,701 | 19,966 | 17,567 | 16,096 | 16,284 | |||||||||||||||
|
Provision
for loan losses
|
4,150 | 1,325 | 700 | 345 | – | |||||||||||||||
|
Non-interest
income
|
3,885 | 3,300 | 907 | 3,937 | 3,262 | |||||||||||||||
|
Non-interest
expense
|
16,586 | 14,628 | 14,441 | 13,234 | 13,102 | |||||||||||||||
|
Income
before income taxes
|
4,850 | 7,313 | 3,333 | 6,454 | 6,444 | |||||||||||||||
|
Provision
for income taxes
|
623 | 1,560 | 286 | 1,034 | 1,398 | |||||||||||||||
|
Net
income
|
$ | 4,227 | $ | 5,753 | $ | 3,047 | $ | 5,420 | $ | 5,046 | ||||||||||
|
Share
and Per Share Data
|
||||||||||||||||||||
|
Net
income - basic
|
$ | 1.37 | $ | 1.83 | $ | 0.97 | $ | 1.73 | $ | 1.63 | ||||||||||
|
Net
income - diluted
|
1.36 | 1.82 | 0.96 | 1.71 | 1.59 | |||||||||||||||
|
Book
value
|
18.24 | 17.21 | 16.99 | 16.11 | 15.00 | |||||||||||||||
|
Cash
dividends
|
0.96 | 0.92 | 0.88 | 0.84 | 0.78 | |||||||||||||||
|
Average
common shares outstanding - basic
|
3,094,624 | 3,135,608 | 3,130,179 | 3,124,724 | 3,101,754 | |||||||||||||||
|
Average
common shares outstanding - diluted
|
3,103,433 | 3,161,326 | 3,174,873 | 3,176,710 | 3,174,647 | |||||||||||||||
|
Balance
Sheet at Year-end
|
||||||||||||||||||||
|
Federal
funds sold
|
– | $ | 4,541 | – | $ | 11,664 | – | |||||||||||||
|
Investment
securities available-for-sale
|
$ | 256,862 | 219,597 | $ | 191,552 | 219,818 | $ | 233,275 | ||||||||||||
|
Investment
securities held-to-maturity
|
3,347 | 3,598 | 3,981 | 5,021 | 5,897 | |||||||||||||||
|
Restricted
investment in bank stocks
|
2,291 | 2,291 | 954 | 3,465 | 3,684 | |||||||||||||||
|
Loans
held-for-sale
|
534 | 120 | 688 | 170 | 134 | |||||||||||||||
|
Loans
receivable
|
449,421 | 403,579 | 381,016 | 343,496 | 301,349 | |||||||||||||||
|
Allowance
for loan losses
|
(6,217 | ) | (3,836 | ) | (3,279 | ) | (2,729 | ) | (2,526 | ) | ||||||||||
|
Other
earning assets
|
22,158 | 1,314 | 579 | 778 | 1,018 | |||||||||||||||
|
Total
assets
|
762,426 | 664,394 | 609,813 | 614,539 | 582,205 | |||||||||||||||
|
Deposits
|
634,103 | 549,790 | 494,124 | 478,922 | 458,670 | |||||||||||||||
|
Borrowed
funds
|
63,433 | 56,663 | 58,990 | 82,113 | 74,596 | |||||||||||||||
|
Shareholders’
equity
|
56,426 | 53,909 | 53,251 | 50,410 | 46,564 | |||||||||||||||
|
Selected
Financial Ratios
|
||||||||||||||||||||
|
Net
interest margin
|
3.42 | % | 3.56 | % | 3.32 | % | 3.12 | % | 3.24 | % | ||||||||||
|
Net
income as a percentage of:
|
||||||||||||||||||||
|
Average
total assets
|
0.59 | 0.91 | 0.51 | 0.91 | 0.86 | |||||||||||||||
|
Average
shareholders’ equity
|
7.73 | 10.76 | 5.94 | 10.89 | 10.83 | |||||||||||||||
|
Average
shareholders’ equity to average total assets
|
7.70 | 8.47 | 8.51 | 8.37 | 7.98 | |||||||||||||||
|
Dividend
payout ratio
|
70.31 | 50.17 | 90.42 | 48.45 | 47.96 | |||||||||||||||
ITEM
7. MANAGEMENT’S DISCUSSION AND ANALYSIS OF FINANCIAL CONDITION AND RESULTS OF
OPERATIONS
Results
of Operations – Overview
QNB Corp.
(QNB or the Company) earns its net income primarily through its subsidiary, QNB
Bank (the Bank). Net interest income, or the spread between the interest,
dividends and fees earned on loans and investment securities and the expense
incurred on deposits and other interest-bearing liabilities, is the primary
source of operating income for QNB. QNB seeks to achieve sustainable and
consistent earnings growth while maintaining adequate levels of capital and
liquidity and limiting its exposure to credit and interest rate risk levels
approved by the Board of Directors. Due to its limited geographic area,
comprised principally of upper Bucks, southern Lehigh and northern Montgomery
counties, growth is pursued through expansion of existing customer relationships
and building new relationships by stressing a consistent high level of service
at all points of contact.
Tabular
information, other than share and per share data, is presented in thousands of
dollars.
Net
income for the year ended December 31, 2009 was $4,227,000, or $1.36 per share
on a diluted basis, compared to net income of $5,753,000, or $1.82 per share on
a diluted basis, for the year ended December 31, 2008.
Two
important measures of profitability in the banking industry are an institution’s
return on average assets and return on average shareholders’ equity. Return on
average assets was 0.59% and 0.91% in 2009 and 2008, respectively, and return on
average shareholders’ equity was 7.73% and 10.76% in those same periods,
respectively.
The core
functions of the Bank, gathering deposits and making loans, continued to show
strength and contributed positively to the results for both 2009 and 2008.
However, the challenging economic environment and the continued uncertainty in
the financial markets negatively impacted QNB’s earnings performance during
these same periods as QNB had to increase its provision for loan losses and
recognize credit related other-than-temporary impairment charges (OTTI) on
investment securities. In addition, results for 2009 were impacted by higher
industry-wide FDIC insurance premiums plus a special industry-wide FDIC
assessment. These FDIC actions were a result of bank failures which
significantly impacted the level of the Deposit Insurance Fund.
18
2009
versus 2008
The
results for 2009 include the following significant components:
Net
interest income increased $1,735,000, or 8.7%, to $21,701,000 for
2009.
|
·
|
During
2008, in response to liquidity issues in the world’s credit markets, the
bursting of the housing bubble with the fallout of increased foreclosures,
a deepening recession and increased unemployment, the Federal Reserve’s
Open Market Committee (Fed) accelerated the pace of reducing the Federal
funds target rate. The Fed reduced the Federal funds target rate by
400-425 basis points between January 2008 and December 2008, bringing the
target rate from 4.25% at January 1, 2008 to a range of 0% to 0.25% at
December 31, 2008. In response, the prime lending rate was also reduced
from 7.25% at December 31, 2007 to 3.25% at December 31, 2008. As a result
of these events the Treasury yield curve steepened during 2008 as
short-term Treasury rates plunged to zero, and even went negative, and
ten-year Treasury notes reached historic lows. At the end of 2008, the
three-month T-bill rate was 0.11%, a decline of 325 basis points from
prior year end, the two-year note was 0.76%, down 229 basis points from
December 31, 2007, and the ten-year note’s yield was 2.25%, a decline of
179 basis points from December 31, 2007. The economy continued to struggle
during 2009 and the Fed remained active with its liquidity programs while
the government used fiscal stimulus to spark the economy. While the
economy has shown signs of improvement the Fed has maintained its strategy
of keeping short-term rates low. As a result, the yield curve continued to
steepen during 2009 as longer term rates increased markedly while
short-term yields rose only slightly. At December 31, 2009, the
three-month T-bill rate was 0.07%, the two-year note’s yield was 1.15% and
the ten-year note’s yield was 3.88%. In addition, the spread on
virtually all debt securities tightened during 2009, which ultimately had
the greatest impact on the yield on the investment portfolio as cash flow
and deposit growth were reinvested at lower
rates.
|
|
·
|
Average
earning assets increased $80,746,000, or 13.4%, to $683,192,000 for 2009
with average loans increasing $44,926,000, or 11.7%, and average
investment securities increasing $32,367,000, or 15.4%. The growth in
loans was centered primarily in loans secured by commercial real estate or
commercial and industrial loans.
|
|
·
|
Funding the growth in earning assets was an increase in average total deposits of $77,386,000, or 15.0%, to $594,328,000 for 2009. The growth is a result of increases in both core deposits, including checking, savings and money market accounts, as well as time deposits. The growth in interest bearing checking accounts and savings accounts reflects the positive response to the introduction of two high rate deposit products, eRewards Checking and Online eSavings as well as customer’s desire to do business with a strong institution that believes in community bank principles. |
|
·
|
The net interest margin for 2009 was 3.42%, a decline of 14 basis points from the margin of 3.56% reported in 2008. The decline in the net interest margin is primarily the result of the yield on investment securities and short-term liquid assets like Federal funds and interest-earning cash accounts declining to a greater degree than the cost of deposits. An increase in non-earning assets including non-accruing loans, trust preferred securities and Federal Home Loan Bank stock also contributed to the decline in the net interest margin. |
QNB
recorded a provision for loan losses of $4,150,000 for 2009, compared with
$1,325,000 for 2008. The significant increase in the provision for loan losses
reflects the recent economic conditions, which has resulted in an increase in
net charge-offs and higher levels of non-performing loans and delinquent loans.
The significant growth in loans also contributed to the need for a higher
provision for loan losses.
|
·
|
Net
charge-offs for 2009 were $1,769,000, or 0.41% of average total loans, as
compared with $768,000, or 0.20% of average total loans for
2008.
|
|
·
|
Total
non-performing loans, which represent loans on non-accrual status, loans
past due more than 90 days and still accruing, and restructured loans,
were $6,102,000, or 1.36% of total loans at December 31, 2009, compared
with $1,308,000, or 0.32% of total loans at December 31,
2008.
|
|
·
|
Total delinquent loans, which includes loans past due more than 30 days, increased to 2.17% of total loans at December 31, 2009 compared with 0.98% of total loans at December 31, 2008. |
|
·
|
QNB’s non-performing loan and delinquent loan ratios of 1.36% and 2.17%, while elevated, continue to compare favorably with the average for Pennsylvania commercial banks with assets between $500 million and $1 billion, as reported by the FDIC. The total non-performing loan and total delinquent loan ratios for the Pennsylvania commercial banks were 2.34% and 3.74% of total loans, respectively, as of December 31, 2009. |
|
·
|
The allowance for loan losses of $6,217,000 represents 1.38% of total loans at December 31, 2009 compared to $3,836,000, or 0.95% of total loans at December 31, 2008. |
Non-interest
income increased $585,000 to $3,885,000 for 2009
|
·
|
Net
losses on investment securities were $454,000 in 2009 compared with net
losses of $609,000 in 2008. The net loss for 2009 was comprised of credit
related OTTI charges on pooled trust preferred securities and equity
securities of $1,523,000 and net gains on the sales of securities of
$1,069,000. The net loss in 2008 included OTTI charges on equity
securities of $917,000 and net gains on sales of securities of
$308,000.
|
19
|
·
|
Gains
on the sale of residential mortgages increased from $93,000 in 2008 to
$633,000 in 2009. Actions by the Federal Reserve to push mortgage rates
down were successful, leading to an increase in loan origination and sales
activity.
|
|
·
|
Income from the processing of merchant transactions increased $97,000, or 66.2%, to $243,000 as a result of the success in acquiring new merchants. |
|
·
|
ATM and debit card income increased $87,000, or 9.4%, to $1,016,000 for 2009 as a result of the continued acceptance and use by consumers. |
|
·
|
Partially offsetting the positive variances noted above was an increase in net losses on other real estate owned and repossessed assets, which increased $152,000 when comparing 2009 to 2008. This again reflects the difficult economic environment over the past year. |
|
·
|
Non-interest income for 2008 included the recognition of $230,000 of income as a result of the Visa initial public offering and $48,000 from the proceeds of life insurance. |
Non-interest
expense increased $1,958,000, or 13.4%, to $16,586,000 for 2009.
|
·
|
Higher
industry-wide FDIC insurance premiums plus a special FDIC assessment in
the second quarter of 2009 resulted in FDIC expense increasing by
$938,000. These actions by the FDIC were a result of bank failures which
have significantly reduced the level of the Deposit Insurance
Fund.
|
|
·
|
Salary
and benefit expense increased $548,000 when comparing 2009 and 2008.
Additional commercial lending and credit administration personnel to
support the growth in the loan portfolio, the staffing of the Wescosville
branch, opened in November 2008, and the payment of severance to a former
executive of the Company account for the majority of the
increase.
|
|
·
|
Third party service costs increased $268,000 from $807,000 for 2008 to $1,075,000 for 2009. The use of consultants for the development and training of employees, the valuation of the trust preferred securities and for an executive search contributed to the increase in third party service expense. Legal expense, primarily related to the collection of loans, the outsourcing of asset liability management reporting and administrative costs related to the eRewards checking product also contributed to the increase in third party services. |
These
items, as well as others, will be explained more thoroughly in the next
sections.
Net
Interest Income
The
following table presents the adjustment to convert net interest income to net
interest income on a fully taxable equivalent basis for the years ended December
31, 2009 and 2008.
| Net Interest Income | ||||||||
|
Year
Ended December 31,
|
2009
|
2008
|
||||||
|
Total
interest income
|
$ | 35,368 | $ | 35,285 | ||||
|
Total
interest expense
|
13,667 | 15,319 | ||||||
|
Net
interest income
|
21,701 | 19,966 | ||||||
|
Tax-equivalent
adjustment
|
1,658 | 1,491 | ||||||
|
Net
interest income (tax-equivalent basis)
|
$ | 23,359 | $ | 21,457 | ||||
Net
interest income is the primary source of operating income for QNB. Net interest
income is interest income, dividends, and fees on earning assets, less interest
expense incurred for funding sources. Earning assets primarily include loans,
investment securities, interest bearing balances at the Fed and Federal funds
sold. Sources used to fund these assets include deposits and borrowed funds. Net
interest income is affected by changes in interest rates, the volume and mix of
earning assets and interest-bearing liabilities, and the amount of earning
assets funded by non-interest bearing deposits.
For
purposes of this discussion, interest income and the average yield earned on
loans and investment securities are adjusted to a tax-equivalent basis as
detailed in the table that appears above. This adjustment to interest income is
made for analysis purposes only. Interest income is increased by the amount of
savings of Federal income taxes, which QNB realizes by investing in certain
tax-exempt state and municipal securities and by making loans to certain
tax-exempt organizations. In this way, the ultimate economic impact of earnings
from various assets can be more easily compared.
20
The net
interest rate spread is the difference between average rates received on earning
assets and average rates paid on interest-bearing liabilities, while the net
interest margin, which includes interest-free sources of funds, is net interest
income expressed as a percentage of average interest-earning assets.
Net
interest income increased $1,735,000, or 8.7%, to $21,701,000 for 2009. On a
tax-equivalent basis, net interest income for 2009 increased $1,902,000, or
8.9%, to $23,359,000. Strong growth in deposits and the deployment of these
deposits into loans and investment securities was the primary contributor to the
growth in net interest income. Total average deposits increased $77,386,000, or
15.0%, to $594,328,000 when comparing 2009 and 2008. Over this same time period
total average loans increased $44,926,000, or 11.7%, and total average
investment securities increased $32,367,000, or 15.4%. Partially offsetting the
positive impact on net interest income of this strong growth was a 14 basis
point decrease in the net interest margin. The net interest margin on a
tax-equivalent basis was 3.42% for 2009 compared with 3.56% for
2008.
Average
Balances, Rates, and Interest Income and Expense Summary (Tax-Equivalent
Basis)
|
|
Average
Balance
|
2009
Average
Rate
|
Interest
|
Average
Balance
|
2008
Average
Rate
|
Interest
|
Average
Balance
|
2007
Average
Rate
|
Interest
|
|||||||||||||||||||||||||||
|
Assets
|
||||||||||||||||||||||||||||||||||||
|
Federal funds
sold
|
$ | 992 | 0.15 | % | $ | 2 | $ | 6,281 | 2.20 | % | $ | 138 | $ | 6,252 | 5.11 | % | $ | 320 | ||||||||||||||||||
|
Investment
securities:
|
||||||||||||||||||||||||||||||||||||
|
U.S.
Treasury
|
5,075 | 1.41 | 71 | 5,152 | 3.46 | 178 | 5,088 | 4.74 | 241 | |||||||||||||||||||||||||||
|
U.S.
Government agencies
|
47,717 | 3.97 | 1,892 | 37,391 | 5.03 | 1,881 | 32,845 | 5.58 | 1,832 | |||||||||||||||||||||||||||
|
State
and municipal
|
50,921 | 6.50 | 3,308 | 43,394 | 6.51 | 2,826 | 39,878 | 6.60 | 2,631 | |||||||||||||||||||||||||||
|
Mortgage-backed
and CMOs
|
126,883 | 4.89 | 6,200 | 107,069 | 5.50 | 5,894 | 102,730 | 5.19 | 5,328 | |||||||||||||||||||||||||||
|
Corporate
bonds (fixed and variable)
|
5,839 | 1.36 | 79 | 12,689 | 6.11 | 776 | 14,360 | 7.08 | 1,017 | |||||||||||||||||||||||||||
|
Money
market mutual funds
|
3,461 | 0.68 | 23 | 865 | 2.62 | 23 | — | — | — | |||||||||||||||||||||||||||
|
Equities
|
3,208 | 3.15 | 101 | 4,177 | 2.57 | 107 | 4,323 | 2.41 | 104 | |||||||||||||||||||||||||||
|
Total
investment securities
|
243,104 | 4.80 | 11,674 | 210,737 | 5.54 | 11,685 | 199,224 | 5.60 | 11,153 | |||||||||||||||||||||||||||
|
Loans:
|
||||||||||||||||||||||||||||||||||||
|
Commercial
real estate
|
219,991 | 6.16 | 13,544 | 183,212 | 6.68 | 12,242 | 166,818 | 6.82 | 11,376 | |||||||||||||||||||||||||||
|
Residential
real estate*
|
24,710 | 5.95 | 1,471 | 21,737 | 6.13 | 1,332 | 24,755 | 5.96 | 1,475 | |||||||||||||||||||||||||||
|
Home
equity loans
|
64,918 | 5.14 | 3,338 | 68,249 | 5.83 | 3,977 | 69,340 | 6.51 | 4,514 | |||||||||||||||||||||||||||
|
Commercial
and industrial
|
74,343 | 5.09 | 3,786 | 67,542 | 5.98 | 4,042 | 61,462 | 7.28 | 4,476 | |||||||||||||||||||||||||||
|
Indirect
lease financing
|
14,735 | 8.62 | 1,270 | 13,372 | 9.79 | 1,309 | 13,471 | 9.48 | 1,277 | |||||||||||||||||||||||||||
|
Consumer
loans
|
3,986 | 10.71 | 427 | 4,524 | 11.49 | 520 | 4,722 | 10.40 | 491 | |||||||||||||||||||||||||||
|
Tax-exempt
loans
|
25,241 | 5.91 | 1,491 | 24,362 | 6.05 | 1,475 | 23,780 | 6.14 | 1,461 | |||||||||||||||||||||||||||
|
Total
loans, net of unearned income
|
427,924 | 5.92 | 25,327 | 382,998 | 6.50 | 24,897 | 364,348 | 6.88 | 25,070 | |||||||||||||||||||||||||||
|
Other
earning assets
|
11,172 | 0.21 | 23 | 2,430 | 2.33 | 56 | 2,723 | 6.68 | 182 | |||||||||||||||||||||||||||
|
Total
earning assets
|
683,192 | 5.42 | 37,026 | 602,446 | 6.10 | 36,776 | 572,547 | 6.41 | 36,725 | |||||||||||||||||||||||||||
|
Cash
and due from banks
|
9,815 | 10,716 | 11,299 | |||||||||||||||||||||||||||||||||
|
Allowance
for loan losses
|
(4,668 | ) | (3,425 | ) | (2,875 | ) | ||||||||||||||||||||||||||||||
|
Other
assets
|
22,241 | 21,955 | 21,630 | |||||||||||||||||||||||||||||||||
|
Total
assets
|
$ | 710,580 | $ | 631,692 | $ | 602,601 | ||||||||||||||||||||||||||||||
|
Liabilities
and Shareholders’ Equity
|
||||||||||||||||||||||||||||||||||||
|
Interest-bearing
deposits:
|
||||||||||||||||||||||||||||||||||||
|
Interest-bearing
demand
|
$ | 70,398 | 0.57 | % | 403 | $ | 57,883 | 0.27 | % | 156 | $ | 54,711 | 0.18 | % | 99 | |||||||||||||||||||||
|
Municipals
|
33,077 | 1.08 | 357 | 39,738 | 2.06 | 818 | 44,718 | 4.84 | 2,167 | |||||||||||||||||||||||||||
|
Money
market
|
60,535 | 1.16 | 703 | 48,027 | 1.83 | 879 | 52,129 | 3.01 | 1,569 | |||||||||||||||||||||||||||
|
Savings
|
51,245 | 0.37 | 189 | 43,859 | 0.39 | 169 | 44,780 | 0.39 | 176 | |||||||||||||||||||||||||||
|
Time
|
218,047 | 3.13 | 6,829 | 198,500 | 4.10 | 8,143 | 184,643 | 4.52 | 8,348 | |||||||||||||||||||||||||||
|
Time
of $100,000 or more
|
107,764 | 3.18 | 3,424 | 77,765 | 4.09 | 3,179 | 60,238 | 4.76 | 2,866 | |||||||||||||||||||||||||||
|
Total
interest-bearing deposits
|
541,066 | 2.20 | 11,905 | 465,772 | 2.86 | 13,344 | 441,219 | 3.45 | 15,225 | |||||||||||||||||||||||||||
|
Short-term
borrowings
|
21,817 | 1.14 | 248 | 22,197 | 2.12 | 471 | 22,930 | 3.53 | 809 | |||||||||||||||||||||||||||
| Long-term debt | 35,000 | 4.27 | 1,514 | 34,535 | 4.28 | 1,504 | 32,732 | 5.21 | 1,704 | |||||||||||||||||||||||||||
|
Total
interest-bearing liabilities
|
597,883 | 2.29 | 13,667 | 522,504 | 2.93 | 15,319 | 496,881 | 3.57 | 17,738 | |||||||||||||||||||||||||||
|
Non-interest
bearing deposits
|
53,262 | 51,170 | 50,942 | |||||||||||||||||||||||||||||||||
|
Other
liabilities
|
4,725 | 4,532 | 3,479 | |||||||||||||||||||||||||||||||||
|
Shareholders’
equity
|
54,710 | 53,486 | 51,299 | |||||||||||||||||||||||||||||||||
|
Total
liabilities and shareholders’ equity
|
$ | 710,580 | $ | 631,692 | $ | 602,601 | ||||||||||||||||||||||||||||||
|
Net
interest rate spread
|
3.13 | % | 3.17 | % | 2.84 | % | ||||||||||||||||||||||||||||||
|
Margin/net
interest income
|
3.42 | % | $ | 23,359 | 3.56 | % | $ | 21,457 | 3.32 | % | $ | 18,987 | ||||||||||||||||||||||||
Tax-exempt
securities and loans were adjusted to a tax-equivalent basis and are based on
the marginal Federal corporate tax rate of 34 percent.
Non-accrual
loans are included in earning assets.
*
Includes loans held-for-sale.
21
Rate-Volume
Analysis of Changes in Net Interest Income (1)(2)(3)
|
2009
vs. 2008
|
2008
vs. 2007
|
|||||||||||||||||||||||
|
Change
due to
|
Total
|
Change
due to
|
Total
|
|||||||||||||||||||||
|
Volume
|
Rate
|
Change
|
Volume
|
Rate
|
Change
|
|||||||||||||||||||
|
Interest
income:
|
||||||||||||||||||||||||
|
Federal
funds sold
|
$ | (116 | ) | $ | (20 | ) | $ | (136 | ) | $ | 1 | $ | (183 | ) | $ | (182 | ) | |||||||
|
Investment
securities:
|
||||||||||||||||||||||||
|
U.S.
Treasury
|
(3 | ) | (104 | ) | (107 | ) | 3 | (66 | ) | (63 | ) | |||||||||||||
|
U.S.
Government agencies
|
519 | (508 | ) | 11 | 254 | (205 | ) | 49 | ||||||||||||||||
|
State
and municipal
|
490 | (8 | ) | 482 | 232 | (37 | ) | 195 | ||||||||||||||||
|
Mortgage-backed
and CMOs
|
1,090 | (784 | ) | 306 | 225 | 341 | 566 | |||||||||||||||||
|
Corporate
bonds (fixed and variable)
|
(419 | ) | (278 | ) | (697 | ) | (118 | ) | (123 | ) | (241 | ) | ||||||||||||
|
Money
market mutual funds
|
67 | (67 | ) | - | 23 | - | 23 | |||||||||||||||||
|
Equities
|
(24 | ) | 18 | (6 | ) | (4 | ) | 7 | 3 | |||||||||||||||
|
Loans:
|
||||||||||||||||||||||||
|
Commercial
real estate
|
2,457 | (1,155 | ) | 1,302 | 1,118 | (252 | ) | 866 | ||||||||||||||||
|
Residential
real estate
|
182 | (43 | ) | 139 | (179 | ) | 36 | (143 | ) | |||||||||||||||
|
Home
equity loans
|
(194 | ) | (445 | ) | (639 | ) | (71 | ) | (466 | ) | (537 | ) | ||||||||||||
|
Commercial
and industrial
|
407 | (663 | ) | (256 | ) | 442 | (876 | ) | (434 | ) | ||||||||||||||
|
Indirect
lease financing
|
134 | (173 | ) | (39 | ) | (10 | ) | 42 | 32 | |||||||||||||||
|
Consumer
loans
|
(62 | ) | (31 | ) | (93 | ) | (21 | ) | 50 | 29 | ||||||||||||||
|
Tax-exempt
loans
|
53 | (37 | ) | 16 | 36 | (22 | ) | 14 | ||||||||||||||||
|
Other
earning assets
|
203 | (236 | ) | (33 | ) | (20 | ) | (106 | ) | (126 | ) | |||||||||||||
|
Total
interest income
|
4,784 | (4,534 | ) | 250 | 1,911 | (1,860 | ) | 51 | ||||||||||||||||
|
Interest
expense:
|
||||||||||||||||||||||||
|
Interest-bearing
demand
|
34 | 213 | 247 | 6 | 51 | 57 | ||||||||||||||||||
|
Municipals
|
(138 | ) | (323 | ) | (461 | ) | (241 | ) | (1,108 | ) | (1,349 | ) | ||||||||||||
|
Money
market
|
229 | (405 | ) | (176 | ) | (124 | ) | (566 | ) | (690 | ) | |||||||||||||
|
Savings
|
29 | (9 | ) | 20 | (4 | ) | (3 | ) | (7 | ) | ||||||||||||||
|
Time
|
802 | (2,116 | ) | (1,314 | ) | 627 | (832 | ) | (205 | ) | ||||||||||||||
|
Time
of $100,000 or more
|
1,227 | (982 | ) | 245 | 833 | (520 | ) | 313 | ||||||||||||||||
|
Short-term
borrowings
|
(8 | ) | (215 | ) | (223 | ) | (26 | ) | (312 | ) | (338 | ) | ||||||||||||
|
Long-term
debt
|
16 | (6 | ) | 10 | 99 | (299 | ) | (200 | ) | |||||||||||||||
|
Total
interest expense
|
2,191 | (3,843 | ) | (1,652 | ) | 1,170 | (3,589 | ) | (2,419 | ) | ||||||||||||||
|
Net
interest income
|
$ | 2,593 | $ | (691 | ) | $ | 1,902 | $ | 741 | $ | 1,729 | $ | 2,470 | |||||||||||
(1) Loan
fees have been included in the change in interest income totals presented.
Non-accrual loans have been included in average loan
balances.
(2) Changes
due to both volume and rates have been allocated in proportion to the
relationship of the dollar amount change in each.
(3) Interest
income on loans and securities is presented on a tax-equivalent
basis.
The
Rate-Volume Analysis table, as presented on a tax-equivalent basis, highlights
the impact of changing rates and volumes on total interest income and interest
expense. Total interest income on a tax-equivalent basis increased $250,000, or
0.7%, in 2009, to $37,026,000, while total interest expense decreased
$1,652,000, or 10.8%, to $13,667,000. The increase in interest income was the
result of the growth in earning assets outpacing the impact of the decline in
interest rates. Volume growth contributed an additional $4,784,000 of interest
income offsetting the decline in interest income of $4,534,000 resulting
from lower interest rates. With regard to interest expense, lower funding costs
resulted in a decline in interest expense of $3,843,000, more than offsetting
the $2,191,000 increase in interest expense caused by volume growth.
The yield
on earning assets on a tax-equivalent basis decreased 68 basis points from 6.10%
for 2008 to 5.42% for 2009. In comparison, the rate paid on interest-bearing
liabilities decreased 64 basis points from 2.93% for 2008 to 2.29% for
2009.
Interest
income on investment securities decreased only $11,000 when comparing the two
years as the $32,367,000, or 15.4%, increase in average balances offset the 74
basis point decline in the average yield of the portfolio. The average yield on
the investment portfolio was 4.80% for 2009 compared with 5.54% for 2008.
The decline in the yield on the investment portfolio is primarily the result of
an increase in liquidity resulting from deposit growth and a significant
increase in cash flow from the investment portfolio as prepayment speeds on
mortgage-backed securities and CMOs ramped-up as did the amount of calls of
agency and municipal securities. The reinvestment of these funds were generally
in securities that had lower yields than what they replaced. The growth in the
investment portfolio was primarily in high quality U.S. Government agency and
agency mortgage-backed and CMO securities and tax-exempt State and municipal
bonds.
Income on
Government agency securities increased by $11,000 as the $10,326,000, or 27.6%,
growth in average balances was almost entirely offset by a 106 basis point
decline in yield from 5.03% for 2008 to 3.97% for 2009. Most of the bonds in the
agency portfolio have call features ranging from three months to five years,
many of which were exercised as a result of the current low interest rate
environment. The proceeds from these called bonds were reinvested in securities
with significantly lower yields. As of December 31, 2009 the balance of the
portfolio was $69,731,000 and the yield was 3.36%. The yield in this
portfolio is likely to continue to decline in 2010 as approximately half the
portfolio is anticipated to be called based on interest rates as of December 31,
2009.
Interest
income on mortgage-backed securities and CMOs increased $306,000 with growth in
the portfolio contributing $1,090,000. Average balances increased $19,814,000,
or 18.5%, to $126,883,000. This increase in interest income due to higher
balances was partially offset by a $784,000 decrease in interest income
resulting from a 61 basis point decline in yield. The yield on the
mortgage-backed portfolio decreased from 5.50% to 4.89% when comparing 2008 and
2009. During the fourth quarter of 2009 QNB sold $3,347,000 of non-agency issued
CMOs and $14,345,000 of mortgage-backed securities as a net gain of $525,000.
The non-agency issued CMOs were sold to reduce credit risk while the
mortgage-backed securities sold were prepaying at very fast speeds.
Interest
on tax-exempt municipal securities increased $482,000 with higher balances
accounting for $490,000 of additional income. Average balances of tax-exempt
municipal securities increased $7,527,000, or 17.4%, to $50,921,000 for 2009.
The yield on the state and municipal securities portfolio declined by only one
basis point when comparing the two years. Credit concerns in the municipal
market arising from issues with the insurance companies that insure the bonds
resulted in yields on municipal bonds remaining high despite the significant
decline in treasury market rates. This is known as spread widening and occurred
during the first half of 2009. By the end of 2009 spreads had tightened
considerably and yields, while still attractive on a relative basis, declined.
As of December 31, 2009 the balance in this category was $57,507,000 with a
tax-equivalent yield of 6.17%.
22
Interest
income on corporate bonds declined by $697,000 from $776,000 for 2008 to $79,000
for 2009. During this same period the yield on the corporate portfolio declined
from 6.11% for 2008 to 1.36% for 2009. The decline in both interest income and
the yield is primarily the result of several events. To reduce credit risk in
the portfolio, in January 2009, QNB sold $6,000,000 in corporate bonds issued by
financial institutions at a gain of $136,000. The bonds sold had an average
yield of 6.89%. This followed the sale in June 2008, of approximately $2,000,000
of Lehman Brothers bonds, which had a yield of 7.25%. These bonds were sold at a
small gain. The other event was the placement of the pooled trust preferred
securities on non-accrual in 2009. The income recognized on the trust preferred
securities was $5,000 in 2009 compared with $243,000 in 2008.
The yield
on the total investment portfolio is anticipated to continue to decline as cash
flow from the portfolio as well as excess liquidity is reinvested at current
market rates which are below the projected portfolio yield at December 31, 2009
of 4.49%.
Income on
loans increased $430,000 to $25,327,000 when comparing 2009 to 2008 as the
impact of declining interest rates was offset by the growth in the portfolio.
Average loans increased $44,926,000, or 11.7%, and contributed an additional
$2,977,000 in interest income. The yield on loans decreased 58 basis points, to
5.92% when comparing the same periods, resulting in a reduction in interest
income of $2,547,000. The decline in the yield on the loan portfolio reflects
the impact of lower interest rates, primarily loans indexed to the prime lending
rate such as commercial loans and home equity lines of credit. Also impacting
the yield in 2009 was the increase in lost interest on loans placed on
non-accrual. Reducing the impact of the decline in interest rates on loan yields
is the structure of the loan portfolio, which has a significant portion of
fixed-rate and adjustable-rate loans with fixed-rate terms for three to five
years. Also helping to stabilize the yield was the implementation of interest
rate floors on some variable rate commercial loans and home equity lines of
credit. Positively impacting the yield on loans and the net interest margin in
2008 was the recognition of $109,000 related to a prepayment penalty on a
commercial loan participation that paid off. This had the impact of increasing
the yield on loans by approximately three basis points and the net interest
margin by two basis points.
Most of
the growth in the loan portfolio, both in terms of balances and interest income,
was in the category of commercial real estate loans. This category of loans
includes commercial purpose loans secured by either commercial properties such
as office buildings, factories, warehouses, medical facilities and retail
establishments, or residential real estate, usually the residence of the
business owner. The category also includes construction and land development
loans. Income on commercial real estate loans increased $1,302,000, with average
balances increasing $36,779,000, or 20.1%, to $219,991,000, for 2009. The growth
in this category resulted in an additional $2,457,000 in interest income. The
yield on commercial real estate loans was 6.16% for 2009, a decline of 52 basis
points from the 6.68% reported for 2008. The decline in the yield on the
portfolio reduced interest income by $1,155,000.
Interest
on commercial and industrial loans, the second largest category, declined
$256,000 with the impact of the increase in average balances being offset by the
impact of the decline in yield. Average commercial and industrial loans
increased $6,801,000, or 10.1%, to $74,343,000 for 2009, contributing an
additional $407,000 in interest income. The average yield on these loans
decreased 89 basis points to 5.09% resulting in a reduction in interest income
of $663,000. The commercial and industrial loan category was impacted
significantly by the action by the Fed to lower interest rates since a large
portion of this category of loans is indexed to the prime lending rate.
Residential
mortgage loan activity, which was slow for most of 2008, picked up significantly
during the first half of 2009 as mortgage rates declined in response to actions
by the Federal government. Income on residential real estate loans increased by
$139,000 when comparing the two years, as the increase in balances offset the
small decline in yield. The average balance of residential mortgages increased
$2,973,000, or 13.7%, when comparing 2009 to 2008, while the average yield
decreased by 18 basis points to 5.95% for 2009. With the support of Federal
government programs designed to lower interest rates on residential mortgage
loans and to stimulate the housing market, mortgage rates did decline to
historically low levels during 2009. However, mortgage rates did not decline to
the magnitude that Treasury rates declined as spreads widened on mortgage loans
and mortgage-backed securities due to issues in the credit markets. QNB sells
most of the fixed rate loans it originates, especially in the current low rate
environment. Included in the increase in average balances was an increase of
$858,000 in residential mortgages held-for-sale. The increase in residential
real estate loans held in the portfolio was in the category of hybrid arms,
mostly loans with a rate fixed for 10 years followed by annual adjustments,
which increased by $2,960,000 on average when comparing 2009 to
2008.
Income on
home equity loans declined by $639,000 when comparing the two years. During this
same time period average home equity loans decreased $3,331,000, or 4.9%, to
$64,918,000, while the yield on the home equity portfolio decreased 69 basis
points to 5.14%. The demand for home equity loans has declined as home values
have fallen preventing some homeowners from having equity in their homes to
borrow against while others have taken advantage of the low interest rates on
mortgages and refinanced their home equity loans into a new mortgage. Included
in the home equity portfolio are floating rate home equity lines tied to the
prime lending rate. The average balance of these loans increased by $6,586,000,
or 43.0%, to $21,890,000 for 2009. In contrast, average fixed rate home equity
loans declined by $9,917,000, or 18.7%, to $43,028,000. The movement from fixed
rate to floating rate loans reflects the significant decline in the prime rate
to 3.25% and the introduction of the Equity Choice product during 2008. This
product is a variable rate line of credit indexed to the prime rate that allows
the borrower to carve out portions of the variable rate balance and to fix the
rate on that portion based on the term and rate at that time. As the fixed rate
portion is paid down, the available amount under the line increases. As with
commercial and industrial loans tied to the prime rate, QNB began to institute a
rate floor on these prime based loans.
23
Interest
income on Federal funds sold decreased $136,000 when comparing the two years, a
result of the decision by management to primarily invest its short-term excess
funds in either AAA rated money market mutual funds included in the investment
securities portfolio or in its account at the Federal Reserve Bank, both of
which were paying more than Federal funds. The average balance of Federal funds
sold for 2009 was $992,000 compared with $6,281,000 for 2008, while the average
rate earned was 0.15% and 2.20% for the same periods, respectively. Income on
money market mutual funds was $23,000 for both years while the average balances
were $3,461,000 for 2009 and $865,000 for 2008 resulting in a yield of 0.68% and
2.62%, respectively. The yield on money markets did decline during 2009 and
eventually was in the range of the Federal funds rate. The average balance held
at the Federal Reserve Bank was $8,385,000 for 2009 compared with $207,000 for
2008. Beginning in the fourth quarter of 2008 the Fed began paying 0.25% on
balances in excess of required reserves. This resulted in interest income of
$21,000 for 2009 included in other earning assets.
Income on
other earning assets is comprised of interest on deposits in correspondent
banks, primarily the Federal Reserve Bank as discussed above, and dividends on
restricted investments in bank stocks, primarily the Federal Home Loan Bank of
Pittsburgh (FHLB). Income on other earning assets declined from $56,000 for 2008
to $23,000 for 2009. In December 2008, the FHLB notified member banks that it
was suspending dividend payments to preserve capital. FHLB dividend income was
$38,000 for 2008.
For the
most part, earning assets are funded by deposits, which increased on average by
$77,386,000, or 15.0%, to $594,328,000, when comparing 2009 and 2008. It appears
that customers are looking for the safety of FDIC insured deposits and the
stability of a strong local community bank as opposed to the volatility of the
equity markets and the uncertainty of the larger regional and national banks. On
October 3, 2008, in response to the ongoing economic crisis affecting the
financial services industry, the Emergency Economic Stabilization Act of 2008
was enacted which temporarily raised the basic limit on FDIC coverage from
$100,000 to $250,000 per depositor until December 31, 2009. However, legislation
was passed during the second quarter of 2009 that extended the higher coverage
through December 31, 2013. In addition, on October 13, 2008, the FDIC
established a program under which the FDIC will fully guarantee all non-interest
bearing transaction accounts until December 31, 2009 (the “Transaction Account
Guarantee Program”). On August 26, 2009 the FDIC amended the program to extend
the date six months until June 30, 2010 to those institutions that do not opt
out of participating. QNB is participating in the Transaction Account Guarantee
Program. These programs likely contributed to the growth in deposits.
While
total income on earning assets on a tax-equivalent basis increased $250,000 when
comparing 2009 to 2008, total interest expense declined $1,652,000. Interest
expense on total deposits decreased $1,439,000 while interest expense on
borrowed funds decreased $213,000 when comparing the two years. The rate paid on
interest-bearing liabilities decreased 64 basis points from 2.93% for 2008 to
2.29% for 2009. During this same period, the rate paid on interest-bearing
deposits decreased 66 basis points from 2.86% to 2.20%.
While
most categories of deposits increased when comparing the two years, the largest
balance increase in average deposits was in time deposits which grew
$49,546,000, or 17.9%, to $325,811,000 for 2009. Included in this total was
$107,764,000 of time deposits of $100,000 or more, an increase of $29,999,000
from the $77,765,000 reported for 2008. Higher yields relative to alternative
investments, including other bank deposits, especially at the end of 2008 and
the first half of 2009, and the increase in FDIC coverage, as discussed above,
appear to be the impetus behind this growth. In addition, the opening of the
Wescosville branch in November 2008 has been extremely successful and
contributed to the significant growth in time deposits. Average time deposit
balances at this location were $35,625,000 for 2009 compared with $984,000 for
2008.
When
comparing 2009 to 2008, interest expense on time deposits decreased $1,069,000.
Similar to fixed-rate loans and investment securities, time deposits reprice
over time and, therefore, have less of an immediate impact on costs in either a
rising or falling rate environment. Unlike loans and investment securities,
however, the maturity and repricing characteristics of time deposits tend to be
shorter. Over the course of 2008 and 2009 a significant amount of time deposits
have repriced lower as rates have declined. The average rate paid on time
deposits decreased from 4.10% for 2008 to 3.15% for 2009 and as a result
interest expense declined by $3,098,000. Partially offsetting the impact of
lower rates was $2,029,000 in additional expense related to the 17.9% increase
in average balances.
24
Approximately
$182,447,000, or 56.8%, of time deposits at December, 31, 2009 will reprice or
mature over the next 12 months. The average rate paid on these time deposits is
approximately 2.85%. This compares to $218,096,000, or 70.1% of time deposits
that were paying 3.47% at December 31, 2008. Given the short-term nature of
QNB’s time deposit portfolio and the current rates being offered, it is likely
that the average rate paid on time deposits should continue to decline as higher
costing time deposits are repriced lower. The challenge will be to retain these
deposits which to date QNB has done successfully.
Average
interest-bearing demand accounts increased $12,515,000, or 21.6%, to $70,398,000
for 2009. Interest expense on interest-bearing demand accounts increased from
$156,000 for 2008 to $403,000 for 2009 while the average rate paid increased
from 0.27% to 0.57%. The increase in average balances, interest expense and the
average rate paid is primarily the result of eRewards checking, a high rate
checking account introduced during the third quarter of 2008. At the time of
introduction the account paid interest of 4.01% on balances up to $25,000. In
order to receive this rate a customer must receive an electronic statement, have
one direct deposit or other ACH transaction and perform at least 12 check card
transactions per cycle. As of April 1, 2009, the rate paid on balances up to
$25,000 was reduced to 3.25%. For 2009, the average balance in the product was
$14,056,000 and the related interest expense was $373,000 for an average yield
of 2.65%. This lower rate than the offering rate reflects the lower rate
paid on accounts that do not meet the qualifications and receive a rate of 0.15%
and balances in excess of $25,000 which receive a rate of 1.01%. In comparison
the average balance for 2008 was $2,099,000 with a related interest expense
of $70,000 and an average rate paid of 3.35%. In February 2010, the rate on this
product was reduced to 2.75%. Even with the drop in the rate paid, it is
anticipated that this product will continue to result in the movement of
balances from lower yielding deposit accounts to this product, but will also
result in obtaining new customers and additional deposits of existing customers.
This product also generates fee income through the use of the check
card.
Interest
expense on municipal interest-bearing demand accounts decreased from $818,000
for 2008 to $357,000 for the same period in 2009. The decrease in interest
expense was the result of both volume and rate declines. The average balance of
municipal interest-bearing demand accounts decreased $6,661,000, or 16.8%, while
the average interest rate paid on these accounts decreased from 2.06% for 2008
to 1.08% for 2009. The decline in average balances accounted for $138,000 of the
decrease in interest expense while the decline in the average rate paid
contributed $323,000. Most of these accounts are tied directly to the Federal
funds rate with some having rate floors between 0.50% and 1.50%. The balances in
many of these accounts are seasonal in nature and are dependant upon the timing
of the receipt of taxes and the disbursement by the schools and municipalities.
Average
money market accounts increased $12,508,000, or 26.0%, to $60,535,000 for 2009
compared with 2008. Despite the significant increase in balances, interest
expense on money market accounts declined $176,000 to $703,000 for 2009 compared
to 2008. Interest expense related to the increase in average balances was
$229,000 while the decline in the rate paid had the impact of decreasing
interest expense by $405,000. The average interest rate paid on money market
accounts was 1.83% for 2008 and 1.16% for 2009, a decline of 67 basis points.
Included in total money market balances is the Select Money Market Account, a
higher yielding money market product that pays a tiered rate based on
account balances. With the sharp decline in short-term interest rates, the rates
paid on the Select Money Market Account have declined as well. The growth in
balances is in consumer, business and municipal accounts and appears to reflect
the desire for safety, liquidity and a rate comparable with short-term time
deposits.
During
the second quarter of 2009 QNB introduced an online only eSavings account to
compete with other online savings accounts. This product, with an average
balance of $3,874,000 for the year, contributed to the $7,386,000, or 16.8%,
increase in average savings accounts when comparing the two years. Statement
savings accounts also increased $3,704,000, or 8.7%, when comparing the same
periods. The average rate paid on savings accounts declined two basis points
from 0.39% for 2008 to 0.37% for 2009. Since the eSavings account currently pays
a yield of 1.85%, the average rate paid on total savings accounts will most
likely increase as growth occurs in this product.
Contributing
to the decrease in total interest expense was a reduction in interest expense on
short-term borrowings of $223,000. The average rate paid on short-term
borrowings declined from 2.12% for 2008 to 1.14% for 2009. Short-term borrowings
are primarily comprised of repurchase agreements (a sweep product for commercial
customers). While not directly indexed to the Federal funds rate, the rate paid
on these accounts moves closely with the Federal funds rate and as a result
declined when comparing the two periods. The average balance of short-term
borrowings decreased slightly from $22,197,000 for 2008 to $21,817,000 for 2009.
25
Provision
For Loan Losses
The
provision for loan losses represents management’s determination of the amount
necessary to be charged to operations to bring the allowance for loan losses to
a level that represents management’s best estimate of the known and inherent
losses in the existing loan portfolio. Actual loan losses, net of recoveries,
serve to reduce the allowance. Recent economic conditions contributed to high
rates of unemployment and a softening of the residential and commercial real
estate markets. These factors have had a negative impact on both consumers and
small businesses and have contributed to an increase in net charge-offs and
higher levels of non-performing and delinquent loans. These results when
combined with the inherent risk related to the significant growth in the loan
portfolio, contributed to QNB recording a provision for loan losses of
$4,150,000 in 2009, compared with $1,325,000 in 2008. Continued strong growth in
the loan portfolio or further deterioration in credit quality could result in a
continuation of an elevated provision for loan losses in 2010.
Non-Interest
Income
QNB,
through its core banking business, generates various fees and service charges.
Total non-interest income is composed of service charges on deposit accounts,
ATM and check card income, income on bank-owned life insurance, mortgage
servicing fees, gains and losses on investment securities and residential
mortgage loans.
Total
non-interest income was $3,885,000 in 2009 compared with $3,300,000 in 2008, an
increase of $585,000, or 17.7%. Included in non-interest income in 2008 was the
recognition of $230,000 of income as a result of the Visa initial public
offering and $48,000 from the proceeds of a life insurance policy. The primary
factors contributing to the increase in non-interest income in 2009 was a
$540,000 increase in gains on the sale of residential mortgages and a $155,000
reduction in losses on investment securities.
|
Year
ended December 31,
|
2009
|
2008
|
||||||
|
Total
non-interest income, as reported
|
$ | 3,885 | $ | 3,300 | ||||
|
Less
adjustments for non-core operating activities:
|
||||||||
|
Net
loss on investment securities available-for-sale
|
(454 | ) | (609 | ) | ||||
|
Visa
income
|
– | 230 | ||||||
|
Net
gain on sale of loans
|
633 | 93 | ||||||
|
(Loss)
gain on sale of repossessed assets
|
(135 | ) | 17 | |||||
|
Loss
on disposal of fixed assets
|
– | (2 | ) | |||||
|
Income
from life insurance proceeds
|
– | 48 | ||||||
|
Sales
tax refund
|
– | 24 | ||||||
|
Total
non-interest income excluding non-core operating
activities
|
$ | 3,841 | $ | 3,499 | ||||
Fees for
services to customers, the largest component of non-interest income, are
primarily comprised of service charges on deposit accounts. These fees were
$1,743,000 for 2009, a $60,000, or 3.3%, decline from 2008. Overdraft charges,
which represent approximately 78% of total fees for services to customers in
2009, declined by $118,000, or 8.0%, when comparing 2009 to 2008. This appears
to be a reflection of the slower economy as customers reduced their number of
transactions which resulted in fewer overdrafts. Overdraft income is likely to
decline further in 2010 as QNB has reduced its overdraft charge by $2.00 per
item. In addition, recent and pending legislation could have a negative impact
on the amount of overdrafts income. Partially offsetting this reduction in
fee income in 2009 was a $36,000, or 27.6% increase in fees on business checking
accounts. This increase reflects the impact of a lower earnings credit rate in
2009 compared to 2008, resulting from the decline in short-term interest rates.
These earnings credits are applied against service charges to reduce the costs
paid by the customer.
ATM and
debit card income is primarily comprised of transaction income on debit cards
and ATM cards and ATM surcharge income for the use of QNB’s ATM machines by
non-QNB customers. ATM and debit card income was $1,016,000 in 2009, an increase
of $87,000, or 9.4%, from the amount recorded in 2008. Debit card income
increased $52,000, or 7.7%, to $721,000, in 2009 while ATM interchange income
increased $38,000, or 25.3%, to $188,000. The increase in debit and ATM card
income was a result of the continuing increased reliance on the card as a means
of paying for goods and services by both consumers and business cardholders. The
higher rate of increase in ATM PIN-based transactions is a function of some
merchants recommending lower costing PIN based transactions over higher costing
signature debit transactions. Also contributing to the increase in ATM and debit
card income was the introduction, during the third quarter of 2008, of eRewards
checking, a high yield checking account which requires a minimum of twelve debit
card transactions per statement cycle to receive the premium interest rate.
26
Income on
bank-owned life insurance (BOLI) represents the earnings and death benefits on
life insurance policies in which the Bank is the beneficiary. Income on these
policies was $309,000 and $343,000 in 2009 and 2008, respectively. As mentioned
previously 2008 BOLI income includes life insurance death benefit income of
$48,000. The insurance carriers reset the rates on these policies annually
taking into consideration the interest rate environment as well as mortality
costs. The existing policies have rate floors which minimize how low the
earnings rate can go. Some of these policies are currently at their floor.
When QNB
sells its residential mortgages in the secondary market, it retains servicing
rights. A normal servicing fee is retained on all loans sold and serviced. QNB
recognizes its obligation to service financial assets that are retained in a
transfer of assets in the form of a servicing asset. The servicing asset is
amortized in proportion to and over the period of net servicing income or loss.
On a quarterly basis, servicing assets are assessed for impairment based on
their fair value. Mortgage servicing fees were $124,000 in 2009, compared to
$69,000 in 2008, an increase of $55,000. Included in mortgage servicing income
in 2008 was a negative fair value adjustment of $32,000 recorded against
certain tranches of mortgage servicing rights whose fair value had declined
below book value. The secondary market for mortgage servicing rights had
deteriorated significantly during 2008 as a result of a number of factors,
including: an increase in perceived servicing costs due to forecasted increased
collection efforts, bankruptcies and foreclosures, a decline in prevailing
mortgage rates resulting in higher forecasted mortgage prepayment speeds, and a
general increase in risk aversion toward mortgage assets in general, and
mortgage servicing rights in particular. The mortgage servicing market settled
down in 2009 and as a result QNB was able to recover $28,000 of the fair market
adjustment in 2009. Negatively impacting mortgage servicing income over the
period was an increase in amortization expense. Amortization expense related to
the mortgage servicing asset was $100,000 in 2009 and $77,000 in 2008. The
increase in amortization expense over the past year reflects the acceleration in
mortgage activity, including early payoffs through mortgage refinancing,
resulting from historically low mortgage rates. The average balance of mortgages
serviced for others was $75,007,000 for 2009 compared to $69,367,000 for 2008.
The timing of mortgage payments and delinquencies also impacts the amount of
servicing fees recorded. For additional information on intangible assets see
Note 8 of the Notes to Consolidated Financial Statements included in Item 8 of
this Report.
The
fixed-income securities portfolio represents a significant portion of QNB’s
earning assets and is also a primary tool in liquidity and asset/liability
management. QNB actively manages its fixed-income portfolio in an effort to take
advantage of changes in the shape of the yield curve, changes in spread
relationships in different sectors, and for liquidity purposes. Management
continually reviews strategies that will result in an increase in the yield or
improvement in the structure of the investment portfolio, including monitoring
credit and concentration risk in the portfolio.
QNB
recorded net losses on investment securities of $454,000 in 2009 compared with
net losses of $609,000 in 2008. The net loss for 2009 included credit related
OTTI charges on pooled trust preferred securities of $1,002,000. The impairment
charge resulted from a valuation performed by an independent third party that
included a review of all eight pooled trust preferred securities owned by the
Bank. The net loss for 2009 also included OTTI charges on equity securities of
$521,000, net gains on the sale of debt securities of $660,000 and net gains on
the sale of equity securities of $409,000. During 2009, in an effort to reduce
credit risk QNB sold $6,000,000 in corporate bonds issued by financial
institutions and $3,347,000 of non-agency issued collateralized mortgage backed
securities. In addition, $14,345,000 of higher coupon faster paying
mortgage-backed securities were sold in the fourth quarter to reposition the
cashflow of the portfolio. Included in the $609,000 loss in 2008 were
OTTI charges of $917,000 related to securities in the equity portfolio. Net
gains on the sale of available-for-sale securities were $308,000 in 2008 and
included $67,000 in gains from the fixed income portfolio and $241,000 in gains
from the equity portfolio.
The net
gain on the sale of residential mortgage loans was $633,000 and $93,000 in 2009
and 2008, respectively. Residential mortgage loans to be sold are identified at
origination. The net gain on residential mortgage sales is directly related to
the volume of mortgages sold and the timing of the sales relative to the
interest rate environment. Proceeds from the sale of residential mortgages were
$25,400,000 for 2009 compared with $7,958,000 for 2008, again reflecting the
increase in activity resulting from the low rate environment. Also impacting the
amount of gains recognized were $189,000 and $60,000 for 2009 and 2008,
respectively, related to the recognition of mortgage servicing assets recorded
at the time of sale.
Other
income declined by $158,000 when comparing the $514,000 recorded in 2009 to the
$672,000 recorded in 2008. The majority of the difference was a result of the
following:
|
·
|
Visa income of $230,000 recorded in 2008 and discussed above. | |
|
·
|
Loss
on the sale of other real estate owned and repossessed assets was $134,000
compared with a gain of $17,000 recorded in 2008.
|
|
|
·
|
Merchant
income increased $97,000, or 66.2%, as a result of successfully obtaining
new merchant accounts.
|
27
|
·
|
Letter
of credit fees increased $92,000 mainly as a result of fees for new
letters of credit including a quarterly fee related to a letter of credit
participation which was entered into during the fourth quarter of
2008.
|
|
|
·
|
Income
from investment in title insurance company increased by $42,000, a result
of the increase in mortgage activity.
|
|
|
·
|
Recognition
of income related to the reversal of a $44,000 accrual recorded in prior
years as a result of a decision to amend the terms of a group term life
plan.
|
|
|
·
|
Sales
and use tax refund of $24,000 received in 2008.
|
|
|
·
|
The
processing of official checks was internalized in 2009 resulting in a loss
of income of $30,000 when compared to 2008.
|
Non-Interest
Income Comparison
|
Change
from Prior Year
|
||||||||||||||||
|
Year
Ended December 31,
|
2009
|
2008
|
Amount
|
Percent
|
||||||||||||
|
Fees
for services to customers
|
$ | 1,743 | $ | 1,803 | $ | (60 | ) | (3.3 | )% | |||||||
|
ATM
and debit card
|
1,016 | 929 | 87 | 9.4 | ||||||||||||
|
Bank-owned
life insurance
|
309 | 343 | (34 | ) | (9.9 | ) | ||||||||||
|
Mortgage
servicing fees
|
124 | 69 | 55 | 79.7 | ||||||||||||
|
Net
loss on investment securities available-for-sale
|
(454 | ) | (609 | ) | 155 | (25.5 | ) | |||||||||
|
Net
gain on sale of loans
|
633 | 93 | 540 | 580.6 | ||||||||||||
|
Other
|
514 | 672 | (158 | ) | (23.5 | ) | ||||||||||
|
Total
|
$ | 3,885 | $ | 3,300 | $ | 585 | 17.7 | % | ||||||||
Non-Interest
Expense
Non-interest
expense is comprised of costs related to salaries and employee benefits, net
occupancy, furniture and equipment, marketing, third party services and various
other operating expenses. Total non-interest expense was $16,586,000 in 2009, an
increase of $1,958,000, or 13.4%, from the $14,628,000 recorded in 2008. The
largest contributing factor to the increase in non-interest expense was FDIC
insurance premium expense which increased $938,000 to $1,211,000 for 2009. The
higher expense is primarily the result of a special assessment levied on all
insured institutions as well as an increased assessment rate levied on all
institutions. These actions were taken by the FDIC in order to replenish the
Deposit Insurance Fund which has been reduced as a result of bank failures. The
special assessment contributed $332,000 of the total increase in FDIC costs.
Strong deposit growth along with QNB’s participation in the FDIC’s Transaction
Account Guarantee Program also contributed to the higher premiums. In addition,
the amount of FDIC expense recorded in 2008 was reduced by $130,000 as a result
of the use of a credit approved by the FDIC in 2006. QNB’s overhead
efficiency ratio, which represents the percentage of each dollar of revenue that
is used for non-interest expense, is calculated by taking non-interest expense
divided by net operating revenue on a tax-equivalent basis. QNB’s efficiency
ratios for 2009 and 2008 were 60.9% and 59.1%, respectively.
Salaries
and benefits expense is the largest component of non-interest expense. QNB
monitors, through the use of various surveys, the competitive salary and benefit
information in its markets and makes adjustments where appropriate. Salaries and
benefits expense for 2009 was $8,525,000, an increase of $548,000, or 6.9%, over
the $7,977,000 reported in 2008. Salary expense for 2009 was $6,843,000, an
increase of $398,000, or 6.2%, over the $6,445,000 reported in 2008. Included in
salary and benefit expense for 2009 was $109,000 in severance related expense
for a former executive of the Company; while salary and benefit expense for 2008
includes an accrual for incentive compensation for all employees of $212,000.
There was no incentive compensation expense in 2009. Also contributing to the
increase in salary expense was an increase of nine in the average number of
full-time equivalent employees. The staffing of the Wescosville branch, opened
in November 2008, and additional commercial lending personnel and credit
administration staff to support the growth in loans account for most of the
increase in the number of employees.
Benefit
expense for 2009 was $1,682,000, an increase of $150,000, or 9.8%, from the
amount recorded in 2008. Payroll tax and retirement plan expense increased
$39,000 and $35,000, respectively, a function of higher salary expense. Medical
and dental premiums, long-term disability and life insurance expense increased
$36,000 compared to 2008, a 7.0% increase.
Net
occupancy expense for 2009 was $1,343,000, an increase of $6,000, or 0.4%, from
the amount reported in 2008. Branch rent expense increased $33,000, utilities
expense increased $14,000 and building security expense increased $15,000 when
comparing the two periods. These increases relate primarily to the new branch.
Offsetting these increases was a $59,000 reduction in building repairs and
maintenance expense. The majority of the decrease was the result of reducing the
frequency of third-party cleaning services which resulted in a savings of
$40,000 for 2009 compared to 2008. A portion of the decrease in building repairs
and maintenance was also a result of the opening of the Wescosville branch in
2008. Due to the short term nature of the lease agreement some items were
expensed in 2008. It is anticipated that the permanent branch in Wescosville
will open in the fall of 2010.
28
Furniture
and equipment expense decreased $17,000, or 1.4%, to $1,220,000, when comparing
2009 to 2008. Furniture and equipment under $1,000 is generally not capitalized.
These types of items were $25,000 higher in 2008 than in 2009 as a result of
information technology purchases as well as items needed for the Wescosville
branch.
Marketing
expense was $647,000 for 2009, a decrease of $41,000, or 6.3%, from the $688,000
recorded in 2008. Sales promotion expense was higher in 2008 due primarily to
expenses related to the rebranding of the Quakertown National Bank as QNB
Bank.
Third-party
services are comprised of professional services including legal, accounting and
auditing, and consulting services, as well as fees paid to outside vendors for
support services of day-to-day operations. These support services include
correspondent banking services, statement printing and mailing, investment
security safekeeping and supply management services. Third-party services
expense was $1,075,000 in 2009, compared to $807,000 in 2008, an increase of
$268,000, or 33.2%. The largest portion of the increase relate to the following
third party services:
|
·
|
Legal
expense increased $73,000, to $129,000, with most of the increase a result
of loan collection costs.
|
|
|
·
|
Consultant
expense increased by $93,000 to $133,000 with expenses associated with an
executive search consultant, employee development and training and the
valuation of the pooled trust preferred securities contributing to the
increase.
|
|
|
·
|
Correspondent
banking service expenses increased $12,000, primarily caused by lower
crediting rates that help offset the fees incurred on these
accounts.
|
|
|
·
|
Vendor
costs in connection with the eRewards checking account introduced during
the second quarter of 2008 increased $18,000. This fee is based on the
number of active accounts which increased significantly when comparing the
two years.
|
Telephone,
postage and supplies expense decreased $16,000, or 2.6%, to $609,000. Supplies
expense decreased $27,000 when comparing 2009 to 2008. The higher expense in
2008 relates to costs associated with the rebranding of QNB Bank, including the
purchase of new supplies, plastics for debit cards and obsolescence costs
related to the old Quakertown National Bank supplies. Telephone expense
increased $8,000, or 4.6%, primarily a result of an additional branch for a full
year.
State tax
expense represents the payment of the Pennsylvania Shares Tax, which is based
primarily on the equity of the Bank, Pennsylvania sales and use tax and the
Pennsylvania capital stock tax. State tax expense was $539,000 and $507,000 for
the years 2009 and 2008, respectively. The Pennsylvania Shares Tax increased
$28,000 in 2009 reflecting higher equity levels. The Pennsylvania Shares Tax for
2009 was $532,000.
Other
expense increased $240,000, or 20.4%, to $1,417,000 for the year ended December
31, 2009. The majority of the difference was a result of the following:
|
·
|
Service
and sales training costs increased $60,000 for training of branch and call
center personnel.
|
|
|
·
|
Expenses
incurred in connection with foreclosed real estate and repossessed assets
increased $34,000.
|
|
|
·
|
Expenses
increased $55,000 related to the processing of check card transactions as
well as the production of replacement cards. The increase in processing
costs is a function of the increase in the number of transactions while
the replacement cost increase relates primarily to a security breach at a
third-party processor.
|
|
|
·
|
Directors
fees increased $40,000 with approximately half of this increase
attributable to increases in retainer and meeting fees and the remainder
of the increase a result of additional Committee meetings held throughout
the year.
|
|
|
·
|
ATM
refunds resulting from qualifying eRewards checking accounts, which
provide refunds for ATM fees charged to our customers by other
institutions, accounted for $22,000 of the 2009 increase. The eRewards
checking accounts were introduced in May of 2008.
|
29
Non-Interest
Expense Comparison
|
Change
from Prior Year
|
||||||||||||||||
|
Year
Ended December 31,
|
2009
|
2008
|
Amount
|
Percent
|
||||||||||||
|
Salaries
and employee benefits
|
$ | 8,525 | $ | 7,977 | $ | 548 | 6.9 | % | ||||||||
|
Net
occupancy
|
1,343 | 1,337 | 6 | 0.4 | ||||||||||||
|
Furniture
and equipment
|
1,220 | 1,237 | (17 | ) | (1.4 | ) | ||||||||||
|
Marketing
|
647 | 688 | (41 | ) | (6.0 | ) | ||||||||||
|
Third
party services
|
1,075 | 807 | 268 | 33.2 | ||||||||||||
|
Telephone,
postage and supplies
|
609 | 625 | (16 | ) | (2.6 | ) | ||||||||||
|
State
taxes
|
539 | 507 | 32 | 6.3 | ||||||||||||
|
FDIC
insurance premiums
|
1,211 | 273 | 938 | 343.6 | ||||||||||||
|
Other
|
1,417 | 1,177 | 240 | 20.4 | ||||||||||||
|
Total
|
$ | 16,586 | $ | 14,628 | $ | 1,958 | 13.4 | % | ||||||||
Income
Taxes
Applicable
income taxes and effective tax rates were $623,000, or 12.8%, for 2009 compared
to $1,560,000, or 21.3%, for 2008. The lower effective tax rate for 2009 is
predominately related to the higher provision for loan losses and the OTTI
charges taken, which reduced the amount of taxable income and as a result,
tax-exempt income from loans and securities comprised a higher proportion of
pre-tax income. For a more comprehensive analysis of income tax expense and
deferred taxes, refer to Note 12 in the Notes to Consolidated Financial
Statements.
Financial
Condition
Financial
service organizations are challenged to demonstrate they can generate
sustainable and consistent earnings growth in a dynamic operating environment.
This challenge was evident in 2009 and 2008 as financial institutions, including
QNB, had to operate in an unprecedented economic environment which included a
global recession, the freeze-up in credit markets, the bursting of the housing
bubble, significant losses in the equity markets and historically low interest
rates. While the economy is showing signs of improvement, a challenging economic
environment is anticipated to continue in 2010.
QNB
operates in an attractive but highly competitive market for financial services.
Competition comes in many forms including other local community banks, regional
banks, national financial institutions and credit unions, all with a physical
presence in the markets we serve. In addition, other strong forms of competition
have emerged, such as internet banks. The internet has enabled customers to
“rate shop” financial institutions throughout the nation, both for deposits and
retail loans. QNB has been able to compete effectively by emphasizing a
consistently high level of customer service, including local decision-making on
loans and by providing a broad range of high quality financial products designed
to address the specific needs of our customers. The establishment of long-term
customer relationships and customer loyalty remain our primary
focus.
Total
assets at December 31, 2009 were $762,426,000, an increase of $98,032,000, or
14.8%, when compared with total assets of $664,394,000 at December 31, 2008. The
growth in total assets since December 31, 2008 was centered in loans receivable
and investment securities which increased $45,842,000 and $37,014,000,
respectively. In addition, interest-bearing deposits in banks increased by
$20,882,000 when comparing the two year-ends. The category of other assets
increased $2,655,000 from December 31, 2008 to December 31, 2009, primarily as a
result of a prepaid FDIC assessment of $3,209,000 as of December 31, 2009. On
September 29, 2009, the FDIC adopted an Amended Restoration Plan. Pursuant to
this Plan being adopted, the FDIC amended its assessment regulations to require
all institutions to prepay, on December 30, 2009, their estimated risk-based
assessments for the fourth quarter of 2009, and for all of 2010, 2011, and 2012,
as estimated by the FDIC. The assessment paid by the Bank was $3,407,000 and the
amount related to 2010 through 2012 is currently in a prepaid asset account. It
will be expensed monthly during the years of 2010 through 2012 based on actual
FDIC assessment rate calculations.
Funding
the growth in assets was an increase in total deposits of $84,313,000, or 15.3%,
to $634,103,000 at December 31, 2009 and an increase in short-term borrowings,
primarily commercial sweep accounts, of $6,770,000. The growth in total deposits
reflects increases in core deposits, including interest-bearing demand, money
market and savings accounts, as well as time deposits. Contributing to the
increase in deposits was the opening of QNB’s new branch in the fast growing
areas of Wescosville and Emmaus in Lehigh County in November 2008. This location
had total deposits of $42,864,000 at December 31, 2009 compared with $22,479,000
at December 31, 2008. The category of other liabilities increased $5,144,000
from December 31, 2008 to December 31, 2009 and includes $4,998,000 of unsettled
trades of investment securities. These trades settled in January
2010.
Average
total assets increased 12.5% in 2009 and 4.8% in 2008 with average total loans
and investment securities increasing 11.7% and 15.4% in 2009 compared to 5.1%
and 5.8% in 2008. During these same time periods average total deposits
increased 15.0% and 5.0%, respectively.
30
The
following discussion will further detail QNB’s financial condition during 2009
and 2008.
Investment
Securities and Other Short-Term Investments
QNB had
interest bearing balances at the Federal Reserve Bank of $22,125,000 at December
31, 2009 compared with $117,000 at December 31, 2008. These balances are
included in the category of interest bearing deposits in banks. At December 31,
2009 and 2008 QNB had Federal funds sold of $0 and $4,541,000, respectively.
With the decline in the Federal funds rate to between 0.0% and 0.25% the
decision was made to maintain excess funds for liquidity purposes at the Fed
which was paying 0.25% and carries a 0% risk weighting for risk-based capital
purposes. Higher balances were maintained at the Fed at December 31, 2009 in
anticipation of paying down $10,000,000 in FHLB advances in January 2010 and for
the payment of the unsettled investment trades, noted previously.
Total
investment securities at December 31, 2009 and 2008 were $260,209,000 and
$223,195,000, respectively. For the same periods, approximately 76.0% and 72.1%,
respectively, of QNB’s investment securities were either U.S. Government, U.S.
Government agency debt securities, U.S. Government agency issued mortgage-backed
securities or collateralized mortgage obligation securities (CMOs). As of
December 31, 2009, QNB held no securities of any one issue or any one issuer
(excluding the U.S. Government and its agencies) that were in excess of 10% of
shareholders’ equity.
In light
of the fact that QNB’s investment portfolio represents a significant portion of
earning assets and interest income, QNB actively manages the portfolio in an
attempt to maximize earnings, while considering liquidity needs, interest rate
risk and credit risk. Proceeds from the sale of investments were $26,006,000 in
2009 compared to $4,128,000 during 2008. During 2009, in an effort to
reduce credit risk QNB sold $6,000,000 in corporate bonds issued by financial
institutions and $3,347,000 of non-agency issued collateralized mortgage backed
securities. Also, $14,345,000 of higher coupon faster paying mortgage-backed
securities were sold in the fourth quarter to reposition the cashflow of the
portfolio. In addition to the proceeds from the sale of investment securities,
proceeds from maturities, calls and prepayments of securities were $88,575,000
in 2009, compared with $46,301,000 in 2008. The higher amount of proceeds in
2009 reflects the lower interest rate environment which resulted in an increase
in the amount of bonds called as well as the amount of prepayments on
mortgage-backed securities and CMOs. The 2009 and 2008 proceeds along with the
increase in deposits were used primarily to fund loan growth and purchase
replacement securities. In 2009, $144,365,000 of investment securities were
purchased compared with $81,138,000 in 2008.
As a
result of this activity and the effort to reduce credit risk and manage cash
flow, the composition of the portfolio changed significantly over the past year.
With the sale of mortgage-backed securities in December 2009, the balances
declined by $5,698,000 to $61,649,000 and represent 23.7% of the portfolio at
December 31, 2009 compared with 30.2% of balances at the end of 2008. U.S.
Government agency securities increased from $44,194,000, or 19.8% of the
portfolio at the end of 2008 to $69,731,000, or 26.8% of the portfolio at
December 31, 2009. The increase in agency securities is partially the result of
the purchase of callable securities that were used to match the expected
withdrawal of deposits of a local school district. Based on the current rate
environment it is anticipated that many of the agency securities will be called
during the first half of 2010. CMOs increased by $12,250,000 to $61,317,000 and
represent 23.6% of the portfolio at December 31, 2009, compared with 22.0% at
December 31, 2008. QNB has increased its purchase of Government National
Mortgage Association (GNMA) CMOs as these securities qualify for 0%
risk-weighting for capital purposes. As a result of widening spreads on
tax-exempt state and municipal securities in 2009, QNB increased its holdings by
$11,860,000 to represent 22.1% of the portfolio at December 31, 2009, compared
with 20.6% at December 31, 2008. Other debt securities, which includes corporate
bonds and pooled trust preferred securities decreased to 0.6% of the portfolio
at the end of 2009 compared with 3.8% and 7.3% of the portfolio at December 31,
2008 and 2007, respectively. The decline in other debt securities over the past
two years is primarily the result of the sale of corporate bonds as well as the
decline in fair value of the pooled trust preferred securities. These sales were
made to reduce the credit risk in the portfolio. The weighted average yield on
the portfolio as of December 31, 2009 and 2008 was 4.43% and 5.52%,
respectively. The decline in yield is the result of an increase in liquidity
resulting from deposit growth and a significant increase in cash flow from the
investment portfolio as prepayment speeds on mortgage-backed securities and CMOs
ramped-up as did the amount of calls of agency and municipal securities. The
reinvestment of these funds was generally in securities that had lower yields
than what they replaced. It is anticipated that the yield will continue to
decline in 2010 as the proceeds from the call and maturity of investment
securities continues to be reinvested at lower rates.
Collateralized
debt obligations (CDOs) are securities derived from the packaging of various
assets with many backed by subprime mortgages. These instruments are complex and
difficult to value. QNB did a review of its mortgage related securities and
concluded that it has no exposure to subprime mortgages within its
mortgage-backed securities portfolio and its CMO portfolio. QNB does not own any
CDOs backed by subprime mortgages.
31
QNB does
own CDOs in the form of pooled trust preferred securities. These securities are
comprised mainly of securities issued by financial institutions, and to a lesser
degree, insurance companies. QNB owns the mezzanine tranches of these
securities. These securities are structured so that the senior and mezzanine
tranches are protected from defaults by over-collateralization and cash flow
default protection provided by subordinated tranches. The senior tranches have
the greatest level of protection, then the mezzanine tranches, and finally the
income note holders who have the least protection. QNB holds eight of these
securities with an amortized cost of $4,073,000 and a fair value of $1,008,000.
All of the trust preferred securities are available-for-sale securities and are
carried at fair value. During 2009, QNB took credit related OTTI charges
through the income statement of $1,002,000. For additional detail on these
securities see Note 4 Investment Securities and Note 18 Fair Value Measurements
and Fair Values of Financial Instruments.
QNB
accounts for its investments by classifying its securities into three
categories. Securities that QNB has the positive intent and ability to hold to
maturity are classified as held-to-maturity securities and reported at amortized
cost. Debt and equity securities that are bought and held principally for the
purpose of selling them in the near term are classified as trading securities
and reported at fair value, with unrealized gains and losses included in
earnings. Debt and equity securities not classified as either held-to-maturity
securities or trading securities are classified as available-for-sale securities
and reported at fair value, with unrealized gains and losses, net of tax,
excluded from earnings and reported as a separate component of shareholders’
equity. Management determines the appropriate classification of securities at
the time of purchase. QNB held no trading securities at December 31, 2009 or
2008.
At
December 31, 2009 and 2008, investment securities totaling $133,136,000 and
$101,302,000, respectively, were pledged as collateral for repurchase agreements
and public deposits.
Investment
Portfolio History
|
December
31,
|
2009
|
2008
|
2007
|
|||||||||
|
Investment
Securities Available-for-Sale
|
||||||||||||
|
U.S.
Treasuries
|
$ | 5,013 | $ | 5,124 | $ | 5,037 | ||||||
|
U.S.
Government agencies
|
69,731 | 44,194 | 30,502 | |||||||||
|
State
and municipal securities
|
54,160 | 42,300 | 39,368 | |||||||||
|
U.S.
Government agencies and sponsored enterprises (GSEs) -
residential:
|
||||||||||||
|
Mortgage-backed
securities
|
61,649 | 67,347 | 57,411 | |||||||||
|
Collateralized
mortgage obligations (CMOs)
|
61,317 | 49,067 | 40,775 | |||||||||
|
Other
debt securities
|
1,533 | 8,476 | 14,301 | |||||||||
|
Equity
securities
|
3,459 | 3,089 | 4,158 | |||||||||
|
Total
investment securities available-for-sale
|
$ | 256,862 | $ | 219,597 | $ | 191,552 | ||||||
|
Investment
Securities Held-to-Maturity
|
||||||||||||
|
State
and municipal securities
|
$ | 3,347 | $ | 3,598 | $ | 3,981 | ||||||
|
Total
investment securities held-to-maturity
|
$ | 3,347 | $ | 3,598 | $ | 3,981 | ||||||
|
Total
investment securities
|
$ | 260,209 | $ | 223,195 | $ | 195,533 | ||||||
32
Investment
Portfolio Maturities and Weighted Average Yields
|
December
31, 2009
|
Under
1
Year
|
1-5
Years
|
5-10
Years
|
Over
10
Years
|
Total
|
|||||||||||||||
|
Investment
Securities Available-for-Sale
|
||||||||||||||||||||
|
U.S.
Treasuries:
|
||||||||||||||||||||
|
Fair
value
|
$ | 3,511 | $ | 1,502 | – | – | $ | 5,013 | ||||||||||||
|
Weighted
average yield
|
0.43 | % | 1.04 | % | – | – | 0.61 | % | ||||||||||||
|
U.S.
Government agencies:
|
||||||||||||||||||||
|
Fair
value
|
– | $ | 36,932 | $ | 27,855 | $ | 4,944 | $ | 69,731 | |||||||||||
|
Weighted
average yield
|
– | 3.18 | % | 3.40 | % | 4.37 | % | 3.36 | % | |||||||||||
|
State
and municipal securities:
|
||||||||||||||||||||
|
Fair
value
|
1,213 | $ | 6,431 | $ | 18,144 | $ | 28,372 | $ | 54,160 | |||||||||||
|
Weighted
average yield
|
4.12 | % | 5.99 | % | 6.54 | % | 5.94 | % | 6.11 | % | ||||||||||
|
Mortgage-backed
securities:
|
||||||||||||||||||||
|
Fair
value
|
– | $ | 61,649 | – | – | $ | 61,649 | |||||||||||||
|
Weighted
average yield
|
– | 4.76 | % | – | – | 4.76 | % | |||||||||||||
| Collateralized mortgage obligations (CMOs) | ||||||||||||||||||||
|
Fair
value
|
$ | 3,832 | $ | 57,485 | – | – | $ | 61,317 | ||||||||||||
|
Weighted
average yield
|
5.18 | % | 4.27 | % | – | – | 4.32 | % | ||||||||||||
|
Other
debt securities: (1)
|
||||||||||||||||||||
|
Fair
value
|
– | $ | 525 | – | $ | 1,008 | $ | 1,533 | ||||||||||||
|
Weighted
average yield
|
– | 9.04 | % | – | 0.15 | % | 1.03 | % | ||||||||||||
|
Equity
securities:
|
||||||||||||||||||||
|
Fair
value
|
– | – | – | $ | 3,459 | $ | 3,459 | |||||||||||||
|
Weighted
average yield
|
– | – | – | 3.65 | % | 3.65 | % | |||||||||||||
|
Total
fair value
|
$ | 8,556 | $ | 164,524 | $ | 45,999 | $ | 37,783 | $ | 256,862 | ||||||||||
|
Weighted
average yield
|
3.06 | % | 4.25 | % | 4.61 | % | 4.98 | % | 4.39 | % | ||||||||||
|
Investment
Securities Held-to-Maturity
|
||||||||||||||||||||
|
State
and municipal securities:
|
||||||||||||||||||||
|
Amortized
cost
|
– | – | $ | 3,347 | – | $ | 3,347 | |||||||||||||
|
Weighted
average yield
|
– | – | 7.12 | % | – | 7.12 | % | |||||||||||||
Securities
are assigned to categories based on stated contractual maturity except for
mortgage-backed securities and CMOs which are based on anticipated payment
periods. See interest rate sensitivity section for practical payment and
repricing characteristics. Tax-exempt securities were adjusted to a
tax-equivalent basis and are based on the marginal Federal corporate tax rate of
34 percent and a Tax Equity and Financial Responsibility Act (TEFRA) adjustment
of 13 basis points. Weighted average yields on investment securities
available-for-sale are based on historical cost.
(1)
Category includes $863,000 of pooled trust preferred securities that are on
non-accrual status.
Investments
Available-For-Sale
Available-for-sale
investment securities include securities that management intends to use as part
of its liquidity and asset/liability management strategy. These securities may
be sold in response to changes in market interest rates, changes in the
securities prepayment or credit risk or in response to the need for liquidity.
At December 31, 2009, the fair value of investment securities available-for-sale
was $256,862,000, or $2,611,000 above the amortized cost of $254,251,000. This
compared to a fair value of $219,597,000, or $353,000 below the amortized cost
of $219,950,000, at December 31, 2008. An unrealized holding gain of $1,723,000,
net of tax, was recorded as an increase to shareholders’ equity as of December
31, 2009, while an unrealized holding loss of $233,000, net of tax, was recorded
as a decrease to shareholders’ equity as of December 31, 2008. The fair value of
the portfolio, especially the state and municipal mortgage-backed and CMO
sectors, benefited from the significant decline in interest rates. However,
this benefit was partially offset by the decline in fair value of the pooled
trust preferred issues as discussed above. The available-for-sale portfolio,
excluding equity securities, had a weighted average maturity of approximately 3
years at December 31, 2009, and 2 years 7 months at December 31, 2008. The
weighted average tax-equivalent yield was 4.39% and 5.50% at December 31, 2009
and 2008, respectively.
The
weighted average maturity is based on the stated contractual maturity or likely
call date of all securities except for mortgage-backed securities and CMOs,
which are based on estimated average life. The maturity of the portfolio could
be shorter if interest rates would decline and prepayments on mortgage-backed
securities and CMOs increase or if more securities are called. However, the
estimated average life could be longer if rates were to increase and principal
payments on mortgage-backed securities and CMOs would slow or bonds anticipated
to be called are not called. The interest rate sensitivity analysis on page 45
reflects the repricing term of the securities portfolio based upon estimated
call dates and anticipated cash flows assuming an unchanged, as well as a
simulated, interest rate environment.
Investments
Held-To-Maturity
Investment
securities held-to-maturity are recorded at amortized cost. Included in this
portfolio are state and municipal securities. At December 31, 2009 and 2008, the
amortized cost of investment securities held-to-maturity was $3,347,000 and
$3,598,000, respectively, and the fair value was $3,471,000 and $3,683,000,
respectively. The held-to-maturity portfolio had a weighted average maturity of
approximately 1 year 7 months at December 31, 2009, and 2 years 4 months at
December 31, 2008. The weighted average tax-equivalent yield was 7.12% and 6.93%
at December 31, 2009 and 2008, respectively.
33
Loans
QNB’s
primary business is to accept deposits and to make loans to meet the credit
needs of the communities it serves. Loans are the most significant component of
earning assets and growth in loans to small businesses and residents of these
communities has been a primary focus of QNB. QNB has been successful in
achieving loan growth even during this difficult economic period. Inherent
within the lending function is the evaluation and acceptance of credit risk and
interest rate risk. QNB manages credit risk associated with its lending
activities through portfolio diversification, underwriting policies and
procedures and loan monitoring practices.
QNB has
comprehensive policies and procedures that define and govern commercial loan,
retail loan and indirect lease financing originations and the management of
risk. All loans are underwritten in a manner that emphasizes the borrowers’
capacity to pay. The measurement of capacity to pay delineates the potential
risk of non-payment or default. The higher potential for default determines the
need for and amount of collateral required. QNB makes unsecured commercial loans
when the capacity to pay is considered substantial. As capacity lessens,
collateral is required to provide a secondary source of repayment and to
mitigate the risk of loss. Various policies and procedures provide guidance to
the lenders on such factors as amount, terms, price, maturity and appropriate
collateral levels. Each risk factor is considered critical to ensuring that QNB
receives an adequate return for the risk undertaken, and that the risk of loss
is minimized.
QNB
manages the risk associated with commercial loans, which generally have balances
larger than retail loans, by having lenders work in tandem with credit analysts
while maintaining independence between personnel. In addition, a Bank loan
committee and a committee of the Board of Directors review and approve certain
loan requests on a weekly basis. At December 31, 2009, there were no
concentrations of loans exceeding 10% of total loans other than disclosed in the
table on page 38.
QNB’s
commercial lending activity is focused on small businesses within the local
community. Commercial and industrial loans represent commercial purpose loans
that are either secured by collateral other than real estate or unsecured.
Tax-exempt loans to qualified municipalities, school districts, and other
not-for-profit entities, not secured by real estate, are also classified as
commercial and industrial loans. Real estate commercial loans include commercial
purpose loans collateralized at least in part by commercial real estate. These
loans may not be for the express purpose of conducting commercial real estate
transactions. Real estate residential loans include loans secured by one-to-four
family units. These loans include fixed-rate home equity loans, floating rate
home equity lines of credit, loans to individuals for residential mortgages, and
commercial purpose loans.
Indirect
lease financing receivables represent loans to small businesses that are
collateralized by equipment. These loans tend to have higher risk
characteristics but generally provide higher rates of return. These loans are
originated by a third party and purchased by QNB based on criteria specified by
QNB. The criteria include minimum credit scores of the borrower, term of the
lease, type and age of equipment financed and geographic area. The geographic
area primarily represents states contiguous to Pennsylvania. QNB is not the
lessor and does not service these loans.
Substantially
all originations of loans to individuals for residential mortgages with
maturities of 20 years or greater are sold in the secondary market. At December
31, 2009 and 2008, real estate residential loans held-for-sale were $534,000 and
$120,000, respectively. These loans are carried at the lower of aggregate cost
or market.
Total
loans, excluding loans held-for-sale, at December 31, 2009 were $449,421,000, an
increase of $45,842,000, or 11.4%, from December 31, 2008. A key financial ratio
is the loan to deposit ratio which was 71.0% at December 31, 2009, compared with
73.4%, at December 31, 2008. The slight decline in the loan to deposit ratio
is more a function of the rapid increase in deposits, rather than a
slowdown in lending. Despite the recent difficult economic environment, the Bank
continues to make loans available to credit worthy residents and businesses. The
hiring of additional experienced commercial loan officers and additional credit
administration staff in 2008 and 2009 provides support to our continued goal of
increasing loans outstanding and building customer relationships.
34
The
Allowance for Loan Losses Allocation table on page 38 shows the percentage
composition of the loan portfolio over the past five years. Between 2008 and
2009 the makeup of the portfolio changed slightly with loans secured by
commercial real estate, the largest sector of the portfolio, increasing from
35.3% of the portfolio at December 31, 2008 to 38.5% of the portfolio at
December 31, 2009. Loans secured by commercial real estate increased by
$30,520,000, or 21.4%, to $173,019,000 at December 31, 2009, following an 8.5%
increase between December 31, 2007 and 2008. While loans secured by commercial
real estate represent a significant portion of the total portfolio, the
collateral is diversified including investment properties, manufacturing
facilities, office buildings, retirement and nursing home facilities, warehouses
and owner occupied facilities. Commercial real estate loans have drawn the
attention of the regulators in recent years as a potential source of risk. As a
result, QNB has increased its monitoring of these types of loans. QNB has had no
net charge-offs in this category over the past five years and as of December 31,
2009 and 2008 has $1,063,000 and $387,000, respectively, in loans in this
category classified as non-accruing or past due 90 days or more.
Real
estate loans secured by residential properties increased by $4,287,000, or 3.4%,
to $128,825,000 at December 31, 2009, and represented 28.7% of the portfolio at
this date, a decline from the 30.9% as of December 31, 2008. The increase in the
balance in this category in 2009 is primarily centered in commercial purpose
loans secured by residential properties which increased by $8,152,000 from
$34,263,000 at December 31, 2008 to $42,415,000 at December 31, 2009.
Also
included in this category are residential mortgage loans secured by first lien
1-4 family residential mortgages which increased by $1,838,000 from $22,091,000
at December 31, 2008 to $23,929,000 at December 31, 2009 and home equity loans
which declined by $5,620,000, or 8.2%, to 62,564,000 at December 31, 2009. With
the historically low level of interest rates mortgage activity, especially
refinancing activity, has increased significantly. QNB does not originate or
hold subprime 1-4 family mortgages or any other high-risk 1-4 family mortgage
products. In addition, QNB sells, but continues to service, most of the fixed
rate 1-4 family residential mortgages it originates, especially in the current
low interest rate environment. The demand for home equity loans has declined as
home values have stabilized or fallen and many homeowners are paying down their
home equity loans when they refinance their first mortgage. Another impact of
the low interest rate environment is the movement from fixed rate home equity
loans to floating rate lines tied to prime. Fixed rate home equity term loans
declined by $11,070,000, or 22.3%, to $38,528,000 at December 31, 2009 while
floating rate home equity lines of credit increased by $5,450,000, or 29.3%, to
$24,036,000. The movement from fixed rate to floating rate loans reflects the
significant decline in the prime rate to 3.25% and the introduction of the
Equity Choice product during 2008. This product is a variable rate line of
credit indexed to the prime rate that allows the borrower to carve out portions
of the variable rate balance and to fix the rate on that portion based on the
term and rate at that time. As the fixed rate portion is paid down, the
available amount under the line increases.
Construction
loans increased $5,673,000 during 2009 to $27,567,000 and represented
approximately 6.1% of the loan portfolio at December 31, 2009 compared with 5.4%
at December 31, 2008. These loans are primarily to developers and builders for
the construction of residential units or commercial buildings, to businesses for
the construction of owner occupied facilities or to individuals for
construction of their homes. This portfolio is diversified among different types
of collateral including:1-4 family residential construction, medical facilities,
factories, office buildings and land for development loans. Construction loans
are generally made only on projects that have municipal approval. These loans
are usually originated to include a short construction period followed by
permanent financing provided through a commercial or residential mortgage after
construction is complete. Once construction is complete the balance is moved to
either the commercial or residential real estate category. There have been no
charge-offs in this category over the past five years, however as of December
31, 2009 there were $1,387,000 listed as non-performing, with $1,334,000
representing loans to one borrower. There were no non-performing construction
loans as of December 31, 2008.
35
The
commercial and industrial loan category continued to experience strong growth in
2009, increasing $7,285,000, or 7.5%, to end the year at $104,523,000. This
followed growth of 9.9% in 2008. The percentage of the portfolio in this
category declined slightly from 24.1% at December 31, 2008 to 23.3% at year-end
2009. Most of the growth in this category in both years was centered in loans to
a few customers, both existing and new to QNB. These businesses have a history
of strong financial results and in many cases, the loans are also guaranteed by
the individuals owning the businesses. Although a certain number
of commercial and industrial loans are considered unsecured, the majority
are secured by non-real estate collateral such as equipment, vehicles, accounts
receivable and inventory.
At
December 31, 2009, indirect lease financing receivables represent approximately
2.6% of the portfolio compared to 3.2% of the portfolio at December 31, 2008.
Total balances at December 31, 2009 and 2008 were $11,826,000 and $12,762,000,
respectively. This portfolio contains loans to businesses in the trucking and
construction industries which have been hit hard by high fuel costs and the
slowdown in the economy. As a result of a high level of charge-offs and
delinquency in this portfolio, QNB has strengthened its underwriting standards
with regard to this portfolio. QNB experienced net charge-offs in this portfolio
of $549,000 and $396,000 in 2009 and 2008, respectively and non-performing
assets, including repossessed equipment, were $373,000 and $555,000 as of
December 31, 2009 and 2008, respectively.
Loan
Portfolio
|
December
31,
|
2009
|
2008
|
2007
|
2006
|
2005
|
|||||||||||||||
|
Commercial
and industrial
|
$ | 104,523 | $ | 97,238 | $ | 88,445 | $ | 72,718 | $ | 64,812 | ||||||||||
|
Construction
|
27,567 | 21,894 | 23,959 | 10,503 | 7,229 | |||||||||||||||
|
Agricultural
|
– | – | 25 | – | – | |||||||||||||||
|
Real
estate-commercial
|
173,019 | 142,499 | 131,392 | 118,166 | 104,793 | |||||||||||||||
|
Real
estate-residential
|
128,825 | 124,538 | 119,172 | 123,531 | 112,920 | |||||||||||||||
|
Consumer
|
3,702 | 4,483 | 4,442 | 5,044 | 5,080 | |||||||||||||||
|
Indirect
lease financing
|
11,826 | 12,762 | 13,431 | 13,405 | 6,451 | |||||||||||||||
|
Total
loans
|
449,462 | 403,414 | 380,866 | 343,367 | 301,285 | |||||||||||||||
|
Unearned
(fees) costs
|
(41 | ) | 165 | 150 | 129 | 64 | ||||||||||||||
|
Total
loans, net of unearned costs (fees)
|
$ | 449,421 | $ | 403,579 | $ | 381,016 | $ | 343,496 | $ | 301,349 | ||||||||||
Loan
Maturities and Interest Sensitivity
|
Under
|
1-5
|
Over
|
||||||||||||||
|
December
31, 2009
|
1
Year
|
Years
|
5
Years
|
Total
|
||||||||||||
|
Commercial
and industrial
|
$ | 15,570 | $ | 61,232 | $ | 27,721 | $ | 104,523 | ||||||||
|
Construction
|
9,064 | 5,769 | 12,734 | 27,567 | ||||||||||||
|
Real
estate-commercial
|
6,554 | 15,571 | 150,894 | 173,019 | ||||||||||||
|
Real
estate-residential
|
8,780 | 12,684 | 107,361 | 128,825 | ||||||||||||
|
Consumer
|
636 | 2,228 | 838 | 3,702 | ||||||||||||
|
Indirect
lease financing
|
543 | 11,283 | – | 11,826 | ||||||||||||
|
Total
|
$ | 41,147 | $ | 108,767 | $ | 299,548 | $ | 449,462 | ||||||||
Demand
loans, loans having no stated schedule of repayment and no stated maturity, are
included in under one year.
The
following shows the amount of loans due after one year that have fixed, variable
or adjustable interest rates at December 31, 2009:
|
Loans
with fixed predetermined interest rates:
|
$ | 102,266 | ||
|
Loans
with variable or adjustable interest rates:
|
$ | 306,049 |
36
Non-Performing
Assets
Non-performing
assets include accruing loans past due 90 days or more, non-accruing loans,
restructured loans, other real estate owned, other repossessed assets and
non-accruing pooled trust preferred securities. The chart below shows the
history of non-performing assets over the past five years. Total non-performing
assets were $7,032,000 at December 31, 2009, or 0.92%, of total assets. This
represents an increase from the December 31, 2008 balance of $1,627,000, or
0.24% of total assets. Included in non-performing assets in 2009 is
$863,000 of pooled trust preferred securities, discussed previously, that
were placed on non-accrual in 2009. QNB’s non-performing loans (non-accrual
loans, loans past due 90 days or more and accruing and restructured loans) were
$6,102,000, or 1.36% of total loans, at December 31, 2009, compared to
$1,308,000, or 0.32% of total loans at December 31, 2008. Despite the increase,
QNB’s percentages compare favorably with the average of 2.34% of total loans for
Pennsylvania commercial banks with assets between $500 million and $1 billion as
reported by the FDIC using December 31, 2009 data.
Loans
past due 90 days or more and still accruing totaled $759,000 at December 31,
2009, an increase from the $478,000 reported as of December 31, 2008. The
balance as of the end of 2009 relates primarily to one loan secured by
commercial real estate.
Non-accrual
loans are those on which the accrual of interest has ceased. Loans and indirect
financing leases are placed on non-accrual status immediately if, in the opinion
of management, collection is doubtful, or when principal or interest is past due
90 days or more and collateral is insufficient to protect principal and
interest. Included in the loan portfolio are loans on non-accrual status of
$3,086,000 at December 31, 2009 compared with $830,000 at December 31, 2008. A
significant portion of the increase relates to loans to a residential home
builder totaling $1,709,000.
Restructured
loans totaled $2,257,000 at December 31, 2009. There were no restructured loans
as of December 31, 2008, as defined in accounting guidance for troubled debt
restructuring in ASC 310-40, that have not already been included in loans past
due 90 days or more or in non-accrual loans. Included in restructured loans is
one loan for $1,915,000 that was modified to allow for interest only payments
until June 30, 2009 at which time the original terms of the loan resumed. This
loan performed under the modified terms and has resumed payments under the
original terms.
QNB did
not have any other real estate owned as of December 31, 2009. QNB held one
property in other real estate owned as of December 31, 2008 at a carrying amount
of $144,000 that was sold in 2009 at a loss of $67,000. Repossessed assets,
which primarily includes commercial trucks and equipment from the indirect
leasing portfolio, was $67,000 and $175,000 at December 31, 2009 and 2008,
respectively.
Loans not
included in past due, non-accrual or restructured categories, but where known
information about possible credit problems causes management to be uncertain as
to the ability of the borrowers to comply with the present loan repayment terms,
totaled $31,145,000 and $21,353,000 at December 31, 2009 and 2008, respectively.
The increase from 2008 levels reflects the economic environment of the past two
years particularly with regard to customers impacted by the downturn in the real
estate market, either commercial or residential. These customers include owners
of investment properties who have seen vacancy rates increase and rental rates
decline as well as businesses who are suppliers of products for new construction
or home remodeling.
Non-Performing
Assets
|
December
31,
|
2009
|
2008
|
2007
|
2006
|
2005
|
|||||||||||||||
|
Loans
past due 90 days or more not on non-accrual status
|
||||||||||||||||||||
|
Commercial
and industrial
|
– | $ | 17 | – | – | – | ||||||||||||||
|
Real
estate-commercial
|
$ | 709 | 300 | – | – | – | ||||||||||||||
|
Real
estate-residential
|
5 | 87 | $ | 156 | $ | 5 | – | |||||||||||||
|
Consumer
|
– | – | – | 4 | $ | 14 | ||||||||||||||
|
Indirect
lease financing
|
45 | 74 | 62 | – | – | |||||||||||||||
|
Total
loans past due 90 days or more and accruing
|
759 | 478 | 218 | 9 | 14 | |||||||||||||||
|
Loans
accounted for on a non-accrual basis
|
||||||||||||||||||||
|
Commercial
and industrial
|
486 | 147 | 202 | – | – | |||||||||||||||
|
Construction
|
1,342 | – | 478 | – | – | |||||||||||||||
|
Real
estate-commercial
|
354 | 87 | 103 | 113 | – | |||||||||||||||
|
Real
estate-residential
|
598 | 290 | 246 | 13 | – | |||||||||||||||
|
Consumer
|
– | – | – | – | – | |||||||||||||||
|
Indirect
lease financing
|
306 | 306 | 368 | 290 | – | |||||||||||||||
|
Total
non-accrual loans
|
3,086 | 830 | 1,397 | 416 | – | |||||||||||||||
|
Restructured
loans, not included above
|
2,257 | – | – | – | – | |||||||||||||||
|
Other
real estate owned
|
– | 144 | – | – | – | |||||||||||||||
|
Repossessed
assets
|
67 | 175 | 6 | 41 | – | |||||||||||||||
|
Non-accrual
pooled trust preferred securities
|
863 | – | – | – | – | |||||||||||||||
|
Total
non-performing assets
|
$ | 7,032 | $ | 1,627 | $ | 1,621 | $ | 466 | $ | 14 | ||||||||||
|
Total
as a percent of total assets
|
0.92 | % | 0.24 | % | 0.27 | % | 0.08 | % | 0.002 | % | ||||||||||
37
Allowance
For Loan Losses
The
allowance for loan losses represents management’s best estimate of the known and
inherent losses in the existing loan portfolio. Management believes that it uses
the best information available to make determinations about the adequacy of the
allowance and that it has established its existing allowance for loan losses in
accordance with U.S. generally accepted accounting principles (GAAP). The
determination of an appropriate level of the allowance for loan losses is based
upon an analysis of the risks inherent in QNB’s loan portfolio. Management, in
determining the allowance for loan losses makes significant estimates and
assumptions. Since the allowance for loan losses is dependent, to a great
extent, on conditions that may be beyond QNB’s control, it is at least
reasonably possible that management’s estimates of the allowance for loan losses
and actual results could differ. In addition, various regulatory agencies, as an
integral part of their examination process, periodically review QNB’s allowance
for losses on loans. Such agencies may require QNB to recognize changes to the
allowance based on their judgments about information available to them at the
time of their examination.
Management
conducts a quarterly analysis of the appropriateness of the allowance for loan
losses. This analysis considers a number of relevant factors including:
historical loan loss experience, general economic conditions, levels of and
trends in delinquent and non-performing loans, levels of classified loans,
trends in the growth rate of loans and concentrations of credit.
QNB
utilizes a risk weighting system that assigns a risk code to every commercial
loan. This risk weighting system is supplemented with a program that encourages
account officers to identify potentially deteriorating loan situations. The
officer analysis program is used to complement the on-going analysis of the loan
portfolio performed during the loan review function. In addition, QNB has a
committee that meets quarterly to review the appropriateness of the allowance
for loan losses based on the current and projected status of all relevant
factors pertaining to the loan portfolio.
Allowance
for Loan Losses Allocation
|
December
31,
|
2009
|
2008
|
2007
|
2006
|
2005
|
|||||||||||||||||||||||||||||||||||
|
Percent
Gross
|
Percent
Gross
|
Percent
Gross
|
Percent
Gross
|
Percent
Gross
|
||||||||||||||||||||||||||||||||||||
|
Amount
|
Loans
|
Amount
|
Loans
|
Amount
|
Loans
|
Amount
|
Loans
|
Amount
|
Loans
|
|||||||||||||||||||||||||||||||
|
Balance
at end of period applicable to:
|
||||||||||||||||||||||||||||||||||||||||
|
Commercial
and industrial
|
$ | 1,797 | 23.3 | % | $ | 886 | 24.1 | % | $ | 850 | 23.2 | % | $ | 623 | 21.2 | % | $ | 695 | 21.5 | % | ||||||||||||||||||||
|
Construction
|
383 | 6.1 | 219 | 5.4 | 249 | 6.3 | 138 | 3.0 | 108 | 2.4 | ||||||||||||||||||||||||||||||
|
Real
estate-commercial
|
2,059 | 38.5 | 1,396 | 35.3 | 1,435 | 34.5 | 1,214 | 34.4 | 1,258 | 34.8 | ||||||||||||||||||||||||||||||
|
Real
estate-residential
|
1,121 | 28.7 | 728 | 30.9 | 427 | 31.3 | 378 | 36.0 | 262 | 37.5 | ||||||||||||||||||||||||||||||
|
Consumer
|
61 | 0.8 | 69 | 1.1 | 56 | 1.2 | 61 | 1.5 | 23 | 1.7 | ||||||||||||||||||||||||||||||
|
Indirect
lease financing
|
581 | 2.6 | 410 | 3.2 | 259 | 3.5 | 214 | 3.9 | 29 | 2.1 | ||||||||||||||||||||||||||||||
|
Unallocated
|
215 | 128 | 3 | 101 | 151 | |||||||||||||||||||||||||||||||||||
|
Total
|
$ | 6,217 | 100.0 | % | $ | 3,836 | 100.0 | % | $ | 3,279 | 100.0 | % | $ | 2,729 | 100.0 | % | $ | 2,526 | 100.0 | % | ||||||||||||||||||||
Gross
loans represent loans before unamortized net loan fees and costs. Percent gross
loans lists the percentage of each loan type to total loans.
A loan is
considered impaired, based on current information and events, if it is probable
that QNB will be unable to collect the scheduled payments of principal or
interest when due according to the contractual terms of the loan agreement.
Impaired loans are primarily those classified as non-accrual or restructured.
The measurement of impaired loans is generally based on the present value of
expected future cash flows discounted at the effective interest rate, except
that all collateral-dependent loans are measured for impairment based on the
fair value of the collateral. At December 31, 2009 and 2008, the recorded
investment in loans for which impairment has been recognized totaled $5,699,000
and $824,000 of which $4,622,000 and $238,000, respectively, required no
allowance for loan losses. The recorded investment in impaired loans
requiring an allowance for loan losses was $1,077,000 and $586,000 at
December 31, 2009 and 2008, respectively. At December 31, 2009 and 2008 the
related allowance for loan losses associated with these loans was $528,000 and
$188,000, respectively. Most of the loans that have been identified as impaired
are collateral-dependent.
38
QNB had
net loan charge-offs of $1,769,000, or 0.41% of average total loans for 2009
compared to $768,000, or 0.20% of average total loans for 2008. The charge-offs
were spread fairly evenly between three portfolios, commercial and industrial
loans, real estate loans secured by residential property and indirect lease
financing. Commercial and industrial loan charge-offs totaled $682,000 in 2009
and were centered primarily in two customers in the construction industry.
Charge-offs for loans secured by residential real estate totaled $527,000, with
$460,000 representing a loan to a commercial borrower whose loans were secured
by junior liens on his residence and whose business relied primarily on the
newspaper industry, an industry severely impacted by the downturn in the economy
and the increased use of the internet. Indirect lease financing net charge-offs
were $549,000 and $396,000 for 2009 and 2008, respectively. This portfolio
contains loans to businesses in the trucking and construction industries which
were hit hard by the significant increase in fuel costs during 2007 and most of
2008 followed by the overall slowdown in the economy in 2008 and 2009.
The
allowance for loan losses was $6,217,000 at December 31, 2009 and represents
1.38% of total loans, compared with $3,836,000, or 0.95% of total loans, at
December 31, 2008. QNB’s management determined a $4,150,000 provision for loan
losses was appropriate in 2009 compared to a provision of $1,325,000 for 2008.
The higher amount of charge-offs combined with increased levels of
non-performing and delinquent loans and the deterioration in economic conditions
precipitated the need for the additional provision in 2009. Management believes
the allowance for loan losses of $6,217,000, or 1.38% of total loans, is
adequate as of December 31, 2009 in relation to the estimate of known and
inherent losses in the portfolio.
Allowance
for Loan Losses
|
2009
|
2008
|
2007
|
2006
|
2005
|
||||||||||||||||
|
Allowance
for loan losses:
|
||||||||||||||||||||
|
Balance,
January 1
|
$ | 3,836 | $ | 3,279 | $ | 2,729 | $ | 2,526 | $ | 2,612 | ||||||||||
|
Charge-offs
|
||||||||||||||||||||
|
Commercial
and industrial
|
682 | 280 | 18 | 5 | 7 | |||||||||||||||
|
Real
estate-commercial
|
– | – | – | – | – | |||||||||||||||
|
Real
estate-residential
|
527 | – | 6 | – | 6 | |||||||||||||||
|
Consumer
|
80 | 137 | 137 | 145 | 102 | |||||||||||||||
|
Indirect
lease financing
|
645 | 429 | 125 | 37 | – | |||||||||||||||
|
Total
charge-offs
|
1,934 | 846 | 286 | 187 | 115 | |||||||||||||||
|
Recoveries
|
||||||||||||||||||||
|
Commercial
and industrial
|
4 | 6 | – | 2 | – | |||||||||||||||
|
Real
estate-commercial
|
– | – | – | – | – | |||||||||||||||
|
Real
estate-residential
|
27 | – | – | 2 | – | |||||||||||||||
|
Consumer
|
38 | 39 | 75 | 41 | 29 | |||||||||||||||
|
Indirect
lease financing
|
96 | 33 | 61 | – | – | |||||||||||||||
|
Total
recoveries
|
165 | 78 | 136 | 45 | 29 | |||||||||||||||
|
Net
charge-offs
|
(1,769 | ) | (768 | ) | (150 | ) | (142 | ) | (86 | ) | ||||||||||
|
Provision
for loan losses
|
4,150 | 1,325 | 700 | 345 | – | |||||||||||||||
|
Balance,
December 31
|
$ | 6,217 | $ | 3,836 | $ | 3,279 | $ | 2,729 | $ | 2,526 | ||||||||||
|
Total
loans (excluding loans held-for-sale):
|
||||||||||||||||||||
|
Average
|
$ | 426,768 | $ | 382,700 | $ | 364,138 | $ | 323,578 | $ | 278,221 | ||||||||||
|
Year-end
|
449,421 | 403,579 | 381,016 | 343,496 | 301,349 | |||||||||||||||
|
Ratios:
|
||||||||||||||||||||
|
Net
charge-offs to:
|
||||||||||||||||||||
|
Average
loans
|
0.41 | % | 0.20 | % | 0.04 | % | 0.04 | % | 0.03 | % | ||||||||||
|
Loans
at year-end
|
0.39 | 0.19 | 0.04 | 0.04 | 0.03 | |||||||||||||||
|
Allowance
for loan losses
|
28.45 | 20.02 | 4.57 | 5.20 | 3.40 | |||||||||||||||
|
Provision
for loan losses
|
42.63 | 57.96 | 21.43 | 41.16 | – | |||||||||||||||
|
Allowance
for loan losses to:
|
||||||||||||||||||||
|
Average
loans
|
1.46 | % | 1.00 | % | 0.90 | % | 0.84 | % | 0.91 | % | ||||||||||
|
Loans
at year-end
|
1.38 | 0.95 | 0.86 | 0.79 | 0.84 | |||||||||||||||
39
Deposits
QNB
primarily attracts deposits from within its market area by offering various
deposit products. These deposits are in the form of time, demand and savings
accounts. Time deposits included certificates of deposit and individual
retirement accounts (IRA’s). The Bank’s demand and savings accounts include
money market accounts, interest-bearing demand accounts, including a high-yield
eRewards checking account, traditional savings accounts, youth savings accounts
and a new high-yield online eSavings account.
Total
deposits increased $84,313,000, or 15.3%, to $634,103,000 at December 31, 2009.
This follows an increase of 11.3% between 2007 and 2008. Average deposits
increased $77,386,000, or 15.0%, during 2009 compared with $24,781,000, or 5.0%,
in 2008.
The mix
of deposits, continued to be impacted by the reaction of customers to interest
rates on various products and by rates paid by the competition. Most customers
continue to look for the highest rate for the shortest term if looking for a
time deposit or rate and liquidity in choosing a transaction account. In
addition, with concerns over the safety of their deposits and the strength of
their financial institutions customers appear to be looking for the safety
of FDIC insured deposits and the stability of a strong local community bank. On
October 3, 2008, in response to the ongoing economic crisis affecting the
financial services industry, the Emergency Economic Stabilization Act of 2008
was enacted which temporarily raises the basic limit on FDIC coverage from
$100,000 to $250,000 per depositor. This legislation has been extended and
provides that the basic deposit insurance limit will return to $100,000 after
December 31, 2013. On October 13, 2008, the FDIC established a Temporary
Liquidity Guarantee Program under which the FDIC will fully guarantee all
non-interest-bearing transaction accounts (the “Transaction Account Guarantee
Program”). This program is currently set to expire on June 30, 2010. QNB
is participating in the Transaction Account Guarantee Program and was
assessed an additional ten basis points for FDIC insurance for transaction
account balances in excess of $250,000 during 2009. In 2010, this assessment
increases to fifteen basis points until the expiration of the program at the end
of June 2010.
Unlike
prior years, the majority of the growth when comparing year end balances was not
attributable to time deposits. Total time deposit account balances were
$321,096,000 at December 31, 2009, an increase of $9,794,000, or 3.1%, when
comparing total deposit balances at December 31, 2009 and December 31, 2008. The
Wescosville branch, opened in November 2008, continued to be an attractive
source of deposits and especially time deposits in 2009. Total deposits at this
branch increased $20,385,000 from $22,479,000 at December 31, 2008 to
$42,864,000 at December 31, 2009 while time deposits increased by $13,044,000
from $22,377,000 to $35,421,000 over this same time period. Much of the growth
in time deposits occurred in maturity ranges of twelve to twenty-four months as
a result of several specials, which QNB promoted in response to customers’
preferences and competitors’ offerings. Average time deposits increased
$49,546,000, or 17.9%, in 2009 compared with a $31,384,000, or 12.8%, increase
in 2008. Time deposits of $100,000 or more contributed $29,999,000 to the growth
in average total time deposits when comparing 2009 to 2008, possibly a reaction
to the increase in insurance discussed above. The significant difference between
the average rate of growth in time deposits and the year over year growth rate
is primarily reaction to changes in interest rates. When interest rates declined
significantly in 2008 and 2009, rates on time deposits did not initially decline
at the speed or to the magnitude of rates on other products. As the decline in
time deposit rates took hold during the second half of 2009 customers began
looking to other interest-bearing deposit accounts that provided a fair return
and liquidity.
40
As
mentioned previously, unlike prior years most of the growth in total deposits
was in the categories of interest-bearing demand, money market and savings
accounts, not time deposits. This growth is consistent with customers looking
for the highest rate for the shortest term. The Bank currently offers several
attractive non-maturity interest-bearing account options that pay very
competitive rates and allow the flexibility to add and withdrawal funds without
penalty. In anticipation of rates increasing at some point in the future,
customers have been migrating to these types of accounts rather than committing
to a specific rate and term for a time deposit account.
Interest-bearing
demand accounts, which include municipal accounts, increased $24,924,000, or
26.1%, to $120,554,000 at December 31, 2009. This compares to a decline of
$1,660,000, or 1.7%, between December 31, 2007 and December 31, 2008. Similar to
non-interest bearing demand accounts, the balances in these accounts can be
volatile on a daily basis. The volatility in this product is usually a result of
the movement of balances by school districts and municipalities. When comparing
balances at December 31, 2009 to December 31, 2008 municipal balances increased
by $6,798,000, or 22.7%.
Also
contributing to the increase in interest-bearing demand accounts was the
introduction, during the second quarter of 2008, of eRewards checking, a high
rate checking account which initially paid 4.01% interest on balances up to
$25,000 and 1.01% interest on balances over $25,000. At the beginning of
the second quarter of 2009 the rate on the eRewards checking account was reduced
to 3.25% where it remained for the rest of 2009. In order to receive this rate a
customer must receive an electronic statement, have one direct deposit or other
ACH transaction and perform at least 12 check card transactions per statement
cycle. If these criteria are not met the customer receives a rate of 0.15%. The
eRewards checking product has been extremely successful and has been the
main contributor to the growth in this category. At December 31, 2009 eRewards
checking accounts had a balance of $22,210,000 compared to a balance of
$6,897,000 at year end 2008. When comparing average balances, average
interest-bearing demand accounts increased $5,854,000, or 6.0%, in 2009 compared
with a decline of 1.8% in 2008. Municipal accounts were $6,661,000 lower, on
average, than 2008. This was offset by an increase of $11,958,000 in average
eRewards checking balances.
Ending
the trend of the past several years, money market accounts increased
$24,593,000, or 54.0%, to $70,165,000 at December 31, 2009. This compares to a
decrease of $4,094,000, or 8.2%, between December 31, 2007 and December 31,
2008. Personal money market accounts increased by $9,791,000 while business and
municipal accounts increased by $14,802,000. Average money market balances
increased 26.0% in 2009 compared to a decrease in average balances of 7.9% in
2008. With the rates paid on many of the money market account balance tiers
exceeding the rates on short-term time deposits and municipal interest-bearing
demand accounts, some customers have opted to move balances to money market
accounts.
Similar
to money market accounts, customers have elected to place funds in savings
accounts that provide safety, liquidity and interest. Savings account balances
increased significantly by $24,352,000, or 55.3%, to $68,358,000 at December 31,
2009. This followed an increase in balances of $1,931,000, or 4.6%, between
December 31, 2007 and December 31, 2008. Contributing to the significant
increase in balances was the introduction during the second quarter of 2009 of
an online eSavings account positioned to compete with other online savings
products. This account yields 1.85% and had balances of $19,944,000 at December
31, 2009. Average savings balances increased 16.8% in 2009 and decreased by 2.1%
in 2008.
At
year-end 2009, non-interest bearing demand accounts increased 1.2% to
$53,930,000. This compares to an increase of 6.5% at year-end 2008 compared with
year-end 2007. Average non-interest bearing demand accounts increased
$2,092,000, or 4.1%, to $53,262,000 when comparing 2009 to 2008. This compares
to a slight increase of 0.5% in average balances when comparing 2008 to 2007.
These deposits are primarily comprised of business checking accounts and are
volatile depending on the timing of deposits and withdrawals.
41
To
continue to attract and retain deposits, QNB plans to be competitive with
respect to rates and to continue to deliver products with terms and features
that appeal to customers. The eRewards checking account and online eSavings
accounts are examples of such products. In addition, during 2009, QNB began
offering the ability to open accounts online and also became a member of the
Certificate of Deposit Account Registry Service (CDARS) program. CDARS is a
funding and liquidity management tool that is used by banks to access funds and
manage their balance sheet. It enables financial institutions to provide
customers with full FDIC insurance on time deposits over $250,000 that are
placed in the program.
Maturity
of Time Deposits of $100,000 or More
|
Year
Ended December 31,
|
2009
|
2008
|
2007
|
|||||||||
|
Three
months or less
|
$ | 20,316 | $ | 24,026 | $ | 14,015 | ||||||
|
Over
three months through six months
|
17,409 | 11,357 | 12,736 | |||||||||
|
Over
six months through twelve months
|
22,576 | 43,552 | 25,320 | |||||||||
|
Over
twelve months
|
45,640 | 26,031 | 12,518 | |||||||||
|
Total
|
$ | 105,941 | $ | 104,966 | $ | 64,589 | ||||||
Average
Deposits by Major Classification
|
2009
|
2008
|
2007
|
||||||||||||||||||||||
|
Balance
|
Rate
|
Balance
|
Rate
|
Balance
|
Rate
|
|||||||||||||||||||
|
Non-interest
bearing demand
|
$ | 53,262 | – | $ | 51,170 | – | $ | 50,942 | – | |||||||||||||||
|
Interest-bearing
demand
|
70,398 | 0.57 | % | 57,883 | 0.27 | % | 54,711 | 0.18 | % | |||||||||||||||
|
Municipals
interest-bearing demand
|
33,077 | 1.08 | 39,738 | 2.06 | 44,718 | 4.84 | ||||||||||||||||||
|
Money
market
|
60,535 | 1.16 | 48,027 | 1.83 | 52,129 | 3.01 | ||||||||||||||||||
|
Savings
|
51,245 | 0.37 | 43,859 | 0.39 | 44,780 | 0.39 | ||||||||||||||||||
|
Time
|
218,047 | 3.13 | 198,500 | 4.10 | 184,643 | 4.52 | ||||||||||||||||||
|
Time
of $100,000 or more
|
107,764 | 3.18 | 77,765 | 4.09 | 60,238 | 4.76 | ||||||||||||||||||
|
Total
|
$ | 594,328 | 2.00 | % | $ | 516,942 | 2.58 | % | $ | 492,161 | 3.09 | % | ||||||||||||
Liquidity
Liquidity
represents an institution’s ability to generate cash or otherwise obtain funds
at reasonable rates to satisfy demand for loans and deposit withdrawals. QNB
attempts to manage its mix of cash and interest-bearing balances, Federal funds
sold and investment securities in an attempt to match the volatility,
seasonality, interest sensitivity and growth trends of its loans and deposits.
The Company manages its liquidity risk by measuring and monitoring its liquidity
sources and estimated funding needs. Liquidity is provided from asset sources
through maturities and repayments of loans and investment securities. The
portfolio of investment securities available-for-sale and QNB’s policy of
selling certain residential mortgage originations in the secondary market also
provide sources of liquidity. Core deposits and cash management repurchase
agreements have historically been the most significant funding sources for QNB.
These deposits and repurchase agreements are generated from a base of consumers,
businesses and public funds primarily located in the Company’s market area.
Additional
sources of liquidity are provided by the Bank’s membership in the FHLB. At
December 31, 2009, the Bank had a maximum borrowing capacity with the FHLB of
approximately $144,797,000. At December 31, 2009 and 2008, the Bank had
$10,000,000 in outstanding advances from the FHLB at a rate of 2.97%. These
borrowings matured in January 2010 and were repaid. The maximum borrowing
capacity changes as a function of qualifying collateral assets. In addition, the
Bank maintains two unsecured Federal funds lines granted by correspondent banks
totaling $18,000,000. At December 31, 2009 and 2008 there were no outstanding
borrowings under these lines. Future availability under these lines is subject
to the policies of the granting banks and may be withdrawn.
42
Total
cash and cash equivalents, available-for-sale securities and loans held-for-sale
totaled $288,395,000 at December 31, 2009 and $236,168,000 at December 31, 2008.
The increase in liquid sources is primarily the result of an increase in the
available-for-sale securities portfolio and interest-bearing deposits held at
the Federal Reserve Bank. These sources should be adequate to meet normal
fluctuations in loan demand or deposit withdrawals. With the current low
interest rate environment, it is anticipated that the investment portfolio will
continue to provide significant liquidity as agency and municipal bonds are
called and as cash flow on mortgage-backed and CMO securities continue to
be steady. In the event that interest rates would increase the cash flow
available from the investment portfolio could decrease.
Approximately
$133,136,000 and $101,302,000 of available-for-sale securities at December 31,
2009 and 2008, respectively, were pledged as collateral for repurchase
agreements and deposits of public funds.
In 2008,
QNB opted into the FDIC’s Transaction Account Guarantee Program. This program
provides unlimited deposit insurance for non-interest bearing transaction
accounts. This program expires June 30, 2010.
As an
additional source of liquidity, QNB has become a member of the Certificate of
Deposit Account Registry Services (CDARS) program offered by the Promontory
Interfinancial Network, LLC. CDARS is a funding and liquidity management tool
used by banks to access funds and manage their balance sheet. It enables
financial institutions to provide customers with full FDIC insurance on time
deposits over $250,000 that are placed in the program.
Capital
Adequacy
A strong
capital position is fundamental to support continued growth and profitability
and to serve the needs of depositors. QNB’s shareholders’ equity at December 31,
2009 was $56,426,000, or 7.40% of total assets, compared to shareholders’ equity
of $53,909,000, or 8.11% of total assets, at December 31, 2008. Shareholders’
equity at December 31, 2009 included a positive adjustment of $1,723,000 related
to unrealized holding gains, net of taxes, on investment securities
available-for-sale while shareholders’ equity at December 31, 2008 included a
negative adjustment of $233,000 related to unrealized holding losses, net of
taxes, on investment securities available-for-sale. Without these adjustments,
shareholders’ equity to total assets would have been 7.17% and 8.15% at
December 31, 2009 and 2008, respectively.
Average
shareholders’ equity and average total assets were $54,710,000 and $710,580,000
for 2009, an increase of 2.3% and 12.5%, respectively, from 2008 averages. The
ratio of average total equity to average total assets was 7.70% for 2009,
compared to 8.47% for 2008.
QNB is
subject to restrictions on the payment of dividends to its shareholders pursuant
to the Pennsylvania Business Corporation Law as amended (the BCL). The BCL
operates generally to preclude dividend payments, if the effect thereof would
render QNB insolvent, as defined. As a practical matter, QNB’s payment of
dividends is contingent upon its ability to obtain funding in the form of
dividends from the Bank. Under Pennsylvania banking law, the Bank is subject to
certain restrictions on the amount of dividends that it may declare without
prior regulatory approval. At December 31, 2009, $48,620,000 of retained
earnings was available for dividends without prior regulatory approval,
subject to the regulatory capital requirements discussed below. QNB paid
dividends to its shareholders of $0.96 per share in 2009, an increase of 4.3%
from the $0.92 per share paid in 2008.
QNB is
subject to various regulatory capital requirements as issued by Federal
regulatory authorities. Regulatory capital is defined in terms of Tier I capital
(shareholders’ equity excluding unrealized gains or losses on available-for-sale
securities and disallowed intangible assets), Tier II capital
which includes the allowance for loan losses and a portion of the
unrealized gains on equity securities, and total capital (Tier I plus Tier II).
Risk-based capital ratios are expressed as a percentage of risk-weighted assets.
Risk-weighted assets are determined by assigning various weights to all assets
and off-balance sheet arrangements, such as letters of credit and loan
commitments, based on associated risk. Regulators have also adopted minimum Tier
I leverage ratio standards, which measure the ratio of Tier I capital to
total quarterly average assets.
The
minimum regulatory capital ratios are 4.00% for Tier I, 8.00% for total
risk-based and 4.00% for leverage. Under the requirements, at December 31, 2009
and 2008, QNB has a Tier I capital ratio of 10.30% and 11.55%, a total
risk-based ratio of 11.51% and 12.37%, and a leverage ratio of 7.34% and 8.32%,
respectively.
The
decline in capital ratios from December 31, 2008 was primarily a result of the
significant asset growth achieved during 2009, and that rate of growth exceeding
the growth rate of capital. Capital levels were impacted by the decision to
repurchase common stock as well as the decision to increase the cash dividend
during the first quarter of 2009. On January 24, 2008, QNB announced that the
Board of Directors authorized the repurchase of up to 50,000 shares of its
common stock in open market or privately negotiated transactions. The repurchase
authorization does not bear a termination date. On February 9, 2009, the Board
of Directors approved increasing the authorization to 100,000 shares. As of
December 31, 2009, 57,883 shares were repurchased under this authorization at an
average price of $16.97 and a total cost of $982,000. There were no shares
repurchased under the plan since the first quarter of 2009.
43
Also
impacting the regulatory capital ratios was a $64,574,000 increase in
risk-weighted assets during 2009. Loan growth, primarily centered in commercial
loans which generally carry a 100% risk-weighting, accounted for approximately
$47,513,000 of the growth in risk-weighted assets, while $27,888,000 of the
increase in risk-weighted assets was due to mezzanine tranches of pooled trust
preferred securities that were downgraded below investment grade during the
first quarter of 2009. Although the amortized cost of these securities was only
$4,073,000 at December 31, 2009, regulatory guidance required an additional
$27,888,000 to be included in risk-weighted assets. The Bank utilized the method
as outlined in the Call Report Instructions for an available-for-sale bond that
has not triggered the Low Level Exposure (LLE) rule. The mezzanine tranches of
CDOs that utilized this method of risk-weighting are 5 out of 8 pooled trust
preferred securities (PreTSLs) held by the Bank as of December 31,
2009. The other three pooled trust preferred securities have only one
tranche remaining so the treatment noted above does not apply.
The
Federal Deposit Insurance Corporation Improvement Act of 1991 established five
capital level designations ranging from “well capitalized” to “critically
undercapitalized.” At December 31, 2009 and December 31, 2008, management
believes that the Company and the Bank met all capital adequacy requirements to
which they are subject and have met the “well capitalized” criteria which
requires minimum Tier I and total risk-based capital ratios of 6.00% and 10.00%,
respectively, and a leverage ratio of 5.00%.
Capital
Analysis
|
December
31,
|
2009
|
2008
|
||||||
|
Tier
I
|
||||||||
|
Shareholders’
equity
|
$ | 56,426 | $ | 53,909 | ||||
|
Net
unrealized securities (gains) losses
|
(1,723 | ) | 233 | |||||
|
Net
unrealized losses on available-for-sale equity securities
|
– | (246 | ) | |||||
|
Total
Tier I risk-based capital
|
54,703 | 53,896 | ||||||
|
Tier
II
|
||||||||
|
Allowable
portion: Allowance for loan losses
|
6,217 | 3,836 | ||||||
|
Unrealized
gains on equity securities
|
248 | – | ||||||
|
Total
risk-based capital
|
$ | 61,168 | $ | 57,732 | ||||
|
Risk-weighted
assets
|
$ | 531,295 | $ | 466,721 | ||||
Capital
Ratios
|
December
31,
|
2009
|
2008
|
||||||
|
Tier
I capital/risk-weighted assets
|
10.30 | % | 11.55 | % | ||||
|
Total
risk-based capital/risk-weighted assets
|
11.51 | 12.37 | ||||||
|
Tier
I capital/average assets (leverage ratio)
|
7.34 | 8.32 | ||||||
Recently
Issued Accounting Standards
Refer to
Note 1 of the Notes to Consolidated Financial Statements for discussion of
recently issued accounting standards.
Critical
Accounting Policies and Estimates
Disclosure
of the Company’s significant accounting policies is included in Note 1 to the
consolidated financial statements. Additional information is contained in
Management’s Discussion and Analysis and the Notes to the Consolidated Financial
Statements for the most sensitive of these issues. The discussion and analysis
of the financial condition and results of operations are based on the
consolidated financial statements of QNB, which are prepared in accordance with
U.S. generally accepted accounting principles (GAAP) and predominant practices
within the banking industry. The preparation of these consolidated financial
statements requires QNB to make estimates and judgments that affect the reported
amounts of assets, liabilities, revenues and expenses, and related
disclosure of contingent assets and liabilities. QNB evaluates estimates on an
on-going basis, including those related to the determination of the allowance
for loan losses, the determination of the valuation of other real estate owned,
other-than-temporary impairments on investment securities, the determination of
impairment of restricted bank stock, the valuation of deferred tax assets,
stock-based compensation and income taxes. QNB bases its estimates on historical
experience and various other factors and assumptions that are believed to be
reasonable under the circumstances, the results of which form the basis for
making judgments about the carrying values of assets and liabilities that are
not readily apparent from other sources. Actual results may differ from these
estimates under different assumptions or conditions.
44
Other-than-Temporary
Investment Security Impairment
Securities
are evaluated periodically to determine whether a decline in their value is
other-than-temporary. Management utilizes criteria such as the magnitude and
duration of the decline, in addition to the reasons underlying the decline, to
determine whether the loss in value is other-than-temporary. The term
“other-than-temporary” is not intended to indicate that the decline is
permanent, but indicates that the prospect for a near-term recovery of value is
not necessarily favorable, or that there is a lack of evidence to support a
realizable value equal to or greater than the carrying value of the investment.
For equity securities, once a decline in value is determined to be
other-than-temporary, the value of the equity security is reduced and a
corresponding charge to earnings is recognized.
Effective
April 1, 2009, the Company adopted new accounting guidance related to
recognition and presentation of other-than-temporary impairment. This recent
accounting guidance amends the recognition guidance for other-than-temporary
impairments of debt securities and expands the financial statement disclosures
for other-than-temporary impairment losses on debt securities. The recent
guidance replaced the “intent and ability” indication in previous guidance by
specifying that (a) if a company does not have the intent to sell a debt
security prior to recovery and (b) it is more likely than not that it will not
have to sell the debt security prior to recovery, the security would not be
considered other-than-temporarily impaired unless there is a credit loss. When
an entity does not intend to sell the security, and it is more likely than not,
the entity will not have to sell the security before recovery of its cost basis,
it will recognize the credit component of an other-than-temporary impairment of
a debt security in earnings and the remaining portion in other comprehensive
income. For held to maturity debt securities, the amount of an
other-than-temporary impairment recorded in other comprehensive income for the
noncredit portion of a previous other-than-temporary impairment should be
amortized prospectively over the remaining life of the security on the
basis of the timing of future estimated cash flows of the security. The impact
of the adoption increased net income by approximately $1,340,000 for the year
ended December 31, 2009 which represents the after-tax non-credit portion of
other-than-temporary impairments for the year ended December 31, 2009. The
effect of the adoption of the new accounting guidance on debt securities
previously reported as other-than-temporarily impaired was not material and,
therefore, QNB did not record a transition adjustment as of the effective date
of the new guidance.
Impairment
of Restricted Investment in Bank Stock
Restricted
bank stock is comprised of restricted stock of the Federal Home Loan Bank of
Pittsburgh (FHLB) and the Atlantic Central Bankers Bank at December 31, 2009.
Federal law requires a member institution of the FHLB to hold stock of its
district bank according to a predetermined formula.
In
December 2008, the FHLB notified member banks that it was suspending dividend
payments and the repurchase of capital stock to preserve capital. Management’s
determination of whether these investments are impaired is based on their
assessment of the ultimate recoverability of their cost rather than by
recognizing temporary declines in value. The determination of whether a decline
affects the ultimate recoverability of their cost is influenced by criteria such
as (1) the significance of the decline in net assets of the FHLB as compared to
the capital stock amount for the FHLB and the length of time this situation has
persisted, (2) commitments by the FHLB to make payments required by law or
regulation and the level of such payments in relation to the operating
performance of the FHLB, and (3) the impact of legislative and regulatory
changes on institutions and, accordingly, on the customer base of the FHLB.
Management believes no impairment charge is necessary related to the restricted
stock as of December 31, 2009.
Allowance
for Loan Losses
QNB
considers that the determination of the allowance for loan losses involves a
higher degree of judgment and complexity than its other significant accounting
policies. The allowance for loan losses is calculated with the objective of
maintaining a level believed by management to be sufficient to absorb probable
known and inherent losses in the outstanding loan portfolio. The allowance is
reduced by actual credit losses and is increased by the provision for loan
losses and recoveries of previous losses. The provisions for loan losses
are charged to earnings to bring the total allowance for loan losses to a level
considered necessary by management.
The
allowance for loan losses is based on management’s continual review and
evaluation of the loan portfolio. The level of the allowance is determined by
assigning specific reserves to individually identified problem credits and
general reserves to all other loans. The portion of the allowance that is
allocated to impaired loans is determined by estimating the inherent loss on
each credit after giving consideration to the value of underlying collateral.
The general reserves are based on the composition and risk characteristics of
the loan portfolio, including the nature of the loan portfolio, credit
concentration trends, delinquency and loss experience, as well as other
qualitative factors such as current economic trends.
45
Management
emphasizes loan quality and close monitoring of potential problem credits.
Credit risk identification and review processes are utilized in order to assess
and monitor the degree of risk in the loan portfolio. QNB’s lending and credit
administration staff are charged with reviewing the loan portfolio and
identifying changes in the economy or in a borrower’s circumstances which may
affect the ability to repay debt or the value of pledged collateral. A loan
classification and review system exists that identifies those loans with a
higher than normal risk of uncollectibility. Each commercial loan is assigned a
grade based upon an assessment of the borrower’s financial capacity to service
the debt and the presence and value of collateral for the loan. An independent
loan review group tests risk assessments and evaluates the adequacy of the
allowance for loan losses. Management meets monthly to review the credit quality
of the loan portfolio and quarterly to review the allowance for loan
losses.
In
addition, various regulatory agencies, as an integral part of their examination
process, periodically review QNB’s allowance for loan losses. Such agencies may
require QNB to recognize additions to the allowance based on their judgments
about information available to them at the time of their
examination.
Management
believes that it uses the best information available to make determinations
about the adequacy of the allowance and that it has established its existing
allowance for loan losses in accordance with GAAP. If circumstances differ
substantially from the assumptions used in making determinations, future
adjustments to the allowance for loan losses may be necessary and results of
operations could be affected. Because future events affecting borrowers and
collateral cannot be predicted with certainty, increases to the allowance may be
necessary should the quality of any loans deteriorate as a result of the factors
discussed above.
Foreclosed
Assets
Assets
acquired through, or in lieu of, loan foreclosure are held for sale and are
initially recorded at fair value less cost to sell at the date of foreclosure,
establishing a new cost basis. Subsequent to foreclosure, valuations are
periodically performed by management and the assets are carried at the lower of
carrying amount or fair value less cost to sell. Revenue and expenses and
changes in the valuation allowance are included in net expenses from foreclosed
assets.
Stock-Based
Compensation
At
December 31, 2009, QNB sponsored stock-based compensation plans, administered by
a board committee, under which both qualified and non-qualified stock options
may be granted periodically to certain employees. QNB accounts for all awards
granted under stock-based compensation plans in accordance with ASC 718, Compensation
– Stock
Compensation. Compensation cost has been measured using the fair value of
an award on the grant date and is recognized over the service period, which is
usually the vesting period. The fair value of each option is amortized into
compensation expense on a straight-line basis between the grant date for the
option and each vesting date. QNB estimates the fair value of stock options on
the date of the grant using the Black-Scholes option pricing model. The model
requires the use of numerous assumptions, many of which are highly subjective in
nature.
Income
Taxes
QNB
accounts for income taxes under the asset/liability method in accordance with
income tax accounting guidance, ASC 740 – Income
Taxes. Deferred tax assets and liabilities are recognized for the future
tax consequences attributable to differences between the financial statement
carrying amounts of existing assets and liabilities and their respective tax
bases, as well as operating loss and tax credit carryforwards. Deferred tax
assets and liabilities are measured using enacted tax rates expected to apply to
taxable income in the years in which those temporary differences are expected to
be recovered or settled. The effect on deferred tax assets and liabilities of a
change in tax rates is recognized in income in the period that includes the
enactment date. A valuation allowance is established against deferred tax assets
when, in the judgment of management, it is more likely than not that such
deferred tax assets will not become available. Because the judgment about the
level of future taxable income is dependent to a great extent on matters that
may, at least in part, be beyond QNB’s control, it is at least reasonably
possible that management’s judgment about the need for a valuation allowance for
deferred taxes could change in the near term.
ITEM
7A. QUANTITATIVE AND QUALITATIVE DISCLOSURES ABOUT MARKET RISK
As a
financial institution, QNB is subject to three primary risks:
|
·
|
Credit
risk
|
|
|
·
|
Liquidity
risk
|
46
|
·
|
Interest
rate risk
|
The Board
of Directors has established an Asset Liability Committee (ALCO) to measure,
monitor and manage interest rate risk for QNB. QNB’s Asset
Liability
and Loan Policies have instituted guidelines covering the three primary
risks.
For
discussion on credit risk refer to the sections on non-performing assets and the
allowance for loan losses, Note 5 and Note 6 of the Notes to Consolidated
Financial Statements. For discussion on liquidity risk refer to the section on
liquidity at page 42 in Item 7 of this Form 10-K filing.
Interest
Rate Sensitivity
Since the
assets and liabilities of QNB have diverse repricing characteristics that
influence net interest income, management analyzes interest sensitivity through
the use of gap analysis and simulation models. Interest rate sensitivity
management seeks to minimize the effect of interest rate changes on net interest
margins and interest rate spreads and to provide growth in net interest income
through periods of changing interest rates. QNB’s Asset/Liability Committee
(ALCO) is responsible for managing interest rate risk and for evaluating the
impact of changing interest rate conditions on net interest income.
Gap
analysis measures the difference between volumes of rate sensitive assets and
liabilities and quantifies these repricing differences for various time
intervals. Static gap analysis describes interest rate sensitivity at a point in
time. However, it alone does not accurately measure the magnitude of changes in
net interest income because changes in interest rates do not impact all
categories of assets and liabilities equally or simultaneously. Interest rate
sensitivity analysis also involves assumptions on certain categories of assets
and deposits. For purposes of interest rate sensitivity analysis, assets and
liabilities are stated at their contractual maturity, estimated likely call
date, or earliest repricing opportunity. Mortgage-backed securities, CMOs and
amortizing loans are scheduled based on their anticipated cash flow.
Interest-bearing demand accounts, money market accounts and savings accounts do
not have stated maturities or repricing terms and can be withdrawn or repriced
at any time. This may impact QNB’s margin if more expensive alternative sources
of deposits or borrowed funds are required to fund loans or deposit runoff.
Management projects the repricing characteristics of these accounts based on
historical performance and assumptions that it believes reflect their rate
sensitivity.
A
positive gap results when the amount of interest rate sensitive assets exceeds
interest rate sensitive liabilities. A negative gap results when the amount of
interest rate sensitive liabilities exceeds interest rate sensitive assets.
Generally a positive gap or asset sensitive position is beneficial in a rising
rate environment while a negative gap or liability sensitive position is
beneficial in a declining rate environment.
QNB
primarily focuses on the management of the one-year interest rate sensitivity
gap, which is shown on the chart on page 48. The one-year cumulative gap, which
reflects QNB’s interest sensitivity over a period of time, was a negative
$47,997,000 at December 31, 2009. The cumulative one-year gap equals -6.5%
of total rate sensitive assets. This position compares to a positive gap
position of $2,132,000, or 0.3%, of total rate sensitive assets, at December 31,
2008. QNB had a negative gap position during most of 2009 which benefited the
Company by reducing interest expense and funding costs as deposits repriced
lower as interest rates declined.
QNB also
uses a simulation model to assess the impact of changes in interest rates on net
interest income. The model reflects management’s assumptions related to asset
yields and rates paid on liabilities, deposit sensitivity, and the size,
composition and maturity or repricing characteristics of the balance sheet. The
assumptions are based on the interest rate environment at period end. Management
also evaluates the impact of higher and lower interest rates by simulating the
impact on net interest income of changing rates. While management performs rate
shocks of 100, 200 and 300 basis points, it believes, given the level of
interest rates at December 31, 2009, that it is unlikely that interest rates
would decline by 200 or 300 basis points. The simulation results can be found in
the chart on page 48.
Net
interest income declines in a falling rate environment. This result reflects
that income on earning assets would decline to a greater degree than the expense
associated with interest-bearing liabilities. In a lower rate environment, the
cash flow or repricing characteristics from both the loan and investment
portfolios would increase and be reinvested at lower rates resulting in less
income. Loan customers would likely either refinance their fixed rate loans at
lower rates or request rate reductions on their existing loans. While interest
expense on time deposits would decrease, the interest rate floors on some
municipal interest-bearing demand accounts, hypothetical interest rate floors on
interest-bearing transaction accounts, regular money market accounts and savings
accounts would prevent a reduction in interest expense on these accounts. In a
rising rate environment net interest income increases slightly as loans and
investments reprice more than rates on interest-bearing liabilities. The rate of
increase in net interest income declines the more rates increase because
prepayments and calls on investments and loans slow resulting in fewer amounts
repricing at higher rates. Actual results may differ from simulated results due
to various factors including time, magnitude and frequency of interest rate
changes, the relationship or spread between various rates, loan pricing and
deposit sensitivity, and asset/liability strategies.
47
Management
believes that the assumptions utilized in evaluating the vulnerability of QNB’s
net interest income to changes in interest rates approximate actual experience.
However, the interest rate sensitivity of QNB’s assets and liabilities as well
as the estimated effect of changes in interest rates on net interest income
could vary substantially if different assumptions are used or actual experience
differs from the experience on which the assumptions were based.
The
nature of QNB’s current operation is such that it is not subject to foreign
currency exchange or commodity price risk. Additionally, neither the Company nor
the Bank owns trading assets. At December 31, 2009, QNB did not have any hedging
transactions in place such as interest rate swaps, caps or floors.
Interest
Rate Sensitivity - Gap Analysis
|
December
31, 2009
|
Within
3
months
|
4
to 6
months
|
6
months
to
1 year
|
1
to 3
years
|
3
to 5
years
|
After
5
years
|
Total
|
|||||||||||||||||||||
|
Assets
|
||||||||||||||||||||||||||||
|
Interest-bearing
balances
|
$ | 22,158 | – | – | – | – | – | $ | 22,158 | |||||||||||||||||||
|
Investment
securities*
|
40,348 | $ | 20,759 | $ | 25,267 | $ | 67,102 | $ | 47,925 | $ | 56,197 | 257,598 | ||||||||||||||||
|
Non-marketable
equity securities
|
– | – | – | – | – | 2,291 | 2,291 | |||||||||||||||||||||
|
Loans,
including loans held-for-sale
|
128,167 | 32,101 | 47,655 | 124,526 | 91,430 | 26,076 | 449,955 | |||||||||||||||||||||
|
Bank-owned
life insurance
|
– | – | 9,109 | – | – | – | 9,109 | |||||||||||||||||||||
|
Total
rate sensitive assets
|
190,673 | 52,860 | 82,031 | 191,628 | 139,355 | 84,564 | $ | 741,111 | ||||||||||||||||||||
|
Total
cumulative assets
|
$ | 190,673 | $ | 243,533 | $ | 325,564 | $ | 517,192 | $ | 656,547 | $ | 741,111 | ||||||||||||||||
|
Liabilities
|
||||||||||||||||||||||||||||
|
Interest-bearing
non-maturing deposits
|
$ | 147,681 | – | – | $ | 13,308 | $ | 20,008 | $ | 78,080 | $ | 259,077 | ||||||||||||||||
|
Time
deposits less than $100,000
|
35,742 | $ | 41,617 | $ | 44,787 | 83,207 | 9,802 | – | 215,155 | |||||||||||||||||||
|
Time
deposits of $100,000 or more
|
20,316 | 17,409 | 22,576 | 39,631 | 6,009 | – | 105,941 | |||||||||||||||||||||
|
Short-term
borrowings
|
28,433 | – | – | – | – | – | 28,433 | |||||||||||||||||||||
|
Long-term
debt
|
10,000 | 5,000 | – | 15,000 | 5,000 | – | 35,000 | |||||||||||||||||||||
|
Total
rate sensitive liabilities
|
242,172 | 64,026 | 67,363 | 151,146 | 40,819 | 78,080 | $ | 643,606 | ||||||||||||||||||||
|
Total
cumulative liabilities
|
$ | 242,172 | $ | 306,198 | $ | 373,561 | $ | 524,707 | $ | 565,526 | $ | 643,606 | ||||||||||||||||
|
Gap
during period
|
$ | (51,499 | ) | $ | (11,166 | ) | $ | 14,668 | $ | 40,482 | $ | 98,536 | $ | 6,484 | $ | 97,505 | ||||||||||||
|
Cumulative
gap
|
$ | (51,499 | ) | $ | (62,665 | ) | $ | (47,997 | ) | $ | (7,515 | ) | $ | 91,021 | $ | 97,505 | ||||||||||||
|
Cumulative
gap/rate sensitive assets
|
-6.95 | % | -8.46 | % | -6.48 | % | -1.01 | % | 12.28 | % | 13.16 | % | ||||||||||||||||
|
Cumulative
gap ratio
|
0.79 | 0.80 | 0.87 | 0.99 | 1.16 | 1.15 | ||||||||||||||||||||||
*
Excludes
unrealized holding gain on available-for-sale securities of
$2,611.
The table
below summarizes estimated changes in net interest income over the next
twelve-month period, under various interest rate
scenarios.
|
Change
in Interest Rates
|
Net
Interest
Income
|
Dollar
Change
|
Percent
Change
|
|||||||||
|
December
31, 2009
|
||||||||||||
|
+300
Basis Points
|
$ | 25,363 | $ | 405 | 1.62 | % | ||||||
|
+200
Basis Points
|
25,351 | 393 | 1.57 | |||||||||
|
+100
Basis Points
|
25,329 | 371 | 1.49 | |||||||||
|
Flat
Rate
|
24,958 | – | – | |||||||||
|
-100
Basis Points
|
23,777 | (1,181 | ) | (4.73 | ) | |||||||
|
December
31, 2008
|
||||||||||||
|
+300
Basis Points
|
$ | 20,880 | $ | 983 | 4.94 | % | ||||||
|
+200
Basis Points
|
20,812 | 915 | 4.60 | |||||||||
|
+100
Basis Points
|
20,450 | 553 | 2.78 | |||||||||
|
Flat
Rate
|
19,897 | – | – | |||||||||
|
-100
Basis Points
|
19,363 | (534 | ) | (2.68 | ) | |||||||
ITEM
8. FINANCIAL STATEMENTS AND SUPPLEMENTARY DATA
The following audited financial
statements are set forth in this Annual Report of Form 10-K on the following
pages:
|
Report
of Independent Registered Public Accounting Firm Page
|
Page
49
|
|
|
Consolidated
Balance Sheets
|
Page
50
|
|
|
Consolidated
Statements of Income
|
Page
51
|
|
|
Consolidated
Statements of Shareholders’ Equity
|
Page
52
|
|
|
Consolidated
Statements of Cash Flows
|
Page
53
|
|
|
Notes
to Consolidated Financial Statements
|
Page
54
|
48
REPORT
OF INDEPENDENT REGISTERED PUBLIC ACCOUNTING FIRM
To the
Board of Directors and Shareholders
QNB
Corp.
We have
audited the accompanying consolidated balance sheets of QNB Corp. and subsidiary
(the Company) as of December 31, 2009 and 2008, and the related consolidated
statements of income, shareholders’ equity, and cash flows for the years then
ended. QNB Corp.’s management is responsible for these financial
statements. Our responsibility is to express an opinion on these
consolidated financial statements based on our audits.
We
conducted our audits in accordance with the standards of the Public Company
Accounting Oversight Board (United States). Those standards require
that we plan and perform the audit to obtain reasonable assurance about whether
the financial statements are free of material misstatement. The
Company is not required to have, nor were we engaged to perform, an audit of its
internal control over financial reporting. Our audits included consideration of
internal control over financial reporting as a basis for designing audit
procedures that are appropriate in the circumstances, but not for the purpose of
expressing an opinion on the effectiveness of the Company’s internal control
over financial reporting. Accordingly, we express no such opinion. An audit
also includes examining, on a test basis, evidence supporting the amounts and
disclosures in the financial statements, assessing the accounting principles
used and significant estimates made by management, as well as evaluating the
overall financial statement presentation. We believe that our audits
provide a reasonable basis for our opinion.
In our
opinion, the consolidated financial statements referred to above present fairly,
in all material respects, the financial position of QNB Corp. and subsidiary as
of December 31, 2009 and 2008, and the results of their operations and their
cash flows for the years then ended in conformity with accounting principles
generally accepted in the United States of America.
|
/s/
ParenteBeard LLC
|
ParenteBeard
LLC
Allentown,
Pennsylvania
March 31,
2010
49
CONSOLIDATED
BALANCE SHEETS
|
(in
thousands, except share data)
|
||||||||
|
December
31,
|
2009
|
2008
|
||||||
|
Assets
|
||||||||
|
Cash
and due from banks
|
$ | 8,841 | $ | 10,634 | ||||
|
Interest-bearing
deposits in banks
|
22,158 | 1,276 | ||||||
|
Federal
funds sold
|
– | 4,541 | ||||||
|
Total
cash and cash equivalents
|
30,999 | 16,451 | ||||||
|
Investment
securities
|
||||||||
|
Available-for-sale
(amortized cost $254,251 and $219,950)
|
256,862 | 219,597 | ||||||
|
Held-to-maturity
(fair value $3,471 and $3,683)
|
3,347 | 3,598 | ||||||
|
Restricted
investment in bank stocks
|
2,291 | 2,291 | ||||||
|
Loans
held-for-sale
|
534 | 120 | ||||||
|
Loans
receivable
|
449,421 | 403,579 | ||||||
|
Allowance
for loan losses
|
(6,217 | ) | (3,836 | ) | ||||
|
Net
loans
|
443,204 | 399,743 | ||||||
|
Bank-owned
life insurance
|
9,109 | 8,785 | ||||||
|
Premises
and equipment, net
|
6,248 | 6,661 | ||||||
|
Accrued
interest receivable
|
2,848 | 2,819 | ||||||
|
Other
assets
|
6,984 | 4,329 | ||||||
|
Total
assets
|
$ | 762,426 | $ | 664,394 | ||||
|
Liabilities
|
||||||||
|
Deposits
|
||||||||
|
Demand,
non-interest bearing
|
$ | 53,930 | $ | 53,280 | ||||
|
Interest-bearing
demand
|
120,554 | 95,630 | ||||||
|
Money
market
|
70,165 | 45,572 | ||||||
|
Savings
|
68,358 | 44,006 | ||||||
|
Time
|
215,155 | 206,336 | ||||||
|
Time
of $100,000 or more
|
105,941 | 104,966 | ||||||
|
Total
deposits
|
634,103 | 549,790 | ||||||
|
Short-term
borrowings
|
28,433 | 21,663 | ||||||
|
Long-term
debt
|
35,000 | 35,000 | ||||||
|
Accrued
interest payable
|
1,565 | 2,277 | ||||||
|
Other
liabilities
|
6,899 | 1,755 | ||||||
|
Total
liabilities
|
706,000 | 610,485 | ||||||
|
Shareholders’
Equity
|
||||||||
|
Common
stock, par value $0.625 per share; authorized 10,000,000 shares; 3,257,794
shares and 3,245,159 shares issued; 3,093,225 and 3,131,815 shares
outstanding
|
2,036 | 2,028 | ||||||
|
Surplus
|
10,221 | 10,057 | ||||||
|
Retained
earnings
|
44,922 | 43,667 | ||||||
|
Accumulated
other comprehensive income (loss), net
|
1,723 | (233 | ) | |||||
|
Treasury
stock, at cost; 164,569 and 113,344 shares
|
(2,476 | ) | (1,610 | ) | ||||
|
Total
shareholders’ equity
|
56,426 | 53,909 | ||||||
|
Total
liabilities and shareholders’ equity
|
$ | 762,426 | $ | 664,394 | ||||
The
accompanying notes are an integral part of the consolidated financial
statements.
50
CONSOLIDATED
STATEMENTS OF INCOME
|
(in
thousands,
except
share data)
|
||||||||
|
Year
Ended December 31,
|
2009
|
2008
|
||||||
|
Interest
Income
|
||||||||
|
Interest
and fees on loans
|
$ | 24,819 | $ | 24,395 | ||||
|
Interest
and dividends on investment securities:
|
||||||||
|
Taxable
|
8,341 | 8,831 | ||||||
|
Tax-exempt
|
2,183 | 1,865 | ||||||
|
Interest
on Federal funds sold
|
2 | 138 | ||||||
|
Interest
on interest-bearing balances and other interest income
|
23 | 56 | ||||||
|
Total
interest income
|
35,368 | 35,285 | ||||||
|
Interest
Expense
|
||||||||
|
Interest
on deposits
|
||||||||
|
Interest-bearing
demand
|
760 | 974 | ||||||
|
Money
market
|
703 | 879 | ||||||
|
Savings
|
189 | 169 | ||||||
|
Time
|
6,829 | 8,143 | ||||||
|
Time
of $100,000 or more
|
3,424 | 3,179 | ||||||
|
Interest
on short-term borrowings
|
248 | 471 | ||||||
|
Interest
on long-term debt
|
1,514 | 1,504 | ||||||
|
Total
interest expense
|
13,667 | 15,319 | ||||||
|
Net
interest income
|
21,701 | 19,966 | ||||||
|
Provision
for loan losses
|
4,150 | 1,325 | ||||||
|
Net
interest income after provision for loan losses
|
17,551 | 18,641 | ||||||
|
Non-Interest
Income
|
||||||||
|
Total
other-than-temporary impairment losses on investment
securities
|
(3,554 | ) | (917 | ) | ||||
|
Less:
Portion of loss recognized in other comprehensive income (before
taxes)
|
2,031 | – | ||||||
|
Net
other-than-temporary impairment losses on investment
securities
|
(1,523 | ) | (917 | ) | ||||
|
Net
gain on sale of investment securities
|
1,069 | 308 | ||||||
|
Net
loss on investment securities
|
(454 | ) | (609 | ) | ||||
|
Fees
for services to customers
|
1,743 | 1,803 | ||||||
|
ATM
and debit card
|
1,016 | 929 | ||||||
|
Bank-owned
life insurance
|
309 | 343 | ||||||
|
Mortgage
servicing fees
|
124 | 69 | ||||||
|
Net
gain on sale of loans
|
633 | 93 | ||||||
|
Other
|
514 | 672 | ||||||
|
Total
non-interest income
|
3,885 | 3,300 | ||||||
|
Non-Interest
Expense
|
||||||||
|
Salaries
and employee benefits
|
8,525 | 7,977 | ||||||
| Net occupancy | 1,343 | 1,337 | ||||||
|
Furniture
and equipment
|
1,220 | 1,237 | ||||||
|
Marketing
|
647 | 688 | ||||||
|
Third-party
services
|
1,075 | 807 | ||||||
|
Telephone,
postage and supplies
|
609 | 625 | ||||||
|
State
taxes
|
539 | 507 | ||||||
|
FDIC
insurance premiums
|
1,211 | 273 | ||||||
|
Other
|
1,417 | 1,177 | ||||||
|
Total
non-interest expense
|
16,586 | 14,628 | ||||||
|
Income
before income taxes
|
4,850 | 7,313 | ||||||
|
Provision
for income taxes
|
623 | 1,560 | ||||||
|
Net
Income
|
$ | 4,227 | $ | 5,753 | ||||
|
Earnings
Per Share - Basic
|
$ | 1.37 | $ | 1.83 | ||||
|
Earnings
Per Share - Diluted
|
$ | 1.36 | $ | 1.82 | ||||
The
accompanying notes are an integral part of the consolidated financial
statements.
51
CONSOLIDATED
STATEMENTS OF SHAREHOLDERS’ EQUITY
|
Accumulated
|
||||||||||||||||||||||||||||
|
Number
|
Other
Comprehensive |
|||||||||||||||||||||||||||
|
of
Shares
|
Common
|
Retained
|
Income
|
Treasury
|
||||||||||||||||||||||||
|
(in
thousands, except share data)
|
Outstanding
|
Stock
|
Surplus
|
Earnings
|
(Loss)
|
Stock
|
Total
|
|||||||||||||||||||||
|
Balance,
December 31, 2007
|
3,134,704 | $ | 2,026 | $ | 9,933 | $ | 41,282 | $ | 1,504 | $ | (1,494 | ) | $ | 53,251 | ||||||||||||||
|
Comprehensive
income:
|
||||||||||||||||||||||||||||
|
Net
income
|
– | – | – | 5,753 | – | – | 5,753 | |||||||||||||||||||||
|
Other
comprehensive loss
|
– | – | – | – | (1,737 | ) | – | (1,737 | ) | |||||||||||||||||||
|
Total
comprehensive income
|
4,016 | |||||||||||||||||||||||||||
|
Cash
dividends declared ($.92
per share)
|
– | – | – | (2,886 | ) | – | (2,886 | ) | ||||||||||||||||||||
|
Stock
issue - Employee stock purchase plan
|
3,769 | 2 | 63 | – | – | – | 65 | |||||||||||||||||||||
|
Purchase
of treasury stock
|
(6,658 | ) | – | – | – | – | (116 | ) | (116 | ) | ||||||||||||||||||
|
Cumulative
effect of adopting new accounting principle-accounting
for deferred
compensation aspects of split
dollar life insurance arrangements
|
– | – | – | (482 | ) | – | – | (482 | ) | |||||||||||||||||||
|
Stock-based
compensation expense
|
– | – | 61 | – | – | – | 61 | |||||||||||||||||||||
|
Balance,
December 31, 2008
|
3,131,815 | 2,028 | 10,057 | 43,667 | (233 | ) | (1,610 | ) | 53,909 | |||||||||||||||||||
|
Comprehensive
income:
|
||||||||||||||||||||||||||||
|
Net
income
|
– | – | – | 4,227 | – | – | 4,227 | |||||||||||||||||||||
|
Other
comprehensive income
|
– | – | – | – | 1,956 | – | 1,956 | |||||||||||||||||||||
|
Total
comprehensive income
|
6,183 | |||||||||||||||||||||||||||
|
Cash
dividends declared ($.96
per share)
|
– | – | – | (2,972 | ) | – | – | (2,972 | ) | |||||||||||||||||||
|
Stock
issue - Employee stock purchase plan
|
4,849 | 3 | 68 | – | – | – | 71 | |||||||||||||||||||||
|
Stock
issued for options exercised
|
7,786 | 5 | 28 | – | – | – | 33 | |||||||||||||||||||||
|
Tax
benefit stock options exercised
|
– | – | 10 | – | – | – | 10 | |||||||||||||||||||||
|
Purchase
of treasury stock
|
(51,225 | ) | – | – | – | – | (866 | ) | (866 | ) | ||||||||||||||||||
| Stock-based compensation expense | – | – | 58 | – | – | – | 58 | |||||||||||||||||||||
|
Balance,
December 31, 2009
|
3,093,225 | $ | 2,036 | $ | 10,221 | $ | 44,922 | $ | 1,723 | $ | (2,476 | ) | $ | 56,426 | ||||||||||||||
The
accompanying notes are an integral part of the consolidated financial
statements.
52
CONSOLIDATED
STATEMENTS OF CASH FLOWS
|
(in
thousands)
|
||||||||
|
Year
Ended December 31,
|
2009
|
2008
|
||||||
|
Operating
Activities
|
||||||||
|
Net
income
|
$ | 4,227 | $ | 5,753 | ||||
|
Adjustments
to reconcile net income to net cash provided by operating
activities
|
||||||||
|
Depreciation
and amortization
|
894 | 901 | ||||||
|
Provision
for loan losses
|
4,150 | 1,325 | ||||||
|
Net
securities losses
|
454 | 609 | ||||||
|
Gain
on sale of equity investment
|
– | (175 | ) | |||||
|
Net
loss (gain) on sale of repossessed assets and other real estate
owned
|
134 | (17 | ) | |||||
|
Net
gain on sale of loans
|
(633 | ) | (93 | ) | ||||
|
Net
loss on disposal of premises and equipment
|
– | 2 | ||||||
|
Proceeds
from sales of residential mortgage
|
25,400 | 7,958 | ||||||
|
Originations
of residential mortgages held-for-sale
|
(25,181 | ) | (7,297 | ) | ||||
|
Income
on bank-owned life insurance
|
(309 | ) | (343 | ) | ||||
|
Life
insurance premiums
|
(15 | ) | (15 | ) | ||||
|
Stock-based
compensation expense
|
58 | 61 | ||||||
|
Deferred
income tax benefit
|
(1,058 | ) | (109 | ) | ||||
|
Net
increase (decrease) in income taxes payable
|
141 | (121 | ) | |||||
|
Amortization
of mortgage servicing rights
|
72 | 77 | ||||||
|
Net
increase in accrued interest receivable
|
(29 | ) | (77 | ) | ||||
|
Net
amortization (accretion) of premiums and discounts on investment
securities
|
278 | (194 | ) | |||||
|
Net
decrease in accrued interest payable
|
(712 | ) | (67 | ) | ||||
|
Increase
in other assets
|
(3,069 | ) | (451 | ) | ||||
|
Increase
in other liabilities
|
146 | 169 | ||||||
|
Net
cash provided by operating activities
|
4,948 | 7,896 | ||||||
|
Investing
Activities
|
||||||||
|
Proceeds
from maturities and calls of investment securities
|
||||||||
|
available-for-sale
|
88,325 | 45,921 | ||||||
|
held-to-maturity
|
250 | 380 | ||||||
|
Proceeds
from sales of investment securities available-for-sale
|
26,006 | 4,128 | ||||||
|
Purchase
of investment securities
|
||||||||
|
available-for-sale
|
(144,365 | ) | (81,138 | ) | ||||
|
Proceeds
from sale of equity investment
|
– | 175 | ||||||
|
Proceeds
from redemptions of restricted bank stock
|
– | 332 | ||||||
|
Purchase
of restricted bank stock
|
– | (1,669 | ) | |||||
|
Net
increase in loans
|
(48,354 | ) | (24,293 | ) | ||||
|
Net
purchases of premises and equipment
|
(481 | ) | (836 | ) | ||||
|
Redemption
of bank-owned life insurance investment
|
– | 224 | ||||||
|
Proceeds
from sale of repossessed assets and other real estate
owned
|
860 | 607 | ||||||
|
Net
cash used by investing activities
|
(77,759 | ) | (56,169 | ) | ||||
|
Financing
Activities
|
||||||||
|
Net
increase in non-interest bearing deposits
|
650 | 3,237 | ||||||
|
Net
increase (decrease) in interest-bearing non-maturity
deposits
|
73,869 | (3,823 | ) | |||||
|
Net
increase in time deposits
|
9,794 | 56,252 | ||||||
|
Net
increase (decrease) in short-term borrowings
|
6,770 | (12,327 | ) | |||||
|
Proceeds
from issuance of long-term debt
|
– | 10,000 | ||||||
|
Tax
benefit from exercise of stock options
|
10 | – | ||||||
|
Cash
dividends paid
|
(2,972 | ) | (2,886 | ) | ||||
|
Purchase
of treasury stock
|
(866 | ) | (116 | ) | ||||
|
Proceeds
from issuance of common stock
|
104 | 65 | ||||||
|
Net
cash provided by financing activities
|
87,359 | 50,402 | ||||||
|
Increase
in cash and cash equivalents
|
14,548 | 2,129 | ||||||
|
Cash
and cash equivalents at beginning of year
|
16,451 | 14,322 | ||||||
|
Cash
and cash equivalents at end of year
|
$ | 30,999 | $ | 16,451 | ||||
|
Supplemental
Cash Flow Disclosures
|
||||||||
|
Interest
paid
|
$ | 14,379 | $ | 15,386 | ||||
|
Income
taxes paid
|
1,514 | 1,773 | ||||||
|
Non-Cash
Transactions
|
||||||||
|
Transfer
of loans to repossessed assets and other real estate owned
|
743 | 902 | ||||||
|
Unsettled
trades to purchase securities
|
4,998 | – | ||||||
The
accompanying notes are an integral part of the consolidated financial
statements.
53
NOTES
TO CONSOLIDATED FINANCIAL STATEMENTS
Note
1 - Summary of Significant Accounting Policies
Business
QNB Corp. (the Company), through its wholly-owned subsidiary, QNB Bank (the Bank), has been serving the residents and businesses of upper Bucks, southern Lehigh, and northern Montgomery counties in Pennsylvania since 1877. The Bank is a locally managed community bank that provides a full range of commercial, retail banking and retail brokerage services. The Bank encounters vigorous competition for market share in the communities it serves from bank holding companies, other community banks, thrift institutions, credit unions and other non-bank financial organizations such as mutual fund companies, insurance companies and brokerage companies. The Company manages its business as a single operating segment.
The Bank
is a Pennsylvania chartered commercial bank. The Company and the Bank are
subject to regulations of certain state and Federal agencies. These regulatory
agencies periodically examine the Company and the Bank for adherence to laws and
regulations.
Basis
of Presentation
The consolidated financial statements include the accounts of the Company and its wholly-owned subsidiary, the Bank. The consolidated entity is referred to herein as “QNB”. All significant inter-company accounts and transactions have been eliminated in the consolidated financial statements.
For
comparative purposes, prior year’s consolidated financial statements have been
reclassified to conform with report classifications of the current year. The
reclassifications had no effect on net income.
Tabular
information, other than share and per share data, is presented in thousands of
dollars.
Use
of Estimates
These statements are prepared in accordance with U.S. generally accepted accounting principles (GAAP) and predominant practices within the banking industry. The preparation of these consolidated financial statements requires QNB to make estimates and judgments that affect the reported amounts of assets, liabilities, revenues and expenses, and related disclosure of contingent assets and liabilities. QNB evaluates estimates on an on-going basis. Material estimates that are particularly susceptible to significant change in the near term relate to the determination of the allowance for loan losses, the determination of the valuation of other real estate owned, other-than-temporary impairment of investment securities, the determination of impairment of restricted bank stock and the valuation of deferred tax assets and income taxes. QNB bases its estimates on historical experience and various other factors and assumptions that are believed to be reasonable under the circumstances, the results of which form the basis for making judgments about the carrying values of assets and liabilities that are not readily apparent from other sources. Actual results may differ from these estimates under different assumptions or conditions.
Significant
Group Concentrations of Credit Risk
Most of the Company’s activities are with customers located within Bucks, Montgomery and Lehigh Counties in southeastern Pennsylvania. Note 4 discusses the types of investment securities in which the Company invests. Note 5 discusses the types of lending in which the Company engages. The Company does not have any significant concentrations to any one industry or customer. Although the Company has a diversified loan portfolio, its debtors’ ability to honor their contracts is influenced by the region’s economy.
Cash
and Cash Equivalents
For purposes of the statement of cash flows, cash and cash equivalents consist of cash on hand, cash items in process of collection, amounts due from banks, interest-bearing deposits in the Federal Reserve Bank and other banks and Federal funds sold. QNB maintains a portion of its interest-bearing deposits in other banks at various commercial financial institutions. At times, the balances exceed the FDIC insured limits.
Investment
Securities
Investment securities that QNB has the positive intent and ability to hold to maturity are classified as held-to-maturity securities and reported at amortized cost. Debt and equity securities that are bought and held principally for the purpose of selling in the near term are classified as trading securities and reported at fair value, with unrealized gains and losses included in earnings. Debt and equity securities not classified as either held-to-maturity securities or trading securities are classified as available-for-sale securities and reported at fair value, with unrealized gains and losses, net of tax, excluded from earnings and reported as accumulated other comprehensive income or loss, a separate component of shareholders’ equity. Management determines the appropriate classification of securities at the time of purchase. QNB had no trading securities at December 31, 2009 and 2008.
54
NOTES
TO CONSOLIDATED FINANCIAL STATEMENTS
Available-for-sale
securities include securities that management intends to use as part of its
asset/liability management strategy and that may be sold in response to changes
in credit ratings, changes in market interest rates and related changes in the
securities’ prepayment risk or to meet liquidity needs.
Premiums
and discounts on debt securities are recognized in interest income using a
constant yield method. Gains and losses on sales of available-for-sale
securities are computed on the specific identification method and included in
non-interest income.
Other-than-Temporary
Impairment of Investment Securities
Securities are evaluated periodically to determine whether a decline in their value is other-than-temporary. Management utilizes criteria such as the magnitude and duration of the decline, in addition to the reasons underlying the decline, to determine whether the loss in value is other-than-temporary. The term “other-than-temporary” is not intended to indicate that the decline is permanent, but indicates that the prospects for a near-term recovery of value is not necessarily favorable, or that there is a lack of evidence to support realizable value equal to or greater than carrying value of the investment. For equity securities, once a decline in value is determined to be other-than-temporary, the value of the equity security is reduced to fair value and a corresponding charge to earnings is recognized.
Effective
April 1, 2009, the Company adopted new accounting guidance related to
recognition and presentation of other-than-temporary impairment. This recent
accounting guidance amends the recognition guidance for other-than-temporary
impairments of debt securities and expands the financial statement disclosures
for other-than-temporary impairment losses on debt securities. The recent
guidance replaced the “intent and ability” indication in previous guidance by
specifying that (a) if a company does not have the intent to sell a debt
security prior to recovery and (b) it is more likely than not that it will not
have to sell the debt security prior to recovery, the security would not be
considered other-than-temporarily impaired unless there is a credit loss. When
an entity does not intend to sell the security, and it is more likely than not,
the entity will not have to sell the security before recovery of its cost basis,
it will recognize the credit component of an other-than-temporary impairment of
a debt security in earnings and the remaining portion in other
comprehensive income. For held to maturity debt securities, the amount of an
other-than-temporary impairment recorded in other comprehensive income for the
noncredit portion of a previous other-than-temporary impairment should be
amortized prospectively over the remaining life of the security on the basis of
the timing of future estimated cash flows of the security. The impact of the
adoption increased net income by approximately $1,340,000 for the year ended
December 31, 2009 which represents the after-tax non-credit portion of
other-than-temporary impairments for the year ended December 31, 2009. The
effect of the adoption of the new accounting guidance on debt securities
previously reported as other-than-temporarily impaired was not material and,
therefore, QNB did not record a transition adjustment as of the effective date
of the new guidance.
Restricted
Investment in Bank Stock
Restricted
bank stock is comprised of restricted stock of the Federal Home Loan Bank of
Pittsburgh (FHLB) in the amount of $2,279,000 and the Atlantic Central Bankers
Bank in the amount of $12,000 at December 31, 2009 and 2008. Federal law
requires a member institution of the FHLB to hold stock of its district bank
according to a predetermined formula. These restricted securities are carried at
cost.
In
December 2008, the FHLB of Pittsburgh notified member banks that it was
suspending dividend payments and the repurchase of capital stock to preserve
capital. Management’s determination of whether these investments are impaired is
based on their assessment of the ultimate recoverability of their cost rather
than by recognizing temporary declines in value. The determination of whether a
decline affects the ultimate recoverability of their cost is influenced by
criteria such as (1) the significance of the decline in net assets of the
FHLB as compared to the capital stock amount for the FHLB and the length of time
this situation has persisted, (2) commitments by the FHLB to make payments
required by law or regulation and the level of such payments in relation to the
operating performance of the FHLB, and (3) the impact of legislative and
regulatory changes on institutions and, accordingly, on the customer base of the
FHLB. Management believes no impairment charge is necessary related to the
restricted stock as of December 31, 2009.
55
NOTES
TO CONSOLIDATED FINANCIAL STATEMENTS
Loans
Loans
that management has the intent and ability to hold for the foreseeable future or
until maturity or pay-off are stated at the principal amount outstanding, net of
deferred loan fees and costs. Interest income is accrued on the principal amount
outstanding. Loan origination and commitment fees and related direct costs are
deferred and amortized to income over the term of the respective loan and loan
commitment period as a yield adjustment.
Loans
held-for-sale consist of residential mortgage loans and are carried at the lower
of aggregate cost or fair value. Net unrealized losses, if any, are recognized
through a valuation allowance charged to income. Gains and losses on residential
mortgages held-for-sale are included in non-interest income.
Non-Performing
Assets
Non-performing
assets are comprised of accruing loans past due 90 days or more, non-accrual
loans and investment securities, restructured loans, other real estate owned and
repossessed assets. Non-accrual loans and investment securities are those on
which the accrual of interest has ceased. Loans and indirect lease financing
loans are placed on non-accrual status immediately if, in the opinion of
management, collection is doubtful, or when principal or interest is past due 90
days or more and collateral is insufficient to cover principal and interest.
Interest accrued, but not collected at the date a loan is placed on non-accrual
status, is reversed and charged against interest income. Subsequent cash
receipts are applied either to the outstanding principal or recorded as interest
income, depending on management’s assessment of the ultimate collectibility of
principal and interest. Loans are returned to an accrual status when the
borrower’s ability to make periodic principal and interest payments has returned
to normal (i.e. brought current with respect to principal or interest or
restructured) and the paying capacity of the borrower and/or the underlying
collateral is deemed sufficient to cover principal and interest.
Accounting
for impairment in the performance of a loan is required when it is probable that
all amounts, including both principal and interest, will not be collected in
accordance with the loan agreement. Impaired loans are measured based on the
present value of expected future cash flows discounted at the loan’s effective
interest rate or, at the loan’s observable market price or the fair value of the
collateral if the loans are collateral dependent. Impairment criteria are
applied to the loan portfolio exclusive of smaller homogeneous loans such as
residential mortgage and consumer loans which are evaluated collectively for
impairment.
Allowance
for Loan Losses
QNB
maintains an allowance for loan losses, which is intended to absorb probable
known and inherent losses in the outstanding loan portfolio. The
allowance is reduced by actual credit losses and is increased by the provision
for loan losses and recoveries of previous losses. The provisions for
loan losses are charged to earnings to bring the total allowance for loan
losses to a level considered necessary by management.
The
allowance for loan losses is based on management’s continuing review and
evaluation of the loan portfolio. The level of the allowance is
determined by assigning specific reserves to individually identified problem
credits and general reserves to all other loans. For such loans that
are also classified as impaired, an allowance is established when the discounted
cash flows (or collateral value) of the impaired loan is lower than the carrying
value of that loan. The portion of the allowance that is allocated to internally
criticized and non-accrual loans is determined by estimating the inherent loss
on each credit after giving consideration to the value of underlying
collateral. The general reserves are based on the composition and
risk characteristics of the loan portfolio, including the nature of the loan
portfolio, credit concentration trends, delinquency and loss experience, as well
as other qualitative factors such as current economic trends. Management
emphasizes loan quality and close monitoring of potential problem
credits. Credit risk identification and review processes are utilized
in order to assess and monitor the degree of risk in the loan
portfolio. QNB’s lending and credit administration staff are charged
with reviewing the loan portfolio and identifying changes in the economy or in a
borrower’s circumstances which may affect the ability to repay debt or the value
of pledged collateral. A loan classification and review system exists
that identifies those loans with a higher than normal risk of
uncollectibility. Each commercial loan is assigned a grade
based upon an assessment of the borrower’s financial capacity to service the
debt and the presence and value of collateral for the loan. An
independent loan review group tests risk assessments and evaluates the adequacy
of the allowance for loan losses. Management meets monthly to review
the credit quality of the loan portfolio and quarterly to review the allowance
for loan losses.
56
NOTES
TO CONSOLIDATED FINANCIAL STATEMENTS
In
addition, various regulatory agencies, as an integral part of their examination
process, periodically review QNB’s allowance for loan losses. Such
agencies may require QNB to recognize additions to the allowance based on their
judgments using information available to them at the time of their
examination.
Management
believes that it uses the best information available to make determinations
about the adequacy of the allowance and that it has established its existing
allowance for loan losses in accordance with GAAP. If circumstances
differ substantially from the assumptions used in making determinations, future
adjustments to the allowance for loan losses may be necessary and results of
operations could be affected. Because future events affecting
borrowers and collateral cannot be predicted with certainty, there can be no
assurance that increases to the allowance will not be necessary should the
quality of any loans deteriorate as a result of the factors discussed
above.
Transfers
of Financial Assets
Transfers
of financial assets are accounted for as sales when control over the assets has
been surrendered. Control over transferred assets is deemed to be
surrendered when (1) the assets have been isolated from the Company, (2) the
transferee obtains the right (free of conditions that constrain it from taking
advantage of that right) to pledge or exchange the transferred assets, and (3)
the Company does not maintain effective control over the transferred assets
through an agreement to repurchase them before their maturity.
Servicing
Assets
Servicing
assets are recognized as separate assets when rights are acquired through the
sale of financial assets. When mortgage loans are sold, a portion of the cost of
originating the loan is allocated to the servicing rights based on relative fair
value. Fair value is based on market prices for comparable mortgage servicing
contracts, when available, or alternatively, is based on a valuation model that
calculates the present value of estimated future net servicing income. Servicing
assets are evaluated for impairment based upon the fair value of the rights as
compared to amortized cost. Impairment is determined by stratifying rights into
tranches based on predominant characteristics, such as interest rate, loan type
and investor type. Impairment is recognized through a valuation allowance for an
individual tranche, to the extent that fair value is less than the capitalized
amount for the tranches. If the Company later determines that all or a portion
of the impairment no longer exists for a particular tranche, a reduction of the
allowance may be recorded as an increase to income. Capitalized servicing rights
are reported in other assets and are amortized into noninterest income in
proportion to, and over the period of, the estimated future net servicing income
of the underlying financial assets.
Servicing
fee income is recorded for fees earned for servicing loans. The fees are based
on a contractual percentage of the outstanding principal, or a fixed amount per
loan and are recorded as income when earned. The amortization of mortgage
servicing rights is netted against loan servicing fee income.
Foreclosed
Assets
Assets acquired through, or in lieu of, loan foreclosure are held for sale and are initially recorded at fair value less cost to sell at the date of foreclosure, establishing a new cost basis. Subsequent to foreclosure, valuations are periodically performed by management and the assets are carried at the lower of carrying amount or fair value less cost to sell. Revenue and expenses from operations and changes in the valuation allowance are included in net expenses from foreclosed assets. At December 31, 2009 and 2008 the Company had foreclosed assets of $67,000 and $319,000, respectively. These amounts are included in other assets on the balance sheet.
Premises
and Equipment
Premises
and equipment are stated at cost, less accumulated depreciation and
amortization. Depreciation and amortization are calculated principally on an
accelerated or straight-line basis over the estimated useful lives of the
assets, or the shorter of the estimated useful life or lease term for leasehold
improvements, as follows: buildings—10 to 40 years, and equipment—3
to 10 years. Expenditures for maintenance and repairs are charged to operations
as incurred. Gains or losses upon disposition are reflected in earnings as
realized.
57
NOTES
TO CONSOLIDATED FINANCIAL STATEMENTS
Bank-Owned
Life Insurance
The Bank
invests in bank-owned life insurance (BOLI) as a source of funding for employee
benefit expenses. BOLI involves the purchasing of life insurance by the Bank on
a chosen group of employees. The Bank is the owner and beneficiary of the
policies. Income from the increase in cash surrender value of the policies as
well as the receipt of death benefits is included in non-interest income on the
income statement.
Effective
January 1, 2008, the Company adopted new accounting guidance for postretirement
benefit aspects of endorsement split-dollar life insurance arrangements. This
guidance applies to life insurance arrangements that provide an employee with a
specified benefit that is not limited to the employee’s active service period,
including certain bank-owned life insurance policies and requires an employer to
recognize a liability and related compensation costs for future benefits that
extend to postretirement periods. The impact of its adoption resulted in a
$482,000 cumulative effect adjustment to opening retained earnings in 2008. In
addition, the expense recorded during 2009 and 2008 was approximately $64,000
and $38,000, respectively, and is included in non-interest expense under
salaries and benefits expense.
Stock-Based
Compensation
At
December 31, 2009, QNB sponsored stock-based compensation plans, administered by
a board committee, under which both qualified and non-qualified stock options
may be granted periodically to certain employees. QNB accounts for
all awards granted under stock-based compensation plans in accordance with ASC
718, Compensation
- Stock Compensation.
Compensation cost has been measured using the fair value of an award on the
grant date and is recognized over the service period, which is usually the
vesting period.
Stock-based
compensation expense was approximately $58,000 and $61,000 for the years ended
December 31, 2009 and 2008, respectively. There was no tax benefit
recognized related to this compensation for the years ended December 31, 2009
and 2008.
The fair
value of each option is amortized into compensation expense on a straight-line
basis between the grant date for the option and each vesting date. QNB estimated
the fair value of stock options on the date of the grant using the Black-Scholes
option pricing model. The model requires the use of numerous assumptions, many
of which are highly subjective in nature. The following assumptions were used in
the option pricing model in determining the fair value of options granted during
the periods presented.
|
2009
|
2008
|
|||||||
|
Risk
free interest rate
|
1.48 | % | 3.00 | % | ||||
|
Dividend
yield
|
4.80 | 3.64 | ||||||
|
Volatility
|
25.04 | 18.46 | ||||||
|
Expected
life
|
5
yrs.
|
5
yrs.
|
||||||
The
risk-free interest rate was selected based upon yields of U.S. Treasury issues
with a term equal to the expected life of the option being
valued. Historical information was the primary basis for the
selection of the expected dividend yield, expected volatility and expected lives
of the options.
The
weighted average fair value per share of options granted during 2009 and 2008
was $2.17 and $2.63, respectively.
Income
Taxes
QNB
accounts for income taxes under the asset/liability method in accordance with
income tax accounting guidance (ASC 740 - Income
Taxes). Deferred tax assets and liabilities are recognized for
the future tax consequences attributable to differences between the financial
statement carrying amounts of existing assets and liabilities and their
respective tax bases, as well as operating loss and tax credit
carryforwards. Deferred tax assets and liabilities are measured using
enacted tax rates expected to apply to taxable income in the years in which
those temporary differences are expected to be recovered or
settled. The effect on deferred tax assets and liabilities of a
change in tax rates is recognized in income in the period that includes the
enactment date. A valuation allowance is established against deferred
tax assets when, in the judgment of management, it is more likely than not that
such deferred tax assets will not become available. Because the judgment about
the level of future taxable income is dependent to a great extent on
matters that may, at least in part, be beyond QNB’s control, it is at least
reasonably possible that management’s judgment about the need for a valuation
allowance for deferred taxes could change in the near
term.
58
NOTES
TO CONSOLIDATED FINANCIAL STATEMENTS
In
connection with the accounting guidance related to accounting for uncertainty in
income taxes, which sets out a consistent framework to determine the appropriate
level of tax reserves to maintain for uncertain tax positions, QNB has evaluated
its tax positions as of December 31, 2009. A tax position is
recognized as a benefit only if it is “more likely than not” that the tax
position would be sustained in a tax examination, with a tax examination being
presumed to occur. The amount recognized is the largest amount of tax benefit
that has more than a 50 percent likelihood of being realized on examination. For
tax positions not meeting the “more likely than not” test, no tax benefit is
recorded. Under the “more-likely-than-not” threshold guidelines, QNB believes no
significant uncertain tax positions exist, either individually or in the
aggregate, that would give rise to the non-recognition of an existing tax
benefit. As of December 31, 2009, QNB had no material unrecognized tax benefits
or accrued interest and penalties. QNB’s policy is to account for interest as a
component of interest expense and penalties as a component of other expense. The
Company and its subsidiary are subject to U.S. Federal income tax as well as
income tax of the Commonwealth of Pennsylvania. QNB is no longer subject to
examination by U.S. Federal or State taxing authorities for years before
2006.
Treasury
Stock
Common
stock shares repurchased are recorded as treasury stock at cost.
Earnings
Per Share
Basic
earnings per share excludes any dilutive effects of options and is computed by
dividing net income by the weighted average number of shares outstanding during
the period. Diluted earnings per share gives effect to all dilutive potential
common shares that were outstanding during the period. Potential common shares
that may be issued by the Company relate solely to outstanding stock options and
are determined using the treasury stock method.
Treasury
shares are not deemed outstanding for earnings per share
calculations.
Comprehensive
Income
Comprehensive
income is defined as the change in equity of a business entity during a period
due to transactions and other events and circumstances, excluding those
resulting from investments by and distributions to owners. Comprehensive income
consists of net income and other comprehensive income. For QNB, the primary
component of other comprehensive income is the unrealized holding gains or
losses on available-for-sale investment securities and unrealized losses on
available-for-sale investment securities related to factors other than credit on
debt securities.
Subsequent
Events
QNB has
evaluated events and transactions occurring subsequent to the balance sheet date
of December 31, 2009 for items that should potentially be recognized or
disclosed in these financial statements.
Recent
Accounting Pronouncements
In June
2009, the Financial Accounting Standards Board (FASB) issued Statement of
Financial Accounting Standards (SFAS) No. 168, The
FASB Accounting Standards CodificationTM
and
the Hierarchy of Generally
Accepted Accounting Principles – a
replacement of FASB Statement No. 162. The FASB Accounting Standards
CodificationTM (ASC) will be the single source of authoritative nongovernmental
generally accepted accounting principles (GAAP) in the United States of America,
excluding SEC guidance. This guidance is codified in ASC 105 and is effective
for financial statements that cover interim and annual periods ending after
September 15, 2009. Other than resolving certain minor inconsistencies in
current GAAP, the ASC is not intended to change GAAP, but rather to make it
easier to review and research GAAP applicable to a particular transaction or
specific accounting issue. Applying the guidance in ASC 105 did not impact the
Company’s financial condition and results of operations. The Company has revised
its references to pre-Codification GAAP in its financial statements for the year
ended December 31, 2009.
59
NOTES
TO CONSOLIDATED FINANCIAL STATEMENTS
In
November 2008, the SEC released a proposed roadmap regarding the potential use
by U.S. issuers of financial statements prepared in accordance with
International Financial Reporting Standards (IFRS). IFRS is a comprehensive
series of accounting standards published by the International Accounting
Standards Board (IASB). Under the proposed roadmap, the Company may be required
to prepare financial statements in accordance with IFRS as early as 2014. The
SEC will make a determination in 2011 regarding the mandatory adoption of IFRS.
The Company is currently assessing the impact that this potential change would
have on its consolidated financial statements, and it will continue to monitor
the development of the potential implementation of IFRS.
In August
2009, the FASB issued Accounting Standards Update (ASU) 2009-05, Measuring
Liabilities at Fair Value, to amend ASC 820, Fair
Value Measurements and Disclosures, to clarify how entities should
estimate the fair value of liabilities. ASC 820, as amended, includes clarifying
guidance for circumstances in which a quoted price in an active market is not
available, the effect of the existence of liability transfer restrictions, and
the effect of quoted prices for the identical liability, including when the
identical liability is traded as an asset. The amended guidance in ASC 820 on
measuring liabilities at fair value is effective for the first interim or
annual reporting period beginning after August 28, 2009, with earlier
application permitted. The adoption of this amended guidance did not have a
material impact on the Company’s consolidated financial statements.
In
October 2009, the FASB issued ASU 2009-16, Transfers
and Servicing (Topic 860) –
Accounting for Transfers of Financial Assets. The amendments in this
update improve financial reporting by eliminating the exceptions for qualifying
special-purpose entities from the consolidation guidance and the exception that
permitted sale accounting for certain mortgage securitizations when a transferor
has not surrendered control over the transferred financial assets. In addition,
the amendments require enhanced disclosures about the risks that a
transferor continues to be exposed to because of its continuing involvement in
transferred financial assets. Comparability and consistency in accounting for
transferred financial assets will also be improved through clarifications of the
requirements for isolation and limitations on portions of financial assets that
are eligible for sale accounting. This update is effective at the start of a
reporting entity’s first fiscal year beginning after November 15, 2009. Early
application is not permitted. The Company is continuing to evaluate the impact
the adoption of ASU 2009-16 will have on our financial position or results of
operations.
The FASB
has issued ASU 2010-06, Fair
Value Measurements and Disclosures (Topic 820): Improving Disclosure
about Fair Value Measurements. This ASU requires some additional
disclosures and clarifies some existing disclosure requirements about fair value
measurements as set forth in Codification Subtopic 820-10. The FASB‘s objective
is to improve these disclosures and, thus, increase transparency in financial
reporting. Specifically, ASU 2010-06 amends Codification Subtopic 820-10 to now
require:
|
·
|
A
reporting entity to disclose separately the amounts of significant
transfers in and out of Level 1 and Level 2 fair value measurements and
describe the reasons for the transfers; and
|
|
|
·
|
In
the reconciliation for fair value measurements using significant
unobservable inputs, a reporting entity should present separately
information about purchases, sales, issuances, and
settlements.
|
In
addition, ASU 2010-06 clarifies the requirements of the following existing
disclosures:
|
·
|
For
purposes of reporting fair value measurements for each class of assets and
liabilities, a reporting entity needs to use judgment in determining the
appropriate classes of assets and liabilities;
and
|
|
|
·
|
A
reporting entity should provide disclosures about the valuation techniques
and inputs used to measure fair value for both recurring and nonrecurring
fair value measurements.
|
ASU
2010-06 is effective for interim and annual reporting periods beginning after
December 15, 2009, except for the disclosures about purchases, sales, issuance,
and settlements in the roll forward of activity in Level 3 fair value
measurements. Those disclosures are effective for fiscal years after December
15, 2010 and for interim periods within those fiscal years. Early adoption is
permitted. The Company is continuing to evaluate the impact the adoption of ASU
2009-16 will have on our financial position or results of
operations
Note 2 - Earnings Per Share and Share
Repurchase Plan
The
following table sets forth the computation of basic and diluted earnings per
share:
|
2009
|
2008
|
|||||||
|
Numerator
for basic and diluted earnings per share - net income
|
$ | 4,227 | $ | 5,753 | ||||
|
Denominator
for basic earnings per share - weighted average shares
outstanding
|
3,094,624 | 3,135,608 | ||||||
|
Effect
of dilutive securities - employee stock options
|
8,809 | 25,718 | ||||||
|
Denominator
for diluted earnings per share - adjusted weighted average shares
outstanding
|
3,103,433 | 3,161,326 | ||||||
|
Earnings
per share - basic
|
$ | 1.37 | $ | 1.83 | ||||
|
Earnings
per share - diluted
|
1.36 |
1.82
|
||||||
60
NOTES
TO CONSOLIDATED FINANCIAL STATEMENTS
There
were 130,300 and 121,600 stock options that were anti-dilutive as of December
31, 2009 and 2008, respectively. These stock options were not included in the
above calculation.
On
January 24, 2008, QNB announced that the Board of Directors authorized the
repurchase of up to 50,000 shares of its common stock in open market or
privately negotiated transactions. On February 9, 2009, the Board of Directors
approved increasing the authorization to 100,000 shares. The repurchase
authorization does not bear a termination date. As of December 31, 2009, 57,883
shares were repurchased under this authorization at an average price of $16.97
and a total cost of $982,000. As of December 31, 2008, QNB had repurchased
6,658 shares under this authorization at an average price of $17.50 and a total
cost of $116,000.
Note
3 - Cash And Cash Equivalents
Included
in cash and cash equivalents are reserves in the form of deposits with the
Federal Reserve Bank of $225,000 as of December 31, 2009 and 2008.
Note
4 - Investment Securities Available-For-Sale
The
amortized cost and estimated fair values of investment securities
available-for-sale at December 31, 2009 and 2008 were as follows:
|
December
31, 2009
|
||||||||||||||||||||
|
Gross
unrealized
|
Gross
unrealized
holding losses
|
|||||||||||||||||||
|
Aggregate
fair
value
|
holding
gains
|
Non-credit
OTTI
|
Other
|
Amortized
cost
|
||||||||||||||||
|
U.S.
Treasury
|
$ | 5,013 | $ | 2 | – | $ | 1 | $ | 5,012 | |||||||||||
| U.S. Government agency securities | 69,731 | 261 | – | 316 | 69,786 | |||||||||||||||
|
State
and municipal securities
|
54,160 | 1,287 | – | 59 | 52,932 | |||||||||||||||
|
U.S.
Goverment agencies and sponsored enterprises (GSEs) -
residential:
|
||||||||||||||||||||
|
Mortgage-backed
securities
|
61,649 | 2,215 | – | 69 | 59,503 | |||||||||||||||
|
Collateralized
mortgage obligations (CMOs)
|
61,317 | 1,787 | – | 60 | 59,590 | |||||||||||||||
|
Other
debt securities
|
1,533 | 78 | $ | 2,410 | 655 | 4,520 | ||||||||||||||
| Equity securities | 3,459 | 565 | – | 14 | 2,908 | |||||||||||||||
|
Total
investment securities available-for-sale
|
$ | 256,862 | $ | 6,195 | $ | 2,410 | $ | 1,174 | $ | 254,251 | ||||||||||
|
December
31, 2008
|
||||||||||||||||
|
Gross
|
Gross
|
|||||||||||||||
|
unrealized
|
unrealized
|
|||||||||||||||
|
Aggregate
|
holding
|
holding
|
Amortized
|
|||||||||||||
|
fair
value
|
gains
|
losses
|
cost
|
|||||||||||||
|
U.S.
Treasury
|
$ | 5,124 | $ | 49 | – | $ | 5,075 | |||||||||
|
U.S.
Government agency securities
|
44,194 | 634 | $ | 5 | 43,565 | |||||||||||
|
State
and municipal securities
|
42,300 | 448 | 512 | 42,364 | ||||||||||||
|
Mortgage-backed
securities
|
67,347 | 2,126 | – | 65,221 | ||||||||||||
| Collateralized mortgage obligations (CMOs) | 49,067 | 963 | 591 | 48,695 | ||||||||||||
|
Other
debt securities
|
8,476 | 79 | 3,171 | 11,568 | ||||||||||||
|
Equity
securities
|
3,089 | 9 | 382 | 3,462 | ||||||||||||
|
Total
investment securities available-for-sale
|
$ | 219,597 | $ | 4,308 | $ | 4,661 | $ | 219,950 | ||||||||
61
NOTES
TO CONSOLIDATED FINANCIAL STATEMENTS
The
amortized cost and estimated fair value of securities available-for-sale by
contractual maturity at December 31, 2009 are shown in the following table.
Expected maturities will differ from contractual maturities because borrowers
may have the right to call or prepay obligations with or without call or
prepayment penalties. Securities are assigned to categories based on contractual
maturity except for mortgage-backed securities and CMOs which are based on the
estimated average life of these securities.
|
Aggregate
|
Amortized
|
|||||||
|
December
31, 2009
|
fair
value
|
cost
|
||||||
|
Due
in one year or less
|
$ | 8,556 | $ | 8,457 | ||||
| Due after one year through five years | 164,524 | 160,378 | ||||||
| Due after five years through ten years | 45,999 | 45,599 | ||||||
|
Due
after ten years
|
34,324 | 36,909 | ||||||
| Equity securities | 3,459 | 2,908 | ||||||
|
Total
securities available-for-sale
|
$ | 256,862 | $ | 254,251 | ||||
Proceeds
from sales of investment securities available-for-sale were $26,006,000 and
$4,128,000 for the years ended December 31, 2009 and 2008,
respectively.
The
following table presents information related to the Company’s gains and losses
on the sales of equity and debt securities, and losses recognized for the
other-than-temporary impairment of these investments. Gains and losses on
available-for-sale securities are computed on the specific identification method
and included in non-interest income. Gross realized losses on equity and debt
securities are net of other-than-temporary impairment charges:
|
December
31,
|
2009
|
2008
|
||||||||||||||||||||||||||||||
|
Gross
realized
gains
|
Gross
realized
losses
|
Other-than-
temporary
impairment
losses
|
Net
losses
|
Gross
realized
gains
|
Gross
realized
losses
|
Other-than-
temporary
impairment
losses
|
Net
gains
(losses)
|
|||||||||||||||||||||||||
|
Equity
securities
|
$ | 410 | $ | (1 | ) | $ | (521 | ) | $ | (112 | ) | $ | 252 | $ | (12 | ) | $ | (917 | ) | $ | (677 | ) | ||||||||||
|
Debt
securities
|
729 | (69 | ) | (1,002 | ) | (342 | ) | 72 | (4 | ) | – | 68 | ||||||||||||||||||||
|
Total
|
$ | 1,139 | $ | (70 | ) | $ | (1,523 | ) | $ | (454 | ) | $ | 324 | $ | (16 | ) | $ | (917 | ) | $ | (609 | ) | ||||||||||
All OTTI
writedowns on equity securities were on marketable equity securities held at the
Corp. All OTTI writedowns on debt securities were on pooled trust preferred
securities, which are included in the other debt securities category, held at
the Bank.
The tax
benefit applicable to the net realized losses for the years ended December 31,
2009 and 2008 amounted to $154,000 and $207,000, respectively.
The
following table presents a summary of the other-than-temporary impairment
charges recognized for debt securities still held by QNB:
|
December
31,
|
2009
|
|||
|
OTTI
on debt securities:
|
||||
|
Recorded
as part of gross realized losses (credit-related)
|
$ | 1,002 | ||
|
Recorded
directly to other comprehensive income for non-credit related
impairment
|
2,031 | |||
|
Total
OTTI on debt securities
|
$ | 3,033 | ||
QNB
recognizes OTTI for debt securities classified as available-for-sale in
accordance with FASB ASC 320, Investments
– Debt
and Equity Securities, which requires that we assess whether we intend to
sell or it is more likely than not that the Company will be required to sell a
security before recovery of its amortized cost basis less any current-period
credit losses. For debt securities that are considered other-than-temporarily
impaired and that we do not intend to sell and will not be required to sell
prior to recovery of our amortized cost basis, the amount of the impairment is
separated into the amount that is credit related (credit loss component) and the
amount due to all other factors. The credit loss component is recognized in
earnings and is the difference between the security’s amortized cost basis and
the present value of its expected future cash flows discounted at the security’s
effective yield. The remaining difference between the security’s fair value
and the present value of future expected cash flows is due to factors that are
not credit related and, therefore, is not required to be recognized as a loss in
the income statement, but is recognized in other comprehensive income. QNB
believes that we will fully collect the carrying value of securities on which we
have recorded a non-credit related impairment in other comprehensive
income.
62
NOTES
TO CONSOLIDATED FINANCIAL STATEMENTS
The table
below presents a rollforward of the credit loss component recognized in
earnings. The credit loss component of the amortized cost represents the
difference between the present value of expected future cash flows and the
amortized cost basis of the security prior to considering credit losses. The
beginning balance represents the credit loss component for debt securities for
which OTTI occurred prior to January 1, 2009. OTTI recognized in earnings in
2009 for credit-impaired debt securities is presented as additions in two
components based upon whether the current period is the first time the debt
security was credit-impaired (initial credit impairment) or is not the first
time the debt security was credit impaired (subsequent credit impairments). If
we sell, intend to sell or believe we will be required to sell previously
credit-impaired debt securities, the credit loss component would be reduced. The
following table presents a summary of the cumulative credit-related
other-than-temporary impairment charges recognized as components of earnings for
debt securities still held by QNB:
| Year Ended December 31, |
2009
|
|||
|
Balance,
beginning of year
|
– | |||
|
Additions:
|
||||
|
Initial
credit impairments
|
$ | 1,002 | ||
|
Subsequent
credit impairments
|
– | |||
|
Balance,
end of year
|
$ | 1,002 | ||
Held-To-Maturity
The
amortized cost and estimated fair values of investment securities
held-to-maturity at December 31, 2009 and 2008 were as follows:
|
December
31,
|
2009
|
2008
|
||||||||||||||||||||||||||||||
|
Amortized
cost
|
Gross
unrealized
holding
gains
|
Gross
unrealized
holding
losses
|
Aggregate
fair
value
|
Amortized
cost
|
Gross
unrealized
holding
gains
|
Gross
unrealized
holding
losses
|
Aggregate
fair
value
|
|||||||||||||||||||||||||
|
State
and municipal securities
|
$ | 3,347 | $ | 124 | $ | – | $ | 3,471 | $ | 3,598 | $ | 90 | $ | 5 | $ | 3,683 | ||||||||||||||||
The
amortized cost and estimated fair values of securities held-to-maturity by
contractual maturity at December 31, 2009, are shown in the following table.
Expected maturities will differ from contractual maturities because borrowers
may have the right to call or prepay obligations with or without penalties.
|
December
31, 2009
|
Aggregate
fair
value
|
Amortized
cost
|
||||||
|
Due
in one year or less
|
– | – | ||||||
|
Due
after one year through five years
|
– | – | ||||||
|
Due
after five years through ten years
|
$ | 3,471 | $ | 3,347 | ||||
| Due after ten years | – | – | ||||||
|
Total
securities held-to-maturity
|
$ | 3,471 | $ | 3,347 | ||||
There
were no sales of investment securities classified as held-to-maturity during
2009 or 2008.
63
NOTES
TO CONSOLIDATED FINANCIAL STATEMENTS
At
December 31, 2009 and 2008, investment securities available-for-sale totaling
$133,136,000 and $101,302,000, respectively, were pledged as collateral for
repurchase agreements and deposits of public funds.
Securities
that have been in a continuous unrealized loss position are as
follows:
|
Less
than 12 months
|
12
months or longer
|
Total
|
Total
|
|||||||||||||||||||||
|
Fair
|
Unrealized
|
Fair
|
Unrealized
|
Fair
|
Unrealized
|
|||||||||||||||||||
|
As
of December 31, 2009
|
value
|
losses
|
value
|
losses
|
value
|
losses
|
||||||||||||||||||
|
U.S.
Treasuries
|
$
|
2,509
|
$
|
1
|
–
|
–
|
$
|
2,509
|
$
|
1
|
||||||||||||||
|
U.S.
Government agency securities
|
28,675
|
316
|
–
|
–
|
28,675
|
316
|
||||||||||||||||||
|
State
and municipal securities
|
6,309
|
45
|
$
|
659
|
$
|
14
|
6,968
|
59
|
||||||||||||||||
|
Mortgage-backed
securities
|
6,934
|
69
|
–
|
–
|
6,934
|
69
|
||||||||||||||||||
|
Collateralized
mortgage obligations (CMOs)
|
6,929
|
60
|
–
|
–
|
6,929
|
60
|
||||||||||||||||||
|
Other
debt securities
|
–
|
–
|
1,008
|
3,065
|
1,008
|
3,065
|
||||||||||||||||||
|
Equity
securities
|
392
|
4
|
137
|
10
|
529
|
14
|
||||||||||||||||||
|
Total
|
$
|
51,748
|
$
|
495
|
$
|
1,804
|
$
|
3,089
|
$
|
53,552
|
$
|
3,584
|
||||||||||||
|
Less
than 12 months
|
12
months or longer
|
Total
|
Total
|
|||||||||||||||||||||
|
Fair
|
Unrealized
|
Fair
|
Unrealized
|
Fair
|
Unrealized
|
|||||||||||||||||||
|
As
of December 31, 2008
|
value
|
losses
|
value
|
losses
|
value
|
losses
|
||||||||||||||||||
|
U.S.
Government agency securities
|
$
|
2,995
|
$
|
5
|
–
|
–
|
$
|
2,995
|
$
|
5
|
||||||||||||||
|
State
and municipal securities
|
15,975
|
517
|
–
|
–
|
15,975
|
517
|
||||||||||||||||||
|
Collateralized
mortgage obligations (CMOs)
|
5,204
|
591
|
–
|
–
|
5,204
|
591
|
||||||||||||||||||
|
Other
debt securities
|
2,978
|
40
|
$
|
1,963
|
$
|
3,131
|
4,941
|
3,171
|
||||||||||||||||
|
Equity
securities
|
1,715
|
382
|
–
|
–
|
1,715
|
382
|
||||||||||||||||||
|
Total
|
$
|
28,867
|
$
|
1,535
|
$
|
1,963
|
$
|
3,131
|
$
|
30,830
|
$
|
4,666
|
||||||||||||
QNB has
67 securities including 4 in the equity portfolio, in an unrealized loss
position at December 31, 2009. The unrealized losses in QNB’s debt securities
holdings are primarily related to the dynamic nature of interest rates as well
as the impact of current market conditions. One of QNB’s prime objectives with
the investment portfolio is to invest excess liquidity that is not needed to
fund loans. As a result, QNB adds new investments throughout the year as they
become available through deposit inflows or roll-off from loans and securities.
The unrealized losses in U.S. Government agency securities, state and municipal
securities, mortgage-backed securities and CMOs are primarily the result of
purchases made when market interest rates were lower than at year end. As
interest rates increase, fixed-rate securities generally fall in market price to
reflect the higher market yield. If held to maturity, all of the bonds will
mature at par, and QNB will not realize a loss. QNB has the intent to hold these
securities and does not believe it will be required to sell the securities
before recovery occurs.
The
Company’s investment in marketable equity securities primarily consists of
investments in large cap stock companies. These equity securities are analyzed
for impairment on an ongoing basis. As a result of declines in equity values
during 2009, $521,000 of other-than-temporary impairment charges were taken in
2009. QNB had 3 equity securities with unrealized losses of $4,000 in this
position for a time period less than twelve months and one equity security with
an unrealized loss of $10,000 for more than twelve months. Management believes
these equity securities will recover in the foreseeable future. QNB evaluated
the near-term prospects of the issuers in relation to the severity and
duration of the impairment. Based on that evaluation and the Company’s ability
and intent to hold those securities for a reasonable period of time sufficient
for a forecasted recovery of fair value, the Company does not consider these
equity securities to be other-than-temporarily impaired.
All of
the securities in the other debt securities category with unrealized losses
greater than twelve months as of December 31, 2009 are pooled trust preferred
security issues. QNB holds eight of these securities with an amortized cost of
$4,073,000 and a fair value of $1,008,000. All of the trust preferred securities
are available-for-sale securities and are carried at fair value.
64
NOTES
TO CONSOLIDATED FINANCIAL STATEMENTS
The
following table provides additional information related to pooled trust
preferred securities as of December 31, 2009:
|
Deal
|
Class
|
Book
Value
|
Fair
Value
|
Unrealized
loss
|
Realized
OTTI
Credit
Loss
|
Moody’s/
Fitch
ratings
|
Current
number
of
banks
|
Current
number of insurance companies
|
Actual
deferrals
and
defaults
as a %
of
current
collateral
|
Excess
subordination
as
a % of
current
performing
collateral
|
||||||||||||||||||||||||||||
|
PreTSL
IV
|
Mezzanine*
|
$
|
243
|
$
|
145
|
$
|
(98
|
)
|
$
|
(1
|
)
|
Ca/CCC
|
5
|
–
|
27.1
|
%
|
19.0
|
%
|
||||||||||||||||||||
|
PreTSL
V
|
Mezzanine*
|
228
|
87
|
(141
|
)
|
(47
|
)
|
Ba3/C
|
2
|
–
|
43.1
|
%
|
No
excess
|
|||||||||||||||||||||||||
|
PreTSL
VI
|
Mezzanine*
|
121
|
100
|
(21
|
)
|
(8
|
)
|
Caa1/CC
|
5
|
–
|
68.7
|
%
|
No
excess
|
|||||||||||||||||||||||||
|
PreTSL
XVII
|
Mezzanine
|
949
|
216
|
(733
|
)
|
(25
|
)
|
Ca/C
|
49
|
7
|
23.7
|
%
|
No
excess
|
|||||||||||||||||||||||||
|
PreTSL
XIX
|
Mezzanine
|
987
|
333
|
(654
|
)
|
–
|
Ca/C
|
53
|
14
|
16.4
|
%
|
No
excess
|
||||||||||||||||||||||||||
|
PreTSL
XXV
|
Mezzanine
|
775
|
63
|
(712
|
)
|
(213
|
)
|
Ca/C
|
60
|
9
|
31.0
|
%
|
No
excess
|
|||||||||||||||||||||||||
|
PreTSL
XXVI
|
Mezzanine
|
770
|
64
|
(706
|
)
|
(708
|
)
|
C/C
|
54
|
10
|
25.0
|
%
|
No
excess
|
|||||||||||||||||||||||||
|
Total
|
$
|
4,073
|
$
|
1,008
|
$
|
(3,065
|
)
|
$
|
(1,002
|
)
|
||||||||||||||||||||||||||||
* - only
class of bonds still outstanding (represents the senior-most obligation of the
trust)
The
market for these securities at December 31, 2009 is not active and markets for
similar securities are also not active. The inactivity was evidenced first by a
significant widening of the bid-ask spread in the brokered markets in which
pooled trust preferred securities trade and then by a significant decrease in
the volume of trades relative to historical levels. The new issue market is also
inactive as no new pooled trust preferred notes have been issued since 2007. The
market values for these securities are significantly depressed relative to
historical levels. In today’s market, a low market price for a particular bond
may only provide evidence of a recent widening of corporate spreads in general
versus being an indicator of credit problems with a particular issuer. Lack of
liquidity in the market for trust preferred collateralized debt
obligations, credit rating downgrades and market uncertainties related to the
financial industry are all factors contributing to the temporary impairment of
these securities. Although these securities are classified as
available-for-sale, QNB has the intent to hold the securities and does not
believe it will be required to sell the securities before recovery occurs. As
illustrated in the table above, these securities are comprised mainly of
securities issued by banks, and to a lesser degree, insurance companies. QNB
owns the mezzanine tranches of these securities.
On a
quarterly basis we evaluate our debt securities for other-than-temporary
impairment (OTTI), which involves the use of a third-party valuation firm to
assist management with the valuation. When evaluating these investments a credit
related portion and a non-credit related portion of OTTI are determined. The
credit related portion is recognized in earnings and represents the expected
shortfall in future cash flows. The non-credit related portion is recognized in
other comprehensive income and represents the difference between the fair value
of the security and the amount of credit related impairment. During 2009,
$1,002,000 in OTTI charges representing credit impairment were recognized on our
pooled trust preferred collateralized debt obligations. A discounted cash flow
analysis provides the best estimate of credit related OTTI for these securities.
Additional information related to this analysis follows:
All of
the pooled trust preferred collateralized debt obligations held by QNB are rated
lower than AA and are measured for OTTI within the scope of ASC 325 (formerly
known as EITF 99-20), Recognition
of Interest Income and Impairment on Purchased
Beneficial Interests and Beneficial Interests That Continue to be Held by a
Transferor in Securitized Financial Assets, and Amendments to the Impairment
Guidance of EITF Issue No. 99-20 (formerly known as EITF 99-20-1). QNB
performs a discounted cash flow analysis on all of its impaired debt securities
to determine if the amortized cost basis of an impaired security will be
recovered. In determining whether a credit loss exists, QNB uses its best
estimate of the present value of cash flows expected to be collected from the
debt security and discounts them at the effective yield implicit in the security
at the date of acquisition. The discounted cash flow analysis is considered to
be the primary evidence when determining whether credit related
other-than-temporary impairment exists.
Results
of a discounted cash flow test are significantly affected by other variables
such as the estimate of future cash flows (including prepayments), credit
worthiness of the underlying banks and insurance companies and determination of
probability and severity of default of the underlying collateral. The following
provides additional information for each of these variables:
|
•
|
Estimate
of Future Cash Flows – Cash flows are constructed in an INTEX desktop
valuation model. INTEX is a proprietary cash flow model recognized as the
industry standard for analyzing all types of structured debt products. It
includes each deal’s structural features updated with trustee information,
including asset-by-asset detail, as it becomes available. The modeled cash
flows are then used to determine if all the scheduled principal and
interest payments of the investments will be returned. For purposes of the
cash flow analysis, relatively modest rates of prepayment were forecasted
(ranging from 0-2%).
|
|
•
|
Internal
Rate of Return – The internal rate of return is the pre-tax yield used to
discount the future cash flows. The cash flows have been discounted using
the stated yield on the individual security purchased plus a market
discount rate ranging from 1% to 6%.
|
|
•
|
Credit
Analysis – A quarterly credit evaluation is performed for the companies
comprising the collateral across the various pooled trust preferred
securities. This credit evaluation considers all available evidence and
focuses on capitalization, asset quality, profitability, liquidity, stock
price performance and whether the institution has received TARP
funding.
|
|
•
|
Probability
of Default – A near-term probability of default is determined for each
issuer based on its financial condition and is used to calculate the
expected impact of future deferrals and defaults on the expected cash
flows. Each issuer in the collateral pool is assigned a near-term
probability of default based on individual performance and financial
characteristics. Various studies suggest that the rate of bank failures
between 1934 and 2008 were approximately 0.36%. Future deferrals on the
individual banks in the analysis are assumed at 1% for 2011, 0.75% for
2012 (two times historical levels) and 0.37% for 2013 and
beyond (historical levels). Banks currently in default or deferring
interest payments are assigned a 100% probability of default. All other
banks in the pool are assigned a probability of default based on their
unique credit characteristics and market
indicators.
|
|
•
|
Severity
of Loss – In addition to the probability of default discussed above, a
severity of loss (projected recovery) is determined in all cases. In the
current analysis, the severity of loss ranges from 0% to 100% depending on
the estimated credit worthiness of the individual issuer, with a 95%
severity of loss utilized for deferrals projected in 2011 and
thereafter.
|
In
addition to the above factors, the evaluation of impairment also includes a
stress test analysis which provides an estimate of excess subordination for each
tranche. This stressed breakpoint is then compared to the level of assets with
credit concerns in each tranche. This comparison allows management to identify
those pools that are at a greater risk for a future adverse change in cash flows
so that we can monitor the asset quality in those pools more closely for
potential deterioration of credit quality.
Based
upon the analysis performed by management as of December 31, 2009, it is
probable that we will collect all contractual principal and interest payments on
one of our eight pooled trust preferred securities, PreTSL XIX. The expected
principal shortfall on the remaining pooled trust preferred securities have
resulted in credit related other-than-temporary impairment charges
during 2009, and these securities could be subject to additional writedowns
in the future if additional deferrals and defaults occur.
65
NOTES
TO CONSOLIDATED FINANCIAL STATEMENTS
Note
5 - Loans
|
December
31,
|
2009
|
2008
|
||||||||||
|
Commercial
and industrial
|
$
|
104,523
|
$
|
97,238
|
||||||||
|
Construction
|
27,567
|
21,894
|
||||||||||
|
Real
estate-commercial
|
173,019
|
142,499
|
||||||||||
|
Real
estate-residential
|
|
128,825
|
124,538
|
|||||||||
|
Consumer
|
3,702
|
4,483
|
||||||||||
|
Indirect
lease financing
|
11,826
|
12,762
|
||||||||||
|
Total
loans
|
449,462
|
403,414
|
||||||||||
|
Net
unearned (fees) costs
|
(41
|
)
|
165
|
|||||||||
|
Loans
receivable
|
$
|
449,421
|
$
|
403,579
|
||||||||
Real
estate commercial loans include all loans collateralized at least in part by
commercial real estate. These loans may not be for the expressed purpose of
conducting commercial real estate transactions.
Overdraft
deposits are reclassified as loans and are included in total loans on the
balance sheet. For the years ended December 31, 2009 and 2008, overdrafts were
$98,000 and $149,000, respectively.
QNB
generally lends in its trade area which is comprised of Quakertown and the
surrounding communities. To a large extent, QNB makes loans collateralized at
least in part by real estate. Its lending activities could be affected by
changes in the general economy, the regional economy, or real estate values. At
December 31, 2009, there were no concentrations of loans exceeding 10 percent of
total loans other than disclosed in the table above.
Note
6 - Allowance For Loan Losses
Activity
in the allowance for loan losses is shown below:
|
December
31,
|
2009
|
2008
|
||||||
|
Balance
at beginning of year
|
$
|
3,836
|
$
|
3,279
|
||||
|
Charge-offs
|
(1,934
|
)
|
(846
|
)
|
||||
|
Recoveries
|
165
|
78
|
||||||
|
Net
charge-offs
|
(1,769
|
)
|
(768
|
)
|
||||
|
Provision
for loan losses
|
4,150
|
1,325
|
||||||
|
Balance
at end of year
|
$
|
6,217
|
$
|
3,836
|
||||
Information
with respect to loans that are considered to be impaired in accordance with the
impairment accounting guidance (ASC 310-10-35-16) is as follows:
|
December
31,
|
2009
|
2008
|
||||||||||||||
|
Loan
Balance
|
Specific
Reserve
|
Loan
Balance
|
Specific
Reserve
|
|||||||||||||
|
Average
recorded investment in impaired loans
|
$
|
1,898
|
$
|
1,024
|
||||||||||||
|
Recorded
investment in impaired loans at year-end subject to a specific allowance
for loan losses and corresponding specific allowance
|
$
|
1,077
|
$
|
528
|
$
|
586
|
$
|
188
|
||||||||
|
Recorded
investment in impaired loans at year-end requiring no specific allowance
for loan losses
|
4,622
|
–
|
238
|
–
|
||||||||||||
|
Recorded
investment in impaired loans at year-end
|
$
|
5,699
|
$
|
824
|
||||||||||||
QNB
recognized $48,000 and $139,000 of interest income on impaired loans in 2009 and
2008, respectively.
Information
regarding non-performing loans greater than 90 days past due is as
follows:
|
December
31,
|
2009
|
2008
|
||||||
|
Recorded
investment in non-accrual loans
|
$
|
3,086
|
$
|
830
|
||||
|
Recorded
investment in loans greater than 90 days past due and still accruing
interest
|
759
|
478
|
||||||
Note
7 - Premises And Equipment
Premises
and equipment, stated at cost less accumulated depreciation and amortization,
are summarized below:
|
December
31,
|
2009
|
2008
|
||||||
|
Land
and buildings
|
$
|
7,184
|
$
|
7,103
|
||||
|
Furniture
and equipment
|
10,055
|
9,677
|
||||||
|
Leasehold
improvements
|
1,668
|
1,668
|
||||||
|
Book
value
|
18,907
|
18,448
|
||||||
|
Accumulated
depreciation and amortization
|
(12,659
|
)
|
(11,787
|
)
|
||||
|
Net
book value
|
$
|
6,248
|
$
|
6,661
|
||||
66
NOTES
TO CONSOLIDATED FINANCIAL STATEMENTS
Depreciation
and amortization expense on premises and equipment amounted to $894,000 and
$901,000 for the years ended December 31, 2009 and 2008, respectively.
Note
8 - Intangible Assets and Servicing
Loans
serviced for others are not included in the accompanying consolidated balance
sheets. The unpaid principal balances of mortgage loans serviced for others were
$79,952,000 and $67,412,000 at December 31, 2009 and 2008,
respectively.
The
following table reflects the activity of mortgage servicing rights for the
periods indicated:
|
Years
Ended December 31,
|
2009
|
2008
|
||||||
|
Balance
at beginning of year
|
$
|
402
|
$
|
451
|
||||
|
Mortgage
servicing rights capitalized
|
189
|
60
|
||||||
|
Mortgage
servicing rights amortized
|
(100
|
)
|
(77
|
)
|
||||
| Fair market value adjustments | 28 | (32 | ) | |||||
|
Balance
at end of year
|
$
|
519
|
$
|
402
|
||||
The balance of these mortgage servicing rights are included in other assets at December 31, 2009 and 2008. The fair value of these rights was $637,000 and $440,000, respectively. The fair value of servicing rights was determined using a 9.0% discount rate for both 2009 and 2008.
Amortization
expense of intangible assets for the years ended December 31, 2009 and 2008 was
$100,000 and $77,000, respectively.
The
annual estimated amortization expense of intangible assets for each of the five
succeeding fiscal years is as follows:
|
2010
|
$
|
126
|
||||||
|
2011
|
|
101
|
||||||
|
2012
|
76
|
|||||||
|
2013
|
57
|
|||||||
|
2014
|
42
|
|||||||
Note
9 - Time Deposits
The
aggregate amount of time deposits, including deposits in denominations of
$100,000 or more, was $321,096,000 and $311,302,000 at December 31, 2009 and
2008, respectively.
At
December 31, 2009, the scheduled maturities of time deposits were as
follows:
|
2010
|
$
|
181,950
|
||
|
2011
|
117,451
|
|||
|
2012
|
5,983
|
|||
|
2013
|
4,377
|
|||
|
2014
|
11,335
|
|||
|
Thereafter
|
–
|
|||
|
Total
time deposits
|
$
|
321,096
|
Note
10 - Short-Term Borrowings
|
Securities
Sold under
|
Other
Short-term
|
|||||||||||
|
December
31,
|
Agreements
to Repurchase (a)
|
Borrowings
(b)
|
||||||||||
|
2009
|
||||||||||||
|
Balance
|
$
|
28,055
|
$
|
378
|
||||||||
|
Maximum
indebtedness at any month end
|
30,938
|
3,657
|
||||||||||
|
Daily
average indebtedness outstanding
|
20,707
|
1,110
|
||||||||||
|
Average
rate paid for the year
|
1.18
|
%
|
0.39
|
%
|
||||||||
|
Average
rate on period-end borrowings
|
1.00
|
–
|
||||||||||
|
2008
|
||||||||||||
|
Balance
|
$
|
21,063
|
$
|
600
|
||||||||
|
Maximum
indebtedness at any month end
|
23,360
|
14,424
|
||||||||||
|
Daily
average indebtedness outstanding
|
19,222
|
2,975
|
||||||||||
|
Average
rate paid for the year
|
2.18
|
%
|
1.77
|
%
|
||||||||
|
Average
rate on period-end borrowings
|
1.72
|
–
|
||||||||||
(a)
Securities sold under agreements to repurchase mature overnight. The repurchase
agreements were collateralized by U.S. Government agency securities, as well as
mortgage-backed securities and CMOs (both backed by U.S. Government agencies)
with an amortized cost of $38,040,000 and $21,678,000 and a fair value of
$39,444,000 and $22,410,000 at December 31, 2009 and 2008, respectively. These
securities are held in safekeeping at the Federal Reserve Bank.
(b) Other
short-term borrowings include Federal funds purchased, overnight borrowings from
the FHLB and Treasury tax and loan notes.
The Bank
has two unsecured Federal funds lines granted by correspondent banks totaling
$18,000,000. Federal funds purchased under these lines were $0 at both December
31, 2009 and 2008.
Note
11 - Long-Term Debt
Under
terms of its agreement with the FHLB, QNB maintains otherwise unencumbered
qualifying assets (principally 1-4 family residential mortgage loans and U.S.
Government and agency notes, bonds, and mortgage-backed securities) in the
amount of at least as much as its advances from the FHLB. QNB’s FHLB stock of
$2,279,000 at both December 31, 2009 and 2008 is also pledged to secure these
advances.
QNB has a
maximum borrowing capacity with the FHLB of approximately $193,062,000. At
December 31, 2009 and 2008, there were $10,000,000 in outstanding advances with
a fixed interest rate of 2.97% maturing in January 2010.
During
2007, the Bank entered into securities sold under agreements to repurchase
totaling $25,000,000. These securities sold under agreements to repurchase have
3 to 7 year terms, carry a fixed interest rate ranging from 4.63% to 4.90%, and
beginning in 2009 may be called.
These
repurchase agreements are treated as financings with the obligations to
repurchase securities sold reflected as a liability in the balance sheet. The
dollar amount of securities underlying the agreements remains recorded as an
asset, although the securities underlying the agreements are delivered to the
broker who arranged the transactions. The broker/dealer who participated with
the Company in these agreements is PNC Bank. Securities underlying sales of
securities under repurchase agreements consisted of municipal securities that
had an amortized cost of $30,227,000 and a fair value of $29,390,000 at December
31, 2009.
Fixed
rate securities sold under agreements to repurchase as of December 31, 2009
mature as follows:
|
Weighted
|
||||||||
|
Amount
|
Average
Rate
|
|||||||
|
2010
|
$
|
5,000
|
1
|
4.90
|
%
|
|||
|
2012
|
15,000
|
2
|
4.75
|
|||||
|
2014
|
5,000
|
3
|
4.77
|
|||||
|
Total
|
$
|
25,000
|
4.78
|
%
|
||||
1 Callable
beginning 4/17/09
2
$5,000,000 callable beginning 4/17/09, $10,000,000 callable beginning
4/17/10
3
$2,500,000 callable beginning 4/17/10, $2,500,000 callable beginning
4/17/12
67
NOTES
TO CONSOLIDATED FINANCIAL STATEMENTS
Note 12 - Income Taxes
Note 12 - Income Taxes
The
components of the provision for income taxes are as follows:
|
Year
Ended December 31,
|
2009
|
2008
|
||||||
|
Current
Federal income taxes
|
$
|
1,681
|
$
|
1,669
|
||||
|
Deferred
Federal income taxes
|
(1,058
|
)
|
(109
|
)
|
||||
|
Net
provision
|
$
|
623
|
$
|
1,560
|
||||
At
December 31, 2009 and 2008, the tax effects of temporary differences that
represent the significant portion of deferred tax assets and liabilities are as
follows:
|
December
31,
|
2009
|
2008
|
||||||
|
Deferred
tax assets
|
||||||||
|
Allowance
for loan losses
|
$
|
2,114
|
$
|
1,304
|
||||
|
Impaired
securities
|
645
|
380
|
||||||
|
Capital
loss carryover
|
63
|
8
|
||||||
|
Net
unrealized holding losses on investment securities
available-for-sale
|
–
|
120
|
||||||
|
Non-credit
OTTI on investment securities available-for-sale
|
819
|
–
|
||||||
|
Deferred
compensation
|
29
|
41
|
||||||
|
Deposit
premium
|
33
|
45
|
||||||
|
Other
|
15
|
14
|
||||||
|
Total
deferred tax assets
|
3,718
|
1,912
|
||||||
|
Deferred
tax liabilities
|
||||||||
|
Depreciation
|
83
|
95
|
||||||
|
Mortgage
servicing rights
|
176
|
137
|
||||||
|
Net
unrealized holding gains on investment securities
available-for-sale
|
1,707
|
–
|
||||||
|
Prepaid
expenses
|
140
|
119
|
||||||
|
Other
|
2
|
1
|
||||||
|
Total
deferred tax liabilities
|
2,108
|
352
|
||||||
|
Net
deferred tax asset
|
$
|
1,610
|
$
|
1,560
|
||||
The realizability of deferred tax assets is dependent upon a variety of factors, including the generation of future taxable income, the existence of taxes paid and recoverable, the reversal of deferred tax liabilities and tax planning strategies. Based upon these and other factors, management believes it is more likely than not that QNB will realize the benefits of the above deferred tax assets. The net deferred tax asset is included in other assets on the consolidated balance sheet. As of December 31, 2009, QNB has a capital loss carryover of $184,000 that will expire on December 31, 2012, if not utilized.
A
reconciliation of the tax provision on income before taxes computed at the
statutory rate of 34% and the actual tax provision was as follows:
|
Year
Ended December 31,
|
2009
|
2008
|
||||||
|
Provision
at statutory rate
|
$
|
1,649
|
$
|
2,486
|
||||
|
Tax-exempt
interest and dividend income
|
(994
|
)
|
(871
|
)
|
||||
|
Bank-owned
life insurance
|
(105
|
)
|
(100
|
)
|
||||
|
Life
insurance proceeds
|
–
|
(16
|
)
|
|||||
|
Stock-based
compensation expense
|
20
|
21
|
||||||
|
Other
|
53
|
40
|
||||||
|
Total
provision
|
$
|
623
|
$
|
1,560
|
||||
68
NOTES
TO CONSOLIDATED FINANCIAL STATEMENTS
Note
13 - Employee Benefit Plans
The QNB
Bank Retirement Savings Plan provides for elective employee contributions up to
the maximum allowed by the IRS and a matching company contribution limited to 3
percent. In addition, the plan provides for safe harbor nonelective
contributions of 5 percent of total compensation by QNB. QNB contributed a
matching contribution of $161,000 and $152,000 for the years ended December 31,
2009 and 2008, respectively, and a safe harbor contribution of $316,000 for 2009
and $290,000 for 2008.
QNB’s
Employee Stock Purchase Plan (the Plan) offers eligible employees an opportunity
to purchase shares of QNB Corp. Common Stock at a 10 percent discount from the
lesser of fair market value on the first or last day of each offering period (as
defined by the plan). The 2006 Plan authorizes the issuance of 20,000 shares. As
of December 31, 2009, 13,502 shares were issued under the 2006 Plan. The 2006
Plan expires May 31, 2011.
Shares
issued pursuant to the Plan were as follows:
|
Year
Ended December 31,
|
Shares
|
Price
per Share
|
||||||
|
2009
|
4,849
|
|
$14.04
and $15.30
|
|||||
|
2008
|
3,769
|
|
$16.07
and $18.63
|
|||||
Note
14 - Stock Option Plan
QNB has
stock option plans (the Plans) administered by a committee which consists of
three or more members of QNB’s Board of Directors. The Plans provide for the
granting of either (i) Non-Qualified Stock Options (NQSOs) or (ii) Incentive
Stock Options (ISOs). The exercise price of an option, as defined by the Plans,
is the fair market value of QNB’s common stock at the date of grant. The Plans
provide for the exercise either in cash or in securities of the Company or in
any combination thereof.
The 1998
Plan authorizes the issuance of 220,500 shares. The time period by which any
option is exercisable under the Plan is determined by the Committee but shall
not commence before the expiration of six months after the date of grant or
continue beyond the expiration of ten years after the date the option is
awarded. The granted options vest after a three-year period. As of December 31,
2009, there were 225,058 options granted, 12,198 options forfeited, 75,758
options exercised and 137,102 options outstanding under this Plan. The 1998 Plan
expired March 10, 2008.
The 2005
Plan authorizes the issuance of 200,000 shares. The terms of the 2005 Plan are
identical to the 1998 Plan except the options expire five years after the grant
date. As of December 31, 2009, there were 63,700 options granted and outstanding
under this Plan. The 2005 Plan expires March 15, 2015.
As of
December 31, 2009, there was approximately $44,000 of unrecognized compensation
cost related to unvested stock option awards granted. That cost is
expected to be recognized over the next two years.
Stock
option activity during 2009 and 2008, was as follows:
|
|
Number
of Options
|
Weighted
Average
Exercise Price
|
Weighted
Average
Remaining
Contractual
Term (in yrs)
|
Aggregate
Intrinsic
Value
|
||||||||||||
|
Outstanding
December 31, 2007
|
203,923
|
$
|
20.56
|
|||||||||||||
|
Granted
|
17,400
|
21.00
|
||||||||||||||
|
Outstanding
December 31, 2008
|
221,323
|
20.60
|
||||||||||||||
|
Exercised
|
(38,317
|
)
|
15.02
|
|||||||||||||
|
Forfeited
|
(2,204
|
)
|
16.70
|
|||||||||||||
|
Granted
|
20,000
|
17.15
|
||||||||||||||
|
Outstanding
at December 31, 2009
|
200,802
|
$
|
21.36
|
2.7
|
$
|
142
|
||||||||||
|
Exercisable
at December 31, 2009
|
146,002
|
$
|
21.53
|
2.5
|
$
|
142
|
||||||||||
As of
December 31, 2009, outstanding stock options consist of the
following:
|
Remaining
|
||||||||||||||||||||
|
Options
|
Exercise
|
Life
|
Options
|
Exercise
|
||||||||||||||||
|
Outstanding
|
Price
|
(in
years)
|
Exercisable
|
Price
|
||||||||||||||||
|
7,938
|
$
|
13.09
|
0.1
|
7,938
|
$
|
13.09
|
||||||||||||||
|
22,364
|
13.30
|
1.0
|
22,364
|
13.30
|
||||||||||||||||
|
31,700
|
16.13
|
2.0
|
31,700
|
16.13
|
||||||||||||||||
|
20,000
|
17.15
|
4.1
|
–
|
–
|
||||||||||||||||
|
31,700
|
20.00
|
3.1
|
31,700
|
20.00
|
||||||||||||||||
|
17,400
|
21.00
|
3.0
|
–
|
–
|
||||||||||||||||
|
17,400
|
25.15
|
2.0
|
–
|
–
|
||||||||||||||||
|
17,400
|
26.00
|
1.1
|
17,400
|
26.00
|
||||||||||||||||
|
17,400
|
32.35
|
5.1
|
17,400
|
32.35
|
||||||||||||||||
|
17,500
|
33.25
|
4.3
|
17,500
|
33.25
|
||||||||||||||||
|
Outstanding
as of December 31, 2009
|
200,802
|
$
|
21.36
|
2.7
|
146,002
|
$
|
21.53
|
|||||||||||||
The cash
proceeds, tax benefits and intrinsic value related to total stock options
exercised during 2009 and 2008 are as follows:
|
2009
|
2008
|
|||||||
|
Tax
benefits related to stock options exercised
|
$
|
10
|
–
|
|||||
|
Intrinsic
value of stock options exercised
|
105
|
–
|
||||||
Note
15 - Related Party Transactions
The
following table presents activity in the amounts due from directors, principal
officers, and their related interests. All of these transactions were made in
the ordinary course of business on substantially the same terms, including
interest rates and collateral, as those prevailing at the time for comparable
transactions with other persons. Also, they did not involve a more than normal
risk of collectibility or present any other unfavorable features.
|
Balance,
December 31, 2008
|
$
|
4,630
|
||||||
|
New
loans
|
|
6,136
|
||||||
|
Repayments
|
(5,490
|
)
|
||||||
|
Balance,
December 31, 2009
|
$
|
5,276
|
||||||
In
previous years, QNB allowed its directors to defer a portion of their
compensation. The amount of deferred compensation accrued as of December 31,
2009 and 2008, was $85,000 and $121,000, respectively.
Note
16 - Commitments And Contingencies
Financial instruments with
off-balance-sheet risk:
In the
normal course of business there are various legal proceedings, commitments, and
contingent liabilities which are not reflected in the financial statements.
Management does not anticipate any material losses as a result of these
transactions and activities. They include, among other things, commitments to
extend credit and standby letters of credit. Outstanding standby letters of
credit amounted to $14,071,000 and $12,051,000, and commitments to extend credit
and unused lines of credit totaled $99,119,000 and $87,227,000 at December 31,
2009 and 2008, respectively. The maximum exposure to credit loss, which
represents the possibility of sustaining a loss due to the failure of the other
parties to a financial instrument to perform according to the terms of the
contract, is represented by the contractual amount of these instruments. QNB
uses the same lending standards and policies in making credit commitments as it
does for on-balance sheet instruments. The activity is controlled through credit
approvals, control limits, and monitoring procedures.
69
NOTES
TO CONSOLIDATED FINANCIAL STATEMENTS
Commitments
to extend credit are agreements to lend to a customer as long as there is no
violation of any condition established in the contract. Commitments generally
have fixed expiration dates or other termination clauses and may require the
payment of a fee. Since many of the commitments are expected to
expire without being drawn upon, the total commitment amounts do not necessarily
represent future cash requirements. QNB evaluates each customer’s
creditworthiness on a case-by-case basis.
Standby
letters of credit are conditional commitments issued by the Bank to guarantee
the financial or performance obligation of a customer to a third party. QNB’s
exposure to credit loss in the event of nonperformance by the other party to the
financial instrument for standby letters of credit is represented by the
contractual amount of those instruments. The Bank uses the same credit policies
in making conditional obligations as it does for on-balance sheet instruments.
These standby letters of credit expire within three years. The credit risk
involved in issuing letters of credit is essentially the same as that involved
in extending other loan commitments. The Bank requires collateral and personal
guarantees supporting these letters of credit as deemed necessary. Management
believes that the proceeds obtained through a liquidation of such collateral and
the enforcement of personal guarantees would be sufficient to cover the
maximum potential amount of future payments required under the corresponding
guarantees. The amount of the liability as of December 31, 2009 and 2008 for
guarantees under standby letters of credit issued is not material.
The
amount of collateral obtained for letters of credit and commitments to extend
credit is based on management’s credit evaluation of the customer. Collateral
varies, but may include real estate, accounts receivable, marketable securities,
pledged deposits, inventory or equipment.
Other
commitments:
QNB has
committed to various operating leases for several of their branch and office
facilities. Some of these leases include renewal options as well as specific
provisions relating to rent increases. The minimum annual rental commitments
under these leases outstanding at December 31, 2009 are as follows:
|
Minimum
Lease Payments
|
||||
|
2010
|
$
|
443
|
||
|
2011
|
443
|
|||
|
2012
|
395
|
|||
|
2013
|
354
|
|||
|
2014
|
330
|
|||
|
Thereafter
|
4,633
|
|||
The leases contain renewal options to extend the initial terms of the lease from one to ten years. With the exception of the renewals for a land lease related to a permanent branch site, the commitment for such renewals is not included above. Rent expense under leases for the years ended December 31, 2009 and 2008, was $426,000 and $400,000, respectively.
Note
17 - Other Comprehensive Income (Loss)
The
component of other comprehensive income (loss) are as follows:
|
Before-Tax
Amount
|
Tax
Expense (Benefit)
|
Net-of-Tax
Amount
|
||||||||||
|
Year
Ended December 31, 2009
|
||||||||||||
|
Unrealized
gains on securities
|
||||||||||||
|
Unrealized
holding gains arising during the period
|
$
|
3,476
|
$
|
(1,182
|
)
|
$
|
2,294
|
|||||
|
Unrealized
losses related to factors other than credit arising during the
year
|
(966
|
)
|
328
|
(638
|
)
|
|||||||
|
Reclassification
adjustment for gains included in net income
|
(1,069
|
)
|
364
|
(705
|
)
|
|||||||
|
Reclassification
adjustment for OTTI losses included in income
|
1,523
|
(518
|
)
|
1,005
|
||||||||
|
Other
comprehensive income
|
$
|
2,964
|
$
|
(1,008
|
)
|
$
|
1,956
|
|||||
|
Year
Ended December 31, 2008
|
||||||||||||
|
Unrealized
losses on securities
|
||||||||||||
|
Unrealized
holding losses arising during the period
|
$
|
(3,241
|
)
|
$
|
1,102
|
$
|
(2,139
|
)
|
||||
|
Reclassification
adjustment for losses included in net income
|
609
|
(207
|
)
|
402
|
||||||||
|
Other
comprehensive (loss)
|
$
|
(2,632
|
)
|
$
|
895
|
$
|
(1,737
|
)
|
||||
70
NOTES
TO CONSOLIDATED FINANCIAL STATEMENTS
Note
18 - Fair Value Measurements and Fair Values of Financial
Instruments
Financial
Accounting Standards Board (FASB) ASC 820, Fair
Value Measurements and Disclosures, defines fair value as an exit price,
representing the amount that would be received to sell an asset or paid to
transfer a liability in an orderly transaction between market participants (fair
values are not adjusted for transaction costs). ASC 820 also establishes a
framework (fair value hierarchy) for measuring fair value under GAAP, and
expands disclosures about fair value measurements.
In
December 2007, the FASB issued guidance which permitted a delay for fair value
measurements and disclosures related to all non-financial assets and
liabilities, except those that are recognized or disclosed at fair value on a
recurring basis (at least annually) to fiscal years beginning after November 15,
2008 and interim periods within those fiscal years. As such, the Company began
to account and report for non-financial assets and liabilities in 2009.
ASC 820
establishes a fair value hierarchy that prioritizes the inputs to valuation
methods used to measure fair value. The hierarchy gives the highest priority to
unadjusted quoted prices in active markets for identical assets or liabilities
(Level 1 measurements) and the lowest priority to unobservable inputs (Level 3
measurements). The three levels of the fair value hierarchy under this guidance
are as follows:
|
|
Level
1: Unadjusted quoted prices in active markets that are
accessible at the measurement date for identical, unrestricted assets or
liabilities.
|
|
|
Level
2: Quoted prices in markets that are not active, or inputs that
are observable either directly or indirectly, for substantially the full
term of the asset or liability.
|
|
|
Level
3: Prices or valuation techniques that require inputs that are
both significant to the fair value measurement and unobservable (i.e.,
supported with little or no market
activity).
|
An
asset’s or liability’s level within the fair value hierarchy is based on the
lowest level of input that is significant to the fair value
measurement.
The
measurement of fair value should be consistent with one of the following
valuation techniques: market approach, income approach, and/or cost approach.
The market approach uses prices and other relevant information generated by
market transactions involving identical or comparable assets or liabilities
(including a business). For example, valuation techniques consistent with the
market approach often use market multiples derived from a set of comparables.
Multiples might lie in ranges with a different multiple for each comparable. The
selection of where within the range the appropriate multiple falls requires
judgment, considering factors specific to the measurement (qualitative and
quantitative). Valuation techniques consistent with the market approach include
matrix pricing. Matrix pricing is a mathematical technique used principally to
value debt securities without relying exclusively on quoted prices for the
specific securities, but rather by relying on the security’s relationship to
other benchmark quoted securities.
For
financial assets measured at fair value on a recurring basis, the fair value
measurements by level within the fair value hierarchy used were as
follows:
|
Quoted
Prices
|
|
|
||||||||||||||
|
in
Active Markets
|
Significant
Other
|
Significant
|
||||||||||||||
|
for
Identical Assets (Level 1)
|
Observable
Inputs (Level
2)
|
Unobservable
Inputs (Level
3)
|
Balance
at end of
Period |
|||||||||||||
|
December
31, 2009
|
||||||||||||||||
|
Securities
available-for-sale
|
$
|
8,472
|
$
|
247,382
|
$
|
1,008
|
$
|
256,862
|
||||||||
|
December
31, 2008
|
||||||||||||||||
|
Securities
available-for-sale
|
$
|
8,213
|
$
|
209,421
|
$
|
1,963
|
$
|
219,597
|
||||||||
71
NOTES
TO CONSOLIDATED FINANCIAL STATEMENTS
The Level
1 securities in the table above include all U.S. Treasury and equity securities
at both December 31, 2009 and 2008.
The
following table presents a reconciliation of the securities available for sale
measured at fair value on a recurring basis using significant unobservable
inputs (Level 3) for the year ended December 31:
|
Fair
Value Measurements Using
|
||||||||
|
Significant
Unobservable Inputs
(Level
3)
|
||||||||
|
|
||||||||
|
Securities
available for sale
|
2009
|
2008
|
||||||
|
Balance,
beginning of year
|
$
|
1,963
|
–
|
|||||
|
Purchases,
issuances and settlements
|
(19
|
)
|
$
|
(86
|
)
|
|||
|
Total
gains or losses (realized/unrealized)
|
||||||||
|
Included
in earnings
|
(1,002
|
)
|
–
|
|||||
|
Included
in other comprehensive income
|
66 | (1,532 | ) | |||||
|
Transfers
in and/or out of Level 3
|
–
|
3,581
|
||||||
|
Balance,
end of year
|
$
|
1,008
|
$
|
1,963
|
||||
There
were $1,002,000 and $0 of losses included in earnings attributable to the change
in unrealized gains or losses relating to the available-for-sale securities
above with fair value measurements utilizing significant unobservable inputs for
the years ended December 31, 2009 and 2008, respectively.
The Level
3 securities consist of eight collateralized debt obligation securities that are
backed by trust preferred securities issued by banks, thrifts, and insurance
companies (TRUP CDOs). The market for these securities at December 31, 2009 is
not active and markets for similar securities are also not active. The
inactivity was evidenced first by a significant widening of the bid-ask spread
in the brokered markets in which TRUP CDOs trade and then by a significant
decrease in the volume of trades relative to historical levels. The new issue
market is also inactive as no new TRUP CDOs have been issued since 2007. There
are currently very few market participants who are willing and or able to
transact for these securities.
Given
conditions in the debt markets today and the absence of observable transactions
in the secondary and new issue markets, we determined:
|
|
• The few
observable transactions and market quotations that are available are not
reliable for purposes of determining fair value at December 31, 2009,
|
|
|
• An income
valuation approach technique (present value technique) that maximizes the
use of relevant observable inputs and minimizes the use of unobservable
inputs will be equally or more representative of fair value than the
market approach valuation technique used at prior measurement dates and
|
|
|
• TRUP CDOs
will be classified within Level 3 of the fair value hierarchy because
significant adjustments are required to determine fair value at the
measurement date.
|
The Bank
is aware of several factors indicating that recent transactions of TRUP CDO
securities are not orderly including an increased spread between bid/ask prices,
lower sales transaction volumes for these types of securities, and a lack of new
issuances. As a result, the Bank engaged an independent third party
to value the securities using a discounted cash flow analysis. The
estimated cash flows are based on specific assumptions about defaults, deferrals
and prepayments of the trust preferred securities underlying each TRUP
CDO. The resulting collateral cash flows are allocated to the bond
waterfall using the INTEX desktop valuation model.
The
estimates for the conditional default rates (CDR) are based on the payment
characteristics of the trust preferred securities themselves (e.g. current,
deferred, or defaulted) as well as the financial condition of the trust
preferred issuers in the pool. A near-term CDR for each issuer in the
pool is estimated based on their financial condition using key financial ratios
relating to the financial institution’s capitalization, asset quality,
profitability and liquidity. Over the long term, the default rates
are modeled to migrate to the historic norms.
72
NOTES
TO CONSOLIDATED FINANCIAL STATEMENTS
The base
loss severity assumption is 95 percent. The severity factor for
near-term CDRs is vectored to reflect the relative expected performance of the
institutions modeled to default, with lower forecasted severities used for the
higher quality institutions. The long-term loss severity is modeled
at 95%.
Prepayments
are modeled to take into account the disruption in the asset-backed securities
marketplace and the lack of new trust preferred issuances.
The rates
used to discount the cash flows were developed using a build-up method based on
the risk free rate for the expected duration of the securities, plus a risk
premium for bearing the uncertainty in the cash flows, and plus other case
specific factors that would be considered by market participants, including a
normal liquidity adjustment.
For
assets measured at fair value on a nonrecurring basis, the fair value
measurements by level within the fair value hierarchy used are as
follows:
|
Quoted
Prices
in
Active Markets
for Identical Assets (Level 1)
|
Significant
Other Observable
Inputs (Level 2)
|
Significant
Unobservable
Inputs (Level 3)
|
Balance
End
of Year
|
|||||||||||||
|
December
31, 2009
|
||||||||||||||||
|
Mortgage
Servicing Rights
|
–
|
–
|
$
|
519
|
$
|
519
|
||||||||||
|
Impaired
Loans
|
–
|
–
|
549
|
549
|
||||||||||||
|
Foreclosed
Assets
|
–
|
–
|
67
|
67
|
||||||||||||
|
December
31, 2008
|
||||||||||||||||
|
Mortgage
Servicing Rights
|
–
|
–
|
402
|
402
|
||||||||||||
|
Impaired
Loans
|
–
|
–
|
398
|
398
|
||||||||||||
As
discussed above, QNB has delayed its disclosure requirements of non-financial
assets and liabilities in prior year. Certain real estate owned are carried at
fair value on the balance sheet at December 31, 2008.
The
following information should not be interpreted as an estimate of the fair value
of the entire Company since a fair value calculation is only provided for a
limited portion of QNB’s assets and liabilities. Due to a wide range of
valuation techniques and the degree of subjectivity used in making the
estimates, comparisons between QNB’s disclosures and those of other companies
may not be meaningful. The following methods and assumptions were used to
estimate the fair values of each major classification of financial instruments
at December 31, 2009 and 2008:
Cash and due from banks, Federal
funds sold, accrued interest receivable and accrued interest payable (Carried at
Cost): The carrying
amounts reported in the balance sheet approximate
those assets’ fair
value.
Investment
securities: The fair value of securities available for sale
(carried at fair value) and held to maturity (carried at amortized cost) are
determined by obtaining quoted market prices on nationally recognized securities
exchanges (Level 1), or matrix pricing (Level 2), which is a mathematical
technique used widely in the industry to value debt securities without relying
exclusively on quoted market prices for the specific securities but rather by
relying on the securities’ relationship to other benchmark quoted prices. For
certain securities which are not traded in active markets or are subject to
transfer restrictions, valuations are adjusted to reflect illiquidity and/or
non-transferability, and such adjustments are generally based on available
market evidence (Level 3). In the absence of such evidence, management’s best
estimate is used. Management’s best estimate consists of both internal and
external support on certain Level 3 investments. Internal cash flow models using
a present value formula that includes assumptions market participants would use
along with indicative exit pricing obtained from broker/dealers (where
available) were used to support fair values of certain Level 3
investments.
Restricted
investment in bank stocks (Carried at Cost): The fair value of
stock in Atlantic Central Bankers Bank, the Federal Reserve Bank and the Federal
Home Loan Bank is the carrying amount, based on redemption provisions, and
considers the limited marketability of such securities.
73
NOTES
TO CONSOLIDATED FINANCIAL STATEMENTS
Loans
Held for Sale (Carried at Lower of Cost or Fair Value): The
fair value of loans held for sale is determined, when possible, using quoted
secondary-market prices. If no such quoted prices exist, the fair value of a
loan is determined using quoted prices for a similar loan or loans, adjusted for
the specific attributes of that loan.
Loans
Receivable (Carried at Cost): The fair values of loans are
estimated using discounted cash flow analyses, using market rates at the balance
sheet date that reflect the credit and interest rate-risk inherent in the loans.
Projected future cash flows are calculated based upon contractual maturity or
call dates, projected repayments and prepayments of principal. Generally, for
variable rate loans that reprice frequently and with no significant change in
credit risk, fair values are based on carrying values.
Impaired
Loans (Generally Carried at Fair Value): Impaired loans are those that
are accounted for under the accounting guidance of ASC 310-10-35-16, in which
the Bank has measured impairment generally based on the fair value of the loan’s
collateral. Fair value is generally determined based upon independent
third-party appraisals of the properties, or discounted cash flows based upon
the expected proceeds. These assets are included as Level 3 fair values, based
upon the lowest level of input that is significant to the fair value
measurements. At December 31, 2009 the fair value consists of the loan balances
of $1,077,000, net of a valuation allowance of $528,000. At December 31, 2008
the fair value consists of loan balances of $586,000, net of a valuation
allowance of $188,000.
Mortgage
Servicing Rights (Carried at Lower of Cost or Fair Value): The
fair value of mortgage servicing rights is based on a valuation model that
calculates the present value of estimated net servicing income. After
stratifying the rights into tranches based on predominant characteristics, such
as interest rate, loan type and investor type. The valuation incorporates
assumptions that market participants would use in estimating future net
servicing income. QNB is able to compare the valuation model inputs and results
to widely available published industry data for reasonableness.
During
2008, mortgage servicing rights, which are carried at lower of cost or fair
value, were written down to fair value resulting in a valuation allowance of
$32,000. A charge of $32,000 was included in earnings for the period. During
2009, as a result of a recovery in the fair value of these mortgage servicing
rights, $28,000 of the valuation allowance was reversed and recognized in
earnings during the period.
Deposit
liabilities (Carried at Cost): The fair value of deposits with
no stated maturity (e.g. demand deposits, interest-bearing demand accounts,
money market accounts and savings accounts) are by definition, equal to the
amount payable on demand at the reporting date (i.e. their carrying amounts).
This approach to estimating fair value excludes the significant benefit that
results from the low-cost funding provided by such deposit liabilities, as
compared to alternative sources of funding. Deposits with a stated maturity
(time deposits) have been valued using the present value of cash flows
discounted at rates approximating the current market for similar
deposits.
Short-term
borrowings (Carried at Cost): The carrying amount of short-term
borrowings approximates their fair values.
Long-term
debt (Carried at Cost): The fair values of FHLB advances and
securities sold under agreements to repurchase are estimated using discounted
cash flow analysis, based on quoted prices for new long-term debt with similar
credit risk characteristics, terms and remaining time to maturity. These prices
obtained from this active market represent a fair value that is deemed to
represent the transfer price if the liability were assumed by a third
party.
Off-balance-sheet
instruments (Disclosed at Cost): The fair values for the
Bank’s off-balance sheet instruments (lending commitments and letters of credit)
are based on fees currently charged in the market to enter into similar
agreements, taking into account, the remaining terms of the agreements and the
counterparties’ credit standing.
The
estimated fair values and carrying amounts are summarized as
follows:
|
December
31,
|
2009
|
2008
|
||||||||||||||
|
Carrying
Amount
|
Estimated
Fair Value
|
Carrying
Amount
|
Estimated
Fair Value
|
|||||||||||||
|
Financial
Assets
|
||||||||||||||||
|
Cash
and due from banks
|
$
|
30,999
|
$
|
30,999
|
$
|
11,910
|
$
|
11,910
|
||||||||
|
Federal
funds sold
|
–
|
–
|
4,541
|
4,541
|
||||||||||||
|
Investment
securities available-for-sale
|
256,862
|
256,862
|
219,597
|
219,597
|
||||||||||||
|
Investment
securities held-to-maturity
|
3,347
|
3,471
|
3,598
|
3,683
|
||||||||||||
|
Restricted
investment in bank stocks
|
2,291
|
2,291
|
2,291
|
2,291
|
||||||||||||
|
Loans
held-for-sale
|
534
|
537
|
120
|
124
|
||||||||||||
|
Net
loans
|
443,204
|
423,036
|
399,743
|
397,232
|
||||||||||||
|
Mortgage
servicing rights
|
519
|
637
|
402
|
440
|
||||||||||||
|
Accrued
interest receivable
|
2,848
|
2,848
|
2,819
|
2,819
|
||||||||||||
|
|
||||||||||||||||
|
Financial
Liabilities
|
||||||||||||||||
|
Deposits
with no stated maturities
|
313,007
|
313,007
|
238,488
|
238,488
|
||||||||||||
|
Deposits
with stated maturities
|
321,096
|
323,437
|
311,302
|
316,239
|
||||||||||||
|
Short-term
borrowings
|
28,433
|
28,433
|
21,663
|
21,663
|
||||||||||||
|
Long-term
debt
|
35,000
|
36,559
|
35,000
|
37,352
|
||||||||||||
|
Accrued
interest payable
|
1,565
|
1,565
|
2,277
|
2,277
|
||||||||||||
74
NOTES
TO CONSOLIDATED FINANCIAL STATEMENTS
The
estimated fair value of QNB’s off-balance sheet financial instruments is as
follows:
|
December
31,
|
2009
|
2008
|
||||||||||||||
|
Notional
Amount
|
Estimated
Fair Value
|
Notional
Amount
|
Estimated
Fair Value
|
|||||||||||||
|
Commitments
to extend credit
|
$
|
99,119
|
–
|
$
|
87,227
|
–
|
||||||||||
|
Standby
letters of credit
|
14,071
|
–
|
12,051
|
–
|
||||||||||||
Note
19 - Parent Company Financial Information
Condensed
financial statements of QNB Corp. only:
|
Balance
Sheets
|
||||||||
|
December
31,
|
2009
|
2008
|
||||||
|
Assets
|
||||||||
|
Cash
and cash equivalents
|
$
|
27
|
$
|
38
|
||||
|
Investment
securities available-for-sale
|
3,459
|
3,089
|
||||||
| Investment in subsidiary | 52,579 | 50,199 | ||||||
|
Other
assets
|
1,007
|
583
|
||||||
|
Total
assets
|
$
|
57,072
|
$
|
53,909
|
||||
|
Liabilities
|
||||||||
|
Other
liabilities
|
$
|
646
|
–
|
|||||
|
Shareholders’
equity
|
||||||||
|
Common
stock
|
2,036
|
$
|
2,028
|
|||||
|
Surplus
|
10,221
|
10,057
|
||||||
|
Retained
earnings
|
44,922
|
43,667
|
||||||
|
Accumulated
other comprehensive income (loss), net
|
1,723
|
(233
|
)
|
|||||
|
Treasury
stock
|
(2,476
|
)
|
(1,610
|
)
|
||||
|
Total
shareholders’ equity
|
56,426
|
53,909
|
||||||
|
Total
liabilities and shareholders’ equity
|
$
|
57,072
|
$
|
53,909
|
||||
75
NOTES
TO CONSOLIDATED FINANCIAL STATEMENTS
| Statements of Income | ||||||||
|
Year
Ended December 31,
|
2009
|
2008
|
||||||
|
Dividends
from subsidiary
|
$ | 3,390 | $ | 3,148 | ||||
| Interest and dividend income | 84 | 79 | ||||||
|
Securities
losses
|
(112 | ) | (676 | ) | ||||
|
Total
income
|
3,362 | 2,551 | ||||||
|
Expenses
|
266 | 267 | ||||||
|
Income
before applicable income taxes and equity in undistributed income of
subsidiary
|
3,096 | 2,284 | ||||||
|
(Benefit)
provision for income taxes
|
(98 | ) | (292 | ) | ||||
|
Income
before equity in undistributed income of subsidiary
|
3,194 | 2,576 | ||||||
|
Equity
in undistributed income of subsidiary
|
1,033 | 3,177 | ||||||
|
Net
income
|
$ | 4,227 | $ | 5,753 | ||||
|
Statements
of Cash Flows
|
||||||||
|
Year
Ended December 31,
|
2009
|
2008
|
||||||
|
Operating
Activities
|
||||||||
|
Net
income
|
$ | 4,227 | $ | 5,753 | ||||
|
Adjustments
to reconcile net income to net cash provided by operating
activities:
|
||||||||
|
Equity
in undistributed income from subsidiary
|
(1,033 | ) | (3,177 | ) | ||||
|
Net
securities losses
|
112 | 676 | ||||||
|
Stock-based
compensation expense
|
58 | 61 | ||||||
|
Increase
in other assets
|
(752 | ) | (32 | ) | ||||
|
Increase
in other liabilities
|
646 | – | ||||||
|
Deferred
income tax provision
|
13 | (265 | ) | |||||
|
Net
cash provided by operating activities
|
3,271 | 3,016 | ||||||
|
Investing
Activities
|
||||||||
|
Purchase
of investment securities
|
(1,183 | ) | (1,898 | ) | ||||
|
Proceeds
from sale of investment securities
|
1,625 | 1,600 | ||||||
|
Net
cash provided by (used by) investing activities
|
442 | (298 | ) | |||||
|
Financing
Activities
|
||||||||
|
Cash
dividends paid
|
(2,972 | ) | (2,886 | ) | ||||
|
Purchase
of treasury stock
|
(866 | ) | (116 | ) | ||||
|
Proceeds
from issuance of common stock
|
104 | 65 | ||||||
|
Tax
benefit from exercise of stock options
|
10 | – | ||||||
|
Net
cash used by financing activities
|
(3,724 | ) | (2,937 | ) | ||||
|
Decrease
in cash and cash equivalents
|
(11 | ) | (219 | ) | ||||
|
Cash
and cash equivalents at beginning of year
|
38 | 257 | ||||||
|
Cash
and cash equivalents at end of year
|
$ | 27 | $ | 38 | ||||
Note
20 - Regulatory Restrictions
Dividends
payable by the Company and the Bank are subject to various limitations imposed
by statutes, regulations and policies adopted by bank regulatory agencies. Under
Pennsylvania banking law, the Bank is subject to certain restrictions on the
amount of dividends that it may declare without prior regulatory approval. Under
Federal Reserve regulations, the Bank is limited as to the amount it may lend
affiliates, including the Company, unless such loans are collateralized by
specific obligations.
Both the
Company and the Bank are subject to regulatory capital requirements administered
by Federal banking agencies. Failure to meet minimum capital requirements can
initiate actions by regulators that could have an effect on the financial
statements. Under the framework for prompt corrective action, both the Company
and the Bank must meet capital guidelines that involve quantitative measures of
their assets, liabilities, and certain off-balance-sheet items. The capital
amounts and classification are also subject to qualitative judgments by the
regulators. Management believes, as of December 31, 2009, that the Company and
the Bank met capital adequacy requirements to which they were
subject.
76
NOTES
TO CONSOLIDATED FINANCIAL STATEMENTS
As of the
most recent notification, the primary regulator of the Bank considered it to be
“well capitalized” under the regulatory framework. There are no conditions or
events since that notification that management believes have changed the
classification. To be categorized as well capitalized, the Company and the Bank
must maintain minimum ratios set forth in the table below. The
Company and the Bank’s actual capital amounts and ratios are presented as
follows:
|
Capital
Levels
|
||||||||||||||||||||||||
|
Actual
|
Adequately
Capitalized
|
Well
Capitalized
|
||||||||||||||||||||||
|
As
of December 31, 2009
|
Amount
|
Ratio
|
Amount
|
Ratio
|
Amount
|
Ratio
|
||||||||||||||||||
|
Total
risk-based capital (to risk weighted assets):1
|
||||||||||||||||||||||||
|
Consolidated
|
$ | 61,168 | 11.51 | % | $ | 42,504 | 8.00 | % | N/A | N/A | ||||||||||||||
|
Bank
|
57,436 | 10.89 | 42,212 | 8.00 | $ | 52,765 | 10.00 | % | ||||||||||||||||
|
Tier
I capital (to risk weighted assets):1
|
||||||||||||||||||||||||
|
Consolidated
|
54,703 | 10.30 | 21,252 | 4.00 | N/A | N/A | ||||||||||||||||||
|
Bank
|
51,219 | 9.71 | 21,106 | 4.00 | 31,659 | 6.00 | % | |||||||||||||||||
|
Tier
I capital (to average assets):1
|
||||||||||||||||||||||||
|
Consolidated
|
54,703 | 7.34 | 29,822 | 4.00 | N/A | N/A | ||||||||||||||||||
|
Bank
|
51,219 | 6.90 | 29,679 | 4.00 | 37,099 | 5.00 | % | |||||||||||||||||
|
Capital
Levels
|
||||||||||||||||||||||||
|
Actual
|
Adequately
Capitalized
|
Well
Capitalized
|
||||||||||||||||||||||
|
As
of December 31, 2008
|
Amount
|
Ratio
|
Amount
|
Ratio
|
Amount
|
Ratio
|
||||||||||||||||||
|
Total
risk-based capital (to risk weighted assets):1
|
||||||||||||||||||||||||
|
Consolidated
|
$ | 57,732 | 12.37 | % | $ | 37,338 | 8.00 | % | N/A | N/A | ||||||||||||||
|
Bank
|
54,022 | 11.67 | 37,043 | 8.00 | $ | 46,304 | 10.00 | % | ||||||||||||||||
|
Tier
I capital (to risk weighted assets):1
|
||||||||||||||||||||||||
|
Consolidated
|
53,896 | 11.55 | 18,669 | 4.00 | N/A | N/A | ||||||||||||||||||
|
Bank
|
50,186 | 10.84 | 18,522 | 4.00 | 27,783 | 6.00 | ||||||||||||||||||
|
Tier
I capital (to average assets):1
|
||||||||||||||||||||||||
|
Consolidated
|
53,896 | 8.32 | 25,924 | 4.00 | N/A | N/A | ||||||||||||||||||
|
Bank
|
50,186 | 7.79 | 25,754 | 4.00 | 32,192 | 5.00 | ||||||||||||||||||
|
1
|
As
defined by the
regulators
|
Note
21 - Consolidated Quarterly Financial Data (Unaudited)
The
unaudited quarterly results of operations for the years ended 2009 and 2008 are
in the following table:
|
Quarters
Ended 2009
|
Quarters
Ended 2008
|
|||||||||||||||||||||||||||||||
|
March
31
|
June
30
|
Sept.
30
|
Dec.
31
|
March
31
|
June
30
|
Sept.
30
|
Dec.
31
|
|||||||||||||||||||||||||
|
Interest
income
|
$
|
8,626
|
$
|
8,859
|
$
|
8,946
|
$
|
8,937
|
$
|
8,790
|
$
|
8,838
|
$
|
8,832
|
$
|
8,825
|
||||||||||||||||
|
Interest
expense
|
3,545
|
3,539
|
3,419
|
3,164
|
4,176
|
3,782
|
3,787
|
3,574
|
||||||||||||||||||||||||
|
Net
interest income
|
5,081
|
5,320
|
5,527
|
5,773
|
4,614
|
5,056
|
5,045
|
5,251
|
||||||||||||||||||||||||
|
Provision
for loan losses
|
600
|
500
|
1,500
|
1,550
|
225
|
200
|
150
|
750
|
||||||||||||||||||||||||
|
Non-interest
income
|
733
|
1,067
|
514
|
1,571
|
1,384
|
829
|
815
|
272
|
||||||||||||||||||||||||
|
Non-interest
expense
|
3,929
|
4,384
|
3,926
|
4,347
|
3,543
|
3,583
|
3,668
|
3,834
|
||||||||||||||||||||||||
|
Income
before income taxes
|
1,285
|
1,503
|
615
|
1,447
|
2,230
|
2,102
|
2,042
|
939
|
||||||||||||||||||||||||
|
Provision
(benefit) for income taxes
|
191
|
276
|
(56
|
)
|
212
|
520
|
496
|
476
|
68
|
|||||||||||||||||||||||
|
Net
Income
|
$
|
1,094
|
$
|
1,227
|
$
|
671
|
$
|
1,235
|
$
|
1,710
|
$
|
1,606
|
$
|
1,566
|
$
|
871
|
||||||||||||||||
|
Earnings
Per Share - basic
|
$
|
0.35
|
$
|
0.40
|
$
|
0.22
|
$
|
0.40
|
$
|
0.55
|
$
|
0.51
|
$
|
0.50
|
$
|
0.28
|
||||||||||||||||
|
Earnings
Per Share - diluted
|
$
|
0.35
|
$
|
0.40
|
$
|
0.22
|
$
|
0.40
|
$
|
0.54
|
$
|
0.51
|
$
|
0.50
|
$
|
0.28
|
||||||||||||||||
77
ITEM
9. CHANGES IN AND DISAGREEMENTS WITH ACCOUNTANTS ON ACCOUNTING AND FINANCIAL
DISCLOSURE
(a)
None.
(b)
None.
ITEM
9A(T). CONTROLS AND PROCEDURES
The
Company’s management, with the participation of the Chief Executive Officer and
the Chief Financial Officer, has evaluated the effectiveness of the design and
operation of the Company’s disclosure controls and procedures, as such term is
defined under Rule 13a-15(e) promulgated under the Securities Exchange Act of
1934, as amended (the “Exchange Act”), as of December 31, 2009. Based on that
evaluation, the Company’s Chief Executive Officer and Chief Financial Officer
conclude that the Company’s disclosure controls and procedures are effective as
of such date.
The
Company’s management is responsible for establishing and maintaining adequate
internal control over financial reporting, as such term is defined in Rule
13a-15(f) promulgated under the Exchange Act. The Company’s management, with the
participation of the Company’s principal executive officer and principal
financial officer, has evaluated the effectiveness of our internal control over
financial reporting based on the framework in Internal
Control—Integrated
Framework issued by the Committee of Sponsoring Organizations of the
Treadway Commission. Based on our evaluation under the framework in Internal
Control—Integrated
Framework, the Company’s management concluded that our internal control
over financial reporting was effective as of December 31, 2009.
There
have been no changes in the Company’s internal control over financial reporting
during the fourth quarter of 2009 that have materially affected, or are
reasonably likely to materially affect, the Company’s internal control over
financial reporting.
(a)
Management’s Report on Internal Control Over Financial Reporting
Management
is responsible for the preparation, integrity, and fair presentation of the
consolidated financial statements included in this annual report. The
consolidated financial statements and notes included in this annual report have
been prepared in conformity with U.S. generally accepted accounting principles,
and as such, include some amounts that are based on management’s best estimates
and judgments.
The
Company’s management is responsible for establishing and maintaining effective
internal control over financial reporting. The system of internal control over
financial reporting, as it relates to the financial statements, is evaluated for
effectiveness by management and tested for reliability through a program of
internal audits and management testing and review. Actions are taken to correct
potential deficiencies as they are identified. Any system of internal control,
no matter how well designed, has inherent limitations, including the possibility
that a control can be circumvented or overridden and misstatements due to error
or fraud may occur and not be detected. Also, because of changes in conditions,
internal control effectiveness may vary over time. Accordingly, even an
effective system of internal control will provide only a reasonable assurance
with respect to financial statement preparation.
Management
assessed the effectiveness of the Company’s internal control over financial
reporting as of December 31, 2009. In making this assessment, it used the
criteria set forth by the Committee of Sponsoring Organizations of the Treadway
Commission (COSO) in Internal
Control —
Integrated Framework. Based on our assessment, management concluded that,
as of December 31, 2009, the Company’s internal control over financial reporting
is effective and meets the criteria of the Internal
Control —
Integrated Framework.
This
annual report does not include an attestation report of the Company’s registered
independent public accounting firm regarding internal control over financial
reporting. Management’s report was not subject to attestation by the
Company’s registered independent public accounting firm pursuant to temporary
rules of the Securities and Exchange Commission that permit the Company, as a
smaller reporting company, to provide only management’s report in this
annual report.
|
/s/ Thomas
J. Bisko
|
/s/ Bret
H. Krevolin
|
|||
|
Thomas
J. Bisko
|
Bret
H. Krevolin
|
|||
|
President
and Chief Executive Officer
|
Chief
Financial Officer
|
March 31,
2010
ITEM
9B. OTHER INFORMATION
None.
78
PART
III
ITEM
10. DIRECTORS, EXECUTIVE OFFICERS AND CORPORATE GOVERNANCE
The
information required by Item 10 is incorporated by reference to information
appearing in QNB Corp.’s definitive proxy statement to be used in connection
with the 2010 Annual Meeting of Shareholders under the
captions
|
·
|
“Election
of Directors”
|
|
·
|
“Governance
of the Company - Code of Ethics”
|
|
·
|
“Section
16(a) Beneficial Ownership
Compliance”
|
|
·
|
“Meetings
and Committees of the Board of Directors of QNB and the
Bank”
|
|
·
|
“Executive
Officers of QNB and/or the Bank”
|
The
Company has adopted a Code of Business Conduct and Ethics applicable to its CEO,
CFO and Controller as well as its long-standing Code of Ethics which applies to
all directors and employees. The codes are available on the Company’s website at
www.qnb.com.
ITEM
11. EXECUTIVE COMPENSATION
The
information required by Item 11 is incorporated by reference to the information
appearing in QNB Corp.’s definitive proxy statement to be used in connection
with the 2010 Annual Meeting of Shareholders under the captions
|
·
|
“Compensation
Committee Report”
|
|
·
|
“Executive
Compensation”
|
|
·
|
“Director
Compensation”
|
|
·
|
“Compensation
Tables”
|
ITEM
12. SECURITY OWNERSHIP OF CERTAIN BENEFICIAL OWNERS AND MANAGEMENT
AND RELATED STOCKHOLDER
MATTERS
Equity
Compensation Plan Information
The
following table summarizes QNB’s equity compensation plan information as of
December 31, 2009. Information is included for both equity compensation plans
approved by QNB shareholders and equity compensation plans not approved by QNB
shareholders.
|
Plan
Category
|
Number
of shares to be issued upon exercise of outstanding options, warrants and
rights
|
Weighted-average
exercise price of outstanding options, warrants and rights
|
Number
of shares available for future issuance under equity compensation plans
[excluding securities reflected in column (a)]
|
|||||||||
|
(a)
|
(b)
|
(c)
|
||||||||||
|
Equity
compensation plans approved by QNB shareholders
|
||||||||||||
|
1998
Stock Option Plan
|
137,102 | $ | 21.24 | – | ||||||||
|
2005
Stock Option Plan
|
63,700 | 21.62 | 136,300 | |||||||||
|
2006
Employee Stock Purchase Plan
|
– | – | 6,498 | |||||||||
|
Equity
compensation plans not approved by QNB shareholders
|
||||||||||||
|
None
|
– | – | – | |||||||||
|
Totals
|
200,802 | $ | 21.36 | 142,798 | ||||||||
79
Additional
information required by Item 12 is incorporated by reference to the information
appearing in QNB Corp.’s definitive proxy statement to be used in connection
with the 2010 Annual Meeting of Shareholders under the captions
|
·
|
“Security
Ownership of Certain Beneficial Owners and
Management”
|
ITEM
13. CERTAIN RELATIONSHIPS AND RELATED PARTY TRANSACTIONS, AND DIRECTOR
INDEPENDENCE
The
information required by Item 13 is incorporated by reference to the information
appearing in QNB Corp.’s definitive proxy statement to be used in
connection with the 2010 Annual Meeting of Shareholders under the captions
|
·
|
“Certain
Relationships and Related Party
Transactions”
|
|
·
|
“Governance
of the Company - Director
Independence”
|
ITEM
14. PRINCIPAL ACCOUNTANT FEES AND SERVICES
The
information required by Item 14 is incorporated by reference to the information
appearing in QNB Corp.’s definitive proxy statement to be used in connection
with the 2010 Annual Meeting of Shareholders under the captions
|
·
|
“Audit Committee
Pre-Approval of Audit and Permissible Non-Audit Services of Independent
Auditors”
|
|
·
|
“Audit Fees, Audit
Related Fees, Tax Fees, and All Other
Fees”
|
80
PART
IV
ITEM
15. EXHIBITS AND FINANCIAL STATEMENT SCHEDULES
(a)
1. Financial Statements
The following financial statements are
included by reference in Part II, Item 8 hereof.
Report of Independent Registered Public
Accounting Firm
Consolidated Balance
Sheets
Consolidated Statements of
Income
Consolidated Statements of
Shareholders’ Equity
Consolidated Statements of Cash
Flows
Notes to Consolidated Financial
Statements
2. Financial
Statement Schedules
The financial statement schedules
required by this Item are omitted because the information is either
inapplicable, not required or is in theconsolidated financial statements as a
part of this Report.
3. The following exhibits are
incorporated by reference herein or annexed to this Form 10-K:
|
3(i)-
|
Articles
of Incorporation of Registrant, as amended. (Incorporated by reference to
Exhibit 3(i) of Registrant’s proxy statement on Schedule
14-A, SEC File No. 0-17706, filed with the Commission on April 15, 2005.)
|
|
3(ii)-
|
By-laws
of Registrant, as amended. (Incorporated by reference to Exhibit 3(ii) of
Registrant’s Current Report on Form 8-K, SEC
File No. 0-17706, filed with the Commission on January 23,
2006.)
|
|
10.1-
|
Employment
Agreement between the Registrant and Thomas J. Bisko. (Incorporated by
reference to Exhibit 10.1 of Registrant’s Quarterly
report on Form 10-Q, SEC File No. 0-17706, filed with the Commission on
November 15, 2004.)
|
81
|
10.2-
|
Salary
Continuation Agreement between the Registrant and Thomas J. Bisko.
(Incorporated by reference to Exhibit 10.2 of Registrant’s Quarterly
report on Form 10-Q, SEC File No. 0-17706, filed with the Commission on
November 15, 2004.)
|
|
10.3-
|
QNB
Corp. 1998 Stock Incentive Plan. (Incorporated by reference to Exhibit 4.3
to Registration Statement No. 333-91201 on Form S-8, filed with the
Commission on November 18, 1999.)
|
|
10.4-
|
The
Quakertown National Bank Retirement Savings Plan. (Incorporated by
reference to Exhibit 10.4 of Registrant’s Quarterly report on Form
10-Q, SEC File No. 0-17706, filed with the Commission on August
14, 2003.)
|
|
10.5-
|
Change
of Control Agreement between Registrant and Robert C. Werner.
(Incorporated by reference to Exhibit 10.5 of Registrant’s Quarterly
report on Form 10-Q, SEC File No. 0-17706, filed with the Commission on
November 8, 2005.)
|
|
10.6-
|
Change
of Control Agreement between Registrant and Bret H. Krevolin.
(Incorporated by reference to Exhibit 10.6 of Registrant’s Quarterly
report on Form 10-Q, SEC File No. 0-17706, filed with the Commission on
November 8, 2005.)
|
|
10.7-
|
QNB
Corp. 2005 Stock Incentive Plan (Incorporated by reference to Exhibit 99.1
to Registration Statement No. 333-125998 on FormS-8, filed with the
Commission on June 21, 2005).
|
|
10.8-
|
QNB
Corp. 2006 Employee Stock Purchase Plan (Incorporated by reference to
Exhibit 99.1 to Registration Statement No. 333-135408on Form S-8, filed
with the Commission on June 28,
2006).
|
|
10.9-
|
Separation
Agreement between Registrant and Robert C. Werner (Incorporated by
reference to Exhibit 10.1 of Registrant’s Current Report on Form 8-K, SEC
File No. 0-17706, filed with the Commission on December 23,
2009.)
|
|
14-
|
Registrant’s
Code of Ethics. (Incorporated by reference to Exhibit 14 of Registrant’s
Annual Report on Form 10-K, SEC File No. 0-17706,filed
with the Commission on March 30,
2004.)
|
|
21-
|
Subsidiaries
of the Registrant.
|
|
23.1-
|
Consent
of Independent Registered Public Accounting
Firm
|
|
31.1-
|
Section
302 Certification of the President and
CEO.
|
|
31.2-
|
Section
302 Certification of the Chief Financial
Officer.
|
|
32.1-
|
Section
906 Certification of the President and
CEO.
|
|
32.2-
|
Section
906 Certification of the Chief Financial
Officer.
|
82
SIGNATURES
Pursuant to the requirements of Section
13 or 15(d) of the Securities Exchange Act of 1934, the Registrant has duly
caused this report to be signed on its behalf by the undersigned, thereunto duly
authorized.
|
QNB
Corp.
|
|||
|
March
31, 2010
|
BY:
|
/s/
Thomas J. Bisko
|
|
|
Thomas
J. Bisko
|
|||
|
President
and Chief
Executive Officer
|
|||
| Officer | |||
Pursuant to the requirements of the
Securities Exchange Act of 1934, this report is signed below by the following
persons on behalf of the Registrant and in the capacities and on the dates
indicated.
|
/s/
Thomas J. Bisko
|
President,
Chief Executive Officer,
|
March
31, 2010
|
||
|
Thomas
J. Bisko
|
Principal
Executive Officer and Director
|
|||
|
|
||||
|
/s/
Bret H. Krevolin
|
Chief
Financial Officer and
|
March
31, 2010
|
||
|
Bret
H. Krevolin
|
Principal
Financial and Accounting Officer
|
|||
|
/s/
Kenneth F. Brown, Jr.
|
Director
|
March
31, 2010
|
||
|
Kenneth
F. Brown, Jr.
|
||||
|
/s/
Dennis Helf
|
Director,
Chairman
|
March
31, 2010
|
||
|
Dennis
Helf
|
||||
|
/s/
G. Arden Link
|
Director
|
March
31, 2010
|
||
|
G.
Arden Link
|
||||
|
/s/
Charles M. Meredith, III
|
Director
|
March
31, 2010
|
||
|
Charles
M. Meredith, III
|
||||
|
/s/
Anna Mae Papso
|
Director
|
March
31, 2010
|
||
|
Anna
Mae Papso
|
||||
|
/s/
Gary S. Parzych
|
Director
|
March
31, 2010
|
||
|
Gary
S. Parzych
|
||||
|
/s/
Bonnie L. Rankin
|
Director
|
March
31, 2010
|
||
|
Bonnie
L. Rankin
|
||||
|
/s/
Henry L. Rosenberger
|
Director
|
March
31, 2010
|
||
|
Henry
L. Rosenberger
|
||||
|
/s/
Edgar L. Stauffer
|
Director
|
March
31, 2010
|
||
|
Edgar
L. Stauffer
|
83
QNB
CORP.
FORM
10-K
FOR
YEAR ENDED DECEMBER 31, 2009
EXHIBIT
INDEX
|
Exhibit
|
||
|
3(i)-
|
Articles
of Incorporation of Registrant, as amended. (Incorporated by reference to
Exhibit 3(i) of Registrant’s proxy statement on Schedule 14-A, SEC File
No. 0-17706, filed with the Commission on April 15,
2005.)
|
|
|
3(ii)-
|
By-laws
of Registrant, as amended. (Incorporated by reference to Exhibit 3(ii) of
Registrant’s Current Report on Form8-K, SEC File No. 0-17706, filed with
the Commission on January 23, 2006.)
|
|
|
10.1-
|
Employment
Agreement between the Registrant and Thomas J. Bisko. (Incorporated by
reference to Exhibit 10.1 of Registrant’s Quarterly Report on Form 10-Q,
SEC File No. 0-17706, filed with the Commission on November 15,
2004.)
|
|
|
10.2-
|
Salary
Continuation Agreement between the Registrant and Thomas J. Bisko.
(Incorporated by reference to Exhibit10.2 of Registrant’s Quarterly Report
on Form 10-Q, SEC File No. 0-17706, filed with the Commission on November
15, 2004.)
|
|
|
10.3-
|
QNB
Corp. 1998 Stock Incentive Plan. (Incorporated by reference to Exhibit 4.3
to Registration Statement No. 333-91201 on Form S-8, filed with the
Commission on November 18, 1999.)
|
|
|
10.4-
|
The
Quakertown National Bank Retirement Savings Plan. (Incorporated by
reference to Exhibit 10.4 of Registrants Quarterly Report on Form 10-Q,
SEC File No. 0-17706, filed with the Commission on August 14,
2003)
|
|
|
10.5-
|
Change
of Control Agreement between Registrant and Robert C. Werner.
(Incorporated by reference to Exhibit 10.5 of Registrant’s Quarterly
Report on Form 10-Q, SEC File No. 0-17706, filed with the Commission on
November 8, 2005.)
|
|
|
10.6-
|
Change
of Control Agreement between Registrant and Bret H. Krevolin.
(Incorporated by reference to Exhibit 10.6 of Registrant’sRegistrant’s
Quarterly Report on Form 10-Q, Registrant’s Quarterly Report on Form 10-Q,
SEC File No. 0-17706, filed with the Commission on November 8,
2005.)
|
|
|
10.7-
|
QNB
Corp. 2005 Stock Incentive Plan (Incorporated by reference to Exhibit 99.1
to Registration Statement No. 333-125998 on Form S-8, filed with the
Commission on June 21, 2005).
|
|
|
10.8-
|
QNB
Corp. 2006 Employee Stock Purchase Plan (Incorporated by reference to
Exhibit 99.1 to Registration Statement No.
333 135408 on
Form S-8, filed with the Commission on June 28, 2006).
|
|
|
10.9-
|
Separation
Agreement between Registrant and Robert C. Werner (Incorporated by
reference to Exhibit 10.1 of Registrant’s Current Report on Form 8-K, SEC
File No. 0-17706, filed with the Commission on December 23,
2009.)
|
|
|
14-
|
Registrant’s
Code of Ethics. (Incorporated by reference to Exhibit 14 of Registrant’s
Annual Report Form 10-K, SEC File No. 0-17706, filed with the Commission
on March 30, 2004.)
|
|
|
21-
|
Subsidiaries
of the Registrant.
|
|
|
23.1-
|
Consent
of Independent Registered Public Accounting Firm
|
|
|
31.1-
|
Section
302 Certification of the President and CEO.
|
|
|
31.2-
|
Section
302 Certification of the Chief Financial Officer.
|
|
|
32.1-
|
Section
906 Certification of the President and CEO.
|
|
|
32.2-
|
Section
906 Certification of the Chief Financial
Officer.
|
84