Attached files
| file | filename |
|---|---|
| EX-99.1 - EX-99.1 - TIER REIT INC | a10-7507_1ex99d1.htm |
| 8-K - CURRENT REPORT OF MATERIAL EVENTS OR CORPORATE CHANGES - TIER REIT INC | a10-7507_18k.htm |
Exhibit 99.2
|
|
Behringer Harvard REIT I, Inc. 10 & 120 South Riverside Plaza, Chicago, Illinois 2009 Fourth Quarter Update–April 2010 |

|
|
Forward-Looking Statements This presentation contains forward-looking statements, including discussion and analysis of the financial condition of us and our subsidiaries and other matters. These forward-looking statements are not historical facts but are the intent, belief or current expectations of our management based on their knowledge and understanding of our business and industry. Words such as “may,” “anticipates,” “expects,” “intends,” “plans,” “believes,” “seeks,” “estimates,” “would,” “could,” “should” and variations of these words and similar expressions are intended to identify forward-looking statements. We intend that such forward-looking statements be subject to the safe harbor provisions created by Section 27A of the Securities Act of 1933 and Section 21E of the Securities Exchange Act of 1934. These statements are not guarantees of future performance and are subject to risks, uncertainties and other factors, some of which are beyond our control, are difficult to predict and could cause actual results to differ materially from those expressed or forecasted in the forward-looking statements. Forward-looking statements that were true at the time made may ultimately prove to be incorrect or false. We caution you not to place undue reliance on forward-looking statements, which reflect our management’s view only as of the date of this presentation. We undertake no obligation to update or revise forward-looking statements to reflect changed assumptions, the occurrence of unanticipated events or changes to future operating results. (continued on next slide) |

|
|
Forward-Looking Statements (cont’d.) Factors that could cause actual results to differ materially from any forward-looking statements made in the presentation include but are not limited to: market and economic challenges experienced by the U.S. economy or real estate industry as a whole and the local economic conditions in the markets in which our properties are located; the inability of tenants to continue paying their rent obligations due to bankruptcy, insolvency or a general downturn in their business; the availability of cash flow from operating activities for distributions and capital expenditures; a decrease in the level of participation under our distribution reinvestment plan; our level of debt and the terms and limitations imposed on us by our debt agreements; the availability of credit generally, and any failure to refinance or extend our debt as it comes due or a failure to satisfy the conditions and requirements of that debt; future increases in interest rates; the need to invest additional equity in connection with debt refinancing as a result of reduced asset values and requirements to reduce overall leverage; our ability to raise capital in the future by issuing additional equity or debt securities, selling our assets or otherwise; impairment charges; our ability to retain our executive officers and other key personnel of our advisor, our property manager and their affiliates; conflicts of interest arising out of our relationships with our advisor and its affiliates; changes in the level of financial assistance or support provided by our sponsor or its affiliates; unfavorable changes in laws or regulations impacting our business or our assets; and factors that could affect our ability to qualify as a real estate investment trust. The forward-looking statements should be read in light of these and other risk factors identified in the “Risk Factors” section of our Annual Report on Form 10-K for the year ended December 31, 2009 as filed with the Securities and Exchange Commission. |

|
|
Questions? During the call, please e-mail questions to: bhreit@behringerharvard.com |

|
|
Presenters Bob Aisner Chief Executive Officer and President Michael Ernst Chief Financial Officer and Treasurer Scott Fordham Chief Accounting Officer One BriarLake Plaza, Houston, TX |

|
|
Behringer Harvard REIT I, Inc. As of December 31, 2009: 72 operating office properties One non-operating office property 25.7 million square feet 33 markets 222 S. Riverside Plaza Chicago, IL Bank of America Plaza Charlotte, NC Three Eldridge Place Houston, TX |

|
|
10 Largest Markets–by Percent of NOI 24.2% 11.4% 10.6% 3.5% 3.5% 3.5% 2.8% 0% 5% 10% 15% 20% 25% Chicago Houston Philadelphia Charlotte Dallas/Fort Worth Minneapolis/ St. Paul Washington, D.C. Baltimore As of December 31, 2009 Percent of NOI 3.4% Atlanta 4.8% Austin 3.5% |

|
|
10 Largest Markets–by Percent of Square Footage As of December 31, 2009 17.3% 13.8% 12.2% 5.5% 5.3% 4.8% 4.4% 3.9% 3.5% 3.0% 0% 5% 10% 15% Chicago Philadelphia Houston Dallas/Ft. Worth Atlanta Louisville Minneapolis/St. Paul Cleveland Charlotte New Orleans Percent of Square Footage 20% |

|
|
Significant Tenants The above table sets forth a schedule of the company’s 20 largest tenants, including their subsidiaries, based upon annualized contractual base rents as of December 31, 2009. Annualized base rental revenue is based on actual December 2009 billings times 12. As annualized base rental revenue is not derived from the historical GAAP results, historical results may differ from those set forth above. Tenants GSA 25,352 $ 6% 1,088 5% AAA / Aaa Bank of America 14,541 3% 731 3% A / A2 Fifth Third Bank 8,231 2% 412 2% BBB / Baa1 Nokia, Inc. 6,967 2% 270 1% A / A2 EDS Information Services LLC 5,287 1% 243 1% A / A2 Rambus, Inc. 4,917 1% 97 0% N/A / N/A J. Ray McDermott, Inc. 4,653 1% 190 1% BB+ / Ba2 Cirrus Logic, Inc. 4,633 1% 197 1% B / N/A Lawson Software 4,491 1% 308 1% N/A / N/A CDW Corporation 4,481 1% 290 1% B - / B3 KeyBank 4,263 1% 202 1% BBB+ / Baa1 Disney Enterprises, Inc. 4,136 1% 115 1% A / A2 Duane Morris LLP 3,984 1% 257 1% N/A / N/A Waste Management, Inc. 3,942 1% 185 1% BBB / Baa3 Litton Loan Servicing LP 3,860 1% 199 1% A / A1 RSUI Group, Inc. 3,832 1% 134 1% N/A / Baa2 The Children's Hospital of Philadelphia 3,739 1% 193 1% N/A / N/A Goldman Sachs 3,702 1% 150 1% A / A1 Allstate Insurance Co. 3,583 1% 181 1% A - / A3 excelleRX, Inc. 3,367 1% 141 1% BB / B1 Total 121,961 $ 28% 5,581 26% Total Company 441,023 $ 21,791 Credit Ratings S&P/Moody's Annualized Base Rental Revenue Percentage of Company Annualized Base Rental Revenue Square Feet Leased Percentage of Company Leased Sq. Ft. |

|
|
Industry Diversification The above table lists the company's 20 industry classifications based on annualized contractual base rent of the operating properties. The company's tenants are classified according to the North American Industrial Classification System (NAICS). Annualized base rental revenue is based on actual billings at December 2009 times 12. As annualized base rental revenue is not derived from historical GAAP results, historical results may differ from those set forth above. Industry Classification Professional, Scientific, and Technical Services 127,692 $ 29% 6,371 29% Finance and Insurance 118,792 27% 5,843 27% Public Administration 34,631 8% 1,554 7% Manufacturing 24,427 6% 974 4% Information 21,073 5% 1,029 5% Health Care and Social Assistance 20,161 5% 1,046 5% Administrative, Support, and Waste Management 19,561 4% 907 4% Real Estate, Rental, and Leasing 10,711 2% 609 3% Other Services (except Public Administration) 10,287 2% 310 1% Mining 9,145 2% 433 2% Retail Trade 7,675 2% 821 4% Utilities 6,454 1% 326 1% Construction 6,201 1% 261 1% Accommodation and Food Services 6,154 1% 307 1% Educational Services 5,209 1% 255 1% Wholesale Trade 4,611 1% 215 1% Transportation and Warehousing 3,435 1% 158 1% Arts, Entertainment, and Recreation 2,699 1% 209 1% Management of Companies and Enterprises 1,294 0% 13 0% Agriculture, Forestry, Fishing, and Hunting 188 0% 9 0% Other or N/A 623 0% 141 1% Total: 441,023 $ 100% 21,791 100% % of Company Annualized Base Rental Revenue % of Total Company Leased Sq. Ft. Annualized Base Rental Revenue Square Feet Leased |

|
|
Property Locations Note: many marked areas have multiple assets in that location |

|
|
Market Overview Mixed economic signals GDP grew 2.2% in Q3 ‘09 and 5.6% in Q4 ‘09 Unemployment at 9.7% in Q4 ‘09 shows job growth still negative 8.4 million jobs lost since economic peak in 2007 Office vacancies continue to climb National vacancy rate at end of Q4 ’09 at 17.5% as reported by CBRE PPR 54 markets recorded Q4 vacancy rate of 19.7% Vacancy rates have climbed for nine consecutive quarters and should continue to climb through 2010 Renter’s market Rental rates fell 5.7% in 2009 and should fall another 7.8% in 2010 (PPR) Sublease space frequently offered at 25% - 35% discount to direct lease space |

|
|
Transaction Activity Loan Restructures Completed: Ashford Perimeter (Atlanta, GA) 1650 Arch (Philadelphia, PA) KeyBank Center (Cleveland, OH) Houston Galleria Office Mezzanine Loan We expect additional restructurings to close during the course of 2010 Asset Sales Completed: Royal Caribbean/DeVry University (Miramar, FL) Three assets currently listed for sale. May consider additional non-strategic asset sales |

|
|
Major Market Occupancy As of December 31, 2009 71.2% TOTAL 7% 88% 81% 2.8% Baltimore CBD (2%) 77% 79% 3.4% Atlanta Suburbs 6% 94% 88% 3.5% Washington D.C. CBD (7%) 75% 82% 3.5% Minneapolis/St. Paul Metro 4% 82% 78% 3.5% Dallas/Ft. Worth Metro 25% 98% 73% 3.5% Austin Suburbs 3% 95% 92% 4.8% Charlotte CBD 3% 89% 86% 10.6% Philadelphia CBD 3% 87% 84% 11.4% Houston Metro 4% 90% 86% 24.2% Chicago CBD 4% 86% 82% National Average BH Outperformance BH Market Occupancy NOI% |

|
|
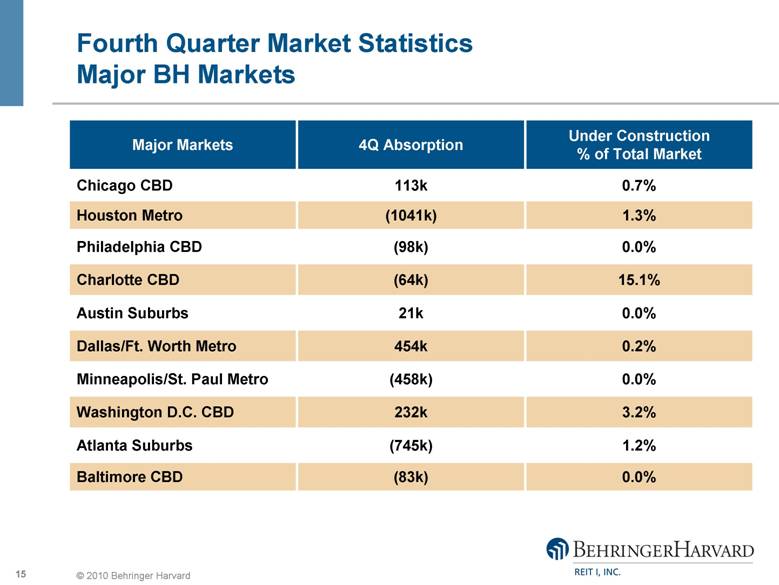
Fourth Quarter Market Statistics Major BH Markets 0.0% (83k) Baltimore CBD 1.2% (745k) Atlanta Suburbs 3.2% 232k Washington D.C. CBD 0.0% (458k) Minneapolis/St. Paul Metro 0.2% 454k Dallas/Ft. Worth Metro 0.0% 21k Austin Suburbs 15.1% (64k) Charlotte CBD 0.0% (98k) Philadelphia CBD 1.3% (1041k) Houston Metro 0.7% 113k Chicago CBD Under Construction % of Total Market 4Q Absorption Major Markets |
|
|
Leasing for 2010 March leasing pipeline shows good activity Signed letters of intent – 964,000 square feet (above average probability) Negotiating letters of intent – 900,000 square feet (average probability) Proposals out – 3,137,000 square feet (low probability) Lease expiration schedule is light for next four quarters, but overweighted in Q1 2010 Q1 ’10 – 784,000 square feet (3.1%) Q2 ’10 – 401,000 square feet (1.6%) Q3 ’10 – 406,000 square feet (1.6%) Q4 ’10 – 656,000 square feet (2.6%) Total – 2,248,000 square feet (8.9%) Occupancy likely to decline in Q1 2010 |

|
|
Lease Expirations Percentage of Total Square Feet 0% 2% 4% 6% 8% 10% 12% 8.9% 2010 11.5% 2011 9.1% 2012 10.5% 2013 9.5% 2014 As of December 31, 2009 |

|
|
Debt Maturities $59 $542 $70 $49 $73 $792 $1,105 $134 $150* $0 $200 $400 $600 $800 $1,000 $1,200 2010 2011* 2012 2013 2014 2015 2016 2017 $692 (in millions) As of December 31, 2009 *Assumes one-year extension of our credit facility |

|
|
Modified Funds from Operations MFFO for the fourth quarter 2009 was $0.09 per share consistent with MFFO reported in the third quarter 2009 MFFO for the fourth quarter 2009 exceeded expectations by $0.01 primarily as a result of an increase in lease termination fee income and lower real estate tax expenses MFFO for 2009 totaled $101.6 million, or $0.35 per share, down from $132.9 million, or $0.55 per share, for 2008 |

|
|
Fourth Quarter 2009 – Leasing Activity Portfolio occupancy remained flat at 86% 586,000 square feet of leases expired 592,000 square feet of executed leases Average new net rent was 7% lower than expiring rent 57% of square footage renewed 60% of tenants renewed |

|
|
Fourth Quarter 2009 – Leasing Cost Analysis 592,000 square feet of executed leases Renewals 334,000 square feet $4.41 per square foot in tenant improvement and commission costs 2.5 year average term Expansions 26,000 square feet $12.67 per square foot in tenant improvement and commission costs 4.1 year average term New leases 232,000 square feet $59.99 per square foot in tenant improvement and commission costs 9.4 year average term |

|
|
Same Store Results Fourth Quarter 2009 versus Fourth Quarter 2008 Same store cash NOI for the fourth quarter 2009 was down $4.6 million, or 6.5% from the fourth quarter 2008 Same store occupancy declined approximately 4% from December 31, 2008, to December 31, 2009 The decrease in cash NOI was primarily attributable to the lower portfolio occupancy and the increase in bad debt expense, partially offset by rental rate growth from in-place leases and a decrease in real estate tax expenses $1.2 million of the decline was attributable to an increase in bad debt expense, some of which may ultimately prove to be collectible |

|
|
Same Store Results Twelve Months 2009 versus Twelve Months 2008 Same store cash NOI for the 12 months ended December 31, 2009 was down $10.6 million, or 4.0%, when compared to the 12 months ended December 31, 2008 The decrease in cash NOI was primarily attributable to the lower portfolio occupancy and the increase in bad debt expense, partially offset by rental rate growth from in-place leases $4.7 million of the decline was attributable to an increase in bad debt expense, some of which may ultimately prove to be collectible |

|
|
Same Store Results Fourth Quarter 2009 versus Third Quarter 2009 Same store cash NOI for the fourth quarter 2009 decreased $2.8 million, or 4.1% from the third quarter 2009 The decrease when comparing the fourth quarter to the third quarter of 2009 was primarily attributable to higher property operating expenses, and the increase in the bad debt expense, partially offset by lower real estate tax expenses $1.5 million of the decline was attributable to an increase in bad debt expense, some of which may ultimately prove to be collectible |

|
|
Potential Sources of Cash Consideration of reduction of distributions and redemptions Asset sales Joint ventures Continued waiver of asset management fees Debt restructurings Operational savings |

|
|
Behringer Harvard REIT I, Inc. 250 West Pratt Baltimore, MD Resurgens Plaza Atlanta, GA Ashford Perimeter Atlanta, GA 500 East Pratt Street Baltimore, MD 1650 Arch Street Philadelphia, PA One Oxmoor Place Louisville, KY One BriarLake Plaza Houston, TX The Wanamaker Building Philadelphia, PA One Financial Place Chicago, IL Westway One Houston, TX Bank of America Plaza Charlotte, NC One & Two Eldridge Place Houston, TX United Plaza Philadelphia, PA Three Parkway Philadelphia, PA Energy Centre New Orleans, LA |

|
|
Questions? Please e-mail questions to: bhreit@behringerharvard.com |
