Attached files
Table of Contents
UNITED STATES
SECURITIES AND EXCHANGE COMMISSION
WASHINGTON, D.C. 20549
FORM 10-K
(Mark one)
| x | ANNUAL REPORT PURSUANT TO SECTION 13 OR 15(d) OF THE SECURITIES EXCHANGE ACT OF 1934 |
For the fiscal year ended December 31, 2009
or
| ¨ | TRANSITION REPORT PURSUANT TO SECTION 13 OR 15(d) OF THE SECURITIES EXCHANGE ACT OF 1934 |
For the transition period from to
Commission file number: 000-20997
SRI/SURGICAL EXPRESS, INC.
(Exact Name of Registrant as Specified in Its Charter)
| Florida | 59-3252632 | |
| (State or other jurisdiction of incorporation or organization) |
(I.R.S. Employer Identification No.) | |
| 12425 Race Track Road Tampa, Florida |
33626 | |
| (Address of principal executive offices) | (Zip Code) | |
Registrant’s telephone number, including area code:
(813) 891-9550
Securities registered pursuant to Section 12(b) of the Act:
| Title of each class |
Name of each exchange on which registered | |
| Common Stock, par value $.001 | The NASDAQ Stock Market LLC |
Securities registered pursuant to Section 12(g) of the Act:
None
Indicate by check mark if the registrant is a well-known seasoned issuer, as defined in Rule 405 of the Securities Act. Yes ¨ No x
Indicate by check mark if the registrant is not required to file reports pursuant to Section 13 or 15(d) of the Act. Yes ¨ No x
Indicate by check mark whether the registrant (1) has filed all reports required to be filed by Section 13 or 15(d) of the Securities Exchange Act of 1934 during the preceding 12 months (or for such shorter period that the registrant was required to file such reports), and (2) has been subject to such filing requirements for the past 90 days. Yes x No ¨
Indicate by check mark if disclosure of delinquent filers pursuant to Item 405 of Regulation S-K is not contained herein, and will not be contained, to the best of registrant’s knowledge, in definitive proxy or information statements incorporated by reference in Part III of this Form 10-K or any amendment to this Form 10-K. ¨
Indicate by check mark whether the registrant has submitted electronically and posted on its corporate Website, if any, every Interactive Data File required to be submitted and posted pursuant to Rule 405 of Regulation S-T during the preceding 12 months (or shorter period that the registrant was required to submit and post such files). Yes ¨ No ¨
Indicate by check mark whether the registrant is a large accelerated filer, an accelerated filer, a non-accelerated filer, or a smaller reporting company. See definitions of “large accelerated filer,” “accelerated filer” and “smaller reporting company “ in Rule 12b-2 of the Exchange Act.
Large accelerated filer ¨ Accelerated filer ¨ Non-accelerated filer ¨ Small reporting company x
Indicate by check mark whether the registrant is a shell company (as defined in Rule 12b-2 of the Exchange Act). Yes ¨ No x
The aggregate market value of the voting common stock held by non-affiliates of the registrant, based on the closing sale price of the common stock on June 30, 2009, as reported on the NASDAQ Global Market, was approximately $7,645,000. For purposes of this determination, the registrant excluded shares of common stock known to be held by officers, directors, and 10% shareholders, because those persons might be deemed affiliates. This determination of affiliate status is not necessarily conclusive for other purposes.
The registrant had 6,485,978 shares of common stock outstanding as of February 26, 2010.
DOCUMENTS INCORPORATED BY REFERENCE
List hereunder the following documents if incorporated by reference and the Part of the Form 10-K (e.g., Part I, Part II, etc.) into which the document is incorporated.
Portions of the Proxy Statement for the registrant’s 2010 Annual Meeting of Shareholders are incorporated by reference into Part III of this Annual Report on Form 10-K.
Table of Contents
FORM 10-K
YEAR ENDED DECEMBER 31, 2009
| Section |
Page | |||
| PART I |
||||
| Item 1. |
1 | |||
| Item 1A. |
8 | |||
| Item 1B. |
10 | |||
| Item 2. |
10 | |||
| Item 3. |
12 | |||
| Item 4. |
12 | |||
| PART II |
||||
| Item 5. |
13 | |||
| Item 6. |
14 | |||
| Item 7. |
Management’s Discussion and Analysis of Financial Condition and Results of Operations |
15 | ||
| Item 7A. |
24 | |||
| Item 8. |
25 | |||
| Item 9. |
Changes in and Disagreements With Accountants On Accounting and Financial Disclosure |
48 | ||
| Item 9A(T). |
48 | |||
| Item 9B. |
49 | |||
| PART III |
||||
| Item 10. |
50 | |||
| Item 11. |
50 | |||
| Item 12. |
Security Ownership of Certain Beneficial Owners and Management and Related Stockholder Matters |
50 | ||
| Item 13. |
Certain Relationships and Related Transactions, and Director Independence |
50 | ||
| Item 14. |
50 | |||
| PART IV |
||||
| Item 15. |
51 | |||
| 55 | ||||
Table of Contents
PART I
| Item 1. | Business |
This Annual Report on Form 10-K, other documents that we publicly disseminate, and oral statements that are made on our behalf might contain both statements of historical fact and forward-looking statements. These forward-looking statements do not guarantee future performance, and our actual results could differ materially from those indicated by the forward-looking statements. Examples of forward-looking statements include: (i) projections of our revenue, earnings, capital structure, and other financial items, (ii) statements of our plans and objectives, (iii) statements of our expected future economic performance, and (iv) assumptions underlying our statements regarding SRI/Surgical Express, Inc. and our business. Among the factors that could cause or contribute to differences are those discussed below under the section entitled “Risk Factors”. We do not undertake to update our forward-looking statements.
The Company
SRI Surgical Express, Inc. (“SRI Surgical”, the “Company”, “we”, “us” or “our”) is a supplier and reprocessor of reusable surgical linen and instrumentation. Our slogan, Environmental Solutions, Delivered Daily® reflects SRI Surgical’s commitment to provide our healthcare clients with high quality reusable products, and the opportunity to reduce waste in the Operating Room (“OR”). Reducing waste in the OR begins with purchasing the appropriate reusable products that meet the needs of the clinical user, and minimize the use of disposable products in the surgical environment. We believe our reusable surgical gowns, drapes, table covers, towels, and instruments provide the opportunity for waste avoidance and environmental sustainability in the surgical arena. We start with products that have been manufactured specifically to be reusable and to be reprocessed. Our products are not single use products that are reprocessed for economic benefit.
SRI Surgical has ten reprocessing facilities that are regionally located across the United States. These facilities adhere to the standards of the United States Food and Drug Administration (“FDA”) regulated medical device manufacturing environment. We guarantee that our surgical linens will always be 100% inspected, repaired when necessary, and sterilized properly. No other company in the industry provides this type of service for their reusable surgical products.
SRI Surgical has a history of commitment to the environment. As well as providing our healthcare clients with environmentally friendly surgical linens and instruments, we have a demonstrated commitment to waste reduction in the communities that we serve, both as a healthcare service provider and a corporate citizen. SRI Surgical is a Charter Member of Practice Greenhealth, a networking organization for institutions in the healthcare community that have made a commitment to sustainable, eco-friendly practices. During 2009, we were awarded with Practice Greenhealth’s Champion for Change Award, which recognizes organizations that demonstrate successful accomplishments in ‘greening’ their organization as well as assisting healthcare clients in improving their environmental performance. SRI Surgical is also an EPA WasteWise Partner. The EPA WasteWise program targets the reduction of waste in the business environment. In 2009, we received the EPA’s Champion Award in the Design for the Environment Program’s Safer Detergents Stewardship Initiative (“SDSI”). In addition, SRI Surgical is also a member of the EPA’s Climate Leaders, a consortium of small business leaders that are measuring their greenhouse gas emissions and setting and achieving goals to reduce them. We are also a member of the EPA’s SmartWay program, which identifies products and services that reduce transportation-related emissions. During the year, we were recognized with the EPA’s Transport Award, which recognizes organizations that have made outstanding contributions to reducing climate change emissions and other air pollutants.
We also offer expert daily instrument processing at both our facilities (off-site) and our customers’ facilities (on-site). This innovative service provides customized, high-quality surgical instrument sets on a per-procedure fee basis. Sets processed at our FDA-regulated facilities have a consistently high level of quality built into every
1
Table of Contents
set. After each use, our highly trained instrument-processing technicians follow a thorough inspection and cleaning process to help ensure that the instruments are in proper working order. We ensure instrument availability and functionality, which offers our customers an opportunity to achieve high efficiency levels. In addition, we manage the instrumentation and supply chain of hospitals, surgery centers and operating rooms and their central sterilization facilities. In this setting, by using our expertise in implementing and managing FDA-regulated instrument processing facilities, we can deliver desired quality and performance levels that our customers seek.
Our integrated “closed-loop” process starts with daily delivery of reusable and disposable surgical supplies and instruments to healthcare providers. After use, we pick up the reusable textiles, basins, and instruments used in surgery and return them to our processing facilities. Used products arriving at our processing facilities are sorted, cleaned, inspected, packaged, sterilized, and shipped back to the healthcare providers. This “closed-loop” system eliminates the need for healthcare providers to stock on-hand inventory and greatly simplifies our customers’ surgical supply chain process. This process also allows healthcare providers to reduce medical waste disposal costs and increase the quality of products used by their staff and physicians. Additionally, with our daily just-in-time delivery model, our customers’ working capital requirements are favorably affected by their ability to carry less on-hand inventory of disposable products to support their surgical procedures.
We are well positioned to help healthcare providers reduce operating costs while improving the quality of care, so that they can respond to pressures created by the continued growth of managed care and reductions in procedure reimbursement. To reduce operating costs, we offer comprehensive procedure bundling solutions and outsourcing of surgical instrument processing. By providing surgical instruments of superior functionality and bundling solutions that allow surgical staff to shift focus from supply management to patient management, we help our customers significantly reduce operating and capital costs, increase revenue, and improve the quality of patient care.
We recently entered into a three-year reusable surgical products agreement with KP Select, Inc. the purchasing agent for the Kaiser Permanente Healthcare System (“Kaiser Permanente”). This agreement is effective March 1, 2010 and gives us the ability to contract with any Kaiser Permanente hospital for whom KP Select provides services and designates KP Select as their purchasing agent. Kaiser Permanente is a 48-hospital system located in the states of California, Ohio, Maryland, Oregon and Washington, and other states. This agreement allows us to assist Kaiser Permanente with their environmental awareness initiative, but does not commit Kaiser Permanente or its member hospitals to purchase any minimum quantity of products or services from us. We believe this agreement is a key element in our strategic growth initiatives.
On November 26, 2008, we entered into a five-year Supply and Co-Marketing Agreement (the “Co-Marketing Agreement”) with Cardinal Health 200, Inc. (“Cardinal” or “Cardinal Health”), an affiliate of Cardinal Health, Inc. Under the terms of the Co-Marketing Agreement, Cardinal is our exclusive supplier of disposable surgical packs, and provides for a new product offering, the Hybrid Preference Pack™, in which we combine our reusable surgical packs with Cardinal Health’s disposable surgical packs. We share profits from sales of the Hybrid Preference Pack™ based on an agreed-upon margin split. This new product couples the convenience of disposables with the waste-wise benefits of our reusable products. This environmentally friendly solution reduces packaging and medical waste, saves water and energy consumption, reduces chemical usage and provides just-in-time delivery and retrieval. In addition, the Co-Marketing Agreement appoints Cardinal the exclusive provider of our complete line of more than 400 disposable surgical kits.
The Co-Marketing Agreement allows us to focus on our strengths: reusable surgical products, instrumentation and management of central sterilization and supply chain activities. The Co-Marketing Agreement gives our environmentally friendly solution greater reach and visibility throughout the healthcare market. It brings together the strengths of two organizations that are market leaders in their segments for a more efficient and effective delivery of healthcare solutions.
2
Table of Contents
On February 3, 2010, SRI and Cardinal entered into an Amended and Restated Supply and Co-Marketing Agreement (the “Amended and Restated Supply Agreement”). We previously received disposable component products included in the Hybrid Preference Packs from Cardinal Health on a consignment basis and shared profits with Cardinal based on an agreed margin split from revenue actually received from sales of Hybrid Preference Packs. The Amended and Restated Supply Agreement provides, among other things, that we purchase from Cardinal Health the disposable component products included in the Hybrid Preference Packs instead of receiving them on a consignment basis. In addition, under the Amended and Restated Supply Agreement, we pay Cardinal Health for such components a fixed percentage of the price we charge our customers for such components. This amount payable to Cardinal Health under the Amended and Restated Supply Agreement will be reconciled quarterly to an agreed margin split based on revenue actually billed to Hybrid Preference Pack customers instead of revenue actually received from such customers. The term of the Co-Marketing Agreement remains unchanged.
Effective June 2009, we entered into a four-year national brand distribution agreement with Cardinal Health’s medical and surgical supply chain business. This agreement appoints Cardinal a non-exclusive, authorized distributor of our products. Cardinal Health includes our products on its master merchandise file and our products will be categorized as national brand. This agreement expands upon our current supply and co-marketing relationship with Cardinal Health’s Presource surgical kitting business and gives us access to a national distribution network that currently serves the Federal government as well as other healthcare providers not currently using our reusable product offering.
We closed our disposable products assembly facility in Plant City, Florida in January 2009. The cost of closing the assembly operations, which was substantially completed by the end of March 2009, was approximately $485,000. The costs that were incurred as part of the closure include, but are not limited to, retention, severance and rent expense. A payment from Cardinal under the Co-Marketing Agreement was used to offset these costs.
We maintain an internet website located at www.srisurgical.com. On our website we make available, free of charge, our Annual Reports on Form 10-K, Quarterly Reports on Form 10-Q, Current Reports on Form 8-K, and any amendments to those reports filed or furnished to the Securities and Exchange Commission (“SEC”). This information is made available as soon as reasonably practicable after we electronically file with or furnish it to the SEC. Our Code of Ethics and Corporate Compliance Policies are also posted on our website. Information contained on our website, whether currently posted or posted in the future, is not part of this document or any documents incorporated by reference in this document.
Market
Since our introduction in the early 1990’s of reusable surgical gowns and drapes of exceptional quality for healthcare providers’ use, we have added custom disposable surgical packs to our product offering. In recent years, we have supplied and reprocessed high quality surgical instruments for our customers. Our ability to offer reusable surgical gowns and drapes, custom disposable surgical packs and reusable surgical instruments enables us to supply most everything our customers require for surgical procedures.
According to the American Hospital Association and Verispan, a healthcare consulting organization, the United States healthcare market includes approximately 5,800 acute care hospitals and 5,000 freestanding surgery centers.
The following market conditions and strategies provide continuing opportunities for us:
Continued Pressure on Providers to Contain Costs and Improve Profitability. With growth of managed care and a decrease in surgical service reimbursements, economic constraints require providers to continually increase their efficiency. To assist them in reducing their cost of operation, we offer products and services that help our customers eliminate inventory, reduce staff, capital expenditures and medical waste, and improve their overall supply chain efficiency.
3
Table of Contents
Increased Outsourcing of Provider Functions That Do Not Involve Patient Care. Providers with significant staff, capital and space dedicated to in-house processing of reusable surgical products and surgical instruments are outsourcing these functions to qualified outsourcing providers. By enabling our customers to outsource non-core functions, we allow them to increasingly focus on patient care.
Concern Regarding the Transmission of Infectious Diseases. The healthcare industry must manage the risk of infectious disease. These concerns increase the need for surgical barrier fabrics that protect surgeons and surgical staff from bloodborne pathogens. Industry response to these concerns led to the promulgation of the Association for the Advancement of Medical Instrumentation (“AAMI”) PB70 standard which establishes levels I, II, III and IV indicating increasing barrier protection. Using this standard as a guideline the FDA mandates that any company that markets their products according to the AAMI PB70 standard is required to submit a 510(k) prior to marketing the various levels. Our line of GreenGown™ gowns helps to prevent liquid and viral strike-through in critical areas during surgical procedures and is approved by the FDA for appropriate barrier labeling. Additionally, our FDA-regulated processes for decontamination and reprocessing of surgical instrumentation enable healthcare providers to better manage the risk of transmission of infectious diseases.
Concern Regarding the Handling and Disposal of Biohazardous Waste. The disposal of large volumes of infectious and hazardous waste generated by the healthcare industry continues to attract increased public awareness. Healthcare providers are under pressure to reduce their generation of biohazardous waste because of restrictions on incineration and limited access to dump sites. This market dynamic offers an advantage to companies that provide outsourced reusable alternatives to disposable surgical products.
Leverage Infrastructure with Increased Penetration in Markets. Our existing facilities combined currently have significant available capacity to access more of the national market. Distribution expansion, if prudently executed, could provide opportunity for business growth with incremental capital investment.
Activities by Hospitals, Hospital Groups and the Federal Government to Become Better Stewards of the Environment and to Create Facilities that Practice Environmental Sustainability. Increasing governmental pressure and public awareness are driving healthcare institutions, including government run institutions, to develop plans and implement policies to control their impact upon the communities in which they reside. The realization that the healthcare industry ranks second only to the food industry in waste generation is fueling increased interest in methods to control and eliminate waste through more aggressive efforts to reduce, reuse, and recycle. Through its Green Procurement Strategy (“DoD GPP”) the U.S. Department of Defense is implementing an agency-wide green procurement program designed to reduce resource consumption and solid waste generation. Green procurement includes, among other things, the acquisition of environmentally preferable products and services. Our reusable products are ideally suited to enable these institutions to respond aggressively by reducing waste through reuse of their surgical linens and basin sets. Additionally, our agreement with Cardinal’s distribution group allows us to reach more healthcare facilities that currently do not utilize our reusable product offering, including healthcare facilities operated by the U.S. Government. As part of that agreement, our products are listed on the Department of Defense’s distribution and pricing agreement (more commonly known as the “DAPA” list). Getting our products included on the DAPA list was a key initiative of ours in 2009. Having our products included on the DAPA list, through the agreement with Cardinal, allows government operated hospitals the ability to purchase our products.
4
Table of Contents
Customers
As of December 31, 2009, we served a customer base of approximately 425 hospitals and surgery centers located throughout the United States. Our strategy is to further expand upon the supply chain management needs of our current customer base, and grow our customer base by focusing on hospitals and surgery centers that are surgical procedure intensive.
We maintain short-term agreements to supply several group purchasing organizations (“GPOs”), including Novation, LLC, HealthTrust Purchasing Group, L.P., MedAssets, Inc., Broadlane, Inc. (for Tenet Healthcare Corporation or “Tenet”), Intermountain Health Services, Inc., Premier Purchasing Partners, L.P., and Hospital Corporation of America. Novation is the supply company for Voluntary Hospitals of America, Inc. and University Health System Consortium. HealthTrust Purchasing is a GPO representing over 1,400 hospitals and surgery centers. MedAssets is the largest independent healthcare purchasing group in the United States. Tenet owns and operates 55 acute care hospitals in 12 states. Intermountain Health Services, Inc. is a healthcare purchasing group that services 24 hospitals. Premier has more than 2,300 member hospitals and 64,000 other healthcare sites. Hospital Corporation of America represents 163 hospitals in 20 states. Through these relationships our products and services are potentially available to the vast majority of providers and surgery centers in our service areas. We continue to pursue additional GPO contracts that would allow us opportunities to further penetrate the healthcare market.
Products
Our principal reusable surgical products are GreenGown™ surgical gowns. We also offer reusable towels, surgical drapes, and stainless steel basin sets as part of our reusable surgical product line. We provide these products in a variety of configurations for a provider’s specific needs. A major benefit of our reusable system is reduced medical waste because of the elimination of disposable, single-use products.
Our GreenGown™ Premium Liquid Resistant Level III and Liquid Proof Level IV gowns are made of some of the most technologically advanced materials available, providing users with a highly breathable gown and excellent protection. This added protection is critical to healthcare providers given the continuing concerns of doctors, staff, and regulatory authorities regarding transmission of bloodborne pathogens, including HIV and hepatitis viruses. The Premium Liquid Resistant and Liquid Proof gowns are ideal for procedures with high bodily fluid volume and of longer duration. Our Standard Level II gown is made from an advanced micro-fiber polyester liquid resistant fabric, ensuring a high degree of comfort to the user, and is a cost-effective alternative to higher priced gowns. We believe this gown is ideal for procedures with minimal fluid exposure and of shorter duration. In November 2008, we obtained FDA 510(k) clearance to market our Level III and Level IV surgical gowns and our Level IV surgical drape, which is intended for use in healthcare facilities, as they are in compliance with AAMI PB70 standard. In May 2009, we obtained FDA 510(k) clearance to market our Level II surgical gowns, which is intended for use in healthcare facilities, as they are in compliance with AAMI PB70 standard.
We utilize RFID technology in our ten processing facilities. RFID technology is a method for identifying and tracking objects based on the use of a small tag that stores a unique code. We utilize “multi-read” RFID tags in our reusable surgical gowns and drapes, which allow us to replace the use of labor-intensive bar code scanning to track product usage. This technology offers us improved inventory control and monitoring of product quality. SRI Surgical holds a patent covering this process.
We contract with third-party vendors for cutting and sewing of gowns and drapes. We had a procurement agreement with Standard Textile Co., Inc. (“Standard Textile”) as our supply source for our reusable surgical products, which expired in August 2008. We continue to work with Standard Textile on a month to month basis and are currently in discussions with Standard Textile regarding a new agreement. We are also utilizing a secondary supplier.
5
Table of Contents
To complement our reusable surgical products, we offer disposable packs containing single-use disposable products, such as gauze, needles, syringes, and tubing. These packs are developed to a customer’s specifications, and in combination with our reusable line of surgical products, offer a cost-effective, high-quality alternative to custom procedure packs containing all disposable products. As mentioned above, in November 2008 we signed the Co-Marketing Agreement with Cardinal (see “Item 1. Business – the Company”). Under this agreement, Cardinal is appointed our sole vendor of disposable surgical packs. In addition, this agreement provides for a new product offering known as the Hybrid Preference Pack™. The Hybrid Preference Pack™ combines our reusable products with Cardinal’s disposable surgical packs. This combined product responds to hospital and surgery center green initiatives by providing environmentally preferred purchasing options that maximize value and minimize waste.
Our instrument-processing program, called AccuSetSM, offers our customers the benefit of consistently available surgical instruments processed at an FDA-regulated facility. Our thorough cleaning and inspection process assures that surgical instruments are functional and meet rigorous quality standards. We offer general, laparoscopic, orthopedic, arthroscopic, ophthalmic, neurological, ENT (ear, nose and throat) and L&D (labor and delivery) instrument processing at our facilities. We have introduced an overnight instrument processing program, ReadyCaseSM OnDemand. The program makes available to hospitals and surgery centers additional processing capabilities at our FDA-regulated facilities should they find themselves in sudden need. As of December 31, 2009, we serviced instrument programs at 77 hospitals.
We offer instruments as part of the AccuSetSM program pursuant to a Joint Marketing Agreement with Aesculap, Inc. (“Aesculap”), one of the oldest and largest worldwide suppliers of surgical instruments. In March 2003, we signed a 10-year Joint Marketing Agreement with Aesculap whereby Aesculap provides most of the surgical instruments our customers use in their procedures. Aesculap receives an agreed upon fee for each procedure based on the number and kinds of procedures performed with its instruments and the number and combination of instruments used for each procedure. We have also developed vendor relationships with many leading manufacturers of surgical instruments to procure instrumentation preferred by our customers and that Aesculap does not manufacture. These vendor relationships expand the range of solutions that we offer our customers. We expect our instrument-processing program will continue to grow and, as a result, we expect our instrument inventory will continue to grow.
ReadyCaseSM, our surgical supply and instrument delivery system, combines reusable products, disposable packs, surgical instruments, and physician preference items to provide most of the products required for a surgical procedure. The system allows our healthcare customers to develop and implement best practice protocols. We believe that ReadyCaseSM is the most complete case cart system available in the market. By delivering a high percentage of surgical products and instruments used in a procedure, ReadyCaseSM offers our customers the potential to reduce their supply chain management costs, improve their operational efficiency, and increase their revenue by improving throughput in their surgical area.
We also provide an outsource solution for our customers’ instrument processing and sterilization needs. Utilizing our expertise in managing FDA-regulated instrument processing facilities, we offer cost-effective management of hospital and surgery center instrumentation supply chain and central sterilization facilities.
Employees
As of December 31, 2009, we employed 834 people. Our employees are not covered by a collective bargaining agreement. We consider our employee relations to be good.
Competition
We compete primarily with sellers of disposable gowns, drapes, basins and custom packs. Our principal competitors are Cardinal Converters (a subsidiary of Cardinal Health, Inc.), Medline Industries, Inc., DeRoyal
6
Table of Contents
Industries, Inc., and Kimberly Clark Corporation. We also compete with third party instrument processors and the in-house processing capabilities of hospitals and surgery centers to provide surgical instruments and reusable products.
The challenging healthcare environment in recent years has led to increasingly intense competition among suppliers and manufacturers of surgical products. As providers seek to reduce operating costs in response to pressure from governments, insurance companies, and health maintenance organizations, suppliers and manufacturers are being forced to compete on price, service, quality and delivery of innovative solutions that improve the healthcare supply chain. Because we believe competitive pressure will continue to intensify for the foreseeable future, we must position SRI Surgical to effectively compete based on our high-quality service and innovative outsourcing solutions.
Regulation
Substantially all of our products and services are subject to extensive government regulation in the United States by federal, state, and local governmental agencies, including the FDA, the Department of Transportation (“DOT”), and the Occupational Safety and Health Administration (“OSHA”).
Our reusable products are regulated as medical devices by the FDA, which regulates the development, production, distribution, and promotion of medical devices in the United States. Various states in which we do business also regulate medical devices. Pursuant to the Federal Food, Drug and Cosmetics Act (the “FDA Act”), our medical devices are subject to general controls regarding FDA inspections of our facilities, current Good Manufacturing Practices (“cGMP’s”), the Quality System Regulations (“QSR”), labeling, maintenance of records, and medical device reporting with the FDA. To the extent required, we have obtained FDA pre-market approval of our devices under Section 510(k) of regulations issued under the Code of Federal Regulations (“CFR”), which provides for FDA approval on an expedited basis for products shown to be substantially equivalent to devices already cleared by the FDA and currently legally marketable in the United States. Products must be produced in establishments registered with the FDA and manufactured in accordance with the QSR, as defined under the FDA Act. In addition, our medical devices must be initially listed with the FDA, and our labeling and promotional activities are subject to scrutiny by the FDA and, in certain instances, by the Federal Trade Commission. The Medical Device Reporting regulation obligates us to provide information to the FDA on serious injuries or deaths alleged to have been associated with the use of a product or in connection with certain product failures that could have caused serious injury or death. If we fail to comply with the applicable provisions of the FDA Act, the FDA may institute proceedings to detain or seize products, impose fines, enjoin future company activities, impose product labeling restrictions, or enforce product recalls or withdrawals from the market.
We and our hospital customers also must comply with regulations of OSHA, including the blood borne pathogen standards requiring “standard (universal) precautions” which must be observed to minimize exposure to blood and other bodily fluids. To comply with these requirements, our employees wear appropriate personal protective equipment when handling soiled linens and materials in the facility’s decontamination area. Properly used, our products allow our hospital customers to protect their employees in compliance with the OSHA regulations. Additionally, we must comply with local regulations governing the discharge of water used in our operations. We use locally licensed contractors to dispose of any biohazardous waste generated by our customers and received by us and therefore do not need to obtain permits for biohazardous waste disposal. We must comply with DOT and OSHA regulations governing the transportation of biohazardous materials, which include containing and labeling waste as well as reporting various discharges. We comply with these regulations by confining soiled products inside marked liquid proof bags for transport within secured and appropriately labeled transfer carts. A third-party contractor provides sterilization of our disposable accessory packs. The use of ethylene oxide by the contractor in the sterilization of our disposable accessory packs is subject to regulation by FDA, OSHA, and the Environmental Protection Agency.
7
Table of Contents
In addition, other federal, state and local regulatory authorities, including those enforcing laws which relate to the environment, fire hazard control, and working conditions, have jurisdiction to take actions that could have a material adverse effect on us. We make expenditures from time to time to comply with environmental regulations, but do not expect to make any material capital expenditures for environmental compliance during 2010. However, current environmental estimates could be modified as a result of changes in our plans, legal requirements or other factors.
| Item 1A. | Risk Factors |
The cautionary statements set forth below, as well as factors described elsewhere in this Annual Report on Form 10-K and in other SEC filings, discuss important factors that could cause actual results to differ materially from any forward-looking statements. We assume no obligation to update these forward-looking statements.
We may need additional capital in the future, which might not be available. Our business is capital intensive and requires annual expenditures for additional surgical products. Should we need or otherwise decide to raise additional funds, we may not be able to obtain financing on favorable terms, if at all. If we cannot raise funds, if needed, on acceptable terms, we may not be able to develop or enhance our products, take advantage of future opportunities, respond to competitive pressures or unanticipated requirements or otherwise support our operations. See “Item 7. Management’s Discussion and Analysis of Financial Condition and Results of Operations – Liquidity and Capital Resources”.
Failure to comply with certain covenants in our credit facility could adversely affect our ability to conduct our business. As of December 31, 2009, we had $10.1 million outstanding and $7.1 million available for borrowings under our credit facility with our lender (the “Credit Facility”). The Credit Facility contains operating and financial covenants which restrict, among other things, our ability to pay dividends, incur more debt, make loans and investments, encumber our assets, enter into a new business, or enter into certain merger, consolidation, or liquidation transactions.
In addition, the Credit Facility requires us to maintain certain financial ratios, including a minimum tangible net worth requirement and a fixed charge coverage ratio. We did not satisfy the tangible net worth covenant as of December 31, 2009. Our lender waived the requirement as of December 31, 2009 and amended the covenant for future periods. There can be no assurance that our lender will issue a waiver or grant an amendment in future periods, if we require one.
Our ability to comply with these covenants and financial ratios may be affected by events beyond our control. A breach of any of the covenants in the Credit Facility could result in an event of default, which, if not cured or waived, could have a material adverse effect on us. In the event of any default under the Credit Facility, we may be restricted from accessing our revolving credit line and the payment of all outstanding borrowings under the Credit Facility could be accelerated, together with accrued and unpaid interest and other fees. See “Item 7. Management’s Discussion and Analysis of Financial Condition and Results of Operations – Liquidity and Capital Resources”.
Recent turmoil in the credit markets and financial services industry could negatively impact our business, results of operations, financial condition or liquidity. The credit markets and the financial services industry have been experiencing a period of unprecedented turmoil and upheaval characterized by the bankruptcy, failure, collapse or sale of various financial institutions, an unprecedented level of intervention from the United States federal government and other foreign governments and tighter availability of credit. While the ultimate outcome of these events cannot be predicted, they could have a negative impact on our liquidity and financial condition if our ability to borrow money to finance operations or obtain credit from creditors were to be impaired.
Bank of America, N.A. is our lender under the Credit Facility. If Bank of America is adversely affected by the conditions of the U.S. and international capital markets, it may become unable to fund borrowings under its
8
Table of Contents
credit commitments to us or otherwise fulfill its obligations under the Credit Facility, which could have a material and adverse impact on our financial condition and our ability to borrow additional funds, if needed, for working capital, capital expenditures and other corporate purposes.
Our future growth is dependent on the sales process and market acceptance of our products and services. Our future performance depends on our ability to maintain and increase revenues from new and existing customers. Our sales process to acquire new customers is typically extended in duration, because of industry factors such as the approval process in hospitals for purchases from new suppliers, the duration of existing supply contracts, and implementation delays pending termination of a hospital’s previous supply relationships. Our future performance also depends on the market accepting our product and service offerings, which emphasize the supply of reusable surgical products to a market that predominantly uses disposable products. We are also regularly developing new instrument processing programs. We are subject to a risk that the market will not broadly accept these product offerings, which would adversely affect our revenues and operating results.
The Supply and Co-Marketing Agreement with Cardinal may not be successful. We signed a five-year Co-Marketing Agreement, as amended, with an affiliate of Cardinal Health, Inc. See “Item 1. Business – The Company”. The Co-Marketing Agreement appoints Cardinal as our exclusive supplier of disposable products and provides for co-marketing of an environmentally friendly healthcare solution, the Hybrid Preference Pack™, a reusable and disposable products pack. The Co-Marketing Agreement requires us to make additional investments in personnel, equipment and programs. If our Hybrid Preference Pack™ initiative is not accepted by the marketplace, it would materially and adversely affect us.
We rely on key suppliers. We rely on Aesculap as our major source of supply of instruments for our instrument processing programs. Any failure of Aesculap to furnish instruments for any reason could materially and adversely affect our ability to service these programs until we secured one or more alternative suppliers. We had a procurement agreement with Standard Textile as our supply source for our reusable surgical products through August 2008. We are currently working with Standard Textile on a month-to-month basis until a new agreement can be reached. We are also utilizing a secondary supplier. If Standard Textile were unable to perform or if we are unable to reach an agreement with Standard Textile or another supplier on favorable terms, we would be materially and adversely affected.
In November 2008, we entered into a Co-Marketing Agreement with Cardinal. The Co-Marketing Agreement appoints Cardinal the exclusive supplier of disposable products for our customers. If the agreement does not provide the results we expect under its terms, we would be materially and adversely affected.
The loss of a significant customer or purchasing organization could adversely affect our operating results. During the year ended December 31, 2009, hospitals belonging to three group purchasing organizations (“GPOs”), Novation, LLC, HealthTrust Purchasing Group, L.P. and MedAssets, Inc. accounted for approximately 62% of our sales. One customer, a healthcare provider, accounted for approximately 10% of our revenues in 2009. Our business with these GPOs is pursuant to short-term agreements, which are subject to renewal from time to time through competitive processes. Although each GPO member hospital currently makes its purchasing decisions on an individual basis, the loss of a substantial portion of the GPO hospitals’ business would adversely affect our revenues and results of operations.
Intense competition in the markets in which we operate could adversely affect us. Our business is highly competitive. Competitors include a number of distributors and manufacturers, as well as the in-house reprocessing operations of hospitals. Certain of our existing and potential competitors possess substantially greater resources than we possess. Some of our competitors, including Cardinal Converters (a subsidiary of Cardinal Health, Inc.) and Medline Industries, Inc., serve as the sole supplier of a wide assortment of products to a significant number of hospitals. While we have a substantial array of surgical products, many of our competitors have a greater number of products for the entire hospital, which in some instances is a competitive disadvantage for us. There is no assurance that we will be able to compete effectively with existing or potential competitors. See “Item 1. Business-Competition.”
9
Table of Contents
The loss of key executives and employees could adversely affect us. Our success depends upon the contributions of executives and key employees. The loss of executives and certain key employees in sales, operations and marketing could have a significant adverse effect on our ability to penetrate our markets, operate efficiently, and develop and sell new products and services. We also believe our success will depend in large part upon our ability to attract and retain additional highly skilled personnel.
Our ability to effectively grow depends on our ability to improve our operational systems. We have expanded our operations since inception and may continue to expand to pursue existing and potential market opportunities. This growth places a significant demand on management, financial and operational resources. To manage growth effectively, we must implement and improve our operational systems, procedures and controls on a timely basis and continue to invest in the operational infrastructure of our business.
Our product liability insurance may not be sufficient to cover all claims. The use of medical devices such as surgical instruments entails an inherent risk of product liability or other claims initiated by patients or hospitals. Any of those claims in excess of our insurance coverage or not covered by insurance could adversely affect our results of operations.
Changes in federal or state regulations could materially adversely affect us. Significant aspects of our business are subject to federal, state and local statutes and regulations governing, among other things, medical waste-disposal and workplace health and safety. In addition, most of the products furnished or sold by us are subject to regulation as medical devices by the FDA, as well as by other federal, state and local agencies. Our facilities are subject to quality systems inspections by FDA officials. The FDA has the power to enjoin future violations, seize adulterated or misbranded devices, and require the manufacturer to remove products from the market, and publicize relevant facts. Federal, state or local governments might impose additional restrictions or adopt interpretations of existing laws that could materially adversely affect us. See “Item 1. Business – Regulation.”
Failure to maintain adequate internal systems and effective internal controls over financial reporting and information systems could adversely affect us. As more fully described in Item 9A(T), Controls and Procedures, in the third quarter of 2009,we identified losses of reusable surgical products that were not previously captured by our tracking systems, and determined this deficiency was a material weakness in our internal controls over financial reporting. We implemented initiatives to remediate this material weakness in our internal controls as of September 30, 2009. Correction of any further “significant deficiencies” or “material weaknesses” (as defined under the Public Company Accounting Oversight Board guidelines) could require additional remedial measures, which could be costly and time-consuming. If a significant deficiency or material weakness exists at any year-end (including a material weakness identified prior to year-end for which there is an insufficient period of time to evaluate and confirm the effectiveness of the corrections or related new procedures), our management will be unable to report favorably as to the effectiveness of our internal control over financial reporting or information systems, which could adversely affect us.
| Item 1B. | Unresolved Staff Comments |
None.
| Item 2. | Properties |
We operate ten reusable processing facilities that range in size between 30,000 and 63,500 square feet in Baltimore, Chattanooga, Cincinnati, Dallas, Houston, Los Angeles, Raleigh, Salt Lake City, Stockton, and Tampa. Each facility has standardized processes and equipment, including computerized and fully automated heavy-duty washers, dryers, and sterilizers to achieve consistent decontamination and sterilization of reusable surgical products and instruments. We follow the Quality System Regulations at each facility, and regularly implement at all facilities efficiencies that have been developed and tested at another location.
10
Table of Contents
We maintain service centers in Detroit, Louisville, Miami and Oklahoma City to facilitate distribution of our products to our customers.
We operated a disposable accessory products facility in Plant City, Florida, where we assembled and packaged single-use surgical products into customized disposable accessory packs. We transported these disposable accessory packs to a third-party facility for sterilization before they were sent to our processing facilities for final delivery. As part of the Co-Marketing Agreement we signed with Cardinal Health in November 2008, we agreed to close the Plant City facility which was substantially completed in March 2009. As a result, we source our disposable products through Cardinal Health.
We own our Chattanooga, Cincinnati, Houston, and Stockton processing facilities and our corporate headquarters; we lease the remaining processing facilities, service centers, and the disposable accessory products facility.
We believe that our existing facilities adequately serve our current requirements. The table below summarizes our properties and the major markets they serve as of December 31, 2009:
| Square Footage (Approx.) |
Lease Expiration |
Selected Markets Served | ||||
| Processing Facilities: |
||||||
| Baltimore, Maryland |
58,700 | May 31, 2012 (Options to 2022) |
Baltimore, Philadelphia, Richmond, New Jersey | |||
| Chattanooga, Tennessee |
50,000 | Owned | Atlanta, Birmingham, Nashville, Mississippi | |||
| Cincinnati, Ohio |
50,000 | Owned | Columbus, Cincinnati, Louisville, Lexington, Detroit, Cleveland | |||
| Dallas, Texas |
31,000 | March 31, 2013 | Dallas, Oklahoma City, Tulsa | |||
| Houston, Texas |
30,000 | Owned | Houston, San Antonio, Austin | |||
| Los Angeles, California |
30,400 | November 30, 2012 | San Diego, Los Angeles | |||
| Raleigh, North Carolina |
63,500 | March 31, 2012 (Options to 2022) |
South Carolina, North Carolina | |||
| Salt Lake City, Utah |
31,800 | July 6, 2012 | Utah, Idaho | |||
| Stockton, California |
57,000 | Owned | Sacramento, San Francisco, Oakland | |||
| Tampa, Florida |
63,000 | January 23, 2012 (Options to 2032) |
Florida, Georgia | |||
| Service Centers: |
||||||
| Detroit, Michigan |
7,300 | November 30, 2012 | ||||
| Louisville, Kentucky |
10,000 | December 31, 2010 | ||||
| Miami, Florida |
4,000 | January 31, 2011 | ||||
| Oklahoma City, Oklahoma |
3,600 | February 28, 2012 | ||||
| Disposable Products: |
||||||
| Plant City, Florida |
40,800 | February 28, 2010 (Notice given to terminate lease on April 7, 2009) |
||||
| Corporate Office: |
||||||
| Tampa, Florida |
42,000 | Owned |
||||
11
Table of Contents
| Item 3. | Legal Proceedings |
From time to time, we are subject to legal proceedings that arise in the ordinary course of our business. We do not believe these proceedings, individually or in the aggregate, will have a material adverse effect on our financial position, results of operations, or cash flows.
| Item 4. | Reserved |
12
Table of Contents
PART II
| Item 5. | Market for the Registrant’s Common Equity, Related Stockholder Matters and Issuer Purchases of Equity Securities |
Common Stock Information
Our common stock trades publicly on The NASDAQ Stock Market LLC (NASDAQ Global Market) (the “NASDAQ”) under the symbol “STRC”. On February 26, 2010, there were approximately 39 holders of record of our common stock. The table below sets forth the high and low sales prices for our common stock for fiscal years 2008 and 2009, as reported on the NASDAQ.
Common Stock Price Range
| Year ended December 31, 2008 |
High | Low | ||||
| First quarter |
$ | 6.44 | $ | 3.52 | ||
| Second quarter |
$ | 4.69 | $ | 3.00 | ||
| Third quarter |
$ | 4.10 | $ | 3.30 | ||
| Fourth quarter |
$ | 3.96 | $ | 0.59 | ||
| Year ended December 31, 2009 |
||||||
| First quarter |
$ | 1.80 | $ | 0.76 | ||
| Second quarter |
$ | 1.58 | $ | 1.00 | ||
| Third quarter |
$ | 2.82 | $ | 1.30 | ||
| Fourth quarter |
$ | 3.40 | $ | 1.50 | ||
We have never declared or paid cash dividends on our common stock and do not anticipate paying dividends on our common stock in the foreseeable future. Additionally, financial covenants in our credit facility prohibit the payment of cash dividends. See “Management’s Discussion and Analysis of Financial Condition and Results of Operations – Liquidity and Capital Resources” and “Notes to Financial Statements”.
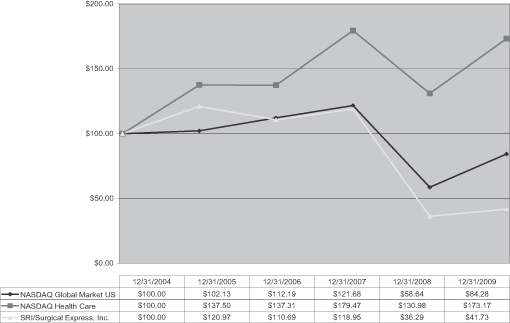
Stock Performance Graph
The following graph shows a comparison of our cumulative total shareholder return, NASDAQ Global Market (U.S.), and the NASDAQ Health Care Index. This graph assumes that $100 was invested on December 31, 2004 in our common stock and in the other indices and in each case, assumes reinvestment of all dividends. Historic stock price performance does not necessarily indicate future stock price performance.
13
Table of Contents
| Item 6. | Selected Financial Data |
The following table contains certain selected financial data that have been derived from our audited financial statements. The data should be read in conjunction with the Financial Statements and Notes thereto incorporated into Item 8 and “Management’s Discussion and Analysis of Financial Condition and Results of Operations” incorporated into Item 7.
| Years Ended December 31, | |||||||||||||||||||
| 2009 | 2008 | 2007 | 2006 | 2005 | |||||||||||||||
| (In thousands, except per share data) | |||||||||||||||||||
| Statement of operations data: |
|||||||||||||||||||
| Revenues |
$ | 98,453 | $ | 97,028 | $ | 94,201 | $ | 93,831 | $ | 91,734 | |||||||||
| Cost of revenues |
78,355 | 75,599 | 73,947 | 71,534 | 68,554 | ||||||||||||||
| Gross profit |
20,098 | 21,429 | 20,254 | 22,297 | 23,180 | ||||||||||||||
| Distribution expenses |
6,933 | 7,227 | 6,394 | 6,327 | 6,261 | ||||||||||||||
| Selling and administrative expenses |
16,607 | 16,289 | 17,775 | 17,574 | 15,092 | ||||||||||||||
| Income (loss) from operations |
(3,442 | ) | (2,087 | ) | (3,915 | ) | (1,604 | ) | 1,827 | ||||||||||
| Interest expense |
619 | 1,077 | 1,385 | 1,206 | 1,197 | ||||||||||||||
| Other income |
(367 | ) | (396 | ) | (342 | ) | — | — | |||||||||||
| Income (loss) before income taxes |
(3,694 | ) | (2,768 | ) | (4,958 | ) | (2,810 | ) | 630 | ||||||||||
| Income tax expense (benefit) |
82 | (212 | ) | (1,765 | ) | (857 | ) | 237 | |||||||||||
| Net income (loss) |
$ | (3,776 | ) | $ | (2,556 | ) | $ | (3,193 | ) | $ | (1,953 | ) | $ | 393 | |||||
| Basic earnings (loss) per common share: |
|||||||||||||||||||
| Earnings (loss) per common share |
$ | (0.58 | ) | $ | (0.40 | ) | $ | (0.50 | ) | $ | (0.31 | ) | $ | 0.06 | |||||
| Basic earnings (loss) per diluted share: |
|||||||||||||||||||
| Earnings (loss) per diluted share |
$ | (0.58 | ) | $ | (0.40 | ) | $ | (0.50 | ) | $ | (0.31 | ) | $ | 0.06 | |||||
| Weighted average common shares outstanding: |
|||||||||||||||||||
| Basic |
6,464 | 6,434 | 6,399 | 6,338 | 6,277 | ||||||||||||||
| Diluted |
6,464 | 6,434 | 6,399 | 6,338 | 6,311 | ||||||||||||||
| Balance sheet data (at end of period): |
|||||||||||||||||||
| Reusable surgical products, net |
$ | 18,151 | $ | 20,577 | $ | 19,416 | $ | 20,954 | $ | 22,416 | |||||||||
| Total assets |
62,928 | 69,746 | 71,968 | 74,354 | 76,432 | ||||||||||||||
| Notes payable |
6,124 | 8,434 | 2,493 | 2,497 | 3,229 | ||||||||||||||
| Mortgages payable |
4,013 | 4,228 | 4,286 | 4,524 | 4,763 | ||||||||||||||
| Bonds payable |
520 | 520 | 7,060 | 7,720 | 8,380 | ||||||||||||||
| Obligation under capital lease |
— | — | — | — | 6 | ||||||||||||||
| Total liabilities |
23,063 | 26,764 | 27,342 | 27,636 | 28,349 | ||||||||||||||
| Shareholders’ equity |
39,865 | 42,982 | 44,626 | 46,718 | 48,083 | ||||||||||||||
14
Table of Contents
| Item 7. | Management’s Discussion and Analysis of Financial Condition and Results of Operations |
The following discussion and analysis should be read with our financial statements and Notes included elsewhere in this Annual Report on Form 10-K. This discussion and analysis contains trend analysis and might contain forward-looking statements. These statements are based on current expectations and actual results might differ materially. Among the factors that could cause actual results to vary are those described in the “Overview” section below and in Item 1A. – Risk Factors.
Overview
We provide daily processing, assembly and delivery of reusable and disposable surgical products and instruments through our state-of-the-art, FDA-regulated service centers. Our integrated “closed-loop” process starts with daily delivery of reusable and disposable surgical supplies and instruments to healthcare providers. After use, we pick up the reusable textiles, basins and instruments used in surgery and return them to our processing facilities. Used products arriving at our processing facilities are sorted, cleaned, inspected, packaged, sterilized and shipped back to the healthcare providers. We also manage the instrumentation and supply chain of hospitals, surgery centers and operating rooms and their central sterilization facilities.
We believe our facilities are strategically situated to capitalize on future market opportunities. These facilities have significant available capacity to access more of the national market.
We derive our revenue from the sale and servicing of reusable and disposable surgical products and instruments and the management of our customers’ supply chain and central sterilization functions. Reusable products include linens (gowns, towels and drapes) and basins (stainless steel cups, carafes, trays and basins). Disposable accessory packs supplement the reusable products with highly customizable components. We sell our products and services through a direct sales force located throughout most of the major markets in the United States. Our revenue growth is primarily determined by the number of customers, the number and type of surgical procedures that we service for each customer, and pricing for our various types of surgical packs and procedures. Revenues are recognized as the agreed upon products and services are delivered, generally daily. We incur most of our cost of revenues from processing the reusable surgical products and instruments at our processing facilities. In November 2008, we signed a five-year Co-Marketing Agreement with Cardinal under which both companies will market an environmentally friendly combined reusable and disposable surgical pack. In addition, we appointed Cardinal as our exclusive provider of disposable surgical products. We amended and restated the Co-Marketing Agreement in February 2010. See “Item 1. Business – The Company.”
Most of our surgical instrument supply arrangements with customers use instruments owned by Aesculap, which receives an agreed upon fee for each procedure based on the number and kinds of procedures performed with its instruments and the number and combination of instruments used for each procedure. This arrangement allows us to limit our cost of capital for instrument programs. In addition to the Aesculap-owned instruments, we purchase surgical instruments from other vendors to service customers who have requirements that Aesculap cannot fulfill. We expect instrument revenues will continue to grow and, as a result, we expect our instrument inventory will continue to grow.
Our profitability is primarily determined by our revenues, the efficiency with which we deliver products and services to customers, and our ability to control our costs. We incurred operating and net losses in 2009, as our revenues were short of our expectations and we experienced lower margins. Although sales to customers who predominantly purchase reusable textiles increased this year and we continue to see growth in other products sold with our ReadyCaseSM case cart management system (combining instruments, reusable textiles and disposable products), we continue to encounter compressed margins, primarily as a result of industry pricing trends and higher levels of reusable surgical product loss recognized during the year. Our Tampa facility incurred higher than normal levels of loss during the year and as a result of an information systems error, we recognized additional loss in the third quarter associated with earlier years which was not known by us at January 1, 2009.
15
Table of Contents
Our principal strategic opportunity to improve our operating results is to capitalize on our service capabilities and considerable infrastructure by leveraging our current relationships with existing customers and adding new customers. We continue to focus on introducing our current and potential new customers to our physician-specific ReadyCaseSM case cart management system, which has been our principal source of new sales. In addition, the Co-Marketing Agreement we entered into with Cardinal Health gives us the opportunity to focus on our strengths: reusable surgical products, instrumentation, and management of central sterilization and supply chain activities. The agreement gives our environmentally friendly solution greater reach and visibility throughout the healthcare market. It brings together the strengths of two organizations that are leaders in their segments for a more efficient and effective delivery of healthcare solutions. See “Item 1. Business – The Company.”
Critical Accounting Policies and Estimates
The preparation of our financial statements and related disclosures in conformity with accounting principles generally accepted in the United States of America requires management to make judgments, assumptions, and estimates that affect the amounts reported in our financial statements and accompanying notes. On an ongoing basis, we evaluate our estimates and assumptions based upon historical experience and various other factors and circumstances. We believe that these estimates and assumptions are reasonable under the circumstances; however, actual results may vary from these estimates and assumptions. Note B to our financial statements describes the significant accounting policies and methods that we use in preparing our financial statements. We identified the following critical accounting policies that affect the more significant judgments, assumptions and estimates used in preparing our financial statements.
Allowance for Doubtful Accounts. Our allowance for doubtful accounts is based on our assessment of the collectability of specific customer accounts, the overall aging of the balances and the financial stability of the customer. The use of different estimates or assumptions could produce different allowance balances. If a major customer’s creditworthiness deteriorates or customer defaults run at a rate higher than historical experience, we would be required to increase this allowance, which could adversely affect our results of operations.
Reserves for Shrinkage, Obsolescence, and Scrap for Reusable Surgical Products and Instruments. We determine our reserves for shrinkage and obsolescence of our reusable surgical products and instruments based on historical experience. Any linen products not scanned by our RFID system for a 210-day period are considered lost and written off. We determine our reserve for scrap based upon quality assurance standards and historical evidence. We periodically verify the quantity of other reusable surgical products by counting and by applying observed turn rates. A third party, Aesculap, owns most of the surgical instruments that we use. We base our reserve for owned surgical instrument losses on our assessment of our historical loss experience, including periodic physical counts. Using different estimates or assumptions could produce different reserve balances for our reusable products and instruments. We review this reserve quarterly. If actual shrinkage, obsolescence or scrap differs from our estimates, our reserve would increase or decrease accordingly, which could adversely affect our results of operations.
Reserves for Shrinkage and Obsolescence for Inventories. We determine our reserves for shrinkage and obsolescence of our inventories based on historical data, including the results of cycle counts performed during the year and the evaluation of the aging of our disposable surgical products. Using different estimates or assumptions could produce different reserve balances. We review this reserve quarterly. If actual losses differ from our estimates, our reserve would increase or decrease accordingly, which could adversely affect our results of operations.
Amortization of Reusable Surgical Products and Instruments. Our reusable surgical products are stated at cost. We amortize linens and basins on a basis similar to the units of production method. Estimated useful lives for each product are based on the estimated total number of available uses for each product. The expected total available usage for our linen products using the three principal fabrics (accounting for approximately 74% of the reusable surgical products) is 75, 100, and 125 uses, based on several factors, including our actual historical
16
Table of Contents
experience with these products. We believe our RFID technology enables us to evaluate the useful lives of linen products more often. Basins are amortized on a straight-line basis over their estimated useful life, up to 20 years. We amortize owned surgical instruments on the straight-line method based on a four-year useful life. If our actual use experience with these products is shorter than these assumptions, our amortization rates for reusable products and instruments would increase, which could adversely affect our results of operations.
Health Insurance Reserves. We offer employee benefit programs including health insurance to eligible employees. We retain a liability up to $95,000 annually for each health insurance claim. Our policy has an estimated annual aggregate liability limit of $3.4 million. We accrue health insurance costs using estimates to approximate the liability for reported claims and claims incurred but not reported. Using different estimates or assumptions could produce different reserve balances. If actual claim results exceed our estimates, our health insurance reserve would increase, which could adversely affect our results of operations.
Workers’ Compensation Insurance Reserve. Our workers’ compensation insurance program is a large dollar deductible, self-funded plan. We retain a liability of $250,000 for each claim occurrence. Our policy has an annual aggregate liability limit of $1.5 million. We base our reserve on historical claims experience and reported claims. We accrue workers’ compensation insurance costs using estimates to approximate the liability for reported claims and claims incurred but not reported. We review this reserve quarterly. If actual claims differ from our estimates, the reserve would increase or decrease accordingly, which could adversely affect our results of operations.
Income Taxes. Our effective tax rate is based on our losses and statutory tax rates in the various jurisdictions in which we operate. Significant judgment is required in determining our effective tax rate and evaluating our tax positions. Income taxes have been provided using the asset and liability method in accordance with ASC Topic 740, Income Taxes, (“ASC 740”). In accordance with ASC 740, deferred tax assets and liabilities are recognized for the future tax consequences attributable to differences between the financial statement carrying amounts of existing assets and liabilities and their respective tax bases. Deferred tax assets and liabilities are measured using enacted tax rates expected to apply to taxable income in the years in which those temporary differences are expected to be recovered or settled. The effect on deferred tax assets and liabilities of a change in the tax rate is recognized in operations in the period that includes the enactment date of the rate change. The tax benefits must be reduced by a valuation allowance in certain circumstances. Realization of the deferred tax benefits is dependent on generating sufficient taxable income prior to the expiration of any net operating loss carry-forwards. We periodically review deferred tax assets for recoverability, and provide valuation allowances as necessary.
Stock-Based Compensation. In accordance with the ASC Topic 718, Share-Based Payments”, (“ASC 718”) and the Security and Exchange Commission Staff Accounting Bulletin No. 107 (“SAB 107”), we recognize stock-based compensation expense in our consolidated statements of operations. We have elected to use the binomial model to determine the fair value of our issued options. Option pricing models require the input of subjective assumptions, including the expected life of the option, the price volatility of the underlying stock, expected interest rates and forfeitures. If actual results differ significantly from our assumptions, stock-based compensation could increase or decrease. For further discussion of our stock-based compensation, see Note B-Summary of Significant Accounting Policies – Stock-Based Compensation and Note J – Stock Options to the financial statements.
Fair Value Accounting. In September 2006, the Financial Accounting Standards Board (the “FASB”) issued an accounting standard that now resides in ASC Topic 820, Fair Value Measurements and Disclosures, (“ASC 820”), ASC 820 defines fair value, establishes a framework for measuring fair value and requires enhanced disclosures about fair value measurements. ASC 820 creates a fair value hierarchy, which prioritizes the inputs to be used in determining fair value. The three hierarchy levels are based upon the assumptions (inputs) used to price the assets or liabilities. Level 1 provides the most reliable measure of fair value, such as quoted market prices in active markets for identical assets and liabilities. Level 2 includes observable inputs other than those
17
Table of Contents
included in Level 1. For example, quoted market prices for similar assets or liabilities in active markets or quoted prices for identical assets or liabilities in inactive markets. Level 3 generally requires significant management judgment as the inputs reflect management’s own assumptions used in pricing the asset or liability. Companies are required to disclose relevant fair value information in their financial statements that allows users to assess inputs used to measure fair value, and the effect of those measurements on earnings for the periods presented. Companies are also required to separately reconcile the beginning and ending balances for each major category of assets and liabilities. ASC 820 is effective for financial statements issued for fiscal years beginning after November 15, 2007; however, the FASB delayed the effective date of ASC 820 for one year for certain nonfinancial assets and liabilities that are not remeasured at fair value on a recurring basis. Examples of nonfinancial assets and liabilities include property and equipment, goodwill and intangible assets that are not amortized. There were no financial instruments recognized at fair value in our financial statements requiring the application of ASC 820 for the year ended December 31, 2009.
In April 2007, the FASB issued an accounting standard that is contained in ASC Topic 825, Financial Instruments, (“ASC 825”). ASC 825 permits an entity to measure certain financial assets and financial liabilities at fair value where entities will report unrealized gains and losses in earnings at each subsequent reporting date. The standard allows entities to elect fair value application on an instrument-by-instrument basis with certain exceptions. The fair value option election is irrevocable in most cases. The new standard establishes presentation and disclosure requirements and assets and liabilities that are measured at fair value must be displayed on the face of the balance sheet. The adoption of ASC 825 did not have a material impact on our financial statements.
Recently Issued Accounting Standards
In June 2009, the Financial Accounting Standards Board (“FASB”) issued a standard that established the FASB Accounting Standards Codification™ (“ASC”) and amended the hierarchy of generally accepted accounting principles (“GAAP”) such that the ASC became the single source of authoritative nongovernmental U.S. GAAP. The ASC did not change current U.S. GAAP, but was intended to simplify user access to all authoritative U.S. GAAP by providing all the authoritative literature related to a particular topic in one place. All previously existing accounting standard documents were superseded and all other accounting literature not included in the ASC is considered non-authoritative. New accounting standards issued subsequent to June 30, 2009 are communicated by the FASB through Accounting Standards Updates (“ASU”). For the Company, the ASC was effective July 1, 2009. This standard did not have an impact on the our results of operations or financial condition. However, throughout the notes to the financial statements references that were previously made to various former authoritative U.S. GAAP pronouncements have been changed to coincide with the appropriate section of the ASC.
In August 2009, the FASB issued ASU No. 2009-05, Measuring Liabilities at Fair Value, which provides additional guidance on how companies should measure liabilities at fair value under ASC 820. The ASU clarifies that the quoted price for an identical liability should be used. However, if such information is not available, an entity may use, the quoted price of an identical liability when traded as an asset, quoted prices for similar liabilities or similar liabilities traded as assets, or another valuation technique (such as the market or income approach). The ASU also indicates that the fair value of a liability is not adjusted to reflect the impact of contractual restrictions that prevent its transfer and indicates circumstances in which quoted prices for an identical liability or quoted price for an identical liability traded as an asset may be considered level 1 fair value measurements. This ASU is effective for us on October 1, 2009. This standard did not have an impact on the our results of operations or financial condition.
In January 2010, the FASB issued ASU No. 2010-6, Improving Disclosures About Fair Value Measurements, that amends existing disclosure requirements under ASC 820 by adding required disclosures about items transferring into and out of levels 1 and 2 in the fair value hierarchy; adding separate disclosures about purchase, sales, issuances, and settlements relative to level 3 measurements; and clarifying, among other things, the existing fair value disclosures about the level of disaggregation. This ASU is effective for us for the
18
Table of Contents
first quarter of 2010, except for the requirement to provide level 3 activities of purchases, sales, issuances, and settlements on a gross basis, which is effective beginning the first quarter of 2011. Since this standard impacts disclosure requirements only and we do not have any items that meet the classification as Level 2 or Level 3 items, its adoption will not have a material impact on our results of operations or financial condition.
Results of Operations
We operate on a 52-53 week fiscal year ending the Sunday nearest December 31st. The financial statements are reflected as of December 31, 2009, 2008, and 2007 for presentation purposes only. The actual end of each period was January 3, 2010, December 28, 2008, and December 30, 2007, respectively. There are 53 weeks in 2009 and 52 weeks in 2008 and 2007.
The following table sets forth for the periods shown the percentage of revenues represented by certain items reflected in our statements of operations:
| Years Ended December 31, | |||||||||
| 2009 | 2008 | 2007 | |||||||
| Revenues |
100.0 | % | 100.0 | % | 100.0 | % | |||
| Cost of revenues |
79.6 | 77.9 | 78.5 | ||||||
| Gross profit |
20.4 | 22.1 | 21.5 | ||||||
| Distribution expenses |
7.0 | 7.4 | 6.8 | ||||||
| Selling and administrative expenses |
16.9 | 16.8 | 18.9 | ||||||
| Loss from operations |
(3.5 | ) | (2.1 | ) | (4.2 | ) | |||
| Interest expense |
0.6 | 1.1 | 1.5 | ||||||
| Other income |
(0.4 | ) | (0.4 | ) | (0.4 | ) | |||
| Loss before income taxes |
(3.7 | ) | (2.8 | ) | (5.3 | ) | |||
| Income tax provision (benefit) |
0.1 | (0.2 | ) | (1.9 | ) | ||||
| Net loss |
(3.8 | )% | (2.6 | )% | (3.4 | )% | |||
Year ended December 31, 2009 compared to year ended December 31, 2008
Revenues
Revenues increased $1.4 million, or 1.5%, to $98.4 million for the year ended December 31, 2009, compared to $97.0 million for the year ended December 31, 2008. The increase in revenues is primarily attributable to the growth of our management of instrumentation and central sterilization department service offering and an extra week of operations in fiscal 2009, partially offset by industry pricing trends. Also, our 2008 revenues were favorably impacted by the reversal of an accrued customer discount of $440,000 that was not realized.
Gross Profit
Gross profit decreased $1.3 million, or 6.1%, to $20.1 million for the year ended December 31, 2009 compared to $21.4 million for the prior year. As a percentage of revenues, gross profit decreased by 1.7 percentage points to 20.4% for the year ended December 31, 2009 compared to 22.1% for the prior year. The decrease in gross profit was primarily due to our reusable surgical product loss being higher than normal in our Tampa facility by approximately $500,000, as well as product loss recognized in 2009 that was not previously captured by our information system in a prior year. As part of our efforts to reduce the level of loss and scrap costs, we performed additional operational reviews of the reusable surgical product usage during the third quarter of 2009, which resulted in identification of additional losses that were not known at January 1, 2009. The amount of the adjustments related to periods prior to January 1, 2009 that were recognized in the three months ended September 30, 2009 decreased gross profit by $591,000.
19
Table of Contents
Distribution Expenses
Distribution expenses decreased $294,000, or 4.1%, to $6.9 million for the year ended December 31, 2009 as compared to $7.2 million in the prior year primarily due to lower fuel costs, partially offset by an extra week of operations in fiscal 2009.
Selling and Administrative Expenses
Selling and administrative expenses increased $318,000, or 2.0%, to $16.6 million for the year ended December 31, 2009 compared to $16.3 million in the prior year. The increase in selling and administrative expenses for 2009 is primarily attributable to the extra week of operations in fiscal 2009 (our 53-week year end), as well as higher marketing costs and bank fees, partially offset by lower stock option expense. Additionally, selling and administrative expenses in 2008 were lower as a result of a reduction in the provision for doubtful accounts by $759,000, primarily as a result of a customer that made substantial payment of past due amounts and brought its account current.
Interest Expense
For the year ended December 31, 2009, interest expense decreased $458,000, or 42.5%, to $619,000 compared to $1.1 million in the prior year. The lower expense when compared to 2008 is due primarily to generally lower interest rates and lower average outstanding balances under our revolving credit facility during the year. During the third quarter of 2009, we converted $4.0 million of our outstanding line of credit and $4.0 million of our term loan to a LIBOR based rate which had a lower interest rate compared to the Prime based rate.
Other Income
Other income was $367,000 for the year ended December 31, 2009, primarily as a result of rental income, which is essentially the same as the prior year. Effective March 1, 2007, we entered into an agreement to lease to a third party a portion of our corporate headquarters under the terms of a non-cancelable operating lease.
Income Tax Expense (Benefit)
Our effective tax rate is a function of our income or loss before taxes and statutory tax rates, as well as minimum taxes, in the various jurisdictions in which we operate. Income tax expense (benefit) is a function of our net income or loss, effective tax rate and valuation allowances. The effective tax rate for the year ended December 31, 2009 was (2.2)% compared to 7.7% for the year ended December 31, 2008. The primary reason for the lower effective tax rate for the year ended December 31, 2009, as compared to the same period last year is primarily attributable to a valuation allowance recorded in 2009 to reduce certain deferred tax assets to the amount that will more likely than not be realized and a deferred tax adjustment recorded during the fourth quarter 2009.
Net loss Per Common Share
We recorded a net loss per common share of $0.58 on a diluted and basic per share basis for 2009 compared with a net loss per common share of $0.40 in 2008.
Year ended December 31, 2008 compared to year ended December 31, 2007
Revenues
Revenues increased $2.8 million, or 3.0%, to $97.0 million for the year ended December 31, 2008, compared to $94.2 million for the year ended December 31, 2007. The increase in revenues was primarily attributable to the growth of our on-site management of hospital and surgery center instrumentation supply chain
20
Table of Contents
and central sterilization services, partially offset by industry pricing trends and a decline in our sales to customers who predominantly purchase reusable textiles. Our revenues were also favorably affected by the reversal of an accrued customer discount not taken of $440,000.
Gross Profit
Gross profit increased $1.2 million, or 5.8%, to $21.4 million for the year ended December 31, 2008 compared to $20.2 million for the prior year. As a percentage of revenues, gross profit increased by 0.6% to 22.1% for the year ended December 31, 2008 compared to 21.5% for the prior year. The increase in gross profit was primarily due to the reversal of the accrued customer discount noted above, and lower amortization of reusable products, partially offset by higher consumables, instrument labor, repair and supply costs, as well as higher amortization expense from a higher level of owned instruments.
Distribution Expenses
Distribution expenses increased $833,000, or 13.0%, to $7.2 million for the year ended December 31, 2008 as compared to $6.4 million in the prior year primarily due to higher fuel and labor related costs.
Selling and Administrative Expenses
Selling and administrative expenses decreased $1.5 million, or 8.4%, to $16.3 million for the year ended December 31, 2008 compared to $17.8 million in the prior year. The decrease in selling and administrative expenses for 2008 was primarily attributable to a decrease in the provision for doubtful accounts, primarily as the result of a customer that made substantial payments of past due amounts, and lower consulting fees, partially offset by higher stock compensation expense and higher accounting and bank fees.
Interest Expense
For the year ended December 31, 2008, interest expense decreased $308,000, or 22.2%, to $1.1 million compared to the prior year. The lower expense when compared to last year was due primarily to generally lower interest rates and lower average outstanding balances under our revolving credit facility during the year.
Other Income
Other income was $396,000 for the year ended December 31, 2008, primarily as a result of rental income. Effective March 1, 2007, we entered into an agreement to lease to a third party a portion of our corporate headquarters under the terms of a non-cancelable operating lease.
Income Tax Benefit
Our effective tax rate is a function of our income or loss before taxes and statutory tax rates, as well as minimum taxes, in the various jurisdictions in which we operate. Income tax expense (benefit) is a function of our net income or loss, effective tax rate and valuation allowances. The effective tax rate for the year ended December 31, 2008 was 7.7% compared to 35.6% for the year ended December 31, 2007. The primary reason for the lower effective tax rate for the year ended December 31, 2008, as compared to the same period last year was primarily attributable to a valuation allowance recorded in 2008 to reduce certain deferred tax assets to the amount that will more likely than not be realized, partially offset by a $189,000 net operating loss carry-back utilized during the year.
Net loss Per Common Share
We recorded a net loss per common share of $0.40 on a diluted and basic per share basis for 2008 compared with a net loss per common share of $0.50 in 2007.
21
Table of Contents
Liquidity and Capital Resources
Our principal sources of capital have been cash flows from operations and borrowings under our revolving credit facility. As of December 31, 2009, we had approximately $802,000 in cash and cash equivalents, compared to approximately $484,000 as of December 31, 2008. In addition, as of December 31, 2009, we had $7.1 million available under our credit facility, after accounting for amounts outstanding under the credit facility, certain letters of credit principally associated with our bonds payable (described below) and a general reserve. Net cash provided by operating activities for 2009 was $10.3 million as compared to $11.2 million last year. Net cash from operations during 2009 is primarily attributable to depreciation and amortization expense of $8.5 million, a decrease in net working capital of $1.7 million due primarily to lower inventories, an increase in the reusable surgical products’ shrinkage reserve of $3.2 million and stock-based compensation expense of $659,000, partially offset by our net loss of $3.8 million and a reduction in our accounts payable and employee related and other accrued liabilities of $1.1 million.
Net cash used in investing activities in 2009 was $7.5 million as compared to $9.0 million in 2008. Cash used in investing activities primarily related to purchases of property, plant and equipment and reusable surgical products. We estimate that our expenditures in 2010 for property, plant and equipment will be approximately $1.8 million and our expenditures in 2010 for reusable surgical products will be approximately $3.1 million, an amount that may fluctuate depending on the growth of our business. We expect instrument revenues will continue to grow and, as a result, we expect our instrument inventory will continue to grow. We estimate that our expenditures in 2010 for instrument inventory will be approximately $1.2 million.
Net cash used in financing activities in 2009 was $2.5 million compared to $2.3 million in 2008. Cash used in financing activities was primarily a result of the repayment on our outstanding notes and mortgage payable, partially offset by our borrowings on our notes payable.
Credit Facility
On August 7, 2008, we entered into a three-year $24.3 million credit facility (the “Credit Facility”). The Credit Facility includes a revolving loan of up to $20 million for working capital, letters of credit, capital expenditures and other purposes, and a $4.3 million term loan, which replaced a prior mortgage loan on our Tampa headquarters. Actual amounts available under the revolving loan are determined by a defined borrowing base, which primarily relates to outstanding receivables, inventories and reusable surgical products. As a result of the borrowing base calculation as of December 31, 2009, we had $17.6 million available for advances of which we had used $10.5 million of the revolving loan, including $6.1 million of advances, $2.2 million of availability for letters of credit to support our bonds and self-insurance policies, and $2.2 million to maintain a required reserve. As of December 31, 2009, we had $4.0 million outstanding on the term loan, which is classified as a mortgage payable. The term loan amortizes based on a 20-year schedule, with the remaining principal balance due when the Credit Facility expires on August 7, 2011. The Credit Facility is secured by substantially all of our assets.
As of December 31, 2009, the Credit Facility required us to comply with (a) a minimum tangible net worth of $40 million and (b) a fixed charge coverage ratio of 1.10 to one. We did not satisfy the tangible net worth covenant required by the Credit Facility for the year ended December 31, 2009. Our lender waived the requirement for us to meet the covenant as of December 31, 2009. In addition, our lender amended the Credit Facility to require us to maintain a minimum tangible net worth covenant of at least $35 million through December 31, 2010 and $37.5 million thereafter, and set the fixed charge coverage ratio as no less than 0.90 to 1.00 through August 31, 2010 and 1.10 to 1.00 thereafter. As amended, the interest rate on the revolving loan varies between 250 and 300 basis points over LIBOR or between 150 and 200 basis points over the Prime Rate, depending on the level of the fixed charge coverage ratio. Interest on the term loan varies between 275 and 325 basis points over LIBOR or between 175 and 225 basis points over the Prime Rate, depending on the level of the fixed charge coverage ratio. The type of interest rate is an election we make periodically. As of December 31, 2009, $4.0 million of the outstanding revolving loan balance was based on LIBOR plus 2.25% (2.625% as of
22
Table of Contents
October 19, 2009) and the remaining outstanding balance of $2.1 million was at the Prime Rate of 3.25%. As of December 31, 2009, $3.9 million of the outstanding term loan was based on LIBOR plus 2.25% (2.625% as of November 6, 2009) and the remaining outstanding balance of $100,000 was at the Prime Rate of 3.25%.
The Credit Facility includes typical provisions restricting us from paying dividends, incurring additional debt, making loans and investments, encumbering our assets, entering into a business outside our current operations, or entering into certain merger, consolidation, or liquidation transactions.
Bonds and Insurance Financing
We have outstanding public bonds that we issued to fund the construction of two of our reusable processing facilities. Interest expense on these bonds adjusts based on rates that approximate LIBOR (0.29% at December 31, 2009). Starting in 2004, we began amortizing the bonds through quarterly payments of $165,000. A balloon principal payment of $3.1 million is due on the bonds in 2014. The bonds are secured by the two reusable processing facilities and backed by letters of credit issued under the Credit Facility. The letters of credit must be renewed in January of each year through maturity in 2014 and we have complied with this requirement.
In October 2008, $6.0 million of the bonds were tendered. The holders of the tendered bonds were paid from draws against the letters of credit under our Credit Facility, and will be reflected as outstanding notes payable until they are remarketed. Under the terms of the indentures relating to the bonds, the tendered bonds can be remarketed at any time prior to their maturity in 2014. Letters of credit issued by our lenders for amounts totaling $7.2 million secure these bonds; however, only $520,000 of the letters of credit are outstanding as of December 31, 2009 as a result of the bonds being tendered.
Contractual Obligations
Our contractual cash obligations for future minimum payments, including interest, under our notes payable to bank, bonds payable, mortgage and operating leases as of December 31, 2009, are as follows:
| Payments due by period (000’s) |
Total | Less than 1 year | 2-3 years | 4-5 years | More than 5 years | ||||||||||
| Notes payable, mortgage and bonds payable |
$ | 10,657 | $ | 215 | $ | 9,922 | $ | 520 | $ | — | |||||
| Operating leases |
6,920 | 2,404 | 3,423 | 634 | 459 | ||||||||||
| Total contractual cash obligations |
$ | 17,577 | $ | 2,619 | $ | 13,345 | $ | 1,154 | $ | 459 | |||||
In addition, as part of our ReadyCaseSM delivery system, we offer instruments for use and reprocessing pursuant to our Joint Marketing Agreement with Aesculap. Under the terms of this agreement, Aesculap furnishes and repairs the surgical instruments that we deliver to customers and receives an agreed upon fee for each procedure. We also had a procurement agreement with Standard Textile under which we agreed to purchase 90% of our reusable surgical products from them. We are not bound to purchase any minimum quantity of products under these agreements; however, we expect to make payments under the contracts to fulfill our requirements. Our agreement with Standard Textile expired in August 2008. We are currently working with Standard Textile on a month-to-month basis until a new agreement can be reached. Our purchases under these agreements in 2009 were $16.1 million. Amounts paid under these agreements will vary based upon changes in customer demand, amortization rates, product prices, and other variables affecting our business.
We believe that our existing cash and cash equivalents together with expected cash provided by operations and the Credit Facility will be adequate to finance our operations for at least the next 12 months. Although it is difficult for us to predict our future liquidity needs with certainty, our continued access to the Credit Facility is an essential requirement for our continued operations.
23
Table of Contents
| Item 7A. | Quantitative and Qualitative Disclosures about Market Risk |
Our principal exposure to market risk is change in interest rates under our various debt instruments and borrowings. The outstanding balance under our revolving credit facility was approximately $6.1 million as of December 31, 2009. The interest rate on the revolving loan varies between 150 and 275 basis points over LIBOR or 150 basis points over the Prime Rate, depending on excess availability under the facility. As of December 31, 2009, $4.0 million of the outstanding revolving loan balance was based on LIBOR plus 2.25% (2.625% as of October 19, 2009) and the remaining outstanding balance of $2.1 million was at the Prime Rate of 3.25% . We are subject to changes in our interest rate on this facility based on fluctuations in interest rates. Assuming an outstanding balance on this facility of $6.1 million, if the Prime and Libor Rates were to increase (decrease) by 100 basis points, our interest payments would increase (decrease) by $15,250 per quarter.
The outstanding balance under the term loan portion of the Credit Facility was approximately $4.0 million as of December 31, 2009. Interest on the term loan varies between 200 and 300 basis points over LIBOR or 175 basis points over the Prime Rate. The type of interest rate is an election we make periodically. As of December 31, 2009, $3.9 million of the outstanding revolving loan balance was based on LIBOR plus 2.25% (2.625% as of November 6, 2009) and the remaining outstanding balance of $0.1 million was at the Prime Rate of 3.25% Assuming an outstanding balance of this facility of $4.0 million, if the Prime and LIBOR Rates increase (decrease) by 100 basis points, our interest payments would increase (decrease) by $10,000 per quarter.
Interest on our bonds that financed two of our facilities is at a rate that approximates LIBOR. We are subject to changes in our interest expense on these bonds based on fluctuations in interest rates. Assuming an outstanding balance of these bonds of $520,000, if LIBOR were to increase (decrease) by 100 basis points, our interest payments would increase (decrease) by $1,300 per quarter.
We do not have any other material market risk sensitive instruments.
24
Table of Contents
| Item 8. | Financial Statements and Supplementary Data |
REPORT OF INDEPENDENT REGISTERED PUBLIC ACCOUNTING FIRM
Board of Directors and Shareholders of
SRI/Surgical Express, Inc.
We have audited the accompanying balance sheets of SRI/Surgical Express, Inc. (a Florida corporation) as of December 31, 2009 and 2008, and the related statements of operations, shareholders’ equity, and cash flows for each of the three years in the period ended December 31, 2009. Our audits of the basic financial statements included the financial statement schedule listed in the index appearing under Item 15 (a)(2). These financial statements and financial statement schedule are the responsibility of the Company’s management. Our responsibility is to express an opinion on these financial statements and financial statement schedule based on our audits.
We conducted our audits in accordance with the standards of the Public Company Accounting Oversight Board (United States). Those standards require that we plan and perform the audit to obtain reasonable assurance about whether the financial statements are free of material misstatement. The Company is not required to have, nor were we engaged to perform an audit of its internal control over financial reporting. Our audit included consideration of internal control over financial reporting as a basis for designing audit procedures that are appropriate in the circumstances, but not for the purpose of expressing an opinion on the effectiveness of the Company’s internal control over financial reporting. Accordingly, we express no such opinion. An audit also includes examining, on a test basis, evidence supporting the amounts and disclosures in the financial statements, assessing the accounting principles used and significant estimates made by management, as well as evaluating the overall financial statement presentation. We believe that our audits provide a reasonable basis for our opinion.
In our opinion, the financial statements referred to above present fairly, in all material respects, the financial position of SRI/Surgical Express, Inc. as of December 31, 2009 and 2008, and the results of its operations and its cash flows for each of the three years in the period ended December 31, 2009 in conformity with accounting principles generally accepted in the United States of America. Also in our opinion, the related financial statement schedule, when considered in relation to the basic financial statements taken as a whole, presents fairly, in all material respects, the information set forth therein.
| /s/ GRANT THORNTON LLP |
| Tampa, Florida |
| March 30, 2010 |
25
Table of Contents
BALANCE SHEETS
(in thousands, except share data)
| December 31, | ||||||
| 2009 | 2008 | |||||
| ASSETS |
||||||
| Cash and cash equivalents |
$ | 802 | $ | 484 | ||
| Accounts receivable, net |
11,460 | 11,200 | ||||
| Inventories, net |
2,903 | 5,727 | ||||
| Prepaid expenses and other assets |
1,947 | 2,271 | ||||
| Reusable surgical products, net |
18,151 | 20,577 | ||||
| Property, plant and equipment, net |
27,665 | 29,487 | ||||
| Total assets |
$ | 62,928 | $ | 69,746 | ||
| LIABILITIES AND SHAREHOLDERS’ EQUITY |
||||||
| Notes payable |
$ | 6,124 | $ | 8,434 | ||
| Accounts payable |
7,439 | 8,461 | ||||
| Employee related accrued expenses |
1,919 | 1,984 | ||||
| Other accrued expenses |
3,048 | 3,137 | ||||
| Mortgage payable |
4,013 | 4,228 | ||||
| Bonds payable |
520 | 520 | ||||
| Total liabilities |
23,063 | 26,764 | ||||
| Shareholders’ Equity |
||||||
| Preferred Stock – authorized 5,000,000 shares of $0.001 par value; no shares issued and outstanding at December 31, 2009 and 2008 |
— | — | ||||
| Common Stock – authorized 30,000,000 shares of $0.001 par value; issued and outstanding 6,485,978 and 6,495,978 shares at December 31, 2009 and 2008, respectively |
6 | 6 | ||||
| Additional paid-in capital |
33,025 | 32,366 | ||||
| Retained earnings |
6,834 | 10,610 | ||||
| Total shareholders’ equity |
39,865 | 42,982 | ||||
| Total liabilities and shareholders’ equity |
$ | 62,928 | $ | 69,746 | ||
The accompanying notes are an integral part of these financial statements.
26
Table of Contents
STATEMENTS OF OPERATIONS
(in thousands, except per share data)
| Years Ended December 31, | ||||||||||||
| 2009 | 2008 | 2007 | ||||||||||
| Revenues |
$ | 98,453 | $ | 97,028 | $ | 94,201 | ||||||
| Cost of revenues |
78,355 | 75,599 | 73,947 | |||||||||
| Gross profit |
20,098 | 21,429 | 20,254 | |||||||||
| Distribution expenses |
6,933 | 7,227 | 6,394 | |||||||||
| Selling and administrative expenses |
16,607 | 16,289 | 17,775 | |||||||||
| Loss from operations |
(3,442 | ) | (2,087 | ) | (3,915 | ) | ||||||
| Interest expense |
619 | 1,077 | 1,385 | |||||||||
| Other income |
(367 | ) | (396 | ) | (342 | ) | ||||||
| Loss before income taxes |
(3,694 | ) | (2,768 | ) | (4,958 | ) | ||||||
| Income tax expense (benefit) |
82 | (212 | ) | (1,765 | ) | |||||||
| Net loss |
$ | (3,776 | ) | $ | (2,556 | ) | $ | (3,193 | ) | |||
| Basic loss per common share: |
$ | (0.58 | ) | $ | (0.40 | ) | $ | (0.50 | ) | |||
| Diluted loss per common share: |
$ | (0.58 | ) | $ | (0.40 | ) | $ | (0.50 | ) | |||
| Weighted average common shares outstanding – basic |
6,464 | 6,434 | 6,399 | |||||||||
| Weighted average common shares outstanding – diluted |
6,464 | 6,434 | 6,399 | |||||||||
The accompanying notes are an integral part of these financial statements.
27
Table of Contents
STATEMENTS OF SHAREHOLDERS’ EQUITY
(In thousands, except share data)
| Common Stock | Additional Paid-in Capital |
Retained Earnings |
Total | ||||||||||||||
| Shares | Amount | ||||||||||||||||
| Balance at January 1, 2007 |
6,459,021 | $ | 6 | $ | 30,353 | $ | 16,359 | $ | 46,718 | ||||||||
| Exercise of stock options |
61,957 | — | 318 | — | 318 | ||||||||||||
| Restricted stock forfeited |
(50,000 | ) | — | — | — | — | |||||||||||
| Compensation expense on stock options |
— | — | 783 | — | 783 | ||||||||||||
| Net loss |
— | — | — | (3,193 | ) | (3,193 | ) | ||||||||||
| Balance at December 31, 2007 |
6,470,978 | 6 | 31,454 | 13,166 | 44,626 | ||||||||||||
| Restricted stock issued |
25,000 | — | — | — | — | ||||||||||||
| Compensation expense on stock options |
— | — | 912 | — | 912 | ||||||||||||
| Net loss |
— | — | — | (2,556 | ) | (2,556 | ) | ||||||||||
| Balance at December 31, 2008 |
6,495,978 | 6 | 32,366 | 10,610 | 42,982 | ||||||||||||
| Common stock cancelled |
(10,000 | ) | — | — | — | — | |||||||||||
| Compensation expense on stock options |
— | — | 659 | — | 659 | ||||||||||||
| Net loss |
— | — | — | (3,776 | ) | (3,776 | ) | ||||||||||
| Balance at December 31, 2009 |
6,485,978 | $ | 6 | $ | 33,025 | $ | 6,834 | $ | 39,865 | ||||||||
The accompanying notes are an integral part of these financial statements.
28
Table of Contents
STATEMENTS OF CASH FLOWS
(In thousands)
| Years Ended December 31, | ||||||||||||
| 2009 | 2008 | 2007 | ||||||||||
| Cash flows from operating activities: |
||||||||||||
| Net loss |
$ | (3,776 | ) | $ | (2,556 | ) | $ | (3,193 | ) | |||
| Adjustments to reconcile net loss to net cash provided by operating activities: |
||||||||||||
| Depreciation and amortization |
3,368 | 3,537 | 3,376 | |||||||||
| Amortization of reusable surgical products |
5,175 | 5,180 | 5,955 | |||||||||
| Gain on sale of property, plant and equipment |
— | — | (44 | ) | ||||||||
| Stock based compensation expense |
659 | 912 | 783 | |||||||||
| (Reduction) provision for doubtful accounts |
18 | (759 | ) | 791 | ||||||||
| (Reduction) provision for slow moving inventory |
48 | (211 | ) | 501 | ||||||||
| Provision for reusable surgical products’ shrinkage |
3,155 | 1,275 | 994 | |||||||||
| Deferred income taxes |
— | (55 | ) | (1,651 | ) | |||||||
| Change in assets and liabilities: |
||||||||||||
| (Increase) decrease in accounts receivable |
(278 | ) | 1,172 | (1,013 | ) | |||||||
| Decrease in inventories |
2,776 | 643 | 55 | |||||||||
| Decrease in prepaid expenses and other assets |
323 | 1,843 | 259 | |||||||||
| (Decrease) increase in accounts payable |
(1,022 | ) | 477 | 1,121 | ||||||||
| (Decrease) increase in employee related and other accrued expenses |
(117 | ) | (303 | ) | 1,097 | |||||||
| Net cash provided by operating activities |
10,329 | 11,155 | 9,031 | |||||||||
| Cash flows from investing activities: |
||||||||||||
| Purchases of property, plant and equipment |
(1,582 | ) | (1,394 | ) | (2,269 | ) | ||||||
| Purchases of reusable surgical products |
(5,904 | ) | (7,616 | ) | (5,411 | ) | ||||||
| Proceeds from sale of property, plant and equipment |
— | — | 87 | |||||||||
| Net cash used in investing activities |
(7,486 | ) | (9,010 | ) | (7,593 | ) | ||||||
| Cash flows from financing activities: |
||||||||||||
| Borrowings on notes payable |
98,215 | 43,907 | 36,172 | |||||||||
| Repayments on notes payable |
(100,513 | ) | (39,600 | ) | (36,641 | ) | ||||||
| Repayment on bonds payable |
— | (6,540 | ) | (660 | ) | |||||||
| Proceeds from mortgage refinancing |
— | 4,300 | — | |||||||||
| Repayments on mortgage payable |
(215 | ) | (4,358 | ) | (238 | ) | ||||||
| Payments on obligation under capital lease |
(12 | ) | (26 | ) | (16 | ) | ||||||
| Net proceeds from issuance of common stock |
— | — | 318 | |||||||||
| Net cash used in financing activities |
(2,525 | ) | (2,317 | ) | (1,065 | ) | ||||||
| Increase (decrease) in cash and cash equivalents |
318 | (172 | ) | 373 | ||||||||
| Cash and cash equivalents at beginning of year |
484 | 656 | 283 | |||||||||
| Cash and cash equivalents at end of year |
$ | 802 | $ | 484 | $ | 656 | ||||||
| Supplemental cash flow information: |
||||||||||||
| Cash paid for interest |
$ | 644 | $ | 1,172 | $ | 1,366 | ||||||
| Cash received for income taxes |
$ | (111 | ) | $ | (364 | ) | $ | (410 | ) | |||
| Supplemental schedule of non-cash investing activities: |
||||||||||||
| Assets acquired under capital lease |
$ | — | $ | 353 | $ | 40 | ||||||
| Noncash insurance financing |
$ | — | $ | 782 | $ | 465 | ||||||
The accompanying notes are an integral part of these financial statements.
29
Table of Contents
NOTE A – DESCRIPTION OF ORGANIZATION AND BUSINESS
SRI/Surgical Express, Inc. (“SRI” or the “Company”) provides central processing and supply chain management services to hospitals and surgery centers across the United States. The Company offers a combination of high quality reusable surgical products (including gowns, towels, drapes, basins and surgical instruments), disposable surgical products, and instruments in a comprehensive case cart management system. At ten regional facilities, the Company collects, sorts, cleans, inspects, packages, and sterilizes its reusable surgical products and instruments, and delivers daily on a just-in-time basis. The Company also provides an outsource solution for the management of hospital instrumentation and central sterilization. The Company operates in one industry segment.
NOTE B – SUMMARY OF SIGNIFICANT ACCOUNTING POLICIES
Financial Statement Presentation
The Company presents an unclassified balance sheet as a result of the extended amortization period (predominantly three to six years) of its reusable surgical products. The Company provides reusable surgical products to its customers on a per use basis similar to a rental arrangement.
The Company operates on a 52-53 week fiscal year ending the Sunday nearest December 31st. The financial statements reflect the Company’s year-end as of December 31st for presentation purposes only. The actual end of each period was January 3, 2010, December 28, 2008 and December 30, 2007. There were 53 weeks included in the year ended December 31, 2009 and 52 weeks included for the years ended December 31, 2008 and 2007.
Use of Estimates
Management is required to make certain estimates and assumptions during the preparation of financial statements and accompanying notes in conformity with accounting principles generally accepted in the United States of America. These estimates and assumptions affect the amounts reported in the financial statements and accompanying notes. Actual results could differ materially from those estimates and assumptions.
Cash and Cash Equivalents
The Company considers all highly liquid investments with an original maturity of three months or less to be cash and cash equivalents.
The Company maintains its cash and cash equivalents in financial institutions the Company considers of high credit quality. From time to time, the cash balances in these accounts exceed the Federal Deposit Insurance Corporation insured limits. To date, the Company has not experienced any losses in such accounts and believes it is not exposed to significant credit risk on its cash and cash equivalents.
Accounts Receivable, Net
The Company has accounts receivable from hospitals and surgery centers. The Company does not believe that there is sufficient credit risk associated with those receivables to require a form of collateral from its customers. The allowance for doubtful accounts as of December 31, 2009 and 2008 was approximately $124,000 and $106,000, respectively. The allowance for doubtful accounts relates to accounts receivable not expected to be collected and is based on management’s assessment of specific customer balances, the overall aging of the balances, and the financial stability of the customers. During 2008, the Company reduced its reserve for doubtful accounts by $759,000 primarily as the result of a customer that made substantial payments of past due amounts and brought its account current. The Company does not customarily charge interest on accounts receivable.
30
Table of Contents
Concentration of Credit Risk
For the year ended December 31, 2009, revenues relating to hospitals belonging to three group purchasing organizations (Novation, LLC, HealthTrust Purchasing Group, L.P., and MedAssets, Inc.) collectively accounted for approximately 62% of the Company’s revenues. For the years ended December 31, 2008 and 2007, revenues relating to hospitals belonging to these group purchasing organizations collectively accounted for approximately 65% and 63%, respectively, of the Company’s revenues. The Company had one customer, a healthcare provider, which accounted for approximately 10%, 11% and 11% of revenue for the years ended December 31, 2009, 2008 and 2007.
Unbilled Receivable
Included in prepaid expenses and other assets are unbilled receivables related to certain instruments purchased on behalf of a vendor in the amounts of $49,000 and $86,000 at December 31, 2009 and 2008, respectively.
Inventories, Net
Inventories consist of raw materials, principally consumables, supplies, and disposable surgical products; work in progress consisting of partially assembled reusable and disposable packs; and finished goods consisting of company-assembled packs of various combinations of raw materials and reusable surgical products, and disposable accessory packs purchased from third parties. Inventories are valued at the lower of cost or market, with cost being determined on the first-in, first-out method. As of December 31, 2009 and 2008, inventory consists of the following:
| December 31, | ||||||||
| 2009 | 2008 | |||||||
| (in 000’s) | ||||||||
| Raw materials |
$ | 1,274 | $ | 2,665 | ||||
| Work in progress |
— | 104 | ||||||
| Finished goods |
1,992 | 3,272 | ||||||
| 3,266 | 6,041 | |||||||
| Less: Inventory reserve |
(363 | ) | (314 | ) | ||||
| $ | 2,903 | $ | 5,727 | |||||
Reusable Surgical Products, Net
The Company’s reusable surgical products, consisting principally of linens (gowns, towels, and drapes), basins (stainless steel medicine cups, carafes, trays, basins) and owned surgical instruments, are stated at cost. Amortization of linens and basins is computed on a basis similar to the units of production method. Estimated useful lives for each product are based on the estimated total number of available uses for each product. The expected total available usage for our linen products using the three principal fabrics (accounting for approximately 74% of the reusable surgical products) is 75, 100, and 125 uses, based on several factors, including our actual historical experience with these products. The Company believes RFID technology enables it to evaluate the useful lives of linen products more efficiently. Basins are amortized on a straight-line basis over their estimated useful life, up to 20 years. Owned surgical instruments are amortized straight line over a period of four years. Accumulated amortization as of December 31, 2009 and 2008 was approximately $13.9 million and $14.1 million, respectively.
As of December 31, 2009 and 2008, the Company had reserves for shrinkage, obsolescence and scrap related to reusable surgical products of approximately $1,213,000 and $1,388,000, respectively.
31
Table of Contents
Property, Plant and Equipment, Net
Property, plant and equipment are stated at cost. Depreciation and amortization are computed on the straight-line method with a half-year convention over the estimated useful lives of the assets, or the term of the related leases for leasehold improvements, whichever is shorter.
Health Insurance
The Company offers employee benefit programs, including health insurance, to eligible employees. The Company retains a liability of up to $95,000 annually for each health insurance claim. The policy has an annual aggregate liability limit of $3.4 million. Health insurance costs are accrued using estimates to approximate the liability for reported claims and claims incurred but not reported.
Workers’ Compensation Insurance
The Company has a large dollar deductible, self-funded plan for its workers’ compensation insurance program. The Company retains a liability of $250,000 for each claim occurrence. The policy has an annual aggregate liability limit of $1.5 million. The Company has obtained letters of credit in the amount of $1,454,000 with its primary lender to secure the payment of future claims. The Company accrues workers’ compensation insurance costs using estimates to approximate the liability for reported claims and claims incurred but not reported, as determined by an independent actuary. As of December 31, 2009 and 2008, the Company accrued a liability of approximately $1,164,000 and $884,000, respectively, for claims incurred and claims incurred but not reported.
Revenue Recognition
Revenues are recognized as products and services are delivered, generally daily. Packing slips, signed and dated by the customer evidence delivery of product. The Company’s contractual relationships with its customers are primarily evidenced by purchase orders or service agreements with terms varying from one to five years, which are generally cancelable by either party.
The Company owns substantially all of the reusable surgical products provided to customers except the surgical instruments. A third party provides most of the surgical instruments that are included in the Company’s comprehensive surgical procedure-based delivery and retrieval service. The Company pays a fee to the third party for the use of the surgical instruments. In accordance with ASC Topic 605, Revenue Recognition (“ASC 605”), the Company acts as a principal in this arrangement and has reported the revenue gross for the comprehensive surgical procedure-based delivery and retrieval service. The third party agent fee charged to the Company is included in cost of revenues in the statements of operations.
Advertising
Costs associated with advertising are charged to expense as incurred. During the fiscal years ended December 31, 2009, 2008 and 2007, advertising costs of approximately $28,000, $19,000, and, $7,000 respectively, were charged to selling and administrative expenses in the Company’s statements of operations.
Income Taxes
Income taxes have been provided using the asset and liability method in accordance with ASC Topic 740. In accordance with ASC 740, deferred tax assets and liabilities are recognized for the future tax consequences attributable to differences between the financial statement carrying amounts of existing assets and liabilities and their respective tax bases. Deferred tax assets and liabilities are measured using enacted tax rates expected to apply to taxable income in the years in which those temporary differences are expected to be recovered or settled.
32
Table of Contents
The effect on deferred tax assets and liabilities of a change in the tax rate is recognized in operations in the period that includes the enactment date of the rate change. The tax benefits must be reduced by a valuation allowance in certain circumstances. The deferred tax assets are reviewed periodically for recoverability, and valuation allowances are provided for as necessary.
In July 2006, the Financial Accounting Standards Board (the “FASB”) issued an interpretation that is contained in ASC 740, which clarifies the accounting for and disclosure of uncertainty in tax positions. This interpretation prescribes a recognition threshold and measurement attribute for the financial statement recognition and measurement of a tax position taken or expected to be taken in a tax return. It also provides guidance on derecognition, classification, interest and penalties, accounting in interim periods, disclosure and transition associated with tax positions. The provisions of this interpretation were effective January 1, 2007. The Company completed an assessment of ASC 740 and determined that it did not have a material impact on its financial statements for the years ended December 31, 2009, 2008 and 2007.
Fair Value of Financial Instruments
The carrying amounts of cash and cash equivalents, accounts payable, accrued expenses and accounts receivable approximate fair value because of their short-term nature. The fair value of notes payable, bonds payable and mortgage payable approximate the carrying amount as the interest rates are based on market interest rates.
Loss Per Share
Basic loss per share is calculated by dividing net loss available for common shareholders by the weighted average number of common shares outstanding during the period. Diluted loss per share is calculated by dividing net loss by the weighted average number of common and potential common shares outstanding during the period. The number of potential common shares takes into account the dilutive effect of outstanding options, calculated using the treasury stock method.
Employee Termination Costs
The Company incurred an expense of $326,000, $212,000 and $442,000 in 2009, 2008, and 2007, respectively, for expenses related to the termination of executive officers and various employees. The Company had $21,000 and $109,000 of employee termination expense accrued as of December 31, 2009 and 2008, respectively.
Stock-based Compensation
Effective January 1, 2006, the Company adopted the provisions of ASC 718, Compensation-Stock Compensation, (“ASC 718”) for its stock-based compensation plans.
Under previous accounting guidance, no compensation expense was recorded in earnings for the Company’s stock options granted under the Company’s stock option plans. The pro forma effects on net income and earnings per share for stock options granted were instead disclosed in a footnote to the financial statements. Under ASC 718, all stock-based compensation cost is measured at the grant date, based on the fair value of the award, and is recognized as an expense over the requisite service period.
The Company adopted ASC 718 using the modified prospective method. Under this transition method, compensation cost to be recognized in fiscal year 2006 and later periods includes the cost for all share-based awards granted prior to, but not yet vested as of January 1, 2006. This cost was based on the grant-date fair value estimated in accordance with the original provisions of ASC 718. The cost for all stock-based awards granted subsequent to December 31, 2005, represents the grant-date fair value that was estimated in accordance with the
33
Table of Contents
provisions of ASC 718, utilizing the binomial (Lattice) model. Results for prior periods have not been restated. Stock-based compensation expense was $659,000, $912,000 and $783,000, or $659,000, $912,000 and $579,000 net of income tax, which contributed to a $0.10, $0.14 and $0.09 reduction in basic and diluted earnings per share for the years ended December 31, 2009, 2008 and 2007, respectively.
The Company did not receive any proceeds from stock option exercises under all shared-based payment arrangements for the years ended December 31, 2009 or 2008 because no exercises were made during these years. There was $318,000 of cash received from stock option exercises under all stock-based payment arrangements for the year ended December 31, 2007. There were no capitalized stock-based compensation costs at December 31, 2009.
Comprehensive Income
The Company accounts for all components of comprehensive income under the provisions of ASC 220, Comprehensive Income (“ASC 220”), which requires that total comprehensive income and comprehensive earnings per share be disclosed with prominence equal to that of net income and earnings per share. Comprehensive income is defined as changes in stockholders’ equity exclusive of transactions with owners such as capital contributions and dividends and specifically excluded items such as deferred compensation. The Company did not have any items of other comprehensive income on which to report in any of the years presented.
Fair Value Accounting
In September 2006, the FASB issued an accounting standard contained in ASC 820, Fair Value Measurements and Disclosures (“ASC 820”). ASC 820 defines fair value, establishes a framework for measuring fair value and requires enhanced disclosures about fair value measurements. ASC 820 creates a fair value hierarchy, which prioritizes the inputs to be used in determining fair value. Companies are required to disclose relevant fair value information in their financial statements that allows users to assess inputs used to measure fair value, and the effect of those measurements on earnings for the periods presented. Companies are also required to separately reconcile the beginning and ending balances for each major category of assets and liabilities. ASC 820 was effective for financial statements issued for fiscal years beginning after November 15, 2007, and interim periods within those fiscal years. The adoption of ASC 820 did not have a material impact on the Company’s financial statements.
In April 2007, the FASB issued an accounting standard contained in ASC 825, Financial Instruments (“ASC 825”). ASC 825 permits an entity to measure certain financial assets and financial liabilities at fair value where entities will report unrealized gains and losses in earnings at each subsequent reporting date. The standard allows entities to elect fair value application on an instrument-by-instrument basis with certain exceptions. The fair value option election is irrevocable in most cases. The new standard establishes presentation and disclosure requirements and assets and liabilities that are measured at fair value must be displayed on the face of the balance sheet. ASC 825 was effective for fiscal years beginning after November 15, 2007. The adoption of ASC 825 did not have a material impact on the Company’s financial statements.
Recently Issued Accounting Standards
In June 2009, the Financial Accounting Standards Board (“FASB”) issued a standard that established the FASB Accounting Standards Codification™ (“ASC”) and amended the hierarchy of generally accepted accounting principles (“GAAP”) such that the ASC became the single source of authoritative nongovernmental U.S. GAAP. The ASC did not change current U.S. GAAP, but was intended to simplify user access to all authoritative U.S. GAAP by providing all the authoritative literature related to a particular topic in one place. All previously existing accounting standard documents were superseded and all other accounting literature not
34
Table of Contents
included in the ASC is considered non-authoritative. New accounting standards issued subsequent to June 30, 2009 are communicated by the FASB through Accounting Standards Updates (“ASU”). For the Company, the ASC was effective July 1, 2009. This standard did not have an impact on the Company’s results of operations or financial condition. However, throughout the notes to the financial statements references that were previously made to various former authoritative U.S. GAAP pronouncements have been changed to coincide with the appropriate section of the ASC.
In August 2009, the FASB issued ASU No. 2009-05, Measuring Liabilities at Fair Value, which provides additional guidance on how companies should measure liabilities at fair value under ASC 820. The ASU clarifies that the quoted price for an identical liability should be used. However, if such information is not available, an entity may use, the quoted price of an identical liability when traded as an asset, quoted prices for similar liabilities or similar liabilities traded as assets, or another valuation technique (such as the market or income approach). The ASU also indicates that the fair value of a liability is not adjusted to reflect the impact of contractual restrictions that prevent its transfer and indicates circumstances in which quoted prices for an identical liability or quoted price for an identical liability traded as an asset may be considered level 1 fair value measurements. For the Company, this ASU was effective October 1, 2009. The adoption of this standard did not have a material impact on the Company’s results of operations or financial condition.
In January 2010, the FASB issued ASU No. 2010-6, Improving Disclosures About Fair Value Measurements, that amends existing disclosure requirements under ASC 820 by adding required disclosures about items transferring into and out of levels 1 and 2 in the fair value hierarchy; adding separate disclosures about purchase, sales, issuances, and settlements relative to level 3 measurements; and clarifying, among other things, the existing fair value disclosures about the level of disaggregation. For SRI, this ASU is effective for the first quarter of 2010, except for the requirement to provide level 3 activities of purchases, sales, issuances, and settlements on a gross basis, which is effective beginning the first quarter of 2011. Since this standard impacts disclosure requirements only and SRI does not have any items recorded at fair value that meet the classification as Level 2 or Level 3 items, its adoption will not have a material impact on SRI’s results of operations or financial condition.
NOTE C – PROPERTY, PLANT AND EQUIPMENT
Property, plant and equipment consist of the following:
| Useful Lives In Years |
December 31, | |||||||||
| 2009 | 2008 | |||||||||
| (in 000’s) | ||||||||||
| Land |
— | $ | 1,582 | $ | 1,582 | |||||
| Land improvements |
15 | 646 | 646 | |||||||
| Construction in process Buildings and improvements |
— 20-40 |
|
1,607 16,093 |
|
|
1,326 16,016 |
| |||
| Leasehold improvements |
2-18 | 7,935 | 8,141 | |||||||
| Machinery and equipment |
3-12 | 25,226 | 25,314 | |||||||
| Office furniture, equipment and computers |
3-10 | 8,602 | 8,529 | |||||||
| 61,691 | 61,554 | |||||||||
| Less: Accumulated depreciation and amortization |
(34,026 | ) | (32,067 | ) | ||||||
| $ | 27,665 | $ | 29,487 | |||||||
In accordance with ASC Topic 350, Intangible-Goodwill and Other (“ASC 350”), certain external direct costs of materials and services, and other qualifying costs incurred in connection with developing or obtaining internal use software are capitalized. The Company capitalized costs of internally developed software in the amounts of approximately $306,000 and $725,000 during the years ended December 31, 2009 and 2008, respectively. Such capitalized costs primarily relate to the cost of software and certain contracted programming costs, as well as other such qualifying costs.
35
Table of Contents
Construction in process primarily relates to internally developed software-related costs for electronic data interchange, quoting, and data management tools to be used in the Company’s daily operations.
For the years ended December 31, 2009, 2008 and 2007, depreciation and amortization expense was approximately $3.4 million, $3.5 million, and $3.4 million, respectively.
NOTE D – NOTES PAYABLE
On August 7, 2008, the Company entered into a three-year $24.3 million credit facility with a financial institution to replace an expiring $20 million credit facility and $4.2 million mortgage loan on its Tampa headquarters. The credit facility includes a revolving loan of up to $20 million for working capital, letters of credit, capital expenditures and other purposes, and a $4.3 million term loan, which replaces the mortgage loan. Actual amounts available under the revolving loan are determined by a defined borrowing base, which primarily relates to outstanding receivables, inventories and reusable surgical products. As a result of the borrowing base calculation, as of December 31, 2009, the Company had $17.6 million available for advances of which the Company had used $10.5 million of the revolving loan, including $6.1 million of advances, $2.2 million of availability for letters of credit to support the Company’s bonds and self-insurance policies and $2.2 million maintained as a required reserve. As a result, at December 31, 2009, the Company had excess availability of $7.1 million. As of December 31, 2009, the Company had $4.0 million outstanding on the term loan, which is classified as a mortgage payable. The term loan amortizes based on a 20-year schedule, with the remaining principal balance due on the expiration date of the facility, which is August 7, 2011. The credit facility is secured by substantially all of the Company’s assets.
As of December 31, 2009, the credit facility required the Company to comply with (a) a minimum tangible net worth of $40 million and (b) a fixed charge coverage ratio of 1.10 to one. The Company did not satisfy the tangible net worth covenant required by the credit facility for the year ended December 31, 2009. The financial institution waived the requirement to meet the covenant as of December 31, 2009. In addition, the financial institution amended the credit facility to require the Company to maintain a minimum tangible net worth covenant of at least $35 million through December 31, 2010 and $37.5 million thereafter, and set the fixed charge coverage ratio as no less than 0.90 to 1.00 through August 31, 2010 and 1.10 to 1.00 thereafter. As amended, the interest rate on the revolving loan varies between 250 and 300 basis points over LIBOR or between 150 and 200 basis points over the Prime Rate, depending on the level of the fixed charge coverage ratio. Interest on the term loan varies between 275 and 325 basis points over LIBOR or between 175 and 225 basis points over the Prime Rate, depending on the level of the fixed charge coverage ratio. The type of interest rate is an election made periodically by the Company. As of December 31, 2009, $4.0 million of the outstanding revolving loan balance was based on LIBOR plus 2.25% (2.625% at October 19 ,2009) and the remaining outstanding balance of $2.1 million was at the Prime Rate of 3.25%. As of December 31, 2009, $3.9 million of the outstanding term loan was based on LIBOR plus 2.25% (2.625% as of November 6, 2009) and the remaining outstanding balance of $100,000 was at the Prime Rate of 3.25%.
The credit facility includes typical provisions restricting the Company from paying dividends, incurring additional debt, making loans and investments, encumbering its assets, entering into a business outside of current operations, or entering into certain merger, consolidation, or liquidation transactions.
On July 28, 2008, the Company entered into a short-term agreement to finance the annual premiums under certain of its insurance contracts. The amount outstanding under the agreement was $442,000 at December 31, 2008. The agreement called for equal monthly payments of principal and interest over a term of nine months, with the final payment due on May 1, 2009. The stated interest rate under the agreement was 3.85%. This agreement was not renewed in 2009.
For the years ended December 31, 2009, 2008, and 2007, interest expense was approximately $619,000, $1.1 million, and $1.4 million, respectively. Interest expense in 2009 and 2008 included approximately $106,965
36
Table of Contents
and $219,000, respectively, of interest related to a mortgage, see Note E – Mortgage Payable. Interest expense in 2009 and 2008 included approximately $76,000 and $192,000, respectively, of interest related to the bonds, see Note F – Bonds Payable.
NOTE E – MORTGAGE PAYABLE
As noted above under Note D – Notes Payable, on August 7, 2008, the Company replaced the previous mortgage note on the Company’s corporate headquarters with a new $4.3 million mortgage. The mortgage loan has a term of three (3) years and an amortization schedule based on 20 years, with a balloon payment due on August 7, 2011. As amended pursuant to the Waiver and Amendment No. 1 to the Loan Agreement described in Note D above, interest on the loan varies between 200 and 300 basis points over LIBOR or 175 basis points over the Prime Rate. The type of interest rate is an election made periodically by the Company. At December 31, 2009, $3.9 million of the mortgage bears an interest rate of LIBOR plus 2.25% (2.625% at November 6, 2009) and the remaining outstanding balance of $100,000 was at the Prime Rate of 3.25%.
Mortgage payments as of December 31, 2009 for the next two years are as follows (in 000’s):
| 2010 |
$ | 215 | |
| 2011 |
3,798 | ||
| Total |
$ | 4,013 | |
NOTE F – BONDS PAYABLE
In 1999, the Company issued public bonds to fund the construction of two of its reusable processing facilities. Interest expense adjusts based on rates that approximate LIBOR (0.29% at December 31, 2009). Starting in 2004, the Company began amortizing the bonds through quarterly payments of $165,000. A balloon principal payment of $3.1 million on the bonds is due in 2014. The bonds payable are secured by the two reusable processing facilities.
In October 2008, $6.0 million of the Company’s bonds were tendered. The holders of the tendered bonds were paid from draws against the letters of credit under the Company’s credit facility, see Note D – Notes Payable above, and will be reflected as outstanding notes payable until they are remarketed. Under the terms of the indentures relating to the bonds, the tendered bonds can be remarketed at any time prior to their maturity in 2014.
Letters of credit issued by the Company’s lenders for amounts totaling $7.2 million secure these bonds; however, only $520,000 of the letters of credit are outstanding as of December 31, 2009 as a result of the bonds being tendered. The Company paid a commitment fee of approximately $76,000 for the letters of credit in 2009. The letters of credit must be renewed each year through the bonds’ maturity in 2014, which the Company has complied with.
Bond payments as of December 31, 2009 for the next five years are as follows (in 000’s):
| Years ending December 31 | |||
| 2010 |
$ | — | |
| 2011 |
— | ||
| 2012 |
— | ||
| 2013 |
— | ||
| 2014 |
520 | ||
| Total |
$ | 520 | |
37
Table of Contents
NOTE G – COMMITMENTS AND CONTINGENCIES
Operating Leases
The Company leases facilities, office equipment, and distribution vehicles under non-cancelable operating leases with terms ranging from one to fifteen years. The processing facility leases contain various renewal options and escalating payments. The Company intends to exercise certain aspects of these renewal options when the initial terms expire. The vehicle leases contain contingent rentals based on mileage.
Future minimum lease payments as of December 31, 2009 are as follows (in 000’s):
| Years ending December 31 | |||
| 2010 |
$ | 2,404 | |
| 2011 |
2,157 | ||
| 2012 |
1,266 | ||
| 2013 |
407 | ||
| 2014 |
227 | ||
| Thereafter |
459 | ||
| Total |
$ | 6,920 | |
Rental expense for the years ended December 31, 2009, 2008 and 2007 totaled approximately $3.5 million, $3.5 million, and $3.9 million (including contingent rentals of approximately $313,000, $275,000, and $275,000), respectively.
Contractual Obligations
The Company offers instruments pursuant to a Joint Marketing Agreement with Aesculap, Inc. (“Aesculap”). Under the terms of this agreement, Aesculap furnishes and repairs most of the surgical instruments that are delivered to customers and receives an agreed upon fee for each procedure. The Company had a procurement agreement with Standard Textile Co., Inc. (“Standard Textile”) under which the Company agreed to purchase 90% of its reusable surgical linens from Standard Textile through August 2008. The Company is currently working with Standard Textile on a month-to-month basis until a new agreement can be reached.
The Company’s management believes that Aesculap and Standard Textile’s prices are and will be comparable to prices available from other vendors. Standard Textile is a shareholder of the Company. If Aesculap or Standard Textile were unable to perform under these procurement agreements, the Company would need to obtain alternate sources for its reusable surgical products. The Company is not bound to purchase any minimum quantity of products under these agreements; however, the Company expects to make payments under them to fulfill its requirements. The Company estimates that its payments under these agreements will be between $14.0 and $16.0 million in 2010. Amounts in subsequent years will be comparable, adjusted by changes in the Company’s customer demand, amortization rates, product prices, and other variables affecting its business. During the years ended December 31, 2009, 2008, and 2007, the Company purchased products in the amounts of $4.8 million, $5.6 million, and $3.0 million, respectively, from Standard Textile. During the years ended December 31, 2009, 2008, and 2007, the Company incurred fees of $11.3 million, $11.9 million, and $11.0 million, respectively, to Aesculap for instrument usage.
Management Employment Agreements
The Company has an employment agreement with its Chief Executive Officer and Chief Financial Officer that provides for payment of twelve months and nine months base salary, respectively, and a pro-rated bonus as severance, if involuntarily terminated by the Company. The officers are prohibited from competing with the
38
Table of Contents
Company during the two-year period following termination of their employment. The Company incurred a charge of approximately $238,000 in 2009 in connection with the termination agreement between the Company and the former Chief Financial Officer. The Company incurred a charge of approximately $370,000 in 2007 in connection with the termination agreement between the Company and the former Chief Executive Officer.
Legal Proceedings
From time to time, the Company is involved in claims that arise in the ordinary course of business. The Company does not believe these proceedings, individually or in the aggregate, will have a material adverse effect on its financial position, results of operations, or cash flows.
NOTE H – INCOME TAX
The expense (benefit) for income taxes from continuing operations for the three years ended December 31 were as follows (in 000’s):
| 2009 | 2008 | 2007 | |||||||||
| Current |
$82 | $(157) | $(115) | ||||||||
| Deferred |
— | (55 | ) | (1,650 | ) | ||||||
| Total |
$ | 82 | $ | (212 | ) | $ | (1,765 | ) | |||
The reconciliation of the federal statutory income tax rate of 34.0% to the effective income tax rate for the three years ended December 31 was as follows:
| 2009 | 2008 | 2007 | |||||||
| Federal statutory income tax rate |
34.0 | % | 34.0 | % | 34.0 | % | |||
| State income taxes, net of federal |
4.8 | 3.0 | 3.8 | ||||||
| Non-deductible items |
(2.7 | ) | (2.3 | ) | (2.1 | ) | |||
| Valuation allowance |
(38.6 | ) | (27.2 | ) | 0.5 | ||||
| Other |
0.3 | 0.2 | (0.6 | ) | |||||
| (2.2 | )% | 7.7 | % | 35.6 | % | ||||
Significant components of the Company’s deferred tax assets and liabilities were as follows (in 000’s):
| December 31, | ||||||||
| 2009 | 2008 | |||||||
| Deferred tax assets: |
||||||||
| Inventory |
$ | 603 | $ | 613 | ||||
| Accounts receivable |
47 | 40 | ||||||
| Accrued expenses |
878 | 713 | ||||||
| State tax credits |
796 | 695 | ||||||
| AMT tax credit carryforward |
— | 40 | ||||||
| Federal and state net operating losses |
930 | 1,335 | ||||||
| Goodwill |
46 | 56 | ||||||
| Stock options |
674 | 495 | ||||||
| Other |
31 | 68 | ||||||
| 4,005 | 4,055 | |||||||
| Valuation allowance |
(2,741 | ) | (1,296 | ) | ||||
| 1,264 | 2,759 | |||||||
| Deferred tax liabilities: |
||||||||
| Property, plant & equipment |
(1,135 | ) | (2,538 | ) | ||||
| Other |
(129 | ) | (221 | ) | ||||
| (1,264 | ) | (2,759 | ) | |||||
| Net deferred income tax asset (liability) |
$ | — | $ | — | ||||
39
Table of Contents
As of December 31, 2009, the Company has federal net operating loss carry-forwards of $2.1 million that will expire between 2027 and 2029, as well as state net operating loss carry-forwards of $5.9 million that expire between 2011 and 2029. At December 31, 2009, the Company also has a net state tax credit carry-forward of approximately $796,000. Approximately $30,000 of the state tax credit carry-forward has a 15-year carry-forward limitation, which begins to expire in 2012. The remaining state tax credit carry-forward amounts have no expiration period.
ASC 740 requires a valuation allowance to reduce reported deferred tax assets if, based on the weight of the evidence, it is more likely than not that some portion or all of the deferred tax assets will not be realized. After consideration of all the evidence, an allowance of $2,741,000 has been established to reduce the deferred tax assets to the amount that will more likely than not be realized. During 2008, the valuation allowance increased $752,000 primarily as a result of the loss incurred during the year. During 2009, the valuation allowance increased $1,445,000.
NOTE I – SHAREHOLDERS’ EQUITY
Common Stock
Subject to preferences which might be applicable to any outstanding preferred stock, the holders of common stock are entitled to receive dividends when, as, and if declared from time to time by the Board of Directors out of funds legally available. The Company’s revolving credit facility restricts the Company from paying dividends. In the event of liquidation, dissolution, or winding-up of the Company, holders of the common stock are entitled to share ratably in all assets remaining after payment of liabilities, subject to prior distribution rights of any preferred stock then outstanding. The common stock has no preemptive or conversion rights and is not subject to call or assessment by the Company. There are no redemption or sinking fund provisions applicable to the common stock.
Preferred Stock
The Company is authorized to issue 5,000,000 shares of preferred stock, $.001 par value per share. The Board of Directors has the authority, without any further vote or action by the Company’s shareholders, to issue preferred stock in one or more series and to fix the number of shares, designations, relative rights (including voting rights), preferences, and limitations of those series to the full extent now or hereafter permitted by Florida law. The Company does not have any outstanding shares of preferred stock at December 31, 2009 or 2008.
NOTE J – STOCK-BASED COMPENSATION
The Company maintains four stock option plans: the 1995 Stock Option Plan, the 1996 Non-Employee Director Plan, the 1998 Stock Option Plan, and the 2004 Stock Compensation Plan.
The 1995 Stock Option Plan
The 1995 Stock Option Plan was designed to provide employees with incentive or non-qualified options to purchase up to 700,000 shares of common stock. The options vest ratably over four to five years from the date of grant. All outstanding options vest upon a change in control of the Company. Options granted under this Plan expire no later than ten years after the date granted or sooner in the event of death, disability, retirement or termination of employment. As of December 31, 2009 and 2008, options to purchase 50,500 and 81,500 shares, respectively, were outstanding. The 1995 Stock Option Plan terminated on December 21, 2005, although that termination does not adversely affect any options outstanding under the Plan.
The 1996 Non-Employee Director Plan
As amended on May 16, 2001, the Non-Employee Plan is designed to provide for the grant of non-qualified stock options to purchase up to 200,000 shares of common stock to members of the Board of Directors who are not employees of the Company. At the completion of its initial public offering, each non-employee director was
40
Table of Contents
granted options to purchase 4,000 shares of common stock for each full remaining year of the director’s term. Thereafter, on the date on which a new non-employee director is first elected or appointed, he or she is automatically granted options to purchase 4,000 shares of common stock for each year of his or her initial term, and will be granted options to purchase 4,000 shares of common stock for each year of any subsequent term to which he or she is elected. As of March 2006, the equity component of the director compensation plan was restructured, so that each non-employee director will receive an annual grant of options to purchase 7,500 shares of common stock as of the date of the Annual Shareholder Meeting. All options vest ratably over a three-year term and have an exercise price equal to the fair market value of the common stock on the date of grant. As of December 31, 2009 and 2008, options to purchase 70,000 and 120,000 shares, respectively, were outstanding. The 1996 Non-Employee Director Plan terminated on July 14, 2006, although that termination does not adversely affect any options outstanding under the Plan.
The 1998 Stock Option Plan
As amended on May 16, 2001, the 1998 Stock Option Plan is designed to provide employees with incentive or non-qualified options to purchase up to 600,000 shares of common stock. The options vest ratably over four to five years from the date of the grant. All outstanding options vest upon a change in control of the Company. Options granted under this Plan expire no later than ten years after the date granted or sooner in the event of death, disability, retirement, or termination of employment. As of December 31, 2009 and 2008, options to purchase 345,800 and 379,400 shares, respectively, were outstanding, and 0 and 0 options, respectively, were available to be granted under this Plan. The 1998 Stock Option Plan terminated on February 17, 2008, although that termination does not adversely affect any options outstanding under the Plan.
The 2004 Stock Compensation Plan
The 2004 Stock Compensation Plan is designed to further the interests of the Company and its shareholders by providing incentives in the form of incentive or non-qualified stock options or restricted stock grants of up to 500,000 shares to key employees and non-employee directors who contribute materially to the success and profitability of the Company. Under this Plan, restricted stock grants are not considered outstanding options upon grant but are considered issued and outstanding stock. When restricted stock awards are forfeited they are considered as available for grant. The equity awards typically vest ratably over five years from the date of the grant. All outstanding grants vest upon a change in control of the Company. Options granted under this Plan expire no later than ten years after the date granted or sooner in the event of death, disability, retirement, or termination of employment. At the Company’s annual meeting of shareholders on May 24, 2007, the shareholders approved an amendment to the 2004 Stock Compensation Plan to authorize an additional 500,000 shares under the Plan. As of December 31, 2009 and 2008, options to purchase 589,350 and 375,500 shares respectively, were outstanding, and 339,850 and 553,700 options, respectively, were available to be granted as options or restricted stock under this Plan.
The 2009 Stock Compensation Plan
The 2009 Stock Compensation Plan is designed to further the interests of the Company and its shareholders by providing incentives in the form of incentive or non-qualified stock options or restricted stock grants to key employees and non-employee directors who contribute materially to the success and profitability of the Company. Under this Plan, restricted stock grants are not considered outstanding options upon grant but are considered issued and outstanding stock. Any forfeited restricted stock awards are considered to be available for grant. Except for annual grants to non-employee directors described above, the equity awards typically vest ratably over five years from the date of the grant. All outstanding grants vest upon a change in control of the Company. Options granted under this Plan expire no later than ten years after the date granted or sooner in the event of death, disability, retirement, or termination of employment. At the Company’s annual meeting of shareholders on May 21, 2009, the shareholders approved the 2009 Stock Compensation Plan and authorized 600,000 shares available for grant under the Plan, all of which were available at December 31, 2009. As of December 31, 2009, there were no options outstanding under this Plan.
41
Table of Contents
Summary Stock Option Information
The fair value of each option grant is estimated on the date of grant using a Binomial options-pricing model. The Company’s stock-based compensation expense model uses graded vesting, with shares being earned per day under the accrual method. In addition, the Company estimates forfeitures on the date of grant. The following weighted-average assumptions were used for grants in the years ended December 31, 2009, 2008 and 2007, respectively; no dividend yield for all years; expected volatility of 108%, 101% and 63%; risk-free interest rates of approximately 3.5%, 2.6%, and 3.8%; and expected lives of 7.2, 6.9, and 6.5 years. The weighted average fair value of options granted during the years ended December 31, 2009, 2008 and 2007 were $1.03, $2.76, and $3.01, respectively.
A summary of the status of the Company’s stock option plans as of December 31, 2009, 2008 and 2007 and changes during the years ended on those dates is presented below:
| Options | Weighted Average Exercise Price | |||||
| Outstanding as of January 1, 2007 |
819,100 | $ | 8.21 | |||
| Granted |
298,000 | 4.77 | ||||
| Exercised |
(61,957 | ) | 5.15 | |||
| Forfeited |
(171,543 | ) | 7.87 | |||
| Outstanding as of December 31, 2007 |
883,600 | $ | 7.33 | |||
| Granted |
310,500 | 4.06 | ||||
| Exercised |
— | — | ||||
| Forfeited |
(87,700 | ) | 10.21 | |||
| Outstanding as of December 31, 2008 |
1,106,400 | $ | 6.18 | |||
| Granted |
328,350 | 1.21 | ||||
| Exercised |
— | — | ||||
| Forfeited |
(229,100 | ) | 8.17 | |||
| Outstanding as of December 31, 2009 |
1,205,650 | $ | 4.45 | |||
The following table summarizes information concerning outstanding and exercisable stock options as of December 31, 2009:
| Range of Exercise Prices |
Number Outstanding | Weighted Average Remaining Contractual Life (years) |
Weighted Average Exercise Price | ||||
| All Outstanding Options |
|||||||
| $ 0.93 – $ 5.85 |
1,097,150 | 7.5 | $ | 3.63 | |||
| 5.86 – 9.50 |
41,500 | 4.1 | 6.70 | ||||
| 9.51 – 17.50 |
52,000 | 1.9 | 15.68 | ||||
| 17.51 – 25.00 |
15,000 | 1.2 | 19.39 | ||||
| 1,205,650 | $ | 4.45 | |||||
| Exercisable Options |
|||||||
| $ 0.93 – $ 5.85 |
412,700 | $ | 4.80 | ||||
| 5.86 – 9.50 |
41,500 | 6.70 | |||||
| 9.51 – 17.50 |
52,000 | 15.68 | |||||
| 17.51 – 25.00 |
15,000 | 19.39 | |||||
| 521,200 | $ | 6.46 | |||||
42
Table of Contents
As of December 31, 2008 and December 31, 2007, there were 483,633 and 405,686 exercisable options outstanding at weighted average exercise prices of $6.53 and $10.27, respectively.
The following table summarizes option grant activity from January 1, 2009 through December 31, 2009:
| Shares Available for Grant |
Options Outstanding |
Weighted Average Exercise Price |
Weighted Average Remaining Contractual Life | ||||||||
| Balance at January 1, 2009 |
553,700 | 1,106,400 | $ | 6.18 | 6.85 | ||||||
| Options and restricted stock authorized |
600,000 | — | — | ||||||||
| Options expired |
52,500 | (148,500 | ) | $ | 10,39 | ||||||
| Options and restricted stock granted |
(328,350 | ) | 328,350 | $ | 1.21 | ||||||
| Options and restricted stock forfeited |
72,000 | (80,600 | ) | $ | 4.07 | ||||||
| Options canceled |
— | — | — | ||||||||
| Options exercised |
— | — | — | ||||||||
| Balance at December 31, 2009 |
949,850 | 1,205,650 | $ | 4.45 | 7.05 | ||||||
| Options exercisable at December 31, 2009 |
— | 521,000 | $ | 6.46 | 5.21 | ||||||
The weighted-average grant date fair value of options granted during the years ended December 31, 2009, 2008 and 2007 was $1.03, $2.76 and $3.01, respectively. There were no options exercised during the year ended December 31, 2009. For the year ended December 31, 2007, the total intrinsic value of options exercised was $13,600. As of December 31, 2009, there was $561,000 of unrecognized compensation cost related to non-vested options and restricted stock that is expected to be recognized over a weighted average period of 1.0 years. The total fair value of options and restricted stock vested during the years ended December 31, 2009 and 2008 was $659,000 and $912,000, respectively. The total fair value of options vested during the year ended December 31, 2009 that were issued prior to adoption of ASC 718 was $35,000. The aggregate intrinsic value of options fully vested at December 31, 2009 was $0. The aggregate intrinsic value of options outstanding at December 31, 2009 and expected to vest was $267,000.
The Company consistently used the binomial model for estimating the fair value of options granted in the years ended December 31, 2009, 2008 and 2007. The Company used historical data to estimate the option exercise and employee departure behavior used in the binomial valuation model. Forfeitures are estimated on the date of grant and shares vest on a graded schedule, with shares being earned per day under the accrual method. The expected term of options granted is derived from the output of the option pricing model and represents the period of time that options granted are expected to be outstanding. The risk-free rates for periods within the contractual term of the options are based on the U.S. Treasury stripped coupon interest in effect at the end of the quarter. Because the binomial valuation model accommodates multiple input values, the risk free interest rates and expected term rates used in calculating the fair value of the options, are expressed in ranges. Expected volatility is based on historical volatility of the Company’s stock.
Following are the weighted-average and range assumptions, where applicable, used for each respective period:
| Twelve Months Ended | ||||||
| December 31, | December 31, | December 31, | ||||
| 2009 | 2008 | 2007 | ||||
| (Binomial) | ||||||
| Expected dividend yield |
0.0% | 0.0% | 0.0% | |||
| Risk-free interest rate |
1.10 to 3.96% | 0.81 to 4.34% | 3.03 to 5.12% | |||
| Weighted-average expected volatility |
108.32% | 100.75% | 62.5% | |||
| Expected term |
2.5 to 8.8 years | 1.8 to 9.5 years | 1.8 to 9.4 years | |||
| Forfeiture rate |
0.59 to 28.01% | 0.14 to 41.76% | 0.18 to 41.76% | |||
| Respective service period |
3 to 5 years | 3 to 5 years | 3 to 5 years | |||
43
Table of Contents
Restricted Stock Awards
In fiscal year 2006, the Company granted unvested common stock awards (“restricted stock”) to certain key employees pursuant to the 2004 Stock Compensation Plan. The shares vest ratably over five years. The restricted stock awards granted in 2006 were accounted for using the measurement and recognition principles of ASC 718. Compensation for restricted stock awards is measured at fair value on the date of grant based on the number of shares expected to vest and the quoted market price of the Company’s common stock. Compensation cost for all awards will be recognized in earnings, net of estimated forfeitures, on a straight-line basis over the requisite service period.
The Company recorded $83,000, $107,000 and $76,000 in compensation expense related to the restricted stock that vested during the years ended December 31, 2009, 2008 and 2007, respectively. As of December 31, 2009, there was approximately $85,000 of total unrecognized compensation cost related to restricted stock awards granted under the Plan which is expected to be recognized over a period of one year.
NOTE K – LOSS PER SHARE
The following table sets forth the computation of basic and diluted loss per share:
| Years ended December 31, | ||||||||||||
| 2009 | 2008 | 2007 | ||||||||||
| (in 000’s except per share data) | ||||||||||||
| Basic |
||||||||||||
| Numerator: |
||||||||||||
| Loss available for common shareholders |
$ | (3,776 | ) | $ | (2,556 | ) | $ | (3,193 | ) | |||
| Denominator: |
||||||||||||
| Weighted average shares outstanding |
6,464 | 6,434 | 6,399 | |||||||||
| Loss per common share – basic |
$ | (0.58 | ) | $ | (0.40 | ) | $ | (0.50 | ) | |||
| Diluted |
||||||||||||
| Numerator: |
||||||||||||
| Net loss |
$ | (3,776 | ) | $ | (2,556 | ) | $ | (3,193 | ) | |||
| Denominator: |
||||||||||||
| Weighted average shares outstanding |
6,464 | 6,434 | 6,399 | |||||||||
| Effect of dilutive securities: |
||||||||||||
| Employee stock options |
— | — | — | |||||||||
| Weighted average shares outstanding – Diluted |
6,464 | 6,434 | 6,399 | |||||||||
| Loss per common share – diluted |
$ | (0.58 | ) | $ | (0.40 | ) | $ | (0.50 | ) | |||
Options to purchase 1,161,710, 1,046,569 and 820,675 shares of common stock for the years ended December 31, 2009, 2008 and 2007, respectively, were not included in the computation of diluted earnings per common share, because the assumed proceeds per share were greater than the average market price, and therefore, were anti-dilutive. The dilutive effect of 15,633, 0 and 44,185 options with assumed proceeds per share less than the average market price, were not included for the years ended December 31, 2009, 2008 and 2007, respectively, because the effect would be anti-dilutive due to the Company’s net loss for the period.
NOTE L – LEASE AGREEMENT
Effective March 1, 2007, the Company entered into an agreement to lease to a third party a portion of its corporate headquarters under the terms of a non-cancelable operating lease. The lease calls for an initial term of
44
Table of Contents
five (5) years with a tenant option to renew for one extension period of five years. The lease agreement provides for escalating rental payments over its term. Under the agreement, the tenant pays an allocated share of the increase over the base year of certain costs, including utilities, maintenance costs and property taxes.
Future minimum lease payments expected to be received as of December 31, 2009 are as follows (in 000’s):
| Year ending December 31 | |||
| 2010 |
$ | 375 | |
| 2011 |
387 | ||
| 2012 |
97 | ||
| $ | 859 | ||
Rental income, which is included in other income in the statements of operations, was approximately $361,000 for each of the years ended December 31, 2009 and 2008.
NOTE M – SRI 401(k) PLAN
The Company sponsors the SRI/Surgical Express, Inc. 401(k) Plan (the “Plan”), a defined contribution plan established under Section 401(k) of the U.S. Internal Revenue Code. Employees are eligible to contribute voluntarily to the Plan after six months of continued service, satisfying 1,000 hours of service and attaining age 21. In addition to the employees’ contributions, at its discretion, the Company may contribute 50% of the first 4% of the employee’s contribution. The Plan allows for employee elective contributions up to an amount equivalent to 15% of salary. Employees are always vested in their contributed balance and vest ratably in the Company’s contribution over three years. For the years ended December 31, 2009, 2008, and 2007, the Company’s expense related to the Plan was approximately $303,000, $269,000, and $228,000, respectively.
NOTE N – RELATED PARTY TRANSACTIONS
The Company had a procurement agreement with Standard Textile under which the Company agreed to purchase 90% of its reusable surgical products from Standard Textile through August 2008. The Company is currently working with Standard Textile on a month-to-month basis until a new agreement can be reached. Standard Textile is a shareholder of the Company. During the years ended December 31, 2009, 2008, and 2007, the Company purchased products in the amounts of $4.8 million, $5.6 million, and $3.0 million, respectively, from Standard Textile.
During the years ended December 31, 2009, 2008 and 2007, the Company paid approximately $1,000, $4,500, and $13,500, respectively, to a company to design and supply the components for water reclamation systems for Company facilities. A shareholder of the Company owns the business providing these services.
During the years ended December 31, 2009,2008 and 2007, the Company paid approximately $93,000, $258,000, and $243,000 respectively, in consulting fees to a director and shareholder of the Company for assistance with managing the facilities operations while the Company searched for a new operations leader.
45
Table of Contents
NOTE O – SELECTED QUARTERLY FINANCIAL DATA (Unaudited)
The following selected unaudited quarterly information is being disclosed in accordance with Regulation S-K (Item 302):
| Quarters Ended | ||||||||||||||||
| Mar. 31, 2009 | Jun. 30, 2009 | Sep. 30, 2009 | Dec. 31, 2009 | |||||||||||||
| (In thousands, except per share data) | ||||||||||||||||
| Revenues |
$ | 23,926 | $ | 24,617 | $ | 24,120 | $ | 25,790 | ||||||||
| Gross profit |
$ | 5,034 | $ | 5,344 | $ | 4,094 | $ | 5,626 | ||||||||
| Net loss |
$ | (894 | ) | $ | (704 | ) | $ | (1,755 | ) | $ | (422 | ) | ||||
| Basic loss per share |
$ | (0.14 | ) | $ | (0.11 | ) | $ | (0.27 | ) | $ | (0.07 | ) | ||||
| Diluted loss per share |
$ | (0.14 | ) | $ | (0.11 | ) | $ | (0.27 | ) | $ | (0.07 | ) | ||||
| Quarters Ended | ||||||||||||||||
| Mar. 31, 2008 | Jun. 30, 2008 | Sep. 30, 2008 | Dec. 31, 2008 | |||||||||||||
| (In thousands, except per share data) | ||||||||||||||||
| Revenues |
$ | 23,968 | $ | 25,113 | $ | 23,959 | $ | 23,988 | ||||||||
| Gross profit |
$ | 5,043 | $ | 5,847 | $ | 5,318 | $ | 5,221 | ||||||||
| Net loss |
$ | (1,294 | ) | $ | (390 | ) | $ | (173 | ) | $ | (699 | ) | ||||
| Basic loss per share |
$ | (0.20 | ) | $ | (0.06 | ) | $ | (0.03 | ) | $ | (0.11 | ) | ||||
| Diluted loss per share |
$ | (0.20 | ) | $ | (0.06 | ) | $ | (0.03 | ) | $ | (0.11 | ) | ||||
46
Table of Contents
SCHEDULE II – VALUATION AND QUALIFYING ACCOUNTS
SRI/SURGICAL EXPRESS, INC.
| Description |
Balance at Beginning of Period |
Charged to Costs and Expenses |
Write-offs/ Reductions |
Balance at end of Period | |||||||||
| Allowance for doubtful accounts: |
|||||||||||||
| Year ended December 31, 2007 |
$ | 474,000 | $ | 791,000 | $ | (400,000 | ) | $ | 865,000 | ||||
| Year ended December 31, 2008 |
865,000 | — | (759,000 | ) | 106,000 | ||||||||
| Year ended December 31, 2009 |
106,000 | 74,000 | (56,000 | ) | 124,000 | ||||||||
| Reserve for shrinkage, obsolescence, and scrap: reusable surgical products | |||||||||||||
| Year ended December 31, 2007 |
$ | 1,554,000 | $ | 994,000 | $ | (1,337,000 | ) | $ | 1,211,000 | ||||
| Year ended December 31, 2008 |
1,211,000 | 1,275,000 | (1,099,000 | ) | 1,387,000 | ||||||||
| Year ended December 31, 2009 |
1,387,000 | 3,155,000 | (3,329,000 | ) | 1,213,000 | ||||||||
| Reserve for shrinkage and obsolescence: disposable products | |||||||||||||
| Year ended December 31, 2007 |
$ | 400,000 | $ | 501,000 | $ | (376,000 | ) | $ | 525,000 | ||||
| Year ended December 31, 2008 |
525,000 | — | (211,000 | ) | 314,000 | ||||||||
| Year ended December 31, 2009 |
314,000 | 145,000 | (96,000 | ) | 362,000 | ||||||||
47
Table of Contents
| Item 9. | Changes in and Disagreements with Accountants on Accounting and Financial Disclosure |
None.
| Item 9A(T). | Controls and Procedures |
Management’s Report on Internal Control Over Financial Reporting
Our management is responsible for establishing and maintaining adequate internal control over financial reporting (as defined in Rule 13a and 15(f)). Our internal control over financial reporting process was designed to provide reasonable assurance to our management and our Board of Directors regarding the reliability of financial reporting and the preparation of our financial statements in accordance with generally accepted accounting principles. Because of its inherent limitations, internal control over financial reporting may not prevent or detect misstatements. Also, projections of any evaluation of effectiveness to future periods are subject to the risk that controls may become inadequate because of changes in conditions, or that the degree or compliance with the policies or procedures may deteriorate.
Our management assessed the effectiveness of our internal control over financial reporting as of December 31, 2009, based upon the criteria set forth by the Committee of Sponsoring Organizations of the Treadway Commission (“COSO”) in Internal Control – Integrated Framework. Based on this assessment under the framework in Internal Control – Integrated Framework issued by COSO, our management concluded that our internal control over financial reporting was ineffective as of December 31, 2009 as described below.
This Annual Report does not include an attestation report of the Company’s registered public accounting firm regarding internal control over financial reporting. Management’s report was not subject to attestation by the Company’s registered public accounting firm pursuant to temporary rules of the Securities and Exchange Commission that permit the Company to provide only management’s report in this Annual Report.
Evaluation of Disclosure Controls and Procedures
Under the supervision and with the participation of our management, including our chief executive officer and chief financial officer (our “Executives”), we have evaluated the effectiveness of the design and operation of our disclosure controls and procedures, as defined in Rules 13a-15(e) and 15d-15(e) under the Securities and Exchange Act of 1934, as amended (the “Exchange Act”), as of the end of the period covered by this Annual Report. Based on that evaluation, we concluded that, solely due to the material weakness described below, our disclosure controls and procedures were not effective, as of December 31, 2009, at a reasonable level of assurance, to ensure that information we are required to disclose in the reports that we file or submit under the Exchange Act is (i) recorded, processed, summarized and reported within the time periods specified in the Securities and Exchange Commission’s rules and forms, and (ii) accumulated and communicated to our management, including the Executives, as appropriate, to allow timely decisions regarding required disclosure.
In our efforts to reduce our reusable surgical products loss and scrap cost, we conduct operational reviews of our product usage. During the third quarter of 2009, we identified a material weakness in our internal control over financial reporting related to accounting and information systems that track our reusable surgical products. We track these products using RFID technology under our reusable surgical product loss policy and the products are expensed if not returned to us by a customer within 210 days. When we employed new tracking mechanisms in an earlier period to better control the location of our reusable surgical products, we inadvertently did not update our accounting and information systems to record lost product for certain locations. This resulted in our understating losses for earlier periods.
48
Table of Contents
Three remediation controls have been identified to help ensure that losses of reusable surgical products are recorded when they are incurred. These controls were implemented as of September 30, 2009 and will continue to be tested and verified in future periods:
| • | Review the pool of use report, which contains all RFID chip information, to ensure there are no reusable surgical products aged beyond our policy of 210 days; |
| • | Perform an independent query of all inventory warehouses to ensure the completeness and accuracy of the pool of use report; and |
| • | Ensure that any information technology system change request relating to our reusable surgical products are approved by our finance and compliance personnel. |
Other than changes related to the material weakness in internal control over financial reporting noted above, there have not been any changes in the Company’s internal controls over financial reporting during the Company’s most recent fiscal quarter that materially affected, or are reasonably likely to materially affect, the Company’s internal control over financial reporting.
Any system of disclosure controls and internal controls, even if well conceived, is inherently limited in detecting and preventing all errors and fraud and provides reasonable, not absolute, assurance that its objectives are met. The design of a control system must reflect resource constraints. Inherent limitations include the potential for faulty judgments in decision-making, breakdowns because of simple errors or mistakes, and circumvention of controls by individual acts, collusion of two or more people, or management override of the controls.
| Item 9B. | Other Information |
On March 30, 2010, we entered into a Waiver and Amendment No. 2 to Loan and Security Agreement (the “Waiver and Amendment”) with Bank of America, N.A. The Waiver and Amendment waives our failure to satisfy the tangible net worth covenant for the fourth quarter of 2009 under our credit facility. In addition, the Waiver and Amendment amends the minimum tangible net worth covenant to require us to maintain a level of $35 million through December 31, 2010, and $37.5 million thereafter. The Waiver and Amendment also adjusts the fixed charge coverage ratio to be no less than 0.90 to 1.00 through August 31, 2010 and 1.10 to 1.00 thereafter. Under the Waiver and Amendment, our lender also increased the interest rate on the revolving loan to vary between 250 and 300 basis points over LIBOR or between 150 and 200 basis points over the Prime Rate, depending on the level of the fixed charge coverage ratio. Interest on the term loan varies between 275 and 325 basis points over LIBOR or between 175 and 225 basis points over the Prime Rate, depending on the level of the fixed charge coverage ratio. The foregoing description of the Waiver and Amendment is not complete and is qualified in its entirety by the actual terms of the Waiver and Amendment, a copy of which is incorporated herein by reference and attached hereto as Exhibit 10.39.
49
Table of Contents
PART III
| Item 10. | Directors, Executive Officers and Corporate Governance |
The information required by this item concerning our executive officers and directors is incorporated by reference to the information set forth under the captions “Proposal No. 1: Election of Directors,” “Executive Officer Compensation,” “Security Ownership of Directors, Officers and Principal Shareholders” and “Corporate Governance” in our Definitive Proxy Statement for the 2010 Annual Meeting of Shareholders to be filed with the SEC within 120 days after the end of our fiscal year ended December 31, 2009.
| Item 11. | Executive Compensation |
The information required by this item is incorporated by reference to the information set forth under the caption “Executive Officer Compensation” and “Director Compensation” in our Definitive Proxy Statement for the 2010 Annual Meeting of Shareholders to be filed with the SEC within 120 days after the end of our fiscal year ended December 31, 2009.
| Item 12. | Security Ownership of Certain Beneficial Owners and Management and Related Stockholder Matters |
The information required by this item is incorporated by reference to the information set forth under the caption “Security Ownership of Directors, Officers and Principal Shareholders” and “Executive Officer Compensation” in our Definitive Proxy Statement for the 2010 Annual Meeting of Shareholders to be filed with the SEC within 120 days after the end of our fiscal year ended December 31, 2009.
| Item 13. | Certain Relationships and Related Transactions, and Director Independence |
The information required by this item is incorporated by reference to the information set forth under the caption “Certain Relationships and Related Transactions” and “Corporate Governance” in our Definitive Proxy Statement for the 2010 Annual Meeting of Shareholders to be filed with the SEC within 120 days after the end of our fiscal year ended December 31, 2009.
| Item 14. | Principal Accountant Fees and Services |
The information required by this item is incorporated by reference to the information set forth under the caption “Ratification of Appointment of Independent Auditors – Fees Paid to Independent Auditors” in our Definitive Proxy Statement for the 2010 Annual Meeting of Shareholders to be filed with the SEC within 120 days after the end of our fiscal year ended December 31, 2009.
50
Table of Contents
PART IV
| Item 15. | Exhibits and Financial Statement Schedules |
(a) 1. The following Financial Statements of the Registrant are included in Part II, Item 8, Page 20:
2. Financial Statement Schedules of the Registrant: See (c) below.
| (b) | Exhibits: See Exhibit Index |
| (c) | Financial Statements Schedule: The valuation and qualifying accounts schedule is provided and all other financial statement schedules are omitted because of the absence of conditions requiring them. |
EXHIBIT INDEX
| Exhibit |
Exhibit Description | |
| 3.1 | Restated Articles of Incorporation of the Company (incorporated herein by reference to Exhibit 3.1 to the Registration Statement on Form S-1 filed by the Registrant on May 15, 1996). | |
| 3.2 | First Amendment to Restated Articles of Incorporation dated as of August 31, 1998, of the Company (for Series A Preferred Stock) (incorporated herein by reference to Exhibit 4.4 to the Current Report on Form 8-K dated August 31, 1998 filed by the Registrant on September 9, 1998). | |
| 3.3 | Amended and Restated Bylaws of the Company (incorporated herein by reference to Exhibit 3.3 to the Annual Report on Form 10-K for the 2006 year filed by the Registrant on March 23, 2007). | |
| 4.1 | Trust Indenture dated as of February 1, 1999, between First Union National Bank and the Industrial Development Board of Hamilton County, Tennessee (incorporated herein by reference to Exhibit 4.2 to the Annual Report on Form 10-K for the 1998 year filed by the Registrant on March 23, 1999). | |
| 4.2 | Trust Indenture dated as of June 1, 1999, between First Union National Bank and First Security Bank, National Association (incorporated herein by reference to Exhibit 4.3 to the Quarterly Report on Form 10-Q for the 1999 third quarter filed by the Registrant on November 12, 1999). | |
| 10.1* | 1995 Stock Option Plan, as amended, of the Company (incorporated herein by reference to Exhibit 10.1 to the Registration Statement on Form S-1 filed by the Registrant on May 15, 1996). | |
| 10.2* | Form of Stock Option Agreement between the Company and participants under the 1995 Stock Option Plan (incorporated herein by reference to Exhibit 10.2 to the Registration Statement on Form S-1 filed by the Registrant on May 15, 1996). | |
| 10.3 | Texas Industrial Net Lease dated March 19, 1992, between the Trustees of the Estate of James Campbell, Deceased, and Amsco SRI/Surgical Express, Inc., as assigned to the Company (incorporated herein by reference to Exhibit 10.18 to the Registration Statement on Form S-1 filed by the Registrant on May 15, 1996). | |
| 10.4 | Lease dated March 30, 1992, between Walter D’Aloisio and Amsco SRI/Surgical Express, Inc., as assigned to the Company (incorporated herein by reference to Exhibit 10.19 to the Registration Statement on Form S-1 filed by the Registrant on May 15, 1996). | |
51
Table of Contents
| Exhibit |
Exhibit Description | |
| 10.5 | Standard Industrial Lease – Multi-Tenant (American Industrial Real Estate Association) dated February 24, 1992, between Borstein Enterprises and Amsco SRI/Surgical Express, Inc., as assigned to the Company (incorporated herein by reference to Exhibit 10.20 to the Registration Statement on Form S-1 filed by the Registrant on May 15, 1996). | |
| 10.6 | Carolina Central Industrial Center Lease dated April 22, 1992, between Industrial Development Associates and Amsco SRI/Surgical Express, Inc., as assigned to the Company (incorporated herein by reference to Exhibit 10.21 to the Registration Statement on Form S-1 filed by the Registrant on May 15, 1996). | |
| 10.7 | Lease Agreement dated September 2, 1993, between Price Pioneer Company, Ltd., and AmscoSRI/Surgical Express, Inc., as assigned to the Company (incorporated herein by reference to Exhibit 10.22 to the Registration Statement on Form S-1 filed by the Registrant on May 15, 1996). | |
| 10.8 | Service Center Lease dated December 4, 1991, between QP One Corporation and Amsco SRI/Surgical Express, Inc., as assigned to the Company (incorporated herein by reference to Exhibit 10.23 to the Registration Statement on Form S-1 filed by the Registrant on May 15, 1996). | |
| 10.9* | 1996 Non-Employee Director Stock Option Plan of the Company (incorporated herein by reference to Exhibit 10.29 to the Registration Statement on Form S-1 filed by the Registrant on May 15, 1996). | |
| 10.10* | Amendments No. 2 and 3 to the 1995 Stock Option Plan of the Company (incorporated herein by reference to Exhibit 10.24 to the Annual Report on Form 10-K for the 1996 year filed by the Registrant on March 24, 1997). | |
| 10.11 | Corporate Service Agreement dated October 21, 1997, between Standard Textile Co., Inc. and the Company (incorporated herein by reference to Exhibit 10.26 to the Annual Report on Form 10-K for the 1997 year filed by the Registrant on March 30, 1998). | |
| 10.12* | 1998 Stock Option Plan of the Company (incorporated herein by reference to Exhibit 10.28 to the Annual Report on Form 10-K for the 1997 year filed by the Registrant on March 30, 1998). | |
| 10.13 | Lease Agreement dated as of June 15, 1999, between the Company and ProLogis Limited Partnership IV (incorporated herein by reference to Exhibit 10.32 to the Quarterly Report on Form 10-Q for the 1999 third quarter filed by the Registrant on November 12, 1999). | |
| 10.14 | Lease Agreement dated as of June 10, 1999, between the Company and Riggs & Company, a division of Riggs Bank, N.A., as Trustee of the Multi-Employer Property Trust, a trust organized under 12 C.F.R. Section 9.18 (incorporated by reference to the Annual Report on Form 10-K for the 1999 year filed by the Registrant on March 30, 2000). | |
| 10.15 | Purchasing Agreement dated as of May 1, 2001, between the Company and HealthTrust Purchasing Group, L.P. (incorporated herein by reference to Exhibit 10.46 to the Quarterly Report on Form 10-Q for the 2001 second quarter filed by the Registrant on July 26, 2001). | |
| 10.16* | Form of stock option agreement between the Company and non-employee directors (incorporated herein by reference to Exhibit 10.47 to the Annual Report on Form 10-K for the 2001 year filed by the Registrant on April 1, 2002). | |
| 10.17 | Joint Marketing Agreement dated as of March 1, 2003 between the Company and Aesculap, Inc. (incorporated herein by reference to Exhibit 10.54 to the Quarterly Report on Form 10-Q for the 2003 first quarter filed by the Registrant on May 14, 2003). | |
| 10.18* | 2004 Stock Compensation Plan of the Company (incorporated herein by reference to Exhibit 4.1 to the Registration Statement on Form S-8 filed by the Registrant on March 28, 2005). | |
52
Table of Contents
| Exhibit |
Exhibit Description | |
| 10.19* | Employment Agreement dated as of July 1, 2005, between Wallace D. Ruiz and the Company (incorporated herein by reference to Exhibit 99.4 to the Current Report on Form 8-K filed by the Registrant on June 24, 2005). | |
| 10.20* | Notice of Restricted Stock Grant and Stock Restriction Agreement (incorporated herein by reference to Exhibit 99.1 to the Current Report on Form 8-K filed by the Registrant on February 3, 2006). | |
| 10.21* | Amendment No. 1 to 1998 Stock Option Plan of the Company (as Amended and Restated as of June 17, 2005) (incorporated herein by reference to Exhibit 10.1 to the Quarterly Report on Form 10-Q for the 2006 first quarter filed by the Registrant on May 9, 2006). | |
| 10.22* | Amendment No. 1 to 2004 Stock Compensation Plan of the Company (incorporated herein by reference to Exhibit 10.2 to the Quarterly Report on Form 10-Q for the 2006 first quarter filed by the Registrant on May 9, 2006). | |
| 10.23* | Letter Agreement dated as of March 22, 2006, between Wayne R. Peterson and the Company (incorporated herein by reference to Exhibit 10.3 to the Quarterly Report on Form 10-Q for the 2006 first quarter filed by the Registrant on May 9, 2006). | |
| 10.24* | Retention Agreement dated as of February 2, 2005, between D. Jon McGuire and the Company (incorporated herein by reference to Exhibit 10.1 to the Current Report on Form 8-K filed by the Registrant on February 5, 2007). | |
| 10.25* | Employment Agreement dated as of December 31, 2007, between Gerald Woodard and the Company (incorporated herein by reference to Exhibit 10.1 to the Current Report on Form 8-K filed by the Registrant on January 7, 2008). | |
| 10.26* | Restricted Stock Grant Agreement dated as of February 6, 2008, between Gerald Woodard and the Company (incorporated herein by reference to Exhibit 10.1 to the Current Report on Form 8-K filed by the Registrant on February 7, 2008). | |
| 10.27* | Stock Option Agreement dated as of February 6, 2008, between Gerald Woodard and the Company (incorporated herein by reference to Exhibit 10.2 to the Current Report on Form 8-K filed by the Registrant on February 7, 2008). | |
| 10.28* | First Amendment to Retention Agreement dated November 4, 2008 between D. Jon McGuire and the Company (incorporated herein by reference to Exhibit 10.1 to the Quarterly Report on Form 10-Q for the 2008 third quarter filed by the Registrant on November 4, 2008). | |
| 10.29* | First Amendment to Retention Agreement dated December 23, 2008 between Gerald Woodard and the Company (incorporated herein by reference to Exhibit 10.29 to the Annual Report on Form 10-K for the 2008 fiscal year filed by the Registrant on March 10, 2009). | |
| 10.30* | First Amendment to Retention Agreement dated December 24, 2008 between Wallace D. Ruiz and the Company (incorporated herein by reference to Exhibit 10.30 to the Annual Report on Form 10-K for the 2008 fiscal year filed by the Registrant on March 10, 2009). | |
| 10.31** | Supply and Co-Marketing Agreement dated November 26, 2008 between Cardinal Health 200, Inc. and the Company(incorporated herein by reference to Exhibit 10.30 to the Annual Report on Form 10-K for the 2008 fiscal year filed by the Registrant on March 10, 2009). | |
| 10.32 | Loan and Security Agreement dated August 7, 2008, between the Company and Bank of America, N.A. (incorporated herein by reference to Exhibit 10.1 to the Quarterly Report on Form 10-Q for the 2008 second quarter filed by the Registrant on August 13, 2008). | |
| 10.33 | Revolving Loan Note dated August 7, 2008, executed by the Company in favor of Bank of America, N.A. (incorporated herein by reference to Exhibit 10.2 to the Quarterly Report on Form 10-Q for the 2008 second quarter filed by the Registrant on August 13, 2008). | |
53
Table of Contents
| Exhibit |
Exhibit Description | |
| 10.34 | Term Loan Note dated August 7, 2008, executed by the Company in favor of Bank of America, N.A. (incorporated herein by reference to Exhibit 10.3 to the Quarterly Report on Form 10-Q for the 2008 second quarter filed by the Registrant on August 13, 2008). | |
| 10.35 | Waiver and Amendment No. 1 to Loan and Security Agreement dated November 13, 2009, between the Company and Bank of America, N.A. (incorporated herein by reference to Exhibit 10.1 to the Quarterly Report on Form 10-Q for the 2009 third quarter filed by the Registrant on November 16, 2009). | |
| 10.36** | Amended and Restated Co-Marketing Agreement dated February 1, 2010 between Cardinal Health 200, LLC, formerly known as Cardinal Health 200, Inc., and the Company. | |
| 10.37** | National Brand Distribution Agreement dated June 15, 2009 between Cardinal Health 200, Inc. and the Company. | |
| 10.38* | Retention Agreement dated as of December 23, 2009, between Mark R. Faris and the Company (incorporated herein by reference to Exhibit 10.1 to the Current Report on Form 8-K filed by the Registrant on December 23, 2009). | |
| 10.39 | Waiver and Amendment No. 2 to Loan and Security Agreement dated March 30, 2010, between the Company and Bank of America, N.A. | |
| 23.1 | Consent of Grant Thornton LLP. | |
| 31 | Certifications by the Chief Executive Officer (CEO) and Chief Financial Officer (CFO) of the Company under Section 302 of the Sarbanes-Oxley Act of 2002. | |
| 32 | Certification by the CEO and CFO of the Company under Section 906 of the Sarbanes-Oxley Act of 2002. (Not deemed to be “filed” with the Securities and Exchange Commission.) | |
| * | Indicates management contract or compensation plan or arrangement. |
| ** | Certain parts of this exhibit have not been disclosed and have been filed separately with the Secretary of the Securities and Exchange Commission, and are subject to a confidential treatment request pursuant to Rule 24b-2 of the Securities Exchange Act of 1934. |
54
Table of Contents
PURSUANT TO THE REQUIREMENTS OF SECTION 13 OR 15(d) OF THE SECURITIES AND EXCHANGE ACT OF 1934, THE REGISTRANT HAS DULY CAUSED THIS REPORT TO BE SIGNED ON ITS BEHALF BY THE UNDERSIGNED, THEREUNTO DULY AUTHORIZED.
| SRI/SURGICAL EXPRESS, INC. | ||||||
| BY: | /s/ GERALD WOODARD |
BY: | /s/ MARK R. FARIS | |||
| Gerald Woodard, Chief Executive Officer |
Mark R. Faris, Vice President & Chief Financial Officer | |||||
Dated: March 30, 2010
PURSUANT TO THE REQUIREMENTS OF THE SECURITIES AND EXCHANGE ACT OF 1934, THIS REPORT HAS BEEN SIGNED BELOW BY THE FOLLOWING PERSONS ON BEHALF OF THE REGISTRANT AND IN THE CAPACITIES AND ON THE DATES INDICATED.
| Signature |
Title |
Date | ||
| /s/ CHARLES W. FEDERICO Charles W. Federico |
Chairman and Director | March 30, 2010 | ||
| /s/ GERALD WOODARD Gerald Woodard |
Chief Executive Officer and Director | March 30, 2010 | ||
| /s/ MARK R. FARIS Mark R. Faris |
Vice President & Chief Financial Officer |
March 30, 2010 | ||
| /s/ JAMES T. BOOSALES James T. Boosales |
Director | March 30, 2010 | ||
| /s/ JAMES M. EMANUEL James M. Emanuel |
Director | March 30, 2010 | ||
| /s/ CHARLES T. ORSATTI Charles T. Orsatti |
Director | March 30, 2010 | ||
| /s/ WAYNE R. PETERSON Wayne R. Peterson |
Director | March 30, 2010 | ||
| /s/ MICHAEL D. ISRAEL Michael D. Israel |
Director | March 30, 2010 | ||
55