Attached files
Table of Contents
SECURITIES AND EXCHANGE COMMISSION
WASHINGTON, D.C. 20549
FORM 10-K
(MARK ONE)
| x | ANNUAL REPORT PURSUANT TO SECTION 13 OR 15(d) OF THE SECURITIES EXCHANGE ACT OF 1934 FOR THE FISCAL YEAR ENDED DECEMBER 31, 2009. |
| ¨ | TRANSITION REPORT PURSUANT TO SECTION 13 OR 15(d) OF THE SECURITIES EXCHANGE ACT OF 1934. |
COMMISSION FILE NUMBER 0-23383
OMNI ENERGY SERVICES CORP.
(Exact name of registrant as specified in our charter)
| LOUISIANA | 72-1395273 | |
| (State or other jurisdiction of incorporation or organization) |
(I.R.S. Employer Identification No.) | |
| 4500 NE EVANGELINE THWY CARENCRO, LOUISIANA |
70520 | |
| (Address of principal executive offices) | (Zip Code) | |
REGISTRANT’S TELEPHONE NUMBER, INCLUDING AREA CODE:
(337) 896-6664
SECURITIES REGISTERED PURSUANT TO SECTION 12(b) OF THE ACT:
COMMON STOCK, $0.01 PAR VALUE PER SHARE
SECURITIES REGISTERED PURSUANT TO SECTION 12(g) OF THE ACT:
NONE
NAME OF EACH EXCHANGE ON WHICH REGISTERED:
THE NASDAQ STOCK MARKET, LLC
Indicate by check mark whether the registrant is a well-known seasoned issuer, as defined in Rule 405 of the Securities Act. Yes ¨ No x
Indicate by check mark whether the registrant is not required to file reports pursuant to Section 13 or Section 15(d) of the Exchange Act. Yes ¨ No x
Indicate by check mark whether the registrant (1) has filed all reports required to be filed by Section 13 or 15(d) of the Securities Exchange Act of 1934 during the preceding 12 months (or for such shorter period that the registrant was required to file such reports) and (2) has been subject to such filing requirements for the past 90 days. Yes x No ¨
Indicate by check mark whether the registrant has submitted electronically and posted on its corporate Web site, if any, every Interactive Data File required to be submitted and posted pursuant to Rule 405 of Regulation S-T during the preceding 12 months (or for such shorter period that the registrant was required to submit and post such files. Yes ¨ No ¨
Indicate by check mark if disclosure of delinquent filers pursuant to Item 405 of Regulation S-K is not contained herein, and will not be contained, to the best of registrant’s knowledge, in definitive proxy or information statements incorporated by reference in Part III of this Form 10-K or any amendment to this Form 10-K. ¨
Indicate by check mark whether the registrant is a large accelerated filer, an accelerated filer, a non-accelerated filer, or a smaller reporting company. See the definitions of “large accelerated filer”, “accelerated filer” and “smaller reporting company” in Rule 12b-2 of the Exchange Act (check one):
Large accelerated filer ¨ Accelerated filer ¨ Non-accelerated filer x Smaller reporting company ¨
(Do not check if a smaller reporting company)
Indicate by check mark whether the registrant is a shell company (as defined by Rule 12b-2 of the Act). Yes ¨ No x
The aggregate market value of the voting stock held by non-affiliates of the registrant at June 30, 2009, based on the closing price of common stock on the Nasdaq Global Market for such date, was $38,785,898.
The number of shares of the Registrant’s common stock, $0.01 par value per share, outstanding at March 25, 2010 was 21,325,648.
DOCUMENTS INCORPORATED BY REFERENCE
The information required by Part III of this Form 10-K is incorporated by reference from the registrant’s definitive proxy statement involving the election of directors at the annual meeting of the shareholders to be held in 2010, which definitive proxy statement will be filed with the Securities and Exchange Commission within 120 days after the end of the fiscal year to which this Form 10-K relates.
Table of Contents
OMNI ENERGY SERVICES CORP.
ANNUAL REPORT ON FORM 10-K FOR
THE YEAR ENDED DECEMBER 31, 2009
| PAGE | ||||
| Item 1. |
3 | |||
| Item 1A. |
15 | |||
| Item 1B. |
22 | |||
| Item 2. |
22 | |||
| Item 3. |
23 | |||
| Item 4. |
23 | |||
| Item 5. |
24 | |||
| Item 6. |
26 | |||
| Item 7. |
Management’s Discussion and Analysis of Financial Condition and Results of Operations |
28 | ||
| Item 7A. |
45 | |||
| Item 8. |
46 | |||
| Item 9. |
Changes in and Disagreements With Accountants on Accounting and Financial Disclosure |
84 | ||
| Item 9A. |
84 | |||
| Item 9B. |
85 | |||
| 86 | ||||
| Item 15. |
86 | |||
| 87 | ||||
| 88 | ||||
2
Table of Contents
OMNI ENERGY SERVICES CORP.
Unless otherwise indicated by the context, references herein to the “Company,” “OMNI,” “we,” “our” or “us” mean OMNI Energy Services Corp., a Louisiana corporation, and its subsidiaries. Certain terms used herein relating to our operations and the oil and natural gas services industry are defined in ITEM 1. “BUSINESS” and ITEM 2. “PROPERTIES.”
FORWARD LOOKING INFORMATION
Certain of the statements contained in all parts of this document (including the portion, if any, to which this Form 10-K is attached), including, but not limited to, those relating to our acquisition plans, the effect of changes in strategy and business discipline, future tax matters, future general and administrative expenses, future growth and expansion, expansion of our operations, review of acquisitions, expansion and improvement of our capabilities, integration of new technology into operations, credit facilities, redetermination of our borrowing base, attraction of new members to the management team, future compensation programs, new alliances, future capital expenditures (or funding thereof) and working capital, sufficiency of future working capital, borrowings and capital resources and liquidity, projected rates of return, retained earnings and dividend policies, projected cash flows from operations, future outcome, effects or timing of any legal proceedings or contingencies, the impact of any change in accounting policies on our financial statements, management’s assessment of internal control over financial reporting, the identification of material weaknesses in internal control over financial reporting and any other statements regarding future operations, financial results, opportunities, growth, business plans and strategy and other statements that are not historical facts are forward looking statements. These forward-looking statements reflect our current view of future events and financial performance. When used in this document, the words “budgeted,” “anticipate,” “estimate,” “expect,” “may,” “project,” “believe,” “intend,” “plan,” “potential,” “forecast,” “might,” “predict,” “should” and similar expressions are intended to be among the statements that identify forward-looking statements. These forward-looking statements speak only as of their dates and should not be unduly relied upon. We undertake no obligation to publicly update or revise any forward-looking statement, whether as a result of new information, future events, or otherwise. Such statements involve risks and uncertainties, including, but not limited to, those set forth under “ITEM 1A.—RISK FACTORS” and other factors detailed in this document and our other filings with the Securities and Exchange Commission. Should one or more of these risks or uncertainties materialize, or should underlying assumptions prove incorrect, actual outcomes may vary materially from those indicated. All subsequent written and oral forward-looking statements attributable to the Company or to persons acting on its behalf are expressly qualified in their entirety by reference to these risks and uncertainties.
| ITEM 1. | BUSINESS |
GENERAL
OMNI Energy Services Corp. is an integrated oilfield service company specializing in providing a range of (i) onshore seismic drilling, operational support, permitting, and survey services; (ii) dock-side and offshore hazardous and non-hazardous oilfield waste management and environmental cleaning services, including tank and vessel cleaning and safe vessel entry; drilling fluid transportation and disposal services; other specialized services such as metal stress relieving, environmental pit cleaning, wellhead preheating and wellhead installation and (iii) oilfield equipment rental, for oil and gas companies operating in the Gulf of Mexico, the Rocky Mountain region and prolific shale regions in the South Central United States and the Appalachian Region. At December 31, 2009, we operated in three business segments—Seismic Services, Environmental and Other Services, and Equipment Leasing. For information about the revenues, operating income (loss) and other financial information relating to the segments, see Note 11 to our Consolidated Financial Statements.
3
Table of Contents
We were founded in 1987, as OMNI Drilling Corporation, to provide drilling services to the geophysical industry. In July 1996, OMNI Geophysical, L.L.C. acquired substantially all of the assets of OMNI Geophysical Corporation, the successor to the business of OMNI Drilling Corporation. OMNI Energy Services Corp. was formed as a Louisiana corporation on September 11, 1997 to acquire all of the outstanding common units of OMNI Geophysical, L.L.C.
BUSINESS SEGMENTS
SEISMIC SERVICES. The market for our Seismic Services segment is South Central United States as well as the Appalachian Region in the Northeast United States. Additionally, we are a leading provider of seismic drilling support services in the marsh, swamp, shallow water and contiguous dry land areas along the Gulf of Mexico (the “Transition Zone”), primarily in Louisiana and Texas, where we are a leading provider of seismic drilling support services.
We own and operate a fleet of specialized seismic drilling and transportation equipment for use in the Transition Zone. We believe we are the only company that currently can both provide an integrated range of seismic drilling, permitting, and survey services in all of the varied terrain of the Transition Zone and simultaneously support operations for multiple, large-scale seismic projects. With the acquisition of all of the assets of AirJac Drilling, a division of Veritas Land DGC in 2002, we became the largest domestic provider of seismic drilling support services to geophysical companies.
In March 2007, we acquired certain assets of Cypress Consulting Services, Inc. d/b/a Cypress Energy Services (“Cypress”), thereby expanding our fleet of seismic drilling equipment and allowing us to better serve the needs of our seismic drilling customers. The entirety of the operations related to the assets purchased from Cypress are included in our Seismic Services segment.
ENVIRONMENTAL AND OTHER SERVICES. We provide specialized environmental cleaning and maintenance equipment and trained personnel to oil and gas companies operating in the Gulf Coast region of the United States. Our services include dock-side and offshore hazardous and non-hazardous oilfield waste management and environmental cleaning services, including drilling rig, tank and vessel cleaning (tank degassing and demolition and rig pit cleaning), safe vessel entry, naturally occurring radioactive material (“NORM”) decontamination and surveys, platform abandonment services, pipeline flushing, gas dehydration, hydro blasting, and offshore sandblasting and painting. We also assist production operators in the maintenance and replacement of anodes, mist extractors, valves, glycol systems, chemical electric units and fire tubes. Our customer list includes virtually all major and independent oil and gas companies operating in the Gulf of Mexico, and the demand for environmental services is directly impacted by offshore drilling and production activity in the Gulf of Mexico. Our dock side services are dependent upon the movement of vessels from offshore production platforms or drilling rigs which operate non-stop throughout the year, and demand for our dock-side vessel and tank cleaning and non-hazardous waste treatment businesses are primarily driven by drilling and well-site abandonment activity in the waters of the Gulf of Mexico, as reflected by the drilling rig count. Much of the cleaning and waste treatment is from residual waste created in the drilling process.
We charge for our Environmental and Other Services on a time and materials basis. Our ability to successfully secure and maintain future environmental services for our customers is dependent upon our ability to provide quick, safe and efficient maintenance and cleaning services at a competitive price. Project backlogs are maintained for NORM decontamination, abandonment and decommissioning and scheduled offshore maintenance.
In March 2007, we acquired BMJ Industrial Investments, L.L.C. and its wholly-owned subsidiary Charles Holston, Inc. (collectively “Holston”). This acquisition provided us with additional opportunities to expand our Environmental and Other Services segment with corrosion proofing and offshore cleaning capabilities. Through Holston we also expanded our transportation services to include vacuum truck, winch truck, roll-off truck and
4
Table of Contents
flat bed services supporting both drilling and production. Holston also offers transportation of non-hazardous by-products, such as saltwater and spent drilling fluids. Holston originally operated two saltwater disposal wells for the disposal of non-hazardous by-products. In late 2007, Holston received the necessary licensing and permits to go forward with the addition of a third saltwater disposal well, which became operational in 2008.
We operate an extensive fleet of power units supporting south Louisiana, east and west Texas, the Barnett and Haynesville Shale and Rocky Mountain regions. We also operate four production water treatment and disposal facilities with locations in south Louisiana and the Barnett Shale. Holston’s customer list includes approximately 200 major and independent oil and gas companies operating in Louisiana, Texas and the Rocky Mountains.
In June 2007, we acquired certain assets of Bailey Operating, Inc. (“BOI”), which geographically extended our core businesses into the Barnett Shale region in North Texas. These assets included an additional saltwater disposal well for the disposal of non-hazardous by-products. Not only did we acquire an exceptional facility for the disposal of non-hazardous oilfield waste by-products, the acquisition also established a platform for further geographic expansion of our core businesses. We have expanded our Environmental and Other Services and Equipment Leasing operations into the Barnett Shale region. We have also expanded our operations into the Haynesville Shale and Fayetteville Shale areas.
In January 2008, we acquired the assets of B.E.G. Liquid Mud Services Corp. (“BEG”), which was an extension of our fluid transportation services and our land-based equipment leasing operations. It allows us to better serve our customers by offering drilling support packages including the supply of drilling fluids, chemicals, storage, mixing and fluid pumping services as well as fluid trucking, recycling, tank cleaning and disposal services. Through Holston, we currently handle the transportation of oilfield drilling and production fluids in Louisiana. The acquisition of BEG strategically positions us for further geographic expansion of these services and also extends our transportation and land-based equipment leasing operations into the southern regions of the Barnett Shale and into East Texas. Additionally, we believe we will be able to capitalize on our existing customer relationships to geographically expand BEG’s fluid service distribution facilities into other prolific onshore regions of the United States. BEG operates drilling fluid distribution facilities located in Woodville, Bryan and Giddings, Texas. The location of the BEG facilities gives us broader reach into other prolific oil and gas producing areas of Texas.
The acquisition of Preheat, Inc. (“Preheat”) in February 2006 allowed us to offer additional services, including wellhead installation services and metal stress relieving services, to our customers in the Gulf of Mexico and southern United States. Wellhead installations, stress relieving and other services are billed on a “per job” basis.
EQUIPMENT LEASING. Preheat provides rental equipment and specialized environmental services principally to drilling contractors operating in the Gulf of Mexico. Preheat has a varied fleet of rental equipment including pressure washers, steam cleaners and oilfield cooling fans. During 2008, Preheat operated from locations in Belle Chasse and Broussard, Louisiana and Rock Springs, Wyoming. In early 2009, we consolidated the Broussard facility with the corporate facilities in Carencro, Louisiana.
In November 2006, we acquired Rig Tools, Inc. (“Rig Tools”). Rig Tools maintains an extensive fleet of rental equipment for various oilfield and commercial applications including water, mud and disposal pumps; mud, fuel and frac tanks; air compressors; wireline units; generators; high pressure washers; light towers; tubing; and handling tools. It also offers certain land based environmental cleaning services. Rig Tools has operating facilities in Youngsville, Louisiana; and Navasota, Timpson and Teague, Texas.
Additionally, the acquisition of Holston brought complementary additions to our equipment rental fleet. Holston maintains a fleet of rental equipment including frac tanks, gas buster tanks, generators, lighting systems and roll-off containers.
5
Table of Contents
In April 2008, we acquired Industrial Lift Truck and Equipment Co., Inc. (“Industrial Lift”), allowing us to further expand the line of products that we provide for lease into specialized lifting units such as industrial forklifts and manlifts. Industrial Lift has operating facilities in Broussard, Louisiana and Lincoln, Texas.
With our acquisitions of Preheat, Rig Tools, Holston, and Industrial Lift we have expanded the list of equipment and services that we offer to customers operating in the Gulf of Mexico and Rocky Mountain regions and the prolific Barnett, Haynesville, Fayetteville and Marcellus Shale regions. Our Equipment Leasing segment has customer lists including virtually all of the major and independent oil and gas companies operating in the Gulf of Mexico and the Rocky Mountains and the prolific shale plays in the United States.
Rental equipment is charged on a daily basis. Our ability to successfully secure and maintain future rental and service opportunities with Preheat customers is dependent upon our ability to continue to provide high-quality, dependable rental equipment and reliable services to these customers at a competitive price.
DESCRIPTION OF OPERATIONS
We provide an integrated range of services including (i) onshore seismic drilling, operational support, permitting and surveying to geophysical companies operating in logistically difficult and environmentally sensitive terrain in the United States, and (ii) dock-side and offshore hazardous and non-hazardous oilfield waste management and environmental cleaning services, including tank and vessel cleaning and safe vessel entry for oil and gas companies operating in the Gulf of Mexico. We have available an extensive fleet of oilfield rental equipment for our customers. With the acquisition of certain assets of Cypress, we further extended our ability to provide seismic drilling and support services to our customers. Through the acquisition of Holston, we expanded our list of services to include the disposal of non-hazardous byproducts, such as saltwater and spent drilling fluids. The acquisition of BOI in June 2007 further expanded our capacity for disposal of non-hazardous byproducts and gave us market presence in the Barnett Shale region of North Texas. Holston also brought an expansion of our market into the Rocky Mountains with an equipment rental outlet in Vernal, Utah and the necessary permitting and licensing to transport oilfield waste in Louisiana. The acquisition of BEG in January 2008 expanded our Environmental and Other Services segment with the addition of drilling mud capabilities. It also gave us a larger presence in the Central and West Texas markets. Industrial Lift, acquired in April 2008, added a large fleet of lift units to our offering of equipment rental items to our customers in the oil and gas services sector.
SEISMIC SERVICES. Seismic data generally consists of computer-generated three-dimensional (“3-D”) images or two-dimensional (“2-D”) cross sections of subsurface geologic formations and is used in the exploration of new hydrocarbon reserves and as a tool for enhancing production from existing reservoirs. Onshore seismic data is acquired by recording subsurface seismic waves produced by an energy source, usually dynamite, at various points (“source points”) at a project site. Historically, 2-D surveys were the primary technique used to acquire seismic data. However, advances in computer technology have made 3-D seismic data, which provides a more comprehensive geophysical image, a practical and capable oil and gas exploration and development tool. 3-D seismic data has proven to be more accurate and effective than 2-D data at identifying potential hydrocarbon-bearing geological formations. The use of 3-D seismic data to identify locations to drill both exploration and development wells has improved the economics of finding and producing oil and gas reserves, which in turn has created increased demand for 3-D seismic surveys and seismic support services.
Oil and gas companies generally contract with independent geophysical companies to acquire seismic data. Once an area is chosen for seismic analysis, permits and landowner consents are obtained, either by us, by the geophysical company or by special permitting agents. The geophysical company then determines the layout of the source and receiving points. For 2-D data, the typical configuration of source and receiving points is a straight line with a source point and small groups of specialized sensors (“geophones”) or geophone stations placed evenly every few hundred feet along the line. For 3-D data, the configuration is generally a grid of perpendicular lines spaced a few hundred to a few thousand feet apart, with geophone stations spaced evenly
6
Table of Contents
every few hundred feet along one set of parallel lines, and source points spaced evenly every few hundred feet along the perpendicular lines. This configuration is designed by the geophysical company to provide the best imaging of the targeted geological structures while taking into account surface obstructions such as water wells, oil and gas wells, pipelines and areas where landowner consents cannot be obtained. A survey team then marks the source points and geophone locations, and the source points are drilled and loaded with dynamite.
After the source points have been drilled and loaded and the network of geophones and field recording boxes deployed over a portion of the project area, the dynamite is detonated at a source point. Seismic waves generated by the blast move through the geological formations under the project area and are reflected by various subsurface strata back to the surface where they are detected by geophones. The signals from the geophones are collected and digitized by recording boxes and transmitted to a central recording system. In the case of 2-D data, the geophones and recording devices from one end of the line are then shuttled, or “rolled forward,” to the other end of the line and the process is repeated. In the case of 3-D data, numerous source points, typically located between the first two lines of a set of three or four parallel lines of geophone stations, are activated in sequence. The geophone stations and recording boxes from the first of those lines are then rolled forward to form the next line of geophone stations. The process is repeated, moving a few hundred feet at a time, until the entire area to be analyzed has been covered.
After the raw seismic data has been acquired, it is sent to a data processing facility. The processed data can then be manipulated and viewed on computer workstations by geoscientists to map the subsurface structures to identify formations where hydrocarbons are likely to have accumulated and to monitor the movement of hydrocarbons in known reservoirs. Domestically, seismic drilling and survey services are typically contracted to companies, such as OMNI, as geophysical companies have found it more economical to outsource these services and focus their efforts and capital on the acquisition and interpretation of seismic data.
DRILLING. The primary activity of our Seismic Services segment is the drilling and loading of source points for seismic analysis. Once the geophysical company has plotted the various source points and a survey crew has marked their locations, our drill crews are deployed to drill and load the source points.
In the Transition Zone, as well as certain land-based geological formations, we use water pressure rotary drills mounted on various types of vehicles to drill the source holes. The nature, accessibility and environmental sensitivity of the terrain surrounding the source point determine the type of vehicle used. Transition Zone source holes are generally drilled to depths of 40 to 180 feet, depending on the nature of the terrain and the needs of the geophysical company. We generally use ten-foot sections of drill pipe that are carried with the drilling unit. Our Transition Zone vehicles are typically manned with a driver and one or two helpers. The driver is responsible for maneuvering the vehicle into position and operating the drilling unit, while the helper sets and guides the drill into position, attaches the drilling unit’s water source, when drilling in dry areas, and loads the drill pipe sections used in the drilling process. Once the hole has been drilled to the desired depth, it is loaded with dynamite, which is carried onboard our vehicles in special containers. The explosive charge is set at the bottom of the drill hole and then tested to ensure that the connection has remained intact. Once the charge has been tested, the hole is plugged in accordance with local, state and federal regulations and marked so that the geophysical company can identify it for detonation at a later date. This process is repeated throughout the survey area until all source points have been drilled and loaded.
In seismic rock drilling, we use compressed air rotary/hammer drills to drill holes that are typically shallower than Transition Zone holes. Rock drills are manned by a two-man or three-man crew and are transported to and from locations by hand, surface vehicle or helicopter. Once the hole has been drilled to the desired depth, it is loaded with explosives, which are delivered to the job site in an explosive magazine carried by hand, vehicle or helicopter.
PERMITTING. We maintain a “Geophysical Permit Acquisition Operation Division” within the Seismic Services segment. Our staff of contract permit agents first conducts research in public land title records to determine ownership of the lands located in the seismic projects. The permit agents then contact, negotiate and
7
Table of Contents
acquire permits and landowner consents for the survey, drilling and recording crews to conduct their operations. Throughout the seismic data acquisition process, the permit agents assist the crews in the field with landowner relations and permit restrictions in order to reduce field-crew downtime for noncompliance with landowner requests. Our permit services are enhanced with the assistance of a proprietary database software program specifically designed for efficient management of seismic projects.
SURVEY. Once all permits and landowner consents for a seismic project have been obtained and the geophysical company has determined the placement of source and receiving points, contract survey crews are sent into the field to plot each source and receiving point prior to drilling. We employ both GPS (global positioning satellite) equipment, which is more efficient for surveying in open areas, and conventional survey equipment, which is generally used to survey wooded areas. We have successfully integrated both types of equipment in order to complete projects throughout the varied terrain of the Transition Zone and elsewhere. In addition, the contract survey crews have access to our extensive fleet of specialized transportation equipment, as opposed to most other survey companies, which must rent this equipment.
OPERATIONAL SUPPORT. We are able to coordinate a variety of related services to customers performing 3-D seismic data acquisition projects that produce significant economies of scale and value. Our substantial base of experience gained from years of work supporting 3-D seismic projects enables us to provide significant pre-job planning information to the customer during job design analysis. Typical 3-D seismic data acquisition projects in the field involve large amounts of equipment, personnel and logistical coordination. Coordination of movements between permitting, survey, drilling and recording crews is of critical importance to timely, safe and cost effective execution of the job. We have a pool of senior field supervisors, with a broad seismic industry experience and who are able to coordinate the activities of drill crews, permit agents and survey teams with the recording crews to achieve improved results. These personnel also have the ability to recommend changes to the customer field representatives in the manner of executing the job in the field to improve performance and reduce costs. By having the ability to perform significant field coordination, we are able to streamline field decision making and information flow and reduce customer overhead costs that otherwise would be required to perform these supervisory tasks. We also have one of the industry’s leading Quality, Health, Safety and Environmental (“QHSE”) programs. The involvement of our experienced personnel monitoring QHSE field practices greatly reduces customer involvement in this area. By offering the only integrated combination of seismic drilling, permit acquisition, seismic survey and operational support, in addition to an equipment fleet that is one of the largest in terms of number of units and most diverse in the industry, we provide significant operational advantages to the customer.
Cypress operated in two distinct business areas—seismic drilling and employee leasing. The employee leasing division provided both skilled and unskilled contract labor services to various companies working in the oil and gas industry.
FABRICATION AND MAINTENANCE. At our Carencro facilities, we perform repairs and maintenance for our Transition Zone and highland drilling equipment. We design and fabricate aluminum marsh all terrain vehicles (ATVs), support boats and pontoon boats, and the drilling units that we use on our Transition Zone equipment. We purchase airboats directly from the manufacturer and then modify the airboats to install the drilling equipment. We have also designed and built a limited number of highland drilling units by installing our drilling equipment on tractors bought directly from the manufacturer. In addition, we fabricate rock-drilling equipment and have the capability of fabricating other key equipment, such as swamp ATVs. Because of our ability to fabricate and maintain much of our equipment, we do not believe that we are dependent on any one supplier for our drilling equipment or parts.
ENVIRONMENTAL AND OTHER SERVICES. We are an environmental and maintenance service contractor working primarily for onshore and offshore oil and gas companies. Our Environmental and Other Services segment provides equipment and personnel to perform environmental cleaning services including drilling rig, tank and vessel cleaning, NORM decontamination, platform abandonment services, pipeline flushing, wellhead installation, metal stress relieving, hydro blasting, gas dehydration services and offshore
8
Table of Contents
painting and blasting. We operate in the onshore, dockside and offshore regions of the Gulf of Mexico where we are considered to be the leading provider of such environmental services. Our cleaning operations are performed at six locations along the Louisiana Gulf Coast.
Through our Holston subsidiary, we are able to offer transportation of non-hazardous oilfield waste by-products and provide saltwater injection well services at our four injection wells located in Louisiana and Texas. Additionally, our acquisition of BEG allows us to provide water-based drilling fluids to the oil and gas exploration and production companies operating in our Texas and Louisiana markets.
EQUIPMENT LEASING. Through our Preheat, Rig Tools and Industrial Lift subsidiaries, we offer a vast fleet of rental equipment including pressure washers, wireline units, frac tanks, forklifts, manlifts and steam cleaners. Our subsidiary, Rig Tools, maintains an extensive fleet of rental equipment for various oilfield and commercial applications including: water, mud and disposal pumps; mud, fuel and frac tanks; air compressors; wireline units; generators; high pressure washers; light towers; tubing; and handling tools. Our Industrial Lift subsidiary maintains an expansive selection of forklifts and man-lifts for use in various oilfield applications. This equipment is also well suited for use in construction applications.
Our acquisition of Holston brought complementary additions to our equipment leasing fleet. Holston maintains a fleet of rental equipment including frac tanks, gas buster tanks, generators, lighting systems and roll-off containers.
MATERIALS AND EQUIPMENT
The principal materials and equipment used in our seismic drilling operations, which include drills, heli-portable and man-portable drills, drill casings, drill bits, engines, gasoline and diesel fuel, dynamite, aluminum and steel plate, welding gasses, trucks and other vehicles, are currently in adequate supply from many sources. We do not depend upon any single supplier or source for such materials.
Environmental cleaning equipment and materials such as compressors, pressure washers, diaphragm pumps, electric generators, water blasters, vacuum trucks, hoses, personnel protection equipment, and cleaning agents are readily available from many sources throughout the Gulf of Mexico. We do not depend upon any single supplier or source for such materials.
Equipment included in our rental fleet such as frac tanks, wireline units and pressure washers are readily available from many sources throughout the region. We do not depend upon any single supplier or source for such materials.
SAFETY AND QUALITY ASSURANCE
We maintain a stringent safety assurance program to reduce the likelihood of accidents. Our QHSE department establishes guidelines to ensure compliance with all applicable state and federal safety regulations and provides training and safety education, including first aid and CPR training through orientations for new employees. Our Vice President of QHSE reports directly to our Chief Executive Officer and supervises three QHSE field advisors and one instructor who provides Occupational Safety and Health Act (“OSHA”) mandated training. We believe that our safety program and commitment to quality are vital to attracting and retaining customers and employees.
Each drilling crew is supervised at the project site by a field supervisor and, depending on the project’s requirements, an assistant supervisor and powderman who is in charge of all explosives. For large projects or when required by a customer, a separate advisor from our QHSE department is also located at the project site. Management is provided with daily updates for each project and believes that our daily review of field performance together with the on-site presence of supervisory personnel helps ensure high quality performance for all of our projects.
9
Table of Contents
Environmental employees work in many facilities, most which have site specific requirements. Our crews attend pre-job meetings to formulate job specific work plans. These plans are monitored and audited by our supervisors and in-house QHSE advisors.
We have implemented an extensive program that provides training for adverse conditions in remote locations. In addition to our internal requirements, our employee training is conducted in accordance with federal, state, and customer requirements.
CUSTOMERS, MARKETING AND CONTRACTING
CUSTOMERS. Historically, our seismic services customers primarily have been geophysical companies, although in many cases the oil and gas company participates in determining which drilling, permitting or survey company will be used on our seismic projects. A few customers historically have generated a large portion of our Seismic Services revenue. While oil and gas companies utilizing our Environmental and Other Services and Equipment Leasing services have comprised a greater share of our revenue base, we currently derive a significant amount of our revenue from a small number of large geophysical companies and independent oil and gas operators. The loss of one of these significant customers, if not offset by sales to new or other existing customers, could have a material adverse effect on our business and operations. Our largest customers (those which individually accounted for more than 10% of revenue in a given year) collectively accounted for 11% (one customer), 21% (two customers), and 12% (one customer) of revenue for fiscal 2007, 2008, and 2009, respectively.
The majority of our customers are engaged in the oil and gas industry. This concentration of customers may impact our overall exposure to credit risk, either positively or negatively, in that customers may be similarly affected by changes in economics and industry conditions. Generally, we do not require collateral in support of trade receivables, but we do maintain reserves for credit losses. Actual losses historically have been within expectations.
MARKETING. Our Seismic Services traditionally have been marketed by our executive officers. We believe that this marketing approach helps us preserve long-term relationships established by our executive officers. Even as our geographical and service capabilities expand, we intend to continue implementing these marketing efforts in both the Transition Zone, the Rocky Mountain region as well as in Appalachia from our principal offices in Carencro, Louisiana. Our Environmental and Other Services are marketed from offices in Louisiana and Texas. Preheat’s, Rig Tools’, Holston’s and Industrial Lift’s equipment and services are marketed from offices in Louisiana, Texas, Utah and Wyoming. Our saltwater disposal operations are marketed from offices in Louisiana and Texas.
CONTRACTING—SEISMIC SERVICES. We generally contract with our customers for seismic drilling services on a unit-price basis, either on a “per hole” or “per foot” basis. These contracts are often awarded after a competitive bidding process. We price our contracts based on detailed project specifications provided by the customer, including the number, location and depth of source holes and the project’s completion schedule. As a result, we generally are able to make a relatively accurate determination prior to pricing a contract of the type and amount of equipment required to complete the contract on schedule.
Because of unit-price contracting, we sometimes bear a portion of the risk of production delays that are beyond our control, such as those caused by adverse weather. We often bill the customer standby charges if our operations are delayed due to delays in permitting or surveying or for other reasons within the customer’s control.
We contract with our customers for permitting services on a day rate or per project basis. Under the per project basis, revenue is recognized when certain percentages of the permitting process are completed. Contracts are often awarded to us only after competitive bidding. In the case of the per project basis, we determine the price
10
Table of Contents
after we have taken into account such factors as the number of permit agents, the number of permits and the detailed project specification provided by the customer.
We contract with our customers for seismic survey services on a day rate or per mile basis. Under the per mile basis, revenue is recognized when the source or receiving point is marked by one of our survey crews. Contracts are often awarded to us only after competitive bidding. In each case, the price is determined after we have taken into account such factors as the number of surveyors and other personnel, the type of terrain and transportation equipment, and the precision required for the project based on detailed project specifications provided by the customer.
CONTRACTING—ENVIRONMENTAL AND OTHER SERVICES. We generally bill for our environmental cleaning and maintenance services on a time and materials basis. Our customer list includes virtually all major and independent oil and gas companies operating in the Gulf of Mexico. Our success in securing projects is often dependent on our ability to immediately provide personnel that operate in a quick, safe and efficient manner at a competitive price. We generally bill our customers an hourly rate for transportation services under a master service agreement or a work-specific purchase order. Any disposal charges are billed at a per barrel rate. Drilling fluids are billed on a per barrel rate with prices dependent upon the weight of the mud.
CONTRACTING—EQUIPMENT LEASING. We generally bill our customers for equipment leasing on a monthly basis. Equipment is generally leased to our customers on a “per day” rate. Our success is dependent upon maintaining our fleet of quality equipment and having the equipment available to our customers on short notice.
COMPETITION
SEISMIC SERVICES
DRILLING. The principal competitive factors for seismic drilling services are price and the ability to meet customer schedules, although other factors including safety, capability, reputation and environmental sensitivity are also considered by customers when deciding upon a provider of seismic drilling services. We have a limited number of competitors in the Transition Zone and numerous smaller competitors in the highland areas in which we operate. We believe that no other company operating in the Transition Zone owns a fleet of Transition Zone seismic drilling equipment as varied or as large as ours. Our extensive and diverse equipment base allows us to provide drilling services to our customers throughout the Transition Zone with the most efficient and environmentally appropriate equipment. We believe there are numerous competitors offering rock and heli-portable drilling in the Rocky Mountain region and internationally. We believe we are the largest provider of seismic drilling services in the United States.
PERMITTING SERVICES. Our competitors include a number of larger, well-established companies with a number of permit agents comparable to us.
SURVEY SERVICES. Our competitors include a number of larger, well-established companies with a number of crews comparable to us.
ENVIRONMENTAL AND OTHER SERVICES. We have several competitors offering identical environmental and other services to those offered by our wholly-owned subsidiaries, Trussco, Inc. (“Trussco”) and Holston. Some of these competitors are larger and have more financial resources than we have available. Our ability to compete effectively is dependent upon our ability to have personnel available when needed at competitive prices. We have specific permits from various state agencies which allow us to transport and dispose of non-hazardous, spent drilling fluids. Our acquisition of BEG allows us the opportunity to offer additional services to our transportation and equipment leasing customers in the exploration and production area. We currently provide transportation and sale of water-based drilling fluids to customers in our Texas and Louisiana markets.
11
Table of Contents
EQUIPMENT LEASING. We have several competitors offering similar equipment leasing and services to those offered by our subsidiaries Preheat, Rig Tools and Industrial Lift. Some of the competitors are larger and have more financial resources than we have available. Our ability to effectively compete is dependent upon having the desired rental equipment available to meet the customer’s needs. In addition, it is imperative that the desired services can be performed for customers in a timely fashion at competitive prices. We feel that our equipment and services are among the best in the market.
SEASONALITY AND WEATHER RISKS
SEISMIC SERVICES. Our Seismic Services operations are subject to seasonal variations in weather conditions and daylight hours. Since our activities take place outdoors, the average number of hours worked per day, and therefore the number of holes drilled or surveyed per day, generally is less in winter months than in summer months, due to an increase in rainy, foggy, snowy and cold conditions and a decrease in daylight hours. Furthermore, demand for seismic data acquisition activity by oil and gas companies at the end of the fourth quarter and in the first quarter is generally lower than at other times of the year. As a result, our revenue and gross profit during the fourth calendar quarter and the first calendar quarter of each year typically are lower than the second and third quarters for this business unit. Operations may also be affected by rainy weather, lightning, hurricanes and other storms prevalent along the Gulf Coast throughout the year and by seasonal climatic conditions in the Rocky Mountain and Appalachian regions. In addition, prolonged periods of dry weather result in slower drill rates in marsh and swamp areas as water in the quantities needed to drill is more difficult to obtain and equipment movement is impeded. Adverse weather conditions and dry weather can also increase maintenance costs for our equipment and decrease the number of vehicles available for operations.
ENVIRONMENTAL AND OTHER SERVICES. Our Environmental and Other Services operations are subject to weather conditions, particularly in the Gulf of Mexico region during what is customarily considered to be hurricane season. Hurricanes which enter the Gulf of Mexico typically cause the companies for which we provide services to suspend operations in the Gulf until the threat of danger to the workers has passed. Conversely, once a hurricane has passed, there is often additional work required of our environmental services crews depending upon the amount of damage caused by the passing of the weather system.
EQUIPMENT LEASING. Our Equipment Leasing operations are generally unaffected by the weather. We do have some pieces of equipment in our rental fleet which are specialized and typically used either in the warmer or colder seasons of the year.
BACKLOG
Our backlog represents those seismic drilling and survey projects for which a customer has hired us and has scheduled a start date for the project. Projects currently included in our backlog are subject to termination or delay without penalty which could substantially reduce the amount of backlog currently reported, at the option of the customer. Backlog levels vary during the year depending on the timing of the completion of certain contracts and when we are awarded new contracts.
Our backlog as of December 31, 2009, was approximately $23.1 million compared to $25.0 million at December 31, 2008, with the decrease due largely to the down-turn in the oil and gas markets and the shrinking capital expenditure budgets of the exploration and production companies. Backlog at December 31, 2008 and 2009, includes seismic drilling and survey projects in the Transition Zone in addition to highland seismic drilling projects.
Our environmental (with the exception of NORM decontamination) and leasing divisions, historically, have not measured backlog due to the nature of our business and our contracts, which are generally cancelable by either party with 30 days written notice. Backlog for NORM decontamination projects is maintained but is not considered to be material.
12
Table of Contents
GOVERNMENTAL REGULATION
SEISMIC SERVICES. Our operations and properties are subject to and affected by various types of governmental laws and regulations, including those governing the entry into and restoration of wetlands, the handling of explosives and numerous other federal, state and local laws and regulations. To date, our cost of complying with such laws and regulations has not been material. However, such laws and regulations frequently change and it is not possible for us to accurately predict the cost or impact such laws and regulations may have on our future operations.
Furthermore, we depend on the demand for our services by the oil and gas industry and are affected by tax legislation, price controls and other laws and regulations relating to the oil and gas industry in general. The adoption of laws and regulations curtailing exploration and development drilling for oil and gas in our areas of operations for economic, environmental or other policy reasons would adversely affect our operations by limiting the demand for our services. We cannot determine to what extent our future operations and earnings may be affected by new legislation, new regulations or changes in existing regulations.
Because we use dynamite in our operations, we are subject to various local, state and federal laws and regulations concerning the handling and storage of explosives and are specifically regulated by the Bureau of Alcohol, Tobacco and Firearms of the U.S. Department of Justice and the Department of Homeland Security. We must take daily inventories of the dynamite and blasting caps that we keep for our seismic drilling and are subject to random checks by state and federal officials. We are licensed by the Louisiana State Police as an explosives handler. Any loss or suspension of these licenses would result in a material adverse effect on our results of operations and financial condition. We believe that we are in compliance with all material laws and regulations with respect to our handling and storage of explosives.
ENVIRONMENTAL. Our operations and properties are subject to a wide variety of increasingly complex and stringent federal, state and local environmental laws and regulations, including those governing discharges into the air and water, the handling and disposal of solid and hazardous wastes, the remediation of soil and groundwater contaminated by hazardous substances and the health and safety of employees. In addition, certain areas where we operate are federally or state protected wetlands or refuges where environmental regulation is particularly strict. These laws may provide “strict liability” for damages to natural resources and threats to public health and safety, rendering a party liable for environmental damage without regard to negligence or fault on the part of such party. Sanctions for noncompliance may include revocation of permits, corrective action orders, administrative or civil penalties and criminal prosecution. Certain environmental laws provide for strict, joint and several liability for remediation of spills and other releases of hazardous substances, as well as damage to natural resources. In addition, we may be subject to claims alleging personal injury or property damage as a result of alleged exposure to hazardous substances. Such laws and regulations may also expose us to liability for the conduct of, or conditions caused by, others, or for our acts that were in compliance with all applicable laws at the time such acts were performed.
The Comprehensive Environmental Response, Compensation, and Liability Act of 1980, as amended, and similar laws provide for responses to and liability for releases of hazardous substances into the environment. Additionally, the Clean Air Act, the Clean Water Act, the Resource Conservation and Recovery Act, the Safe Drinking Water Act, the Emergency Planning and Community Right to Know Act, each as amended, and similar state or local counterparts to these federal laws, regulate air emissions, water discharges, hazardous substances and wastes, and require public disclosure related to the use of various hazardous substances. Compliance with such environmental laws and regulations may require the acquisition of permits or other authorizations for certain activities and compliance with various standards or procedural requirements. We believe that our facilities are in substantial compliance with current regulatory standards.
Our fluid and transportation operations within our Environmental and Other Services Segment are subject to a wide variety of stringent federal, state and local environmental laws and regulations, including those governing
13
Table of Contents
the disposal of saltwater. We have acquired the necessary permits from regulatory agencies to transport oilfield fluids and the necessary licenses and permits to operate saltwater disposal wells at certain sites in Louisiana and Texas.
WORKER SAFETY. Laws and regulations relating to workplace safety and worker health, primarily OSHA and regulations promulgated thereunder, govern our operations. In addition, various other governmental and quasi-governmental agencies require us to obtain certain permits, licenses and certificates with respect to our operations. The kind of permits, licenses and certificates required in our operations depend upon a number of factors. We believe that we have all permits, licenses and certificates necessary to the conduct of our existing business.
INSURANCE
SEISMIC SERVICES. Our operations are subject to the inherent risks of inland marine activity, heavy equipment operations and the transporting and handling of explosives, including accidents resulting in personal injury, the loss of life or property, environmental mishaps, mechanical failures and collisions. We maintain insurance coverage, which we believe is reasonable and customary in the industry, against certain of these risks. We also maintain insurance coverage against property damage caused by fire, flood, explosion and similar catastrophic events that may result in physical damage or destruction to our equipment or facilities. All policies are subject to deductibles and other coverage limitations. We believe our insurance coverage is adequate. Historically, we have not experienced an insured loss in excess of our policy limits; however, there can be no assurance that we will be able to maintain adequate insurance at rates which we consider commercially reasonable, nor can there be any assurance such coverage will be adequate to cover all claims that may arise.
ENVIRONMENTAL AND OTHER SERVICES AND EQUIPMENT LEASING. Our operations involve a high degree of operational risk, particularly of personal injury and the inherent risk of loss or damage of equipment. Failure or loss of our equipment could result in property damage, personal injury, environmental pollution and other damage for which we could be liable. We maintain insurance against risk that we believe is consistent with industry standards and required by our customers. Although we believe that our insurance protection is adequate and we have not experienced a loss in excess of our policy limits, we may not be able to maintain adequate insurance at rates that we consider commercially reasonable, or ensure that our coverage will be adequate to cover all claims that may arise. Our fluid and transportation services involve risks associated with the transportation of goods and materials on state and federal highways. We maintain insurance against foreseeable risks that we believe is consistent with prevailing standards in our industry and required by our customers and lenders. Although we believe that our insurance protection is adequate and we have not experienced any loss in excess of our policy limits, we may not be able to maintain adequate insurance at rates that we consider commercially reasonable, or ensure that our coverage will be adequate to cover all claims that may arise.
EMPLOYEES
As of December 31, 2009, we had approximately 625 employees including operating, corporate, administrative and management personnel. Our employees are not unionized or employed pursuant to any collective bargaining agreement or any similar agreement. We believe our relations with our employees are generally good.
AVAILABLE INFORMATION
Under the Exchange Act, we are required to file annual, quarterly and current reports, proxy statements and other information with the SEC. You may read a copy of any document we file with the SEC at the SEC’s Public Reference Room at 100 F Street, N.E., Washington, D.C. 20549. Please call the SEC at 1-800-SEC-0330 for further information about the Public Reference Room. The SEC maintains a web site at http://www.sec.gov that contains reports, proxy and information statements, and other information we file electronically with the SEC.
14
Table of Contents
We make available, free of charge through our web site, our reports on Forms 10-K, 10-Q and 8-K, and amendments to those reports, as soon as reasonably practicable after such reports are filed with the SEC. Additionally, we have adopted and posted on our website a Code of Ethics for Officers that applies to our principal executive officer, principal financial and accounting officer and our General Code of Ethics for all other employees. Any amendment to our Code of Ethics for Officers or General Code of Ethics will be posted promptly on our website. Our website also includes the charters for our Audit Committee, Corporate Governance and Nominating Committee and Compensation Committee. The address for our web site is http://www.omnienergy.com. The information contained on or accessible from our website does not constitute a part of this report and is not incorporated by reference herein. We will also provide a printed copy of any of these aforementioned documents free of charge upon request.
Our principal executive offices are located at 4500 N.E. Evangeline Thruway, Carencro, Louisiana 70520. Our telephone number at that address is (337) 896-6664.
| ITEM 1A. | RISK FACTORS |
You should carefully consider the following risk factors, in addition to the other information set forth or incorporated by reference herein. Each of these risk factors could adversely affect our business, operating results and financial condition, and also adversely affect the value of an investment in our common stock.
WE MAY NOT BE ABLE TO OBTAIN FUNDING OR OBTAIN FUNDING ON ACCEPTABLE TERMS BECAUSE OF THE DETERIORATION OF THE CREDIT AND CAPITAL MARKETS. THIS MAY HINDER OR PREVENT US FROM MEETING OUR FUTURE CAPITAL NEEDS.
Global financial markets and economic conditions have been, and continue to be, disrupted and volatile. The debt and equity capital markets have been exceedingly distressed. These issues, along with significant write-offs in the financial services sector, the re-pricing of credit risk and the current weak economic conditions have made, and will likely continue to make, it difficult to obtain funding.
In particular, the cost of raising money in the debt and equity capital markets has increased substantially while the availability of funds from those markets generally has diminished significantly. Also, as a result of concerns about the stability of financial markets generally and the solvency of counterparties specifically, the cost of obtaining money from the credit markets generally has increased as many lenders and institutional investors have increased interest rates, enacted tighter lending standards, refused to refinance existing debt at maturity at all or on terms similar to our current debt and reduced and, in some cases, ceased to provide funding to borrowers.
Due to these factors, we cannot be certain that funding will be available if needed and to the extent required, on acceptable terms. If funding is not available when needed, or is available only on unfavorable terms, we may be unable to grow our existing business, complete acquisitions or otherwise take advantage of business opportunities or respond to competitive pressures any of which could have a material adverse effect on our financial condition and results of operations.
WE HAVE A SUBSTANTIAL AMOUNT OF OUTSTANDING INDEBTEDNESS, AND WE MAY NEED TO PAY OR REFINANCE OUR EXISTING INDEBTEDNESS OR INCUR ADDITIONAL INDEBTEDNESS, WHICH MAY ADVERSELY AFFECT OUR OPERATIONS.
As of December 31, 2009, we had outstanding total indebtedness of approximately $52.3 including capital lease obligations. Total indebtedness on that date included $36.0 million in borrowings under a term loan incurred under our senior credit facility (see MANAGEMENT’S DISCUSSION AND ANALYSIS OF FINANCIAL CONDITION AND RESULTS OF OPERATIONS—SENIOR CREDIT FACILITY and Note 4 to the Consolidated Financial Statements). It also included $12.8 million of indebtedness outstanding under various subordinated promissory notes payable to certain former owners of acquired companies.
15
Table of Contents
As of December 31, 2009, we had available borrowing capacity under our senior credit facility consisting of $20.0 million (available amount limited to eligible accounts receivable and inventories adjusted for letters of credit outstanding and other contingencies was $7.6 million) under the working capital revolving line of credit.
Our substantial levels of indebtedness and our other financial obligations increase the possibility that we may be unable to generate cash sufficient to pay, when due, the principal of, interest on or other amounts due, in respect of our outstanding indebtedness. Our substantial debt could also have other significant consequences. For example, it could:
| • | increase our vulnerability to general adverse economic, competitive and industry conditions; |
| • | limit our ability to obtain additional financing in the future for working capital, capital expenditures, acquisitions, general corporate purposes or other purposes on satisfactory terms, or at all; |
| • | require us to dedicate a substantial portion of our cash flow from operations to the payment of our indebtedness, thereby reducing funds available to us for operations and any future business opportunities; |
| • | expose us to the risk of increased interest rates because certain of our borrowings, including borrowings under our senior credit facility, are at variable rates of interest; |
| • | restrict us from making strategic acquisitions or cause us to make non-strategic divestitures; |
| • | limit our planning flexibility for, or ability to react to, changes in our business and the industries in which we operate; |
| • | limit our ability to adjust to changing market conditions; and |
| • | place us at a competitive disadvantage to our competitors who may have less indebtedness or greater access to financing. |
In November 2009, we disclosed that we had not remained in compliance with certain of the financial covenants contained in our senior credit facility. We obtained a waiver of a financial covenant in the senior credit facility for the fiscal quarter ending September 30, 2009. Without this waiver and other modifications, we would not have been in compliance with certain of our financial covenants at September 30, 2009. We were in compliance with the covenants under the senior credit facility as of December 31, 2009, but at this time it is uncertain whether the covenants, specifically the leverage ratio covenant, will be met at March 31, 2010 and thereafter. If we are unable to comply with our covenants at March 31, 2010 or in the future, we believe that it is probable that we would be able to cure covenant violations by obtaining waivers from our lenders to cure a default, although we can give no assurances that any waiver or amendment will be entered into, or on terms acceptable to us. If we were not able to comply with our covenants in the future, and we were not able to obtain waivers from our lenders to cure a default, our lenders would have the right to demand acceleration of payment on all amounts outstanding under the senior credit facility.
Our failure to comply with any of our other covenants under the senior credit facility could result in an event of default that, if not cured or waived, could have a material adverse effect on our financial condition, results of operations and debt service capabilities.
Even though the lenders under the senior credit facility have demonstrated their willingness to work with us in amending or providing sufficient waivers to our facility, there can be no assurance that we would be able to obtain any such waivers or amendments in the future. If we were unable to obtain such waivers or amendments from the lenders, we would likely seek to replace or pay off the senior credit facility with new secured debt, unsecured debt or equity financing. However, there also can be no assurance that such debt or equity financing would be available on terms acceptable to us or at all.
If we fail to make any required payments under our credit instruments, or if we fail to comply with any of the financial and operating covenants included in those instruments, we will be in default under their terms. The
16
Table of Contents
lenders under the senior credit facility or the note holders could then accelerate the maturity of the indebtedness and foreclose upon our and our subsidiaries’ assets that may secure such indebtedness. If our creditors accelerate the maturity of our indebtedness, we may not have sufficient assets to satisfy our debt obligations.
THE CURRENT FINANCIAL AND CREDIT MARKET ENVIRONMENT MAY LIMIT THE FUTURE LEVEL OF EXPLORATION AND PRODUCTION INVESTMENT BY OUR CUSTOMERS.
Recent events experienced in the global financial and credit markets have had a significant impact on the availability of credit and the overall costs at which funds can be obtained. These factors coupled with the significant reduction in commodity prices, which has contributed to lower cash flow generation for a number of exploration and production companies, could contribute to a material decline in our customers’ spending levels. The reduction in the level of future investment, if any, could have a material adverse effect on our financial condition and results of operations.
THE FINANCIAL SOUNDNESS OF OUR CUSTOMERS COULD AFFECT OUR BUSINESS AND OPERATING RESULTS.
As a result of the disruptions in the financial markets and other macro-economic challenges currently affecting the economy of the United States and other parts of the world, our customers may experience cash flow concerns. As a result, if customers’ operating and financial performance deteriorates, or if they are unable to make scheduled payments or obtain credit, customers may not be able to pay, or may delay payment of, accounts receivable owed to us. Any inability of current and/or potential customers to pay us for services may adversely affect our financial condition and results of operations.
OUR RESULTS OF OPERATIONS COULD BE ADVERSELY AFFECTED BY ASSET IMPAIRMENTS.
We periodically review our portfolio of equipment for impairment. If we expect significant sustained decreases in oil and natural gas prices in the future, we may be required to write down the value of our equipment if the future cash flows anticipated to be generated from the related equipment falls below net book value. The recent decline in oil and natural gas prices, if sustained, could result in future impairments. If we are forced to write down the value of our equipment, these noncash asset impairments could negatively affect our results of operations in the period in which they are recorded. See discussion of “Impairment of Long-Lived Assets” included in “Critical Accounting Policies and Estimates.”
BECAUSE WE HAVE NO PLANS TO PAY ANY DIVIDENDS FOR THE FORESEEABLE FUTURE, INVESTORS MUST LOOK SOLELY TO STOCK APPRECIATION FOR A RETURN ON THEIR INVESTMENT IN US.
We have not paid cash dividends on our common stock since our incorporation and do not anticipate paying any cash dividends in the foreseeable future. We currently intend to retain any future earnings to support our operations and growth. Any payment of cash dividends in the future will be dependent on the amount of funds legally available, our financial condition, capital requirements and other factors that our Board of directors may deem relevant. Accordingly, investors must rely on sales of their common stock after price appreciation, which may never occur, as the only way to realize any future gains on their investment.
OUR OPERATIONS ARE SUBJECT TO DELAYS RELATED TO OBTAINING LAND ACCESS RIGHTS OF WAY FROM THIRD PARTIES WHICH COULD AFFECT OUR RESULTS OF OPERATIONS.
Our seismic data acquisition operations could be adversely affected by our inability to obtain timely right of way usage from both public and private land and/or mineral owners. In recent years, it has become more
17
Table of Contents
difficult, costly and time-consuming to obtain access rights of way as drilling activities have expanded into more populated areas, and landowners have become more resistant to seismic and drilling activities occurring on their property. Delays associated with obtaining such rights of way could negatively affect our results.
INDUSTRY VOLATILITY MAY ADVERSELY AFFECT OUR RESULTS OF OPERATIONS.
The demand for our services depends on the level of capital expenditures by oil and gas companies for developmental construction and these expenditures are critical to our operations. The levels of such capital expenditures are influenced by the following factors:
| • | oil and gas prices and industry perceptions of future price levels and demand; |
| • | the cost of exploring for, producing and developing oil and gas reserves; |
| • | the ability of oil and gas companies to generate capital; |
| • | the sale and expiration dates of leases in the United States; |
| • | the availability of current geophysical data; |
| • | the discovery rate of new oil and gas reserves; |
| • | local and international political and economic conditions; and |
| • | government regulations. |
The cyclical nature of the oil and gas industry has a significant effect on our revenues and profitability. Historically, prices of oil and gas, as well as the level of exploration and developmental activity, have fluctuated substantially. This has, in the past, and may in the future, adversely affect our business. We are unable to predict future oil and gas prices or the level of oil and gas industry activity. A prolonged low level of activity in the oil and gas industry will likely depress development activity, adversely affecting the demand for our products and services and our financial condition and results of operations.
OUR GROWTH AND GROWTH STRATEGY INVOLVES RISKS.
We have grown over the last several years through internal growth and acquisitions of other companies. It will be important for our future success to manage our growth and this will require increased responsibility for management personnel. The following factors could present difficulties to us:
| • | the lack of sufficient executive-level personnel; |
| • | the successful integration of the operations and management teams from our recent acquisitions; |
| • | increased levels of debt and administrative burdens; and |
| • | increased logistical problems of large, expansive operations. |
If we do not manage these potential difficulties successfully, they could have a material adverse effect on our financial condition and results of operations.
THE DANGERS INHERENT IN OUR OPERATIONS AND THE POTENTIAL LIMITS ON INSURANCE COVERAGE FOR CERTAIN RISKS COULD EXPOSE US TO POTENTIALLY SIGNIFICANT LIABILITY COSTS.
Our operations, and to a significant degree our seismic operations, are subject to risks or injury to personnel and loss of equipment. Our crews often conduct operations in extreme weather, in difficult terrain that is not easily accessible, and under other hazardous conditions. We maintain what we believe is prudent insurance protection. However, we cannot assure that our insurance will be sufficient or effective under all circumstances. A successful claim for which we are not fully insured may have a material adverse effect on our financial condition. Moreover, we do not carry business interruption insurance with respect to our operations.
18
Table of Contents
WE OPERATE IN A HIGHLY COMPETITIVE INDUSTRY.
We compete with several other providers of seismic drilling, permitting, survey and environmental and other services. Competition among seismic contractors historically has been, and will continue to be, intense. Competitive factors have in recent years included price, crew experience, equipment availability, technological expertise and reputation for quality and dependability. Our revenues and earnings may be affected by the following factors:
| • | changes in competitive prices and availability of trained personnel; |
| • | fluctuations in the level of activity and major markets; |
| • | general economic conditions; and |
| • | governmental regulation. |
Additionally, in certain geographical areas, some of our competitors operate more crews than we do and may have substantially greater financial and other resources. These operators could enjoy an advantage over us if the competitive environment for contract awards shifts to one characterized principally by intense price competition.
SEASONALITY AND ADVERSE WEATHER CONDITIONS IN THE REGIONS IN WHICH WE OPERATE MAY ADVERSELY AFFECT OUR OPERATIONS.
Our operations are directly affected by the weather conditions in the Gulf of Mexico. Due to seasonal differences in weather patterns, we may operate more days in the spring, summer and fall periods and less in the winter months. The seasonality of oil and gas industry activity in the Gulf Coast region also affects our operations. Due to exposure to weather, we generally experience higher drilling activity in the spring, summer and fall months with the lowest activity in winter months, especially with respect to our operations in the mountainous regions of the western United States. The rainy weather, hurricanes and other storms prevalent in the Gulf of Mexico and along the Gulf Coast throughout the year may also affect our operations. As a result, full-year results are not likely to be a direct multiple of any particular quarter or combination of quarters.
WE ARE DEPENDENT ON KEY PERSONNEL.
Our success depends on, among other things, the continued active participation of our executive officers and certain of our other key operating personnel. Our officers and personnel have extensive experience in the domestic and international oilfield services industry. The loss of the services of any one of these persons could impact adversely our ability to implement our expansion strategy.
WE MAY INCUR ADDITIONAL EXPENDITURES TO COMPLY WITH GOVERNMENTAL REGULATIONS.
Our seismic and environmental operations are subject to extensive governmental regulation, violations of which may result in civil and criminal penalties, injunctions and cease and desist orders. These laws and regulations govern, among other things, operations in wetlands, the handling of explosives and hazardous and non-hazardous waste. Although our cost of compliance with such laws has to date been immaterial, such laws frequently change. Accordingly, it is impossible to predict the cost or impact of such laws on our future operations. We are also required by various governmental agencies to obtain certain permits, licenses and certificates. To date, we believe that we possess all permits, licenses and certificates material to the operation of our business. The loss of any of the licenses required for our operation could have a material adverse effect on our financial condition and results of operations.
We depend on demand for our services from the oil and gas industry, and this demand may be affected by changing tax laws and oil and gas regulations. As a result, the adoption of laws that curtail oil and gas production in our areas of operation may adversely affect us. We cannot determine to what extent our operations may be affected by any new regulations or changes in existing regulations.
19
Table of Contents
ONE STOCKHOLDER HAS SUBSTANTIAL INFLUENCE OVER OUR AFFAIRS.
Dennis R. Sciotto beneficially owns approximately 30% of our outstanding common stock. Mr. Sciotto represents and controls The Dennis R. Sciotto Family Trust and was appointed to the Board of Directors in 2005. As a result, Mr. Sciotto has the ability to substantially influence our management and affairs and all matters requiring stockholder approval, including the election of directors and approval of significant corporate transactions, such as a merger, consolidation or sale of substantially all of our assets. This may have the effect of delaying, deferring or preventing a change in control, or impeding a merger or consolidation.
FUTURE TECHNOLOGICAL ADVANCES COULD IMPAIR OPERATING ASSETS OR REQUIRE SUBSTANTIAL UNBUDGETED CAPITAL EXPENDITURES.
We compete in providing services in a capital intensive business. The development of seismic data acquisition and processing equipment has been characterized by rapid technological advancements in recent years, and this trend may continue. Manufacturers of seismic equipment may develop new systems that have competitive advantages over systems now in use that could render our current equipment obsolete or require us to make significant unplanned capital expenditures to maintain our competitive position. Under such circumstances, there can be no assurance that we would be able to obtain necessary financing on favorable terms.
OUR OPERATIONS DEPEND ON A FEW SIGNIFICANT CUSTOMERS.
We derive a significant amount of our revenue from a small number of geophysical companies. Our inability to continue to perform services for a number of our large existing customers, if not offset by sales to new or other existing customers, could have a material adverse effect on our business and operations. For example, our largest customers (those which individually accounted for more than 10% of revenue in a given year) collectively accounted for 11% (one customer), 21% (two customers), and 12% (one customer) of revenue for fiscal 2007, 2008 and 2009, respectively.
OUR BACKLOG MAY NOT BE TIMELY CONVERTED INTO REVENUE IN ANY PARTICULAR FISCAL PERIOD.
Our backlog represents those seismic drilling and survey projects for which a customer has hired us and has scheduled a start date for the project. Backlog levels vary during the year depending on weather, the timing of the completion of certain contracts and when we are awarded new contracts. Projects currently included in our backlog, at the option of the customer, are subject to termination or delay without penalty, which could substantially reduce the amount of backlog currently reported, and consequently, the conversion of that backlog into revenue.
UNFAVORABLE RESULTS OF LITIGATION COULD HAVE A MATERIAL ADVERSE IMPACT ON OUR FINANCIAL STATEMENTS.
We are subject to a variety of claims and lawsuits that arise from time to time in the ordinary course of our business. Management currently believes that resolving any of such matters, individually or in the aggregate, will not have a material adverse impact on our financial position or results of operations. The litigation and claims are subject to inherent uncertainties and management’s view of these matters may change in the future. There exists the possibility of a material adverse impact on our financial position and the results of operations for the period in which the effect of an unfavorable final outcome becomes probable and reasonably estimable.
IF WE BREACH ANY OF THE MATERIAL FINANCIAL COVENANTS UNDER OUR VARIOUS INDEBTEDNESS, OR IF AN EVENT OF DEFAULT IS DECLARED WITH RESPECT TO ANY SUCH INDEBTEDNESS, OUR DEBT SERVICE OBLIGATIONS COULD BE ACCELERATED.
If we breach any of the material financial covenants under our various indebtedness, or if an event of default is declared with respect to any such indebtedness, our substantial debt service obligations could be accelerated. In the event of any such simultaneous acceleration, we would not be able to repay all of the indebtedness.
20
Table of Contents
THE MARKET PRICE OF OUR COMMON STOCK IS HIGHLY VOLATILE.
The market price of our common stock has been and is expected to continue to be highly volatile. Factors, including announcements of technological innovations by us or other companies, regulatory matters, new or existing products or procedures, concerns about our financial position, operating results, litigation, government regulation, developments or disputes relating to agreements, patents or proprietary rights, may have a significant impact on the market price of our common stock. In addition, potential dilutive effects of future sales of shares of common stock by our shareholders and by us could have an adverse effect on the market price of our common stock.
THE HIGH FIXED COSTS OF OUR OPERATIONS COULD RESULT IN OPERATING LOSSES.
Our business has high fixed costs. As a result, any significant downtime or low productivity caused by reduced demand, weather interruptions, equipment failures, permit delays or other causes could adversely affect our results of operations.
FAILURE TO MAINTAIN EFFECTIVE INTERNAL CONTROLS IN ACCORDANCE WITH SECTION 404 OF THE SARBANES-OXLEY ACT COULD HAVE A MATERIAL ADVERSE EFFECT ON OUR STOCK PRICE.
In the future, if we fail to maintain the adequacy of our internal controls, as such standards are modified, supplemented or amended from time to time, we may not be able to ensure that we can conclude on an ongoing basis that we have effective internal controls over financial reporting in accordance with Section 404 of the Sarbanes-Oxley Act. Failure of our internal control over financial reporting may result in errors or omissions in our periodic filings which may require us to amend our prior filings. Failure to achieve and maintain an effective internal control environment could have a material adverse effect on the price of our common stock.
Our Chief Executive Officer and Chief Financial Officer reevaluated the effectiveness of the design and operation of our internal controls as they relate to accounting for income taxes at December 31, and concluded that our controls and procedures were not effective due to a material weakness in our internal control over financial reporting. There can be no assurance that our controls will effectively prevent material misstatements in our consolidated financial statements in future periods.
CERTAIN OF OUR FACILITIES COULD BE DAMAGED BY HURRICANES AND OTHER NATURAL DISASTERS, WHICH COULD HAVE AN ADVERSE EFFECT ON OUR RESULTS OF OPERATIONS AND FINANCIAL CONDITION.
Certain of our facilities are located in regions of the United States that are susceptible to damage from hurricanes and other weather events, and, during 2005 and 2008, were impacted by hurricanes or weather events. Future hurricanes or similar natural disasters that impact our facilities may negatively affect our financial position and operating results for those periods. These negative effects may include reduced operations; costs associated with resuming operations; reduced demand for our services from customers that were similarly affected by these events; lost market share; late deliveries; additional costs to purchase materials and supplies from outside suppliers; uninsured property losses; inadequate business interruption insurance and an inability to retain necessary staff.
THE ADOPTION OF CLIMATE CHANGE LEGISLATION OR REGULATIONS RESTRICTING EMISSIONS OF “GREENHOUSE GASES” COULD RESULT IN INCREASED OPERATING COSTS AND REDUCED DEMAND FOR THE PRODUCTS AND SERVICES WE PROVIDE.
On June 26, 2009, the United States House of Representatives approved adoption of the “American Clean Energy and Security Act of 2009,” also known as the “Waxman-Markey cap-and-trade legislation” (ACESA), which would establish an economy-wide cap-and-trade program in the United States to reduce emissions of
21
Table of Contents
“greenhouse gases” (GHGs), including carbon dioxide and methane that may be contributing to warming of the Earth’s atmosphere and other climatic changes. ACESA would require an overall reduction in GHG emissions of 17 percent (from 2005 levels) by 2020, and by over 80 percent by 2050. Under ACESA, covered sources of GHG emissions would be required to obtain GHG emission “allowances” corresponding to their annual emissions of GHGs. The number of emission allowances issued each year would decline as necessary to meet ACESA’s overall emission reduction goals. As the number of GHG emission allowances declines each year, the cost or value of allowances is expected to escalate significantly. The net effect of ACESA would be to impose increasing costs on the combustion of carbon-based fuels such as oil, refined petroleum products, natural gas and NGLs.
The United States Senate has begun work on its own legislation for controlling and reducing emissions of GHGs in the United States. If the Senate adopts GHG legislation that is different from ACESA, the two versions of the bill would need to be reconciled in both chambers of Congress and both chambers would be required to approve identical legislation before it could become law. President Obama has indicated that he is in support of the adoption of legislation to control and reduce emissions of GHGs through an emission allowance permitting system that results in fewer allowances being issued each year but that allows parties to buy, sell and trade allowances as needed to fulfill their GHG emission obligations. Although it is not possible at this time to predict whether or when the Senate may act on climate change legislation or how any bill approved by the Senate would be reconciled with ACESA, any laws or regulations that may be adopted to restrict or reduce emissions of GHGs would likely require our customers to incur increased operating costs. Increased operating costs could cause our customers to decrease their spending levels. The reduction in level of investment by our customers, if any, could have a material adverse effect on our financial condition and results of operations.
WE ARE SUBJECT TO RISKS ASSOCIATED WITH CLIMATE CHANGE.
There is a belief that emissions of greenhouse gases may be linked to climate change. Climate change and the costs that may be associated with its impact and the regulation of GHGs have the potential to affect our business in many ways, including negatively impacting the costs we incur in providing our services, including costs to operate and maintain our facilities, install new emission controls on our facilities, pay any taxes related to GHG emissions and administer and manage a GHG emissions program, higher insurance premiums or the potential for increased insurance claims in areas affected by adverse weather and coastal regions in the event of rising sea levels, the demand for and consumption of our services (due to change in both costs and weather patterns), and the economic health of the regions in which we operate, all of which could have a material adverse effect on our financial condition and results of operations.
| ITEM 1B. | UNRESOLVED STAFF COMMENTS |
NONE.
| ITEM 2. | PROPERTIES |
FACILITIES. Our corporate headquarters are located on 34 company-owned acres of land situated in Carencro, Louisiana. The building provides approximately 20,000 square feet of office space. It is located adjacent to our primary repair and maintenance facilities. Our environmental unit operates from land and dock-side bases leased from various owners along the Louisiana Gulf Coast.
SEISMIC SERVICES FACILITIES. Our primary fabrication and maintenance facilities are situated in a building located adjacent to our corporate headquarters. The building provides approximately 28,000 square feet of covered maintenance and fabrication space.
ENVIRONMENTAL AND OTHER SERVICES FACILITIES. The primary executive offices for our Environmental and Other Services segment are located in the Carencro, Louisiana facility. Our primary operations and offshore cleaning support facility is located in Carencro, Louisiana. We maintain six leased
22
Table of Contents
facilities along the Louisiana Gulf Coast to support our cleaning and maintenance operations. These locations include Cameron, Intracoastal City, Morgan City, Venice and Fourchon, Louisiana. Fourchon is Louisiana’s largest and busiest deep water port. Our NORM decontamination site is located in a separate facility also in Intracoastal City, Louisiana.
The acquisition of Holston provided us with additional opportunities to expand our Environmental and Other Services segment. Holston currently operates from its main facility in Jennings, Louisiana and operated satellite facilities in Cameron and Fourchon, Louisiana, which were consolidated with the facilities from which we previously operated. Additionally, Holston operates three saltwater disposal wells located in south Louisiana. Further, the BOI acquisition provided us with a saltwater disposal well in northern Texas. We also have fluid services locations in Giddings, Woodville and Bryan, Texas.
EQUIPMENT LEASING FACILITIES. Our primary operations facilities for our Equipment Leasing division are located in leased facilities in Broussard and Belle Chasse, Louisiana; Teague, Timpson, Lincoln and Navasota, Texas; Rock Springs, Wyoming; and Vernal, Utah.
| ITEM 3. | LEGAL PROCEEDINGS |
On May 1, 2008, the former owners of Preheat, Inc., which we acquired in February 2006, filed a lawsuit in federal court in the United States District Court for the Western District of Louisiana in Lafayette, Louisiana, against us, our directors, our current Chief Executive Officer, our current Senior Vice President/Chief Financial Officer, one of our investment advisors, and a principal of the investment advisor. The lawsuit sought, among other things, (i) a declaratory judgment that the Preheat purchase agreement executed in December 2005 is null because of alleged inducement to enter into the purchase agreement by criminal or fraudulent conduct, securities fraud and bad faith breach of the purchase agreement and that one of the former owner’s ERISA rights be clarified, (ii) injunctive relief to halt alleged securities disclosure violations by us and to remove three board members, and (iii) damages resulting from the nullification of the Preheat purchase agreement. We, together with the other defendants, filed a motion to dismiss the lawsuit. The motion was granted in a judgment dated July 23, 2009. No appeal was taken, and that judgment is now final. The right of the plaintiffs to pursue certain state law claims was preserved.
We have filed suit in the 15th Judicial District Court, Lafayette, Parish, against the former owners of Preheat alleging damages that we have sustained as a result of their actions. Additionally, the former owners of Preheat have filed suit against us, our directors, and others in the 16th Judicial District Court, Iberia Parish. We, along with all the defendants named, have filed exceptions to the suit based on improper venue. That motion is pending with the court. At this point, we are unable to assess the ultimate impact of the litigation in either venue. We believe the claims against us are without merit and are vigorously contesting the legal action. Additionally, we believe the value of our claim against the former owners of Preheat exceeds the amount of any claims against us.
We are involved in various additional legal and other proceedings that are incidental to the conduct of our business. We believe that none of these proceedings, if adversely determined, would have a material effect on our financial condition, results of operations or cash flows.
| ITEM 4. | REMOVED AND RESERVED |
23
Table of Contents
| ITEM 5. | MARKET FOR REGISTRANT’S COMMON EQUITY, RELATED STOCKHOLDER MATTERS AND ISSUER PURCHASES OF EQUITY SECURITIES |
PERFORMANCE GRAPH
The following graph compares the total shareholder return on the Common Stock from December 31, 2004 until December 31, 2009 with the total return on (i) the S&P Index, and (ii) a group of peer companies selected by the Company based on similarity to the Company’s line of business and similar market capitalization for the same period, in each case assuming an initial investment of $100 on December 31, 2004.
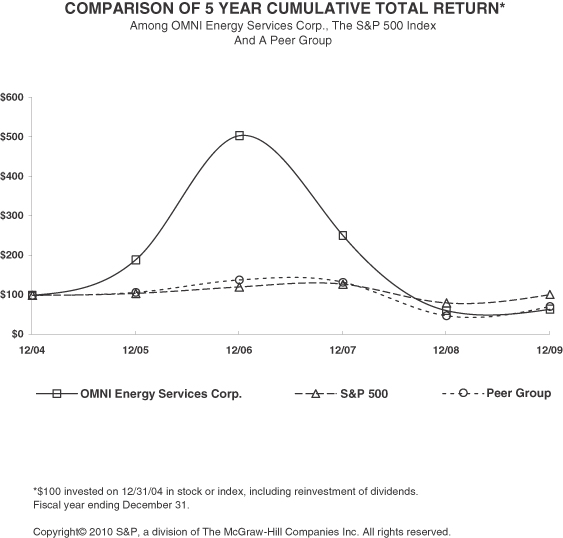
| Cumulative Total Return | ||||||||||||
| 12/04 | 12/05 | 12/06 | 12/07 | 12/08 | 12/09 | |||||||
| OMNI Energy Services Corp. |
100.00 | 189.69 | 504.64 | 251.55 | 61.34 | 64.95 | ||||||
| S&P 500 |
100.00 | 104.91 | 121.48 | 128.16 | 80.74 | 102.11 | ||||||
| Peer Group |
100.00 | 107.60 | 138.92 | 133.03 | 48.22 | 71.68 | ||||||
24
Table of Contents
The Company’s peer Group consists of Mitcham Industries, Inc. (NASDAQ:MIND), Ion Geophysical Corp. (NYSE:IO), Basic Energy Services (NYSE:BAS), Key Energy Services (NYSE:KEG), Complete Production Services (NYSE:CPX) and the Company.
Our Common Stock is traded on the Nasdaq Global Market under the symbol “OMNI.” The following table sets forth the range of high and low sales prices of our Common Stock as reported by the Nasdaq Global Market for the periods indicated.
| HIGH | LOW | |||||
| 2009 |
||||||
| First quarter |
$ | 1.71 | $ | 0.55 | ||
| Second quarter |
$ | 2.65 | $ | 1.03 | ||
| Third quarter |
$ | 2.45 | $ | 1.38 | ||
| Fourth quarter |
$ | 2.08 | $ | 0.99 | ||
| 2008 |
||||||
| First quarter |
$ | 5.30 | $ | 3.60 | ||
| Second quarter |
$ | 7.15 | $ | 3.31 | ||
| Third quarter |
$ | 6.48 | $ | 2.90 | ||
| Fourth quarter |
$ | 3.72 | $ | 1.02 | ||
On March 25, 2010, the last reported sales price of our common stock as reported by the Nasdaq Global Market was $1.68. As of March 25, 2010, we had approximately 4,100 stockholders of record.
We have never paid cash dividends on our Common Stock. We intend to retain future earnings, if any, to meet our working capital requirements and to finance the future operations of our business. Therefore, we do not plan to declare or pay cash dividends to holders of our Common Stock in the foreseeable future. In addition, certain of our credit arrangements contain provisions that limit our ability to pay cash dividends on our Common Stock.
ISSUER PURCHASES OF EQUITY SECURITIES
There were no stock repurchases during the year ended December 31, 2009.
EQUITY COMPENSATION PLAN INFORMATION
The following table gives information about the Common Stock that may be issued upon the exercise of options, warrants and rights under all of the Company’s existing equity compensation plans as of December 31, 2009, including the Incentive Plan and the Amended OMNI Energy Services Corp. 1999 Stock Option Plan.
| PLAN CATEGORY |
(A) NUMBER OF SECURITIES TO BE ISSUED UPON THE EXERCISE OF OUTSTANDING OPTIONS, WARRANTS AND RIGHTS |
(B) WEIGHTED AVERAGE EXERCISE PRICE OF OUTSTANDING OPTIONS, WARRANTS AND RIGHTS |
(C) NUMBER OF SECURITIES REMAINING AVAILABLE FOR FUTURE ISSUANCE UNDER EQUITY COMPENSATION PLANS (EXCLUDING SECURITIES REFLECTED IN COLUMNS (A) & (B)) |
(D) TOTAL OF SECURITIES REFLECTED IN COLUMNS (A) & (C) | |||||
| Equity Compensation Plans Approved by Shareholders |
3,479,784 | $ | 2.19 | 2,270,216 | 5,750,000 | ||||
| Equity Compensation Plans Not Approved by Shareholders |
100,000 | $ | 2.08 | — | 100,000 | ||||
| Total |
3,579,784 | $ | 2.19 | 2,270,216 | 5,850,000 | ||||
25
Table of Contents
Plan Not Approved by Stockholders. In January 1999, the Company approved the Amended OMNI Energy Services Corp. 1999 Stock Option Plan (the “Option Plan”) to provide for the grant of options to purchase shares of Common Stock to the Company’s non-officer employees in lieu of year-end cash bonuses. The Option Plan is intended to increase stockholder value and advance the Company’s interests by providing an incentive to employees and by increasing employee awareness of the Company in the marketplace. Under the Option Plan, the Company may grant options to any of its employees with the exception of officers of the Company. The options become exercisable immediately with respect to one-half of the shares, and the remaining one-half are exercisable one year following the date of the grant. The exercise price of any stock option granted may not be less than the fair market value of the Common Stock on the effective date of the grant. A total of 100,000 shares of Common Stock are authorized, of which none remain available for issuance at December 31, 2009.
| ITEM 6. | SELECTED FINANCIAL DATA |
The selected financial data as of and for the five years ended December 31, 2009 are derived from our audited consolidated financial statements. The following information is qualified in its entirety by reference to and should be read in conjunction with “Management’s Discussion and Analysis of Financial Condition and Results of Operations” and the consolidated financial statements and notes thereto included elsewhere in this document. Our selected historical results are not necessarily indicative of results expected in future periods.
We sold our Aviation Transportation Services business effective June 30, 2005. The financial information related to the results of operations for the year ended December 31, 2005 has been adjusted to present the operations of the Aviation Transportation Services business as discontinued operations.
26
Table of Contents
SELECTED FINANCIAL DATA
| YEAR ENDED DECEMBER 31, | ||||||||||||||||||||
| 2005 | 2006 | 2007 | 2008 | 2009 | ||||||||||||||||
| (In thousands, except per share data) | ||||||||||||||||||||
| INCOME STATEMENT DATA: |
||||||||||||||||||||
| Operating revenue |
||||||||||||||||||||
| Services |
$ | 43,350 | $ | 82,819 | $ | 140,695 | $ | 149,559 | $ | 96,433 | ||||||||||
| Rentals |
— | 16,179 | 31,784 | 44,027 | 25,993 | |||||||||||||||
| Total operating revenue |
43,350 | 98,998 | 172,479 | 193,586 | 122,426 | |||||||||||||||
| Operating expenses |
||||||||||||||||||||
| Direct costs (exclusive of depreciation and amortization shown separately below) |
||||||||||||||||||||
| Services |
26,689 | 54,484 | 95,476 | 105,852 | 69,307 | |||||||||||||||
| Rentals |
— | 5,298 | 14,603 | 21,981 | 13,438 | |||||||||||||||
| Depreciation and amortization |
4,627 | 5,660 | 10,761 | 13,313 | 13,511 | |||||||||||||||
| General and administrative expenses (exclusive of depreciation and amortization shown separately above) (includes litigation settlement of $2,400 in 2008) |
8,497 | 13,780 | 28,117 | 31,006 | 22,211 | |||||||||||||||
| Total operating expenses |
39,813 | 79,222 | 148,957 | 172,152 | 118,467 | |||||||||||||||
| Impairment of goodwill and intangibles |
— | — | — | 25,047 | 2,369 | |||||||||||||||
| Impairment of fixed assets |
— | — | — | 417 | 237 | |||||||||||||||
| Operating income (loss) |
3,537 | 19,776 | 23,522 | (4,030 | ) | 1,353 | ||||||||||||||
| Interest expense |
(2,836 | ) | (4,966 | ) | (6,936 | ) | (6,826 | ) | (3,685 | ) | ||||||||||
| Gain (loss) on debenture conversion inducement and debt extinguishment |
758 | 15 | (1,100 | ) | 120 | (8 | ) | |||||||||||||
| Other income, net |
9 | 185 | 187 | 249 | 22 | |||||||||||||||
| Income (loss) before income taxes |
1,468 | 15,010 | 15,673 | (10,487 | ) | (2,318 | ) | |||||||||||||
| Income tax benefit (expense) |
508 | 6,805 | (5,504 | ) | (3,153 | ) | (591 | ) | ||||||||||||
| Net income (loss) from continuing operations |
1,976 | 21,815 | 10,169 | (13,640 | ) | (2,909 | ) | |||||||||||||
| Loss from discontinued operations, net of taxes |
(3,978 | ) | — | — | — | — | ||||||||||||||
| Loss on disposal of discontinued operations assets, net of taxes |
(2,271 | ) | — | — | — | — | ||||||||||||||
| Net income (loss) |
(4,273 | ) | 21,815 | 10,169 | (13,640 | ) | (2,909 | ) | ||||||||||||
| Dividends and accretion of preferred stock |
(249 | ) | (488 | ) | (503 | ) | (489 | ) | (486 | ) | ||||||||||
| Non-cash charge attributable to beneficial conversion features of preferred stock |
(745 | ) | (458 | ) | (255 | ) | — | — | ||||||||||||
| Net income (loss) available to common stockholders |
$ | (5,267 | ) | 20,869 | 9,411 | (14,129 | ) | (3,395 | ) | |||||||||||
| Basic income (loss) per common share: |
||||||||||||||||||||
| Income (loss) from continuing operations |
$ | 0.07 | $ | 1.29 | $ | 0.52 | $ | (0.72 | ) | $ | (0.16 | ) | ||||||||
| Loss from discontinued operations |
(0.30 | ) | — | — | — | — | ||||||||||||||
| Loss on disposal of discontinued operations assets |
(0.17 | ) | — | — | — | — | ||||||||||||||
| Net income (loss) available to common stockholders |
$ | (0.40 | ) | $ | 1.29 | $ | 0.52 | $ | (0.72 | ) | $ | (0.16 | ) | |||||||
| Diluted income (loss) per common share: |
||||||||||||||||||||
| Income (loss) from continuing operations |
$ | 0.07 | $ | 0.89 | $ | 0.40 | $ | (0.72 | ) | $ | (0.16 | ) | ||||||||
| Loss from discontinued operations |
(0.29 | ) | — | — | — | — | ||||||||||||||
| Loss on disposal of discontinued operations assets |
(0.16 | ) | — | — | — | — | ||||||||||||||
| Net income (loss) available to common stockholders |
$ | (0.38 | ) | $ | 0.89 | $ | 0.40 | $ | (0.72 | ) | $ | (0.16 | ) | |||||||
| Number of Weighted Average Shares: |
||||||||||||||||||||
| Basic |
13,251 | 16,190 | 18,077 | 19,740 | 20,795 | |||||||||||||||
| Diluted |
13,683 | 24,459 | 25,634 | 19,740 | 20,795 | |||||||||||||||
27
Table of Contents
| DECEMBER 31, | ||||||||||||||||||||
| 2005 | 2006 | 2007 | 2008 | 2009 | ||||||||||||||||
| (In thousands) | ||||||||||||||||||||
| BALANCE SHEET DATA: |
||||||||||||||||||||
| Total assets |
$ | 43,758 | $ | 120,540 | $ | 164,994 | $ | 163,522 | $ | 127,274 | ||||||||||
| Long-term debt, less current maturities |
15,801 | 32,935 | 34,827 | 45,710 | 35,941 | |||||||||||||||
| Preferred stock |
806 | 1,285 | 1,162 | 1,074 | 1,074 | |||||||||||||||
| Total equity |
11,135 | 39,426 | 60,159 | 51,009 | 49,459 | |||||||||||||||
| YEAR ENDED DECEMBER 31, | ||||||||||||||||||||
| 2005 | 2006 | 2007 | 2008 | 2009 | ||||||||||||||||
| (In thousands) | ||||||||||||||||||||
| STATEMENT OF CASH FLOW DATA: |
||||||||||||||||||||
| Net cash provided by operating activities |
$ | 2,894 | $ | 22,360 | $ | 34,581 | $ | 28,656 | $ | 25,599 | ||||||||||
| Net cash provided by (used in) investing activities |
11,474 | (26,120 | ) | (35,523 | ) | (32,529 | ) | (557 | ) | |||||||||||
| Net cash provided by (used in) financing activities |
(15,237 | ) | 16,162 | 1,797 | (7,515 | ) | (25,154 | ) | ||||||||||||
| ITEM 7. | MANAGEMENT’S DISCUSSION AND ANALYSIS OF FINANCIAL CONDITION AND RESULTS OF OPERATIONS |
Management’s Discussion and Analysis of Financial Condition and Results of Operations contains certain “forward looking statements” within the meaning of Section 27A of the Securities Act of 1933, as amended (the “Securities Act”) and Section 21E of the Securities Exchange Act of 1934, as amended (the “Exchange Act”), which reflect management’s best judgment based on factors currently known. Actual results could differ materially from those anticipated in these “forward looking statements” as a result of a number of factors, including but not limited to those discussed under the headings “Cautionary Statements,” “Risk Factors,” and “Forward Looking Statements” provided by us pursuant to the safe harbor established by the federal securities laws, and should be evaluated in the context of these factors.
This discussion and analysis should be read in conjunction with our consolidated financial statements and accompanying notes contained herein.
EXECUTIVE OVERVIEW
Our business is driven by the supply and demand of hydrocarbon commodities in the United States and, to a certain extent, the international markets. Virtually all of our customers are involved in the exploration and/or production of oil and natural gas in the continental United States and the coastal waters of the Gulf of Mexico. Not surprisingly, a higher demand for oil and gas results in a higher demand for our equipment and services. Our operational levels for 2009 were generally below levels for 2008 as the demand for natural gas fell and the corresponding rig count in support of exploration and production was likewise reduced.
In the immediate past, we have been active in acquiring companies which we believe are well aligned with our Company philosophy. The companies acquired have been complementary to our core business segments. We plan to diversify into other service lines and other service areas through additional acquisitions, as opportunities arise that we believe fit into our overall business strategy.
We continue to maintain a large and visible presence along the coast of Louisiana to service our customers in the offshore exploration and production markets. While the offshore rig counts in the Gulf of Mexico have fallen in recent years, we feel that there is still adequate activity in the area to allow us to remain profitable in that region.
Our acquisitions have allowed us to expand our operations into what currently appear to be more prolific areas of activity, such as the Rocky Mountain and shale regions in the South Central and Northeast United States.
28
Table of Contents
We anticipate that the Rocky Mountain region will continue to be a very active area in terms of natural gas exploration. During 2006, we opened an Equipment Leasing location in Rock Springs, Wyoming to establish a presence in the Rocky Mountain region. In conjunction with the acquisition of Holston, we were able to expand our visibility in the Rocky Mountains with the addition of an additional leasing location in Vernal, Utah.
The Haynesville and Fayetteville Shale region in northern Louisiana and southern Arkansas also appear to be a very active area in terms of oil and gas exploration and production. Our acquisition of Rig Tools in November 2006 and Industrial Lift in April 2008 allowed us to position ourselves in some of the more prolific shale regions to take advantage of the anticipated growth in those geographical areas. It is our intention to continue to expand into areas that we feel are beneficial to the growth and well-being of the Company.
The Marcellus Shale region of the Northeast United States is expected to be one of the most prolific shale plays in recent times. During 2009, we secured a seismic drilling contract in the Marcellus region. Work on that project began in early 2010. Additionally, we have begun operations of an equipment rental facility in the Marcellus region.
We believe that the outlook for 2010 will remain largely dependent on the U.S. and global economic climate and growth and the working rig counts in the regions that we serve. As gas prices have gradually recovered and the working rig count increased during the second half of 2009, we believe that the outlook for 2010 will be generally favorable relative to the lows that we experienced during 2009. Our activity levels for the latter half of the fourth quarter showed improvement over earlier periods with the exception of our Seismic Services segment which was negatively impacted by weather conditions in the fourth quarter of 2009. We believe that if natural gas prices and the number of working rigs continue to increase, our customers will increase capital spending in 2010 compared to 2009.
We will continue to monitor our cost structure and focus on growth opportunities as they present themselves. During 2009, we consolidated several facilities in order to more efficiently serve our customers and reduce costs. Throughout 2010 we will continue to assess the size and compensation levels of our workforce to ensure that we can take advantage of any recovery that may occur during the near term. We believe that this process will serve to better position us to take advantage of those opportunities. Some portion of the cost cutting measures that we put into place during 2009 may be discontinued as activity levels in the market and business activity increases. Additionally, we are exploring several opportunities to expand our services and feel that our liquidity will be sufficient to take advantage of any attractive acquisition opportunities should they develop.
GENERAL
DEMAND FOR OUR SERVICES. We receive our revenues from customers in the energy industry. Demand for our seismic services is principally impacted by conditions affecting geophysical companies engaged in the acquisition of 3-D seismic data. All other services and equipment rentals are a function of exploration and production activities of oil and gas companies operating in the continental United States, as well as in the Gulf of Mexico. The level of demand for our services and equipment rentals is primarily influenced by the level of capital expenditures by oil and gas companies.
A number of factors affect the decision of oil and gas companies to pursue the acquisition of seismic data and the exploration for oil and gas, including (i) prevailing and expected oil and gas demand and prices; (ii) the cost of exploring for, producing and developing oil and gas reserves; (iii) the discovery rate of new oil and gas reserves; (iv) the availability and cost of permits and consents from landowners to conduct seismic activity; (v) local and international political and economic conditions; (vi) governmental regulations; and (vii) the availability and cost of capital. The ability to finance the acquisition of seismic data in the absence of oil and gas companies’ interest in obtaining the information is also a factor, as some geophysical companies will acquire seismic data on a speculative basis.
29
Table of Contents
The demand for our environmental and equipment leasing services are affected by the level of activity in the exploration and production of oil and gas companies in the Gulf of Mexico, the Rocky Mountains and the Barnett, Fayetteville and Haynesville Shale regions.
SEASONALITY AND WEATHER RISKS. Our seismic services operations are subject to seasonal variations in weather conditions and daylight hours as our activities take place outdoors. On average, fewer hours are worked per day and fewer holes are generally drilled or surveyed per day in winter months than in summer months due to an increase in rainy, foggy, snowy and cold conditions and a decrease in daylight hours. Our environmental, equipment rental, transportation and fluid and other services are potentially affected by hurricanes in the Gulf of Mexico region. The hurricane season is from June 1 through November 30 each year.
RESULTS OF OPERATIONS
The following discussion provides information related to the results of our operations.
Year Ended December 31, 2008 Compared To The Year Ended December 31, 2009:
| YEAR ENDED DECEMBER 31, | ||||||||
| 2008 | 2009 | |||||||
| (In thousands) | ||||||||
| Operating revenue |
||||||||
| Services |
$ | 149,559 | $ | 96,433 | ||||
| Rentals |
44,027 | 25,993 | ||||||
| Total operating revenue |
193,586 | 122,426 | ||||||
| Operating expenses |
||||||||
| Direct costs (exclusive of depreciation and amortization shown separately below) |
||||||||
| Services |
105,852 | 69,307 | ||||||
| Rentals |
21,981 | 13,438 | ||||||
| Depreciation and amortization |
13,313 | 13,511 | ||||||
| General and administrative expenses (exclusive of depreciation and amortization shown separately above) (includes litigation settlement of $2,400 in 2008) |
31,006 | 22,211 | ||||||
| Total operating expenses |
172,152 | 118,467 | ||||||
| Impairment of goodwill and intangibles |
25,047 | 2,369 | ||||||
| Impairment of fixed assets |
417 | 237 | ||||||
| Operating income (loss) |
(4,030 | ) | 1,353 | |||||
| Interest expense |
(6,826 | ) | (3,685 | ) | ||||
| Gain (loss) on debt extinguishment |
120 | (8 | ) | |||||
| Other income, net |
249 | 22 | ||||||
| Loss before income taxes |
(10,487 | ) | (2,318 | ) | ||||
| Income tax expense |
(3,153 | ) | (591 | ) | ||||
| Net loss |
(13,640 | ) | (2,909 | ) | ||||
| Preferred stock dividends |
(489 | ) | (486 | ) | ||||
| Net loss available to common stockholders |
$ | (14,129 | ) | $ | (3,395 | ) | ||
Consolidated operating revenues decreased 37% or $71.2 million, from $193.6 million for the year ended December 31, 2008 to $122.4 million for the year ended December 31, 2009. This decrease was due to decreases of $53.2 million in Service revenues and $18.0 million in Rental revenues.
30
Table of Contents
Service revenues. The decrease of $53.2 million in Service revenues was attributable to the decrease in demand for our services in light of the reduction in natural gas prices and the number of rigs operating in the regions in which we service. Decreases in revenue of $19.0 million occurred in the Environmental and Other Services segment primarily due to the reduction in the number of rigs operating in the Gulf of Mexico and in the continental United States. With the reduction in rigs, we saw a diminished demand for our services and an increase in pricing pressures among the customers that we service. The Seismic Services segment experienced a $34.2 million reduction in revenue compared to the previous year due to uncertainties in the data acquisition industry as a result of lower natural gas prices and diminished demand for seismic data as a result of the reduction of working rigs.
Rental revenues. Revenues from the Equipment Leasing segment decreased by $18.0 million as a result of lower demand for our equipment coupled with increase pricing pressures. With the large drop in operating rigs in the areas we serve, the number of customers demanding our services dropped and pricing became much more competitive during the downturn resulting in lower pricing.
Direct costs, excluding depreciation and amortization decreased 35%, or $45.1 million, from $127.8 million for the year ended December 31, 2008 to $82.7 million for the year ended December 31, 2009. This decrease was due to a decrease of $36.6 million in direct costs associated with Service revenue and a decrease of $8.5 million in direct costs related to Rental revenues.
Direct costs, excluding depreciation and amortization—Services. Direct costs, excluding depreciation and amortization related to Service revenues decreased by $36.6 million due to the general reduction in costs related to the reduction in the level of business activity. Decreases in direct costs of $11.4 million occurred in the Environmental and Other Services segment and $25.2 million occurred in the Seismic Services segment. In response to the downturn in the market, we made a concerted effort to reduce headcount and cut costs in an effort to manage into the anticipated lower activity levels.
Direct costs, excluding depreciation and amortization—Rentals. Direct costs, excluding depreciation and amortization related to Rental activities decreased by $8.5 million due to a reduction in headcount and the general reduction in costs related to the diminished level of business activity.
Depreciation and amortization costs increased $0.2 million from $13.3 million for the year ended December 31, 2008 to $13.5 million for year ended December 31, 2009. Depreciation expense increased $2.3 million due primarily to the increase in revenue-producing assets in the equipment leasing and environmental and other services segments. Amortization expense decreased $2.1 million due to the decrease in intangibles related to the impairment recorded in 2008.
General and administrative costs decreased $8.8 million, from $31.0 million during the year ended December 31, 2008 to $22.2 million for the year ended December 31, 2009. Of the decrease over the prior year, $2.4 million relates to the settlement of litigation with Siemens Water Technologies, $3.3 million relates to decreases in payroll and related costs, and $2.2 million relates to decreases in professional services.
We test goodwill for impairment on an annual basis, or more often if circumstances indicate our goodwill might be impaired. Upon completion of our test in 2008, there were indicators that a portion of the goodwill and intangibles of our Seismic Services, Equipment Leasing and Environmental and Other Services segments might be impaired. As required by Accounting Standards Codification (“ASC”) 350, “Intangibles—Goodwill and Other,” we calculated the implied fair value of the goodwill and intangibles for these segments and determined that the implied fair value was less than the carrying value of the goodwill and intangibles, meaning that the goodwill and intangibles were impaired.
During our test for impairment in 2009, we recorded an impairment charge in the amount of $2.4 million related to the goodwill in our Equipment Leasing segment. Management believes that the goodwill of this segment was impaired because of the economic downturn and deterioration in the global credit markets and
31
Table of Contents
specifically the downturn in the oilfield services sector, which has resulted in a decline in our stock price and market valuation. The goodwill which was written off arose from our acquisitions of Preheat and Holston in 2006 and 2007, respectively.
As a result, during the fourth quarter of 2008, we recorded a pre-tax charge of approximately $25.0 million to write off a portion of the intangible and goodwill balances related to our Seismic Services, Equipment Leasing and Environmental and Other Services segments. As mentioned above, management of the Company believes that the intangibles and goodwill of these segments were impaired because of the overall economic downturn and deterioration in the global credit markets and specifically the downturn in the oilfield services sector, which has resulted in a decline in our stock price and market valuation. The intangibles and goodwill which were written off arose from our acquisitions of Cypress, Preheat, Rig Tools, Holston and Industrial Lift between February 2006 and April 2008.
During our test for impairment in 2009, we recorded an impairment charge in the amount of $2.4 million related to the goodwill in our Equipment Leasing segment. As noted above, this also was due to the overall economic downturn and deterioration in the global credit markets and specifically the downturn in the oilfield services sector. The intangibles and goodwill which were written off arose from the acquisition of Preheat.
Interest expense decreased approximately $3.1 million from $6.8 million for the year ended December 31, 2008 to $3.7 million for the year ended December 31, 2009. This decrease was due to decreased levels of debt coupled with decreases in variable interest rates from 2008 to 2009.
Gain on debt extinguishment decreased $0.1 million from 2008 to 2009 primarily as a result of the early repayment of a former shareholder note.
Other income decreased from $0.2 million in 2008 to $0.0 million in 2009. This decrease was primarily attributable to a $0.2 million decrease in miscellaneous income.
For the year ended December 31, 2008, the provision for income tax expense was $3.2 million compared to $0.6 million for 2009. Our effective tax rates differ from the statutory rate of 35% primarily because of state income taxes, and the tax effects of permanent items attributable to book-tax differences.
Preferred stock dividends were $0.5 million each for the years ended December 31, 2008 and 2009.
32
Table of Contents
Year Ended December 31, 2007 Compared To The Year Ended December 31, 2008:
| YEAR ENDED DECEMBER 31, | ||||||||
| 2007 | 2008 | |||||||
| (In thousands) | ||||||||
| Operating revenue |
||||||||
| Services |
$ | 140,695 | $ | 149,559 | ||||
| Rentals |
31,784 | 44,027 | ||||||
| Total operating revenue |
172,479 | 193,586 | ||||||
| Operating expenses |
||||||||
| Direct costs (exclusive of depreciation and amortization shown separately below) |
||||||||
| Services |
95,476 | 105,852 | ||||||
| Rentals |
14,603 | 21,981 | ||||||
| Depreciation and amortization |
10,761 | 13,313 | ||||||
| General and administrative expenses (exclusive of depreciation and amortization shown separately above) (includes litigation settlement of $2,400 in 2008) |
28,117 | 31,006 | ||||||
| Total operating expenses |
148,957 | 172,152 | ||||||
| Impairment of goodwill and intangibles |
— | 25,047 | ||||||
| Impairment of fixed assets |
— | 417 | ||||||
| Operating income (loss) |
23,522 | (4,030 | ) | |||||
| Interest expense |
(6,936 | ) | (6,826 | ) | ||||
| Gain (loss) on debt extinguishment |
(1,100 | ) | 120 | |||||
| Other income |
187 | 249 | ||||||
| Income (loss) before income taxes |
15,673 | (10,487 | ) | |||||
| Income tax expense |
(5,504 | ) | (3,153 | ) | ||||
| Net income (loss) |
10,169 | (13,640 | ) | |||||
| Preferred stock dividends |
(503 | ) | (489 | ) | ||||
| Non-cash charge attributable to beneficial conversion features of preferred stock |
(255 | ) | — | |||||
| Net income (loss) available to common stockholders |
$ | 9,411 | $ | (14,129 | ) | |||
Consolidated operating revenues increased 12% or $21.1 million, from $172.5 million for the year ended December 31, 2007 to $193.6 million for the year ended December 31, 2008. This increase was due to an increase of $8.9 million in Service revenue and an increase of $12.2 million in Rental revenues.
Service revenues. The increase of $8.9 million in Service revenues was due in part to the January 2008 BEG acquisition which contributed $18.7 million of the $24.2 million increase in our Environmental and Other Services segment revenues. Offsetting decreases in revenue of $6.1 million occurred in the Environmental and Other Services segment due to the reduction in active drilling rigs in the areas which we service, and $9.2 million occurred in the Seismic Services segment due to the fall in the price of natural gas, which had a negative impact on the demand for seismic data acquisition, one of the drivers in the demand for our seismic services.
Rental revenues. Revenues from the Equipment Leasing segment increased by $12.2 million primarily due to the increase in revenues resulting from our acquisition of Industrial Lift in April 2008, which contributed $8.6 million of the increase in Rental revenue for 2008.
Direct costs, excluding depreciation and amortization increased 16%, or $17.8 million, from $110.0 million for the year ended December 31, 2007 to $127.8 million for the year ended December 31, 2008. This increase was due to an increase of $10.4 million in direct costs associated with Service revenue and an increase of $7.4 million in direct costs related to Rental revenues.
33
Table of Contents
Direct costs, excluding depreciation and amortization—Services. Direct costs, excluding depreciation and amortization related to Service revenues increased by $10.4 million due in part to the BEG acquisition which contributed $12.7 million to the increase in our Environmental and Other Services direct costs of $12.8 million. Offsetting decreases in direct costs of $2.4 million occurred in the Seismic Services segment.
Direct costs, excluding depreciation and amortization—Rentals. Direct costs, excluding depreciation and amortization related to Rental activities increased by $7.4 million due partly to the increase in direct costs resulting from our acquisition of Industrial Lift in April 2008 which contributed $4.7 million.
Depreciation and amortization costs increased $2.5 million from $10.8 million for the year ended December 31, 2007 to $13.3 million for year ended December 31, 2008. Depreciation expense increased $0.7 million due primarily to the increase in revenue-producing assets from the acquisitions of BEG in January 2008 and Industrial Lift in April 2008. Amortization expense increased $1.8 million due to the increase in intangibles related to the aforementioned acquisitions.
General and administrative costs increased $2.9 million, from $28.1 million during the year ended December 31, 2007 to $31.0 million for the year ended December 31, 2008 partially as a result of the acquisitions of BEG and Industrial Lift in 2008. Of the increase over the prior year, $2.4 million relates to the settlement of litigation with Siemens Water Technologies.
We test goodwill for impairment on an annual basis, or more often if circumstances indicate our goodwill might be impaired. Upon completion of our test in 2008, there were indicators that the a portion of the goodwill and intangibles of our Seismic Services, Equipment Leasing and Environmental and Other Services segments might be impaired. As required by Accounting Standards Codification (“ASC”) 350, “Intangibles—Goodwill and Other,” we calculated the implied fair value of the goodwill and intangibles for these segments and determined that the implied fair value was less than the carrying value of the goodwill and intangibles, meaning that the goodwill and intangibles were impaired. As a result, during the fourth quarter of 2008, we recorded a pre-tax charge of approximately $25.0 million to write off a portion of the intangible and goodwill balances related to our Seismic Services, Equipment Leasing and Environmental and Other Services segments. Management of the Company believes that the intangibles and goodwill of these segments were impaired because of the overall economic downturn and deterioration in the global credit markets and specifically the downturn in the oilfield services sector, which has resulted in a decline in our stock price and market valuation. The intangibles and goodwill which were written off arose from our acquisitions of Cypress, Preheat, Rig Tools, Holston and Industrial Lift between February 2006 and April 2008.
Interest expense decreased approximately $0.1 million from $6.9 million for the year ended December 31, 2007 to $6.8 million for the year ended December 31, 2008. Increased levels of debt including financing for recent acquisitions were offset by decreases in variable interest rates from 2007 to 2008.
Loss on debt extinguishment decreased $1.2 million from 2007 to 2008 primarily as a result of the early repayment of our previous revolving line of credit in March 2007. In November 2008, as an accommodation to the holder of a former shareholder note, we paid the $1.0 million due in February 2009 in exchange for a discounted payment by $0.1 million. This discount is reflected as a gain on early extinguishment of debt in the financial statements. Accordingly, any remaining deferred loan cost attributable to line of credit was expensed at that time in addition to an early payment penalty.
Other income remained constant at $0.2 million for 2007 and 2008.
For the year ended December 31, 2007, the provision for income tax expense was $5.5 million compared to $3.2 million for 2008. The provision for income taxes for 2008 on the loss before income taxes is partially derived from the non-deductibility of certain goodwill impairment charges.
34
Table of Contents
Preferred stock dividends were $0.5 million each for the years ended December 31, 2007 and 2008. Furthermore, we recorded a non-cash charge (deemed dividend) of $0.3 million attributable to the beneficial conversion feature associated with the Series C 9% Convertible Preferred Stock issued in 2007 and $0 million for 2008.
LIQUIDITY AND CAPITAL RESOURCES
At December 31, 2009, we had approximately $1.9 million in cash on hand and approximately $7.6 million available for future borrowings on our revolving line of credit. This compares to approximately $2.0 million in cash on hand and approximately $12.0 million available for future borrowings on our revolving line of credit at December 31, 2008. At December 31, 2009, we had working capital of approximately $5.5 million as compared to approximately $4.0 million at December 31, 2008. Our increase in working capital is primarily attributable to an increase in prepaid income taxes and a reduction in notes payable, accounts payable and accrued expenses that more than offset the decline in accounts receivable due to the reduction in business levels.
Cash provided by continuing operating activities was $25.6 million, $28.7 million, and $34.6 million for the years ended December 31, 2009, 2008 and 2007, respectively. In 2007, the largest contributing factor to our increase over the previous year was an increase in accounts payable. In 2008, the largest contributing factor to our decrease over the prior year was a decrease in accounts receivable, accounts payable and accrued expenses. In 2009, the largest contributing factor to our decrease over the prior year was a decrease in income from operations.
Historically, our capital requirements have primarily related to the purchase or fabrication of new seismic drilling equipment, and related support equipment. As our business has diversified, the capital requirements have expanded to include additions to our equipment rental fleet and expansion of our rolling stock. In 2006, we acquired Preheat and Rig Tools, purchased approximately $5.1 million in equipment and refinanced our rolling stock of vehicles previously accounted for as capital leases into operating leases. In 2007, we acquired Holston and certain assets of Cypress and BOI, and purchased approximately $13.8 million in equipment. For the year ended December 31, 2008, we completed the acquisitions of BEG and Industrial Lift and expended approximately $12.2 million on equipment and other fixed assets. In 2009, we concentrated on upgrading our equipment to improve efficiency of our operations enabling us to continue to be responsive to our markets as directed by the needs of our customers. In 2010, we will continue to explore strategic business opportunities and acquire additional equipment to enhance our ability to service our customers.
During 2010, management plans to continue to invest in our business through capital expenditures, albeit at levels lower than in prior years. Our capital expenditure program for 2010 is expected to total approximately $2.0 million, to be spread among growth and maintenance capital expenditures. Our focus in 2010 will be maximizing the utilization of our current equipment; however, we may seek to increase our 2010 capital expenditure budget in the event expansion opportunities develop. We currently plan to fund these expenditures through a combination of cash on hand, operating cash flows and borrowings under our Senior Credit Facility (defined below). Should our operating cash flows prove to be insufficient to fund these expenditures, management expects it will adjust capital spending plans accordingly.
Effective as of April 24, 2008, we completed a modification of our $90.0 million credit facility (“Senior Credit Facility”), including a $50.0 million term loan, a $25.0 million working capital revolving line of credit, and a $15.0 million delayed draw term loan available to fund future acquisitions. With the proceeds from the Senior Credit Facility, we (i) repaid approximately $28.7 million of outstanding principal balance under our previous term loan; (ii) repaid approximately $2.1 million of outstanding principal balance under our previous capital expenditure loan; (iii) repaid the balance on the previous line of credit; and (iv) closed the acquisition of Industrial Lift. The balance of the proceeds available under the Senior Credit Facility was used to pay fees and expenses of the aforementioned transaction and to provide additional working capital.
35
Table of Contents
On August 28, 2008, the Senior Credit Facility was amended to remove the $15.0 million delayed draw term loan. As an accommodation to our lender, we agreed to remove the delayed draw portion of the Senior Credit Facility in order to make syndication of the loan more manageable.
During November 2009, we entered into an amendment and waiver to the Senior Credit Facility. The waiver provided relief from the required fixed charge coverage ratio covenant for the quarter ended September 30, 2009. The amendment adjusted the required covenants related to our leverage ratio, our fixed charge coverage ratio and reduced our annual capital expenditure limit for 2009 and 2010. Additionally, the amendment reduced the availability under the working capital revolving line of credit from $25.0 million to $20.0 million. Interest rates were adjusted on the Term Loan and the Revolver as a result of the amendment. We were in compliance with all loan covenants at December 31, 2009.
Loan closing costs related to our various credit facilities were $0.2 million, $1.8 million and $2.4 million for the years ended December 31, 2009, 2008 and 2007, respectively.
We believe that our internally generated cash flows from operations are sufficient to finance the majority of our cash requirements for current and future operations, budgeted capital expenditures and debt service for 2010. As we have historically done, we may, from time to time, access available funds under our Senior Credit Facility to supplement our liquidity to meet our cash requirements for day to day operations and times of peak needs throughout the year. Our planned capital expenditures as well as any acquisitions we choose to pursue, are expected to be financed through a combination of cash on hand, cash flow from operations and borrowings under our Senior Credit Facility.
Our Senior Credit Facility contains numerous covenants that govern our ability to make investments and to repurchase our stock. Even if we experience a more severe downturn in our business, we believe that the covenants related to our capital spending and our investments are within our control. We were in compliance with all loan covenants at December 31, 2009 and we believe that we can avoid a default of these covenants. Although continued deterioration of market conditions could lead to a downgrade in the credit ratings of companies in our industry, a downgrade of our credit rating would not have an effect on our outstanding debt under our Senior Credit Facility, but would potentially impact our ability to obtain additional external financing, if it was required.
While management anticipates that 2010 may be a period of recovering demand and prices for our services, we believe that our operating cash flow, cash on hand and available borrowings, coupled with our ability to control our capital expenditures, will be sufficient to maintain adequate liquidity throughout 2010.
We have no plans to sell or liquidate any significant assets currently utilized in our active operating fleet other than the disposal of excess equipment in the normal course of business.
Management believes that softening market conditions may have an impact on our customer’s payment patterns but we continue to monitor policies currently in place and do not expect any material impact to our liquidity as a result.
Management anticipates that the Senior Credit Facility should be adequate to support the operating needs of the Company during these uncertain economic times and further feels that it will be able to maintain compliance with the required covenants of our Senior Credit Facility. If for some reason the Senior Credit Facility were to become unavailable, the Company may not be able to operate as a going concern.
36
Table of Contents
LONG-TERM DEBT
At December 31, 2008 and December 31, 2009, long-term debt consists of the following:
| DECEMBER 31, | ||||||||
| 2008 | 2009 | |||||||
| (In thousands) | ||||||||
| Notes payable to a bank with interest payable at prime plus 1.50% (6.5% at December 31, 2008 and 4.75 % at December 31, 2009) maturing July 31, 2023, secured by real estate |
$ | 1,243 | $ | 1,183 | ||||
| Promissory notes payable to certain former owners of acquired companies with interest at 5%, maturing at various dates through April 2013 |
6,000 | 5,350 | ||||||
| Convertible promissory notes payable to certain former stockholders of acquired companies with interest at 5%, maturing at various dates through April 2013 |
11,500 | 7,467 | ||||||
| Promissory notes payable to finance companies secured by vehicles and equipment |
492 | 329 | ||||||
| Capital leases payable to finance companies secured by equipment |
39 | 1,967 | ||||||
| Term Loan payable to a bank, variable interest rate at 30-day LIBOR plus 2.75% at December 31, 2008 and 30-day LIBOR with 1% floor plus 4.5% at December 31, 2009 (3.71% at December 31, 2008 and 5.50% at December 31, 2009), secured by various equipment, maturing April 23, 2013 |
44,000 | 36,000 | ||||||
| Total |
$ | 63,274 | $ | 52,296 | ||||
| Less: current maturities |
(17,564 | ) | (16,355 | ) | ||||
| Long-term debt, less current maturities |
$ | 45,710 | $ | 35,941 | ||||
SENIOR CREDIT FACILITY
Our Senior Credit Facility consists of a $50.0 million term loan (the “Term Loan”) and a $20.0 million working capital revolving line of credit (the “Revolver”). Availability under the Revolver is the lower of: (i) $20.0 million or (ii) the sum of eligible accounts receivable and inventory, as defined under the agreement governing the Revolver. The Revolver accrued interest at the 30-day LIBOR plus 2.25% (3.22% at December 31, 2008) and at the 30-day LIBOR with a 1% floor plus 4.0% (5.0% at December 31, 2009), and matures in April 2013. The Revolver is collateralized by accounts receivable and inventory. As of December 31, 2008 and 2009, we had $9.8 million and $0.0 million outstanding under the Revolver, respectively. Due to the lock-box arrangement and the subjective acceleration clause in the agreements governing the Revolver, the debt under our previous line of credit and the Revolver has been classified as a current liability as of December 31, 2008 and December 31, 2009, as required by ASC 470-10-45 (formerly Emerging Issues Task Force (“EITF”) No. 95-22), “Balance Sheet Classification of Borrowings Outstanding under Revolving Credit Agreements that include both a Subjective Acceleration Clause and a Lock-box Arrangement.”
Under the terms of the Term Loan, the funding limits are limited to the lesser of $50.0 million and 80% of the orderly liquidation value of our equipment. In addition, the Term Loan matures in April 2013 and will be repaid quarterly in equal payments of $2.0 million. Interest is due monthly in arrears and accrues at the 30-day LIBOR plus 2.75% (3.71% at December 31, 2008) and at the 30-day LIBOR with a 1% floor plus 4.5% (5.50% at December 31, 2009). The Term Loan contains customary financial covenants and limitations on capital expenditures. As of December 31, 2008 and 2009, we had $44.0 million and $36.0 million outstanding under the Term Loan, respectively.
During November 2009, we entered into an amendment and waiver to the Senior Credit Facility. The waiver provided relief from the required fixed charge coverage ratio covenant for the quarter ended September 30, 2009. The amendment adjusted the required covenants related to our leverage ratio, our fixed charge coverage ratio and reduced our annual capital expenditure limit for 2009 and 2010. Additionally, the amendment reduced the availability under the Revolver from $25.0 million to $20.0 million. Interest rates were adjusted on the Term
37
Table of Contents
Loan and the Revolver as a result of the amendment. At December 31, 2009, we were in compliance with all covenants under the Senior Credit Facility.
We were in compliance with the covenants under the Senior Credit Facility as of December 31, 2009, but at this time it is uncertain whether the covenants, specifically the leverage ratio covenant, will be met at March 31, 2010 and thereafter. If we are unable to comply with our covenants at March 31, 2010 or in the future, we believe that it is probable that we would be able to cure covenant violations by obtaining waivers from our lenders to cure a default, although we can give no assurances that any waiver or amendment will be entered into, or on terms acceptable to us. If we were not able to comply with our covenants in the future, and we were not able to obtain waivers from our lenders to cure a default, our lenders would have the right to demand acceleration of payment on all amounts outstanding under the Senior Credit Facility.
CAPITAL LEASES
In 2007, we acquired a forklift under capital lease. The capital lease matures in February 2012. In 2009, we acquired several units of equipment under capital leases for the seismic services and environmental and other services segments. These leases have maturity dates ranging from February 2011 to July 2014. Total balance of all capital leases payable as of December 31, 2009 was $2.0 million.
PREHEAT NOTES
In connection with the February 2006 purchase of Preheat, we issued $4.0 million in 5% promissory notes payable to certain Preheat stockholders (“Preheat Notes”). The Preheat Notes consist of three separate notes with $2.7 million maturing in February 2008 and $1.3 million maturing in February 2009. At December 31, 2008 and 2009, the Preheat Notes had an outstanding balance of $4.0 million and $3.85 million, respectively. In February 2008, we terminated for cause the employment of one of the Preheat stockholders. The terms of the Preheat Notes provide that a termination of either of the Preheat stockholders’ employment for cause results in the cancellation of the Preheat Notes. The Preheat stockholders are contesting our assertion and have filed a lawsuit against the Company (See Note 9 to the Consolidated Financial Statements). Consequently, the Preheat Notes remain recorded as a liability in the financial statements pending resolution of the matter.
CHARLES HOLSTON NOTES
In connection with the acquisition of Holston in March 2007, we issued $5.0 million in 5% promissory notes payable to certain Holston owners (“Holston Notes”). The Holston Notes consist of three separate notes with $1.0 million maturing in February 2008, $2.0 million maturing in February 2009 and $2.0 million maturing in February 2010. The notes maturing in 2009 and 2010 are convertible into shares of our common stock at a price of $9.24 per share. Based upon the stock valuation at the time of issuance, no beneficial conversion feature existed. At December 31, 2008 and 2009, the Holston Notes had a balance of $4.0 million and $2.0 million, respectively.
In February 2010, each of the holders of the Holston Notes signed note modification agreements (“Holston Note Modifications”) whereby the payment terms of the Holston Notes were modified to thirty-five monthly payments of principal and interest of $0.06 million beginning February 28, 2010 and one payment for the balance on January 28, 2013. At the time of the Holston Note Modifications, we issued an aggregate of 107,334 shares of our unregistered restricted common stock to the holders of the Holston Notes. The restrictions on the shares will lapse at various times prior to the maturity of the Holston Notes and we may, at our option, pay the Holston Note balances prior to the new maturity date without penalty. If payment of the Holston Notes is made prior to the lapse of the periodic restrictions, the remaining restricted shares will be forfeited to us and cancelled. The allocation between current and long-term debt was adjusted in the 2009 financial statements to reflect these modifications.
38
Table of Contents
CYPRESS NOTE
In connection with the acquisition of certain assets of Cypress effective in February 2007, we issued $3.0 million in a 5% promissory note payable to a certain Cypress Energy stockholder (“Cypress Note”). The Cypress Note is payable over three years with $1.0 million maturing in February 2008, $1.0 million maturing in February 2009 and $1.0 million maturing in February 2010. In November 2008, as an accommodation to the holder of the note, we paid the $1.0 million due in February 2009 in exchange for a discounted payment by $0.1 million. This discount is reflected as a gain on early extinguishment of debt in the financial statements. At December 31, 2008 and 2009, the Cypress Note had a balance of $1.0 million.
BAILEY NOTE
In connection with the acquisition of in June 2007, we issued $0.5 million in a 5% promissory note payable to BOI (“Bailey Note”). The Bailey Note is payable on or before May 31, 2010. At December 31, 2008 and 2009, the Bailey Note had a balance of $0.5 million.
In January 2010, the holder of the Bailey Note signed a note modification agreement (“Bailey Note Modification”) whereby the payment terms of the Bailey Note were modified to thirty-five monthly payments of principal and interest of $0.015 million beginning May 30, 2010 and one payment for the balance on April 30, 2013. At the time of the Bailey Note Modifications, we issued an aggregate of 26,832 shares of our unregistered restricted common stock to the holder of the Bailey Note. The restrictions on the shares will lapse at various times prior to the maturity of the Bailey Notes and we may, at our option, pay the Bailey Note balance prior to the new maturity date without penalty. If payment of the Bailey Note is made prior to the lapse of the periodic restrictions, the remaining restricted shares will be forfeited to us and cancelled. The allocation between current and long-term debt was adjusted in the 2009 financial statements to reflect the modification.
BEG NOTES
In connection with the acquisition of certain assets of BEG in January 2008, we issued $4.0 million of 5% promissory notes payable to certain shareholders of BEG (“BEG Notes”). The BEG Notes are payable over three years with $1.3 million maturing in January 2009, $1.3 million maturing in January 2010 and $1.4 million maturing in January 2011 and are convertible into shares of our common stock at a rate of $3.70 per share under certain circumstances. Based upon the stock valuation at the time of the issuance, no beneficial conversion feature exists. At December 31, 2008 and 2009, the BEG Notes had a balance of $4.0 million and $2.7 million, respectively.
In January 2010, each of the holders of the BEG Notes signed note modification agreements (“BEG Note Modifications”) whereby the payment terms of the BEG Notes were modified to thirty-five monthly payments of principal and interest of $0.08 million beginning January 18, 2010 and one payment for the balance on December 18, 2013. At the time of the BEG Note Modifications, we issued an aggregate of 143,112 shares of our restricted common stock to the holders of the BEG Notes. The restrictions on the shares will lapse at various times prior to the maturity of the BEG Notes and we may, at our option, pay the BEG Notes balance prior to the new maturity date without penalty. If payment of the BEG Notes is made prior to the lapse of the periodic restrictions, the remaining restricted shares will be forfeited to us and cancelled. The allocation between current and long-term debt was adjusted in the 2009 financial statements to reflect these modifications.
INDUSTRIAL LIFT NOTES
In connection with the acquisition of Industrial Lift in April 2008, we issued $4.0 million of promissory notes payable to the shareholders of Industrial Lift (the “ILT Notes”). The ILT Notes are payable over three years with $2.0 million maturing in April 2009, $1.0 million maturing in April 2010 and $0.5 million maturing in April 2011. The ILT Notes bear interest at a rate of 5% per annum payable in arrears and are convertible into shares of our common stock at a rate of $10.50 per share under certain circumstances. Based upon the stock valuation at
39
Table of Contents
the time of the issuance, no beneficial conversion feature exists. An additional note in the amount of $0.5 million, which is non-convertible and non-interest bearing, matures in April 2011. In April 2009, an agreement was reached with the former shareholder of Industrial Lift whereby $0.5 million of the scheduled principal payment due in April 2009 was paid in cash and $0.3 million of the obligation was satisfied through the issuance of 233,333 unregistered restricted shares of our common stock valued at $0.3 million. Additionally, $0.4 million was deposited into an irrevocable trust which was released prior to December 31, 2009. At December 31, 2008 and 2009, the ILT Notes had a balance of $4.0 million and $2.8 million, respectively.
In March 2010, each of the holders of the ILT Notes signed a note modification agreement (“ILT Note Modification”) whereby the payment terms of $1.0 million of the ILT Notes were modified to thirty-five monthly payments of principal and interest of $0.03 million beginning April 23, 2010 and one payment for the balance on March 23, 2013. At the time of the ILT Note Modification, we issued an aggregate of 53,665 shares of our unregistered restricted common stock to the holders of the ILT Notes. The restrictions on the shares will lapse at various times prior to the maturity of the notes and we may, at our option, pay the note balance prior to the new maturity date without penalty. If payment of the ILT Note is made prior to the lapse of the periodic restrictions, the remaining restricted shares will be forfeited to us and cancelled. The terms and maturity on the $1.0 million of ILT Notes originally maturing in April 2011 remain unchanged. The allocation between current and long-term debt was adjusted in the 2009 financial statements to reflect the modification.
INSURANCE NOTES PAYABLE
A portion of our property and casualty insurance premiums are financed through certain short-term installment loan agreements. The insurance notes are payable in monthly installments through June 2010 and accrue interest at 5.16%.
SERIES C 9% CONVERTIBLE PREFERRED STOCK
On May 17, 2005, we entered into a Securities Purchase Agreement with certain of our affiliates and executive officers to issue up to $5.0 million of Series C 9% Convertible Preferred Stock (the “Series C Preferred”) in conjunction with the completion of a term loan. Our Series C Preferred is convertible into shares of our common stock at a conversion price of $1.95 per share and includes detachable warrants to purchase up to 6,550,000 additional shares of our common stock at exercise prices ranging between $1.95 and $3.50 per share. The transactions contemplated by the Securities Purchase Agreement closed in two tranches. On May 17, 2005, we issued an aggregate of 3,500 shares of Series C Preferred and warrants to acquire 4,585,000 shares of our common stock, in exchange for $3.5 million. On August 29, 2005, the remainder of the Series C Preferred and warrants were issued generating proceeds of $1.5 million and we granted the remaining 1,965,000 warrants.
The prior term loan agreements and senior credit facility restricted the payment of cash dividends. Consequently, a portion of the 9% dividend obligation related to the Series C Preferred were satisfied through the issuance of payment-in-kind (“PIK”) dividends. The PIK dividends were paid through the issuance of additional shares of Series C Preferred. These additional shares of preferred stock did not have warrants attached to them. During the year ended December 31, 2007, 256 shares of Series C Preferred were issued as PIK dividends at par. Effective April 29, 2007, the loan and security agreement governing the Term Loan was amended to remove the restriction on cash dividend payments on the preferred equity shares, provided we have sufficient availability and are in compliance with all other covenants. Consequently, the accrued dividends since April 2007 were paid in cash. Cash dividends of $0.5 million and $0.5 million were paid during the years ended December 31, 2008 and 2009.
RELATED PARTY TRANSACTIONS
See above discussion of Series C Preferred, Preheat Notes, Holston Notes, Cypress Note, Bailey Note, BEG Notes and ILT Notes.
40
Table of Contents
CRITICAL ACCOUNTING POLICIES AND ESTIMATES
USE OF ESTIMATES
The discussion and analysis of financial condition and results of operation are based upon our consolidated financial statements, which have been prepared in accordance with U.S. generally accepted accounting principles. The preparation of these financial statements requires us to make estimates and judgments that affect the reported amounts of assets, liabilities, revenues and expenses, and related disclosure of contingent assets and liabilities. We evaluate our estimates on an on-going basis, based on historical experience and on various other assumptions that we believe to be reasonable under the circumstances. Actual results may differ from these estimates under different assumptions or conditions.
We believe the following critical accounting policies affect our more significant judgments and estimates used in the preparation of our consolidated financial statements.
ACCOUNTS RECEIVABLE
We extend credit to customers and other parties in the normal course of business. We regularly review outstanding receivables, and provide for estimated losses through an allowance for doubtful accounts. In evaluating the level of established reserves, we make judgments regarding the customer’s ability to make required payments, economic events and other factors. As the financial condition of these parties change, circumstances develop or additional information becomes available, adjustments to the allowance for doubtful accounts may be required. Due to the nature of our industry, we may periodically have concentration of credit risks. As a result, adjustments to the allowance for doubtful accounts may be significant.
INVENTORY
We have made significant investments in inventory to service our equipment. On a routine basis, we use judgments in determining the level of reserves required to state inventory at the lower of average cost or market. Technological innovations, market activity levels and the physical condition of products primarily influence our estimates. Changes in these or other factors may result in adjustments to the carrying value of inventory.
INCOME TAXES
Deferred tax assets and liabilities are recognized for differences between the book basis and tax basis of our assets and liabilities. In providing for deferred taxes, we consider current tax regulations, estimates of future taxable income and available tax planning strategies. If tax regulations change, operating results or the ability to implement tax planning strategies vary, adjustments to the carrying value of our net deferred tax assets and liabilities may be required. In making this determination, we have considered future taxable income in assessing the ultimate recoverability of the recognized net deferred tax asset.
OTHER CONTINGENCIES
We record liabilities for environmental obligations when remedial efforts are probable and the costs can be reasonably estimated. Our estimates are based on currently enacted laws and regulations. As more information becomes available or environmental laws and regulations change, such liabilities may be required to be adjusted. Additionally, in connection with acquisitions, we obtain indemnifications from the seller related to environmental matters. If the indemnifying parties do not fulfill their obligations, adjustments to recorded amounts may be required.
We maintain insurance coverage for various aspects of our business and operations. We retain a portion of losses that occur through the use of deductibles and, to a limited extent, self-funded insurance programs. We regularly review estimates of reported and unreported claims and provide for losses through insurance reserves. As claims develop and additional information becomes available, adjustments to loss reserves may be required.
41
Table of Contents
STOCK BASED COMPENSATION
ASC 718, “Compensation—Stock Compensation” (“ASC 718”) requires that compensation cost relating to share-based payment transactions be recognized in the financial statements. The cost is measured at the grant date, based on the calculated fair value of the award, and is recognized as an expense over the employee’s requisite service period (generally the vesting period of the equity award). The fair value of options that were not vested as of January 1, 2006 was estimated on the date of grant using the Black-Scholes option-pricing model and those amounts are recorded as stock-based compensation prospectively over the remaining service period.
IMPAIRMENT OF LONG-LIVED ASSETS AND ASSETS HELD FOR SALE
We review our long lived assets for impairment whenever events or changes in circumstances indicate that the carrying amount of an asset may not be recoverable in accordance with ASC 360, “Property, Plant and Equipment” (“ASC 360”). If the carrying amount of the asset, including any intangible assets associated with that asset, exceeds its estimated undiscounted net cash flow, before interest, we will recognize an impairment loss equal to the difference between its carrying amount and its estimated fair value.
Assets held for sale are recorded at the lower of their net book value or their net realizable value, which is determined based upon an estimate of their fair market value less the cost of selling the assets. An impairment is recorded to the extent that the amount that was carried on the books is in excess of the anticipated net realizable value. Assets held for sale at December 31, 2007 are comprised of eight steel marsh buggies. In 2008 we sold one of the marsh buggies and we recognized an impairment charge of $0.1 for the remaining seven. In 2008, we also recognized an impairment charge of $0.3 million related to our aircraft and reclassified it as held for sale. In 2009, we recognized an additional impairment charge of $0.2 million related to the aircraft. As of December 31, 2009, assets held for sale consisted of one helicopter valued at $0.7 million.
IMPAIRMENT OF GOODWILL AND INTANGIBLES
During 2009, we evaluated our goodwill and indefinite-lived intangible assets in accordance with the recoverability tests prescribed by GAAP as of our annual testing date, December 31st and determined that goodwill associated with one of our reporting units was impaired as of the testing date. For the year ended December 31, 2008, we performed this test at the annual testing date and impairment of goodwill was indicated for our Seismic Services and Equipment Leasing reporting units.
In performing the two-step goodwill impairment test, we compared the fair value of each of our reportable units to its carrying value. We estimated the fair value of our reportable units by considering both the income approach and market approach. Under the market approach, the fair value of the reportable unit is based on market multiples and recent transaction values of peer companies. Under the income approach, the fair value of the reportable unit is based on the present value of estimated future cash flows using the discounted cash flow method. The discounted cash flow method is dependent on a number of unobservable inputs including projections of the amounts and timing of future revenues and cash flows, assumed discount rates and other assumptions. Based upon this testing, we determined that goodwill associated with our Equipment Leasing reporting unit was impaired, which triggered step two. For step two, we calculated the implied fair value of goodwill and compared it to the carrying amount of that goodwill, by examining the fair value of the tangible and intangible property of the reportable unit. The inputs for this model were largely unobservable estimates from management based on historical performance. We retained the assistance of a third-party valuation firm to assess the market value of the property, plant and equipment of the Equipment Leasing reporting unit. The result of this analysis was a calculated goodwill impairment of $2.4 million which is recorded in the accompanying statement of operations at December 31, 2009. This impairment was deemed necessary due to an overall decline in oil and gas exploration and production activity throughout 2009.
We engaged a third-party valuation firm to gauge the reasonableness of the discounted cash flow (“DCF”) calculation by comparing the DCF results combined with other capital elements, such as preferred shares, term
42
Table of Contents
debt and enterprise value, to the market capitalization of our common stock. Under this enterprise value method, a control premium of 22% was calculated using the closing price of our common stock at December 31, 2009. Management believes that this control premium is reasonable because, among other reasons, (i) one shareholder beneficially owns approximately 30% of outstanding common stock resulting in less liquidity and lower trading volumes; (ii) our share price is further impacted by our low average trading volume (approx. 80,000 shares) given the total shares outstanding; and (iii) as a microcap company it is difficult for us to obtain analyst coverage that management feels is critical to messaging the Company and delivering such information to the investing community. Management feels that the lack of analyst coverage is partially responsible for the Company’s inability to reflect appropriate valuation based on its potential to generate profits. Management believes that these factors contributed to the high volatility in our share price as evidenced by a share price (a range of $0.55 to $2.65 per share) over the twelve month period ended December 31, 2009. As mentioned previously, the control premium calculated using the enterprise value method was 22% based on our share price at December 31, 2009. If the same method is employed using the closing share price of our stock on March 25, 2010, the control premium would be 11%. Management believes that both of these percentages seem reasonable when compared to the five year forward DCF analysis.
COMMITMENTS AND CONTINGENCIES
On December 31, 2007, we entered into a new Restricted Stock Agreement (“NRSA”) with Mr. James Eckert that replaced his previous restricted stock and stock-based award incentive agreement. At the time of entering into the NSRA, Mr. Eckert was our Chief Executive Officer. Under the NRSA, we awarded Mr. Eckert 400,000 restricted shares of our common stock on January 1, 2008. The restricted shares vested immediately, but the shares remain subject to transfer restrictions which lapse at a rate of 33,333 quarterly after the initial lapse of transfer restrictions on 100,000 shares on January 1, 2009.
In conjunction with the NRSA, we mutually terminated Mr. Eckert’s previous restricted stock and stock-based award incentive agreement and entered into an Amended and Restated Employment Agreement with Mr. Eckert, which was effective until June 30, 2008. Additionally, we entered into a Consulting Agreement with Mr. Eckert pursuant to which we retained Mr. Eckert as an independent contractor to perform consulting services for us until June 30, 2009.
On May 1, 2008, the former owners of Preheat, which we acquired in February 2006, filed a lawsuit in federal court in the United States District Court for the Western District of Louisiana in Lafayette, Louisiana, against us, our directors, our current Chief Executive Officer, our current Senior Vice President/Chief Financial Officer, one of our investment advisors, and a principal of the investment advisor. The lawsuit sought, among other things, (i) a declaratory judgment that the Preheat purchase agreement executed in December 2005 is null because of alleged inducement to enter into the purchase agreement by criminal or fraudulent conduct, securities fraud and bad faith breach of the purchase agreement and that one of the former Preheat owner’s ERISA rights be clarified, (ii) injunctive relief to halt alleged securities disclosure violations by us and to remove three board members, and (iii) damages resulting from the nullification of the Preheat purchase agreement. We, together with the other defendants, filed a motion to dismiss the lawsuit and that motion was granted in a final judgment date July 23, 2009. The right of the plaintiffs to pursue certain state law claims was preserved. We believe the claims against us are without merit and will vigorously contest any legal action. Accordingly, we have not accrued any amounts related to this litigation.
We have employment agreements with our executive officers and some former shareholders of companies we acquired. These agreements generally last two or three years and have renewal provisions at our option.
43
Table of Contents
CONTRACTUAL OBLIGATIONS
We have the following contractual debt obligations as of December 31, 2009:
| TOTAL | PAYMENTS DUE BY PERIOD | ||||||||||||||
| 2010 | 2011-2012 | 2013-2014 | THEREAFTER | ||||||||||||
| (In thousands) | |||||||||||||||
| Long-term debt |
$ | 55,777 | $ | 17,842 | $ | 24,175 | $ | 12,746 | $ | 1,014 | |||||
| Capital lease obligations |
2,293 | 908 | 1,316 | 69 | — | ||||||||||
| Insurance notes |
252 | 252 | — | — | — | ||||||||||
| Total Contractual Cash |
$ | 58,322 | $ | 19,002 | $ | 25,491 | $ | 12,815 | $ | 1,014 | |||||
| Less: interest |
5,778 | 2,399 | 2,816 | 400 | 163 | ||||||||||
| Total Principal Due |
$ | 52,544 | $ | 16,603 | $ | 22,675 | $ | 12,415 | $ | 851 | |||||
We have the following operating lease commitments as of December 31, 2009:
| PAYMENTS DUE BY PERIOD | |||||||||||||||
| TOTAL | 2010 | 2011-2012 | 2013-2014 | THEREAFTER | |||||||||||
| (In thousands) | |||||||||||||||
| Operating leases |
$ | 5,869 | $ | 3,300 | $ | 2,329 | $ | 177 | $ | 63 | |||||
We believe that cash flow generated from operations in 2010 and our Senior Credit Facility will be sufficient to fund our working capital needs, satisfy our debt service requirements and contractual commitments, and fulfill our un-financed capital expenditure needs for at least the next twelve months.
OFF BALANCE SHEET ARRANGEMENTS
As mentioned above, we have various vehicle and facilities leases which are classified as operating leases for reporting purposes. The total future commitments under these leases total $5.8 million.
ACCOUNTING PRONOUNCEMENTS
In June 2009, Financial Accounting Standards Board (“FASB”) issued its Accounting Standards Codification (“ASC”) 810-10 (ASC 810-10), “Amendments to FASB Interpretation No. 46(R), Consolidation of Variable Interest Entities,” for determining whether an entity is a variable interest entity (“VIE”) and requires an enterprise to perform an analysis to determine whether the enterprise’s variable interest or interests give it a controlling financial interest in a VIE. ASC 810-10 also requires ongoing assessments of whether an enterprise is the primary beneficiary of a VIE, requires enhanced disclosures and eliminates the scope exclusion for qualifying special-purpose entities. ASC 810-10 is effective for annual reporting periods beginning after November 15, 2009. We are currently evaluating the impact the adoption of ASC 810-10 will have on our results of operations and financial position.
In October 2009, the FASB issued Accounting Standards Update 2009-13 (ASU 2009-13), “Multiple-Deliverable Revenue Arrangements.” The new standard changes the requirements for establishing separate units of accounting in a multiple element arrangement and requires the allocation of arrangement consideration to each deliverable based on the relative selling price. The selling price for each deliverable is based on vendor-specific objective evidence (“VSOE”) if available, third-party evidence if VSOE is not available, or estimated selling price if neither VSOE or third-party evidence is available. ASU 2009-13 is effective for revenue arrangements entered into in fiscal years beginning on or after June 15, 2010. We are currently evaluating the impact the adoption of ASU 2009-13 will have on our results of operations and financial position.
44
Table of Contents
In January 2010, the FASB issued Accounting Standards Update 2010-06 (ASU 2010-06), “Improving Disclosures about Fair Value Measurements.” The update provides an amendment to ASC 820-10, “Fair Value Measurements and Disclosures,” requiring additional disclosures of significant transfers between Level 1 and Level 2 within the fair value hierarchy as well as information about purchases, sales, issuances and settlements using unobservable inputs (Level 3). ASU 2010-06 is effective for interim and annual reporting periods beginning after December 15, 2009 for new disclosures and clarifications of existing disclosures, except for disclosures about purchases, sales, issuances and settlements in the rollforward of activity in the Level 3 fair value measurements, which are effective for fiscal years beginning after December 15, 2010. We are currently evaluating the impact the adoption of ASU 2010-06 will have on our disclosures within our financial statements.
| ITEM 7A. | QUANTITATIVE AND QUALITATIVE DISCLOSURES ABOUT MARKET RISK |
INTEREST RATE RISK
We are exposed to interest rate risk due to changes in interest rates in the United States. Our policy is to manage interest rates through the use of a combination of fixed and floating rate debt. We currently do not use any derivative financial instruments to manage our exposure to interest rate risk. The table below provides information about the future maturities of principal for outstanding debt instruments at December 31, 2009 subject to interest rate risk. All instruments described are non-traded instruments and approximate fair value.
| DECEMBER 31, | ||||||||||||||||||||
| 2010 | 2011 | 2012 | 2013 | 2014+ | ||||||||||||||||
| (Dollars in thousands) | ||||||||||||||||||||
| Long-term debt |
||||||||||||||||||||
| Fixed Rate |
$ | 8,296 | $ | 3,751 | $ | 2,796 | $ | 245 | $ | 25 | ||||||||||
| Average interest rate |
5.8 | % | 6.1 | % | 6.2 | % | 5.7 | % | 9.6 | % | ||||||||||
| Variable Rate |
$ | 8,059 | $ | 8,063 | $ | 8,066 | $ | 12,070 | $ | 925 | ||||||||||
| Average interest rate |
5.5 | % | 5.5 | % | 5.5 | % | 5.5 | % | 4.8 | % | ||||||||||
| Short-term debt |
||||||||||||||||||||
| Fixed Rate |
$ | 248 | — | — | — | — | ||||||||||||||
| Average interest rate |
5.2 | % | — | — | — | — | ||||||||||||||
INTEREST RATE EXPOSURE
Our exposure to changes in interest rates primarily results from our long-term debt with both fixed and floating interest rates. The debt on our consolidated financial statements at December 31, 2009 with fixed interest rates totals $15.4 million. At December 31, 2009, 71% of our consolidated long-term debt was subject to variable interest rates. The detrimental effect of a hypothetical 100 basis point increase in interest rates would be to decrease net income before provision for income taxes by approximately $0.6 million for the year ended December 31, 2009.
FOREIGN CURRENCY RISKS
We transact 100% of our business in U.S. dollars, thus we are not subject to foreign currency exchange risks.
45
Table of Contents
| ITEM 8. | FINANCIAL STATEMENTS AND SUPPLEMENTARY DATA |
REPORT OF INDEPENDENT REGISTERED PUBLIC ACCOUNTING FIRM
Board of Directors and Stockholders of
OMNI Energy Services Corp.
We have audited the accompanying consolidated balance sheet of OMNI Energy Services Corp. and subsidiaries (a Louisiana corporation) as of December 31, 2009, and the related consolidated statements of operations, stockholders’ equity and cash flows for the year ended December 31, 2009. These financial statements are the responsibility of the Company’s management. Our responsibility is to express an opinion on these financial statements based on our audit.
We conducted our audit in accordance with the standards of the Public Company Accounting Oversight Board (United States). Those standards require that we plan and perform the audit to obtain reasonable assurance about whether the financial statements are free of material misstatement. The Company is not required to have, nor were we engaged to perform an audit of its internal control over financial reporting. Our audit included consideration of internal control over financial reporting as a basis for designing audit procedures that are appropriate in the circumstances, but not for the purpose of expressing an opinion on the effectiveness of the Company’s internal control over financial reporting. Accordingly, we express no such opinion. An audit also includes examining, on a test basis, evidence supporting the amounts and disclosures in the financial statements, assessing the accounting principles used and significant estimates made by management, as well as evaluating the overall financial statement presentation. We believe that our audit provides a reasonable basis for our opinion.
In our opinion, the consolidated financial statements referred to above present fairly, in all material respects, the financial position of OMNI Energy Services Corp. and subsidiaries as of December 31, 2009, and the results of their operations and their cash flows for the year ended December 31, 2009 in conformity with accounting principles generally accepted in the United States of America.
/s/ GRANT THORNTON LLP
Houston, Texas
March 31, 2010
46
Table of Contents
REPORT OF INDEPENDENT REGISTERED PUBLIC ACCOUNTING FIRM
The Board of Directors and Stockholders
OMNI Energy Services Corp:
We have audited the accompanying consolidated balance sheet of OMNI Energy Services Corp. as of December 31, 2008, and the related consolidated statements of operations, stockholders’ equity and cash flows for each of the years in the two-year period ended December 31, 2008. These consolidated financial statements are the responsibility of the Company’s management. Our responsibility is to express an opinion on these consolidated financial statements based on our audits.
We conducted our audits in accordance with standards of the Public Company Accounting Oversight Board (United States). Those standards require that we plan and perform the audit to obtain reasonable assurance about whether the financial statements are free of material misstatement. An audit includes examining, on a test basis, evidence supporting the amounts and disclosures in the financial statements. An audit also includes assessing the accounting principles used and significant estimates made by management as well as evaluating the overall financial statement presentation. We believe that our audits provide a reasonable basis for our opinion.
As referred to in Note 11, the financial results of the Company’s reportable segments as of and for the years ended December 31, 2008 and 2007 have been restated to align, consistent with the current year’s presentation, management’s resource allocation and performance assessment in making decisions regarding operations.
In our opinion, the consolidated financial statements referred to above present fairly, in all material respects, the financial position of Omni Energy Services Corp. as of December 31, 2008, and the results of their operations and their cash flows for each of the years in the two-year period ended December 31, 2008, in conformity with U.S. generally accepted accounting principles.
/s/ PANNELL KERR FORSTER OF TEXAS, P.C.
Houston, Texas
March 13, 2009, except for Note 11, for which the date is March 31, 2010
47
Table of Contents
OMNI ENERGY SERVICES CORP. AND SUBSIDIARIES
CONSOLIDATED BALANCE SHEETS
| DECEMBER 31, | ||||||||
| 2008 | 2009 | |||||||
| (In thousands, except share data) | ||||||||
| ASSETS | ||||||||
| CURRENT ASSETS: |
||||||||
| Cash and cash equivalents |
$ | 2,043 | $ | 1,931 | ||||
| Restricted cash |
942 | — | ||||||
| Trade receivables, net |
33,848 | 15,016 | ||||||
| Other receivables |
682 | 578 | ||||||
| Parts and supplies inventory |
7,897 | 6,811 | ||||||
| Prepaid expenses and other current assets |
5,789 | 4,638 | ||||||
| Deferred tax assets |
384 | 66 | ||||||
| Due from related party |
204 | 131 | ||||||
| Assets held for sale |
900 | 736 | ||||||
| Total current assets |
52,689 | 29,907 | ||||||
| PROPERTY, PLANT AND EQUIPMENT, net |
80,654 | 72,144 | ||||||
| OTHER ASSETS: |
||||||||
| Goodwill |
8,614 | 7,824 | ||||||
| Customer intangible assets, net |
2,726 | 3,539 | ||||||
| Licenses, permits and other intangible assets, net |
13,626 | 9,816 | ||||||
| Loan closing costs, net |
4,963 | 3,758 | ||||||
| Other assets |
250 | 286 | ||||||
| Total other assets, net |
30,179 | 25,223 | ||||||
| TOTAL ASSETS |
$ | 163,522 | $ | 127,274 | ||||
| LIABILITIES AND STOCKHOLDERS’ EQUITY | ||||||||
| CURRENT LIABILITIES: |
||||||||
| Accounts payable |
$ | 12,005 | $ | 3,911 | ||||
| Accrued expenses |
7,599 | 3,895 | ||||||
| Line of credit |
9,801 | — | ||||||
| Current maturities of long-term debt and capital leases |
17,564 | 16,355 | ||||||
| Insurance notes payable |
1,710 | 248 | ||||||
| Total current liabilities |
48,679 | 24,409 | ||||||
| LONG-TERM LIABILITIES: |
||||||||
| Long-term debt and capital leases, less current maturities |
45,710 | 35,941 | ||||||
| Other long-term liabilities |
527 | 172 | ||||||
| Deferred tax liability |
17,597 | 17,293 | ||||||
| Total long-term liabilities |
63,834 | 53,406 | ||||||
| Total liabilities |
112,513 | 77,815 | ||||||
| COMMITMENTS AND CONTINGENCIES |
||||||||
| STOCKHOLDERS’ EQUITY: |
||||||||
| Convertible preferred stock, no par value, 5,000,000 shares authorized; 29 shares of Series B issued and outstanding at December 31, 2008 and 2009 and 5,396 shares of Series C issued and outstanding at December 31, 2008 and 2009, liquidation preference of $1,000 per share |
1,074 | 1,074 | ||||||
| Common stock, $0.01 par value, 45,000,000 shares authorized; 20,647,496 and 20,980,202 issued and outstanding at December 31, 2008 and 2009, respectively |
206 | 209 | ||||||
| Preferred stock dividends declared |
3 | 3 | ||||||
| Additional paid-in capital |
99,045 | 100,887 | ||||||
| Accumulated deficit |
(49,319 | ) | (52,714 | ) | ||||
| Total stockholders’ equity |
51,009 | 49,459 | ||||||
| TOTAL LIABILITIES AND STOCKHOLDERS’ EQUITY |
$ | 163,522 | $ | 127,274 | ||||
The accompanying notes are an integral part of these consolidated financial statements.
48
Table of Contents
OMNI ENERGY SERVICES CORP. AND SUBSIDIARIES
CONSOLIDATED STATEMENTS OF OPERATIONS
| YEAR ENDED DECEMBER 31, | ||||||||||||
| 2007 | 2008 | 2009 | ||||||||||
| (In thousands, except per share data) | ||||||||||||
| Operating revenue |
||||||||||||
| Services |
$ | 140,695 | $ | 149,559 | $ | 96,433 | ||||||
| Rentals |
31,784 | 44,027 | 25,993 | |||||||||
| Total operating revenue |
172,479 | 193,586 | 122,426 | |||||||||
| Operating expenses |
||||||||||||
| Direct costs (exclusive of depreciation and amortization shown separately below) |
||||||||||||
| Services |
95,476 | 105,852 | 69,307 | |||||||||
| Rentals |
14,603 | 21,981 | 13,438 | |||||||||
| Depreciation and amortization |
10,761 | 13,313 | 13,511 | |||||||||
| General and administrative expenses (exclusive of depreciation and amortization shown separately above) (includes litigation settlement of $2,400 in 2008) |
28,117 | 31,006 | 22,211 | |||||||||
| Total operating expenses |
148,957 | 172,152 | 118,467 | |||||||||
| Impairment of goodwill and intangibles |
— | 25,047 | 2,369 | |||||||||
| Impairment of fixed assets |
— | 417 | 237 | |||||||||
| Operating income (loss) |
23,522 | (4,030 | ) | 1,353 | ||||||||
| Interest expense |
(6,936 | ) | (6,826 | ) | (3,685 | ) | ||||||
| Gain (loss) on debt extinguishment |
(1,100 | ) | 120 | (8 | ) | |||||||
| Other income, net |
187 | 249 | 22 | |||||||||
| Income (loss) before income taxes |
15,673 | (10,487 | ) | (2,318 | ) | |||||||
| Income tax expense |
(5,504 | ) | (3,153 | ) | (591 | ) | ||||||
| Net income (loss) |
10,169 | (13,640 | ) | (2,909 | ) | |||||||
| Dividends on preferred stock |
(503 | ) | (489 | ) | (486 | ) | ||||||
| Non-cash charge attributable to beneficial conversion feature of preferred stock |
(255 | ) | — | — | ||||||||
| Net income (loss) available to common stockholders |
$ | 9,411 | $ | (14,129 | ) | $ | (3,395 | ) | ||||
| Basic income (loss) per common share: |
||||||||||||
| Net income (loss) available to common stockholders |
$ | 0.52 | $ | (0.72 | ) | $ | (0.16 | ) | ||||
| Diluted income (loss) per common share: |
||||||||||||
| Net income (loss) available to common stockholders |
$ | 0.40 | $ | (0.72 | ) | $ | (0.16 | ) | ||||
| Number of weighted average shares: |
||||||||||||
| Basic |
18,077 | 19,740 | 20,795 | |||||||||
| Diluted |
25,634 | 19,740 | 20,795 | |||||||||
The accompanying notes are an integral part of these consolidated financial statements.
49
Table of Contents
OMNI ENERGY SERVICES CORP. AND SUBSIDIARIES
CONSOLIDATED STATEMENTS OF STOCKHOLDERS’ EQUITY
| PREFERRED STOCK |
COMMON STOCK |
|||||||||||||
| SHARES | AMOUNT | SHARES | AMOUNT | |||||||||||
| (In thousands, except share data) | ||||||||||||||
| BALANCE, December 31, 2006 |
5,636 | $ | 1,285 | 16,909,949 | $ | 169 | ||||||||
| Stock based compensation |
— | — | — | — | ||||||||||
| Restricted stock awards, net of forfeitures |
— | — | 12,500 | — | ||||||||||
| Stock options and warrants exercised for cash and other |
— | — | 945,378 | 9 | ||||||||||
| Preferred stock dividends declared |
— | — | — | — | ||||||||||
| Preferred stock dividends paid in kind |
256 | 256 | — | — | ||||||||||
| Common stock issued for cash, net of offering costs |
— | — | 665,429 | 7 | ||||||||||
| Beneficial conversion feature associated with preferred stock |
— | — | — | — | ||||||||||
| Preferred stock conversion |
(379 | ) | (379 | ) | 194,359 | 2 | ||||||||
| Net income |
— | — | — | — | ||||||||||
| BALANCE, December 31, 2007 |
5,513 | $ | 1,162 | 18,727,615 | $ | 187 | ||||||||
| Stock based compensation |
— | — | — | — | ||||||||||
| Restricted stock awards, net of forfeitures |
— | — | 462,500 | 5 | ||||||||||
| Stock options and warrants exercised for cash and other |
— | — | 1,057,766 | 11 | ||||||||||
| Preferred stock dividends declared |
— | — | — | — | ||||||||||
| Common stock issued in legal settlement |
— | — | 400,000 | 4 | ||||||||||
| Common stock retired |
— | — | (45,000 | ) | (1 | ) | ||||||||
| Preferred stock conversion |
(88 | ) | (88 | ) | 44,615 | — | ||||||||
| Net loss |
— | — | — | — | ||||||||||
| BALANCE, December 31, 2008 |
5,425 | $ | 1,074 | 20,647,496 | $ | 206 | ||||||||
| Stock based compensation |
— | — | — | — | ||||||||||
| Restricted stock awards, net of forfeitures |
— | — | 16,500 | — | ||||||||||
| Preferred stock dividends declared |
— | — | — | — | ||||||||||
| Common stock issued in legal settlement |
— | — | 82,873 | 1 | ||||||||||
| Common stock issued in debt extinguishment |
— | — | 233,333 | 2 | ||||||||||
| Net loss |
— | — | — | — | ||||||||||
| BALANCE, December 31, 2009 |
5,425 | $ | 1,074 | 20,980,202 | $ | 209 | ||||||||
50
Table of Contents
OMNI ENERGY SERVICES CORP. AND SUBSIDIARIES
CONSOLIDATED STATEMENTS OF STOCKHOLDERS’ EQUITY—(Continued)
| PREFERRED STOCK DIVIDEND DECLARED |
ADDITIONAL PAID-IN CAPITAL |
ACCUMULATED DEFICIT |
TOTAL | |||||||||||||
| (In thousands, except share data) | ||||||||||||||||
| BALANCE, December 31, 2006 |
$ | 132 | $ | 82,441 | $ | (44,601 | ) | $ | 39,426 | |||||||
| Stock based compensation |
— | 2,487 | — | 2,487 | ||||||||||||
| Restricted stock, net of forfeitures |
— | — | — | — | ||||||||||||
| Stock options and warrants exercised for cash and other |
— | 2,216 | — | 2,225 | ||||||||||||
| Preferred stock dividends declared |
127 | — | (503 | ) | (376 | ) | ||||||||||
| Preferred stock dividends paid in kind |
(256 | ) | — | — | — | |||||||||||
| Common stock issued for cash, net of offering costs |
— | 6,221 | — | 6,228 | ||||||||||||
| Beneficial conversion feature associated with preferred stock |
— | 255 | (255 | ) | — | |||||||||||
| Preferred stock conversion |
— | 377 | — | — | ||||||||||||
| Net income |
— | — | 10,169 | 10,169 | ||||||||||||
| BALANCE, December 31, 2007 |
$ | 3 | $ | 93,997 | $ | (35,190 | ) | $ | 60,159 | |||||||
| Stock based compensation |
— | 1,233 | — | 1,233 | ||||||||||||
| Restricted stock, net of forfeitures |
— | 1,218 | — | 1,223 | ||||||||||||
| Stock options and warrants exercised for cash and other |
— | 2,512 | — | 2,523 | ||||||||||||
| Preferred stock dividends declared |
— | — | (489 | ) | (489 | ) | ||||||||||
| Common stock issued in legal settlement |
— | (4 | ) | — | — | |||||||||||
| Common stock retired |
— | 1 | — | — | ||||||||||||
| Preferred stock conversion |
— | 88 | — | — | ||||||||||||
| Net loss |
— | — | (13,640 | ) | (13,640 | ) | ||||||||||
| BALANCE, December 31, 2008 |
$ | 3 | $ | 99,045 | $ | (49,319 | ) | $ | 51,009 | |||||||
| Stock based compensation |
— | 1,383 | — | 1,383 | ||||||||||||
| Restricted stock, net of forfeitures |
— | — | — | — | ||||||||||||
| Preferred stock dividends declared |
— | — | (486 | ) | (486 | ) | ||||||||||
| Common stock issued in legal settlement |
— | 111 | — | 112 | ||||||||||||
| Common stock issued in debt extinguishment |
— | 348 | — | 350 | ||||||||||||
| Net loss |
— | — | (2,909 | ) | (2,909 | ) | ||||||||||
| BALANCE, December 31, 2009 |
$ | 3 | $ | 100,887 | $ | (52,714 | ) | $ | 49,459 | |||||||
The accompanying notes are an integral part of these consolidated financial statements.
51
Table of Contents
OMNI ENERGY SERVICES CORP. AND SUBSIDIARIES
CONSOLIDATED STATEMENTS OF CASH FLOWS
| YEAR ENDED DECEMBER 31, |
||||||||||||
| 2007 | 2008 | 2009 | ||||||||||
| (In thousands) | ||||||||||||
| CASH FLOWS FROM OPERATING ACTIVITIES: |
||||||||||||
| Net income (loss) |
$ | 10,169 | $ | (13,640 | ) | $ | (2,909 | ) | ||||
| Adjustments to reconcile net income (loss) to net cash provided by operating activities— |
||||||||||||
| Depreciation and amortization |
10,761 | 13,313 | 13,511 | |||||||||
| (Gain) loss on property, plant and equipment disposals |
(173 | ) | 358 | 97 | ||||||||
| Stock based compensation expense |
2,487 | 1,233 | 1,383 | |||||||||
| Accretion of discount on convertible notes and other |
511 | 141 | 45 | |||||||||
| Amortization of loan closing costs |
1,013 | 1,148 | 1,415 | |||||||||
| Stock issued in legal settlement |
— | — | 112 | |||||||||
| Impairment of goodwill and intangibles |
— | 25,047 | 2,369 | |||||||||
| Impairment of fixed assets |
— | 417 | 237 | |||||||||
| (Gain) loss extinguishment of debt |
1,100 | (120 | ) | 8 | ||||||||
| Provision for doubtful accounts |
60 | 375 | 1,346 | |||||||||
| Deferred taxes |
4,328 | 2,865 | 15 | |||||||||
| Changes in operating assets and liabilities: |
||||||||||||
| Trade receivables |
(4,711 | ) | (4,586 | ) | 17,487 | |||||||
| Other receivables |
(729 | ) | 39 | 177 | ||||||||
| Parts and supplies inventory |
(1,583 | ) | (111 | ) | 1,086 | |||||||
| Prepaid expenses and other current assets |
4,615 | 5,090 | 1,600 | |||||||||
| Other assets |
(334 | ) | 55 | (99 | ) | |||||||
| Accounts payable and accrued expenses |
7,067 | (2,968 | ) | (12,281 | ) | |||||||
| Net cash provided by operating activities |
34,581 | 28,656 | 25,599 | |||||||||
| CASH FLOWS FROM INVESTING ACTIVITIES: |
||||||||||||
| Acquisitions, net of cash received |
(23,673 | ) | (20,836 | ) | — | |||||||
| Investment in restricted cash |
— | (1,142 | ) | (350 | ) | |||||||
| Return of restricted cash |
— | 689 | 1,292 | |||||||||
| Proceeds from collection of other receivables |
420 | — | — | |||||||||
| Proceeds from disposal of property, plant and equipment |
1,578 | 1,009 | 551 | |||||||||
| Purchase of property, plant and equipment |
(13,848 | ) | (12,249 | ) | (2,050 | ) | ||||||
| Net cash used in investing activities |
(35,523 | ) | (32,529 | ) | (557 | ) | ||||||
| CASH FLOWS FROM FINANCING ACTIVITIES: |
||||||||||||
| Proceeds from issuance of long-term debt |
14,934 | 19,232 | — | |||||||||
| Principal payments on long-term debt |
(26,240 | ) | (19,604 | ) | (14,656 | ) | ||||||
| Payments on line of credit |
(276,969 | ) | (242,705 | ) | (94,343 | ) | ||||||
| Borrowings on line of credit |
284,039 | 235,157 | 84,542 | |||||||||
| Preferred stock dividends paid in cash |
(129 | ) | (491 | ) | (486 | ) | ||||||
| Loan closing costs |
(2,420 | ) | (1,752 | ) | (211 | ) | ||||||
| Proceeds from stock options and warrants exercised |
2,225 | 2,648 | — | |||||||||
| Proceeds from issuance of common stock |
6,357 | — | — | |||||||||
| Net cash provided by (used in) financing activities |
1,797 | (7,515 | ) | (25,154 | ) | |||||||
| NET INCREASE (DECREASE) IN CASH AND CASH EQUIVALENTS |
855 | (11,388 | ) | (112 | ) | |||||||
| CASH, at beginning of year |
12,576 | 13,431 | 2,043 | |||||||||
| CASH, at end of year |
$ | 13,431 | $ | 2,043 | $ | 1,931 | ||||||
52
Table of Contents
OMNI ENERGY SERVICES CORP. AND SUBSIDIARIES
CONSOLIDATED STATEMENTS OF CASH FLOWS—(Continued)
| YEAR ENDED DECEMBER 31, | |||||||||
| 2007 | 2008 | 2009 | |||||||
| (In thousands) | |||||||||
| Supplemental cash flow disclosures: |
|||||||||
| Cash paid for interest |
$ | 5,329 | $ | 5,505 | $ | 2,379 | |||
| Cash paid for income taxes |
$ | 236 | $ | 789 | $ | 1,403 | |||
| Supplemental non-cash disclosures: |
|||||||||
| Equipment acquired under capital lease |
$ | 58 | $ | — | $ | 2,116 | |||
| Premium financed with insurance carrier |
$ | 6,663 | $ | 3,109 | $ | 450 | |||
| Application of restricted cash to capital lease payable and other |
$ | — | $ | 625 | $ | — | |||
| Equipment note paid off in sale/leaseback |
$ | 201 | $ | 132 | $ | — | |||
| Equipment transferred in satisfaction of settlement of accrued liability |
$ | — | $ | 750 | $ | — | |||
| Beneficial conversion feature associated with issuance of preferred stock |
$ | 255 | $ | — | $ | — | |||
| Shareholder notes issued in acquisitions |
$ | 8,500 | $ | 8,000 | $ | — | |||
| Conversion of preferred stock to common |
$ | 377 | $ | 88 | $ | — | |||
| Stock issued in satisfaction of note payable |
$ | — | $ | — | $ | 350 | |||
| Preferred stock issued as dividends paid-in-kind |
$ | 256 | $ | — | $ | — | |||
The accompanying notes are an integral part of these consolidated financial statements.
53
Table of Contents
OMNI ENERGY SERVICES CORP. AND SUBSIDIARIES
NOTES TO CONSOLIDATED FINANCIAL STATEMENTS
| 1. | SUMMARY OF SIGNIFICANT ACCOUNTING POLICIES |
NATURE OF BUSINESS
We are a leading, integrated oilfield service company specializing in providing a range of (i) onshore seismic drilling, operational support, permitting, and survey, (ii) dock-side and offshore hazardous and non-hazardous oilfield waste management and environmental cleaning services, including tank and vessel cleaning and safe vessel entry, drilling fluid transportation and disposal services, and other specialized services such as metal stress relieving and wellhead installation and preheating, and (iii) oilfield equipment rental, for oil and gas companies operating in the Gulf of Mexico and various exploration and production areas in the United States of America.
During 2009, we revised our reportable business segments in order to align them with changes in management’s resource allocation and the performance assessment in making decisions regarding our operations. At December 31, 2009, we operated in three business segments—Seismic Services, Environmental and Other Services, and Equipment Leasing.
The principal market of our Seismic Services segment is the marsh, swamps, shallow water and contiguous dry areas along the Gulf of Mexico (the “Transition Zone”), primarily in Louisiana and Texas, where we believe we are the leading provider of seismic drilling support services. In 2009, we expanded our Seismic Service market to include the prolific shale plays in the United States.
Our Environmental and Other Services segment provides dock-side and offshore tank, vessel, boat and barge cleaning services principally to major and independent oil and gas companies operating in the Gulf of Mexico and the disposal of oilfield waste at our company-operated disposal facilities, the sale and transportation of drilling, completion and production fluids, and various services such as metal stress relieving and wellhead installation services to offshore and land-based oil production rigs and drilling contractors operating primarily in Louisiana and the Gulf of Mexico.
Our Equipment Leasing segment provides various pieces of oilfield equipment to offshore and land-based oil production rigs and drilling contractors operating primarily in Louisiana, Texas, Utah and Wyoming.
We receive our revenues principally from customers in the energy industry. This volatile market has impacted our ability, as well as that of our customers and others in the industry, to change their forecasts and budgets in response to future uncertainties of commodity pricing. These fluctuations can rapidly impact our cash flows as supply and demand factors impact the number and size of seismic projects available. The demand for our services increased significantly in 2007 and much of 2008. However, the demand for these services diminished in the fourth quarter of 2008 and through much of 2009 with the fall of global and domestic oil and natural gas prices and the reduction in the domestic oil and gas rig counts in the markets that we serve.
We adjust our operations to current market conditions by downsizing, when necessary, our operations through closure of certain operating locations, disposing of excess equipment and reducing our corporate overhead structure.
In February 2006, we acquired Preheat, Inc. (“Preheat”), a premier provider of rental equipment and specialized environmental services principally to drilling contractors operating in the Gulf of Mexico.
In November 2006, we acquired Rig Tools, Inc. (“Rig Tools”), a leading rental equipment supplier to land-based drilling contractors operating primarily in Louisiana and Texas.
54
Table of Contents
In February 2007, we acquired certain seismic drilling assets of Cypress Consulting Services, Inc. (“Cypress”), a provider of seismic services and employee leasing. Cypress serves many of the same customers as our core Seismic Services operations (See Note 12).
In March 2007, we acquired Charles Holston, Inc. pursuant to a Membership Interest Purchase and Sale Agreement to acquire BMJ Industrial Investment, L.L.C., and its wholly-owned subsidiary Charles Holston, Inc. (collectively “Holston”). Holston provides a full range of environmental and other services including transportation of non-hazardous oilfield byproducts, cleaning and waste disposal, dockside and offshore cleaning; and offshore sandblasting and painting operating primarily, in Louisiana and Texas (See Note 12).
Effective June 7, 2007, we acquired certain assets of Bailey Operating, Inc. (“BOI”). The assets acquired include a salt water disposal well, related permits and well-site equipment located on approximately five acres of land in Bowie, Texas (See Note 12).
In January 2008, we acquired the assets of B.E.G. Liquid Mud Services Corp. (“BEG”) pursuant to an Asset Purchase Agreement. BEG supplies and provides transportation of drilling fluids in the Texas markets from locations in Giddings, Bryan and Woodville, Texas (See Note 12).
In April 2008, we acquired Industrial Lift Truck and Equipment Co., Inc. (“Industrial Lift”) pursuant to a Stock Purchase and Sale Agreement. Industrial Lift has an extensive rental fleet of forklifts and manlifts. It operates from locations in Broussard, Louisiana and Lincoln, Texas (See Note 12).
PRINCIPLES OF CONSOLIDATION AND BASIS OF PRESENTATION
The consolidated financial statements include the accounts of OMNI Energy Services Corp., a Louisiana corporation, and all subsidiaries. All material intercompany accounts and transactions have been eliminated upon consolidation.
USE OF ESTIMATES
The preparation of financial statements in conformity with U.S. generally accepted accounting principles requires management to make estimates and assumptions that affect the reported amounts of assets and liabilities and the disclosures of contingent assets and liabilities at the date of the financial statements and the reported amounts of revenue and expenses during the reporting period. The more significant estimates include asset impairments, useful lives for depreciation and amortization, salvage values of depreciable equipment, valuation of warrants and options, allowance for doubtful accounts receivables and the utilization of deferred tax assets. Actual results could differ from those estimates.
REVENUE RECOGNITION
We derive revenue from two types of activities—services and equipment rentals. Service activities include drilling, seismic surveys, permitting, environmental clean-up, fluid transportation, wellhead installation, metal stress relieving and other services. Rentals activities relate to our equipment leasing operations. Revenue from our drilling operations is recognized on a per hole basis. Once we have drilled and loaded a source point, revenue from the drilling of such source point is recognized. Similarly, revenue is recognized from our seismic survey operations either on a day rate or per mile basis. Under the per mile basis, revenue is recognized when the source or receiving point is marked by one of our survey crews. Permitting revenue is recognized on a per day basis as services are rendered. Environmental revenue is recognized upon completion of each cleaning project. Revenues for wellhead installations, metal stress relieving and other services are recognized upon completion of each project, all of which have relatively short durations lasting from one to five days. Transportation revenues are billed by the hour, load or barrel. Equipment leasing revenue is recognized on a daily basis.
55
Table of Contents
CASH AND CASH EQUIVALENTS
We consider highly liquid investments with an original maturity of 90 days or less to be cash equivalents. The $0.9 million included in restricted cash at December 31, 2008 represents cash deposited into an irrevocable trust as part of a legal settlement which was paid to the trust beneficiary in January 2009.
ACCOUNTS RECEIVABLE AND ALLOWANCE FOR DOUBTFUL ACCOUNTS
Trade and other receivables are stated at net realizable value. We grant short-term credit to our customers, primarily geophysical and oil and gas operating companies. We regularly review outstanding trade receivables and provide for estimated losses through our allowance for doubtful accounts when it is determined that an amount is not collectible. Accounts are charged off against the allowance after all appropriate means of collection have been exhausted and the potential for recovery is considered remote.
INVENTORIES
Inventories consist of parts and supplies used for our drilling and rental equipment operations. All inventories are valued at lower of average cost or market. Parts and supplies are charged to expense when it is determined that such items have no value or when their service hours have expired.
SEGMENTS
During the fourth quarter of 2009, we revised our reportable business segments in order to align them with changes in management’s resource allocation and the performance assessment in making decisions regarding our operations. At December 31, 2009, we operated in three business segments—Seismic Services, Environmental and Other Services, and Equipment Leasing.
PROPERTY, PLANT AND EQUIPMENT
Property, plant and equipment are stated at cost less accumulated depreciation. We provide for depreciation expense on a straight line basis over each asset’s estimated useful life depreciated to their estimated salvage values as follows:
| ASSET CLASSIFICATION |
USEFUL LIFE | SALVAGE VALUE | |||
| Buildings and improvements |
15-25 years | — | |||
| Drilling, field and support equipment |
5-10 years | 10 | % | ||
| Shop equipment |
10 years | — | |||
| Saltwater disposal wells |
20 years | — | |||
| Office equipment |
5 years | — | |||
| Vehicles |
4-5 years | — | |||
| Environmental |
5 years | — | |||
| Rental Equipment |
3-10 years | — |
Additions to property and equipment and major replacements are capitalized. Gains and losses on dispositions, maintenance, repairs and minor replacements are charged to expense as incurred. Capitalized equipment, some of which is modified to fit our business needs, is comprised of direct and indirect costs incurred during the modification process. Costs include materials and labor consumed during fabrication.
Assets held for sale are recorded at the lower of their net book value or their net realizable value which is determined based upon an estimate of their fair market value less the cost of selling the assets. An impairment is recorded to the extent that the amount that was carried on the books is in excess of the net realizable value. Assets held for sale at December 31, 2008 and 2009 consisted of one helicopter which was deemed expendable as our travel needs changed.
56
Table of Contents
IMPAIRMENT OF LONG-LIVED ASSETS AND ASSETS HELD FOR SALE
We review our long lived assets for impairment whenever events or changes in circumstances indicate that the carrying amount of an asset may not be recoverable in accordance with Accounting Standards Codification (“ASC”) 360, “Property, Plant and Equipment” (“ASC 360”). If the carrying amount of the asset, including any intangible assets associated with that asset, exceeds its estimated undiscounted net cash flow, before interest, we will recognize an impairment loss equal to the difference between its carrying amount and its estimated fair value. In 2008, we recorded an impairment charge $0.1 million for seven marsh buggies and $0.3 million for a helicopter. In 2009, we recorded an additional impairment charge of $0.2 million related to the helicopter. In 2008 and 2009, the helicopter is classified as held for sale and is reflected in the financial statements at $0.9 million and $0.7 million, respectively. There were no impairment charges for 2007.
Long-lived assets:
In 2009, we evaluated the fair market value of our equipment used in our different reporting units with the assistance of a third-party appraiser and determined that no impairment was required except as described above as it relates to assets held for sale. We engaged a third party valuation firm to perform various cash flow analyses at the operating entity level which further indicated an impairment was not required on our long-lived assets. We continue to evaluate the remaining useful lives of our equipment and have considered our depreciation methodology and these estimates of useful lives in our projected future cash flows associated with these assets.
ASSET RETIREMENT OBLIGATIONS
Asset retirement obligation are recorded at fair value as a liability in the period in which a legal obligation is incurred associated with the retirement of tangible long-lived assets that result from the acquisition, construction, development, and/or normal use of the assets in accordance with United States Generally Accepted Accounting Principles (“GAAP”). Furthermore, a corresponding asset would be recorded and depreciated over the contractual term of the underlying asset. Subsequent to the initial measurement of the asset retirement obligation, the obligation would be adjusted at the end of each period to reflect the passage of time and changes in the estimated future cash flows underlying the obligation. There were no retirement obligations recorded at December 31, 2009 and 2008.
GOODWILL AND OTHER INTANGIBLE ASSETS
Goodwill represents the excess of the purchase price of acquisitions over the fair value of the net assets acquired. We account for goodwill in accordance with ASC 350, “Intangibles—Goodwill and Other.” (“ASC 350”). Under ASC 350, goodwill and intangible assets with indefinite lives are no longer amortized but are reviewed annually (or more frequently if impairment indicators arise) for impairment. Separable intangible assets that are not deemed to have indefinite lives will continue to be amortized over their useful lives. The amortization provisions of ASC 350 apply to goodwill and intangible assets acquired after June 30, 2001. As of December 31, 2008 and 2009, we have goodwill of $8.6 million and $7.8 million, respectively.
We perform annual impairment tests associated with our goodwill on December 31 of each year, or more frequently if circumstances warrant. In performing this test, we first compared the fair value of each of our reportable units to its carrying value. We estimated the fair value of our reportable units by considering both the income approach and market approach. Under the market approach, the fair value of the reportable unit is based on market multiples and recent transaction values of peer companies. Under the income approach, the fair value of the reportable unit is based on the present value of estimated future cash flows using the discounted cash flow method. The discounted cash flow method is dependent on a number of unobservable inputs including projections of the amounts and timing of future revenues and cash flows, assumed discount rates and other assumptions. Based upon this testing, we determined that goodwill associated with our Equipment Leasing reporting unit was impaired, which triggered step two of the impairment test. For step two, we calculated the implied fair value of goodwill and compared it to the carrying amount of that goodwill, by examining the fair value of the tangible and intangible property of these reportable units. The inputs for this model were largely
57
Table of Contents
unobservable estimates from management based on historical performance. We retained the assistance of a third-party valuation firm to assess the market value of the property, plant and equipment of the Equipment Leasing reporting unit. The result of this analysis was a calculated goodwill impairment of $2.4 million which is recorded in the accompanying statement of operations at December 31, 2009. This impairment was deemed necessary due to an overall decline in oil and gas exploration and production activity throughout 2009.
For purposes of the impairment analysis, our segments are considered to be the reporting unit, which represents the lowest level for which there are identifiable cash flows.
Upon completion of the 2008 assessment, we determined that the fair value associated with our Seismic Services and Equipment Leasing segments was less than the carrying value of these reporting units, indicating potential impairment. We determined, because of existing market conditions, that future cash flows may not be sufficient to recover the value of certain identified intangibles and portions of goodwill related to certain acquisitions and that they were impaired and therefore we recorded an impairment charge of $25.0 million during 2008.
INCOME TAXES
We provide for deferred taxes in accordance with ASC 740, “Income Taxes” (“ASC 740”), which requires an asset and liability approach for measuring deferred taxes and liabilities due to temporary differences existing at year-end using currently enacted rates (See Note 10).
In July 2006, ASC 740 clarified the accounting for uncertainty in tax positions taken or expected to be taken in a tax return, including issues relating to financial statement recognition and measurement. ASC 740 provides that the tax effects from an uncertain tax position can be recognized in the financial statements only if the position is “more-likely-than-not” of being sustained if the position were to be challenged by a taxing authority. The assessment of the tax position is based solely on the technical merits of the position, without regard to the likelihood that the tax position may be challenged. If an uncertain tax position meets the “more-likely-than-not” threshold, the largest amount of tax benefit that is greater than 50 percent likely of being recognized upon ultimate settlement with the taxing authority, is recorded. These provisions became effective for fiscal years beginning after December 15, 2006, with the cumulative effect of the change in accounting principle recorded as an adjustment to opening retained earnings. Our consolidated financial statements have not been materially impacted by the adoption of this portion of ASC 740.
In May 2007, ASC 740 provided guidance on how an enterprise should determine whether a tax position is effectively settled for the purpose of recognizing previously unrecognized tax benefits. Our adoption of this portion of ASC 740 was consistent with prior guidance.
FINANCIAL INSTRUMENTS
The financial instruments recognized in the balance sheet consist of cash and cash equivalents, trade accounts receivable, revolving credit facilities, accounts payable and accrued liabilities, certain of our long-term debt and senior notes. The fair value of our financial instruments approximate their carrying amounts due to their current maturities, market rates of interest, or because fixed interest rates approximate prevailing market rates at December 31, 2008 and 2009. The fair value of our long-term debt is based upon the quoted market prices and face value for the various debt securities at December 31, 2009. The carrying value of these notes as of December 31, 2009 was $52.3 million and the fair value was $52.1 million (99.6% of carrying value).
FAIR VALUE MEASUREMENT
We evaluate fair value measurements in accordance with GAAP, which requires us to base our estimates on assumptions market participants would use to price an asset or liability, and to establish a hierarchy that prioritizes the information used to determine fair value. The fair value hierarchy consists of three broad levels,
58
Table of Contents
which gives the highest priority to unadjusted quoted prices in active markets for identical assets and liabilities (Level 1) and lowest priority to unobservable inputs (Level 3). The three levels of the fair value hierarchy are described below:
Level 1—Unadjusted quoted prices in active markets that are accessible at the measurement date for identical, unrestricted assets or liabilities.
Level 2—Inputs other than quoted prices included within Level 1 that are observable for the asset or liability, either directly or indirectly, including quoted prices for similar assets or liabilities in active markets; quoted prices for identical or similar assets or liabilities in markets that are not active; inputs other than quoted prices that are observable for the asset or liability (e.g. interest rates); and inputs that are derived principally from or corroborated by observable market data by correlation or other means.
Level 3—Inputs that are both significant to the fair value and unobservable.
We generally apply fair value valuation techniques on a non-recurring basis associated with: (1) valuing assets and liabilities acquired in connection with business combinations and other transactions; (2) valuing potential impairment loss related to long-lived assets; and (3) valuing potential impairment loss related to goodwill and indefinite-lived intangible assets. We generally do not hold trading securities, and we were not party to derivative contract arrangements during the years ended December 31, 2008 and 2009.
The following table presents the fair values for those assets and liabilities measured at fair value during 2009 on a non-recurring basis. Total losses include losses recognized from all non-recurring fair value measurements during the year ended December 31, 2009.
| December 31, 2009 |
Fair Value Measurements | Total Losses | |||||||||||||
| Level 1 | Level 2 | Level 3 | |||||||||||||
| Assets held for sale |
$ | 736 | $ | — | $ | — | $ | 736 | $ | 237 | |||||
| Goodwill and other intangibles |
$ | 21,179 | $ | — | $ | — | $ | 21,179 | $ | 2,369 | |||||
STOCK BASED COMPENSATION
We account for stock option and restricted stock awards in 2007, 2008 and 2009 using a fair-value based method resulting in compensation expense for stock-based awards being recorded in our consolidated statements of income. Stock options issued are valued on the grant date using Black-Scholes option pricing model and restricted stock issued is valued based on the fair value of our common stock at the grant date and is expensed over the employee’s requisite service period (generally the vesting period of the equity award). In addition, judgment is required in estimating the amount of stock-based awards that are expected to be forfeited. Because the determination of these various assumptions is subject to significant management judgment and different assumptions could result in material differences in amounts recorded in our consolidated financial statements, management believes that accounting estimates related to the valuation of stock options are critical.
EARNINGS PER SHARE
We account for our earnings per share (“EPS”) in accordance with ASC 260, “Earnings Per Share” (“ASC 260”), which establishes the requirements for presenting EPS. ASC 260 requires the presentation of “basic” and “diluted” EPS on the face of the income statement. Basic EPS begins with income (loss) applicable to common stockholders (net income (loss) less preferred stock dividends) and is based on the weighted average number of common shares outstanding during each period presented. Diluted EPS assumes the exercise of all stock options and warrants having exercise prices less than the average market price of the common stock using the treasury stock method. In computing basic loss per share we consider dividends and accretion on the Series B
59
Table of Contents
Preferred Stock and Series C 9% Convertible Preferred Stock (the “Series C Preferred”) as a reduction of net income from operations in computing basic net income (loss) per share. For the purpose of diluted earnings per common share, and only if such calculation results in dilution, preferred stock dividends will not reduce earnings; however, the weighted average common shares outstanding would increase representing the amount of common shares into which such preferred stock is currently convertible. Convertible preferred stock, convertible debt instruments, warrants, restricted stock, and options to purchase common stock are included as common stock equivalents only when dilutive.
ACCOUNTING PRONOUNCEMENTS
In December 2007, the Financial Accounting Standards Board (“FASB”) issued ASC 810, “Consolidations” (“ASC 810”). ASC 810 establishes principles and requirements for how an acquirer in a business combination recognizes and measures in its financial statements the identifiable assets acquired, liabilities assumed, and any noncontrolling interests in the acquiree, as well as the goodwill acquired. Significant changes from previous practice resulting from ASC 810 include the expansion of the definitions of a “business” and a “business combination.” For all business combinations (whether partial, full or step acquisitions), the acquirer will record 100% of all assets and liabilities of the acquired business, including goodwill, generally at their fair values; contingent consideration will be recognized at its fair value on the acquisition date and, for certain arrangements, changes in fair value will be recognized in earnings until settlement; and acquisition-related transaction and restructuring costs will be expensed rather than treated as part of the cost of the acquisition. ASC 810 also establishes disclosure requirements to enable users to evaluate the nature and financial effects of the business combination. ASC 810 applies prospectively to business combinations for which the acquisition date is on or after the beginning of the first annual reporting period beginning on or after December 15, 2008. We adopted the provisions of ASC 810 on January 1, 2009, but did not consummate any business combinations during 2009. ASC 810 may have an impact on our consolidated financial statements in the future. The nature and magnitude of the specific impact will depend upon the nature, terms, and size of any acquisitions consummated after the effective date.
In May 2009, the FASB issued ASC 855, “Subsequent Events,” (“ASC 855”). ASC 855 establishes general standards of accounting for and disclosure of events that occur after the balance sheet date but before financial statements are issued or are available to be issued. It requires disclosure of the date through which an entity has evaluated subsequent events. We adopted ASC 855 in the second quarter of 2009 and the adoption of ASC 855 did not materially impact our consolidated financial statements.
In June 2009, the FASB issued Accounting Standards Update (“ASU”) No. 2009-01 (ASC Topic 105), “Generally Accepted Accounting Principles,” which establishes the FASB Accounting Standards Codification (the “Codification” or “ASC”) as the official single source of authoritative GAAP. All existing accounting standards are superseded. All other accounting guidance not included in the Codification is considered non-authoritative. The Codification also includes all relevant Securities and Exchange Commission guidance organized using the same topical structure in separate sections within the Codification. Following the Codification, the Board will not issue new standards in the form of Statements, FASB Staff Positions or Emerging Issues Task Force Abstracts. Instead, it will issue Accounting Standards Updates which will serve to update the Codification, provide background information about the guidance and provide the basis for conclusions on the changes to the Codification. The Codification is not intended to change GAAP, but it changes the way GAAP is organized and presented. The Codification is effective for financial statements issued for interim and annual periods ending after September 15, 2009 and the principal impact on our financial statements is limited to disclosures as all current and future references to authoritative accounting literature will be referenced in accordance with the Codification.
60
Table of Contents
RECLASSIFICATIONS
We have reclassified our reporting of gains and losses from the disposal of fixed assets from other income and expense to income from operations for all periods presented. The reclassifications that have been made in prior period financial statements to conform to current period presentation have not resulted in any changes to previously reported net income for any periods.
| 2. | VALUATION ALLOWANCE ACCOUNTS |
The allowance for uncollectible accounts consists of the following:
| DESCRIPTION |
BALANCE AT BEGINNING OF PERIOD |
ADDITIONS CHARGED TO EXPENSE |
WRITE-OFF OF UNCOLLECTIBLE AMOUNTS |
BALANCE AT END OF PERIOD | ||||||||
| December 31, 2009 Allowance for uncollectible accounts |
$ | 253 | $ | 1,346 | $ | 1,424 | $ | 175 | ||||
| December 31, 2008 Allowance for uncollectible accounts |
$ | 130 | $ | 375 | $ | 252 | $ | 253 | ||||
| December 31, 2007 Allowance for uncollectible accounts |
$ | 128 | $ | 60 | $ | 58 | $ | 130 | ||||
| 3. | PROPERTY, PLANT AND EQUIPMENT |
Property, plant and equipment consists of the following at December 31:
| DECEMBER 31, | ||||||||
| 2008 | 2009 | |||||||
| (In thousands) | ||||||||
| Land |
$ | 493 | $ | 493 | ||||
| Building and improvements |
9,103 | 8,874 | ||||||
| Drilling, field and support equipment |
105,894 | 108,393 | ||||||
| Shop equipment |
721 | 742 | ||||||
| Office equipment |
2,387 | 2,389 | ||||||
| Vehicles |
4,991 | 4,404 | ||||||
| Construction in progress |
751 | 1,202 | ||||||
| 124,340 | 126,497 | |||||||
| Less: accumulated depreciation |
(43,686 | ) | (54,353 | ) | ||||
| Total property, plant and equipment, net |
$ | 80,654 | $ | 72,144 | ||||
During 2008, some of our facilities and equipment were damaged as a result of Hurricanes Ike and Gustav. As a result of the storms, we incurred damages of approximately $0.5 million. Excluding nominal deductibles, the damage was covered by insurance. A receivable related to insurance proceeds in the amount of $0.1 million is included in receivables in the consolidated financial statements at December 31, 2008 and was received during 2009.
61
Table of Contents
| 4. | LONG-TERM DEBT AND LINE OF CREDIT |
LONG-TERM DEBT
At December 31, 2008 and December 31, 2009, long-term debt consists of the following:
| DECEMBER 31, | ||||||||
| 2008 | 2009 | |||||||
| (In thousands) | ||||||||
| Notes payable to a bank with interest payable at prime plus 1.50% (6.5% at December 31, 2008 and 4.75 % at December 31, 2009) maturing July 31, 2023, secured by real estate |
$ | 1,243 | $ | 1,183 | ||||
| Promissory notes payable to certain former owners of acquired companies with interest at 5%, maturing at various dates through April 2013 |
6,000 | 5,350 | ||||||
| Convertible promissory notes payable to certain former stockholders of acquired companies with interest at 5%, maturing at various dates through April 2013 |
11,500 | 7,467 | ||||||
| Promissory notes payable to finance companies secured by vehicles and equipment |
492 | 329 | ||||||
| Capital leases payable to finance companies secured by equipment |
39 | 1,967 | ||||||
| Term Loan payable to a bank, variable interest rate at 30-day LIBOR plus 2.75% at December 31, 2008 and 30-day LIBOR with 1% floor plus 4.5% at December 31, 2009 (3.71% at December 31, 2008 and 5.50% at December 31, 2009), secured by various equipment, maturing April 23, 2013 |
44,000 | 36,000 | ||||||
| Total |
$ | 63,274 | $ | 52,296 | ||||
| Less: current maturities |
(17,564 | ) | (16,355 | ) | ||||
| Long-term debt, less current maturities |
$ | 45,710 | $ | 35,941 | ||||
Annual maturities of long-term debt during each of the years ended December 31, are as follows:
| YEAR ENDED DECEMBER 31, |
|||
| (In thousands) | |||
| 2010 |
$ | 16,355 | |
| 2011 |
11,814 | ||
| 2012 |
10,862 | ||
| 2013 |
12,315 | ||
| 2014 and thereafter |
950 | ||
| $ | 52,296 | ||
Loan closing costs at December 31, 2008 and 2009 are reflected on the balance sheet, net of accumulated amortization of $4.6 million and $6.0 million, respectively. These costs are capitalized as incurred and amortized to interest expense using the effective-interest method.
Our Senior Credit Facility consists of a $50.0 million term loan (the “Term Loan”) and a $20.0 million working capital revolving line of credit (the “Revolver”). Availability under the Revolver is the lower of: (i) $20.0 million or (ii) the sum of eligible accounts receivable and inventory, as defined under the agreement governing the Revolver. The Revolver accrued interest at the 30-day LIBOR plus 2.25% (3.22% at December 31, 2008) and at the 30-day LIBOR with a 1% floor plus 4.0% (5.0% at December 31, 2009), and matures in April 2013. The Revolver is collateralized by accounts receivable and inventory. As of December 31, 2008 and 2009, we had $9.8 million and $0.0 million outstanding under the Revolver, respectively. Due to the lock-box arrangement and the subjective acceleration clause in the agreements governing the Revolver, the debt under our previous revolving line of credit and the Revolver has been classified as a current liability as of December 31, 2008 and December 31, 2009, as required by ASC 470-10-45 (formerly Emerging Issues Task Force (“EITF”) No. 95-22), “Balance Sheet Classification of Borrowings Outstanding under Revolving Credit Agreements that include both a Subjective Acceleration Clause and a Lock-box Arrangement.”
62
Table of Contents
Under the terms of the Term Loan, the funding limits are limited to the lesser of $50.0 million and 80% of the orderly liquidation value of our equipment. In addition, the Term Loan matures in April 2013 and will be repaid quarterly in equal payments of $2.0 million. Interest is due monthly in arrears and accrues at the 30-day LIBOR plus 2.75% (3.71% at December 31, 2008) and at the 30-day LIBOR with a 1% floor plus 4.5% (5.50% at December 31, 2009). The Term Loan contains customary financial covenants and limitations on capital expenditures. As of December 31, 2008 and 2009, we had $44.0 million and $36.0 million outstanding under the Term Loan, respectively.
During November 2009, we entered into an amendment and waiver to the Senior Credit Facility. The waiver provided relief from the required fixed charge coverage ratio covenant for the quarter ended September 30, 2009. The amendment adjusted the required covenants related to our leverage ratio, our fixed charge coverage ratio and reduced our annual capital expenditure limit for 2009 and 2010. Additionally, the amendment reduced the availability under the Revolver from $25.0 million to $20.0 million. Interest rates were adjusted on the Term Loan and the Revolver as a result of the amendment. At December 31, 2009, we were in compliance with all covenants under the Senior Credit Facility.
We were in compliance with the covenants under the Senior Credit Facility as of December 31, 2009, but at this time it is uncertain whether the covenants, specifically the leverage ratio covenant, will be met at March 31, 2010 and thereafter. If we are unable to comply with our covenants at March 31, 2010 or in the future, we believe that it is probable that we would be able to cure covenant violations by obtaining waivers from our lenders to cure a default, although we can give no assurances that any waiver or amendment will be entered into, or on terms acceptable to us. If we were not able to comply with our covenants in the future, and we were not able to obtain waivers from our lenders to cure a default, our lenders would have the right to demand acceleration of payment on all amounts outstanding under the Senior Credit Facility.
PREHEAT NOTES
In connection with the February 2006 purchase of Preheat, we issued $4.0 million in 5% promissory notes payable to certain Preheat stockholders (“Preheat Notes”). The Preheat Notes consist of three separate notes with $2.7 million maturing in February 2008 and $1.3 million maturing in February 2009. At December 31, 2008 and 2009, the Preheat Notes had a balance of $4.0 million and $3.85 million, respectively. In February 2008, we terminated for cause the employment of one of the Preheat stockholders. The terms of the Preheat Notes provide that a termination of either of the Preheat stockholders’ employment for cause results in the cancellation of the Preheat Notes. The Preheat stockholders are contesting our assertion and have filed a lawsuit against the Company (See Note 8). Consequently, the Preheat Notes remain recorded as a liability in the financial statements pending resolution of the matter.
CHARLES HOLSTON NOTES
In connection with the acquisition of Holston (see Note 12) in March 2007, we issued $5.0 million in 5% promissory notes payable to certain Holston owners (“Holston Notes”). The Holston Notes consist of three separate notes with $1.0 million maturing in February 2008, $2.0 million maturing in February 2009 and $2.0 million maturing in February 2010. The notes maturing in 2009 and 2010 are convertible into shares of our common stock at a price of $9.24 per share. Based upon the stock valuation at the time of issuance, no beneficial conversion feature existed. At December 31, 2008 and 2009, the Holston Notes had a balance of $4.0 million and $2.0 million, respectively.
In February 2010, each of the holders of the Holston Notes signed note modification agreements (“Holston Note Modifications”) whereby the payment terms of the Holston Notes were modified to thirty-five monthly payments of principal and interest of $0.06 million beginning February 28, 2010 and one payment for the balance on January 28, 2013. At the time of the Holston Note Modifications, we issued an aggregate of 107,334 shares of our unregistered restricted common stock to the holders of the Holston Notes. The restrictions on the shares will
63
Table of Contents
lapse at various times prior to the maturity of the Holston Notes and the we may, at our option, pay the Holston Notes balance prior to the new maturity date without penalty. If payment of the Holston Notes is made prior to the lapse of the periodic restrictions, the remaining restricted shares will be forfeited to us and cancelled. The allocation between current and long-term debt was adjusted in the 2009 financial statements to reflect these modifications.
CYPRESS NOTE
In connection with the acquisition of certain assets of Cypress (see Note 12) effective in February 2007, we issued $3.0 million in a 5% promissory note payable to a certain Cypress Energy stockholder (“Cypress Note”). The Cypress Note is payable over three years with $1.0 million maturing in February 2008, $1.0 million maturing in February 2009 and $1.0 million maturing in February 2010. In November 2008, as an accommodation to the holder of the note, we paid the $1.0 million due in February 2009 in exchange for a discounted payment by $0.1 million. This discount is reflected as a gain on early extinguishment of debt in the financial statements. At December 31, 2008 and 2009, the Cypress Note had a balance of $1.0 million each.
BAILEY NOTE
In connection with the acquisition of BOI (see Note 12) in June 2007, we issued $0.5 million in a 5% promissory note payable to BOI (“Bailey Note”). The Bailey Note is payable on or before May 31, 2010. At December 31, 2008 and 2009, the Bailey Note had a balance of $0.5 million.
In January 2010, the holder of the Bailey Note signed a note modification agreement (“Bailey Note Modification”) whereby the payment terms of the Bailey Note were modified to thirty-five monthly payments of principal and interest of $0.015 million beginning May 30, 2010 and one payment for the balance on April 30, 2013. At the time of the Bailey Note Modifications, we issued an aggregate of 26,832 shares of our unregistered restricted common stock to the holder of the Bailey Note. The restrictions on the shares will lapse at various times prior to the maturity of the Bailey Note and we may, at our option, pay the Bailey Note balance prior to the new maturity date without penalty. If payment of the Bailey Note is made prior to the lapse of the periodic restrictions, the remaining restricted shares will be forfeited to us and cancelled. The allocation between current and long-term debt was adjusted in the 2009 financial statements to reflect this modification.
BEG NOTES
In connection with the acquisition of certain assets of BEG (see Note 12) in January 2008, we issued $4.0 million of 5% promissory notes payable to certain shareholders of BEG (“BEG Notes”). The BEG Notes are payable over three years with $1.3 million maturing in January 2009, $1.3 million maturing in January 2010 and $1.4 million maturing in January 2011 and are convertible into shares of our common stock at a rate of $3.70 per share under certain circumstances. Based upon the stock valuation at the time of the issuance, no beneficial conversion feature exists. At December 31, 2008 and 2009, the BEG Notes had a balance of $4.0 million and $2.7 million, respectively.
In January 2010, each of the holders of the BEG Notes signed note modification agreements (“BEG Note Modifications”) whereby the payment terms of the BEG Notes were modified to thirty-five monthly payments of principal and interest of $0.08 million beginning January 18, 2010 and one payment for the balance on December 18, 2013. At the time of the BEG Note Modifications, we issued an aggregate of 143,112 shares of our unregistered restricted common stock to the holders of the BEG Notes. The restrictions on the shares will lapse at various times prior to the maturity of the BEG Notes and we may, at our option, pay the note balance prior to the new maturity date without penalty. If payment of the BEG Notes are made prior to the lapse of the periodic restrictions, the remaining restricted shares will be forfeited to us and cancelled. The allocation between current and long-term debt was adjusted in the 2009 financial statements to reflect these modifications.
64
Table of Contents
INDUSTRIAL LIFT NOTES
In connection with the acquisition of Industrial Lift (see Note 12) in April 2008, we issued $4.0 million of promissory notes payable to the shareholders of Industrial Lift (“the ILT Notes”). The ILT Notes are payable over three years with $2.0 million maturing in April 2009, $1.0 million maturing in April 2010 and $0.5 million maturing in April 2011. The ILT Notes bear interest at a rate of 5% per annum payable in arrears and are convertible into shares of our common stock at a rate of $10.50 per share under certain circumstances. Based upon the stock valuation at the time of the issuance, no beneficial conversion feature exists. An additional note in the amount of $0.5 million, which is non-convertible and non-interest bearing, matures in April 2011. In April 2009, an agreement was reached with the former shareholder of Industrial Lift whereby $0.5 million of the scheduled principal payment due in April 2009 was paid in cash and $0.3 million of the obligation was satisfied through the issuance of 233,333 unregistered restricted shares of our common stock valued at $0.3 million. Additionally, $0.4 million was deposited into an irrevocable trust which was released prior to December 31, 2009. At December 31, 2008 and 2009, the ILT Notes had a balance of $4.0 million and $2.8 million, respectively.
In March 2010, each of the holders of the ILT Notes signed a note modification agreement (“ILT Note Modification”) whereby the payment terms of $1.0 million of the ILT Notes were modified to thirty-five monthly payments of principal and interest of $0.03 million beginning April 23, 2010 and one payment for the balance on March 23, 2013. At the time of the ILT Note Modification, we issued an aggregate of 53,665 shares of our unregistered restricted common stock to the holders of the ILT Notes. The restrictions on the shares will lapse at various times prior to the maturity of the ILT notes and we may, at our option, pay the note balance prior to the new maturity date without penalty. If payment of the ILT Note is made prior to the lapse of the periodic restrictions, the remaining restricted shares will be forfeited to us and cancelled. The terms and maturity on the $1.0 million of ILT Notes originally maturing in April 2011 remain unchanged. The allocation between current and long-term debt was adjusted in the 2009 financial statements to reflect this modification.
INSURANCE NOTES PAYABLE
A portion of our property and casualty insurance premiums are financed through certain short-term installment loan agreements. The insurance notes are payable in monthly installments through June 2010 and accrue interest at 5.16%.
CAPITAL LEASES
In 2007, we acquired a forklift under capital lease. The capital lease matures in February 2012. In 2009, we acquired several pieces of equipment for the Seismic Services and Environmental and Other Services segments under capital leases. These leases have maturity dates ranging from February 2011 to July 2014. The balance of all capital leases payable as of December 31, 2009 was $2.0 million.
Total cost and related accumulated depreciation of assets held under capital lease were nominal at December 31, 2008. The cost and related accumulated depreciation of assets held under capital lease was $2.3 million and $0.1 million, respectively, at December 31, 2009.
Depreciation expense for the years ended December 31, 2007, 2008 and 2009 was approximately $0.1 million for each year respectively, for all assets held under capital lease.
The future minimum lease payments for capital leases as of December 31, 2009 are $0.9 million for 2010, $0.7 million for 2011, $0.6 million for 2012, and less than $0.1 million for 2013 and 2014, with $0.3 million representing interest over the life of the leases.
65
Table of Contents
| 5. | INTANGIBLE ASSETS |
Intangible assets consist of the following at December 31:
| BALANCE DECEMBER 31, 2007 |
2008 | BALANCE DECEMBER 31, 2008 |
||||||||||||||||||
| ADDITIONS | REDUCTIONS | IMPAIRMENTS | ||||||||||||||||||
| (In thousands) | ||||||||||||||||||||
| Goodwill |
$ | 17,239 | $ | 8,647 | $ | (299 | ) | $ | (14,877 | ) | $ | 10,710 | ||||||||
| Trademark/tradename |
1,532 | 1,054 | — | (401 | ) | 2,185 | ||||||||||||||
| Licenses and permits |
— | — | — | — | — | |||||||||||||||
| Less Accumulated Amortization |
(424 | ) | — | — | — | (424 | ) | |||||||||||||
| Total unamortizable assets |
18,347 | 9,701 | (299 | ) | (15,278 | ) | 12,471 | |||||||||||||
| Customer lists |
17,903 | 526 | — | (11,954 | ) | 6,475 | ||||||||||||||
| Non-compete agreements |
1,157 | 757 | — | (882 | ) | 1,032 | ||||||||||||||
| Favorable lease |
196 | — | — | (196 | ) | — | ||||||||||||||
| Licenses and permits |
3,700 | 4,991 | — | — | 8,691 | |||||||||||||||
| Less Accumulated Amortization |
(3,403 | ) | (3,563 | ) | — | 3,263 | (3,703 | ) | ||||||||||||
| Net amortizable assets |
19,553 | 2,711 | — | (9,769 | ) | 12,495 | ||||||||||||||
| Total intangibles, net |
$ | 37,900 | $ | 12,412 | $ | (,299 | ) | $ | (25,047 | ) | $ | 24,966 | ||||||||
| BALANCE DECEMBER 31, 2008 |
2009 | BALANCE DECEMBER 31, 2009 |
||||||||||||||||||
| ADDITIONS | REDUCTIONS | IMPAIRMENTS | ||||||||||||||||||
| (In thousands) | ||||||||||||||||||||
| Goodwill |
$ | 10,710 | $ | — | $ | — | $ | (2,369 | ) | $ | 8,341 | |||||||||
| Trademark/tradename |
2,185 | 64 | — | — | 2.249 | |||||||||||||||
| Licenses and permits |
— | 2,500 | — | — | 2,500 | |||||||||||||||
| Less Accumulated Amortization |
(424 | ) | — | — | — | (424 | ) | |||||||||||||
| Total unamortizable assets |
12,471 | 2,564 | — | (2,369 | ) | 12,666 | ||||||||||||||
| Customer lists |
6,475 | — | — | — | 6,475 | |||||||||||||||
| Non-compete agreements |
1,032 | — | — | — | 1,032 | |||||||||||||||
| Favorable lease |
— | — | — | — | — | |||||||||||||||
| Licenses and permits |
8,691 | — | (2,500 | ) | — | 6,191 | ||||||||||||||
| Less Accumulated Amortization |
(3,703 | ) | (1,482 | ) | — | — | (5,185 | ) | ||||||||||||
| Net amortizable assets |
12,495 | (1,482 | ) | (2,500 | ) | — | 8,513 | |||||||||||||
| Total intangibles, net |
$ | 24,966 | $ | 1,082 | $ | (2,500 | ) | $ | (2,369 | ) | $ | 21,179 | ||||||||
66
Table of Contents
Intangible assets by segment, net of accumulated amortization at December 31 are as follows:
| BALANCE DECEMBER 31, 2007 |
2008 | BALANCE DECEMBER 31, 2008 | |||||||||||||||
| ADDITIONS | REDUCTIONS(1) | IMPAIRMENTS | |||||||||||||||
| (In thousands) | |||||||||||||||||
| Seismic services |
$ | 8,756 | $ | 439 | $ | (761 | ) | $ | (6,314 | ) | $ | 2,120 | |||||
| Environmental and Other services |
12,536 | 10,016 | (1,248 | ) | (5,538 | ) | 15,766 | ||||||||||
| Equipment leasing |
16,608 | 5,521 | (1,854 | ) | (13,195 | ) | 7,080 | ||||||||||
| Corporate |
— | — | — | — | — | ||||||||||||
| Total intangibles by segment, net |
$ | 37,900 | $ | 15,976 | $ | (3,863 | ) | $ | (25,047 | ) | $ | 24,966 | |||||
| (1) | Includes amortization charged to expense during the year |
| BALANCE DECEMBER 31, 2008 |
2009 | BALANCE DECEMBER 31, 2009 | |||||||||||||||
| ADDITIONS | REDUCTIONS(1) | IMPAIRMENTS | |||||||||||||||
| (In thousands) | |||||||||||||||||
| Seismic services |
$ | 2,120 | $ | 8 | $ | — | $ | — | $ | 2,128 | |||||||
| Environmental and Other services |
15,766 | 311 | (1,482 | ) | — | 14,595 | |||||||||||
| Equipment leasing |
7,080 | — | (255 | ) | (2,369 | ) | 4,456 | ||||||||||
| Corporate |
— | — | — | — | — | ||||||||||||
| Total intangibles by segment, net |
$ | 24,966 | $ | 319 | $ | (1,737 | ) | $ | (2,369 | ) | $ | 21,179 | |||||
| (1) | Includes amortization charged to expense during the year |
| YEAR ENDED DECEMBER 31, |
AGGREGATE AMORTIZATION EXPENSE |
ESTIMATED AGGREGATE AMORTIZATION EXPENSE | ||||
| (In thousands) | ||||||
| 2007 |
$ | 1,704 | $ | — | ||
| 2008 |
3,563 | — | ||||
| 2009 |
1,482 | — | ||||
| 2010 |
— | 1,482 | ||||
| 2011 |
— | 1,267 | ||||
| 2012 |
— | 1,224 | ||||
| 2013 |
— | 1,042 | ||||
| 2014 |
— | 965 | ||||
| Thereafter |
— | 2,533 | ||||
Goodwill, net of amortization, at December 31, 2009 is comprised of $2.0 million which is attributable to our previous acquisition of Gulf Coast Resources in 2000, $2.2 million attributable to our acquisition of Trussco in 2004, and $4.4 million attributable to our acquisition of Preheat in 2006.
| 6. | RELATED PARTY TRANSACTIONS |
On May 17, 2005, we entered into a Securities Purchase Agreement with certain of our affiliates and executive officers to issue up to $5.0 million of Series C Preferred in conjunction with the completion of a term loan. Our Series C Preferred is convertible into shares of our common stock at a conversion price of $1.95 per share and includes detachable warrants to purchase up to 6,550,000 additional shares of our common stock at exercise prices ranging between $1.95 and $3.50 per share. The transactions contemplated by the Securities Purchase Agreement closed in two tranches. On May 17, 2005, we issued an aggregate of 3,500 shares of Series C Preferred and warrants to acquire 4,585,000 shares of our common stock, in exchange for $3.5 million.
67
Table of Contents
On August 29, 2005, the remainder of the Series C Preferred and warrants were issued generating proceeds of $1.5 million and we granted the remaining 1,965,000 warrants.
The prior term loan agreement and senior credit facility restricted the payment of cash dividends. Consequently, a portion of the 9% dividend obligation related to the Series C Preferred was satisfied through the issuance of payment-in-kind (“PIK”) dividends. The PIK dividends were paid through the issuance of additional shares of Series C Preferred. These additional shares of preferred stock did not have warrants attached to them. During the year ended December 31, 2007, 256 shares of Series C Preferred were issued as PIK dividends at par. Effective April 29, 2007, the loan and security agreement governing the Term Loan was amended to remove the restriction on cash dividend payments on the preferred equity shares, provided we had sufficient availability under our Revolver and were in compliance with all other covenants. Consequently, the accrued dividends from April 2007 to December 2007 of $0.1 million, for 2008 of $0.5 million and for 2009 of $0.5 million were paid in cash.
In connection with the February 2006 purchase of Preheat, we issued the Preheat Notes. The Preheat Notes consist of three separate notes issued to the former owners who became employees with $2.7 million maturing in February 2008 and $0.5 million and $0.8 million maturing in February 2009 (see Note 4). At December 31, 2008 and 2009, the Preheat Notes had a balance of $4.0 million and $3.85 million, respectively. In February 2008, we terminated for cause the employment of one of the Preheat stockholders. The terms of the Preheat Notes provide that a termination of either of the Preheat stockholders’ employment for cause results in the cancellation of the Preheat Notes. The Preheat stockholders are contesting our assertion and have filed a lawsuit against the Company. Consequently, the Preheat notes remain recorded as a liability in the financial statements pending resolution of the matter (see Note 8).
In connection with the purchase of Holston (see Note 12) in March 2007, we issued the Holston Notes (see Note 4). The Holston Notes consist of three separate notes issued to the former owners who are now employees with $1.0 million maturing in February 2008, $2.0 million maturing in February 2009 and $2.0 million maturing in February 2010. The notes maturing in 2009 and 2010 are convertible into shares of our common stock at a price of $9.24 per share. Based upon the stock valuation at the time of issuance, no beneficial conversion feature existed. At December 31, 2008 and 2009, the Holston Notes had a balance of $4.0 million and $2.0 million, respectively. In conjunction with the acquisition of Holston, we acquired a receivable from an entity owned by the former shareholders of Holston who are now employees of the Company. This receivable had a balance at December 31, 2008 and 2009 in the amount of $0.2 million and $0.1 million, respectively.
In connection with the acquisition of certain assets of Cypress (see Note 12) in February 2007, we issued $3.0 million in Cypress Notes to the former owner who was an employee (see Note 4). The Cypress Note is payable over three years with $1.0 million maturing in February 2008, $1.0 million maturing in February 2009 and $1.0 million maturing in February 2010. At December 31, 2008 and 2009, the Cypress Note had a balance of $1.0 million.
In connection with the acquisition of BOI (see Note 12) in June 2007, we issued the Bailey Note to the former owner who was an employee (See Note 4). The Bailey Note is payable on or before May 31, 2010. At December 31, 2008 and 2009, the Bailey Note had a balance of $0.5 million.
In connection with the acquisition of certain assets of BEG (see Note 12) in January 2008, we issued the BEG Notes to certain shareholders of BEG, two of which are now employees of the Company (see Note 4). The BEG Notes are payable over three years with $1.3 million maturing in January 2009, $1.3 million maturing in January 2010 and $1.4 million maturing in January 2011 and are convertible into shares of our common stock at a rate of $3.70 per share under certain circumstances (see Note 5). Based upon the stock valuation at the time of the issuance, no beneficial conversion feature exists. At December 31, 2008 and 2009, the BEG Notes had a balance of $4.0 million and 2.7 million, respectively.
In connection with the acquisition of Industrial Lift (see Note 4), we issued the ILT Notes to a shareholder of Industrial Lift, who is currently an employee of the Company. The ILT Notes are payable over three years with $2.0 million maturing in April 2009, $1.0 million maturing in April 2010 and $0.5 million maturing in April
68
Table of Contents
2011 (see Note 5). The ILT Notes bear interest at a rate of 5% per annum payable in arrears and are convertible into shares of our common stock at a rate of $10.50 per share under certain circumstances. Based upon the stock valuation at the time of the issuance, no beneficial conversion feature exists. An additional note in the amount of $0.5 million, which is non-convertible and non-interest bearing, matures in April 2011. In April 2009, an agreement was reached with the former shareholder of Industrial Lift whereby $0.5 million of the scheduled principal payment due in April 2009 was paid in cash and $0.3 million of the obligation was satisfied through the issuance of 233,333 shares of our common stock valued at $0.3 million. Additionally, $0.4 million was deposited into an irrevocable trust which was released prior to December 31, 2009. At December 31, 2008 and 2009, the ILT Notes had a balance of $4.0 million and $2.8 million, respectively.
| 7. | CUSTOMER AND CREDIT CONCENTRATION |
During the year ended December 31, 2007, one customer associated with the Seismic Services segment, accounted for 11% of our total revenues. Included in accounts receivable as of December 31, 2007, are amounts receivable from this customer totaling approximately 7% of total accounts receivable.
During the year ended December 31, 2008, two customers associated with the Seismic Services segment accounted for 21% (11% and 10%, respectively) of our total revenues. Included in accounts receivable as of December 31, 2008, are amounts receivable from these customers totaling approximately 6% (4% and 2%, respectively) of total accounts receivable.
During the year ended December 31, 2009, one customer accounted for 12% of our total revenues. Included in accounts receivable as of December 31, 2009, are amounts receivable from this customer totaling approximately 11% of total accounts receivable.
| 8. | COMMITMENTS AND CONTINGENCIES |
OPERATING LEASES
Total rental expense inclusive of equipment leased on a short-term basis, was $4.9 million, $4.7 million and $4.4 million for the years ended December 31, 2007, 2008 and 2009, respectively.
We have the following operating lease commitments under non-cancelable lease terms, as of December 31, 2009:
| 2010 | PAYMENTS DUE BY PERIOD | ||||||||||||||||||||
| 2011 | 2012 | 2013 | 2014 | Thereafter | Total | ||||||||||||||||
| (In thousands) | |||||||||||||||||||||
| Operating leases |
$ | 3,300 | $ | 1,832 | $ | 497 | $ | 140 | $ | 37 | $ | 63 | $ | 5,869 | |||||||
EMPLOYMENT AGREEMENTS
On December 31, 2007, we entered into a new Restricted Stock Agreement (“NRSA”) with Mr. James Eckert that replaced his previous restricted stock and stock-based award incentive agreement. At the time of the agreement, Mr. Eckert was our Chief Executive Officer. Under the NRSA, we awarded Mr. Eckert 400,000 restricted shares of our common stock on January 1, 2008. The restricted shares vested immediately, but the shares remain subject to transfer restrictions which lapse at a rate of 33,333 quarterly after the initial lapse of transfer restrictions on 100,000 shares on January 1, 2009.
In conjunction with the NRSA, we mutually terminated the previous restricted stock and stock-based award incentive agreement with Mr. Eckert and entered into an Amended and Restated Employment Agreement with Mr. Eckert which was effective until June 30, 2008. Additionally, we entered into a Consulting Agreement with Mr. Eckert pursuant to which we retained Mr. Eckert as an independent contractor to perform consulting services until June 30, 2009.
69
Table of Contents
We have employment agreements with our executive officers and certain former shareholders of companies we acquired. These agreements generally last two or three years and have renewal provisions at our option.
OTHER CONTINGENCIES
In the normal course of our business, we become involved in various litigation matters including, among other things, claims by third parties for alleged property damages, personal injuries and other matters. While we believe we have meritorious defenses against these claims, management has used estimates in determining our potential exposure and has recorded reserves in our financial statements related thereto where appropriate. It is possible that a change in our estimates of that exposure could occur, but we do not expect such changes in estimated costs will have a material effect on our financial position or results of operations.
We record liabilities for environmental obligations when remediation efforts are probable and the costs can be reasonably estimated. Our estimates are based on currently enacted laws and regulations. As more information becomes available or environmental laws and regulations change, such liabilities may be required to be adjusted. Additionally, in connection with acquisitions, we obtain indemnifications from the seller related to environmental matters. If the indemnifying parties do not fulfill their obligations, adjustments of recorded amounts may be required.
We maintain insurance coverage for various aspects of our business and operations. We retain a portion of losses that occur through the use of deductibles and, to a limited extent, self-funded insurance programs. We regularly review estimates of reported and unreported claims and provide for losses through insurance reserves. As claims develop and additional information becomes available, adjustments to loss reserves may be required. As of December 31, 2008 and 2009, no liability related to remediation efforts were recorded, since none were deemed necessary.
On May 1, 2008, the former owners of Preheat, Inc., which we acquired in February 2006, filed a lawsuit in federal court in the United States District Court for the Western District of Louisiana in Lafayette, Louisiana, against us, our directors, our current Chief Executive Officer, our current Senior Vice President/Chief Financial Officer, one of our investment advisors, and a principal of the investment advisor. The lawsuit sought, among other things, (i) a declaratory judgment that the Preheat purchase agreement executed in December 2005 is null because of alleged inducement to enter into the purchase agreement by criminal or fraudulent conduct, securities fraud and bad faith breach of the purchase agreement and that one of the former owner’s ERISA rights be clarified, (ii) injunctive relief to halt alleged securities disclosure violations by us and to remove three board members, and (iii) damages resulting from the nullification of the Preheat purchase agreement. We, together with the other defendants, filed a motion to dismiss the lawsuit. The motion was granted in a judgment dated July 23, 2009. No appeal was taken, and that judgment is now final. The right of the plaintiffs to pursue certain state law claims was preserved.
We have filed suit in the 15th Judicial District Court, Lafayette, Parish, against the former owners of Preheat alleging damages that we have sustained as a result of their actions. Additionally, the former owners of Preheat have filed suit against us, our directors, and others in the 16th Judicial District Court, Iberia Parish. We, along with all the defendants named, have filed exceptions to the suit based on improper venue. That motion is pending with the court. At this point, we are unable to assess the ultimate impact of the litigation in either venue. We believe the claims against us are without merit and are vigorously contesting the legal action. Additionally, we believe the value of our claim against the former owners of Preheat exceeds the amount of any claims against us.
| 9. | STOCKHOLDERS’ EQUITY |
COMMON STOCK
We currently have 45,000,000 shares of our $0.01 par value common stock authorized; of these authorized shares, there were 20,647,496 and 20,980,202 shares issued at December 31, 2008 and 2009, respectively.
70
Table of Contents
On April 29, 2008, we mutually terminated a previous restricted stock and stock-based award incentive agreement with our former Executive Vice President, Darcy Klug, pursuant to a Termination and Mutual Release Agreement effective April 28, 2008, in connection with the termination of his employment and settlement of litigation between Mr. Klug and us, among others. As part of the agreement, we issued 400,000 shares of our common stock in partial settlement of litigation.
On May 11, 2009, we entered into a Settlement Agreement, Mutual Release and Indemnity Agreement with Advantage Capital Corporation, et. al (collectively “ACP”) to settle claims filed by ACP in the Civil District Court in the Parish of Orleans, State of Louisiana, against us and certain of our executive officers at the time. Under the terms of the settlement agreement, we agreed to pay ACP $0.75 million in cash and 82,873 shares of our common stock valued at $0.15 million as of the May 12, 2009 closing price of $1.81 per share. Additionally, we agreed to instruct Eagle Geophysical, Inc. to issue to ACP 17,220 shares of Eagle Geophysical, Inc. common stock valued at $0.12 million as of its last known trade.
PREFERRED STOCK
At December 31, 2009, 29 shares of Series B Preferred remain outstanding and are convertible into 7,733 shares of our common stock.
On May 17, 2005, we entered into a Securities Purchase Agreement with certain of our affiliates and executive officers to issue up to $5.0 million of Series C Preferred in conjunction with the completion of a senior credit facility at the time. Our Series C Preferred is convertible into shares of our common stock at a conversion price of $1.95 per share and includes detachable warrants to purchase up to 6,550,000 additional shares of our common stock at exercise prices ranging between $1.95 and $3.50 per share. The conversion prices of our Series C Preferred and the warrant exercise prices were supported by a fairness opinion issued by a third party. The transactions contemplated by the Securities Purchase Agreement closed in two tranches. On May 17, 2005, we issued an aggregate of 3,500 shares of Series C Preferred and warrants to acquire 4,585,000 shares of our common stock, in exchange for $3.3 million, net of offering costs of $0.2 million. The proceeds of the issuance were allocated to the warrants and preferred stock based on the relative fair value of each instrument. The value attributed to the warrants was $2.9 million ($2.7 million net of offering costs) and was recorded as additional paid in capital while $0.6 million was the remaining allocated value to the preferred stock. In addition, the conversion terms of the preferred stock result in a beneficial conversion feature valued at approximately $0.7 million. As a result of the terms of conversion, we recorded a one time charge to retained earnings for this amount representing a deemed dividend to the preferred stockholders with the offset recorded in additional paid in capital.
On August 29, 2005, the remainder of the Series C Preferred and warrants were issued generating gross proceeds of $1.5 million. The proceeds of the issuance of the second tranche were allocated to the warrants and preferred stock based on the relative fair value of each instrument. The entire value of $1.5 million was attributed to the fair value of the warrants and was recorded as additional paid in capital. In addition, the conversion terms of the preferred stock issued in the second tranche resulted in no beneficial conversion feature.
The prior term loan agreements and the senior credit facility restricted the payment of cash dividends. Consequently, the dividend obligation related to the Series C Preferred had been satisfied through the issuance of PIK dividends. The PIK dividends are paid through the issuance of additional shares of Series C Preferred. These additional shares of preferred stock do not have warrants attached to them. During the year ended December 31, 2007, 256 shares of Series C Preferred were issued as PIK dividends. In addition, the conversion terms of the preferred stock issued as PIK dividends resulted in a beneficial conversion feature resulting in a one time charge to retained earnings representing a dividend to the preferred stockholders with the offset recorded in additional paid in capital.
Effective April 29, 2007, the loan and security agreement governing the term loan was amended to remove the restriction on cash dividend payments on the preferred equity shares, provided we had sufficient availability
71
Table of Contents
under our Revolver and were in compliance with all other loan covenants. We paid cash dividends on the preferred equity shares during 2008 and 2009 in the amount of $0.5 million and $0.5 million, respectively.
During 2008, a total of 88 shares of our Series C Preferred were converted into 44,615 shares of our common stock. Additionally, a total of 1,050,000 warrants were exercised during 2008 resulting in proceeds to the Company of approximately $2.6 million.
At December 31, 2009, 5,396 shares of Series C Preferred remain outstanding and are convertible into 2,767,179 shares of our common stock at a conversion rate of $1.95 per share.
EARNINGS PER SHARE
Basic EPS is determined by dividing income (loss) available to common stockholders by the weighted average number of shares of common stock outstanding during the period. Diluted EPS reflects the potential dilution that could occur if options and other contracts to issue shares of common stock were exercised or converted into common stock. We had 298,840, 1,345,258, and 1,531,652 options outstanding at December 31, 2007, 2008 and 2009, respectively, which were excluded from the calculation of diluted EPS as they were antidilutive. In addition, warrants to purchase up to 151,500, 2,965,992, and 4,981,794 shares of common stock were also excluded at December 31, 2007, 2008, and 2009, respectively, as they were antidilutive. Additionally, notes that were payable to certain Rig Tools stockholders were convertible into 437,329, 104,167 and 0 shares of common stock, Holston Notes convertible into 362,925, 432,900, and 251,438 shares of common stock, BEG Notes convertible into 0, 1,027,913, and 738,492 shares of common stock and Industrial Lift Notes convertible into 0, 228,597, and 312,694 shares of common stock were excluded from the calculation of Diluted EPS for 2007, 2008, and 2009, respectively, as they were antidilutive. Additionally, preferred stock convertible into 0, 2,786,133, and 2,774,913 shares of common stock were excluded from the calculation as they were antidilutive.
The following table sets forth the computation of basic and diluted weighted average shares outstanding used to compute earnings per share for each year, respectively:
| YEAR ENDED DECEMBER 31, | |||||||||||
| 2007 | 2008 | 2009 | |||||||||
| (In thousands) | |||||||||||
| Numerator: |
|||||||||||
| Net income (loss) available to common stockholders |
$ | 9,411 | $ | (14,129 | ) | $ | (3,395 | ) | |||
| Dilutive effect of preferred stock |
758 | — | — | ||||||||
| Net income (loss) available to common stockholders with assumed conversions |
$ | 10,169 | $ | (14,129 | ) | $ | (3,395 | ) | |||
| Denominator: |
|||||||||||
| Basic earnings (loss) per share weighted average shares |
18,077 | 19,740 | 20,795 | ||||||||
| Stock options |
298 | — | — | ||||||||
| Warrants |
4,337 | — | — | ||||||||
| Contingently issuable shares |
45 | — | — | ||||||||
| Preferred stock |
2,877 | — | — | ||||||||
| Denominator for dilutive earnings (loss) per share-adjusted for weighted average shares with assumed conversions |
25,634 | 19,740 | 20,795 | ||||||||
| Basic income (loss) per common share: |
|||||||||||
| Net income (loss) available to common stockholders |
$ | 0.52 | $ | (0.72 | ) | $ | (0.16 | ) | |||
| Diluted income (loss) per common share: |
|||||||||||
| Net income (loss) available to common stockholders |
$ | 0.40 | $ | (0.72 | ) | $ | (0.16 | ) | |||
72
Table of Contents
STOCK BASED COMPENSATION
We have stock-based compensation plans available to grant nonqualified stock options, incentive stock options, stock appreciation rights, restricted units and restricted stock to key employees. The OMNI Energy Services Corp. Eighth Amended and Restated Stock Incentive Plan (the “Stock Plan”), provides for the issuance of 5,750,000 shares of our common stock, of which 2,270,216 shares were available for issuance at December 31, 2009. The principal awards outstanding under our stock-based compensation plans include non-qualified stock options and restricted stock units. In addition, we have the 1999 Stock Option Plan (the “1999 Plan”) which became effective on November 11, 1999 and was not approved by the stockholders. The total shares of our common stock available for issuance under the 1999 Plan is 100,000 shares, of which 0 shares were available for issuance at December 31, 2009.
The exercise price, term and other conditions applicable to each stock option granted under the stock plans are generally determined by the Compensation Committee of the Board of Directors. The exercise price of stock options is set on the grant date and may not be less than the fair market value per share of our stock on that date. The options generally become exercisable over a three-year period and expire after ten years.
There was $1.0 million, $1.1 million and $1.3 million of compensation cost related to non-qualified stock options recognized in operating results (included in general and administrative expenses) for the year ended December 31, 2007, 2008 and 2009, respectively. In addition, restricted stock vested in 2007, 2008 and 2009 amounted to $2.7 million, $0.1 million, and $0.1 million, respectively.
The total intrinsic value of options (which is the amount by which the stock price exceeded the exercise price of the options on the date of exercise) exercised during the years ended December 31, 2009, 2008 and 2007 was approximately $0.0 million, $0.0 million and $1.9 million (employee share), respectively. During the years ended December 31, 2009, 2008 and 2007, the amount of cash we received from the exercise of stock options was approximately $0.0 million, $0.0 million and $0.9 million (Company share), respectively.
On April 13, 2009, the Compensation Committee of our Board of Directors approved a resolution whereby the exercise price of options held by certain of our officers, directors and employees would be changed to a price equal to the closing price of our stock on May 29, 2009. The closing price on May 29, 2009 was $2.28. This decision was approved by an advisory vote of our stockholders at the annual shareholder’s meeting on May 27, 2009. The total number of options subject to the repricing was 1,487,477. The repriced options had original exercise prices ranging from $2.32 to $10.14, which prices reflected the then current market prices of our stock on the dates of the original grant. The other terms of the options, including the vesting schedules, remained unchanged as a result of the repricing. As a result of the sharp reduction in our stock price, the Compensation Committee and Board of Directors believed that such options no longer would properly incentivize the option holders to work in our and our stockholders’ best interests. Moreover, the Board of Directors believed that if these options were repriced, such options would provide better incentives to such employees, officers and directors. Under terms of the repricing plan, the number of options outstanding was reduced to 1,190,573 in order to have no impact on compensation expense.
The following table summarizes information about non-vested stock option awards as of December 31, 2008 and changes for the year ended December 31, 2009:
| NUMBER OF OPTIONS |
WEIGHTED AVERAGE GRANT DATE FAIR VALUE | |||||
| Non-vested at December 31, 2008 |
746,974 | $ | 3.00 | |||
| Granted |
493,841 | 1.47 | ||||
| Vested |
(515,384 | ) | 2.47 | |||
| Forfeited |
(104,236 | ) | 3.48 | |||
| Non-vested at December 31, 2009 |
621,195 | $ | 1.54 | |||
73
Table of Contents
The fair value of each option award is estimated on the date of grant using the Black-Scholes option-pricing model. Expected volatility is based on implied volatilities from long-term traded options on our stock. We use the simplified method to derive an expected term because we feel that the actual terms are not indicative of our actual experience. The expected term represents an estimate of the time options are expected to remain outstanding. The risk-free rate for periods within the contractual life of the option is based on the U.S. treasury yield curve in effect at the time of grant. The following sets forth the assumptions used to determine compensation cost for our non-qualified stock options consistent with the requirements of ASC 718.
At December 31, 2009, there was $1.0 million, of total unrecognized compensation cost related to non-vested non-qualified stock option awards that is expected to be recognized over a weighted-average period of 1.86 years. The total fair value of options vested during the year ended December 31, 2009 and 2008 was $1.3 million and $1.1 million, respectively.
The weighted average fair value at date of grant for options granted during 2007 was $4.49 per option. The fair value of options granted is estimated on the date of grant using the Black-Scholes option-pricing model with the following assumptions: (a) dividend yield of 0.00%; (b) expected volatility of 38%; (c) average risk-free interest rate of 4.53%; and (d) expected life of 6.5 years.
The weighted average fair value at date of grant for options granted during 2008 was $2.66 per option. The fair value of options granted is estimated on the date of grant using the Black-Scholes option-pricing model with the following assumptions: (a) dividend yield of 0.00%; (b) expected volatility of 53%; (c) average risk-free interest rate of 3.38%; and (d) expected life of 6.5 years.
The weighted average fair value at date of grant for options granted during 2009 was $2.05 per option. The fair value of options granted is estimated on the date of grant using the Black-Scholes option-pricing model with the following assumptions: (a) dividend yield of 0.00%; (b) expected volatility of 78%; (c) average risk-free interest rate of 3.30%; and (d) expected life of 6.5 years.
A summary of our employee stock options as of December 31, 2007, 2008 and 2009, and changes during the years then ended, are presented below:
| WEIGHTED AVERAGE EXERCISE PRICE |
INCENTIVE PLAN OPTIONS |
WEIGHTED AVERAGE REMAINING CONTRACTUAL TERM (Years) |
AGGREGATE INTRINSIC VALUE (In Thousands) | ||||||||
| Balance at December 31, 2006 |
$ | 3.59 | 856,367 | 8.1 | $ | 5,309 | |||||
| Exercisable |
$ | 2.85 | 474,210 | 6.1 | $ | 3,291 | |||||
| Granted |
9.67 | 431,800 | |||||||||
| Exercised |
2.68 | (327,378 | ) | ||||||||
| Forfeited |
6.27 | (59,259 | ) | ||||||||
| Balance at December 31, 2007 |
$ | 6.65 | 901,530 | 8.4 | $ | — | |||||
| Exercisable |
$ | 5.38 | 426,642 | 8.0 | $ | — | |||||
| Granted |
4.77 | 817,000 | |||||||||
| Exercised |
2.97 | (7,766 | ) | ||||||||
| Forfeited |
7.50 | (156,627 | ) | ||||||||
| Balance at December 31, 2008 |
$ | 5.59 | 1,554,137 | 8.3 | $ | — | |||||
| Exercisable |
$ | 5.54 | 807,163 | 7.7 | $ | — | |||||
| Granted |
1.47 | 493,841 | |||||||||
| Replaced during repricing |
5.62 | (1,487,477 | ) | ||||||||
| Issued under the repricing |
2.28 | 1,190,573 | |||||||||
| Forfeited |
3.48 | (104,233 | ) | ||||||||
| Balance at December 31, 2009 |
$ | 2.21 | 1,646,841 | 7.8 | $ | — | |||||
| Exercisable |
$ | 2.26 | 1,025,646 | 7.2 | $ | — | |||||
74
Table of Contents
We entered into Restricted Stock and Stock-based Award Incentive Agreements (“RSA”) on January 3, 2007 with our Chief Executive Officer and Executive Vice President at that time. The RSAs have since been terminated. The RSAs provided for the granting of between 400,000 and 500,000 shares of our restricted common stock to each of the executive officers on the terms set forth in the RSAs. The number of shares of restricted stock would have become fixed and payable in the event of (i) a change in control of or the receipt by our Board of Directors of a change of control offer as defined by the RSAs; (ii) termination without cause; or (iii) death or disability. Additionally, at the time of vesting in the restricted shares, each executive officer would receive the right to a cash payment of $1.2 million. The RSAs were terminated during 2008.
RESTRICTED STOCK
In 2007, 2008 and 2009, we issued 12,500, 62,500, and 16,500 shares, respectively, of restricted stock under our Stock Plan in accordance with employment agreements entered into with our executives. During 2008, we issued 400,000 shares of restricted stock, under our Stock Plan in accordance with the NRSA described in Note 8 above.
The following table summarizes activity of unvested restricted stock awards as of December 31, 2007, 2008 and 2009:
| SHARES | WEIGHTED AVERAGE GRANT DATE FAIR VALUE |
AGGREGATE INTRINSIC VALUE | |||||||
| (in thousands) | |||||||||
| Non-vested at December 31, 2006 |
— | $ | — | $ | — | ||||
| Granted |
12,500 | $ | 5.43 | ||||||
| Non-vested at December 31, 2007 |
12,500 | $ | 5.43 | $ | 61 | ||||
| Granted |
462,500 | $ | 4.83 | ||||||
| Vested |
(404,167 | ) | $ | 4.89 | |||||
| Non-vested at December 31, 2008 |
70,833 | $ | 4.53 | $ | 89 | ||||
| Granted |
16,500 | $ | 1.16 | ||||||
| Vested |
(49,914 | ) | $ | 3.96 | |||||
| Non-vested at December 31, 2009 |
37,419 | $ | 3.81 | $ | 47 | ||||
At December 31, 2009, $0.1 million of total unrecognized compensation cost related to the unvested portion of the restricted stock awards is expected to be recognized over a weighted average period of 2.0 years.
75
Table of Contents
WARRANTS
A summary of our warrants as of December 31, 2007, 2008 and 2009, and changes during the years then ended are presented below:
| WEIGHTED AVERAGE EXERCISE PRICE |
WARRANTS | ||||
| Balance at December 31, 2006 |
$ | 2.73 | 6,860,650 | ||
| Exercisable |
$ | 2.73 | 6,860,650 | ||
| Granted |
— | — | |||
| Exercised |
2.25 | 618,000 | |||
| Forfeited |
— | — | |||
| Balance at December 31, 2007 |
$ | 2.78 | 6,242,650 | ||
| Exercisable |
$ | 2.78 | 6,242,650 | ||
| Granted |
— | — | |||
| Exercised |
2.50 | 1,050,000 | |||
| Forfeited |
— | — | |||
| Balance at December 31, 2008 |
$ | 2.84 | 5,192,650 | ||
| Exercisable |
$ | 2.84 | 5,192,650 | ||
| Granted |
— | — | |||
| Exercised |
— | — | |||
| Forfeited |
8.50 | 598,650 | |||
| Balance at December 31, 2009 |
$ | 2.10 | 4,594,000 | ||
| Exercisable |
$ | 2.10 | 4,594,000 | ||
During the years ended December 31, 2007, 2008 and 2009, we received proceeds from the exercise of warrants totaling approximately $1.4 million, $2.6 million and $0.0 million, respectively.
| 10. | INCOME TAXES |
The components of deferred tax assets and liabilities as of December 31, are as follows:
| DECEMBER 31, | ||||||
| 2008 | 2009 | |||||
| (In thousands) | ||||||
| Deferred Tax Assets: |
||||||
| Allowance for doubtful accounts |
$ | 372 | $ | 66 | ||
| Net operating loss carryforward and credits |
598 | 699 | ||||
| Stock based compensation |
— | 464 | ||||
| Accrued expenses and other |
12 | — | ||||
| Total deferred tax assets |
982 | 1,229 | ||||
| Deferred Tax Liabilities: |
||||||
| Property and equipment |
17,206 | 16,972 | ||||
| Intangibles |
989 | 1,484 | ||||
| Total deferred tax liabilities |
$ | 18,195 | $ | 18,456 | ||
| Classified in the balance sheet as follows: |
||||||
| Net deferred tax assets—current |
$ | 384 | $ | 66 | ||
| Net deferred tax liabilities – long-term |
$ | 17,597 | $ | 17,293 | ||
76
Table of Contents
The income tax expense for the years ended December 31, consisted of the following:
| YEAR ENDED DECEMBER 31, | |||||||||
| 2007 | 2008 | 2009 | |||||||
| (In thousands) | |||||||||
| Current expense |
$ | 683 | $ | 291 | $ | 576 | |||
| Deferred expense |
4,821 | 2,862 | 15 | ||||||
| Total expense |
$ | 5,504 | $ | 3,153 | $ | 591 | |||
| Federal |
$ | 4,706 | $ | 2,315 | $ | 553 | |||
| State |
798 | 838 | 38 | ||||||
| Total tax expense |
$ | 5,504 | $ | 3,153 | $ | 591 | |||
The reconciliation of Federal statutory and effective income tax rates for the years ended December 31, is shown below:
| YEAR ENDED DECEMBER 31, |
|||||||||
| 2007 | 2008 | 2009 | |||||||
| Statutory federal rate |
34 | % | (34 | )% | (34 | )% | |||
| Non-deductible impairment |
— | 48 | 35 | ||||||
| Stock-based compensation |
— | 8 | 0 | ||||||
| Non-deductible expenses and other |
(2 | ) | 4 | 22 | |||||
| State taxes |
3 | 5 | 2 | ||||||
| Total |
35 | % | 31 | % | 25 | % | |||
As of December 31, 2009, for tax purposes, we had net operating loss carryforwards (NOLs) of approximately $0.2 million. The NOLs will expire commencing 2018. We account for income taxes under the provision of ASC 740 which requires recognition of future tax benefits (NOLs and other temporary differences), subject to a valuation allowance based on more-likely-than-not that such asset will be realized. In determining whether it is more-likely-than-not that we will realize such tax asset, ASC 740 requires that all negative and positive evidence be considered (with more weight given to evidence that is “objective and verifiable”) in making the determination.
We receive a tax deduction for certain stock option exercises during the period the options are exercised, generally for the excess of the fair market value of the stock over the exercise price of the options. This excess windfall tax deduction is recorded as a tax asset when it is a cash tax savings to us with a corresponding amount recorded as additional paid in capital. For each of the years ended December 31, 2007, 2008 and 2009, we had net operating losses available for carryforward. Consequently, we were not in a position requiring us to make cash payments for income taxes. The income tax benefit of the option exercises was $0.5 million, $0.4 million and $0.2 million for 2007, 2008 and 2009, respectively. These amounts are not recorded until we have cash taxes to pay and they are available for carryforward to future periods. At the time that we are required to pay cash taxes, the amount of the tax benefit will be recorded as a reduction of current taxes paid and an increase in additional paid in capital. The total aggregate value of deferred tax benefit not recorded as a deferred tax asset at December 31, 2009 is approximately $0.2 million.
On January 1, 2007, we adopted provisions of ASC 740 related to uncertainties related to income taxes. As a result of the implementation of these provisions, management assessed its various income tax positions and this assessment resulted in no adjustment to the tax asset or liability. The preparation of our various tax returns requires the use of estimates for federal and state income tax purposes. These estimates may be subjected to review by the respective taxing authorities. A revision, if any, to an estimate may result in an assessment of
77
Table of Contents
additional taxes, penalties and interest. At this time, a range in which our estimates may change is not quantifiable and a change, if any, is not expected to be material. We will account for interest and penalties relating to uncertain tax provisions in the current period income statement, as necessary. We have not recorded any adjustment to our financial statements as a result of this interpretation We have tax years 2006 through 2008 remaining subject to examination by various federal and state tax jurisdictions except for a limited number of state jurisdictions where 2005 remains open.
Interest and penalties relating to any income tax settlements are charged to penalty and interest expense. Such amounts are immaterial for years 2007 through 2009.
| 11. | SEGMENT INFORMATION |
ASC 280, “Segment Reporting” (“ASC 280”), requires that companies disclose segment data based on how management makes decisions about allocating resources to segments and measuring their performance. We revised our reportable business segments during the fourth quarter of 2009. The new operating segments are Seismic Services, Environmental and Other Services and Equipment Leasing. Financial results for the years ended December 31, 2008 and 2007 have been restated to reflect the change in operating segments. We revised our segments to align with changes in management’s resource allocation and performance assessment in making decisions regarding our operations. Our seismic drilling, surveying and permitting operations remain in the Seismic Services segment. Our saltwater transportation and disposal, solids removal and hauling and liquid mud services are now included within our Environmental and Other Services segment along with our boat tank and pit cleaning services. These changes reflect our current operating focus. All of their assets and operations are exclusively in North America. All remaining assets, primarily our corporate offices, warehouses and underlying real estate, also are located in North America. The segment classified as Corporate includes operating activities that support the executive offices, capital structure and costs of being a public registrant. These costs are not allocated to the operating segments when determining segment profit or loss.
The following table shows segment information (net of intercompany transactions) as adjusted for discontinued operations for the years ended December 31, 2007, 2008 and 2009:
| SEISMIC SERVICES |
ENVIRONMENTAL AND OTHER SERVICES |
EQUIPMENT LEASING |
CORPORATE | TOTAL | ||||||||||||||
| (In thousands) | ||||||||||||||||||
| 2009 |
||||||||||||||||||
| Operating revenues |
$ | 37,577 | $ | 58,856 | $ | 25,993 | $ | — | $ | 122,426 | ||||||||
| Operating income (loss) |
5,653 | 4,638 | (1,228 | ) | (7,710 | ) | 1,353 | |||||||||||
| Interest expense |
74 | 348 | 346 | 2,917 | 3,685 | |||||||||||||
| Depreciation and amortization |
901 | 5,918 | 6,395 | 297 | 13,511 | |||||||||||||
| Identifiable assets |
14,652 | 42,868 | 56,093 | 13,661 | 127,274 | |||||||||||||
| Capital expenditures |
337 | 1,116 | 583 | 14 | 2,050 | |||||||||||||
| 2008 (Restated) |
||||||||||||||||||
| Operating revenues |
$ | 71,757 | $ | 77,802 | $ | 44,027 | $ | — | $ | 193,586 | ||||||||
| Operating income (loss) |
7,456 | 7,597 | (7,461 | ) | (11,622 | ) | (4,030 | ) | ||||||||||
| Interest expense |
126 | 448 | 1,189 | 5,063 | 6,826 | |||||||||||||
| Depreciation and amortization |
1,886 | 5,395 | 5,596 | 436 | 13,313 | |||||||||||||
| Identifiable assets |
24,729 | 54,675 | 70,114 | 14,004 | 163,522 | |||||||||||||
| Capital expenditures(1) |
314 | 4,633 | 7,165 | 137 | 12,249 | |||||||||||||
| 2007 (Restated) |
||||||||||||||||||
| Operating revenues |
$ | 81,021 | $ | 59,674 | $ | 31,784 | $ | — | $ | 172,479 | ||||||||
| Operating income (loss) |
19,380 | 11,010 | 6,792 | (13,660 | ) | 23,522 | ||||||||||||
| Interest expense |
153 | 247 | 911 | 5,625 | 6,936 | |||||||||||||
| Depreciation and amortization |
2,422 | 3,474 | 4,469 | 396 | 10,761 | |||||||||||||
| Identifiable assets |
33,191 | 42,571 | 57,870 | 31,362 | 164,994 | |||||||||||||
| Capital expenditures(1) |
151 | 3,163 | 9,401 | 1,133 | 13,848 | |||||||||||||
| (1) | Excludes assets obtained in acquisitions (See Note 12). |
78
Table of Contents
| 12. | ACQUISITIONS |
CHARLES HOLSTON, INC.
On March 2, 2007, we acquired Holston pursuant to a Membership Interest Purchase and Sale Agreement (the “Holston Purchase Agreement”). Subject to the terms and conditions of the Holston Purchase Agreement, we purchased 100% of the membership interests and equity interests of Holston for the total consideration of approximately $23.0 million, including $18.0 million in cash, $5.0 million in 5% promissory notes payable to certain owners and the assumption of approximately $3.4 million in debt and other liabilities. The Holston Notes consist of three separate notes with $1.0 million maturing in February 2008, $2.0 million maturing in February 2009 and $2.0 million maturing in February 2010 (see Note 4). The Holston Notes maturing in 2009 and 2010 are convertible into shares of our common stock at $9.24 per share. The acquisition was accounted for using purchase accounting. Holston provides a full range of environmental services including transportation of non-hazardous oilfield byproducts, such as salt water and spent drilling fluids; naturally occurring radioactive material (“NORM”) surveys, cleaning and waste disposal; tank degreasing and demolition; rig pit cleaning; oilfield waste disposal; hydro blasting; dockside and offshore cleaning; and offshore sandblasting and painting. Holston also operates salt water disposal wells. The addition of Holston expanded our Environmental Services operations into the transportation and disposal of non-hazardous oilfield byproducts, and is an extension of that business unit. Holston also offers a wide variety of rental equipment including frac tanks, gas busters, generators, lighting systems and roll-off containers, which complements the equipment currently offered by our oilfield rental equipment units, Preheat and Rig Tools. The results of Holston’s operations are included in our consolidated financial statements since the effective date of the acquisition.
The following table summarizes the estimated fair values of the assets acquired and liabilities assumed at the date of acquisition. The property and equipment are amortized over three to ten years with no residual value. The allocation of the purchase price is as follows (in thousands):
| Current assets (includes cash of $2,676) |
$ | 9,158 | ||
| Property and equipment |
13,362 | |||
| Other assets, including intangibles |
11,621 | |||
| Deferred income tax liability |
(4,431 | ) | ||
| Current liabilities |
(3,284 | ) | ||
| Assumption of debt |
(3,426 | ) | ||
| Purchase price |
$ | 23,000 | ||
In 2008, we determined that $5.5 million of the intangibles associated with the Holston acquisition have been impaired; therefore, we recorded an impairment charge of $5.5 million representing the unamortized balance as of December 31, 2008.
CYPRESS ENERGY SERVICES
Effective February 16, 2007, we acquired certain assets of Cypress for an aggregate acquisition price of $10.1 million, including $7.1 million in cash and $3.0 million in a 5% promissory note payable to a certain stockholder. The Cypress Note is payable over three years with $1.0 million maturing in February 2008, $1.0 million maturing in February 2009, and $1.0 million maturing in February 2010 (see Note 4). The acquisition was accounted for using purchase accounting. The acquisition of the seismic drilling assets of Cypress substantially improved our market position as a leading provider of domestic highland seismic drilling services. We have previously been recognized as the leading domestic provider of seismic drilling services in the transition zone. The acquisition of these assets of Cypress further strengthened the permitting and survey services offered to our customers. The results of Cypress’ operations are included in our consolidated financial statements since the date of the acquisition.
79
Table of Contents
The following table summarizes the estimated fair values of the assets acquired at the date of this acquisition. The property and equipment are amortized over three to ten years with no residual value. The allocation of the purchase price is as follows (in thousands):
| Property and equipment |
$ | 4,255 | |
| Other assets, including intangibles |
5,795 | ||
| Purchase price |
$ | 10,050 | |
In 2008, we determined that $6.2 million of the intangibles associated with the Cypress acquisition have been impaired; therefore, we recorded an impairment charge of $5.1 million representing the unamortized balance as of December 31, 2008.
BAILEY OPERATING, INC.
Effective June 7, 2007, we acquired certain assets of BOI for an aggregate acquisition price of $1.8 million, including $1.3 million in cash and $0.5 million in a 5% promissory note payable to BOI (see Note 4). The Bailey Note is payable on or before May 31, 2010. The acquisition was accounted for using purchase accounting. The acquisition of the assets of BOI geographically extended our core businesses into the Barnett Shale region in North Texas, currently one of the most prolific onshore regions in the United States for oil and gas exploration. Through the acquisition, we acquired a facility for the disposal of non-hazardous oilfield waste by-products and established a platform for further geographic expansion of our core businesses. Follow-on expansion will occur through a combination of increased asset utilization, planned capital expenditures and other strategic transactions currently under consideration. The results of BOI’s operations are included in our consolidated financial statements since the date of the acquisition.
The following table summarizes the estimated fair values of the assets acquired at the date of this acquisition. The property and equipment are amortized over three to ten years with no residual value. The allocation of the purchase price is as follows (in thousands):
| Property and equipment |
$ | 1,799 | |
| Purchase price |
$ | 1,799 | |
BEG
On January 18, 2008, we completed the acquisition of BEG pursuant to an Asset Purchase Agreement (the “BEG Purchase Agreement”). Subject to the terms and conditions of the BEG Purchase Agreement, we purchased certain assets from BEG for the total consideration of approximately $11.95 million, including $7.45 million of cash, a payable of $0.5 million held in escrow pending final reconciliation of purchase matters and the issuance of $4.0 million of three-year, 5% convertible promissory notes (see Note 4). The acquisition of BEG allows us to offer a drilling support package including the supply of drilling fluids, chemicals, storage, mixing and fluid pumping services as well as fluid trucking, recycling, tank cleaning and disposal services. BEG also operates drilling fluid distribution facilities.
The following table summarizes the estimated fair values of the assets acquired at the date of this acquisition. The property and equipment are amortized over three to ten years with no residual value. The allocation of the purchase price is as follows (in thousands):
| Current assets (includes cash of $341) |
$ | 2,502 | ||
| Property and equipment |
4,553 | |||
| Other assets, including intangibles |
5,391 | |||
| Current liabilities |
(496 | ) | ||
| Purchase price |
$ | 11,950 | ||
80
Table of Contents
INDUSTRIAL LIFT
On April 24, 2008, pursuant to a Stock Purchase and Sale Agreement we completed the acquisition of 100% of the issued and outstanding shares of common stock of Industrial Lift for an aggregate acquisition price of $20.3 million, including $16.3 million of cash and the issuance of $4.0 million of three-year, 5% promissory notes, of which $3.5 million of such notes are convertible (see Note 4). The acquisition of Industrial Lift allows us to further expand the line of products that we provide for lease into specialized lifting units such as industrial forklifts and manlifts.
The following table summarizes the estimated fair values of the assets acquired and liabilities assumed at the date of this acquisition. The property and equipment are amortized over three to ten years with no residual value. The allocation of the purchase price is as follows (in thousands):
| Current assets (includes cash of $2,523) |
$ | 5,728 | ||
| Property and equipment |
16,561 | |||
| Other assets, including intangibles |
5,404 | |||
| Deferred income tax liability |
(3,732 | ) | ||
| Current liabilities |
(2,874 | ) | ||
| Assumption of debt |
(837 | ) | ||
| Purchase price |
$ | 20,250 | ||
In 2008, we determined that $5.4 million of the intangibles associated with the Industrial Lift acquisition have been impaired; therefore, we recorded an impairment charge of $5.3 million representing the unamortized balance as of December 31, 2008.
The results of BOI prior to acquisition are considered immaterial and are therefore not included below. The operating results of the other acquired companies have been included in the consolidated financial statements from the dates of acquisitions. The following table provides the unaudited pro forma revenue, net earnings and earnings per diluted common share as if the results of the 2008 and 2007 acquisitions had been included in operations commencing January 1, 2007. This pro forma information is not necessarily indicative either of the combined results of operations that actually would have been realized had the acquisitions been consummated during the periods for which the pro forma information is presented, or of future results.
UNAUDITED PRO FORMA RESULTS OF OPERATIONS
| YEAR ENDED DECEMBER 31, | |||||||||||
| 2007 | 2008 | 2009 | |||||||||
| (In thousands, except per share data) | |||||||||||
| INCOME STATEMENT DATA |
|||||||||||
| Operating revenue |
$ | 207,231 | $ | 199,309 | $ | 122,426 | |||||
| Operating expenses |
175,648 | 175,994 | 118,467 | ||||||||
| Net income (loss) available to common stockholders |
$ | 12,920 | $ | (13,206 | ) | $ | (3,395 | ) | |||
| Basic income (loss) per common share: |
|||||||||||
| Net Income (loss) available to common stockholders |
$ | 0.71 | $ | (0.67 | ) | $ | (0.16 | ) | |||
| Diluted income (loss) per common share: |
|||||||||||
| Net income (loss) available to common stockholders |
$ | 0.52 | $ | (0.67 | ) | $ | (0.16 | ) | |||
81
Table of Contents
| 13. | SUMMARIZED QUARTERLY FINANCIAL INFORMATION (UNAUDITED) |
| QUARTER ENDED | ||||||||||||||||
| MARCH 31, | JUNE 30, | SEPTEMBER 30, | DECEMBER 31, | |||||||||||||
| (In thousands except per share data) | ||||||||||||||||
| 2009 |
||||||||||||||||
| Operating revenues |
$ | 34,904 | $ | 32,601 | $ | 28,359 | $ | 26,562 | ||||||||
| Operating expenses |
32,156 | 31,396 | 28,461 | 26,454 | ||||||||||||
| Impairment of goodwill and intangibles |
— | — | — | 2,369 | ||||||||||||
| Impairment of fixed assets |
— | 73 | 164 | — | ||||||||||||
| Operating income (loss) |
2,748 | 1,132 | (266 | ) | (2.261 | ) | ||||||||||
| Other expense |
(1,034 | ) | (691 | ) | (673 | ) | (1,273 | ) | ||||||||
| Income (loss) before income taxes |
1,714 | 441 | (939 | ) | (3,534 | ) | ||||||||||
| Income tax (expense) benefit |
(784 | ) | (205 | ) | 94 | 304 | ||||||||||
| Net income (loss) |
930 | 236 | (845 | ) | (3,230 | ) | ||||||||||
| Dividends and accretion of preferred stock |
(120 | ) | (121 | ) | (122 | ) | (123 | ) | ||||||||
| Net income (loss) available to common stockholders |
$ | 810 | $ | 115 | $ | (967 | ) | $ | (3,353 | ) | ||||||
| Basic income per common share: |
||||||||||||||||
| Net income (loss) available to common stockholders |
$ | 0.04 | $ | 0.01 | $ | (0.05 | ) | $ | (0.16 | ) | ||||||
| Diluted income per common share: |
||||||||||||||||
| Net income (loss) available to common stockholders |
$ | 0.04 | $ | 0.01 | $ | (0.05 | ) | $ | (0.16 | ) | ||||||
| 2008 |
||||||||||||||||
| Operating revenues |
$ | 40,961 | $ | 48,920 | $ | 53,284 | $ | 50,421 | ||||||||
| Operating expenses |
40,983 | 42,824 | 45,165 | 43,179 | ||||||||||||
| Impairment of goodwill and intangibles |
— | — | — | 25,047 | ||||||||||||
| Impairment of fixed assets |
— | — | — | 417 | ||||||||||||
| Operating income (loss) |
(22 | ) | 6,096 | 8,119 | (18,222 | ) | ||||||||||
| Other expense |
(1,944 | ) | (1,676 | ) | (1,438 | ) | (1,400 | ) | ||||||||
| Income (loss) before income taxes |
(1,966 | ) | 4,420 | 6,681 | (19,622 | ) | ||||||||||
| Income tax (expense) benefit |
562 | (1,678 | ) | (2,572 | ) | 535 | ||||||||||
| Net income (loss) |
(1,404 | ) | 2,742 | 4,109 | (19,087 | ) | ||||||||||
| Dividends and accretion of preferred stock |
(123 | ) | (121 | ) | (123 | ) | (122 | ) | ||||||||
| Net income (loss) available to common stockholders |
$ | (1,527 | ) | $ | 2,621 | $ | 3,986 | $ | (19,209 | ) | ||||||
| Basic income per common share: |
||||||||||||||||
| Net income (loss) available to common stockholders |
$ | (0.08 | ) | $ | 0.14 | $ | 0.20 | $ | (0.93 | ) | ||||||
| Diluted income per common share: |
||||||||||||||||
| Net income (loss) available to common stockholders |
$ | (0.08 | ) | $ | 0.10 | $ | 0.15 | $ | (0.93 | ) | ||||||
The decrease in operating results for the fourth quarter of 2008 is primarily due to the impairment charge in the amount of $25.0 million taken with respect to goodwill and intangible assets. The fourth quarter of the year is generally lower in revenue volume due to weather conditions and shorter daylight hours. Additionally, the reduction in the global demand for oil and gas products adversely affected our operations at the end of the fourth quarter.
82
Table of Contents
Operating results for 2009 decreased from 2008 primarily due to the continued decline in the global demand for oil and gas products through 2009. This decrease in demand led to a large decrease in the number of oil and gas rigs operating in the United States and the waters of the Gulf of Mexico.
The sum of the individual quarterly basic and diluted earnings per share amounts may not agree with year-to-date basic and diluted earnings per share amounts as the result of each period’s computation being based on the weighted average number of common shares outstanding during that period.
| 14. | SUBSEQUENT EVENTS |
As described in Note 4, subsequent to December 31, 2009, certain of our subordinated notes payable were modified resulting in adjustment to the maturity dates and payment schedules of the notes. As an incentive to modify the notes, the Company issued an aggregate of 330,943 unregistered, restricted shares of our common stock in amounts dependent upon the balances modified. The restrictions on the shares will lapse at various times prior to the maturity of the notes and we may, at our option, pay the note balances prior to the new maturity dates. If payment of the notes is made prior to the lapse of the periodic restriction on the stock, the remaining restricted shares will be forfeited to us and cancelled. The allocation between current and long-term debt was adjusted in the 2009 financial statements to reflect this modification.
83
Table of Contents
| ITEM 9. | CHANGES IN AND DISAGREEMENTS WITH ACCOUNTANTS ON ACCOUNTING AND FINANCIAL DISCLOSURE |
NONE.
| ITEM 9A. | CONTROLS AND PROCEDURES |
Disclosure Controls and Procedures.
We maintain disclosure controls and procedures that are designed to provide reasonable assurance that information required to be disclosed by us in the reports that we file or submit to the SEC under the Securities Exchange Act of 1934, as amended (the “Exchange Act”), is recorded, processed, summarized and reported within the time periods specified by the SEC’s rules and forms. Our disclosure controls and procedures are designed to ensure that information required to be disclosed in the reports we file or submit under the Exchange Act is accumulated and communicated to management, including our Chief Executive Officer (“CEO”) and Chief Financial Officer (“CFO”), as appropriate, to allow timely decisions regarding required disclosure.
In accordance with Exchange Act Rules 13a-15 and 15d-15, we carried out an evaluation, under the supervision and with the participation of management, including our CEO and CFO, of the effectiveness of our disclosure controls and procedures (as defined in Exchange Act Rule 13a-15(e)) as of the end of the period covered by this report. Based upon that evaluation, our CEO and CFO have concluded that our disclosure controls and procedures were not effective as of December 31, 2009. To address the material weakness described below, we performed additional review and analysis and other post-closing procedures to ensure that our income tax provision and related tax disclosures were prepared in accordance with accounting principles generally accepted in the United States of America (US GAAP). Based on the additional procedures performed, management has concluded that the consolidated financial statements included in this Annual Report on Form 10-K fairly present, in all material respects, our financial condition, result of operations and cash flows for the periods presented in conformity with US GAAP.
Management’s Annual Report on Internal Control over Financial Reporting.
Management of the Company is responsible for establishing and maintaining adequate internal control over financial reporting as defined in Rules 13a-15(f) and 15d-15(f) under the Exchange Act. The Company’s internal control over financial reporting is designed to provide reasonable assurance regarding the reliability of financial reporting and the preparation of financial statements for external purposes in accordance with generally accepted accounting principles. The Company’s internal control over financial reporting includes those policies and procedures that:
| i. | pertain to the maintenance of records that, in reasonable detail, accurately and fairly reflect the transactions and dispositions of the assets of the Company; |
| ii. | provide reasonable assurance that transactions are recorded as necessary to permit preparation of financial statements in accordance with generally accepted accounting principles, and that receipts and expenditures of the Company are being made only in accordance with authorizations of management and directors of the Company; and |
| iii. | provide reasonable assurance regarding prevention or timely detection of unauthorized acquisition, use, or disposition of the Company’s assets that could have a material effect on the financial statements. |
Because of the inherent limitations, internal control over financial reporting may not prevent or detect misstatements. Also, projections of any evaluation of effectiveness to future periods are subject to the risk that controls may become inadequate because of changes in conditions, or that the degree of compliance with the policies or procedures may deteriorate.
Management assessed the effectiveness of the Company’s internal control over financial reporting as of December 31, 2009. In making this assessment, management used the criteria set forth by the Committee of
84
Table of Contents
Sponsoring Organizations of the Treadway Commission in Internal Control-Integrated Framework. Based on this assessment and those criteria, and as described below, our management concluded that the Company did not maintain effective internal control over financial reporting as of December 31, 2009 as a result of a material weakness in accounting for income taxes.
A material weakness is a deficiency, or combination of deficiencies, that results in a reasonable possibility that a material misstatement of a company’s annual or interim financial statements will not be prevented or detected on a timely basis. As of December 31, 2009, management identified the following material weakness in its assessment of the effectiveness of our internal control over financial reporting:
We did not maintain effective controls over our accounting for income taxes. Specifically, we did not maintain effective controls over (i) the review of federal tax filings, (ii) the preparation of information supporting the recognition and measurement of income tax positions and (iii) the completeness and accuracy of our year-end federal and state tax provision calculations and related deferred income tax calculations in accordance with US GAAP.
This control deficiency resulted in various audit adjustments to the consolidated financial statements in the fourth quarter of 2009. Additionally, this control deficiency, if not corrected, could result in a material misstatement of the income tax accounts that would result in a material misstatement in our annual or interim consolidated financial statements that would not be prevented or detected on a timely basis. Therefore, we have concluded that this control deficiency constitutes a material weakness.
Notwithstanding our assessment that our internal controls over financial reporting were not effective and that there was a material weakness as identified in this report, we believe that our financial statements contained in this report on Form 10-K for the year ended December 31, 2009 accurately present our financial condition, results of operations and cash flows in all material respects.
This Annual Report does not include an attestation report of our independent registered public accounting firm regarding internal control over financial reporting. Management’s report was not subject to attestation by our registered public accounting firm pursuant to temporary rules of the SEC that permit us to provide only management’s report in this Annual Report.
Management’s Remediation Initiatives
In order to remediate the material weakness described above, we will implement the following remediation steps to enhance our internal controls over financial reporting related to income taxes.
| • | We will review and document in detail the review of the federal tax return filing, including all forms and schedules; |
| • | We will document our consideration of the recognition and measurement of income tax positions on a quarterly basis, updating our analysis throughout the year, and |
| • | We will review and document in detail the review of our year end federal and state tax provision calculations and related deferred income tax calculations. |
Changes in Internal Control Over Financial Reporting.
There have not been any changes in the Company’s internal control over financial reporting during the fiscal quarter ended December 31, 2009 that have materially affected, or are reasonably likely to materially affect, the Company’s internal control over financial reporting.
| ITEM 9B. | OTHER INFORMATION |
NONE.
85
Table of Contents
In accordance with paragraph (3) of General Instruction G to Form 10-K, Part III of this Report is omitted because we will file a definitive proxy statement involving the election of directors with the Securities and Exchange Commission not later than 120 days after the close of the fiscal year pursuant to Regulation 14A.
Reference is made to the sections of such proxy statement entitled “ Information About the Company’s Directors”, “Board Committees,” “Director Independence,” “Executive Officers and Key Managers,” “Compensation,” “Principal Stockholders,” “Certain Relationships and Related Transactions” and “Principal Accountant Fees and Services,” which sections of such proxy statement are incorporated herein.
| ITEM 15. | EXHIBITS AND FINANCIAL STATEMENT SCHEDULES |
(a) The following financial statements, schedules and exhibits are filed as part of this Report:
| (1) | Financial Statements. Reference is made to Item 8 hereof. |
| (2) | Financial Statement Schedules: None. |
| (3) | Exhibits. See Index to Exhibits. We will furnish to any eligible shareholder, upon written request of such shareholder, a copy of any exhibit listed upon the payment of a reasonable fee equal to our expenses in furnishing such exhibit. |
86
Table of Contents
Pursuant to the requirements of Section 13 or 15(d) of the Securities Exchange Act of 1934, the Registrant has duly caused this Report to be signed on our behalf by the undersigned, thereunto duly authorized.
| OMNI ENERGY SERVICES CORP. (REGISTRANT) | ||
| By: |
/s/ BRIAN J. RECATTO | |
| Brian J. Recatto President and Chief Executive Officer (Principal Executive Officer) | ||
| Date: March 31, 2010 | ||
Pursuant to the requirements of the Securities Exchange Act of 1934, this Report has been signed below by the following persons on behalf of the Registrant and in the capacities and on the dates indicated.
| SIGNATURE |
TITLE |
DATE | ||
| /s/ BRIAN J. RECATTO Brian J. Recatto |
President, Chief Executive Officer (Principal Executive Officer) |
March 31, 2010 | ||
| /s/ RONALD D. MOGEL Ronald D. Mogel |
Senior Vice President and Chief Financial Officer (Principal Financial Officer) |
March 31, 2010 | ||
| /s/ GREGORY B. MILTON Gregory B. Milton |
Vice President and Chief Accounting Officer |
March 31, 2010 | ||
| /s/ DENNIS R. SCIOTTO Dennis R. Sciotto |
Chairman of the Board, Director |
March 31, 2010 | ||
| /s/ EDWARD E. COLSON, III Edward E. Colson III |
Director |
March 31, 2010 | ||
| /s/ RONALD E. GEREVAS Ronald E. Gerevas |
Director |
March 31, 2010 | ||
| /s/ BARRY E. KAUFMAN Barry E. Kaufman |
Director |
March 31, 2010 | ||
| /s/ RICHARD C. WHITE Richard C. White |
Director |
March 31, 2010 | ||
87
Table of Contents
EXHIBIT INDEX
| EXHIBIT NUMBER |
||
| 2.1 | Stock Purchase and Sale Agreement dated December 29, 2005, by and between OMNI Energy Services Corp. and the stockholders of Preheat, Inc., a Louisiana corporation (incorporated by reference to Exhibit 10.1 to our Current Report on Form 8-K originally filed with the Commission on January 5, 2006). | |
| 2.2 | Membership Interest Purchase and Sale Agreement dated January 16, 2007 by and between OMNI Energy Services Corp., BMJ Industrial Investments, L.L.C., a Texas limited liability company, Charles Holston, Inc., a Louisiana corporation, and Brian J. Recatto, Lawrence J. Shaw, III, and Matthew E. Miller (incorporated by reference to Exhibit 10.1 to our Current Report on Form 8-K originally filed with the Commission on January 22, 2007). | |
| 2.3 | Asset Purchase Agreement dated January 24, 2007 by and between OMNI Energy Services Corp. and Cypress Consulting Services, Inc., d/b/a Cypress Energy Services, a Texas corporation and Dennis Gray (incorporated by reference to Exhibit 10.1 to our Current Report on Form 8-K originally filed with the Commission on January 30, 2007). | |
| 2.4 | Asset Purchase Agreement dated January 18, 2008 by and between OMNI Energy Services Corp. and B.E.G. Liquid Mud Services Corp., a Texas limited liability company, B.E.G. Acquisition Corp., a Texas corporation, Dan S. Keen, Mike Schooler and Kurt Chew (incorporated by reference to Exhibit 2.1 to our Current Report on Form 8-K originally filed with the Commission on January 25, 2008). | |
| 3.1 | Composite Articles of Incorporation of OMNI Energy Services Corp. (as of November 7, 2000) (filed as Exhibit 3 to our Annual Report on Form 10-K for the fiscal year ended December 31, 2000 and incorporated by reference herein). | |
| 3.2 | Form of Articles of Amendment—Articles of Incorporation (filed as Exhibit 3.2 to our Annual Report on Form 10-K for the fiscal year ended December 31, 2001 and incorporated by reference herein). | |
| 3.3 | Form of Articles of Amendment—Articles of Incorporation (incorporated by reference to Exhibit 3.1 to our Current Report on Form 8-K originally filed with the Commission on May 24, 2005). | |
| 3.4 | Bylaws of OMNI, as amended (incorporated by reference to Exhibit 3.1 to our Current Report on Form 8-K originally filed with the Commission on December 12, 2007). | |
| 4.1 | See Exhibit 3.1, 3.2, 3.3 and 3.4 for provisions of our Articles of Incorporation and By-laws defining the rights of holders of Common Stock. | |
| 4.2 | Specimen Common Stock Certificate (incorporated by reference to our Registration Statement on Form S-1 (Registration Statement No. 333-36561)). | |
| 4.3 | Form of Series A Warrant (incorporated by reference to Exhibit 4.1 to our Current Report on Form 8-K originally filed with the Commission on May 24, 2005). | |
| 4.4 | Form of Series B Warrant (incorporated by reference to Exhibit 4.2 to our Current Report on Form 8-K originally filed with the Commission on May 24, 2005). | |
| 4.5 | Form of Series C Warrant (incorporated by reference to Exhibit 4.2 to our Current Report on Form 8-K originally filed with the Commission on May 24, 2005). | |
88
Table of Contents
| EXHIBIT NUMBER |
||
| 4.6 | Registration Rights Agreement, dated May 17, 2005, by and between OMNI Energy Services Corp. and certain investors identified therein (incorporated by reference to Exhibit 4.3 to our Current Report on Form 8-K originally filed with the Commission on May 24, 2005). | |
| 4.7 | Amendment No. 1 to Registration Rights Agreement, dated July 16, 2005, by and between OMNI Energy Services Corp. and certain investors identified therein (incorporated by reference to Exhibit 4.7 to our Registration Statement on Form S-1, as amended, (Registration Statement No. 333-129138)). | |
| *10.1 | Form of Indemnity Agreement by and between us and each of our directors and executive officers (incorporated by reference to our Registration Statement on Form S-1 (Registration Statement No. 333-36561)). | |
| *10.2 | Eighth Amended And Restated OMNI Energy Services Corp. Stock Incentive Plan (incorporated by reference to our Exhibit 10.1 to our Current Report on Form 8-K originally filed with the Commission on June 2, 2009). | |
| *10.3 | Form of Stock Option Agreements under our Stock Incentive Plan (incorporated by reference to our Registration Statement on Form S-1 (Registration Statement No. 333-36561)). | |
| *10.4 | Employment Agreement effective September 23, 2006 by and between OMNI Energy Services Corp. and John Harris (incorporated by reference to Exhibit 10.1 to our Current Report on Form 8-K originally filed with the Commission on September 29, 2006). | |
| *10.5 | Restricted Stock Agreement between OMNI Energy Services Corp. and James C. Eckert effective as of January 1, 2008 (incorporated by reference to Exhibit 10.3 to our Current Report on Form 8-K originally filed with the Commission on January 7, 2008). | |
| *10.6 | Employment Agreement effective January 2, 2008 by and between OMNI Energy Services Corp. and Ronald Mogel (incorporated by reference to Exhibit 10.16 to our Annual Report on Form 10-K for the year ended December 31, 2007). | |
| 10.7 | Loan and Security Agreement, dated as of April 23, 2008, by and among Fifth Third Bank, the lenders identified therein, OMNI, the subsidiaries of OMNI identified therein and the other Credit Parties identified therein (incorporated by reference to Exhibit 10.1 to our Current Report on Form 8-K originally filed with the Commission on April 30, 2008). | |
| *10.8 | Employment Agreement between OMNI Energy Services Corp. and Brian J. Recatto dated December 1, 2008 (incorporated by reference to Exhibit 10.1 to our Current Report on Form 8-K originally filed with the Commission on December 17, 2008). | |
| *10.9 | Employment Agreement between OMNI Energy Services Corp. and Gregory B. Milton dated May 1, 2008 (incorporated by reference to Exhibit 10.1 to our Current Report on Form 8-K originally filed with the Commission on March 3, 2009). | |
| *10.10 | Employment Agreement between OMNI Energy Services Corp. and Mark E. Stipe dated October 1, 2008 (incorporated by reference to Exhibit 10.14 to our Annual Report on Form 10-K for the fiscal year ended December 31, 2008). | |
| *10.11 | Restricted Stock Agreement between OMNI Energy Services Corp. and Brian J. Recatto dated February 3, 2009 (incorporated by reference to Exhibit 10.15 to our Annual Report on Form 10-K for the fiscal year ended December 31, 2008). | |
89
Table of Contents
| EXHIBIT NUMBER |
||
| *10.12 | Fourth Amendment and Waiver to Loan Agreement, dated November 13, 2009, by and among Fifth Third Bank, the lenders identified therein, OMNI Energy Services Corp., The subsidiaries of OMNI identified therein and the other Credit Parties identified therein (incorporated by reference to Exhibit 10.1 to our Current Report on Form 8-K originally filed with the Commission on November 16, 2009). | |
| *10.13 | Restricted Stock Agreement between OMNI Energy Services Corp. and Brian J. Recatto dated January 5, 2010 (incorporated by reference to Exhibit 10.1 to our Current Report on Form 8-K originally filed with the Commission on January 15, 2010). | |
| *10.14 | Restricted Stock Agreement between OMNI Energy Services Corp. and Ronald D. Mogel dated January 5, 2010 (incorporated by reference to Exhibit 10.2 to our Current Report on Form 8-K originally filed with the Commission on January 15, 2010). | |
| *10.15 | Restricted Stock Agreement between OMNI Energy Services Corp. and John A. Harris dated January 5, 2010 (incorporated by reference to Exhibit 10.3 to our Current Report on Form 8-K originally filed with the Commission on January 15, 2010). | |
| *10.16 | Restricted Stock Agreement between OMNI Energy Services Corp. and Lawrence J. Shaw dated January 5, 2010 (incorporated by reference to Exhibit 10.4 to our Current Report on Form 8-K originally filed with the Commission on January 15, 2010). | |
| *10.17 | Stock Incentive Plan between OMNI Energy Services Corp. and Brian J. Recatto effective as of January 1, 2010 (incorporated by reference to Exhibit 10.1 to our Current Report on Form 8-K originally filed with the Commission on February 3, 2010). | |
| *10.18 | Stock Option Agreement for the Grant of Non-Qualified Stock Options Under the Eighth Amended and Restated OMNI Energy Services Corp. Stock Incentive Plan between OMNI Energy Services Corp. and Ronald D. Mogel effective as of January 1, 2010 (incorporated by reference to Exhibit 10.1 to our Current Report on Form 8-K originally filed with the Commission on February 12, 2010). | |
| *10.19 | Stock Option Agreement for the Grant of Non-Qualified Stock Options Under the Eighth Amended and Restated OMNI Energy Services Corp. Stock Incentive Plan between OMNI Energy Services Corp. and John A. Harris effective as of January 1, 2010 (incorporated by reference to Exhibit 10.2 to our Current Report on Form 8-K originally filed with the Commission on February 12, 2010). | |
| *10.20 | Stock Option Agreement for the Grant of Non-Qualified Stock Options Under the Eighth Amended and Restated OMNI Energy Services Corp. Stock Incentive Plan between OMNI Energy Services Corp. and Lawrence J. Shaw effective as of January 1, 2010 (incorporated by reference to Exhibit 10.3 to our Current Report on Form 8-K originally filed with the Commission on February 12, 2010). | |
| 21.1 | Subsidiaries of OMNI Energy Services Corp. | |
| 23.1 | Consent of Pannell Kerr Forster of Texas, P.C. | |
| 23.2 | Consent of Grant Thornton LLP | |
| 31.1 | Section 302 Certification of Chief Executive Officer | |
| 31.2 | Section 302 Certification of Chief Financial Officer | |
| 32.1 | Section 906 Certification of Chief Executive Officer | |
| 32.2 | Section 906 Certification of Chief Financial Officer | |
| * | Management contract or compensation plan or arrangement |
90