Attached files
UNITED STATES
SECURITIES AND EXCHANGE COMMISSION
Washington, D.C. 20549
FORM 10-K
ANNUAL REPORT PURSUANT TO SECTION 13 OR 15(d) OF THE SECURITIES EXCHANGE ACT OF 1934
For the Fiscal Year Ended December 31, 2009
OR
TRANSITION REPORT PURSUANT TO SECTION 13 OR 15(d) OF THE SECURITIES EXCHANGE ACT OF 1934
For the transition period from _________________ to __________________
Commission File Number 000-15540
Frontier Financial Corporation
(Exact Name of registrant as specified in its charter)
Washington 91-1223535
(State of incorporation or organization) (IRS
Employer Identification Number)
332 S.W. Everett Mall Way
P. O. Box 2215
Everett, Washington 98213
(Address of Principal Executive Office) (Zip
Code)
Registrant’s telephone number, including area code: (425) 514-0700
Securities registered pursuant to Section 12(b) of the Act:
Title of each class Name
of each exchange on which registered
Common Stock (no par value) The
NASDAQ Stock Market LLC
Securities registered pursuant to Section 12(g) of the Act: None
Indicate by a check mark if the registrant is a well-known seasoned issuer, as defined in Rule 405 of the Securities Act.
Indicate by a check mark if the registrant is not required to file reports pursuant to Section 13 or Section 15(d) of the Act.
Yes [ ] No [X]
Indicate by check mark whether the registrant: (1) has filed all reports required to be filed by Section 13 or 15(d) of the Securities Exchange Act of 1934 during the preceding 12 months (or for such shorter period that the registrant was required to file such reports), and (2) has been subject to such filing requirements for the past 90
days. Yes [X] No [ ]
Indicate by check mark whether the registrant has submitted electronically and posted on its corporate Web site, if any, every Interactive Data File required to be submitted and posted pursuant to Rule 405 of Regulation S-T during the preceding 12 months (or for such shorter period that the registrant was required to submit and post such
files). Yes [ ] No [ ]
Indicate by check mark if disclosure of delinquent filers pursuant to Item 405 of Regulation S-K (§229.405 of this chapter) is not contained herein, and will not be contained, to the best of the registrant’s knowledge, in definitive proxy or information statements incorporated by reference in Part III of this Form 10-K or any
amendment to this Form 10-K. [ ]
Indicate by a check mark whether the registrant is a large accelerated filer, an accelerated filer, a nonaccelerated filer or a “small reporting company”. See definition of “large accelerated filer, accelerated filer and small reporting company” in Rule 12b-2 of the Exchange Act. (Check one):
| Large accelerated filer [ ] | Accelerated Filer [X] | Non-accelerated Filer [ ] | Small reporting company [ ] |
Indicate by a check mark whether the registrant is a shell company (as defined in Rule 12b-2 of the Exchange Act).
Yes [ ] No [X]
As of June 30, 2009, 4,713,185 shares of common stock were owned by non-affiliates, with an aggregate market value of $55,615,587 (based upon the closing market price of $11.80 per share, adjusted for a one-for-ten reverse stock split, effective November 24, 2009).
The number of shares of the Registrant’s common stock (no par value) outstanding as of March 19, 2010 was 4,725,076.
DOCUMENTS INCORPORATED BY REFERENCE
Portions of the Annual Report to Shareholders for the fiscal year ended December 31, 2009 – Parts I and II.
Portions of the Definitive Proxy Statement to be filed with the Securities and Exchange Commission, relating to the 2010 Annual Meeting of Shareholders – Part III.
FRONTIER FINANCIAL CORPORATION AND SUBSIDIARY
|
Page |
|||||
| 1 | |||||
|
Item 1. |
2 | ||||
|
Item 1A. |
15 | ||||
|
Item 1B. |
22 | ||||
|
Item 2. |
22 | ||||
|
Item 3. |
22 | ||||
|
Item 4. |
22 | ||||
| 23 | |||||
|
Item 5. |
|||||
| 23 | |||||
|
Item 6. |
25 | ||||
|
Item 7. |
|||||
| 26 | |||||
|
Item 7A. |
44 | ||||
|
Item 8. |
47 | ||||
|
Item 9. |
|||||
| 47 | |||||
|
Item 9A. |
47 | ||||
|
Item 9B. |
48 | ||||
| 48 | |||||
|
Item 10. |
48 | ||||
|
Item 11. |
48 | ||||
|
Item 12. |
|||||
| 48 | |||||
|
Item 13. |
48 | ||||
|
Item 14. |
49 | ||||
| 49 | |||||
|
Item 15. |
49 | ||||
| 50 | |||||
Forward-Looking Statements
This annual report on Form 10-K includes forward-looking statements, within the meaning of Section 27A of the Securities Act of 1933, as amended, and Section 21E of the Securities Exchange Act of 1934, as amended, and subject to the safe harbor created by the Private Securities Litigation Reform Act of 1995, that are subject to risks and
uncertainties that could cause actual results to differ materially from those projected. These statements may be identified by the use of forward-looking terminology such as “anticipate,” “believe,” “continue,” “could,” “estimate,” “expect,” “intend,” “may,” “might,” “plan,” “potential,” “predict,” “should” or “will” or the negative
thereof or other variations thereon or comparable terminology. We have based these forward-looking statements on our current expectations, assumptions, estimates and projections. While we believe these expectations, assumptions, estimates and projections are reasonable, such forward-looking statements are only predictions and involve known and unknown risks and uncertainties, many of which are beyond our control. These and other important factors, including those discussed below
under the headings “Business,” “Risk Factors” and “Management’s Discussion and Analysis of Financial Condition and Results of Operations” may cause our actual results, performance or achievements to differ materially from any future results, performance or achievements expressed or implied by these forward-looking statements. Some of the key factors that could cause actual results to differ from our expectations are:
|
· |
management’s ability to effectively execute its business plan and strategy; |
|
· |
the possibility that we will be unable to raise sufficient capital and comply with the conditions imposed upon us in regulatory actions against us, which could result in the imposition of further restrictions on our operations, penalties or other regulatory actions; |
|
· |
the credit risks of lending activities, including changes in the level and trend of loan delinquencies, collections and write-offs and changes in our allowance for loan losses and provision for loan losses that may be impacted by deterioration in the residential housing and commercial real estate markets; |
|
· |
changes in general economic conditions, either nationally or in our market areas; |
|
· |
the availability of and costs associated with sources of liquidity; |
|
· |
inflation, interest rates, market and monetary fluctuations; |
|
· |
legislative or regulatory changes or changes in accounting principles, policies or guidelines; |
|
· |
the costs and effects of legal and regulatory developments, including the resolution of legal proceedings or regulatory or other governmental inquiries and the results of regulatory examinations or reviews; |
|
· |
our ability to attract and retain deposits; |
|
· |
further increases in premiums for deposit insurance; |
|
· |
the use of estimates in determining fair value of certain of our assets, which estimates may prove to be incorrect and result in significant declines in valuation; |
|
· |
the failure or security breach of computer systems on which we depend; |
|
· |
increased competitive pressures among financial services companies; |
|
· |
adverse changes in the securities markets; |
|
· |
technological changes; |
|
· |
the ability to increase market share and control expenses; |
|
· |
our success at managing the risks involved in the foregoing; and |
|
· |
other risks which may be described in Frontier’s future filings with the SEC under the Securities Exchange Act of 1934. |
Given these risks and uncertainties, you are cautioned not to place undue reliance on such forward-looking statements. The forward-looking statements included or incorporated by reference into this report are made only as of the date hereof. We do not undertake and specifically decline any obligation to update any
such statements or to publicly announce the results of any revisions to any such statements to reflect future events or developments. In addition, we may make certain statements in future Securities and Exchange Commission (“SEC”) filings, in press releases and in oral and written statements that are not statements of historical fact and may constitute forward-looking statements.
General
Frontier Financial Corporation (“FFC”, “Frontier”, “the Corporation”, “we”, “our” or “us”) is a Washington corporation which was incorporated in 1983 and is registered as a bank holding company under the Bank Holding Company Act of 1956. At December 31, 2009,
FFC had one subsidiary, Frontier Bank, which is engaged in a general banking business and in businesses related to banking.
The Bank
Frontier Bank (the “Bank”) is a Washington state chartered commercial bank with headquarters located in Everett, Snohomish County, Washington. The Bank was founded in September 1978, and is an “insured bank” as defined in the Federal Deposit Insurance Act.
We engage in general banking business in Washington and Oregon, including the acceptance of demand, savings and time deposits and the origination of loans. As of the end of 2009, we serve our customers from fifty offices. In Snohomish County, Washington, four offices are located in Everett, and one office each is located
in Arlington, Edmonds, Lake Stevens, Marysville, Mill Creek, Monroe, Lynnwood, Smokey Point, Snohomish and Stanwood. Seven offices are located in Pierce County, Washington, in the cities of Buckley, Edgewood-Milton, Orting, Puyallup, Sumner, Tacoma and University Place. Frontier has thirteen branches in King County, Washington, one each in Ballard (Seattle), Bellevue, Bothell, Duvall, Fremont (Seattle), Kent, Kirkland, Lake City (Seattle), Redmond, Renton, Seattle, Totem Lake (Kirkland)
and Woodinville. In addition, the following thirteen branches are located in the Washington Counties of Clallam, Jefferson, Kitsap, Skagit, Thurston and Whatcom: two branches in Bellingham, and one each in Bainbridge Island, Bremerton, Gig Harbor, Lacey, Lynden, Mount Vernon, Port Angeles, Port Townsend, Poulsbo, Sequim and Silverdale. In Oregon, we have one office each in Portland, Salem and Tigard.
Banking Services
We provide a full range of consumer banking services including savings accounts, checking accounts, installment and commercial lending, safe deposit facilities, time deposits and other consumer and business related financial services. In addition to consumer-oriented activities, we maintain a commercial lending program, servicing
individuals and businesses headquartered in our principal market areas.
Lending Activities
Historically, our focus has been on secured real estate construction lending, but we are currently in the process of diversifying our loan portfolio. Due to the downturn in the economy and the negative impact on the regional housing market, we are rebalancing our loan portfolio to include more commercial and industrial business
and consumer loans. Refer to page 4 for a summary of loan category amounts for the last five years.
Real Estate Loans
Real estate loans represented the largest share of our loan portfolio at December 31, 2009. These loans are comprised of commercial real estate term loans, construction loans, land development loans, completed lot loans and residential 1-4 family loans. As noted above, we are in the process of diversifying our loan
portfolio. For the most part, we are not currently originating real estate construction, land development or completed lot loans. The construction loan portfolio is comprised of two types:
|
1. |
Loans for construction of residential and commercial income-producing properties that generally have terms of less than two years and typically bear an interest rate that floats with our base rate. |
|
2. |
Loans for construction of single-family speculative and owner-occupied properties that generally have terms of one year or less and typically bear an interest rate that floats with our base rate. |
Our commercial real estate term loans finance the purchase and/or ownership of income producing properties. These loans generally mature in one to ten years with a payment amortization schedule ranging from 15 to 25 years. Interest rates may be fixed or variable. The interest rates on fixed rate loans
typically reprice between the first and fifth year.
Land development loans are used for either residential or commercial purposes. These loans generally have terms of one year or less and typically bear an interest rate that floats with our base rate.
Residential 1-4 family loans include various types of loans for which residential real property is held as collateral. These loans, collateralized by 1-4 family residences, typically have maturities between one and five years with payment amortization schedules ranging from 10 to 20 years. Residential 1-4 family loans
are written with both fixed and variable rates.
We also originate and sell residential 1-4 family loans into the secondary market. We offer a variety of products for refinancing and purchases and are approved to originate FHA and VA loans. The majority of loans originated in 2009 were fixed rate single-family loans. Total loans sold in 2009 were approximately
$140.4 million. Servicing is sold with the loan. Funding requirements for these loans are minimal as few of these loans are retained for investment.
Commercial and Industrial Loans
This category of loans includes both commercial and industrial loans used to provide working capital or for specific purposes, such as to finance the purchase of fixed assets, equipment or inventory. Commercial loans include lines of credit and term loans. Lines of credit are extended to businesses based on the
financial strength and integrity of the borrower, are generally collateralized by short-term assets such as accounts receivable and have a maturity of one year or less. Such lines of credit bear an interest rate that floats with our base rate or another established index. Commercial term loans are typically made to finance the acquisition of fixed assets, refinance short-term debt originally used to purchase fixed assets or, in rare cases, to finance a business purchase. Commercial
term loans generally mature within one to five years. They may be collateralized by the asset being acquired or other available assets. These term loans will generally bear interest that either floats with our base rate or another established index or is fixed for the term of the loan. Industrial loans generally consist of farm related credits used to finance operating expenses. These loans generally have terms of one year and bear interest that either floats with our
base rate or is fixed for the term of the loan. These loans are generally collateralized by farm related assets including land, equipment, crops or livestock.
Installment Loans
We provide loans for consumer use, including: auto loans, boat loans, home improvement loans, revolving lines of credit, VISA credit cards and other loans typically made by banks to individual borrowers. These loans generally have terms ranging from one to five years, with up to 20-year amortizations and are written with both
fixed and variable rates.
Concentrations of Credit
The following chart indicates the amount of loans, net of deferred fees, and as a percent of total loans, including loans held for resale, for the years ended December 31 (in thousands):
|
2009 |
2008 |
2007 |
2006 |
2005 |
||||||||||||||||
|
Real estate commercial loans |
$ | 965,266 | $ | 1,044,833 | $ | 1,003,916 | $ | 897,714 | $ | 859,251 | ||||||||||
|
Real estate construction loans |
$ | 447,879 | $ | 949,909 | $ | 1,062,662 | $ | 735,926 | $ | 554,021 | ||||||||||
|
Real estate land development loans |
$ | 319,320 | $ | 580,453 | $ | 537,410 | $ | 399,950 | $ | 269,662 | ||||||||||
|
Total loans at end of period (1) |
$ | 2,869,498 | $ | 3,778,733 | $ | 3,612,122 | $ | 2,908,000 | $ | 2,389,224 | ||||||||||
|
Real estate commercial loans |
||||||||||||||||||||
|
as a percent of total loans |
33.6 | % | 27.7 | % | 27.8 | % | 30.9 | % | 36.0 | % | ||||||||||
|
Real estate construction loans |
||||||||||||||||||||
|
as a percent of total loans |
15.6 | % | 25.1 | % | 29.4 | % | 25.3 | % | 23.2 | % | ||||||||||
|
Real estate land development loans |
||||||||||||||||||||
|
as a percent of total loans |
11.1 | % | 15.4 | % | 14.9 | % | 13.8 | % | 11.3 | % | ||||||||||
|
(1) Includes loans held for resale |
||||||||||||||||||||
Investment Activities
From time to time, we acquire investment securities when funds received through deposit activities exceed loan demand or when there are collateral requirements When excess funds are considered temporary in nature by management, they are typically placed in federal funds sold on an overnight basis to correspondent banks approved
by the Board of Directors. When funds are considered longer term, they are generally invested in securities purchased in the open market. At December 31, 2009, we had investments with an amortized cost totaling $87.0 million. Please see Note 3 of the Annual Report to Shareholders for details on the makeup of the portfolio. We have an investment policy that generally permits purchasing securities rated only in one of the four highest rating categories by a nationally
recognized credit rating organization. The investment policy also provides for maturity patterns, diversification of investments and avoidance of concentrations within the portfolio.
Deposit Activities and Other Funding Sources
Our primary source of funds has historically been customer deposits. We offer a variety of accounts designed to attract both short-term and long-term deposits in our market area. These accounts include demand (checking), NOW, money market, sweep, savings and certificates of deposit. Interest rates paid on
these accounts vary from time to time and are based on competitive factors and liquidity needs. One of our goals is to maintain noninterest bearing deposits at the highest level possible. These are low cost funds and help to increase the net interest margin. Noninterest bearing accounts comprised 12.1% of total deposits at December 31, 2009.
We intend to continue our efforts at attracting deposits from our business lending relationships in order to reduce our cost of funds and improve our net interest margin. We have also utilized brokered deposits and other wholesale funding from time to time, which are now restricted by the FDIC Directive and FDIC Order described in “Regulation
and Supervision” below. These regulatory actions require Frontier Bank to reduce its reliance on brokered deposits and other non-core funding sources.
We have other funding sources such as Federal Home Loan Bank (“FHLB”) advances, federal funds purchased and repurchase agreements. The major source of funds in this area is advances from the FHLB of Seattle. Our line of credit with the FHLB is approximately 10% of qualifying Bank assets and is collateralized
by qualifying first residential 1-4 family loans, qualifying commercial real estate and government agency securities. At December 31, 2009, we had FHLB advances totaling $375.5 million (please refer to Note 10 in the Annual Report to Shareholders for detail regarding these advances). These advances were collateralized with $678.8 million in qualifying first residential 1-4 family loans, commercial real estate loan, other certain assets and FHLB stock.
Other Financial Services
We offer other financial services complementary to banking, including an insurance and investment center that markets annuities, life insurance products and mutual funds to our customers and the general public, a trust department that offers a full array of trust services and a private banking department to provide personal service to high
net worth customers.
Business Strategies
Our current business strategies are as follows:
|
· |
Strengthening our capital position. |
|
· |
Proactively managing credit quality and loan collections and improving asset quality. |
|
· |
Diversifying our loan portfolio by emphasizing commercial and industrial lending through our existing branches. |
|
· |
Managing liquidity and improving our capital position in compliance with regulatory guidelines. |
|
· |
Continuing to seek out reasonable expense reduction measures. |
|
· |
Increasing core deposits to fund loan growth and maintaining net interest margins through an enhanced branch network and online banking. |
The Corporation and its subsidiary, Frontier Bank, are subject to regulatory actions with respect to their operations, including the FDIC Directive and FDIC Order described in “Regulation and Supervision” below. As a result of these regulatory actions, the significant operating losses incurred in 2009 and 2008 and our needs
to raise additional capital, there is substantial doubt about our ability to continue as a going concern. The report of the Corporation’s independent registered public accounting firm on our financial statements for the year ended December 31, 2009, contains an explanatory paragraph with respect to our ability to continue as a going concern. The 2009 financial statements do not include any adjustments that might result from the outcome of this uncertainty, which could affect our ability to continue as a
going concern.
Competition
The banking industry is highly competitive. We face strong competition in attracting deposits and in originating loans. The most direct competition for deposits has historically come from other commercial banks, saving institutions and credit unions located in our primary market areas. As with all banking organizations, we also have competition
from non-banking sources, including mutual funds, corporate and governmental debt securities and other investment alternatives. We expect increasing competition from other financial institutions and non-banking sources in the future. Many of our competitors have more significant financial resources, larger market share and greater name recognition than us. The existence of such competitors may make it difficult for us to achieve our financial goals.
Competition has further increased as a result of Washington banking laws that permit statewide branching of Washington domiciled financial institutions and acquisitions of Washington-based financial institutions by out-of-state bank holding companies. We believe that the principal competitive factors affecting our markets include
interest rates paid on deposits and charged on loans, the range of banking products available and customer service and support. Although we believe that our products currently compete favorably with respect to these factors, there can be no assurance that we can maintain our competitive position against current and potential competitors, especially those with significantly greater financial resources.
Our competition for loans comes principally from other commercial banks, savings institutions, credit unions and mortgage banking companies. We compete for loans principally through the efficiency, timeliness and quality of the services we provide borrowers and the interest rates and loan fees we charge.
We compete for deposits by offering depositors a wide variety of checking accounts, savings accounts, certificates and other services. Our ability to attract and retain deposits depends on our ability to provide deposit products that satisfy the requirements of customers as to interest rates, liquidity, transaction fees, risk of loss of
deposit, convenience and other factors. Deposit relationships are actively solicited through a branch sales and service system.
Changes in technology, mostly from the growing use of computers and computer-based technology, present competitive challenges. Large banking institutions typically have the ability to devote significantly more resources to developing and maintaining technology-based services such as on-line banking and other banking products and services
over the Internet, including deposit services and mortgage loans. Some new banking competitors offer all of these services online. Customers who bank by computer or by telephone may not need to go to a branch location in person. Our high service philosophy emphasizes face-to-face contact with tellers, loan officers and other employees. We believe a personal approach to banking is a competitive advantage, one that will remain popular in the communities that we serve. However, customer preferences may change, and
the rapid growth of online banking could, at some point, render our personal, branch-based approach less desirable. We believe we have reduced this risk by expanding our on-line banking services to our customers, and by continuing to provide 24-hour online banking services. There can be no assurance that these efforts will be successful in preventing the loss of customers to competitors.
Regulation and Supervision
Regulatory Actions
FDIC Directive
On March 16, 2010, the Federal Deposit Insurance Corporation (“FDIC”) issued a Supervisory Prompt Corrective Action Directive (the “FDIC Directive”) to Frontier Bank. As of that date, Frontier Bank was already operating subject to all of the restrictions set forth in the FDIC Order as described below,
except that the FDIC Directive imposed a new requirement that Frontier Bank take one or more of the following actions to recapitalize the Bank within 30 days (by April 15, 2010): (1) sell enough voting shares or obligations of Frontier Bank so that it will be “adequately capitalized,” as defined under the Federal Deposit Insurance Act (“FDI Act”) and the related FDIC regulations, after the sale; and/or (2) accept an offer to be acquired by a depository institution holding company
or combine with another insured depository institution.
The Directive states that the FDIC has categorized the Bank as being a “critically undercapitalized” depository institution at December 31, 2009, as defined under the FDI Act and FDIC rules and regulations, prohibits the acceptance, renewal or rollover of brokered deposits and restricts the interest rates that the Bank may pay
on deposits to rates not more than 75 basis points higher than those paid on similar deposits in its market area. In addition, the FDIC Directive states that the Bank is not permitted to increase its average total assets or make any capital distributions to the Corporation or any affiliate or to pay bonuses to or increase the compensation of any director or officer of the Bank without the approval from the FDIC. The FDIC Directive also precludes the Bank from branching, or relocation, selling
or disposing of any of its existing branches without FDIC approval. Further, the Bank is directed to comply with Section 23A of the Federal Reserve Act in connection with transactions between affiliates without regard to certain exceptions.
FDIC Order
On March 20, 2009, Frontier Bank entered into a Stipulation and Consent to the Issuance of an Order to Cease and Desist (the “FDIC Order”) with the FDIC and the Washington Department of Financial Institutions (the “Washington DFI”). The regulators alleged that Frontier Bank had engaged in unsafe or unsound
banking practices by operating with inadequate management and board supervision; engaging in unsatisfactory lending and collection practices; operating with inadequate capital in relation to the kind and quality of assets held at Frontier Bank; operating with an inadequate loan valuation reserve; operating with a large volume of poor quality loans; operating in such a manner as to produce low earnings and operating with inadequate provisions for liquidity. By consenting to the FDIC Order, Frontier
Bank neither admitted nor denied the alleged charges.
Under the terms of the FDIC Order, Frontier Bank cannot declare dividends or pay any management, consulting or other fees or funds to the Corporation, without the prior written approval of the FDIC and the Washington DFI. Other material provisions of the FDIC Order require Frontier Bank to: (1) review the qualifications of Frontier
Bank’s management, (2) provide the FDIC with 30 days written notice prior to adding any individual to the Board of Directors of Frontier Bank (the “Frontier Bank Board”) or employing any individual as a senior executive officer, (3) increase director participation and supervision of Frontier Bank affairs, (4) improve Frontier Bank’s lending and collection policies and procedures, particularly with respect to the origination and monitoring of real estate construction and land development
loans, (5) develop a capital plan and increase Tier 1 leverage capital to 10% of Frontier Bank’s total assets by July 29, 2009, and maintain that capital level, in addition to maintaining a fully funded allowance for loan losses satisfactory to the regulators, (6) implement a comprehensive policy for determining the adequacy of the allowance for loan losses and limiting concentrations in commercial real estate and acquisition, development and construction loans, (7) formulate a written plan to reduce Frontier
Bank’s risk exposure to adversely classified loans and nonperforming assets, (8) refrain from extending additional credit with respect to loans charged-off or classified as “loss” and uncollected, (9) refrain from extending additional credit with respect to other adversely classified loans without collecting all past due interest, without the prior approval of a majority of the directors on the Frontier Bank Board or its loan committee, (10) develop a plan to control overhead and other expenses
to restore profitability, (11) implement a liquidity and funds management policy to reduce Frontier Bank’s reliance on brokered deposits and other non-core funding sources, and (12) prepare and submit progress reports to the FDIC and the Washington DFI. The FDIC Order will remain in effect until modified or terminated by the FDIC and the Washington DFI.
The FDIC Order does not restrict Frontier Bank from transacting its normal banking business. Frontier Bank has continued to serve its customers in all areas including making loans, establishing lines of credit, accepting deposits and processing banking transactions. Customer deposits remain fully insured to the highest
limits set by FDIC. The FDIC and Washington DFI did not impose any monetary penalties in connection with the FDIC Order.
FRB Agreement
In addition, on July 2, 2009, the Corporation entered into a Written Agreement (the “FRB Written Agreement”) with the Federal Reserve Bank of San Francisco (the “FRB”). Under the terms of the FRB Written Agreement, the Corporation has agreed to: (1) refrain from declaring or paying any dividends without
prior written consent of the FRB; (2) refrain from taking dividends or any other form of payment that represents a reduction in capital from Frontier Bank without prior written consent of the FRB; (3) refrain from making any distributions of interest or principal on subordinated debentures or trust preferred securities without prior written consent of the FRB; (4) refrain from incurring, increasing or guaranteeing any debt without prior written consent of the FRB; (5) refrain from purchasing or redeeming any
shares of its stock without prior written consent of the FRB; (6) implement a capital plan and maintain sufficient capital; (7) comply with notice and approval requirements established by the FRB relating to the appointment of directors and senior executive officers as well as any change in the responsibility of any current senior executive officer; (8) not pay or agree to pay any indemnification and severance payments except under certain circumstances, and with the prior approval of the FRB; and (9) provide
quarterly progress reports to the FRB.
General
The following discussion is only intended to provide summaries of significant statutes and regulations that affect the banking industry and is therefore not complete. Changes in applicable laws or regulations, and in the policies of regulators, may have a material effect on our business and prospects. We cannot accurately predict the nature
or extent of the effects on our business and earnings that fiscal or monetary policies, or new federal or state laws and regulations, may have in the future.
We are extensively regulated under federal and state law. These laws and regulations are primarily intended to protect depositors, not shareholders. The discussion below describes and summarizes certain statutes and regulations. These descriptions and summaries are qualified in their entirety by reference to the particular statute or regulation.
Changes in applicable laws or regulations may have a material effect on our business and prospects. Our operations may also be affected by changes in the policies of banking and other government regulators. We cannot accurately predict the nature or extent of the possible future effects on our business and earnings of changes in fiscal or monetary policies, or new federal or state laws and regulations.
Compliance
In order to assure that we are in compliance with the laws and regulations that apply to our operations, including those summarized below, we employ a compliance officer and engage an independent compliance auditing firm. We are regularly reviewed or audited by the Federal Reserve, the Federal Deposit Insurance Corporation (“FDIC”)
and the Washington Department of Financial Institutions, Division of Banks (“DFI”), during which examinations such agencies assess our compliance with applicable laws and regulations.
Frontier Bank and the Frontier Bank Board entered into a Memorandum of Understanding with the FDIC dated August 20, 2008, relating to the correction of certain violations of applicable consumer protection and fair lending laws and regulations, principally including the failure to provide certain notices to consumers pursuant to the
Flood Disaster Protection Act of 1973, and certain violations of the Truth in Lending Act (Regulation Z).
The Memorandum of Understanding requires Frontier Bank and the Frontier Bank Board to (1) correct all violations found and implement procedures to prevent their recurrence; (2) increase oversight of the Frontier Bank Board’s compliance function, including monthly reports from Frontier Bank’s compliance officer to the
Frontier Bank Board detailing actions taken to comply with the Memorandum of Understanding; (3) review its compliance policies and procedures and develop and implement detailed operating procedures and controls, where necessary, to ensure compliance with all consumer protection laws and regulations; (4) establish monitoring procedures to ensure compliance with all consumer protection laws and regulations (including flood insurance), including the documentation and reporting of all exceptions to the
Frontier Bank Board and its audit committee; (5) review, expand and improve the quality of such compliance with the frequency of compliance audits to be reviewed and approved annually by the Frontier Bank Board or audit committee, with a goal of auditing compliance at least annually; (6) ensure that Frontier Bank’s compliance management function has adequate staff, resources, training and authority for the size and structure of Frontier Bank; (7) establish flood insurance monitoring procedures
to ensure loans are not closed without flood insurance and prior notices to customers required by law, that lapses of flood insurance do not occur, and to develop methods to ensure that adequate amounts of flood insurance are provided, with Frontier Bank agreeing to force place flood insurance when necessary; (8) provide additional training for all Frontier Bank personnel, including the Frontier Bank Board and audit and compliance staff for applicable laws and regulations and (9) furnish quarterly
progress reports to the Regional Director of the FDIC detailing the actions taken to secure compliance with the Memorandum of Understanding until the Regional Director has released the institution, in writing, from submitting further reports. Frontier Bank was assessed civil monetary penalties of $48,895 for flood insurance violations and required to pay $10,974 in restitution to customers for certain violations of the Truth in Lending Act (Regulation Z) in 2008.
Federal Bank Holding Company Regulation
General: Frontier Financial Corporation, Inc. is a registered bank holding company as defined in the Bank Holding Company Act of 1956, as amended, or the Bank Holding Company Act, and is therefore subject to regulation, supervision and examination by the Federal Reserve. In general,
the Bank Holding Company Act limits the business of bank holding companies to owning or controlling banks and engaging in other activities closely related to banking. FFC must file reports with the Federal Reserve and must provide it with such additional information as it may require.
The Federal Reserve may require FFC to terminate an activity or terminate control or liquidate or divest certain subsidiaries, affiliates or investments when the Federal Reserve believes the activity or the control of the subsidiary or affiliates constitutes a significant risk to the financial safety, soundness or stability of any of its
banking subsidiaries.
The Federal Reserve also has the authority to regulate provisions of certain bank holding company debt, including the authority to impose interest ceilings and reserve requirements on such debt. Under certain circumstances, FFC must file written notice and obtain Federal Reserve approval prior to purchasing or redeeming its equity securities.
Additionally, FFC is required by the Federal Reserve to maintain certain levels of capital. See “Capital Adequacy” below for a discussion of the applicable federal capital requirements.
Acquisition of Banks: The Bank Holding Company Act requires every bank holding company to obtain the Federal Reserve Board’s prior approval before:
|
· |
acquiring direct or indirect ownership or control of any voting shares of any bank if, after the acquisition, the bank holding company will directly or indirectly own or control more than 5% of the bank’s voting shares; |
|
· |
acquiring all or substantially all of the assets of any bank; or |
|
· |
merging or consolidating with any other bank holding company. |
Additionally, the Bank Holding Company Act provides that the Federal Reserve Board may not approve any of these transactions if it would result in or tend to create a monopoly, substantially lessen competition or otherwise function as a restraint of trade, unless the anti-competitive effects of the proposed transaction are clearly outweighed
by the public interest in meeting the convenience and needs of the community to be served. The Federal Reserve Board is also required to consider the financial and managerial resources and future prospects of the bank holding companies and banks concerned and the convenience and needs of the community to be served. The Federal Reserve Board’s consideration of financial resources generally focuses on capital adequacy, which is discussed below.
Restrictions on Ownership of FFC: The Bank Holding Company Act requires any “bank holding company” (as defined in that Act) to obtain the approval of the Board of Governors of the Federal Reserve System prior to acquiring more than 5% of our outstanding common stock. Any
person other than a bank holding company is required to obtain prior approval of the Federal Reserve Board to acquire 10% or more of our outstanding common stock under the Change in Bank Control Act. Any holder of 25% or more of our outstanding common stock, other than an individual, is subject to regulation as a bank holding company under the Bank Holding Company Act.
Holding Company Control of Nonbanks: With some exceptions, the Bank Holding Company Act also prohibits a bank holding company from acquiring or retaining direct or indirect ownership or control of more than 5% of the voting shares of any company which is not a bank or bank holding
company, or from engaging directly or indirectly in activities other than those of banking, managing or controlling banks, or providing services for its subsidiaries. The principal exceptions to these prohibitions involve certain non-bank activities which, by statute or by Federal Reserve regulation or order, have been identified as activities closely related to the business of banking or of managing or controlling banks.
Transactions with Affiliates: Subsidiary banks of a bank holding company are subject to restrictions imposed by the Federal Reserve Act on extensions of credit to the holding company or its subsidiaries, on investments in their securities and on the use of their securities as collateral
for loans to any borrower. These regulations and restrictions may limit our ability to obtain funds from the Bank for our cash needs, including funds for payment of future dividends, interest and operational expenses.
Tying Arrangements: We are prohibited from engaging in certain tie-in arrangements in connection with any extension of credit, sale or lease of property or furnishing of services. For example, with certain exceptions, neither FFC nor the Bank may condition an extension of credit to
a customer on either: (i) a requirement that the customer obtain additional services provided by us; or (ii) an agreement by the customer to refrain from obtaining other services from a competitor.
Support of Subsidiary Banks: Under Federal Reserve policy, FFC is expected to act as a source of financial and managerial strength to the Bank. This means that FFC is required to commit, as necessary, resources to support the Bank. Any capital loans a bank holding company makes to
its subsidiary banks are subordinate to deposits and to certain other indebtedness of those subsidiary banks.
Federal and State Regulation of the Bank
General: The Bank is a Washington chartered commercial bank with deposits insured by the Federal Deposit Insurance Corporation (“FDIC”). As a result, the Bank is subject to supervision and regulation by the Washington DFI and the FDIC. These agencies have the authority
to prohibit banks from engaging in what they believe constitute unsafe or unsound banking practices.
Lending Limits: Washington banking law generally limits the amount of funds that a bank may lend to a single borrower to 20% of shareholders’ equity.
Control of Financial Institutions: The acquisition of 25% or more of a state chartered bank’s voting power by any individual, group or entity, is deemed a change in control under Washington banking law, requiring notice and application and prior approval of the DFI.
Community Reinvestment: The Community Reinvestment Act requires that, in connection with examinations of financial institutions within their jurisdiction, the FDIC evaluate the record of the financial institution in meeting the credit needs of its local communities, including low
and moderate income neighborhoods, consistent with the safe and sound operation of the institution. These factors are also considered in evaluating mergers, acquisitions and applications to open a branch or facility.
Insider Credit Transactions: Banks are also subject to certain FDIC restrictions on extensions of credit to executive officers, directors, principal shareholders or any related interests of such persons (i.e., insiders). Extensions of credit: (i) must be made on substantially the
same terms and pursuant to the same credit underwriting procedures as those for comparable transactions with persons who are neither insiders nor employees; and (ii) must not involve more than the normal risk of repayment or present other unfavorable features. Banks are also subject to certain lending limits and restrictions on overdrafts to insiders. A violation of these restrictions may result in regulatory sanctions on the bank or its insiders.
Regulation of Management: Federal law sets forth circumstances under which officers or directors of a bank may be removed by the institution’s federal supervisory agency. Federal law also prohibits management personnel of a bank from serving as a director or in a management
position of another financial institution whose assets exceed a specified amount or which has an office within a specified geographic area.
Safety and Soundness Standards: Federal law imposes upon banks certain non-capital safety and soundness standards. These standards cover internal controls, information systems, internal audit systems, loan documentation, credit underwriting, interest rate exposure, asset growth, compensation
and benefits. Additional standards apply to asset quality, earnings and stock valuation. An institution that fails to meet these standards must develop a plan acceptable to its regulators, specifying the steps that the institution will take to meet the standards. Failure to submit or implement such a plan may subject the institution to regulatory sanctions. Under Washington state law, if the shareholders’ equity of a Washington state-chartered bank becomes impaired, the Commissioner of the Washington DFI
will require the bank to make the impairment good. Failure to make the impairment good may result in the Commissioner’s taking possession of the bank and liquidating it.
Dividends: The principal source of FFC cash reserves are dividends received from the Bank. Washington law limits the Bank’s ability to pay cash dividends. Under these restrictions, a bank may not declare or pay any dividend greater than its retained earnings without approval
of the Washington DFI. The Washington DFI has the power to require any state-chartered bank to suspend the payment of any and all dividends.
In addition, a bank may not pay cash dividends if doing so would reduce its capital below minimum applicable federal capital requirements. See “Capital Adequacy” below for a discussion of the applicable federal capital requirements.
Other Regulations: The loan operations of the Bank are subject to state usury laws and federal laws concerning interest rates.
Federal Laws Applicable to Credit Transactions: The Bank’s loan operations are also subject to federal laws applicable to credit transactions, such as the:
|
· |
Truth-In-Lending Act, governing disclosures of credit terms to consumer borrowers; |
|
· |
Home Mortgage Disclosure Act of 1975, requiring financial institutions to provide information to enable the public and public officials to determine whether a financial institution is fulfilling its obligation to help meet the housing needs of the community it serves; |
|
· |
Equal Credit Opportunity Act, prohibiting discrimination on the basis of race, creed or other prohibited factors in extending credit; |
|
· |
Fair Credit Reporting Act of 1978, governing the use and provision of information to credit reporting agencies; |
|
· |
Fair Debt Collection Practices Act, governing the manner in which consumer debts may be collected by collection agencies; |
|
· |
Service Members Civil Relief Act, which amended the Soldiers’ and Sailors’ Civil Relief Act of 1940, governing the repayment terms of, and property rights underlying, secured obligations of persons in military service; and |
|
· |
Rules and regulations of the various federal agencies charged with the responsibility of implementing these federal laws. |
Federal Laws Applicable to Deposit Operations: The Bank’s deposit operations are subject to:
|
· |
the Right to Financial Privacy Act, which imposes a duty to maintain confidentiality of consumer financial records and prescribes procedures for complying with administrative subpoenas of financial records; and |
|
· |
the Electronic Funds Transfer Act and Regulation E issued by the Federal Reserve Board to implement that act, which govern automatic deposits to and withdrawals from deposit accounts and customers’ rights and liabilities arising from the use of automated teller machines and other electronic banking services. |
Check Clearing for the 21st Century Act: Also known as Check 21, which gives “substitute checks,” such as a digital image of a check and copies made from that image, the same legal standing as the original paper check; allows check truncation without making it mandatory;
requires that financial institutions communicate to accountholders in writing a description of its substitute check processing program and their rights under the law; legalizes substitutions for and replacements of paper checks without agreement from consumers; retaining in place the previously mandated electronic collection and return of checks between financial institutions only when individual agreements are in place; requires that when accountholders request verification, financial institutions produce the
original check (or a copy that accurately represents the original) and demonstrate that the account debit was accurate and valid; and requires recrediting of funds to an individual’s account on the next business day after a consumer proves that the financial institution has erred.
Federal Home Loan Bank System: The Federal Home Loan Bank system, of which the Bank is a member, consists of 12 regional Federal Home Loan Banks governed and regulated by the Federal Housing Finance Board (“FHFB”). The Federal Home Loan Banks serve as reserve or credit
facilities for member institutions within their assigned regions. They are funded primarily from proceeds derived from the sale of consolidated obligations of the FHLB system. They make loans (i.e. advances) to members in accordance with policies and procedures established by the FHLB and the boards of directors of each regional FHLB.
As a system member, the Bank is entitled to borrow from the FHLB of its region and is required to own a certain amount of capital stock in the FHLB. The Bank is in compliance with the stock ownership rules described above with respect to such advances, commitments and letters of credit and residential 1-4 family loans and similar obligations.
All loans, advances and other extensions of credit made by the FHLB to the Bank are secured by a portion of its residential 1-4 loan portfolio, certain other investments and the capital stock of the FHLB held by the Bank.
Mortgage Banking Operations: The Bank is subject to the rules and regulations of FHA, VA, FNMA, FHLMC and GNMA with respect to originating, processing, selling and servicing mortgage loans and the issuance and sale of mortgage-backed securities. Those rules and regulations, among
other things, prohibit discrimination and establish underwriting guidelines which include provisions for inspections and appraisals require credit reports on prospective borrowers and fix maximum loan amounts, and, with respect to VA loans, fix maximum interest rates. Mortgage origination activities are subject to, among others, the Equal Credit Opportunity Act, Federal Truth-in-Lending Act and the Real Estate Settlement Procedures Act and the regulations promulgated thereunder which, among other things, prohibit
discrimination and require the disclosure of certain basic information to mortgagors concerning credit terms and settlement costs.
Commercial Real Estate Guidance: The FDIC and the Federal Reserve Board issued joint Guidance on Concentrations in Commercial Real Estate Lending, Sound Risk Management Practices on December 6, 2006. The Guidance provides supervisory criteria, including the following numerical indicators,
to assist bank examiners in identifying banks with potentially significant commercial real estate loan concentrations that may warrant greater supervisory scrutiny: (1) commercial real estate loans exceed 300% of capital and increased 50% or more in the preceding three years; or (2) construction and land development loans exceed 100% of capital. The Guidance does not limit banks’ levels of commercial real estate lending activities. The Guidance applies to the Bank, based on our current loan portfolio. We
believe that our loan portfolio has been subject to rigorous examination by banking regulators and our own credit review function and that we are taking appropriate precautions to address the risks associated with our concentrations in commercial real estate lending. We do not expect the Guidance to adversely affect our operations or our ability to execute our business strategy.
Privacy
Federal banking rules limit the ability of banks and other financial institutions to disclose nonpublic information about consumers to nonaffiliated third-parties. Pursuant to these rules, financial institutions must provide:
|
· |
initial notices to customers about their privacy policies, describing the conditions under which they may disclose nonpublic personal information to nonaffiliated third-parties and affiliates; |
|
· |
annual notices of their privacy policies to current customers; and |
|
· |
a reasonable method for customers to “opt out” of disclosures to nonaffiliated third-parties. |
These privacy provisions affect how consumer information is transmitted through diversified financial companies and conveyed to outside vendors. We have implemented privacy policies to comply with these requirements.
Interstate Banking and Branching
The Riegle-Neal Interstate Banking and Branching Efficiency Act of 1994 (“Interstate Act”) permits nationwide interstate banking and branching under certain circumstances. This legislation generally authorizes interstate branching and relaxes federal law restrictions on interstate banking. Currently, bank holding companies may
purchase banks in any state, and states may not prohibit these purchases. Additionally, banks are permitted to merge with banks in other states, as long as the home state of neither merging bank has opted out under the legislation. The Interstate Act requires regulators to consult with community organizations before permitting an interstate institution to close a branch in a low-income area.
FDIC regulations prohibit banks from using their interstate branches primarily for deposit production. The FDIC has implemented a loan-to-deposit ratio screen to ensure compliance with this prohibition.
Washington enacted “opting in” legislation in accordance with the Interstate Act, allowing banks to engage in interstate merger transactions, subject to certain “aging” requirements. Until recently, Washington restricted out-of-state banks from opening de novo branches; however, in 2005, Washington interstate branching
laws were amended so that an out-of-state bank may, subject to the DFI’s approval, open de novo branches in Washington or acquire an in-state branch so long as the home state of the out-of-state bank has reciprocal laws with respect to de novo branching or branch acquisitions. Once an out-of-state bank has acquired a bank within Washington, either through merger or acquisition of all or substantially all of the bank’s assets or through authorized de novo branching, the out-of-state bank may open additional
branches within the state.
Deposit Insurance
Our deposits are generally insured to a maximum of $250,000 per depositor through the Deposit Insurance Fund administered by the FDIC. In addition, we are participating in the FDIC Insurance Temporary Liquidity Guarantee Program, in which all noninterest bearing transaction deposit accounts are fully insured until June 30, 2010. We
are required to pay deposit insurance premiums, which are assessed semiannually and paid quarterly. The premium amount is based upon a risk classification system established by the FDIC. Banks with higher levels of capital and a low degree of supervisory concern are assessed lower premiums than banks with lower levels of capital or a higher degree of supervisory concern.
The FDIC is also empowered to make special assessments on insured depository institutions in amounts determined by the FDIC to be necessary to give it adequate assessment income to repay amounts borrowed from the U.S. Treasury and other sources or for any other purpose the FDIC deems necessary.
Legislative reform to modernize the Federal Deposit Insurance System merged the Bank Insurance Fund and the Savings Association Insurance Fund into a new Deposit Insurance Fund, and also:
|
· |
raised the deposit insurance limit on certain retirement accounts to $250,000 and indexes that limit for inflation; |
|
· |
required the FDIC and National Credit Union Administration boards, starting in 2010 and every succeeding five years, to consider raising the standard maximum deposit insurance; and |
|
· |
eliminated the current fixed 1.25 percent Designated Reserve Ratio (“DRR”) and provided the FDIC with the discretion to set the DRR within a range of 1.15 to 1.50 percent for any given year. |
Capital Adequacy
Regulatory Capital Guidelines: Federal bank regulatory agencies use capital adequacy guidelines in the examination and regulation of bank holding companies and banks. The guidelines are “risk-based,” meaning that they are designed to make capital requirements more sensitive
to differences in risk profiles among banks and bank holding companies.
Tier I and Tier II Capital: Under the guidelines, an institution’s capital is divided into two broad categories, Tier I capital and Tier II capital. Tier I capital generally consists of common shareholders’ equity, surplus and undivided profits. Tier II capital
generally consists of the allowance for loan losses, hybrid capital instruments and subordinated debt. The sum of Tier I capital and Tier II capital represents an institution’s total capital. The guidelines require that at least 50% of an institution’s total capital consist of Tier I capital.
Risk-based Capital Ratio: The adequacy of an institution’s capital is gauged primarily with reference to the institution’s risk weighted assets. The guidelines assign risk weightings to an institution’s assets in an effort to quantify the relative risk of each asset
and to determine the minimum capital required to support that risk. An institution’s risk weighted assets are then compared with its Tier I capital and total capital to arrive at a Tier I risk-based ratio and a total risk-based ratio, respectively. The guidelines provide that an institution must have a minimum Tier I risk-based ratio of 4% and a minimum total risk-based ratio of 8%.
Leverage Ratio: The guidelines also employ a leverage ratio, which is Tier I capital as a percentage of total assets less intangibles, to be used as a supplement to risk-based guidelines. The principal objective of the leverage ratio is to constrain the maximum degree to which a bank
holding company may leverage its equity capital base. The minimum leverage ratio is 3%; however, for all but the most highly rated bank holding companies and for bank holding companies seeking to expand, regulators generally expect an additional cushion of at least 1% to 2%.
Prompt Corrective Action (“PCA”): Under the guidelines, an institution is assigned to one of five capital categories depending on its total risk-based capital ratio, Tier I risk-based capital ratio, and leverage ratio, together with certain subjective factors. The categories
range from “well capitalized” to “critically undercapitalized.” Institutions that are deemed to be undercapitalized, depending on the category to which they are assigned, are subject to certain mandatory supervisory corrective actions.
As of December 31, 2009, Frontier Bank was categorized by the FDIC as “critically undercapitalized” for purposes of PCA, as a result of the FDIC Directive. Under the Federal Deposit Insurance (“FDI”) Act’s PCA capital requirements (12 U.S.C. § 1831o), depository institutions that are “critically
undercapitalized”, in addition to being subject to a number of additional restrictions, must be placed into conservatorship or receivership within 90 days of becoming critically undercapitalized, unless the institution’s primary Federal regulatory authority (here, the FDIC) determines and documents that “other action” would better achieve the purposes of PCA. Refer to Note 2 of the Annual Report to Shareholders for further discussion.
State Corporate Law Restrictions
As a Washington corporation, we are subject to certain limitations and restrictions under applicable Washington corporate law. For example, state law restrictions in Washington include limitations and restrictions relating to indemnification of directors; distributions to shareholders; transactions involving directors, officers, or interested
shareholders; maintenance of books, records, and minutes; and observance of certain corporate formalities.
Corporate Governance and Accounting Legislation
Sarbanes-Oxley Act of 2002: On July 30, 2002, the Sarbanes-Oxley Act of 2002, or SOX, was signed into law to address corporate and accounting fraud. SOX established a new accounting oversight board that enforces auditing standards and restricts the scope of services that
accounting firms may provide to their public company audit clients. Among other things, SOX also: (i) requires chief executive officers and chief financial officers to certify to the accuracy of periodic reports filed with the SEC; (ii) imposes new disclosure requirements regarding internal controls, off-balance-sheet transactions, and pro forma (non GAAP) disclosures; (iii) accelerates the time frame for reporting of insider transactions and periodic disclosures by public companies; and (iv) requires companies
to disclose whether or not they have adopted a code of ethics for senior financial officers and whether the audit committee includes at least one “audit committee financial expert.”
Under SOX, the SEC is required to regularly and systematically review corporate filings, based on certain enumerated factors. To deter wrongdoing, SOX: (i) subjects bonuses issued to top executives to disgorgement if a restatement of a company’s financial statements was due to corporate misconduct; (ii) prohibits an officer or director
from misleading or coercing an auditor; (iii) prohibits insider trades during pension fund “blackout periods”; (iv) imposes new criminal penalties for fraud and other wrongful acts; and (v) extends the period during which certain securities fraud lawsuits can be brought against a company or its officers.
As a public reporting company, we are subject to the requirements of SOX and related rules and regulations issued by the SEC and NASDAQ.
Anti-terrorism Legislation
USA Patriot Act of 2001: Among other things, the Patriot Act: (i) prohibits banks from providing correspondent accounts directly to foreign shell banks; (ii) imposes due diligence requirements on banks opening or holding accounts for foreign financial institutions or wealthy
foreign individuals; (iii) requires financial institutions to establish an anti-money-laundering compliance program; and (iv) eliminates civil liability for persons who file suspicious activity reports. The Patriot Act also increased governmental powers to investigate terrorism, including expanded government access to account records. The Department of the Treasury is empowered to administer and make rules to implement the Patriot Act.
Effects of Government Monetary Policy
Our earnings and growth are affected not only by general economic conditions, but also by the fiscal and monetary policies of the federal government, particularly the Federal Reserve. The Federal Reserve can and does implement national monetary policy for such purposes as curbing inflation and combating recession. The nature and impact
of future changes in monetary policies and their impact on us cannot be predicted with certainty.
Employees
At December 31, 2009, we had 703 full-time equivalent (“FTE”) employees, of which 700 were employed in our wholly-owned subsidiary, Frontier Bank, and 3 were engaged in our bank holding company, Frontier Financial Corporation. The employees are not represented by a collective bargaining unit. We believe
we have a good relationship with our employees.
Corporate Information
We make available through our Internet website, free of charge, copies of our annual report on Form 10-K, quarterly reports on Form 10-Q, current reports on Form 8-K and amendments to those reports filed or furnished pursuant to Section 13(a) or Section 15(d) of the Securities Exchange Act of 1934, as amended, as soon as reasonably practicable
after filing such material electronically or otherwise furnishing it to the Securities and Exchange Commission (“SEC”). These filings can be accessed under “Investor Relations” found on the homepage of our website at www.frontierbank.com. Our Code of Ethics for Senior Financial Officers, which includes a code of ethics applicable to our accounting and financial employees, including our Chief Executive Officer and Chief Financial Officer, is also available on our website
under “Investor Relations.” These filings are also accessible on the SEC’s website at www.sec.gov. The public may read and copy any materials we file with the SEC at the SEC’s Public Reference Room at 100 F Street, N.E., Washington, D.C. 20549. The public may obtain information on the operation of the Public Reference Room by calling the SEC at 1-800-SEC-0330. Further, each of these documents is also available in print (at no charge) to any shareholder upon request, addressed
to:
Investor Relations
Frontier Financial Corporation
332 S.W. Everett Mall Way
P.O. Box 2215
Everett, WA 98213
Our website and the information contained therein or connected thereto are not incorporated by reference into this Form 10-K.
In addition to general investment risks and the other information contained in this report or incorporated by reference, including the consolidated financial statements and the notes thereto, “Forward-Looking Statements” and “Management’s Discussion and Analysis of Financial Condition and Results of Operations”,
before investing in our securities, you should carefully consider the risks described below. Any of these risks could significantly and adversely affect our business, prospects, financial condition and results of operations. If one or more of these risks and uncertainties is realized, the trading price of our common shares or the value of our other securities could decline, and you could lose all or part of your investment. This report is qualified in its entirety by these risk
factors.
Risks Related To Our Business and Market
Our capital position has deteriorated and we are now categorized by the FDIC as critically undercapitalized, and subject to an FDIC Directive to recapitalize the Bank.
The Corporation’s and the Bank’s capital positions have deteriorated and the Bank is now considered to be “critically undercapitalized” under the prompt corrective action provision of the FDI Act and related regulations, according to the FDIC Directive. Refer to Item 1 of this report captioned “Regulation
and Supervision” for further discussion.
On January 15, 2010, the Bank filed a capital restoration plan with the FDIC, but the FDIC subsequently informed the Bank that the plan was not acceptable. The prompt corrective action provisions of the FDI Act generally require the appropriate federal banking agency (in the case of the Bank, the FDIC) no later than 90 days after a bank
becomes critically undercapitalized to place the bank into receivership or conservatorship or to take such other action that the agency determines would better achieve the purpose of the prompt corrective action provisions. Such an action would have a material and adverse effect on the value of our stock and would result in it having little or no value.
Our ability to raise additional capital is contingent on the current capital markets and on our financial performance. Available capital markets are not currently available and we have not been able to raise the required capital to date and cannot be certain of our ability to raise additional capital on any terms.
As a result of the FDIC Directive, the significant operating losses incurred in 2009 and 2008, and our needs to raise additional capital, there is substantial doubt about our ability to continue as a going concern. The report of our independent registered public accounting firm on our consolidated financial statements for the
year ended December 31, 2009, contains an explanatory paragraph with respect to our ability to continue as a going concern. The 2009 financial statements do not include any adjustments that might result from the outcome of these uncertainties, which could affect our ability to continue as a going concern.
Restrictions imposed by regulatory actions could have an adverse effect on us and failure to comply with these regulatory actions could result in further regulatory action or restrictions.
The business and operations of the Corporation and our subsidiary, Frontier Bank, are currently subject to regulatory actions, which for example, generally prohibit us from paying dividends, repurchasing stock, retaining new directors or senior managers or changing the duties of senior management, paying management or consulting fees or
other funds to the Corporation, and extending additional credit with respect to nonperforming and adversely classified loans, which management believes complicates the workout of troubled loans. We are also required to raise additional capital. These and other regulatory actions are described in more detail in Item 1 of this report under “Regulation and Supervision.” Management believes that it is in compliance with all the requirements of these regulatory actions,
other than the requirement to recapitalize the Bank. These regulatory actions and any future actions could continue to adversely affect our earnings, business and operations. In addition, failure to comply with these regulatory actions or any future actions could result in further regulatory actions or restrictions, including monetary penalties and the potential closure of Frontier Bank.
The downturn in the real estate market and weakness in the economy continue to adversely affect our financial condition and profitability.
We are currently operating in a challenging and uncertain economic environment, both nationally and in our Washington and Oregon markets. Like many other financial institutions, we are being affected by sharp declines in residential and commercial real estate values, with rising foreclosures and unemployment, and constrained
financial markets. Continued declines in residential and commercial real estate values and home sales and financial stress on borrowers as a result of the uncertain economic environment and job losses, could have an adverse effect on our borrowers or their customers and demand for our products and services, which could adversely affect our financial condition and earnings, increase loan delinquencies, defaults and foreclosures, and significantly impair the value of our collateral and our ability to
sell the collateral upon foreclosure.
We have been experiencing significant deterioration in our loan portfolio, centered in our residential construction and land development loans.
As of December 31, 2009, approximately 84.0% of our loan portfolio was comprised of loans secured by real estate, made up of 33.7% commercial real estate loans, 15.6% construction loans, 14.8% term 1-4 family residential loans, 11.1% land development loans and 8.8% completed lot loans. We have been experiencing deterioration
in our loan portfolio, centered in our residential construction and land development loans. Many of these loans are maturing and classified as nonperforming assets while we work with borrowers to maximize our recovery. If loan payments from borrowers are over 90 days past due, or sooner if normal repayment cannot resume, the loans are placed on nonaccrual status, thereby reducing and/or reversing previously accrued interest income. Our nonperforming loans increased significantly over the
past year, from $435.2 million to $705.2 million, $426.8 million of which were residential construction and land development loans, which represent 55.6% of our residential construction and land development loans. The contraction or expansion of our nonaccrual loan portfolio and other real estate owned (“OREO”) properties in future periods will depend upon our ongoing collection efforts and changes in market conditions. We have a dedicated team of 42 employees focused on the
management of problem loans, but there is no guarantee that this team will be able to effectively manage the amount of problem loans we may encounter in the future. Additional information regarding credit risk is included in “Management’s Discussion and Analysis of Financial Condition and Results of Operations - Loans.”
Due to unforeseen circumstances and/or changes in estimates, our allowance for loan losses may not be adequate to cover actual losses.
An essential element of our business is to make loans. We maintain an allowance for loan losses that we believe is a reasonable estimate of known and inherent losses within the loan portfolio. Our loan portfolio and allowance for loan losses are assessed each quarter by management, and were subject to recent examinations
by our federal and state regulators. As of December 31, 2009, our allowance for loan losses increased to $151.3 million, or 5.27% of our total loans of $2.87 billion, as a result of significant additional provisions for loan losses and charge-offs in 2009. See “Management’s Discussion & Analysis of Financial Condition and Results of Operations - Allowance for Loan Losses.” The determination of the appropriate level of loan loss allowance as well as the appropriate
amount of loan charge-offs (net of loan recoveries) is an inherently difficult process and is based on numerous assumptions and there may be a range of potential estimates. The amount of future losses is susceptible to changes in economic, operating and other conditions, including changes in our real estate markets and interest rates that are beyond our control. Our underwriting policies, credit monitoring processes and risk management systems and controls may not prevent unexpected losses. In
addition, bank regulators periodically review our allowance for loan losses and may require us to increase our provision for loan losses or recognize further loan charge-offs. Any such additional loan losses, should they occur, would adversely affect our financial condition and profitability.
Defaults and related losses in our residential construction and land development loan portfolio could result in a significant increase in OREO balances and the number of properties to be disposed of, which would adversely affect our financial results.
As part of our collection process for all nonperforming real estate loans, we may foreclose on and take title to the property serving as collateral for the loan. Real estate owned by us and not used in the ordinary course of our operations is referred to as other real estate owned (“OREO”) property. We
expect to take additional properties into OREO. Increased OREO balances lead to greater expenses as we incurs costs to manage and dispose of the properties and, in certain cases, complete construction of improvements prior to sale. Any decrease in sale prices on properties may lead to OREO write-downs with a corresponding expense in our statement of operations. Our management expects that earnings over the next several quarters could be negatively affected by various expenses associated
with OREO, including personnel costs, insurance and taxes, completion and repair costs, and other costs associated with property ownership, as well as by the funding costs associated with assets that are tied up in real estate during the period they are held in OREO. The management and oversight of OREO is time consuming and can be complex and can require significant resources of our management and employees. We will also be at risk of further declines in real estate prices in the market
areas in which we conduct our lending business.
We may have continuing losses and continuing variation in our quarterly results.
We reported net losses of $295.1 million during the year ended December 31, 2009. This loss primarily resulted from our high level of nonperforming assets and the resultant reduction in interest income and increased provision for loan losses. We may continue to suffer further losses as a result of credit-related factors. In
addition, several other factors affecting our business can cause significant variations in our quarterly results of operations. In particular, variations in the volume of our loan originations and sales, the differences between our costs of funds and the average interest rate earned on investments and other-than-temporary impairment charges in our investment securities portfolio could have a material adverse affect on our results of operations and financial condition.
Our future earnings may be adversely affected by legal and regulatory actions taken against us, as well as those legal actions that Frontier has and may pursue.
Frontier and Frontier Bank are involved in the regulatory, collection and potential foreclosure actions and proceedings referenced in “Item 3: Legal Proceedings,” which, if adversely determined, could have a material adverse effect on our consolidated financial position, results of operations or cash flows and our ability to
raise capital. Moreover, the expenses of pending legal proceedings will adversely affect our results of operations until they are resolved.
Our profitability and the value of shareholders’ investments may suffer because of rapid and unpredictable changes in the highly regulated environment in which we operate.
We are subject to extensive supervision by several governmental regulatory agencies at the federal and state levels in the financial services area. Recently enacted, proposed and future legislation and regulations have had, and will continue to have, or may have a significant impact on the financial services industry. These
regulations, which are generally intended to protect depositors and not stockholders, and the interpretation and application of them by federal and state regulators, are beyond our control, may change rapidly and unpredictably and can be expected to influence earnings and growth. For example, the FDIC and the Federal Reserve recently issued joint Guidance on Concentrations in Commercial Real Estate Lending, Sound Risk Management Practices that sets forth supervisory criteria to assist bank examiners
in identifying banks with potentially significant commercial real estate loan concentrations that may warrant greater supervisory scrutiny. The Guidance applies to Frontier Bank, based on our current loan portfolio, and our management expects that our business and operations will be subject to enhanced regulatory review for the foreseeable future. Regulatory authorities have extensive discretion in their supervisory and enforcement activities, including the imposition of restrictions on
operations, the classification of assets and determination of the level of allowance for loan losses. Our success depends on our continued ability to maintain compliance with these regulations. Such additional regulation and supervision may increase our costs and limit our ability to pursue business opportunities.
Market and other constraints on our construction loan origination volume are expected to lead to decreases in our interest and fee income that are not expected to be fully offset by reductions in our noninterest expenses.
Due to existing conditions in housing markets in the areas where we operate, the recession and other factors, we project construction loan originations to be materially constrained in 2010 and beyond. Additionally, management’s revised business plan will de-emphasize the origination of construction loans. This
will lower interest income and fees generated from this part of our business. Unless this revenue decline is offset by other areas of operations, our total revenues may decline relative to our total noninterest expense. We expect that it will be difficult to find new revenue sources in the near term to completely offset expected declines in our interest income. In that regard, the adverse economic conditions that began in 2007 and that have continued into 2010 have significantly reduced
our origination of all new loans, and management cannot give assurance that our total loans or assets will increase or not decline in 2010.
The value of certain securities in our portfolio may be negatively affected by disruptions in the market for these securities.
The market for certain securities held within our portfolio has become more volatile over the past year. These volatile markets may affect the value of these securities, such as through reduced valuations due to the perception of heightened credit and liquidity risks, in addition to interest rate risk typically associated with
these securities. There can be no assurance that the declines in market value associated with these disruptions will not result in impairments of these assets, which would lead to accounting charges that could have a material adverse affect on our net income, equity and capital ratios.
Fluctuations in interest rates could reduce our profitability and affect the value of our assets.
Our earnings and cash flows are largely dependent upon our net interest income. Net interest income is the difference between interest income earned on interest earning assets such as loans and securities and interest expense paid on interest bearing liabilities such as deposits and borrowed funds. Interest rates are
highly sensitive to many factors that are beyond our control, including but not limited to; general economic conditions and policies of various governmental and regulatory agencies and, in particular, the Federal Reserve Board. Changes in monetary policy, including changes in interest rates, could influence not only the amount of interest we receive on loans and securities and the amount of interest we pay on deposits and borrowings, but such changes could also affect our ability to originate loans
and obtain deposits as well as the fair value of our financial assets and liabilities. If the interest we pay on deposits and other borrowings increases at a faster rate than the interest we receive on loans and other investments, our net interest income, and therefore earnings, could be adversely affected. Earnings could also be adversely affected if the interest we receive on loans and other investments fall more quickly than the interest we pay on deposits and other borrowings. Additional
information regarding how we manage our interest rate risk is included in Item 7A of this report captioned “Quantitative and Qualitative Disclosures about Market Risk.”
Concern of customers over the safety of their deposits may cause a decrease in deposits.
With recent increased concerns about bank failures, customers increasingly are concerned about the safety of their deposits and the extent to which their deposits are insured by the FDIC. Customers may not believe Frontier Bank is a safe place to keep their deposit accounts and they may remove their deposit accounts. Additionally,
customers may withdraw deposits from Frontier Bank in an effort to ensure that the amount they have on deposit at Frontier Bank is fully insured. Decreases in deposits may adversely affect our funding costs, liquidity and net income.
We depend on key personnel for success.
Our operating results and ability to adequately manage our growth and minimize loan and lease losses are highly dependent on the services, managerial abilities and performance of our current executive officers and other key personnel. We have an experienced management team that the Board of Directors believes is capable of managing
and growing our operations. However, losses of or changes in our current executive officers or other key personnel and their responsibilities may disrupt our business and could adversely affect financial condition, results of operations and liquidity. We may not be successful in retaining our current executive officers or other key personnel.
Liquidity risk could impair our ability to fund operations and jeopardize our financial condition.
Liquidity is essential to our business. An inability to raise funds through deposits, borrowings, the sale of loans and other sources could have a substantial negative effect on our liquidity. Our access to funding sources in amounts adequate to finance our activities or the terms of which are acceptable to us could
be impaired by factors that affect us specifically or the financial services industry in general. Factors that could detrimentally impact our access to liquidity sources include a decrease in the level of our business activity as a result of weak economic conditions in the western Washington and northwest Oregon markets in which our loans are concentrated or adverse regulatory action against us. Our ability to borrow could also be impaired by factors that are not specific to us, such as
a disruption in the financial markets or negative views and expectations about the prospects for the financial services industry in light of the turmoil currently faced by financial institutions and the continued deterioration in credit markets and the economy. Additional information regarding liquidity risk is included on this report under “Management’s Discussion and Analysis of Financial Condition and Results of Operations - Liquidity Resources and Capital Requirements.”
Our ability to service our debt, pay dividends and otherwise pay our obligations as they come due is substantially dependent on capital distributions from Frontier Bank, and these distributions are subject to regulatory limits and other restrictions.
A substantial source of our income from which we service our debt, pay our obligations and from which we can pay dividends is the receipt of dividends from Frontier Bank. The availability of dividends from Frontier Bank is limited by various statutes and regulations, and under the FDIC Order the Bank is currently prohibited from
paying cash dividends without the prior consent of the FDIC and the DFI. It is possible; depending upon the financial condition of Frontier Bank and other factors, that the applicable regulatory authorities could assert that payment of dividends or other payments is an unsafe or unsound practice. If Frontier Bank is unable to pay dividends to us, we may not be able to service our debt, pay our obligations or pay dividends on our common stock. The inability to receive dividends
from Frontier Bank would adversely affect our business, financial condition, results of operations and prospects. Additional information regarding dividend restrictions is included in Item 1 of this report captioned “Regulation and Supervision.”
Strong competition within our market areas may limit our growth and adversely affect our operating results.
The banking and financial services industry is highly competitive. We compete in our market areas with commercial banks, savings institutions, mortgage brokerage firms, credit unions, finance companies, mutual funds, insurance companies, and brokerage and investment banking firms operating locally and elsewhere. Some
of these competitors have substantially greater resources and lending limits than we do, have greater name recognition and market presence that benefit them in attracting business and deposits, and offer certain services that we do not or cannot provide. In addition, larger competitors may be able to price loans and deposits more aggressively than we do. Our results of operations depend upon our continued ability to successfully compete in our market area. The greater resources
and deposit and loan products offered by some of our competitors may limit our ability to increase or maintain our interest earning assets. In that regard, the adverse economic conditions that began in 2007 and that have continued into 2010 have significantly reduced our origination of new loans, and there is no assurance that our total loans or assets will increase or not decline in 2010.
Further increases in FDIC insurance premiums or special assessments could adversely impact our earnings.
Recent insured institution failures, as well as deterioration in banking and economic conditions, have significantly increased FDIC loss provisions, resulting in a decline in the designated reserve ratio to historical lows. The FDIC expects a higher rate of insured institution failures in the next few years compared to recent
years; thus, the reserve ratio may continue to decline.
On May 22, 2009, the FDIC adopted a final rule levying a five basis point special assessment on each insured depository institution’s assets minus Tier 1 capital as of June 30, 2009. We recorded an expense of $1.9 million for the fiscal year ended December 31, 2009, to reflect the special assessment. In addition,
the FDIC increased the general assessment rate and the rate is scheduled to increase again by 3 basis points in 2011.
Should the FDIC find it necessary to impose any further special assessments or further increase assessment rates, or to revise the risk-based assessment system, our FDIC general insurance premium expense could increase compared to prior periods.
Our controls and procedures may fail or be circumvented.
Management regularly reviews and updates our internal controls, disclosure controls and procedures, and corporate governance policies and procedures. Any system of controls, however well designed and operated, is based in part on certain assumptions and can provide only reasonable, not absolute, assurances that the objectives
of the system are met. Any failure or circumvention of our controls and procedures or failure to comply with regulations related to controls and procedures could have a material adverse affect on our financial condition and results of operations.
We continually encounter technological change.
The financial services industry is continually undergoing rapid technological change with frequent introductions of new technology-driven products and services. The effective use of technology increases efficiency and enables financial institutions to better serve customers and to reduce costs. Our future success depends,
in part, upon our ability to address the needs of our customers by using technology to provide products and services that will satisfy customer demands, as well as to create additional efficiencies in our operations. Many of our competitors have substantially greater resources to invest in technological improvements. We may not be able to effectively implement new technology-driven products and services or be successful in marketing these products and services to our customers. Failure
to successfully keep pace with technological change affecting the financial services industry could have a material adverse affect on our financial condition and results of operations.
We are subject to operational risk, which may result in incurring financial and reputation losses.
We are exposed to many types of operational risk, including the risk of fraud by employees or outsiders, the risk of operational errors, including clerical or record-keeping errors or those resulting from faulty or disabled computer or telecommunications systems. Given our high volume of transactions, certain errors may be repeated
or compounded before they are discovered and successfully corrected. Our dependence upon automated systems to record and process transactions may further increase the risk that technical system flaws or employee tampering with or manipulation of those systems will result in losses that are difficult to detect.
We may be subject to disruptions of our systems, arising from events that are wholly or partially beyond our control (including, for example, computer viruses or electrical or telecommunications outages), which may give rise to losses in service to customers and to financial loss or liability. We are further exposed to the risk
that our external vendors may be unable to fulfill their contractual obligations (or will be subject to the same risk of fraud or operational errors by their respective employees as we are) and to the risk that our (or our vendors’) business continuity and data security systems prove to be inadequate.
We are exposed to risk of environmental liabilities with respect to properties to which we take title.
Approximately 84.0% of our outstanding loan portfolio, at December 31, 2009, was secured by real estate. In the course of our business, we may foreclose and take title to real estate, and could be subject to environmental liabilities with respect to these properties. We may be held liable to a governmental entity or to third-parties for
property damage, personal injury, investigation and clean-up costs incurred by these parties in connection with environmental contamination, or may be required to investigate or clean up hazardous or toxic substances, or chemical releases at a property. The costs associated with investigation or remediation activities could be substantial. In addition, if we are the owner or former owner of a contaminated site, we may be subject to common law claims by third-parties based on damages and costs resulting
from environmental contamination emanating from the property. If we ever become subject to significant environmental liabilities, our business, financial condition, liquidity and results of operations could be materially and adversely affected.
Our earnings may be affected by changes in accounting principles and tax laws.
Changes in U.S. generally accepted accounting principles could have a significant adverse affect on our reported financial results. Although these changes may not have an economic impact on our business, they could affect our ability to attain targeted levels for certain performance or regulatory measures.
We are subject to tax laws, rules and regulations. Changes to tax laws, rules and regulations, including changes in the interpretation or implementation of tax laws, rules and regulations by the Internal Revenue Service or other governmental bodies, could affect us in substantial and unpredictable ways. Such changes could subject
us to additional costs, among other things. Failure to appropriately comply with tax laws, rules and regulations could result in sanctions by regulatory agencies, civil money penalties and/or reputation damage, which could have a material adverse affect on our business, financial condition and results of operations.
Severe weather, natural disasters, acts of war or terrorism and other external events could significantly impact our business.
Severe weather, natural disasters, acts of war or terrorism and other adverse external events could have a significant impact on our ability to conduct business. Such events could affect the stability of our deposit base, impair the ability of borrowers to repay outstanding loans, impair the value of collateral securing loans,
cause significant property damage, result in loss of revenue, interrupt our information systems, and/or cause us to incur additional expenses. Although management has established disaster recovery plans and procedures, the occurrence of any such event could have a material adverse affect on our business, which, in turn, could have a material adverse affect on our financial condition and results of operations.
Risks Associated With Our Securities
The market price and trading volume of our common shares may be volatile and the value of our other securities may decline as a result of adverse changes in our financial performance, the economy, market conditions and other factors.
The stock market and, in particular, the market for financial institution stocks, has experienced significant volatility in recent years. As a result, the market price of our common shares may be volatile. In addition, the trading volume in our common shares may fluctuate and cause significant price variations to occur. The
trading price of the shares of our common shares and the value of our other securities will depend on many factors, which may change from time to time, including, without limitation, our financial condition, performance, creditworthiness and prospects, future sales of our equity or equity-related securities, and other factors, including those identified above in “Forward-Looking Statements.”
Recent legislative and regulatory initiatives to address difficult market and economic conditions may not stabilize the U.S. banking system or economy or benefit us.
On October 3, 2008, President Bush signed into law the Emergency Economic Stabilization Act of 2008 (“EESA”) in response to the financial crises affecting the banking system and financial markets. The U.S. Department of the Treasury and banking regulators are implementing a number of programs under this legislation
to address capital and liquidity issues in the banking system. Subsequently, on February 17, 2009, President Obama signed the American Recovery and Reinvestment Act, to stimulate the economy. There can be no assurance, however, as to the actual impact that these programs and legislation or any other governmental program will have on the financial markets, including the extreme levels of volatility and limited credit availability currently being experienced, or on the economy. The
failure of any such program or the U.S. government to stabilize the financial markets and a continuation or worsening of current financial market conditions and the national and regional economy is expected to materially and adversely affect our business, financial condition, results of operations, access to credit and the trading price of our common stock.
Pursuant to the EESA, the Treasury has the authority to, among other things, purchase up to $700 billion (of which $250 billion is currently available) of mortgages, mortgage-backed securities and certain other financial instruments from financial institutions for the purpose of stabilizing and providing liquidity to the U.S. financial
markets. Shortly following the enactment of EESA, the Treasury created a capital purchase program, pursuant to which it is providing access to capital to financial institutions through a standardized program to acquire preferred stock (accompanied by warrants) from eligible financial institutions that will serve as Tier I capital, and the FDIC approved the temporary liquidity guaranty program, which is intended to strengthen confidence and encourage liquidity in the banking system by permitting the FDIC to (1)
guarantee certain newly-issued senior unsecured debt issued by participating institutions and (2) fully insure noninterest bearing transaction deposit accounts held at participating FDIC-insured institutions. There can be no assurance regarding the specific impact that such measures may have on us – or whether (or to what extent) we will be able to benefit from such programs.
We expect to face increased regulation and supervision of our industry as a result of the existing financial crisis, and there will be additional requirements and conditions imposed on us to the extent that we participate in any of the programs established or to be established by the Treasury under the EESA or by the federal bank regulatory
agencies. Such additional regulation and supervision may increase our costs and limit our ability to pursue business opportunities.
Shareholders’ interests may be diluted by future equity offerings or transactions.
In the future, we may attempt to increase our capital resources or, we could be forced to raise additional capital by making additional offerings of common stock, debt or preferred equity securities, including medium-term notes, trust preferred securities, senior or subordinated notes and preferred stock. In the event of liquidation,
holders of our debt securities and shares of preferred stock and lenders with respect to other borrowings would receive distributions of our available assets prior to the holders of our common shares. Additional equity offerings may dilute the holdings of our existing shareholders or reduce the market price of our common shares, or both. Holders of our common shares are not entitled to preemptive rights or other protections against dilution.
Shareholders’ may not receive any dividends on Frontier common shares.
On December 19, 2008, we announced that we had suspended payment of cash dividends on our common stock. Commencing with the interest payments due February 23, 2009, we exercised our right to defer regularly scheduled interest payments on our outstanding junior subordinated debentures related to trust preferred securities. We
may not pay any cash dividends on our common stock until we are current on interest payments on our outstanding junior subordinated debentures. In addition, cash dividends from the Bank are the primary source of funds for payment of cash dividends to our shareholders, and under the FDIC Order the Bank is currently prohibited from paying cash dividends without the prior consent of the FDIC and the DFI. We are also prohibited from paying dividends under the FRB Written Agreement without the
prior consent of the Reserve Bank and the DFI.
None.
Our principal office is located in a ninety thousand square foot facility in Everett, Washington. Our data processing and operations center are located in a sixteen thousand square foot facility located in Everett, Washington. In addition to our principal and administrative facilities, we operate 50 offices in western
Washington and northwestern Oregon.
The Bank owns the properties and buildings housing our principal office, data processing and operations center and 29 of our branch facilities, including the branch in our principal office. The Bank also owns the buildings for 3 of our branches which are located on leased land. We lease the land and buildings for 18
of our branch offices. The leases on our branch offices have expiration dates ranging from 2010 to 2024.
The aggregate monthly rental on our leased properties is approximately $193 thousand.
We are periodically a party to or otherwise involved in legal proceedings arising in the normal and ordinary course of business, such as claims to enforce liens, foreclose on loan defaults, and other issues incident to its business. As of December 31, 2009, Frontier Bank had commenced collection proceedings on approximately 507 real estate
loans, and there may be additional lawsuits or claims arising out of or related to the impaired loans.
We are unable to predict the outcome of these matters. Our cash expenditures, including legal fees, associated with the pending litigation described above, and the regulatory proceedings described in Item 1 of this report under the caption “Regulation and Supervision,” cannot be reasonably predicted at this time. Litigation
and any potential regulatory actions or proceedings can be time-consuming and expensive and could divert management time and attention from our business, which could have a material adverse affect on our business, results of operations and financial condition.
Other than the regulatory proceedings described or referenced above and the anticipated institution of additional lawsuits or claims arising out of or related to the impaired loans, including lender liability claims and counterclaims, management does not believe that there are any proceedings threatened or pending against us which, if determined
adversely, would have a material effect on our business, results of operations, cash flows or financial position.
|
MARKET FOR REGISTRANT'S COMMON EQUITY, RELATED SHAREHOLDER MATTERS AND ISSUER PURCHASES OF EQUITY SECURITIES |
(a) Our common stock is traded on the NASDAQ Stock Market LLC under the symbol “FTBK.” The high and low sales prices of our common stock, by quarter, during the years ended December 31, 2009 and 2008, are as follows:
|
Year Ended December 31, |
||||||||||||||||
|
2009 |
2008 |
|||||||||||||||
|
High |
Low |
High |
Low |
|||||||||||||
|
First Quarter |
$ | 50.20 | $ | 11.20 | $ | 202.10 | $ | 150.55 | ||||||||
|
Second Quarter |
25.90 | 11.40 | 198.95 | 82.80 | ||||||||||||
|
Third Quarter |
17.10 | 6.55 | 178.85 | 87.20 | ||||||||||||
|
Fourth Quarter |
9.90 | 3.41 | 130.95 | 21.80 | ||||||||||||
(b) We only have one class of stock outstanding, which is common stock. At March 19, 2010, there were 4,725,076 shares outstanding and there were approximately 10,601 holders of record of our common stock. The principal market for our common stock is The NASDAQ Stock Market LLC.
(c) We did not pay quarterly cash dividends in 2009. The payment of future cash dividends is at the discretion of the Board of Directors and is subject to a number of factors, including results of operations, general business conditions, growth, financial condition and other factors deemed relevant. Further,
our ability to pay future cash dividends is subject to certain regulatory requirements and restrictions discussed in Note 2 of the Annual Report to Shareholders. Given our current operating results and need to raise additional capital, it is highly unlikely that dividends will be paid in the foreseeable future.
Additionally, our junior subordinated debt agreement prohibits us from paying dividends on shares of our common stock if we defer payment of interest on outstanding trust preferred securities. Commencing with the interest payments due in the first quarter of 2009, we elected to defer our quarterly interest payments on the junior
subordinated debentures, as permitted by the indenture agreement.
The table below indicates the cash dividends paid on each share of our common stock in the year ended December 31, 2008, adjusted for the one-for-ten reverse stock split, effective November 24, 2009:
|
Dividend Declared |
Record Date |
Payment Date | |||
| $ | 1.75 |
January 7, 2008 |
January 21, 2008 | ||
| 1.80 |
April 7, 2008 |
April 21, 2008 | |||
| 0.60 |
July 8, 2008 |
July 22, 2008 | |||
| 0.60 |
October 7, 2008 |
October 21, 2008 | |||
(d) The following table sets forth information regarding outstanding options and shares reserved for issuance under our stock-based compensation plans:
|
Number of securities to be issued upon exercise of outstanding options, warrants and rights |
Weighted average exercise price of outstanding options, warrants and rights |
Number of securities remaining available for future issuance under equity compensation plans (excluding securities reflected in the first column) |
||||||||||
|
Equity compensation plans approved by |
||||||||||||
|
security holders (A) |
231,724 | $ | 84.65 | 322,357 | ||||||||
|
Equity compensation plans not approved by |
||||||||||||
|
security holders (B) |
926 | N/A | - | |||||||||
| 232,650 | 322,357 | |||||||||||
|
(A) Consists of FFC Incentive Stock Options Plan |
||||||||||||
|
(B) Consists of FFC 1999 Employee Stock Award Plan, which expired in 2009 |
||||||||||||
Five-Year Stock Performance Graph
Total Cumulative Return to Shareholders
The graph below provides an indicator of cumulative shareholder returns for the Corporation as compared with the NASDAQ Bank Index and the S&P 500 Index.
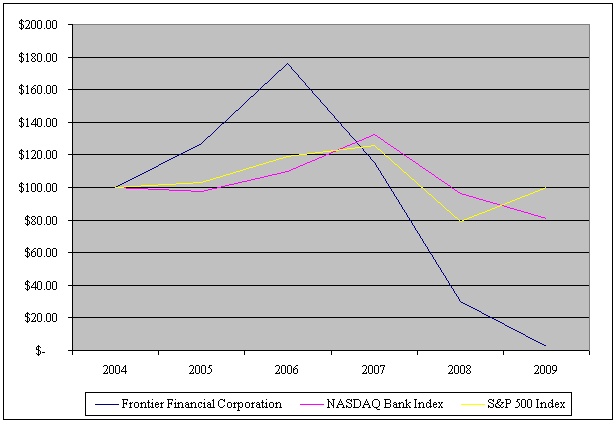
|
Index |
12/31/2004 |
12/31/2005 |
12/31/2006 |
12/31/2007 |
12/31/2008 |
12/31/2009 |
||||||||||||||||||
|
Frontier Financial Corporation |
$ | 100.00 | $ | 126.70 | $ | 175.77 | $ | 115.57 | $ | 30.09 | $ | 2.42 | ||||||||||||
|
NASDAQ Bank Index |
$ | 100.00 | $ | 97.70 | $ | 109.63 | $ | 132.37 | $ | 96.51 | $ | 80.86 | ||||||||||||
|
S&P 500 Index |
$ | 100.00 | $ | 103.00 | $ | 119.26 | $ | 125.81 | $ | 79.26 | $ | 100.24 | ||||||||||||
FINANCIAL HIGHLIGHTS
|
In thousands, except per share amounts and percentages |
||||||||||||||||||||||||
|
% Change |
||||||||||||||||||||||||
|
AT YEAR END |
2009 |
2008 |
2007 |
2006 |
2005 |
2009-2008 | ||||||||||||||||||
|
Total assets |
$ | 3,594,984 | $ | 4,104,445 | $ | 3,995,689 | $ | 3,238,464 | $ | 2,640,275 | -12.4 | % | ||||||||||||
|
Net loans |
2,718,149 | 3,666,177 | 3,558,127 | 2,867,351 | 2,355,419 | -25.9 | % | |||||||||||||||||
|
Securities |
87,194 | 93,691 | 135,121 | 114,711 | 110,617 | -6.9 | % | |||||||||||||||||
|
Deposits |
3,122,476 | 3,275,165 | 2,943,236 | 2,453,632 | 2,061,380 | -4.7 | % | |||||||||||||||||
|
Shareholders' equity |
61,486 | 352,043 | 459,612 | 395,283 | 296,097 | -82.5 | % | |||||||||||||||||
|
FOR THE YEAR |
||||||||||||||||||||||||
|
Interest income |
$ | 177,533 | $ | 279,055 | $ | 299,672 | $ | 250,144 | $ | 178,886 | -36.4 | % | ||||||||||||
|
Interest expense |
93,462 | 112,185 | 113,041 | 86,942 | 51,736 | -16.7 | % | |||||||||||||||||
|
Net interest income |
84,071 | 166,870 | 186,631 | 163,202 | 127,150 | -49.6 | % | |||||||||||||||||
|
Provision for loan losses |
375,000 | 120,000 | 11,400 | 7,500 | 4,200 | 212.5 | % | |||||||||||||||||
|
Securities gains (losses) |
(102 | ) | 4,570 | (937 | ) | (25 | ) | (211 | ) | -102.2 | % | |||||||||||||
|
Net income (loss) |
(295,094 | ) | (89,737 | ) | 73,938 | 68,910 | 51,584 | 228.8 | % | |||||||||||||||
|
Basic earnings (loss) per share |
$ | (62.61 | ) | $ | (19.10 | ) | $ | 16.33 | $ | 15.31 | $ | 12.14 | 227.8 | % | ||||||||||
|
Diluted earnings (loss) per share |
$ | (62.61 | ) | $ | (19.10 | ) | $ | 16.21 | $ | 15.15 | $ | 12.07 | 227.8 | % | ||||||||||
|
Cash dividends declared |
||||||||||||||||||||||||
|
per common share |
$ | - | $ | 4.75 | $ | 6.50 | $ | 5.00 | $ | 4.00 | -100.0 | % | ||||||||||||
|
Dividend payout ratio |
0.0 | % | -25.1 | % | 40.1 | % | 33.0 | % | 33.1 | % | -100.0 | % | ||||||||||||
|
Return on Average |
||||||||||||||||||||||||
|
Assets |
-6.51 | % | -2.18 | % | 2.13 | % | 2.27 | % | 2.09 | % | 198.6 | % | ||||||||||||
|
Equity |
-101.36 | % | -19.42 | % | 18.76 | % | 18.91 | % | 18.75 | % | 421.9 | % | ||||||||||||
|
Avg. equity/avg. assets |
6.42 | % | 11.25 | % | 11.36 | % | 11.98 | % | 11.16 | % | -42.9 | % | ||||||||||||
|
Efficiency Ratio |
98 | % | 45 | % | 37 | % | 38 | % | 41 | % | 117.8 | % | ||||||||||||
The information contained in this section should be read in conjunction with the Consolidated Financial Statements and accompanying Notes to the Consolidated Financial Statements in the Annual Report to Shareholders.
Frontier Financial Corporation (the “Corporation”), a Washington corporation, is a bank holding company owning all of the equity of its wholly owned subsidiary, Frontier Bank (the "Bank").
Financial Overview
For the year ended December 31, 2009, we had a net loss of $295.1 million, or ($62.61) per diluted share, compared to a net loss of $89.7 million, or ($19.10) per diluted share, for the year ended December 31, 2008, and net income of $73.9 million, or $16.21 per diluted share, for the year ended December 31, 2007. All prior period
results reflect the one-for-ten reverse stock split, which was effective November 24, 2009.
The results for 2009 reflect continued pressure from an uncertain economy and the negative impact of the regional housing market. The impact of the economic downturn resulted in:
|
· |
Allowance for loan losses of $151.3 million, or 5.27%, of total loans outstanding at December 31, 2009, compared to $112.6 million, or 2.98%, at December 31, 2008, and $54.0 million, or 1.49%, at December 31, 2007. |
|
· |
Net charge-offs of $337.3 million for 2009, compared to $63.0 million and $920 thousand for 2008 and 2007, respectively. |
|
· |
Nonperforming assets totaling $874.9 million, or 24.34% of total assets at December 31, 2009, compared to $446.0 million, or 10.87% of total assets at December 31, 2008. |
Despite these challenging times, the Board of Directors and management continue to take important steps to strengthen the Corporation. During the year, we:
|
· |
Successfully reduced our concentrations in real estate construction and land development loans, including undisbursed loan commitments as defined by the FDIC, by $979.7 million, or 48.7%, from December 31, 2008 to December 31, 2009. |
|
· |
Continued to closely monitor and manage our liquidity position and at December 31, 2009, total liquidity, as a percentage of assets, was at its highest level for 2009, totaling 13.5%. |
|
· |
Successfully reduced other targeted noninterest expenses. Management set a goal of reducing targeted noninterest expense categories by $8.5 million for 2009. The cost containment efforts resulted in a reduction of targeted expense categories by $10.2 million in 2009. Those categories included salaries and benefits, consulting,
marketing, advertising, director fees and expenses related to furniture and equipment. |
The results for the year ended December 31, 2009, also reflect a $90.7 million income tax benefit primarily related to newly enacted legislation that allows banks, such as Frontier Bank, which had not received government assistance in the form of TARP, to carryback losses incurred in 2008 or 2009 for a period of five years. We
expect to receive an income tax refund of approximately $82.4 million in 2010.
Recent Events
On March 16, 2010, the Federal Deposit Insurance Corporation (“FDIC”) issued a Supervisory Prompt Corrective Action Directive (the “FDIC Directive”) to Frontier Bank. Refer to Note 2 of the Annual Report to Shareholders for further discussion.
On July 2, 2009, the Corporation entered into a Written Agreement (the “FRB Written Agreement”) with the Federal Reserve Bank of San Francisco (the “FRB”). Refer to Note 2 of the Annual Report to Shareholders for further discussion.
On March 20, 2009, Frontier Bank entered into a Stipulation and Consent to the Issuance of an Order to Cease and Desist (the “FDIC Order”) with the FDIC and the Washington Department of Financial Institutions (the “Washington DFI”). Refer to Note 2 of the Annual Report to Shareholders for further discussion.
Critical Accounting Policies and Estimates
The preparation of the consolidated financial statements in conformity with accounting principles generally accepted in the United States requires management to make estimates and assumptions that affect amounts reported in the consolidated financial statements and the accompanying notes. Changes in these estimates and assumptions are considered
reasonably possible and may have a material impact on the consolidated financial statements and thus actual results could differ from the amounts reported and disclosed herein. We consider the allowance for loan loss a critical accounting policy subject to estimate. For additional information regarding the allowance for loan losses, refer to Allowance for Loan Losses in this Management’s Discussion and Analysis and Allowance for Loan Losses in Note 1 of the Annual Report to Shareholders.
Our financial statements are based on the selection and application of significant accounting policies which require management to make significant estimates and assumptions (see Note 1 of the Annual Report to Shareholders). We believe that the allowance for loan losses is one of the more critical judgment areas in the application
of our accounting policies that affect financial condition and results of operations.
Material estimates particularly susceptible to significant change relate to the determination of the allowance for loan losses, the assessment of impaired loans, deferred income taxes, fair value measurements, the valuation of stock options and valuation of real estate acquired in connection with foreclosures or in satisfaction of loans.
In connection with the determination of the allowance for loan losses and the valuation of foreclosed assets held for sale, management obtains independent appraisals for significant properties.
Review of Financial Condition
Securities
At December 31, 2009, securities totaled $87.2 million, compared to $93.7 million at December 31, 2008, a decrease of $6.5 million, or 6.9%. The year-over-year decrease in securities is primarily attributable to sales and maturities totaling $64.5 million, principal repayments on mortgage-backed securities totaling $8.2 million,
amortization of net purchase price premiums of $848 thousand and a decrease in the fair value of available for sale securities of $472 thousand. These were partially offset by the purchase of $67.6 million of available for sale securities.
Additional information about the securities portfolio is provided in Note 3 of the Annual Report to Shareholders.
The following table presents the available for sale and held to maturity securities by major type as of December 31 for each of the last three years (in thousands):
|
2009 |
2008 |
2007 |
||||||||||||||||||||||
|
Amortized Cost |
Fair Value |
Amortized Cost |
Fair Value |
Amortized Cost |
Fair Value |
|||||||||||||||||||
|
AFS Securities |
||||||||||||||||||||||||
|
Equities |
$ | 1,818 | $ | 2,099 | $ | 6,107 | $ | 1,930 | $ | 27,606 | $ | 34,575 | ||||||||||||
|
U.S. Treasuries |
250 | 311 | 6,304 | 6,457 | 6,223 | 6,311 | ||||||||||||||||||
|
U.S. Agencies |
39,786 | 39,877 | 51,594 | 52,055 | 71,385 | 72,167 | ||||||||||||||||||
|
Corporate securities |
7,841 | 6,882 | 4,528 | 4,439 | 15,537 | 15,180 | ||||||||||||||||||
|
Mortgage-backed securities |
32,653 | 33,336 | 22,791 | 22,791 | - | - | ||||||||||||||||||
|
Municipal securities |
2,500 | 2,587 | 2,855 | 2,934 | 3,134 | 3,145 | ||||||||||||||||||
| 84,848 | 85,092 | 94,179 | 90,606 | 123,885 | 131,378 | |||||||||||||||||||
|
HTM Securities |
||||||||||||||||||||||||
|
Corporate securities |
1,524 | 1,435 | 1,524 | 1,753 | 1,525 | 1,524 | ||||||||||||||||||
|
Municipal securities |
578 | 589 | 1,561 | 1,587 | 2,218 | 2,242 | ||||||||||||||||||
| 2,102 | 2,024 | 3,085 | 3,340 | 3,743 | 3,766 | |||||||||||||||||||
|
Total |
$ | 86,950 | $ | 87,116 | $ | 97,264 | $ | 93,946 | $ | 127,628 | $ | 135,144 | ||||||||||||
The following table sets forth the maturities of available for sale and held to maturity securities, at amortized cost, at December 31, 2009 (in thousands). Tax equivalent values are used in calculating weighted average yields, assuming a 35% tax rate.
|
After 1 Yr |
After 5 Yrs |
Total & |
||||||||||||||||||
|
Within |
But Within |
But Within |
After |
Weighted |
||||||||||||||||
|
1 Year/ |
5 Years/ |
10 Years/ |
10 Years/ |
Average |
||||||||||||||||
|
Yield |
Yield |
Yield |
Yield |
Yield |
||||||||||||||||
|
Equities |
$ | - | $ | - | $ | - | $ | 1,818 | $ | 1,818 | ||||||||||
| - | - | - | 0.42 | % | 0.42 | % | ||||||||||||||
|
U.S. Treasury |
- | - | 250 | - | 250 | |||||||||||||||
| - | - | 7.20 | % | - | 7.20 | % | ||||||||||||||
|
U.S. Agencies |
1,508 | 38,278 | - | - | 39,786 | |||||||||||||||
| 3.86 | % | 1.38 | % | - | - | 1.48 | % | |||||||||||||
|
Corporate securities |
5,325 | - | - | 4,040 | 9,365 | |||||||||||||||
| 0.38 | % | - | - | 10.13 | % | 4.59 | % | |||||||||||||
|
Mortgage-backed securities |
- | - | - | 32,653 | 32,653 | |||||||||||||||
| - | - | - | 4.16 | % | 4.16 | % | ||||||||||||||
|
Municipal securities |
753 | - | 1,354 | 971 | 3,078 | |||||||||||||||
| 5.32 | % | - | 5.15 | % | 7.24 | % | 5.85 | % | ||||||||||||
| $ | 7,586 | $ | 38,278 | $ | 1,604 | $ | 39,482 | $ | 86,950 | |||||||||||
| 1.56 | % | 1.38 | % | 5.47 | % | 4.26 | % | 2.85 | % | |||||||||||
Loans
The major classifications of loans, excluding loans held for resale and net of deferred loan fees, at December 31 are as follows (in thousands):
|
2009 |
2008 |
2007 |
2006 |
2005 |
||||||||||||||||
|
Commercial and industrial |
$ | 388,548 | $ | 457,215 | $ | 402,569 | $ | 380,939 | $ | 321,303 | ||||||||||
|
Real Estate: |
||||||||||||||||||||
|
Commercial |
965,266 | 1,044,833 | 1,003,916 | 897,714 | 859,251 | |||||||||||||||
|
Construction |
447,879 | 949,909 | 1,062,662 | 735,926 | 554,021 | |||||||||||||||
|
Land development |
319,320 | 580,453 | 537,410 | 399,950 | 269,662 | |||||||||||||||
|
Completed lots |
252,492 | 249,685 | 249,573 | 188,032 | 143,652 | |||||||||||||||
|
Residential 1-4 family |
423,032 | 424,492 | 282,344 | 235,169 | 188,772 | |||||||||||||||
|
Installment and other loans |
69,740 | 65,468 | 67,421 | 63,050 | 46,852 | |||||||||||||||
|
Total loans |
$ | 2,866,277 | $ | 3,772,055 | $ | 3,605,895 | $ | 2,900,780 | $ | 2,383,513 | ||||||||||
Total loans, excluding loans held for resale, decreased $905.8 million, or 24.0%, to $2.87 billion at December 31, 2009, from $3.77 billion a year ago. Management has been diligently working to reduce the concentration in real estate construction and land development
loans, as defined by the FDIC, and has successfully reduced these portfolios by $979.7 million, or 48.7%, from December 31, 2008 to December 31, 2009, including undisbursed loan commitments.
Despite the increase in outstanding balance, there were no new completed lot loans originated from December 31, 2008 to December 31, 2009. In certain circumstances, where real estate construction projects will not be completed, they are reclassified as real estate completed lot loans. We reclassified $22.6 million
of residential construction loans to residential completed lot loans as of December 31, 2009. Reclassification of a residential construction loan to a residential lot loan eliminates any remaining unadvanced funds originally intended for construction. The background loan loss reserve is adjusted on subject loans to the new loan type and grade, and if placed into nonperforming status, a specific reserve is assigned. There were no changes in the related loan agreements resulting
in credits that would be considered troubled debt restructurings. At December 31, 2009, $13.7 million of residential construction loans converted to residential lot loans were nonperforming.
Contractual maturities of loans, excluding loans held for resale and net of deferred fees, at December 31, 2009, are shown below (in thousands). Expected maturities may differ from contractual maturities because borrowers may have the right to prepay loans with or without prepayment penalties.
|
Within 1 Year |
1 -5 Years |
After 5 Years |
Total |
|||||||||||||
|
Commercial and industrial |
$ | 240,476 | $ | 102,185 | $ | 45,887 | $ | 388,548 | ||||||||
|
Real Estate: |
||||||||||||||||
|
Commercial |
115,682 | 558,693 | 290,891 | 965,266 | ||||||||||||
|
Construction |
399,646 | 48,233 | - | 447,879 | ||||||||||||
|
Land development |
293,038 | 26,282 | - | 319,320 | ||||||||||||
|
Completed lots |
196,795 | 53,661 | 2,036 | 252,492 | ||||||||||||
|
Residential 1-4 family |
136,187 | 209,410 | 77,435 | 423,032 | ||||||||||||
|
Installment and other loans |
18,401 | 14,113 | 37,226 | 69,740 | ||||||||||||
|
Total loans |
$ | 1,400,225 | $ | 1,012,577 | $ | 453,475 | $ | 2,866,277 | ||||||||
|
1 -5 Years |
After 5 Years |
|||||||||||||||
|
Fixed rates |
$ | 781,942 | $ | 102,894 | ||||||||||||
|
Variable rates |
230,635 | 350,581 | ||||||||||||||
| $ | 1,012,577 | $ | 453,475 | |||||||||||||
Allowance for Loan Losses
The allowance for loan losses is the amount which, in the opinion of management, is necessary to absorb future probable loan losses. Management’s determination of the level of the provision for loan losses is based on various judgments and assumptions, including general economic conditions, loan portfolio composition, prior
loan loss experience, the evaluation of credit risk related to specific credits and market segments and monitoring results from our ongoing internal credit review staff. Management also reviews the growth and terms of loans so that the allowance can be adjusted for probable losses. The allowance methodology takes into account that the loan loss reserve will change at different points in time based on economic conditions, credit performance, loan mix and collateral values.
Management and the Board review policies and procedures at least annually, and changes are made to reflect the current operating environment integrated with regulatory requirements. Partly out of these policies has evolved an internal credit risk review process. During this process, the quality grades of loans are
reviewed and loans are assigned a dollar value of the loan loss reserve by degree of risk. This analysis is performed quarterly and reviewed by senior management who makes the determination if the risk is reasonable and if the reserve is adequate. This quarterly analysis is then reviewed by the Board of Directors.
The allowance for loan losses totaled $151.3 million, or 5.27%, of total loans outstanding at December 31, 2009. This compares to the allowance for loan losses of $112.6 million, or 2.98%, of total loans outstanding at December 31, 2008, and $54.0 million, or 1.49%, at December 31, 2007. The increase in the allowance
for loan loss for 2009, as compared to 2008 and 2007, is primarily attributable to the downturn in the economy and the negative impact on the regional housing market, which significantly affected our real estate construction, land development and completed lot portfolios.
For the year ended December 31, 2009, net charge-offs totaled $337.3 million, compared to $63.0 million for the year ended December 31, 2008, and $920 thousand for the year ended December 31, 2007.
Our allowance for loan losses, as a percentage of total loans, is impacted by nonperforming loans as a significant portion of our nonperforming loans are collateral dependent. Nonperforming loans result in the assignment of a specific reserve that adjusts the net book value of the loan’s principal balance to reflect the
estimated fair value of supporting collateral or result in no assignment of a specific reserve if the loans collateral value is in excess of its book value. Our customary practice is to charge-off the amount of impairment representing the excess of the loan’s net book value over the estimated fair value within the quarter a loan is identified as nonperforming and a confirmed loss (“partial charge-off”). For nonperforming loans not immediately charged-off as a result of the determination
of a confirmed loss, a specific reserve representing the amount of estimated impairment is applied. Impaired loans are assessed for valuation on a recurring basis. Once a partial charge-off is taken no additional reserve is required, unless as a result of our recurring impairment analysis, new information becomes available that would necessitate further adjustment to the allowance for loan losses and subsequent write downs. As a result, many of the nonperforming loans are collateral-based
loans measured at fair value and the balance in excess of collateral value is charged-off during the same quarter, thus resulting in a lower coverage ratio (total allowance for loan losses divided by total nonperforming loans).
The following table includes information pertaining to the allowance for loan losses and nonperforming loans at December 31 (in thousands):
|
2009 |
2008 |
|||||||
|
Total loans |
$ | 2,869,498 | $ | 3,778,733 | ||||
|
General reserves |
$ | 96,531 | $ | 99,671 | ||||
|
Specific reserves |
54,818 | 12,885 | ||||||
|
Total allowance for loan losses |
$ | 151,349 | $ | 112,556 | ||||
|
Nonperforming loans with specific reserves |
||||||||
|
included in the allowance for loan losses |
361,541 | $ | 96,238 | |||||
|
Nonperforming loans without specific reserves |
||||||||
|
included in the allowance for loan losses |
343,652 | 338,987 | ||||||
|
Total nonperforming loans |
$ | 705,193 | $ | 435,225 | ||||
|
Total charge-offs related to nonperforming loans |
$ | 185,306 | $ | 48,168 | ||||
|
Nonperforming loans recorded at carrying |
||||||||
|
value to total loans |
11.98 | % | 8.97 | % | ||||
|
Nonperforming loans recorded at carrying value |
||||||||
|
to total nonperforming loans |
48.73 | % | 77.89 | % | ||||
|
Coverage ratio (total allowance for loan losses divided |
||||||||
|
by total nonperforming loans) |
21.46 | % | 25.86 | % | ||||
|
Coverage ratio after considering effects of charge-offs |
37.81 | % | 33.25 | % | ||||
|
Coverage ratio net of nonperforming loans carried at |
||||||||
|
carrying value |
41.86 | % | 116.96 | % | ||||
|
Total loans less nonperforming loans at carrying value |
$ | 2,525,846 | $ | 3,439,746 | ||||
|
Total allowance for loan losses/total loans |
5.27 | % | 2.98 | % | ||||
|
Total allowance for loan losses/total loans less nonperforming |
||||||||
|
loans at carrying value |
5.99 | % | 3.27 | % | ||||
|
Specific reserves/balance of nonperforming loans with |
||||||||
|
specific reserves |
15.16 | % | 13.39 | % | ||||
The following table provides an analysis of the allowance for loan losses and the net losses, by loan type, for the years ended December 31 (in thousands):
|
2009 |
2008 |
2007 |
2006 |
2005 |
||||||||||||||||
|
Balance at beginning of year |
$ | 114,638 | $ | 57,658 | $ | 44,195 | $ | 37,075 | $ | 32,728 | ||||||||||
|
Provision for loan losses |
375,000 | 120,000 | 11,400 | 7,500 | 4,200 | |||||||||||||||
|
Loans charged-off: |
||||||||||||||||||||
|
Commercial and industrial |
(39,044 | ) | (3,101 | ) | (1,183 | ) | (2,283 | ) | (342 | ) | ||||||||||
|
Real estate: |
||||||||||||||||||||
|
Commercial |
(10,477 | ) | (1,264 | ) | - | - | (4 | ) | ||||||||||||
|
Construction |
(117,258 | ) | (31,968 | ) | (201 | ) | (855 | ) | - | |||||||||||
|
Land development |
(109,651 | ) | (12,165 | ) | - | - | - | |||||||||||||
|
Completed lots |
(44,031 | ) | (13,839 | ) | - | - | - | |||||||||||||
|
Residential 1-4 family |
(18,708 | ) | (846 | ) | (300 | ) | - | (116 | ) | |||||||||||
|
Installment and other |
(2,362 | ) | (343 | ) | (222 | ) | (156 | ) | (244 | ) | ||||||||||
|
Total charged-off loans |
(341,531 | ) | (63,526 | ) | (1,906 | ) | (3,294 | ) | (706 | ) | ||||||||||
|
Recoveries: |
||||||||||||||||||||
|
Commercial and industrial |
715 | 308 | 845 | 353 | 623 | |||||||||||||||
|
Real estate: |
||||||||||||||||||||
|
Commercial |
2 | - | - | - | - | |||||||||||||||
|
Construction |
2,705 | 161 | - | - | 142 | |||||||||||||||
|
Land development |
12 | - | - | - | - | |||||||||||||||
|
Completed lots |
665 | 9 | - | - | - | |||||||||||||||
|
Residential 1-4 family |
62 | - | - | - | 27 | |||||||||||||||
|
Installment and other |
72 | 28 | 141 | 60 | 61 | |||||||||||||||
|
Total recoveries |
4,233 | 506 | 986 | 413 | 853 | |||||||||||||||
|
Net (charge-offs) recoveries |
(337,298 | ) | (63,020 | ) | (920 | ) | (2,881 | ) | 147 | |||||||||||
|
Balance before portion identified |
||||||||||||||||||||
|
for undisbursed loans |
152,340 | 114,638 | 54,675 | 41,694 | 37,075 | |||||||||||||||
|
Reserve acquired in merger |
- | - | 2,983 | 2,501 | - | |||||||||||||||
|
Portion of reserve identified for |
||||||||||||||||||||
|
undisbursed loans and |
||||||||||||||||||||
|
reclassified as a liability |
(991 | ) | (2,082 | ) | (3,663 | ) | (3,546 | ) | (3,270 | ) | ||||||||||
|
Balance at end of year |
$ | 151,349 | $ | 112,556 | $ | 53,995 | $ | 40,649 | $ | 33,805 | ||||||||||
|
Total loans at end of period (1) |
$ | 2,869,498 | $ | 3,778,733 | $ | 3,612,122 | $ | 2,908,000 | $ | 2,389,224 | ||||||||||
|
Daily average loans |
$ | 3,430,885 | $ | 3,774,501 | $ | 3,185,751 | $ | 2,731,257 | $ | 2,200,344 | ||||||||||
|
Ratio of net charged-offs |
||||||||||||||||||||
|
(recoveries) during the period |
||||||||||||||||||||
|
to average loans outstanding |
9.83 | % | 1.67 | % | 0.03 | % | 0.11 | % | -0.01 | % | ||||||||||
|
Loan loss reserve as a |
||||||||||||||||||||
|
percentage of total loans |
5.27 | % | 2.98 | % | 1.49 | % | 1.40 | % | 1.41 | % | ||||||||||
|
(1) Includes loans held for resale |
||||||||||||||||||||
Based on certain characteristics of the portfolio, potential losses can be anticipated by major loan categories. In the following table, the allowance for loan losses for the years ended December 31, has been allocated among the major loan categories based primarily on their historical net charge-off experience, along with consideration
of factors such as quality, volume, anticipated economic conditions and other business considerations (in thousands).
|
Loan |
Loan |
Loan |
||||||||||||||||||||||
|
2009 |
Category |
2008 |
Category |
2007 |
Category |
|||||||||||||||||||
|
Reserve |
Percent |
Reserve |
Percent |
Reserve |
Percent |
|||||||||||||||||||
|
Commercial and industrial |
$ | 19,856 | 13.6 | % | $ | 15,127 | 12.1 | % | $ | 9,856 | 11.2 | % | ||||||||||||
|
Real estate: |
||||||||||||||||||||||||
|
Commercial |
17,557 | 33.7 | % | 11,388 | 27.7 | % | 12,373 | 27.8 | % | |||||||||||||||
|
Construction |
31,997 | 15.6 | % | 27,636 | 25.2 | % | 824 | 29.5 | % | |||||||||||||||
|
Land development |
24,437 | 11.1 | % | 22,701 | 15.4 | % | 5,257 | 14.9 | % | |||||||||||||||
|
Completed lots |
19,447 | 8.8 | % | 9,054 | 6.6 | % | 3,443 | 6.9 | % | |||||||||||||||
|
Residential 1-4 family |
26,128 | 14.8 | % | 14,056 | 11.3 | % | 16,900 | 7.8 | % | |||||||||||||||
|
Installment and other |
3,132 | 2.4 | % | 1,071 | 1.7 | % | 1,060 | 1.9 | % | |||||||||||||||
|
Unallocated |
8,795 | 11,523 | 4,282 | |||||||||||||||||||||
| 151,349 | 112,556 | 53,995 | ||||||||||||||||||||||
|
Portion of reserve identified for undisbursed |
||||||||||||||||||||||||
|
loans and reclassifed as a liability |
991 | 2,082 | 3,663 | |||||||||||||||||||||
| $ | 152,340 | 100.0 | % | $ | 114,638 | 100.0 | % | $ | 57,658 | 100.0 | % | |||||||||||||
|
Loan |
Loan |
|||||||||||||||||||||||
| 2006 |
Category |
2005 |
Category |
|||||||||||||||||||||
|
Reserve |
Percent |
Reserve |
Percent |
|||||||||||||||||||||
|
Commercial and industrial |
$ | 9,726 | 13.1 | % | $ | 11,061 | 13.5 | % | ||||||||||||||||
|
Real estate: |
||||||||||||||||||||||||
|
Commercial |
11,040 | 30.9 | % | 12,622 | 36.0 | % | ||||||||||||||||||
|
Construction |
809 | 25.4 | % | 504 | 23.2 | % | ||||||||||||||||||
|
Land development |
4,123 | 13.8 | % | 1,699 | 11.3 | % | ||||||||||||||||||
|
Completed lots |
1,560 | 6.5 | % | 907 | 6.0 | % | ||||||||||||||||||
|
Residential 1-4 family |
7,168 | 8.1 | % | 4,088 | 7.9 | % | ||||||||||||||||||
|
Installment and other |
1,012 | 2.2 | % | 724 | 2.1 | % | ||||||||||||||||||
|
Unallocated |
5,211 | 2,200 | ||||||||||||||||||||||
| 40,649 | 33,805 | |||||||||||||||||||||||
|
Portion of reserve identified for undisbursed |
||||||||||||||||||||||||
|
loans and reclassified as a liability |
3,546 | 3,270 | ||||||||||||||||||||||
| $ | 44,195 | 100.0 | % | $ | 37,075 | 100.0 | % | |||||||||||||||||
Historical net charge-offs are not necessarily accurate indicators of future losses since net charge-offs vary from period to period due to economic conditions and other factors that cannot be accurately predicted. Thus, an evaluation based on historical loss experience within individual loan categories is only one of many factors considered
by management in evaluating the adequacy of the overall allowance.
Nonperforming Assets
Loans delinquent 90 days or more or other nonaccruing, restructured and other real estate owned (“OREO”), on which the accrual of interest has been discontinued at December 31 are as follows (in thousands):
|
2009 |
2008 |
2007 |
2006 |
2005 |
||||||||||||||||
|
Commercial and industrial |
$ | 31,401 | $ | 12,908 | $ | 159 | $ | 574 | $ | 4,939 | ||||||||||
|
Real estate: |
||||||||||||||||||||
|
Commercial |
89,708 | 10,937 | - | - | - | |||||||||||||||
|
Construction |
192,215 | 181,905 | 19,842 | 47 | - | |||||||||||||||
|
Land development |
234,627 | 177,139 | - | 7,143 | - | |||||||||||||||
|
Completed lots |
87,632 | 34,005 | 804 | - | - | |||||||||||||||
|
Residential 1-4 family |
68,178 | 17,686 | 93 | 889 | - | |||||||||||||||
|
Installment and other |
1,432 | 645 | 10 | - | 10 | |||||||||||||||
|
Total nonaccruing loans |
705,193 | 435,225 | 20,908 | 8,653 | 4,949 | |||||||||||||||
|
Other real estate owned |
169,674 | 10,803 | 367 | - | - | |||||||||||||||
|
Total nonperforming assets |
$ | 874,867 | $ | 446,028 | $ | 21,275 | $ | 8,653 | $ | 4,949 | ||||||||||
|
Restructured loans |
$ | - | $ | - | $ | - | $ | - | $ | - | ||||||||||
|
Total loans at end of period (1) |
$ | 2,869,498 | $ | 3,778,733 | $ | 3,612,122 | $ | 2,908,000 | $ | 2,389,224 | ||||||||||
|
Total assets at end of period |
$ | 3,594,984 | $ | 4,104,445 | $ | 3,995,689 | $ | 3,238,464 | $ | 2,640,275 | ||||||||||
|
Total nonperforming loans to total loans |
24.58 | % | 11.52 | % | 0.58 | % | 0.30 | % | 0.21 | % | ||||||||||
|
Total nonperforming assets to total assets |
24.34 | % | 10.87 | % | 0.53 | % | 0.27 | % | 0.19 | % | ||||||||||
|
(1) Includes loans held for resale |
||||||||||||||||||||
For the years ended December 31, there are certain amounts of interest collected on nonaccrual loans that is included in income, and amounts that have not been accrued, which are indicated in the following table (in thousands):
|
2009 |
2008 |
2007 |
2006 |
2005 |
||||||||||||||||
|
Additional interest income which |
||||||||||||||||||||
|
would have been recorded during the |
||||||||||||||||||||
|
period under original loan terms |
$ | 65,790 | $ | 18,915 | $ | 757 | $ | 761 | $ | 67 | ||||||||||
|
Interest collected and included in |
||||||||||||||||||||
|
net income for the period |
$ | 18,100 | $ | 21,004 | $ | 1,131 | $ | 344 | $ | 327 | ||||||||||
|
Commitments for additional funds |
||||||||||||||||||||
|
related to loans above |
$ | - | $ | - | $ | - | $ | - | $ | - | ||||||||||
Impaired Loans
A loan is considered impaired when management determines it is probable that all contractual amounts of principal and interest will not be paid as scheduled in the loan agreement. These loans include all nonaccrual loans, restructured loans and other loans that management considers to be at risk.
This assessment for impairment occurs when and while such loans are on nonaccrual or the loan has been restructured. When a loan with unique risk characteristics has been identified as being impaired, the amount of impairment will be measured by the Bank. If the current value of the impaired loan is less than the recorded
investment in the loan impairment is recognized by creating or adjusting an existing allocation of the allowance for loan losses.
Nonaccrual Loans
It is the Bank's practice to discontinue accruing interest on virtually all loans that are delinquent in excess of 90 days regardless of risk of loss, collateral, etc. Some problem loans, which are less than 90 days delinquent, are also placed into nonaccrual status if the success of collecting full principal and interest in a timely manner
is in doubt. Some loans will remain in nonaccrual even after improved performance until a consistent timely repayment pattern is exhibited and/or timely performance is considered reliable.
At December 31, 2009, nonaccrual loans totaled $705.2 million, compared to $435.2 million at December 31, 2008, and $20.9 million at December 31, 2007. The increase in nonaccruing loans for the period is primarily attributable to the slow down in the housing market and general economy, which significantly impacted our real estate
construction and land development portfolios. Of the total nonaccrual loans at December 31, 2009, 73.0% relate to our real estate construction, land development and completed lot portfolios.
At December 31, 2009 and 2008, nonaccruing loans totaling $361.5 million and $96.2 million had related specific reserves in the allowance for loan losses of $54.8 million and $12.9 million, respectively. Nonaccruing loans without related specific reserves in the allowance for loan losses at December 31, 2009
and 2008, totaled $343.7 million and $339.0 million, respectively.
Restructured Loans
In cases where a borrower experiences financial difficulties and we make certain concessionary modifications to the contractual terms, the loan is classified as a restructured (accruing) loan. Loans restructured at a rate equal to or greater than that of a new loan with comparable risk at the time of the contract is modified
may be excluded from the impairment assessment and may cease to be considered impaired.
Interest income on restructured loans is recognized pursuant to the terms of the new loan agreement. Interest income on impaired loans is monitored and based upon the terms of the underlying loan agreement. However, the recorded net investment in impaired loans, including accrued interest, is limited to the present value of the expected
cash flows of the impaired loan or the observable fair market value of the loan or the fair market value of the loan's collateral. There were no restructured loans at December 31, 2009 or 2008.
Other Real Estate Owned
Other real estate owned (“OREO”) is carried at the lesser of book value or market value, less selling costs. The costs related to completion, repair, maintenance, or other costs of such properties, are generally expensed with any gains or shortfalls from the ultimate sale of OREO being shown as other income or other
expense.
The following table presents the activity related to OREO for the years ended December 31 (in thousands):
|
2009 |
2008 |
|||||||||||||||
|
Amount |
Number |
Amount |
Number |
|||||||||||||
|
Beginning balance |
$ | 10,803 | 64 | $ | 367 | 1 | ||||||||||
|
Additions to OREO |
217,720 | 618 | 12,992 | 76 | ||||||||||||
|
Capitalized improvements |
884 | 623 | ||||||||||||||
|
Valuation adjustments |
(9,702 | ) | (68 | ) | ||||||||||||
|
Disposition of OREO |
(50,031 | ) | (188 | ) | (3,111 | ) | (13 | ) | ||||||||
|
Ending balance |
$ | 169,674 | 494 | $ | 10,803 | 64 | ||||||||||
Certain other loans, currently in nonaccrual, are in the process of foreclosure and potentially could become OREO. Efforts, however, are constantly underway to reduce and minimize such nonperforming assets. During 2008 and 2009, we expanded our special assets group to focus on reducing nonperforming assets.
The decision to begin a foreclosure action generally occurs after all other reasonable collection efforts have been found ineffective. We comply with all applicable state statues regarding foreclosure proceedings. Loans in foreclosure are always categorized as nonperforming assets, and as such, have been assigned a
specific loan loss reserve based on the most current property valuations available, discounted to reflect foreclosure expense, holding time and sales costs. Assuming no other legal actions, the statutory processing period for a so-called nonjudicial foreclosure in the state of Washington is a minimum of 120 days or 190 days after the date of default. The first step is a notice of default that is mailed to the borrower and posted at the property or the notice is delivered
to the borrower in person. The borrower is given 30 days to respond to the notice of default. If the borrower does not stop the foreclosure within 30 days after receiving the notice of default, we record a notice of sale with the appropriate county recorder. The notice of sale is recorded at least 90 days before the sale date and is mailed to the borrower and any other lien holders. The notice of sale is also published twice in a local newspaper. A
notice of foreclosure is also required to be sent to the borrower and/or guarantors if we want to retain the right to a deficiency. We are required to publish the notice of sale once between the 32nd and 28th days prior to the sale, and once between the 11th and 7th days before the sale. Foreclosure sales are by public auction with the property going to the highest bidder.
We will bid up to the amount of our loan balance. If we do not have a buyer for the collateral by the sale date, and there is no other or higher bidder, then we acquire ownership of the property for the amount of our credit bid, and the property becomes an OREO property of the Bank. The obligations of the guarantors
(but not the borrower) of a commercial loan for any deficiency (the amount by which the loan balance exceeds the foreclosure sale price), generally survives the sale and we may bring a lawsuit against the guarantors to collect the deficiency if we determine a judgment against the guarantors may be collectible and cost-effective.
A judicial foreclosure action may also be brought to collect a real estate loan in the state of Washington, and is used by Frontier Bank in certain cases; however, nonjudicial foreclosure is usually the preferred remedy because it is normally faster and less expensive than litigation, which can take from 6 months for summary judgment,
to 2 years for trial.
Foreclosure proceedings in the state of Oregon are similar to Washington’s in most material respects.
In addition, where appropriate, instead of foreclosure, we may negotiate a settlement agreement with the borrower, with a deed in lieu of foreclosure conveying the property to the Bank, to enable the Bank to acquire possession of the property faster than pursuing the normal foreclosure process.
The transition of loans from performing to nonperforming status will generally result in the assignment of a specific reserve that adjusts the net book value of the loan’s principal balance to reflect the estimated fair value of supporting collateral or result in no assignment of a specific reserve if the loans collateral value is
in excess of its book value. Subsequent write-downs, requiring additional loan loss provisioning, could occur as a loan moves through the foreclosure process into OREO based on recurring impairment analysis up to and until a property becomes an OREO.
Deposits
Interest bearing deposits at December 31 are as follows (in thousands):
|
2009 |
% |
2008 |
% |
2007 |
% |
|||||||||||||||||||
|
Money market, sweep and NOW accounts |
$ | 497,952 | 18.1 | % | $ | 325,554 | 11.3 | % | $ | 745,780 | 29.2 | % | ||||||||||||
|
Savings |
241,261 | 8.8 | % | 365,114 | 12.7 | % | 254,722 | 10.0 | % | |||||||||||||||
|
Time deposits, $100,000 and over |
830,508 | 30.3 | % | 1,430,685 | 49.7 | % | 832,373 | 32.6 | % | |||||||||||||||
|
Other time deposits |
1,175,497 | 42.8 | % | 758,361 | 26.3 | % | 719,835 | 28.2 | % | |||||||||||||||
|
Total interest bearing deposits |
$ | 2,745,218 | 100.0 | % | $ | 2,879,714 | 100.0 | % | $ | 2,552,710 | 100.0 | % | ||||||||||||
Maturities of time certificates of deposit of $100,000 and over at December 31, 2009 are shown below (in thousands):
|
3 months or less |
$ | 179,533 | ||
|
Over 3 months through 6 months |
134,425 | |||
|
Over 6 months through 12 months |
352,894 | |||
|
Over 12 months |
163,656 | |||
|
Total |
$ | 830,508 |
Federal Funds Purchases and Securities Sold Under Agreements to Repurchase
The amount of federal funds purchased and securities sold under agreement to repurchase for the years ended December 31 are as follows (in thousands):
|
Weighted |
Weighted |
Weighted |
||||||||||||||||||||||
|
Average |
Average |
Average |
||||||||||||||||||||||
|
Interest |
Interest |
Interest |
||||||||||||||||||||||
|
2009 |
Rate |
2008 |
Rate |
2007 |
Rate |
|||||||||||||||||||
|
Year end balance |
$ | 11,107 | 0.09 | % | $ | 21,616 | 0.10 | % | $ | 258,145 | 4.92 | % | ||||||||||||
|
Highest month end balance |
||||||||||||||||||||||||
|
during the period |
$ | 25,259 | $ | 198,200 | $ | 260,554 | ||||||||||||||||||
Federal Home Loan Bank Advances
The maximum and average outstanding balances and average interest rates on advances from FHLB were as follows for the year ended December 31 (in thousands):
|
2009 |
2008 |
2007 |
||||||||||
|
Maximum outstanding at any month end |
$ | 429,279 | $ | 429,417 | $ | 341,704 | ||||||
|
Average outstanding |
407,015 | 340,350 | 294,169 | |||||||||
|
Weighted average interest rates |
||||||||||||
|
Annual |
3.78 | % | 4.09 | % | 4.15 | % | ||||||
|
End of year |
3.91 | % | 3.91 | % | 4.43 | % | ||||||
Results of Operations
Net Interest Income
Net interest income is our principal source of revenue and is comprised of interest income on earning assets, less interest expense on interest bearing liabilities. The net interest margin is net interest income expressed as a percent of average earning assets and represents the difference between the yield on earning assets
and the composite interest rate paid on all sources of funds. Net interest income is adjusted to a taxable equivalent basis to present income earned on taxable and tax-exempt assets on a comparable basis. Reference to net interest income and net interest margin (“NIM”), in this discussion, represents taxable equivalent (“TE”) amounts using a tax rate of 35%, and applies only to loans and investments as no other assets or liabilities are affected by the adjustment.
TE net interest income for 2009 was $85.4 million, compared to $168.4 million in 2008, and $187.9 million in 2007. For all periods, the decrease in TE net interest income was primarily attributable to increases in net loan charge-offs and nonperforming loans placed on nonaccrual status. TE net interest income for 2009
was negatively impacted by the $17.0 million reversal of interest income on loans during the year. This compared to reversals of interest income on loans of $9.5 million in 2008 and $1.3 million in 2007.
The TE net interest margin was 2.23% for 2009, a decrease of 203 basis points as compared to 2008. The reversal of $17.0 million of interest income on nonaccrual loans in 2009 lowered the tax equivalent net interest margin by approximately 43 basis points. The year-over-year decrease in the TE net interest margin can
also be attributed to increases in total nonaccruing loans and net charge-offs, as well as a decrease in new loan originations. For the year ended December 31, 2009, new loan originations decreased 84.8%, compared to the same period a year ago, resulting in lower loan fees.
Also contributing to the decrease in the TE net interest margin for 2009, compared to 2008, was the change in mix of earning assets. As previously mentioned, in an effort to increase on-balance sheet liquidity, we have increased federal funds sold balances. For the years ended December 31, 2009 and 2008, average federal funds
sold accounted for approximately 7.8% and 0.7% of total average earning assets, respectively. Typically, federal funds sold are a lower earning asset and currently yield a rate of 0.25%.
The TE net interest margin was 4.26% for 2008, a decrease of 141 basis points as compared to 2007. The reversal of $9.5 million of interest income on nonaccrual loans in 2008 lowered the tax equivalent net interest margin by approximately 24 basis points. Also contributing the decrease in the TE net interest margin
for the period, were decreases in market index rates, such as prime and the fed funds rates. For the period, changes in interest rate decreased the yield on interest earning assets by 197 basis points and rates paid on interest bearing liabilities by 81 basis points.
Our net interest income is affected by changes in the amount and mix of interest earning assets and interest bearing liabilities, as well as, changes in the yields earned on interest earning assets and rates paid on deposits and borrowed funds. The average balances of interest earning assets and interest bearing liabilities,
along with tax equivalent interest income and expense and average rates earned and paid for the following years are as follows (in thousands):
|
Year Ended December 31, |
||||||||||||||||||||||||||||||||||||
|
2009 |
2008 |
2007 |
||||||||||||||||||||||||||||||||||
|
TE |
Average |
TE |
Average |
TE |
Average |
|||||||||||||||||||||||||||||||
|
Interest |
Rates |
Interest |
Rates |
Interest |
Rates |
|||||||||||||||||||||||||||||||
|
Average |
Income/ |
Earned/ |
Average |
Income/ |
Earned/ |
Average |
Income/ |
Earned/ |
||||||||||||||||||||||||||||
|
Balance |
Expense |
Paid |
Balance |
Expense |
Paid |
Balance |
Expense |
Paid |
||||||||||||||||||||||||||||
|
Interest Earning Assets |
||||||||||||||||||||||||||||||||||||
|
Taxable investments |
$ | 97,301 | $ | 2,663 | 2.74 | % | $ | 139,753 | $ | 5,054 | 3.62 | % | $ | 109,798 | $ | 4,585 | 4.18 | % | ||||||||||||||||||
|
Nontaxable investments (1) |
4,218 | 258 | 6.12 | % | 5,018 | 309 | 6.16 | % | 2,907 | 209 | 7.19 | % | ||||||||||||||||||||||||
|
Total |
101,519 | 2,921 | 2.88 | % | 144,771 | 5,363 | 3.70 | % | 112,705 | 4,794 | 4.25 | % | ||||||||||||||||||||||||
|
Federal funds sold |
300,617 | 766 | 0.25 | % | 29,197 | 457 | 1.57 | % | 18,405 | 958 | 5.21 | % | ||||||||||||||||||||||||
|
Loans (1) (2) |
||||||||||||||||||||||||||||||||||||
|
Installment |
69,851 | 5,004 | 7.16 | % | 68,562 | 5,813 | 8.48 | % | 62,841 | 6,083 | 9.68 | % | ||||||||||||||||||||||||
|
Commercial(1) |
429,256 | 26,616 | 6.20 | % | 437,481 | 32,064 | 7.33 | % | 383,242 | 33,776 | 8.81 | % | ||||||||||||||||||||||||
|
Real estate |
||||||||||||||||||||||||||||||||||||
|
Commercial (1) |
1,008,493 | 71,044 | 7.04 | % | 1,036,171 | 79,573 | 7.68 | % | 919,028 | 72,313 | 7.87 | % | ||||||||||||||||||||||||
|
Construction |
738,100 | 25,652 | 3.48 | % | 1,056,159 | 73,315 | 6.94 | % | 890,404 | 91,963 | 10.33 | % | ||||||||||||||||||||||||
|
Land development |
474,046 | 10,585 | 2.23 | % | 585,508 | 40,313 | 6.89 | % | 457,116 | 48,310 | 10.57 | % | ||||||||||||||||||||||||
|
Completed lots |
275,010 | 10,255 | 3.73 | % | 244,575 | 17,400 | 7.11 | % | 209,916 | 20,784 | 9.90 | % | ||||||||||||||||||||||||
|
Residential 1-4 family |
436,129 | 26,014 | 5.96 | % | 346,045 | 26,238 | 7.58 | % | 263,204 | 21,965 | 8.35 | % | ||||||||||||||||||||||||
|
Total loans |
3,430,885 | 175,170 | 5.11 | % | 3,774,501 | 274,716 | 7.28 | % | 3,185,751 | 295,194 | 9.27 | % | ||||||||||||||||||||||||
|
Total earning assets/total |
||||||||||||||||||||||||||||||||||||
|
interest income |
3,833,021 | 178,857 | 4.67 | % | 3,948,469 | 280,536 | 7.10 | % | 3,316,861 | 300,946 | 9.07 | % | ||||||||||||||||||||||||
|
Reserve for loan losses |
(120,733 | ) | (82,529 | ) | (43,972 | ) | ||||||||||||||||||||||||||||||
|
Cash and due from banks |
44,680 | 50,410 | 68,285 | |||||||||||||||||||||||||||||||||
|
Other assets |
218,946 | 191,221 | 129,390 | |||||||||||||||||||||||||||||||||
|
TOTAL ASSETS |
$ | 3,975,914 | $ | 4,107,571 | $ | 3,470,564 | ||||||||||||||||||||||||||||||
|
Interest Bearing Liabilities |
||||||||||||||||||||||||||||||||||||
|
Money Market, Sweep & |
||||||||||||||||||||||||||||||||||||
|
NOW accounts |
$ | 396,287 | $ | 2,753 | 0.69 | % | $ | 586,943 | $ | 8,950 | 1.52 | % | $ | 716,777 | $ | 23,990 | 3.35 | % | ||||||||||||||||||
|
Savings accounts |
298,370 | 3,293 | 1.10 | % | 349,318 | 7,405 | 2.12 | % | 268,017 | 6,207 | 2.32 | % | ||||||||||||||||||||||||
|
Other time deposits |
2,177,546 | 71,615 | 3.29 | % | 1,894,455 | 79,736 | 4.21 | % | 1,325,777 | 66,883 | 5.04 | % | ||||||||||||||||||||||||
|
Total interest bearing |
||||||||||||||||||||||||||||||||||||
|
deposits |
2,872,203 | 77,661 | 2.70 | % | 2,830,716 | 96,091 | 3.39 | % | 2,310,571 | 97,080 | 4.20 | % | ||||||||||||||||||||||||
|
Short-term borrowings |
16,226 | 15 | 0.09 | % | 73,460 | 1,562 | 2.13 | % | 42,542 | 2,212 | 5.20 | % | ||||||||||||||||||||||||
|
FHLB borrowings |
407,015 | 15,555 | 3.82 | % | 338,268 | 14,244 | 4.21 | % | 294,169 | 13,402 | 4.56 | % | ||||||||||||||||||||||||
|
Subordinated debt |
5,156 | 231 | 4.48 | % | 5,156 | 288 | 5.59 | % | 5,156 | 347 | 6.73 | % | ||||||||||||||||||||||||
|
Total interest bearing |
||||||||||||||||||||||||||||||||||||
|
liabilities/total |
||||||||||||||||||||||||||||||||||||
|
interest expense |
3,300,600 | 93,462 | 2.83 | % | 3,247,600 | 112,185 | 3.45 | % | 2,652,438 | 113,041 | 4.26 | % | ||||||||||||||||||||||||
|
Noninterest bearing |
||||||||||||||||||||||||||||||||||||
|
deposits |
397,533 | 379,766 | 396,293 | |||||||||||||||||||||||||||||||||
|
Other liabilities |
22,424 | 18,224 | 27,657 | |||||||||||||||||||||||||||||||||
|
Shareholders' equity |
255,357 | 461,981 | 394,176 | |||||||||||||||||||||||||||||||||
|
TOTAL LIABILITIES |
||||||||||||||||||||||||||||||||||||
|
AND CAPITAL |
$ | 3,975,914 | $ | 4,107,571 | $ | 3,470,564 | ||||||||||||||||||||||||||||||
|
NET INTEREST INCOME |
$ | 85,395 | $ | 168,351 | $ | 187,905 | ||||||||||||||||||||||||||||||
|
NET YIELD ON INTEREST |
||||||||||||||||||||||||||||||||||||
|
EARNING ASSETS |
2.23 | % | 4.26 | % | 5.67 | % | ||||||||||||||||||||||||||||||
|
(1) Includes amounts to convert nontaxable amounts to a fully taxable equivalent basis at a 35% tax rate. |
||||||||||||||||||||||||||||||||||||
|
(2) Includes nonaccruing loans. |
||||||||||||||||||||||||||||||||||||
The following table (in thousands) includes a breakdown of the change in earning assets and liabilities, referred to as "volume," and the repricing of assets and liabilities referred to as "rate."
|
Year ended December 31, |
||||||||||||||||||||||||
|
2009 versus 2008 |
2008 versus 2007 |
|||||||||||||||||||||||
|
Increase (Decrease) Due |
Increase (Decrease) Due |
|||||||||||||||||||||||
|
to Change in |
to Change in |
|||||||||||||||||||||||
|
Total |
Total |
|||||||||||||||||||||||
|
Average |
Average |
Increase |
Average |
Average |
Increase |
|||||||||||||||||||
|
Volume |
Rate |
(Decrease) |
Volume |
Rate |
(Decrease) |
|||||||||||||||||||
|
INTEREST INCOME |
||||||||||||||||||||||||
|
Taxable investments |
$ | (1,535 | ) | $ | (856 | ) | $ | (2,391 | ) | $ | 1,263 | $ | (794 | ) | $ | 469 | ||||||||
|
Nontaxable investments |
(49 | ) | (2 | ) | (51 | ) | 152 | (52 | ) | 100 | ||||||||||||||
|
Total |
(1,584 | ) | (858 | ) | (2,442 | ) | 1,415 | (846 | ) | 569 | ||||||||||||||
|
Federal funds sold |
4,248 | (3,939 | ) | 309 | 562 | (1,063 | ) | (501 | ) | |||||||||||||||
|
Loans |
||||||||||||||||||||||||
|
Installment |
109 | (918 | ) | (809 | ) | 554 | (824 | ) | (270 | ) | ||||||||||||||
|
Commercial |
(603 | ) | (4,845 | ) | (5,448 | ) | 4,780 | (6,492 | ) | (1,712 | ) | |||||||||||||
|
Real estate |
- | - | ||||||||||||||||||||||
|
Commercial |
(2,126 | ) | (6,428 | ) | (8,554 | ) | 9,217 | (1,957 | ) | 7,260 | ||||||||||||||
|
Construction |
(22,079 | ) | (25,544 | ) | (47,623 | ) | 17,120 | (35,768 | ) | (18,648 | ) | |||||||||||||
|
Land development |
(7,674 | ) | (22,056 | ) | (29,730 | ) | 13,569 | (21,566 | ) | (7,997 | ) | |||||||||||||
|
Completed lots |
2,165 | (9,314 | ) | (7,149 | ) | 3,432 | (6,816 | ) | (3,384 | ) | ||||||||||||||
|
Residential 1-4 family |
6,830 | (7,063 | ) | (233 | ) | 6,913 | (2,640 | ) | 4,273 | |||||||||||||||
|
Total loans |
(23,378 | ) | (76,168 | ) | (99,546 | ) | 55,585 | (76,063 | ) | (20,478 | ) | |||||||||||||
|
TOTAL INTEREST INCOME |
(20,714 | ) | (80,965 | ) | (101,679 | ) | 57,562 | (77,972 | ) | (20,410 | ) | |||||||||||||
|
INTEREST EXPENSE |
||||||||||||||||||||||||
|
Money Market, Sweep & |
||||||||||||||||||||||||
|
NOW accounts |
(2,907 | ) | (3,290 | ) | (6,197 | ) | (4,345 | ) | (10,695 | ) | (15,040 | ) | ||||||||||||
|
Savings accounts |
(1,080 | ) | (3,032 | ) | (4,112 | ) | 1,883 | (685 | ) | 1,198 | ||||||||||||||
|
Other time deposits |
11,915 | (20,036 | ) | (8,121 | ) | 28,689 | (15,836 | ) | 12,853 | |||||||||||||||
|
Total interest bearing deposits |
7,928 | (26,358 | ) | (18,430 | ) | 26,227 | (27,216 | ) | (989 | ) | ||||||||||||||
|
Short-term borrowings |
(1,217 | ) | (330 | ) | (1,547 | ) | 1,608 | (2,258 | ) | (650 | ) | |||||||||||||
|
FHLB borrowing |
2,895 | (1,584 | ) | 1,311 | 2,009 | (1,167 | ) | 842 | ||||||||||||||||
|
Subordinated debt |
- | (57 | ) | (57 | ) | - | (59 | ) | (59 | ) | ||||||||||||||
|
TOTAL INTEREST EXPENSE |
9,606 | (28,329 | ) | (18,723 | ) | 29,844 | (30,700 | ) | (856 | ) | ||||||||||||||
|
CHANGE IN NET INTEREST INCOME |
$ | (30,320 | ) | $ | (52,636 | ) | $ | (82,956 | ) | $ | 27,718 | $ | (47,272 | ) | $ | (19,554 | ) | |||||||
Provision for Loan Losses
The provision for loan losses totaled $375.0 million for the year ended December 31, 2009, compared to $120.0 million for the year ended December 31, 2008, and $11.4 million for the year ended December 31, 2007.
The increase in the provision for loan losses in 2009, as compared to 2008 and 2007, is primarily attributable to the overall decline in the economy, the downturn in the regional housing market and its impact on our real estate construction, land development and completed lot portfolios and an increase in nonperforming loans. At
December 31, 2009, nonperforming loans totaled $705.2 million, compared to $435.2 million at December 31, 2008, and $20.9 million at December 31, 2007.
The provision for loan losses is based on management’s evaluation of inherent risks in the loan portfolio and a corresponding analysis of the allowance for loan losses. Additional discussion on the allowance for loan losses is provided under the heading Allowance for Loan
Losses above.
Noninterest Income
Noninterest income for 2009 totaled $4.9 million, a decrease of $9.9 million, or 66.9%, compared to 2008. Noninterest income for 2008 totaled $14.8 million, an increase of $1.5 million, or 11.4%, compared to 2007. The following table presents the key components of noninterest income for the years ended December 31 (in thousands):
|
2009 compared to 2008 |
2008 compared to 2007 |
|||||||||||||||||||||||||||
|
2009 |
2008 |
2007 |
$ Change |
% Change |
$ Change |
% Change |
||||||||||||||||||||||
|
Other-than-temporary loss on securities |
$ | (4,289 | ) | $ | (6,430 | ) | $ | - | $ | 2,141 | -33.3 | % | $ | (6,430 | ) |
NM |
||||||||||||
|
Gain (loss) on sale of securities |
(102 | ) | 4,570 | (937 | ) | (4,672 | ) | -102.2 | % | 5,507 | -587.7 | % | ||||||||||||||||
|
Gain on sale of secondary mortgage loans |
1,675 | 1,321 | 1,586 | 354 | 26.8 | % | (265 | ) | -16.7 | % | ||||||||||||||||||
|
Gain on sale of premises and equipment |
136 | 30 | 24 | 106 | 353.3 | % | 6 | 25.0 | % | |||||||||||||||||||
|
Net gain (loss) on OREO |
(7,054 | ) | 97 | - | (7,151 | ) |
NM |
97 |
NM |
|||||||||||||||||||
|
Service charges on deposit accounts |
6,154 | 5,421 | 4,721 | 733 | 13.5 | % | 700 | 14.8 | % | |||||||||||||||||||
|
Other noninterest income |
8,394 | 9,821 | 7,915 | (1,427 | ) | -14.5 | % | 1,906 | 24.1 | % | ||||||||||||||||||
|
Total noninterest income |
$ | 4,914 | $ | 14,830 | $ | 13,309 | $ | (9,916 | ) | -66.9 | % | $ | 1,521 | 11.4 | % | |||||||||||||
Other-than-temporary loss on securities
Management evaluates securities and FHLB stock for other-than-temporary impairment (“OTTI”) at least on an annual basis, and more frequently when economic or market concerns warrant such evaluation. Consideration is given to: (1) the length of time and extent to which the fair value has been less than cost, (2) the
financial condition and near term prospects of the issuer, (3) our intent and ability to retain a security for a period of time sufficient to allow for any anticipated recovery in fair value and (4) whether we expect to recover the amortized cost basis of the security. For the years ended December 31, 2009 and 2008, OTTI losses totaling $4.3 million and $6.4 million, respectively, were recognized through earnings. No OTTI losses were recognized in the year ended December 31, 2007.
Gain (loss) on sale of securities
During 2008, we sold our interests in Skagit State Bank and Washington Banking Company and recorded pre-tax gains of $2.0 million and $2.5 million, respectively. We also recorded a one-time gain of $274 thousand related to the required liquidation in our stake of VISA, Inc. In addition, we sold Fannie Mae and Freddie
Mac preferred stock that we had previously written down for a pre-tax gain of $68 thousand. Partially offsetting these gains was a pre-tax loss of $1.0 million related to the sale of a Washington Mutual bond.
During 2007, we recorded a loss of $937 thousand as part of a balance sheet restructure in which we sold securities with less attractive yields and purchased new securities with higher yields.
Net gain (loss) on other real estate owned
During 2009, we recognized a net loss on other real estate owned of $7.1 million, primarily due to valuation adjustments totaling $9.7 million, resulting from declines in the market value of these properties subsequent to foreclosure. Valuation adjustment totaled $68 thousand in 2008 and there were no such valuation adjustments
in 2007.
Other noninterest income
For the year ended December 31, 2009, other noninterest income decreased $1.4 million, or 14.5%, compared to a year ago, and was primarily attributable to the decrease in revenues from our Insurance and Investment Center.
The increase in other noninterest income of $1.9 million, or 24.1%, for the year ended December 31, 2008, compared to the prior year ended, was primarily attributable to a $506 thousand gain on sale of consumer credit cards, a $613 thousand increase in debit card fee income, a $306 thousand increase in time deposit early withdrawal penalties,
a $293 thousand increase in ATM fees and a $196 thousand increase in trust fees.
Noninterest Expense
Noninterest expense for 2009 totaled $99.7 million, a decrease of $60.3 million, or 37.7%, compared to 2008. Noninterest expense for 2008 totaled $160.1 million, an increase of $83.1 million, or 107.8%, compared to 2007. The following table presents the key components of noninterest expense for the years ended December 31
(in thousands):
|
2009 compared to 2008 |
2008 compared to 2007 |
|||||||||||||||||||||||||||
|
2009 |
2008 |
2007 |
$ Change |
% Change |
$ Change |
% Change |
||||||||||||||||||||||
|
Salaries and employee benefits |
$ | 46,985 | $ | 48,403 | $ | 48,297 | $ | (1,418 | ) | -2.9 | % | $ | 106 | 0.2 | % | |||||||||||||
|
Occupancy expense |
10,953 | 11,148 | 9,956 | (195 | ) | -1.7 | % | 1,192 | 12.0 | % | ||||||||||||||||||
|
State business taxes |
1,068 | 2,013 | 2,066 | (945 | ) | -46.9 | % | (53 | ) | -2.6 | % | |||||||||||||||||
|
FHLB prepayment penalty |
- | - | 1,534 | - | - | (1,534 | ) | -100.0 | % | |||||||||||||||||||
|
FDIC insurance |
15,962 | 2,650 | 362 | 13,312 | 502.3 | % | 2,288 | 632.0 | % | |||||||||||||||||||
|
Other noninterest expense |
24,766 | 18,785 | 14,801 | 5,981 | 31.8 | % | 3,984 | 26.9 | % | |||||||||||||||||||
| 99,734 | 82,999 | 77,016 | 16,735 | 20.2 | % | 5,983 | 7.8 | % | ||||||||||||||||||||
|
Goodwill impairment |
- | 77,073 | - | (77,073 | ) | -100.0 | % | 77,073 |
NM |
|||||||||||||||||||
|
Total noninterest expense |
$ | 99,734 | $ | 160,072 | $ | 77,016 | $ | (60,338 | ) | -37.7 | % | $ | 83,056 | 107.8 | % | |||||||||||||
Salaries and employee benefits
The decrease in salaries and employee benefits for 2009, compared to a year ago, was primarily the result of the elimination of bonus and incentive pay, a reduction in executive compensation, a moratorium on hiring and a reduction in force, partially offset by a reduction in deferred loan costs. At December 31, 2009, full time
equivalent employees totaled 703, down from 799 at December 31, 2008, a decrease of 12.0%. In addition, the Board of Directors voted to suspend the Corporation’s matching of employee 401(K) Plan contributions, effective May 1, 2009. Excluding the impact of the lower deferred loan costs in 2009, resulting from lower loan originations, the reduction in salaries and benefits would have been $6.2 million.
FHLB prepayment penalty
For the year ended December 31, 2007, we incurred a pre-tax prepayment penalty of $1.5 million on the prepayment of $60.0 million of FHLB advances as part of our second quarter 2007 balance sheet restructure. The advances chosen to be paid off early were those having the least attractive cost and interest rate risk characteristics.
New advances of $60.0 million were purchased at a rate 126 basis points lower than the blended rates of the advances that were prepaid. There were no such prepayment penalties incurred for the years ended December 31, 2009 or 2008.
FDIC insurance
On May 22, 2009, the FDIC adopted a final rule levying a five basis point special assessment on each insured depository institution’s assets minus Tier 1 capital as of June 30, 2009. We recorded an expense of $1.9 million for the year ended December 31, 2009, to reflect the special assessment. In addition, the
FDIC increased the general assessment rate and, therefore, our FDIC general insurance premium expense increased in 2009 as compared to 2008 and 2007.
Other noninterest expense
The increase in other noninterest expense for 2009, compared to 2008, was primarily attributable to increases in collection expense, foreclosure expense and legal fees resulting from an increase in nonperforming assets for the period. Despite these increases, however, management has been successful in reducing other targeted
noninterest expenses, such as consulting, marketing, advertising, director fees and expenses related to furniture and equipment.
The $4.0 million, or 26.9%, increase in other noninterest expense for the year ended December 31, 2008, compared to the prior year ended, was primarily attributable a $1.5 million increase in consulting fees. Additionally, foreclosure expense increased $447 thousand, legal fees increased $367 thousand and collection expense increased
$226 thousand. These increases directly correspond to the increase in nonperforming assets over the period. Director expense also decreased $143 thousand as the directors elected to forego their monthly meeting fee beginning in the fourth quarter 2008.
Goodwill impairment
During the fourth quarter of 2008, we recorded a non-cash charge of $77.1 million related to the impairment of goodwill. This write down resulted from goodwill impairment testing that was performed at the end of the fourth quarter due to the quarterly decline in the stock price and the resulting difference between the market
capitalization and book value of the Corporation. The results of the goodwill impairment testing demonstrated that the estimated fair value of the Corporation, or reporting unit, was less than the book value, resulting in full impairment. This impairment charge had no effect on our cash balances or liquidity. In addition, because goodwill is not included in the calculation of regulatory capital, the Corporation’s and Bank’s regulatory ratios were not affected by this
non-cash expense.
Liquidity Resources
Liquidity refers to the ability to generate sufficient cash to meet the funding needs of current loan demand, deposit withdrawals, principal and interest payments with respect to outstanding borrowings and payment of operating expenses. The need for liquidity is affected by loan demand, net changes in deposit levels and the scheduled
maturities of borrowings. We monitor the sources and uses of funds on a daily basis to maintain an acceptable liquidity position. Liquidity is derived from assets by receipt of interest and principal payments and prepayments, by the ability to sell assets at market prices, earnings and by utilizing unpledged assets as collateral for borrowings.
We continue to closely monitor and manage our liquidity position, understanding that this is of critical importance in the current economic environment. At December 31, 2009, total liquidity, as a percentage of assets, was at its highest level for 2009, totaling 13.5%
In an effort to increase on-balance sheet liquidity, we have been focused on restructuring our balance sheet, and in particular, reducing the loan portfolio and increasing core deposits. As a result, we have increased our federal funds sold balances to $333.8 million at December 31, 2009, an increase of $216.1 million from a
year ago, to maintain a strong liquidity position. Year-over-year, total loans decreased $909.2 million, or 24.1%.
As shown in the Consolidated Statements of Cash Flows, net cash provided by operating activities was $67.6 million for the year ended December 31, 2009. The primary source (use) of cash provided by operating activities was net income (loss), after excluding non-cash charges such as the provision for loan losses of $375.0 million. Net
cash of $191.3 million provided by investing activities consisted primarily of $351.1 million from the net reduction of loan, $62.2 million from the maturity of available for sale securities and $52.7 million from proceeds on the sale of other real estate owned; partially offset by the $216.1 million increase in net federal funds sold and the purchase of $67.6 million of available for sale securities. The $217.1 million of cash used in financing activities primarily consisted of the $183.7 million
decrease in time deposits and the $53.9 million net decrease in FHLB advances.
Capital Requirements
Regulatory Capital Guidelines: Federal bank regulatory agencies use capital adequacy guidelines in the examination and regulation of bank holding companies and banks. The guidelines are “risk-based,” meaning that they are designed to make capital requirements
more sensitive to differences in risk profiles among banks and bank holding companies.
The minimum ratios and the actual capital ratios at December 31, 2009, are set forth in the table below:
|
Frontier Financial Corporation |
Frontier Bank |
Well Capitalized Minimum |
Adequately Capitalized Minimum |
|||||||||||||
|
Total capital to risk-weighted assets |
3.58 | % | 3.38 | % | 10.00 | % | 8.00 | % | ||||||||
|
Tier 1 capital to risk-weighted assets |
2.29 | % | 2.09 | % | 6.00 | % | 4.00 | % | ||||||||
|
Tier 1 leverage capital to average assets |
1.80 | % | 1.65 | % | 5.00 | % | 4.00 | % | ||||||||
Prompt Corrective Action (“PCA”): Under the guidelines, an institution is assigned to one of five capital categories depending on its total risk-based capital ratio, Tier I risk-based capital ratio, and leverage ratio, together with certain subjective factors. The categories
are “well capitalized,” “adequately capitalized,” “undercapitalized,” “significantly undercapitalized,” and “critically undercapitalized. Institutions that are deemed to be undercapitalized, depending on the category to which they are assigned, are subject to certain mandatory supervisory corrective actions.
As of December 31, 2009, Frontier Bank was categorized by the FDIC as “critically undercapitalized” for purposes of PCA, as a result of the FDIC Directive. Under the FDI Act’s PCA capital requirements (12 U.S.C. § 1831o), depository institutions that are “critically undercapitalized”, in
addition to being subject to a number of additional restrictions, must be placed into conservatorship or receivership within 90 days of becoming critically undercapitalized, unless the institution’s primary Federal regulatory authority (here, the FDIC) determines and documents that “other action” would better achieve the purposes of PCA. Refer to Note 2 of the Annual Report to Shareholders for further discussion.
Contractual Obligations and Commitments
The following table sets forth our long-term contractual obligations at December 31, 2009 (in thousands):
|
Payments due per period |
||||||||||||||||||||
|
Less Than |
||||||||||||||||||||
|
One Year |
1-3 Years |
3-5 Years |
Thereafter |
Total |
||||||||||||||||
|
Time deposits |
$ | 1,564,745 | $ | 389,244 | $ | 50,683 | $ | 1,333 | $ | 2,006,005 | ||||||||||
|
FHLB borrowings |
65,137 | 115,342 | 100,000 | 95,000 | 375,479 | |||||||||||||||
|
Junior subordinated debt |
- | - | - | 5,156 | 5,156 | |||||||||||||||
|
Operating leases |
1,692 | 2,430 | 1,541 | 879 | 6,542 | |||||||||||||||
|
Total |
$ | 1,631,574 | $ | 507,016 | $ | 152,224 | $ | 102,368 | $ | 2,393,182 | ||||||||||
See additional discussion under Notes 8, 10, 11 and 18 of the Annual Report to Shareholders.
Off-Balance Sheet Arrangements
In the ordinary course of business, we have entered into off-balance sheet financial instruments consisting of commitments for the extension of credit, credit card commitments, letter of credit commitments, home equity lines and standby letters of credit. These instruments are recorded in the financial statements only when they
are funded or related fees are incurred or received. The following table summarizes the amount of commitments as of December 31, 2009 (in thousands):
|
Amount |
||||
|
Commitments to extend credit |
$ | 225,882 | ||
|
Credit card arrangements |
18,903 | |||
|
Standby and commercial letters of credit |
19,591 | |||
| $ | 264,376 | |||
Commitments to extend credit and letters of credit are written for one year, or have a call in one year. The fair value of these commitments is not material since they are for a short period of time and subject to customary credit terms. A fee is charged for all commitments to lend. There have been no losses
associated with these commitments.
See Note 18 of the Annual Report to Shareholders for additional discussion.
Market risk is the risk of loss from adverse changes in market pricing and rates. A significant market risk arises from interest rate risk inherent in our lending, deposit, borrowing and mortgage-banking activities. To that end, we actively monitor and manage interest rate risk exposure.
A number of measures are utilized to monitor and manage interest rate risk, including income simulation and “gap” analysis (further discussed below under the subheading “Asset and Liability Management”). An income simulation model is primarily used to assess the impact on earning changes that interest
rates may produce. Key assumptions in the model include cash flows and maturities of financial instruments, changes in market conditions, loan volumes and pricing, deposit sensitivity, consumer preferences and management's capital leverage plans. These assumptions are inherently uncertain; therefore, the model cannot precisely estimate net interest income or precisely predict the impact of higher or lower interest rates on net interest income. Actual results may significantly
differ from simulated results due to timing, magnitude and frequency of interest rate changes and changes in market conditions and specific strategies, among other factors. The model also uses a multiplier effect which is discussed later.
We use a simulation model to estimate the impact of changing interest rates on our earnings and capital. The model calculates the change in net interest income and net income under various rate shocks. As of December 31, 2009, the model predicted that net income would decrease by approximately $5.5 million if rates
increased 2% and decrease $634 thousand if rates decreased 0.25%. A rate shock of (0.25%) was used for 2010, as this represents the current Federal Funds rate at December 31, 2009.
The percentages shown in the table below represent changes over a 12 month period in net interest income and net income under two rate scenarios. The cash flows have been adjusted to account for prepayments and other factors and an assumed 35% tax rate.
(In thousands)
|
2010 Estimated Change |
2009 Estimated Change |
2008 Estimated Change |
||||||||||||||||||||||
|
Rate shock |
(0.25 | %) | 2.0 | % | (1.0 | %) | 2.0 | % | (1.0 | %) | 2.0 | % | ||||||||||||
|
Net interest income |
$ | 961 | $ | (8,343 | ) |
NA |
$ | 488 | $ | (974 | ) | $ | 4,837 | |||||||||||
|
Net income |
(634 | ) | (5,506 | ) |
NA |
303 | (643 | ) | 3,192 | |||||||||||||||
The interest rate scenarios reflected above represent the results of possible near-term interest rate movements. Our primary objective in managing interest rate risk is to minimize the adverse impact of changes in interest rates on our net interest income and capital, while structuring the asset and liability components to obtain the maximum net interest margin. We rely primarily
on our asset and liability structure to control interest rate risk.
Asset and Liability Management
Asset and liability management is the responsibility of the Asset/Liability Committee, which acts within policy directives established by the Board of Directors. This Committee meets regularly to monitor the composition of the balance sheet, to assess projected earnings trends and to formulate strategies consistent with the objectives for
liquidity, interest rate risk and capital adequacy. The objective of asset/liability management is to maximize long-term shareholder returns by optimizing net interest income within the constraints of credit quality, interest rate risk policies, levels of capital leverage and adequate liquidity.
Assets and liabilities are managed by matching maturities and repricing in a systematic manner. In addition to a simulation model, an interest rate “gap” analysis is used to measure the effect interest rate changes have on net interest income. The gap is the difference between the amount of interest-earning assets maturing or
repricing within a specific time period and the amount of interest bearing liabilities maturing or repricing in that same time period. A gap is considered positive when the amount of interest-rate-sensitive assets exceeds the amount of interest-rate-sensitive liabilities. A gap is considered negative in the reverse situation. However, the exact impact of the gap on future income is uncertain both in timing and amount because interest rates for our assets and liabilities can change rapidly as a result
of market conditions and customer behavior patterns.
Expected Maturities for Financial Assets and Liabilities
In the following table (in thousands), the expected maturities for financial liabilities, with no stated maturity, reflect assumptions using the run-off rates for noninterest bearing deposits of 6% per year; for NOW, sweep and money market accounts 8% per year; and for savings accounts 10% per year. The weighted average interest
rates for financial instruments presented are for year end 2009.
|
Expected Maturity Date |
Fair |
|||||||||||||||||||||||||||||||
|
2010 |
2011 |
2012 |
2013 |
2014 |
Thereafter |
Total |
Value |
|||||||||||||||||||||||||
|
Financial Assets |
||||||||||||||||||||||||||||||||
|
Cash and due from banks |
||||||||||||||||||||||||||||||||
|
Noninterest bearing |
$ | 93,761 | $ | - | $ | - | $ | - | $ | - | $ | - | $ | 93,761 | $ | 93,761 | ||||||||||||||||
|
Fed Funds Sold |
||||||||||||||||||||||||||||||||
|
Variable Rate |
333,819 | - | - | - | - | - | 333,819 | 333,819 | ||||||||||||||||||||||||
|
Weighted average interest rate |
0.25 | % | - | - | - | - | - | 0.25 | % | |||||||||||||||||||||||
|
Securities available for sale |
||||||||||||||||||||||||||||||||
|
Fixed Rate |
7,008 | 20,253 | - | - | 18,025 | 39,562 | 84,848 | 85,092 | ||||||||||||||||||||||||
|
Weighted average interest rate (1) |
1.27 | % | 0.42 | % | - | - | 2.45 | % | 4.11 | % | 2.72 | % | ||||||||||||||||||||
|
Securities held to maturity |
||||||||||||||||||||||||||||||||
|
Fixed Rate |
578 | - | - | - | - | 1,524 | 2,102 | 2,024 | ||||||||||||||||||||||||
|
Weighted average interest rate (1) |
5.06 | % | - | - | - | - | 9.62 | % | 8.36 | % | ||||||||||||||||||||||
|
Loans Receivable, net |
||||||||||||||||||||||||||||||||
|
Fixed Rate |
405,427 | 187,731 | 175,175 | 287,813 | 131,223 | 102,894 | 1,290,263 | 983,647 | ||||||||||||||||||||||||
|
Weighted average interest rate (2) |
8.45 | % | 7.82 | % | 7.61 | % | 6.74 | % | 6.16 | % | 6.57 | % | 7.50 | % | ||||||||||||||||||
|
Variable Rate |
994,798 | 24,852 | 50,679 | 86,714 | 68,390 | 350,581 | 1,576,014 | 1,576,014 | ||||||||||||||||||||||||
|
Weighted average interest rate (2) |
7.60 | % | 5.32 | % | 7.67 | % | 6.90 | % | 6.24 | % | 6.63 | % | 7.25 | % | ||||||||||||||||||
|
Financial Liabilities |
||||||||||||||||||||||||||||||||
|
Noninterest bearing deposits |
$ | 22,635 | $ | 21,277 | $ | 20,001 | $ | 18,801 | $ | 17,673 | $ | 276,871 | $ | 377,258 | $ | 377,258 | ||||||||||||||||
|
NOW, Sweep and Money Market accounts |
39,836 | 36,649 | 33,717 | 31,020 | 28,538 | 328,191 | 497,952 | 497,952 | ||||||||||||||||||||||||
|
Weighted average interest rate |
0.68 | % | 0.68 | % | 0.68 | % | 0.68 | % | 0.68 | % | 0.68 | % | 0.68 | % | ||||||||||||||||||
|
Savings accounts |
24,126 | 21,713 | 19,542 | 17,588 | 15,829 | 142,462 | 241,261 | 241,261 | ||||||||||||||||||||||||
|
Weighted average interest rate |
0.88 | % | 0.88 | % | 0.88 | % | 0.88 | % | 0.88 | % | 0.88 | % | 0.88 | % | ||||||||||||||||||
|
Time Certificates |
||||||||||||||||||||||||||||||||
|
Fixed Rate |
1,564,745 | 291,218 | 98,026 | 23,258 | 27,425 | 1,333 | 2,006,005 | 2,030,245 | ||||||||||||||||||||||||
|
Weighted average interest rate |
2.54 | % | 2.81 | % | 3.84 | % | 4.09 | % | 3.52 | % | 4.56 | % | 2.67 | % | ||||||||||||||||||
|
Federal funds purchased & securities |
||||||||||||||||||||||||||||||||
|
sold under agreements to repurchase |
||||||||||||||||||||||||||||||||
|
Variable rate |
11,107 | - | - | - | - | - | 11,107 | 11,107 | ||||||||||||||||||||||||
|
Weighted average interest rate |
0.09 | % | - | - | - | - | - | 0.09 | % | |||||||||||||||||||||||
|
Subordinated debt |
- | - | - | - | - | 5,156 | 5,156 | 2,191 | ||||||||||||||||||||||||
|
Weighted average interest rate |
- | - | - | - | - | 4.13 | % | 4.13 | % | |||||||||||||||||||||||
|
FHLB advances |
||||||||||||||||||||||||||||||||
|
Fixed Rate |
65,137 | 15,000 | 100,342 | 100,000 | - | 95,000 | 375,479 | 386,976 | ||||||||||||||||||||||||
|
Weighted average interest rate |
3.95 | % | 2.13 | % | 4.55 | % | 3.04 | % | - | 4.42 | % | 3.91 | % | |||||||||||||||||||
|
(1) Represents tax equivalent yield |
||||||||||||||||||||||||||||||||
|
(2) Represents weighted note rates exclusive of loan fees |
||||||||||||||||||||||||||||||||
Please note that in the above table, financial assets and liabilities are listed at their expected maturity date. Our variable rate financial assets may reprice much sooner than their expected maturity date and liabilities may or may not run off at the expected rate as indicated above. Therefore, we prefer to analyze our assets and liabilities as shown in the following
chart, which indicates when the assets and liabilities can be repriced.
Repricing Opportunities for Assets and Liabilities
(In thousands, as of December 31, 2009)
|
2010 |
2011 |
2012 |
2013 |
2014 |
Thereafter |
Total |
||||||||||||||||||||||
|
Assets |
||||||||||||||||||||||||||||
|
Loans (1)(2) |
$ | 1,638,912 | $ | 249,094 | $ | 272,760 | $ | 448,204 | $ | 178,433 | $ | 78,874 | $ | 2,866,277 | ||||||||||||||
|
Yield |
7.93 | % | 7.07 | % | 7.19 | % | 6.53 | % | 5.88 | % | 4.78 | % | 7.35 | % | ||||||||||||||
|
Investments (2)(3) |
8,934 | 40,526 | 12,380 | 18,024 | 1,604 | 5,482 | 86,950 | |||||||||||||||||||||
|
Yield |
1.53 | % | 2.22 | % | 4.38 | % | 2.45 | % | 5.47 | % | 9.22 | % | 2.85 | % | ||||||||||||||
|
Fed funds sold |
333,819 | - | - | - | - | - | 333,819 | |||||||||||||||||||||
|
Yield |
0.25 | % | - | - | - | - | - | 0.25 | % | |||||||||||||||||||
|
Total earning assets |
$ | 1,981,665 | $ | 289,620 | $ | 285,140 | $ | 466,228 | $ | 180,037 | $ | 84,356 | $ | 3,287,046 | ||||||||||||||
|
Yield |
6.60 | % | 6.39 | % | 7.07 | % | 6.37 | % | 5.88 | % | 5.07 | % | 6.51 | % | ||||||||||||||
|
Liabilities |
||||||||||||||||||||||||||||
|
NOW, money market, |
||||||||||||||||||||||||||||
|
and sweep accounts |
$ | 68,886 | $ | 21,661 | $ | 21,661 | $ | 21,661 | $ | 21,661 | $ | 342,422 | $ | 497,952 | ||||||||||||||
|
Cost |
0.68 | % | 0.68 | % | 0.68 | % | 0.68 | % | 0.68 | % | 0.68 | % | 0.68 | % | ||||||||||||||
|
Savings |
71,509 | 71,509 | 71,509 | 26,734 | - | - | 241,261 | |||||||||||||||||||||
|
Cost |
0.88 | % | 0.88 | % | 0.88 | % | 0.88 | % | 0.88 | % | ||||||||||||||||||
|
Time deposits |
1,564,745 | 291,218 | 98,026 | 23,258 | 27,425 | 1,333 | 2,006,005 | |||||||||||||||||||||
|
Cost |
2.54 | % | 2.81 | % | 3.84 | % | 4.09 | % | 3.52 | % | 4.56 | % | 2.67 | % | ||||||||||||||
|
Fed funds purchased |
||||||||||||||||||||||||||||
|
and repurchase agreements |
11,107 | - | - | - | - | - | 11,107 | |||||||||||||||||||||
|
Cost |
0.09 | % | 0.09 | % | ||||||||||||||||||||||||
|
Subordinated debt |
- | - | - | - | - | 5,156 | 5,156 | |||||||||||||||||||||
|
Cost |
4.13 | % | 4.13 | % | ||||||||||||||||||||||||
|
FHLB borrowings |
65,137 | 15,000 | 100,342 | 100,000 | - | 95,000 | 375,479 | |||||||||||||||||||||
|
Cost |
3.95 | % | 2.13 | % | 4.55 | % | 3.04 | % | 1.42 | % | 3.15 | % | ||||||||||||||||
|
Total interest bearing liabilitites |
$ | 1,781,384 | $ | 399,388 | $ | 291,538 | $ | 171,653 | $ | 49,086 | $ | 443,911 | $ | 3,136,960 | ||||||||||||||
|
Cost |
2.44 | % | 2.32 | % | 3.12 | % | 2.55 | % | 2.26 | % | 1.48 | % | 2.35 | % | ||||||||||||||
|
GAP |
$ | 200,281 | $ | (109,768 | ) | $ | (6,398 | ) | $ | 294,575 | $ | 130,951 | $ | (359,555 | ) | $ | 150,086 | |||||||||||
|
(1) Loan fees and costs are included in balance but not in the yield |
||||||||||||||||||||||||||||
|
(2) Taxable equivalent |
||||||||||||||||||||||||||||
|
(3) Amortized cost |
||||||||||||||||||||||||||||
It is generally assumed that during a period of rising interest rates, the net earnings of an institution with a negative gap may be adversely affected due to its interest bearing liabilities repricing to a greater extent than its interest-earning assets. Conversely, during a period of falling interest rates, net earnings may increase. That assumption, however, is based
on the premise that assets/liabilities within a one-year time frame will generally move in the same direction at approximately the same rate. However, historical data reflects that the relationship between one-year asset/liabilities may not be as strongly correlated as assumed. Loans with one-year repricing characteristics are tied to a number of indexes to include our base rate, the Wall Street Journal prime, the one-year constant maturity treasury, LIBOR and FHLB rates. Those
indexes are subject to the movement of the one-year market rates. On the other hand, NOW and time deposits, which constitute the bulk of the one-year repricing liabilities, are subject to the local financial institutions' market. Pricing for NOW and time deposits is dependent on customer preferences and the subjective pricing influence of local banks, credit unions, etc. Thus, while a good portion of our loans are tied to national and international money markets; deposits are
subject to the conditions of our market areas in Washington and Oregon. Additionally, when interest rates change, different rates change by different amounts. The use of “multipliers” is used that represent the change of each asset/liability rate compared to the change in the federal funds rate. For example, the prime rate has a factor of 1 indicating it changes the same amount as any federal funds rate change. Core deposit sectors may have a factor of 0.25,
indicating those rates move only 25% as much. Applying the multipliers to the balance sheet, at December 31, 2009, we had a positive gap of $200.3 million, compared to a positive gap of $433.3 million at December 31, 2008.
Financial statements and supplementary data required by this Item are incorporated by reference from the 2009 Annual Report to Shareholders.
|
ITEM 9. |
CHANGES IN AND DISAGREEMENTS WITH ACCOUNTANTS ON ACCOUNTING AND FINANCIAL DISCLOSURE |
None.
ITEM 9A. CONTROLS AND PROCEDURES
Management’s Report on Internal Control over Financial Reporting
Management of Frontier Financial Corporation and its subsidiary (“the Corporation”) is responsible for establishing and maintaining adequate internal control over financial reporting, and for performing an assessment of the effectiveness of internal control over financial reporting as of December 31, 2009. The Corporation’s
internal control over financial reporting is a process designed under the supervision of the Corporation’s management, including the Chief Executive Officer and Chief Financial Officer, to provide reasonable assurance regarding the reliability of financial reporting and the preparation of financial statements for external purposes in accordance with accounting principles generally accepted in the United States of America.
The Corporation’s system of internal control over financial reporting includes policies and procedures that (i) pertain to the maintenance of records that, in reasonable detail, accurately and fairly reflect transactions and dispositions of assets of the Corporation; (ii) provide reasonable assurance that transactions are recorded
as necessary to permit preparation of financial statements in accordance with accounting principles generally accepted in the United States, and that receipts and expenditures of the Corporation are being made only in accordance with authorizations of Management and Directors of the Corporation; and (iii) provide reasonable assurance regarding prevention or timely detection of unauthorized acquisition, use or disposition of the Corporation’s assets that could have a material effect on the financial
statements.
Management recognizes that there are inherent limitations in the effectiveness of any system of internal control, and accordingly, even effective internal control can provide only reasonable assurance with respect to financial statements preparation and fair presentation. Further, because of changes in condition, the effectiveness
of internal control may vary over time.
Under the supervision and with the participation of the Corporation’s management, including the Corporation’s Chief Executive Officer and Chief Financial Officer, the Corporation performed an assessment of the effectiveness of the Corporation’s internal control over financial reporting as of December 31, 2009, based upon
criteria in Internal Control – Integrated Framework issued by the Committee of Sponsoring Organizations of the Treadway Commission (“COSO”). Based on this assessment, management identified the material weaknesses described in the following paragraph, and therefore, concluded that at December 31, 2009 the Corporation’s internal control over financial reporting was not effective.
As of December 31, 2009, material weaknesses existed related to controls over the identification, monitoring and evaluation of impaired loans and for the timely revision to management’s approach for assessing credit risk inherent in the Bank’s loan portfolio to reflect changes in the economic environment and monitoring and approving
of disbursements, capitalizing of costs and reconciliation of accounts specific to other real estate owned. These material weaknesses resulted in two adjustments being identified outside of the Corporations internal control over financial reporting. One of the adjustments was based upon an FDIC examination subsequent to year end due to new information about borrowers and underlying collateral that existed at December 31, 2009 and was learned in February 2010. The other adjustment was based
upon untimely reconciliation of accounts, inadequate disbursement approval processes, and inadequate procedures for the capitalization of costs related to other real estate owned. Frontier is reviewing its controls and procedures for these two adjustments to ensure such adjustments will not occur in the future.
The Corporation’s independent registered public accounting firm, Moss Adams LLP who audits the Corporation’s consolidated financial statements, have issued an attestation report on the effectiveness of the Corporation’s internal control over financial reporting. See the 2009 Annual Report to Shareholders.
Evaluation of Disclosure Controls and Procedures
Management, including the Chief Executive Officer (“CEO”) and Chief Financial Officer (“CFO”), evaluated the effectiveness of our disclosure controls and procedures as of December 31, 2009. Based on this evaluation, the CEO and the CFO each concluded that as of December 31, 2009, there were two identified controls
which were deficient, as described in Management’s Report of Internal Control over Financial Reporting, and concluded that our current disclosure controls and procedures were not effective as of December 31, 2009. Management is reviewing its disclosure controls and procedures to ensure their effectiveness in the future.
Changes in Internal Control over Financial Reporting
There has been no change in our internal control over financial reporting in the period covered by this report that has materially affected, or are reasonably likely to affect, our internal control over financial reporting.
ITEM 9B. OTHER INFORMATION
Not applicable.
ITEM 10. DIRECTORS, EXECUTIVE OFFICERS AND CORPORATE GOVERNANCE
Biographical and business experience information about the directors and director nominees are included in Frontier Financial Corporation’s Proxy Statement for the Annual Meeting of Shareholders (the “Proxy Statement”) under the caption “Election of Directors” and the information incorporated by reference pursuant
to Item 13 below is hereby incorporated herein by reference. Information on our executive officers is also included in the Proxy Statement.
Information regarding our Audit Committee included under the caption “Directors’ Meetings, Committees and Compensation” of the Proxy Statement is hereby incorporated herein by reference.
Information regarding late filings under Section 16(a) of the Securities Exchange Act of 1934 included in the Proxy Statement under the caption “Section 16(a) Beneficial Ownership Reporting Compliance” is hereby incorporated herein by reference.
Our Code of Ethics for Senior Executive Officers (“Code of Ethics”) is available at www.frontierbank.com, as discussed in “Available Information” above. We intend to disclose any amendments or waivers with respect to our Code of Ethics on our website at www.frontierbank.com.
ITEM 11. EXECUTIVE COMPENSATION
Information regarding compensation of directors and executive officers included under the caption “Compensation of Executives” of the Proxy Statement is hereby incorporated herein by reference. However, the information provided in the Proxy Statement under the heading “Report of the Compensation Committee of the Board
of Directors on Executive Compensation” and in this report under the heading “Five Year Performance Comparison” shall not be deemed to be “soliciting material” or to be “filed” with the Securities and Exchange Commission, subject to Regulation 14A or 14C, other than as provided in Item 402 of Regulation S-K, or subject to liabilities of Section 18 of the Securities Exchange Act of 1934.
ITEM 12. SECURITY OWNERSHIP OF CERTAIN BENEFICIAL OWNERS AND MANAGEMENT AND RELATED SHAREHOLDER MATTERS
The information set forth under the caption “Share Ownership Information” in the Proxy Statement is hereby incorporated herein by reference.
ITEM 13. CERTAIN RELATIONSHIPS AND RELATED TRANSACTIONS AND DIRECTOR INDEPENDENCE
The information set forth in the Proxy Statement under the caption “Related Party Transactions and Business Relationships” is hereby incorporated herein by reference.
ITEM 14. PRINCIPAL ACCOUNTANT FEES AND SERVICES
The information set forth in the Proxy Statement under the caption “Independent Registered Public Accounting Firm” is hereby incorporated herein by reference.
ITEM 15. EXHIBITS AND FINANCIAL STATEMENT SCHEDULES
(a)(1) Financial Statements.
Financial statements required by Item 8 of this report are incorporated by reference from the 2009 Annual Report to Shareholders.
(a)(2) Financial Statement Schedules.
All financial schedules for which provision is made in the applicable accounting regulations of the Securities and Exchange Commission are not required under the related instructions or are inapplicable and therefore have been omitted.
(a)(3) Exhibits.
Pursuant to the requirements of Section 13 or 15(d) of the Securities Exchange Act of 1934, the registrant has duly caused this report to be signed on its behalf by the undersigned, thereunto duly authorized.
|
FRONTIER FINANCIAL CORPORATION | |||
|
March 31, 2010 |
/s/ Patrick M. Fahey | ||
|
Patrick M. Fahey | |||
|
Chairman and Chief Executive Officer | |||
Pursuant to the requirements of the Securities Exchange Act of 1934, this report has been signed below by the following persons on behalf of the registrant and in the capacities and on the dates indicated:
|
March 31, 2010 |
/s/ Patrick M. Fahey | ||
|
Patrick M. Fahey |
|||
|
Chairman and Chief Executive Officer |
|||
|
(Principal Executive Officer) |
|||
|
March 31, 2010 |
/s/ Carol E. Wheeler | ||
|
Carol E. Wheeler |
|||
|
Chief Financial Officer |
|||
|
(Principal Financial and Accounting Officer) |
|||
|
March 31, 2010 |
/s/ David M. Cuthill | ||
|
David M. Cuthill, Director |
|||
|
March 31, 2010 |
/s/ Lucy DeYoung | ||
|
Lucy DeYoung, Director |
|||
|
March 31, 2010 |
/s/ Edward D. Hansen | ||
|
Edward D. Hansen, Director |
|||
|
March 31, 2010 |
/s/ Edward C. Rubatino | ||
|
Edward C. Rubatino, Director |
|||
|
March 31, 2010 |
/s/ Darrell J. Storkson | ||
|
Darrell J. Storkson, Director |
|||
|
March 31, 2010 |
/s/ Mark O. Zenger | ||
|
Mark O. Zenger, Director |
| (3 | )(a) |
Articles of Incorporation of Frontier Financial Corporation are incorporated herein by reference to Appendix A | |||
|
to the registrant's definitive Proxy Statement on Schedule 14A filed on March 20, 1998 (File No. 000-15540). | |||||
| (3 | )(b) |
By-laws of Frontier Financial Corporation are incorporated herein by reference to Exhibit 3(ii) to Form 10-Q filed | |||
|
on October 29, 2003. | |||||
| * | (10 | )(a) |
Amended and Restated Frontier Financial Corporation Incentive Stock Option Plan incorporated by reference | ||
|
to Exhibit 99.1 to Registration Statement on Form S-8, filed March 27, 1998 (File No. 333-48805). | |||||
| * | (10 | )(b) |
Frontier Financial Corporation 1999 Employee Stock Award Plan is incorporated herein by reference to Exhibit 99.1 | ||
|
to Registration Statement on Form S-8, filed March 2, 1999 (File No. 333-73217). | |||||
| * | (10 | )(c) |
Frontier Financial Corporation 2001 Stock Award Plan is incorporated herein by reference to Exhibit 99.1 | ||
|
to Registration Statement on Form S-8, filed January 26, 2001 (File No. 333-54362). | |||||
| * | (10 | )(d) |
Frontier Financial Corporation Employee Stock Option Plan and Interbancorp, Inc. Director Stock Option Plan is | ||
|
incorporated herein by reference to Exhibit 10.1 to Registration Statement on Form S-8, filed January 26, 2001 | |||||
|
(File No. 333-37242). | |||||
| * | (10 | )(e) |
Interbancorp, Inc. Employee Stock Option Plan and Interbancorp, Inc. Director Stock Option Plan is incorporated | ||
|
herein by reference to Exhibit 10.1 to Registration Statement on Form S-8, filed February 13, 2001 | |||||
|
(File No. 333-50882). | |||||
| * | (10 | )(f) |
Frontier Financial Corporation Employee Stock Option Plan and NorthStar Bank Employee Stock Option Plan, | ||
|
NorthStar Bank 1994 Employee Stock Option Plan and NorthStar Director Nonqualified Stock Option Plan are | |||||
|
incorporated herein by reference to Exhibit 10.1 to Registration Statement on Form S-8, filed March 16, 2006 | |||||
|
(File No. 333-132487). | |||||
| * | (10 | )(g) |
Frontier Financial Corporation 2006 Stock Incentive Plan is incorporated herein by reference to Exhibit 99.1 to | ||
|
Registration Statement on Form S-8, filed August 4, 2006 (File No. 333-136298). | |||||
| * | (10 | )(h) |
Change of Control Agreement with John J. Dickson is incorporated herein by reference to Exhibit 10.1 to | ||
|
Current Report on Form 8-K, filed January 19, 2006 (File No. 000-15540). | |||||
| * | (10 | )(i) |
Change of Control Agreements with other executive officers. | ||
| (13 | ) |
Portions of the Annual Report to Shareholders for the year ended December 31, 2009, are incorporated by | |||
|
herein by reference. | |||||
| ** | (14 | ) |
Code of Ethics for senior financial officers. | ||
| (21 | ) |
Subsidiaries of Registrant. | |||
| (23.1 | ) |
Consent of Moss Adams LLP, Independent Registered Public Accounting Firm. | |||
| (31.1 | ) |
302 Certification of Chief Executive Officer. | |||
| (31.2 | ) |
302 Certification of Chief Financial Officer. | |||
| (32 | ) |
Certification pursuant to 28 U.S.C Section 1350, as adopted pursuant to Section 906 of the Sarbanes-Oxley Act of 2002. | |||
| * |
Compensatory plan or arrangement. | ||||
| ** |
Previously filed. | ||||
-51-