Attached files
Table of Contents
UNITED STATES
SECURITIES AND EXCHANGE COMMISSION
Washington, D.C. 20549
FORM 10-K
| x | Annual Report Pursuant to Section 13 or 15(d) of the Securities Exchange Act of 1934 |
For the fiscal year ended December 31, 2009
| ¨ | Transition Report Pursuant to Section 13 or 15(d) of the Securities Exchange Act of 1934 |
For the transition period from to
Commission file number: 001-12487
FIRST STATE BANCORPORATION
(Exact name of registrant as specified in its charter)
| NEW MEXICO | 85-0366665 | |
| (State or other jurisdiction of incorporation or organization) |
(IRS Employer Identification No.) |
| 7900 JEFFERSON NE ALBUQUERQUE, NEW MEXICO |
87109 | |
| (Address of principal executive offices) | (Zip Code) |
Registrant’s telephone number, including area code: (505) 241-7500
Securities registered pursuant to Section 12(b) of the Act:
| Title of each class |
Name of each exchange on which registered | |
| Common Stock, no par value | NASDAQ Stock Market LLC |
Securities registered pursuant to Section 12(g) of the Act:
None
(Title of class)
Indicate by check mark whether the registrant is a well-known seasoned issuer, as defined in Rule 405 of the Securities Act. Yes ¨ No x
Indicate by check mark whether the registrant is not required to file reports pursuant to Section 13 or Section 15(d) of the Act. Yes ¨ No x
Indicate by check mark whether the registrant (1) has filed all reports required to be filed by Section 13 or 15(d) of the Securities Exchange Act of 1934 during the preceding 12 months (or for such shorter period that the registrant was required to file such reports), and (2) has been subject to such filing requirements for the past 90 days. Yes x No ¨
Indicate by check mark if disclosure of delinquent filers pursuant to Item 405 of Regulation S-K is not contained herein, and will not be contained, to the best of registrant’s knowledge, in definitive proxy or information statements incorporated by reference in Part III of this Form 10-K or any amendment to this Form 10-K. x
Indicate by check mark whether the registrant is a large accelerated filer, an accelerated filer, a non-accelerated filer, or a smaller reporting company. See definition of “accelerated filer and large accelerated filer” in Rule 12b-2 of the Exchange Act.
Large accelerated filer ¨ Accelerated filer ¨ Non-accelerated filer ¨ Smaller reporting company x
Indicate by check mark whether the registrant is a shell company (as defined in Rule 12b-2 of the Exchange Act). Yes ¨ No x
The aggregate market value of the Common Stock held by non-affiliates of the registrant was approximately $37,390,000, computed by reference to the closing sale price of the stock on The Nasdaq Stock Market on June 30, 2009, the last trading day of the registrant’s most recently completed second fiscal quarter.
As of March 25, 2010, there were 20,805,547 shares of Common Stock issued and outstanding.
Documents Incorporated By Reference
Certain Part III information is incorporated herein by reference, pursuant to Instruction G of Form 10-K, from First State Bancorporation’s Proxy Statement for its 2010 Annual Shareholders’ Meeting to be filed with the Commission within 120 days after December 31, 2009.
Table of Contents
| Page | ||||
| PART I |
||||
| Item 1: | 3 | |||
| Item 1A: | 19 | |||
| Item 1B: | 32 | |||
| Item 2: | 33 | |||
| Item 3: | 33 | |||
| Item 4: | 33 | |||
| PART II |
||||
| Item 5: | 33 | |||
| Item 6: | 35 | |||
| Item 7: | Management’s Discussion and Analysis of Financial Condition and Results of Operations |
35 | ||
| Item 7A: | 35 | |||
| Item 8: | 36 | |||
| Item 9: | Changes in and Disagreements with Accountants on Accounting and Financial Disclosure |
36 | ||
| Item 9A: | 36 | |||
| Item 9B: | 36 | |||
| PART III |
||||
| Item 10: | 37 | |||
| Item 11: | 37 | |||
| Item 12: | Security Ownership of Certain Beneficial Owners and Management and Related Stockholder Matters |
37 | ||
| Item 13: | Certain Relationships and Related Transactions, and Director Independence |
38 | ||
| Item 14: | 38 | |||
| PART IV |
||||
| Item 15: | 38 | |||
| 41 | ||||
| Appendix A | ||||
2
Table of Contents
PART I
| Item 1: | Business. |
First State Bancorporation
First State Bancorporation (the “Company,” “First State,” “we,” “our,” or similar terms) is a New Mexico-based bank holding company. We provide a variety of banking services to businesses, individuals, and local governments through our subsidiary bank, First Community Bank, (“First Community Bank” or “Bank”). At December 31, 2009, we operated forty branch offices, including thirty-six in New Mexico (three offices each in Taos and Las Cruces, twelve offices in Albuquerque, four offices in Santa Fe, two offices each in Rio Rancho, Belen, and Clovis, and one office each in Los Lunas, Gallup, Portales, Grants, Bernalillo, Pojoaque, Placitas, and Moriarty), and four in Arizona (three offices in Phoenix and one in Sun City). At December 31, 2009, we had total assets, total deposits, and total stockholders’ equity of $2.744 billion, $2.034 billion, and $47.0 million, respectively. Our executive offices are located at 7900 Jefferson NE, Albuquerque, New Mexico 87109, and our telephone number is (505) 241-7500.
History
First Community Bank began operations in 1922 in Taos County, New Mexico. First State Bancorporation and an affiliated company, New Mexico Bank Corporation, were organized under the laws of New Mexico in 1988 to acquire banking institutions in New Mexico. In December 1988, we acquired First Community Bank, and New Mexico Bank Corporation acquired National Bank of Albuquerque (“NBA”). After a change in New Mexico banking laws in 1991, First State Bancorporation and New Mexico Bank Corporation merged, and the operations of NBA were merged into First Community Bank in December 1991.
On December 1, 1993, we purchased 94.5% of the outstanding shares of common stock of First State Bank of Santa Fe (“Santa Fe Bank”). Santa Fe Bank was merged into First State Bank as of June 5, 1994.
During the fourth quarter of 1999, First Community Bank opened a mortgage origination division. The mortgage division allows the Bank to generate fee income from our branch network and construction lending activities as well as to attract additional customers. In 2004, the mortgage origination division was reorganized and began operating as First Community Mortgage.
On October 1, 2002, we entered the Colorado and Utah markets when we completed our acquisition of First Community Industrial Bank (“FCIB”).
On January 3, 2006, we completed the acquisition of Access Anytime Bancorp, Inc. and its wholly owned subsidiary, AccessBank (collectively “Access”) and on January 10, 2006, we completed the acquisition of New Mexico Financial Corporation and its wholly owned subsidiary, Ranchers Banks (collectively “NMFC”). Through the Access transaction, we added branches in Albuquerque, Clovis, Gallup, Las Cruces, and Portales, New Mexico. We also entered the Arizona market through the Access Sun City branch.
On March 1, 2007, we completed the acquisition of Front Range Capital Corporation and its subsidiary, Heritage Bank (collectively “Front Range”), for $72 million in cash. The transaction added 13 branches to our franchise in the Denver-Boulder-Longmont triangle along Colorado’s front range. Subsequent to the completion of the transaction, we closed two of the Front Range branches, one in Firestone, Colorado and one in Denver, Colorado. See Note 2 of Notes to Consolidated Financial Statements for additional information on this acquisition.
In June 2008, we performed an analysis to test for goodwill impairment as a result of the Company’s market capitalization being less than our stockholders’ equity. This analysis resulted in a $127.4 million non-cash charge to earnings representing the write off of all of the Company’s goodwill. See Item 7: “Management’s
3
Table of Contents
Discussion and Analysis of Financial Condition and Results of Operations-Critical Accounting Estimates and Judgments” and Note 7 of Notes to Consolidated Financial Statements for additional information on goodwill impairment.
On October 31, 2008, we completed the closure of our Utah branches, which had achieved substantial loan growth but had essentially no deposit growth. The Utah branches were acquired as part of the FCIB acquisition in October of 2002. At the closing date, the Utah branches included $286.4 million in total loans and $13.7 million in deposits. The Utah loans continue to be held and serviced by Bank personnel in Utah, until they are paid off or sold. At December 31, 2009, the remaining Utah loan and deposits totaled $214.9 million and $2.8 million, respectively.
See “Recent Company Developments” below regarding the sale of our Colorado branches in June 2009.
Current Economic Environment
During 2009, economic conditions in the U.S. continued to be challenged by tighter credit conditions, reduced economic growth and declines in the housing market. Although the economy appeared to improve somewhat by the third quarter of 2009, U.S. unemployment rates continue to be a major factor in the deterioration of credit quality in the U.S. U.S. unemployment rates increased to 10.0% at December 31, 2009, from 7.4% at December 31, 2008. During 2009, the overall industry continued to be challenged by weakening asset quality, evidenced by higher levels of non-performing loans and higher provisions for loan losses. Access to capital markets is still extremely limited, and consequently, the availability of additional capital within the financial sector was tight during 2009.
Recent Company Developments
On December 21, 2009, Michael R. Stanford, President and Chief Executive Officer of the Company retired effective December 31, 2009. H. Patrick Dee was appointed to succeed Mr. Stanford as President and Chief Executive Officer. Mr. Dee has been associated with the Bank in various capacities since 1984, serving for a time as the Company’s Chief Financial Officer and, since 1996, as the Company’s Chief Operating Officer. Mr. Stanford will continue to be available to the Company in an advisory capacity throughout 2010.
On December 14, 2009, we received a notice from the Nasdaq Stock Market (“Nasdaq”) stating that the Company no longer meets the $1.00 per share requirement for continued listing on the Nasdaq Global Select Market under Listing Rule 5450 (a)(1). This notice does not result in an immediate delisting of the Company’s common stock from the Nasdaq Global Select Market, as a grace period of 180 calendar days or until June 14, 2010, is provided under the listing rules. If at any time during this grace period the bid price of the Company’s common stock closes at $1.00 per share or more for a minimum of ten consecutive business days, Nasdaq will provide us written confirmation of compliance. In the event that the Company does not regain compliance prior to the expiration of the grace period, Nasdaq will provide written notification that the Company’s common stock is subject to delisting. We may apply for the transfer of the Company’s common stock to the Nasdaq Capital Market as set forth in Listing Rule 5505. If we elect to apply for such transfer, and the application is approved, the Company would be eligible for an additional 180 calendar day grace period. The requirements for initial listing on the Nasdaq Capital Market include a minimum market value of publicly held shares of $15 million, which the Company does not currently meet. We are evaluating all of our options following receipt of this notification and intend to work diligently to attempt to retain listing of the Company’s common stock on Nasdaq. We believe that improved financial performance that results in an increased stock price, much closer to the Company’s tangible book value, is the best potential solution for regaining compliance with the minimum bid requirement. However, there can be no assurance that our financial performance will improve during the 180 day grace period. Also, see “Risk Factors” below.
On August 5, 2009, we announced the retention of Keefe, Bruyette & Woods as a financial advisor to review strategic alternatives to enhance shareholder value, including the possibility of entering into a business combination with a strategic partner.
4
Table of Contents
In June 2009, as part of our efforts to improve capital levels, we completed the sale of our Colorado branches, transferring approximately $387 million in loans, $512 million in deposits and securities sold under agreements to repurchase, $20 million of premises and equipment and other assets, and received a deposit premium of $30 million. After the write-off of the core deposit intangible associated with these deposits and investment banking fees, we recorded a pretax gain of approximately $23.3 million. Transaction costs recorded as expenses totaled $1.8 million. The remaining Colorado loans continue to be held and serviced by Bank personnel in Colorado, until they are paid off or sold. At December 31, 2009, the remaining Colorado loans and deposits totaled $214.5 million and $17.9 million, respectively.
On July 2, 2009, the Company and the Bank executed a written agreement (“Regulator Agreement”) with the Federal Reserve Bank of Kansas City and the New Mexico Financial Institutions Division (collectively, the “Regulators”). The Regulator Agreement is based on findings of the Regulators identified in an examination of the Bank and the Company during January and February of 2009.
Under the terms of the Regulator Agreement, the Company and the Bank agreed, among other things, to engage an independent consultant acceptable to the Regulators to assess the Bank’s management and staffing needs, assess the qualifications and performance of all officers of the Bank, and assess the current structure and compositions of the Bank’s board of directors and its committees. In addition, within 60 days of the Regulator Agreement, the Company and or the Bank was required to submit a written plan to strengthen lending and credit risk management practices and improve the Bank’s position regarding past due loans, problem loans, classified loans, and other real estate owned; maintain sufficient capital at the Bank, holding company and the consolidated level; improve the Bank’s earnings and overall condition; and improve management of the Bank’s liquidity position, funds management process, and interest rate risk management. The Company and or the Bank have also agreed to maintain an adequate allowance for loan and lease losses; charge-off or collect assets classified as “loss” in the Report of Examination that have not been previously collected or charged off; not to pay any dividends; not to distribute any interest, principal or other sums on trust preferred securities; not to issue, increase or guarantee any debt; not to purchase or redeem any shares of the Company’s stock; and not to accept any new brokered deposits, even if the Bank is considered well capitalized.
The Board of Directors of the Company and the Bank are also required to appoint a Compliance Committee to monitor and coordinate the Company’s and the Bank’s compliance with the provisions of the Regulator Agreement, obtain prior approval for the appointment of new directors, the hiring or change in responsibilities of senior executive officers, and to comply with restrictions on severance payments and indemnification payments to institution affiliated parties.
Failure to comply with the provisions of the Regulator Agreement could subject the Company and or the Bank to additional enforcement actions. See “Supervision and Regulation” below. We continue to work closely with the Regulators regarding the Regulator Agreement and believe that the Company and the Bank are in compliance with the requirements of the Regulator Agreement except for the requirement to submit an acceptable capital plan. Capital plans for the Company and the Bank were submitted timely, but were not accepted by the regulators due to uncertainty of our ability to execute the plans. We are continuing to work toward compliance with the requirements of the capital plans. However, there can be no assurance that the Company and or the Bank will be able to comply fully with the provisions of the Regulator Agreement, or that efforts to comply with the Regulator Agreement will not have adverse effects on the Company’s ability to continue as a going concern.
Although we do not believe we currently have the ability to raise new capital through a public offering at an acceptable price, we continue to work with our investment bankers to evaluate alternative capital strengthening strategies, and are currently working on other initiatives to strengthen our capital position including the possibility of entering into a business combination with a strategic partner or a transaction with a private equity group. However, there can be no assurance that the review of strategic alternatives will result in the Company pursuing any particular transaction or strategy, or if it pursues any such transaction or strategy, that it will be completed. At December 31, 2009, the Bank was considered “adequately capitalized” while the Company was considered “significantly undercapitalized” under
5
Table of Contents
regulatory guidelines. At the current time, the Company’s “significantly undercapitalized” classification has no immediate impact on our day-to-day operations because the holding company has no immediate significant cash flow needs or significant obligations that are due in the next twelve months. In addition, the prompt corrective actions required by the Regulators are directed at the Bank. Based on the recent deterioration of the loan portfolio, there is a pressing need for additional capital. The substantial erosion of the Bank’s capital position in 2009 and the continued deterioration in the loan portfolio makes it unlikely that the Bank will be able to maintain its “adequately capitalized” status under regulatory guidelines without raising additional capital, a strategic merger, selling a significant amount of assets, obtaining government assistance, or some combination thereof.
The Company will continue to conduct its banking business with customers in a normal fashion. The Bank’s deposits will remain insured by the FDIC to the maximum limits allowed by law. Depending on the level of capital, the Regulators and or the FDIC can institute other corrective measures to require additional capital and have broad enforcement powers to impose substantial fines and other penalties for violation of laws and regulations. See “Supervision and Regulation” below.
Management and Operating Strategy
Our management strategy is to provide a business culture in which customers are provided individualized customer service. We believe that we differentiate ourselves through this responsive customer service, our streamlined management structure, and management’s and employees’ strong community involvement in our business locations. We believe we can continue to attract employees and management teams who are not satisfied by working at larger organizations. Since 1993, large out of state financial institutions have acquired several banks that compete with us. These institutions concentrate on the mass retail customer base and extremely large customers. They also tend to reduce service levels to small to medium size businesses. These institutions’ method of doing business affords us a continuing opportunity to gain profitable new account relationships and to expand existing relationships by positioning ourselves as a local responsive alternative to the impersonal service of the larger banks.
In order to realize our objectives, we are pursuing the following strategies:
Improvement of Capital Ratios. Since mid-2008, we have taken extensive actions to bolster our capital ratios, in an effort to protect depositors and shareholders from various factors affecting the commercial banking industry. The actions taken include, among others, the suspension of dividend payments to shareholders in July 2008, the sale of our Colorado branches in June 2009, and a significant altering of our loan growth strategy (See “Internal Growth” below). In addition, we are focused on reductions in certain non-interest expenses and improvement in non-interest income, in an effort to increase profitability. Although we do not believe we currently have the ability to raise new capital through a public offering at an acceptable price, we continue to work with our investment bankers to evaluate alternative capital strengthening strategies, and are currently working on other initiatives to strengthen our capital position including the possibility of entering into a business combination with a strategic partner or a transaction with a private equity group. However, there can be no assurance that the review of strategic alternatives will result in the Company pursuing any particular transaction or strategy, or if it pursues any such transaction or strategy, that it will be completed.
Internal Growth. We believe that our markets provide us with significant opportunities for internal growth and are focused on attracting core deposits from individuals, local businesses, and governmental entities in New Mexico and Arizona. Given the current focus on capital, new loan requests of any significant size are limited to existing customers or potential new customers who would maintain substantial deposit relationships with us. We do not expect any new branch openings in the near-term.
Customer Service. Our objective is to increase market share in New Mexico and Arizona, with our current focus on deposits, by providing responsive customer service that is tailored to our customers’ needs. By maximizing personal contact with customers, maintaining low employee turnover, and endeavoring to understand the needs and preferences of our customers, we are working to maintain and further enhance our reputation for providing excellent customer service. We have developed a
6
Table of Contents
streamlined management structure that allows us to make decisions rapidly. We believe that this structure, when compared to other competing institutions, enables us to provide a higher degree of service and increased flexibility to our customers.
Employees. We recognize that our individual employees are the core of our overall business strategy. We are committed to providing a workplace environment in which the individual employee is valued and respected. We have strategically hired and promoted within the Bank and although we have tightened the lending authority due to current market conditions, we continue to provide each region with sufficient local decision making ability which allows us to better serve and attract small to medium size businesses.
New Account Relationships. We emphasize relationship banking with local businesses, local governmental entities, and individual customers across all product lines. We intend to continue to target our marketing efforts to those businesses, governments, and individuals who prefer our personalized customer service, combined with our emphasis on local decision making and the delivery of a state-of-the-art array of products and services.
Community Involvement. First Community Bank’s management and other employees participate actively in a wide variety of civic and community activities and organizations. First Community Bank’s management also sponsors a number of community-oriented programs and events each year, contributing approximately $1.1 million to these organizations in 2009. We believe that these activities assist First Community Bank through increased visibility and through development and maintenance of customer relationships.
Maintaining Asset Quality. We aggressively manage the exposure in our loan portfolio with particular attention focused on our construction portfolio including residential construction as well as commercial real estate construction. Approximately 86% of our loan portfolio remains heavily concentrated in the real estate market. In addition, we proactively work with borrowers as we see potential signs of deterioration in collateral values or general market conditions. During 2009, the Bank expanded its Special Assets department to ensure adequate staffing to manage the rising level of problem assets. We believe that the combined effects of early identification and a staff dedicated to and skilled in the work out of problem credits results in a more timely exit of these credits with the most recovery of principal to the Bank. While our lenders are primarily responsible for identifying potential problem loans, we also have a fully outsourced loan review function. We believe that this outsourcing allows for a more efficient and independent assessment of potential credit weakness. During 2009, all non-performing loans with specific reserves that were basically collateral dependent were charged off and at December 31, 2009, our allowance for loan losses totaled 50% of non-accrual loans. The charge-offs and allowance for loan losses are generally based on appraisals obtained within the last twelve months, with further allowances for the cost of the disposition of the collateral. In cases where appraisals are not totally up to date, we have discounted them further to account for estimated market deterioration. In late 2008, the Bank significantly reduced lending authorities for the front line lenders to allow for a more centralized credit decision making process. In 2009, the Bank further reduced individual lending authorities for members of the Bank’s Credit Committee to further centralize the credit decision making process. See Item 7: “Management’s Discussion and Analysis of Financial Condition and Results of Operations-Non-performing Assets and Analysis of the Allowance for Loan Losses.”
Increasing Efficiency. Investments in technology over the past 24 months will continue to produce operational efficiencies over the next few years. Our investments in imaging and workflow systems are providing greater efficiencies in our lending processes and deposit generation processes. Our “Green” initiatives which include datacenter server virtualization and database consolidation technology have reduced the number of servers required to run our applications and have also afforded significant energy savings in our data center. Our investments in desktop virtualization and thin client technology allow bank employees greater communication flexibility throughout the organization as well as increasing worker productivity, while reducing support and maintenance costs. Single sign-on technology has reduced password support calls and made our systems more secure. We have implemented significant enhancements to our automated banking channels to better serve both our retail and commercial customers. We continue to experience operating efficiencies by leveraging the technologies brought
7
Table of Contents
about by the Check 21 Act with the addition of electronic check clearing in addition to all of our branch locations utilizing remote check capture and imaged deposit and loan workflow technologies. Our merchant remote capture product, digiPost®, continues to aid us in gaining market share in markets with fewer branch locations. We continue to be strategically focusing on improving processes and workflows of our existing systems as well as evaluating future and emerging technologies. We will continue to evaluate outsourcing options for systems and processes when appropriate and more efficient, such as paper statement processing, which was accomplished in 2009. We believe these investments will allow us to service our existing asset base more efficiently as well as expand our asset base in the future without a commensurate increase in non-interest expenses.
Asset/Liability Management. Our asset/liability management policy is designed to provide stable net interest income growth by protecting our earnings from undue interest rate risk. We maintain a strategy of keeping the rate adjustment period on the majority of both assets and liabilities to an earnings neutral position, with a substantial amount of these assets and liabilities adjustable in 90 days or less. See Item 7: “Management’s Discussion and Analysis of Financial Condition and Results of Operations-Asset/Liability Management.”
Market Areas and Banks
Markets. First Community Bank serves three distinct market areas within New Mexico: Central New Mexico, including the Albuquerque metropolitan area (Bernalillo and Sandoval Counties), Gallup (McKinley County), and Grants (Cibola County); Northern New Mexico including Taos (Taos County) and Santa Fe (Santa Fe County); and Southern New Mexico including Belen and Los Lunas (Valencia County), Moriarty (Torrance County), Clovis (Curry County), Portales (Roosevelt County), and Las Cruces (Dona Ana County). The Bank’s Arizona market includes the Phoenix, Arizona (Maricopa County) metropolitan area which includes Sun City. Our markets are currently dominated by a number of large regional and national financial institutions that have acquired locally based banks. Our success is dependent to a significant degree on the economic conditions in our geographical markets.
Currently, our markets are performing slightly better than the nation as a whole in terms of unemployment rates. According to the United States Department of Labor’s Bureau of Labor Statistics, in December 2009, unemployment rates were 8.3% for New Mexico and 9.1% for Arizona, lower than the national unemployment rate of 10.0%.
The following is selected market data regarding the markets we serve:
The Albuquerque metropolitan area is the largest metropolitan area in New Mexico and is the financial center of the state. Albuquerque’s economy is centered around federal and state government, military, service, and technology industries. The New Mexico state government has an elaborate system of tax credits and technical assistance to promote job growth and business investment, especially in new technologies and the film industry. Military facilities include Kirtland Air Force Base and Sandia National Laboratories. A number of companies, including Hewlett Packard, Intel, General Mills, The Gap, Fidelity Investments, and Wal-Mart have initiated or expanded operations in the area in the past several years. In addition, several solar companies have initiated operations in recent years.
Gallup, New Mexico, in the west-central area of the state is on Interstate 40 (the only east-west interstate spanning New Mexico) just miles from the Arizona border. Gallup is adjacent to the Navajo Indian reservation, the largest Native American Indian reservation in land size in the United States.
Grants, New Mexico, located 80 miles west of Albuquerque, was once home to one of the largest uranium mines in the United States. Although the Grants economy is now driven more by tourism, it still sits on top of the nation’s second largest uranium ore reserve.
Taos County is a popular year-round recreation and tourist area. Ski and golf resorts in the area attract visitors from throughout the southwestern and western United States. Taos also has an active art community catering to the tourist trade.
8
Table of Contents
Santa Fe is the state capital of New Mexico. Its principal industries are government and tourism. Santa Fe is widely known for its southwestern art galleries and amenities, including the Santa Fe Opera. Santa Fe is one of the largest art markets in the United States, attracting visitors from all parts of the United States and many foreign countries.
Clovis, New Mexico and nearby Portales, New Mexico are small communities in the east-central side of the state. Clovis is home to Cannon Air Force Base, which under its new mission should remain open indefinitely. Portales is home to one of the state’s major universities, Eastern New Mexico University. Both communities are also supported by agricultural activity.
Las Cruces, New Mexico is the second largest city in New Mexico and marks the southern end of Interstate 25 at its intersection with Interstate 10 approximately 45 miles from El Paso, Texas. Las Cruces is home to New Mexico State University with an economy that benefits from its proximity to military installations, including White Sands Missile Range.
Phoenix, in Maricopa County, has a very diverse economic base, including financial services, professional services, health care, leisure, hospitality, and government, with dramatic growth over the last several years. Arizona has felt the affects of the economic downturn more than New Mexico primarily due to the overbuilding of houses in 2005 and 2006. We believe our business model, which is designed to attract disenfranchised customers of the very large banks, should continue to work well in Maricopa County. Over the next several years, assuming the return to an appropriate capital level and other factors, we intend to increase our market share through organic growth and selective de novo branch openings. Our entrance into the Maricopa County market began with a deposit only branch in Sun City, a retirement community just minutes away from Phoenix, which was acquired via Access in 2006. In 2007, we opened three full service branches in Phoenix.
First Community Bank serves a diverse group of small to medium size businesses, individuals and local governmental entities, and provides conventional commercial loans to established commercial businesses. We offer a full range of financial services to our customers, including checking accounts, on-line banking, short and medium term loans, revolving credit facilities, inventory and accounts receivable financing, equipment financing, residential and commercial construction lending, residential mortgage loans, various savings programs, installment and personal loans, and safe deposit services.
First Community Bank. The following table sets forth certain information concerning the banking offices of First Community Bank as of December 31, 2009. We completed the closure of our two Utah branches on October 31, 2008 and completed the sale of our Colorado branches on June 26, 2009. The remaining Utah and Colorado loans will continue to be serviced by Bank personnel in Utah and Colorado, until they are paid off or sold.
| First Community Bank Locations (by Region) |
Number of Branches |
Total Deposits |
Total Loans | |||||
| (Dollars in thousands) | ||||||||
| Northern New Mexico |
8 | $ | 343,276 | $ | 224,618 | |||
| Central New Mexico |
18 | 1,129,685 | 1,013,851 | |||||
| Southern New Mexico |
10 | 373,815 | 174,255 | |||||
| Arizona |
4 | 166,853 | 175,585 | |||||
| Colorado |
— | 17,853 | 214,489 | |||||
| Utah |
— | 2,846 | 214,892 | |||||
| Total |
40 | $ | 2,034,328 | $ | 2,017,690 | |||
9
Table of Contents
The following is a summary of the percentage of our deposits to total deposits of FDIC insured institutions (market share) in the counties in which we do business as reported by the FDIC as of June 30, 2009, the latest date for which the data is available.
| New Mexico | |||
| Taos |
36.15 | % | |
| Bernalillo |
9.07 | % | |
| Santa Fe |
9.94 | % | |
| Sandoval |
37.63 | % | |
| Valencia |
28.03 | % | |
| Torrance |
37.02 | % | |
| Dona Ana |
6.21 | % | |
| Cibola |
20.95 | % | |
| Curry |
9.65 | % | |
| Roosevelt |
22.32 | % | |
| McKinley |
14.86 | % | |
| Arizona | |||
| Maricopa |
0.28 | % | |
Competition
First Community Bank competes for loans and deposits with other commercial banks, savings banks, savings and loan associations, credit unions, finance companies, mutual funds, insurance companies, brokerage and investment banking firms, asset-based non-bank lenders, governmental organizations, and other institutions with respect to the scope and type of services offered, interest rates paid on deposits, and pricing of loans, among other things. Many of our competitors have significantly greater financial and other resources than we do. First Community Bank also faces significant competition for investors’ funds from sellers of short-term money market securities and other corporate and government securities.
First Community Bank competes for loans principally through the range and quality of its services, interest rates, and loan fees. We believe that First Community Bank’s personal-service philosophy enables the bank to compete favorably with other financial institutions in its focus market of local businesses. First Community Bank actively solicits deposit-related clients and competes for deposits by offering customers a broad array of products and services, competitive interest rates, personal attention, and professional service.
Employees
As of December 31, 2009, we had 542 full-time equivalent employees. We place a high priority on staff development, training, and selective hiring. We select new employees on the basis of both technical skills and customer-service capabilities. Our staff development involves training in marketing, customer service, and regulatory compliance. Our employees are not covered by a collective bargaining agreement. We believe that our relationship with our employees is good.
Supervision and Regulation
First State Bancorporation. We are a bank holding company subject to the supervision, examination, and regulation of the Board of Governors of the Federal Reserve System (the “Federal Reserve Board”) under the Bank Holding Company Act (the “BHCA”). The BHCA and other federal laws subject bank holding companies to particular restrictions on the types of activities in which they may engage and to a range of supervisory requirements and activities, including regulatory enforcement actions for violations of laws
10
Table of Contents
and regulations. As a bank holding company, our activities and those of our banking subsidiary are limited to the business of banking and activities closely related or incidental to banking, and we may not directly or indirectly acquire the ownership or control of more than 5% of any class of voting shares or substantially all of the assets of any company, including a bank, without the prior approval of the Federal Reserve Board.
Supervision and regulation of bank holding companies and their subsidiaries are intended primarily for the protection of depositors, the deposit insurance funds of the Federal Deposit Insurance Corporation (the “FDIC”), and the banking system as a whole, not for the protection of bank holding company stockholders or creditors. The banking regulatory agencies have broad enforcement power over bank holding companies and banks, including the power to impose substantial fines and other penalties for violation of laws and regulations. See “Recent Company Developments” above for information regarding a Regulator Agreement between First State Bancorporation, First Community Bank, and our Regulators.
On January 1, 2005, the Federal Reserve Board’s revised bank holding company rating system became effective. The revised system more closely aligns the Federal Reserve’s rating process with the focus of its current supervisory practices by placing an increased emphasis on risk management, providing a more flexible and comprehensive framework for evaluating financial condition, and requiring an explicit determination of the likelihood that the non-depository entities of a bank holding company will have a significant negative impact on the depository subsidiaries. Under the revised rating system, each bank holding company is assigned a composite rating based on an evaluation and rating of three essential components of an institution’s financial condition and operations. These three components are: Risk Management, Financial Condition, and potential impact of the parent company and non-depository subsidiaries on the subsidiary depository institutions. A fourth rating, Depository Institution, mirrors the primary regulator’s assessment of the subsidiary depository institutions.
First Community Bank. As a New Mexico-chartered state member bank of the Federal Reserve System, First Community Bank is subject to regulation and supervision by the Federal Reserve Board and the New Mexico Financial Institutions Division, and, as a result of the insurance of its deposits, by the FDIC. Almost every aspect of the operations and financial condition of First Community Bank is subject to extensive regulation and supervision and to various requirements and restrictions under federal and state law, including requirements governing capital adequacy, liquidity, earnings, dividends, reserves against deposits, management practices, branching, loans, investments, and the provision of services. Various consumer protection laws and regulations also affect the operations of First Community Bank. The deposits of First Community Bank are insured up to applicable limits by the FDIC. See “Recent Company Developments” above for information regarding a Regulator Agreement between First State Bancorporation, First Community Bank, and our Regulators.
Holding Company Liability. Under Federal Reserve Board policy, a bank holding company is expected to act as a source of financial strength to its banking subsidiaries and commit resources to their support. This support may be required by the Federal Reserve Board at times when, absent this Federal Reserve policy, we may not be inclined to provide it. As discussed below under “Prompt Corrective Action,” a bank holding company in certain circumstances also could be required to guarantee the capital plan of an undercapitalized banking subsidiary. In addition, any capital loans by a bank holding company to any of its depository institution subsidiaries are subordinate in right of payment to deposits and to certain other indebtedness of the banks.
In the event of a bank holding company’s bankruptcy under Chapter 11 of the U.S. Bankruptcy Code, the trustee will be deemed to have assumed and is required to cure immediately any deficit under any commitment by the debtor holding company to any of the federal banking agencies to maintain the capital of an insured depository institution, and any claim for breach of such obligation will generally have priority over most other unsecured claims.
Payment of Dividends. The Federal Reserve Board has issued a policy statement with regard to the payment of cash dividends by bank holding companies. The policy statement provides that, as a matter of prudent banking, a bank holding company should not maintain a rate of cash dividends unless its net
11
Table of Contents
income available to common stockholders has been sufficient to fully fund the dividends, and the prospective rate of earnings retention appears to be consistent with the holding company’s capital needs, asset quality, and overall financial condition. Accordingly, a bank holding company should not pay cash dividends that exceed its net income or can only be funded in ways that weaken the bank holding company’s financial health, such as by borrowing.
In addition, as noted above, bank holding companies are expected under Federal Reserve Board policy to serve as a source of financial strength for their depository institution subsidiaries. This requirement, and the capital adequacy requirements applicable to bank holding companies, described below under “Capital Adequacy Requirements,” may also limit our ability to pay dividends. See “Recent Company Developments” above for information regarding a Regulator Agreement between First State Bancorporation, First Community Bank, and our Regulators and restrictions on our ability to pay dividends.
As a bank holding company, we are a legal entity separate and distinct from First Community Bank. Our principal asset is the outstanding capital stock of First Community Bank. As a result, our ability to pay dividends on our common stock will depend primarily on the ability of First Community Bank to pay dividends to us in amounts in excess of the amounts required to service our obligations. Dividend payments from First Community Bank are subject to federal and state limitations, generally based on the capital level and current and retained earnings of the bank. Approval of the Federal Reserve Board is required, for example, for payment of any dividend if the total of all dividends declared by the bank in any calendar year would exceed the total of its net profits (as defined by regulatory agencies) for that year combined with its retained net profits for the preceding two years. First Community Bank may not pay a dividend in an amount greater than its net profits. First Community Bank is also prohibited under federal law from paying any dividend that would cause it to become undercapitalized. In addition, the Federal regulatory agencies are authorized to prohibit a bank or bank holding company from engaging in an unsafe or unsound banking practice. The payment of dividends could, depending on the financial condition of First Community Bank, be deemed to constitute an unsafe or unsound practice.
Under New Mexico law, First Community Bank may not pay a dividend on its common stock unless its remaining surplus after payment of such dividend is equal to at least 20% of its minimum common capital requirement. First Community Bank is also prohibited from paying dividends from undivided profits if its reserves against deposits are impaired or will become impaired as a result of such payment.
In order to help improve the Company’s and the Bank’s capital ratios, we suspended our cash dividend payments to shareholders in July 2008, and the Bank has not declared a cash dividend to the Company since May 2008. The Company and First Community Bank are both currently precluded from paying dividends pursuant to the Regulator Agreement. See “Recent Company Developments” above.
Capital Adequacy Requirements. We are subject to the Federal Reserve Board’s risk-based capital and leverage guidelines for bank holding companies. The minimum ratio of total capital to risk-weighted assets, which are the credit risk equivalents of balance sheet assets and certain off balance sheet items such as standby letters of credit, is 8%. At least half of the total capital must be composed of common stockholders’ equity (including retained earnings), trust preferred securities, qualifying non-cumulative perpetual preferred stock (and, for bank holding companies only, a limited amount of qualifying cumulative perpetual preferred stock), and minority interests in the equity accounts of consolidated subsidiaries, less goodwill, other disallowed intangibles, and disallowed deferred tax assets, among other items (“Tier 1 Capital”). The remainder may consist of a limited amount of subordinated debt, other perpetual preferred stock, hybrid capital instruments, mandatory convertible debt securities that meet certain requirements, as well as a limited amount of reserves for loan losses (“Tier 2 Capital”). The maximum amount of Tier 2 Capital that may be included in an organization’s qualifying total capital is limited to 100% of Tier 1 Capital. The Federal Reserve Board has also adopted a minimum leverage ratio for bank holding companies, requiring Tier 1 Capital of at least 4% of average total consolidated assets. See “Recent Company Developments” above for information regarding a Regulator Agreement between First State Bancorporation, First Community Bank, and our Regulators.
12
Table of Contents
Our subsidiary, First Community Bank, also is subject to risk-based and leverage capital guidelines of the Federal Reserve Board which are similar to those established by the Federal Reserve Board for bank holding companies. Under the Federal Deposit Insurance Corporation Act of 1991 (“FDICIA”) institutions are classified in one of five defined categories as illustrated in the chart below. Capital ratios for First State Bancorporation and First Community Bank are also provided in the chart below. As discussed below under “Enforcement Powers of the Federal Regulatory Agencies,” failure to meet the minimum regulatory capital requirements could subject a banking institution to a variety of enforcement remedies available to federal regulatory authorities, including, in most severe cases, the termination of deposit insurance by the FDIC and the placement of the institution into conservatorship or receivership.
Risk-Based Capital and Leverage Ratios
| As of December 31, 2009 Risk-Based Ratios |
|||||||||
| Tier I Capital |
Total Capital |
Leverage Ratio |
|||||||
| First State Bancorporation |
2.8 | % | 5.6 | % | 2.0 | % | |||
| First Community Bank |
7.0 | % | 8.3 | % | 4.9 | % | |||
| Well capitalized |
³6.0 | % | ³10.0 | % | ³5.0 | % | |||
| Adequately capitalized |
³4.0 | % | ³8.0 | % | ³4.0 | % | |||
| Undercapitalized |
<4.0 | % | <8.0 | % | <4.0 | % | |||
| Significantly undercapitalized |
<3.0 | % | <6.0 | % | <3.0 | % | |||
| Critically undercapitalized |
£2.0 | % | |||||||
The federal bank regulatory agencies’ risk-based and leverage ratios are minimum supervisory ratios generally applicable to banking organizations that meet certain specified criteria, assuming that they have the highest regulatory rating. Banking organizations not meeting these criteria are expected to operate with capital positions well above the minimum ratios. The federal bank regulatory agencies may set capital requirements for a particular banking organization that are higher than the minimum ratios when circumstances warrant. Federal Reserve Board guidelines also provide that banking organizations experiencing internal growth or making acquisitions will be expected to maintain strong capital positions substantially above the minimum supervisory levels, without significant reliance on intangible assets. In addition, the regulations of the Federal Reserve Board provide that concentration of credit risk, interest rate risk, and certain risks arising from nontraditional activities, as well as an institution’s ability to manage these risks, are important factors to be taken into account by regulatory agencies in assessing an organization’s overall capital adequacy. The risk-based capital regulations also provide for the consideration of interest rate risk in the agencies’ determination of a banking institution’s capital adequacy. The regulations require such institutions to effectively measure and monitor their interest rate risk and to maintain capital adequate for that risk. The regulatory capital calculation limits the amount of allowance for loan losses that is included in capital to 1.25 percent of risk-weighted assets. At December 31, 2009, the Company and the Bank had approximately $103 million of allowance for loan losses which was excluded from regulatory capital. See “Recent Company Developments” above for information regarding a Regulator Agreement between First State Bancorporation, First Community Bank, and our Regulators.
Prompt Corrective Action. Under the Federal Deposit Insurance Corporation Improvement Act of 1991, the federal banking agencies must take prompt supervisory and regulatory actions against undercapitalized depository institutions. Depository institutions, such as First Community Bank, are assigned one of five capital categories: “well capitalized,” “adequately capitalized,” “undercapitalized,” “significantly undercapitalized,” and “critically undercapitalized” and are subjected to differential regulation corresponding to the capital category within which the institution falls. Under certain circumstances, a well capitalized, adequately capitalized, or undercapitalized institution may be treated as if the institution were in the next lower capital category. A depository institution is generally prohibited from making capital distributions (including paying dividends) or paying management fees to a holding company if the institution would thereafter be undercapitalized. Adequately capitalized institutions cannot accept, renew, or roll over brokered deposits except with a waiver from the FDIC, and are subject to restrictions on the interest rates that can be paid on such deposits. Undercapitalized institutions may not accept, renew, or roll over brokered deposits.
13
Table of Contents
The banking regulatory agencies are permitted or, in certain cases, required to take certain actions with respect to institutions falling within one of the three undercapitalized categories. Depending on the level of an institution’s capital, the agencies’ corrective powers include, among other things:
| • | prohibiting the payment of principal and interest on subordinated debt; |
| • | prohibiting the holding company from making distributions without prior regulatory approval; |
| • | placing limits on asset growth and restrictions on activities; |
| • | placing additional restrictions on transactions with affiliates; |
| • | restricting the interest rate the institution may pay on deposits; |
| • | prohibiting the institution from accepting deposits from correspondent banks; and |
| • | in the most severe cases, appointing a conservator or receiver for the institution. |
A banking institution that is undercapitalized is required to submit a capital restoration plan, and such a plan will not be accepted unless, among other things, the banking institution’s holding company guarantees the plan up to a certain specified amount. Any such guarantee from a depository institution’s holding company is entitled to a priority of payment in bankruptcy. Failure to meet capital guidelines could subject the bank to a variety of enforcement remedies by federal bank regulatory agencies, including termination of deposit insurance by the FDIC, and to certain restrictions on business. As of December 31, 2009, the Bank was considered “adequately capitalized” while the Company was considered “significantly undercapitalized.” The Bank and the Company are currently subject to a Regulator Agreement with the Regulators. See “Recent Company Developments” above. Failure to comply with the provisions of the Regulator Agreement could subject the Company and/or the Bank to additional enforcement actions. See “Supervision and Regulation” below.
Enforcement Powers of the Federal Banking Agencies. The federal banking agencies have broad enforcement powers. Failure to comply with applicable laws, regulations, and supervisory agreements could subject First State Bancorporation or First Community Bank, as well as officers, directors, and other institution-affiliated parties of these organizations, to administrative sanctions and potentially substantial civil monetary penalties. In addition to the grounds discussed under “Prompt Corrective Action,” the appropriate federal banking agency may appoint the FDIC as conservator or receiver for a banking institution (or the FDIC may appoint itself, under certain circumstances) if any one or more of a number of circumstances exist, including, without limitation, where the banking institution:
| • | is undercapitalized and has no reasonable prospect of becoming adequately capitalized; |
| • | fails to become adequately capitalized when required to do so; |
| • | fails to submit a timely and acceptable capital restoration plan; or |
| • | materially fails to implement an accepted capital restoration plan. |
Control Acquisitions. The Change in Bank Control Act prohibits a person or group of persons from acquiring “control” of a bank holding company unless the Federal Reserve Board has been notified and has not objected to the transaction. Under a rebuttable presumption established by the Federal Reserve Board, the acquisition of 10% or more of a class of voting stock of a bank holding company with a class of securities registered under Section 12 of the Securities Exchange Act of 1934, such as First State Bancorporation, would, under the circumstances set forth in the presumption, constitute acquisition of control of First State Bancorporation.
In addition, any company is required to obtain the approval of the Federal Reserve Board under the BHCA before acquiring 25% (5% in the case of an acquiror that is a bank holding company) or more of the outstanding common stock of First State Bancorporation, or otherwise obtaining control or a “controlling influence” over First State Bancorporation.
14
Table of Contents
Restrictions on Transactions with Affiliates and Insiders. First Community Bank is subject to restrictions under federal law that limits certain transactions with affiliates, including loans, other extensions of credit, investments, or asset purchases. Such transactions by a banking subsidiary with any one affiliate are limited in amount to 10% of the bank’s capital and surplus and, with all affiliates together, to an aggregate of 20% of the bank’s capital and surplus. Furthermore, such loans and extensions of credit, as well as certain other transactions, are required to be secured in specified amounts. These and certain other transactions, including any payment of money to us, must be on terms and conditions that are or in good faith would be offered to nonaffiliated companies.
The restrictions on loans to directors, executive officers, principal stockholders, and their related interests (collectively referred to herein as “insiders”) contained in the Federal Reserve Act and Regulation O apply to all federally insured institutions and their subsidiaries and holding companies. These restrictions include limits on loans to one borrower and conditions that must be met before such a loan can be made. There is also an aggregate limitation on all loans to insiders and their related interests. These loans cannot exceed the institution’s total unimpaired capital and surplus, and the FDIC may determine that a lesser amount is appropriate. Insiders are subject to enforcement actions for knowingly accepting loans in violation of applicable restrictions. Regulation O institutions are not subject to the prohibitions of the Sarbanes-Oxley Act of 2002 on certain loans to insiders.
Anti-Terrorism Legislation. We are subject to the USA Patriot Act of 2001, which contains the International Money Laundering Abatement and Anti-Terrorist Financing Act of 2001. The Act contains anti-money laundering measures affecting insured depository institutions, broker-dealers, and certain financial institutions. The Act requires U.S. financial institutions to adopt policies and procedures to combat money laundering and grants the Secretary of the Treasury broad authority to establish regulations and to impose requirements and restrictions on financial institutions’ operations. We have established policies and procedures to ensure compliance with the Act and the related regulations.
Interstate Banking and Branching. The Riegle-Neal Act, enacted in 1994, permits an adequately capitalized and adequately managed bank holding company, with Federal Reserve Board approval, to acquire banking institutions located in states other than the bank holding company’s home state without regard to whether the transaction is prohibited under state law. In addition, national banks and state banks with different home states are permitted to merge across state lines, with the approval of the appropriate federal banking agency, unless the home state of a participating banking institution has passed legislation prior to that date that expressly prohibits interstate mergers. De novo interstate branching is permitted if the laws of the host state so authorize.
The Gramm-Leach-Bliley Act. The GLBA enables qualified bank holding companies to acquire insurance companies and securities firms and effectively repeals depression-era laws, which prohibited the affiliation of banks and these other financial services entities under a single holding company. Certain qualified bank holding companies and other types of financial service entities may elect to become financial holding companies under the GLBA. Financial holding companies may engage in a wide range of activities and may affiliate with a wider range of companies than bank holding companies that are not financial holding companies. The GLBA enables financial holding companies and their non-bank subsidiaries to engage in activities that are financial in nature, incidental to financial activities, or complementary to financial activities, including banking, securities underwriting, merchant banking, and insurance (both underwriting and agency services). Qualification as a financial holding company depends on subsidiary depository institutions remaining well capitalized and well managed, as defined in Federal Reserve Board regulations, and receiving at least satisfactory ratings under the Community Reinvestment Act. In connection with the Regulator Agreement (see “Recent Company Developments” above), we relinquished our status as a financial holding company.
The financial activities authorized by the GLBA also may be engaged in by a “financial subsidiary” of a national or state bank, with the exception of insurance or annuity underwriting, insurance company portfolio investments, real estate investment and development, and merchant banking, all of which must be conducted by the financial holding company.
15
Table of Contents
The GLBA also modified laws related to financial privacy and community reinvestment. The new financial privacy provisions generally prohibit financial institutions, including us, from disclosing nonpublic personal financial information to third parties unless customers have the opportunity to “opt out” of the disclosure. Financial institutions are also required to establish and maintain policies and procedures to safeguard their customers’ records and information. We have established policies and procedures regarding the GLBA financial privacy requirements and the related regulations.
Community Reinvestment Act. First Community Bank is subject to the CRA. The CRA and the regulations issued thereunder are intended to encourage banks to help meet the credit needs of their service area, including low and moderate income neighborhoods, consistent with the safe and sound operations of the banks. These regulations also provide for regulatory assessment of a bank’s record in meeting the needs of its service area when considering applications to establish branches, merger applications, and applications to acquire the assets and assume the liabilities of another bank. The Financial Institutions Reform, Recovery, and Enforcement Act of 1989 (“FIRREA”) requires federal banking agencies to make public a rating of a bank’s performance under the CRA. In the case of a bank holding company, the CRA performance record of its bank subsidiaries are reviewed by federal banking agencies in connection with the filing of an application to acquire ownership or control of shares or assets of a bank or thrift or to merge with any other bank holding company. An unsatisfactory record can substantially delay or block the transaction. First Community Bank received an “outstanding” CRA rating, the highest rating available, from the Federal Reserve at its most recent CRA examination.
Consumer Laws and Regulations. In addition to the laws and regulations discussed herein, First Community Bank is also subject to certain consumer laws and regulations that are designed to protect consumers in transactions with banks. While the list set forth herein is not exhaustive, these laws and regulations include the Truth in Lending Act, the Truth in Savings Act, the Electronic Funds Transfer Act, the Expedited Funds Availability Act, the Equal Credit Opportunity Act, the Fair Housing Act, the Home Mortgage Disclosure Act, the Fair Credit Reporting Act, the Unfair Practices Acts of states, and the Real Estate Settlement Procedures Act among others. These laws and regulations mandate certain disclosure requirements and regulate the manner in which financial institutions must deal with customers when taking deposits, making loans, or engaging in other types of transactions with such customers.
Effect on Economic Environment. The policies of regulatory authorities, especially the monetary policy of the Federal Reserve Board, have a significant effect on the operating results of bank holding companies and their subsidiaries. Among the means available to the Federal Reserve Board to affect the money supply are open market operations in U.S. Government securities, changes in the discount rate on member bank borrowings, and changes in reserve requirements against member bank deposits. These means are used in varying combinations to influence overall growth and distribution of bank loans, investments and deposits, and their use may affect interest rates charged on loans or paid for deposits. Federal Reserve Board monetary policies have materially affected the operating results of commercial banks in the past and are expected to continue to do so in the future. The nature of future monetary policies and the effect of such policies on our business and earnings cannot be predicted.
Check 21 Act. We are subject to the Check Clearing for the 21st Century Act (the “Check 21 Act”), which was enacted on October 28, 2003 and became effective on October 28, 2004. The Check 21 Act authorizes a negotiable instrument called a “substitute check” to facilitate check truncation and electronic check exchange. A substitute check is a paper reproduction of the original check that contains an image of the front and back of the original check and can be processed just like the original check. The Check 21 Act provides that a properly prepared substitute check is the legal equivalent of the original check for all purposes. The Check 21 Act does not require any bank to create substitute checks or to accept checks electronically. The Check 21 Act includes warranties, an indemnity, and expedited re-credit procedures that protect substitute check recipients. We have established policies and procedures designed for compliance with the Check 21 Act.
Corporate Governance—Sarbanes-Oxley Act of 2002 and Nasdaq Independence Rules. We are subject to the Sarbanes-Oxley Act of 2002 (“SOX”), which implemented reforms intended to address securities and accounting fraud. Among other things, SOX established a new accounting oversight board to enforce
16
Table of Contents
auditing, quality control and independence standards, restricts provision of both auditing and consulting services by accounting firms, and provides audit committee pre-approval of non-audit services to audit clients. To insure auditor independence, any non-audit services being provided to an audit client requires pre-approval by a company’s audit committee members. SOX requires chief executive officers and chief financial officers, or their equivalent, to certify to the accuracy of periodic reports filed with the Commission, subject to civil and criminal penalties for knowing violations. SOX also requires audit committees to be independent, and enacts other requirements for audit committee operations and selection of auditor. SOX expands the scope and penalties of the federal criminal code relating to securities and accounting fraud, and affords protection for employees who are “whistle-blowers.” We are subject to the requirements of Section 404 of SOX wherein management is required to establish and maintain internal controls and procedures for financial reporting and to report annually on (1) management’s responsibility for the internal controls and procedures for financial reporting and (2) their effectiveness.
This annual report does not include an attestation report of the Company’s registered public accounting firm regarding internal control over financial reporting. Management’s report was not subject to attestation by the Company’s registered public accounting firm pursuant to temporary rules of the Securities and Exchange Commission that permit the Company to provide only management’s report in this annual report.
We are listed on the Nasdaq as a member of their Global Select Market (Nasdaq). On November 2, 2003, the SEC approved Nasdaq rules for companies listed on Nasdaq as part of their qualitative listing requirements for listing or continued listing relating to audit committee composition, audit committee charters, nominating committee charters, executive sessions of independent directors, and code of conduct requirements. Under the Nasdaq rules, the audit committee must be composed of independent directors without recent affiliation with auditors of the company, must have at least one financial expert, must have an audit committee charter, directors must have executive sessions of independent directors, must have a nominating committee charter, and must have a code of conduct applying to all employees, officers, and directors meeting certain minimum standards. As required by the Nasdaq rules, we have certified that we comply with the new rules. In addition, the Nasdaq also requires audit committee approval of all related party transactions and that a majority of the board of directors be independent under the Nasdaq definition of independence. See “Recent Company Developments” above for information regarding notification from Nasdaq of the failure to maintain listing requirements. Also, see “Risk Factors” below.
The board is committed to maintaining a corporate governance structure that meets or exceeds the requirements under the securities laws and the Nasdaq rules.
Deposit Insurance Reform. The deposits of First Community Bank are insured up to applicable limits by the FDIC. In November 2008, the Board of Directors of the FDIC adopted a final rule relating to the Temporary Liquidity Guarantee (“TLG”) Program. Under the TLG’s debt guarantee program, the FDIC will guarantee, through the earlier of maturity or June 30, 2012, certain newly issued senior unsecured debt issued by participating institutions on or after October 14, 2008, and before June 30, 2009. This debt guarantee program was subsequently extended for senior unsecured debt issued after April 1, 2009 and before October 31, 2009 and maturing on or before December 31, 2012. In addition, in October 2009, the FDIC established a limited six-month emergency guarantee facility upon expiration of the debt guarantee program. Under this emergency guarantee facility, certain participating entities can apply to the FDIC for permission to issue FDIC-guaranteed debt during the period starting October 31, 2009 through April 30, 2010. We do not currently have any qualifying senior debt. Under the Transaction Account Guarantee (“TAG”) portion of the TLG the FDIC will provide full deposit insurance coverage for non-interest bearing transaction deposit accounts, Negotiable Order of Withdrawal (“NOW”) accounts paying less than 0.5% interest per annum and Interest on Lawyers Trust Accounts held at participating FDIC insured institutions. In August 2009, the FDIC adopted a final rule extending the TAG portion of the TLG for six months through June 30, 2010. We have elected to participate in both guarantee programs and will continue to participate in the TAG program through June 30, 2010. See “Risk Factors” below.
The FDIC insures deposits at FDIC insured depository institutions, including the Bank. Under current FDIC regulations, each insured depository institution is assigned to one of nine risk categories based on
17
Table of Contents
capital and supervisory measures and, depending on its assigned category, is assessed insurance premiums based on the amount of deposits held. The FDIC charges insured financial institutions premiums to maintain the Deposit Insurance Fund (“DIF”) at a certain level. Recent bank failures and expectations for further failures in the near-term have reduced insurance reserve funds to their lowest level since 1993. On October 16, 2008, the FDIC published a restoration plan designed to replenish the DIF over a period of five years and to increase the deposit insurance reserve ratio to 1.15% of insured deposits by December 31, 2013. In order to implement the restoration plan, the FDIC proposed to change both its risk-based assessment system and its base assessment rates. On February 27, 2009, the FDIC amended the restoration plan to extend the restoration plan horizon to seven years. The amended restoration plan was accompanied by a final rule setting assessment rates and making adjustments to improve how the assessment system differentiates for risk. Under the final rule, the base assessment rates increased substantially beginning April 1, 2009. Changes to the risk-based assessment system included increasing premiums for institutions that rely on excessive amounts of brokered deposits, including Certificate of Deposit Account Registry Service (“CDARS”), increasing premiums for excessive use of secured liabilities, including Federal Home Loan Bank, (“FHLB”) advances, lowering premiums for smaller institutions with high capital levels and reducing assessment rates for institutions holding long-term unsecured debt. In addition, institutions that elected to participate in the extension of the TAG program experienced an increase in their quarterly annualized fee from 10 basis points to between 15 and 25 basis points, depending on their risk rating.
On May 22, 2009, the FDIC adopted another final rule imposing a 5 basis point special assessment on each insured depository institution’s assets minus Tier 1 capital, as of June 30, 2009. This special assessment, which totaled $1.4 million for the Bank, was collected on September 30, 2009. On November 17, 2009, the FDIC also published a final rule requiring insured depository institutions to prepay their estimated quarterly risk-based assessments for the fourth quarter of 2009 and for all of 2010, 2011 and 2012. On November 12, 2009, the FDIC provided an exemption to the Bank from the prepayment provisions.
Future Legislation. Legislation is from time to time introduced in Congress and state legislatures with respect to the regulation of financial institutions. Such legislation may change the banking statutes and our operating environment in substantial and unpredictable ways. We cannot determine the ultimate effect that potential legislation, if enacted, or implementing regulations, would have upon our financial condition or our results of operations.
Other
For a discussion of asset/liability management, the investment portfolio, loan portfolio, non-performing assets, allowance for loan losses, and deposits see Item 7: “Management’s Discussion and Analysis of Financial Condition and Results of Operations.”
Available Information
Our Internet address is www.fcbnm.com. We make available free of charge through our web site our annual report on Form 10-K, quarterly reports on Form 10-Q, current reports on Form 8-K, and all amendments to those reports filed or furnished pursuant to Section 13(a) or 15(d) of the Exchange Act as soon as reasonably practicable after we electronically file such material with, or furnish such material to, the SEC. Information contained on the web site is not part of this report.
18
Table of Contents
| Item 1A: | Risk Factors. |
Forward-Looking Statements
Certain statements in this Form 10-K are forward-looking statements, within the meaning of Section 27A of the Securities Act of 1933 and Section 21E of the Securities Exchange Act of 1934 (the “Exchange Act”). These statements are based on management’s current expectations or predictions of future results or events. We make these forward-looking statements in reliance on the safe harbor provisions provided under the Private Securities Litigation Reform Act of 1995.
All statements, other than statements of historical fact, included in this report which relate to performance, development or activities that we expect or anticipate will or may happen in the future, are forward looking statements. The discussions regarding our growth strategy, expansion of operations in our markets, acquisitions, dispositions, competition, loan and deposit growth or decline, timing of new branch openings, capital expectations, and response to consolidation in the banking industry include forward-looking statements. Other forward-looking statements may be identified by the use of forward-looking words such as “believe,” “expect,” “may,” “might,” “will,” “should,” “seek,” “could,” “approximately,” “intend,” “plan,” “estimate,” or “anticipate” or the negative of those words or other similar expressions.
Forward-looking statements involve inherent risks and uncertainties and are based on numerous assumptions. They are not guarantees of future performance. A number of important factors could cause actual results to differ materially from those in the forward-looking statement. Some factors include changes in interest rates, local business conditions, government regulations, lack of available credit, lack of confidence in the financial markets, loss of key personnel or inability to hire suitable personnel, asset quality and loan loss trends, faster or slower than anticipated growth, economic conditions, our competitors’ responses to our marketing strategy or new competitive conditions, and competition in the geographic and business areas in which we conduct our operations. Forward-looking statements contained herein are made only as of the date made, and we do not undertake any obligation to update them to reflect events or circumstances after the date of this report to reflect the occurrence of unanticipated events.
Because forward-looking statements involve risks and uncertainties, we caution that there are important factors, in addition to those listed above, that may cause actual results to differ materially from those contained in the forward-looking statements. These factors include the following:
Our independent registered public accounting firm has expressed substantial doubt about our ability to continue as a going concern.
Our independent registered public accounting firm in their audit report for the period ended December 31, 2009 has expressed substantial doubt about our ability to continue as a going concern, noting in their report that our Regulator Agreement (discussed below), among other things restricts certain operations and requires us to maintain sufficient capital and to submit a capital plan. Our independent registered public accounting firm also notes that further decline in our capital ratios or failure to increase capital could expose us to additional restrictions and regulatory actions, including being placed into a FDIC-administered receivership or conservatorship. Our audited financial statements do not include any adjustments that might result from the outcome of these uncertainties. If we cannot continue as a going concern, our shareholders will lose some or all of their investment in the Company.
Management has determined that significant additional sources of capital will likely be required for the Company to continue operating through 2010 and beyond. Although management does not believe that the Company currently has the ability to raise new capital through a public offering at an acceptable price, management continues to work with the Company’s investment bankers to evaluate alternative capital strengthening strategies, and are currently working on other initiatives to strengthen the Company’s capital position including the possibility of entering into a business combination with a strategic partner or a transaction with a private equity group. However, there can be no assurance that the review of strategic alternatives will result in the Company pursuing any particular transaction or strategy, or if it pursues any such transaction or strategy, that it will be completed.
19
Table of Contents
We operate in a highly regulated environment; changes in federal and state laws and regulations and accounting principles may adversely affect us.
We are a bank holding company. Bank holding companies and their subsidiaries operate in a highly regulated environment, subject to extensive supervision and examination by federal and state bank regulatory agencies. We are subject to changes in federal and state law, as well as changes in regulation and governmental policies, income tax law, and accounting principles. The significant federal and state banking regulations that affect us are described in this report under the heading “Business — Regulation and Supervision”. Recent events have resulted in legislators, regulators and authoritative bodies, such as the Financial Accounting Standards Board, the Securities and Exchange Commission, or SEC, the Public Company Accounting Oversight Board and various taxing authorities responding by adopting and/or proposing substantive revisions to laws, regulations, rules, standards, policies and interpretations. Further, federal monetary policy as implemented through the Board of Governors of the Federal Reserve System, or Federal Reserve, can significantly affect credit conditions in our markets. If new legislation, regulations, or accounting principles are enacted or adopted, our results of operations and financial condition may be adversely affected.
In particular, we are subject to the Bank Holding Company Act of 1956, as amended, and to regulation and supervision by the Federal Reserve Board. First Community Bank, as a state member bank of the Federal Reserve System, is subject to regulation and supervision by the Federal Reserve Board and the New Mexico Financial Institutions Division of the Regulation and Licensing Department and, because its deposits are insured, by the Federal Deposit Insurance Corporation. Our operations in Arizona may also be subject to regulation and supervision by the Arizona State Banking Department. Regulators have significant discretion and power to prevent or remedy unsafe or unsound practices or violations of laws by banks and bank holding companies in the performance of the regulators’ supervisory and enforcement duties. If regulators exercise these powers, our results of operations and financial condition may be adversely affected.
The Federal Reserve Board has a policy stating that a bank holding company is expected to act as a source of financial and managerial strength to a subsidiary bank and to commit resources to support the subsidiary bank. Under this doctrine, the Federal Reserve may require a bank holding company to make capital injections into a troubled subsidiary bank and may charge the bank holding company with engaging in unsafe and unsound practices if it fails to commit resources to such a subsidiary bank. A capital injection may be required at times when the holding company may be required to borrow the funds or otherwise obtain the funds from external sources. If we are required to make such a capital injection, we may need to seek capital in order to do so. We do not believe we currently have the ability to raise new capital through a public offering at an acceptable price. We continue to work with our investment bankers to evaluate alternative capital strengthening strategies, and are currently working on other initiatives to strengthen our capital position including the possibility of entering into a business combination with a strategic partner, or a transaction with a private equity group. However, there can be no assurance that the review of strategic alternatives will result in the Company pursuing any particular transaction or strategy, or if it pursues any such transaction or strategy, that it will be completed.
Non-compliance of our Regulator Agreement may adversely affect our operations.
As a result of a safety and soundness examination of the Company and our subsidiary First Community Bank, which was conducted jointly by the Federal Reserve and the New Mexico Financial Institutions Division, we entered into an agreement on July 2, 2009 (the “Regulator Agreement”). Under the terms of the Regulator Agreement, we agreed, among other things, to engage an independent consultant acceptable to the regulators to assess the Bank’s management and staffing needs, assess the qualifications and performance of all officers of the Bank, and assess the current structure and compositions of the Bank’s board of directors and its committees. In addition, within 60 days of the Regulator Agreement, the Company and or the Bank was required to submit a written plan to strengthen lending and credit risk
20
Table of Contents
management practices and improve the Bank’s position regarding past due loans, problem loans, classified loans, and other real estate owned; maintain sufficient capital at the Bank, holding company and the consolidated level; improve the Bank’s earnings and overall condition; and improve management of the Bank’s liquidity position, funds management process, and interest rate risk management. The Company and or the Bank have also agreed to maintain an adequate allowance for loan and lease losses; charge-off or collect assets classified as “loss” in the Report of Examination that have not been previously collected or charged off; not to pay any dividends; not to distribute any interest, principal or other sums on trust preferred securities; not to issue, increase or guarantee any debt; not to purchase or redeem any shares of the Company’s stock; and not to accept any new brokered deposits, even if the Bank is considered well capitalized. There can be no assurance that the Company and or the Bank’s plans or level of capital will be deemed sufficient by the Regulators. We continue to work closely with the Regulators regarding the Regulator Agreement and believe that the Company and the Bank are in full compliance with the Regulator Agreement, except for the requirement to submit an acceptable capital plan. Capital plans for the Company and the Bank were submitted timely, but were not accepted by the regulators due to uncertainty of our ability to execute the plans. We are continuing to work toward full compliance with the requirements of the capital plans. However, there can be no assurance that the Company and or the Bank will be able to comply fully with the provisions of the Regulator Agreement, or that efforts to comply with the Regulator Agreement will not have adverse effects on the Company’s ability to continue as a going concern. In addition, compliance with the terms of the Regulator Agreement may be expensive, and may take a significant amount of time of our management. However, if we fail to comply with the terms of the Regulator Agreement, we may be subject to further regulations.
There can be no assurance that the recent efforts by legislators and regulators will help stabilize the U.S. financial system, and the expiration of programs implemented under such legislation may have unintended adverse effects on us.
In response to market disruptions, legislators and financial regulators have implemented a number of mechanisms designed to stabilize the financial markets, including the provision of direct and indirect assistance to distressed financial institutions, assistance by the banking authorities in arranging acquisitions of weakened banks and broker-dealers and implementation of programs by the Federal Reserve, to provide liquidity to the commercial paper markets. On October 3, 2008, the Emergency Economic Stabilization Act of 2008, as amended, (“EESA”), was enacted which, among other things, authorized the United States Department of the Treasury, or the Treasury, to provide up to $700 billion of funding to stabilize and provide liquidity to the financial markets. On October 14, 2008, the Secretary of the Treasury announced the Troubled Asset Relief Program (“TARP”) Capital Purchase Program, a program in which $250 billion of the funds under EESA are made available for the purchase of preferred equity interests in qualifying financial institutions. On February 17, 2009, the American Recovery and Reinvestment Act of 2009 (“ARRA”), was enacted which amended, in certain respects, EESA and provided an additional $787 billion in economic stimulus funding. Also in 2009, legislation proposing significant structural reforms to the financial services industry was also introduced in the U.S. Congress and passed by the House of Representatives. Among other things, the legislation proposes the establishment of a consumer financial protection agency, which would have broad authority to regulate providers of credit, savings, payment and other consumer financial products and services. Other recent initiatives include:
| • | the Federal Reserve’s proposed guidance on incentive compensation policies at banking organizations; |
| • | proposals to limit a lender’s ability to foreclose on mortgages or make such foreclosures less economically viable, including by allowing Chapter 13 bankruptcy plans to “cram down” the value of certain mortgages on a consumer’s principal residence to its market value and/or reset interest rates and monthly payments to permit defaulting debtors to remain in their home; and |
| • | accelerating the effective date of various provisions of the Credit Card Accountability Responsibility and Disclosure Act of 2009, which restrict certain credit and charge card practices, require expanded disclosures to consumers and provide consumers with the right to opt out of interest rate increases (with limited exceptions). |
21
Table of Contents
The overall effects of these and other legislative and regulatory efforts on the financial markets remain uncertain and they may not have the intended stabilization results. These efforts may even have unintended harmful consequences on the U.S. financial system and our business. Should these or other legislative or regulatory initiatives have unintended effects, our business, financial condition, results of operations and prospects could be materially and adversely affected.
To the extent that we qualify and participate in these programs or other programs, there is no assurance that such programs will remain available for sufficient periods of time or on acceptable terms to benefit us, and the expiration of such programs could have unintended adverse effects on us.
In addition, we may need to modify our strategies and business operations in response to these changes. We may also incur increased capital requirements and constraints or additional costs in order to satisfy new regulatory requirements. Given the volatile nature of the current market and the uncertainties underlying efforts to mitigate or reverse disruptions, we may not timely anticipate or manage existing, new or additional risks, contingencies or developments in the current or future environment. Our failure to do so could materially and adversely affect our business, financial condition, results of operations and prospects.
Non-compliance with laws and regulations could result in fines, sanctions and other enforcement actions.
Federal and state regulators have broad enforcement powers. If we fail to comply with any laws, regulations, rules, standards, policies or interpretations applicable to us, we could face various sanctions and enforcement actions, which include:
| • | the appointment of a conservator or receiver for us; |
| • | the issuance of a cease and desist order that can be judicially enforced; |
| • | the termination of our deposit insurance; |
| • | the imposition of civil monetary fines and penalties; |
| • | the issuance of directives to increase capital; |
| • | the issuance of formal and informal agreements; |
| • | the issuance of removal and prohibition orders against officers, directors and other institution-affiliated parties; and |
| • | the enforcement of such actions through injunctions or restraining orders. |
The expiration of the FDIC’S TAG program in June may cause depositors to reduce the size of their deposits with us.
In October 2008, the FDIC announced its TAG Program as part of the TLG Program. The TAG Program guarantees full deposit insurance coverage of non-interest bearing transaction accounts until June 30, 2010, regardless of the dollar amount and in addition to the standard FDIC insurance. The current expiration of the TAG Program is anticipated to be the Bank’s most significant liquidity risk in the near term and mitigating the liquidity impact of such an event remains a priority. As of December 31, 2009, the Company had 293 deposit accounts with balances greater than $250,000 participating in the TAG Program providing unlimited insurance coverage for a total of $309 million in deposits. Approximately half of the deposits are public funds and half are primarily private business accounts. The FDIC is currently evaluating a possible extension of the TAG Program, however, if the TAG Program is not extended by the FDIC, we will be required to collateralize these outstanding public funds immediately upon expiration. We could also experience withdrawals by account holders of any amounts they have on deposit in excess of the amount then insured by the FDIC. Even if the FDIC decides to extend the TAG Program, it could do so on terms that makes the program unavailable to us or on terms that make the program less attractive for us to participate. Based on current liquidity sources, we anticipate that we will have adequate collateral and other sources of liquidity to meet those potential needs. However, it could require us to utilize the majority of our available liquidity and potentially utilize a portion of our borrowing capacity at the discount window. A significant decline in our deposits and/or an increase in collateral requirements could adversely affect our liquidity and financial position, and could adversely affect our business, results of operations, and prospects.
22
Table of Contents
Supervisory guidance on commercial real estate concentrations could restrict our activities and impose financial requirements or limitations on the conduct of our business.
The Office of the Comptroller of the Currency, the Board of Governors of the Federal Reserve System, and the Federal Deposit Insurance Corporation have joint supervisory guidance on sound risk management practices for concentrations in commercial real estate lending. The guidance is intended to help ensure that institutions pursuing a significant commercial real estate lending strategy remain healthy and profitable while continuing to serve the credit needs of their communities. The agencies are concerned that rising commercial real estate loan concentrations may expose institutions to unanticipated earnings and capital volatility in the event of adverse changes in commercial real estate markets. The guidance reinforces and enhances existing regulations and guidelines for safe and sound real estate lending. The guidance provides supervisory criteria, including numerical indicators to assist in identifying institutions with potentially significant commercial real estate loan concentrations that may warrant greater supervisory scrutiny. The guidance does not limit banks’ commercial real estate lending, but rather guides institutions in developing risk management practices and levels of capital that are commensurate with the level and nature of their commercial real estate concentrations. The lending and risk management practices will be taken into account in supervisory evaluation of capital adequacy. Our commercial real estate portfolio as of December 31, 2009 meets the definition of commercial real estate concentration as set forth in the final guidelines. If our risk management practices are found to be deficient, it could result in increased reserves and capital costs.
Banking regulations have restricted our ability to pay dividends and the ability of our bank subsidiary to pay dividends to us.
The Company and First Community Bank are both currently precluded from paying dividends pursuant to the Regulator Agreement. There is no assurance that the Company or First Community Bank will be able or permitted to resume paying dividends.
Although we hold all of the outstanding capital stock of First Community Bank, we are a legal entity separate and distinct from First Community Bank. Our ability to pay dividends on our common stock or service our obligations will depend primarily on the ability of First Community Bank to pay dividends to us. First Community Bank’s ability to pay dividends and make other capital distributions to us is governed by federal and state law. Federal and state regulatory limitations on a bank’s dividends generally are based on the bank’s capital levels and current and retained earnings. The earnings of First Community Bank may not be sufficient to make capital distributions to us in an amount sufficient for us to service our obligations or to pay dividends on our common stock. During the third quarter of 2008, we suspended the payment of interest on all of our existing trust preferred securities, pursuant to an informal agreement with regulators. We have since entered into the Regulator Agreement which prohibits us from making such payments.
First Community Bank is prohibited under federal law from paying any dividend that would cause it to become “undercapitalized.” It is the policy of the Federal Reserve Board that bank holding companies should pay cash dividends on common stock only out of income available from the past year and only if prospective earnings retention is consistent with the organization’s expected future needs and financial condition. Federal Reserve Board policy also provides that bank holding companies should not maintain such a level of cash dividends that would undermine the bank holding company’s ability to provide financial resources as needed to its insured banking subsidiaries. Additionally, the Federal Reserve Board has the right to object to a distribution on safety and soundness grounds. Depending upon the circumstances, the Federal Reserve Board could take the position that paying a dividend would constitute an unsafe or unsound banking practice.
23
Table of Contents
It may be difficult to trade our shares if we are unable to maintain our listing on the Nasdaq Stock Market or if our stock becomes subject to the penny stock rules of the Securities and Exchange Commission (“SEC”).
Our shares are currently listed with Nasdaq on its Global Select Market. This listing is dependent on us maintaining certain minimum listing standards, including, among others, minimum bid price and stockholders’ equity standards. On December 14, 2009 we received a notice from the Nasdaq Stock Market stating that our stock price (technically, the closing bid price) had failed to maintain the minimum $1.00 per share requirement for the 30 consecutive business days preceding the notice. The notice states that we have a grace period of 180 calendar days or until June 14, 2010, in which to regain compliance. If at any time during this grace period the bid price of our common stock closes at $1.00 per share or more for a minimum of ten consecutive business days, Nasdaq will provide us with written confirmation of compliance. In the event that we do not regain compliance prior to the expiration of the grace period, Nasdaq will provide written notification that our common stock is subject to delisting. We may apply for the transfer of our common stock to the Nasdaq Capital Market prior to the delisting date if we satisfy all of the requirements, other than the minimum bid price requirement, for initial listing on the Nasdaq Capital Market. If we elect to apply for such transfer, and the application is approved we would be eligible for an additional 180 calendar day grace period. The requirements for initial listing on the Nasdaq Capital Market include a minimum market value of publicly held shares of $15 million, which First State does not currently meet. Should our common stock be delisted, trading could then be conducted on the over-the-counter market on the OTC Bulletin Board, and we could become subject to the SEC’s penny stock rules. These rules impose additional sales practice requirements on broker-dealers. The additional sales practice requirements could materially adversely affect the willingness or ability of broker-dealers to sell our common stock. As a result, it may be difficult to sell shares or to obtain accurate quotations as to the price of our shares. In addition, it may be more difficult for us to obtain additional equity financing due to liquidity concerns of potential investors. While we are evaluating all of our options following receipt of the notification from the Nasdaq Stock Market, we believe that improved financial performance that results in an increased stock price, much closer to our tangible book value, is the best potential solution for regaining compliance with the minimum bid price requirement. There is no assurance that our financial performance will improve and other possible solutions may have adverse effects on us, such as adverse reaction from employees, investors and financial markets in general, adverse publicity, and adverse reactions from customers. We believe we are currently in compliance with all other listing standards applicable to us. There can be no assurance that we will be able to maintain compliance or that the Nasdaq Stock Market will not revise the standards in a way that would make it more difficult for us to comply.
Our deposit insurance premiums could be substantially higher in the future, which could have a material adverse effect on our future earnings.
The FDIC insures deposits at FDIC insured depository institutions, including the Bank. Under current FDIC regulations, each insured depository institution is assigned to one of nine risk categories based on capital and supervisory measures and, depending on its assigned category, is assessed insurance premiums based on the amount of deposits held. The FDIC charges insured financial institutions premiums to maintain the Deposit Insurance Fund (“DIF”), at a certain level. Recent bank failures and expectations for further failures in the near-term have reduced insurance reserve funds to their lowest level since 1993. On October 16, 2008, the FDIC published a restoration plan designed to replenish the DIF over a period of five years and to increase the deposit insurance reserve ratio to 1.15% of insured deposits by December 31, 2013. In order to implement the restoration plan, the FDIC proposed to change both its risk-based assessment system and its base assessment rates. On February 27, 2009, the FDIC amended the restoration plan to extend the restoration plan horizon to seven years. The amended restoration plan was accompanied by a final rule setting assessment rates and making adjustments to improve how the assessment system differentiates for risk. Under the final rule, the base assessment rates increased substantially beginning April 1, 2009. Changes to the risk-based assessment system included increasing premiums for institutions that rely on excessive amounts of brokered deposits, including CDARS, increasing premiums for excessive use of secured liabilities, including FHLB advances, lowering premiums for smaller institutions with high capital levels and reducing assessment rates for institutions holding long-term unsecured debt.
24
Table of Contents
On May 22, 2009, the FDIC adopted another final rule imposing a 5 basis point special assessment on each insured depository institution’s assets minus Tier 1 capital, as of June 30, 2009. This special assessment, which totaled $1.4 million for the Bank, was collected on September 30, 2009. On November 17, 2009, the FDIC also published a final rule requiring insured depository institutions to prepay their estimated quarterly risk-based assessments for the fourth quarter of 2009 and for all of 2010, 2011 and 2012. On November 12, 2009, the FDIC provided an exemption to the Bank from the prepayment provisions.
A change in the risk categories assigned to our Bank, further adjustments to base assessment rates and additional special assessments could have a material adverse effect on our earnings and financial condition.
Current market developments may adversely affect our industry, business, results of operations and access to capital.
Dramatic declines in the housing market, with falling home prices and increasing foreclosures and unemployment, have resulted in higher levels of non-performing assets and significant write-downs of asset values by financial institutions, including government-sponsored entities as well as major commercial and investment banks. These increased levels of non-performing assets and write-downs, initially of mortgage-backed securities but spreading to credit default swaps and other derivative securities, in turn have caused many financial institutions to seek additional capital, to merge with larger and stronger institutions and, in some cases, to fail. Reflecting concern about the stability of the financial markets generally and the strength of counterparties, many lenders and institutional investors have ceased to provide funding to even the most credit-worthy borrowers or to other financial institutions. The resulting lack of available credit and lack of confidence in the financial markets could continue to materially and adversely affect our financial condition and results of operations and our access to capital. In particular, we may face the following risks in connection with these events:
| • | The processes we use to estimate inherent losses may no longer be reliable because they rely on complex judgments, including forecasts of economic conditions, which may no longer be capable of accurate estimation. |
| • | Our ability to assess the creditworthiness of our customers may be impaired if the models and approaches we use to select, manage, and underwrite our customers become less predictive of future charge-offs. |
| • | Our ability to borrow or otherwise raise capital from other financial institutions on favorable terms or at all could be adversely affected by further disruptions in the capital markets or other events, including actions by rating agencies and deteriorating investor expectations. |
| • | We expect to face increased regulation of our industry. Compliance with such regulation may increase our costs, limit our ability to pursue business opportunities, and increase compliance challenges. |
We may incur significant credit losses, particularly in light of current market conditions.
We take on credit risk by virtue of making loans and extending loan commitments and letters of credit. Our credit standards, procedures and policies may not prevent us from incurring substantial credit losses, particularly in light of recent market developments. During 2008 and 2009, we experienced deterioration in credit quality, particularly in certain real estate development loans, due, in part, to the impact resulting from the downturn in the prevailing economic, real estate and credit markets. This deterioration resulted in higher levels of non-performing assets, including other real estate owned and internally risk classified loans, thereby increasing our provision for loan losses and decreasing our operating income in 2008 and 2009. As of December 31, 2009, we had total non-performing assets of approximately $323.0 million,
25
Table of Contents
compared with approximately $137.2 million as of December 31, 2008 and approximately $48.8 million as of December 31, 2007. Given the current economic conditions and trends, management believes we may continue to experience credit deterioration and higher levels of non-performing loans in the near-term, which will likely have an adverse impact on our financial condition, results of operations and prospects.
Defaults in the repayment of loans may negatively affect our business.
A borrower’s default on its obligations under one or more of our loans may result in lost principal and interest income and increased operating expenses as a result of the allocation of management time and resources to the collection and work-out of the loan. In certain situations, where collection efforts are unsuccessful or acceptable work-out arrangements cannot be reached, we may have to write-off the loan in whole or in part. In these situations, we may acquire real estate or other assets, if any, which secure the loan through foreclosure or other similar available remedies. In these cases, the amount owed under the defaulted loan often exceeds the value of the assets acquired.
We regularly make a determination of an allowance for loan losses based on available information, including the quality of and trends in our loan portfolio, economic conditions, the value of the underlying collateral, historical charge-offs, and the level of our non-accruing loans. Provisions for this allowance result in an expense for the period. Given the current economic conditions and trends, management believes we may continue to experience credit deterioration and higher levels of non-performing loans in the near-term, which may cause us to continue to have negative earnings or otherwise adversely impact our financial condition and results of operations.
To qualify as collateral under the FHLB credit policy, loans must not be past due 90 days or more or classified substandard or below. Continuing deterioration of the loan performance could result in the Company being unable to satisfy the collateral requirements of the FHLB and the financial condition of the Company may be adversely affected.
As of December 31, 2009, our allowance for loan losses was $129.2 million or 6.45% of total loans held for investment. Our allowance for loan losses may not be sufficient to cover future loan losses. Future adjustments to the allowance for loan losses may be necessary if economic conditions differ substantially from the assumptions used or further adverse developments arise with respect to our non-performing or performing loans. Material additions to our allowance for loan losses could have a material adverse effect on our financial condition and results of operations.
In addition, bank regulatory agencies periodically review our allowance for loan losses and the values we attribute to real estate acquired through foreclosure or other similar remedies. These regulatory agencies may require us to adjust our determination of the value for these items. If we are required to adjust our allowance for loan losses, our results of operations and financial condition may be adversely affected.
Our profitability depends significantly on local and overall economic conditions.
Our success is dependent to a significant extent upon local economic conditions in the communities we serve and the general economic conditions in the United States. The economic conditions, including real estate values, in these areas and throughout the United States, have a significant impact on loan demand, the ability of borrowers to repay these loans, and the value of the collateral securing these loans. The current decline in general economic conditions, including the decline in real estate values, has resulted in an increase in our non-performing assets and an increase in our charge-offs on defaulted loans during 2009. A further decline in economic conditions, including depressed real estate values, over a prolonged period of time in any of these areas could cause additional significant increases in non-performing assets and could continue to affect our ability to recover on defaulted loans by foreclosing and selling the real estate collateral, which could continue to cause decreased operating results, liquidity, and capital. As of December 31, 2009, approximately 86% of the book value of our loan portfolio consisted of loans collateralized by various types of real estate.
26
Table of Contents
Our loan portfolio is currently concentrated in New Mexico, Colorado, Utah, and Arizona. Adverse economic conditions in these states could have a greater effect on our ability to attract deposits and result in high rates of loss and delinquency on our loan portfolio compared to competitors who may have more geographic diversification.
Our concentration of real estate loans subjects us to increased risks in the event real estate values continue to decline due to the economic recession, a further deterioration in the real estate markets or other causes.
At December 31, 2009, we had approximately $1.7 billion of loans collateralized by various types of real estate, representing approximately 86% of our total loan portfolio. The current economic recession, deterioration in the real estate markets and increasing delinquencies and foreclosures have had an adverse effect on the collateral value for many of our loans and on the repayment ability of many of our borrowers. The continuation or further deterioration of these factors, including increasing foreclosures and unemployment, will continue to have the same or similar adverse effects. In addition, these factors could reduce the amount of loans we make to businesses in the construction and real estate industry, which could negatively impact our interest income and results of operations. A continued decline in real estate values could also lead to higher charge-offs in the event of defaults in our real estate loan portfolio. Similarly, the occurrence of a natural or manmade disaster in our market areas could impair the value of the collateral we hold for real estate secured loans. Any one or a combination of the factors identified above could negatively impact our business, financial condition, results of operations and prospects.
Our loans are currently concentrated in New Mexico, Colorado, Utah, and Arizona and adverse conditions in those markets could adversely affect operations.
Because our loans and deposits are in only a few concentrated geographic areas, our business may be more affected by local economic conditions and could be more vulnerable than banks whose lending and deposit activities are in larger, more geographically diversified markets. A prolonged or more extreme downturn in the local economies in New Mexico, Colorado, Utah, or Arizona could have further adverse effects on business activity, employment, and collateral values, with a corresponding adverse effect on loan growth, income, and on borrowers’ abilities to repay loans. The current economic recession and deterioration in the real estate markets have had an adverse effect on the collateral value for many of our loans and on the repayment ability of many of our borrowers. The continuation or further deterioration of these factors, including increasing foreclosures and unemployment, will continue to have the same or similar adverse effects. In addition, these factors could reduce the amount of loans we make to businesses in the construction and real estate industry, which could negatively impact our interest income and results of operations. A continued significant decline in real estate values could also lead to higher charge-offs in the event of defaults in our real estate loan portfolio. Similarly, the occurrence of a natural or manmade disaster in our market areas could impair the value of the collateral we hold for real estate secured loans. Any one or a combination of the factors identified above could negatively impact our business, financial condition, results of operations and prospects.
Our real estate construction loan portfolio may expose us to increased credit risk.
At December 31, 2009, our portfolio of real estate construction loans totaled $645.3 million or 32.0% of total loans. Approximately 38% of these loans are related to residential construction and approximately 62% are for commercial purposes or vacant land. During 2007, 2008, and 2009, the housing markets declined, evidenced by excess lot inventory and higher levels of completed unsold housing inventory. The decline in the housing market, sub-prime loan crisis, and tightening of credit markets has led to higher than normal foreclosure rates on a national level. Of the states that we operate in, Arizona, where we have the lowest dollar amount of real estate construction loans, has had the largest downturn in the residential real estate market. Although New Mexico, Colorado, and Utah have not experienced as significant a downturn in the residential real estate market, foreclosure rates as well as excess inventory levels have negatively affected the construction industry as well as the acquisition and development sectors exposing us to increased credit risk within our construction loan portfolio.
27
Table of Contents
The value of our investments is influenced by varying economic and market conditions and a decrease in value could have an adverse effect on our results of operations, liquidity, and financial condition.
We classify investment securities in one of three categories and account for them as follows: (1) debt securities that we have the positive intent and ability to hold to maturity are classified as held to maturity and carried at amortized cost; (2) debt and equity securities that are bought and held primarily for the purpose of selling them in the near term are classified as trading securities and carried at fair value, with unrealized gains and losses included in earnings; and (3) debt and equity securities not classified as either held to maturity securities or trading securities are classified as available for sale securities. These are securities that we will hold for an indefinite period of time and may be used as a part of our asset/liability management strategy and may be sold in response to changes in interest rates, prepayments, or similar factors. Available for sale securities are carried at estimated market value, with unrealized gains and losses excluded from earnings and reported as a separate component of stockholders’ equity, net of related deferred income taxes. Upon purchase of investment securities, management designates securities as either held to maturity or available for sale. Amortization of premiums and accretion of discounts are calculated using a method that approximates the effective interest method. Declines below cost in the fair value of investment securities that are other-than-temporary are recorded as write-downs of the individual securities to their estimated fair value and are included in earnings as realized losses or other comprehensive income to the extent the impairment is not due to credit. We do not maintain a trading portfolio.
In accordance with applicable accounting standards, we review our investment securities to determine if declines in fair value below cost are other-than-temporary. This review is subjective and requires a high degree of judgment. We conduct this review on a quarterly basis, using both quantitative and qualitative factors, to determine whether a decline in value is other-than-temporary. Such factors considered include the length of time and the extent to which market value has been less than cost, financial condition and near term prospects of the issuer, recommendations of investment advisors, and forecasts of economic, market, or industry trends. This review process also entails an evaluation of our ability and intent to hold individual securities until they mature or full cost can be recovered.
The current economic environment and recent volatility of the securities markets increase the difficulty of assessing investment impairment and the same influences tend to increase the risk of potential impairment of these assets. During the twelve months ended December 31, 2009, we have not recorded any charges for other-than-temporary impairment of securities. Over time, the economic and market environment may further deteriorate or provide additional insight regarding the fair value of certain securities, which could change our judgment regarding impairment. This could result in realized losses relating to other-than-temporary declines recorded as an expense. Given the current market conditions and the significant judgments involved, there is continuing risk that further declines in fair value may occur and material other-than-temporary impairments may result in realized losses in future periods which could have an adverse effect on our results of operations, liquidity, and financial condition.
Our small to medium-sized business customers may have less financial resources with which to weather a downturn in the economy.
One of the primary focal points of our business development and marketing strategy is serving the banking and financial services needs of small to medium-sized businesses. Small to medium-sized businesses generally have fewer financial resources in terms of capital or borrowing capacity than larger entities. Commercial loans, including commercial real estate loans, are often larger and involve greater risks than other types of lending. Because payments on such loans are often dependent on the successful operation of the property or business involved, repayment of such loans is more sensitive than other types of loans to adverse conditions in the real estate market or the general economy. Accordingly, the recent downturn in the real estate market and the economy has heightened our risk related to commercial loans, particularly commercial real estate loans. At December 31, 2009, we had approximately $1.1 billion of commercial loans, including $883.6 million of commercial real estate loans, representing approximately 56.6% and 43.8% of our total loan portfolio, respectively. If general economic conditions worsen in New
28
Table of Contents
Mexico, Colorado, Utah, or Arizona, the businesses of our customers and their ability to repay outstanding loans may be further negatively affected. As a consequence, our results of operations and financial condition may be adversely affected.
Fluctuations in interest rates could reduce our profitability.
Our net interest income may be reduced by changes in the interest rate environment. Our earnings depend to a significant extent on the interest rate differential. The interest rate differential or “spread” is the difference between the interest earned on loans, securities, and other interest-earning assets, and interest paid on deposits, borrowings, and other interest-bearing liabilities. These rates are highly sensitive to many factors that are beyond our control, including general economic conditions and the policies of various governmental and regulatory authorities. In particular, changes in the discount rate and the Federal Funds target rate by the Board of Governors of the Federal Reserve System (“Federal Reserve”) usually lead to changes in interest rates, which affect our interest income, interest expense, and securities portfolio. Net interest spreads are affected by the difference between the maturities and repricing characteristics of interest-earning assets and interest-bearing liabilities. Loan volume and yields are affected by market interest rates on loans, and rising interest rates generally are associated with a lower volume of loan originations. We cannot assure you that we can minimize our interest rate risk. In addition, an increase in the general level of interest rates may adversely affect the ability of certain borrowers to pay the interest on and principal of their obligations. Accordingly, changes in levels of market interest rates could materially and adversely affect our net interest spread, asset quality, loan origination volume, which may cause us to continue to have negative earnings or otherwise adversely impact our results of operations and financial condition.
In addition, our net income is affected by our interest rate sensitivity. Interest rate sensitivity is the difference between our interest-earning assets and our interest-bearing liabilities maturing or repricing within a given time period. Interest rate sensitivity is considered positive when the amount of interest rate sensitive assets exceeds the amount of interest rate sensitive liabilities. Since the middle of 2007, and as of December 31, 2009, the Federal Reserve has lowered the discount rate 500 basis points which has negatively impacted our interest spread. As of December 31, 2009, our cumulative interest rate gap for the period up to three months was a positive $255.3 million. If additional rate decreases occur, our results of operations and financial condition may be further adversely affected.
We may not be able to meet the cash flow requirements of our depositors and borrowers unless we have sufficient liquidity.
Liquidity is the ability to meet current and future cash flow needs on a timely basis at a reasonable cost. Our liquidity is used to make loans and to repay deposit liabilities as they become due or are demanded by customers. We regularly monitor our overall liquidity position to ensure that various alternative strategies exist to cover unanticipated events that could affect liquidity. Without sufficient liquidity from these potential sources, we may not be able to meet the cash flow requirements of our depositors and borrowers. Also, see Item 2: “Management’s Discussion and Analysis of Financial Condition and Results of Operations-Liquidity.”
The recent disruption and illiquidity in the credit markets are continuing challenges that have generally made potential funding sources more difficult to access, less reliable, and more expensive. In addition, liquidity in the inter-bank market, as well as the markets for commercial paper, certificates of deposits, and other short-term instruments have significantly contracted. Reflecting concern about the stability of the financial markets generally and the strength of counterparties, many lenders and institutional investors have reduced, and in some cases, ceased to provide funding to borrowers, including other financial institutions. These market conditions have made the management of our own and our customers’ liquidity significantly more challenging. At December 31, 2008, all outstanding borrowings with the FHLB were collateralized by a blanket pledge agreement on the Company’s loan portfolio. During 2009, the blanket lien was replaced by a custody arrangement, whereby the FHLB has custody and endorsement of the loans that collateralize the FHLB borrowings. Effective July 29, 2009, the FHLB increased the collateral requirements related to our outstanding borrowing position by reducing the available collateral percentage
29
Table of Contents
applied to the unpaid principal balance of our pledged loans. As of December 31, 2009, the FHLB provided an aggregate collateral value of approximately 29% of the total outstanding unpaid principal balance of loans pledged to the FHLB. The FHLB takes into consideration a number of factors in calculating the available collateral value including: credit quality, past due status, loan type and loan documentation exceptions, among other factors. In addition to investment securities with a carrying value of $198 million, loan collateral with par value of approximately $1.3 billion has been delivered to satisfy the requirements of the custody arrangement. For loans to qualify as collateral, they must not be past due 90 days or more, must not be classified substandard or below, and must not be a loan to a director, employee, or agent of the Company or the FHLB. Because collateral values are determined subjectively by the FHLB, there is no assurance that the FHLB will not require additional collateral or repayment of existing borrowings. Based on our current status with the FHLB, the Company no longer has the ability to draw down additional advances. Under the terms of the Bank’s agreement with the FHLB, the FHLB may at its own option call the outstanding debt due and payable if any of the following have occurred: the Bank has suspended payment to any creditor or there has been an acceleration of the maturity of any indebtedness of the Bank to others; the FHLB reasonably and in good faith determines that a material adverse change has occurred in the financial condition of the Bank; or the FHLB reasonably and in good faith deems itself insecure in the collateral even though the Bank is not otherwise in default.
Based on the Bank’s agreement with the FHLB and the FHLB’s credit policy, as the existing borrowings mature, they will be allowed to continuously renew for like amounts, but for terms not to exceed thirty days. The Bank has not received any notice from the FHLB regarding a call of its outstanding debt.
A further deterioration in the credit markets or a prolonged period without improvement of market liquidity could adversely affect our liquidity and financial position, including our regulatory capital ratios, and could adversely affect our business, results of operations, and prospects.
The soundness of other financial institutions could adversely affect us.
Our ability to engage in routine funding transactions could be adversely affected by the actions and commercial soundness of other financial services institutions. Financial services institutions are interrelated as a result of trading, clearing, counterparty, or other relationships. We have exposure to many different industries and counterparties, and we routinely execute transactions with counterparties in the financial services industry, including brokers and dealers, commercial banks, investment banks, mutual and hedge funds, and other institutional clients, resulting in a significant credit concentration with respect to the financial services industry overall. As a result, defaults by, or even rumors or questions about one or more financial services institutions, or the financial services industry generally, have led to market-wide liquidity problems and could lead to losses or defaults by us or by other institutions. Our results of operations and financial condition could be adversely affected if we become the subject of rumors or questions regarding our financial soundness.
The terms of our trust preferred securities may restrict our ability to pay dividends.
The terms of our trust preferred securities allow us to suspend payments of interest, at our option, for up to five years. Since we have exercised our option to suspend those payments, we are prohibited from paying any dividends on any class of capital stock for as long as the trust preferred interest payments remain suspended. Pursuant to the Regulator Agreement, we are prohibited from paying interest on all of our existing trust preferred securities. Our ability to make interest payments on the trust preferred securities is highly dependent on receiving dividends from First Community Bank. There is no assurance that we will be able to resume making the interest payments.
Competition with other financial institutions could adversely affect our profitability.
The banking business is highly competitive, and our profitability depends upon our ability to compete in our market areas. We compete with other commercial and savings banks and savings and loan associations. We also compete with credit unions, finance companies, mutual funds, insurance companies, brokerage and investment banking firms, asset-based non-bank lenders, and governmental
30
Table of Contents
organizations that may offer subsidized financing at lower rates than those we offer. Many of our competitors have significantly greater financial and other resources than we do. Although we have been able to compete effectively in the past, we may not be able to compete effectively in the future. Our large competitors may also in the future attempt to respond directly to our marketing strategy by emphasizing similar services.
We may not be able to manage risks inherent in our business, particularly given the recent turbulent and dynamic market conditions.
A comprehensive and well-integrated risk management function is essential for our business. We have adopted various policies, procedures, and systems to monitor and manage risk, including risk associated with our non-performing assets. These policies, procedures, and systems may be inadequate to identify and mitigate all risks inherent in our business. In addition, our business and the markets and industry in which we operate are continuously evolving. We may fail to understand fully the implications of changes in our business or the financial markets and fail to adequately or timely enhance our risk framework to address those changes, particularly given the recent turbulent and dynamic market conditions. If our risk framework is ineffective, either because it fails to keep pace with changes in the financial markets or in our business or for other reasons, we could incur losses and otherwise experience harm to our business.
Environmental liability associated with commercial lending could result in losses.
In the course of our business, we may acquire through foreclosure properties securing loans that are in default. Particularly in commercial real estate lending, there is a risk that hazardous substances could be discovered on these properties. In this event, under some circumstances we might be required to remove these substances from the affected properties at our sole cost and expense. The cost of this removal could substantially exceed the value of the affected properties. In addition, future laws or more stringent interpretations or enforcement policies with respect to existing laws may increase our exposure to environmental liability. We may not have adequate remedies against the prior owner or other responsible parties, and could find it difficult or impossible to sell the affected properties. If we experience these difficulties, our results of operations and financial condition may be adversely affected.
We are dependent on key personnel.
Our success has been and continues to be largely dependent on the services of H. Patrick Dee, our President and Chief Executive Officer, and Christopher C. Spencer, our Senior Vice President and Chief Financial Officer, and other members of management who have significant relationships with our customers. The prolonged unavailability or the unexpected loss of any of these officers could have an adverse effect on our growth and profitability.
We may not be able to attract and retain qualified employees to operate our business effectively.
There is substantial competition for qualified personnel in our markets. Although unemployment rates have been rising in New Mexico and Arizona and the surrounding region, it may still be difficult to attract and retain qualified employees at all management and staffing levels. Failure to attract and retain employees and maintain adequate staffing of qualified personnel could adversely impact our operations and our ability to execute our business strategy. Furthermore, unemployment rates in New Mexico and Arizona are lower than national unemployment rates, which may lead to significant increases in salaries, wages and employee benefits expenses as we compete for qualified, skilled employees.
Our Restated Articles of Incorporation and New Mexico law may delay or prevent an acquisition of us by a third party.
Our Restated Articles of Incorporation and New Mexico law contain provisions that make it more difficult for a third party to acquire us without the consent of our Board of Directors. These provisions also could discourage proxy contests and may make it more difficult for you and other shareholders to elect your own representatives as directors and take other corporate actions.
31
Table of Contents
Our Restated Articles of Incorporation also prohibit business combinations with a person who acquires 10% or more of any class of our equity securities, including our common stock, unless the acquiror receives prior approval for the business combination from at least 66.6% of the votes entitled to vote at a meeting of our shareholders held to vote on the proposed business combination. This provision in our Restated Articles of Incorporation is in addition to the limitations that New Mexico law provides that may discourage potential acquirors from purchasing shares of our common stock. Under New Mexico law, our directors may consider the interest of persons other than our shareholders when faced with unsolicited offers for control of us. For example, our directors may consider the interest of our employees, suppliers, creditors, the communities we serve, and the State of New Mexico generally in evaluating any change of control offer.
These and other provisions of New Mexico law and our governing documents may have the effect of delaying, deferring, or preventing a transaction or a change in control that might be in the best interest of our shareholders.
An extended disruption of our vital infrastructure could negatively impact our operations, results, and financial condition.
Our operations depend upon, among other things, vital infrastructure, including equipment, information and telecommunications technologies, power grids, and facilities. An extended disruption of vital infrastructure by fire, power loss, computer hacking or viruses, terrorist activity, natural disaster, telecommunications failure, or other events beyond our control could impact the financial services industry as a whole and our business. Our business recovery plan may not work as intended or may not prevent significant interruptions of our operations.
Rapid technological changes may adversely affect the value of our current or future technologies to us and our customers, which could cause us to increase expenditures to upgrade and protect our technology or develop and protect competing technologies for delivering our services.
Technology in our industry is evolving rapidly. Our ability to compete and our future results depend in part on our ability to make timely and cost-effective enhancements and additions to our technology, to introduce new products and services that meet customer demands, and to keep pace with rapid advancements in technology. Maintaining flexibility to respond to technological and market dynamics may require substantial expenditures and lead-time. We cannot assure you that we will successfully identify and develop new products or services in a timely manner, that offerings, technologies, or services developed by others will not render our offerings obsolete or noncompetitive, or that the technologies in which we focus our investments will achieve acceptance in the marketplace and provide a return on our investment.
Material breaches of our systems may have a significant effect on our business.
We collect, process, and store sensitive consumer data by utilizing computer systems and telecommunications networks operated by both us and third party service providers. We have security, backup and recovery systems in place, as well as a business continuity plan to ensure the system will not be inoperable. We also have security to prevent unauthorized access to the system. In addition, we require our third party service providers to maintain similar controls. However, we cannot be certain that the measures will be successful. A breach in the security of these systems could result in failures or disruptions in our customer relationship management, general ledger, deposit, loan, investment, credit card and other information systems. A breach of the security of our information systems could damage our reputation, result in a loss of customer business, subject us to additional regulatory scrutiny and expose us to civil litigation and possible financial liability.
| Item 1B: | Unresolved Staff Comments. |
None.
32
Table of Contents
| Item 2: | Properties. |
Our principal offices are located at 7900 Jefferson NE, Albuquerque, New Mexico 87109. At December 31, 2009, we operated forty branch offices, including thirty-six in New Mexico (three offices each in Taos and Las Cruces, twelve offices in Albuquerque, four offices in Santa Fe, two offices each in Rio Rancho, Belen, and Clovis, and one office each in Los Lunas, Gallup, Portales, Grants, Bernalillo, Pojoaque, Placitas, and Moriarty), and four in Arizona (three offices in Phoenix and one in Sun City). In addition to these branch offices, we have three administrative facilities in Albuquerque. We own the following locations: the Main and Southside facilities in Taos; the Journal Center facility, the Isleta facility, and the Fourth Street facility in Albuquerque; the Pile and Prince locations in Clovis; the Gallup location; the Portales location; the Moriarty location; the Grants location; the Belen Reinken location; the Bernalillo location; the Sun City location; the Amador and Roadrunner locations in Las Cruces; we lease the remaining banking facilities. We monitor the quality and appearance of our banking facilities and complete renovations as considered appropriate in order to effectively serve our customers.
In addition to the above properties, we have three parcels of vacant land, one each in Santa Fe and Taos, New Mexico, and one in Broomfield, Colorado. We also have one vacant branch facility in Belen, New Mexico. All of these properties are included in other real estate owned and are listed for sale.
| Item 3: | Legal Proceedings. |
From time to time we are involved in legal proceedings. In the ordinary course of our business, claims and lawsuits are filed against us or raised by counterclaims. These legal actions arise out of claims to enforce liens, in condemnation or quiet title proceedings on properties in which we hold security interests, and by claims involving the making and servicing of real property loans, and other issues incident to our business. In the opinion of management, the ultimate liability, if any, resulting from known claims or lawsuits will not have a material adverse effect on our consolidated financial position or results of operations.
| Item 4: | Submission of Matters to a Vote of Security Holders. |
No matters were submitted to a vote of our security holders during the fourth quarter of 2009.
PART II
| Item 5: | Market for Registrant’s Common Equity, Related Stockholder Matters and Issuer Purchases of Equity Securities. |
Performance Graph
The graph below compares the cumulative shareholder return on the Company’s Common Stock since December 31, 2004, with the cumulative total return on the Nasdaq Total US Index and the SNL $1B-$5B Bank Index. The table below compares the cumulative total return of the Common Stock as of December 31, 2004, 2005, 2006, 2007, 2008, and 2009 assuming a $100 investment on December 31, 2004, and assuming reinvestment of all dividends. This data was furnished by SNL Securities LLC.
33
Table of Contents
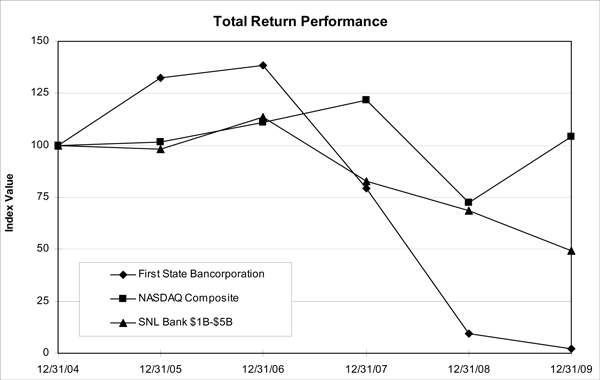
| Period Ending | ||||||||||||
| Index |
12/31/04 | 12/31/05 | 12/31/06 | 12/31/07 | 12/31/08 | 12/31/09 | ||||||
| First State Bancorporation |
100.00 | 132.33 | 138.24 | 79.17 | 9.55 | 2.32 | ||||||
| NASDAQ Composite |
100.00 | 101.37 | 111.03 | 121.92 | 72.49 | 104.31 | ||||||
| SNL Bank $1B-$5B |
100.00 | 98.29 | 113.74 | 82.85 | 68.72 | 49.26 | ||||||
The preceding information under the caption “Performance Graph” shall be deemed to be “furnished” but not “filed” with the Securities and Exchange Commission.
Price Range of Common Stock
Our Common Stock is traded on The Nasdaq Stock Market as a member of their Global Select Market under the symbol “FSNM.” Our Common Stock commenced trading on November 3, 1993. The following table presents the per share diluted net earnings, dividends paid, and book value for each quarter within the two most recent fiscal years. In addition, the table presents the range of high and low sales prices of our common stock, and the quarter end closing sales price for each quarter within the two most recent fiscal years as reported by the Nasdaq Global Select Market.
34
Table of Contents
| Per Share | |||||||||||||||||||
| Quarter Ended |
Diluted Net Earnings |
Dividends Paid |
Book Value |
Low Price (1) |
High Price (1) |
Quarter End Price | |||||||||||||
| December 31, 2009 |
$ | (1.37 | ) | $ | 0.00 | $ | 2.27 | $ | 0.36 | $ | 1.38 | $ | 0.40 | ||||||
| September 30, 2009 |
(2.49 | ) | 0.00 | 3.76 | 1.00 | 1.96 | 1.19 | ||||||||||||
| June 30, 2009 |
(0.30 | ) | 0.00 | 6.27 | 1.29 | 2.79 | 1.93 | ||||||||||||
| March 31, 2009 |
(1.19 | ) | 0.00 | 6.59 | 0.60 | 1.81 | 1.39 | ||||||||||||
| December 31, 2008 |
(1.85 | ) | 0.00 | 7.84 | 1.17 | 5.30 | 1.65 | ||||||||||||
| September 30, 2008 |
(0.09 | ) | 0.00 | 9.37 | 3.65 | 11.86 | 5.34 | ||||||||||||
| June 30, 2008 |
(5.87 | ) | 0.09 | 9.52 | 5.50 | 14.93 | 5.50 | ||||||||||||
| March 31, 2008 |
0.19 | 0.09 | 15.72 | 9.15 | 14.00 | 13.39 | |||||||||||||
| (1) | The prices shown represent the high and low sales prices for the quarter. |
The last reported sale price of our Common Stock on March 26, 2010, was $0.52 per share. As of March 25, 2010, there were approximately 267 shareholders of record, not including shareholders who beneficially own Common Stock held in nominee or street name.
Dividend Policy
We paid cash dividends of $3.6 million or $0.18 per share in 2008. There were no dividends paid in 2009. The declaration and payment of cash dividends are determined by the Board of Directors in light of the earnings, capital requirements, our financial condition, and other relevant factors. Our ability to pay cash dividends depends on the amount of cash dividends paid to us by First Community Bank and our capital position. Capital distributions, including dividends, by First Community Bank, are subject to federal and state regulatory restrictions tied to its earnings and capital. In order to help improve the Company’s and the Bank’s capital ratios, we suspended our cash dividend payments to shareholders in July 2008, and the Bank has not declared a cash dividend to the Company since May 2008. The Company and First Community Bank are both currently precluded from paying dividends pursuant to the Regulator Agreement. See “Recent Company Developments” above. There is no assurance that First Community Bank will be able or permitted to resume paying dividends. Further Information regarding dividend restrictions is incorporated herein by reference to Item 1. “Business–Supervision and Regulation/Payment of Dividends.”
| Item 6: | Selected Financial Data. |
Selected Financial Data are filed as part of this report and appear in “Financial Summary” in the attached Appendix A.
| Item 7: | Management’s Discussion and Analysis of Financial Condition and Results of Operations. |
Management’s Discussion and Analysis of Financial Condition and Results of Operations are filed as part of this report and appear in the attached Appendix A.
| Item 7A: | Quantitative and Qualitative Disclosures About Market Risk. |
Quantitative and Qualitative Disclosures About Market Risk are filed as part of this report and appear within Management’s Discussion and Analysis of Financial Condition and Results of Operations under the captions Net Interest Income and Asset/Liability Management in the attached Appendix A.
35
Table of Contents
| Item 8: | Financial Statements and Supplementary Data. |
Our consolidated financial statements are filed as a part of this report and appear in Appendix A immediately following the Management’s Discussion and Analysis of Financial Condition and Results of Operations.
| Item 9: | Changes in and Disagreements With Accountants on Accounting and Financial Disclosure. |
None.
| Item 9A: | Controls and Procedures. |
Management’s Evaluation of Disclosure Controls and Procedures. We maintain controls and procedures designed to ensure that we are able to collect the information required to be disclosed in the reports we file with the SEC, and to process, summarize, and disclose this information within the time periods specified in the rules of the SEC.
An evaluation was performed under the supervision and with the participation of management, including the Chief Executive Officer and Chief Financial Officer, of the effectiveness of the design and operation of our disclosure controls and procedures as of December 31, 2009, pursuant to Exchange Act Rules 13(a)-15(e) and 15(d)-15(e). Based upon that evaluation, the Chief Executive Officer and Chief Financial Officer concluded that our disclosure controls and procedures were effective as of December 31, 2009, in all material respects, to ensure that information required to be disclosed in the reports we file and submit under the Exchange Act is recorded, processed, summarized, and reported as and when required. There were no changes in our internal control over financial reporting during the quarter ended December 31, 2009, that has materially affected, or is reasonably likely to materially affect, our internal control over financial reporting.
Management’s Report on Internal Control over Financial Reporting. Management is responsible for establishing and maintaining effective internal control over financial reporting as defined in Rules 13(a)-15(f) under the Securities Exchange Act of 1934. Our internal control over financial reporting is a process designed under the supervision of our Chief Executive Officer and Chief Financial Officer to provide reasonable assurance to our management and board of directors regarding the reliability of financial reporting and the preparation of financial statements for public disclosure in accordance with U.S. Generally Accepted Accounting Principles.
Because of its inherent limitations, internal control over financial reporting may not prevent or detect misstatements. Therefore, even those systems determined to be effective can provide only reasonable assurance with respect to financial statement preparation and presentation.
Management assessed the effectiveness of our internal control over financial reporting as of December 31, 2009. In making this assessment, management used the criteria set forth by the Committee of Sponsoring Organizations of the Treadway Commission (COSO) in Internal Control – Integrated Framework. Based on our assessment, we believe that, as of December 31, 2009, our internal control over financial reporting was effective.
This annual report does not include an attestation report of the Company’s registered public accounting firm regarding internal control over financial reporting. Management’s report was not subject to attestation by the Company’s registered public accounting firm pursuant to temporary rules of the Securities and Exchange Commission that permit the Company to provide only management’s report in this annual report.
| Item 9B: | Other Information. |
None.
36
Table of Contents
PART III
| Item 10: | Directors, Executive Officers, and Corporate Governance. |
Information regarding directors appearing under the caption “Election of Directors” in our Proxy Statement for the 2010 Annual Meeting of Shareholders is hereby incorporated by reference. Information relating to disclosure of delinquent Form 3, 4, and 5 filers is incorporated by reference to the information appearing under the caption “Section 16(a) Beneficial Ownership Reporting Compliance” in our Proxy Statement for the 2010 Annual Meeting of Shareholders.
Information regarding our audit committee financial experts appearing under the caption “Information with Respect to Standing Committees of the Board of Directors and Meetings” in our Proxy Statement for the 2010 Annual Meeting of Shareholders is hereby incorporated by reference.
Information regarding our Code of Ethics appearing under the caption “Corporate Governance” in our Proxy Statement for the 2010 Annual Meeting of Shareholders is hereby incorporated by reference. The Code of Ethics has been filed with the Commission and is posted on our website at www.fcbnm.com “Investor Relations.”
Information regarding executive officers appearing under the caption “Executive Officers of the Company” in our Proxy Statement for the 2010 Annual Meeting of Shareholders is hereby incorporated by reference.
| Item 11: | Executive Compensation. |
Information appearing under the captions “Compensation of Directors” and “Executive Compensation” in the 2010 Proxy Statement is hereby incorporated by reference.
| Item 12: | Security Ownership of Certain Beneficial Owners and Management and Related Stockholder Matters. |
Securities Authorized for Issuance Under Equity Compensation Plans
The following table provides information regarding compensation plans under which shares of Common Stock may be issued upon the exercise of options, warrants, and rights under the First State Bancorporation 1993 Stock Option Plan and the 2003 Equity Incentive Plan as of December 31, 2009:
| (a) | (b) | (c) | |||||
| Plan Category |
Number of securities to be issued upon exercise of outstanding options |
Weighted- average exercise price of outstanding options |
Number of securities remaining available for future issuance under equity compensation plans (excluding securities reflected in column (a)) | ||||
| Equity compensation plans approved by security holders |
1,110,482 | $ | 15.16 | 864,547 | |||
| Equity compensation plans not approved by security holders |
— | — | — | ||||
| Total |
1,110,482 | $ | 15.16 | 864,547 | |||
37
Table of Contents
Information setting forth the security ownership of certain beneficial owners and management appearing under the caption “Voting Securities and Principal Holders” in the 2010 Proxy Statement is hereby incorporated by reference.
| Item 13: | Certain Relationships and Related Transactions, and Director Independence. |
Information regarding certain related transactions appearing under the caption “Certain Business Relationships” in the 2010 Proxy Statement is hereby incorporated by reference.
| Item 14: | Principal Accountant Fees and Services. |
Information regarding principal accountant fees and services appearing under the caption “Ratification of Independent Auditors” in the 2010 Proxy Statement is hereby incorporated by reference.
PART IV
| Item 15: | Exhibits and Financial Statement Schedules. |
The following documents are filed as part of this annual report on Form 10-K:
1. Financial Statements:
| • | Financial Highlights |
| • | Management’s Discussion and Analysis of Financial Condition and Results of Operations |
| • | Management’s Report on Internal Controls over Financial Reporting |
| • | Report of Independent Registered Public Accounting Firm (Consolidated Financial Statements) |
| • | Consolidated Balance Sheets as of December 31, 2009 and 2008 |
| • | Consolidated Statements of Operations for the Years Ended December 31, 2009, 2008, and 2007 |
| • | Consolidated Statements of Comprehensive Income (Loss) for the Years Ended December 31, 2009, 2008, and 2007 |
| • | Consolidated Statements of Stockholders’ Equity for the Years Ended December 31, 2009, 2008, and 2007 |
| • | Consolidated Statements of Cash Flows for the Years Ended December 31, 2009, 2008, and 2007 |
The above financial statements are incorporated by reference from pages A-27 through A-67 of the attached Appendix.
2. Financial Statement Schedules
All schedules are omitted because they are not applicable or the required information is shown in the financial statements or notes thereto.
3. Exhibits
| No. |
Description | |
| 2.1 | Agreement and Plan of Merger, dated as of May 22, 2002, by and among First State Bancorporation, First State Bank N.M. (formerly known as First State Bank of Taos), First Community Industrial Bank, Blazer Financial Corporation, and Washington Mutual Finance Corporation. (20) | |
| 2.2 | Agreement and Plan of Merger, dated as of August 31, 2005, by and among First State Bancorporation, Access Anytime Bancorp, Inc. and AccessBank. (5) | |
| 2.3 | Agreement and Plan of Merger, dated as of September 2, 2005, by and among First State Bancorporation, New Mexico Financial Corporation, and Ranchers Banks. (6) | |
| 2.4 | Amendment Number 1 to the Agreement and Plan of Merger, dated September 29, 2005, by and among First State Bancorporation, Access Anytime Bancorp, Inc., and AccessBank. (7) | |
38
Table of Contents
| 2.5 | Agreement and Plan of Merger, dated as of October 4, 2006, by and among First State Bancorporation, MSUB, Inc., Front Range Capital Corporation, and Heritage Bank. (11) | |
| 2.6 | Loan Purchase Agreement, dated July 27, 2007, by and between First Community Bank, successor by merger to Heritage Bank and CAPFINANCIAL CV2, LLC. (16) | |
| 2.7 | Written Agreement, dated July 2, 2009, by and between First Community Bank, Federal Reserve Bank of Kansas City, and New Mexico Financial Institutions Division. (23) | |
| 2.8 | Retention of Financial Advisor, dated August 5, 2009, by and between First State Bancorporation and Keefe, Bruyette & Woods. (24) | |
| 3.1 | Restated Articles of Incorporation of First State Bancorporation. (1) | |
| 3.2 | Articles of Amendment to the Restated Articles of Incorporation of First State Bancorporation. (3) | |
| 3.3 | Articles of Amendment to the Restated Articles of Incorporation of First State Bancorporation. (10) | |
| 3.4 | Amended Bylaws of First State Bancorporation. * | |
| 3.5 | Articles of Amendment to the Restated Articles of Incorporation of First State Bancorporation. (19) | |
| 10.1 | Executive Employment Agreement. (20) | |
| 10.2 | First State Bancorporation 2003 Equity Incentive Plan. (20) | |
| 10.3 | Executive Deferred Compensation Plan. (20) (Participation and contributions to this Plan have been frozen as of December 31, 2004.) | |
| 10.4 | First Amendment to Executive Employment Agreement. (4) | |
| 10.5 | Officer Employment Agreement. (4) | |
| 10.6 | First Amendment to Officer Employment Agreement. (4) | |
| 10.7 | First State Bancorporation Deferred Compensation Plan. (3) | |
| 10.8 | First State Bancorporation Compensation and Bonus Philosophy and Plan. (13) | |
| 10.9 | First Amendment to the First State Bancorporation 2003 Equity Incentive Plan. (9) | |
| 10.10 | Second Amendment to the First State Bancorporation 2003 Equity Incentive Plan. (9) | |
| 10.11 | Access Anytime Bancorp, Inc. 1997 Stock Option and Incentive Plan. (14) | |
| 10.12 | Restated and Amended Access Anytime Bancorp, Inc. 1997 Stock Option and Incentive Plan. (8) | |
| 10.13 | Third Amendment to First State Bancorporation 2003 Equity Incentive Plan. (10) | |
| 10.14 | Compensation Committee Approval and Board Ratification of Certain Executive Salaries. (12) | |
| 10.15 | Fourth Amendment to First State Bancorporation 2003 Equity Incentive Plan. (17) | |
| 10.16 | Second Amendment to Executive Employment Agreement (Stanford). (15) | |
| 10.17 | Second Amendment to Executive Employment Agreement (Dee). (15) | |
| 10.18 | Second Amendment to Executive Employment Agreement (Spencer). (15) | |
| 10.19 | Second Amendment to Executive Employment Agreement (Martin). (15) | |
| 10.20 | Key Executives Incentive Plan. (18) | |
| 10.21 | Second Amendment to the First State Bancorporation Deferred Compensation Plan. (2) | |
| 10.22 | Executive Compensation Plan of Heritage Bank. (2) | |
| 10.23 | Form of Adoption Agreement for Executive compensation Plan of Heritage Bank. (2) | |
| 10.24 | Executive Retirement Plan of Heritage Bank Amendment and Restatement. (2) | |
| 10.25 | Form of Adoption Agreement for Executive Retirement Plan of Heritage Bank. (2) | |
| 10.26 | First Amendment to the Key Executives Incentive Plan. (21) | |
| 10.27 | Branch purchase agreement, dated as of March 10, 2009, by and among Great Western Bank, First Community Bank, and First State Bancorporation. (22) | |
| 14 | Code of Ethics for Executives. (20) | |
| 22 | Subsidiaries of Registrant. (22) | |
| 23 | Consent of KPMG LLP. * | |
| 31.1 | Certification of CEO pursuant to Section 302 of the Sarbanes-Oxley Act of 2002. * | |
| 31.2 | Certification of CFO pursuant to Section 302 of the Sarbanes-Oxley Act of 2002. * | |
| 32.1 | Certification of CEO pursuant to 18 U.S.C. Section 1350, as adopted pursuant to Section 906 of the Sarbanes-Oxley Act of 2002. * | |
| 32.2 | Certification of CFO pursuant to 18 U.S.C. Section 1350, as adopted pursuant to Section 906 of the Sarbanes-Oxley Act of 2002. * | |
| (1) | Incorporated by reference from Amendment 1 to First State Bancorporation’s Registration Statement on Form S-2, Commission File No. 333-24417, declared effective April 25, 1997. |
| (2) | Incorporated by reference from First State Bancorporation’s 10-K for the year ended December 31, 2007. |
| (3) | Incorporated by reference from First State Bancorporation’s 10-K for the year ended December 31, 2005. |
| (4) | Incorporated by reference from First State Bancorporation’s Form 10-Q for the quarter ended March 31, 2005. |
39
Table of Contents
| (5) | Incorporated by reference from First State Bancorporation’s Current Report on Form 8-K filed September 2, 2005. |
| (6) | Incorporated by reference from First State Bancorporation’s Current Report on Form 8-K filed September 6, 2005. |
| (7) | Incorporated by reference from First State Bancorporation’s Current Report on Form 8-K filed September 30, 2005. |
| (8) | Incorporated by reference from Access Anytime Bancorp, Inc.’s Registration Statement on Form S-8, filed May 1, 2003 (SEC file No. 333-104906). |
| (9) | Incorporated by reference from First State Bancorporation’s 10-Q for the quarter ended March 31, 2006. |
| (10) | Incorporated by reference from First State Bancorporation’s 10-Q for the quarter ended June 30, 2006. |
| (11) | Incorporated by reference from First State Bancorporation’s Current Report on Form 8-K filed October 5, 2006. |
| (12) | Incorporated by reference from First State Bancorporation’s Current Report on Form 8-K filed November 2, 2006. |
| (13) | Incorporated by reference from First State Bancorporation’s Form 8-K filed on January 26, 2006. |
| (14) | Incorporated by reference from Access Anytime Bancorp, Inc.’s Registration Statement on Form S-8, filed June 2, 1997 (SEC file No. 333-28217). |
| (15) | Incorporated by reference from First State Bancorporation’s Form 8-K filed on July 27, 2007. |
| (16) | Incorporated by reference to Exhibit 2.1 from First State Bancorporation’s Form 8-K filed on August 1, 2007. |
| (17) | Incorporated by reference from First State Bancorporation’s 10-Q for the quarter ended June 30, 2007. |
| (18) | Incorporated by reference to Exhibit 10.1 from First State Bancorporation’s Form 8-K filed on August 10, 2007. |
| (19) | Incorporated by reference from First State Bancorporation’s 10-Q for the quarter ended June 30, 2008. |
| (20) | Incorporated by reference from First State Bancorporation’s 10-Q for the quarter ended September 30, 2008. |
| (21) | Incorporated by reference to Exhibit 10.1 from First State Bancorporation’s Form 8-K filed on December 30, 2008. |
| (22) | Incorporated by reference from First State Bancorporation’s 10-K for the year ended December 31, 2008. |
| (23) | Incorporated by reference from First State Bancorporation’s Form 8-K filed on July 9, 2009. |
| (24) | Incorporated by reference from First State Bancorporation’s Form 8-K filed on August 6, 2009. |
| * | Filed herewith. |
40
Table of Contents
Pursuant to the requirements of Section 13 or 15(d) of the Exchange Act, the registrant has duly caused this report to be signed on its behalf by the undersigned, thereunto duly authorized.
| FIRST STATE BANCORPORATION | ||
| By: | /S/ H. PATRICK DEE | |
| H. Patrick Dee, President and Chief Executive Officer | ||
Dated: March 31, 2010
Pursuant to the requirements of the Exchange Act, this report has been signed below by the following persons on behalf of the registrant and in the capacities and on the dates indicated.
| Signatures |
Title |
Date | ||
| /S/ H. PATRICK DEE H. Patrick Dee |
President, Chief Executive Officer, Treasurer and a Director (Principal Executive Officer) | March 31, 2010 March 31, 2010 | ||
| /S/ CHRISTOPHER C. SPENCER Christopher C. Spencer |
Senior Vice President and Chief Financial Officer (Principal Financial Officer and Principal Accounting Officer) | March 31, 2010 March 31, 2010 | ||
| /S/ LEONARD J. DELAYO, JR. Leonard J. DeLayo, Jr. |
Director | March 31, 2010 March 31, 2010 | ||
| /S/ A. J. WELLS A. J. Wells |
Director | March 31, 2010 March 31, 2010 | ||
| /S/ MICHAEL J. BLAKE Michael J. Blake |
Director | March 31, 2010 March 31, 2010 | ||
| /S/ GARREY E. CARRUTHERS, PH.D. Garrey E. Carruthers, Ph.D. |
Director | March 31, 2010 March 31, 2010 | ||
| /S/ NEDRA J. MATTEUCCI Nedra J. Matteucci |
Director | March 31, 2010 March 31, 2010 | ||
| /S/ LOWELL A. HARE Lowell A. Hare |
Director | March 31, 2010 March 31, 2010 | ||
| /S/ DANIEL H. LOPEZ, PH.D. Daniel H. Lopez, Ph.D. |
Director | March 31, 2010 March 31, 2010 | ||
| /S/ KATHLEEN L. AVILA Kathleen L. Avila |
Director | March 31, 2010 March 31, 2010 | ||
41
Table of Contents
FIRST STATE BANCORPORATION AND SUBSIDIARY
INDEX
A-1
Table of Contents
| Years ended December 31, | ||||||||||||||||||||
| 2009 | 2008 | 2007 | 2006 | 2005 | ||||||||||||||||
| (Dollars in thousands, except per share data) | ||||||||||||||||||||
| Statement of Operations Data: |
||||||||||||||||||||
| Interest income |
$ | 140,468 | $ | 198,415 | $ | 229,232 | $ | 181,852 | $ | 121,957 | ||||||||||
| Interest expense |
52,525 | 73,835 | 96,425 | 67,051 | 37,712 | |||||||||||||||
| Net interest income |
87,943 | 124,580 | 132,807 | 114,801 | 84,245 | |||||||||||||||
| Provision for loan losses |
(162,600 | ) | (71,618 | ) | (10,267 | ) | (6,993 | ) | (3,920 | ) | ||||||||||
| Net interest (loss) income after provision for loan losses |
(74,657 | ) | 52,962 | 122,540 | 107,808 | 80,325 | ||||||||||||||
| Non-interest income |
55,456 | 26,338 | 25,096 | 19,347 | 16,113 | |||||||||||||||
| Non-interest expenses |
112,159 | 238,554 | 109,517 | 91,883 | 63,252 | |||||||||||||||
| Income (loss) before income taxes |
(131,360 | ) | (159,254 | ) | 38,119 | 35,272 | 33,186 | |||||||||||||
| Income tax expense (benefit) |
(20,867 | ) | (5,623 | ) | 13,312 | 12,497 | 11,788 | |||||||||||||
| Net income (loss) |
$ | (110,493 | ) | $ | (153,631 | ) | $ | 24,807 | $ | 22,775 | $ | 21,398 | ||||||||
| Per Share Data: |
||||||||||||||||||||
| Diluted earnings (loss) per share |
$ | (5.36 | ) | $ | (7.60 | ) | $ | 1.20 | $ | 1.26 | $ | 1.36 | ||||||||
| Book value |
2.27 | 7.84 | 15.47 | 14.67 | 10.41 | |||||||||||||||
| Tangible book value |
2.01 | 7.08 | 8.23 | 11.04 | 7.56 | |||||||||||||||
| Dividends paid |
— | 0.18 | 0.35 | 0.32 | 0.28 | |||||||||||||||
| Market price end of period |
0.40 | 1.65 | 13.90 | 24.75 | 23.99 | |||||||||||||||
| Weighted average diluted common shares outstanding |
20,612,746 | 20,207,478 | 20,628,019 | 18,061,931 | 15,689,445 | |||||||||||||||
| Average Balance Sheet Data: |
||||||||||||||||||||
| Total assets |
$ | 3,188,084 | $ | 3,462,488 | $ | 3,240,376 | $ | 2,592,464 | $ | 1,977,615 | ||||||||||
| Loans |
2,418,664 | 2,684,488 | 2,401,787 | 1,903,414 | 1,477,146 | |||||||||||||||
| Investment securities |
508,655 | 497,703 | 480,165 | 427,693 | 327,169 | |||||||||||||||
| Interest-bearing deposits with other banks |
140,293 | 2,649 | 4,276 | 7,206 | 4,056 | |||||||||||||||
| Federal funds sold |
6,114 | 3,937 | 9,479 | 10,792 | 7,968 | |||||||||||||||
| Deposits |
2,397,103 | 2,545,657 | 2,435,125 | 2,027,378 | 1,446,212 | |||||||||||||||
| Borrowings |
579,966 | 461,099 | 282,378 | 179,718 | 285,527 | |||||||||||||||
| Stockholders’ equity |
120,951 | 254,872 | 309,332 | 224,481 | 152,695 | |||||||||||||||
| Performance Ratios: |
||||||||||||||||||||
| Return on average assets |
(3.47 | )% | (4.44 | )% | 0.77 | % | 0.88 | % | 1.08 | % | ||||||||||
| Return on average common equity |
(91.35 | )% | (60.28 | )% | 8.02 | % | 10.15 | % | 14.01 | % | ||||||||||
| Net interest margin |
2.86 | % | 3.91 | % | 4.59 | % | 4.89 | % | 4.64 | % | ||||||||||
| Efficiency ratio (1) |
78.21 | % | 158.07 | % | 69.36 | % | 68.49 | % | 63.03 | % | ||||||||||
| Earnings to fixed charges: |
||||||||||||||||||||
| Including interest on deposits |
(1.41 | )x | (1.08 | )x | 1.39x | 1.51x | 1.85x | |||||||||||||
| Excluding interest on deposits |
(7.77 | )x | (7.54 | )x | 2.41x | 2.91x | 3.28x | |||||||||||||
| Asset Quality Ratios: |
||||||||||||||||||||
| Non-performing assets to total loans and other real estate owned |
15.65 | % | 4.95 | % | 1.91 | % | 0.99 | % | 0.49 | % | ||||||||||
| Net charge-offs to average loans |
4.36 | % | 0.88 | % | 0.19 | % | 0.18 | % | 0.12 | % | ||||||||||
| Allowance for loan losses to total loans held for investment |
6.45 | % | 2.91 | % | 1.26 | % | 1.15 | % | 1.16 | % | ||||||||||
| Allowance for loan losses to non-performing loans |
50.15 | % | 67.39 | % | 103.17 | % | 166.06 | % | 259.16 | % | ||||||||||
| Capital Ratios: |
||||||||||||||||||||
| Leverage ratio |
1.98 | % | 5.72 | % | 8.48 | % | 10.96 | % | 8.18 | % | ||||||||||
| Average stockholders’ equity to average total assets |
3.79 | % | 7.36 | % | 9.55 | % | 8.66 | % | 7.72 | % | ||||||||||
| Tier I risk-based capital ratio |
2.80 | % | 6.69 | % | 9.25 | % | 12.47 | % | 9.62 | % | ||||||||||
| Total risk-based capital ratio |
5.59 | % | 9.42 | % | 10.32 | % | 13.48 | % | 10.63 | % | ||||||||||
| (1) | Computed by dividing non-interest expense by the sum of net interest income and non-interest income. This is a non-GAAP financial measure, which we believe provides investors with important information regarding our financial performance. Comparison of our efficiency ratio with those of other companies may not be possible, because other companies may calculate the efficiency ratio differently. The efficiency ratio is used by management in its assessment of financial performance specifically as it relates to non-interest expense control. |
A-2
Table of Contents
SELECTED QUARTERLY FINANCIAL DATA
(unaudited)
| 2009 | ||||||||||||||||
| Fourth Qtr | Third Qtr | Second Qtr | First Qtr | |||||||||||||
| (Dollars in thousands, except per share data) | ||||||||||||||||
| Statement of Operations Data: |
||||||||||||||||
| Interest income |
$ | 29,016 | $ | 30,224 | $ | 39,998 | $ | 41,230 | ||||||||
| Interest expense |
10,663 | 11,904 | 15,080 | 14,878 | ||||||||||||
| Net interest income |
18,353 | 18,320 | 24,918 | 26,352 | ||||||||||||
| Provision for loan losses |
(45,700 | ) | (52,500 | ) | (31,100 | ) | (33,300 | ) | ||||||||
| Net interest loss after provision for loan losses |
(27,347 | ) | (34,180 | ) | (6,182 | ) | (6,948 | ) | ||||||||
| Non-interest income |
6,028 | 9,726 | 30,068 | 9,634 | ||||||||||||
| Non-interest expenses |
28,448 | 26,540 | 30,112 | 27,059 | ||||||||||||
| Loss before income taxes |
(49,767 | ) | (50,994 | ) | (6,226 | ) | (24,373 | ) | ||||||||
| Income tax expense (benefit) |
(21,413 | ) | 546 | — | — | |||||||||||
| Net loss |
$ | (28,354 | ) | $ | (51,540 | ) | $ | (6,226 | ) | $ | (24,373 | ) | ||||
| Net interest margin |
2.62 | % | 2.53 | % | 2.96 | % | 3.27 | % | ||||||||
| Per Share Data: |
||||||||||||||||
| Net loss per diluted share |
$ | (1.37 | ) | $ | (2.49 | ) | $ | (0.30 | ) | $ | (1.19 | ) | ||||
| Book value |
2.27 | 3.76 | 6.27 | 6.59 | ||||||||||||
| Tangible book value |
2.01 | 3.49 | 5.98 | 5.86 | ||||||||||||
| Dividends paid |
— | — | — | — | ||||||||||||
| Weighted average diluted common shares outstanding |
20,709,965 | 20,660,518 | 20,608,912 | 20,468,411 | ||||||||||||
| 2008 | ||||||||||||||||
| Fourth Qtr | Third Qtr | Second Qtr | First Qtr | |||||||||||||
| (Dollars in thousands, except per share data) | ||||||||||||||||
| Statement of Operations Data: |
||||||||||||||||
| Interest income |
$ | 46,437 | $ | 49,468 | $ | 49,541 | $ | 52,969 | ||||||||
| Interest expense |
16,170 | 17,806 | 18,295 | 21,564 | ||||||||||||
| Net interest income |
30,267 | 31,662 | 31,246 | 31,405 | ||||||||||||
| Provision for loan losses |
(23,383 | ) | (15,635 | ) | (28,700 | ) | (3,900 | ) | ||||||||
| Net interest income after provision for loan losses |
6,884 | 16,027 | 2,546 | 27,505 | ||||||||||||
| Non-interest income |
6,769 | 6,370 | 6,987 | 6,212 | ||||||||||||
| Non-interest expenses |
28,399 | 27,260 | 155,134 | 27,761 | ||||||||||||
| Income (loss) before income taxes |
(14,746 | ) | (4,863 | ) | (145,601 | ) | 5,956 | |||||||||
| Income tax expense (benefit) |
22,725 | (3,085 | ) | (27,294 | ) | 2,031 | ||||||||||
| Net income (loss) |
$ | (37,471 | ) | $ | (1,778 | ) | $ | (118,307 | ) | $ | 3,925 | |||||
| Net interest margin |
3.70 | % | 3.87 | % | 3.96 | % | 4.12 | % | ||||||||
| Per Share Data: |
||||||||||||||||
| Net income (loss) per diluted share |
$ | (1.85 | ) | $ | (0.09 | ) | $ | (5.87 | ) | $ | 0.19 | |||||
| Book value |
7.84 | 9.37 | 9.52 | 15.72 | ||||||||||||
| Tangible book value |
7.08 | 8.57 | 8.68 | 8.52 | ||||||||||||
| Dividends paid |
— | — | 0.09 | 0.09 | ||||||||||||
| Weighted average diluted common shares outstanding |
20,295,741 | 20,232,171 | 20,165,335 | 20,157,739 | ||||||||||||
A-3
Table of Contents
MANAGEMENT’S DISCUSSION AND ANALYSIS OF
FINANCIAL CONDITION AND RESULTS OF
OPERATIONS FOR THE YEARS ENDED DECEMBER 31, 2009, 2008, AND 2007
Basis of Presentation
The following represents management’s discussion and analysis of First State Bancorporation’s consolidated financial condition as of December 31, 2009 and 2008 and our results of consolidated operations for the years ended December 31, 2009, 2008, and 2007. This discussion should be read in conjunction with the consolidated financial statements and related footnotes and the five-year summary of selected financial data.
Overview
For the years ended December 31, 2009 and 2008, we reported a net loss of $110.5 million, or $(5.36) per diluted share and $153.6 million, or $(7.60) per diluted share, respectively. Net income for the year ended December 2007 was $24.8 million, or $1.20 per diluted share. The net loss for the year ended December 31, 2009 resulted primarily from the significant provision for loan losses due to the level of non-performing assets and charge-offs and write-downs of other real estate owned. Our loss for the year ended December 31, 2009 was mitigated by a tax benefit of $20.9 million and the gain on the sale of our Colorado branches of $23.3 million recorded in the second quarter of 2009. The net loss for the year ended December 31, 2008 resulted primarily from a $127.4 million non-cash goodwill impairment charge that occurred in the second quarter of 2008, the significant level of provision for loan losses due to the level of non-performing assets and charge-offs, and a $29.0 million valuation allowance against deferred tax assets. In addition, earnings were impacted by a compressed net interest margin, primarily caused by the 500 basis point reduction in the federal funds target rate that occurred over the period from September 2007 to December 2008 and the increase in non-performing assets throughout 2008 and 2009.
During 2009, asset quality remained the significant issue impacting the Bank. Problem and potential problem loans continued to migrate through the workout process in a very challenging credit cycle with the largest impact in the residential land development and construction portfolio. The increase in problem assets and charge-offs resulted in a significant increase in the provision for loan losses in 2009. The $129.2 million allowance for loan losses was 6.45% of total loans held for investment at December 31, 2009. The quality in our general commercial real estate loan portfolio continues to remain fairly stable, especially in the New Mexico market, which has by far our largest exposure. Our unemployment level in New Mexico, at 8.3% at December 31, 2009, remains below the national level of 10%. The unemployment level in Arizona is 9.1%. Our liquidity improved substantially during 2009, but we continue to monitor and manage it very closely. With a steady stream of payoffs in our loan portfolio, limited new loan activity, and net growth in our core deposits for the year, excluding the Colorado branch sale, we have been able to more than compensate for the decrease in brokered deposits for the year. We will get an additional boost in our liquidity in early 2010 when we receive an approximate $27 million tax refund resulting from our net operating loss carry-back. For 2010, we continue to increase the resources devoted to resolving our problem asset portfolio and are determined to continue to reduce certain non-interest expenses.
Given current economic conditions and trends, we may continue to experience asset quality deterioration and higher levels of non-performing loans in the near-term, as well as continued compression in our net interest margin, which would result in negative earnings and financial condition pressures.
In June 2009, we completed the sale of our Colorado branches, transferring approximately $387 million in loans, $512 million in deposits and securities sold under agreements to repurchase, $20 million of premises and equipment and other assets, and received a deposit premium of $30 million. After the write-off of the core deposit intangible associated with these deposits and investment banking fees, we recorded a pretax gain of approximately $23.3 million. Transaction costs recorded as expenses totaled $1.8 million.
Capital Adequacy and Regulatory Matters
On December 31, 2008 and January 27, 2009, respectively, to prepare for any opportunity to issue capital that may arise, we filed a universal shelf registration and an amendment to the shelf registration that allows the Company to issue any combination of common stock, preferred stock depositary shares, debt securities, and warrants from time to time in one or more offerings up to a total dollar amount of $100 million.
In order to help improve the Company’s and the Bank’s capital ratios, we suspended our cash dividend payments to shareholders in July 2008, and the Bank has not declared a cash dividend to the Company since May 2008. In early September 2008, we began notifying the holders of our trust preferred securities that interest payments would be deferred, as allowed by the terms of those securities.
At December 31, 2009, the Bank was considered “adequately capitalized” while the Company was considered “significantly undercapitalized” under regulatory guidelines, subjecting both entities to prompt supervisory and regulatory actions pursuant to the FDIC Improvement Act of 1991, and prohibiting us from accepting, renewing, or rolling over brokered deposits except with a waiver from the FDIC and subjecting the Bank to restrictions on the interest rates that can be paid on deposits.
A-4
Table of Contents
On July 2, 2009, the Company and the Bank executed a written agreement (“Regulator Agreement”) with the Federal Reserve Bank of Kansas City and the New Mexico Financial Institutions Division (collectively, the “Regulators”). The Regulator Agreement is based on findings of the Regulators identified in an examination of the Bank and the Company during January and February of 2009.
Under the terms of the Regulator Agreement, the Company and the Bank agreed, among other things, to engage an independent consultant acceptable to the Regulators to assess the Bank’s management and staffing needs, assess the qualifications and performance of all officers of the Bank, and assess the current structure and compositions of the Bank’s board of directors and its committees. In addition, within 60 days of the Regulator Agreement, the Company and or the Bank was required to submit a written plan to strengthen lending and credit risk management practices and improve the Bank’s position regarding past due loans, problem loans, classified loans, and other real estate owned; maintain sufficient capital at the Bank, holding company and the consolidated level; improve the Bank’s earnings and overall condition; and improve management of the Bank’s liquidity position, funds management process, and interest rate risk management. The Company and or the Bank have also agreed to maintain an adequate allowance for loan and lease losses; charge-off or collect assets classified as “loss” in the Report of Examination that have not been previously collected or charged off; not to pay any dividends; not to distribute any interest, principal or other sums on trust preferred securities; not to issue, increase or guarantee any debt; not to purchase or redeem any shares of the Company’s stock; and not to accept any new brokered deposits, even if the Bank is considered well capitalized. Within 30 days of the Regulator Agreement, the Bank was required to submit a written plan to the Regulators for reducing its reliance on brokered deposits.
The Board of Directors of the Company and the Bank are also required to appoint a Compliance Committee to monitor and coordinate the Company’s and the Bank’s compliance with the provisions of the Regulator Agreement, obtain prior approval for the appointment of new directors, the hiring or change in responsibilities of senior executive officers, and to comply with restrictions on severance payments and indemnification payments to institution affiliated parties.
Failure to comply with the provisions of the Regulator Agreement could subject the Company and or the Bank to additional enforcement actions. We continue to work closely with the Regulators regarding the Regulator Agreement and believe that the Company and the Bank are in compliance with the requirements of the Regulator Agreement except for the requirement to submit an acceptable capital plan. Capital plans for the Company and the Bank were submitted timely, but were not accepted by the regulators due to uncertainty of our ability to execute the plans. We are continuing to work toward compliance with the requirements of the capital plans. However, there can be no assurance that the Company and or the Bank will be able to comply fully with the provisions of the Regulator Agreement, or that efforts to comply with the Regulator Agreement will not have adverse effects on the Company’s ability to continue as a going concern. See “Going Concern Considerations” below.
At the current time, the Company’s “significantly undercapitalized” classification has no immediate impact on our day-to-day operations because the holding company has no immediate significant cash flow needs or significant obligations that are due in the next twelve months. In addition, the prompt corrective actions required by the Regulators are directed at the Bank. The substantial erosion of the Bank’s capital position in 2009 and the continued deterioration in the loan portfolio makes it unlikely that the Bank will be able to maintain its “adequately capitalized” status under regulatory guidelines without raising additional capital, a strategic merger, selling a significant amount of assets, obtaining government assistance, or some combination thereof.
The Company will continue to conduct its banking business with customers in a normal fashion. The Bank’s deposits will remain insured by the FDIC to the maximum limits allowed by law. Depending on the level of capital, the Regulators and or the FDIC can institute other corrective measures to require additional capital and have broad enforcement powers to impose additional restrictions on operations, substantial fines and other penalties for violation of laws and regulations.
Our total stockholders’ equity decreased to $47.0 million at December 31, 2009, from $159.3 million at December 31, 2008. This decrease is primarily due to $110.5 million in losses, $3.1 million from the decrease in market value of securities available for sale, and $130,000 change in the deferred tax asset for vested expired options, partially offset by $592,000 of share-based compensation expense related to restricted stock and employee stock options, $545,000 from stock issuances related to the employee benefit plan, and $333,000 for the change in the valuation allowance on deferred tax assets resulting from changes in unrealized holding gains on securities.
Going Concern Considerations
The Company’s financial condition has continued to deteriorate, and the Company has come under increasingly close scrutiny by the Regulators. Based on their assessment of the Company’s ability to operate in compliance with the Regulator Agreement, the regulatory authorities have broad discretion to take actions, including placing the Bank into a FDIC-administered receivership or conservatorship. The regulatory provisions under which the regulatory authorities act are intended to protect depositors, the deposit insurance fund and the banking system and are not intended to protect shareholders or other investors in other securities in a bank or its holding company. The Company cannot predict what additional actions the regulatory authorities may take.
A-5
Table of Contents
Management has determined that significant additional sources of capital will likely be required for the Company to continue operating through 2010 and beyond. Although management does not believe that the Company currently has the ability to raise new capital through a public offering at an acceptable price, management continues to work with the Company’s investment bankers to evaluate alternative capital strengthening strategies, and are currently working on other initiatives to strengthen the Company’s capital position including the possibility of entering into a business combination with a strategic partner or a transaction with a private equity group. However, there can be no assurance that the review of strategic alternatives will result in the Company pursuing any particular transaction or strategy, or if it pursues any such transaction or strategy, that it will be completed.
The consolidated financial statements have been prepared on a going concern basis, which contemplates the realization of assets and the discharge of liabilities in the normal course of business for the foreseeable future, and do not include any adjustments to reflect the possible future effects on the recoverability and classification of assets, or the amounts and classification of liabilities that may result should the Company not be able to continue as a going concern.
Liquidity
During 2009, our liquidity risk increased due to the impact of the operating losses and capital erosion discussed above, including the elimination of all available uncollateralized liquidity sources, the replacement of our FHLB blanket lien status with a restricted custody collateral arrangement, and increased collateral requirements imposed by the FHLB. However, we were able to maintain sufficient liquidity to satisfy our cash flow requirements during 2009.
In early 2009, we were notified that our borrowing lines at other banks had been modified, due to the deterioration of our 2008 operating results. Currently, our available borrowing lines which were previously unsecured, are required to be fully secured. In order to improve our liquidity position, we issued additional brokered deposits in the first quarter focusing on maturities of 15 to 24 months and borrowed additional funds from the FHLB focusing on maturities over the next two to three years to further strengthen our liquidity position. Throughout 2009, we continued to reduce our balance sheet by curtailing lending and focusing on retail deposit growth to provide further stabilization to our operations.
During 2009, the FHLB, which provides a significant amount of financing to us, replaced the previous blanket lien in effect at the end of 2008 with a custody arrangement, whereby the FHLB has custody and endorsement of the loans that collateralize our outstanding borrowing position with the FHLB. The FHLB further increased the collateral requirements related to our outstanding borrowing position by reducing the available collateral percentage applied to the unpaid principal balance of our pledged loans. The FHLB currently allows an aggregate collateral value of approximately 29% of the outstanding unpaid principal balance of the loans pledged to the FHLB.
We currently have investment securities with a carrying value of approximately $198 million and loan collateral with a par value of approximately $1.3 billion delivered to the FHLB to satisfy the requirements of the custody arrangement. The FHLB takes into consideration a number of factors in calculating the available collateral value including: credit quality, past due status, loan type, and loan documentation exceptions, among other factors. For loans to qualify as collateral, they must not be past due 90 days or more, must not be classified substandard or below, and must not be a loan to a director, employee or agent of the Company or the FHLB. Because collateral values are determined subjectively by the FHLB, there is no assurance that the FHLB will not require additional collateral or repayment of existing borrowings.
Under the terms of the Bank’s agreement with the FHLB, the FHLB may at its own option call the outstanding debt due and payable if any of the following have occurred: the Bank has suspended payment to any creditor or there has been an acceleration of the maturity of any indebtedness of the Bank to others; the FHLB reasonably and in good faith determines that a material adverse change has occurred in the financial condition of the Bank; or the FHLB reasonably and in good faith deems itself insecure in the collateral even though the Bank is not otherwise in default. Based on the Bank’s agreement with the FHLB and the FHLB’s credit policy, as the existing borrowings mature, they will be allowed to continuously renew for like amounts, but for terms not to exceed thirty days. Based on our current status with the FHLB, the Company no longer has the ability to draw down additional advances. The Bank has not received any notice from the FHLB regarding a call of its outstanding debt.
Our most liquid assets are cash and cash equivalents and marketable investment securities that are not pledged as collateral. The levels of these assets are dependent on operating, financing, lending, and investing activities during any given period. At December 31, 2009, our liquidity position consists of excess cash liquidity and several other liquidity sources. The cash liquidity at December 31, 2009 of approximately $105 million is made up of excess investable cash on the balance sheet including interest-bearing deposits with other banks and federal funds sold. Our other liquidity sources include two borrowing lines for a total capacity of approximately $76 million, fully collateralized by investment securities and commercial loans, approximately $23 million of unpledged investments, and $8 million of redeemable bank owned life insurance policies.
A-6
Table of Contents
Our primary sources of funds are customer deposits, loan repayments, maturities of and cash flow from investment securities, and borrowings. Investment securities may be used as a source of liquidity either through sale of investment securities available for sale or pledging for qualified deposits, as collateral for borrowings, or as collateral for other liquidity sources. Borrowings may include federal funds purchased, securities sold under agreements to repurchase, borrowings from the FHLB, and borrowings from the Federal Reserve Bank discount window.
During the third quarter, the Bank secured a subordination agreement with the FHLB, which provides the Bank the ability to pledge non-real estate commercial loans to the Federal Reserve Bank discount window. At the end of December, the Bank had approximately $72 million in borrowing capacity at the Federal Reserve Bank discount window, included in the $76 million referred to above, collateralized by approximately $152 million in commercial loans.
The Bank is currently “adequately capitalized.” From a liquidity standpoint, the most significant ramification of the drop in capitalized category relates to our inability to rollover or renew existing brokered deposits, including Certificate of Deposit Account Registry Service (“CDARS”) reciprocal deposits, that mature or come up for renewal while the Bank is considered adequately capitalized, without a waiver from the FDIC. The CDARS program is designed to achieve full insurance protection for the customer while protecting the deposit relationship of the banking institution. Under the program, depositors’ funds in excess of the FDIC insurance limit are broken into smaller amounts and placed with other member banks who reciprocate the action by placing small deposits with us, thus achieving fully insured balances for the customer. The Bank has not received a waiver and does not anticipate receiving a waiver from the FDIC. At December 31, 2009, the Bank had $170 million in brokered deposits including CDARS reciprocal which will mature in the next twelve months of which $44 million mature in the next 90 days. The Bank has maintained in excess of $100 million in overnight investments, which combined with normal expected repayments of loans outstanding, should provide adequate cash liquidity required to redeem these brokered deposits at maturity. In addition, at the end of 2009, we subscribed to two deposit listing services to help generate out of market deposits which are not considered to be brokered funds and have generated a total of $150 million in deposits from these two listing services as of March 2010.
Our liquidity position will also benefit during the first part of 2010 from the legislation extending the tax net operating loss carry-back period from two to five years passed in early November. This change allows us to carry back tax losses sustained during 2008 or 2009 back five years which is expected to provide approximately $27 million in additional cash liquidity during the first part of 2010.
The Bank is a participating institution in the Transaction Account Guarantee Program (“TAG Program”), which the FDIC extended in the third quarter from December 31, 2009 to June 30, 2010. The TAG Program provides the Bank’s deposit customers in non-interest bearing and interest-bearing NOW accounts paying fifty basis points or less full FDIC insurance for an unlimited amount. The current expiration of the TAG Program is anticipated to be the Bank’s most significant liquidity risk in the near term and mitigating the liquidity impact of such an event remains a priority. As of December 31, 2009, the Company had 293 deposit accounts with balances greater than $250,000 participating in the TAG Program providing unlimited insurance coverage for a total of $309 million in deposits. Approximately half of the deposits are public funds and half are primarily private business accounts. The FDIC is currently evaluating a possible extension of the TAG Program; however, if the TAG Program is not extended by the FDIC, the Bank will be required to collateralize these outstanding public funds immediately upon expiration. The Bank may also experience withdrawals by account holders of any amounts they have on deposit in excess of the amount then insured by the FDIC. Based on current liquidity sources, management anticipates that the Bank will have adequate collateral and other sources of liquidity to meet these potential needs. However, it could require the Bank to utilize the majority of its available liquidity and potentially utilize a portion of our borrowing capacity at the discount window. Even if the FDIC decides to extend the TAG program, it could do so on terms that makes the program unavailable to us or on terms that make the program less attractive for us to participate.
Management currently anticipates that our cash and cash equivalents, expected cash flows from operations, loan and investment security principal repayments, and borrowing capacity will be sufficient to meet our anticipated cash requirements for working capital, loan originations, capital expenditures, brokered deposit maturities, and other obligations for at least the next twelve months. This expectation assumes that, because we have provided the requisite collateral and are in compliance with our debt agreement, the FHLB will continue to renew existing borrowings as they mature. However, if the FHLB were to call our borrowings due and payable based on the terms described above, we may not be able to continue as a going concern without substantial disposition of assets, restructuring of the debt, or other means of raising capital. This expectation also assumes that core deposits remain stable. A substantial decline in core deposits would severely impact our ability to meet our obligations for at least the next twelve months.
Business Combinations
On March 1, 2007, we completed the acquisition of Front Range Capital Corporation (“Front Range”) for $72 million in cash. We acquired approximately $292 million in net loans and $360 million in deposits, and recognized goodwill of approximately $61 million related to the transaction. The transaction added 13 branches to our franchise in the Denver-Boulder-Longmont triangle along Colorado’s front range. Subsequent to the completion of the transaction, we closed two of the Front Range branches, one in Firestone, Colorado and one in Denver, Colorado. See Note 2 of Notes to Consolidated Financial Statements for additional information on this acquisition.
A-7
Table of Contents
In 2008, all of the Company’s goodwill was written off. See “Critical Accounting Estimates and Judgments” below and Note 7 of Notes to Consolidated Financial Statements for additional information on goodwill impairment.
Critical Accounting Estimates and Judgments
Allowance for Loan Losses
Management analyzes the loan portfolio to determine the adequacy of the allowance for loan losses and the appropriate provision required to maintain an adequate allowance. Estimating the allowance is a critical accounting policy and is subject to a greater degree of uncertainty than in prior periods as a result of current economic conditions. Management uses a systematic methodology with subjective elements that require material estimates which are subject to revision as facts and circumstances warrant. In assessing the adequacy of the allowance, management reviews the size, quality, and risks of loans in the portfolio, and considers factors such as specific known risks, past experience, the status and amount of non-performing assets, and economic conditions. A specific percentage is provided for inherent losses in the loan portfolio based on historical loss experience, while additional amounts are added for individual loans considered to have specific loss potential. Loan losses are charged off as identified. Based on total allocations, the provision is recorded, based on management’s best estimate of the level deemed appropriate to provide for probable inherent losses in the loan portfolio. As future events and their effects cannot be determined with precision, it is reasonably possible that a change will occur in the near term and actual results could differ significantly from the estimate.
Goodwill and Intangible Assets
We periodically evaluate goodwill and intangible assets for impairment whenever events or changes in circumstances indicate that the asset might be impaired, and, at least annually, for goodwill. As a result of the Company’s market capitalization being less than our stockholders’ equity at June 30, 2008, we performed an analysis to determine whether and to what extent our goodwill may have been impaired. The Company has one reporting unit. The estimated fair value of the Company, which was less than the Company’s stockholders’ equity balance at June 30, 2008, was determined using three methods: comparable transactions; a discounted cash flow model; and a market premium approach. Based on the guidance included in the Financial Accounting Standards Board’s (“FASB”) Accounting Standards Codification (“ASC”) Topic 350 “Intangibles – Goodwill and Other,” the market premium approach, based on the fair value of the Company’s common stock on June 30, 2008, plus a control premium, received significant weighting in our analysis at the June 30, 2008 testing date. The second step of the analysis compared the implied fair value of goodwill to the carrying amount of goodwill on the Company’s balance sheet. If the carrying amount of the goodwill exceeds the implied fair value of that goodwill, an impairment loss must be recognized in an amount equal to the excess. The implied fair value of the Company’s goodwill was determined in the same manner as goodwill recognized in a business combination. That is, the estimated fair value of the Company on the test date is allocated to all of the Company’s individual assets and liabilities, including any unrecognized identifiable intangible assets, as if the Company had been acquired in a business combination with the estimated fair value of the Company representing the price paid to acquire it. The allocation process performed on the test date is only for purposes of determining the amount of goodwill impairment, as no assets or liabilities are written up or down, nor are any additional unrecognized identifiable intangible assets recorded as part of this process. Based on the analysis, we determined that the implied fair value of goodwill was zero, resulting in the recognition of a goodwill impairment charge to earnings of $127.4 million in June 2008. The goodwill impairment charge had no effect on the Company’s or the Bank’s cash balances, liquidity, or risk-based capital.
We periodically review our core deposit intangibles in a manner similar to that for goodwill and to date have not found any indication of impairment.
Valuation of Deferred Tax Assets
We record income taxes under the asset and liability method, whereby deferred tax assets and liabilities are recognized for the future tax consequences attributable to differences between the financial statement carrying amounts of existing assets and liabilities and their respective tax bases. Deferred tax assets and liabilities are measured using enacted tax rates expected to apply to taxable income in the years in which those temporary differences are expected to be recovered or settled. The effect on deferred tax assets and liabilities of a change in tax rates is recognized in income in the period that includes the enactment date.
ASC Topic 740, “Income Taxes” requires a reduction of the carrying amounts of deferred tax assets by a valuation allowance if, based on the available evidence, it is more likely than not that such assets will not be realized. Accordingly, the need to establish valuation allowances for deferred tax assets are assessed periodically by us based on ASC Topic 740’s more-likely-than-not realization threshold criterion. In the assessment for a valuation allowance, appropriate consideration is given to all positive and negative evidence related to the realization of the deferred tax assets. This assessment considers, among other matters, the nature, frequency and severity of current and cumulative losses, forecasts of future profitability, the duration of statutory carry-forward
A-8
Table of Contents
and carry-back periods, our experience with operating loss and tax credit carry-forwards not expiring unused, and tax planning alternatives. When substantial uncertainty exists concerning the recoverability of a deferred tax asset, the carrying value of the deferred tax asset is reduced by a valuation allowance. Increases or decreases in the valuation allowance result in increases or decreases to the provision for income taxes. Based on our assessment, we determined that a $61.7 million and $29.0 million valuation allowance related to deferred tax assets was necessary at December 31, 2009 and 2008, respectively. Changes in existing tax laws or rates could affect actual tax results and future business results, which could affect the amount of or need for a valuation allowance in future periods. In addition, current uncertain and volatile economic conditions could affect our future business results, also affecting the amount of or need for a valuation allowance in future periods. Our current evaluation represents our best estimate of future events.
Recent Accounting Pronouncements and Developments
Note 1 to the Consolidated Financial Statements discusses new accounting policies that we adopted and the expected impact of other new accounting standards recently issued but not yet required to be adopted. To the extent the adoption of new accounting standards materially affects our financial condition, results of operations, or liquidity, the impact is discussed elsewhere in “Management’s Discussion and Analysis of Financial Condition and Results of Operations” and in the notes to the consolidated financial statements.
Results of Operations
Earnings Performance
An analysis of the major components of net income in 2009, 2008, and 2007 is presented below. Additional data on our performance during the past five years appear in “Financial Highlights.”
| Years ended December 31, | ||||||||||||
| 2009 | 2008 | 2007 | ||||||||||
| (Dollars in thousands) | ||||||||||||
| Interest income |
$ | 140,468 | $ | 198,415 | $ | 229,232 | ||||||
| Interest expense |
52,525 | 73,835 | 96,425 | |||||||||
| Net interest income |
87,943 | 124,580 | 132,807 | |||||||||
| Provision for loan losses |
(162,600 | ) | (71,618 | ) | (10,267 | ) | ||||||
| Non-interest income |
55,456 | 26,338 | 25,096 | |||||||||
| Non-interest expense |
112,159 | 238,554 | 109,517 | |||||||||
| Income (loss) before income taxes |
(131,360 | ) | (159,254 | ) | 38,119 | |||||||
| Income tax expense (benefit) |
(20,867 | ) | (5,623 | ) | 13,312 | |||||||
| Net income (loss) |
$ | (110,493 | ) | $ | (153,631 | ) | $ | 24,807 | ||||
Net Interest Income
The primary component of earnings for most financial institutions is net interest income. Net interest income is the difference between interest income, principally from loan and investment securities portfolios, and interest expense, principally on customer deposits and borrowings. Changes in net interest income result from changes in volume, spread, and margin. Volume refers to the average dollar level of interest-earning assets and interest-bearing liabilities. Spread refers to the difference between the average yield on interest-earning assets and the average cost of interest-bearing liabilities. Margin refers to net interest income divided by average interest-earning assets and is influenced by the level and relative mix of interest-earning assets and interest-bearing liabilities.
Our net interest income decreased by $36.6 million, or 29.4%, to $87.9 million in 2009, from $124.6 million in 2008. The decrease in 2009 was composed of a $57.9 million decrease in total interest income, partially offset by a $21.3 million decrease in total interest expense.
The decrease in total interest income in 2009 was composed of a decrease of $45.0 million due to a 1.65% decrease in the yield on average interest-earning assets and a decrease of $12.9 million due to decreased average interest-earning assets of $115.1 million. The yield on average interest-earning assets has been negatively affected by the increase in non-accrual loans. See further discussion below regarding the affect of non-accrual loans on net interest margin. The decrease in average interest-earning assets was primarily due to a $265.8 million decrease in average loans, partially offset by an increase of $137.6 million in average interest bearing deposits with other banks. The decrease in average loans is primarily due to the sale of our Colorado branches that occurred in June 2009. Loan fees of $3.1 million, $6.0 million, and $7.9 million are included in interest income for the years ended December 31, 2009, 2008, and 2007, respectively.
A-9
Table of Contents
The decrease in total interest expense in 2009 was composed of a decrease of $21.3 million due to a 0.70% decrease in the cost of interest-bearing liabilities, and a decrease of $4,000 due to decreased average interest-bearing liabilities of $106.0 million. The decrease in average interest-bearing liabilities was due to a decrease in average interest-bearing deposits of $110.6 million, and a decrease in average short-term borrowings and securities sold under agreements to repurchase of $234.5 million, offset by an increase in average long term debt of $239.2 million. The decrease in average interest-bearing deposits is primarily due to the sale of our Colorado branches that occurred in June 2009.
Our net interest income decreased by $8.2 million, or 6.2%, to $124.6 million in 2008, from $132.8 million in 2007. The decrease in 2008 was composed of a $30.8 million decrease in total interest income, partially offset by a $22.6 million decrease in total interest expense.
The decrease in total interest income in 2008 was composed of a decrease of $55.7 million due to a 1.70% decrease in the yield on average interest-earning assets, partially offset by an increase of $24.9 million due to increased average interest-earning assets of $293.1 million. The increase in average interest-earning assets was primarily due to a $282.7 million increase in average loans, particularly during the first six months of the 2008.
The decrease in total interest expense in 2008 was composed of a decrease of $34.8 million due to a 1.23% decrease in the cost of interest-bearing liabilities, partially offset by an increase of $12.2 million due to increased average interest-bearing liabilities of $267.6 million. The increase in average interest-bearing liabilities was partially due to an increase in average interest-bearing deposits of $104.6 million, due primarily to an increase in market share in New Mexico and Colorado. In addition, average short-term borrowings increased by $131.5 million as the overall growth in our loan portfolio exceeded our ability to generate deposits.
Our net interest margin was 2.86% in 2009, compared to 3.91% in 2008 and 4.59% in 2007. The decrease in the net interest margin is primarily due to the decrease in the federal funds target rate that began in September 2007 and continued through December 2008, along with the increase in non-performing assets throughout 2008 and 2009. The Federal Reserve Bank lowered the federal funds target rate by 500 basis points, 400 of which occurred in calendar 2008, leading to equal decreases in the prime lending rate. A significant portion of our loan portfolio is tied directly to the prime lending rate and adjusts daily when there is a change in the prime lending rate. The rates paid on customer deposits are influenced more by competition in our markets and tend to lag behind Federal Reserve Bank action in both timing and magnitude, particularly in this very low rate environment. Although we have lowered selected deposit rates since the beginning of 2008, we continue to remain competitive in the markets we serve.
Our asset sensitivity, including the increase in excess cash for liquidity purposes, the decrease in the prime lending rate, and the increase in non-accrual loans combined with an increase in borrowings in early 2009 and minimal deposit repricing, continues to have a negative impact on the net interest margin.
In the first quarter of 2009, in order to increase our liquidity position, we issued additional brokered deposits and borrowed additional funds from the FHLB, resulting in an increase in lower yielding cash on the balance sheet. This strategy increased our cash liquidity and at the same time resulted in further margin compression by increasing our earning asset base with lower yielding assets and contributing to an increase in interest expense. As part of our strategy, we focused on maturities of 15 to 24 months for brokered deposits issued in the first quarter of 2009, as well as maturities over the next two to three years for FHLB borrowings to further strengthen our liquidity position. Although these activities noted above have contributed to the recent margin compression, we continue to believe that the improvement in our current liquidity position in the current banking environment outweighs the margin compression we have seen over the last few quarters.
The increase in non-accrual loans has continued to put pressure on our net interest margin. The margin compression is a direct result of reversals of accrued interest on loans moving to non-accrual status during the period as well as the inability to accrue interest on the respective loans going forward, ultimately resulting in an earning asset with a zero yield. The level of non- accrual loans has increased to $258 million at the end of December 2009 from $114 million at the end of December 2008. Non- accrual loans now make up 9.6% of interest-earning assets compared to 3.6% a year ago.
In addition, in 2009 we classified two Colorado metropolitan municipal district bonds totaling $18.8 million as non-accrual investment securities and reversed approximately $1.9 million in accrued interest during the third and fourth quarters of 2009. The bond agreements allow the districts to defer interest payments in the case where available funds from development of the district are not sufficient to cover the debt service. Due to the status of the developments and related uncertainty of the cash flows, we reversed the accrued interest on these bonds.
The extent of future changes in our net interest margin will depend on the amount and timing of any Federal Reserve rate changes, our overall liquidity position, our non-performing asset levels, our ability to manage the cost of interest-bearing liabilities, and our ability to stay competitive in the markets we serve.
A-10
Table of Contents
The following tables set forth, for the periods indicated, information with respect to average balances of assets and liabilities, as well as the total dollar amounts of interest income from interest-earning assets and interest expense from interest-bearing liabilities, resultant yields or costs, net interest income, net interest spread, net interest margin, and the ratio of average interest-earning assets to average interest-bearing liabilities. No tax equivalent adjustments were made and all average balances are daily average balances. Non-accruing loans have been included in the table as loans carrying a zero yield.
| Years ended December 31, | ||||||||||||||||||||||||||||||
| 2009 | 2008 | 2007 | ||||||||||||||||||||||||||||
| Average Balance |
Interest Income or Expense |
Average Yield or Cost |
Average Balance |
Interest Income or Expense |
Average Yield or Cost |
Average Balance |
Interest Income or Expense |
Average Yield or Cost |
||||||||||||||||||||||
| (Dollars in thousands) | ||||||||||||||||||||||||||||||
| Assets |
||||||||||||||||||||||||||||||
| Loans: |
||||||||||||||||||||||||||||||
| Commercial |
$ | 304,009 | $ | 15,958 | 5.25 | % | $ | 345,248 | $ | 22,815 | 6.61 | % | $ | 326,715 | $ | 27,953 | 8.56 | % | ||||||||||||
| Real estate |
2,065,015 | 102,514 | 4.96 | 2,280,208 | 147,349 | 6.46 | 2,000,495 | 171,635 | 8.58 | |||||||||||||||||||||
| Consumer |
32,845 | 3,355 | 10.21 | 44,356 | 4,498 | 10.14 | 55,300 | 5,626 | 10.17 | |||||||||||||||||||||
| Mortgage |
15,676 | 732 | 4.67 | 12,596 | 750 | 5.95 | 17,052 | 1,078 | 6.32 | |||||||||||||||||||||
| Other |
1,119 | — | — | 2,080 | — | — | 2,225 | — | — | |||||||||||||||||||||
| Total loans |
2,418,664 | 122,559 | 5.07 | % | 2,684,488 | 175,412 | 6.53 | % | 2,401,787 | 206,292 | 8.59 | % | ||||||||||||||||||
| Allowance for loan losses |
(103,662 | ) | (49,994 | ) | (28,731 | ) | ||||||||||||||||||||||||
| Securities: |
||||||||||||||||||||||||||||||
| U.S. government and mortgage-backed |
379,451 | 14,100 | 3.72 | 387,441 | 17,969 | 4.64 | 409,408 | 18,630 | 4.55 | |||||||||||||||||||||
| States and political subdivisions: |
||||||||||||||||||||||||||||||
| Non-taxable |
96,168 | 2,800 | 2.91 | 81,920 | 3,865 | 4.72 | 52,398 | 2,672 | 5.10 | |||||||||||||||||||||
| Taxable |
2,402 | 142 | 5.91 | 2,539 | 149 | 5.87 | 100 | 6 | 6.00 | |||||||||||||||||||||
| Other |
30,634 | 502 | 1.64 | 25,803 | 859 | 3.33 | 18,259 | 963 | 5.27 | |||||||||||||||||||||
| Total securities |
508,655 | 17,544 | 3.45 | % | 497,703 | 22,842 | 4.59 | % | 480,165 | 22,271 | 4.64 | % | ||||||||||||||||||
| Interest-bearing deposits with other banks |
140,293 | 353 | 0.25 | 2,649 | 81 | 3.06 | 4,276 | 198 | 4.63 | |||||||||||||||||||||
| Federal funds sold |
6,114 | 12 | 0.20 | 3,937 | 80 | 2.03 | 9,479 | 471 | 4.97 | |||||||||||||||||||||
| Total interest-earning assets |
3,073,726 | 140,468 | 4.57 | % | 3,188,777 | 198,415 | 6.22 | % | 2,895,707 | 229,232 | 7.92 | % | ||||||||||||||||||
| Non-interest-earning assets: |
||||||||||||||||||||||||||||||
| Cash and due from banks |
58,768 | 66,348 | 72,769 | |||||||||||||||||||||||||||
| Other |
159,252 | 257,357 | 300,631 | |||||||||||||||||||||||||||
| Total non-interest-earning assets |
218,020 | 323,705 | 373,400 | |||||||||||||||||||||||||||
| Total assets |
$ | 3,188,084 | $ | 3,462,488 | $ | 3,240,376 | ||||||||||||||||||||||||
| Liabilities and Stockholders’ Equity |
||||||||||||||||||||||||||||||
| Deposits: |
||||||||||||||||||||||||||||||
| Interest-bearing demand accounts |
$ | 325,350 | $ | 2,024 | 0.62 | % | $ | 320,217 | $ | 2,656 | 0.83 | % | $ | 334,962 | $ | 3,760 | 1.12 | % | ||||||||||||
| Money market savings accounts |
472,331 | 7,296 | 1.54 | 507,297 | 12,073 | 2.38 | 331,783 | 11,160 | 3.36 | |||||||||||||||||||||
| Regular savings accounts |
96,463 | 492 | 0.51 | 105,997 | 807 | 0.76 | 113,209 | 1,154 | 1.02 | |||||||||||||||||||||
| Certificates of deposit > $100,000 |
457,921 | 13,959 | 3.05 | 612,194 | 22,725 | 3.71 | 730,604 | 34,732 | 4.75 | |||||||||||||||||||||
| Certificates of deposit < $100,000 |
286,251 | 8,554 | 2.99 | 358,703 | 13,958 | 3.89 | 385,191 | 17,386 | 4.51 | |||||||||||||||||||||
| CDARS Reciprocal |
128,662 | 3,354 | 2.61 | 112,327 | 3,487 | 3.10 | 20,384 | 1,038 | 5.09 | |||||||||||||||||||||
| Brokered CDs |
192,071 | 3,937 | 2.05 | 52,893 | 2,042 | 3.86 | 48,929 | 2,613 | 5.34 | |||||||||||||||||||||
| Total interest-bearing deposits |
1,959,049 | 39,616 | 2.02 | % | 2,069,628 | 57,748 | 2.79 | % | 1,965,062 | 71,843 | 3.66 | % | ||||||||||||||||||
| Federal funds purchased and securities sold under agreements to repurchase |
64,698 | 181 | 0.28 | 179,021 | 2,664 | 1.49 | 194,697 | 8,080 | 4.15 | |||||||||||||||||||||
| Short-term borrowings |
187,418 | 2,204 | 1.18 | 307,588 | 6,777 | 2.20 | 176,110 | 9,039 | 5.13 | |||||||||||||||||||||
| Long-term debt |
294,156 | 7,549 | 2.57 | 54,972 | 1,811 | 3.29 | 15,172 | 828 | 5.46 | |||||||||||||||||||||
| Trust preferred securities |
98,392 | 2,975 | 3.02 | 98,539 | 4,835 | 4.91 | 91,096 | 6,635 | 7.28 | |||||||||||||||||||||
| Total interest-bearing liabilities |
2,603,713 | 52,525 | 2.02 | % | 2,709,748 | 73,835 | 2.72 | % | 2,442,137 | 96,425 | 3.95 | % | ||||||||||||||||||
| Non-interest-bearing demand accounts |
438,054 | 476,029 | 470,063 | |||||||||||||||||||||||||||
| Other non-interest-bearing liabilities |
25,366 | 21,839 | 18,844 | |||||||||||||||||||||||||||
| Total liabilities |
3,067,133 | 3,207,616 | 2,931,044 | |||||||||||||||||||||||||||
| Stockholders’ equity |
120,951 | 254,872 | 309,332 | |||||||||||||||||||||||||||
| Total liabilities and stockholders’ equity |
$ | 3,188,084 | $ | 3,462,488 | $ | 3,240,376 | ||||||||||||||||||||||||
| Net interest income |
$ | 87,943 | $ | 124,580 | $ | 132,807 | ||||||||||||||||||||||||
| Net interest spread |
2.55 | % | 3.50 | % | 3.97 | % | ||||||||||||||||||||||||
| Net interest margin |
2.86 | % | 3.91 | % | 4.59 | % | ||||||||||||||||||||||||
| Ratio of average interest-earning assets to average interest-bearing liabilities |
118.05 | % | 117.68 | % | 118.57 | % | ||||||||||||||||||||||||
A-11
Table of Contents
The following table illustrates the changes in our net interest income due to changes in volume and changes in interest rates. Changes attributable to the combined effect of volume and interest rates have been included in the changes due to volume.
| Years ended December 31, | ||||||||||||||||||||||||
| 2009 vs. 2008 Increase (decrease) due to changes in |
2008 vs. 2007 Increase (decrease) due to changes in |
|||||||||||||||||||||||
| Volume | Rate | Total | Volume | Rate | Total | |||||||||||||||||||
| (Dollars in thousands) | ||||||||||||||||||||||||
| Interest-earning assets |
||||||||||||||||||||||||
| Loans: |
||||||||||||||||||||||||
| Commercial |
$ | (2,725 | ) | $ | (4,132 | ) | $ | (6,857 | ) | $ | 1,586 | $ | (6,724 | ) | $ | (5,138 | ) | |||||||
| Real estate |
(13,906 | ) | (30,929 | ) | (44,835 | ) | 23,998 | (48,284 | ) | (24,286 | ) | |||||||||||||
| Consumer |
(1,167 | ) | 24 | (1,143 | ) | (1,113 | ) | (15 | ) | (1,128 | ) | |||||||||||||
| Mortgage |
183 | (201 | ) | (18 | ) | (282 | ) | (46 | ) | (328 | ) | |||||||||||||
| Total loans |
(17,615 | ) | (35,238 | ) | (52,853 | ) | 24,189 | (55,069 | ) | (30,880 | ) | |||||||||||||
| Securities: |
||||||||||||||||||||||||
| U.S. government and mortgage-backed |
(371 | ) | (3,498 | ) | (3,869 | ) | (1,000 | ) | 339 | (661 | ) | |||||||||||||
| States and political subdivisions: |
||||||||||||||||||||||||
| Non-taxable |
672 | (1,737 | ) | (1,065 | ) | 1,505 | (312 | ) | 1,193 | |||||||||||||||
| Taxable |
(8 | ) | 1 | (7 | ) | 146 | (3 | ) | 143 | |||||||||||||||
| Other |
161 | (518 | ) | (357 | ) | 398 | (502 | ) | (104 | ) | ||||||||||||||
| Total securities |
454 | (5,752 | ) | (5,298 | ) | 1,049 | (478 | ) | 571 | |||||||||||||||
| Interest-bearing deposits with other banks |
4,209 | (3,937 | ) | 272 | (75 | ) | (42 | ) | (117 | ) | ||||||||||||||
| Federal funds sold |
44 | (112 | ) | (68 | ) | (275 | ) | (116 | ) | (391 | ) | |||||||||||||
| Total interest-earning assets |
(12,908 | ) | (45,039 | ) | (57,947 | ) | 24,888 | (55,705 | ) | (30,817 | ) | |||||||||||||
| Interest-bearing liabilities |
||||||||||||||||||||||||
| Deposits: |
||||||||||||||||||||||||
| Interest-bearing demand accounts |
43 | (675 | ) | (632 | ) | (166 | ) | (938 | ) | (1,104 | ) | |||||||||||||
| Money market savings accounts |
(832 | ) | (3,945 | ) | (4,777 | ) | 5,904 | (4,991 | ) | 913 | ||||||||||||||
| Regular savings accounts |
(73 | ) | (242 | ) | (315 | ) | (74 | ) | (273 | ) | (347 | ) | ||||||||||||
| Certificates of deposit > $100,000 |
(5,727 | ) | (3,039 | ) | (8,766 | ) | (5,629 | ) | (6,378 | ) | (12,007 | ) | ||||||||||||
| Certificates of deposit < $100,000 |
(2,819 | ) | (2,585 | ) | (5,404 | ) | (1,196 | ) | (2,232 | ) | (3,428 | ) | ||||||||||||
| CDARS Reciprocal |
507 | (640 | ) | (133 | ) | 4,682 | (2,233 | ) | 2,449 | |||||||||||||||
| Brokered CDs |
5,373 | (3,478 | ) | 1,895 | 212 | (783 | ) | (571 | ) | |||||||||||||||
| Total interest-bearing deposits |
(3,528 | ) | (14,604 | ) | (18,132 | ) | 3,733 | (17,828 | ) | (14,095 | ) | |||||||||||||
| Federal funds purchased and securities sold under agreements to repurchase |
(1,701 | ) | (782 | ) | (2,483 | ) | (651 | ) | (4,765 | ) | (5,416 | ) | ||||||||||||
| Short-term borrowings |
(2,648 | ) | (1,925 | ) | (4,573 | ) | 6,748 | (9,010 | ) | (2,262 | ) | |||||||||||||
| Long-term debt |
7,880 | (2,142 | ) | 5,738 | 2,172 | (1,189 | ) | 983 | ||||||||||||||||
| Junior subordinated debentures |
(7 | ) | (1,853 | ) | (1,860 | ) | 542 | (2,342 | ) | (1,800 | ) | |||||||||||||
| Total interest-bearing liabilities |
(4 | ) | (21,306 | ) | (21,310 | ) | 12,544 | (35,134 | ) | (22,590 | ) | |||||||||||||
| Total increase (decrease) in net interest income |
$ | (12,904 | ) | $ | (23,733 | ) | $ | (36,637 | ) | $ | 12,344 | $ | (20,571 | ) | $ | (8,227 | ) | |||||||
A-12
Table of Contents
Non-interest Income
An analysis of the components of non-interest income is presented in the table below:
| Years ended December 31, | $ Change | % Change | ||||||||||||||||||||||
| 2009 | 2008 | 2007 | 2009-2008 | 2008-2007 | 2009-2008 | 2008-2007 | ||||||||||||||||||
| (Dollars in thousands) | ||||||||||||||||||||||||
| Service charges |
$ | 13,606 | $ | 14,872 | $ | 10,943 | $ | (1,266 | ) | $ | 3,929 | (9 | )% | 36 | % | |||||||||
| Credit and debit card transaction fees |
3,717 | 4,011 | 4,331 | (294 | ) | (320 | ) | (7 | ) | (7 | ) | |||||||||||||
| Gain (loss) on investment securities |
8,040 | (732 | ) | 39 | 8,772 | (771 | ) | 1,198 | (1,977 | ) | ||||||||||||||
| Gain on sale of loans |
3,933 | 3,947 | 4,788 | (14 | ) | (841 | ) | — | (18 | ) | ||||||||||||||
| Gain on sale of Colorado branches |
23,292 | — | — | 23,292 | — | — | — | |||||||||||||||||
| Other |
2,868 | 4,240 | 4,995 | (1,372 | ) | (755 | ) | (32 | ) | (15 | ) | |||||||||||||
| Total non-interest income |
$ | 55,456 | $ | 26,338 | $ | 25,096 | $ | 29,118 | $ | 1,242 | 111 | % | 5 | % | ||||||||||
The decrease in service charges and credit and debit card transaction fees in 2009 is due to the completion of the sale of our Colorado branches in June 2009 and a general decrease in NSF activity, partially offset by an increase in NSF fees charged per occurrence, an increase in account analysis fees, an increase in non-customer ATM fees, and a reduction in fees waived from deposit accounts. The increase in service charges on deposit accounts in 2008 is primarily due to an increase in NSF fees charged per occurrence, an increase in account analysis fees, and increased volume.
The decrease in credit and debit card transaction fees in 2008 is primarily due to a decrease in credit card income due to the sale of the credit card portfolio in November 2007, partially offset by an increase in debit card interchange income primarily resulting from a general increase in debit card transaction volume.
The gain on investment securities in 2009 is due to an increase in sales of investment securities during the period. Certain securities were sold at a gain as part of our continued efforts to bolster capital by repositioning U.S. Agency securities into GNMA securities which are guaranteed by the U.S. government and therefore have a lower risk weighting for capital purposes. The 2008 loss on investment securities includes an other-than-temporary impairment charge of $948,000 on FHLMC preferred stock acquired as part of the acquisition of Front Range Capital in March 2007, partially offset by gains from calls and sales of securities.
The decrease in gain on sale of loans in 2008 is primarily due to reduced volumes reflecting the nationwide slow down in the residential mortgage market.
The 2009 gain on sale of our Colorado branches is from the sale transaction completed in June 2009.
The decrease in other non-interest income in 2009 is due to several items including a decrease in check imprint income, a decrease in official check outsourcing fee income as official check processing was brought in-house in the fourth quarter of 2008, a decrease attributable to the redemption of VISA stock that occurred in the first quarter of 2008, a decrease in rental income related to the sale of our Colorado branches in June 2009, and a decrease in bank-owned life insurance income. In September 2009, we surrendered bank-owned life insurance policies with a current value of approximately $36 million for liquidity and risk-based capital purposes. The surrenders resulted in a tax penalty of approximately $896,000 which is included in other non-interest expense. The decrease in other non-interest income in 2008 is primarily due to the receipt of approximately $550,000 in June 2007 from the death benefit of an insured employee, a decrease in official check outsourcing fee income due to a change in vendor pricing that occurred in 2008 and a gain on the sale of MasterCard stock that did not recur in 2008, partially offset by earnings on an additional $8.8 million in cash surrender value of bank-owned life insurance acquired in conjunction with the Front Range acquisition on March 1, 2007, the amortization of the gain on the sale of the credit card portfolio which occurred in November 2007 and the gain on sale of a building.
A-13
Table of Contents
Non-interest Expense
An analysis of the components of non-interest expense is presented in the table below:
| Years ended December 31, | $ Change | % Change | |||||||||||||||||||||
| 2009 | 2008 | 2007 | 2009-2008 | 2008-2007 | 2009-2008 | 2008-2007 | |||||||||||||||||
| (Dollars in thousands) | |||||||||||||||||||||||
| Salaries and employee benefits |
$ | 42,197 | $ | 51,204 | $ | 50,590 | $ | (9,007 | ) | $ | 614 | (18 | )% | 1 | % | ||||||||
| Occupancy |
13,554 | 16,523 | 14,838 | (2,969 | ) | 1,685 | (18 | ) | 11 | ||||||||||||||
| Data processing |
5,541 | 5,714 | 6,553 | (173 | ) | (839 | ) | (3 | ) | (13 | ) | ||||||||||||
| Equipment |
6,070 | 7,892 | 8,234 | (1,822 | ) | (342 | ) | (23 | ) | (4 | ) | ||||||||||||
| Legal, accounting, and consulting |
6,611 | 2,849 | 2,747 | 3,762 | 102 | 132 | 4 | ||||||||||||||||
| Marketing |
2,418 | 3,856 | 3,364 | (1,438 | ) | 492 | (37 | ) | 15 | ||||||||||||||
| Telephone |
1,567 | 1,891 | 2,391 | (324 | ) | (500 | ) | (17 | ) | (21 | ) | ||||||||||||
| Other real estate owned |
10,330 | 3,194 | 2,357 | 7,136 | 837 | 223 | 36 | ||||||||||||||||
| FDIC insurance premiums |
8,998 | 2,325 | 1,053 | 6,673 | 1,272 | 287 | 121 | ||||||||||||||||
| Goodwill impairment |
— | 127,365 | — | (127,365 | ) | 127,365 | (100 | ) | — | ||||||||||||||
| Amortization of intangibles |
1,746 | 2,560 | 2,380 | (814 | ) | 180 | (32 | ) | 8 | ||||||||||||||
| Other |
13,127 | 13,181 | 15,010 | (54 | ) | (1,829 | ) | — | (12 | ) | |||||||||||||
| Total non-interest expense |
$ | 112,159 | $ | 238,554 | $ | 109,517 | $ | (126,395 | ) | $ | 129,037 | (53 | )% | 118 | % | ||||||||
The decrease in salaries and employee benefits in 2009 is primarily due to a decrease in headcount. At December 31, 2009, full time equivalent employees totaled 542 compared to 813 at December 31, 2008. The decrease is also due to a decrease in incentive bonus expense and a decrease in self-insured medical and dental claims, partially offset by separation pay associated with the sale of the Colorado branches and the closure of our Colorado mortgage division. The separation pay related to the Colorado branches and the Colorado Mortgage division totaled approximately $1.3 million. The increase in salaries and employee benefits in 2008 is primarily due to the Front Range acquisition which occurred on March 1, 2007, normal compensation increases for job performance, $355,000 of employee severance, and an increase in self-insured medical and dental claims, partially offset by a decrease in incentive compensation expense, mortgage commissions, stock compensation expense, retention and stay bonuses for Front Range employees that did not recur in 2008, and a reduction in expenses related to temporary help.
The decrease in occupancy in 2009 is primarily due to a decrease in building depreciation expense and leasehold amortization, and a decrease in rent and related expenses due to the sale of the Colorado branches and Colorado mortgage division closure, partially offset by approximately $511,000 of expense related to lease impairments. The increase in occupancy expense in 2008 reflects the full impact of the acquisition of Front Range on March 1, 2007, the lease of space and other occupancy costs in Ft. Collins for a new branch that opened in June 2007, the lease of space that began in April 2007 for a new branch location in Albuquerque that opened in the fourth quarter of 2007, the lease of space and other occupancy costs for two new branches in Phoenix that opened in the second quarter of 2007, and approximately $563,000 of expense related to lease impairments.
The decrease in data processing in 2008 is primarily due to expenses incurred in 2007 related to the Front Range system conversion that did not recur in 2008, a decrease in computer processing costs related to Front Range’s legacy system, and a reduction in credit card processing costs due to the sale of our credit card portfolio in November 2007.
The decrease in equipment in 2009 is primarily due to the decrease in equipment depreciation expense, primarily related to the Colorado branches that were sold in June 2009.
The increase in legal, accounting, and consulting expense in 2009 resulted from legal and investment banking fees incurred in connection with the sale of our Colorado branches of approximately $1.3 million, consulting costs of $1.8 million related to a staffing model and various revenue enhancement models that were prepared in connection with our continued efforts to control non-interest expenses and increase other non-interest income, and legal fees associated with higher levels of non-performing loans and our Regulator Agreement.
The decrease in marketing expenses in 2009 is primarily due to a decrease in controllable direct advertising costs. Marketing costs were higher in the 2008 period due to the Bank’s new ad campaign combined with costs associated with the introduction of the Bank’s new deposit products. The decrease in 2009 is also due to a decrease in contributions and sponsorships resulting from our expense reduction initiative. The increase in marketing expense in 2008 is primarily due to an increase in direct advertising costs related to the Bank’s new ad campaign combined with costs associated with the introduction of the Bank’s new deposit products.
A-14
Table of Contents
The decrease in telephone expense in 2008 is primarily due to savings associated with upgrading to Voice Over Internet Protocol technology, as well as savings associated with the conversion to new lines and circuits in the second and third quarters of 2008.
The increase in expenses for other real estate owned in 2009 and 2008 is primarily due to an increase in write-downs of properties to reflect further deterioration of fair values subsequent to foreclosure and an increase in other expenses related to the properties, both commensurate with the increase in number of properties.
The increase in FDIC insurance premiums in 2009 is due to new FDIC assessment rates that took effect on January 1, 2009, and the five basis point special assessment for $1.4 million that occurred in the second quarter of 2009. The increase in FDIC insurance premiums in 2008 is also due to higher assessment rates as well as an increase in deposits, particularly from acquisitions. This assessment system allowed eligible insured depository institutions to share a one-time assessment credit pool, which offset premiums for a period of time. First Community Bank’s share of the credit was used up in the third quarter of 2007. In addition, there was an additional rate increase in 2008.
The decrease in amortization of intangibles in 2009 is due to the sale of our Colorado branches in June 2009.
Other non-interest expense in 2009 includes the $896,000 tax penalty that resulted from the surrender of bank-owned life insurance policies in the third quarter of 2009. This amount was offset by a decrease in travel and entertainment resulting from our expense reduction initiative. The decrease in other non-interest expense in 2008 is primarily due to the net $449,000 loss on redemption of certain trust preferred securities and the $400,000 loss on disposal of fixed assets, both occurring in 2007 and not recurring in 2008. The decrease in other non-interest expenses is also due to a decrease in travel, meals, and entertainment, supplies expense and delivery expense resulting from our 2008 expense management initiative, and a decrease in expense related to our credit cards rewards program, due to the sale of the credit card portfolio in November 2007, partially offset by an increase in loan review fees. The loan review function was fully outsourced beginning in January 2008.
Income Tax Expense
Income tax benefit was $20.9 million in 2009 and $5.6 million in 2008. Income tax expense was $13.3 million in 2007, representing a 34.9% effective income tax rate. The income tax benefit for 2009 is due to the future recovery of previous taxes paid, resulting from recently enacted legislation allowing corporations the ability to carry-back 2008 or 2009 net operating losses five years. For 2010 and forward, net operating losses for federal tax purposes can be carried back two years and carried forward twenty years. The income tax benefit for 2008 resulted from the pre-tax loss and the impact of permanent non-deductible and non-taxable items, principally the non-deductible portion of the goodwill impairment charge, the impact of finalizing the 2007 tax return in September 2008, and the $29.0 million valuation allowance against deferred tax assets.
Return on Equity and Assets
The following table shows the return on average assets, return on average equity, dividend payout ratio, and ratio of average equity to average assets for the periods indicated.
| Years ended December 31, | |||||||||
| 2009 | 2008 | 2007 | |||||||
| Return on average assets |
(3.47 | )% | (4.44 | )% | 0.77 | % | |||
| Return on average equity |
(91.35 | ) | (60.28 | ) | 8.02 | ||||
| Dividend payout ratio |
— | (2.36 | ) | 28.87 | |||||
| Average equity to average assets |
3.79 | 7.36 | 9.55 | ||||||
A-15
Table of Contents
Financial Condition
Summary of Changes in Investments, Loans, Deposits, and Securities sold under agreements to repurchase, and Borrowings
The following table summarizes the change in our investment, loan, deposit, securities sold under agreements to repurchase and federal funds purchased, and borrowing balances compared to the previous year:
| As of December 31, | $ Change | % Change | |||||||||||||||||||||
| 2009 | 2008 | 2007 | 2009-2008 | 2008-2007 | 2009-2008 | 2008-2007 | |||||||||||||||||
| (Dollars in thousands) | |||||||||||||||||||||||
| Investments |
$ | 562,124 | $ | 488,996 | $ | 516,404 | $ | 73,128 | $ | (27,408 | ) | 15 | % | (5 | )% | ||||||||
| Total loans |
2,017,690 | 2,754,589 | 2,541,210 | (736,899 | ) | 213,379 | (27 | ) | 8 | ||||||||||||||
| Deposits |
2,034,328 | 2,522,542 | 2,574,687 | (488,214 | ) | (52,145 | ) | (19 | ) | (2 | ) | ||||||||||||
| Securities sold under agreements to repurchase |
40,646 | 112,276 | 213,270 | (71,630 | ) | (100,994 | ) | (64 | ) | (47 | ) | ||||||||||||
| Borrowings |
595,365 | 596,060 | 301,613 | (695 | ) | 294,447 | — | 98 | |||||||||||||||
The decrease in loans in 2009 was due to the transfer of approximately $387 million in loans, in conjunction with the sale of our Colorado branches in June 2009 and to normal loan amortization and repayments.
The lack of deposit growth, combined with the overall organic loan growth that we experienced in 2008 resulted in an increase in FHLB borrowings.
The 2009 and 2008 decrease in securities sold under agreements to repurchase was primarily due to a general decrease in net activity and a shift in depositors’ funds into higher rate deposit products including money market savings accounts and certificates of deposit offered through the CDARS network. During 2009, customers also shifted their deposits from securities sold under agreements to repurchase to non-interest and interest-bearing NOW accounts paying fifty basis points or less as these accounts offered full FDIC insurance for unlimited amounts through the Bank’s participation in the TAG Program.
The decrease in deposits in 2009 was primarily due to the transfer of approximately $512 million in deposits, in conjunction with the sale of our Colorado branches in June 2009. Deposits at December 31, 2009, 2008 and 2007, include approximately $145.0 million, $191.6 million, and $50.0 million in non-CDARS reciprocal brokered deposits, respectively. Deposits at December 31, 2009, 2008, and 2007 include approximately $56.7 million, $212.2 million, and $65.3 million in CDARS reciprocal deposits, respectively. CDARS reciprocal deposits represent customer funds, but are considered brokered deposits for regulatory purposes. Excluding the $145.0 million in non-CDARS reciprocal brokered deposits and excluding the transfer of approximately $512 million in deposits in conjunction with the sale of our Colorado branches in June 2009, deposits increased by approximately $71.0 million in 2009. Excluding the $191.6 million in non-CDARS reciprocal brokered deposits, deposits decreased by approximately $193.7 million in 2008. The 2008 decrease in deposits is due in part to current economic conditions and events surrounding the financial services industry, combined with difficulty in competing with other banks and financial service providers due to the current low rate environment. The Bank is currently prohibited, in accordance with the Regulator Agreement, from accepting any new brokered deposits, even if the Bank is considered well capitalized. In addition, because the Bank is considered “adequately capitalized” under regulatory guidelines, the Bank cannot accept, renew, or roll over brokered deposits except with a waiver from the FDIC. The Bank is not currently seeking a waiver from the FDIC.
Asset/Liability Management
Our results of operations depend substantially on our net interest income. Like most financial institutions, our interest income and cost of funds are affected by general economic conditions and by competition in the marketplace.
The purpose of asset/liability management is to provide stable net interest income growth by protecting our earnings from undue interest rate risk. Exposure to interest rate risk arises from volatile interest rates and changes in the balance sheet mix. Our policy is to maintain an asset/liability management policy that provides guidelines for controlling exposure to interest rate risk. Our policy is to control the exposure of our earnings to changing interest rates by generally maintaining a position within a narrow range around an “earnings neutral position,” which is defined as the mix of assets and liabilities that generates a net interest margin that is least affected by interest rate changes. Due to the amount and maturity schedule of our FHLB advances, we were liability sensitive for the period three months to one year. See the table below and further discussion below regarding the structure of our balance sheet.
The interest rate sensitivity (“GAP”) is defined as the difference between interest-earning assets and interest-bearing liabilities maturing or repricing within a given time period. A GAP is considered positive when the amount of interest rate sensitive assets exceeds the amount of interest rate sensitive liabilities. A GAP is considered negative when the amount of interest rate sensitive liabilities exceeds interest rate sensitive assets. During a period of rising interest rates, a negative GAP
A-16
Table of Contents
would tend to adversely affect net interest income, while a positive GAP would tend to result in an increase in net interest income. During a period of falling interest rates, a negative GAP would tend to result in an increase in net interest income, while a positive GAP would tend to affect net interest income adversely. While the interest rate sensitivity GAP is a useful measurement and contributes toward effective asset and liability management, it is difficult to predict the effect of changing interest rates solely on that measure. Because different types of assets and liabilities with the same or similar maturities may react differently to changes in overall market rates or conditions, changes in interest rates may affect net interest income positively or negatively even if an institution were perfectly matched in each maturity category.
To effectively measure and manage interest rate risk, we use GAP analysis and simulation analysis to determine the impact on net interest income under various interest rate scenarios, balance sheet trends, and strategies. From these analyses, interest rate risk is quantified and appropriate strategies are developed and implemented. Additionally, duration and market value sensitivity measures are utilized when they provide added value to the overall interest rate risk management process. The overall interest rate risk position and strategies are reviewed by management and the Bank’s Board of Directors on an ongoing basis.
As of December 31, 2009, our cumulative interest rate GAP for the period up to three months was a positive $255.3 million and for the period up to one year was a negative $160.7 million. Based solely on our interest rate GAP for the period up to three months, our net income would be favorably impacted by increases in interest rates or unfavorably impacted by decreases in interest rates. For the period three months to less than one year, our net income would be unfavorably impacted by increases in interest rates. However, the current rates on existing financial instruments including caps and floors as instruments reprice or the lack of ability to replace financial instruments at maturity such as brokered deposits, may cause fluctuations in the net interest margin inconsistent with general expectations based solely on the movement in interest rates. In addition, a large portion of interest-bearing liabilities include savings and NOW accounts, where rates are influenced more by competition in the marketplace versus changes in the interest rate environment. Repricing of these interest-bearing liabilities tends to lag behind changes in the overall interest rate environment and the magnitude of repricing is minimal in the current low rate environment.
During 2009, the structure of our balance sheet changed on both the asset side and the liability side. The asset changes were the result of our efforts to strengthen our on-balance sheet cash liquidity early in the year. Our management made a conscious decision to strengthen our liquidity position in early 2009, in order to provide additional operational stability, additional liquidity to support the pending sale of the Colorado branches if necessary, and to mitigate the continued uncertainty in the liquidity markets carried over from the 2008 collapse of the financial markets. In doing so, our management took steps to lengthen the maturities of the Company’s wholesale funding sources and secured other liquidity sources available to diversify the Company’s liquidity exposure. Management secured additional funding from the FHLB for terms ranging between six months and three years to stabilize the Company’s short-term liquidity position. In addition, the Company lengthened the average maturities of brokered deposits into the fifteen month to eighteen month time horizon. These efforts along with our loan repayments and core deposit growth have increased the level of low interest-bearing cash significantly compared to the prior year.
The further deterioration in our loan portfolio in 2009 has resulted in an increase in non-accrual loans from $114 million at the end of 2008 to $258 million at the end of 2009. This increase in non-accrual loans has resulted in an increase in our interest rate GAP for the period over five years as these loans have moved from shorter maturity or repricing periods and are no longer considered to be impacted by rate fluctuations.
The following table sets forth the estimated maturity or repricing and the resulting interest rate GAP of our interest-earning assets and interest-bearing liabilities at December 31, 2009. The amounts could be significantly affected by external factors such as changes in prepayment assumptions, early withdrawals of deposits, and competition.
A-17
Table of Contents
| Less than three months |
Three months to less than one year |
One to five years |
Over five years |
Total | |||||||||||||
| (Dollars in thousands) | |||||||||||||||||
| Interest-earning assets: |
|||||||||||||||||
| Investment securities |
$ | 38,843 | $ | 110,488 | $ | 255,529 | $ | 157,264 | $ | 562,124 | |||||||
| Interest-bearing deposits with other banks |
104,074 | 625 | 239 | — | 104,938 | ||||||||||||
| Federal funds sold |
144 | — | — | — | 144 | ||||||||||||
| Loans held for investment: |
|||||||||||||||||
| Commercial |
131,860 | 56,513 | 51,903 | 19,077 | 259,353 | ||||||||||||
| Real estate |
635,098 | 208,762 | 557,308 | 314,795 | 1,715,963 | ||||||||||||
| Consumer |
9,359 | 5,362 | 10,286 | 3,195 | 28,202 | ||||||||||||
| Total loans held for investment |
776,317 | 270,637 | 619,497 | 337,067 | 2,003,518 | ||||||||||||
| Mortgage loans available for sale |
14,172 | — | — | — | 14,172 | ||||||||||||
| Total interest-earning assets |
933,550 | 381,750 | 875,265 | 494,331 | 2,684,896 | ||||||||||||
| Interest-bearing liabilities: |
|||||||||||||||||
| Deposits: |
|||||||||||||||||
| Savings and NOW accounts |
164,664 | 202,824 | 367,481 | 88,346 | 823,315 | ||||||||||||
| Certificates of deposit of $100,000 or more |
107,022 | 213,792 | 104,028 | 897 | 425,739 | ||||||||||||
| CDARS reciprocal deposits |
33,606 | 21,339 | 1,796 | — | 56,741 | ||||||||||||
| Brokered deposits |
9,909 | 105,068 | 30,000 | — | 144,977 | ||||||||||||
| Certificates of deposit of $100,000 or less |
53,055 | 122,754 | 56,447 | 596 | 232,852 | ||||||||||||
| Securities sold under agreements to repurchase |
40,646 | — | — | — | 40,646 | ||||||||||||
| FHLB advances and other |
180,660 | 132,038 | 184,348 | — | 497,046 | ||||||||||||
| Junior subordinated debentures |
88,663 | — | 9,656 | — | 98,319 | ||||||||||||
| Total interest-bearing liabilities |
678,225 | 797,815 | 753,756 | 89,839 | 2,319,635 | ||||||||||||
| Interest rate GAP |
$ | 255,325 | $ | (416,065 | ) | $ | 121,509 | $ | 404,492 | $ | 365,261 | ||||||
| Cumulative interest rate GAP at December 31, 2009 |
$ | 255,325 | $ | (160,740 | ) | $ | (39,231 | ) | $ | 365,261 | |||||||
| Cumulative GAP ratio at December 31, 2009 |
1.38 | 0.89 | 0.98 | 1.16 | |||||||||||||
The following table presents an analysis of the sensitivity inherent in our net interest income and market value of portfolio equity (market value of assets, less the market value of liabilities). The interest rate scenarios presented in the table include interest rates at December 31, 2009, and as adjusted by instantaneous parallel rate changes upward of up to 200 basis points and downward of up to 25 basis points. The likelihood of a decrease in interest rates beyond 25 basis points as of December 31, 2009, was considered to be remote given current interest rate levels. Each rate scenario reflects unique prepayment and repricing assumptions.
Since there are limitations inherent in any methodology used to estimate the exposure to changes in market interest rates, this analysis is not intended to be a forecast of the actual effect of a change in market interest rates. This analysis is based on the earlier of repricing or contractual final maturity of our assets and liabilities at December 31, 2009.
| Change in Interest Rates |
Net Interest Income |
Market Value of Portfolio Equity | ||
| +200 |
6% | (12)% | ||
| +100 |
4% | (2)% | ||
| 0 |
1% | -% | ||
| (25) |
-% | 1% |
Investment Portfolio
The following table provides the carrying value of our investment portfolio at each of the dates indicated. At December 31, 2009 and 2008, the carrying value exceeded the market value by approximately $874,000 and $1.5 million, respectively. We do not own a 10 percent or greater position in any single issuer. We have no investments in securities that are backed by sub-prime mortgages.
| As of December 31, | |||||||||
| 2009 | 2008 | 2007 | |||||||
| (Dollars in thousands) | |||||||||
| U.S. Treasury securities |
$ | — | $ | 997 | $ | 990 | |||
| U.S. government agency securities |
5,455 | 27,739 | 201,989 | ||||||
| Mortgage-backed securities: |
|||||||||
| Pass-through certificates |
120,229 | 177,360 | 114,746 | ||||||
| Collateralized mortgage obligations |
317,446 | 154,694 | 109,787 | ||||||
| Obligations of states and political subdivisions |
88,905 | 95,881 | 69,794 | ||||||
| Other securities |
30,089 | 32,325 | 19,098 | ||||||
| Total investment securities |
$ | 562,124 | $ | 488,996 | $ | 516,404 | |||
A-18
Table of Contents
The table below provides the carrying values, maturities, and weighted average yields of our investment portfolio as of December 31, 2009.
| Carrying Value |
Average maturity (years) |
Weighted average yields |
||||||
| (Dollars in thousands) | ||||||||
| U.S. Treasury securities: |
||||||||
| One year or less |
$ | — | — | — | % | |||
| U.S. government agency securities: |
||||||||
| One year or less |
5,455 | 5.02 | 2.47 | |||||
| Mortgage-backed securities: |
||||||||
| One year or less |
— | — | ||||||
| After one through five years |
8,989 | 3.29 | 3.98 | |||||
| After five through ten years |
35,775 | 8.73 | 2.98 | |||||
| After ten years |
75,465 | 17.00 | 3.66 | |||||
| Total mortgage-backed securities obligations (a) |
120,229 | 13.51 | 3.48 | |||||
| Collateralized mortgage obligations: |
||||||||
| After one through five years |
255 | 4.50 | 1.36 | |||||
| After five through ten years |
3,779 | 5.28 | 2.24 | |||||
| After ten years |
313,412 | 24.38 | 2.87 | |||||
| Total collateralized mortgage obligations (a) |
317,446 | 24.13 | 2.86 | |||||
| Obligations of states and political subdivisions: |
||||||||
| One year or less |
1,285 | 0.53 | 3.46 | |||||
| After one through five years |
6,745 | 3.11 | 3.41 | |||||
| After five through ten years |
31,441 | 7.73 | 3.86 | |||||
| After ten years |
49,434 | 17.50 | 2.53 | |||||
| Total states and political subdivisions securities |
88,905 | 12.71 | 3.08 | |||||
| Other securities |
30,089 | — | 0.72 | |||||
| Total investment securities |
$ | 562,124 | 18.58 | 2.91 | % | |||
| (a) | Substantially all of our mortgage-backed securities are due in 10 years or more based on contractual maturity. The estimated weighted average life, which reflects anticipated future prepayments, is approximately 3 years for pass-through certificates and 2 years for collateralized mortgage obligations. |
The yields shown above have not been computed on a tax equivalent basis for tax-exempt obligations.
Loan Portfolio
The following table presents the amount of our loans, by category, at the dates indicated.
| As of December 31, | ||||||||||||||||||||||||||||||
| 2009 | 2008 | 2007 | 2006 | 2005 | ||||||||||||||||||||||||||
| Amount | Percent | Amount | Percent | Amount | Percent | Amount | Percent | Amount | Percent | |||||||||||||||||||||
| (Dollars in thousands) | ||||||||||||||||||||||||||||||
| Commercial |
$ | 259,353 | 12.8 | % | $ | 356,769 | 13.0 | % | $ | 342,141 | 13.5 | % | $ | 295,566 | 14.5 | % | $ | 201,816 | 13.2 | % | ||||||||||
| Real estate—commercial |
883,598 | 43.8 | 1,172,952 | 42.6 | 967,322 | 38.1 | 714,086 | 35.0 | 653,566 | 42.8 | ||||||||||||||||||||
| Real estate—one to four family |
187,085 | 9.3 | 270,613 | 9.8 | 235,015 | 9.2 | 217,247 | 10.6 | 170,158 | 11.2 | ||||||||||||||||||||
| Real estate—construction |
645,280 | 32.0 | 896,117 | 32.5 | 928,582 | 36.5 | 733,333 | 35.9 | 453,567 | 29.8 | ||||||||||||||||||||
| Consumer and other |
28,202 | 1.4 | 41,474 | 1.5 | 47,372 | 1.9 | 55,647 | 2.7 | 27,888 | 1.8 | ||||||||||||||||||||
| Mortgage loans available for sale |
14,172 | 0.7 | 16,664 | 0.6 | 20,778 | 0.8 | 25,728 | 1.3 | 18,932 | 1.2 | ||||||||||||||||||||
| Total loans |
$ | 2,017,690 | 100.0 | % | $ | 2,754,589 | 100.0 | % | $ | 2,541,210 | 100.0 | % | $ | 2,041,607 | 100.0 | % | $ | 1,525,927 | 100.0 | % | ||||||||||
Total loans decreased by $736.9 million at December 31, 2009, compared to December 31, 2008, due to the transfer of approximately $387 million in loans, in conjunction with the sale of our Colorado branches in June 2009 and to normal loan amortization and repayments. Total loans increased by $213.4 million at December 31, 2008, compared to December 31, 2007. However, during the second half of 2008, the Bank significantly altered its loan growth strategy, and loan totals were basically flat in the second half of 2008.
In connection with the acquisition of Front Range on March 1, 2007, we acquired approximately $296 million in total loans. In the acquisition accounting, we identified certain of these loans to be sold, which were ultimately written down to their estimated net realizable value of approximately $35.5 million when the sale was completed in the third quarter of 2007. There was no gain or loss associated with the sale of the loans.
In the fourth quarter of 2007, we completed the sale of our credit card portfolio to an independent third party. The Company operates as an agent under a five year agreement. The credit card portfolio, with a balance of approximately $8.2 million on the closing date, was sold at a premium of 31% or approximately $2.5 million. The gain on the sale was deferred and will be recognized ratably over the period of the revenue sharing agreement of 60 months.
A-19
Table of Contents
The following table presents the aggregate maturities of loans held for investment in each major category of our loans held for investment portfolio at December 31, 2009. Actual maturities may differ from the contractual maturities shown as a result of renewals and prepayments.
| Less than one year |
One to five years |
Over five years |
Total | |||||||||
| (Dollars in thousands) | ||||||||||||
| Fixed-rate loans: |
||||||||||||
| Commercial |
$ | 49,255 | $ | 25,607 | $ | 4,469 | $ | 79,331 | ||||
| Real estate |
115,294 | 138,896 | 111,883 | 366,073 | ||||||||
| Consumer |
7,442 | 10,286 | 3,109 | 20,837 | ||||||||
| Total fixed-rate loans |
171,991 | 174,789 | 119,461 | 466,241 | ||||||||
| Variable-rate loans: |
||||||||||||
| Commercial |
139,118 | 26,296 | 14,608 | 180,022 | ||||||||
| Real estate |
728,566 | 418,412 | 202,912 | 1,349,890 | ||||||||
| Consumer |
7,279 | — | 86 | 7,365 | ||||||||
| Total variable-rate loans |
874,963 | 444,708 | 217,606 | 1,537,277 | ||||||||
| Total loans held for investment |
$ | 1,046,954 | $ | 619,497 | $ | 337,067 | $ | 2,003,518 | ||||
Non-performing Assets
Non-performing assets consist of loans past due 90 days or more, non-accrual loans, restructured loans, other real estate owned, and non-accrual investment securities. We generally place a loan on non-accrual status and cease accruing interest when loan payment performance is deemed unsatisfactory or we become aware that adverse factors have occurred that create substantial doubt about the collectability of the loan. All loans past due 90 days, however, are placed on non-accrual status, unless the loan is both well collateralized and in the process of collection. Cash payments received, while a loan is classified as non-accrual, are recorded as a reduction of principal as long as doubt exists as to collection. During 2009, we continued to experience increases in both non-performing assets and potential problem loans, largely due to problem loans in our residential construction and lot development portfolios. National economic trends and conditions continue to show signs of weakness, evidenced by continued excess levels of lot inventory, instability in the credit markets, and higher default rates seen on a nationwide basis. High foreclosure rates as well as excess inventory levels continue to negatively affect the construction industry, sub-contractors for the construction industry, and acquisition and development sectors of our market, with lot inventory in Colorado, Utah, Arizona, and New Mexico at high levels. These factors have contributed to the increase in our allowance for loan losses as well as an increase in expenses related to other real estate owned. Non-performing loans increased by $139.4 million during 2009, including increases of $45.3 million and $47.7 million in the first and second quarters, respectively, while the increase for the third and fourth quarters was $17.3 million and $29.1 million, respectively. Potential problem loans increased by $42.1 million from December 31, 2008; however, for the quarters ended September 30, 2009 and December 31, 2009, they declined by $53.1 million and $32.8 million, respectively. Our loan portfolio remains heavily concentrated in real estate at approximately 86%. Our market exposure in the real estate-construction industry at December 31, 2009, was approximately $645.3 million. Approximately 38% of these loans are related to residential construction and approximately 62% are for commercial purposes or vacant land. Approximately 54% of our real estate-construction loans are in New Mexico, approximately 22% are in Colorado, approximately 19% are in Utah, and approximately 5% are in Arizona. Approximately 35% of our non-performing loans are in New Mexico, approximately 24% are in Colorado, approximately 27% are in Utah, and approximately 14% are in Arizona. Given current economic conditions and trends, we may continue to experience asset quality deterioration and high levels of non-performing loans, which would result in negative earnings and financial condition and capital pressures.
Management monitors the performance and value of any collateral securing non-performing loans monthly, and in cases where the loan balance exceeds the estimated fair value of collateral, a specific portion of the allowance for loan losses is allocated to these loans. In instances where repayment is solely dependent on the sale of the collateral, the amount of the impairment is charged-off.
Other real estate owned at the end of 2009 includes $41.9 million in foreclosed or repossessed assets, and $4.6 million in facilities and vacant land listed for sale. Of the $41.9 million in foreclosed or repossessed assets, $32.3 were real estate – construction loans, $1.8 million were real estate – one to four family loans, and $7.8 million were real estate – commercial loans. Of the $32.3 million that were real estate – construction loans, $18.7 million were for residential construction and $13.6 million were for commercial purposes or vacant land.
Potential problem assets are defined as loans presently accruing interest, and not contractually past due 90 days or more and not restructured, but about which management has doubt as to the future ability of the borrower to comply with present repayment terms, which may result in the reporting of the loans as non-performing assets in the future.
A-20
Table of Contents
In the third quarter of 2007, we completed the sale of certain loans acquired in the Front Range transaction. These loans had a carrying value of approximately $35.5 million. The loans that were sold included non-accrual loans with an estimated net realizable value of approximately $13.9 million and potential problem loans with an estimated net realizable value of approximately $8.3 million.
The following table sets forth information with respect to these assets at the dates indicated.
| As of December 31, | ||||||||||||||||||||
| 2009 | 2008 | 2007 | 2006 | 2005 | ||||||||||||||||
| (Dollars in thousands) | ||||||||||||||||||||
| Loans past due 90 days or more |
$ | — | $ | 4,139 | $ | 2 | $ | 75 | $ | 21 | ||||||||||
| Non-accrual loans |
257,689 | 114,138 | 30,736 | 13,851 | 6,698 | |||||||||||||||
| Total non-performing loans |
257,689 | 118,277 | 30,738 | 13,926 | 6,719 | |||||||||||||||
| Other real estate owned |
46,503 | 18,894 | 18,107 | 6,396 | 778 | |||||||||||||||
| Non-accrual investment securities |
18,775 | — | — | — | — | |||||||||||||||
| Total non-performing assets |
$ | 322,967 | $ | 137,171 | $ | 48,845 | $ | 20,322 | $ | 7,497 | ||||||||||
| Allowance for loan losses |
$ | 129,222 | $ | 79,707 | $ | 31,712 | $ | 23,125 | $ | 17,413 | ||||||||||
| Potential problem assets |
$ | 173,003 | $ | 130,884 | $ | 63,961 | $ | 35,916 | $ | 17,684 | ||||||||||
| Ratio of total non-performing assets to total assets |
11.77 | % | 4.02 | % | 1.43 | % | 0.73 | % | 0.35 | % | ||||||||||
| Ratio of total non-performing loans to total loans |
12.77 | % | 4.29 | % | 1.21 | % | 0.68 | % | 0.44 | % | ||||||||||
| Ratio of allowance for loan losses to total non-performing Loans |
50.15 | % | 67.39 | % | 103.17 | % | 166.06 | % | 259.16 | % | ||||||||||
The carrying value of impaired loans was approximately $257.7 million at December 31, 2009, $114.1 million at December 31, 2008, and $30.7 million at December 31, 2007. The average investment in non-accrual loans was approximately $204.8 million in 2009, $76.0 million in 2008, and $25.9 million in 2007. The allowance recorded on these loans was approximately $24.5 million, $16.7 million and $5.7 at December 31, 2009, 2008 and 2007, respectively. If interest on the non-accrual loans had been accrued, such income would have been approximately $11.7 million in 2009, $5.3 million in 2008, and $1.5 million in 2007. Interest income recognized on the non-accrual loans was insignificant in 2009, 2008, and 2007.
The $257.7 million of impaired loans includes $73.4 million of loans that are net of $43.6 million of partial charge-offs.
The $18.8 million of non-accrual investment securities represent the par value of two municipal bond agreements that allow the districts to defer interest in the case where available funds from development of the district are not sufficient to cover the debt service. Due to the status of the developments and related uncertainty of the cash flows, we reversed the accrued interest on these bonds through a charge to earnings.
Analysis of the Allowance for Loan Losses
Management uses a systematic methodology, which is applied monthly, to evaluate the amount of allowance for loan losses and the resultant provisions for loan losses it considers adequate to provide for probable inherent losses in the portfolio. This estimate is subject to a greater degree of uncertainty as a result of current economic conditions. As future events and their effects cannot be determined with precision, actual results could differ significantly from the estimate.
The methodology includes the following elements:
| • | A periodic detailed analysis of the loan portfolio |
| • | A systematic loan grading system |
| • | A periodic review of the summary of the allowance for loan loss balance |
| • | Identification of loans to be evaluated on an individual basis for impairment under SFAS 114 |
| • | Consideration of internal factors such as our size, organizational structure, loan portfolio structure, loan administration procedures, past due and delinquency trends, and loss experience |
| • | Consideration of risks inherent in different kinds of lending |
| • | Consideration of external factors such as local, regional, and national economic factors |
| • | An overall evaluation of the quality of the underlying collateral, and holding and disposition costs |
A-21
Table of Contents
The following table sets forth information regarding changes in our allowance for loan losses for the periods indicated.
| Years ended December 31, | ||||||||||||||||||||
| 2009 | 2008 | 2007 | 2006 | 2005 | ||||||||||||||||
| (Dollars in thousands) | ||||||||||||||||||||
| Allowance for loan losses, beginning of period |
$ | 79,707 | $ | 31,712 | $ | 23,125 | $ | 17,413 | $ | 15,331 | ||||||||||
| Charge-offs: |
||||||||||||||||||||
| Commercial and other |
7,170 | 5,604 | 2,208 | 945 | 798 | |||||||||||||||
| Real estate loans |
99,142 | 18,674 | 2,047 | 2,259 | 1,000 | |||||||||||||||
| Consumer loans |
1,194 | 1,309 | 1,128 | 573 | 468 | |||||||||||||||
| Credit cards |
— | — | 157 | 134 | 107 | |||||||||||||||
| Total charge-offs |
107,506 | 25,587 | 5,540 | 3,911 | 2,373 | |||||||||||||||
| Recoveries: |
||||||||||||||||||||
| Commercial and other |
339 | 463 | 304 | 65 | 134 | |||||||||||||||
| Real estate loans |
1,654 | 1,186 | 150 | 287 | 240 | |||||||||||||||
| Consumer loans |
175 | 305 | 381 | 110 | 136 | |||||||||||||||
| Credit cards |
— | 10 | 67 | 40 | 25 | |||||||||||||||
| Total recoveries |
2,168 | 1,964 | 902 | 502 | 535 | |||||||||||||||
| Net charge-offs |
105,338 | 23,623 | 4,638 | 3,409 | 1,838 | |||||||||||||||
| Provision for loan losses |
162,600 | 71,618 | 10,267 | 6,993 | 3,920 | |||||||||||||||
| Allowance related to acquired loans |
(7,747 | ) | — | 2,958 | 2,128 | — | ||||||||||||||
| Allowance for loan losses, end of period |
$ | 129,222 | $ | 79,707 | $ | 31,712 | $ | 23,125 | $ | 17,413 | ||||||||||
| As a percentage of average total loans: |
||||||||||||||||||||
| Net charge-offs |
4.36 | % | 0.88 | % | 0.19 | % | 0.18 | % | 0.12 | % | ||||||||||
| Provision for loan losses |
6.72 | 2.67 | 0.43 | 0.37 | 0.27 | |||||||||||||||
| Allowance for loan losses |
5.34 | 2.97 | 1.32 | 1.21 | 1.18 | |||||||||||||||
| As a percentage of total loans held for investment at year-end: |
||||||||||||||||||||
| Allowance for loan losses |
6.45 | 2.91 | 1.26 | 1.15 | 1.16 | |||||||||||||||
| As a multiple of net charge-offs: |
||||||||||||||||||||
| Allowance for loan losses |
1.23 | 3.37 | 6.84 | 6.78 | 9.47 | |||||||||||||||
| Income (loss) before income taxes and provision for loan losses |
0.30 | (3.71 | ) | 10.43 | 12.40 | 20.19 | ||||||||||||||
Specific allowances are provided for individual loans where ultimate collection is considered questionable by management after reviewing the current status of loans that are contractually past due and considering the net realizable value of the security and of the loan guarantees, if applicable.
The subjective portion of the allowance for loan losses, which is judgmentally determined, is maintained to recognize the imprecision in estimating and measuring loss when evaluating reserves for individual loans or pools of loans. In calculating the subjective portion of the allowance for loan loss, we consider levels and trends in delinquencies, charge-offs and recoveries, changes in underwriting and policies, trends in volume and terms of loans, the quality of lending management and staff, national and local economic conditions, industry conditions, changes in credit concentrations, independent loan review results, and overall problem loan levels. The subjective factor for levels and trends in delinquencies is applied to all non-impaired delinquent loans and the subjective factor for levels and trends in charge-offs and recoveries is applied to all non-impaired classified loans. Subjective factors related to trends in volume and terms of loans, national and local economic trends, and industry conditions are applied to all non-impaired loans. Subjective factors related to changes in credit concentrations are applied to all non-impaired loans above an $8 million relationship level and changes in underwriting and policies are applied to all non-impaired loans below an $8 million relationship level. The subjective factor related to the quality of lending management and staff is applied to all non-impaired Colorado and Utah loans. The subjective factors for overall problem loan levels and independent loan review results are applied to all classified and special mention loans that are not impaired.
Our loan portfolio is currently concentrated in New Mexico, Colorado, Utah, and Arizona. A significant portion of our loan portfolio is secured by real estate in those communities. Accordingly, the ultimate collectability of our loan portfolio is dependent upon the economy and real estate values in those markets.
The table below provides an allocation of the year-end allowance by loan type, based upon management’s assessment of the risk associated with these categories at the dates indicated, and summarizes the percentage of loans in each category as a percentage of total loans. The allocation of a portion of the allowance to one category of loans does not preclude its availability to absorb losses in other categories. The allowance is utilized as a single unallocated allowance available for all loans. The allocation table is meant, combined with other provided information, to serve as a useful device for assessing the adequacy of the
A-22
Table of Contents
allowance as a whole. The allowance includes reserves of $104.7 million under ASC Topic 450, “Contingencies,” and specific reserves under ASC Topic 310 “Receivables” of $24.5 million. The ASC Topic 450 portion includes reserves of $50.4 million based on historical loss experience factors allocated to various categories of loans (such as real estate loans, commercial loans, consumer loans and other) by loan grade. The remaining ASC Topic 450 portion of $54.3 million is based on various subjective considerations discussed above. The ASC Topic 310 specific reserves are recognized on impaired loans.
| As of December 31, | ||||||||||||||||||||||||||||||
| 2009 | 2008 | 2007 | 2006 | 2005 | ||||||||||||||||||||||||||
| (Dollars in thousands) | ||||||||||||||||||||||||||||||
| Amount of allowance |
Percent of loans to total loans |
Amount of allowance |
Percent of loans to total loans |
Amount of allowance |
Percent of loans to total loans |
Amount of allowance |
Percent of loans to total loans |
Amount of allowance |
Percent of loans to total loans |
|||||||||||||||||||||
| Commercial and other |
$ | 8,045 | 12.79 | % | $ | 6,322 | 12.95 | % | $ | 4,464 | 13.46 | % | $ | 2,570 | 14.47 | % | $ | 1,770 | 13.22 | % | ||||||||||
| Real estate |
66,047 | 85.83 | 29,062 | 85.54 | 13,451 | 84.68 | 10,427 | 82.80 | 7,524 | 84.95 | ||||||||||||||||||||
| Consumer |
785 | 1.38 | 1,179 | 1.51 | 1,396 | 1.86 | 1,425 | 2.73 | 782 | 1.83 | ||||||||||||||||||||
| Subjective portion |
54,345 | — | 43,144 | — | 12,401 | — | 8,703 | — | 7,337 | — | ||||||||||||||||||||
| Total allowance for loan losses |
$ | 129,222 | 100.00 | % | $ | 79,707 | 100.00 | % | $ | 31,712 | 100.00 | % | $ | 23,125 | 100.00 | % | $ | 17,413 | 100.00 | % | ||||||||||
The provision for loan losses increased to $162.6 million in 2009, from $71.6 million in 2008, and $10.3 million in 2007. The provision in each year was based on management’s judgment concerning the amount of allowance for loan losses necessary after its review of various factors, which we believe affect the credit quality of the loan portfolio. The increase in the provision for loan losses in 2009 and 2008 is primarily a result of an increase in net charge-offs and an increase in non-performing loans. Management intends to continue, based on its best estimate of the amount necessary, to provide for probable inherent losses in the portfolio, and considers, among other factors, trends in delinquencies, charge-off experience, and local and national economic conditions.
Deposits
The following table presents the average balances outstanding for each major category of our deposits and the weighted average interest rate paid for interest-bearing deposits for the periods indicated.
| Years ended December 31, | ||||||||||||||||||
| 2009 | 2008 | 2007 | ||||||||||||||||
| (Dollars in thousands) | ||||||||||||||||||
| Average Balance |
Weighted Average Interest Rate |
Average Balance |
Weighted Average Interest Rate |
Average Balance |
Weighted Average Interest Rate |
|||||||||||||
| Interest-bearing demand accounts |
$ | 325,350 | 0.62 | % | $ | 320,217 | 0.83 | % | $ | 334,962 | 1.12 | % | ||||||
| Certificates of deposit |
1,064,905 | 2.80 | 1,136,117 | 3.72 | 1,185,108 | 4.71 | ||||||||||||
| Money market savings accounts |
472,331 | 1.54 | 507,297 | 2.38 | 331,783 | 3.36 | ||||||||||||
| Regular savings accounts |
96,463 | 0.51 | 105,997 | 0.76 | 113,209 | 1.02 | ||||||||||||
| Total interest-bearing deposits |
1,959,049 | 2.02 | 2,069,628 | 2.79 | 1,965,062 | 3.66 | ||||||||||||
| Non-interest-bearing demand accounts |
438,054 | — | 476,029 | — | 470,063 | — | ||||||||||||
| Total deposits |
$ | 2,397,103 | 1.65 | % | $ | 2,545,657 | 2.27 | % | $ | 2,435,125 | 2.95 | % | ||||||
The following table shows the amount and maturity of certificates of deposit that had balances of $100,000 or more and the percentage of the total for each maturity.
| As of December 31, | ||||||||||||||||||
| 2009 | 2008 | 2007 | ||||||||||||||||
| (Dollars in thousands) | ||||||||||||||||||
| Three months or less |
$ | 140,628 | 29.15 | % | $ | 281,098 | 41.09 | % | $ | 483,731 | 60.57 | % | ||||||
| Four through six months |
111,874 | 23.19 | 159,150 | 23.26 | 109,758 | 13.74 | ||||||||||||
| Seven through twelve months |
123,257 | 25.54 | 156,553 | 22.89 | 101,955 | 12.77 | ||||||||||||
| Over twelve months |
106,721 | 22.12 | 87,274 | 12.76 | 103,184 | 12.92 | ||||||||||||
| Totals |
$ | 482,480 | 100.00 | % | $ | 684,075 | 100.00 | % | $ | 798,628 | 100.00 | % | ||||||
A-23
Table of Contents
Securities Sold Under Agreements to Repurchase
Securities sold under agreements to repurchase are summarized as follows:
| Years ended December 31, | ||||||||||||
| 2009 | 2008 | 2007 | ||||||||||
| (Dollars in thousands) | ||||||||||||
| Balance |
$ | 40,646 | $ | 112,276 | $ | 213,270 | ||||||
| Weighted average interest rate |
0.25 | % | 0.51 | % | 3.48 | % | ||||||
| Maximum amount outstanding at any month end |
$ | 131,618 | $ | 198,030 | $ | 213,270 | ||||||
| Average balance outstanding during the period |
$ | 61,291 | $ | 175,433 | $ | 194,633 | ||||||
| Weighted average interest rate during the period |
0.26 | % | 1.51 | % | 4.15 | % | ||||||
Short-term FHLB Advances
Short-term FHLB advances are summarized as follows:
| Years ended December 31, | ||||||||||||
| 2009 | 2008 | 2007 | ||||||||||
| (Dollars in thousands) | ||||||||||||
| Balance |
$ | 180,000 | $ | 428,000 | $ | 191,000 | ||||||
| Weighted average interest rate |
0.83 | % | 0.43 | % | 3.85 | % | ||||||
| Maximum amount outstanding at any month end |
$ | 298,900 | $ | 448,100 | $ | 239,400 | ||||||
| Average balance outstanding during the period |
$ | 187,418 | $ | 307,588 | $ | 176,110 | ||||||
| Weighted average interest rate during the period |
1.18 | % | 2.20 | % | 5.13 | % | ||||||
Contractual Obligations and Commercial Commitments
The following tables present contractual cash obligations, defined as principal of non-deposit obligations with maturities in excess of one year, and property and equipment operating lease obligations, and commercial commitments, defined as commitments to extend credit as of December 31, 2009. See Notes 9, 10, and 13 of Notes to the Consolidated Financial Statements.
| Payments Due by Period | |||||||||||||||
| Contractual Cash Obligations | Total | One Year and Less |
One to Three Years |
Four to Five Years |
After Five Years | ||||||||||
| (Dollars in thousands) | |||||||||||||||
| FHLB advances |
$ | 497,046 | $ | 312,698 | $ | 183,496 | $ | 852 | $ | — | |||||
| Operating leases |
26,479 | 5,432 | 8,300 | 5,725 | 7,022 | ||||||||||
| Junior subordinated debentures |
98,319 | — | — | — | 98,319 | ||||||||||
| Total contractual cash obligations |
$ | 621,844 | $ | 318,130 | $ | 191,796 | $ | 6,577 | $ | 105,341 | |||||
| Amount of Commitment Expiration Per Period | |||||||||||||||
| Commercial Commitments | Unfunded Commitments |
Less than One Year |
One to Three Years |
Four to Five Years |
After Five Years | ||||||||||
| (Dollars in thousands) | |||||||||||||||
| Lines of credit |
$ | 167,670 | $ | 127,889 | $ | 18,534 | $ | 5,340 | $ | 15,907 | |||||
| Standby letters of credit |
33,686 | 32,941 | 336 | — | 409 | ||||||||||
| Total commercial commitments |
$ | 201,356 | $ | 160,830 | $ | 18,870 | $ | 5,340 | $ | 16,316 | |||||
Impact of Inflation
The consolidated financial statements and related financial data and notes presented herein have been prepared in accordance with U.S. generally accepted accounting principles, which require the measurement of financial position and operating results in terms of historical dollars, without considering changes in the relative purchasing power of money over time due to inflation.
Unlike most industrial companies, virtually all of our assets and liabilities are monetary in nature. As a result, interest rates have a more significant impact on our performance than the effects of general price levels.
A-24
Table of Contents
MANAGEMENT’S REPORT ON INTERNAL CONTROL OVER FINANCIAL REPORTING
Management of First State Bancorporation (the “Company”) is responsible for establishing and maintaining adequate internal control over financial reporting as defined in Rules 13(a)-15(f) under the Securities Exchange Act of 1934. The Company’s internal control over financial reporting is a process designed under the supervision of the Company’s Chief Executive Officer and Chief Financial Officer to provide reasonable assurance to the Company’s management and board of directors regarding the reliability of financial reporting and the preparation of the Company’s financial statements for public disclosure in accordance with U.S. generally accepted accounting principles.
Because of its inherent limitations, internal control over financial reporting may not prevent or detect misstatements. Therefore, even those systems determined to be effective can provide only reasonable assurance with respect to financial statement preparation and presentation.
Management assessed the effectiveness of the Company’s internal control over financial reporting as of December 31, 2009. In making this assessment, management used the criteria set forth by the Committee of Sponsoring Organizations of the Treadway Commission (COSO) in Internal Control – Integrated Framework. Based on this assessment, management believes that, as of December 31, 2009, the Company’s internal control over financial reporting is effective.
This annual report does not include an attestation report of the Company’s registered public accounting firm regarding internal control over financial reporting. Management’s report was not subject to attestation by the Company’s registered public accounting firm pursuant to temporary rules of the Securities and Exchange Commission that permit the Company to provide only management’s report in this annual report.
| March 31, 2010 | /S/ H. PATRICK DEE | |||
| H. Patrick Dee | ||||
| President and Chief Executive Officer | ||||
| /S/ CHRISTOPHER C. SPENCER | ||||
| Christopher C. Spencer | ||||
| Chief Financial Officer |
A-25
Table of Contents
REPORT OF INDEPENDENT REGISTERED PUBLIC ACCOUNTING FIRM
The Board of Directors and Stockholders
First State Bancorporation:
We have audited the accompanying consolidated balance sheets of First State Bancorporation and subsidiary (the “Company”) as of December 31, 2009 and 2008, and the related consolidated statements of operations, stockholders’ equity and comprehensive income (loss), and cash flows for each of the years in the three-year period ended December 31, 2009. These consolidated financial statements are the responsibility of the Company’s management. Our responsibility is to express an opinion on these consolidated financial statements based on our audits.
We conducted our audits in accordance with the standards of the Public Company Accounting Oversight Board (United States). Those standards require that we plan and perform the audit to obtain reasonable assurance about whether the financial statements are free of material misstatement. An audit includes examining, on a test basis, evidence supporting the amounts and disclosures in the financial statements. An audit also includes assessing the accounting principles used and significant estimates made by management, as well as evaluating the overall financial statement presentation. We believe that our audits provide a reasonable basis for our opinion.
In our opinion, the consolidated financial statements referred to above present fairly, in all material respects, the financial position of First State Bancorporation and subsidiary as of December 31, 2009 and 2008, and the results of their operations and their cash flows for each of the years in the three-year period ended December 31, 2009, in conformity with U.S. generally accepted accounting principles.
The accompanying consolidated financial statements have been prepared assuming that the Company will continue as a going concern. As discussed in Note 1 to the consolidated financial statements, the Company and its subsidiary First Community Bank (the “Bank”) entered into a written agreement, dated July 2, 2009, with their primary banking regulators that among other things, restricts certain operations, and requires the Company and the Bank to maintain sufficient capital and to submit a capital plan. The capital plans for the Company and the Bank were not accepted by their primary banking regulators. Further declines in their capital ratios or failure to increase capital could expose the Company and the Bank to additional restrictions and regulatory actions, including being placed into a FDIC-administered receivership or conservatorship. This situation raises substantial doubt about the Company’s ability to continue as a going concern. Management’s plans regarding these matters are also described in Note 1. The consolidated financial statements do not include any adjustments that might result from the outcome of these uncertainties.
| KPMG LLP | ||||
| Albuquerque, New Mexico March 31, 2010 |
A-26
Table of Contents
FIRST STATE BANCORPORATION AND SUBSIDIARY
CONSOLIDATED BALANCE SHEETS
(Dollars in thousands, except share amounts)
| As of December 31, | ||||||||
| 2009 | 2008 | |||||||
| ASSETS | ||||||||
| Cash and due from banks (note 3) |
$ | 40,863 | $ | 64,891 | ||||
| Interest-bearing deposits with other banks |
104,938 | 1,593 | ||||||
| Federal funds sold |
144 | 96 | ||||||
| Total cash and cash equivalents |
145,945 | 66,580 | ||||||
| Investment securities (note 4): |
||||||||
| Available for sale (at market, amortized cost of $472,737 at December 31, 2009 and $387,713 at December 31, 2008) |
473,580 | 393,488 | ||||||
| Held to maturity (at amortized cost, market of $57,581 at December 31, 2009, and $61,700 at December 31, 2008) |
58,455 | 63,183 | ||||||
| Non-marketable securities, at cost |
30,089 | 32,325 | ||||||
| Total investment securities |
562,124 | 488,996 | ||||||
| Mortgage loans available for sale (note 5) |
14,172 | 16,664 | ||||||
| Loans held for investment, net of unearned interest (note 5) |
2,003,518 | 2,737,925 | ||||||
| Less allowance for loan losses (note 5) |
(129,222 | ) | (79,707 | ) | ||||
| Net loans |
1,888,468 | 2,674,882 | ||||||
| Premises and equipment (net of accumulated depreciation of $29,934 at December 31, 2009, and $31,965 at December 31, 2008) (note 6) |
34,583 | 59,669 | ||||||
| Accrued interest receivable |
8,106 | 12,437 | ||||||
| Other real estate owned |
46,503 | 18,894 | ||||||
| Intangible assets (net of accumulated amortization of $4,622 at December 31, 2009, and $6,603 at December 31, 2008) (note 7) |
5,402 | 15,529 | ||||||
| Cash surrender value of bank-owned life insurance |
11,001 | 45,304 | ||||||
| Net deferred tax asset (note 11) |
1,771 | 6,260 | ||||||
| Income tax receivable (note 11) |
28,084 | 6,431 | ||||||
| Other assets, net |
12,408 | 20,067 | ||||||
| Total assets |
$ | 2,744,395 | $ | 3,415,049 | ||||
| LIABILITIES AND STOCKHOLDERS’ EQUITY | ||||||||
| Liabilities: |
||||||||
| Deposits (note 8): |
||||||||
| Non-interest-bearing |
$ | 350,704 | $ | 453,319 | ||||
| Interest-bearing |
1,683,624 | 2,069,223 | ||||||
| Total deposits |
2,034,328 | 2,522,542 | ||||||
| Securities sold under agreements to repurchase (note 9) |
40,646 | 112,276 | ||||||
| Federal Home Loan Bank advances (note 9) |
497,046 | 497,594 | ||||||
| Junior subordinated debentures (note 10) |
98,319 | 98,466 | ||||||
| Other liabilities |
27,025 | 24,917 | ||||||
| Total liabilities |
2,697,364 | 3,255,795 | ||||||
| Stockholders’ equity (note 12): |
||||||||
| Preferred stock, no par value, 1,000,000 shares authorized, none issued or outstanding |
— | — | ||||||
| Common stock, no par value, authorized 50,000,000; issued 22,450,391 at December 31, 2009 and 22,025,214 at December 31, 2008; outstanding 20,729,049 at December 31, 2009 and 20,303,872 at December 31, 2008 |
223,928 | 222,921 | ||||||
| Treasury stock, at cost (1,721,342 shares at December 31, 2009 and December 31, 2008) |
(25,027 | ) | (25,027 | ) | ||||
| Retained deficit |
(152,713 | ) | (42,220 | ) | ||||
| Accumulated other comprehensive income– |
||||||||
| Unrealized gain on investment securities, net of tax (notes 4 and 11) |
843 | 3,580 | ||||||
| Total stockholders’ equity |
47,031 | 159,254 | ||||||
| Commitments and contingencies (note 13) |
||||||||
| Total liabilities and stockholders’ equity |
$ | 2,744,395 | $ | 3,415,049 | ||||
See accompanying notes to consolidated financial statements.
A-27
Table of Contents
FIRST STATE BANCORPORATION AND SUBSIDIARY
CONSOLIDATED STATEMENTS OF OPERATIONS
(Dollars in thousands, except per share amounts)
| Years ended December 31, | ||||||||||||
| 2009 | 2008 | 2007 | ||||||||||
| Interest income: |
||||||||||||
| Interest and fees on loans (note 5) |
$ | 122,559 | $ | 175,412 | $ | 206,292 | ||||||
| Interest on marketable securities (note 4): |
||||||||||||
| Taxable |
14,744 | 18,977 | 19,599 | |||||||||
| Non-taxable |
2,800 | 3,865 | 2,672 | |||||||||
| Federal funds sold |
12 | 80 | 471 | |||||||||
| Interest-bearing deposits with other banks |
353 | 81 | 198 | |||||||||
| Total interest income |
140,468 | 198,415 | 229,232 | |||||||||
| Interest expense: |
||||||||||||
| Deposits (note 8) |
39,616 | 57,748 | 71,843 | |||||||||
| Short-term borrowings (note 9) |
2,385 | 9,441 | 17,119 | |||||||||
| Long-term debt (note 9) |
7,549 | 1,811 | 828 | |||||||||
| Junior subordinated debentures (note 10) |
2,975 | 4,835 | 6,635 | |||||||||
| Total interest expense |
52,525 | 73,835 | 96,425 | |||||||||
| Net interest income |
87,943 | 124,580 | 132,807 | |||||||||
| Provision for loan losses (note 5) |
(162,600 | ) | (71,618 | ) | (10,267 | ) | ||||||
| Net interest (loss) income after provision for loan losses |
(74,657 | ) | 52,962 | 122,540 | ||||||||
| Non-interest income: |
||||||||||||
| Service charges on deposit accounts |
13,606 | 14,872 | 10,943 | |||||||||
| Credit and debit card transaction fees |
3,717 | 4,011 | 4,331 | |||||||||
| Gain (loss) on sale or call of investment securities (note 4) |
8,040 | (732 | ) | 39 | ||||||||
| Gain on sale of loans |
3,933 | 3,947 | 4,788 | |||||||||
| Gain on sale of Colorado branches |
23,292 | — | — | |||||||||
| Other |
2,868 | 4,240 | 4,995 | |||||||||
| Total non-interest income |
55,456 | 26,338 | 25,096 | |||||||||
| Non-interest expense: |
||||||||||||
| Salaries and employee benefits (notes 12 and 13) |
42,197 | 51,204 | 50,590 | |||||||||
| Occupancy |
13,554 | 16,523 | 14,838 | |||||||||
| Data processing |
5,541 | 5,714 | 6,553 | |||||||||
| Equipment |
6,070 | 7,892 | 8,234 | |||||||||
| Legal, accounting, and consulting |
6,611 | 2,849 | 2,747 | |||||||||
| Marketing |
2,418 | 3,856 | 3,364 | |||||||||
| Telephone expense |
1,567 | 1,891 | 2,391 | |||||||||
| Other real estate owned |
10,330 | 3,194 | 2,357 | |||||||||
| FDIC insurance premiums |
8,998 | 2,325 | 1,053 | |||||||||
| Goodwill impairment (note 7) |
— | 127,365 | — | |||||||||
| Amortization of intangibles |
1,746 | 2,560 | 2,380 | |||||||||
| Other |
13,127 | 13,181 | 15,010 | |||||||||
| Total non-interest expense |
112,159 | 238,554 | 109,517 | |||||||||
| Income (loss) before income taxes |
(131,360 | ) | (159,254 | ) | 38,119 | |||||||
| Income tax expense (benefit) (note 11) |
(20,867 | ) | (5,623 | ) | 13,312 | |||||||
| Net income (loss) |
$ | (110,493 | ) | $ | (153,631 | ) | $ | 24,807 | ||||
| Earnings per share (note 1): |
||||||||||||
| Basic earnings (loss) per share |
$ | (5.36 | ) | $ | (7.60 | ) | $ | 1.21 | ||||
| Diluted earnings (loss) per share |
$ | (5.36 | ) | $ | (7.60 | ) | $ | 1.20 | ||||
See accompanying notes to consolidated financial statements.
A-28
Table of Contents
FIRST STATE BANCORPORATION AND SUBSIDIARY
CONSOLIDATED STATEMENTS OF COMPREHENSIVE INCOME (LOSS)
(Dollars in thousands)
| Years ended December 31, | ||||||||||||
| 2009 | 2008 | 2007 | ||||||||||
| Net income (loss) |
$ | (110,493 | ) | $ | (153,631 | ) | $ | 24,807 | ||||
| Other comprehensive income, net of tax—unrealized holding gains on securities available for sale arising during period |
1,794 | 3,079 | 2,906 | |||||||||
| Change in valuation allowance on deferred tax assets resulting from changes in unrealized holding gains on securities |
333 | — | — | |||||||||
| Reclassification adjustment for losses (gains) included in net income |
(4,864 | ) | 454 | (25 | ) | |||||||
| Total comprehensive income (loss) |
$ | (113,230 | ) | $ | (150,098 | ) | $ | 27,688 | ||||
See accompanying notes to consolidated financial statements.
A-29
Table of Contents
FIRST STATE BANCORPORATION AND SUBSIDIARY
CONSOLIDATED STATEMENTS OF STOCKHOLDERS’ EQUITY
(Dollars in thousands, except share and per share amounts)
| Years ended December 31, 2009, 2008, and 2007 | ||||||||||||||||||||||||||
| Common Stock Shares |
Common Stock Amount |
Treasury Stock |
Retained Earnings (Deficit) |
Unearned Compensation |
Accumulated Other Comprehensive Income (Loss) |
Total Stockholders’ Equity |
||||||||||||||||||||
| Balance at December 31, 2006 |
20,777,056 | $ | 216,692 | $ | (6,360 | ) | $ | 97,394 | $ | — | $ | (2,834 | ) | $ | 304,892 | |||||||||||
| Net income |
— | — | — | 24,807 | — | — | 24,807 | |||||||||||||||||||
| Dividends ($0.35) per share |
— | — | — | (7,162 | ) | — | — | (7,162 | ) | |||||||||||||||||
| Common stock repurchase |
(902,700 | ) | — | (18,650 | ) | — | — | — | (18,650 | ) | ||||||||||||||||
| Common shares issued from exercise of options |
173,801 | 1,208 | — | — | — | — | 1,208 | |||||||||||||||||||
| Income tax benefit from exercise of options |
— | 963 | — | — | — | — | 963 | |||||||||||||||||||
| Common shares issued in employee benefit plan |
35,904 | 711 | — | — | — | — | 711 | |||||||||||||||||||
| Common shares issued pursuant to dividend reinvestment plan |
7,865 | 141 | — | — | — | — | 141 | |||||||||||||||||||
| Share-based compensation expense related to employee stock options and restricted stock awards |
— | 1,082 | — | — | — | — | 1,082 | |||||||||||||||||||
| Deferred compensation |
(633 | ) | — | (11 | ) | — | — | — | (11 | ) | ||||||||||||||||
| Net change in market value, net of tax |
— | — | — | — | — | 2,881 | 2,881 | |||||||||||||||||||
| Balance at December 31, 2007 |
20,091,293 | $ | 220,797 | $ | (25,021 | ) | $ | 115,039 | $ | — | $ | 47 | $ | 310,862 | ||||||||||||
| Net loss |
— | — | — | (153,631 | ) | — | — | (153,631 | ) | |||||||||||||||||
| Dividends ($0.18) per share |
— | — | — | (3,628 | ) | — | — | (3,628 | ) | |||||||||||||||||
| Common shares issued in employee benefit plan |
204,295 | 1,202 | — | — | — | — | 1,202 | |||||||||||||||||||
| Common shares issued pursuant to dividend reinvestment plan |
8,939 | 81 | — | — | — | — | 81 | |||||||||||||||||||
| Share-based compensation expense related to employee stock options and restricted stock awards |
— | 841 | — | — | — | — | 841 | |||||||||||||||||||
| Deferred compensation |
(655 | ) | — | (6 | ) | — | — | — | (6 | ) | ||||||||||||||||
| Net change in market value of investment securities, net of tax |
— | — | — | — | — | 3,533 | 3,533 | |||||||||||||||||||
| Balance at December 31, 2008 |
20,303,872 | $ | 222,921 | $ | (25,027 | ) | $ | (42,220 | ) | $ | — | $ | 3,580 | $ | 159,254 | |||||||||||
| Net loss |
— | — | — | (110,493 | ) | — | — | (110,493 | ) | |||||||||||||||||
| Common shares issued in employee benefit plan |
427,758 | 545 | — | — | — | — | 545 | |||||||||||||||||||
| Share-based compensation expense related to employee stock options and restricted stock awards |
(2,581 | ) | 592 | — | — | — | — | 592 | ||||||||||||||||||
| Change in deferred tax asset for vested expired stock options |
— | (130 | ) | — | — | — | — | (130 | ) | |||||||||||||||||
| Change in valuation allowance on deferred tax assets resulting from changes in unrealized holding gains on securities |
— | — | — | — | — | 333 | 333 | |||||||||||||||||||
| Net change in market value of investment securities, net of tax |
— | — | — | — | — | (3,070 | ) | (3,070 | ) | |||||||||||||||||
| Balance at December 31, 2009 |
20,729,049 | $ | 223,928 | $ | (25,027 | ) | $ | (152,713 | ) | $ | — | $ | 843 | $ | 47,031 | |||||||||||
See accompanying notes to consolidated financial statements.
A-30
Table of Contents
FIRST STATE BANCORPORATION AND SUBSIDIARY
CONSOLIDATED STATEMENTS OF CASH FLOWS
(Dollars in thousands)
| Years ended December 31, | ||||||||||||
| 2009 | 2008 | 2007 | ||||||||||
| Cash flows from operating activities: |
||||||||||||
| Net income (loss) |
$ | (110,493 | ) | $ | (153,631 | ) | $ | 24,807 | ||||
| Adjustments to reconcile net income (loss) to cash provided by operating activities: |
||||||||||||
| Provision for loan losses |
162,600 | 71,618 | 10,267 | |||||||||
| Depreciation and amortization |
6,683 | 8,789 | 8,724 | |||||||||
| Goodwill impairment charge |
— | 127,365 | — | |||||||||
| Provision for decline in value of other real estate owned |
7,343 | 1,496 | 995 | |||||||||
| Provision for decline in value of premises and equipment |
— | 365 | — | |||||||||
| Gain on sale of Colorado branches |
(23,292 | ) | — | — | ||||||||
| Increase in bank-owned life insurance cash surrender value |
(1,383 | ) | (1,805 | ) | (1,559 | ) | ||||||
| Amortization of securities, net |
3,308 | (889 | ) | (1,572 | ) | |||||||
| Amortization of core deposit intangible |
1,746 | 2,560 | 2,380 | |||||||||
| (Gain) loss on sale of investment securities available for sale |
(8,040 | ) | 732 | (39 | ) | |||||||
| Net loss on sale of other real estate owned |
480 | 298 | 223 | |||||||||
| Gain on sale of loans |
(3,933 | ) | (3,947 | ) | (4,788 | ) | ||||||
| (Gain) loss on disposal of fixed assets |
32 | (26 | ) | 392 | ||||||||
| Share-based compensation expense |
592 | 841 | 1,082 | |||||||||
| Mortgage loans originated for sale |
(287,476 | ) | (261,636 | ) | (339,993 | ) | ||||||
| Proceeds from sale of mortgage loans originated for sale |
293,901 | 264,796 | 344,091 | |||||||||
| Excess tax benefits from share-based compensation |
— | — | (963 | ) | ||||||||
| Decrease in accrued interest receivable |
3,241 | 3,324 | 658 | |||||||||
| Deferred income taxes |
4,359 | (6,650 | ) | 6,243 | ||||||||
| Change in income tax receivable |
(19,459 | ) | — | — | ||||||||
| Decrease (increase) in other assets, net |
6,380 | (4,140 | ) | (3,673 | ) | |||||||
| (Decrease) increase in other liabilities, net |
2,186 | 1,146 | (5,541 | ) | ||||||||
| Net cash provided by operating activities |
38,775 | 50,606 | 41,734 | |||||||||
| Cash flows from investing activities: |
||||||||||||
| Net decrease (increase) in loans |
192,645 | (248,450 | ) | (262,597 | ) | |||||||
| Purchases of investment securities carried at amortized cost |
(8,700 | ) | (56,515 | ) | (64,848 | ) | ||||||
| Maturities of investment securities carried at amortized cost |
13,432 | 97,194 | 23,752 | |||||||||
| Purchases of investment securities carried at market |
(517,232 | ) | (192,716 | ) | (104,693 | ) | ||||||
| Maturities of investment securities carried at market |
205,830 | 196,043 | 129,968 | |||||||||
| Sale of investment securities available for sale |
231,107 | 2,484 | 70,991 | |||||||||
| Purchases of non-marketable securities carried at cost |
(62 | ) | (14,298 | ) | (10,573 | ) | ||||||
| Redemption of non-marketable securities carried at cost |
2,298 | 1,071 | 10,558 | |||||||||
| Purchase of other investment |
— | — | (1,200 | ) | ||||||||
| Proceeds from the sale of loans |
— | — | 46,117 | |||||||||
| Purchases of premises and equipment |
(481 | ) | (2,749 | ) | (11,189 | ) | ||||||
| Surrender (purchase) of bank-owned life insurance |
35,686 | (500 | ) | 796 | ||||||||
| Bank-owned life insurance proceeds |
— | — | 570 | |||||||||
| Purchase of trust preferred capital securities |
— | — | (1,966 | ) | ||||||||
| Redemption of trust preferred capital securities |
— | — | 1,022 | |||||||||
| Proceeds from sale of and payments on other real estate owned |
13,657 | 10,517 | 8,997 | |||||||||
| Proceeds from the sale of fixed assets |
15 | 80 | 1,443 | |||||||||
| Net cash paid upon sale of Colorado branches |
(80,217 | ) | — | — | ||||||||
| Business acquisitions, net of cash acquired |
— | — | (57,164 | ) | ||||||||
| Net cash provided by (used in) investing activities |
87,978 | (207,839 | ) | (220,016 | ) | |||||||
| Cash flows from financing activities: |
||||||||||||
| Net increase (decrease) in interest-bearing deposits |
38,633 | (20,045 | ) | 109,332 | ||||||||
| Net decrease in non-interest-bearing deposits |
(19,296 | ) | (32,100 | ) | (15,490 | ) | ||||||
| Net (decrease) increase in securities sold under agreements to repurchase |
(66,722 | ) | (100,994 | ) | 53,173 | |||||||
| Proceeds from Federal Home Loan Bank advances |
460,000 | 488,000 | 191,000 | |||||||||
| Payments on Federal Home Loan Bank advances and other |
(460,548 | ) | (193,406 | ) | (168,059 | ) | ||||||
| Issuance of junior subordinated debentures |
— | — | 65,466 | |||||||||
| Redemption of junior subordinated debentures |
— | — | (34,022 | ) | ||||||||
| Proceeds from common stock issued |
545 | 1,283 | 2,060 | |||||||||
| Excess tax benefits from share-based compensation |
— | — | 963 | |||||||||
| Dividends paid |
— | (3,628 | ) | (7,162 | ) | |||||||
| Treasury stock purchases and deferred compensation |
— | (6 | ) | (18,650 | ) | |||||||
| Net cash (used in) provided by financing activities |
(47,388 | ) | 139,104 | 178,611 | ||||||||
| Increase (decrease) in cash and cash equivalents |
79,365 | (18,129 | ) | 329 | ||||||||
| Cash and cash equivalents at beginning of year |
66,580 | 84,709 | 84,380 | |||||||||
| Cash and cash equivalents at end of year |
$ | 145,945 | $ | 66,580 | $ | 84,709 | ||||||
continued
A-31
Table of Contents
FIRST STATE BANCORPORATION AND SUBSIDIARY
CONSOLIDATED STATEMENTS OF CASH FLOWS
(Dollars in thousands)
(continued)
| Years ended December 31, | |||||||||||
| 2009 | 2008 | 2007 | |||||||||
| Supplemental disclosure of additional noncash investing and financing activities: |
|||||||||||
| Additions to other real estate owned from premises and equipment |
$ | — | $ | 863 | $ | 6,973 | |||||
| Additions to other real estate owned in settlement of loans |
$ | 49,788 | $ | 12,235 | $ | 8,054 | |||||
| Loans originated through sale of other real estate owned |
$ | 728 | $ | — | $ | — | |||||
| Transfers from loans held for sale to loans held for investment |
$ | — | $ | 4,901 | $ | 5,640 | |||||
| Transfer of fixed assets to other assets |
$ | 522 | $ | — | $ | — | |||||
| Supplemental disclosure of cash flow information: |
|||||||||||
| Cash paid for interest |
$ | 50,779 | $ | 73,825 | $ | 94,354 | |||||
| Cash received (paid) for income taxes |
$ | 5,766 | $ | (3,451 | ) | $ | (9,320 | ) | |||
| Summary of assets acquired and liabilities assumed through acquisitions: |
|||||||||||
| Cash and cash equivalents |
— | — | 14,836 | ||||||||
| Investment securities |
— | — | 72,549 | ||||||||
| Net loans |
— | — | 292,167 | ||||||||
| Accrued interest receivable |
— | — | 2,540 | ||||||||
| Goodwill and intangibles |
— | — | 72,407 | ||||||||
| Premises and equipment |
— | — | 12,872 | ||||||||
| Other real estate owned |
— | — | 6,899 | ||||||||
| Bank-owned life insurance |
— | — | 8,771 | ||||||||
| Other assets, net |
— | — | 594 | ||||||||
| Deferred tax asset (liability) |
— | — | 10,041 | ||||||||
| Deposits |
— | — | (359,921 | ) | |||||||
| Securities sold under agreements to repurchase |
— | — | (10,926 | ) | |||||||
| FHLB advances |
— | — | (24,371 | ) | |||||||
| Junior subordinated debentures |
— | — | (10,072 | ) | |||||||
| Other liabilities |
— | — | (16,386 | ) | |||||||
See accompanying notes to consolidated financial statements.
A-32
Table of Contents
FIRST STATE BANCORPORATION AND SUBSIDIARY
NOTES TO CONSOLIDATED FINANCIAL STATEMENTS
1. Summary of Significant Accounting Policies
Organization, Basis of Presentation, and Principles of Consolidation
First State Bancorporation is a New Mexico-based holding company that serves communities in New Mexico and Arizona through its wholly owned subsidiary First Community Bank, (“First Community Bank” or “Bank”). First Community Bank is a state chartered bank providing a full range of commercial banking services in Albuquerque, Taos, Santa Fe, Rio Rancho, Los Lunas, Bernalillo, Placitas, Pojoaque, Belen, Clovis, Gallup, Grants, Las Cruces, Portales, and Moriarty, New Mexico; and Sun City and Phoenix, Arizona. First State Bancorporation and First Community Bank are collectively referred to as “the Company.”
The Company’s Board of Directors meets monthly along with the Bank’s Board of Directors and provides broad oversight to the Company’s business. Direct oversight of the Bank’s business, including development of strategic direction, policies, and other matters, is provided by its Board of Directors. The Bank board is composed entirely of internal management, with H. Patrick Dee, the Company’s President and Chief Executive Officer filling the positions of Chairman and Chief Executive Officer at the Bank.
All significant intercompany accounts and transactions have been eliminated in the consolidated financial statements.
In preparing the financial statements in conformity with accounting principles generally accepted in the United States of America, management is required to make estimates and assumptions about future events. These estimates and the underlying assumptions affect the reported amounts of assets and liabilities as of the date of the balance sheet and revenues and expenses for the period. Management evaluates its estimates and assumptions on an ongoing basis using historical experience and other factors, including the current economic environment, which management believes to be reasonable under the circumstances. These estimates and assumptions are subject to a greater degree of uncertainty as a result of current economic conditions. As future events and their effects cannot be determined with precision, actual results could differ significantly from these estimates and it is reasonably possible that a change in these estimates will occur in the near term.
Material estimates that are particularly susceptible to significant change in the near term relate to the determination of the allowance for loan losses, including the assessment of the underlying collateral values, the valuation of real estate acquired in satisfaction of loans, other-than-temporary impairment of investment securities, the assessment of impairment of intangible assets, and the valuation of deferred tax assets. In connection with the determination of the allowance for loan losses and other real estate owned, management obtains independent appraisals for significant properties.
Management believes that the estimates and assumptions it uses to prepare the consolidated financial statements, including those related to the allowance for loan losses, including the assessment of the underlying collateral values, the valuation of other real estate owned, and valuation of deferred tax assets are adequate. However, further deterioration of the loan portfolio and or changes in economic conditions would require future additions to the allowance and future adjustments to the valuation of real estate owned. Further, regulatory agencies, as an integral part of their examination process, periodically review the allowance for losses on loans and real estate owned, and may require the Company to recognize additions to the allowance based on their judgments about information available to them at the time of their examinations. In addition, current uncertain and volatile economic conditions will likely affect our future business results.
The Company’s results of operations depend on establishing underwriting criteria to minimize loan losses and generating net interest income. The components of net interest income, interest income, and interest expense are affected by general economic conditions and by competition in the marketplace.
Accounting Standards Codification
The Financial Accounting Standards Board’s (“FASB”) Accounting Standards Codification (“ASC”) became effective on July 1, 2009. At that date, the ASC became FASB’s officially recognized source of authoritative U.S. generally accepted accounting principles (“GAAP”) applicable to all public and non-public non-governmental entities, superseding existing FASB, American Institute of Certified Public Accountants (“AICPA”), Emerging Issues Task Force (“EITF”) and related literature. Rules and interpretive releases of the SEC under the authority of federal securities laws are also sources of authoritative GAAP for SEC registrants. All other accounting literature is considered non-authoritative. The switch to the ASC affects the way companies refer to U.S. GAAP in financial statements and accounting policies. Citing particular content in the ASC involves specifying the unique numeric path to the content through the Topic, Subtopic, Section and Paragraph structure.
A-33
Table of Contents
FIRST STATE BANCORPORATION AND SUBSIDIARY
NOTES TO CONSOLIDATED FINANCIAL STATEMENTS—(Continued)
Going Concern Consideration, and Management’s Plan
During 2008 and 2009, the Company experienced increases in both non-performing assets and potential problem loans, largely due to problem loans in the residential construction and lot development portfolios. This has resulted in a significant increase in the level of the Company’s provision for loan losses. The increase in non-accrual loans has continued to put pressure on our net interest margin. The margin compression is a direct result of reversals of accrued interest on loans moving to non- accrual status during the period as well as the inability to accrue interest on the respective loans going forward, ultimately resulting in an earning asset with a zero yield. The level of non-accrual loans has increased to $258 million at December 31, 2009 from $114 million at December 31, 2008. Non-accrual loans as a percentage of interest-earning assets rose to 9.6% compared to 3.6% at December 31, 2008.
Although management has continued to monitor and address this deterioration by providing for an adequate level of allowance for loan losses, the significance of the deterioration has caused the recognition of significant net losses. These net losses have caused the Company to fall below the “well capitalized” status under regulatory guidelines.
At December 31, 2009, the Bank was considered “adequately capitalized” while the Company was considered “significantly undercapitalized” under regulatory guidelines. See further information at Note 14. At the current time, the Company’s “significantly undercapitalized” classification has no immediate impact on its day-to-day operations because the holding company has no immediate significant cash flow needs or significant obligations that are due in the next twelve months. In addition, the prompt corrective actions required by the Federal Reserve Bank of Kansas City and the New Mexico Financial Institutions Division (collectively, the “Regulators”) are directed at the Bank. The substantial erosion of the Bank’s capital position in 2009 and the continued deterioration in the loan portfolio makes it unlikely that the Bank will be able to maintain its “adequately capitalized” status under regulatory guidelines without raising additional capital, a strategic merger, selling a significant amount of assets, obtaining government assistance, or some combination thereof.
The Company’s financial condition has continued to deteriorate, and the Company has come under increasingly close scrutiny by its regulators. On July 2, 2009, the Company and the Bank executed a written agreement (“Regulator Agreement”) with the Regulators. The Regulator Agreement is based on findings of the Regulators identified in an examination of the Bank and the Company during January and February of 2009. Based on their assessment of the Company’s ability to operate in compliance with the Regulator Agreement, the regulatory authorities have broad discretion to take actions, including placing the Bank into a FDIC-administered receivership or conservatorship. The regulatory provisions under which the regulatory authorities act are intended to protect depositors, the deposit insurance fund and the banking system and are not intended to protect shareholders or other investors in other securities in a bank or its holding company. The Company cannot predict what additional actions the regulatory authorities may take.
Management has determined that significant additional sources of capital will likely be required for the Company to continue operating through 2010 and beyond. Although management does not believe that the Company currently has the ability to raise new capital through a public offering at an acceptable price, management continues to work with the Company’s investment bankers to evaluate alternative capital strengthening strategies, and are currently working on other initiatives to strengthen the Company’s capital position including the possibility of entering into a business combination with a strategic partner or a transaction with a private equity group. However, there can be no assurance that the review of strategic alternatives will result in the Company pursuing any particular transaction or strategy, or if it pursues any such transaction or strategy, that it will be completed.
The consolidated financial statements have been prepared on a going concern basis, which contemplates the realization of assets and the discharge of liabilities in the normal course of business for the foreseeable future, and do not include any adjustments to reflect the possible future effects on the recoverability and classification of assets, or the amounts and classification of liabilities that may result should the Company not be able to continue as a going concern.
During 2009, asset quality remained the significant issue impacting the Company. Problem and potential problem loans continued to migrate through the workout process in a very challenging credit cycle with the largest impact in the residential land development and construction portfolio. The increase in problem assets and charge-offs resulted in a significant increase in the provision for loan losses in 2009. The $129.2 million allowance for loan losses was 6.45% of total loans held for investment at December 31, 2009.
Given current economic conditions and trends, the Company may continue to experience asset quality deterioration and higher levels of non-performing loans, as well as continued compression of its net interest margin, which would result in negative earnings and financial condition pressures.
A-34
Table of Contents
FIRST STATE BANCORPORATION AND SUBSIDIARY
NOTES TO CONSOLIDATED FINANCIAL STATEMENTS—(Continued)
Under the terms of the Regulator Agreement, the Company and the Bank agreed, among other things, to engage an independent consultant acceptable to the Regulators to assess the Bank’s management and staffing needs, assess the qualifications and performance of all officers of the Bank, and assess the current structure and compositions of the Bank’s board of directors and its committees. In addition, within 60 days of the Regulator Agreement, the Company and or the Bank was required to submit a written plan to strengthen lending and credit risk management practices and improve the Bank’s position regarding past due loans, problem loans, classified loans, and other real estate owned; maintain sufficient capital at the Bank, holding company and the consolidated level; improve the Bank’s earnings and overall condition; and improve management of the Bank’s liquidity position, funds management process, and interest rate risk management. The Company and or the Bank have also agreed to maintain an adequate allowance for loan and lease losses; charge-off or collect assets classified as “loss” in the Report of Examination that have not been previously collected or charged off; not to pay any dividends; not to distribute any interest, principal or other sums on trust preferred securities; not to issue, increase or guarantee any debt; not to purchase or redeem any shares of the Company’s stock; and not to accept any new brokered deposits, even if the Bank is considered well capitalized. Within 30 days of the Regulator Agreement, the Bank was required to submit a written plan to the Regulators for reducing its reliance on brokered deposits.
The Board of Directors of the Company and the Bank are also required to appoint a Compliance Committee to monitor and coordinate the Company’s and the Bank’s compliance with the provisions of the Regulator Agreement, obtain prior approval for the appointment of new directors, the hiring or change in responsibilities of senior executive officers, and to comply with restrictions on severance payments and indemnification payments to institution affiliated parties.
Failure to comply with the provisions of the Regulator Agreement could subject the Company and or the Bank to additional enforcement actions. Management continues to work closely with the Regulators regarding the Regulator Agreement and believes that the Company and the Bank are in compliance with the requirements of the Regulator Agreement, except for the requirement to submit an acceptable capital plan. Capital plans for the Company and the Bank were submitted timely, but were not accepted by the regulators due to uncertainty around the Company’s ability to execute the plans. Management continues to work toward compliance with the requirements of the capital plans. However, there can be no assurance that the Company and or the Bank will be able to comply fully with the provisions of the Regulator Agreement, or that efforts to comply with the Regulator Agreement will not have adverse effects on the Company’s ability to continue as a going concern.
Depending on the level of capital, the Regulators and or the FDIC can institute other corrective measures to require additional capital and have broad enforcement powers to impose additional restrictions on operations, substantial fines and other penalties for violation of laws and regulations.
Liquidity
During 2009, the Company’s liquidity risk increased due to the impact of the operating losses and capital erosion discussed above, including the elimination of all available uncollateralized liquidity sources, the replacement of the FHLB blanket lien status with a restricted custody collateral arrangement, and increased collateral requirements imposed by the FHLB. However, the Company was able to maintain sufficient liquidity to satisfy its cash flow requirements during 2009.
In early 2009, the Company was notified that its borrowing lines at other banks had been modified, reflective of its 2008 operating results. Currently, the Company’s borrowing lines which were previously unsecured, are required to be fully secured. In order to increase its liquidity position, the Company issued additional brokered deposits in the first quarter focusing on maturities of 15 to 24 months and borrowed additional funds from the FHLB focusing on maturities over the next two to three years to further strengthen its liquidity position. Throughout 2009, management continued to reduce the Company’s balance sheet by curtailing lending and focusing on retail deposit growth to provide further stabilization to the Company’s operations.
During 2009, the FHLB, which provides a significant amount of financing to the Company, replaced the previous blanket lien in effect at the end of 2008 with a custody arrangement, whereby the FHLB has custody and endorsement of the loans that collateralize the Company’s outstanding borrowing position with the FHLB. The FHLB further increased the collateral requirements related to our outstanding borrowing position by reducing the available collateral percentage applied to the unpaid principal balance of the Company’s pledged loans. The FHLB currently allows an aggregate collateral value of approximately 29% of the outstanding unpaid principal balance of the loans pledged to the FHLB.
A-35
Table of Contents
FIRST STATE BANCORPORATION AND SUBSIDIARY
NOTES TO CONSOLIDATED FINANCIAL STATEMENTS—(Continued)
The Company currently has investment securities with a carrying value of approximately $198 million and loan collateral with a par value of approximately $1.3 billion delivered to the FHLB to satisfy the requirements of the custody arrangement. The FHLB takes into consideration a number of factors in calculating the available collateral value including: credit quality, past due status, loan type, and loan documentation exceptions, among other factors. For loans to qualify as collateral, they must not be past due 90 days or more, must not be classified substandard or below, and must not be a loan to a director, employee or agent of the Company or the FHLB. Because collateral values are determined subjectively by the FHLB, there is no assurance that the FHLB will not require additional collateral or repayment of existing borrowings.
Under the terms of the Bank’s agreement with the FHLB, the FHLB may at its own option call the outstanding debt due and payable if any of the following have occurred: the Bank has suspended payment to any creditor or there has been an acceleration of the maturity of any indebtedness of the Bank to others; the FHLB reasonably and in good faith determines that a material adverse change has occurred in the financial condition of the Bank; or the FHLB reasonably and in good faith deems itself insecure in the collateral even though the Bank is not otherwise in default. Based on the Bank’s agreement with the FHLB and the FHLB’s credit policy, as the existing borrowings mature, they will be allowed to continuously renew for like amounts, but for terms not to exceed thirty days. Based on the Bank’s current status with the FHLB, the Bank no longer has the ability to draw down additional advances. The Bank has not received any notice from the FHLB regarding a call of its outstanding debt.
The Company’s most liquid assets are cash and cash equivalents and marketable investment securities that are not pledged as collateral. The levels of these assets are dependent on operating, financing, lending, and investing activities during any given period. At December 31, 2009, the Company’s liquidity position consists of excess cash liquidity and several other liquidity sources. The cash liquidity at December 31, 2009 of approximately $105 million is made up of excess investable cash on the balance sheet including interest-bearing deposits with other banks and federal funds sold. The Company’s other liquidity sources include two borrowing lines for a total capacity of approximately $76 million, fully collateralized by investment securities and commercial loans, approximately $23 million of unpledged investments, and $8 million of redeemable bank owned life insurance policies.
The Company’s primary sources of funds are customer deposits, loan repayments, maturities of and cash flow from investment securities, and borrowings. Investment securities may be used as a source of liquidity either through sale of investment securities available for sale or pledging for qualified deposits, as collateral for borrowings, or as collateral for other liquidity sources. Borrowings may include federal funds purchased, securities sold under agreements to repurchase, borrowings from the FHLB, and borrowings from the Federal Reserve Bank discount window.
During the third quarter, the Bank secured a subordination agreement with the FHLB, which provides the Bank the ability to pledge non-real estate commercial loans to the Federal Reserve Bank discount window. At the end of December, the Bank had approximately $72 million in borrowing capacity at the Federal Reserve Bank discount window, included in the $76 million referred to above, collateralized by approximately $152 million in commercial loans.
The Bank is currently “adequately capitalized.” From a liquidity standpoint, the most significant ramification of the drop in capitalized category relates to our inability to rollover or renew existing brokered deposits, including CDARS reciprocal deposits, that mature or come up for renewal while the Bank is considered adequately capitalized, without a waiver from the FDIC. The Bank has not received a waiver and does not anticipate receiving a waiver from the FDIC. At December 31, 2009, the Bank had $170 million in brokered deposits including CDARS reciprocal which will mature in the next twelve months of which $44 million mature in the next 90 days. The Bank has maintained in excess of $100 million in overnight investments, which combined with normal expected repayments of loans outstanding, should provide adequate cash liquidity required to redeem these brokered deposits at maturity. In addition, at the end of 2009 we subscribed to two deposit listing services to help generate out of market deposits which are not considered to be brokered funds.
The Company’s liquidity position will also benefit during the first part of 2010 from the legislation extending the tax net operating loss carry-back period from two to five years passed in early November. This change allows us to carry tax losses sustained during 2008 or 2009 back five years, which is expected to provide approximately $27 million in additional cash liquidity during the first part of 2010.
A-36
Table of Contents
FIRST STATE BANCORPORATION AND SUBSIDIARY
NOTES TO CONSOLIDATED FINANCIAL STATEMENTS—(Continued)
The Bank is a participating institution in the Transaction Account Guarantee Program (“TAG Program”), which the FDIC extended in the third quarter from December 31, 2009 to June 30, 2010. The TAG Program provides the Bank’s deposit customers in non-interest bearing and interest-bearing NOW accounts paying fifty basis points or less full FDIC insurance for an unlimited amount. The current expiration of the TAG Program is anticipated to be the Bank’s most significant liquidity risk in the near term and mitigating the liquidity impact of such an event remains a priority. As of December 31, 2009, the Company had 293 deposit accounts with balances greater than $250,000 participating in the TAG Program providing unlimited insurance coverage for a total of $309 million in deposits. Approximately half of the deposits are public funds and half are primarily private business accounts. The FDIC is currently evaluating a possible extension of the TAG Program; however, if the TAG Program is not extended by the FDIC, the Bank will be required to collateralize these outstanding public funds immediately upon expiration. The Bank may also experience withdrawals by account holders of any amounts they have on deposit in excess of the amount then insured by the FDIC. Based on current liquidity sources, management anticipates that the Bank will have adequate collateral and other sources of liquidity to meet these potential needs. However, it could require the Bank to utilize the majority of its available liquidity and potentially utilize a portion of the Bank’s borrowing capacity at the discount window. Even if the FDIC decides to extend the TAG program, it could do so on terms that make the program unavailable to the Bank or on terms that make the program less attractive for the Bank to participate.
Management currently anticipates that the Company’s cash and cash equivalents, expected cash flows from operations, loan and investment security principal repayments, and borrowing capacity will be sufficient to meet anticipated cash requirements for working capital, loan originations, capital expenditures, brokered deposit maturities, and other obligations for at least the next twelve months. This expectation assumes that, because the Company has provided the requisite collateral and is in compliance with the debt agreement, the FHLB will continue to renew existing borrowings as they mature. However, if the FHLB were to call the Company’s borrowings due and payable based on the terms described above, the Company may not be able to continue as a going concern without substantial disposition of assets, restructuring of the debt, or other means of raising capital. This expectation also assumes that core deposits remain stable. A substantial decline in core deposits would severely impact the Company’s ability to meet its obligations for at least the next twelve months.
Investment Securities
The Company classifies investment securities in one of three categories and accounts for them as follows: (i) debt securities that the Company has the positive intent and ability to hold to maturity are classified as held to maturity and carried at amortized cost; (ii) debt and equity securities that are bought and held primarily for the purpose of selling them in the near term are classified as trading securities and carried at fair value, with unrealized gains and losses included in earnings; and (iii) debt and equity securities not classified as either held to maturity securities or trading securities are classified as available for sale securities. These are securities that the Company will hold for an indefinite period of time and may be used as a part of the Company’s asset/liability management strategy and may be sold in response to changes in interest rates, prepayments, or similar factors. Available for sale securities are carried at estimated market value, with unrealized gains and losses excluded from earnings and reported as a separate component of stockholders’ equity, net of related deferred income taxes. Upon purchase of investment securities, management designates securities as either held to maturity or available for sale. Amortization of premiums and accretion of discounts are calculated using a method that approximates the effective interest method. Declines below cost in the fair value of investment securities that are other-than-temporary are recorded as write-downs of the individual securities to their estimated fair value and are included in earnings as realized losses or other comprehensive income to the extent the impairment is not due to credit. The Company does not maintain a trading portfolio.
The Company’s investments in FHLB stock and Federal Reserve Bank (“FRB”) stock are restricted securities and not readily marketable, therefore these investments are carried at cost, which approximates fair value. As a member of the FHLB and FRB systems, the Company is required to maintain a minimum level of investment in stock based on specific percentages of its outstanding mortgages, total assets, or FHLB advances. At December 31, 2009 and 2008, the Company met its minimum required investments.
A-37
Table of Contents
FIRST STATE BANCORPORATION AND SUBSIDIARY
NOTES TO CONSOLIDATED FINANCIAL STATEMENTS—(Continued)
Loans and Allowance for Loan Losses
Interest on loans is recognized as income based upon the daily principal amount outstanding. Interest accrued on loans is discontinued in most instances when a loan becomes 90 days past due and/or management believes the borrower’s financial condition is such that collection of future principal and interest payments is doubtful. Loans are removed from non-accrual status when they become current as to both principal and interest, and concern no longer exists as to the collectability of principal or interest. Interest on non-accrual loans is recognized as income when the loan is returned to accrual status. When a loan is placed on non-accrual, any uncollected interest accrued in the current year is charged against income, with prior years’ accruals charged to the allowance for loan losses unless in management’s opinion the loan is well secured and in the process of collection.
The allowance for loan losses is established through a provision for loan losses charged to operations as losses are estimated. Loan amounts determined to be uncollectible are charged-off to the allowance and recoveries of amounts previously charged-off, if any, are credited to the allowance.
In analyzing the adequacy of the allowance for loan losses, management uses a comprehensive loan grading system to determine risk potential in the portfolio, and considers the results of internal and external loan reviews. The allowance for loan losses is that amount which, in management’s judgment, is considered adequate to provide for potential losses in the loan portfolio and includes components for specifically identified loss on impaired loans, an estimate of loss based on historical charge-offs, and a subjective allocation.
Loans are considered impaired when, based on current information and events, it is probable that the Company will be unable to collect all amounts due according to the contractual terms of the loan agreement, including contractual interest payments. When a loan has been identified as impaired, the amount of impairment is measured using cash flow of expected repayments discounted using the loan’s contractual interest rate or at the fair value of the underlying collateral less estimated selling costs when it is determined that the source of repayment is the liquidation of the underlying collateral.
We utilize external appraisals to determine the fair value of the collateral for all real estate related loans. For loans secured by other types of assets such as inventory, equipment, and receivables, the values are typically established based on current financial information of the borrower after applying discounts, usually 50% to 100% for stale dated financial information. Appraisals are obtained upon origination of real estate loans. Updated real estate appraisals are generally obtained at the time a loan is classified as a non-performing asset and determined to be impaired, unless a current appraisal is already on file. New appraisals for impaired loans are obtained annually thereafter or sooner if circumstances indicate that a significant change in value has occurred. Due to the potential for real estate values to change rapidly, appraised values for real estate are discounted to account for deteriorating real estate markets. These discounts consider economic differences that exist in the various markets we serve as well as differences experienced by type of loan and collateral and typically range from 0% to 30% depending on the circumstances surrounding each individual loan. A larger discount may be applied to stale dated appraisals where a current appraisal has been ordered but not yet received. Appraisals on other types of collateral, such as equipment, are also subject to discounting; however, only 8% of our non-performing loans as of December 31, 2009 are secured by collateral other than real estate.
The subjective portion of the allowance for loan losses, which is judgmentally determined, is maintained to recognize the imprecision in estimating and measuring loss when evaluating reserves for individual loans or pools of loans. In calculating the subjective portion of the allowance for loan loss, we consider levels and trends in delinquencies, charge-offs and recoveries, changes in underwriting and policies, trends in volume and terms of loans, the quality of lending management and staff, national and local economic conditions, industry conditions, changes in credit concentrations, independent loan review results, and overall problem loan levels. The subjective factor for levels and trends in delinquencies is applied to all non-impaired delinquent loans and the subjective factor for levels and trends in charge-offs and recoveries is applied to all non-impaired classified loans. Subjective factors related to trends in volume and terms of loans, national and local economic trends, and industry conditions are applied to all non-impaired loans. Subjective factors related to changes in credit concentrations are applied to all non-impaired loans above an $8 million relationship level and changes in underwriting and policies are applied to all non-impaired loans below an $8 million relationship level. The subjective factor related to the quality of lending management and staff is applied to all non-impaired Colorado and Utah loans. The subjective factors for overall problem loan levels and independent loan review results are applied to all classified and special mention loans that are not impaired.
A-38
Table of Contents
FIRST STATE BANCORPORATION AND SUBSIDIARY
NOTES TO CONSOLIDATED FINANCIAL STATEMENTS—(Continued)
Impaired loans acquired by completion of a transfer, including business combinations, that have evidence of deterioration of credit quality since origination, and for which it is probable, at acquisition, that the Company will be unable to collect all contractually required payments receivable are initially recorded at fair value, as determined by the present value of expected future cash flows, with no valuation allowance. Loans acquired in the acquisition of Front Range Capital Corporation that were considered to be impaired, under the above criteria, at acquisition were immaterial. There were no loans acquired in the acquisitions of Access Anytime Bancorp, Inc. and New Mexico Financial Corporation that were considered to be impaired, under the above criteria, at acquisition.
The Company’s loan portfolio is currently concentrated in New Mexico, Colorado, Utah, and Arizona. A significant portion of the loan portfolio is secured by real estate in those communities. Accordingly, the ultimate collectability of the Company’s loan portfolio is dependent upon real estate values in New Mexico, Colorado, Utah, and Arizona. The current economic recession and deterioration in the real estate markets have had an adverse effect on the collateral value for many of the Company’s loans and on the repayment ability of many of the Company’s borrowers. A continued significant decline in real estate values could also lead to higher charge-offs in the event of defaults in the Company’s real estate portfolio. Because of the negative trend in non-performing assets, management will continue to aggressively manage the exposure in the Company’s loan portfolio and devote increased attention to the Company’s construction portfolio including residential construction as well as commercial real estate construction. Management will continue to proactively work with borrowers as they begin to see potential signs of deterioration in collateral values or general market conditions.
Loan origination fees and certain direct loan origination costs are deferred and amortized to income over the contractual life of the loan using the interest method. Any unamortized balance of the deferred fees is recognized as income if the loans are sold, participated, or repaid prior to maturity.
Mortgage loans available for sale are carried at the lower of aggregate cost or estimated fair market value. Estimated fair market value is determined using forward commitments to sell loans to permanent investors or current market rates for loans of similar quality and type. Net unrealized losses, if any, are recognized in a valuation allowance by charges to income. Gains resulting from sales of mortgage loans are recognized at settlement date. The loans are primarily secured by one-to-four family residential real estate.
As of December 31, 2009 the bank had approximately $165.0 million in construction and acquisition and development loans with interest reserves. Historically, the bank has advanced from the interest reserve on a monthly basis to pay accrued interest on the loan. Projects are currently monitored with third party inspections required prior to advancing new funds on the loan other than for interest. Due to the current state of the real estate economy many of these loans have been extended and/or renewed as a result of slower than projected absorption. The bank’s policy however, does not allow for additional interest reserves to be added to the loan but rather the borrower is required to fund the monthly interest expense out-of-pocket. Also, if the interest reserve is depleted prior to maturity of the loan the borrower is expected to fund interest expense out-of-pocket. Of the $165.0 million in construction and acquisition and development loans with interest reserves, approximately $30.0 million is on non-accrual. Once a loan is placed on non-accrual status advances for interest expense are no longer funded.
Premises and Equipment
Premises and equipment are stated at cost, less accumulated depreciation and amortization. Depreciation and amortization are computed by the straight-line method over the estimated useful lives of the related assets. Routine repairs and maintenance are charged to expense as incurred. Leasehold improvements are amortized over the shorter of the lease term or the asset life.
Goodwill and Intangible Assets
The excess of cost over the fair value of the net assets of acquired banks is recorded as goodwill. The Company tests goodwill for impairment on an annual basis or more frequently if events or changes in circumstances indicate that the asset might be impaired. As a result of the Company’s market capitalization being less than our stockholders’ equity at June 30, 2008, an analysis was performed to determine whether and to what extent our goodwill may have been impaired. Based on the analysis, we determined that the implied fair value of goodwill was zero, resulting in the recognition of a goodwill impairment charge to earnings of $127.4 million in June 2008. For 2007, we completed our required annual goodwill impairment tests during the fourth quarter and found no impairment. See Note 7 for further discussion on goodwill and impairment.
Core deposit intangibles are amortized on an accelerated basis based on an estimated useful life of approximately 10 years. The Company reviews its core deposit intangible assets periodically for impairment whenever events or changes in circumstances indicate that its carrying amount may not be recoverable and has found no indication of impairment. If such impairment is indicated, recoverability of the asset is assessed based on expected undiscounted net cash flows. Any impairment losses would be reported in the consolidated statements of operations.
A-39
Table of Contents
FIRST STATE BANCORPORATION AND SUBSIDIARY
NOTES TO CONSOLIDATED FINANCIAL STATEMENTS—(Continued)
Other Real Estate Owned
Other real estate owned consists of loan-related properties acquired through foreclosure and by deed-in-lieu of foreclosure and bank facilities and vacant land listed for sale. Other real estate owned is carried at the lower of the investment in the related loan or the estimated fair value of the assets received. Fair value of such assets is determined based on current market information, including independent appraisals less estimated costs of disposition. Due to the potential for real estate values to change rapidly, appraised values for real estate are discounted to account for deteriorating real estate markets. These discounts consider economic differences that exist in the various markets we serve as well as differences experienced by type of loan and collateral and typically range from 0% to 30% depending on the circumstances surrounding each individual loan. A larger discount may be applied to stale dated appraisals where a current appraisal has been ordered. Provisions for losses subsequent to acquisition, operating expenses, and gains or losses from sales of other real estate owned are charged or credited to other operating income or costs.
Income Taxes
The Company files a consolidated tax return with its wholly owned subsidiary. The Company uses the asset and liability method to account for income taxes. Under the asset and liability method, deferred tax assets and liabilities are recognized for the future tax consequences attributable to differences between the financial statement carrying amounts of existing assets and liabilities and their respective tax bases. Deferred tax assets and liabilities are measured using enacted tax rates expected to apply to taxable income in the years in which those temporary differences are expected to be recovered or settled. The effect on deferred tax assets and liabilities of a change in tax rates is recognized in income in the period that includes the enactment date. ASC Topic 740, “Income Taxes,” requires a reduction of the carrying amounts of deferred tax assets by a valuation allowance if, based on the available evidence, it is more likely than not that such assets will not be realized. Accordingly, the need to establish valuation allowances for deferred tax assets are assessed periodically based on the ASC Topic 740 more-likely-than-not realization threshold criterion. In the assessment for a valuation allowance, appropriate consideration is given to all positive and negative evidence related to the realization of the deferred tax assets. This assessment considers, among other matters, the nature, frequency and severity of current and cumulative losses, forecasts of future profitability, the duration of statutory carry-forward periods, the availability of carry-back benefits, the Company’s experience with operating loss and tax credit carry-forwards not expiring unused, and tax planning alternatives. When substantial uncertainty exists concerning the recoverability of a deferred tax asset, the carrying value of the deferred tax asset is reduced by a valuation allowance.
Statements of Cash Flows
The Company considers all liquid investments with original maturities of three months or less to be cash equivalents. Cash and cash equivalents include cash and due from banks, interest-bearing deposits with other banks, and federal funds sold.
Earnings (Loss) per Common Share
Basic earnings (loss) per share are computed by dividing net income (loss) (the numerator) by the weighted average number of common shares outstanding during the period (the denominator). Diluted earnings per share are calculated by increasing the basic earnings per share denominator by the number of additional common shares that would have been outstanding if dilutive potential common shares for options had been issued. The following is a reconciliation of the numerators and denominators of basic and diluted earnings per share.
| Years ended December 31, | ||||||||||||||||||||||||||||
| 2009 | 2008 | 2007 | ||||||||||||||||||||||||||
| Net Income (Numerator) |
Shares (Denominator) |
Per Share Amount |
Net Income (Numerator) |
Shares (Denominator) |
Per Share Amount |
Net Income (Numerator) |
Shares (Denominator) |
Per Share Amount | ||||||||||||||||||||
| (Dollars in thousands, except per share amounts) | ||||||||||||||||||||||||||||
| Basic EPS: |
||||||||||||||||||||||||||||
| Net income (loss) |
$ | (110,493 | ) | 20,612,746 | $ | (5.36 | ) | $ | (153,631 | ) | 20,207,478 | $ | (7.60 | ) | $ | 24,807 | 20,427,682 | $ | 1.21 | |||||||||
| Effect of dilutive securities - options |
— | — | — | — | — | 200,337 | ||||||||||||||||||||||
| Diluted EPS: |
||||||||||||||||||||||||||||
| Net income (loss) |
$ | (110,493 | ) | 20,612,746 | $ | (5.36 | ) | $ | (153,631 | ) | 20,207,478 | $ | (7.60 | ) | $ | 24,807 | 20,628,019 | $ | 1.20 | |||||||||
A-40
Table of Contents
FIRST STATE BANCORPORATION AND SUBSIDIARY
NOTES TO CONSOLIDATED FINANCIAL STATEMENTS—(Continued)
Due to the net loss for the years ended December 31, 2009 and 2008, 1,433,062 and 1,427,706 weighted average stock options outstanding, respectively, were excluded from the calculation of diluted earnings per share because their inclusion would have been anti-dilutive. For the years ended December 31, 2007, approximately 268,900 weighted average stock options outstanding, respectively, were excluded from the calculation of diluted earnings per share because the exercise prices of the stock options were equal to or greater than the average share price of the common shares, and therefore, their inclusion would have been anti-dilutive.
Share-Based Compensation
The Company measures compensation cost for all share-based awards at fair value on the grant date and recognition of compensation expense over the requisite service period for awards expected to vest. The fair value of stock option grants is determined using the Black-Scholes valuation model. The volatility is determined based on the average change in stock price over a historical period equal to the contractual term of the respective stock option. The fair value of restricted stock awards is determined based on the number of shares granted and the quoted price of our common stock. Such fair values are recognized as compensation expense over the requisite service period, net of estimated forfeitures. Forfeitures are estimated at the time of grant and revised, if necessary, in subsequent periods if actual forfeitures differ from those estimates. In conjunction with the adoption of SFAS 123R (ASC Topic 718) on January 1, 2006, the Company changed its method of attributing the value of share-based compensation to expense from the accelerated multiple-option approach to the straight-line single options method for all future share-based grants. Compensation expense for all share-based payment awards granted on or prior to January 1, 2006, continues to be recognized using the accelerated multiple-option approach.
See Note 12 for further discussion of the Company’s share-based employee compensation.
Reclassifications
Certain previous period balances have been reclassified to conform to the 2009 presentation.
Reporting Comprehensive Income
ASC Topic 220, “Comprehensive Income,” requires disclosure in the financial statements of comprehensive income that encompasses earnings and those items currently required to be reported directly in the equity section of the balance sheet, such as unrealized gains and losses on available for sale securities.
Other New Accounting Standards
As discussed above, on July 1, 2009, the Accounting Standards Codification became FASB’s officially recognized source of authoritative U.S. generally accepted accounting principles applicable to all public and non-public non-governmental entities, superseding existing FASB, AICPA, EITF and related literature. Rules and interpretive releases of the SEC under the authority of federal securities laws are also sources of authoritative GAAP for SEC registrants. All other accounting literature is considered non-authoritative. The switch to the ASC affects the way companies refer to U.S. GAAP in financial statements and accounting policies. Citing particular content in the ASC involves specifying the unique numeric path to the content through the Topic, Subtopic, Section and Paragraph Structure.
In January 2010, the FASB issued Accounting Standards Update No. 2010-06. This update provides amendments to Topic 820 “Fair Value Measurements and Disclosures.” The update requires the separate disclosure of significant transfers in and out of Level 1 and Level 2 fair value measurements. The update also requires that reconciliation for fair value measurements using significant unobservable inputs (Level 3) present separately information about purchases, sales, issuances and settlements. and clarifies existing disclosures regarding the level of disaggregation and inputs and valuations techniques. The new disclosures and clarifications of existing disclosures are effective for interim and annual reporting periods beginning after December 15, 2009, except for the disclosures about purchases, sales, issuances, and settlements in the roll forward of activity in Level 3 fair value measurements. These disclosures are effective for fiscal years beginning after December 15, 2010 and for interim periods within those fiscal years. Management does not expect this guidance to have a material impact on the Company’s consolidated financial statements.
In July 2009, the FASB issued authoritative guidance under ASC Topic 810, “Consolidation” that requires former “qualifying special-purpose entities” (“QSPEs”) to be evaluated for consolidation and also changes the approach to determining a variable interest entity’s (“VIE”) primary beneficiary and requires companies to more frequently reassess whether they must consolidate VIEs. The guidance requires additional year-end and interim disclosures for public and nonpublic companies. The guidance is effective as of the beginning of the first annual reporting period that begins after November 15, 2009, for interim periods within that first annual reporting period, and for interim and annual reporting periods thereafter. Earlier application is prohibited. For public entities, in periods after initial adoption, certain comparative disclosures are required. Management does not expect this guidance to have any impact on the Company’s consolidated financial statements.
A-41
Table of Contents
FIRST STATE BANCORPORATION AND SUBSIDIARY
NOTES TO CONSOLIDATED FINANCIAL STATEMENTS—(Continued)
In June 2009, the FASB issued authoritative guidance under ASC Topic 860, “Transfers and Servicing” eliminating the concept of a QSPE and associated guidance that had been a significant source of complexity, creating more stringent conditions for reporting a transfer of a portion of a financial asset as a sale, clarifying other sale-accounting criteria, and changing the initial measurement of a transferor’s interest in transferred financial assets. The guidance is effective as of the beginning of the first annual reporting period that begins after November 15, 2009, for interim periods within that first annual reporting period, and for interim and annual reporting periods thereafter. Earlier application is prohibited. Management does not expect this guidance to have any impact on the Company’s consolidated financial statements.
In April 2009, the FASB issued authoritative guidance under ASC Topic 825, “Financial Instruments” requiring disclosures about fair value of financial instruments for interim reporting periods of publicly traded companies as well as in annual financial statements. This guidance is effective for interim reporting periods ending after June 15, 2009. This guidance did not have any impact on the Company’s consolidated financial statements.
In April 2009, the FASB issued authoritative guidance under ASC Topic 820, “Fair Value Measurements and Disclosures” providing additional guidance for estimating fair value when the volume and level of activity for the asset or liability have significantly decreased. The guidance also identifies circumstances that indicate a transaction is not orderly and reaffirms that fair value is the price that would be received to sell an asset or paid to transfer a liability in an orderly transaction (that is, not a forced liquidation or distressed sale) between market participants at the measurement date under current market conditions. The guidance is effective for interim reporting periods ending after June 15, 2009, and must be applied prospectively. The adoption of this guidance did not have a material impact on the Company’s consolidated financial statements.
In April 2009, the FASB issued authoritative guidance under ASC Topic 325, “Investments – Other” modifying the requirements for recognizing other-than-temporarily impaired debt securities and significantly changing the existing impairment model for such securities. The current “intent and ability” indicator has been modified and other factors have been incorporated to determine whether a debt security is other-than-temporarily impaired. The guidance also changes the trigger used to assess the collectability of cash flows from “probable that the investor will be unable to collect all amounts due” to “the entity does not expect to recover the entire amortized cost basis of the security.” Disclosures about other-than-temporarily impaired debt and equity securities have been expanded and are required for interim and annual reporting periods, effective for interim and annual reporting periods ending after June 15, 2009. The adoption of this guidance did not have a material impact on the Company’s consolidated financial statements.
In January 2009, the FASB issued authoritative guidance under ASC Topic 325, “Investments – Other” amending previously issued guidance regarding the determination of whether an other-than-temporary impairment has occurred. The guidance retains and emphasizes the objective of an other-than-temporary impairment assessment and the related disclosure requirements contained in other guidance, is effective for interim and annual reporting periods ending after December 15, 2008, and is applied prospectively. The adoption of this guidance did not have a material impact on the Company’s consolidated financial statements.
2. Business Acquisitions and Dispositions
In June 2009, we completed the sale of our Colorado branches transferring approximately $387 million in loans, $512 million in deposits and securities sold under agreements to repurchase, $20 million of premises and equipment and other assets, and received a deposit premium of $30 million. After the write-off of the core deposit intangible associated with these deposits and investment banking fees, we recorded a pretax gain of approximately $23.3 million. Transaction costs recorded as expenses totaled $1.8 million.
On March 1, 2007, the Company completed the acquisition of Front Range Capital Corporation (“Front Range”), paying $72 million in cash. Under the terms of the agreement, each issued and outstanding share of Front Range common stock, the 1987 voting preferred stock, and the 1988 non-voting preferred stock were converted into the right to receive $35.904 (rounded to the nearest full cent) per share in cash, and each issued and outstanding share of Front Range 2000 non-voting preferred stock was converted into the right to receive $1,000 per share in cash. Concurrent with the merger of First State and Front Range, First Community Bank and Heritage Bank, Front Range’s wholly owned subsidiary, merged with First Community Bank surviving. The acquisition was entered into to strengthen the Bank franchise to allow for potential growth along Colorado’s front range. The results of operations for Front Range are included in the Company’s results subsequent to the acquisition date.
A-42
Table of Contents
FIRST STATE BANCORPORATION AND SUBSIDIARY
NOTES TO CONSOLIDATED FINANCIAL STATEMENTS—(Continued)
The following table summarizes the estimated fair values of the assets acquired and liabilities assumed at the date of acquisition (in thousands).
| At March 1, 2007 | |||
| Cash and cash equivalents |
$ | 14,836 | |
| Investments |
72,549 | ||
| Loans, net |
292,167 | ||
| Premises and equipment |
12,872 | ||
| Other real estate owned |
6,899 | ||
| Goodwill |
61,180 | ||
| Core deposit intangible asset |
11,227 | ||
| Cash surrender value of bank-owned life insurance |
8,771 | ||
| Deferred tax asset |
10,041 | ||
| Other assets |
3,134 | ||
| Total assets acquired |
493,676 | ||
| Deposits |
359,921 | ||
| Securities sold under agreements to repurchase |
10,926 | ||
| Borrowings |
24,371 | ||
| Junior subordinated debentures |
10,072 | ||
| Other liabilities |
16,386 | ||
| Total liabilities |
421,676 | ||
| Net assets acquired |
$ | 72,000 | |
The core deposit intangible asset is being amortized over its estimated useful life of ten years.
3. Cash and Due from Banks
First Community Bank is required to maintain certain daily reserve balances in the form of vault cash or cash on deposit with the Federal Reserve Bank in accordance with Federal Reserve Board requirements. The consolidated reserve balances maintained in accordance with these requirements were approximately $13.9 million and $11.4 million at December 31, 2009 and 2008, respectively.
A-43
Table of Contents
FIRST STATE BANCORPORATION AND SUBSIDIARY
NOTES TO CONSOLIDATED FINANCIAL STATEMENTS—(Continued)
4. Investment Securities
Following is a summary of amortized cost and approximate market value of investment securities:
| Amortized cost |
Gross unrealized gains |
Gross unrealized losses |
Estimated market value | |||||||||
| (Dollars in thousands) | ||||||||||||
| As of December 31, 2009 |
||||||||||||
| Obligations of U.S. government agencies— |
||||||||||||
| Available for sale |
$ | 5,571 | $ | — | $ | 116 | $ | 5,455 | ||||
| Mortgage-backed securities: |
||||||||||||
| Pass-through certificates: |
||||||||||||
| Available for sale |
98,007 | 594 | 177 | 98,424 | ||||||||
| Held to maturity |
21,804 | 693 | — | 22,497 | ||||||||
| Collateralized mortgage obligations: |
||||||||||||
| Available for sale |
315,668 | 1,452 | 2,021 | 315,099 | ||||||||
| Held to maturity |
2,348 | — | 703 | 1,645 | ||||||||
| Obligations of states and political subdivisions: |
||||||||||||
| Available for sale |
53,491 | 1,456 | 345 | 54,602 | ||||||||
| Held to maturity |
34,303 | 136 | 1,000 | 33,439 | ||||||||
| Federal Home Loan Bank stock |
23,103 | — | — | 23,103 | ||||||||
| Federal Reserve Bank stock |
6,851 | — | — | 6,851 | ||||||||
| Bankers’ Bank of the West stock |
135 | — | — | 135 | ||||||||
| Total |
$ | 561,281 | $ | 4,331 | $ | 4,362 | $ | 561,250 | ||||
| As of December 31, 2008 |
||||||||||||
| Obligations of the U.S. Treasury— |
||||||||||||
| Held to maturity |
$ | 997 | $ | 21 | $ | — | $ | 1,018 | ||||
| Obligations of U.S. government agencies: |
||||||||||||
| Available for sale |
27,457 | 282 | — | 27,739 | ||||||||
| Mortgage-backed securities: |
||||||||||||
| Pass-through certificates: |
||||||||||||
| Available for sale |
143,705 | 4,875 | 42 | 148,538 | ||||||||
| Held to maturity |
28,822 | 407 | 45 | 29,184 | ||||||||
| Collateralized mortgage obligations: |
||||||||||||
| Available for sale |
150,875 | 1,792 | 1,106 | 151,561 | ||||||||
| Held to maturity |
3,133 | — | 1,910 | 1,223 | ||||||||
| Obligations of states and political subdivisions: |
||||||||||||
| Available for sale |
65,676 | 942 | 968 | 65,650 | ||||||||
| Held to maturity |
30,231 | 76 | 32 | 30,275 | ||||||||
| Federal Home Loan Bank stock |
24,738 | — | — | 24,738 | ||||||||
| Federal Reserve Bank stock |
7,452 | — | — | 7,452 | ||||||||
| Bankers’ Bank of the West stock |
135 | — | — | 135 | ||||||||
| Total |
$ | 483,221 | $ | 8,395 | $ | 4,103 | $ | 487,513 | ||||
A-44
Table of Contents
FIRST STATE BANCORPORATION AND SUBSIDIARY
NOTES TO CONSOLIDATED FINANCIAL STATEMENTS—(Continued)
The amortized cost and estimated market value of investment securities at December 31, 2009, by contractual maturity, are shown below. Expected maturities will differ from contractual maturities because borrowers may have the right to call or prepay obligations.
| Amortized Cost | Estimated Market Value | |||||
| (Dollars in thousands) | ||||||
| Within one year: |
||||||
| Available for sale |
$ | 775 | $ | 784 | ||
| Held to maturity |
501 | 508 | ||||
| One through five years: |
||||||
| Available for sale |
8,439 | 8,465 | ||||
| Held to maturity |
3,734 | 3,852 | ||||
| Five through ten years: |
||||||
| Available for sale |
27,900 | 28,726 | ||||
| Held to maturity |
2,715 | 2,727 | ||||
| After ten years: |
||||||
| Available for sale |
21,948 | 22,082 | ||||
| Held to maturity |
27,353 | 26,352 | ||||
| Mortgage-backed securities (a) |
119,811 | 120,921 | ||||
| Collateralized mortgage obligations(a) |
318,016 | 316,744 | ||||
| Federal Home Loan Bank stock |
23,103 | 23,103 | ||||
| Federal Reserve Bank stock |
6,851 | 6,851 | ||||
| Bankers’ Bank of the West stock |
135 | 135 | ||||
| Total |
$ | 561,281 | $ | 561,250 | ||
| (a) | Substantially all of the Company’s mortgage-backed securities are due in 10 years or more based on contractual maturity. The estimated weighted average life, which reflects anticipated future prepayments, is approximately three years for pass-through certificates and two years for collateralized mortgage obligations. |
Marketable securities available for sale with a market value of approximately $461.2 million and marketable securities held to maturity with an amortized cost of approximately $36.8 million were pledged to collateralize deposits as required by law and for other purposes at December 31, 2009.
Proceeds from sales of investments in debt securities for the years ended December 31, 2009, 2008, and 2007 were $231.1 million, $2.5 million, and $71.0 million, respectively. Gross losses realized were $21,000 in 2009, zero in 2008, and zero in 2007. Gross gains realized were $8,061,000 in 2009, $68,000 in 2008, and $43,000 in 2007. The Company calculates gain or loss on sale of securities based on the specific identification method.
The unrealized losses on investment securities are caused by fluctuations in market interest rates. The majority of the gross unrealized losses as of December 31, 2009, have been in an unrealized loss position for less than 12 months. The underlying cash obligations of Ginnie Mae securities are guaranteed by the U.S. government and it is the belief of the Company that all related municipalities issuing the debt will honor the interest payment schedules, as well as the full debt at maturity. The securities are purchased by the Company for their economic value. Because the decrease in fair value is primarily due to market interest rates, projected cash flows are expected to be in excess of amortized cost, and because the Company has the intent and ability to hold these investments until a market price recovery, or maturity of the securities, the Company has concluded that the investments are not considered other-than-temporarily impaired.
A-45
Table of Contents
FIRST STATE BANCORPORATION AND SUBSIDIARY
NOTES TO CONSOLIDATED FINANCIAL STATEMENTS—(Continued)
| Less than twelve months | Greater than twelve months | Total | ||||||||||||||||
| Fair Value | Unrealized Loss |
Fair Value | Unrealized Loss |
Fair Value | Unrealized Loss | |||||||||||||
| (Dollars in thousands) | ||||||||||||||||||
| As of December 31, 2009 |
||||||||||||||||||
| Obligations of the U.S. government agencies |
$ | 5,455 | $ | 116 | $ | — | $ | — | $ | 5,455 | $ | 116 | ||||||
| Mortgage-backed securities |
39,876 | 177 | — | — | 39,876 | 177 | ||||||||||||
| Collateralized mortgage obligations |
133,012 | 1,744 | 6,265 | 980 | 139,277 | 2,724 | ||||||||||||
| Obligations of states and political subdivisions |
5,680 | 1,045 | 4,350 | 300 | 10,030 | 1,345 | ||||||||||||
| Total |
$ | 184,023 | $ | 3,082 | $ | 10,615 | $ | 1,280 | $ | 194,638 | $ | 4,362 | ||||||
| As of December 31, 2008 |
||||||||||||||||||
| Mortgage-backed securities |
$ | 12,513 | $ | 87 | $ | — | $ | — | $ | 12,513 | $ | 87 | ||||||
| Collateralized mortgage obligations |
34,557 | 2,704 | 2,957 | 312 | 37,514 | 3,016 | ||||||||||||
| Obligations of states and political subdivisions |
24,049 | 977 | 1,252 | 23 | 25,301 | 1,000 | ||||||||||||
| Total |
$ | 71,119 | $ | 3,768 | $ | 4,209 | $ | 335 | $ | 75,328 | $ | 4,103 | ||||||
5. Loans
Following is a summary of loans by major categories:
| Loans | Non-Performing Loans | |||||||||||
| December 31, 2009 | December 31, 2008 | December 31, 2009 | December 31, 2008 | |||||||||
| (Dollars in thousands) | ||||||||||||
| Commercial |
$ | 259,353 | $ | 356,769 | $ | 13,037 | $ | 4,493 | ||||
| Consumer and other |
28,202 | 41,474 | 5,893 | 2,394 | ||||||||
| Real estate—commercial |
883,598 | 1,172,952 | 70,065 | 10,912 | ||||||||
| Real estate—one to four family |
187,085 | 270,613 | 22,497 | 9,540 | ||||||||
| Real estate—construction |
645,280 | 896,117 | 146,197 | 90,938 | ||||||||
| Loans held for investment |
2,003,518 | 2,737,925 | 257,689 | 118,277 | ||||||||
| Mortgage loans available for sale |
14,172 | 16,664 | — | — | ||||||||
| Total loans |
$ | 2,017,690 | $ | 2,754,589 | $ | 257,689 | $ | 118,277 | ||||
Included in the above balances are net deferred fees of approximately $3.1 million and $5.5 million, at December 31, 2009 and 2008, respectively. At December 31, 2009 and 2008, respectively, approximately $1.3 billion and $582 million in loans were pledged as collateral for FHLB advances and FHLB letters of credit.
The Company’s loans are currently concentrated in New Mexico, Colorado, Utah, and Arizona. The loan portfolio is heavily concentrated in real estate at approximately 86%. Similarly, the Company’s potential problem loans are concentrated in real estate loans, specifically the real estate construction category. These real estate construction loans are considered to be the loans with the highest risk of loss. Real estate construction loans comprise approximately 32% of the total loans of the Company. Of the $645 million of real estate construction loans, approximately 38% are related to residential construction and approximately 62% are for commercial purposes or vacant land. Approximately 54% of our real estate construction loans are in New Mexico, approximately 22% are in Colorado, approximately 19% are in Utah and approximately 5% are in Arizona.
A-46
Table of Contents
FIRST STATE BANCORPORATION AND SUBSIDIARY
NOTES TO CONSOLIDATED FINANCIAL STATEMENTS—(Continued)
The following is a summary of the real estate construction loans by type:
| Construction Loans December 31, 2009 (Dollars in thousands)
| |||||||||||||||||||||
| Total | % of Total |
$ Impaired |
% Impaired |
$ Delinquent |
% Delinquent |
YTD Charge Offs Net of Recoveries | |||||||||||||||
| 1-4 family vertical construction |
$ | 63,464 | 10 | % | $ | 24,098 | 38.0 | % | $ | 11,548 | 18.2 | % | $ | 16,185 | |||||||
| 1-4 family lots and lot development |
180,749 | 28 | 61,169 | 33.8 | 7,534 | 4.2 | 31,189 | ||||||||||||||
| Commercial owner occupied |
18,535 | 3 | 2,117 | 11.4 | — | — | 13 | ||||||||||||||
| Commercial non-owner occupied (land development and vertical construction) |
217,879 | 33 | 34,117 | 15.7 | 16,238 | 7.5 | 13,125 | ||||||||||||||
| Vacant land |
164,653 | 26 | 24,696 | 15.0 | 1,861 | 1.1 | 19,301 | ||||||||||||||
| Total |
$ | 645,280 | 100 | % | $ | 146,197 | 22.7 | % | $ | 37,181 | 5.8 | % | $ | 79,813 | |||||||
| Construction Loans December 31, 2008 (Dollars in thousands)
| |||||||||||||||||||||
| Total | % of Total |
$ Impaired |
% Impaired |
$ Delinquent |
% Delinquent |
YTD Charge Offs Net of Recoveries | |||||||||||||||
| 1-4 family vertical construction |
$ | 179,918 | 20 | % | $ | 34,207 | 19.0 | % | $ | 10,551 | 5.9 | % | $ | 4,067 | |||||||
| 1-4 family lots and lot development |
239,471 | 27 | 19,805 | 8.3 | 6,874 | 2.9 | 5,071 | ||||||||||||||
| Commercial owner occupied |
25,000 | 3 | 196 | 0.8 | 6,388 | 25.6 | 38 | ||||||||||||||
| Commercial non-owner occupied (land development and vertical construction) |
263,754 | 29 | 19,296 | 7.3 | 13,784 | 5.2 | 2,747 | ||||||||||||||
| Vacant land |
187,974 | 21 | 17,434 | 9.3 | 3,531 | 1.9 | 1,080 | ||||||||||||||
| Total |
$ | 896,117 | 100 | % | $ | 90,938 | 10.1 | % | $ | 41,128 | 4.6 | % | $ | 13,003 | |||||||
The increase in non-performing loans relates to various small-to medium-sized loans. At December 31, 2009, the non-performing loans included approximately 400 borrower relationships. The largest borrower relationships are loans for acquisition and development of residential lots. The 20 largest, with balances ranging from $5.1 million to $9.8 million, comprise $130.3 million, or 51%, of the total non-performing loans and have balances of $33.5 million in New Mexico, $19.1 million in Arizona, $23.3 million in Colorado, and $54.4 million in Utah. The $130.3 million is net of partial charge-offs of $27.3 million, the majority of which occurred in 2009. The allowance for loan losses on these loans totaled $14.9 million at December 31, 2009. These 20 loans are collateralized by partially developed lots, developed lots and vertical construction. No other non-performing borrower relationship is greater than 2% of the total non-performing loans.
The allowance for loan losses is established through a provision for loan losses charged to operations as losses are estimated. Loan amounts determined to be uncollectible are charged-off to the allowance and recoveries of amounts previously charged-off, if any, are credited to the allowance.
The allowance for loan losses is that amount which, in management’s judgment, is considered adequate to provide for potential losses in the loan portfolio. In analyzing the adequacy of the allowance for loan losses, management uses a comprehensive loan grading system to determine risk potential in the portfolio, and considers the results of internal and external loan reviews.
At December 31, 2009, loans held for investment were comprised of fixed and variable rate instruments as follows:
| (Dollars in thousands) | |||
| Loans at fixed rates |
$ | 466,241 | |
| Loans at variable rates |
1,537,277 | ||
| Total loans held for investment |
$ | 2,003,518 | |
Loans at variable rates include loans that reprice immediately, as well as loans that reprice any time prior to maturity.
A-47
Table of Contents
FIRST STATE BANCORPORATION AND SUBSIDIARY
NOTES TO CONSOLIDATED FINANCIAL STATEMENTS—(Continued)
Approximate loan portfolio maturities on fixed-rate loans held for investment and repricings on variable-rate loans held for investment at December 31, 2009, are as follows:
| Within 1 year | 1 to 5 Years | After 5 Years | Total | |||||||||
| (Dollars in thousands) | ||||||||||||
| Commercial |
$ | 188,373 | $ | 51,903 | $ | 19,077 | $ | 259,353 | ||||
| Real estate |
843,860 | 557,308 | 314,795 | 1,715,963 | ||||||||
| Consumer |
14,721 | 10,286 | 3,195 | 28,202 | ||||||||
| Total loans held for investment |
$ | 1,046,954 | $ | 619,497 | $ | 337,067 | $ | 2,003,518 | ||||
Following is a summary of changes to the allowance for loan losses:
| Years ended December 31, | ||||||||||||
| 2009 | 2008 | 2007 | ||||||||||
| (Dollars in thousands) | ||||||||||||
| Balance at beginning of year |
$ | 79,707 | $ | 31,712 | $ | 23,125 | ||||||
| Provision charged to operations |
162,600 | 71,618 | 10,267 | |||||||||
| Loans charged-off |
(107,506 | ) | (25,587 | ) | (5,540 | ) | ||||||
| Recoveries |
2,168 | 1,964 | 902 | |||||||||
| Allowance related to acquired (sold) loans |
(7,747 | ) | — | 2,958 | ||||||||
| Balance at end of year |
$ | 129,222 | $ | 79,707 | $ | 31,712 | ||||||
The increase in the provision for loan losses is due to increased non-performing assets and net charge-offs. The carrying value of impaired loans was approximately $257.7 million at December 31, 2009, $114.1 million at December 31, 2008, and $30.7 million at December 31, 2007. The average investment in non-accrual loans was approximately $204.8 million in 2009, $76.0 million in 2008, and $25.9 million in 2007. The allowance recorded on these loans was approximately $24.5 million, $16.7 million and $5.7 at December 31, 2009, 2008 and 2007, respectively. If interest on the non-accrual loans had been accrued, such income would have been approximately $11.7 million in 2009, $5.3 million in 2008, and $1.5 million in 2007. Interest income recognized on the non-accrual loans was insignificant in 2009, 2008, and 2007. The recorded investment in loans past due ninety days or more and still accruing was zero and $4.1 million at December 31, 2009 and 2008, respectively. The recorded investment in loans past due ninety days or more and still accruing was insignificant at December 31, 2007.
As of December 31, 2009 and 2008, loans outstanding to certain related-party loan customers of the subsidiary bank (executive officers, directors, and principal shareholders of the Company, including their families and companies in which they are principal owners) totaled $6.5 million, for both years. In the opinion of management, all transactions entered into between the Company and such related parties have been, and are, in the ordinary course of business, made on the same terms and conditions as similar transactions with unaffiliated persons.
6. Premises and Equipment
Following is a summary of premises and equipment, at cost:
| Estimated Useful Life (years) |
As of December 31, | |||||||||
| 2009 | 2008 | |||||||||
| (Dollars in thousands) | ||||||||||
| Land |
— | $ | 6,084 | $ | 9,130 | |||||
| Building and leasehold improvements |
1-30 | 35,816 | 51,995 | |||||||
| Equipment |
3-5 | 22,617 | 30,509 | |||||||
| Sub-total |
64,517 | 91,634 | ||||||||
| Less accumulated depreciation and amortization |
(29,934 | ) | (31,965 | ) | ||||||
| Total premises and equipment |
$ | 34,583 | $ | 59,669 | ||||||
Depreciation and amortization expense on premises and equipment in 2009, 2008, and 2007 was approximately $5.9 million, $8.0 million, and $8.2 million, respectively.
A-48
Table of Contents
FIRST STATE BANCORPORATION AND SUBSIDIARY
NOTES TO CONSOLIDATED FINANCIAL STATEMENTS—(Continued)
7. Goodwill and Intangible Assets
The excess of cost over the fair value of the net assets of acquired banks is recorded as goodwill. As a result of the Company’s market capitalization being less than stockholders’ equity at June 30, 2008, management performed an analysis to determine whether and to what extent the Company’s goodwill may have been impaired. The Company has one reporting unit. The estimated fair value of the Company, which was less than the Company’s stockholders’ equity balance at June 30, 2008, was determined using three methods: comparable transactions; discounted cash flow models; and a market premium approach. Because of the requirements defined in the ASC Topic 350, “Intangibles – Goodwill and Other,” the market premium approach, based on the fair value of the Company’s common stock on June 30, 2008, plus a control premium, received significant weighting in the analysis at the June 30, 2008 testing date. The second step of the analysis compared the implied fair value of goodwill to the carrying amount of goodwill on the Company’s balance sheet. If the carrying amount of the goodwill exceeds the implied fair value of that goodwill, an impairment loss must be recognized in an amount equal to the excess. The implied fair value of the Company’s goodwill was determined in the same manner as goodwill recognized in a business combination. That is, the estimated fair value of the Company on the test date is allocated to all of the Company’s individual assets and liabilities, including any unrecognized identifiable intangible assets, as if the Company had been acquired in a business combination with the estimated fair value of the Company representing the price paid to acquire it. The allocation process performed on the test date is only for purposes of determining the implied fair value of goodwill and no assets or liabilities are written up or down, nor are any additional unrecognized identifiable intangible assets recorded as part of this process. Based on the analysis, it was determined that the implied fair value of the Company’s goodwill was zero, resulting in the recognition of a goodwill impairment charge to earnings of $127.4 million in June 2008. The goodwill impairment charge had no effect on the Company’s or the Bank’s cash balances or liquidity.
Following is a summary of the changes in the carrying amount of goodwill:
| Year Ended December 31, 2008 | ||||
| (Dollars in thousands) | ||||
| Balance at beginning of year |
$ | 127,365 | ||
| Goodwill acquired |
— | |||
| Goodwill impairment charge |
(127,365 | ) | ||
| Balance at end of year |
$ | — | ||
The Company’s core deposit intangibles primarily relate to the acquisitions Access Anytime Bancorp, Inc. and New Mexico Financial Corporation in January 2006. Core deposit intangibles recognized in the Access and NMFC acquisitions totaled approximately $6.4 million and $3.6 million, respectively. The core deposit intangibles are being amortized over their estimated useful lives of ten years. In conjunction with the sale of our Colorado branches in June 2009, $8.1 million and $242,000 of core deposit intangibles, net of accumulated amortization from the Front Range acquisition and the FCIB acquisition, respectively, were written off and netted against the pretax gain from the sale. The Company has reviewed its remaining core deposit intangibles for potential impairment and did not determine any indication of impairment.
Following is a summary of intangible assets:
| As of December 31, | ||||||||
| 2009 | 2008 | |||||||
| (Dollars in thousands) | ||||||||
| Core deposit intangibles |
$ | 10,024 | $ | 22,132 | ||||
| Accumulated amortization |
(4,622 | ) | (6,603 | ) | ||||
| Net core deposit intangibles |
$ | 5,402 | $ | 15,529 | ||||
A-49
Table of Contents
FIRST STATE BANCORPORATION AND SUBSIDIARY
NOTES TO CONSOLIDATED FINANCIAL STATEMENTS—(Continued)
Expected future annual amortization expense related to core deposit intangibles is as follows:
| Years ending December 31, | |||
| (Dollars in thousands) | |||
| 2010 |
$ | 1,046 | |
| 2011 |
946 | ||
| 2012 |
909 | ||
| 2013 |
871 | ||
| 2014 |
834 | ||
| Thereafter |
796 | ||
| Total expected future annual amortization expense |
$ | 5,402 | |
8. Deposits
Following is a summary of interest-bearing deposits:
| As of December 31, | ||||||
| 2009 | 2008 | |||||
| (Dollars in thousands) | ||||||
| Interest-bearing checking accounts |
$ | 353,705 | $ | 296,732 | ||
| Money market savings |
381,566 | 471,011 | ||||
| Regular savings |
88,044 | 100,691 | ||||
| Time: |
||||||
| Denominations $100,000 and over |
482,480 | 684,075 | ||||
| Denominations under $100,000 |
377,829 | 516,714 | ||||
| Total interest-bearing deposits |
$ | 1,683,624 | $ | 2,069,223 | ||
At December 31, 2009, the scheduled maturities of all time deposits are as follows:
| Years ending December 31, | |||
| (Dollars in thousands) | |||
| 2010 |
$ | 666,545 | |
| 2011 |
142,739 | ||
| 2012 |
24,655 | ||
| 2013 |
24,877 | ||
| 2014 |
1,493 | ||
| Total time deposits |
$ | 860,309 | |
Deposits at December 31, 2009 and 2008 included approximately $201.7 million and $403.9 million, respectively, of brokered deposits. The brokered deposit balances in 2009 and 2008 include $56.7 million and $212.2 million, respectively, of CDARS reciprocal deposits which represent customer funds and are considered part of the Bank’s core funding. The Bank has historically used other brokered deposits as wholesale funding sources. The Bank is currently prohibited, in accordance with the Regulatory Agreement, from accepting any new brokered deposits, even if the Bank is considered well capitalized. In addition, because the Bank is considered “adequately capitalized” under regulatory guidelines, the Bank cannot accept, renew, or roll over brokered deposits except with a waiver from the FDIC. The Bank is not currently seeking a waiver from the FDIC. See Note 14 for further information on regulatory matters.
9. Borrowings
Securities Sold Under Agreements to Repurchase
Securities sold under agreements to repurchase are comprised of customer deposit agreements with overnight maturities. The obligations are not federally insured but are collateralized 102% by a security interest in U.S. Treasury, U.S. government agencies, or U.S. government agency issued mortgage-backed securities. These securities are segregated and held in safekeeping by third-party banks. These securities had a market value of approximately $41.7 million and $115.1 million, at December 31, 2009 and 2008, respectively. Interest expense included in the consolidated statements of operations was approximately $160,000, $2.6 million, and $8.1 million for the years ended December 31, 2009, 2008, and 2007, respectively.
A-50
Table of Contents
FIRST STATE BANCORPORATION AND SUBSIDIARY
NOTES TO CONSOLIDATED FINANCIAL STATEMENTS—(Continued)
Securities sold under agreements to repurchase are summarized as follows:
| Years ended December 31, | ||||||||
| 2009 | 2008 | |||||||
| (Dollars in thousands) | ||||||||
| Balance |
$ | 40,646 | $ | 112,276 | ||||
| Weighted average interest rate |
0.25 | % | 0.51 | % | ||||
| Maximum amount outstanding at any month end |
$ | 131,618 | $ | 198,030 | ||||
| Average balance outstanding during the period |
$ | 61,291 | $ | 175,433 | ||||
| Weighted average interest rate during the period |
0.26 | % | 1.51 | % | ||||
Federal Funds Purchased
Federal funds purchased generally mature within one to four days from the transaction date. As of December 31, 2009 and 2008, federal funds purchased totaled zero. Interest expense included in the consolidated statements of operations was approximately $21,000, $23,000, and $4,000 for the years ended December 31, 2009, 2008, and 2007, respectively. As of December 31, 2009, the Company had available unused federal funds borrowing capacity of $75.5 million.
Federal Home Loan Bank Advances and Other
First Community Bank has FHLB advances and notes payable as follows:
| As of December 31, | ||||||
| 2009 | 2008 | |||||
| (Dollars in thousands) | ||||||
| $198 million note payable to FHLB, interest at 0.05%, due on January 2, 2009 |
$ | — | $ | 198,000 | ||
| $200 million note payable to FHLB, interest at 0.50%, due on January 2, 2009 |
— | 200,000 | ||||
| $30 million note payable to FHLB, interest only at 2.42% payable monthly, due on April 2, 2009 |
— | 30,000 | ||||
| $30 million note payable to FHLB, interest only at 2.66%, payable monthly, due on October 2, 2009 |
— | 30,000 | ||||
| $30 million note payable to FHLB, interest only at 2.73%, payable monthly, due on April 12, 2010 |
30,000 | 30,000 | ||||
| $75 million note payable to FHLB, interest only at 0.10%, payable monthly, due on January 14, 2010 |
75,000 | — | ||||
| $30 million note payable to FHLB, interest only at 0.12%, payable monthly due on January 25, 2010 |
30,000 | — | ||||
| $75 million note payable to FHLB, interest only at 1.85%, payable monthly, due on January 29, 2010 |
75,000 | — | ||||
| $25 million note payable to FHLB, interest only at 2.07%, payable monthly due on July 30, 2010 |
25,000 | — | ||||
| $75 million note payable to FHLB, interest only at 2.27%, payable monthly, due on September 20, 2010 |
75,000 | — | ||||
| $25 million note payable to FHLB, interest only at 2.34%, payable monthly, due on January 31, 2011 |
25,000 | — | ||||
| $50 million note payable to FHLB, interest only at 2.48%, payable monthly, due on February 28, 2011 |
50,000 | — | ||||
| $75 million note payable to FHLB, interest only at 2.66%, payable monthly, due on August 29, 2011 |
75,000 | — | ||||
| $30 million note payable to FHLB, interest only at 2.54%, payable monthly, due on April 2, 2012 |
30,000 | — | ||||
| $7.5 million note payable to FHLB, interest at 5.75%, payable in monthly principal and interest installments of approximately $144,000 through August 1, 2011 |
2,742 | 4,266 | ||||
| $7.5 million note payable to FHLB, interest at 5.78%, payable in monthly principal and interest installments of approximately $109,000 through August 1, 2013 |
4,304 | 5,328 | ||||
| Total FHLB advances and other |
$ | 497,046 | $ | 497,594 | ||
All outstanding borrowings with the FHLB are collateralized by a custody arrangement, whereby the FHLB has custody and endorsement of the loans that collateralize the FHLB borrowings. In late March, 2009, the FHLB notified the Company that it no longer has the ability to draw down additional advances. Borrowings, as they mature, will be allowed to continuously renew for like amounts, but for terms not to exceed thirty days.
A-51
Table of Contents
FIRST STATE BANCORPORATION AND SUBSIDIARY
NOTES TO CONSOLIDATED FINANCIAL STATEMENTS—(Continued)
Under the terms of the Bank’s agreement with the FHLB, the FHLB may at its own option call the outstanding debt due and payable if any of the following have occurred: the Bank has suspended payment to any creditor or there has been an acceleration of the maturity of any indebtedness of the Bank to others; the FHLB reasonably and in good faith determines that a material adverse change has occurred in the financial condition of the Bank; or the FHLB reasonably and in good faith deems itself insecure in the collateral even though the Bank is not otherwise in default. The Company has not received any notice from the FHLB regarding a call of its outstanding debt.
Short-term (original term less than one year) FHLB advances are summarized as follows:
| Years ended December 31, | ||||||||
| 2009 | 2008 | |||||||
| (Dollars in thousands) | ||||||||
| Balance |
$ | 180,000 | $ | 428,000 | ||||
| Weighted average interest rate |
0.83 | % | 0.43 | % | ||||
| Maximum amount outstanding at any month end |
$ | 298,900 | $ | 448,100 | ||||
| Average balance outstanding during the period |
$ | 187,418 | $ | 307,588 | ||||
| Weighted average interest rate during the period |
1.18 | % | 2.20 | % | ||||
As of December 31, 2009, the contractual maturities of FHLB advances are as follows:
| Years ending December 31, | |||
| (Dollars in thousands) | |||
| 2010 |
$ | 312,698 | |
| 2011 |
152,278 | ||
| 2012 |
31,218 | ||
| 2013 |
852 | ||
| Total FHLB advances |
$ | 497,046 | |
10. Junior Subordinated Debentures
On August 20, 2004, the Company formed First State NM Statutory Trust III (“Trust III”) for the purpose of issuing trust preferred securities (“Trust III Securities”) in a pooled transaction to unrelated investors. Trust III issued $5,000,000 of Trust III Securities that qualify as capital for regulatory purposes that bear interest at an annual rate equal to the three-month LIBOR plus 2.25% and invested the proceeds thereof in $5,155,000 of junior subordinated deferrable interest debentures of the Company (“Trust III Debentures”) that also bear interest at an annual rate equal to the three-month LIBOR plus 2.25%. The Trust III Securities and Trust III Debentures provide interest only payments payable at three-month intervals with the rate adjusted quarterly on March 20, June 20, September 20, and December 20 (2.50% at December 31, 2009). Both the Trust III Securities and the Trust III Debentures will mature on September 20, 2034; however, they are callable at par beginning September 20, 2009. So long as there are no events of default, the Company may defer payments of interest for up to twenty consecutive interest payment periods.
On May 26, 2005, the Company formed First State NM Statutory Trust IV (“Trust IV”) for the purpose of issuing trust preferred securities (“Trust IV Securities”) in a pooled transaction to unrelated investors. Trust IV issued $10,000,000 of Trust IV Securities that qualify as capital for regulatory purposes that bear interest at an annual rate equal to the three-month LIBOR plus 1.75% and invested the proceeds thereof in $10,310,000 of junior subordinated deferrable interest debentures of the Company (“Trust IV Debentures”) that also bear interest at an annual rate equal to the three-month LIBOR plus 1.75%. The Trust IV Securities and the Trust IV Debentures provide interest only payments payable at three-month intervals with the rate adjusted quarterly on March 15, June 15, September 15, and December 15 (2.00% at December 31, 2009). Both the Trust IV Securities and the Trust IV Debentures will mature on June 15, 2035; however, they are callable at par beginning June 15, 2010. So long as there are no events of default, the Company may defer payments of interest for up to twenty consecutive interest payment periods.
On November 22, 2006, the Company formed First State NM Statutory Trust V (“Trust V”) for the purpose of issuing trust preferred securities (“Trust V Securities”) in a pooled transaction to unrelated investors. Trust V issued $7,500,000 of Trust V Securities that qualify as capital for regulatory purposes that bear interest at an annual rate equal to the three-month LIBOR plus 1.75% and invested the proceeds thereof in $7,732,000 of junior subordinated deferrable interest debentures of the Company (“Trust V Debentures”) that also bear interest at an annual rate equal to the three-month LIBOR plus 1.75%. The Trust V Securities and the Trust V Debentures provide interest only payments payable at three-month intervals with the rate adjusted quarterly on March 15, June 15, September 15, and December 15 (2.00% at December 31, 2009). Both the Trust V Securities and the Trust V Debentures will mature on December 15, 2036; however, they are callable at par beginning December 15, 2011. So long as there are no events of default, the Company may defer payments of interest for up to twenty consecutive interest payment periods.
A-52
Table of Contents
FIRST STATE BANCORPORATION AND SUBSIDIARY
NOTES TO CONSOLIDATED FINANCIAL STATEMENTS—(Continued)
On March 22, 2007, the Company formed First State NM Statutory Trust VI (“Trust VI”) for the purpose of issuing trust preferred securities (“Trust VI Securities”) in a pooled transaction to unrelated investors. Trust VI issued $20,000,000 of Trust VI Securities that qualify as capital for regulatory purposes that bear interest at an annual rate equal to the three-month LIBOR plus 1.65% and invested the proceeds thereof in $20,619,000 of junior subordinated deferrable interest debentures of the Company (“Trust VI Debentures”) that also bear interest at an annual rate equal to the three-month LIBOR plus 1.65%. The Trust VI Securities and the Trust VI Debentures provide interest only payments payable at three-month intervals with the rate adjusted quarterly on March 15, June 15, September 15, and December 15 (1.90% at December 31, 2009). Both the Trust VI Securities and the Trust VI Debentures will mature on June 15, 2037; however, they are callable at par beginning June 15, 2012. So long as there are no events of default, the Company may defer payments of interest for up to twenty consecutive interest payment periods.
On May 14, 2007, the Company formed First State NM Statutory Trust VII (“Trust VII”) for the purpose of issuing trust preferred securities (“Trust VII Securities”) in a pooled transaction to unrelated investors. Trust VII issued $21,000,000 ($10,000,000 on May 15, 2007 and $11,000,000 on June 29, 2007) of Trust VII Securities that qualify as capital for regulatory purposes that bear interest at an annual rate equal to the three-month LIBOR plus 1.45% and invested the proceeds thereof in $21,651,000 ($10,310,000 on May 15, 2007 and $11,341,000 on June 29, 2007) of junior subordinated deferrable interest debentures of the Company (“Trust VII Debentures”) that also bear interest at an annual rate equal to the three-month LIBOR plus 1.45%. The Trust VII Securities and the Trust VII Debentures provide interest only payments payable at three-month intervals with the rate adjusted quarterly on March 6, June 6, September 6, and December 6 (1.71% at December 31, 2009). Both the Trust VII Securities and the Trust VII Debentures will mature on September 6, 2037; however, they are callable at par beginning September 6, 2012. So long as there are no events of default, the Company may defer payments of interest for up to twenty consecutive interest payment periods.
On September 12, 2007, the Company formed First State NM Statutory Trust VIII (“Trust VIII”) for the purpose of issuing trust preferred securities (“Trust VIII Securities”) in a pooled transaction to unrelated investors. Trust VIII issued $22,500,000 of Trust VIII Securities that qualify as capital for regulatory purposes that bear interest at an annual rate equal to the three-month LIBOR plus 1.35% and invested the proceeds thereof in $23,196,000 of junior subordinated deferrable interest debentures of the Company (“Trust VIII Debentures”) that also bear interest at an annual rate equal to the three-month LIBOR plus 1.35%. The Trust VIII Securities and the Trust VIII Debentures provide interest only payments payable at three-month intervals with the rate adjusted quarterly on January 30, April 30, July 30, and October 30 (1.63% at December 31, 2009). Both the Trust VIII Securities and the Trust VIII Debentures will mature on October 30, 2037; however, they are callable at par beginning October 30, 2012. So long as there are no events of default, the Company may defer payments of interest for up to twenty consecutive interest payment periods.
On November 3, 2005, Front Range Capital formed Front Range Capital Trust II (“Front Range Trust II”) for the purpose of issuing trust preferred securities (“Front Range Trust II Securities”) in a pooled transaction to unrelated investors. Effective March 1, 2007, as a result of the Company’s acquisition of Front Range, the Company assumed all the duties, warranties, and obligations of Front Range in relation to the Front Range Trust II Securities and the Front Range Trust II Debentures. Front Range Trust II issued $9,200,000 of Front Range Trust II Securities that qualify as capital for regulatory purposes that bear interest at a fixed annual rate of 8.50% through the interest payment date on February 23, 2011 and a variable annual rate equal to the three-month LIBOR plus 3.45% thereafter and invested the proceeds thereof in $9,485,000 of junior subordinated deferrable interest debentures of Front Range (“Front Range Trust II Debentures”) that also bear interest at a fixed annual rate of 8.5% through the interest payment date on February 23, 2011 and a variable annual rate equal to the three-month LIBOR plus 3.45% thereafter. The Front Range Trust II Securities and the Front Range Trust II Debentures provide interest only payments payable at three-month intervals on February 23, May 23, August 23, and November 23. Both the Front Range Trust II Securities and the Front Range Trust II Debentures will mature on February 23, 2036; however, they are callable at par on February 23, 2011. So long as there are no events of default, payments of interest may be deferred for up to twenty consecutive interest payment periods.
In conjunction with the purchase accounting for the acquisition of Front Range, Front Range Trust II was recorded at fair value on the date of acquisition. Front Range Trust II had an initial purchase accounting adjustment of approximately $587,000. The purchase accounting adjustment for Front Range Capital Trust II is being amortized through February 2011, the date through which the securities and debentures bear interest at a fixed rate and can be called or redeemed at par. At December 31, 2009, the remaining fair value adjustment for Front Range Trust II was approximately $171,000.
A-53
Table of Contents
FIRST STATE BANCORPORATION AND SUBSIDIARY
NOTES TO CONSOLIDATED FINANCIAL STATEMENTS—(Continued)
For liquidity and capital ratio purposes, in September 2008 the Company began notifying the holders of all of the trust preferred securities that the quarterly interest payments would be deferred, as allowed by the terms of the securities.
Junior Subordinated Debentures are summarized as follows:
| As of December 31, | ||||||
| 2009 | 2008 | |||||
| (Dollars in thousands) | ||||||
| Junior Subordinated Debentures—Trust III |
$ | 5,155 | $ | 5,155 | ||
| Junior Subordinated Debentures—Trust IV |
10,310 | 10,310 | ||||
| Junior Subordinated Debentures—Trust V |
7,732 | 7,732 | ||||
| Junior Subordinated Debentures—Trust VI |
20,619 | 20,619 | ||||
| Junior Subordinated Debentures—Trust VII |
21,651 | 21,651 | ||||
| Junior Subordinated Debentures—Trust VIII |
23,196 | 23,196 | ||||
| Junior Subordinated Debentures—Front Range Capital Trust II |
9,485 | 9,485 | ||||
| Purchase Accounting Adjustment |
171 | 318 | ||||
| Total Junior Subordinated Debentures |
$ | 98,319 | $ | 98,466 | ||
11. Income Taxes
Income tax expense (benefit) consisted of the following:
| Years ended December 31, | |||||||||||
| 2009 | 2008 | 2007 | |||||||||
| (Dollars in thousands) | |||||||||||
| Current: |
|||||||||||
| Federal |
$ | (25,159 | ) | $ | 717 | $ | 6,327 | ||||
| State |
(67 | ) | 310 | 742 | |||||||
| Deferred: |
|||||||||||
| Federal |
3,604 | (6,148 | ) | 5,703 | |||||||
| State |
755 | (502 | ) | 540 | |||||||
| Total expense (benefit) |
$ | (20,867 | ) | $ | (5,623 | ) | $ | 13,312 | |||
Actual income tax expense (benefit) from continuing operations differs from the “expected” tax expense (benefit) for 2009, 2008, and 2007 (computed by applying the U.S. federal corporate tax rate of 35% to income before income taxes) as follows:
| Years ended December 31, | ||||||||||||
| 2009 | 2008 | 2007 | ||||||||||
| (Dollars in thousands) | ||||||||||||
| Computed “expected” tax expense (benefit) |
$ | (45,976 | ) | $ | (55,740 | ) | $ | 13,342 | ||||
| Increase (reduction) in income taxes resulting from: |
||||||||||||
| Tax-exempt interest |
(882 | ) | (1,252 | ) | (832 | ) | ||||||
| State tax, net |
(5,594 | ) | (2,602 | ) | 827 | |||||||
| Non-deductible goodwill |
— | 26,088 | — | |||||||||
| Bank-owned life insurance |
2,653 | (631 | ) | (745 | ) | |||||||
| Change in valuation allowance |
32,693 | 29,000 | — | |||||||||
| Change in unrealized gain/loss effect on valuation allowance |
(1,861 | ) | — | — | ||||||||
| Change in deferred rate – effect on valuation allowance |
(1,392 | ) | — | — | ||||||||
| Other |
(508 | ) | (486 | ) | 720 | |||||||
| Total income tax expense (benefit) |
$ | (20,867 | ) | $ | (5,623 | ) | $ | 13,312 | ||||
A-54
Table of Contents
FIRST STATE BANCORPORATION AND SUBSIDIARY
NOTES TO CONSOLIDATED FINANCIAL STATEMENTS—(Continued)
Deferred income taxes reflect the net tax effect of temporary differences between the carrying amounts of assets and liabilities for financial reporting purposes and the amounts used for tax purposes. Components of deferred income tax assets and liabilities are as follows:
| As of December 31, | ||||||||
| 2009 | 2008 | |||||||
| (Dollars in thousands) | ||||||||
| Deferred tax assets: |
||||||||
| Allowance for loan losses |
$ | 47,623 | $ | 25,388 | ||||
| Capital loss carry-forward |
— | 195 | ||||||
| Share-based compensation expense |
822 | 767 | ||||||
| Goodwill |
2,476 | 11,636 | ||||||
| Deferred gain on sale |
835 | 998 | ||||||
| Fair value adjustments—acquisitions |
252 | 1,945 | ||||||
| Deferred compensation |
1,867 | 1,520 | ||||||
| Other real estate owned |
5,032 | 3,369 | ||||||
| State NOL |
5,829 | — | ||||||
| AMT Credits |
3,693 | — | ||||||
| Other |
697 | 228 | ||||||
| Total gross deferred tax assets |
69,126 | 46,046 | ||||||
| Deferred tax liabilities: |
||||||||
| Prepaid expenses |
1,185 | 837 | ||||||
| Depreciation |
1,509 | 1,756 | ||||||
| Core deposit intangible |
2,134 | 5,691 | ||||||
| Tax effect of unrealized gain on investment securities |
333 | 2,194 | ||||||
| Other |
501 | 308 | ||||||
| Total gross deferred tax liabilities |
5,662 | 10,786 | ||||||
| Valuation allowance |
(61,693 | ) | (29,000 | ) | ||||
| Net deferred tax asset (liability) |
$ | 1,771 | $ | 6,260 | ||||
Deferred tax assets and liabilities are recognized for the tax effects of differing carrying values of assets and liabilities for tax and financial statement purposes that will reverse in future periods. The Company conducts periodic evaluations to determine whether it is more likely than not that some or all of its deferred tax assets will not be realized. Among the factors considered in this evaluation are the availability of tax carry-back benefits, estimates of future earnings, the future reversal of temporary differences and the impact of tax planning strategies that can be implemented if warranted. The Company is required to provide a valuation allowance for any portion of its deferred tax assets that, more likely than not, will not be realized at December 31, 2009. Based on this evaluation, the Company recorded a deferred tax asset valuation of $61.7 and $29.0 million at December 31, 2009 and 2008. The $1.8 million net deferred tax asset at December 31, 2009 represents the carry-back of projected 2010 taxable loss against 2008 taxes paid, taking into consideration alternative minimum tax carry-back limitations. The Company continually monitors forecast information to ensure the valuation allowance is at the appropriate value. The Company also recorded and expects to receive a current federal tax benefit of approximately $27.0 million resulting from the carry-back of the tax loss sustained during 2009. This $27.0 million is included in the $28.1 million income tax receivable on the consolidated balance sheet at December 31, 2009. This benefit resulted from recently enacted legislation which allowed corporations the ability to carry-back 2008 or 2009 net operating losses five years. For 2010 and forward, the net operating losses for federal tax purposes can be carried back two years and carried forward twenty years. The Company elected to carry-back its 2009 losses for purposes of the five year carry-back provision. For state purposes, New Mexico and Arizona have carry-forward periods of five years, Utah has a carry-forward period of fifteen years, and Colorado has a carry-forward period of twenty years. Utah has a carry-back period of three years. After the Colorado branch sale in June, 2009, the Company increased the estimated rate at which net deferred taxes are expected to be realized to 39.5%.
As required by ASC Topic 740, “Income Taxes”, the Company recognizes the financial statement benefit of a tax position only after determining that the relevant tax authority would more likely than not sustain the position following an audit. For tax positions meeting the more-likely-than-not threshold, the amount recognized in the financial statements is the largest benefit that has a greater than 50 percent likelihood of being realized upon ultimate settlement with the relevant tax authority. The Company has no material unrecognized tax benefits.
The Company’s policy is to recognize interest related to unrecognized tax benefits as interest expense and penalties as operating expenses. No accrued interest or penalties have been booked at December 31, 2009. We believe that we have appropriate support for the income tax positions taken and to be taken on our tax returns and that our accruals for tax liabilities are adequate for all open years based on an assessment of many factors including past experience and interpretations of tax law applied to the facts of each matter.
A-55
Table of Contents
FIRST STATE BANCORPORATION AND SUBSIDIARY
NOTES TO CONSOLIDATED FINANCIAL STATEMENTS—(Continued)
Because there are no material unrecognized tax benefits, there will not be an impact to the effective tax rate in a future period. We do not expect the total amounts of unrecognized tax benefits to increase within 12 months.
Tax returns filed in previous years are subject to audit by various federal and state taxing authorities and as a result of such audits, additional tax assessments may be proposed. The following tax years remain open to income tax examination for each of the more significant jurisdictions where the Company is subject to income taxes: tax years after 2005 remain open to U.S. federal, New Mexico. Colorado, and Utah income tax examination; and tax years after 2004 remain open to Arizona income tax examination.
12. Stockholders’ Equity
On March 26, 2007, the Board of Directors authorized the repurchase, through a revised share repurchase program, of up to five percent of the then current 20,825,782 outstanding shares, or approximately 1,040,000 shares. As of December 31, 2009, the Company had purchased 902,700 shares under the revised program. The Company sponsors a deferred compensation plan, which is included in the consolidated financial statements. At December 31, 2009 and 2008, the assets of the deferred compensation plan included 34,542 shares of Company common stock. Under the previously authorized repurchase program, the Company had purchased 784,100 shares, excluding the deferred compensation plan shares.
Effective June 6, 2003, the stockholders of the Company approved and the Company adopted the First State Bancorporation 2003 Equity Incentive Plan (“2003 Plan”), which provided for the granting of options to purchase up to 1,500,000 shares of the Company’s common stock. Effective June 2, 2006, the stockholders of the Company approved an amendment to the 2003 Plan to increase the number of shares available for grant from 1,500,000 to 2,000,000. Exercise dates and prices for option grants are set by the Compensation Committee of the Board of Directors. The 2003 Plan provides that stock options (which may be incentive stock options or non-qualified stock options), restricted stock, stock appreciation rights, and other awards that are valued by reference to Company common stock may be issued. The options granted vest over a five-year period from the date of grant unless otherwise stated and have a contractual term of the shorter of the term set in the option agreement or ten years. The 2003 Plan replaced the First State Bancorporation 1993 Stock Option Plan (“1993 Plan”), and all unissued options from the 1993 Plan are included in the total number of shares available for grant under the 2003 Plan. No outstanding awards under the 1993 Plan or the 2003 Plan may be repriced. In conjunction with the 2007 Board of Directors approval of the Key Executives Incentive Plan, 216,635 options have been issued under the 2003 Plan that will vest upon the occurrence of certain events (performance based awards). The criteria for these performance based options are measured for certain three year performance periods.
Options under the plans are as follows:
| Shares | Weighted average exercise price |
Weighted average remaining contractual life |
Aggregate intrinsic value | ||||||||
| (Dollars in thousands) | |||||||||||
| Outstanding at December 31, 2008 |
1,772,980 | $ | 14.82 | ||||||||
| Granted |
10,000 | 1.53 | |||||||||
| Exercised |
— | — | |||||||||
| Expired |
(199,834 | ) | 13.36 | ||||||||
| Forfeited |
(472,664 | ) | 14.36 | ||||||||
| Outstanding at December 31, 2009 |
1,110,482 | $ | 15.16 | 4.35 | $ | — | |||||
| At December 31, 2009: Vested and expected to vest |
1,024,958 | $ | 15.41 | 4.26 | $ | — | |||||
| Exercisable |
691,595 | $ | 16.76 | 2.96 | $ | — | |||||
The aggregate intrinsic value in the preceding table represents the total pretax intrinsic value, based on the Company’s closing stock price of $0.40 as of December 31, 2009, the last business day of the year, which would have been received by the option holders had all option holders exercised their options as of that date.
A-56
Table of Contents
FIRST STATE BANCORPORATION AND SUBSIDIARY
NOTES TO CONSOLIDATED FINANCIAL STATEMENTS—(Continued)
For the years ended December 31, 2009, 2008, and 2007 the Company recorded approximately $592,000, $841,000, and $1.1 million respectively, of pretax share-based compensation expense, pursuant to the grant of options and restricted stock in salaries and employee benefits. The deferred income tax benefit associated with this compensation expense was approximately $24,000, $218,000, and $152,000 for the years ended December 31, 2009, 2008, and 2007, respectively. In addition, for the year ended December 31, 2007, the Company received an income tax benefit of approximately $963,000 related to the exercise of nonqualifying employee stock options and vesting of restricted stock awards. There were no exercises of stock options during the year ended December 31, 2009, and there was no tax benefit for vesting of restricted stock, due to the decline in the market value of the Company’s common stock. At December 31, 2009, 2008, and 2007, management believed that the performance targets under the Key Executives Incentive Plan, for the first and second performance periods, January 1, 2007 to December 31, 2009, and January 1, 2008 to December 31, 2010, were not probable of achievement. Therefore, no compensation expense was recognized for these options for the years ended December 31, 2008 and 2007, respectively. For the first performance period, January 1, 2007 to December 31, 2009, the performance levels were not met and as such, 94,590 options did not vest and were cancelled. In accordance with the First Amendment to the Key Executives Incentive Plan, the Company’s Board of Directors declined the grant of performance options for the third performance period, January 1, 2009 to December 31, 2011. As of December 31, 2009, there was approximately $1.6 million of remaining unamortized share-based compensation expense associated with unvested stock options which will be expensed over a weighted average remaining service period of approximately 2.0 years.
The total pretax intrinsic value of options exercised during the year ended December 31, 2007 was approximately $2.7 million.
Significant option groups outstanding and exercisable at December 31, 2009, and related average price and life information follows:
| Grant price |
Options outstanding |
Weighted average remaining life (yrs) |
Weighted average exercise price |
Options exercisable |
Weighted average exercise price | |||||||
| $ 6.39 – 12.47 |
253,027 | 7.81 | $ | 8.39 | 35,140 | $ | 11.36 | |||||
| 14.98 – 15.71 |
308,000 | 2.43 | 15.33 | 264,000 | 15.38 | |||||||
| 16.07 – 16.07 |
400,000 | 3.01 | 16.07 | 288,000 | 16.07 | |||||||
| 17.24 – 25.77 |
146,955 | 6.06 | 23.78 | 102,955 | 23.95 | |||||||
| 25.95 – 25.95 |
2,500 | 6.82 | 25.95 | 1,500 | 25.95 | |||||||
| 1,110,482 | 4.35 | $ | 15.16 | 691,595 | $ | 16.76 | ||||||
The Company estimated the weighted average fair value of options granted in 2009, 2008, and 2007 to be approximately $0.91, $2.59, and $5.63, respectively, using the Black-Scholes option pricing model. The fair value of each stock option grant is estimated using the Black-Scholes option pricing model with the following weighted average assumptions:
| Years Ended December 31, | |||||||||
| 2009 | 2008 | 2007 | |||||||
| Risk-free interest rate |
1.65 | % | 3.04 | % | 4.62 | % | |||
| Expected dividend yield |
— | % | 3.11 | % | 1.91 | % | |||
| Expected life (years) |
6.50 | 7.18 | 6.43 | ||||||
| Expected volatility |
62.07 | % | 36.87 | % | 27.05 | % | |||
The following table summarizes our restricted stock awards activity during the year ended December 31, 2009.
| Shares | Weighted average grant date fair value | |||||
| Nonvested at December 31, 2008 |
7,210 | $ | 21.57 | |||
| Granted |
— | — | ||||
| Vested |
(2,828 | ) | 20.94 | |||
| Forfetied |
(2,581 | ) | 21.92 | |||
| Nonvested at December 31, 2009 |
1,801 | $ | 22.06 | |||
As of December 31, 2009, there was approximately $18,000 of remaining unamortized share-based compensation expense associated with restricted stock awards, which will be expensed over a weighted average remaining service period of approximately 0.8 years. The total fair value of shares vested during the years ended December 31, 2009, 2008, and 2007, was approximately $3,000, $32,000, and $192,000, respectively.
A-57
Table of Contents
FIRST STATE BANCORPORATION AND SUBSIDIARY
NOTES TO CONSOLIDATED FINANCIAL STATEMENTS—(Continued)
13. Commitments and Contingencies
Employee Benefit Plans
First Community Bank sponsors an employee tax-sheltered savings plan for substantially all full-time employees, which provides a mandatory 50% match (through December 31, 2009) by First Community Bank of employee contributions up to a maximum of 6% of gross annual wages. Full vesting occurs after three years. Effective January 1, 2010, the plan was amended to make matching contributions discretionary. The Company’s contributions to the plan totaled approximately $757,000 in 2009, $908,000 in 2008, and $851,000 in 2007.
In 2003, the Company established a nonqualified deferred compensation plan for certain of its executive employees and non-employee directors. The deferred compensation plan allows employees to contribute up to 50% of the employees’ base pay and 100% of the employees’ bonus compensation. Directors of the Company are allowed to contribute up to 100% of their compensation as a director. In addition, an employee with a vested unexercised stock award may elect to defer all or any portion of the stock award. All amounts contributed by employees or directors vest immediately. The Company’s obligation to the participants in the deferred compensation plan is limited to the balance in the deferred compensation plan. The deferred compensation plan is an unfunded, unsecured promise to pay compensation in the future. At December 31, 2009 and 2008, the total assets of the plan were $913,000 and $939,000, respectively, which included an investment of $600,000, carried at amortized cost, in the Company’s common stock. The investment in the Company’s common stock is recorded as treasury stock in the consolidated statement of stockholders’ equity. An offsetting liability is recorded in the consolidated financial statements totaling $913,000 and $939,000. All amounts contributed are subject to an underlying trust and shall be subject to the claims of the general creditors of the Company. Because certain provisions of the plan were not in compliance with the American Jobs Creation Act of 2004 (“Act”), the plan was frozen effective December 31, 2004, and as such, there was no compensation expense for this plan for the years ended December 31, 2009, 2008, and 2007, respectively.
In 2005, the Company established a new nonqualified deferred compensation plan in compliance with the Act for certain of its highly compensated or management employees. The new plan allows employees to contribute up to 50% of the employees’ base pay and 100% of the employees’ bonus compensation. All amounts contributed by employees vest immediately. The Company’s obligation to the participants in the deferred compensation plan is limited to the balance in the deferred compensation plan. All amounts payable by the Company are in cash only. The deferred compensation plan is an unfunded, unsecured promise to pay compensation in the future. At December 31, 2009 and 2008, the total assets of the plan were $337,000 and $232,000, respectively. An offsetting liability is recorded in the consolidated financial statements totaling $337,000 and $232,000. The Company’s compensation expense was $43,000 for the year ended December 31, 2009, and $65,000 for this plan for each of the years ended December 31, 2008, and 2007. All amounts contributed are subject to an underlying trust and shall be subject to the claims of the general creditors of the Company.
In conjunction with the Front Range acquisition, the Company assumed the liability for the deferred compensation plans of Heritage Bank. The intention of the plans was to provide certain Heritage Bank key management employees with benefits upon retirement, death, disability, or other termination of employment, including termination of employment under a change in control. Vesting was based on age and years of service. Vesting under the years of service requirement accelerated for all participants at the acquisition date. For participants terminated after the acquisition date, vesting based on age also accelerated, and monthly payments began immediately after termination. All amounts payable by the Company are in cash only. Each plan is an unfunded, unsecured promise to pay compensation in the future. The liability recorded under these agreements at December 31, 2009 and 2008 was approximately $4.2 million and $4.4 million, respectively. The expense related to these deferred compensation agreements for the years ended December 31, 2009 and 2008, was approximately $291,000 and $305,000, respectively, representing the imputed interest on the obligation.
A-58
Table of Contents
FIRST STATE BANCORPORATION AND SUBSIDIARY
NOTES TO CONSOLIDATED FINANCIAL STATEMENTS—(Continued)
Leases
The Company leases certain of its premises and equipment under noncancellable operating leases from certain related and unrelated parties. Certain of the lease agreements contain rent holidays and rent escalation provisions. Rent holidays and rent escalation provisions are considered in determining straight line rent expense to be recorded over the lease term. Lease renewal periods are generally not included in the initial lease term. Rent expense for the years ended December 31, 2009, 2008, and 2007, totaled approximately $6.2 million, $7.7 million, and $7.3 million, respectively. Minimum future payments under these leases at December 31, 2009, are as follows:
| Years ending December 31, | |||
| (Dollars in thousands) | |||
| 2010 |
$ | 5,432 | |
| 2011 |
4,470 | ||
| 2012 |
3,830 | ||
| 2013 |
3,205 | ||
| 2014 |
2,520 | ||
| Thereafter |
7,022 | ||
| Total minimum future lease payments |
$ | 26,479 | |
Financial Instruments with Off-balance Sheet Risk
In the normal course of business, various commitments and contingent liabilities are outstanding, such as standby letters of credit and commitments to extend credit. These financial instruments with off-balance sheet risk are not reflected in the consolidated financial statements. Financial instruments with off-balance sheet risk involve elements of credit risk, interest rate risk, liquidity risk, and market risk. Management does not anticipate any significant losses as a result of these transactions. The following table summarizes these financial instruments:
| As of December 31, | ||||||
| 2009 | 2008 | |||||
| (Dollars in thousands) | ||||||
| Commitments to extend credit |
$ | 167,670 | $ | 404,563 | ||
| Standby letters of credit |
33,686 | 66,756 | ||||
The Bank’s exposure to credit loss in the event of nonperformance by the other party to the financial instrument for commitments to extend credit and standby letters of credit is represented by the contractual notional amount of those instruments. The Bank controls the credit risk of these transactions through credit approvals, limits, and monitoring procedures.
Commitments to extend credit are agreements to lend to a customer as long as there is no violation of any condition established in the contract. Commitments generally have fixed expiration dates or other termination clauses and may require payment of a fee. Since many of the commitments are expected to expire without being drawn upon, the total commitment amounts do not necessarily represent future cash requirements.
Standby letters of credit are written conditional commitments issued by the Bank to guarantee the performance of a customer to a third party. Those guarantees are primarily issued to support public and private borrowing arrangements. The credit risk involved in issuing letters of credit is essentially the same as that involved in extending loan facilities to customers.
The Bank evaluates each customer’s creditworthiness on a case-by-case basis. The amount of collateral obtained, if deemed necessary by the Bank upon extension of credit, is based on management’s credit evaluation of the customer. Collateral held varies but may include accounts receivable, inventory, property, plant and equipment, and income-producing commercial properties.
In connection with mortgage loans originated and sold, the Company typically makes representations and warranties about the underlying assets conforming to specified guidelines. If the underlying assets do not conform to the specifications, the Company may have an obligation to repurchase the assets or indemnify the purchaser against any loss. The Company believes that the potential for loss under these arrangements is remote. The fair value of such obligations is not material.
A-59
Table of Contents
FIRST STATE BANCORPORATION AND SUBSIDIARY
NOTES TO CONSOLIDATED FINANCIAL STATEMENTS—(Continued)
Outstanding Letters of Credit
The Company has outstanding letters of credit from the FHLB that are used to secure certain governmental deposits over and above FDIC limits. At December 31, 2009, the letters of credit were fully collateralized by the Company’s Custody Collateral status with the FHLB as if they were funded FHLB advances. The Company does not currently intend to renew the outstanding letters of credit as they expire. The letters of credit as of December 31, 2009, are summarized in the table below.
| As of December 31, 2009 | |||
| (Dollars in thousands) | |||
| $20.4 million letter of credit, expires January 6, 2010, if not renewed |
$ | 20,400 | |
| $4 million letter of credit, expires February 12, 2010, if not renewed |
4,000 | ||
| $2 million letter of credit, expires February 12, 2010, if not renewed |
2,000 | ||
| $4 million letter of credit, expires February 23, 2010, if not renewed |
4,000 | ||
| $2 million letter of credit, expires February 19, 2010, if not renewed |
2,000 | ||
| $6 million letter of credit, expires March 1, 2010, if not renewed |
6,000 | ||
| $15 million letter of credit, expires March 10, 2010, if not renewed |
15,000 | ||
| $20 million letter of credit, expires March 10, 2010, if not renewed |
20,000 | ||
| Total |
$ | 73,400 | |
Employment Agreements
Certain officers and employees of the Company have entered into employment agreements providing for salaries and benefits. The agreements provide severance for an employee in the event of termination for cause, termination other than for cause, and following a change in control.
Legal Matters
In the normal course of business, the Company is involved in various legal matters. After consultation with legal counsel, management does not believe the outcome of these legal matters will have an adverse impact on the Company’s consolidated financial position or results of operations.
14. Regulatory Matters
The Company and the Bank are subject to various regulatory capital requirements administered by federal banking agencies. Failure to meet minimum capital requirements can initiate certain mandatory—and possibly discretionary—actions by regulators that, if undertaken, could have a direct material effect on the Company’s consolidated financial statements. Under capital adequacy guidelines and the regulatory framework for prompt corrective action, the Company and the Bank must meet specific capital guidelines that involve quantitative measures of the Company’s and the Bank’s assets, liabilities, and certain off-balance sheet items as calculated under regulatory accounting practices. The Company’s and the Bank’s capital amounts and classification are also subject to qualitative judgments by the regulators about components, risk weightings, and other factors.
On July 2, 2009, the Company and the Bank executed the Regulator Agreement. The Regulator Agreement is based on findings of the Regulators identified in an examination of the Bank and the Company during January and February of 2009.
Under the terms of the Regulator Agreement, the Company and the Bank agreed, among other things, to engage an independent consultant acceptable to the Regulators to assess the Bank’s management and staffing needs, assess the qualifications and performance of all officers of the Bank, and assess the current structure and compositions of the Bank’s board of directors and its committees. In addition, within 60 days of the Regulator Agreement, the Company and or the Bank was required to submit a written plan to strengthen lending and credit risk management practices and improve the Bank’s position regarding past due loans, problem loans, classified loans, and other real estate owned; maintain sufficient capital at the Bank, holding company and the consolidated level; improve the Bank’s earnings and overall condition; and improve management of the Bank’s liquidity position, funds management process, and interest rate risk management. The Company and or the Bank have also agreed to maintain an adequate allowance for loan and lease losses; charge-off or collect assets classified as “loss” in the Report of Examination that have not been previously collected or charged off; not to pay any dividends; not to distribute any interest, principal or other sums on trust preferred securities; not to issue, increase or guarantee any debt; not to purchase or redeem any shares of the Company’s stock; and not to accept any new brokered deposits, even if the Bank is considered well capitalized. Within 30 days of the Regulator Agreement, the Bank submitted a written plan to the Regulators for reducing its reliance on brokered deposits.
A-60
Table of Contents
FIRST STATE BANCORPORATION AND SUBSIDIARY
NOTES TO CONSOLIDATED FINANCIAL STATEMENTS—(Continued)
The Board of Directors of the Company and the Bank are also required to appoint a Compliance Committee to monitor and coordinate the Company’s and the Bank’s compliance with the provisions of the Regulator Agreement, obtain prior approval for the appointment of new directors, the hiring or change in responsibilities of senior executive officers, and to comply with restrictions on severance payments and indemnification payments to institution affiliated parties.
Failure to comply with the provisions of the Regulator Agreement could subject the Company and or the Bank to additional enforcement actions. Management continues to work closely with the Regulators regarding the Regulator Agreement and believes that the Company and the Bank are in compliance with the requirements of the Regulator Agreement, except for the requirement to submit an acceptable capital plan. Capital plans for the Company and the Bank were submitted timely, but have not been accepted by the Regulators due to uncertainty of the Company’s ability to execute the plans. Management is continuing to work toward full compliance with the requirements of the capital plans. However, there can be no assurance that the Company and or the Bank will be able to comply fully with the provisions of the Regulator Agreement, or that efforts to comply with the Regulator Agreement will not have adverse effects on the Company’s ability to continue as a going concern.
At December 31, 2009, the Bank was considered “adequately capitalized” while the Company was considered “significantly undercapitalized” under regulatory guidelines, subjecting the Company and the Bank to prompt supervisory and regulatory actions pursuant to the FDIC Improvement Act of 1991, prohibiting the Bank from accepting, renewing, or rolling over brokered deposits except with a waiver from the FDIC, and subjecting the Bank to restrictions on the interest rates that can be paid on deposits. At the current time, the Company’s “significantly undercapitalized” classification has no immediate impact on its day-to-day operations because the holding company has no immediate significant cash flow needs or significant obligations that are due in the next twelve months. In addition, the prompt corrective actions required by the Regulators are directed at the Bank. Under certain circumstances, a well capitalized or adequately capitalized institution may be treated as if the institution is in the next lower capital category. Depending on the level of capital, the Regulators and or the FDIC can institute other corrective measures to require additional capital and have broad enforcement powers to impose substantial fines and other penalties for violation of laws and regulations. The substantial erosion of the Bank’s capital position in 2009 and the continued deterioration in the Bank’s loan portfolio makes it unlikely that the Bank will be able to maintain its “adequately capitalized” status under regulatory guidelines without raising additional capital, a strategic merger, selling a significant amount of assets, obtaining government assistance, or some combination thereof.
Bank regulations specify the level of dividends that can be paid by the Company and First Community Bank. In July 2008, to help improve the Company’s and the Bank’s capital ratios, the Company suspended its cash dividend to shareholders and the Bank has not declared a cash dividend to the Company since May 2008. The Company and First Community Bank are both currently precluded from paying dividends pursuant to the Regulator Agreement. Future dividend payments will be dependent upon the level of earnings and/or regulatory restrictions, if any.
Quantitative measures established by regulation to ensure capital adequacy require the Company to maintain minimum amounts and ratios of total and Tier I capital (as defined in regulations and set forth in the following table) to risk-weighted assets, and of Tier I capital to average total assets (leverage ratio). The regulatory capital calculation limits the amount of allowance for loan losses that is included in capital to 1.25 percent of risk-weighted assets. At December 31, 2009, the Company and the Bank had approximately $103 million of allowance for loan losses which was excluded from regulatory capital.
A-61
Table of Contents
FIRST STATE BANCORPORATION AND SUBSIDIARY
NOTES TO CONSOLIDATED FINANCIAL STATEMENTS—(Continued)
As of December 31, 2009
| Actual | For capital adequacy purposes |
To be considered well capitalized |
||||||||||||||||
| Amount | Ratio | Amount | Ratio | Amount | Ratio | |||||||||||||
| (Dollars in thousands) | ||||||||||||||||||
| Total capital to risk-weighted assets: |
||||||||||||||||||
| Consolidated |
$ | 112,364 | 5.6 | % | $ | 160,793 | 8.0 | % | $ | 200,991 | 10.0 | % | ||||||
| Bank subsidiary |
166,629 | 8.3 | % | 160,490 | 8.0 | % | 200,612 | 10.0 | % | |||||||||
| Tier I capital to risk-weighted assets: |
||||||||||||||||||
| Consolidated |
56,182 | 2.8 | % | 80,396 | 4.0 | % | 120,594 | 6.0 | % | |||||||||
| Bank subsidiary |
140,267 | 7.0 | % | 80,245 | 4.0 | % | 120,367 | 6.0 | % | |||||||||
| Tier I capital to average total assets: |
||||||||||||||||||
| Consolidated |
56,182 | 2.0 | % | 113,615 | 4.0 | % | 142,019 | 5.0 | % | |||||||||
| Bank subsidiary |
140,267 | 4.9 | % | 113,472 | 4.0 | % | 141,840 | 5.0 | % | |||||||||
As of December 31, 2008
| Actual | For capital adequacy purposes |
To be considered well capitalized |
||||||||||||||||
| Amount | Ratio | Amount | Ratio | Amount | Ratio | |||||||||||||
| (Dollars in thousands) | ||||||||||||||||||
| Total capital to risk-weighted assets: |
||||||||||||||||||
| Consolidated |
$ | 278,650 | 9.4 | % | $ | 236,705 | 8.0 | % | $ | 295,881 | 10.0 | % | ||||||
| Bank subsidiary |
278,858 | 9.4 | % | 236,395 | 8.0 | % | 295,494 | 10.0 | % | |||||||||
| Tier I capital to risk-weighted assets: |
||||||||||||||||||
| Consolidated |
197,828 | 6.7 | % | 118,352 | 4.0 | % | 177,528 | 6.0 | % | |||||||||
| Bank subsidiary |
241,394 | 8.2 | % | 118,198 | 4.0 | % | 177,296 | 6.0 | % | |||||||||
| Tier I capital to average total assets: |
||||||||||||||||||
| Consolidated |
197,828 | 5.7 | % | 138,298 | 4.0 | % | 172,873 | 5.0 | % | |||||||||
| Bank subsidiary |
241,394 | 7.0 | % | 138,142 | 4.0 | % | 172,678 | 5.0 | % | |||||||||
15. Condensed Financial Information of Parent Company
The assets of First State Bancorporation, as parent company, consist primarily of the investment in the Bank and a money market savings account held in the Bank. The primary sources of the parent company’s cash revenues are dividends from the Bank along with interest received from the money market account. Following are condensed financial statements of the parent company:
Condensed Statements of Condition
| As of December 31, | ||||||
| 2009 | 2008 | |||||
| (Dollars in thousands) | ||||||
| Assets: |
||||||
| Cash and due from banks |
$ | 528 | $ | 1,973 | ||
| Investment in subsidiary |
146,512 | 254,987 | ||||
| Income tax receivable |
1,339 | — | ||||
| Other assets |
3,637 | 4,040 | ||||
| Total assets |
$ | 152,016 | $ | 261,000 | ||
| Liabilities and equity capital: |
||||||
| Accounts payable and accrued expenses |
$ | 6,666 | $ | 3,280 | ||
| Junior subordinated debentures |
98,319 | 98,466 | ||||
| Total liabilities |
104,985 | 101,746 | ||||
| Equity capital |
47,031 | 159,254 | ||||
| Total liabilities and equity capital |
$ | 152,016 | $ | 261,000 | ||
A-62
Table of Contents
FIRST STATE BANCORPORATION AND SUBSIDIARY
NOTES TO CONSOLIDATED FINANCIAL STATEMENTS—(Continued)
Condensed Statements of Operations
| Years ended December 31, | ||||||||||||
| 2009 | 2008 | 2007 | ||||||||||
| (Dollars in thousands) | ||||||||||||
| Income: |
||||||||||||
| Cash dividends from subsidiary |
$ | — | $ | 2,500 | $ | 5,000 | ||||||
| Other income |
9 | 87 | 700 | |||||||||
| Total income |
9 | 2,587 | 5,700 | |||||||||
| Expenses: |
||||||||||||
| Interest expense |
2,975 | 4,835 | 6,616 | |||||||||
| Legal fees |
42 | 30 | 17 | |||||||||
| Loss on early redemption of debentures, net |
— | — | 449 | |||||||||
| Goodwill impairment |
— | 1,012 | — | |||||||||
| Other expense |
837 | 695 | 690 | |||||||||
| Total expenses |
3,854 | 6,572 | 7,772 | |||||||||
| Loss before income taxes and undistributed income (loss) of bank subsidiary |
(3,845 | ) | (3,985 | ) | (2,072 | ) | ||||||
| Income tax benefit |
1,339 | 2,119 | 2,613 | |||||||||
| Undistributed income (loss) of bank subsidiary |
(107,987 | ) | (151,765 | ) | 24,266 | |||||||
| Net income (loss) |
$ | (110,493 | ) | $ | (153,631 | ) | $ | 24,807 | ||||
A-63
Table of Contents
FIRST STATE BANCORPORATION AND SUBSIDIARY
NOTES TO CONSOLIDATED FINANCIAL STATEMENTS—(Continued)
Condensed Statements of Cash Flows
| Years ended December 31, | ||||||||||||
| 2009 | 2008 | 2007 | ||||||||||
| (Dollars in thousands) | ||||||||||||
| Cash flows from operating activities: |
||||||||||||
| Net income (loss) |
$ | (110,493 | ) | $ | (153,631 | ) | $ | 24,807 | ||||
| Adjustments to reconcile net income to cash provided (used) by operating activities: |
||||||||||||
| Undistributed (income) loss of bank subsidiary |
107,987 | 151,765 | (24,266 | ) | ||||||||
| Goodwill impairment |
— | 1,012 | — | |||||||||
| Excess tax benefits from share-based compensation |
— | — | (963 | ) | ||||||||
| Change in income tax receivable |
(1,339 | ) | — | — | ||||||||
| Decrease in other assets, net |
274 | 335 | 1,360 | |||||||||
| Increase in other liabilities, net |
3,239 | 1,313 | 163 | |||||||||
| Net cash provided (used) by operating activities |
(332 | ) | 794 | 1,101 | ||||||||
| Cash flows from investing activities: |
||||||||||||
| Business acquisition, net of cash acquired |
— | — | (71,991 | ) | ||||||||
| Issuance of trust preferred securities |
— | — | (1,966 | ) | ||||||||
| Redemption of trust preferred securities |
— | — | 1,022 | |||||||||
| Net cash (used) provided by investing activities |
— | — | (72,935 | ) | ||||||||
| Cash flows from financing activities: |
||||||||||||
| Common stock issued |
545 | 1,283 | 2,060 | |||||||||
| Costs associated with issuance of common stock |
— | — | — | |||||||||
| Common stock repurchased and deferred compensation |
— | (6 | ) | (18,650 | ) | |||||||
| Payment from subsidiary bank for acquisition costs |
— | — | — | |||||||||
| Payment from subsidiary bank for stock option compensation |
592 | 841 | 1,082 | |||||||||
| Capital contributions to subsidiary bank |
(2,250 | ) | (3,500 | ) | (6,500 | ) | ||||||
| Issuance of junior subordinated debentures |
— | — | 65,466 | |||||||||
| Redemption of junior subordinated debentures |
— | — | (34,022 | ) | ||||||||
| Excess tax benefits from share-based compensation |
— | — | 963 | |||||||||
| Dividends paid |
— | (3,628 | ) | (7,162 | ) | |||||||
| Net cash provided (used) by financing activities |
(1,113 | ) | (5,010 | ) | 3,237 | |||||||
| Net change in cash and due from banks |
(1,445 | ) | (4,216 | ) | (68,597 | ) | ||||||
| Cash and due from banks at beginning of year |
1,973 | 6,189 | 74,786 | |||||||||
| Cash and due from banks at end of year |
$ | 528 | $ | 1,973 | $ | 6,189 | ||||||
16. Fair Values of Assets and Liabilities
The Company uses fair value measurements to record fair value adjustments to certain assets and liabilities and to determine fair value disclosures. Securities available for sale are recorded at fair value on a recurring basis. Additionally, from time to time, the Company may be required to record at fair value other assets on a nonrecurring basis, such as loans held for sale, loans held for investment, other real estate owned, and certain other assets. These nonrecurring fair value adjustments typically involve the application of lower-of-cost-or-market accounting or write-downs of individual assets.
Accounting guidance allows companies to irrevocably elect fair value as the initial and subsequent measurement attribute for certain financial assets and liabilities, with changes in fair value recognized in earnings as they occur. This fair value option election is on an instrument by instrument basis at initial recognition of an asset or liability or upon an event that gives rise to a new basis of accounting for that instrument. The Company did not elect to apply the fair value option to any financial assets or liabilities, except as already applicable under other accounting guidance.
A-64
Table of Contents
FIRST STATE BANCORPORATION AND SUBSIDIARY
NOTES TO CONSOLIDATED FINANCIAL STATEMENTS—(Continued)
The Company groups its assets and liabilities at fair values in three levels based on the markets in which the assets and liabilities are traded and the reliability of the assumptions used to determine fair value. In general, fair values determined by Level 1 inputs utilize quoted prices (unadjusted) in active markets for identical assets or liabilities that the Company has the ability to access. Fair values determined by Level 2 inputs utilize inputs other than quoted prices included in Level 1 that are observable for the asset or liability, either directly or indirectly. Level 2 inputs include quoted prices for similar assets or liabilities in active markets, and inputs other than quoted prices that are observable for the asset or liability, such as interest rates and yield curves that are observable at commonly quoted intervals. Level 3 inputs are unobservable inputs for the asset or liability, and include situations where there is little, if any, market activity for the asset or liability. In certain cases, the inputs used to measure fair value may fall into different levels of the hierarchy. In such cases, the fair value of the asset or liability is determined based on the lowest level input that is significant to the fair value measurement in its entirety.
The following is a description of the valuation methodologies used for assets and liabilities that are recorded at fair value and for estimating fair value for financial instruments not recorded at fair value.
Cash and cash equivalents – Carrying value approximates fair value since the majority of these instruments are payable on demand and do not present credit concerns.
Securities available for sale – Securities available for sale are recorded at fair value on a recurring basis. For these securities, the Company obtains fair value measurements from Interactive Data Corporation (“IDC”), an independent pricing service. Where quoted market prices are available in an active market, securities are classified within Level 1 of the valuation hierarchy. If quoted market prices are not available, then fair values are based on pricing models that vary by asset class and incorporate available trade, bid, and other market information. Because many fixed income securities do not trade on a daily basis, the pricing applications apply available information as applicable through processes such as benchmark curves, benchmarking of like securities, sector groupings, and matrix pricing. Models are used to assess interest rate impact and develop prepayment scenarios. Relevant credit information, perceived market movements, and sector news are integrated into the pricing applications and models. Securities that are priced using these types of inputs are classified within Level 2 of the valuation hierarchy. Pricing as received from IDC is reviewed for reasonableness each quarter. In addition, the Company obtains pricing on select securities from Bloomberg and compares this pricing to the pricing obtained from IDC. No significant differences have been found.
Marketable securities held to maturity – The estimated fair value of the majority of securities held to maturity is determined in the same manner as securities available for sale. The remaining securities consist of municipal bonds that are carried at par. Due to the lack of an active market for these municipal securities and the individuality of each of these municipal issuances where we hold the majority if not all of the issuance, we analyze these securities for impairment each quarter and have not considered it appropriate to record a value other than par. We currently have four of these securities totaling $29.0 million with a weighted average coupon of 6.65% and remaining maturities greater than five years. Two of the bond agreements, with a par value of $18.8 million and a weighted average coupon of 7.95%, allow the districts to defer interest in the case where available funds from development of the district are not sufficient to cover the debt service. Due to the status of the developments and related uncertainty of the cash flows, we reversed the accrued interest on these bonds through a charge to earnings. The estimated fair value of these bonds is calculated by discounting scheduled or anticipated cash flows through maturity using current rates at which similar bonds would be entered into based on current market conditions and associated credit risk.
Non-marketable securities – These securities include Federal Home Loan Bank, Federal Reserve Bank, and Bankers’ Bank of the West stock. This stock is carried at cost, which approximates fair value. The fair value determination was determined based on the ultimate recoverability of the par value of the stock and considered, among other things, any significant decline in the net assets of the institutions, scheduled dividend payments, any impact of legislative and regulatory changes, and the liquidity position of the institutions.
Loans held for investment – We do not record loans at fair value on a recurring basis. As such, valuation techniques discussed herein for loans are primarily for estimating the entry price fair value for disclosure purposes. The estimated fair value of the loan portfolio is calculated by discounting scheduled cash flows over the estimated maturity of loans using the current rates at which similar loans would be made to borrowers with similar credit ratings and for the same remaining maturities or repricing terms. Credit risk is accounted for through a reduction of contractual cash flows by loss estimates of classified loans and as a component of the discount rate.
A-65
Table of Contents
FIRST STATE BANCORPORATION AND SUBSIDIARY
NOTES TO CONSOLIDATED FINANCIAL STATEMENTS—(Continued)
Impaired loans – Impaired loans are reported at the present value of the estimated cash flow of expected repayments discounted using the loan’s contractual interest rate or at the fair value of the underlying collateral less estimated selling costs when it is determined that the source of repayment is dependent on the underlying collateral. External appraisals are used to determine the fair value of the collateral for all real estate related loans. For loans secured by other types of assets such as inventory, equipment, and receivables, the values are typically established based on current financial information of the borrower after applying discounts, usually 50% to 100% for stale dated financial information. Appraisals are obtained upon origination of real estate loans. Updated real estate appraisals are generally obtained at the time a loan is classified as a non-performing asset and determined to be impaired, unless a current appraisal is already on file. New appraisals for impaired loans are obtained annually thereafter or sooner if circumstances indicate that a significant change in value has occurred. Due to the potential for real estate values to change rapidly, appraised values for real estate are discounted to account for deteriorating real estate markets. These discounts consider economic differences that exist in the various markets we serve as well as differences experienced by type of loan and collateral and typically range from 0% to 30% depending on the circumstances surrounding each individual loan. A larger discount may be applied to stale dated appraisals where a current appraisal has been ordered but not yet received. Appraisals on other types of collateral, such as equipment, are also subject to discounting; however only 8% of our non-performing loans as of December 31, 2009 are secured by collateral other than real estate. Appraisals with discounts up to 10% are considered Level 2 inputs. Appraisals with discounts greater than 10% and the internally developed estimates, including discounted estimated cash flows of expected repayments are considered Level 3 inputs.
Loans held for sale – These loans are reported at the lower of cost or fair value. Fair value is determined based on expected proceeds based on sales contracts and commitments. At December 31, 2009 and December 31, 2008, all of the Company’s loans held for sale are carried at cost, as generally, cost is less than the price at which the Company commits to sell the loan to the permanent investor.
Accrued interest receivable – Carrying value of interest receivable approximates fair value, since these instruments have short-term maturities.
Other real estate owned – These assets are reported at the lower of the investment in the related loan or the estimated fair value of the assets received. Fair value of the assets received is determined based on current market information, including independent appraisals less estimated costs of disposition. Due to the potential for real estate values to change rapidly, appraised values for real estate are discounted to account for deteriorating real estate markets. These discounts consider economic differences that exist in the various markets we serve as well as differences experienced by type of loan and collateral and typically range from 0% to 30% depending on the circumstances surrounding each individual loan. A larger discount may be applied to stale dated appraisals where a current appraisal has been ordered but not yet received. Appraisals with discounts up to 10% are considered Level 2 inputs. Appraisals with discounts greater than 10% are considered Level 3 inputs.
Cash surrender value of bank-owned life insurance – The carrying value of cash surrender value of bank-owned life insurance is the amount realizable by the Company if it were to surrender the policy to the issuing company. Because the carrying value is equal to the amount the Company could realize in cash, the carrying value is considered its fair value.
Deposits – The estimated fair value of deposits with no stated maturity, such as demand deposits, savings accounts, and money market deposits, approximates the amounts payable on demand at December 31, 2009 and December 31, 2008. The fair value of fixed maturity certificates of deposit is estimated by discounting the future contractual cash flows using the rates currently offered for deposits of similar remaining maturities.
Securities sold under agreements to repurchase and federal funds purchased – The carrying value of securities sold under agreements to repurchase and federal funds purchased, which reset frequently to market interest rates, approximates fair value.
FHLB advances and other – Fair values for FHLB advances and other are estimated based on the current rates offered for similar borrowing arrangements at December 31, 2009.
Junior subordinated debentures – The fair value of fixed junior subordinated debentures, the majority of which reset quarterly to market interest rates, is estimated by discounting the future contractual cash flows using the rates currently offered for similar borrowing arrangements.
Off-balance sheet items – The majority of our commitments to extend credit carry current market interest rates if converted to loans. Because these commitments are generally unassignable by either the borrower or the Company, they only have value to the borrower and to the Company. The estimated fair value approximates the recorded deferred fee amounts and is excluded from the fair value of financial instruments table below because it is immaterial.
A-66
Table of Contents
FIRST STATE BANCORPORATION AND SUBSIDIARY
NOTES TO CONSOLIDATED FINANCIAL STATEMENTS—(Continued)
Assets and Liabilities Measured at Fair Value on a Recurring Basis
| Financial Assets |
Balance as of December 31, 2009 |
Quoted Prices in Active Markets for Identical Assets (Level 1) |
Significant Other Observable Inputs (Level 2) |
Significant Unobservable Inputs (Level 3) | ||||||||
| (Dollars in thousands) | ||||||||||||
| Securities available for sale |
$ | 473,580 | $ | — | $ | 473,580 | $ | — | ||||
Assets and Liabilities Recorded at Fair Value on a Nonrecurring Basis
For assets measured at fair value on a nonrecurring basis, the following table provides the level of valuation assumptions used to determine each adjustment and the carrying value of the related individual assets or portfolios. The valuation methodologies used to measure these fair value adjustments are described previously in this note.
| Carrying value at December 31, 2009 | Period ended December 31, 2009 |
||||||||||||||||
| (Dollars in thousands) | |||||||||||||||||
| Total | Level 1 | Level 2 | Level 3 | Total Losses | |||||||||||||
| Impaired loans |
$ | 257,689 | $ | — | $ | 144,349 | $ | 113,340 | $ | 121,058 | (1) | ||||||
| Other real estate owned |
46,503 | (2) | — | 39,840 | 6,663 | 7,343 | (3) | ||||||||||
| $ | 128,401 | ||||||||||||||||
| (1) | Total losses on impaired loans represents the sum of charge offs, net of recoveries, of $105.3 million, plus the increase in specific reserves of $15.7 million ($24.5 million at December 31, 2009, less $8.8 million at December 31, 2008) for the twelve-month period ended December, 2009. |
| (2) | Represents the fair value of other real estate owned that is measured at fair value less costs to sell. |
| (3) | Represents write-downs during the period of other real estate owned subsequent to the initial classification as a foreclosed asset. |
The table below is a summary of fair value estimates as of December 31, 2009 and 2008, for financial instruments. This table excludes financial instruments that are recorded at fair value on a recurring basis.
| 2009 | 2008 | |||||||||||
| Carrying Amount |
Fair Value | Carrying Amount |
Fair Value | |||||||||
| (Dollars in thousands) | ||||||||||||
| Financial assets: |
||||||||||||
| Cash and cash equivalents |
$ | 145,945 | $ | 145,945 | $ | 66,580 | $ | 66,584 | ||||
| Marketable securities held to maturity |
58,455 | 57,581 | 63,183 | 61,700 | ||||||||
| Federal Home Loan Bank, Federal Reserve Bank, and Bankers’ Bank of the West stock |
30,089 | 30,089 | 32,325 | 32,325 | ||||||||
| Loans, net |
1,888,468 | 1,902,352 | 2,674,882 | 2,703,847 | ||||||||
| Accrued interest receivable |
8,106 | 8,106 | 12,437 | 12,437 | ||||||||
| Cash surrender value of bank-owned life insurance |
11,001 | 11,001 | 45,304 | 45,304 | ||||||||
| Financial liabilities: |
||||||||||||
| Deposits |
2,034,328 | 2,041,898 | 2,522,542 | 2,529,237 | ||||||||
| Securities sold under agreements to repurchase |
40,646 | 40,646 | 112,276 | 112,276 | ||||||||
| FHLB advances |
497,046 | 502,792 | 497,594 | 499,313 | ||||||||
| Junior subordinated debentures |
98,319 | 98,319 | 98,466 | 98,571 | ||||||||
A-67