Attached files
| file | filename |
|---|---|
| EX-21 - EX-21 - EF Johnson Technologies, Inc. | a2197725zex-21.htm |
| EX-32.2 - EX-32.2 - EF Johnson Technologies, Inc. | a2197725zex-32_2.htm |
| EX-23.1 - EX-23.1 - EF Johnson Technologies, Inc. | a2197725zex-23_1.htm |
| EX-31.2 - EX-31.2 - EF Johnson Technologies, Inc. | a2197725zex-31_2.htm |
| EX-31.1 - EX-31.1 - EF Johnson Technologies, Inc. | a2197725zex-31_1.htm |
| EX-32.1 - EX-32.1 - EF Johnson Technologies, Inc. | a2197725zex-32_1.htm |
| EX-11.1 - EX-11.1 - EF Johnson Technologies, Inc. | a2197725zex-11_1.htm |
Use these links to rapidly review the document
TABLE OF CONTENTS
PART IV
UNITED STATES
SECURITIES AND EXCHANGE COMMISSION
Washington, D.C. 20549
FORM 10-K
ý |
ANNUAL REPORT PURSUANT TO SECTION 13 OR 15(d) OF THE SECURITIES EXCHANGE ACT OF 1934 |
|
For the fiscal year ended December 31, 2009 |
||
OR |
||
o |
TRANSITION REPORT PURSUANT TO SECTION 13 OR 15(d) OF THE SECURITIES EXCHANGE ACT OF 1934 |
|
Commission file number: 000-21681
EF Johnson Technologies, Inc.
(Exact name of Registrant as specified in its charter)
| Delaware (State or other jurisdiction of incorporation or organization) |
47-0801192 (I.R.S. Employee Identification No.) |
1440 CORPORATE DRIVE
IRVING, TEXAS 75038
(Address of principal executive offices) (Zip Code)
(972) 819-0700
(Registrant's telephone number, including area code)
Securities
registered pursuant to Section 12(b) of the Act:
Common Stock, par value $.01 per share
Name
of Each Exchange on Which Registered:
The Nasdaq Stock Market, LLC
Securities
registered pursuant to Section 12(g) of the Act:
None
(Title of Class)
Indicate by check mark if the registrant is a well-known seasoned issuer, as defined in Rule 405 of the Securities Act. Yes o No ý
Indicate by check mark if the registrant is not required to file reports pursuant to Section 13 or Section 15(d) of the Act. Yes o No ý
Indicate by check mark whether the registrant (1) has filed all reports required to be filed by Section 13 or 15(d) of the Securities Exchange Act of 1934 during the preceding 12 months (or for such shorter period that the registrant was required to file such reports), and (2) has been subject to such filing requirements for the past 90 days. Yes ý No o
Indicate by check mark whether the registrant has submitted electronically and posted on its corporate Website, if any, every Interactive Data File required to be submitted and posted pursuant to Rule 405 of Regulation S-T (§232.405 of this chapter) during the preceding 12 months (or for such shorter period that the registrant was required to submit and post such files). Yes o No o
Indicate by check mark if disclosure of delinquent filers pursuant to Item 405 of Regulation S-K is not contained herein, and will not be contained, to the best of registrant's knowledge, in definitive proxy or information statements incorporated by reference in Part III of this Form 10-K or any amendment to this Form 10-K. o
Indicate by check mark whether the registrant is a large accelerated filer, an accelerated filer, a non-accelerated filer, or a smaller reporting company. See definition of "large accelerated filer", "accelerated filer" and "smaller reporting company" in Rule 12b-2 of the Exchange Act.
| Large accelerated filer o | Accelerated filer o | Non-accelerated filer o (Do not check if a smaller reporting company) |
Smaller reporting company ý |
Indicate by check mark whether the registrant is a shell company (as defined in Rule 12b-2 of the Exchange Act). Yes o No ý
On March 29, 2010, 26,486,586 shares of EF Johnson Technologies, Inc. common stock were outstanding.
As of June 30, 2009, based on the closing sales price as quoted by the NASDAQ, 26,107,145 shares of Common Stock, having an aggregate market value of approximately $16,447,501 were held by non-affiliates. For purposes of the above statement only, all directors and executive officers of the registrant are assumed to be affiliates.
DOCUMENTS INCORPORATED BY REFERENCE
Selected designated portions of the Registrant's definitive Proxy Statement to be filed on or before April 30, 2010 in connection with the Registrant's 2010 Annual Meeting of stockholders are incorporated by reference into Part III of this Annual Report.
EF Johnson Technologies, Inc.
FORM 10-K
Year Ended December 31, 2009
Unless the context otherwise provides, all references to "we," "us," "our," and "Company" include EF Johnson Technologies, Inc., its predecessor entity and its subsidiaries, including E.F. Johnson Company, Transcrypt International, Inc., and 3e Technologies International, Inc. on a combined basis. All references to "EFJohnson" refer to E.F. Johnson Company, all references to "Transcrypt" refer to Transcrypt International, Inc. and all references to 3eTI refer to 3e Technologies International, Inc.
Forward-Looking Statements
This Annual Report on Form 10-K, including "Management's Discussion and Analysis of Financial Condition and Results of Operations" in Item 7, may contain forward-looking statements that involve risks, uncertainties, and assumptions. If the risks or uncertainties materialize or the assumptions prove incorrect, the results of EF Johnson Technologies, Inc. and its consolidated subsidiaries may differ materially from those expressed or implied by such forward-looking statements. All statements other than statements of historical fact are statements that could be deemed forward-looking statements, including but not limited to any projections of earnings, revenue, expenses, liquidity, or other financial items; future sales levels and customer confidence; any statement of the plans, strategies, and objectives of management for future operations; any statements concerning developments, performance, or market share relating to products or services; any statements regarding future economic conditions; any statements regarding pending claims or disputes; any statements of expectation or belief; and any statements of assumptions underlying any of the foregoing.
Certain matters discussed in this Annual Report may constitute forward-looking statements under Section 27A of the Securities Act and Section 21E of the Exchange Act. These statements may involve risks and uncertainties, including without limitation, the following:
- •
- our ability to obtain financing for working capital on acceptable terms in a timely manner;
- •
- our ability to satisfy our debt instruments;
- •
- our future financial condition, liquidity and general business prospects;
- •
- our ability to successfully execute our business plan and control costs and expenses;
- •
- the difficulty of aligning expense levels with revenue changes;
- •
- our limited market capitalization;
- •
- our ability to obtain expected and timely orders resulting from existing contracts;
- •
- future sales levels and customer confidence;
- •
- government agendas, budget issues and constraints, and funding delays;
- •
- perceived opportunities in the marketplace for our products;
- •
- successful execution of our contracts by our suppliers;
- •
- our ability to introduce new products, gain broad market acceptance for such products and ramp up manufacturing in a
timely manner;
- •
- our ability to establish strategic partnerships to develop our business;
- •
- new products or technologies introduced by our competitors, many of whom are bigger and better financed than us;
- •
- government regulation of policies involving our technology and/or products;
- •
- continued domestic government acceptance of Project 25 as the interoperability standard; and
- •
- macroeconomic and geopolitical trends and events
1
and those items discussed in "Item 1A. Risk Factors" set forth in this Report and in our other periodic reports filed with the Securities and Exchange Commission.
The actual outcomes of the above referenced matters may differ significantly from the outcomes expressed or implied in these forward-looking statements. We assume no obligation and do not intend to update these forward-looking statements except as required by law.
2
General
EF Johnson Technologies, Inc. is an innovator, developer and marketer of the highest quality secure communications solutions to organizations whose mission is to protect and save lives. We design, develop, market and support wireless communications, including wireless radios and wireless communications infrastructure and systems for digital and analog platforms, and secure wireless networking solutions that include Wi-Fi products, mesh networking, access points, bridges and client products. In addition, we offer encryption technologies for wireless voice, video and data communications. We provide our products and services to (i) domestic and foreign public safety/public service entities, (ii) federal, state and local governmental agencies, including the Departments of Homeland Security and Defense, and (iii) domestic and foreign commercial customers.
Our products are marketed under the "EFJohnson," "3eTI" and "Transcrypt" brand names. Our EFJohnson-branded products consist of wireless radios and wireless communications infrastructures and systems. Our wireless offerings are primarily digital solutions designed to operate in both analog and digital wireless radio system environments. These products are based on the Project 25 industry standard, and our systems utilize Voice over Internet Protocol ("VoIP") technology to enhance interoperability among systems, improve bandwidth efficiency, and integrate voice and data communications. We sell these products and systems primarily to domestic governmental entities, such as the Departments of Defense and Homeland Security, as well as state and local governmental agencies.
We also have significant license rights that allow us to sell our EFJohnson wireless communications products that are compatible with the large installed base of analog wireless radios, infrastructure and proprietary systems as well as networks that will utilize the next generation of public safety technology. We believe there is a strong commitment by the federal government to improve homeland security by providing first responders with secure and interoperable communications. Government agencies are currently mandating secure and interoperable compliant digital wireless communications systems to replace the existing proprietary analog systems. We understand that the federal government, which typically provides the funding for such wireless systems, and to a lesser extent state governmental agencies, have made appropriations for such future systems a top priority.
Our 3eTI-branded products consist of secure Wi-Fi products, including mesh network, access point, bridge, and client products, as well as security software and custom solutions. We also provide sensor networking solutions, through our InfoMatics® middleware, which enable sensors and databases to communicate data to pertinent personnel for command and control applications in near real-time. All 3eTI-branded products are integrated into solutions that get information to essential users so they may securely, reliably and cost-effectively utilize communications to meet federal and military customers' force protection/anti-terrorism mission requirements and corporate needs. We specialize in secure government wireless broadband solutions and have achieved many firsts in wireless technology, including the first Federal Information Processing Standards ("FIPS") 140-2 Layer 2 validated access point. In 2006, we became the first wireless supplier to receive National Information Assurance Partnership ("NIAP") Evaluation Assurance Level 2 Common Criteria certification ("Common Criteria") for our wireless LAN access point and client software. We continue to maintain and advance our security capabilities.
Our Transcrypt-branded products consist of encryption technologies for analog wireless radios. We leverage our leading market position to gain new customers in parts of the world where wireless radio systems remain analog, security needs are high, and the cost to upgrade to a digital communications system is prohibitive. These products are sold as aftermarket add-on components or embedded
3
components for existing analog radios and systems. Terrorist threats, political unrest and military conflicts drive the need for more secure communications. We offer other solutions, such as our digital encryption product for certain analog and digital wireless radios, to obtain higher levels of security which also allows for compatibility with our analog encryption product line.
EF Johnson Technologies, Inc. was originally incorporated in 1996 under the name "Transcrypt International, Inc." In 2002, the Company changed its name to EFJ, Inc., and, at the Company's May 28, 2008 Annual Meeting of Stockholders, the Stockholders approved an amendment to the Company's Certificate of Incorporation to change the corporate name from EFJ, Inc. to EF Johnson Technologies, Inc. The Company's stock is quoted on the NASDAQ Global market under the symbol "EFJI."
Available Information
The address of our principal executive office is 1440 Corporate Drive, Irving, Texas 75038, and our telephone number is (972) 819-0700. Our website address is http://www.efjohnsontechnologies.com. We are subject to the informational requirements of the Securities Exchange Act of 1934 and, in accordance therewith, file reports and other information with the Securities and Exchange Commission (SEC). Such reports and other information can be inspected and copied at the Public Reference Room of the SEC, located at 100 F Street N.E., Washington D.C. 20549. Copies of such material can be obtained from the Public Reference Room of the SEC at prescribed rates. You may obtain information on the operation of the Public Reference Room by calling the SEC at 1-800-SEC-0330. Such material also may be accessed electronically by means of the SEC's home page on the Internet at http://www.sec.gov or at www.efjohnsontechnologies.com .
We provide free of charge on our web site, under the heading "Investor Relations," our annual report on Form 10-K, quarterly reports on Form 10-Q, current reports on Form 8-K and amendments to reports filed or furnished, pursuant to Section 13(a) or 15(d) of the Securities Exchange Act of 1934, as amended, as soon as reasonably practicable after we file such material with, or furnish it to, the U.S. Securities and Exchange Commission.
The corporate governance information on our web site includes our Code of Ethics and Business Conduct for all employees of EF Johnson Technologies, Inc. These corporate governance documents can be accessed by visiting our web site and clicking on the "About EFJohnson" link, followed by the "Board of Directors" link, followed by the "Code of Business Conduct & Ethics" link.
Our Industry
Background
In the mid-1930s, police departments began using wireless radio systems to enable immediate communication between headquarters and patrolling officers. Historically, a local municipality would procure a proprietary wireless system that met the needs of its municipal police organization with little concern if it was interoperable with other local wireless systems. The public safety and public service market for wireless communications evolved with agencies purchasing disparate systems. As a result, the land mobile radio communications market for domestic public safety and public service agencies has a large installed base of proprietary analog radios and infrastructure.
The federal government allocates certain RF spectrum specifically to ensure critical and secure communications for first responders and other government users. Unlike the cellular market, governmental entities are not required to purchase licensed spectrum. Governmental entities purchase land mobile radio products and systems for their own use and do not pay ongoing monthly services or airtime fees. These land mobile radio networks include infrastructure components such as base stations, transmitters and receivers, network switches and portable and mobile two-way communication radios.
4
Individual users on private networks operate portable hand-held radios and vehicular mounted radios. Utilizing free licensed RF spectrum, the user owns and operates the communications system, which is networked by linking the infrastructure components together. Users often require solutions that integrate their existing wireless communication radios and systems with enterprise wide applications.
Earlier wireless communications devices utilized conventional systems. Conventional systems use a single channel to transmit and receive information. All users have unrestricted access, and the user must monitor the system and wait until the channel is unoccupied to make a call. The technology later evolved to what is now referred to as a trunked system. Trunked systems combine multiple channels so that an unoccupied channel is automatically selected when a user begins transmitting, allowing for increased usage of the same amount of licensed radio spectrum. With the development of digital wireless radios and trunked systems, the industry has a choice between conventional and trunked systems. The availability of new features, channel allocations and available frequency band is driving many customers to trunked technology. More recently, manufacturers have developed spectrally efficient or narrow bandwidth digital communications devices.
Technological developments have enabled wireless radio systems to be networked, permitting multiple sites between users to be linked together through a switch or router to provide extended geographic coverage. More recent technology provides for the interconnection between users to be accomplished over digital packet-based networks using VoIP. Wireless communications networking technology continues to evolve as public users demand greater integration of voice and data capabilities.
Technical Standards
Many federal, state and local agencies operate wireless radio equipment that complies with specifications established by the Association of Public Safety Communications Officials International, Inc. ("APCO"). APCO is the world's largest not-for-profit professional organization dedicated to the enhancement of public safety communications. APCO has more than 16,000 members around the world, and serves the people who manage, operate, maintain, and supply the communications systems used to safeguard the lives and property of citizens. The APCO 16 standard, established in 1979, includes recommendations for 800 MHz transmissions, analog voice modulation and trunking functions for use of the RF spectrum. However, the APCO 16 recommendations permitted development of proprietary systems. As a result, three proprietary APCO 16 technologies evolved in the market: Motorola's SmartNet®/SmartZone®, Harris' EDACS®, and our Multi-Net®, with Motorola establishing the dominant market position. The establishment of proprietary systems effectively limited competition severely hampering interoperability and market choice. Consequently, APCO focused on a more comprehensive standard that would emphasize interoperability.
In 1995, APCO promulgated a new recommended standard known as Project 25. Project 25 specifies features and signaling for narrow band digital voice and data communications with conventional and trunking modes of operation. The Telecommunications Industry Association ("TIA") participated in the development of these standards, following an industry-sanctioned accredited process. Project 25 was structured to specify details of fundamental wireless radio communications to allow multi-source procurement and interoperability of Project 25 radios and systems.
The Project 25 standard has been adopted by the National Telecommunications and Information Administration ("NTIA") of the Department of Commerce, which controls wireless radio specifications for the federal government. NTIA specified a conversion to narrowband by January 1, 2008; however, systems are continuing to make the transition, as many older systems were grandfathered. Several U.S. government agencies, including the Departments of Defense, Homeland Security, Interior, Justice and Treasury, have specified a Project 25 requirement for procurements of new wireless radio equipment. Although state and local public safety agencies are not currently required by the FCC or NTIA to
5
purchase Project 25 compliant wireless radio systems or otherwise adopt the Project 25 standard, Project 25 compatibility is a key purchasing factor for state and local public safety and public service wireless radio buyers. Due to the FCC mandate for narrowband communications, the demand for Project 25 wireless radio systems is expected to significantly increase. Additionally, grant funding available from the Department of Homeland Security for public safety requires radios that are purchased with grant funds are to be compatible with the Project 25 standard.
During 2005, the FCC enacted regulatory changes to reallocate portions of the 800 MHz frequency band. The reallocation was designed to alleviate interference problems experienced by some public safety, business, and industrial users which were caused by commercial systems, most notably Sprint/Nextel. The resulting regulatory changes will consolidate all public safety users into one portion of the 800 MHz frequency band and move the commercial systems to a different portion of the RF spectrum. The resulting frequency transition will impact many of the public safety users, who must transition their radio systems into a different portion of the frequency band. We expect these transitions will result in challenges supporting existing customers in rebanding their equipment, as well as opportunities to upgrade the customers' equipment.
With the acquisition of 3e Technologies International, Inc. ("3eTI") in July 2006, we expanded our product portfolio by adding wireless data and wireless data security products and solutions that increase the addressable market for our company. Our WLAN solutions are based on the 802.11 (Wi-Fi) family of WLAN standards, as well as other emerging wireless standards such as Bluetooth and WiMAX. Our software security technologies meet federal standards for securing wireless data networks primarily in the government sectors for WLAN solutions.
The use of cryptographic modules, validated to meet Federal Information Processing Standards ("FIPS"), is required by the U.S. government for all unclassified uses of cryptography. The government of Canada also recommends the use of FIPS 140 validated cryptographic modules in unclassified applications within its departments. FIPS 140-2 and Common Criteria are both widely used government security standards in today's security market. FIPS 140-2 applies to products that contain cryptography and are sold to governments and financial institutions. We supply products meeting these standards.
We provide products and services in a variety of markets. Our analog encryption products originated from the need to secure sensitive wireless military communications. By the late 1970s, these devices became economically feasible for non-military government users, such as police, fire, emergency personnel and large commercial users, such as transportation, construction and oil companies. Our products are designed to protect the transmission of sensitive voice and data communications. Without such protection, many forms of electronic communications, telephone conversations and remote data communications are vulnerable to interception and theft.
Wireless communications can be transmitted through either analog or digital modulation technology. Analog transmissions typically consist of a voice or other signals modulated directly onto a continuous radio wave. An analog transmission can be made secure by scrambling the original signal at the point of transmission, and reconstituting the original signal at the receiving end. Digital transmissions can be made secure by a process known as encryption, which utilizes a mathematical algorithm to rearrange the bit-stream prior to transmission and a decoding algorithm to reconstitute the transmitted information back into its original form at the receiving end. The use of scrambling and encryption equipment is required on both the transmitting and receiving sides of communications to operate in secure mode. However, most wireless radio encryption products can be used in the clear, non-scrambled mode to communicate with equipment that does not contain a corresponding security device.
Wireless radio encryption users are migrating from analog to digital transmission systems at different rates around the world. In developing countries, wireless radio systems remain analog because the cost to upgrade to digital secured communications systems is usually prohibitive and there is lower
6
demand for RF spectrum. The large existing analog wireless radio installed base can obtain encryption and scrambling security features in the aftermarket with add-on modules to analog radios, often incurring substantially less cost than converting their entire wireless radio system to digital. Drivers for secured communication systems with scrambling and encryption include an increase in military conflicts and heightened security concerns.
Competitive Strengths
We believe the following competitive strengths will allow us to take advantage of the opportunities we see in our industry.
Technical and Industry Expertise—We have significant experience in secure products that provide wireless voice, video and data for public safety radio networks. Our next generation public safety radio network solutions are scalable, allowing our customers to implement a network that can grow as their wireless system needs change. Our research and development efforts are focused on (i) smaller, lower cost radio platforms supporting multiband/multimode operation and the emerging APCO Project 25 Phase 2 standard software defined radio architecture, (ii) radio and system management capability expansion, (iii) enhanced wireless network system features supporting a broader market penetration using industry standard internet protocol switching techniques and addressing the emerging APCO Project 25 Phase 2 standard, and (iv) continued evolution of our secure broadband solutions portfolio to incorporate emerging 802.11 standards. We are an industry standards leader within APCO, TIA, and the Institute of Electrical and Electronics Engineers, Inc. ("IEEE") providing significant support by chairing committees and working groups formulating the standards.
Our technical expertise has enabled us to improve our core technologies and incorporate them into our new products more quickly and with relatively lower development costs due to our ability to build these platforms mainly based on open industry standards and software based radios. We have been first to market with a number of products that meet FIPS for securing wireless data protocols, and we were the first wireless supplier to have a wireless LAN Access Point and client software receive National Information Assurance Partnership ("NIAP") Evaluation Assurance Level 2 Common Criteria Certification.
Product Value Proposition—We continue to make investments in research and development to provide greater features in our products and systems for our customers as well as more options for interoperability. Furthermore, by leveraging our wireless communications expertise, we believe that we can provide lower cost products with enhanced features.
Motorola License Rights—We have significant license rights that allow us to sell products that work in the largest proprietary analog public safety radio network base as well as in networks that utilize the next generation of public safety technology. This allows us to address the large installed proprietary analog market that has extensive investments and will likely evolve to Project 25 digital solutions on an incremental basis over the next few years. This license facilitates the selling and marketing of our products to customers that undergo the transition to the new digital systems.
Customer Relationships—We have extensive customer relationships with (i) state and local governmental agencies, including the States of California and Wisconsin, (ii) several U.S. government agencies, including the Departments of Defense and Homeland Security, and (iii) international entities. We are able to attract such customers due to our competitive product positioning, brand awareness and strong service commitment. Our products have also gone through numerous customer testing and government regulatory qualification processes which can take significant time and effort. After our products are approved for use by the various government agencies, we obtain the necessary approval to list certain of our products for sale on procurement contracts, such as the General Services Administration ("GSA") schedule, to make them available for purchase. We also leverage our customer
7
relationships to maintain a leading market position in analog radio encryption by providing a high level of service and support.
Strategy
We believe the following key elements of our strategy will allow us to grow our business and continue to provide innovative and high quality secure communications solutions for organizations whose mission is to protect and save lives.
Build a More Aggressive and Focused Marketing Effort—One of our primary goals is to increase our share in markets where first responder communications are critical. To do so, we have developed a focused sales and marketing strategy to (i) capitalize on our proven growth engine of selling subscriber products on competitive radio networks, and (ii) sell our P25 conventional and hybrid systems to smaller cities and counties where there is less competition and our advantages resonate with end customers. These systems marketing strategies are beginning to take root, starting with the migration of our legacy Multi-Net® customers to P25 while further leveraging our awards in Hawaii, Texas, Wisconsin and Canada as references for future opportunities.
Our strategy utilizes a regionally based sales team structured to deepen our account base in existing core states, combined with a systematic year over year expansion into new states targeted to align with grant funding. This expansion strategy is augmented with the selective expansion of our dealer channel and relationships with large systems integrators. Our dealer channel is being expanded to nurture new customer relationships and grow our revenue base from repeat customer sales. Our relationships with large systems integrators, such as European Aeronautic Defense and Space ("EADS"), Arinc and Raytheon, are also being cultivated where project size and scope exceed our current capabilities but our product content provides a competitive offering that strengthens the integrator's market position. This includes our Federal growth strategy that aims to deepen existing customer relationships with Army CECOM through systems integrators like DRS while positioning us to opportunistically expand our presence with other DoD and Federal agencies such as the Air Force, Navy, DHS, DOJ, DOE, and DOI.
Continue to Capitalize on the Demand for Interoperability and the Transition from Analog to Digital Platforms—Demand is growing as the land mobile radio industry transitions from analog to digital platforms, which increasingly utilize our digital Project 25 products and solutions, and as a response to the government mandated requirement for a common standard for federal, state and local government public safety/service agencies, allowing them to communicate with each other in emergency situations. We plan to capitalize on this demand growth by continuing to develop Project 25 compliant feature enhancements and additions to our digital radios and systems.
Develop New and Adapt Existing Technologies to Meet the Market Drive Towards Media Convergence —We believe that the public safety/public service market is moving towards multiband/multimode radio platforms with a slow migration to the APCO Project 25 Phase 2 standard suite. We also believe that the market is moving towards convergent telecommunications solutions that allow easy cost-efficient access to mission critical information, including voice, data and video. We intend on meeting that market shift by integrating the systems we currently have, introducing new products and adding additional components to existing products. In the near term, this will mean kits that include land mobile radios (LMR) and WiFi mesh, location-based context-aware management and dispatching, unified key management framework (KMF) and accessories integrated for solutions. In the longer term, it will mean box-level integration with LMR, WiFi mesh and additional networks, including WiMAX and satellite, and two-tier architecture for gateways and handsets.
8
Seek Partnerships that Enhance Technology or Open New Markets—We recognize that one of the quickest most cost-efficient ways to meet our objectives is to partner with other industry leaders. Therefore we intend to pursue partnerships which allow us to advance our product capabilities in order to offer federal, state and local governments and industry complete solutions that will help them improve response times or improve process control and security for critical infrastructure, such as our partnership with Honeywell International, Inc. in which our wireless access products are offered as part of Honeywell's OneWireless™ universal industrial wireless mesh network solution.
Actively Participate in Driving Industry Standards—We intend to continue to be a leader in setting the public communications standards, which are critical to the markets in which we compete. Our active participation in development activities with industry associations like the Association of Public Safety Communications Officials ("APCO"), Telecommunications Industry Association ("TIA") and the Institute of Electrical and Electronics Engineers ("IEEE") allows us to contribute to the development of better solutions for the market, to build recognition of our technical competence in the industry and among our customers, to gain insight into market trends, and to secure positions for our intellectual property within the technology standards.
Products and Services
Our EFJohnson-branded products consist of wireless radios and communication systems, including system design and installation of infrastructure equipment and services. Our services include technical support maintenance contracts, service parts and training. Our wireless radio offerings are primarily designed to operate in both analog and digital system environments that include Project 25 industry standard, Multi-Net®, and Motorola's SmartNet®/SmartZone®. Certain of our wireless radios, both hand-held portable radios and vehicle-mounted mobile radios, can contain digital encryption technology, Project 25 trunking and various other features.
Our 3eTI-branded products consist of reliable and secure wireless data networking products that meet the highest U.S. government and wireless industry standards. We offer a wide variety of products that can be used in myriad government, military, enterprise, industrial and business applications. We design and sell a range of products meeting many wireless needs, including mesh, bridge, access point, repeater, gateway, client and bridge and complete turnkey solutions and services.
Our Transcrypt-branded products consist of analog and digital encryption products that are sold as an aftermarket add-on for existing radios and systems. These products are available in plug-in or wire-in modules. We also produce modules that add signaling features to radios.
Customers
We sell our products to federal, state and local governmental entities, domestic commercial users and international entities. The end users for our products are first responders such as police, fire and other emergency personnel and military and other governmental users. The U.S. Department of Defense is a significant customer, representing approximately 35%, 15% and 62% of consolidated revenues in 2009, 2008 and 2007, respectively. Sprint/Nextel is a significant customer, representing 17%, and 12% of consolidated revenues in 2009 and 2008, respectively. DRS Technologies, Inc. and the State of California are significant customers, representing 13%, and 12%, respectively, of consolidated revenues in 2008.
Sales and Marketing
We sell our EFJohnson-branded products domestically through a direct sales force of account executives and sales managers as well as through an indirect channel of dealers. We provide support to wireless radio dealers, who re-sell our products to end-users. This support includes advertising materials, sales and service training and technical support. Our sales employees work with our
9
EFJohnson dealer network which spans the United States with approximately 200 participating members. For our 3eTI products, we also utilize original equipment manufacturing ("OEM") and original design manufacturing ("ODM") arrangements for some of our product distribution. We utilize sales channel relationships with larger system integrators who provide solutions to large government agencies. Our international sales are primarily made through a specialized international direct sales force in conjunction with company-authorized dealers/distributors, which typically provide a local contact and arrange for technical training in foreign countries. For sales of our Transcrypt-branded products, our sales employees work with a select group of dealers that service the majority of the countries around the world.
The majority of system sales involves soliciting and responding to requests for proposals ("RFP"). The RFP process for system sales has a relatively long cycle time, typically taking as long as one year, and, depending on the size of the system, taking multiple years to complete installation of a project. In connection with the sale of wireless radio systems to local and state governmental entities, we may be required, at the time the bid is submitted and once the contract is entered into, to provide letters of credit or performance and/or bid bonds that may be drawn upon if we fail to perform under our contracts.
Much of our business is obtained through submission of formal competitive bids. Our government customers generally specify the terms, conditions and form of the contract. Government business is subject to government funding decisions and contract types can vary widely, including fixed-priced, cost-plus, indefinite-delivery/indefinite quantity ("IDIQ"), and a government-wide acquisition contract with the General Services Administration ("GSA") which requires pre-qualification of vendors and allows government customers to more easily procure our products and systems.
GSA Schedule contracts are listings of services, products and prices of contractors maintained by the GSA for use throughout the federal government. When an agency uses a GSA Schedule contract to meet its requirement, the agency or the GSA, on behalf of the agency, conducts the procurement. The user agency, or the GSA on its behalf, evaluates the user agency's services requirements and initiates a competition limited to GSA Schedule qualified contractors. Use of GSA Schedule contracts provides the user agency with reduced procurement time and lower procurement costs.
We also utilize the Small Business Innovative Program ("SBIR") to obtain funding for development and delivery of our 3eTI products and services to government customers. The SBIR program provides funding to small, hi-tech businesses to research, design, develop and test prototype technologies related to specific government needs which are issued as Solicitation Topics every few months on the Internet. This program stimulates technological innovation, integrates small business-developed inventions into defense systems and increases commercial application of DoD supported research and development efforts. The SBIR program has three phases. In Phase I, a small business submits a proposal in response to a DoD Solicitation Topic. Phase I projects that demonstrate the most potential are invited to submit a Phase II proposal to further develop the idea and produce a well-defined prototype. This is where the major R&D effort is conducted. In Phase III, companies are expected to leverage SBIR funding to obtain private or non-SBIR government funding to turn the prototype developed in Phase II into a commercial product or service for sale to military and private sector customers. To participate in Phase I and Phase II, a company must be a for-profit U.S. owned and operated small business with 500 or fewer employees. All work must be performed in the United States.
Research and Development
We design new products around common wireless technologies using commercial off-the-shelf signal processing platforms and circuitry. We have generally been able to incorporate improvements in
10
core technologies into our new products more quickly and with relatively lower development costs by building these platforms on software-based radios.
Our research and development organization has expertise in RF technology, VoIP solutions, call processing, internet protocol networking, cryptography, object-oriented software, WLAN, WiFi, Mesh and analog and digital hardware designs. This knowledge base is leveraged to implement new standards and competitive features into our products and systems. Ongoing engineering efforts are focused on adding features to existing product lines and developing new and innovative products and platforms. Cross-disciplinary groups, involving marketing, customer service, manufacturing and engineering are used for product planning, definition, internal testing and beta testing. We also have knowledge in customized wireless network centric products and systems that utilize FIPS 140-2 validated wireless products, 802.11 wireless networking (WiFi) solutions, mesh networking, and conditions-based and location-based telematics solutions.
We will continue to develop Project 25 products to comply with the Project 25 standards, both existing and emerging. Current developments include the addition of lower cost digital portable and mobile radios, as well as the development of advanced features in our Project 25 infrastructure equipment, including repeaters, base stations, network-switching equipment, network management solutions and consoles. We have applied standard internet protocol switching techniques for the connection of wireless sites and have been granted patents by the United States patent office in this area with several other patents pending. Our WLAN solutions utilize the 802.11i family of standard protocols. Encryption used in products includes the Advanced Encryption Standard ("AES") published as a Federal Information Processing Standard of the National Institute of Standards and Technology.
With the acquisition of 3eTI in July 2006, we gained significant expertise in wireless LAN, wireless LAN security, mesh networking and other leading wireless data protocols. We plan to continue to develop leading edge wireless technology solutions for governmental agencies and to bring those technologies into the industrial process control marketplace providing high-speed, reliable and secure wireless networking capabilities to the market.
In fiscal 2009, approximately $11.5 million was expended for research and development compared with $10.1 million (net of $4.0 million reimbursed expenses more fully disclosed herein) in fiscal 2008, and $15.7 million in fiscal 2007.
Intellectual Property and Material Licenses
We hold a number of U.S. patents. These patents cover a broad range of technologies, including trunking protocols, high-end scrambling and encryption techniques, methods of integrating after-market devices, and a high-speed data interface for wireless radio communications. Furthermore, we hold certain copyrights that cover software containing algorithms for frequency hopping, scrambling and wireless radio signaling technologies, as well as registered trademarks related to the "EFJohnson", "3eTI" and "Transcrypt" names and product names. In addition to patent, trademark, and copyright laws, we rely on trade secret law and employee and third party non-disclosure agreements to protect our proprietary intellectual property rights.
We have obtained from Motorola a non-exclusive, worldwide license to manufacture products containing certain proprietary wireless radio and digital encryption technology. We believe this technology has been and will continue to be important to the success of our business for the next three to five years. The license includes rights to use Motorola's proprietary analog APCO 16 trunking technology (SmartNet®/SmartZone®), and certain Motorola digital encryption algorithms in our wireless radio products. In addition, we obtained a license to utilize certain proprietary technology from Motorola relating to the development of Project 25 compliant digital wireless radios. This license covers wireless radios, infrastructure wireless systems and other Project 25 technology. We have also obtained a license from Motorola to license a limited number of their proprietary SmartNet®/SmartZone®
11
technology products relating to the FCC enacted regulatory changes to reallocate portions of the 800 MHz frequency band, discussed above.
Suppliers
We outsource manufacturing of our EFJohnson and 3eTI-branded products, which permits us to efficiently allocate our resources to marketing and research and development efforts, which we perceive to be our core competencies. Our EFJohnson-branded products are manufactured by Creation Technologies, Inc., a Vancouver, British Columbia, Canada-based contract manufacturer with manufacturing operations in Plano, Texas, and McDonald Technologies International, Inc., a Texas-based contract manufacturer. We assemble some of our 3eTI networking products at our facilities in Irving, Texas. Sub-assembly components for Transcrypt-branded products are manufactured by Tran Electronics, Inc., a Minnesota-based contract manufacturer, and Honeywell International, Inc. manufactures sub-assembly components for certain 3eTI-branded products. Creation Technologies, Inc. and McDonald Technologies International, Inc. contract with other vendors to manufacture components and subassemblies in accordance with our specific design criteria. Some components and subassemblies used in our products are presently available only from a single supplier or a limited group of suppliers. CalAmp Corp. provides us with our RF module for our land mobile radio products. If necessary, we believe that alternative sources could be obtained to supply these products. To date, we have been able to obtain adequate supplies of key components and subassemblies in a timely manner from existing sources.
Competition
In addition to EFJohnson, we believe that Motorola, Harris, Icom America, Inc., Kenwood, Tait Electronics and Relm are currently the principal suppliers of Project 25 wireless radio products, although we anticipate other companies to announce future entry into the Project 25 compliant product market. Of our competitors, we believe that Motorola, and to a much lesser extent, Harris and EADS, are the primary Project 25 suppliers offering trunked infrastructure. Other wireless radio providers are less focused on the Project 25 market, including Uniden America Corporation, Datron, Vertex and Midland. Our focus is homeland security, defense, public safety and public service and international markets, where we compete on the basis of value, technology and the flexibility, support and responsiveness provided by us and by our dealers.
The markets for secured wireless networking and encryption products are highly competitive. Competitors include Fortress Technologies, Aruba Networks, Tropos, Alvarion, Cisco Systems, Filcom d/b/a/ Daxon, Kavit Electronics Industries, and Midian Electronics Inc. Significant competitive factors in these markets include product quality and performance features, including effectiveness of security features, quality of the resulting voice or data signal, development of new products and features, price, name recognition, and quality and experience of sales, marketing and service personnel.
Government Regulation and Export Controls
Wireless communications are regulated by a variety of governmental and other regulatory agencies throughout the world. In the U.S., our wireless products are subject to regulation by the Federal Communications Commission ("FCC"), which has been granted broad authority under the Communications Act of 1934, as amended, to make rules and regulations. Foreign regulatory bodies, such as the European Telecommunication Standards Institute ("ETSI"), perform functions similar to the FCC in countries subject to their respective regulatory authority. Compliance with these FCC and foreign rules and regulations provide us with general approval to sell products within a given country for operation in a given frequency band, one-time equipment certification, and, at times, local approval for installation of communications systems. Additionally, the FCC and foreign regulatory authorities regulate the spectrum used to provide wireless radio communications, as well as the construction,
12
operation, and acquisition of wireless communications systems, and certain aspects of the performance of mobile communications products. In those countries that have accepted certain worldwide standards, such as the FCC or ETSI rulings, we have not experienced significant regulatory barriers in bringing our products to market. Approval in these markets involves retaining local testing agencies to verify specific product compliance with all applicable rules and regulations.
In addition to FCC rules and regulations, wireless radio communications of the U.S. Government are controlled by the National Telecommunications and Information Administration, or NTIA, which regulates technical specifications of the product and spectrum used by the U.S. Government and other users. Many of these governmental regulations are highly technical and subject to change.
The majority of the systems operated by our land mobile radio customers must comply with the rules and regulations governing what have traditionally been characterized as "private radio" or private carrier communications systems. Licenses are issued to use frequencies on either a shared or exclusive basis, depending upon the frequency band in which the system operates. Some of the channels designated for exclusive use are employed on a for-profit basis, and other channels are used to satisfy internal communications requirements.
The regulatory environment is inherently uncertain and changes in the regulatory structure and laws and regulations, both in the United States and internationally, can adversely affect us and our customers. Such changes could make existing or planned products obsolete or unusable in one or more markets, which could have a material adverse effect on us. The FCC, through the Public Safety Wireless Advisory Committee, has considered regulatory measures to facilitate a transition by public safety agencies to a more competitive, innovative environment so that the agencies may gain access to higher-quality transmission, emerging technologies, and broader services, including interoperability.
In August 1998, the FCC adopted rules for licensing the largest block of spectrum ever allocated at one time for public safety. The FCC established rules for licensing 24 megahertz in the 700 MHz band and established a band plan for use of this spectrum. In accordance with this rule, in January 1999, the FCC established a Public Safety National Coordination Committee ("NCC") to advise it on issues relating to the use of the 700 MHz public safety spectrum. The NCC was responsible for formulating a national interoperability plan, recommending technical standards to achieve interoperability, and providing policy recommendations on an advisory basis to the regional planning committees in order to facilitate the development of coordinated plans. The NCC recommended that Project 25 be established as the interim interoperability mode for digital voice communications in this new band. During January of 2001, the FCC released its Fourth Report and Order in which Project 25 was chosen as the interoperability standard. Subsequent FCC rulings established a timetable for mandating the use of narrower channels in order to promote better spectrum utilization. Specifically, the date of January 1, 2007 was established as the date after which all radios that are FCC type certified, and all radios that are sold for use in the 700 MHz band, must include a mode that has an equivalent 6.25 kHz channel efficiency. This date was also established as the date after which no 12.5 kHz licenses could be applied for. In 2005, the FCC delayed that date until January 1, 2015. Legislation known as the Digital Television Transition Act of 2005, as part of the Deficit Reduction Act of 2005, set the date of February 17, 2009 as the date by which all incumbent television broadcast stations must evacuate the 700 MHz spectrum, thus freeing the spectrum for the exclusive use of public safety users. This date was further delayed until June 12, 2009, at which time the transition was implemented. This has freed up additional spectrum for Public Safety in the 700 MHz band.
In March 2006, the FCC sought direction as to whether the segment of the 700 MHz frequency band that had been allocated to wideband operation should be allocated instead to broadband operation. In July 2007, the FCC revised their rules to promote broadband deployment in the 700 MHz band. This ruling established a public/private partnership for broadband data service. This would result in a single nationwide license for 10 MHz of public safety spectrum to be granted to a Public Safety
13
Broadband Licensee ("PSBL"). A partnership would be established between the PSBL and the winning bidder for the adjacent 10 MHz of spectrum, known as the "D block." These combined spectrum assets would form the basis for a shared private/public network, resulting in a nationwide network for public safety with secondary usage for commercial entities. The FCC "D block" auction in January 2009 failed to garner the requisite minimum bid. Subsequent rulemaking and future auction dates have not been finalized.
FCC rulings in the VHF and UHF frequency bands have been enacted to promote more spectral efficiency by mandating the use of narrower channels. In 2005, however, the FCC delayed the implementation of some of these rules. The date by which all radios receiving type certification must have an equivalent channel efficiency of one voice channel in 6.25 kHz of spectrum, and preventing the certification of equipment with 25 kHz channel efficiency, initially set as January 1, 2005, was delayed until January 2011, thus allowing the continuation of certification and manufacture of 25 kHz equipment. The date of January 1, 2011 has been set as the last day for users to apply for 25 kHz licenses, and the last day to sell or import 25 kHz equipment. Also, the date of January 1, 2013 has been established as the date when all users must migrate away from 25 kHz equipment, and use equipment with 12.5 kHz channel efficiency or less.
Our products are currently subject to general export controls administered by the Department of Commerce, Bureau of Industry Security ("BIS"). U.S. export laws strictly prohibit the export of any product to certain specified countries. In addition to the regulation of product export in general, additional regulations permit the export of our encryption products to commercial or governmental end users only with the required level of export license or license exception.
Additionally, in certain foreign countries, our distributors are subject to applicable import regulations required to secure licenses or formal permission before encryption products can be imported.
We cannot predict whether any new legislation regarding export or import controls will be enacted, what form such legislation will take or how any such legislation will impact international sales of our products.
Backlog
Our Transcrypt-branded products typically have a short turnaround cycle. In contrast, our EFJohnson products and systems, and 3eTI government services contracts, typically have a longer turnaround cycle due to customer system integration and contract delivery requirements that may span multiple years. At December 31, 2009, we had a total backlog of purchase orders and contracts of approximately $70.2 million. This compares to backlog of $68.2 million and $95.0 million at December 31, 2008 and 2007, respectively.
Employees
At December 31, 2009, we had 267 full-time equivalent employees. We also use temporary employees, independent contractors and consultants when necessary to manage fluctuations in demand. None of our employees are covered by a collective bargaining agreement.
14
You should carefully consider the risks described below before investing in our securities. The risks and uncertainties described below are not the only ones facing our company. Additional risks and uncertainties not presently known to us or that we currently deem immaterial may also affect our business and results of operations. If any of these risks actually occur, they could have a material adverse effect on our business, financial condition, cash flow or results of operations, as well as adversely affect the value of an investment in our common stock.
Our indebtedness, ability to repay or refinance, could limit our ability to operate our business successfully.
The Company's loan agreement with Bank of America, N.A., which governs our revolving line of credit and $15 million term loan, expires June 30, 2010. As a result, the $15.0 million term loan is due and payable in full on that date. The Company does not anticipate that it will have sufficient cash on hand on that date to pay off the term loan, or, if at all, without dedicating all or substantially all of our cash flow from operations to the payment of our indebtedness, thereby substantially reducing the funds available for operations, working capital, capital expenditures, research and development, sales and marketing initiatives and general corporate or other purposes. As a result, the Company is exploring options available to it to refinance the debt, or to raise additional funds through private equity or debt financing, sales of assets, or other strategic alternatives. These funds may not be available, or if available, we may not be able to obtain them on terms favorable to us. If we are unable to refinance the debt or raise sufficient additional funds, our business could materially suffer.
If we raise additional funds through further issuances of equity or convertible debt securities, our existing stockholders could suffer significant dilution in their percentage ownership of our company, and any new equity securities we issue could have rights, preferences and privileges senior to those of holders of our common stock. In addition, any debt financing that we may secure in the future could have restrictive covenants relating to our capital raising activities and other financial and operational matters, which may make it more difficult for us to obtain additional capital and to pursue business opportunities.
If we sell certain assets of the Company to satisfy our obligations, that may materially reduce our revenues in the future, which, to the extent not offset by cost reductions or revenue from new or existing customers, could materially reduce our cash flows and adversely affect our financial position. This may limit our ability to raise capital or fund our operations, working capital needs and capital expenditures in the future.
Our loan agreement contains covenants that require us to satisfy certain criteria.
The loan agreement with Bank of America, N.A. contains certain covenants regarding limitations on debt, liens, fundamental changes, acquisitions, transfers of assets, investments, loans, guarantees, use of proceeds and capital expenditures. In addition, the loan agreement contains certain financial covenants. We were not in compliance with certain of the financial covenants of the loan agreement for the quarter ended December 31, 2009. As a result, effective March 1, 2010, we executed an amendment to the loan agreement whereby Bank of America waived such financial covenant defaults on a one-time basis, waived compliance with such financial covenants for the Company's first quarter of 2010, and further amended the loan agreement to, among other things, (i) lower the revolving line of credit from $10.0 million to $3.75 million, (ii) make all future advances under the line subject to the lender's discretion, (iii) further limit our ability to obtain letters of credit, (iv) require us to pledge additional cash collateral totaling $3.5 million for the remaining term of the loan agreement no later than June 15, 2010, and (v) require us to provide additional financial reporting to the bank on a monthly basis. Failure to comply with any of these terms could constitute an event of default that would permit the lender to accelerate the loans upon their occurrence, which could have a material adverse effect on
15
our operating results and cash flows. We cannot assure that in the future we will be able to achieve, maintain or satisfy these obligations under the loan agreement or obtain a waiver from Bank of America in the event we fail to comply.
We have limited resources and our inability to obtain additional financing could negatively affect our growth and success.
Our current cash flow and capital resources are limited, and we require additional funds to pursue our business. We may not be able to secure further financing in the future. If we are not able to obtain additional financing on reasonable terms, we may not be able to execute our business strategy, conduct our operations at the level desired, or even to continue business.
Our "report of registered public accounting firm" indicates substantial doubt about out ability to continue as a going concern.
Our "report of registered public accounting firm" on our financial statements indicates that our recurring losses from operations, working capital deficit and maturing term loan raise substantial doubt about our ability to continue as a going concern.
Our financial results have varied, and may continue to vary, significantly from quarter to quarter and we may fail to meet expectations, which might negatively impact our business and the price of our stock.
Our operating results may fluctuate significantly from period to period due to a number of factors, many of which are outside our control, including:
- •
- timing of customer orders;
- •
- timing and mix of product sales;
- •
- seasonality of product sales;
- •
- timing of the introduction of new products;
- •
- the duration of the sales cycle for our systems business;
- •
- our ability to meet the performance criteria under our agreements with our customers;
- •
- general economic conditions, both in the United States and overseas; and
- •
- specific economic conditions in our industry and markets.
These factors have limited our ability to forecast our sales volume and product mix, making it difficult to provide estimates of revenues and operating results. These factors also make it difficult to use our quarterly results as a predictor of future operations. Historically, more than half of each quarter's revenues are shipped during the third month of a quarter, and disproportionately in the latter half of that month. These factors make revenue forecasting inherently uncertain. We continue to have limited visibility into the capital spending plans of our current and prospective customers. Fluctuations in our revenue can lead to even greater fluctuations in operating results. Our planned expense levels depend, in part, on revenue expectations, but significant portions of our expenses are not variable in the short term. Our planned expenses include significant investments in research and development necessary to develop products to be sold to current and prospective customers, even though we are unsure of the volume, duration, or timing of any purchase orders. Accordingly, it is difficult to forecast revenue and operating results, and a relatively small revenue shortfall may cause a period's results to be substantially below expectations. If our revenue or operating results are below expectations, that could materially and negatively impact our financial position, results of operations and liquidity. Furthermore, failure to meet investor and market analyst expectations could cause a decline in the price of our common stock.
16
Our recent financial results may continue to impact our ability to secure satisfactory bonding arrangements, which could adversely affect revenues.
In the normal course of our business activities, we are required under certain contracts with various government authorities to provide letters of credit and bonds that may be drawn upon if we fail to perform under our contracts. A number of factors can limit the availability of such bonds, including a company's financial condition and operating results, a company's record for completing similar systems contracts in the past and the extent to which a company has bonds in place for other projects. Bonds, which expire on various dates, totaled approximately $2.4 million at December 31, 2009, and, as of such date, no bonds have been drawn upon. While we have not had a customer declare a default, a customer could declare an event of default under an outstanding bond related to a system contract. In such event, the issuer of our bonds could reduce the maximum amount of bond coverage available to us, or impose additional restrictions with respect to the issuance of bonds on our behalf. Our inability to secure bonding arrangements when needed would adversely affect our ability to be awarded new systems installation contracts, which would adversely affect our revenues. Our recent financial results may also impact customers' decisions in awarding new systems contracts where long-term warranties or service commitments are required.
The current capital and credit market conditions may adversely affect our access to capital, cost of capital and business operations.
The general economic and capital market conditions in the United States and other parts of the world have adversely affected access to capital and increased the cost of capital. If these conditions continue or become worse, our future cost of debt and equity capital and access to capital markets could be adversely affected. Additionally, these conditions could negatively impact our ability to refinance the current debt with Bank of America and other strategic financing alternatives that we are pursuing. Any inability to obtain adequate financing from debt and equity sources could force us to self-fund strategic initiatives or even forego some opportunities, potentially harming our financial position, results of operations and liquidity.
Demand for our products and services are vulnerable to economic downturns. If general economic conditions continue to weaken, then our revenues and our financial condition may materially decline.
We are vulnerable to general downturns in the economy. Due to the ongoing economic downturn, demand for our products and services may decrease as our customers face a deterioration of their funding sources or decide to delay spending out of uncertainty regarding the future. A continued deterioration of the economy could result in the following risks to our business:
- •
- declines in revenues and profitability from reduced orders, payment delays or other factors caused by the economic
problems of customers;
- •
- reprioritization of government spending away from defense and homeland security programs in which we participate;
- •
- adverse impacts on our access to credit sources; and
- •
- supply problems associated with any financial constraints faced by our vendors.
A significant portion of our sales have been, and will continue to be, to federal, state and local government agencies, both directly or indirectly, through system integrators and other resellers. Sales to government contractors and government agencies could decline as a result of spending cuts and general budgetary constraints which may become more frequent as tax revenues decline due to the continued weakening of general economic conditions.
17
Our sales are substantially concentrated in public sector markets that inherently possess additional risks that could harm revenues and gross margins.
A significant portion of our revenue is derived from sales to federal, state, and local governments, both directly or through system integrators and other resellers. Sales to these government entities present risks in addition to those involved in sales to commercial customers, including potential disruptions due to appropriation and spending patterns, changes in government personnel, political factors and the government's reservation of the right to cancel contracts for its convenience. The bidding cycle for a request for proposal, or RFP, and contract award stage can take six months to two years before a contract is awarded and the government funding process for these systems can delay the bidding cycle as well. We expect that sales to government entities will increasingly be subject to competitive bidding requirements. This intensified competition may result in lower prices, longer sales cycles and lower margins. Further, our sales to these domestic public safety and public service entities can be substantially attributed to Project 25 interoperability mandates and homeland security initiatives. Changes in governmental budget priorities could result in decreased opportunities for us to sell into this market segment. Additionally, certain industry initiatives, such as the rebanding initiative, are expected to wind down by the end of 2011.
We depend on federal government contracts for a substantial portion of our revenues, and the loss of federal government contracts or a decline in funding of existing or future government contracts could adversely affect our revenues and cash flows.
A substantial portion of our revenues is dependent upon continued funding of federal government agencies, as well as continued funding of the programs targeted by us. U.S. government contracts are subject to termination for convenience by the government, as well as termination, reduction, or modification in the event of budgetary constraints or any change in the government's requirements. General political and economic conditions, which cannot be accurately predicted, directly and indirectly may affect the quantity and allocation of expenditures by federal agencies. Even the timing of incremental funding commitments to existing, but partially funded, contracts can be affected by these factors. Therefore, cutbacks or re-allocations in the federal budget could have a material adverse impact on our results of operations. Further, our contract-related costs and fees, including allocated indirect costs, may be subject to audits by the U.S. government that may result in recalculation of contract revenues and non-reimbursement of some contract costs and fees. In addition, when we act as a subcontractor, the failure or inability of the prime contractor to perform its prime contract may result in an inability to obtain payment of fees and contract costs.
In addition, government contract awards can be contested by other competing contractors, which may result in delays in the commencement of our performance and receipt of payments for our work under such contracts.
U.S. government contracts are dependent upon the continuing availability of congressional appropriations. Congress usually appropriates funds on a fiscal year basis even though contract performance may take several years. Consequently, at the outset of a major program, the contract is usually incrementally funded and additional funds are normally committed to the contract by the procuring agency as Congress makes appropriations for future fiscal years. Any failure of such agencies to continue to fund such contracts could have a material adverse effect on our operating results.
These or other factors could cause federal government agencies to shift their spending priorities, reduce their purchases under contracts, to exercise their right to terminate contracts, or exercise their right not to renew contracts, all of which may limit our ability to obtain or maintain contract awards. Any of the aforementioned actions above could adversely affect our revenues and cash flows.
18
We carry substantial quantities of inventories.
We carry a significant amount of inventories to service customer requirements in a timely manner. If we are unable to sell these inventories over a commercially reasonable time, we may be required to take inventory markdowns in the future, which could reduce our gross margins. In addition, it is critical to our success that we accurately predict trends in customer demand in the future and do not overstock unpopular products or fail to sufficiently stock popular products. Both scenarios could harm our operating results.
Our reliance on third-party suppliers poses significant risks to our business and prospects.
We use contract manufacturers to manufacture our products, in some cases on a sole or limited source basis. In addition, a substantial portion of the hardware components for our products, including integrated circuits, printed circuit boards, connectors, cables, power supplies, and certain RF modules, are obtained on a sole or limited source basis from third-party suppliers, including third-party suppliers located in foreign countries. We are subject to substantial risks because of our reliance on these suppliers. For example:
- •
- if a supplier fails to provide components that meet our specifications in sufficient quantities to meet demand, then
production and sale of our products may be delayed or otherwise adversely affected;
- •
- if a supplier disagrees with our assessment that the supplier products do not meet specifications, we may incur additional
costs associated with disputed products;
- •
- if a reduction or an interruption in the supply of our components should occur, either because a supplier fails to provide
parts on a timely basis, a supplier provides parts that later prove to be defective or a single-source supplier elects to no longer provide those components to us, it could take us a considerable
period of time to identify and qualify alternative suppliers to redesign our products as necessary and to begin manufacture of the redesigned components or we may not be able to redesign such
components;
- •
- if we were unable to locate a supplier for a key component, we may be unable to identify an alternative component and
therefore may be unable to complete and deliver our products;
- •
- one or more suppliers could make strategic changes in their product offerings, which might delay delivery, suspend
manufacturing or increase the cost of our components or systems;
- •
- some of our key suppliers are small companies with limited financial and other resources, and consequently may be more
likely to experience financial and operational difficulties than larger, well-established companies that could result in the interruption or termination of the supply of critical
components; and
- •
- some of our suppliers are located in foreign countries which may be subject to economic or political uncertainty.
Our products must meet demanding specifications and must perform reliably. Delays in product shipments and acceptances adversely affect our revenues and margins.
Our products and planned successor products are based upon certain processors manufactured from multiple suppliers. If any of these suppliers were to cease providing these processors, or suffer delays or cancel the development of enhancements to its processors, our product revenue could be adversely affected. Changing our product designs to utilize another supplier's integrated circuits would be a costly and time-consuming process.
19
If the quality of our products does not meet our customers' expectations, then our sales and operating earnings, and ultimately our reputation, could be adversely affected.
The products we sell are subject to quality and reliability issues resulting from the design or manufacture of the product, components provided by our suppliers or partners, or from the software used in the product. Issues may be identified prior to the shipment of the products and may cause delays in shipping products to customers, or even the cancellation of orders by customers. We may discover or may be informed of quality issues in the products after they have been shipped to our distributors or end-user customers, requiring us to resolve such issues in a timely manner that is the least disruptive to our customers. Such pre-shipment and post-shipment quality issues could have legal and financial ramifications, including: delays in the recognition of revenue, loss of revenue or future orders, customer-imposed penalties on us for failure to meet contractual shipment deadlines, increased costs associated with repairing or replacing products, and a negative impact on our goodwill and brand name reputation.
We may be required to offset future deferred tax assets with a valuation allowance.
During the quarter ended December 31, 2009, we conducted an analysis of our ability to utilize our deferred tax assets. As a result of this analysis, we changed the valuation allowance relating to our increased deferred tax assets resulting in a $5.0 million increase to the valuation allowance. If we fail to achieve revenue growth rates or gross margins assumed in the calculation of our deferred tax assets, we may be required to offset future deferred tax assets with a valuation allowance, resulting in an additional tax expense. The change in the valuation may have a material impact on future results. If we do not achieve sufficient domestic federal taxable income in future years to utilize all or some of our net operating loss carryforwards, they will expire.
Reduced access to Motorola's technology could harm our business and operations.
We have obtained from Motorola a non-exclusive, worldwide license to manufacture products containing certain proprietary wireless radio and digital encryption technology. We believe this technology will be important to the success of certain of our existing and proposed Project 25 compliant wireless radio products. The license includes rights to use Motorola's proprietary analog APCO 16 trunking technology (SmartNet®/SmartZone®) and Project 25 required products. The digital encryption technology may also be incorporated into certain other secured communications products. In addition, we obtained a license to utilize certain proprietary technology from Motorola relating to the development of Project 25 compliant digital wireless radios. This license covers infrastructure and other Project 25 technology. Any termination of these licensing arrangements would significantly harm our business and operations.
Our future success will depend upon our ability, and our having the resources available, to respond to the rapidly evolving technology and customer requirements in the markets in which we operate.
The markets in which we compete are rapidly evolving as a result of changing technology, industry standards and customer requirements. Our ability to compete effectively will depend upon our ability to anticipate and react to these changes in a timely manner. We may not have adequate capital or human resources to respond to these changes.
Technological developments in the digital wireless radio industry include the use of digital trunking, digital simulcast and digital voting technologies. Also, the standards under which we develop our products, such as the 802.11 standards, are rapidly evolving. These technologies have led a number of manufacturers to change the architectures and methodologies used in designing, developing and implementing large wireless radio systems. In order for us to develop and integrate these new technologies and standards into our products, we have made a substantial investment in fixed assets
20
and human resources. However, due to our limited capital resources, we have significantly reduced expenditures for on-going research and development, delaying and/or cancelling certain research and development projects. There can be no assurance that sufficient resources will be readily available to us in the future, and our failure to incorporate these technologies into our wireless radio products could place our wireless radio products at a competitive disadvantage. This situation could possibly make our hand-held and mobile wireless radios incompatible with systems developed by other manufacturers, which would have a material adverse effect on us.
The products as complex as those under development by us frequently are subject to delays, and we cannot ensure that we will not encounter difficulties, such as the inability to assign a sufficient number of quality software and hardware engineers to key projects or other unanticipated causes, that could delay or prevent the successful and timely development, introduction and marketing of new products or required product features. In addition, our products are implemented by certain third-party hardware and software. We cannot ensure that we will be able to design, have manufactured, or procure from third parties, the hardware and software necessary to successfully implement our new products and applications.
In addition, part of our success depends on our ability to commercialize our custom solutions to enable us to sell such solutions to other customers, including government and commercial users.
We face competitive pressures that could adversely affect revenues, gross margins and profitability.
Our industry and markets are highly competitive. Motorola and Harris hold dominant and entrenched market positions in the domestic public safety and service market for wireless communication products. In addition, these competitors have financial, technical, marketing, sales, manufacturing, distribution and other resources substantially greater than our resources. Finally, these competitors have established trade names, trademarks, patents and other intellectual property rights and substantial technological capabilities. These advantages may allow such competitors to:
- •
- respond more quickly to new or emerging technologies;
- •
- manage more extensive research and development programs;
- •
- undertake more far-reaching marketing campaigns;
- •
- engage in more aggressive merger and acquisition strategies; and
- •
- adopt more aggressive pricing policies.
Also, we could lose some of our competitive advantage if our competitors obtain common criteria and FIPS 140-2 validation for their products. Accordingly, we cannot make any assurances that we will be able to continue to compete effectively in our markets, that competition will not intensify, or that future competition from existing or from new competitors will not have a material adverse effect on our revenues, gross margins or profitability.
The loss of certain of our key personnel and any future potential losses of key personnel or our failure to attract additional personnel could seriously harm our company.
We have continued our efforts to reduce costs by eliminating certain employee positions and / or leaving some positions unfilled. As a result, we rely upon the continued service of a relatively small number of key technical, sales and senior management personnel. Our future success depends on retaining our key employees and our ability to retain, attract and train other highly qualified technical, sales and managerial personnel. Our employees can typically resign with little or no prior notice. Our loss of certain of our key technical, sales and senior management personnel, and the intellectual capital that they possess, or our inability to retain, attract and train additional qualified personnel could have a material adverse effect on our business, results of operations, cash flow and financial condition.
21
If we are unable to protect our intellectual property adequately or license technology from third parties, we could lose our competitive advantage.
Our ability to compete effectively against competing technologies will depend, in part, on our ability to protect our current and future technology, product designs and manufacturing processes through a combination of patent, copyright, trademark, trade secret and unfair competition laws. Although we assess the advisability of patenting any technological development, we have historically relied on copyright and trade secret law, as well as employee and third-party non-disclosure agreements, to protect our proprietary intellectual property and rights. The protection afforded by such means may not be as complete as patent protection. In addition, the laws of some countries do not protect trade secrets. In the event that our proprietary rights prove inadequate to protect our intellectual property, our competitors may:
- •
- independently develop substantially equivalent proprietary information, products and techniques;
- •
- otherwise gain access to our proprietary information; or
- •
- design around our patents or other intellectual property.
In addition, much of our business and many of our products rely on key technologies developed by third parties, and we may not be able to obtain or renew licenses or technologies from these third parties on reasonable terms or at all. In addition, when we do not control the prosecution, maintenance and enforcement of certain important intellectual property rights, such as a technology licensed to us, the protection of the intellectual property rights may not be within our control. If the entity that controls the intellectual property rights does not adequately protect those rights, our rights may be impaired which may impact our ability to develop, market and commercialize the related products.
If we are subject to litigation and infringement claims, they could be costly and disrupt our business.
In recent years, there has been significant litigation involving patents and other intellectual property rights in many technology-related industries. There may be patents or patent applications in the United States or other countries that are pertinent to our business of which we are not aware. The technology that we incorporate into and use to develop and manufacture our products may be subject to claims that they infringe the patents or proprietary rights of others. The success of our technology efforts will also depend on our ability to develop new technologies without infringing or misappropriating the proprietary rights of others.
While we have no currently pending claims, we have received in the past, and may receive in the future, notices from third parties alleging patent, trademark or copyright infringement, claims regarding trade secrets or contract claims. Receipt of these notices could result in significant costs as a result of the diversion of the attention of management from our technology efforts. If a successful claim were brought against us, we may be required to license the intellectual property right from the claimant or to spend time and money to design around or avoid the intellectual property. Any such license may not be available at reasonable terms, or at all.
We may be involved in future lawsuits, arbitrations or other legal proceedings alleging patent infringement or other intellectual property rights violations. In addition, litigation, arbitration or other legal proceedings may be necessary to:
- •
- assert claims of infringement or misappropriation of or otherwise enforce our intellectual property rights;
- •
- protect our trade secrets or know-how; or
- •
- determine the enforceability, scope and validity of our intellectual property rights or those of others.
22
We may be unsuccessful in defending or pursuing these lawsuits or claims. Regardless of the outcome, litigation can be very costly and can divert management's efforts. An adverse determination may subject us to significant liabilities or require us to seek licenses to other parties' intellectual property rights. We may also be restricted or prevented from developing, manufacturing, marketing or selling a product or service that we develop. Further, we may not be able to obtain any necessary licenses on acceptable terms, if at all.
In addition, we may have to participate in proceedings before the United States Patent and Trademark office, or before foreign patent and trademark offices, with respect to our patents, patent applications, trademarks or trademark applications or those of others. These actions may result in substantial costs to us as well as a diversion of management attention. Furthermore, these actions could place our patents, trademarks and other intellectual property rights at risk and could result in the loss of patent, trademark or other intellectual property rights protection for the products and services on which our business strategy depends.
Unfavorable government audit results could subject us to a variety of penalties and sanctions.
The federal government audits and reviews our performance on awards, pricing practices, cost structure, and compliance with applicable laws, regulations, and standards. Like most large government vendors, our awards are audited and reviewed on a continual basis by federal agencies, including the Defense Contract Management Agency and the Defense Contract Audit Agency. An audit of our work, including an audit of work performed by subcontractors we have hired or may hire, could result in an adjustment in the current period operating results. For example, any costs which were originally reimbursed could subsequently be disallowed. In this case, cash we have already collected may need to be refunded and our operating margins may be reduced.
If a government audit uncovers improper or illegal activities, we may be subject to civil and criminal penalties and administrative sanctions, including termination of contracts, forfeiture of profits, suspension of payments, fines and suspension or debarment from doing business with U.S. Government agencies. In addition, we could suffer serious harm to our reputation if allegations of impropriety were made against us, even if the allegations were not true.
If we were suspended or debarred from contracting with the U.S. Government generally, or any specific agency, if our reputation or relationship with U.S. Government agencies were impaired, or if the Government otherwise ceased doing business with us or significantly decreased the amount of business it does with us, our revenue and operating results would be materially harmed.
We may be liable for penalties under a variety of federal procurement rules and regulations, and changes in such rules and regulations could adversely impact our revenues, operating expenses and profitability.
Parts of our business must comply with and may be affected by government regulations that impact our operating costs and profit margins, as well as our internal organization and operation. The most significant regulations are:
- •
- the U.S. Federal Acquisition Regulations, which comprehensively regulate the formation, administration and performance of
government contracts, including our GSA contract;
- •
- the U.S. Truth in Negotiations Act.; and
- •
- the U.S. Cost Accounting Standards.
These regulations affect how we and our customers do business and, in some instances, impose added costs. Any failure to comply with applicable laws or any changes in applicable laws could result in contract termination, price reduction, customer reimbursement, contract suspension or debarment
23
from contracting with the U.S. Government. Any of these results could adversely affect our financial performance.
Our failure to comply with, or changes in, governmental regulation could adversely affect our business and operations.
Our products, and the spectrum within which these products are used, are subject to regulation by domestic and foreign laws and international treaties, as are our customers. In particular, our wireless radio products are regulated by the FCC. The regulatory environment is uncertain. Changes in the regulatory structure, laws or regulations, or in the use or allocation of spectrum, could adversely affect us or our customers. Such changes could make our existing or planned products obsolete or not sellable in one or more markets, which could have a material adverse effect on us. Further, our failure to comply in the future with applicable regulations could result in penalties on us, such as fines, operational restrictions, or a temporary or permanent closure of our facilities.
If the current Project 25 standard is supplanted by some other recommended protocol or is otherwise not supported or mandated by the federal, state and local government agencies, it would adversely affect our operations, cash flows and financial condition.
In 1995, APCO promulgated a new recommended standard known as Project 25. Our land mobile radio marketing and research and development efforts are substantially focused on Project 25 standard compliant equipment. We believe that sales of our Project 25 digital wireless radio products have been, and will continue in the foreseeable future to be, substantially dependent upon Motorola's dominant position as a market leader in the Project 25 marketplace. Motorola is the largest manufacturer of Project 25 compliant wireless radio products and has been the principal public supporter of the Project 25 digital transmission standard for the wireless radio market. If Motorola does not continue to support the standard, or if the Project 25 standard is otherwise abandoned by industry and government public safety and public service users, it would adversely affect our operations, cash flows and financial condition. Further, if the industry materially accelerates its movement towards Phase II, the next generation of the APCO Project 25 standard, to the degree that our development efforts cannot keep pace with Phase II compliant equipment, it would have a material adverse effect on our financial results.
Business, political, regulatory, or economic changes in foreign countries in which we market our products or services could adversely affect our revenues.
Although our sales have historically been denominated in U.S. dollars, fluctuations in the value of international currencies relative to the U.S. dollar may affect the price, competitiveness, economic attractiveness, and, ultimately, profitability of our products sold in international markets. Furthermore, the uncertainty of monetary exchange values has caused, and may in the future cause, some foreign customers to delay new orders or delay payment for existing orders. Additionally, troubled economic conditions, in regions and nations to which we presently market, could result in lower revenues for us.
In 2009, 2008 and 2007, international sales constituted approximately 12%, 7% and 4% of revenues, respectively, most of which involve our land mobile radios for 2009 and 2008 and our higher margin analog encryption products for 2007. While many of the international sales are supported by irrevocable letters of credit or cash in advance and thereby pose little credit risk, our international business could be adversely affected by a variety of factors presenting increased risks to profitability. These factors include:
- •
- unexpected changes in regulatory requirements;
- •
- tariffs and other trade barriers;
24
- •
- political and economic instability in foreign markets;
- •
- difficulties in establishing foreign distribution channels;
- •
- longer payment cycles or uncertainty in the collection of accounts receivable;
- •
- increased costs associated with maintaining international marketing efforts;
- •
- cultural differences in the conduct of business;
- •
- natural disasters or acts or terrorism;
- •
- difficulties in protecting intellectual property; and
- •
- susceptibility to orders being cancelled as a result of foreign currency fluctuations.
We are subject to government regulation, which may require us to obtain additional licenses and could limit our ability to sell our products outside the United States.
The sale of certain of our products outside the United States is subject to compliance with the United States Export Administration Regulations and the International Traffic in Arms Regulations. Sales of several of our encryption and broadband products require clearance and export licenses from the U.S. Department of Commerce under these regulations. We cannot assure that such approvals will be available to us or our products in the future in a timely manner, or at all, or that the federal government will not revise its export policies or the list of products and countries for which export approval is required. In addition, the Departments of Commerce or State may prevent us from selling products to any of our distributors, customers or end-users at any time. These agencies may also place additional restrictions or requirements relative to certain products exportability. Our inability to obtain, or a delay in obtaining, required export approvals would harm our international sales. In addition, foreign companies not subject to United States export restrictions may have a competitive advantage in the international market. We cannot predict the impact of these factors on the international market for our products.
In order to sell our products outside the United States, we must satisfy certain registrations and technical requirements, including the Restriction of Hazardous Substances Directive ("RoHS"). If we were unable to comply with those requirements with respect to our products, our sales in foreign countries could be restricted.
The Company's foreign transactions are subject to additional risks.
The Foreign Corrupt Practices Act prohibits corporations and individuals, including the Company and its employees, from engaging in certain activities to obtain or retain business or to influence a person working in an official capacity. Although the Company has implemented policies and procedures designed to ensure compliance with these laws, there can be no assurance that all of the Company's employees, contractors and agents, including those based in or from countries where practices which violate such United States laws may be customary, will not take actions in violation of the Company's policies. Any such violation, even if prohibited by the Company's policies, could have a material adverse effect on the Company's business.
We executed a ten-year lease on a 40,000 square-foot administrative, sales and engineering facility located at 1440 Corporate Drive in Irving, Texas. On March 31, 2006, EFJohnson exercised an option under its existing lease agreement to purchase the facility for $3.6 million. Simultaneously, EFJohnson sold the facility to an unrelated party for $4.6 million and executed a ten-year lease for the facility terminating in March 31, 2016. The aggregate effect of the purchase and sale transaction was a gain of
25
$1.0 million, which was deferred at March 31, 2006, and is recorded in accrued liabilities in the accompanying financial statements and is being amortized over the term of the lease as a reduction of rent expense in general and administrative expenses. The annual lease payments were approximately, $400,000 in 2006 increasing to $500,000 in 2007, thereafter reflecting an additional 10,000 square feet expansion in the facility beginning in the first quarter of 2007. On February 3, 2010, we entered into an addendum to the lease agreement pursuant to which the monthly lease payments were reduced by $6,000 during the period from May 1, 2009 through April 30, 2010. Thereafter, the lease payments will return to the $500,000 annual rate. In addition, the lease was extended an additional three years, expiring March 31, 2019. Lease payments during the three-year extension period will be determined by mutual agreement of the parties based on the then current market rates.
On June 30, 2008, we executed a ten-year lease, with a term commencing on October 1, 2008, on a 16,000 square-foot warehouse and quality testing facility located at 2720 Commodore Drive, Suite 120, Carrollton, Texas. The current annual rent is approximately $83,000, and rent will increase to approximately $87,000 from the third to the seventh year of the lease, and will increase to $91,000 from the seventh to the tenth year of the lease. The lease will expire on June 30, 2018.
We also lease additional sales, customer service, repair depot and warehouse facilities in: Irving, Texas (approximately 15,000 square feet; annual rent of approximately $108,000; lease expires August 2010); Waseca, Minnesota (approximately 8,700 square feet; annual rent of approximately $37,000; lease expires August 2010); and Gaithersburg, Maryland, (approximately 2,000 square feet; on a month-to-month basis with monthly rent of approximately $2,100).
The administrative offices for our 3eTI broadband business are located at 9715 Key West Blvd, #500, Rockville, MD. This facility is located within a secure multi-building business complex, and we occupy approximately 26,700 square feet with current annual rent of approximately $620,000, that will escalate three percent per annum on each anniversary date. The lease will expire May 31, 2012.
The administrative, engineering and sales facility for our Transcrypt business is located at 3900 NW 12th Street, Suite 200 in Lincoln, Nebraska. The present facility, which consists of 18,000 square feet located within a multi-building industrial part complex, is leased pursuant to a ten-year agreement terminating May 31, 2014. Annual occupancy costs, including estimated common area maintenance charges, are approximately $218,000.
We are party to various claims, legal actions and complaints arising in the ordinary course of our business. We do not believe that any liabilities relating to such matters are likely to be, individually or in the aggregate, material to our business, financial condition, results of operations or cash flows.
The total we have accrued in regards to all legal proceedings as of December 31, 2009 was $32,000.
26
ITEM 5. MARKET FOR REGISTRANT'S COMMON EQUITY, RELATED STOCKHOLDER MATTERS AND ISSUER PURCHASES OF EQUITY SECURITIES
Our common stock trades on the NASDAQ Global Market under the symbol "EFJI."
The following table sets forth, in the periods indicated, the high and low sales prices per share of our common stock, as reported by the NASDAQ Global Market (and its predecessor, the NASDAQ National Market) for the periods presented.
2008 |
|||||||
First Quarter |
$ | 2.79 | $ | 1.12 | |||
Second Quarter |
$ | 1.95 | $ | 0.96 | |||
Third Quarter |
$ | 1.89 | $ | 1.02 | |||
Fourth Quarter |
$ | 1.92 | $ | 0.94 | |||
2009 |
|||||||
First Quarter |
$ | 1.80 | $ | 0.74 | |||
Second Quarter |
$ | 0.77 | $ | 0.59 | |||
Third Quarter |
$ | 1.35 | $ | 0.60 | |||
Fourth Quarter |
$ | 1.91 | $ | 0.97 |
The last sale price of the common stock on December 31, 2009, as reported in the NASDAQ Global Market was $1.11. As of March 29, 2010, we had approximately 1,560 shareholders of record.
Issuer Purchase of Equity Securities
We have no programs to repurchase shares of our common stock. Pursuant to the terms of the 2005 Omnibus Incentive Compensation Plan ("2005 Plan"), participants may in some cases elect to have shares of restricted stock withheld by the Company in satisfaction of tax obligations due upon vesting of restricted stock or other grants pursuant to the 2005 Plan. We classify these withheld shares as treasury stock and the shares are then available for re-issuance under the 2005 Plan. During the first and second quarters of 2009, the Company withheld 34,694 and 15,734 shares of stock, respectively, in satisfaction of tax obligations arising in connection with the vesting of 106,250 and 77,514 shares of restricted stock, respectively, during those quarters. Additionally, in the first quarter of 2009, the Company withheld 50,473 shares of stock in satisfaction of tax obligations arising in connection with the grant of 154,589 shares of fully-vested common stock to certain executive officers of the Company in lieu of cash bonuses.
Dividends
We have never declared or paid any cash dividends on shares of our common stock. Further, our revolving line of credit agreement imposes restrictions upon our ability to pay dividends. We currently intend to retain any future earnings to finance the growth and development of our business. Any determination in the future to pay dividends would depend on our financial condition, capital requirements, results of operations, contractual limitations and any other factors deemed relevant by our Board of Directors.
27
Performance Graph
The graph below compares the quarterly cumulative return to stockholders (stock price appreciation plus reinvested dividends) for EF Johnson Technologies, Inc. common stock with the comparable return of two indexes: the NASDAQ Global Market and the NASDAQ Electronic Components Index. Points on the graph represent the performance between January 1, 2005 and December 31, 2009.
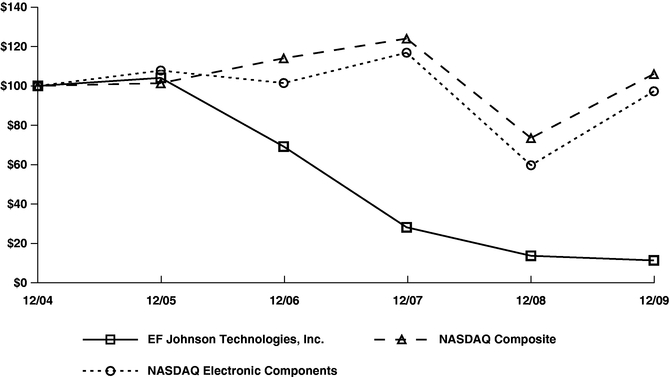
| |
Period Ended December 31, | ||||||||||||||||||
|---|---|---|---|---|---|---|---|---|---|---|---|---|---|---|---|---|---|---|---|
Company/Index/Market
|
2004 | 2005 | 2006 | 2007 | 2008 | 2009 | |||||||||||||
EFJohnson Technologies, Inc. |
$ | 100.00 | $ | 104.10 | $ | 69.23 | $ | 28.21 | $ | 13.74 | $ | 11.38 | |||||||
NASDAQ Composite |
100.00 | 101.41 | 114.05 | 124.05 | 73.57 | 106.10 | |||||||||||||
NASDAQ Electronic Components |
100.00 | 107.82 | 101.46 | 116.88 | 59.71 | 97.30 | |||||||||||||
28
ITEM 6. SELECTED FINANCIAL DATA
The following selected consolidated financial data is qualified by reference to, and should be read together with the Consolidated Financial Statements, with related notes and the related report of independent registered public accounting firm thereon, and "Management's Discussion and Analysis of Financial Condition and Results of Operations", included elsewhere in this Annual Report on Form 10-K. The Consolidated Statement of Operations data for the years ended December 31, 2009, 2008 and 2007 and the Consolidated Balance Sheet data as of December 31, 2009 and 2008 are derived from the Consolidated Financial Statements of the Company included elsewhere in this Annual Report on Form 10-K. The Consolidated Statement of Operations data for the years ended December 31, 2006 and 2005 and the Consolidated Balance Sheet data as of December 31, 2007, 2006, and 2005 are derived from financial statements not included herein.
| |
Year ended December 31, | |||||||||||||||||
|---|---|---|---|---|---|---|---|---|---|---|---|---|---|---|---|---|---|---|
| |
2005 | 2006 | 2007 | 2008 | 2009 | |||||||||||||
| |
(in thousands, except share and per share data) |
|||||||||||||||||
Consolidated Statement of Operations Data: |
||||||||||||||||||
Revenues |
$ | 94,616 | $ | 96,721 | $ | 154,610 | $ | 126,286 | $ | 92,341 | ||||||||
Cost of sales(1) |
45,671 | 61,291 | 113,606 | 83,560 | 64,425 | |||||||||||||
Gross profit |
48,945 | 35,430 | 41,004 | 42,726 | 27,916 | |||||||||||||
Operating expenses: |
||||||||||||||||||
Research and development |
13,686 | 12,276 | 15,677 | 10,099 | 11,532 | |||||||||||||
Sales and marketing |
10,326 | 10,470 | 13,640 | 12,218 | 9,432 | |||||||||||||
General and administrative(2) |
12,982 | 18,928 | 24,193 | 24,435 | 19,861 | |||||||||||||
Amortization of intangibles |
6 | 727 | 1,613 | 1,526 | 992 | |||||||||||||
Impairment of goodwill(3) |
— | — | 5,475 | 14,914 | — | |||||||||||||
Escrow fund settlement(4) |
— | — | — | — | (2,804 | ) | ||||||||||||
Write-off of in-process R&D |
— | 1,600 | — | — | — | |||||||||||||
Total operating expenses |
37,000 | 44,001 | 60,598 | 63,192 | 39,013 | |||||||||||||
Income (loss) from operations |
11,945 | (8,571 | ) | (19,594 | ) | (20,466 | ) | (11,097 | ) | |||||||||
Interest income, net of interest (expense) |
683 | 1,045 | (34 | ) | (980 | ) | (1,372 | ) | ||||||||||
Other income, net of other (expense) |
(36 | ) | — | (1 | ) | (1 | ) | (5 | ) | |||||||||
Income tax benefit (expense)(5) |
9,957 | 745 | (21,470 | ) | 574 | 246 | ||||||||||||
Net income (loss) |
$ | 22,549 | $ | (6,781 | ) | $ | (41,099 | ) | $ | (20,873 | ) | $ | (12,228 | ) | ||||
Net income (loss) per share—Basic |
$ | 1.07 | $ | (0.26 | ) | $ | (1.58 | ) | $ | (0.79 | ) | $ | (0.46 | ) | ||||
Net income (loss) per share—Diluted |
$ | 1.06 | $ | (0.26 | ) | $ | (1.58 | ) | $ | (0.79 | ) | $ | (0.46 | ) | ||||
Weighted average common shares—Basic |
20,984,688 | 25,844,956 | 26,039,246 | 26,261,062 | 26,386,388 | |||||||||||||
Weighted average common shares—Diluted |
21,253,783 | 25,844,956 | 26,039,246 | 26,261,062 | 26,386,388 | |||||||||||||
Consolidated Balance Sheet Data: |
||||||||||||||||||
Working capital(6) |
$ | 86,470 | $ | 67,942 | $ | 52,852 | $ | 51,726 | $ | 30,210 | ||||||||
Total assets |
$ | 134,238 | $ | 152,563 | $ | 120,043 | $ | 97,687 | $ | 84,145 | ||||||||
Long-term debt and capitalized lease obligations, net of current portion(6) |
$ | 5 | $ | 15,332 | $ | 15,752 | $ | 16,112 | $ | — | ||||||||
Stockholders' equity |
$ | 120,845 | $ | 116,706 | $ | 76,920 | $ | 56,969 | $ | 46,371 | ||||||||
- (1)
- 2009 and 2008 includes $0.3 million and $0.8 million in reductions in cost of sales related to credits earned and 2007 includes $3.4 million net increase in cost of sales for the write-off of "Other Receivables" in the third quarter of 2007 net of credits earned.
29
- (2)
- Includes
$1.1 million, $1.2 million, $1.6 million, $1.8 million and $(0.3) million of non-cash compensation
expense/(benefit) in 2009, 2008, 2007, 2006 and 2005, respectively, resulting from the variable accounting treatment applied to certain repriced stock options (2005) and adoption of FASB authoritative
guidance for stock compensation in 2006.
- (3)
- Impairment
of goodwill of $14.9 million in 2008 and $5.5 million in 2007 related to the 3eTI reporting unit.
- (4)
- Escrow
fund settlement of $2.8 million reflects a reduction of operating expenses associated with the 3eTI reporting unit for the January 2009
settlement claims against funds held in an escrow account. The Company previously incurred research and development costs in connection with the re-design, re-testing and
re-certification of certain 3eTI products to bring them up to specifications represented to exist at the acquisition date.
- (5)
- Income
tax benefit amounts result primarily from a change in the valuation allowance for deferred tax assets during the fourth quarter of 2005. For 2006,
the income tax benefit was primarily due to increased net operating loss (NOL) carry forward. For 2007, the income tax expense was due to establishing a full valuation allowance for deferred tax
assets as a result of a three-year cumulative loss. For 2008, the income tax benefit was primarily due to a reduction in deferred tax liabilities relating to the impairment charge for
indefinite lived intangible assets associated with the 3eTI reporting unit. For 2009, the income tax benefit was primarily due to carry backs of business tax credits and alternative minimum tax
credits.
- (6)
- Working capital and long-term debt decreased in 2009 reflecting the reclassification of the term loan to current portion of long-term debt that is due June 2010.
30
ITEM 7. MANAGEMENT'S DISCUSSION AND ANALYSIS OF FINANCIAL CONDITION AND RESULTS OF OPERATIONS
Overview
EF Johnson Technologies, Inc. is an innovator, developer and marketer of the highest quality secure communications solutions to organizations whose mission is to protect and save lives. We design, develop, market and support wireless communications, including wireless radios and wireless communications infrastructure and systems for digital and analog platforms, and secure wireless networking solutions that include Wi-Fi products, mesh networking, access points, bridges and client products. In addition, we offer encryption technologies for wireless voice, video and data communications. We provide our products and services to (i) domestic and foreign public safety/public service entities, (ii) federal, state and local governmental agencies, including the Departments of Homeland Security and Defense, and (iii) domestic and foreign commercial customers.
Our products are marketed under the "EFJohnson," "3eTI" and "Transcrypt" brand names. Our EFJohnson-branded products consist of wireless radios and wireless communications infrastructures and systems. Our wireless offerings are primarily digital solutions designed to operate in both analog and digital wireless radio system environments. These products are based on the Project 25 industry standard and our systems utilize Voice over Internet Protocol ("VoIP") technology to enhance interoperability among systems, improve bandwidth efficiency, and integrate voice and data communications. We sell these products and systems primarily to domestic governmental entities, such as the Departments of Defense and Homeland Security, as well as state and local governmental agencies.
We also have significant license rights that allow us to sell our EFJohnson wireless communications products that are compatible with the large installed base of analog wireless radios, infrastructure and proprietary systems as well as networks that will utilize the next generation of public safety technology. We believe there is a strong commitment by the federal government to improve homeland security by providing first responders with secure and interoperable communications. Government agencies are currently mandating secure and interoperable compliant digital wireless communications systems to replace the existing proprietary analog systems. We understand that the federal government, which typically provides the funding for such wireless systems, and to a lesser extent, state governmental agencies, have made appropriations for such future systems a top priority.
Our 3eTI-branded products consist of secure Wi-Fi products, including mesh network, access point, bridge, and client products, as well as security software and custom solutions. We also provide sensor networking solutions, through our InfoMatics® middleware, which enables sensors and databases to communicate data to pertinent personnel for command and control applications in near real-time. 3eTI-branded products are integrated into solutions that get information to essential users so they may securely, reliably and cost-effectively utilize communications to meet federal and military customer's force protection/anti-terrorism mission requirements and corporate needs. We specialize in secure government wireless broadband solutions and have achieved many firsts in wireless technology, including the first validated Federal Information Processing Standards ("FIPS") 140-2 Layer 2 access point. In 2006, we became the first wireless supplier to receive National Information Assurance Partnership ("NIAP") Evaluation Assurance Level 2 Common Criteria Validation ("Common Criteria") for our wireless LAN access point and client software. We continue to maintain and advance our secure capabilities.
Our Transcrypt-branded products consist of encryption technologies for analog wireless radios. We leverage our leading market position to gain new customers in parts of the world where wireless radio systems remain analog, security needs are high, and the cost to upgrade to a digital secured communications system is prohibitive. These products are sold as aftermarket add-on components or embedded components for existing analog radios and systems. Terrorist threats, political unrest and
31
military conflicts drive the need for more secure communications. We offer other solutions, such as our digital encryption product for certain analog and digital wireless radios, to obtain higher levels of security which also allows for compatibility with our analog encryption product line.
Prior to 2008, the Company was organized, and reported its financial results, as a parent company with two segments, Private Wireless Communications and Secured Communications. Having recognized that the public safety/public service market is moving towards convergent telecommunications solutions, the continued demand for interoperability and the transition from analog to digital platforms, we reorganized the Company in January 2008 into a single centralized corporate structure that we expect to improve efficiencies in our operations and reduce our infrastructure costs. Our current products, system solutions, and technology allow us to participate and be competitive in this transitioning market and technology trend of convergence.
In light of these changes, the Company reassessed its segment reporting, and beginning with the first quarter of 2008, no longer reported the two segments of Private Wireless Communications and Secured Communications. The operating structure of the Company also changed in the first quarter of 2008. Under the new structure, all of the Company's operations report up to the chief executive officer and president. Management allocates resources and evaluates results based on the financial performance of the consolidated entity. Based on the synergies of our products, customers, and organizational structure, the Company now operates in a single segment.
Factors Affecting Our Business
Fluctuations and Seasonality of Results—Due to the timing of orders and seasonality, our quarterly results fluctuate. We experience seasonality in our results in part due to governmental customer spending patterns that are influenced by government fiscal year-end budgets and appropriations.
Gross Margins—There are a number of factors that have impacted and will impact our gross margins. These include:
- •
- Revenue Mix—We historically generated consistently higher
gross margins from our Transcrypt-branded encryption products and relatively lower margins for our EFJohnson and 3eTI-branded products. While once a significant part of our revenues, our
Transcrypt-branded products represent less than 4% of our revenues in 2008 and 2009, thus have minimal impact on our gross margin. We expect this lower encryption revenue to continue into the future
years. EFJohnson and 3eTI-branded products are impacted by the type of sale, with those sales including more features, options and accessories obtaining higher margins than those with a larger amount
of third party product content. This varies depending on the nature and type of sale, dollar value of the sale and competitive bid dynamics.
- •
- Transition to new product platform—During 2008, we launched our new land mobile radio platform which we believe has substantially improved design, manufacturability, and overall quality. In the later part of 2008, we began to achieve lower rework and warranty expenditures and continue to experience this trend into 2009 as the transition from our older platform to our new platform was completed. By the later half of 2009, it became clear that our customers preferred the new "ES" radios and based upon our improved cost structure in delivering these radios, the Company determined to move to end of life of the "X"-platform. Therefore, in the fourth quarter of 2009, we wrote off approximately $4.1 million of inventory impacting our gross profit margins by approximately 4% and utilized inventory reserves for approximately $3.4 million associated with the older radio platform, RF decks and components. We will continue to evaluate service and warranty requirements of the older platform during the next two to three years and will retain some service inventory on hand and will record inventory reserves as required during this time period.
32
Reorganization—On November 15, 2007, the Company committed to an organizational plan (the "Plan") to shift operationally from three divisions into one integrated corporate structure. The Plan was implemented during 2008 and resulted in a positive impact to our gross profits and operating expense structure beginning in the second quarter of 2008.
Research and Development—With the adoption of the Project 25 standard, the need for digital product technology for government customers has increased. As such, we concentrate our research and development efforts on digital technology for land mobile radios and systems. In 2010, we will continue to develop products, features, accessories and systems that comply with the Project 25 standard. Additionally, we plan to invest further research and development efforts in 3eTI, supporting incremental product development and government certifications for our products and software solutions.
In 2009, research and development expenditures were concentrated on:
- •
- trunked and conventional Project 25 system infrastructure, including repeaters, voters and base stations;
- •
- applying standard internet protocol switching techniques for connecting wireless sites utilizing VoIP technology including
wide area multi-site trunking;
- •
- development of new lower cost radios with new features such as submersibility and the expansion to address the remaining
frequency bands, new vocoder and location based technologies; and
- •
- continued development of our wireless networking solutions such as intelligent video analytics, enhancement of industrial WLAN and secure supplicant software.
General and Administrative—General and Administrative includes expenses for non-cash stock compensation expense of $1.1 million, $1.2 million, and $1.6 million for the years ended December 31, 2009, 2008 and 2007, respectively.
Effective January 1, 2006, we adopted the FASB authoritative guidance related to accounting for stock compensation and selected the modified prospective method to report equity-based compensation amounts in the consolidated financial statements. We are currently using the Black-Scholes option pricing model to determine the fair value of all equity-based grants. Prior to 2006, we accounted for stock options under the recognition and measurement provisions of APB Opinion No. 25 and related interpretations. During the fourth quarters of 2009 and 2008, we evaluated the past and expected forfeitures and determined that an increase in the forfeiture rate associated with our equity-based compensation was appropriate. The increase in the forfeiture rate resulted from the integration of our business units in 2008 and anticipated flattening of our organizational structure as outlined in our 2009 Plan, resulting in a reduction in the number of employees. The impact of this change was a cumulative reduction to equity-based compensation expense of $0.4 million and $1.0 million recorded in the fourth quarters of 2009 and 2008, respectively. The unamortized amount of equity-based compensation expense as of December 31, 2009 was $1.5 million. Of this balance, we anticipate that equity-based compensation expense will be approximately $0.7 million in 2010.
General and Administrative also includes $0.3 million, $0.5 million and $0.6 million of estimated costs for the exit, disposal, certain severance and other charges associated with the reorganization of our operations for 2009, 2008 and 2007, respectively.
General and Administrative also includes impairment charges of $3.5 million and $0.3 million recorded in the fourth quarters of 2008 and 2007, respectively due to annual impairment testing of our definite and indefinite lived intangible assets associated with the 3eTI reporting unit. Impairments are recorded if the reporting unit's fair value is less than the carrying value. Actual results may differ from
33
the estimates used under different assumptions and conditions. Further impairment adjustments may be required in future periods that could have a material adverse impact on our financial statements.
Amortization of Intangibles—Amortization expense, related to intangible assets which are subject to amortization, was $1.0 million for the year ended December 31, 2009. Amortization expense of intangible assets is anticipated to be approximately $1.0 million, $1.0 million, $0.9 million, $0.6 million and $0.4 million for 2010, 2011, 2012, 2013 and 2014, respectively.
Intangible assets were purchased as part of the acquisition of 3eTI. Intangible assets, consisting of existing technology, customer relationships, license and covenants not-to-compete, are amortized over their useful life on a straight-line basis. Additionally, intangible assets subject to amortization are reviewed for impairment at least annually. Intangible assets consisting of trademark and trade name and certifications are not subject to amortization and are reviewed for impairment at least annually as noted above.
Impairment of Goodwill—Represents goodwill impairment charges of $14.9 million and $5.5 million resulting from the annual impairment testing of our goodwill tested in the fourth quarters of 2008 and 2007, respectively, associated with the 3eTI reporting unit. These impairment charges brought the goodwill associated with our 3eTI reporting unit to a zero balance. Our goodwill is tested for impairment annually as of December 31 of each year typically after we have completed our strategic planning and budget cycle for the following year, unless events or circumstances would require an immediate review. Goodwill amounts are generally allocated to the reporting units based upon amounts allocated at the time of their respective acquisition. Because of delays in key new business opportunities and near-term growth opportunities considered in our original assessment of 3eTI that did not materialize within the expected timelines, in 2008 it was necessary to significantly lower cash flow projections for this reporting unit. Specifically, we reduced the revenue and margin projections based on our recent financial performance, strategic plans and future performance expectations for the non-government solutions programs of the reporting unit. Actual results may differ from the estimates used under different assumptions and conditions. Impairments are recorded if the reporting unit's fair value is less than the carrying value.
Escrow fund settlement—Represents a reduction of operating expenses associated with the 3eTI reporting unit for the January 2009 settlement of claims against funds held in an escrow account. The Company previously incurred research and development costs in connection with the re-design, re-testing and re-certification of certain 3eTI products to bring them up to specifications represented to exist at the acquisition date.
Description of Operating Accounts
Revenues. Revenues consist of product sales, services, and government-funded research and development services and solutions net of returns and allowances. Longer-term system and government services revenues are recognized under the percentage of completion method.
Cost of Sales. Cost of sales includes costs of components and materials, labor, depreciation and overhead costs associated with the production of our products and services, as well as shipping, royalty, inventory reserves, warranty product costs, and incurred cost under sales contracts.
Gross Profit. Gross profit is net revenues less the cost of sales and is affected by a number of factors, including competitive pricing, product mix, business segment mix, cost of products and services, including warranty and inventory reserves, and conversion costs.
Research and Development. Unreimbursed research and development expenses consist primarily of costs associated with research and development personnel, materials, and the depreciation of research and development equipment and facilities. We expense all unreimbursed research and development
34
costs as they are incurred while all research and development expenses that are reimbursed by our government customers are included as a component of cost of sales.
Sales and Marketing. Sales and marketing expenses consists primarily of salaries and related costs of sales personnel, including sales commissions and travel expenses, as well as costs of advertising, product and program management, public relations and trade show participation.
General and Administrative. General and administrative expenses consist primarily of salaries and other expenses associated with our management, post sales operations support, accounting, IT and administrative functions. This expense also includes the impact of equity-based compensation expense and costs related to our operating facilities moves. Pertinent to 3eTI, accounting for government contracts delineates what is a direct charge allowable to include in contract costs and what is considered to be an indirect charge reflected as general and administrative expenses. We consider indirect engineering labor and operating costs such as quality, planning, operations, and company fringe benefits, general administrative salaries and other general administrative expenses as general and administrative expense. This expense also includes impairment charges associated with the definite and indefinite lived intangible assets acquired in the 3eTI acquisition.
Amortization of Intangibles. Amortization of intangibles consist primarily amortization expense associated with the definite lived intangibles assets acquired in the 3eTI acquisition. Definite lived intangible assets, consisting of existing technology, customer relationships, license and covenants not-to-compete, are amortized over their useful life on a straight-line basis.
Impairment of Goodwill. Impairment of goodwill consists of impairment charges resulting from impairment tests associated with the goodwill asset acquired in the 3eTI acquisition.
Escrow Fund Settlement. Escrow fund settlement consists of funds received associated with the 3eTI reporting unit for settled claims against funds held in an escrow account. The escrow fund reimbursed the Company for previously incurred research and development costs in connection with the re-design, re-testing and re-certification of certain 3eTI products to bring them up to specifications represented to exist at the acquisition date.
Net Interest Income or Expense. Net interest income (expense) consists of interest income earned on cash and invested funds, net of interest expense for capital leases, the term note and bank revolving line of credit.
Provision for Income Taxes. Provision (benefit) for income taxes includes the increase or decrease in the valuation reserve that is based upon management's conclusions regarding, among other considerations, our historical operating results and forecasted future earnings over a five-year period, our current and expected customer base projections, and technological and competitive factors impacting our current products. Current financial accounting standards require that organizations analyze all positive and negative evidence relating to deferred tax asset realization, which would include our historical accuracy in forecasting future earnings, as well as our history of losses since 2007. Should factors underlying management's estimates change, future adjustments, either positive or negative, to our valuation allowance may be necessary. Our tax asset is principally composed of net tax benefits associated with net operating loss carryforwards, or NOLs.
Critical Accounting Policies
The preparation of our consolidated financial statements in conformity with accounting principles generally accepted in the United States of America, or GAAP, requires management to make judgments, estimates and assumptions in certain circumstances that affect the amounts reported in the consolidated financial statements and related footnotes. We regularly evaluate the accounting policies and estimates used to prepare our financial statements. Estimates are used for, but not limited to, the
35
accounting for allowance for doubtful accounts and sales returns, application of the percentage of completion accounting for long-term contract revenues, inventory reserves, warranty reserves, valuation allowance for deferred income tax assets, and contingencies. These estimates are based on historical experience and various assumptions that we believe to be reasonable under the particular applicable facts and circumstances. Actual results could differ from those estimates.
We consider our critical accounting policies to be those that involve significant judgments and uncertainties, require estimates that are more difficult for management to determine, and have the potential to result in materially different outcomes under varying assumptions and conditions. The application of GAAP requires management to make estimates and assumptions that affect the amounts reported in the financial statements and accompanying results. Listed below are those policies we believe are critical and require the use of complex judgment in their application. For further discussion, see Notes to Consolidated Financial Statements.
Revenues
If collection is reasonably assured, and no significant future obligations or contingencies associated with the sale exist, revenues for product sales are recognized when delivery occurs, less an estimate for an allowance for returns or doubtful accounts, if applicable. For shipments where collection is not reasonably assured, we recognize revenue as cash is received. If collection is contingent on a future contractual event, we recognize revenue when the contingency lapses, generally upon cash collection.
System sales under long-term contracts are accounted for under the percentage-of-completion method. Under this method, revenues are recognized as work on a contract progresses. The recognized revenue is that percentage of estimated total revenues that incurred costs to date bear to estimated total costs to complete the contract. Revisions in cost and profit estimates are made when conditions requiring such revisions become known. Anticipated losses on contracts are recognized in operations as soon as such losses are determined to be probable and reasonably estimable. If our estimates of total costs to complete certain contracts are inaccurate, revenue and gross margin could be impacted.
Government funded services revenue from cost plus contracts is recognized as costs are incurred on the basis of direct costs plus allowable indirect costs and an allocable portion of the fixed fee. Revenue from fixed-type contracts is recognized under the percentage of completion method with estimated costs and profits included in contract revenue as work is performed. Revenue from time and materials contracts is recognized as costs are incurred at amounts represented by the agreed billing amounts.
Deferred revenues include unearned services provided under systems maintenance contracts and optional extended warranties sold to customers. We recognize the fees ratably based upon a straight-line method over the life of the contract or extended warranty period.
We periodically review our revenue recognition procedures to assure that such procedures are in accordance with the provisions of Staff Accounting Bulletins 101 and 104 and new FASB authoritative guidance relating to revenue recognition and multiple element arrangements, as applicable. In addition, while most of our current products contain software, we believe the software is incidental in the overall context of our products' features and functionality, therefore, at present we do not use revenue recognition authoritative guidance applicable to software sales.
Revenue Recognition for Arrangements with Multiple Deliverables
For multi-element arrangements that include products and contain optional extended warranties, the Company allocates revenue to all deliverables based on their relative selling prices. In such circumstances, the new accounting guidance establish a hierarchy to determine the selling price to be used for allocating revenue to deliverables as follows: (i) vendor-specific objective evidence of fair value
36
("VSOE"), (ii) third-party evidence of selling price ("TPE"), and (iii) best estimate of the selling price ("ESP") in the absence of VSOE and TPE. VSOE generally exists when the Company sells the deliverable separately at prices regularly charged by the Company for that deliverable on a stand-alone basis. TPE generally exists when the Company has access to and can quantify competitor pricing of similar product offerings on a stand-alone basis. ESP is management's best estimate of selling price on a stand-alone basis, considering market conditions and entity-specific factors.
The Company has allocated revenue between the multiple deliverables using the relative selling price method. The Company has determined that due significant variation and ranges of actual selling prices, the existence of VSOE could not be established. Furthermore, the Land Mobile Radio industry does not publish standard pricing and invoiced amounts by product offerings; therefore, the Company could not establish TPE. Because the Company has neither VSOE nor TPE for the multiple deliverables, the allocation of revenue is based on the Company's ESPs. The revenue relating to hardware is recognized at time of delivery, while the optional extended warranty is deferred and recognized ratably over the period benefited. All hardware cost of sales, including standard estimated warranty costs, are generally recognized upon delivery of the hardware.
The Company's process for determining its ESP considers multiple factors. Such factors may vary depending upon the unique facts and circumstances related to each deliverable. Key factors considered by the Company in developing the ESPs for products and optional extended warranties include: prices charged by the Company for unbundled product sales, the Company's historical pricing practices and the nature of the optional extended warranty.
Receivables
Accounts receivable are presented in the balance sheet at net realizable value, which equals the gross receivable value less allowance for bad debts and estimated returns and allowances. Such allowances are based upon our estimate of non-collectability due to customer factors, such as payment history and customer classification as well as our estimate of product returns based on historical trends. We continually monitor our customers collection status and product return trends and adjust our allowances accordingly.
Other receivables mainly consist of credits due from the outsourced manufacturers as a result of inventories purchased or transferred for production.
Inventories
Inventories are recorded at the lower of cost or market with cost based on a standard cost method that approximates the first-in, first-out costing method. We periodically assess our inventory for potential obsolescence and lower-of-cost-or-market issues. We make estimates of inventory obsolescence, providing reserves when necessary, and adjust inventory balances accordingly. We consider, among other factors, demand for inventories based on backlog, product pricing, the ability to liquidate or sell older inventories, the impact of introducing new products, and compliance with laws and regulations, including the Restriction of Hazardous Substances Directive ("RoHS"). We continually monitor inventory procurement, usage and product sales trends and adjust the carrying value of inventory accordingly.
Inventories comprised of components and parts on hand to support maintenance of products previously sold, or service inventory, are anticipated to be utilized over extended periods of time. Service inventories are carried at the lower of cost or market.
37
Goodwill and Other Intangibles Assets
Goodwill represents the excess of purchase price over fair value of identifiable net tangible and identifiable intangible assets acquired. We assess the recoverability of the indefinite lived tangible and intangible assets by performing a fair value impairment test, at least annually. If the respective carrying amount exceeds the fair value, the indefinite lived tangible and intangible assets are considered to be impaired and written down to its estimated net realizable value. In evaluating impairment, we estimate the sum of the expected future cash flows derived from such indefinite lived tangible and intangible assets and present value implied by estimates of future revenues, costs and expenses and other factors. The estimates use assumptions about our market segment share in the future and about future expenditures by government entities for secured wireless communications products. We continually evaluate whether events and circumstances have occurred that indicate the remaining balance of indefinite lived tangible and intangible assets may not be recoverable. To the extent our assumptions change, we may be required to adjust the carrying value of the indefinite lived tangible and intangible assets. Identifiable intangible assets with identifiable fixed lives, consisting of existing technology, customer relationships, licenses and covenants not-to-compete, are amortized over their useful life on a straight-line basis.
Warranty Costs
We generally provide a one to three year warranty on our products. We estimate future warranty claims based on historical experience and anticipated costs to be incurred. During 2008, we launched our new land mobile radio platform which we believe has substantially improved design, manufacturability, and overall quality. In the second half of 2008, we began to achieve lower warranty expenditures that continued into 2009 as the transition from our older platform to our new platform is completed. Warranty expense is accrued at the time of sale with an additional accrual for specific items after the sale when their existence is known and amounts are determinable. In certain cases, the Company provides optional extended warranties that are deferred and amortized into revenue over the period benefited.
Income Taxes
We account for income taxes using the asset and liability method. Deferred tax assets and liabilities are recognized for the future tax consequences attributable to differences between the financial statement carrying amounts of existing assets and liabilities and their respective tax bases. Deferred tax assets and liabilities are measured using current enacted tax rates. The effect on deferred tax assets and liabilities of a change in tax rates is recognized in the results of operations in the period that includes the enactment date. We recognize the financial statement benefit of a tax position after determining that the relevant tax authority would more likely than not sustain the position following an audit. For tax positions meeting the more-likely-than not threshold, the amount recognized in the financial statements is the largest benefit that has the a greater than fifty percent likelihood of being realized upon the ultimate settlement with the relevant tax authority. Valuation allowances are provided to the extent that recoverability of tax assets is not considered likely. In determining recoverability of the future tax benefits associated with our deferred tax asset, management takes into account, among other factors, our historical operating results, our current and expected customer base, technological and competitive factors impacting our current products, and management's estimates of future earnings that are based upon a five-year earnings projection, using information currently available, and discounted for risk. We review our tax positions quarterly and adjust the tax related balances as new information becomes available.
38
Long-Lived Assets
We review our long-lived assets, to include intangible assets subject to amortization, for recoverability whenever events or changes in circumstances indicate that the carrying amount of such long-lived asset or group of long-lived assets may not be recoverable. Such circumstances include, but are not limited to:
- •
- a significant decrease in the market price of the long-lived asset;
- •
- a significant change in the extent or manner in which the long-lived asset is being used;
- •
- a significant change in the business climate that could affect the value of the long-lived asset;
- •
- a current period loss combined with projection of continuing loss associated with use of the long-lived asset;
and
- •
- a current expectation that, more likely than not, the long-lived asset will be sold or otherwise disposed of before the end of its previously estimated useful life.
We continually evaluate whether events and circumstances have occurred which may indicate that the carrying value may not be recoverable. When such events or circumstances exist, the recoverability of the long-lived asset's carrying value shall be determined by estimating the undiscounted future cash flows (cash inflows less associated cash outflows) that are directly associated with and that are expected to arise as a direct result of the use and eventual disposition of the long-lived asset. To the extent such events or circumstances occur that could affect the recoverability of our long-lived assets, we may be required to impair these assets.
Stock-based Compensation
Under the fair value recognition of FASB authoritative guidance relating to accounting for stock compensation, stock-based compensation cost is estimated at the grant date based on the value of the award and is recognized as expense ratably over the requisite service period of the award. Determining the appropriate fair value model and calculating the fair value of stock-based awards at the grant date requires judgment, including estimating stock price volatility, expected option life and rates of forfeiture. To the extent actual and our estimates of expected forfeiture rates change, the amount of compensation costs we would be required to record could change.
39
Results of Operations
The following table sets forth certain Consolidated Statement of Operations information as a percentage of revenues during the periods indicated.
| |
Year ended December 31 | |||||||||||
|---|---|---|---|---|---|---|---|---|---|---|---|---|
| |
2009 | 2008 | 2007 | |||||||||
Revenues |
100.0 | % | 100.0 | % | 100.0 | % | ||||||
Cost of sales |
69.8 | 66.2 | 73.5 | |||||||||
Gross profit |
30.2 | 33.8 | 26.5 | |||||||||
Operating expenses: |
||||||||||||
Research and development |
12.4 | 8.0 | 10.1 | |||||||||
Sales and marketing |
10.2 | 9.7 | 8.8 | |||||||||
General and administrative |
21.5 | 19.3 | 15.7 | |||||||||
Amortization of intangibles |
1.1 | 1.2 | 1.0 | |||||||||
Impairment of goodwill |
— | 11.8 | 3.6 | |||||||||
Escrow fund settlement |
(3.0 | ) | — | — | ||||||||
Total operating expenses |
42.2 | 50.0 | 39.2 | |||||||||
Loss from operations |
(12.0 | ) | (16.2 | ) | (12.7 | ) | ||||||
Interest income (expense), net |
(1.5 | ) | (0.8 | ) | — | |||||||
Income tax benefit (expense) |
0.3 | 0.5 | (13.9 | ) | ||||||||
Net loss |
(13.2 | )% | (16.5 | )% | (26.6 | )% | ||||||
Comparison of the Fiscal years Ended December 31, 2009 and 2008
Revenues. Our revenues decreased $34.0 million, or 27%, to $92.3 million for 2009 from $126.3 million for 2008. The decline was attributable to lower federal, state and local revenues relating to land mobile radio products resulting from delays in shipments from backlog into 2010 and delays in obtaining certain re-banding agreements. The decline was partially offset by increases associated with government services revenues.
Gross Profit. Our gross profit decreased $14.8 million, or 35%, to $27.9 million for 2009 from $42.7 million for 2008. The decrease was mainly attributable to the decline in revenue volume coupled with a write off approximately $4.1 million "X"-platform raw materials inventory during the fourth quarter of 2009 relating to a decision to end the life of the "X"-platform product and legacy service stock. Gross profit, as a percentage of revenues, or gross margin, was 30.2% for 2009, as compared to 33.8% for 2008. The lower gross margin in 2009 was due to the above noted decision to end the life of the "X"-platform product.
Research and Development. Research and development expenses increase $1.4 million, or 14%, to $11.5 million for 2009 from $10.1 million for 2008. Research and development expenses as a percentage of revenues increased to 12.4% in 2009 versus 8.0% in 2008.
The increase in research and development expenses is primarily attributable to a non-recurring engineering cost reimbursement of $4.0 million received in the second quarter of 2008 from a customer for research and development expenses relating to the development and re-engineering of our Multi-Net® radio product line associated with the FCC re-banding effort. As anticipated, no further non-recurring engineering cost reimbursement of this magnitude was replicated in 2009.
Sales and Marketing. Sales and marketing expenses decreased $2.8 million, or 23% to $9.4 million for 2009 from $12.2 million for 2008. The decrease is mainly attributable to lower sales incentives
40
resulting from the decline in revenue noted above coupled with a reduction in marketing expenses relating to lower full time employees during 2009. Sales and marketing expenses as a percentage of revenues were 10.2% for 2009 and 9.7% for 2008.
General and Administrative. General and administrative expenses decreased $4.5 million, or 18%, to $19.9 million for 2008 from $24.4 million for 2008. As a percentage of revenue, general and administrative expenses were 21.5% of revenues for 2009 versus 19.3% for 2008. General and administrative expenses decreased in 2009 compared with 2008 primarily attributable to impairment charges of $3.5 million for the annual impairment testing of our definite and indefinite lived intangible assets associated with the 3eTI reporting unit coupled with lower general and administrative expenses associated work force reductions during 2009.
On December 31, 2009, the Company committed to a work force reduction plan (the "2009 Plan") to realign certain executive and senior management positions as well as staff reductions resulting from the fourth quarter 2009 performance of the Company's land mobile radio business. The 2009 Plan was implemented in the first quarter of 2010. In connection with the 2009 Plan, the Company identified and recorded a liability of approximately $0.3 million consisting of severance and other employee-related costs, substantially all of which will be incurred during the first quarter of 2010.
On November 15, 2007, the Company committed to an organizational plan (the "2007 Plan") to shift from three divisions to one integrated corporate structure focused on secure wireless communications for government and industrial customers. The Plan was implemented in the first quarter of 2008. Implementation of the Plan included senior and middle management changes as well as staff reductions to eliminate redundant positions and reflect the Company's decision to close down production in three locations, with all outsourcing centralized in the Dallas/Fort Worth area. In connection with the 2007 Plan, the Company identified approximately $1.1 million in total costs to execute the Plan, resulting in cash expenditures of $1.1 million during 2008. The Company recorded an expense of $0.5 million and $0.6 million during December 31, 2008 and 2007, respectively. The costs consisted primarily of severance, relocation, and other employee-related costs.
Included in general and administrative expenses for the year ended December 31, 2009 was $1.0 million related to equity-based compensation expense required by FASB authoritative guidance related to accounting for stock compensation. For the year ended December 31, 2008, we recorded equity-based compensation expense of $1.2 million. During the fourth quarters of 2009 and 2008, we evaluated the past and expected forfeitures and determined that an increase in the forfeiture rate associated with our equity-based compensation was appropriate. The increase in the forfeiture rate resulted from the integration of our business units in 2008 and anticipated flattening of our organizational structure as outlined in our 2009 Plan, resulting in a reduction in the number of employees. The impact of this change was a cumulative reduction to equity-based compensation expense of $0.4 million $1.0 million recorded in the fourth quarters of 2009 and 2008, respectively. The unamortized amount of equity-based compensation expense as of December 31, 2009 was $1.5 million. Of this balance we anticipate that equity-based compensation expense will be approximately $0.7 million in 2010.
Amortization of Intangibles. For the years ended December 31, 2009 and 2008, we recorded $1.0 million and $1.5 million, respectively, of amortization mainly associated with the intangibles acquired in the July 2006 acquisition of 3eTI. Intangible assets, consisting of existing technology, customer relationships and technology licenses are amortized over their useful life on a straight-line basis.
Impairment of Goodwill—Represents goodwill impairment charges resulting from goodwill tests for impairment prepared annually as of December 31 of each year typically after we have completed our strategic planning and budget cycle unless events or circumstances would require an immediate review. In the fourth quarter of 2009, we performed our annual impairment test of the goodwill associated with
41
our EF Johnson reporting unit resulting in no impairment of the reporting unit goodwill. For the annual impairment testing of our goodwill tested in the fourth quarter of 2008, the Company recorded an impairment charge of $14.9 million associated with the 3eTI reporting unit. This impairment charge brought the goodwill associated with our 3eTI reporting unit to a zero balance.
During our strategic planning and budget preparation in the fourth quarter of 2008, we noted continued delays in key new business opportunities and near-term growth opportunities considered in our original assessment of 3eTI that did not materialize within the expected timelines. Therefore, it was necessary to significantly lower cash flow projections for this reporting unit. Specifically, we reduced the revenue and margin projections based on our recent financial performance, strategic plans and future performance expectations for the non-government solutions programs of the reporting unit. Therefore, we concluded that the fair value of this reporting unit was lower than the carrying value of the associated goodwill, and thus overall impaired. Actual results may differ from the use of estimates under different assumptions and conditions.
Escrow fund settlement. In connection with the acquisition of 3eTI in 2006, the total consideration paid by the Company consisted of $36.0 million in cash, which included $3.6 million to be held in escrow to indemnify the Company for any claims under the Merger Agreement. In August 2008, the Company made a claim against the escrow fund for damages arising out of certain alleged breaches of representations and warranties contained in the Merger Agreement. In January 2009, we settled claims under the Merger Agreement and received $2.8 million of the funds held in the escrow account. The escrow funds received as part of the settlement were recorded as a reduction of operating expense. The Company previously incurred research and development costs in connection with the re-design, re-testing and re-certification of certain 3eTI products to bring them up to specifications represented to exist at the acquisition date.
Interest Expense, net. Interest expense, net, increased $0.4 million to $1.4 million in expense for 2009 from $1.0 million for 2008. The increase is attributable to interest on the term loan, and lower interest income earned on cash investments.
Income Tax Benefit. For the years ended December 31, 2009 and 2008, we recorded an income tax benefit of $0.2 million and $0.6 million, respectively. The tax benefit for 2009 reflects carry backs of business tax credits and alternative minimum tax credits. Current year net operating loss (NOL) carry forward, certain business credits and adjustments partially offset increases in the valuation allowance. For 2008, the income tax benefit was primarily due to a reduction in deferred tax liabilities relating to the impairment charge for indefinite lived intangible assets associated with the 3eTI reporting unit. The increase in the valuation allowance in 2009 is based upon management's conclusions regarding, among other considerations, our cumulative loss position during 2009, 2008 and 2007, our current backlog, current and expected customer base, technological and competitive factors impacting our current products, and management's estimates of future earnings based on information currently available.
Net Loss. Net loss was $12.2 million in 2009, an improvement of $8.7 million or 42%, as compared to a net loss of $20.9 million in 2008. Impairment charges against goodwill and other intangibles of $18.4 million made up 88% of the 2008 net loss not replicated in 2009. The majority of the net loss in 2009 is attributable to the decline in land mobile radio revenue volume and associated gross profit partially offset by expense reduction programs in effect for 2009.
Comparison of the Fiscal years Ended December 31, 2008 and 2007
Revenues. Our revenues decreased $28.3 million, or 18%, to $126.3 million for 2008 from $154.6 million for 2007. The decline was attributable to large deliveries against Department of Defense contracts in 2007 not replicated in 2008. Partially offsetting this decline in revenue were increases in revenues associated with the FCC rebanding effort and large deliveries against state and local orders.
42
Gross Profit. Our gross profit increased $1.7 million, or 4%, to $42.7 million for 2008 from $41.0 million for 2007. The increase was the result of reduced warranty costs associated with improved product quality and lower material handling and order fulfillment costs relating to the integration of the business units during the first quarter of 2008. This was partially offset by a decline in gross profit attributable to the volume variance due to the decline in revenue. Gross profit, as a percentage of revenues, or gross margin, was 33.8% for 2008, as compared to 26.5% for 2007. The improved gross margin in 2008 was due to the above noted achievements coupled with the restatement recorded in 2007 that resulted in a $3.4 million write-off of "Other Receivables" to cost of sales.
Research and Development. Research and development expenses decreased $5.6 million, or 36%, to $10.1 million for 2008 from $15.7 million for 2007. Research and development expenses as a percentage of revenues decreased to 8% in 2008 versus 10% for 2007.
The decrease in research and development expenses is primarily attributable to a non-recurring engineering cost reimbursement of $4.0 million received in the second quarter of 2008 from a customer for research and development expenses relating to the development and re-engineering of our Multi-Net® radio product line associated with the FCC re-banding effort. The development of our Multi-Net® radio has been completed and no further non-recurring engineering cost reimbursement will be received. Additional reductions in research and development expenses were realized as a result of the integration of the business units during the first quarter of 2008.
Sales and Marketing. Sales and marketing expenses decreased $1.4 million, or 10% to $12.2 million for 2008 from $13.6 million for 2007. The decrease is mainly attributable to lower sales incentives resulting from the decline in revenue noted above. Sales and marketing expenses as a percentage of revenues were 10% for 2008 versus 9% in 2007.
General and Administrative. General and administrative expenses increased $0.2 million, or 1%, to $24.4 million for 2008 from $24.2 million for 2007. As a percentage of revenue, general and administrative expenses were 19% of revenues for 2008 versus 16% for 2007. General and administrative expenses remained relatively flat in 2008 compared with 2007 primarily attributable to impairment charges of $3.5 million for the annual impairment testing of our definite and indefinite lived intangible assets associated with the 3eTI reporting unit. Excluding this impairment charge, general and administrative would have declined in 2008 as compared with 2007 due to lower general and administrative expenses associated with 3eTI and the integration of our operating units in the first quarter of 2008.
On November 15, 2007, the Company committed to an organizational plan (the "2007 Plan") to shift from three divisions to one integrated corporate structure focused on secure wireless communications for government and industrial customers. The Plan was implemented in the first quarter of 2008. Implementation of the Plan included senior and middle management changes as well as staff reductions to eliminate redundant positions and reflect the Company's decision to close down production in three locations, with all outsourcing centralized in the Dallas/Fort Worth area.
In connection with the 2007 Plan, the Company identified approximately $1.1 million in total costs to execute the 2007 Plan, resulting in cash expenditures of $1.1 million during 2008. The Company recorded an expense of $0.5 million and $0.6 million during December 31, 2008 and 2007, respectively. The costs consisted primarily of severance, relocation, and other employee-related costs.
Included in general and administrative expenses for the year ended December 31, 2008 was $1.2 million related to equity-based compensation expense required by FASB authoritative guidance related to accounting for stock compensation. For the year ended December 31, 2007, we recorded equity-based compensation expense of $1.6 million. During the fourth quarter of 2008, we evaluated the past and expected forfeitures and determined that an increase in the forfeiture rate associated with our equity-based compensation was appropriate. The increase in the forfeiture rate resulted from the
43
integration of our business units reducing the number of employees throughout the year. The impact of this change was a cumulative reduction to equity-based compensation expense of $1.0 million recorded in the fourth quarter of 2008. The unamortized amount of equity-based compensation expense as of December 31, 2008 was $2.5 million.
Amortization of Intangibles. For the years ended December 31, 2008 and 2007, we recorded $1.5 million and $1.6 million, respectively, of amortization mainly associated with the intangibles acquired in the July 2006 acquisition of 3eTI. Intangible assets, consisting of existing technology, customer relationships and technology licenses are amortized over their useful life on a straight-line basis.
Impairment of Goodwill—Represents goodwill impairment charges of $14.9 million for the annual impairment testing of our goodwill tested in the fourth quarter of 2008 associated with the 3eTI reporting unit. This impairment charge brought the goodwill associated with our 3eTI reporting unit to a zero balance. In the fourth quarter of 2007, we also performed our annual evaluation of the goodwill assets resulting in impairment charges of $5.5 million associated with the goodwill related to the 3eTI reporting unit. We have had no impairment of the goodwill associated with our EF Johnson reporting unit. Our goodwill is tested for impairment annually as of December 31 of each year typically after we have completed our strategic planning and budget cycle unless events or circumstances would require an immediate review.
During our strategic planning and budget preparation in the fourth quarter of 2008, we noted continued delays in key new business opportunities and near-term growth opportunities considered in our original assessment of 3eTI that did not materialize within the expected timelines. Therefore, it was necessary to significantly lower cash flow projections for this reporting unit. Specifically, we reduced the revenue and margin projections based on our recent financial performance, strategic plans and future performance expectations for the non-government solutions programs of the reporting unit. Therefore, we concluded that the fair value of this reporting unit was lower than the carrying value of the associated goodwill, and thus overall impaired. Actual results may differ from the use of estimates under different assumptions and conditions.
Interest Expense, net. Interest expense, net, increased $0.9 million to $1.0 million in expense for 2008 from $0.03 million for 2007. The increase is attributable to interest on the term loan, short term borrowings and lower interest income earned on cash investments.
Income Tax Benefit (Expense). For the years ended December 31, 2008 and 2007, we recorded an income tax benefit / (expense) of $0.6 and $(21.5) million, respectively. For 2008, the income tax benefit was primarily due to a reduction in deferred tax liabilities relating to the impairment charge for indefinite lived intangible assets associated with the 3eTI reporting unit. The tax expense for 2007 reflects a $27.8 million increase in the valuation allowance on net deferred tax assets and certain business credits and adjustments. The increase in the valuation allowance in 2007 is based upon management's conclusions regarding, among other considerations, our cumulative loss position during 2008, 2007 and 2006, our current backlog, current and expected customer base, technological and competitive factors impacting our current products, and management's estimates of future earnings based on information currently available.
Net Loss. Net loss was $20.9 million in 2008, an improvement of $20.2 million or 49%, as compared to a net loss of $41.1 million in 2007. Impairment charges against goodwill and other intangibles of $18.4 million made up 88% of the 2008 net loss. In 2007, income tax expense of $21.5 million made up 52% of the net loss, impairment charges against goodwill and other intangibles of $5.8 million made up 14% of the net loss and the $3.4 million write-off of "Other Receivables" to cost of sales made up 8% of the net loss.
44
Selected Quarterly Financial Information
The following table sets forth certain unaudited financial information in dollars and as a percentage of revenues for the eight quarters ended December 31, 2009. In our opinion, this information has been prepared on the same basis as the audited Consolidated Financial Statements appearing elsewhere in this Annual Report on Form 10-K and includes all adjustments, consisting only of normal recurring adjustments, necessary to present fairly the unaudited results set forth herein. The operating results for any quarter are not necessarily indicative of results for subsequent periods or for the entire fiscal year.
45
Quarterly Results of Operations
| |
Quarter Ended | ||||||||||||||||||||||||
|---|---|---|---|---|---|---|---|---|---|---|---|---|---|---|---|---|---|---|---|---|---|---|---|---|---|
| |
March 31, 2008 |
June 30, 2008 |
Sept. 30, 2008 |
Dec. 31, 2008 |
March 31, 2009 |
June 30, 2009 |
Sept. 30, 2009 |
Dec. 31, 2009 |
|||||||||||||||||
| |
(in thousands, except per share data) |
||||||||||||||||||||||||
Revenues |
$ | 33,899 | $ | 32,570 | $ | 34,500 | $ | 25,317 | $ | 22,081 | $ | 29,876 | $ | 24,124 | $ | 16,260 | |||||||||
Cost of sales(1) |
22,505 | 21,564 | 21,649 | 17,842 | 14,731 | 17,538 | 16,170 | 15,986 | |||||||||||||||||
Gross profit(2) |
11,394 | 11,006 | 12,851 | 7,475 | 7,350 | 12,338 | 7,954 | 274 | |||||||||||||||||
Operating expenses: |
|||||||||||||||||||||||||
Research and development(3) |
3,255 | 121 | 3,559 | 3,164 | 3,331 | 3,105 | 2,424 | 2,672 | |||||||||||||||||
Sales and marketing |
3,166 | 3,248 | 3,275 | 2,529 | 2,476 | 2,433 | 2,229 | 2,294 | |||||||||||||||||
General and administrative(4)(5)(6) |
6,401 | 5,706 | 4,756 | 7,572 | 5,423 | 5,329 | 4,577 | 4,532 | |||||||||||||||||
Amortization of intangibles |
407 | 406 | 357 | 356 | 246 | 244 | 250 | 252 | |||||||||||||||||
Impairment of goodwill(7) |
— | — | — | 14,914 | — | — | — | — | |||||||||||||||||
Escrow fund settlement(8) |
— | — | — | — | (2,804 | ) | — | — | — | ||||||||||||||||
Total operating expenses |
13,229 | 9,481 | 11,947 | 28,535 | 8,672 | 11,111 | 9,480 | 9,750 | |||||||||||||||||
Income (loss) from operations |
(1,835 | ) | 1,525 | 904 | (21,060 | ) | (1,322 | ) | 1,227 | (1,526 | ) | (9,476 | ) | ||||||||||||
Interest (expense) income and other income (expense) |
(181 | ) | (268 | ) | (259 | ) | (273 | ) | (284 | ) | (352 | ) | (367 | ) | (374 | ) | |||||||||
Net income (loss) before income taxes |
$ | (2,016 | ) | $ | 1,257 | $ | 645 | $ | (21,333 | ) | $ | (1,606 | ) | $ | 875 | $ | (1,893 | ) | $ | (9,850 | ) | ||||
Income tax benefit (expense)(9) |
— | — | — | 574 | — | — | — | 246 | |||||||||||||||||
Net income (loss) |
$ | (2,016 | ) | $ | 1,257 | $ | 645 | $ | (20,759 | ) | $ | (1,606 | ) | $ | 875 | $ | (1,893 | ) | $ | (9,604 | ) | ||||
Net income (loss) per share—basic |
$ | (0.08 | ) | $ | 0.05 | $ | 0.02 | $ | (0.79 | ) | $ | (0.06 | ) | $ | 0.03 | $ | (0.07 | ) | $ | (0.36 | ) | ||||
Net income (loss) per share—diluted |
$ | (0.08 | ) | $ | 0.05 | $ | 0.02 | $ | (0.79 | ) | $ | (0.06 | ) | $ | 0.03 | $ | (0.07 | ) | $ | (0.36 | ) | ||||
Weighted average common shares—basic |
26,063 | 26,082 | 26,122 | 26,328 | 26,383 | 26,540 | 26,441 | 26,477 | |||||||||||||||||
Weighted average common shares—diluted |
26,063 | 26,407 | 26,687 | 26,328 | 26,383 | 27,009 | 26,441 | 26,477 | |||||||||||||||||
As a Percentage of Revenues: |
|||||||||||||||||||||||||
Revenues |
100.0 | % | 100.0 | % | 100.0 | % | 100.0 | % | 100.0 | % | 100.0 | % | 100.0 | % | 100.0 | % | |||||||||
Cost of sales(1) |
66.4 | 66.2 | 62.8 | 70.5 | 66.7 | 58.7 | 67.0 | 98.3 | |||||||||||||||||
Gross profit(2) |
33.6 | 33.8 | 37.2 | 29.5 | 33.3 | 41.3 | 33.0 | 1.7 | |||||||||||||||||
Operating expenses: |
|||||||||||||||||||||||||
Research and development(3) |
9.6 | 0.4 | 10.3 | 12.5 | 15.1 | 10.4 | 10.0 | 16.4 | |||||||||||||||||
Sales and marketing |
9.3 | 10.0 | 9.5 | 10.0 | 11.2 | 8.1 | 9.3 | 14.1 | |||||||||||||||||
General and administrative(4)(5)(6) |
18.9 | 17.5 | 13.8 | 29.9 | 24.6 | 17.8 | 19.0 | 27.9 | |||||||||||||||||
Amortization of intangibles |
1.2 | 1.2 | 1.0 | 1.4 | 1.1 | 0.8 | 1.0 | 1.6 | |||||||||||||||||
Impairment of goodwill(7) |
— | — | — | 58.9 | — | — | — | — | |||||||||||||||||
Escrow fund settlement(8) |
— | — | — | — | (12.7 | ) | — | — | — | ||||||||||||||||
Total operating expenses |
39.0 | 29.1 | 34.7 | 112.7 | 39.3 | 37.3 | 39.3 | 60.0 | |||||||||||||||||
Income (loss) from operations |
(5.4 | ) | 4.7 | 2.5 | (83.2 | ) | (6.0 | ) | 4.1 | (6.3 | ) | (58.3 | ) | ||||||||||||
Interest (expense) income and other income (expense), net |
(0.5 | ) | (0.8 | ) | (0.8 | ) | (1.1 | ) | (1.3 | ) | (1.2 | ) | (1.5 | ) | (2.3 | ) | |||||||||
Income tax benefit (expense)(9) |
— | — | — | 2.3 | — | — | — | 1.5 | |||||||||||||||||
Net income (loss) |
(5.9 | )% | 3.9 | % | 1.8 | % | (82.0 | )% | (7.3 | )% | 2.9 | % | (7.8 | )% | (59.1 | )% | |||||||||
- (1)
- During the third quarter of 2007, the Company entered into a Memorandum of Understanding ("MOU") with one of its vendors in an effort to resolve a dispute between the parties regarding an outstanding receivable. The execution of the Memorandum of Understanding effectively changed the nature of the outstanding receivable such
46
that it should no longer be considered a receivable balance. As a result, the Company wrote off this "Other Receivable" of $3,557 in the third quarter of 2007 against cost of sales and received credits under the MOU during 2007, reducing the net impact to gross margin by $3.4 million. We received credits under the agreement amounting to $96, $246, $223 and $189 in the quarters ended March 31, June 30, September 30 and December 31, 2008, respectively. We received credits under the agreement amounting to $117, $101, $37 and $30 in the quarters ended March 31, June 30, September 30 and December 31, 2009, respectively.
- (2)
- During
the fourth quarter of 2009 the Company wrote off the "X"-platform and legacy service stock raw materials inventory for $4.1 million, thereby
impacting the gross profit for the fourth quarter.
- (3)
- The
decrease in research and development expenses in the second quarter of 2008 is primarily attributable to a non-recurring engineering cost
reimbursement of $4.0 million received in the second quarter of 2008 from a customer for research and development expenses relating to the development and re-engineering of our
Multi-Net® radio product line associated with the FCC re-banding effort.
- (4)
- We
incurred non-cash compensation expense of $642, $533, $566 and $(492) in the quarters ended March 31, June 30,
September 30 and December 31, 2008 and $549, $316, $307 and $(115) in the quarters ended March 31, June 30, September 30 and December 31, 2009,
respectively. See Notes 15 and 16 of Notes to Consolidated Financial Statements for a more detailed explanation.
- (5)
- During
the fourth quarter of 2008, we incurred impairment charge against the intangibles of $3.5 million associated with the 3eTI reporting unit.
- (6)
- In
relation to the 2009 work force reduction plan, the Company recorded $336 for one time termination benefits and other associated costs in the quarter
ended December 31, 2009.
- (7)
- During
the fourth quarter of 2008, the Company incurred a goodwill impairment charge of $14.9 million associated with the 3eTI reporting unit.
- (8)
- Escrow
fund settlement of $2.8 million reflects a reduction of operating expenses associated with the 3eTI reporting unit for the first quarter 2009
settlement of claims against funds held in an escrow account.
- (9)
- A tax benefit of $574 was recorded in the fourth quarter of 2008 due to a reduction in deferred tax liabilities relating to the impairment charge for indefinite lived intangible assets associated with the 3eTI reporting unit. A tax benefit of $246 was recorded in the fourth quarter of 2009 relating to carry backs of business tax credits and alternative minimum tax credits. The timing of our changes in estimates were dependent upon various factors considered by management.
We historically have experienced substantial variability in our results of operations from quarter to quarter. The level of revenues in a particular quarter varies primarily based upon the timing of customer purchase orders, due principally to the nature of governmental budgeting processes and the needs of competing budgetary concerns of our customers during the year. Other factors that affect the results of operations in a particular quarter include the timing of the introduction of new products, general economic conditions, the timing and mix of product sales and specific economic conditions. We believe that quarterly results are likely to vary for the foreseeable future.
Liquidity and Capital Resources
The Company's primary sources of liquidity are its cash and cash equivalents which were $16.0 million at December 31, 2009 (net of $5.0 million pledged restricted cash). Due to the net losses in 2009, 2008 and 2007, we considered several key factors in assessing the liquidity requirements of the Company for the next twelve months. Management developed operational cash flow projections which factor in our backlog of orders, timing of receiving and shipping orders, the continued focus on cost management, and our historical collection and payment patterns with customers and vendors. The majority of our customers are with the United States Government, state counties that are rebanding under the FCC and Sprint / Nextel escrowed funds arrangement, state and local agencies and our dealer network supporting state and local agencies. In several cases, our customer purchases of products and services are supported by encumbered funds and grants. While this does not provide absolute payment assurance, it does indicate collectibility is reasonably assured. Management continues to monitor the financial condition of our vendors and supply chain noting some impact from the current economic conditions could disrupt our deliveries.
47
The Company also has a secured line of credit agreement with Bank of America, N.A. (the "Loan Agreement"), which expires June 30, 2010. We amended the Loan Agreement in July 2006 to include a revolving line of credit of up to $15.0 million and a term loan of $15.0 million. The $15.0 million term loan was fully funded and used to finance the acquisition of 3eTI. Both borrowings bear interest at a variable rate based on the London Interbank Offered Rate ("LIBOR") plus a margin ("LIBOR Margin"). The LIBOR Margin was 500 basis points at December 31, 2009. The effective interest rate at December 31, 2009 was 5.235 percent.
The Loan Agreement provides for customary affirmative and negative covenants, including maintenance of corporate existence, property and certain reporting requirements, as well as limitations on debt, liens, fundamental changes, acquisitions, investments, loans, guarantees, use of proceeds and capital expenditures. In addition, the Loan Agreement contains certain financial covenants including a maximum ratio of funded debt to EBITDA and a fixed charge coverage ratio. The Loan Agreement also provides for events of default that would permit the lender to accelerate the loans upon their occurrence. As collateral for the obligations under the Loan Agreement, the Lender has a security interest in substantially all assets of the borrowers, including accounts receivable, inventories and general intangibles.
We were not in compliance with the financial covenants of the Loan Agreement for the quarter ending December 31, 2008. As a result, on March 16, 2009 we executed an Amendment to the Loan Agreement whereby Bank of America waived such financial covenant defaults on a one time basis and amended the Loan Agreement to, among other things, lower the revolving line of credit from $15.0 million to $10.0 million, revise such financial covenants, add additional covenants, and to modify the advance and borrowing revisions under the Loan Agreement. In order to maintain compliance with the terms of the Amendment, the Company pledged as additional cash collateral for the remaining term of the term loan, $3.0 million on the effective date of the Amendment. Furthermore, beginning with the quarter ending June 30, 2009, we were required to maintain a certain level of EBITDA, a certain fixed charge coverage ratio on a cumulative basis beginning April 1, 2009, a minimum funded debt to EBITDA ratio on an annualized basis beginning April 1, 2009 for each quarterly financial reporting period through June 30, 2010 and limit capital expenditures to $2.5 million for 2009. In addition, the interest rate on the revolving note was amended to a floating rate equal to LIBOR plus a Libor Margin ranging from 2.50% to 5.00% through the term of the note based on the Company's funded debt to EBITDA.
The Company did not borrow against the revolving line of credit during 2009. The Company borrowed against the revolving line during 2008 due to the collection timing of certain receivables. We had outstanding borrowings of $6.5 million and $2.0 million at March 31, 2008 and September 30, 2008, respectively. At December 31, 2009 and 2008, no borrowings were outstanding on the revolving line of credit. The total available credit under the line of credit was $3.1 million and $14.4 million as of December 31, 2009 and 2008, respectively. Effective March 1, 2010, any borrowings under the line of credit are at the discretion of the lender.
We were not in compliance with certain of the financial covenants of the Loan Agreement for the quarter ended December 31, 2009. As a result, effective March 1, 2010, we executed another amendment to the Loan Agreement whereby Bank of America waived such financial covenant defaults on a one-time basis, waived compliance with such financial covenants for the Company's first quarter of 2010, and further amended the Loan Agreement to, among other things, (i) lower the revolving line of credit from $10.0 million to $3.75 million, (ii) make all future advances under the line subject to the lender's discretion, (iii) further limit our ability to obtain letters of credit, (iv) require us to pledge additional cash collateral totaling $3.5 million for the remaining term of the Loan Agreement no later than June 15, 2010, and (v) require us to provide additional financial reporting to the bank on a monthly basis. Failure to comply with any of these terms could constitute an event of default that would permit the lender to accelerate the loans upon their occurrence, which could have a material
48
adverse effect on our operating results and cash flows. We cannot assure that in the future we will be able to achieve, maintain or satisfy these obligations under the Loan Agreement or obtain a waiver from Bank of America in the event we fail to comply.
As noted above, the Loan Agreement expires June 30, 2010. As a result, the $15.0 million term loan is due and payable in full on that date. The Company does not anticipate that it will have sufficient cash on hand on that date to pay off the term loan, or, if at all, without dedicating all or substantially all of our cash flow from operations to the payment of our indebtedness, thereby substantially reducing the funds available for operations, working capital, capital expenditures, research and development, sales and marketing initiatives and general corporate or other purposes. As a result, the Company is exploring options available to it to refinance the debt, or raise additional funds through private equity or debt financing, sales of assets, or other strategic alternatives. These funds may not be available, or if available, we may not be able to obtain them on terms favorable to us. If we are unable to refinance the debt or raise sufficient additional funds, our business could materially suffer.
Our current cash flow and capital resources are limited, and we require additional funds to pursue our business. We may not be able to secure further financing in the future. If we are not able to obtain additional financing on reasonable terms, we may not be able to execute our business strategy, conduct our operations at the level desired, or even to continue business.
If we raise additional funds through further issuances of equity or convertible debt securities, our existing stockholders could suffer significant dilution in their percentage ownership of our company, and any new equity securities we issue could have rights, preferences and privileges senior to those of holders of our common stock. In addition, any debt financing that we may secure in the future could have restrictive covenants relating to our capital raising activities and other financial and operational matters, which may make it more difficult for us to obtain additional capital and to pursue business opportunities.
If we sell certain assets of the Company to satisfy our obligations, that may materially reduce our revenues in the future, which, to the extent not offset by cost reductions or revenue from new or existing customers, could materially reduce our cash flows and adversely affect our financial position. This may limit our ability to raise capital or fund our operations, working capital needs and capital expenditures in the future. See "Item 1A. Risk Factors" for an additional discussion of risks.
Letters of credits and bonds. In the normal course of our business activities related to sales of wireless radio systems to local and state governmental entities, we are required under contracts with various government authorities to provide letters of credit or performance or bid bonds that may be drawn upon if we fail to perform under our contracts. There was a $750 letter of credit under our line of credit as of December 31, 2009 and there were no letters of credit under our line of credit as of December 31, 2008. Performance and bid bonds, which expire on various dates, totaled $2.4 million at December 31, 2009 and 2008, respectively. No bonds had been drawn upon at either date. The majority of bonds relate to the contract awarded in May 2008 by the Government of Yukon, Canada that is collateralized by restricted cash of $2.0 million.
Net cash from operating activities. Our operating activities provided / (used) cash of $9.1 million, ($0.7) million and ($3.8) million in 2009, 2008 and 2007, respectively. Cash provided by or used in operating activities is primarily a reflection of our collections on billed receivables, investment in inventories and expenditures for operations.
During 2009 operating cash was provided primarily from collection of trade accounts receivable, improved inventory turnover, increased billings in excess of cost on uncompleted contracts, lower prepaid expenses and increased deferred revenues coupled with non-cash depreciation, amortization and stock compensation of $4.8 million all contributing to $27.6 million in the aggregate to cash from operations. Partially offsetting were the net loss of $12.2 million coupled with reductions in accounts
49
payable and other accrued liabilities all aggregating to $18.5 million. Operating cash includes $2.8 million received from the escrow fund settlement in January 2009. In connection with the acquisition of 3eTI in 2006, the total consideration paid by the Company consisted of $36.0 million in cash, which included $3.6 million to be held in escrow to indemnify the Company for any claims under the Agreement. In January 2009, we settled claims under the Agreement and received $2.8 million of the funds held in the escrow account.
During 2008, operating cash was primarily used by a net loss of $20.9 million coupled with increased inventories, prepaid expenses and reductions in accounts payable and other liabilities all aggregating to $29.6 million. Partially offsetting were non-cash impairment charges of $18.4 million, depreciation, amortization and stock compensation of $5.7 million coupled with collection of receivables and increases in deferred revenue all aggregating to $28.9 million
During 2007, operating cash was primarily used by a net loss of $41.1 million coupled with increased inventories, and reductions in other liabilities all aggregating to $50.9 million. Partially offsetting were non-cash increased tax valuation of $21.4, impairment charges of $5.8 million, depreciation, amortization and stock compensation of $6.1 million coupled with collection of receivables and increases of deferred revenue all aggregating to $47.1 million
Net cash used in investing activities. During the years ended December 31, 2009, 2008 and 2007, we used $1.3 million, $3.7 million and $3.5 million in investing, respectively. During 2009, $1.2 million was used to purchase fixed assets. During 2008, $2.0 million of cash was restricted to secure a $2.0 million bonding arrangement (noted above) and $1.9 million was used to purchase fixed assets. During 2007, $3.2 million was used to purchase fixed assets.
Net cash from financing activities. Financing activities used cash in 2009 for an increase in restricted cash of $3.0 million relating to the loan amendment noted above together with other minimal financing activities. There were no borrowings against the revolving line of credit during 2009. Financing activities provided cash negligible amounts in 2008 and $0.1 million in 2007. Although there were no short-term borrowings under the revolving line of credit outstanding at December 31, 2008, the Company borrowed against the revolving line of credit during the year due the collection timing of certain receivables. We had outstanding borrowings of $6.5 million and $2.0 million at March 31, 2008 and September 30, 2008, respectively.
Dividend policy
Since our initial public offering, we have not declared or paid any dividends on our common stock. We presently intend to retain earnings for use in our operations and to finance our business. Any change in our dividend policy is within the discretion of our board of directors and will depend, among other things, on our earnings, debt service and capital requirements, restrictions in financing agreements, if any, business conditions and other factors that our board of directors deems relevant.
Operating leases
We lease various equipment and buildings under operating leases. Future minimum rental payments under non-cancelable operating lease agreements are shown below in the table under the subheading "Contractual Obligations." Of the $7.4 million in operating lease obligations, $8.0 million relates to the leases of our operating facilities with leases expiring through March 2019; and $(0.6) million relates to the amortization of the gain generated by the sale-leaseback of our headquarter facility. We anticipate that, in the normal course of business, leases will be renewed or replaced as they expire.
50
Tabular Disclosure of Contractual Obligations
Our known contractual obligations as of December 31, 2009 are shown below:
Tabular Disclosure of Contractual Obligations
| |
Payment due by period | |||||||||||||||
|---|---|---|---|---|---|---|---|---|---|---|---|---|---|---|---|---|
Contractual Obligations (in millions)
|
Total | Less than 1 year |
1-3 Years |
4-5 Years |
More than 5 Years |
|||||||||||
Long-term debt obligations(1) |
$ | 15.0 | $ | 15.0 | $ | — | $ | — | $ | — | ||||||
Capital lease obligations(2) |
— | — | — | — | — | |||||||||||
Operating lease obligations |
7.4 | 1.5 | 2.4 | 1.3 | 2.2 | |||||||||||
Purchase obligations(3) |
22.7 | 22.7 | — | — | — | |||||||||||
Other long-term liabilities—deferred revenue |
1.8 | 1.1 | 0.6 | 0.1 | — | |||||||||||
Total |
$ | 46.6 | $ | 40.2 | $ | 2.7 | $ | 1.4 | $ | 2.3 | ||||||
- (1)
- Interest
expense on the long-term debt obligation will be approximately $0.795 through June 30, 2010 based on a 10.64% interest rate that
is fixed by the related interest rate swap agreement plus 500 basis points per Loan Amendment.
- (2)
- Amounts
due less than one year under the capital lease obligation are $0.006.
- (3)
- Purchase obligations represent purchase commitments to suppliers of services, inventory and capital expenditures that could be canceled with sufficient notice, generally 30 to 60 days.
Off-Balance Sheet Arrangements
As part of our ongoing business, we do not participate in transactions that generate relationships with unconsolidated entities or financial partnerships, such as entities often referred to as structured finance or variable interest entities, or VIEs, which would have been established for the purpose of facilitating off-balance sheet arrangements or other contractually narrow or limited purposes. As of December 31, 2009, we are not involved in VIE transactions.
ITEM 7A. QUANTITATIVE AND QUALITATIVE DISCLOSURES ABOUT MARKET RISK
We are exposed to certain market risks in the ordinary course of our business. These risks result primarily from changes in interest rates and foreign currency exchange rates. We do not currently hold any derivatives or other financial instruments purely for trading or speculative purposes.
Our financial instruments consist of cash, cash equivalents, short- and long-term investments, trade accounts receivable, accounts payable and long-term obligations. The primary objective of our investment activities is to preserve principal while at the same time maximizing yields without increasing risk. As of December 31, 2009, we had an investment portfolio of short-term investments in a variety of interest-bearing money market funds. Due to the short duration of our investment portfolio, a hypothetical 1% change in interest rates would not be material to our financial condition or results of operations.
51
The Company has $15.0 million of variable rate debt outstanding at December 31, 2009, which debt matures on June 30, 2010. The debt is variable based on the LIBOR rate. Assuming interest rate volatility in the future is similar to what has been seen in recent years, the Company does not anticipate that short term changes in interest rates will materially affect its consolidated, financial position, results of operations or cash flows. The Company is currently exploring options available to it to refinance the debt or raise additional funds through private equity or debt financing, sales of assets, or other strategic alternatives. These funds may not be available, or if available, we may not be able to obtain them on terms favorable to us. If we are unable to refinance the debt or raise sufficient additional funds, our business could materially suffer. See "Liquidity and Capital Resources" for further discussion of our financing facilities and capital structure.
Although a substantial majority of our sales are denominated in U.S. dollars, fluctuations in the value of international currencies relative to the U.S. dollar may affect the price, competitiveness and profitability of our products sold in international markets. Furthermore, the uncertainty of monetary exchange values has caused, and may in the future cause, some foreign customers to delay new orders or delay payment for existing orders. The company does not use financial instruments to hedge foreign currency exchange rate changes.
Recently Issued Accounting Standards
In December 2007, the FASB revised authoritative guidance for business combinations, which establishes principles and requirements for how an acquirer recognizes and measures in its financial statements the identifiable assets acquired, the liabilities assumed, any noncontrolling interest in the acquiree and the goodwill acquired. The guidance also establishes disclosure requirements which will enable users to evaluate the nature and financial effects of the business combination. The guidance is to be applied prospectively to business combinations for which the acquisition date is on or after an entity's fiscal year that begins after December 15, 2008. The impact of our adoption of this guidance will depend upon the nature and terms of business combinations, if any, that we consummate on or after January 1, 2009.
In December 2007, the FASB revised authoritative guidance for consolidations, which establishes accounting and reporting standards for ownership interests in subsidiaries held by parties other than the parent, the amount of consolidated net income attributable to the parent and to the noncontrolling interest, changes in a parent's ownership interest and the valuation of retained noncontrolling equity investments when a subsidiary is deconsolidated. The guidance also establishes reporting requirements that provide sufficient disclosures that clearly identify and distinguish between the interests of the parent and the interests of the noncontrolling owners. The adoption of this guidance currently has no impact on our Consolidated Financial Statements.
In March 2008, the FASB revised authoritative guidance for disclosures of derivative instruments and hedging activities, which requires additional disclosures about the objectives of using derivative instruments, the method by which the derivative instruments and related hedged items are accounted for and the effect of derivative instruments and related hedged items on financial position, financial performance, and cash flows. The guidance also requires disclosure of the fair values of derivative instruments and their gains and losses in a tabular format. The Company adopted this guidance effective January 1, 2009. The adoption of this guidance had no material impact on our consolidated financial statements.
In April 2008, the FASB revised authoritative guidance for determining the useful life of intangible assets, which revises the factors that should be considered in developing renewal or extension assumptions used to determine the useful life of a recognized intangible asset. The Company will be required to adopt this guidance with respect to intangible assets acquired on or after January 1, 2009.
52
Due to the prospective application requirement, the adoption of this guidance had no impact on our consolidated financial statements.
In November 2008, the FASB revised authoritative guidance for accounting for defensive intangible assets, which addresses the accounting for assets acquired in a business combination or asset acquisition that an entity does not intend to actively use, otherwise referred to as a 'defensive asset'. The guidance requires defensive intangible assets to be initially accounted for as a separate unit of accounting and not included as part of the cost of the acquirer's existing intangible asset(s) because it is separately identifiable. The guidance also requires that defensive intangible assets be assigned a separate useful life. Due to the prospective application requirement, the adoption of this guidance had no impact on our consolidated financial statements.
In April 2009, the FASB revised authoritative guidance for determining fair value when the volume and level of activity for the asset or liability have significantly decreased and identifying transactions that are not orderly. The guidance emphasizes that even if there has been a significant decrease in the volume and level of activity for the asset or liability and regardless of the valuation technique(s) used, the objective of a fair value measurement remains the same. Fair value is the price that would be received to sell an asset or paid to transfer a liability in an orderly transaction (that is, not a forced liquidation or distressed sale) between market participants at the measurement date under current market conditions. The guidance is effective for interim and annual reporting periods ending after June 15, 2009, and is applied prospectively. The Company's adoption of this guidance did not have an impact on its consolidated financial statements.
In April 2009, the FASB revised authoritative guidance for disclosures of financial instruments. The guidance requires disclosures about fair value of financial instruments for interim reporting periods of publicly traded companies as well as in annual financial statements. The guidance is effective for interim and annual reporting periods ending after June 15, 2009. The Company's adoption of this guidance did not have an impact on its consolidated financial statements.
In May 2009, as amended in February 2010, the FASB revised authoritative guidance for subsequent events, which establishes general standards of accounting for and disclosures of events that occur after the balance sheet date but before financial statements are issued or are available to be issued. It requires the evaluation of subsequent events through the date the Company's financial statements are issued. The guidance was effective for interim or annual financial periods ending after June 15, 2009. The Company adopted this guidance and has provided the required disclosures for the period.
In June 2009, the FASB issued new authoritative guidance for the hierarchy of accounting standards, which establishes the FASB Accounting Standards Codification ™ ("Codification") as the source of authoritative U.S. GAAP recognized by the FASB to be applied by nongovernmental entities. Rules and interpretive releases of the SEC under authority of federal securities laws are also sources of authoritative GAAP for SEC registrants. On the effective date of the guidance, the Codification superseded all then-existing non-SEC accounting and reporting standards. All other nongrandfathered non-SEC accounting literature not included in the Codification became nonauthoritative. This guidance is effective for financial statements issued for interim and annual periods ending after September 15, 2009. The adoption of this guidance did not have a material impact on our consolidated financial statements.
In October 2009, the FASB issued Accounting Standards Update ("Update") No. 2009-13, which amends the Revenue Recognition topic of the Codification. This update provides amendments to the criteria in Subtopic 605-25 of the Codification for separating consideration in multiple-deliverable arrangements. As a result of those amendments, multiple-deliverable arrangements will be separated in more circumstances than under existing U.S. GAAP. The amendments establish a selling price hierarchy for determining the selling price of a deliverable and will replace the term fair value in the revenue
53
allocation guidance with selling price to clarify that the allocation of revenue is based on entity-specific assumptions rather than assumptions of a marketplace participant. The amendments will also eliminate the residual method of allocation and require that arrangement consideration be allocated at the inception of the arrangement to all deliverables using the relative selling price method and will require that a vendor determine its best estimate of selling price in a manner that is consistent with that used to determine the price to sell the deliverable on a standalone basis. These amendments will be effective prospectively for revenue arrangements entered into or materially modified in fiscal years beginning on or after June 15, 2010, with early adoption permitted. We adopted the amended Revenue Recognition guidelines during the fourth quarter of 2009 as more fully disclosed in our notes to consolidated financial statements.
In October 2009, the FASB issued Update No. 2009-14, which amends the Software topic of the Codification. The amendments in this update change the accounting model for revenue arrangements that include both tangible products and software elements. Tangible products containing software components and nonsoftware components that function together to deliver the tangible product's essential functionality are no longer within the scope of the software revenue guidance in Subtopic 605-985 of the Codification. In addition, the amendments in this update require that hardware components of a tangible product containing software components always be excluded from the software revenue guidance. In that regard, the amendments provide additional guidance on how to determine which software, if any, relating to the tangible product also would be excluded from the scope of the software revenue guidance. The amendments also provide guidance on how a vendor should allocate arrangement consideration to deliverables in an arrangement that includes both tangible products and software. The amendments also provide further guidance on how to allocate arrangement consideration when an arrangement includes deliverables both included and excluded from the scope of the software revenue guidance. These amendments will be effective prospectively for revenue arrangements entered into or materially modified in fiscal years beginning on or after June 15, 2010, with early adoption permitted. We adopted the amended Software guidelines during the fourth quarter of 2009. The adoption of this guidance did not have an impact on our consolidated financial statements.
In January 2010, the FASB issued FASB ASU 2010-06, Improving Disclosures About Fair Value Measurements, which amends FASB ASC 820. The updated guidance requires new disclosures about recurring or nonrecurring fair-value measurements including significant transfers into and out of Level 1 and Level 2 fair-value measurements and information on purchases, sales, issuances, and settlements on a gross basis in the reconciliation of Level 3 fair-value measurements. The guidance also clarified existing fair-value measurement disclosure guidance about the level of disaggregation, inputs, and valuation techniques. The guidance became effective for interim and annual reporting periods beginning on or after December 15, 2009, with an exception for the disclosures of purchases, sales, issuances and settlements on the roll-forward of activity in Level 3 fair value measurements. Those disclosures will be effective for fiscal years beginning after December 15, 2010 and for interim periods within those fiscal years. We are currently evaluating the impact the adoption of this update might have on our consolidated financial statements.
ITEM 8. FINANCIAL STATEMENTS AND SUPPLEMENTARY DATA
See "Item 15. Exhibits and Financial Statement Schedules and Reports" for the Company's consolidated financial statement, and the notes thereto, and the financial statement schedule filed as part of this report.
ITEM 9. CHANGES IN AND DISAGREEMENTS WITH ACCOUNTANTS ON ACCOUNTING AND FINANCIAL DISCLOSURE
None.
54
ITEM 9A. CONTROLS AND PROCEDURES
Disclosure Controls and Procedures
Disclosure controls are procedures designed with the objective of ensuring information required to be disclosed in our reports filed under the Exchange Act, such as this Annual Report, is recorded, processed, summarized and reported within the time periods specified in the Securities and Exchange Commission, or SEC, rules and forms. Disclosure controls are also designed with the objective of ensuring such information is accumulated and communicated to management, including the CEO and CFO, as appropriate to allow timely decisions regarding required disclosure.
Our disclosure controls are also evaluated on an ongoing basis by our Finance department. The overall goals of these various evaluation activities are to monitor our disclosure controls and to make modifications as necessary. Our intent in this regard is that the disclosure controls will be maintained as dynamic systems that change (including with improvements and corrections) as conditions warrant.
In accordance with Rule 13a-15(b) of the Securities Exchange Act of 1934, or the Exchange Act, we evaluated the effectiveness of the design and operation of our disclosure controls and procedures as defined in Rule 13a-15(e) and 15d-15(e) under the Exchange Act as of the year ended December 31, 2009. This evaluation, or the controls evaluation, was done under the supervision and with the participation of management, including our Chief Executive Officer, or CEO, and Chief Financial Officer, or CFO. Based on this evaluation, our CEO and CFO concluded that the Company's disclosure controls and procedures were effective as of the end of the period covered by this report.
Management's Report on Internal Control over Financial Reporting (See Management's Report on page F-1)
Internal control over financial reporting (as defined in Rules 13a-15(f) and 15d-15(f) under the Exchange Act) refers to the process designed by, or under the supervision of, our CEO and CFO, and effected by our Board of Directors, management and other personnel, to provide reasonable assurance regarding the reliability of financial reporting and the preparation of financial statements for external purposes in accordance with generally accepted accounting principles. Management is responsible for establishing and maintaining adequate internal control over our financial reporting.
We have evaluated the effectiveness of our internal control over financial reporting as of December 31, 2009. This evaluation was performed using the Internal Control—Integrated Framework developed by the Committee of Sponsoring Organizations of the Treadway Commission. Based on our evaluation under the framework, our management concluded that our internal control over financial reporting was effective as for December 31, 2009.
This Form 10-K does not include an attestation report of our registered public accounting firm regarding internal control over financial reporting. Management's report was not subject to attestation by our registered public accounting firm pursuant to temporary rules of the SEC that permit the Company to provide only management's report in this Form 10-K.
Changes in Internal Control over Financial Reporting
As part of our normal operations, we update our internal controls as necessary to accommodate any modifications to our business processes or accounting procedures. No change occurred during the most recent fiscal quarter that materially affected, or is reasonably likely to materially affect, our internal control over financial reporting.
None.
55
ITEM 10. DIRECTORS, EXECUTIVE OFFICERS AND CORPORATE GOVERNANCE
The information required by this Item is incorporated by reference from the information provided under the headings "Proposal One—Election of Class II Directors", "Corporate Governance and Information About Directors", "Information about Executive Officers," "Security Ownership" "Section 16(a) Beneficial Ownership Reporting Compliance" and "Code of Ethics" of our Proxy Statement.
ITEM 11. EXECUTIVE COMPENSATION
The information required by this Item is incorporated by reference from the information provided under the headings "Compensation Discussion and Analysis", "Summary Compensation Table", "Grants of Plan-Based Awards Table", "Outstanding Equity Awards at Fiscal Year-End Table", "Option Exercises and Stock Vested Table", "Nonqualified Deferred Compensation Table", "All Other Compensation Table", "Compensation Committee Report" and "Perquisites Table" of our Proxy Statement.
ITEM 12. SECURITY OWNERSHIP OF CERTAIN BENEFICIAL OWNERS AND MANAGEMENT AND RELATED STOCKHOLDER MATTERS
Incorporated by reference in this Annual Report is the information required by this Item 12 contained in the section entitled "Security Ownership" of our Proxy Statement.
The following table summarizes our equity compensation plan information as of December 31, 2009. Information is included for both equity compensation plans which were approved by our stockholders. We currently maintain two equity compensation plans, the 1996 Stock Incentive Plan and the 2005 Omnibus Incentive Plan. The following table sets forth information regarding outstanding options and shares reserved for future issuance under the 1996 Stock Incentive Plan and 2005 Omnibus Incentive Plan as of December 31, 2009.
| |
(a) Number of securities to be issued upon exercise of outstanding options, warrants and rights |
(b) Weighted- average exercise price of outstanding options, warrants and rights |
(c) Number of securities remaining available for future issuance under equity compensation plans (excluding securities reflected in column (a)) |
||||||||
|---|---|---|---|---|---|---|---|---|---|---|---|
Plan Category |
|||||||||||
Equity compensation plans approved by security holders(1) |
1,693,377 | $ | 4.20 | 998,756 | |||||||
Equity compensation plans not approved by security holders |
— | — | — | ||||||||
Total |
1,693,377 | $ | 4.20 | 998,756 | |||||||
- (1)
- Under the 2005 Omnibus Incentive Plan, the Compensation Committee may make various stock-based awards. In addition, shares covered by outstanding awards may become available for new awards if, among other things, the outstanding awards are forfeited or otherwise are terminated before the awards vest and shares are issued. The 1996 Stock Incentive Plan terminated under its own terms on December 31, 2006.
In addition, the Company maintains the 1999 Non-Employee Director Stock Purchase Plan under which the non-employee directors of the Company may elect to receive some or all of their
56
compensation for serving on the Board of Directors of the Company in the form of Company common stock. Several directors elected to participate in the 1999 Plan over the past several years, and, as of December 31, 2009, there were only 14,751 shares remaining available for issuance under this Plan. Due to the small number of shares remaining available for issuance under the 1999 Plan, on December 18, 2008, the Compensation Committee authorized the use of the 2005 Plan to issue shares to participating non-employee directors in lieu of cash director compensation. During 2009, Robert L. Barnett, Edward H. Bersoff, Veronica A. Haggart and Thomas R. Thomsen elected to participate in such plan.
ITEM 13. CERTAIN RELATIONSHIPS AND RELATED TRANSACTIONS, AND DIRECTOR INDEPENDENCE
Incorporated by reference in this Annual Report is the information required by this Item 13 contained in the section entitled "Corporate Governance and Information About Directors—Certain Relationships and Related Transactions" of our Proxy Statement.
ITEM 14. PRINCIPAL ACCOUNTANT FEES AND SERVICES
Incorporated by reference in this Annual Report is the information required by this Item 14 contained in the section entitled "Audit Committee Disclosure" of our Proxy Statement.
57
ITEM 15. EXHIBITS and FINANCIAL STATEMENT SCHEDULES AND REPORTS
(a). Financial Statements
The following documents are filed as part of this report.
Schedules not listed above have been omitted because the information required to be set forth therein is not applicable or the information is presented in the consolidated financial statements or related notes.
(b). Exhibits.
The following exhibits are filed herewith or are incorporated by reference to exhibits previously filed with the SEC (the original Exhibit number is referenced parenthetically).
| Exhibit Number |
Description | ||
|---|---|---|---|
| 2.1 | Agreement and Plan of Merger by and among the Company, Avanti Acquisition Corp., 3e Technologies International, Inc., Chih-Hsiang Li and the principal stockholders named therein, dated as of July 10, 2006 (incorporated herein by reference to Exhibit 10.1 to the Company's Current Report on Form 8-K filed with the SEC on July 14, 2006). | ||
| 3.1 | (a) | Second Amended and Restated Certificate of Incorporation of the Company filed on September 30, 1996 with the Secretary of State of the State of Delaware as amended (incorporated herein by reference to Exhibit 3.1 to the Company's Annual Report on Form 10-K filed with the SEC on March 13, 2008). | |
| 3.1 | (b) | Certificate of Amendment of the Second Amended and Restated Certificate of Incorporation of the Company filed on May 28, 2008 with the Secretary of State of the State of Delaware (incorporated herein by reference to Exhibit 3.1 to the Company's Quarterly Report on Form 10-Q filed with the SEC on July 30, 2008). | |
| 3.2 | Amended and Restated Bylaws of the Company (incorporated herein by reference to Exhibit 3.2 to the Company's Annual Report on Form 10-K filed with the SEC on March 13, 2008). | ||
58
| Exhibit Number |
Description | ||
|---|---|---|---|
| 4.1 | (a) | Description of Specimen Form of Common Stock certificate (incorporated herein by reference to Exhibit 4.1 to the Registration Statement on Form S-1/A filed with the SEC on November 21, 1996, Commission file number 333-14351). | |
| 4.1 | (b) | Specimen Form of Common Stock certificate (incorporated herein by reference to Exhibit 4.1 to the Company's Quarterly Report on Form 10-Q filed with the SEC on July 30, 2008). | |
| 10.1 | + | Transcrypt International, Inc. 1996 Stock Incentive Plan, as amended (incorporated by reference to Exhibit 99.1 to the S-8 Registration Statement filed with the SEC on October 27, 2000, Commission file number 333-48880). | |
| 10.2 | + | Transcrypt International, Inc. 1999 Non-Employee Director Stock Purchase Plan (incorporated by reference to Exhibit 10.1 to the Company's Annual Report on Form 10-K filed with the SEC on March 23, 2000). | |
| 10.3 | + | Transcrypt International, Inc. 1999 Executive Officer Stock Purchase Plan (incorporated by reference to Exhibit 10.2 to the Company Annual Report on Form 10-K filed with the SEC on March 23, 2000). | |
| 10.4 | + | Form of Stock Appreciation Rights Agreement (incorporated by reference to Exhibit 10.2 to the Company's Current Report on Form 8-K filed with the SEC on November 26, 2007). | |
| 10.5 | + | Transcrypt Executive Health Program (incorporated herein by reference to Exhibit 10.14 to the Annual Report on Form 10-K filed with the SEC on March 7, 2002). | |
| 10.6 | (a)+ | 2005 Omnibus Incentive Plan (incorporated herein by reference to Exhibit 4.1 to the Company's Registration Statement on Form S-8 filed with the SEC on November 15, 2005, Commission file number 333-129717). | |
| 10.6 | (b)+ | EFJ, Inc. form of Incentive Stock Option Agreement (incorporated herein by reference to Exhibit 10.2 to the Company's Current Report on Form 8-K filed with the SEC on October 31, 2006). | |
| 10.6 | (c)+ | EFJ, Inc. form of Non-Statutory Stock Option Agreement (incorporated herein by reference to Exhibit 10.3 to the Company's Current Report on Form 8-K filed with the SEC on October 31, 2006). | |
| 10.6 | (d)+ | 2005 Omnibus Incentive Compensation Plan's Restricted Shares Form of Notice of Award and Restricted Share Award Agreement (incorporated herein by reference to Exhibit 4.2 to the Company's Registration Statement on Form S-8 filed with the SEC on November 11, 2005, Commission file number 333-129717). | |
| 10.6 | (e)+ | EFJ, Inc. 2005 Omnibus Incentive Compensation Plan Restricted Stock Unit Agreement (incorporated herein by reference to Exhibit 10.1 to the Company's Current Report on Form 8-K filed with the SEC on October 26, 2007) | |
| 10.6 | (f)+ | Amendment to EFJ, Inc. 2005 Omnibus Incentive Compensation Plan (incorporated herein by reference to Exhibit 99.1 to the Company's Registration Statement on Form S-8 filed with the SEC on June 27, 2008, Commission file number 333-151999). | |
| 10.6 | (g)+ | Amendment to the EFJ, Inc. 2005 Omnibus Incentive Compensation Plan (incorporated herein by reference to Exhibit 10.1 to the Company's Quarterly Report on Form 10-Q filed with the SEC on August 6, 2009). | |
59
| Exhibit Number |
Description | ||
|---|---|---|---|
| 10.7 | + | Form of Adoption Agreement for Nonstandardized 401(k) Profit Sharing Plan (incorporated herein by reference to Exhibit 10.24 to the Registration Statement on Form S-1/A filed with the SEC on November 21, 1996, Commission file number 333-14351). | |
| 10.8 | + | Norwest Bank Nebraska, NA. Defined Contribution Master Plan and Trust Agreement (incorporated herein by reference to Exhibit 10.25 to the Registration Statement on Form S-1/A filed with the SEC on November 21, 1996, Commission file number 333-14351). | |
| 10.9 | + | Form of Indemnification Agreement (incorporated herein by reference to Exhibit 10.5 to the Registration Statement on Form S-1/A filed with the SEC on November 21, 1996, Commission file number 333-14351). | |
| 10.10 | (a) | License Agreement for APCO 25 Compliant Product between Motorola, Inc. and the Company dated as of August 2, 1994 (incorporated herein by reference to Exhibit 10.6 to the Registration Statement on Form S-1 filed with the SEC on October 18, 1996, Commission file number 333-14351). | |
| 10.10 | (b)* | License Agreement Amendment, dated as of June 28, 1996, to License Agreement for APCO Project 25 Compliant Product between Motorola, Inc. and the Company dated as of August 2, 1994 (incorporated herein by reference to Exhibit 10.7 to the Registration Statement on Form S-1/A filed with the SEC on January 2, 1997, Commission file number 333-14351). | |
| 10.11 | Master Agreement for Products and Services between E. F. Johnson Company and McDonald Technologies International, Inc. dated May 14, 2004 (incorporated herein by reference to Exhibit 10.16 to the Company's Annual Report on Form 10-K filed with the SEC on March 3, 2005). | ||
| 10.12 | Agreement between Transcrypt International, Inc. and Tran Electronics, Inc. dated December 2, 2004 (incorporated herein by reference to Exhibit 99.1 to the Company's Current Report on Form 8-K filed with the SEC on December 7, 2004). | ||
| 10.13 | (a)+ | Employment Agreement between the Company and Jana Ahlfinger Bell dated February 1, 2005 (incorporated herein by reference to Exhibit 99.2 to the Company's Current Report on Form 8-K filed with the SEC on March 18, 2005). | |
| 10.13 | (b)+ | Amendment to Employment Agreement between the Company and Jana Ahlfinger Bell dated as of December 4, 2008 (incorporated herein by reference to Exhibit 10.3 to the Company's Current Report on Form 8-K filed with the SEC on December 5, 2008). | |
| 10.14 | + | Consulting Agreement and Termination of Employment Agreement between the Company and John T. Connor dated February 23, 1999 (incorporated herein by reference to Exhibit 10.41 to the Company's Annual Report on Form 10-K filed with the SEC on March 30, 1999). | |
| 10.15 | (a)+ | Employment Agreement between the Company and Michael E. Jalbert dated October 15, 2002 (incorporated herein by reference to Exhibit 10.42 to the Company's Annual Report on Form 10-K filed with the SEC on March 5, 2003). | |
| 10.15 | (b)+ | Transcrypt International, Inc. Michael Jalbert 1999 Non-Qualified Stock Option Agreement (incorporated by reference to Exhibit 99.1 to the S-8 Registration Statement filed with the SEC on October 27, 2000, Commission file number 333-48836). | |
60
| Exhibit Number |
Description | ||
|---|---|---|---|
| 10.15 | (c)+ | Letter Agreement between the Company and Michael E. Jalbert dated October 14, 2008 (incorporated herein by reference to Exhibit 10.1 to the Company's Quarterly Report on Form 10-Q filed with the SEC on October 29, 2008). | |
| 10.15 | (d)+ | Amended and Restated Employment Agreement between the Company and Michael E. Jalbert dated as of November 1, 2008 (incorporated herein by reference to Exhibit 10.1 to the Company's Current Report on Form 8-K filed with the SEC on November 7, 2008). | |
| 10.16 | (a) | Revolving Line of Credit Loan Agreement and Security Agreement between the Company, E. F. Johnson Company and Bank of America, N.A., dated November 15, 2002 (incorporated herein by reference to Exhibit 10.48 to the Company's Annual Report on Form 10-K filed with the SEC on March 5, 2003). | |
| 10.16 | (b) | First Amendment to Revolving Line of Credit, Loan Agreement and Security Agreement by and among the Company, E. F. Johnson Company, Transcrypt International, Inc. and Bank of America, N.A., dated September 13, 2004 (incorporated herein by reference to Exhibit 99.1 to the Company's Current Report on Form 8-K filed with the SEC on November 5, 2004). | |
| 10.16 | (c) | Second Amendment to Revolving Line of Credit Loan Agreement and Security Agreement by and among the Company, E. F. Johnson Company, Transcrypt International, Inc., 3e Technologies International, Inc, and Bank of America, N.A., dated July 11, 2006 (incorporated herein by reference to Exhibit 10.2 to the Company's Current Report on Form 8-K filed on July 14, 2006). | |
| 10.16 | (d) | Term Note by and among the Company, E. F. Johnson Company, Transcrypt International, Inc., 3e Technologies International, Inc., and Bank of America, N.A., dated July 11, 2006 dated as of July 11, 2006 (incorporated herein by reference to Exhibit 10.3 to the Company's Current Report on Form 8-K filed with the SEC on July 14, 2006). | |
| 10.16 | (e) | Second Amendment to Revolving Note by and among the Company, E. F. Johnson Company, Transcrypt International, Inc., 3e Technologies International, Inc., and Bank of America, N.A., dated July 11, 2006 dated as of July 11, 2006 (incorporated herein by reference to Exhibit 10.4 to the Company's Current Report on Form 8-K filed with the SEC on July 14, 2006). | |
| 10.16 | (f) | Third Amendment to Revolving Line of Credit Loan Agreement, Term Loan Agreement and Security Agreement dated as of March 6, 2006 by and among the Company, E.F. Johnson Company, Transcrypt International, Inc., 3e Technologies International, Inc. and Bank of America, N.A. (incorporated herein by reference to Exhibit 10.1 to the Company's Current Report on Form 8-K filed with the SEC on March 7, 2007). | |
| 10.16 | (g) | Third Amendment to Revolving Note by and among the Company, E. F. Johnson Company, Transcrypt International, Inc., 3e Technologies International, Inc., and Bank of America, N.A., dated as of March 10, 2008, (incorporated herein by reference to Exhibit 10.2 to the Company's Current Report on Form 8-K filed with the SEC on April 9, 2008). | |
| 10.16 | (h) | Fourth Amendment to Revolving Line of Credit Loan Agreement, Term Loan Agreement and Security Agreement dated as of March 10, 2008 by and among the Company, E.F. Johnson Company, Transcrypt International, Inc., 3e Technologies International, Inc. and Bank of America, N.A. (incorporated herein by reference to Exhibit 10.2 to the Company's Current Report on Form 8-K filed with the SEC on March 13, 2008). | |
61
| Exhibit Number |
Description | ||
|---|---|---|---|
| 10.16 | (i) | First Amendment to Term Note by and among the Company, E.F. Johnson Company, Transcrypt International, Inc., 3e Technologies International, Inc. and Bank of America, N.A., dated as of March 10, 2008 (incorporated herein by reference to Exhibit 10.1 to the Company's Current Report on Form 8-K filed with the SEC on April 9, 2008). | |
| 10.16 | (j) | Fifth Amendment to Revolving Line of Credit Loan Agreement, Term Loan Agreement and Security Agreement dated as of March 13, 2009 by and among the Company, E.F. Johnson Company, Transcrypt International, Inc., 3e Technologies International, Inc. and Bank of America, N.A. (incorporated herein by reference to Exhibit 10.1 to the Company's Current Report on Form 8-K filed with the SEC on March 19, 2009). | |
| 10.16 | (k) | Fourth Amendment to Revolving Note by and among the Company, E. F. Johnson Company, Transcrypt International, Inc., 3e Technologies International, Inc., and Bank of America, N.A., dated as of March 13, 2009 (incorporated herein by reference to Exhibit 10.2 to the Company's Current Report on Form 8-K filed with the SEC on March 19, 2009). | |
| 10.16 | (l) | Second Amendment to Term Note by and among the Company, E.F. Johnson Company, Transcrypt International, Inc., 3e Technologies International, Inc. and Bank of America, N.A., dated as of March 13, 2009 (incorporated herein by reference to Exhibit 10.3 to the Company's Current Report on Form 8-K filed with the SEC on March 19, 2009). | |
| 10.16 | (m) | Sixth Amendment to Revolving Line of Credit Loan Agreement, Term Loan Agreement and Security Agreement dated as of March 1, 2010 by and among the Company, E.F. Johnson Company, 3e Technologies International, Inc. and Bank of America, N.A. (incorporated herein by reference to Exhibit 10.1 to the Company's Current Report on Form 8-K filed with the SEC on March 5, 2010). | |
| 10.16 | (n) | Fifth Amendment to Revolving Note by and among the Company, E. F. Johnson Company, 3e Technologies International, Inc., and Bank of America, N.A., dated as of March 1, 2010 (incorporated herein by reference to Exhibit 10.2 to the Company's Current Report on Form 8-K filed with the SEC on March 5, 2010). | |
| 10.16 | (o) | Third Amendment to Term Note by and among the Company, E.F. Johnson Company, 3e Technologies International, Inc. and Bank of America, N.A., dated as of March 1, 2010 (incorporated herein by reference to Exhibit 10.3 to the Company's Current Report on Form 8-K filed with the SEC on March 5, 2010). | |
| 10.17 | (a) | Lease Agreement between the Company and 1440 Corporate, L.P., dated March 31, 2006 (incorporated herein by reference to Exhibit 10.20 to the Company's Current Report on Form 8-K filed with the SEC on April, 6, 2006). | |
| 10.17 | (b) | Addendum I to Lease Agreement between the Company and 30 West 46 LLC d/b/a Goldhaber Las Colinas LLC, dated February 3, 2010 (incorporated herein by reference to Exhibit 10.1 to the Company's Current Report on Form 8-K filed with the SEC on February 17, 2010). | |
| 10.18 | (a)+ | Employment Offer Letter between Massoud Safavi and the Company dated November 15, 2007 (incorporated herein by reference to Exhibit 10.1 to the Company's Current Report on Form 8-K filed with the SEC on November 16, 2007). | |
| 10.18 | (b)+ | Employment Agreement between Massoud Safavi and the Company dated November 15, 2007 (incorporated herein by reference to Exhibit 10.2 to the Company's Current Report on Form 8-K filed with the SEC on November 16, 2007). | |
62
| Exhibit Number |
Description | ||
|---|---|---|---|
| 10.18 | (c)+ | Relocation Policy between Massoud Safavi and the Company dated November 15, 2007 (incorporated herein by reference to Exhibit 10.3 to the Company's Current Report on Form 8-K filed with the SEC on November 16, 2007). | |
| 10.18 | (d)+ | Amendment to Employment Agreement between Massoud Safavi and the Company dated December 4, 2008 (incorporated herein by reference to Exhibit 10.1 to the Company's Current Report on Form 8-K filed with the SEC on December 5, 2008). | |
| 10.18 | (e)+ | Relocation Policy between Massoud Safavi and the Company dated December 4, 2008 (incorporated herein by reference to Exhibit 10.2 to the Company's Current Report on Form 8-K filed with the SEC on December 5, 2008). | |
| 10.18 | (f)+ | Separation Agreement and Release between the Company and Massoud Safavi dated January 5, 2010 (incorporated herein by reference to Exhibit 10.1 to the Company's Current Report on Form 8-K filed with the SEC on January 11, 2010). | |
| 10.19 | Sublease Agreement between the Company and MANUGISTICS, INC., dated May 1, 2007 (incorporated herein by reference to Exhibit 10.26 to the Company's Annual Report on Form 10-K filed with the SEC on March 13, 2008). | ||
| 10.20 | (a)+ | Employment Agreement between Elaine Flud Rodriguez and the Company dated March 17, 2008 (incorporated herein by reference to Exhibit 10.1 to the Company's Current Report on Form 8-K filed with the SEC on March 18, 2008). | |
| 10.20 | (b)+ | Amendment to Employment Agreement between Elaine Flud Rodriguez and the Company dated as of December 4, 2008 (incorporated herein by reference to Exhibit 10.4 to the Company's Current Report on Form 8-K filed with the SEC on December 5, 2008). | |
| 10.21 | Settlement Agreement and Mutual Release between the Company and the Company Securityholders, by and through Chih-Hsiang Li as Stockholders' Agent, dated as of January 13, 2009 (incorporated herein by reference to Exhibit 10.1 to the Company's Current Report on Form 8-K filed with the SEC on January 20, 2009). | ||
| 11.1 | Statement re. Computation of Per Share Earnings. | ||
| 21 | Subsidiaries of the Registrant | ||
| 23.1 | Consent of Grant Thornton LLP. | ||
| 31.1 | Chief Executive Officer's Certification of Report on Form 10-K for Year Ended December 31, 2009. | ||
| 31.2 | Chief Financial Officer's Certification of Report on Form 10-K for Year Ended December 31, 2009. | ||
| 32.1 | Written Certification of Chief Executive Officer, dated March 31, 2009, pursuant to 18 U.S.C. § 1350. | ||
| 32.2 | Written Certification of Chief Financial Officer, dated March 31, 2009, pursuant to 18 U.S.C. § 1350. | ||
- D
- Except
as noted below, Form 8-K, 10-Q and 10-K have SEC file
number 000-21681
- *
- Confidential
treatment has previously been granted by the SEC as to a portion of this exhibit.
- +
- Management contract or compensatory plan or arrangement
63
Pursuant to the requirements of Section 13 or 15(d) of the Securities Exchange Act of 1934, the Registrant has duly caused this report to be signed on its behalf by the undersigned, thereunto duly authorized.
| EF JOHNSON TECHNOLOGIES, INC. | ||||
By: |
/s/ MICHAEL E. JALBERT Michael E. Jalbert Chairman of the Board of Directors and Chief Executive Officer (Principal Executive Officer) |
|||
Dated: March 31, 2010 |
||||
Pursuant to the requirements of the Securities Exchange Act of 1934, this report has been signed below by the following persons on behalf of the Registrant and in the capacities and on the dates indicated.
Name
|
Title
|
Date
|
||
|---|---|---|---|---|
| /s/ MICHAEL E. JALBERT Michael E. Jalbert |
Chairman of the Board of Directors, President and Chief Executive Officer (Principal Executive Officer) | March 31, 2010 | ||
/s/ JANA AHLFINGER BELL Jana Ahlfinger Bell |
Chief Financial Officer (Principal Financial and Accounting Officer) |
March 31, 2010 |
||
/s/ BERNARD C. BAILEY Bernard C. Bailey |
Director |
March 31, 2010 |
||
/s/ ROBERT L. BARNETT Robert L. Barnett |
Director |
March 31, 2010 |
||
/s/ EDWARD H. BERSOFF Edward H. Bersoff |
Director |
March 31, 2010 |
||
/s/ VERONICA A. HAGGART Veronica A. Haggart |
Director |
March 31, 2010 |
||
/s/ THOMAS R. THOMSEN Thomas R. Thomsen |
Director |
March 31, 2010 |
64
Management's Report on Financial Statements:
Our management is responsible for the preparations, integrity and fair presentation of information in our consolidated financial statements, including estimates and judgments. The consolidated financial statements presented in this report have been prepared in accordance with accounting principles generally accepted in the United States of America. Our management believes the consolidated financial statements and other financial information included in this report fairly present, in all material respects, our financial condition, results of operations and cash flows as of and for the periods presented in this report. The consolidated financial statements have been audited by Grant Thornton, LLP, an independent registered public accounting firm, as stated in their report, which is included herein.
Management's Report on Internal Control Over Financial Reporting:
Our management is responsible for establishing and maintaining an adequate system of internal control over financial reporting. Our system of internal control over financial reporting is designed to provide reasonable assurance regarding the reliability of financial reporting and the preparation of financial statements for external purposes in accordance with accounting principles generally accepted in the United States of America.
Our internal control over financial reporting includes those policies and procedures that:
- •
- Pertain to the maintenance of records that, in reasonable detail, accurately and fairly reflect our transactions and
dispositions of our assets;
- •
- Provide reasonable assurance that our transactions are recorded as necessary to permit preparation of our financial
statements in accordance with accounting principles generally accepted in the United States of America, and that our receipts and expenditures are being made only in accordance with authorizations of
our management and our directors; and
- •
- Provide reasonable assurance regarding prevention or timely detection of unauthorized acquisitions, use or disposition of our assets that could have a material effect on the financial statements.
Because of its inherent limitations, a system of internal control over financial reporting can provide only reasonable assurance and may not prevent or detect misstatements. Further, because of changes in conditions, effectiveness of internal controls over financial reporting may vary over time. Our system contains self monitoring mechanisms, and actions are taken to correct deficiencies as they are identified.
Our management conducted an evaluation of the effectiveness of the system of internal control over financial reporting based on the framework in Internal Control—Integrated Framework issued by the Committee of Sponsoring Organizations of the Treadway Commission. Based on this evaluation, our management concluded that our system of internal control over financial reporting was effective as of December 31, 2009.
Audit Committee Oversight:
The Audit Committee of the Board of Directors, which is comprised solely of independent directors, has oversight responsibility for our financial reporting process and the audits of our consolidated financial statements and internal control over financial reporting. The Audit Committee meets regularly with management and with our internal auditors and independent registered public accounting firm (collectively, the "auditors") to review matters related to the quality and integrity of our financial reporting, internal control over financial reporting (including compliance matters related
F-1
to our Code of Ethics and Business Conduct), and the nature, extent, and results of internal and external audits. Our auditors have full and free access and report directly to the Audit Committee. The Audit Committee recommended, and the Board of Directors approved, that the audited consolidated financial statements be included in this Annual Report on Form 10-K.
| /s/ MICHAEL E. JALBERT Michael E. Jalbert, Chief Executive Officer |
||
/s/ JANA AHLFINGER BELL Jana Ahlfinger Bell, Chief Financial Officer |
Irving,
Texas
March 31, 2010
F-2
REPORT OF INDEPENDENT REGISTERED PUBLIC ACCOUNTING FIRM
Board
of Directors and Stockholders
EF Johnson Technologies, Inc. and Subsidiaries
We have audited the accompanying consolidated balance sheets of EF Johnson Technologies, Inc. (a Delaware corporation) and subsidiaries (collectively, the "Company") as of December 31, 2009 and 2008, and the related consolidated statements of operations, changes in stockholders' equity, and cash flows for each of the three years in the period ended December 31, 2009. Our audits of the basic financial statements included the financial statement schedule listed in the index appearing under Item 15 (a) (2). These financial statements and the financial statement schedule are the responsibility of the Company's management. Our responsibility is to express an opinion on these financial statements and the financial statement schedule based on our audits.
We conducted our audits in accordance with the standards of the Public Company Accounting Oversight Board (United States). Those standards require that we plan and perform the audit to obtain reasonable assurance about whether the financial statements are free of material misstatement. The Company is not required to have, nor were we engaged to perform an audit of its internal control over financial reporting. Our audit included consideration of internal control over financial reporting as a basis for designing audit procedures that are appropriate in the circumstances, but not for the purpose of expressing an opinion on the effectiveness of the Company's internal control over financial reporting. Accordingly, we express no such opinion. An audit also includes examining, on a test basis, evidence supporting the amounts and disclosures in the financial statements, assessing the accounting principles used and significant estimates made by management, as well as evaluating the overall financial statement presentation. We believe that our audits provide a reasonable basis for our opinion.
In our opinion, the consolidated financial statements referred to above present fairly, in all material respects, the financial position of EF Johnson Technologies, Inc and subsidiaries as of December 31, 2009 and 2008, and the results of their operations and their cash flows for each of the three years in the period ended December 31, 2009 in conformity with accounting principles generally accepted in the United States of America. Also in our opinion, the related financial statement schedule, when considered in relation to the basic financial statements taken as a whole, presents fairly, in all material respects, the information set forth therein.
As discussed in Notes 1 and 3 to the consolidated financial statements, the Company retrospectively adopted new accounting guidance as of January 1, 2009 related to revenue recognition for arrangements with multiple deliverables.
The accompanying financial statements have been prepared assuming that the Company will continue as a going concern. As discussed in Note 2, the Company has incurred substantial net losses in each of the last three years and has a $15.0 million term loan due on June 30, 2010. These factors, among others, as discussed in Note 2 to the financial statements, raise substantial doubt about the Company's ability to continue as a going concern. Management's plans in regard to these matters are also described in Note 2. The financial statements do not include any adjustments that might result from the outcome of this uncertainty.
/s/ Grant Thornton LLP
Dallas,
Texas
March 31, 2010
F-3
EF JOHNSON TECHNOLOGIES, INC. AND SUBSIDIARIES
CONSOLIDATED BALANCE SHEETS
December 31, 2009 and 2008
(in thousands, except
share and per share data)
| |
2009 | 2008 | |||||||
|---|---|---|---|---|---|---|---|---|---|
Current assets: |
|||||||||
Cash and cash equivalents |
$ | 16,030 | $ | 11,267 | |||||
Restricted cash |
5,032 | — | |||||||
Accounts receivable, net of allowance for returns and doubtful accounts of $1,490 and $1,969, respectively |
7,477 | 18,234 | |||||||
Accounts receivable due from related parties |
— | 1,281 | |||||||
Receivables—other |
796 | 849 | |||||||
Cost in excess of billings on uncompleted contracts |
5,096 | 5,116 | |||||||
Inventories, net |
31,295 | 37,322 | |||||||
Prepaid expenses |
912 | 1,632 | |||||||
Total current assets |
66,638 | 75,701 | |||||||
Property, plant and equipment, net |
4,425 | 5,996 | |||||||
Restricted cash |
— | 2,021 | |||||||
Goodwill |
5,126 | 5,126 | |||||||
Other intangible assets, net of accumulated amortization |
7,778 | 8,770 | |||||||
Other assets |
178 | 73 | |||||||
TOTAL ASSETS |
$ | 84,145 | $ | 97,687 | |||||
LIABILITIES AND STOCKHOLDERS' EQUITY |
|||||||||
Current liabilities: |
|||||||||
Current portion of long-term debt obligations |
$ | 15,476 | $ | 9 | |||||
Accounts payable |
8,470 | 11,728 | |||||||
Accrued expenses |
7,754 | 10,786 | |||||||
Billings in excess of cost on uncompleted contracts |
3,610 | 217 | |||||||
Deferred revenues |
1,118 | 1,235 | |||||||
Total current liabilities |
36,428 | 23,975 | |||||||
Long-term debt obligations, net of current portion |
— | 15,006 | |||||||
Deferred income taxes |
631 | 631 | |||||||
Other liabilities |
715 | 1,106 | |||||||
TOTAL LIABILITIES |
37,774 | 40,718 | |||||||
Commitments and contingencies |
|||||||||
Stockholders' equity: |
|||||||||
Preferred stock ($0.01 par value; 3,000,000 shares authorized; none issued) |
— | — | |||||||
Common stock ($0.01 par value; 50,000,000 voting shares authorized, 26,477,611 and 26,336,735 issued and outstanding as of December 31, 2009 and December 31, 2008, respectively) |
264 | 262 | |||||||
Additional paid-in capital |
155,795 | 154,688 | |||||||
Accumulated other comprehensive loss |
(470 | ) | (1,088 | ) | |||||
Accumulated deficit |
(109,089 | ) | (96,861 | ) | |||||
Less: Treasury stock (118,989 and 18,083 shares at cost at December 31, 2009 and December 31, 2008, respectively) |
(129 | ) | (32 | ) | |||||
TOTAL STOCKHOLDERS' EQUITY |
46,371 | 56,969 | |||||||
TOTAL LIABILITIES AND STOCKHOLDERS' EQUITY |
$ | 84,145 | $ | 97,687 | |||||
See accompanying notes to the consolidated financial statements.
F-4
EF JOHNSON TECHNOLOGIES, INC. AND SUBSIDIARIES
CONSOLIDATED STATEMENTS OF OPERATIONS
Years Ended December 31, 2009, 2008 and 2007
(in thousands, except share and per share data)
| |
Year ended December 31, | |||||||||||
|---|---|---|---|---|---|---|---|---|---|---|---|---|
| |
2009 | 2008 | 2007 | |||||||||
Revenues |
$ | 92,341 | $ | 126,286 | $ | 154,610 | ||||||
Cost of sales |
64,425 | 83,560 | 113,606 | |||||||||
Gross profit |
27,916 | 42,726 | 41,004 | |||||||||
Operating expenses: |
||||||||||||
Research and development |
11,532 | 10,099 | 15,677 | |||||||||
Sales and marketing |
9,432 | 12,218 | 13,640 | |||||||||
General and administrative |
19,861 | 24,435 | 24,193 | |||||||||
Amortization of intangibles |
992 | 1,526 | 1,613 | |||||||||
Impairment of goodwill |
— | 14,914 | 5,475 | |||||||||
Escrow fund settlement |
(2,804 | ) | — | — | ||||||||
Total operating expenses |
39,013 | 63,192 | 60,598 | |||||||||
Loss from operations |
(11,097 | ) | (20,466 | ) | (19,594 | ) | ||||||
Interest income |
22 | 197 | 1,074 | |||||||||
Interest expense |
(1,394 | ) | (1,177 | ) | (1,108 | ) | ||||||
Other expense, net |
(5 | ) | (1 | ) | (1 | ) | ||||||
Loss before income taxes |
(12,474 | ) | (21,447 | ) | (19,629 | ) | ||||||
Income tax benefit (expense) |
246 | 574 | (21,470 | ) | ||||||||
Net loss |
$ | (12,228 | ) | $ | (20,873 | ) | $ | (41,099 | ) | |||
Net loss per share—Basic |
$ | (0.46 | ) | $ | (0.79 | ) | $ | (1.58 | ) | |||
Net loss per share—Diluted |
$ | (0.46 | ) | $ | (0.79 | ) | $ | (1.58 | ) | |||
Weighted average common shares—Basic and diluted |
26,386,388 | 26,261,062 | 26,039,246 | |||||||||
See accompanying notes to the consolidated financial statements.
F-5
EF JOHNSON TECHNOLOGIES, INC. AND SUBSIDIARIES
CONSOLIDATED STATEMENTS OF CHANGES IN STOCKHOLDERS' EQUITY
Years Ended December 31, 2009, 2008
and 2007,
(in thousands, except share and per share data)
| |
Common Stock Shares |
Par Value | Additional Paid-in Capital |
Accumulated Other Comprehensive Loss |
Accumulated Deficit |
Treasury Stock |
Total Stockholders' Equity |
|||||||||||||||||
|---|---|---|---|---|---|---|---|---|---|---|---|---|---|---|---|---|---|---|---|---|---|---|---|---|
Balances, December 31, 2006 |
26,179,707 | $ | 262 | $ | 151,665 | $ | (332 | ) | $ | (34,889 | ) | $ | — | $ | 116,706 | |||||||||
Comprehensive loss: |
||||||||||||||||||||||||
Net loss |
— | — | — | — | (41,099 | ) | — | (41,099 | ) | |||||||||||||||
Fair value adjustments for interest rate swap |
— | — | — | (378 | ) | — | — | (378 | ) | |||||||||||||||
Total comprehensive loss |
(41,477 | ) | ||||||||||||||||||||||
Expense related to restricted stock awards |
— | — | 24 | — | — | — | 24 | |||||||||||||||||
Expense related to restricted stock units |
— | — | 8 | — | — | — | 8 | |||||||||||||||||
Expense related to option awards |
— | — | 1,553 | — | — | — | 1,553 | |||||||||||||||||
Expense related to satisfied stock appreciation rights |
— | — | 23 | — | — | — | 23 | |||||||||||||||||
Issuance of stock to directors in lieu of cash compensation |
4,405 | — | 25 | — | — | — | 25 | |||||||||||||||||
Issuance of equity awards |
26,120 | — | 58 | — | — | — | 58 | |||||||||||||||||
Balances, December 31, 2007 |
26,210,232 | 262 | 153,356 | (710 | ) | (75,988 | ) | — | 76,920 | |||||||||||||||
Comprehensive loss: |
||||||||||||||||||||||||
Net loss |
— | — | — | — | (20,873 | ) | — | (20,873 | ) | |||||||||||||||
Fair value adjustments for interest rate swap |
— | — | — | (378 | ) | — | — | (378 | ) | |||||||||||||||
Total comprehensive loss |
(21,251 | ) | ||||||||||||||||||||||
Expense related to restricted stock awards |
— | — | 538 | — | — | — | 538 | |||||||||||||||||
Expense related to restricted stock units |
— | — | 135 | — | — | — | 135 | |||||||||||||||||
Expense related to option awards |
— | — | 557 | — | — | — | 557 | |||||||||||||||||
Expense related to satisfied stock appreciation rights |
— | — | 19 | — | — | — | 19 | |||||||||||||||||
Issuance of stock to directors in lieu of cash compensation |
44,249 | — | 65 | — | — | — | 65 | |||||||||||||||||
Issuance of equity awards |
100,337 | — | 18 | — | — | — | 18 | |||||||||||||||||
Treasury stock |
(18,083 | ) | — | — | — | — | (32 | ) | (32 | ) | ||||||||||||||
Balances, December 31, 2008 |
26,336,735 | 262 | 154,688 | (1,088 | ) | (96,861 | ) | (32 | ) | 56,969 | ||||||||||||||
Comprehensive loss: |
||||||||||||||||||||||||
Net loss |
— | — | — | — | (12,228 | ) | — | (12,228 | ) | |||||||||||||||
Fair value adjustments for interest rate swap |
— | — | — | 618 | — | — | 618 | |||||||||||||||||
Total comprehensive loss |
(11,610 | ) | ||||||||||||||||||||||
Expense related to restricted stock awards |
— | — | 43 | — | — | — | 43 | |||||||||||||||||
Expense related to restricted stock units |
— | — | 151 | — | — | — | 151 | |||||||||||||||||
Expense of stock equity awards |
154,589 | 2 | 160 | — | — | — | 162 | |||||||||||||||||
Expense related to option awards |
— | — | 573 | — | — | — | 573 | |||||||||||||||||
Expense related to satisfied stock appreciation rights |
— | — | 130 | — | — | — | 130 | |||||||||||||||||
Issuance of stock to directors in lieu of cash compensation |
53,129 | — | 50 | — | — | — | 50 | |||||||||||||||||
Issuance of equity awards |
34,064 | — | — | — | — | — | 162 | |||||||||||||||||
Treasury stock |
(100,906 | ) | — | — | — | — | (97 | ) | (97 | ) | ||||||||||||||
Balances, December 31, 2009 |
26,477,611 | $ | 264 | $ | 155,795 | $ | (470 | ) | $ | (109,089 | ) | $ | (129 | ) | $ | 46,371 | ||||||||
See accompanying notes to the consolidated financial statements.
F-6
EF JOHNSON TECHNOLOGIES, INC. AND SUBSIDIARIES
CONSOLIDATED STATEMENTS OF CASH FLOWS
Years Ended December 31, 2009, 2008, and 2007
(in thousands, except share data)
| |
2009 | 2008 | 2007 | |||||||||||
|---|---|---|---|---|---|---|---|---|---|---|---|---|---|---|
Cash flows from operating activities: |
||||||||||||||
Net loss |
$ | (12,228 | ) | $ | (20,873 | ) | $ | (41,099 | ) | |||||
Adjustments to reconcile net loss to net cash (used in) provided by operating activities: |
||||||||||||||
Provision (used) provided for returns and doubtful accounts |
(479 | ) | 333 | 848 | ||||||||||
Impairment of goodwill |
— | 14,914 | 5,475 | |||||||||||
Impairment of other intangible assets |
— | 3,525 | 300 | |||||||||||
Depreciation and amortization |
3,744 | 4,548 | 4,440 | |||||||||||
Recognition of deferred gain |
(95 | ) | (95 | ) | (95 | ) | ||||||||
Deferred taxes |
— | (858 | ) | 21,418 | ||||||||||
Stock-based compensation |
1,057 | 1,249 | 1,633 | |||||||||||
Changes in operating assets and liabilities (net of acquisition): |
||||||||||||||
Accounts receivable |
11,236 | 2,230 | 192 | |||||||||||
Accounts receivable from related parties |
1,281 | (733 | ) | 1,043 | ||||||||||
Receivables—other |
53 | 2,649 | 5,174 | |||||||||||
Cost in excess of billings on uncompleted contracts |
20 | (1,841 | ) | 665 | ||||||||||
Inventories |
6,027 | (3,451 | ) | (9,460 | ) | |||||||||
Prepaid expenses and other |
720 | (523 | ) | 208 | ||||||||||
Accounts payable |
(3,258 | ) | (1,683 | ) | 2,314 | |||||||||
Accrued expenses and other liabilities |
(2,937 | ) | (351 | ) | 3,216 | |||||||||
Billings in excess of cost on uncompleted contracts |
3,393 | (4 | ) | (206 | ) | |||||||||
Deferred revenues |
581 | 216 | 152 | |||||||||||
Total adjustments |
21,343 | 20,125 | 37,317 | |||||||||||
Net cash (used in) provided by operating activities |
9,115 | (748 | ) | (3,782 | ) | |||||||||
Cash flows from investing activities: |
||||||||||||||
Increase in restricted cash related to collateralized bond |
— | (2,021 | ) | — | ||||||||||
Purchase of property, plant and equipment |
(1,181 | ) | (1,922 | ) | (3,183 | ) | ||||||||
Purchase of intangibles |
— | — | (94 | ) | ||||||||||
Other assets |
(105 | ) | 279 | (266 | ) | |||||||||
Net cash used in investing activities |
(1,286 | ) | (3,664 | ) | (3,543 | ) | ||||||||
Cash flows from financing activities: |
||||||||||||||
Proceeds on revolving lines of credits |
— | 15,400 | — | |||||||||||
Principal payments on revolving lines of credits |
— | (15,400 | ) | — | ||||||||||
Increase in restricted cash related to term loan |
(3,011 | ) | — | — | ||||||||||
Proceeds from capitalized lease |
— | — | 25 | |||||||||||
Principal payments on long-term debt |
(8 | ) | (8 | ) | (7 | ) | ||||||||
Proceeds from issuances of common stock |
50 | 65 | — | |||||||||||
Purchase of treasury stock |
(97 | ) | (32 | ) | — | |||||||||
Proceeds from exercise of stock options |
— | 18 | 58 | |||||||||||
Net cash (used in) provided by financing activities |
(3,066 | ) | 43 | 77 | ||||||||||
Net increase in cash and cash equivalents |
4,763 | (4,369 | ) | (7,249 | ) | |||||||||
Cash and cash equivalents, beginning of period |
11,267 | 15,636 | 22,885 | |||||||||||
Cash and cash equivalents, end of period |
$ | 16,030 | $ | 11,267 | $ | 15,636 | ||||||||
Supplemental Disclosure of Cash Flow Information: |
||||||||||||||
We paid interest of $1,393, $1,223 and $1,088 during the years 2009, 2008 and 2007, respectively. |
||||||||||||||
We paid income taxes of $97, $243 and $171 during the years 2009, 2008 and 2007, respectively. |
||||||||||||||
See accompanying notes to the consolidated financial statements.
F-7
EF JOHNSON TECHNOLOGIES, INC. AND SUBSIDIARIES
NOTES TO CONSOLIDATED FINANCIAL STATEMENTS
(in thousands, except per share and per share date)
1. Significant Accounting Policies:
The following is a summary of significant accounting policies followed in the preparation of these consolidated financial statements.
Organization
We are a provider of secure wireless communications solutions that are sold to: (1) domestic and foreign public safety / public service entities, (2) federal, state and local governmental agencies, including the Departments of Homeland Security and Defense, and (3) domestic and foreign commercial customers. We design, develop, market, and support:
- •
- mobile and portable wireless radios;
- •
- stationary transmitters / receivers (base stations or repeaters);
- •
- infrastructure equipment and systems;
- •
- secure encryption technologies for proprietary wireless radios;
- •
- customized wireless network centric products and systems to the federal government primarily under government funded Small
Business Innovative Research (SBIR) programs; and
- •
- niche hardware and secure software technologies for the WLAN markets primarily in the government and industrial controls sectors.
Our products are marketed under the "EFJohnson," "3eTI" and "Transcrypt" brandnames.
Principles of Consolidation
The consolidated financial statements include the accounts of EF Johnson Technologies, Inc. and our wholly-owned subsidiaries. All inter-company accounts and transactions have been eliminated in the consolidation.
Retrospective Adoption of New Accounting Guidance
In September 2009, the Financial Accounting Standards Board ("FASB") amended the accounting standards related to revenue recognition for arrangements with multiple deliverables ("new accounting guidance"). The new accounting guidance permits prospective or retrospective adoption, and the Company elected to retrospectively adopt as of January 1, 2009 during the fourth quarter of 2009.
Prior to 2009, the Company has not provided a significant number of optional extended warranties; and therefore, the Company determined that the deferral of revenue associated with optional extended warranties was insignificant in prior years.
The new accounting guidance generally requires the Company to account for the sale of products and optional extended warranties as separate deliverables. The first deliverable is the hardware recognized at the time of delivery, and the second deliverable is the optional extended warranty recognized ratably over the period benefited. The new accounting guidance requires the Company to estimate a stand-alone selling price for the optional extended warranty, defer that amount as deferred revenue and recognize the revenue ratably over the period benefited.
F-8
EF JOHNSON TECHNOLOGIES, INC. AND SUBSIDIARIES
NOTES TO CONSOLIDATED FINANCIAL STATEMENTS (Continued)
(in thousands, except per share and per share date)
1. Significant Accounting Policies: (Continued)
The Company had the option of adopting the new accounting guidance at the start of the fiscal year on a prospective basis or at an interim period on a retrospective basis and elected retrospective adoption. Retrospective adoption required the Company to revise its previously issued 2009 quarterly interim financial statements as if the new accounting guidance had been applied from the beginning of the fiscal year.
Refer to Footnote 3, "Retrospective Adoption of New Accounting Guidance" for additional information on the impact of adoption.
Cash and Cash Equivalents
All highly-liquid investments with original maturities less than 90 days are considered cash equivalents. We place our temporary cash investments with high-credit financial institutions. Such investments balances may at times exceed FDIC insured limits and are carried at cost, which approximates fair value.
Restricted Cash
Restricted cash consists of cash pledged as collateral for the remaining term of the Loan Agreement of $3.0 million effective March 16, 2009 and for the Government of Yukon, Canada bond established in July 2008 for $2.0 million.
Revenue Recognition
If collection is reasonably assured, and no significant future obligations or contingencies associated with the sale exist, revenues for product sales are recognized when delivery occurs, less an estimate for an allowance for returns. For shipments where collection is not reasonably assured, we recognize revenue as cash is received. If collection is contingent on a future contractual event, we recognize revenue when the contingency lapses, generally upon cash collection. Our sales typically do not provide the customer with a general right of return except as provided under our warranties.
System sales under long-term contracts are accounted for using the percentage-of-completion method. Under this method, revenues are recognized as work on a contract progresses. The revenue recognized in each period is the pro rata portion of costs incurred over estimated costs to complete the contract. Revisions in cost and profit estimates are made when conditions requiring such revisions become known. Anticipated losses on contracts are recognized as soon as such losses are determined to be probable and reasonably estimable. Government funded services revenues from cost plus contracts are recognized as costs are incurred on the basis of direct costs plus allowable indirect costs and an allocable portion of the fixed fee. Revenues from fixed-type contracts are recognized under the percentage of completion method with estimated costs and profits included in contract revenue as work is performed. Revenues from time and materials contracts are recognized as costs are incurred at amounts represented by the agreed billing amounts.
Deferred revenues include unearned fees on systems maintenance contracts and optional extended warranties sold to customers. We recognize the fees ratably over the life of the contract or extended warranty period, generally on a straight-line basis.
F-9
EF JOHNSON TECHNOLOGIES, INC. AND SUBSIDIARIES
NOTES TO CONSOLIDATED FINANCIAL STATEMENTS (Continued)
(in thousands, except per share and per share date)
1. Significant Accounting Policies: (Continued)
We periodically review our revenue recognition procedures to assure that such procedures are in accordance with the provisions of SEC Staff Accounting Bulletins 101 and 104 and FASB authoritative guidance relating to revenue recognition, as applicable. In addition, while most of our current products contain software, we believe the software is incidental in the overall context of our product's features and functionality, therefore, at present we do not use revenue recognition authoritative guidance applicable to software sales.
For multi-element arrangements that include products and contain optional extended warranties, the Company allocates revenue to all deliverables based on their relative selling prices. In such circumstances, the new accounting guidance establishes a hierarchy to determine the selling price to be used for allocating revenue to deliverables as follows: (i) vendor-specific objective evidence of fair value ("VSOE"), (ii) third-party evidence of selling price ("TPE"), and (iii) best estimate of the selling price ("ESP") in the absence of VSOE and TPE. VSOE generally exists when the Company sells the deliverable separately at prices regularly charged by the Company for that deliverable on a stand-alone basis. TPE generally exists when the Company has access to and can quantify competitor pricing of similar product offerings on a stand-alone basis. ESP is management's best estimate of selling price on a stand-alone basis, considering market conditions and entity-specific factors.
The Company has allocated revenue between the multiple deliverables using the relative selling price method. The Company has determined that due to significant variation and ranges of actual selling prices, the existence of VSOE could not be established. Furthermore, the Land Mobile Radio industry does not publish standard pricing and invoiced amounts by product offerings; therefore, the Company could not establish TPE. Because the Company has neither VSOE nor TPE for the multiple deliverables, the allocation of revenue is based on the Company's ESPs. The revenue relating to hardware is recognized at time of delivery, while the optional extended warranty is deferred and recognized ratably over the period benefited. All hardware cost of sales, including standard estimated warranty costs, are generally recognized upon delivery of the hardware.
The Company's process for determining its ESP considers multiple factors. Such factors may vary depending upon the unique facts and circumstances related to each deliverable. Key factors considered by the Company in developing the ESPs for products and optional extended warranties include: prices charged by the Company for unbundled product sales, the Company's historical pricing practices, the current market for the product and the nature of the optional extended warranty.
Receivables
Accounts receivable are presented in the balance sheet at net realizable value, which equals the gross receivable value less allowance for bad debts and estimated returns and allowances. Accounts outstanding longer than the contractual payment terms are considered past due. Such allowances are based upon our estimate of non-collectibility due to customer factors such as payment history and customer classification as well as our estimate of product returns based on historical trends. We continually monitor our customers collection status and product return trends and adjust our allowances accordingly. The Company writes off specific accounts receivable when they become uncollectible, and payments subsequently received on such receivables are credited to the allowance for doubtful accounts.
F-10
EF JOHNSON TECHNOLOGIES, INC. AND SUBSIDIARIES
NOTES TO CONSOLIDATED FINANCIAL STATEMENTS (Continued)
(in thousands, except per share and per share date)
1. Significant Accounting Policies: (Continued)
Our policy does not require significant collateral or other security to support the substantial portion of its receivables. However, we typically request prepayment or letters of credit on certain foreign sales that carry higher than normal collection risk characteristics.
Other receivables are primarily attributable to credits due from the outsourced manufacturers as a result of inventories purchased or transferred for production.
Inventories
Inventories are recorded at the lower of cost or market with cost based on a standard cost method that approximates the first-in first-out costing method. We periodically assess our inventories for potential obsolescence and lower-of-cost-or-market issues. We make estimates of inventory obsolescence, providing reserves when necessary, and adjust inventory balances accordingly. We consider, among other factors, demand for inventories based on backlog, product pricing, the ability to liquidate or sell older inventories, and the impact of introducing new products, and compliance with laws and regulations, including the Restriction of Hazardous Substances Directive ("RoHS"). We continually monitor inventory procurement, usage and product sales trends and adjust the carrying value of inventory accordingly..
Inventories comprised of components and parts on hand to support maintenance of products previously sold, or service inventories, are anticipated to be utilized over extended periods of time. Service inventories are carried at the lower of cost or market.
Property, Plant and Equipment
Property, plant and equipment are recorded at cost. Our policy is to capitalize expenditures for major improvements and to charge to operating expenses the cost of maintenance and repairs. Depreciation is computed on the straight-line method over the estimated useful lives of the assets as follows: buildings—fifteen to thirty years; leasehold improvements—the lesser of the term of the lease or fifteen years; equipment and furniture and fixtures—two to seven years; computer applications (software)—one to three years. The cost and related accumulated depreciation of assets retired or otherwise disposed of are eliminated from the respective accounts at the time of disposition. Any resulting gain or loss is included in current operating results.
Long-Lived Asset Impairment
We account for the impairment of long-lived assets in accordance FASB authoritative guidance relating to accounting for the impairment or disposal of long-lived assets. An impairment of long-lived assets exists when the carrying value of an asset exceeds its fair value and when the carrying value is not recoverable through future undiscounted cash flows from operations. We review the carrying value of long-lived assets for impairment when events or changes in circumstances indicate that the carrying amount of assets may not be recoverable.
Intangible Assets
Goodwill represents the excess of purchase price over fair value of identifiable net tangible and identifiable intangible assets acquired. Other indefinite lived intangible assets consist of trademark,
F-11
EF JOHNSON TECHNOLOGIES, INC. AND SUBSIDIARIES
NOTES TO CONSOLIDATED FINANCIAL STATEMENTS (Continued)
(in thousands, except per share and per share date)
1. Significant Accounting Policies: (Continued)
tradenames, and certifications that are not subject to amortization. We assess the recoverability of goodwill and other indefinite-lived intangible assets by performing a fair value impairment test of the respective reporting unit, at least annually and if a triggering event were to occur in an interim period. If the respective carrying amount of the asset exceeds the fair value, goodwill or other indefinite-lived intangible assets are considered to be impaired and written down to its estimated net realizable value. In evaluating impairment, we estimate the sum of the expected future cash flows derived from such reporting unit and present value implied by estimates of future revenues, costs and expenses and other factors. The estimates use assumptions about our market segment share in the future and about future expenditures by government entities for secure wireless communications products. We continually evaluate whether events and circumstances have occurred that indicate the remaining balance of goodwill or other indefinite-lived intangible assets may not be recoverable. To the extent our assumptions change, we may be required to adjust the carrying value of the goodwill or other indefinite-lived intangible assets. Additionally, specifically identifiable intangible assets with identifiable fixed lives, consisting of existing technology, customer relationships, license and covenants not-to-compete, are amortized over their useful life on a straight-line basis.
Derivatives
In connection with our term loan, we have entered into an interest rate swap agreement, which is reported as a derivative financial instrument at fair value in the consolidated financial statements. Changes in the fair value of the derivative are included each period in accumulated other comprehensive loss in the consolidated financial statements if the derivative is designated as effectively hedged. Any ineffective portion is recognized currently into earnings. We enter into derivative transactions to manage our exposure to fluctuations in interest rates, and to decrease volatility of earnings and cash flows associated with changes in variable interest rates underlying our term loan. We do not enter into derivative transactions for speculative or trading purposes.
The cash flows of the interest rate swap are expected to be highly effective in offsetting cash flows attributable to fluctuations in the cash flows of the floating rate term loan. If it becomes probable that a forecasted transaction will no longer occur, the interest rate swap will continue to be carried in other liabilities on the balance sheet at fair value, and gains or losses that were deferred in accumulated other comprehensive loss will be recognized immediately into earnings. If the interest rate swap agreement is terminated prior to its expiration date, any cumulative gains and losses will be deferred and recognized into earnings over the remaining life of the underlying exposure.
We use the cumulative approach to assess effectiveness of this cash flow hedge. The measurement of hedge ineffectiveness is based on the cumulative dollar offset method. To date, the interest rate swap has been highly effective in achieving offsetting cash flows attributable to the fluctuations in the cash flows of the hedged risk, and no amount has been required to be reclassified from accumulated other comprehensive loss into earnings for hedge ineffectiveness.
Warranty Costs
We generally provide a one to three year warranty on our products. We estimate future warranty claims based on historical experience and anticipated costs to be incurred. Warranty expense is accrued
F-12
EF JOHNSON TECHNOLOGIES, INC. AND SUBSIDIARIES
NOTES TO CONSOLIDATED FINANCIAL STATEMENTS (Continued)
(in thousands, except per share and per share date)
1. Significant Accounting Policies: (Continued)
at the time of sale with an additional accrual for specific items after the sale when their existence is known and amounts are determinable.
Research and Development Costs
Research and development ("R&D") costs are expensed as incurred. Equipment purchased with alternative future benefit in R&D activities is capitalized and resulting depreciation is recorded as R&D expense. Additionally, R&D costs include employee salaries directly related to R&D efforts and all other costs directly allocable to R&D efforts, including equipment for which there is no alternative use. R&D costs are presented separately as an operating expense in our consolidated statements of operations. Certain legal costs incurred in securing patents may be capitalized.
Income Taxes
Deferred tax assets and liabilities are recognized for the future tax consequences attributable to differences between the financial statement carrying amounts of existing assets and liabilities and their respective tax bases and operating loss and tax credit carryforwards. We recognize the financial statement benefit of a tax position after determining that the relevant tax authority would more likely than not sustain the position following an audit. For tax positions meeting the more-likely-than not threshold, the amount recognized in the financial statements is the largest benefit that has a greater than fifty percent likelihood of being realized upon the ultimate settlement with the relevant tax authority. Deferred income tax assets and liabilities are measured using enacted tax rates expected to apply to taxable income in the years in which those temporary differences are expected to be recovered or settled. We periodically evaluate the deferred tax asset and assess the need for a valuation allowance based upon our estimate of the recoverability of the future tax benefits associated with the deferred tax asset.
Loss Per Share
Basic net loss per share is calculated based upon the weighted average number of common shares outstanding during the period. Outstanding options at December 31, 2009, 2008 and 2007, to purchase 1,272,460, 1,064,815, and 1,295,222 shares of common stock, with weighted average exercise prices of $4.93, $6.23, and $6.93 were used in the computation of common share equivalents for 2009, 2008 and 2007, respectively.
At December 31, 2009, 1,238,880 of the 1,272,460, and at December 31, 2008, 1,030,415 of the 1,064,815 and at December 31, 2007, 1,143,560 of the 1,295,222, outstanding options were excluded from the computation of weighted average shares outstanding because their exercise prices were above the annual average trading price of our common stock.
Although we have disclosed both basic and dilutive weighted average common shares, only basic weighted average shares were used to compute earnings per share in years in which there is a net loss.
F-13
EF JOHNSON TECHNOLOGIES, INC. AND SUBSIDIARIES
NOTES TO CONSOLIDATED FINANCIAL STATEMENTS (Continued)
(in thousands, except per share and per share date)
1. Significant Accounting Policies: (Continued)
Interest Income
Interest income is recognized as earned on cash, cash equivalents and notes receivable.
Recently Issued Accounting Standards
In December 2007, the FASB revised authoritative guidance for business combinations, which establishes principles and requirements for how an acquirer recognizes and measures in its financial statements the identifiable assets acquired, the liabilities assumed, any noncontrolling interest in the acquiree and the goodwill acquired. The guidance also establishes disclosure requirements which will enable users to evaluate the nature and financial effects of the business combination. The guidance is to be applied prospectively to business combinations for which the acquisition date is on or after an entity's fiscal year that begins after December 15, 2008. The impact of our adoption of this guidance will depend upon the nature and terms of business combinations, if any, that we consummate on or after January 1, 2009.
In December 2007, the FASB revised authoritative guidance for consolidations, which establishes accounting and reporting standards for ownership interests in subsidiaries held by parties other than the parent, the amount of consolidated net income attributable to the parent and to the noncontrolling interest, changes in a parent's ownership interest and the valuation of retained noncontrolling equity investments when a subsidiary is deconsolidated. The guidance also establishes reporting requirements that provide sufficient disclosures that clearly identify and distinguish between the interests of the parent and the interests of the noncontrolling owners. The adoption of this guidance currently has no impact on our consolidated financial statements.
In March 2008, the FASB revised authoritative guidance for disclosures of derivative instruments and hedging activities, which requires additional disclosures about the objectives of using derivative instruments, the method by which the derivative instruments and related hedged items are accounted for and the effect of derivative instruments and related hedged items on financial position, financial performance, and cash flows. The guidance also requires disclosure of the fair values of derivative instruments and their gains and losses in a tabular format. The Company adopted this guidance effective January 1, 2009. The adoption of this guidance had no material impact on our consolidated financial statements.
In April 2008, the FASB revised authoritative guidance for determining the useful life of intangible assets, which revises the factors that should be considered in developing renewal or extension assumptions used to determine the useful life of a recognized intangible asset. The Company will be required to adopt this guidance with respect to intangible assets acquired on or after January 1, 2009. Due to the prospective application requirement, the adoption of this guidance had no impact on our consolidated financial statements.
In November 2008, the FASB revised authoritative guidance for accounting for defensive intangible assets, which addresses the accounting for assets acquired in a business combination or asset acquisition that an entity does not intend to actively use, otherwise referred to as a 'defensive asset'. The guidance requires defensive intangible assets to be initially accounted for as a separate unit of accounting and not included as part of the cost of the acquirer's existing intangible asset(s) because it is separately identifiable. The guidance also requires that defensive intangible assets be assigned a separate useful
F-14
EF JOHNSON TECHNOLOGIES, INC. AND SUBSIDIARIES
NOTES TO CONSOLIDATED FINANCIAL STATEMENTS (Continued)
(in thousands, except per share and per share date)
1. Significant Accounting Policies: (Continued)
life. Due to the prospective application requirement, the adoption of this guidance had no impact on our consolidated financial statements.
In April 2009, the FASB revised authoritative guidance for determining fair value when the volume and level of activity for the asset or liability have significantly decreased and identifying transactions that are not orderly. The guidance emphasizes that even if there has been a significant decrease in the volume and level of activity for the asset or liability and regardless of the valuation technique(s) used, the objective of a fair value measurement remains the same. Fair value is the price that would be received to sell an asset or paid to transfer a liability in an orderly transaction (that is, not a forced liquidation or distressed sale) between market participants at the measurement date under current market conditions. The guidance is effective for interim and annual reporting periods ending after June 15, 2009, and is applied prospectively. The Company's adoption of this guidance did not have a material impact on its consolidated financial statements.
In April 2009, the FASB revised authoritative guidance for disclosures of financial instruments. The guidance requires disclosures about fair value of financial instruments for interim reporting periods of publicly traded companies as well as in annual financial statements. The guidance is effective for interim and annual reporting periods ending after June 15, 2009. The Company's adoption of this guidance did not have a material impact on its consolidated financial statements.
In May 2009, as amended in February 2010, the FASB revised authoritative guidance for subsequent events, which establishes general standards of accounting for and disclosures of events that occur after the balance sheet date but before financial statements are issued or are available to be issued. It requires the evaluation of subsequent events through the date the Company's financial statements are issued. The guidance was effective for interim or annual financial periods ending after June 15, 2009. The Company adopted this guidance.
In June 2009, the FASB issued new authoritative guidance for the hierarchy of accounting standards, which establishes the FASB Accounting Standards Codification ™ ("Codification") as the source of authoritative U.S. GAAP recognized by the FASB to be applied by nongovernmental entities. Rules and interpretive releases of the SEC under authority of federal securities laws are also sources of authoritative GAAP for SEC registrants. On the effective date of the guidance, the Codification superseded all then-existing non-SEC accounting and reporting standards. All other nongrandfathered non-SEC accounting literature not included in the Codification became nonauthoritative. This guidance is effective for financial statements issued for interim and annual periods ending after September 15, 2009. The adoption of this guidance did not have a material impact on our consolidated financial statements.
In October 2009, the FASB issued Accounting Standards Update ("Update") No. 2009-13, which amends the Revenue Recognition topic of the Codification. This update provides amendments to the criteria in Subtopic 605-25 of the Codification for separating consideration in multiple-deliverable arrangements. As a result of those amendments, multiple-deliverable arrangements will be separated in more circumstances than under existing U.S. GAAP. The amendments establish a selling price hierarchy for determining the selling price of a deliverable and will replace the term fair value in the revenue allocation guidance with selling price to clarify that the allocation of revenue is based on entity-specific assumptions rather than assumptions of a marketplace participant. The amendments will also eliminate
F-15
EF JOHNSON TECHNOLOGIES, INC. AND SUBSIDIARIES
NOTES TO CONSOLIDATED FINANCIAL STATEMENTS (Continued)
(in thousands, except per share and per share date)
1. Significant Accounting Policies: (Continued)
the residual method of allocation and require that arrangement consideration be allocated at the inception of the arrangement to all deliverables using the relative selling price method and will require that a vendor determine its best estimate of selling price in a manner that is consistent with that used to determine the price to sell the deliverable on a standalone basis. These amendments will be effective prospectively for revenue arrangements entered into or materially modified in fiscal years beginning on or after June 15, 2010, with early adoption permitted. We adopted the amended Revenue Recognition guidelines during the fourth quarter of 2009 as more fully disclosed in footnotes 3 in our consolidated financial statements.
In October 2009, the FASB issued Update No. 2009-14, which amends the Software topic of the Codification. The amendments in this update change the accounting model for revenue arrangements that include both tangible products and software elements. Tangible products containing software components and nonsoftware components that function together to deliver the tangible product's essential functionality are no longer within the scope of the software revenue guidance in Subtopic 605-985 of the Codification. In addition, the amendments in this update require that hardware components of a tangible product containing software components always be excluded from the software revenue guidance. In that regard, the amendments provide additional guidance on how to determine which software, if any, relating to the tangible product also would be excluded from the scope of the software revenue guidance. The amendments also provide guidance on how a vendor should allocate arrangement consideration to deliverables in an arrangement that includes both tangible products and software. The amendments also provide further guidance on how to allocate arrangement consideration when an arrangement includes deliverables both included and excluded from the scope of the software revenue guidance. These amendments will be effective prospectively for revenue arrangements entered into or materially modified in fiscal years beginning on or after June 15, 2010, with early adoption permitted. We adopted the amended Software guidelines during the fourth quarter of 2009. The adoption of this guidance did not have an impact on our consolidated financial statements.
In January 2010, the FASB issued FASB ASU 2010-06, Improving Disclosures About Fair Value Measurements, which amends FASB ASC 820. The updated guidance requires new disclosures about recurring or nonrecurring fair-value measurements including significant transfers into and out of Level 1 and Level 2 fair-value measurements and information on purchases, sales, issuances, and settlements on a gross basis in the reconciliation of Level 3 fair-value measurements. The guidance also clarified existing fair-value measurement disclosure guidance about the level of disaggregation, inputs, and valuation techniques. The guidance became effective for interim and annual reporting periods beginning on or after December 15, 2009, with an exception for the disclosures of purchases, sales, issuances and settlements on the roll-forward of activity in Level 3 fair value measurements. Those disclosures will be effective for fiscal years beginning after December 15, 2010 and for interim periods within those fiscal years. Upon adopting the guidance, there was no material impact on the Company's consolidated financial statements.
Management Estimates
The preparation of financial statements in conformity with accounting principles generally accepted in the United States of America requires us to make certain estimates and assumptions that affect
F-16
EF JOHNSON TECHNOLOGIES, INC. AND SUBSIDIARIES
NOTES TO CONSOLIDATED FINANCIAL STATEMENTS (Continued)
(in thousands, except per share and per share date)
1. Significant Accounting Policies: (Continued)
carrying amounts of assets and liabilities and disclosures of contingent assets and liabilities as of financial statement dates, as well as the reported revenues and expenses for the years then ended. These estimates are used for, but not limited to, the accounting for allowance for doubtful accounts and sales returns, application of the percentage of completion accounting for long-term contract revenues, inventory reserves, warranty reserves, valuation allowance for deferred income tax assets, and contingencies. These estimates are based on historical experience and various assumptions that we believe to be reasonable under the particular applicable facts and circumstances. Actual results may differ from our estimates.
Accounting For Stock-Based Compensation
For the years ended December 31, 2009, 2008 and 2007, we recognized compensation expense under the FASB authoritative guidance related to accounting for stock compensation of $0.7 million, $0.6 million, and $1.6 million, respectively, related to options and $0.2 million, $0.6 million and $0.03 million, respectively, related to restricted stock units and restricted stock grants. Additionally, $0.1 million of compensation expense was recognized related to equity grants made in the first quarter of 2009 to certain named executive officers associated with performance-based incentives earned for meeting certain operational, new product introductions and other personal goals.
Stock Option Plans
We use the Black-Scholes option pricing model to determine the fair value of all stock option grants and stock satisfied stock appreciation rights ("SSAR's") (collectively "equity-based awards"). For equity-based awards issued in the year December 31, 2009, 2008, and 2007, the following weighted-average assumptions were used:
| |
2009 | 2008 | 2007 | |||||||
|---|---|---|---|---|---|---|---|---|---|---|
Expected option life |
3.75 years | 3.75 years | 3.75 years | |||||||
Expected annual volatility |
179 | % | 152 | % | 110 | % | ||||
Risk-free interest rate |
2.69 | % | 1.55 | % | 3.45 | % | ||||
Dividend yield |
0 | % | 0 | % | 0 | % | ||||
The weighted average fair value per equity-based award at date of grant during 2009, 2008 and 2007 was $0.87, $1.33 and $4.27, respectively.
Restricted Stock Plans
Restricted stock units issued during 2008 and 2007 vest over a four year period from the date of grant. Restricted stock issued during 2007 vests over a twenty month period and restricted stock issued in 2006 vests over a three year period from the date of grant. Restricted stock issued to employees or non-employee directors during 2005 include performance criteria. Compensation cost is recognized as expense based on the vesting period and consideration of performance criteria included in the restricted grant.
F-17
EF JOHNSON TECHNOLOGIES, INC. AND SUBSIDIARIES
NOTES TO CONSOLIDATED FINANCIAL STATEMENTS (Continued)
(in thousands, except per share and per share date)
2. Business Condition and Liquidity:
The Company has incurred net losses of $12.2 million, $20.9 million and $41.1 million for the years ended December 31, 2009, 2008 and 2007, respectively. The Company generated net cash and cash equivalents of $4.8 million (net of restricted cash) in 2009, but used net cash and cash equivalents of $4.4 million in 2008 and $7.2 million in 2007. The Company was not in compliance with certain of the financial covenants of its loan agreement with Bank of America, N. A. for the quarter ending December 31, 2009. The Company executed an amendment to the loan agreement effective March 1, 2010 which waived these covenant violations on a one-time basis, but the amendment also included additional restrictions and further limited our access to liquidity (See Note 8).
The Company's loan agreement with Bank of America, N.A., which governs our revolving line of credit and $15 million term loan, expires June 30, 2010. Management believes that Bank of America will not renew the loan agreement with terms favorable to the Company. As a result, the $15.0 million term loan is due and payable in full on that date. The Company has pledged $3.0 million to Bank of America that is shown as Restricted Cash on our balance sheet and partially offsets this term loan. As of December 31, 2009, the Company had approximately $3.1 million available under its existing line of credit (subject to the lender's discretion) and had unrestricted cash of approximately $16.0 million.
The Company does not anticipate that it will have sufficient cash on hand to pay off the term loan when due, without dedicating all or substantially all of our cash flow from operations to the payment of our indebtedness, thereby substantially reducing the funds available for operations, working capital, capital expenditures, research and development, sales and marketing initiatives and general corporate or other purposes.
As a result, the Company has developed and is implementing specific action plans to improve profitability and resolve this liquidly matter in the first half of 2010 including the following: i) flattened the organizational structure and reduced employee and operational expenses in January 2010, and ii) has retained the services of an outside investment banking firm to support the required programs to accomplish management's objectives and to explore options available to the Company to refinance the debt, or raise additional funds through private equity or debt financing, sales of assets, or other strategic alternatives. These funds may not be available, or if available, we may not be able to obtain them on terms favorable to us. The Company's long-term viability, as well as its ability to meet its existing operating requirements and future capital needs, depends on its ability to resolve this liquidly issue and achieve and maintain profitable operations.
The accompanying financial statements have been prepared assuming that the Company will continue as a going concern; however, the above conditions raise substantial doubt about the Company's ability to do so. The financial statements do not include any adjustments to reflect the possible future effects on the recoverability and classification of assets or the amounts and classifications of liabilities that may result should the Company be unable to continue as a going concern.
3. Retrospective Adoption of New Accounting Guidance:
In September 2009, the FASB amended the accounting standards related to revenue recognition for arrangements with multiple deliverables. In the fourth quarter of 2009, the Company adopted the new accounting guidance on a retrospective basis as of January 1, 2009. Footnote 1, "Significant
F-18
EF JOHNSON TECHNOLOGIES, INC. AND SUBSIDIARIES
NOTES TO CONSOLIDATED FINANCIAL STATEMENTS (Continued)
(in thousands, except per share and per share date)
3. Retrospective Adoption of New Accounting Guidance: (Continued)
Accounting Policies" under the subheadings "Retrospective Adoption of New Accounting Guidance" and "Revenue Recognition" provides additional information on the Company's change in accounting resulting from the adoption of the new accounting guidance as of January 1, 2009 and the Company's revenue recognition accounting policy.
The following unaudited table (in thousands, except share amounts) presents the effects of the retrospective adoption of the new accounting guidance as of January 1, 2009 to the Company's previously reported Consolidated Statements of Operations for the three months ended March 31, June 30, and September 30, 2009:
| |
As previously reported March 31, 2009 |
Adjustment | As amended March 31, 2009 |
As previously reported June 30, 2009 |
Adjustment | As amended June 30, 2009 |
As previously reported Sept. 30, 2009 |
Adjustment | As amended Sept. 30, 2009 |
|||||||||||||||||||
|---|---|---|---|---|---|---|---|---|---|---|---|---|---|---|---|---|---|---|---|---|---|---|---|---|---|---|---|---|
Revenues |
$ | 22,429 | $ | (348 | ) | $ | 22,081 | $ | 30,129 | $ | (253 | ) | $ | 29,876 | $ | 24,412 | $ | (288 | ) | $ | 24,124 | |||||||
Net income (loss) before income taxes |
$ | (1,258 | ) | $ | (348 | ) | $ | (1,606 | ) | $ | 1,128 | $ | (253 | ) | $ | 875 | $ | (1,605 | ) | $ | (288 | ) | $ | (1,893 | ) | |||
Net income (loss) |
$ | (1,258 | ) | $ | (348 | ) | $ | (1,606 | ) | $ | 1,128 | $ | (253 | ) | $ | 875 | $ | (1,605 | ) | $ | (288 | ) | $ | (1,893 | ) | |||
Net income (loss) per share—basic |
$ | (0.05 | ) | $ | (0.01 | ) | $ | (0.06 | ) | $ | 0.04 | $ | (0.01 | ) | $ | 0.03 | $ | (0.06 | ) | $ | (0.01 | ) | $ | (0.07 | ) | |||
Net income (loss) per share—diluted |
$ | (0.05 | ) | $ | (0.01 | ) | $ | (0.06 | ) | $ | 0.04 | $ | (0.01 | ) | $ | 0.03 | $ | (0.06 | ) | $ | (0.01 | ) | $ | (0.07 | ) | |||
Weighted average common shares—basic |
26,383 | — | 26,383 | 26,540 | — | 26,540 | 26,441 | — | 26,441 | |||||||||||||||||||
Weighted average common shares—diluted |
26,383 | — | 26,383 | 27,009 | — | 27,009 | 26,441 | — | 26,441 | |||||||||||||||||||
4. Inventories:
The following is a summary of inventories at December 31:
| |
2009 | 2008 | |||||
|---|---|---|---|---|---|---|---|
Raw materials and supplies |
$ | 6,773 | $ | 11,598 | |||
Work in process |
742 | 1,049 | |||||
Finished goods |
23,621 | 24,673 | |||||
Service inventories |
1,696 | 3,163 | |||||
|
32,832 | 40,483 | |||||
Less: reserve for obsolescence |
1,537 | 3,161 | |||||
|
$ | 31,295 | $ | 37,322 | |||
F-19
EF JOHNSON TECHNOLOGIES, INC. AND SUBSIDIARIES
NOTES TO CONSOLIDATED FINANCIAL STATEMENTS (Continued)
(in thousands, except per share and per share date)
4. Inventories: (Continued)
The inventory balances have decreased at December 31, 2009 primarily due to a write off of $4.1 million related to the "X-platform" raw materials inventory and service stock during the fourth quarter of 2009 relating to a decision to end the life of the "X"-platform product and legacy service stock. The reserve for obsolescence at December 31, 2009 relates primarily to raw materials coupled with service stock held to provide maintenance to our customer base.
5. Contracts in Progress:
Costs incurred to date, profits and the related progress billings to date on contracts in progress are as follows as of December 31:
| |
2009 | 2008 | ||||||
|---|---|---|---|---|---|---|---|---|
Costs on uncompleted contracts |
$ | 192,060 | $ | 148,804 | ||||
Profits in uncompleted contracts |
25,116 | 18,982 | ||||||
|
217,176 | 167,786 | ||||||
Less progress billings |
215,690 | 162,887 | ||||||
|
$ | 1,486 | $ | 4,899 | ||||
The above is included in the consolidated balance sheets as follows: |
||||||||
Cost in excess of billings on uncompleted contracts |
5,096 | 5,116 | ||||||
Billings in excess of cost on uncompleted contracts |
(3,610 | ) | (217 | ) | ||||
|
$ | 1,486 | $ | 4,899 | ||||
Cost in excess of billings on uncompleted contracts includes direct costs of materials, installation, project management, engineering, allocable overhead costs and accrued profits in excess of amounts billed. Billings in excess of costs on uncompleted contracts include amounts billed on open contracts in excess of the aforementioned costs and accrued profits. The increases in costs and profits on uncompleted contracts with related billings primarily relate to increased government services contracts at 3eTI. Billings in excess of costs on uncompleted contracts primarily relate to certain land mobile radio system contracts at the end of 2009.
F-20
EF JOHNSON TECHNOLOGIES, INC. AND SUBSIDIARIES
NOTES TO CONSOLIDATED FINANCIAL STATEMENTS (Continued)
(in thousands, except per share and per share date)
6. Property, Plant and Equipment:
Property, plant and equipment consist of the following at December 31:
| |
2009 | 2008 | ||||||
|---|---|---|---|---|---|---|---|---|
Buildings and improvements |
$ | 1,093 | $ | 1,033 | ||||
Equipment |
14,159 | 13,040 | ||||||
Furniture and fixtures |
1,210 | 1,205 | ||||||
Software |
2,670 | 2,594 | ||||||
Construction in progress |
0 | 79 | ||||||
|
19,132 | 17,951 | ||||||
Less accumulated depreciation and amortization |
14,707 | 11,955 | ||||||
|
$ | 4,425 | $ | 5,996 | ||||
Depreciation expense was $2.8 million, $3.0 million, and $2.8 million as of December 31, 2009, 2008 and 2007, respectively.
7. Goodwill and Intangible Assets:
Our goodwill and intangible assets are tested for impairment annually as of December 31 of each year typically after we have completed our strategic planning and budget cycle for the following year, unless events or circumstances would require an immediate review. Goodwill and intangible asset amounts are allocated to the reporting units based upon amounts allocated at the time of their respective acquisition. Intangible assets, consisting of existing technology, customer relationships, license and covenants not-to-compete, are amortized over their useful life on a straight-line basis. Intangible assets consisting of trademark and trade name and certifications are not subject to amortization.
We performed fair value-based impairment tests at December 31, 2009, 2008 and 2007 related to the EF Johnson reporting unit, concluding no impairment of its related goodwill or trade name had occurred as of these dates.
We performed fair value-based impairment tests at December 31, 2009 related to the 3eTI reporting unit, concluding no impairment of its remaining intangible assets had occurred.
We performed fair value-based impairment tests at December 31, 2009, 2008 and 2007 related to the 3eTI reporting unit. During our strategic planning and budget preparation in the fourth quarter of 2008, we noted continued delays in key new business opportunities and near-term growth opportunities considered in our original assessment of 3eTI that did not materialize within the expected timelines. Therefore, it was necessary to significantly lower cash flow projections for this reporting unit. Specifically, we reduced the revenue and margin projections based on our recent financial performance, modifications to our strategic direction and future performance expectations of the reporting unit. Upon completion of the impairment test, we concluded that the fair value of this reporting unit was lower than the carrying value of the associated goodwill, certain intangibles and its' trade name. As a result, we reported an impairment charge of $14.9 million and $5.5 million related to goodwill at December 31, 2008 and 2007, respectively, and; $3.5 million and $0.3 million related to the other intangibles including trade name at December 31, 2008 and 2007, respectively recorded in general and administrative expenses.
F-21
EF JOHNSON TECHNOLOGIES, INC. AND SUBSIDIARIES
NOTES TO CONSOLIDATED FINANCIAL STATEMENTS (Continued)
(in thousands, except per share and per share date)
7. Goodwill and Intangible Assets: (Continued)
The change in the carrying amount of goodwill for the years ended December 31, 2009 and 2008 is shown in the following table:
| |
2009 | 2008 | |||||
|---|---|---|---|---|---|---|---|
Balance at beginning of year |
$ | 5,126 | $ | 20,040 | |||
Goodwill impairment |
— | (14,914 | ) | ||||
Balance at end of year |
$ | 5,126 | $ | 5,126 | |||
Goodwill attributable to the EF Johnson reporting unit was $5.1 million as of December 31, 2009 and 2008, respectively. Goodwill attributable to 3eTI reporting unit was zero and as of December 31, 2009 and 2008, respectively.
Amortization expense, related to intangible assets, was $1.0 million and $1.5 million for the years ended December 31, 2009 and 2008, respectively. Amortization expense of intangible assets is anticipated to be approximately $1.0 million, $1.0 million, $0.9 million, $0.6 million and $0.4 million for 2010, 2011, 2012, 2013 and 2014, respectively. Intangible assets consist of the following at December 31:
| |
December 31, 2009 | December 31, 2008 | ||||||||||||||||||
|---|---|---|---|---|---|---|---|---|---|---|---|---|---|---|---|---|---|---|---|---|
| |
Gross Amount |
Impairment | Net Amount |
Gross Amount |
Impairment | Net Amount |
||||||||||||||
Intangible assets not subject to amortization: |
||||||||||||||||||||
Goodwill |
$ | 5,126 | $ | — | $ | 5,126 | $ | 20,040 | $ | (14,914 | ) | $ | 5,126 | |||||||
Trademarks |
2,044 | — | 2,044 | 4,364 | (2,320 | ) | 2,044 | |||||||||||||
Certifications |
1,230 | — | 1,230 | 1,230 | — | 1,230 | ||||||||||||||
|
$ | 8,400 | $ | — | $ | 8,400 | $ | 25,634 | $ | (17,234 | ) | $ | 8,400 | |||||||
| |
December 31, 2009 | December 31, 2008 | ||||||||||||||||||||||||
|---|---|---|---|---|---|---|---|---|---|---|---|---|---|---|---|---|---|---|---|---|---|---|---|---|---|---|
| |
Gross Amount |
Impairment | Accumulated Amortization |
Net Amount |
Gross Amount |
Impairment | Accumulated Amortization |
Net Amount |
||||||||||||||||||
Intangible assets subject to amortization: |
||||||||||||||||||||||||||
Existing technology |
$ | 6,190 | $ | — | $ | (3,218 | ) | $ | 2,972 | $ | 6,190 | $ | — | $ | (2,667 | ) | $ | 3,523 | ||||||||
Customer relationships |
3,756 | — | (2,333 | ) | 1,423 | 4,800 | (1,044 | ) | (1,908 | ) | 1,848 | |||||||||||||||
Licences |
159 | — | (159 | ) | — | 320 | (161 | ) | (159 | ) | — | |||||||||||||||
Covenant not-to-compete |
400 | — | (400 | ) | — | 400 | — | (400 | ) | — | ||||||||||||||||
Trademarks/Patents |
209 | — | (100 | ) | 109 | 209 | — | (84 | ) | 125 | ||||||||||||||||
|
$ | 10,714 | $ | — | $ | (6,210 | ) | $ | 4,504 | $ | 11,919 | $ | (1,205 | ) | $ | (5,218 | ) | $ | 5,496 | |||||||
F-22
EF JOHNSON TECHNOLOGIES, INC. AND SUBSIDIARIES
NOTES TO CONSOLIDATED FINANCIAL STATEMENTS (Continued)
(in thousands, except per share and per share date)
8. Escrow Fund Settlement:
On January 13, 2009, the Company entered into a Settlement Agreement and Mutual Release (the "Settlement Agreement") settling a claim made by the Company against the escrow fund established in connection with the acquisition of 3eTI by the Company in 2006. Pursuant to the Agreement and Plan of Merger (the "Merger Agreement"), dated July 10, 2006, by and among the Company, 3eTI, Avanti Acquisition Corp., Chih-Hsiang Li, as Stockholders' Agent, and Steven Chen, James Whang, Chih-Hsiang Li and AEPCO, Inc., $3.6 million (or ten percent (10%) of the purchase price for 3eTI) was deposited into an escrow account at the time of closing to indemnify the Company for any claims under the Merger Agreement. In August 2008, the Company made a claim against the escrow fund for damages arising out of certain alleged breaches of representations and warranties contained in the Merger Agreement.
Pursuant to the terms of the Settlement Agreement, the Company received on January 16, 2009, approximately $2.8 million, inclusive of interest, out of the escrow fund. The remaining balance of the escrow fund (or approximately $1.1 million, inclusive of interest) was paid out to the former stockholders of 3eTI pursuant to the terms of the Merger Agreement. The Settlement Agreement also contains a mutual release of liability for claims related to the acquisition of 3eTI by the Company.
The escrow funds received as part of the settlement were recorded as a reduction of operating expense. The Company previously incurred research and development costs in connection with the re-design, re-testing and re-certification of certain 3eTI products to bring them up to specifications represented to exist at the acquisition date.
9. Note Payable and Line of Credit:
We amended our line of credit agreement with Bank of America in July 2006 to retain our revolving line of credit of up to $15.0 million and include a term loan of $15.0 million (the "Loan Agreement"). Both borrowings bear interest at a variable rate based on the London Interbank Offered Rate ("LIBOR") plus a margin ("LIBOR Margin"). The LIBOR Margin was 500 basis points at December 31, 2009. The interest rate of 5.235 percent and 3.431 percent were in effect at December 31, 2009 and 2008, respectively. The Loan Agreement expires June 30, 2010. As discussed below, an Amendment to the Loan Agreement was executed subsequent to December 31, 2009 that resulted in higher interests rates.
The $15.0 million term loan was fully funded and used to finance the acquisition of 3eTI. The Company did not borrow against the revolving line during 2009. The Company borrowed against the revolving line during 2008 due to the collection timing of certain receivables. We had outstanding borrowings of $6.5 million and $2.0 million at March 31, 2008 and September 30, 2008, respectively. At December 31, 2009 and 2008, no borrowings existed under the revolving line of credit. There was $0.75 million open letters of credit under our line of credit at December 31, 2009 and there were no open letters of credit, under our line of credit at December 31, 2008. The total available credit under the line of credit was approximately $3.1 million and $14.4 million as of December 31, 2009 and 2008, respectively. As discussed in more detail below, the maximum that we can borrow under the revolving credit line has been reduced to $3.75 million through June 30, 2010.
The Loan Agreement provides for customary affirmative and negative covenants, including maintenance of corporate existence and certain reporting requirements, as well as limitations on debt,
F-23
EF JOHNSON TECHNOLOGIES, INC. AND SUBSIDIARIES
NOTES TO CONSOLIDATED FINANCIAL STATEMENTS (Continued)
(in thousands, except per share and per share date)
9. Note Payable and Line of Credit: (Continued)
liens, fundamental changes, acquisitions, investments, loans, guarantees, use of proceeds and capital expenditures. In addition, the Loan Agreement contains certain financial covenants including a maximum ratio of funded debt to EBITDA and a fixed charge coverage ratio. The Loan Agreement also provides for events of default that would permit the lender to accelerate the loans upon their occurrence. As collateral for the obligations under the Loan Agreement the Lender has a security interest in substantially all assets of the borrowers, including accounts receivable, inventories and general intangibles.
We were not in compliance with the financial covenants of the Loan Agreement for the quarter ending December 31, 2008. As a result, on March 11, 2009 we executed an Amendment to the Loan Agreement whereby Bank of America waived such financial covenant defaults on a one time basis and amended the Loan Agreement to, among other things, lower the revolving line of credit from $15.0 million to $10.0 million, revise such financial covenants, add additional covenants, and to modify the advance and borrowing revisions under the Loan Agreement. In order to maintain compliance with the terms of the Amendment, the Company pledged as additional cash collateral for the remaining term of the term loan, $3.0 million on the effective date of the Amendment. Furthermore, beginning with the quarter ending June 30, 2009, we were required to maintain a certain level of EBITDA, maintain certain fixed charge coverage ratio on a cumulative basis beginning April 1, 2009, a minimum funded debt to EBITDA ratio on an annualized basis beginning April 1, 2009 for each quarterly financial reporting period through June 30, 2010 and limit capital expenditures to $2.5 million for 2009. In addition, the interest rate on the revolving note issuable pursuant to the Loan Agreement was amended to a floating rate equal to LIBOR plus a Libor Margin ranging from 2.50% to 5.00% through the term of the note based on the Company's funded debt to EBITDA.
We were not in compliance with certain of the financial covenants of the Loan Agreement for the quarter ended December 31, 2009. As a result, effective March 1, 2010, we executed another amendment to the Loan Agreement whereby Bank of America waived such financial covenant defaults on a one-time basis, waived compliance with such financial covenants for the Company's first quarter of 2010, and further amended the Loan Agreement to, among other things, (i) lower the revolving line of credit from $10.0 million to $3.75 million, (ii) make all future advances under the line subject to the lender's discretion, (iii) further limit our ability to obtain letters of credit, (iv) require us to pledge additional cash collateral totaling $3.5 million for the remaining term of the loan agreement no later than June 15, 2010, and (v) require us to provide additional financial reporting to the bank on a monthly basis. Failure to comply with any of these terms could constitute an event of default that would permit the lender to accelerate the loans upon their occurrence, which could have a material adverse effect on our operating results and cash flows. We cannot assure that in the future we will be able to achieve, maintain or satisfy these obligations under the Loan Agreement or obtain a waiver from Bank of America in the event we fail to comply.
F-24
EF JOHNSON TECHNOLOGIES, INC. AND SUBSIDIARIES
NOTES TO CONSOLIDATED FINANCIAL STATEMENTS (Continued)
(in thousands, except per share and per share date)
9. Note Payable and Line of Credit: (Continued)
Future principal payments of long-term debt as of December 31, 2009 are as follows:
Year Ending December 31 |
|||||
2010 |
$ | 15,006 | |||
2011 |
— | ||||
2012 |
— | ||||
2013 |
— | ||||
2014 |
— | ||||
Thereafter |
— | ||||
|
$ | 15,006 | |||
10. Interest Rate Swap Agreement:
On July 19, 2006, in connection with the amended loan agreement, we entered into an interest rate swap agreement that effectively converts the variable LIBOR component of the interest rate on the $15.0 million notional amount of the term loan to a fixed rate of 5.64%. Under the terms of the interest rate swap agreement, the Company will pay 5.64% and the counterparty will pay LIBOR on a monthly basis. The interest rate swap agreement terminates on June 30, 2010, the termination date of the term loan. The fair value of the interest rate swap was $0.5 million and is included in the current portion of long-term debt obligations and accumulated other comprehensive loss in the consolidated financial statements at December 31, 2009.
11. Leases:
EF Johnson Technologies, Inc. and EF Johnson's facilities are in Irving, Texas. Under the lease agreement, we exercised an option to purchase this facility for $3.6 million on March 31, 2006 and simultaneously sold the facility and entered into a ten year lease agreement, expiring March 31, 2016. Additionally, on February 3, 2010, we entered into an addendum extending the term for an additional three year period to end on March 31, 2019. The addendum to the lease also reduced the basic rent by $0.072 million for twelve months beginning May of 2009 and a return of escrow funds in the amount of $0.028 million. The $0.072 rent reduction is being recognized ratably as a reduction of rent expense over the remaining life of the lease. For the extension term, the basic rent will be the current market rate at the extension date, determined by mutual agreement. During 2009, the annual lease payments were $0.5 million.
Effective May 1, 2007, the Company executed a lease for an administrative facility located in Rockville, Maryland, that is primarily used by 3eTI . The lease will expire in May 2012. In 2009, annual lease payments were approximately $0.6 million with a three percent increase on each anniversary date. 3eTI's manufacturing and warehouse facility was located in Indiana, Pennsylvania. The lease expired in March 2009 and was closed. During 2009, we paid $0.01 million.
3eTI had a Taiwan administrative and manufacturing branch office in Taipei, Taiwan. We terminated the leases in March 2008 and there is no further obligation for this lease.
F-25
EF JOHNSON TECHNOLOGIES, INC. AND SUBSIDIARIES
NOTES TO CONSOLIDATED FINANCIAL STATEMENTS (Continued)
(in thousands, except per share and per share date)
11. Leases: (Continued)
EF Johnson has a facility in Lincoln, Nebraska located in a minor portion of an industrial park and is leased pursuant to a ten-year agreement expiring in June 2014, with an option to renew for an additional five years. Annual occupancy costs, including common area maintenance charges, are approximately $0.2 million.
Effective June 30, 2008, EF Johnson executed a lease for a warehouse facility is in Carrollton, Texas located in a minor portion of an industrial park and is leased pursuant to a ten-year agreement expiring in September 2018. The annual lease payments are approximately $0.083 million for the first three years, $0.087 million for the following fours years and $0.091 million for the last three years of the lease term that expires June 30, 2018.
We also lease additional warehouse facilities in: Irving, Texas; Waseca, Minnesota; and Gaithersburg, Maryland.
We also lease various equipment and buildings under operating leases. We anticipate that, in the normal course of business, leases will be renewed or replaced as they expire. Rent expense for all operating leases was $1.5 million, $1.5 million and $1.6 million for the years 2009, 2008 and 2007, respectively. Rent expense is recorded on the straight-line method considering contractual rents due and escalation clauses in the individual contracts.
Future minimum rental payments under non-cancelable operating lease agreements and future minimum capital lease payments as of December 31, 2009 are as follows:
Year Ending December 31
|
Operating Lease | |||
|---|---|---|---|---|
2010 |
$ | 1,491 | ||
2011 |
1,399 | |||
2012 |
1,018 | |||
2013 |
741 | |||
2014 |
614 | |||
Thereafter |
2,172 | |||
Total |
$ | 7,435 | ||
12. Income Taxes:
The components of the income tax expense/ (benefit) for the years ended December 31, 2009, 2008, and 2007, are as follows:
| |
2009 | 2008 | 2007 | |||||||||
|---|---|---|---|---|---|---|---|---|---|---|---|---|
Current: |
||||||||||||
Federal |
$ | (279 | ) | $ | — | $ | (48 | ) | ||||
State |
33 | 284 | 100 | |||||||||
Deferred: |
||||||||||||
Federal |
(4 | ) | (742 | ) | 19,133 | |||||||
State |
4 | (116 | ) | 2,285 | ||||||||
Total |
$ | (246 | ) | $ | (574 | ) | $ | 21,470 | ||||
F-26
EF JOHNSON TECHNOLOGIES, INC. AND SUBSIDIARIES
NOTES TO CONSOLIDATED FINANCIAL STATEMENTS (Continued)
(in thousands, except per share and per share date)
12. Income Taxes: (Continued)
A reconciliation of our effective tax rate to the U.S. federal statutory rate is as follows:
| |
2009 | Percent | 2008 | Percent | 2007 | Percent | ||||||||||||||
|---|---|---|---|---|---|---|---|---|---|---|---|---|---|---|---|---|---|---|---|---|
U.S. federal tax at statutory tax rate |
$ | (4,241 | ) | 34.0 | % | $ | (7,292 | ) | 34.0 | % | $ | (6,674 | ) | 34.0 | % | |||||
Change in valuation allowance |
4,984 | (40.0 | ) | 249 | (1.2 | ) | 27,766 | (141.5 | ) | |||||||||||
NOL's benefiting goodwill and equity |
228 | (1.8 | ) | (140 | ) | 0.7 | (1,016 | ) | 5.2 | |||||||||||
State income taxes, net of federal tax effect |
(430 | ) | 3.4 | 910 | (4.2 | ) | (413 | ) | 2.1 | |||||||||||
Tax credits |
(7 | ) | 0.1 | (193 | ) | 0.9 | (737 | ) | 3.8 | |||||||||||
Deferred tax asset true-ups |
145 | (1.2 | ) | 441 | (2.1 | ) | 472 | (2.4 | ) | |||||||||||
Escrow fee settlement, goodwill impairment |
(953 | ) | 7.6 | 5,071 | (23.6 | ) | 1,861 | (9.5 | ) | |||||||||||
Other |
28 | (0.2 | ) | 380 | (1.8 | ) | 211 | (1.1 | ) | |||||||||||
Total |
$ | (246 | ) | 1.9 | % | $ | (574 | ) | 2.7 | % | $ | 21,470 | (109.4 | )% | ||||||
Temporary differences between the financial statement carrying amounts and tax bases of assets and liabilities that give rise to deferred income taxes at December 31, 2009 and 2008 relate to the following:
| |
2009 | 2008 | ||||||
|---|---|---|---|---|---|---|---|---|
Allowance for bad debts and returns |
$ | 233 | $ | 589 | ||||
Reserve for inventory obsolescence |
569 | 1,169 | ||||||
NOL carryforwards |
30,814 | 24,776 | ||||||
General business credits |
3,168 | 3,264 | ||||||
Non-cash compensation expense |
1,575 | 1,488 | ||||||
Deferred gain on sale / leaseback |
220 | 255 | ||||||
Fair value of interest rate swap |
174 | 403 | ||||||
Difference between tax and book liability accruals and prepaid assets |
1,447 | 1,591 | ||||||
Gross deferred tax assets |
38,200 | 33,535 | ||||||
Less valuation allowance |
36,757 | 31,773 | ||||||
Deferred tax assets, net of valuation allowance |
1,443 | 1,762 | ||||||
Difference between tax and book depreciation |
(73 | ) | (229 | ) | ||||
Difference between tax and book amortization |
(2,001 | ) | (2,164 | ) | ||||
Net deferred tax liability |
$ | (631 | ) | $ | (631 | ) | ||
Taxable net operating loss carryforwards ("NOLs"), totaling approximately $85.5 million at December 31, 2009, originated in 1997 through 2009 and expire in 2017 through 2029. The NOLs at December 31, 2009 include $3.9 million expense attributable to income recognized by employees through the exercise of our stock options which would be recognized as an increase to additional paid in capital upon the full utilization of the previously described NOLs and tax credits. We also have $3.2 million in general business credits which were earned in 1997 through 2009 and expire in 2011 through 2029.
F-27
EF JOHNSON TECHNOLOGIES, INC. AND SUBSIDIARIES
NOTES TO CONSOLIDATED FINANCIAL STATEMENTS (Continued)
(in thousands, except per share and per share date)
12. Income Taxes: (Continued)
In assessing the realizability of deferred tax assets, we consider whether it is more likely than not some portion or all of the deferred tax assets will not be realized. The ultimate realization of deferred tax assets is entirely dependent upon the generation of future taxable income during the periods in which those temporary differences become deductible. We consider the scheduled reversal of deferred tax liabilities, projected future taxable income, and tax planning strategies in making this assessment. Taxable loss, before application of NOLs, for the years ended December 31, 2009, 2008 and 2007 was approximately $16.7 million, $0.6 million and $6.5 million, respectively.
In addition, in determining recoverability of the future tax benefits associated with our deferred tax asset, we take into account, among other factors, our operating results during 2009, 2008, and 2007, our current and expected customer base, technological and competitive factors impacting our current products, and our estimates of future earnings which are based upon a five-year earnings projection, using information currently available, discounted for risk. Based on these determining factors, we have provided a valuation allowance for all of our deferred tax assets as of December 31, 2009, and 2008, respectively, due to the uncertainty regarding their future realization.
We recorded a net deferred tax liability associated with the non amortizing indefinite lived intangibles of $0.6 million at December 31, 2009 and 2008, after the tax effected impairment charges (see Note 7).
We adopted the FASB authoritative guidance related to accounting for uncertainty in income taxes on January 1, 2007. The guidance prescribes a recognition threshold that a tax position is required to meet before being recognized in the financial statements and provides guidance on recognition, measurement, classification, interest and penalties, accounting in interim periods, disclosure and transition issues. The Company had unrecognized tax benefits of approximately $0.5 million at December 31, 2009 relating to carry forward of business credits. The adoption of guidance did not result in the recognition of additional tax liability for unrecognized income tax benefits since the tax benefits have not been included in prior income tax return filings. In addition, future changes in the unrecognized tax benefit will have no net impact on the effective tax rate due to the existence of the valuation allowance.
As of December 31, 2009 and 2008, we had no accrual requirement for interest or penalties related to uncertain tax positions since the tax benefits have not been included in prior income tax return filings. Accrued interest relating to uncertain tax positions would be recorded as a component of interest expense and penalties related to uncertain tax positions would be recorded as a component of general and administrative expenses.
The tax years 2005-2009 remain open to examination by the major taxing jurisdictions to which we are subject. Additionally, upon inclusion of the NOL and R&D credit carry forward tax benefits from tax years 1996 to 2004 in future tax returns, the related tax benefit for the period in which the benefit arose may be subject to examination.
F-28
EF JOHNSON TECHNOLOGIES, INC. AND SUBSIDIARIES
NOTES TO CONSOLIDATED FINANCIAL STATEMENTS (Continued)
(in thousands, except per share and per share date)
12. Income Taxes: (Continued)
A reconciliation of our unrecognized tax benefits is as follows:
| |
2009 | 2008 | |||||
|---|---|---|---|---|---|---|---|
Balance at beginning of year |
$ | 479 | $ | 504 | |||
Additions based on tax positions related to the current year |
18 | 21 | |||||
Additions for tax positions of prior years |
— | — | |||||
Reductions for tax positions of prior years |
— | (46 | ) | ||||
Settlements |
— | — | |||||
Balance at end of year |
$ | 497 | $ | 479 | |||
13. Accrued Expenses:
Accrued expenses consist of the following at December 31:
| |
2009 | 2008 | |||||
|---|---|---|---|---|---|---|---|
Payroll, commissions, bonuses and employee benefits |
$ | 1,968 | $ | 2,250 | |||
Accrued interest |
233 | 231 | |||||
Warranty reserve |
2,600 | 3,116 | |||||
Unamortized gain on sale / leaseback transaction |
592 | 687 | |||||
Other accrued liabilities |
2,361 | 4,502 | |||||
|
$ | 7,754 | $ | 10,786 | |||
The following represents a reconciliation of changes in our accrued warranty reserve as of December 31, 2009 and 2008:
| |
Balance at Beginning of Period |
Charged to Costs and Expenses |
Deductions | Balance at End of Period |
|||||||||
|---|---|---|---|---|---|---|---|---|---|---|---|---|---|
Year Ended December 31, 2008 |
$ | 3,803 | $ | 3,668 | $ | 4,355 | $ | 3,116 | |||||
Year Ended December 31, 2009 |
$ | 3,116 | $ | 1,806 | $ | 2,322 | $ | 2,600 | |||||
The decrease in our accrued warranty reserve as of December 31, 2009 is attributable to improved warranty experience in 2009 as compared with 2008 and the projection of lower warranty costs continuing under our new radio platforms in the future.
14. Commitments and Contingencies:
We are party to various claims, legal actions and complaints arising in the normal conduct of our business. We do not believe that any liabilities relating to such matters are likely to be, individually or in the aggregate, material to our business, financial condition, and results of operations or cash flows.
The total we have accrued in regards to all legal proceedings as of December 31, 2009 and 2008 was $0.032 million and $0.1 million, respectively.
F-29
EF JOHNSON TECHNOLOGIES, INC. AND SUBSIDIARIES
NOTES TO CONSOLIDATED FINANCIAL STATEMENTS (Continued)
(in thousands, except per share and per share date)
14. Commitments and Contingencies: (Continued)
In the normal course of our business activities related to sales of wireless radio systems to local and state governmental entities, we are required under certain contracts with various government authorities to provide letters of credit or performance or bid bonds that may be drawn upon if we fail to perform under our contracts. There was a $0.75 million letter of credit under our line of credit as of December 31, 2009 and there were no letters of credit under our line of credit as of December 31, 2008. Performance and bid bonds, which expire on various dates, totaled $2.4 million at December 31, 2009 and 2008. No bonds had been drawn upon at either date. The majority of bonds relate to the contract awarded in May 2008 by the Government of Yukon, Canada that is collateralized by restricted cash of $2.0 million.
15. Option Plans:
Under our 1996 Stock Incentive Plan (the "1996 Plan"), any employee, non-employee director or independent contractor, was eligible to be considered for the issuance of shares of common stock or of any other class of security or right which is convertible into common stock. The 1996 Plan expired pursuant to its terms on December 31, 2006. The plan provided that, unless otherwise provided by the plan committee, any stock option granted shall have an exercise price not less than 100% of the market value of a share of common stock on the date the option is granted and that the term of such option shall be ten years from date of grant with vesting of the options at a rate of 20% per year.
Under our 2005 Omnibus Incentive Compensation Plan (the "2005 Plan"), any employee or non-employee director is eligible to be considered for the issuance of shares of common stock or of any other class of security or right which is convertible into common stock. At the Company's May 28, 2008 Annual Meeting of Stockholders, the Stockholders approved an amendment to the EFJ, Inc. 2005 Omnibus Incentive Compensation Plan to increase the number of shares available for issuance pursuant to the plan by 1,500,000 shares. There are approximately 998,800 remaining shares available to be issued under the 2005 Plan as of December 31, 2009. The plan provides that, unless otherwise provided by the plan committee, any stock option granted shall have an exercise price not less than 100% of the market value of a share of common stock on the date the option is granted and that the term of such option shall be up to seven years from date of grant with vesting of the options at a rate of 25% per year.
We made grants of 10,000, 10,000 and 110,000 of stock option grants during 2009, 2008 and 2007, respectively, to non-employee directors of the Company and key employees. The stock option grant made in 2009, vests over a five year period and expires in seven years. Stock option grants made in 2008 and 2007 vest over a four year period and expire in five years.
In July 2007, the Compensation Committee of the Board of Directors approved the use of and awards of Stock Satisfied Stock Appreciation Rights ("SSAR's") as an equity instrument for grants to certain key employees of the Company pursuant to the 2005 Omnibus Incentive Compensation Plan. We made grants of 316,250, 117,500 and 61,000 SSAR's during 2009, 2008 and 2007, respectively, to key employees that vest over a four year period and expire in five years.
Stock option grants and stock satisfied stock appreciation rights ("SSAR's") are collectively referred to as "equity-based awards". Equity-based awards issued during 2009 have four or five year vesting periods and five or seven year lives, 2007 and 2008 have four-year vesting periods and five-year
F-30
EF JOHNSON TECHNOLOGIES, INC. AND SUBSIDIARIES
NOTES TO CONSOLIDATED FINANCIAL STATEMENTS (Continued)
(in thousands, except per share and per share date)
15. Option Plans: (Continued)
lives. Equity-based awards issued during 2006 have four-year vesting periods and seven year lives. Awards issued prior to November 15, 2005 generally had five-year vesting periods and ten-year lives.
A summary of equity-based award activity at December 31, 2009, 2008 and 2007 is presented below:
Options
|
Shares | Weighted- Average Exercise Price |
Weighted Average Options Exercisable |
Weighted- Average Remaining Contractual Term |
Aggregate Intrinsic Value ($000) |
|||||||||||
|---|---|---|---|---|---|---|---|---|---|---|---|---|---|---|---|---|
Outstanding at December 31, 2006 |
1,291,172 | $ | 6.91 | 7.2 | $ | 8,925 | ||||||||||
Granted |
171,000 | 5.82 | 994 | |||||||||||||
Exercised |
(26,120 | ) | 0.99 | (26 | ) | |||||||||||
Forfeited or expired |
(140,830 | ) | 6.55 | (922 | ) | |||||||||||
Outstanding at December 31, 2007 |
1,295,222 | $ | 6.93 | 525,282 | 6.3 | $ | 8,971 | |||||||||
Exercisable at December 31, 2007 |
525,282 | $ | 6.18 | 6.0 | $ | 3,245 | ||||||||||
Outstanding at December 31, 2007 |
1,295,222 | $ | 6.93 | 6.3 | $ | 8,971 | ||||||||||
Granted |
127,500 | 1.73 | 221 | |||||||||||||
Exercised |
(32,422 | ) | 0.55 | (18 | ) | |||||||||||
Forfeited or expired |
(325,485 | ) | 7.80 | (2,540 | ) | |||||||||||
Outstanding at December 31, 2008 |
1,064,815 | $ | 6.23 | 577,700 | 5.2 | $ | 6,634 | |||||||||
Exercisable at December 31, 2008 |
577,700 | $ | 6.39 | 5.1 | $ | 3,690 | ||||||||||
Outstanding at December 31, 2008 |
1,064,815 | $ | 6.23 | 5.2 | $ | 6,634 | ||||||||||
Granted |
326,250 | 1.02 | 333 | |||||||||||||
Exercised |
(300 | ) | 0.51 | — | ||||||||||||
Forfeited or expired |
(118,305 | ) | 5.88 | (696 | ) | |||||||||||
Outstanding at December 31, 2009 |
1,272,460 | $ | 4.93 | 720,465 | 4.0 | $ | 6,273 | |||||||||
Exercisable at December 31, 2009 |
720,465 | $ | 6.47 | 4.2 | $ | 4,661 | ||||||||||
Our outstanding equity-based awards as of December 31, 2009 are as follows:
Range of Exercise Price
|
Number Outstanding at December 31, 2009 |
Weighted Average Remaining Contractual Life |
Weighted Average Exercise Price |
Number Exercisable at December 31, 2009 |
Exercisable Weighted Average Exercise Price |
|||||||||||
|---|---|---|---|---|---|---|---|---|---|---|---|---|---|---|---|---|
$0.510 - 0.890 |
33,580 | 2.9 | $ | 0.613 | 23,580 | $ | 0.588 | |||||||||
1.035 - 1.880 |
476,890 | 3.3 | 1.286 | 92,515 | 1.726 | |||||||||||
3.180 - 6.750 |
215,650 | 4.0 | 6.200 | 139,164 | 6.290 | |||||||||||
7.100 - 7.880 |
359,900 | 4.4 | 7.224 | 327,025 | 7.207 | |||||||||||
8.460 - 11.230 |
186,440 | 4.9 | 9.124 | 138,181 | 9.111 | |||||||||||
$0.510 - 11.230 |
1,272,460 | 4.0 | $ | 4.929 | 720,465 | $ | 6.470 | |||||||||
F-31
EF JOHNSON TECHNOLOGIES, INC. AND SUBSIDIARIES
NOTES TO CONSOLIDATED FINANCIAL STATEMENTS (Continued)
(in thousands, except per share and per share date)
15. Option Plans: (Continued)
Equity-based awards in-the-money and out-of -the-money as of December 31, 2009 are as follows:
| |
Options | SSARS | Total | Percentage | |||||||||
|---|---|---|---|---|---|---|---|---|---|---|---|---|---|
In-the money |
33,580 | — | 33,580 | 3 | % | ||||||||
Out-of-the money |
807,130 | 431,750 | 1,238,880 | 97 | % | ||||||||
Total shares |
840,710 | 431,750 | 1,272,460 | ||||||||||
At December 31, 2009 and 2008, there is $1.2 million and $2.4 million of total unrecognized compensation cost related to unvested stock options and SSAR's remaining to be recognized. Under the FASB authoritative guidance relating to accounting for stock compensation, any tax deductions in excess of recognized compensation costs are reported as financing cash flows rather than operating cash flows as was prescribed prior to the adoption of the authoritative guidance. Due to our significant net operating loss carryforwards (NOLs), we have not reflected these excess deductions since they have not yet reduced taxes payable.
During 2000 and 2001, we cancelled and reissued options to purchase 620,000 and 366,000 shares of common stock, respectively, under the 1996 Plan to lower the exercise price of those options to an amount approximately 150% of the prevailing market value of our common stock (the "repricing"), $0.656 per share. The repricing of the stock options resulted in a new measurement date for accounting purposes and the reclassification of these options as variable plan awards beginning on the date of the repricing. We previously accounted for these option grants as fixed plan awards. The resulting non-cash compensation is dependent upon our closing stock price at the end of the respective period. These amounts were included in general and administrative expenses. Upon our adoption of the FASB authoritative guidance relating to accounting for stock compensation in 2006, the expensing of re-priced shares under the variable accounting method was discontinued in accordance with the authoritative guidance.
As of December 31, 2009 and 2008, repriced options of 6,000 fully vested shares were outstanding.
For the years ended December 31, 2009, 2008 and 2007, the Company recognized $0.7 million, $1.2 million and $0.6 million, respectively, in non-cash stock compensation relating to equity-based awards.
16. Restricted Stock Plan and Non-Employee Director Stock Purchase Plan:
In November 2005, our board of directors granted 170,000 shares of restricted stock, at a fair value of $9.34 per share, to the CEO and members of the board of directors under the 2005 Omnibus Incentive Compensation Plan. The vesting of the restricted stock is determined based on the achievement of at least 80% of a specified revenue target and 80% of a specified EBITDA target. For purposes of vesting, the revenue and EBITDA targets are weighted equally at 50% and the vesting of the restricted stock is based on the pro-rata achievement of each target above the 80% level. Since the actual number of shares may vary based upon achievement of the revenue and EBITDA targets, we recorded these grants as variable awards with performance arrangements and recognized an increase of $0.14 million in both unearned stock compensation and additional paid in capital due to changes in the market price of our stock through December 31, 2005.
F-32
EF JOHNSON TECHNOLOGIES, INC. AND SUBSIDIARIES
NOTES TO CONSOLIDATED FINANCIAL STATEMENTS (Continued)
(in thousands, except per share and per share date)
16. Restricted Stock Plan and Non-Employee Director Stock Purchase Plan: (Continued)
In the fourth quarter of 2007, management reviewed the probability of meeting the performance-based criteria and targets for the 170,000 shares of restricted stock. We concluded that the revenue and EBITDA targets described above were not likely to be met and discontinued the expense recognition associated with these shares. Furthermore, the cumulative effect of the change in expense recognition should be recognized in the period of change; accordingly, the cumulative expense of $0.6 million was reversed in the fourth quarter of 2007. As of December 31, 2008, the performance period for the 170,000 shares of restricted stock ended and the shares have been returned to the remaining shares available to be issued under the 2005 Plan.
In February, 2007, an additional restricted stock grant of 65,040 shares was made to the CEO. This restricted stock vested on October 14, 2008. Under the authoritative guidance, the full fair value compensation expense of $0.4 million was being recorded over the service period. The Company withheld 17,203 shares of stock in satisfaction of tax obligations arising in connection with the vesting of 65,040 shares of restricted stock on October 14, 2008 for the CEO.
In July, 2007 the Compensation Committee of the Board of Directors approved the use of Restricted Stock Units ("RSU's) the equity instrument for grants to certain key employees of the Company pursuant to the 2005 Omnibus Incentive Compensation Plan. We made no grants of RSU's in 2009. We made grants of 522,850 and 15,500 RSU's during 2008 and 2007, respectively, to key employees that vest over a four year period and expire in five years. Accordingly, the fair value compensation expense of $1.0 million is being recorded over the four year vesting period. We recognized compensation expense of $0.151 million, $0.135 million and $0.008 million in the years ended December 31, 2009, 2008 and 2007, respectively.
In March, 2006, an additional restricted stock grant of 62,500 shares was made to the CEO. This restricted stock vested on March 9, 2009. Under the authoritative guidance, the full fair value compensation expense of $0.7 million was being recorded over the service period. The Company withheld 20,407 shares of stock in satisfaction of tax obligations arising in connection with the vesting of 62,500 shares of restricted stock on March 9, 2009 for the CEO.
For the years ended December 31, 2009, 2008 and 2007, the Company recognized $0.2 million, $0.6 million and $0.03 million, respectively, in non-cash stock compensation relating to restricted stock options and restricted stock units.
F-33
EF JOHNSON TECHNOLOGIES, INC. AND SUBSIDIARIES
NOTES TO CONSOLIDATED FINANCIAL STATEMENTS (Continued)
(in thousands, except per share and per share date)
16. Restricted Stock Plan and Non-Employee Director Stock Purchase Plan: (Continued)
A summary of the status of our unvested restricted stock grants as of December 31, 2008 and 2009 and changes during the year ended December 31, 2008 and 2009 is presented below:
| |
Shares | Weighted- Average Grant-Date Fair Value |
||||||
|---|---|---|---|---|---|---|---|---|
Unvested Restricted Stock Grants |
||||||||
Unvested at December 31, 2007 |
297,500 | $ | 8.83 | |||||
Granted |
— | — | ||||||
Vested |
(65,000 | ) | 6.15 | |||||
Expired |
(170,000 | ) | 8.96 | |||||
Unvested at December 31, 2008 |
62,500 | $ | 11.23 | |||||
Granted |
— | — | ||||||
Vested |
(62,500 | ) | 11.23 | |||||
Expired |
— | — | ||||||
Unvested at December 31, 2009 |
— | $ | — | |||||
A summary of the status of our unvested restricted stock unit grants as of December 31, 2008 and 2009 and changes during the year ended December 31, 2008 and 2009 is presented below:
| |
Shares | Weighted- Average Grant-Date Fair Value |
||||||
|---|---|---|---|---|---|---|---|---|
Unvested Restricted Stock Units |
||||||||
Unvested at December 31, 2007 |
15,500 | $ | 5.17 | |||||
Granted |
522,850 | 1.68 | ||||||
Vested |
(2,875 | ) | 5.31 | |||||
Forfeited |
(7,150 | ) | 4.24 | |||||
Unvested at December 31, 2008 |
528,325 | $ | 1.73 | |||||
Granted |
— | — | ||||||
Vested |
(121,264 | ) | 1.72 | |||||
Forfeited |
(45,025 | ) | 1.93 | |||||
Unvested at December 31, 2009 |
362,036 | $ | 1.70 | |||||
Pursuant to the 1999 Non-Employee Director Stock Purchase Plan (the "1999 Plan"), the non-employee directors of the Company may elect to receive some or all of their compensation for serving on the Board of Directors of the Company in the form of Company common stock. As of December 31, 2009, there were only 14,751 shares remaining available for issuance under this Plan. Due to the small number of shares remaining available for issuance under the 1999 Plan, on December 18, 2008, the Compensation Committee authorized the use of the 2005 Plan to issue shares to participating non-employee directors in lieu of cash director compensation. During 2009, Veronica
F-34
EF JOHNSON TECHNOLOGIES, INC. AND SUBSIDIARIES
NOTES TO CONSOLIDATED FINANCIAL STATEMENTS (Continued)
(in thousands, except per share and per share date)
16. Restricted Stock Plan and Non-Employee Director Stock Purchase Plan: (Continued)
Haggart, Thomas Thomsen, Edward Bersoff and Robert Barnett elected to participate in the 2005 Plan. During 2008, Veronica Haggart, Thomas Thomsen and Robert Barnett and during 2007, Veronica Haggart and Thomas Thomsen elected to participate in the 1999 Plan. For the year ended December 31, 2009, 2008 and 2007, the Company issued $0.05 million, $0.07 million and $0.02 million in common stock in lieu of cash for director fees, respectively.
17. Benefit Plans:
We have a profit sharing plan, which covers substantially all employees. Contribution levels are determined annually by the Board of Directors. There were no profit sharing contributions in any of the three years ended December 31, 2009, 2008 and 2007.
We also have a 401(k) plan, which covers substantially all employees of EF Johnson Technologies, Inc., E.F. Johnson, 3eTI, and Transcrypt. Participants may contribute up to the federal limit of their annual compensation. After one year of employment, we make matching contributions of 50% for the first 6% of the amount contributed by participants. Contributions may not exceed the maximum allowable by law. During 2009, the Company temporarily discontinued matching employee contributions. Our contributions approximated $0.4 million and $0.3 million for the years ended December 31, 2008, and 2007, respectively. The contributions made by the Company vest 25% after two years of service, 50% after three years of service, 75% after four years of service and 100% after five years of service.
In 2007, we closed the 401(k) plan that covers substantially all the employees of 3eTI to new participant contributions. Participants may contribute up to the federal limit of their annual compensation into the remaining EF Johnson Technologies, Inc. 401(k) plan. 3eTI made no matching contributions in to this plan for 2008. The Company made no contributions in 2008 to this plan. Our contributions approximated $0.1 million for the year ended December 31, 2007. The contributions made by the Company vest 33% after one year of service, 66% after two years of service and 100% after three years of service. Effective January 1, 2009, the 3eTI 401(k) plan has been terminated and merged into the EF Johnson Technologies, Inc. 401(k) plan.
18. Fair Value of Financial Instruments:
The carrying amount of our current assets and liabilities approximates fair value because of the short maturity of these instruments. The carrying amount of our term loan approximates fair value as it is based on prevailing market rates of interest. The fair value of our interest rate swap agreement represents the amount required to settle the agreement using prevailing market rates of interest.
Effective January 1, 2008, we adopted the FASB authoritative guidance relating to the accounting for financial assets and liabilities which defines fair value, establishes a framework for measuring fair value, provides guidance regarding the manner in determining fair value of a financial asset when there is no active market for such asset at the measurement date and expands disclosures about fair value measurements. The adoption of the authoritative guidance did not have a material impact on our financial condition and results of operations.
The authoritative guidance defines fair value as the price that would be received for an asset or paid to transfer a liability (an exit price) in the principal or most advantageous market for the asset or
F-35
EF JOHNSON TECHNOLOGIES, INC. AND SUBSIDIARIES
NOTES TO CONSOLIDATED FINANCIAL STATEMENTS (Continued)
(in thousands, except per share and per share date)
18. Fair Value of Financial Instruments: (Continued)
liability in an orderly transaction between market participants on the measurement date. There are three levels of inputs that may be used to measure fair value:
- •
- Level 1—quoted prices in active markets for identical assets and liabilities.
- •
- Level 2—observable inputs other than quoted prices in active markets for identical assets and
liabilities.
- •
- Level 3—unobservable inputs in which there is little or no market data available, which require the reporting entity to develop its own assumptions.
The following table provides the liabilities carried at fair value measured on a recurring basis as of December 31, 2009 and 2008:
| |
|
Fair Value Measurements Using: | |||||||||||
|---|---|---|---|---|---|---|---|---|---|---|---|---|---|
| |
Total Carrying Value | Quoted prices in active markets (Level 1) |
Significant other observable inputs (Level 2) |
Significant unobservable inputs (Level 3) |
|||||||||
Interest rate swap—liability at December 31, 2008 |
$ | 1,088 | $ | — | $ | 1,088 | $ | — | |||||
Interest rate swap—liability at December 31, 2009 |
$ | 470 | $ | — | $ | 470 | $ | — | |||||
19. Concentrations:
The U.S. Department of Defense is a significant customer, representing approximately 35%, 15% and 62% of consolidated revenues in 2009, 2008 and 2007, respectively. Sprint/Nextel is a significant customer, representing 17%, and 12% of consolidated revenues in 2009 and 2008, respectively. DRS Technologies, Inc. and the State of California are significant customers, representing 13%, and 12%, respectively, of consolidated revenues in 2008.
20. Export Sales:
A portion of our sales are made to customers outside of North America. Export sales are recorded and settled in U.S. dollars. Export sales by major geographic areas (based on the destination for such deliveries), were as follows for the years ended December 31, 2009, 2008 and 2007:
| |
2009 | 2008 | 2007 | |||||||
|---|---|---|---|---|---|---|---|---|---|---|
Europe |
$ | 636 | $ | 1,284 | $ | 2,139 | ||||
Middle East and Asia |
1,296 | 1,445 | 3,707 | |||||||
Central and Latin America |
379 | 2,695 | 431 | |||||||
|
$ | 2,311 | $ | 5,424 | $ | 6,277 | ||||
F-36
EF JOHNSON TECHNOLOGIES, INC. AND SUBSIDIARIES
NOTES TO CONSOLIDATED FINANCIAL STATEMENTS (Continued)
(in thousands, except per share and per share date)
21. Related Party Transaction:
For the period October 2005 through June 2009, DRS Technologies, Inc. ("DRS") was considered a related party due to Mr. Newman, Chairman, President and Chief Executive Officer of DRS, who also served as a director of the Company during this period. Effective June 5, 2009, Mr. Newman resigned as a Director of the Company due to potential conflicts of interest relating to his position with DRS. Transactions with DRS subsequent to June 5, 2009 would not be considered related party transactions.
For the approximate five month period ended June 5, 2009, DRS and its related subsidiaries acquired approximately $1.6 million of our products.
During the years ended December 31, 2008 and 2007, DRS and its related subsidiaries (part of Finmeccanica) acquired approximately $16.6 million and $0.7 million, respectively, of products from EF Johnson. Included in our account receivable balances as of December 31, 2008 were amounts due from DRS for $1.3 million.
22. Costs Associated with Exit or Disposal Activities:
On November 15, 2007, the Company committed to an organizational plan (the "2007 Plan") to shift from three divisions to one integrated corporate structure focused on secure wireless communications for government and industrial customers. The Plan was expected to improve efficiencies in our operations, reduce our infrastructure costs and support a new technology roadmap driving toward a streamlined and more effective structure. Implementation of the Plan included senior and middle management changes as well as staff reductions that eliminated redundant positions and reflected the Company's decision to consolidate operations and move production from three locations into a centralized operations and outsourcing program in the Dallas/Fort Worth area.
On December 31, 2009, the Company committed to a work force reduction plan (the "2009 Plan") to realign certain executive and senior management positions as well as staff reductions resulting from the fourth quarter 2009 performance of land mobile radio product sales. The 2009 Plan was implemented in the first quarter of 2010.
Costs that are directly associated with the two Plans are being recorded as "restructuring costs" and are included in general and administrative expenses. Other costs that do not qualify as restructuring costs are being classified as other operating expenses or costs of goods sold in the Company's consolidated statements of operations.
The timing of the recognition of costs associated with these activities were determined in accordance the FASB authoritative guidance relating to the accounting for costs associated with exit or disposal activities and provides that a liability for a cost associated with an exit or disposal activity shall be recognized at its fair value in the period in which the liability is incurred. In particular, employee-related termination costs associated with the relocation are generally recognized ratably over the period that the employees are required to provide services in order to earn the respective termination benefit.
F-37
EF JOHNSON TECHNOLOGIES, INC. AND SUBSIDIARIES
NOTES TO CONSOLIDATED FINANCIAL STATEMENTS (Continued)
(in thousands, except per share and per share date)
22. Costs Associated with Exit or Disposal Activities: (Continued)
The following table summarizes the estimates and actual exit costs incurred as of December 31, 2009 for the 2007 Plan:
| |
Original amount expected to be incurred |
Additional costs incurred |
Total amount expected to be incurred |
Amount incurred as of December 31, 2008 |
Amount incurred as of December 31, 2009 |
Remaining amount to be incurred |
|||||||||||||
|---|---|---|---|---|---|---|---|---|---|---|---|---|---|---|---|---|---|---|---|
One-time termination benefits |
$ | 951 | $ | — | $ | 951 | $ | 939 | $ | 12 | $ | — | |||||||
Other costs |
139 | 59 | 198 | 198 | — | — | |||||||||||||
Total costs |
$ | 1,090 | $ | 59 | $ | 1,149 | $ | 1,137 | $ | 12 | $ | — | |||||||
The following table summarizes the beginning and ending liability reserve for exit costs as of December 31, 2009 for the 2007 Plan:
| |
Balance at December 31, 2008 |
Cash Payments |
Balance at December 31, 2009 |
|||||||
|---|---|---|---|---|---|---|---|---|---|---|
One-time termination benefits |
$ | 12 | $ | 12 | $ | — | ||||
Other costs |
— | — | — | |||||||
Total costs |
$ | 12 | $ | 12 | $ | — | ||||
The following table summarizes the estimates and actual exit costs incurred as of December 31, 2009 for the 2009 Plan:
| |
Original amount expected to be incurred |
Remaining amount to be incurred |
|||||
|---|---|---|---|---|---|---|---|
One-time termination benefits |
$ | 311 | $ | 311 | |||
Other costs |
25 | 25 | |||||
Total costs |
$ | 336 | $ | 336 | |||
The following table summarizes the beginning and ending liability reserve for exit costs as of December 31, 2009 for the 2009 Plan:
| |
Accued in December 2009 |
Cash Payments |
Balance at December 31, 2009 |
|||||||
|---|---|---|---|---|---|---|---|---|---|---|
One-time termination benefits |
$ | 311 | $ | — | $ | 311 | ||||
Other costs |
25 | — | 25 | |||||||
Total costs |
$ | 336 | $ | — | $ | 336 | ||||
F-38
EF JOHNSON TECHNOLOGIES, INC. AND SUBSIDIARIES
NOTES TO CONSOLIDATED FINANCIAL STATEMENTS (Continued)
(in thousands, except per share and per share date)
23. Unaudited Quarterly Financial Data:
The following table sets forth unaudited condensed operating results for each of the eight quarters in the two-year period ended December 31, 2009. This information has been prepared on the same basis as the financial statements appearing elsewhere in this report. Our operating results for any one quarter are not indicative of results for any future period. Earnings per share for each quarter are computed independently of earnings per share for the year. The sum of the quarterly earnings per share may not equal the earnings per share for the year because of: (i) transactions affecting the weighted average number of common shares outstanding in each quarter; and (ii) the uneven distribution of earnings during the year.
| |
Quarter Ended | ||||||||||||
|---|---|---|---|---|---|---|---|---|---|---|---|---|---|
| |
March 31, | June 30, | Sept. 30, | Dec. 31, | |||||||||
| |
(in thousands, except per share data) |
||||||||||||
2008 |
|||||||||||||
Revenues |
$ | 33,899 | $ | 32,570 | $ | 34,500 | $ | 25,317 | |||||
Income (loss) from operations |
(1,835 | ) | 1,525 | 904 | (21,060 | ) | |||||||
Interest and other income (expenses), net |
(181 | ) | (268 | ) | (259 | ) | (273 | ) | |||||
Income (loss) before income taxes |
(2,016 | ) | 1,257 | 645 | (21,333 | ) | |||||||
Income tax benefit (expense) |
— | — | — | 574 | |||||||||
Net income (loss) |
$ | (2,016 | ) | $ | 1,257 | $ | 645 | $ | (20,759 | ) | |||
Net income (loss) per share—basic |
$ | (0.08 | ) | $ | 0.05 | $ | 0.02 | $ | (0.79 | ) | |||
Net income (loss) per share—diluted |
$ | (0.08 | ) | $ | 0.05 | $ | 0.02 | $ | (0.79 | ) | |||
2009 |
|||||||||||||
Revenues |
$ | 22,081 | $ | 29,876 | $ | 24,124 | $ | 16,260 | |||||
Income (loss) from operations |
(1,322 | ) | 1,227 | (1,526 | ) | (9,476 | ) | ||||||
Interest and other income (expenses), net |
(284 | ) | (352 | ) | (367 | ) | (374 | ) | |||||
Income (loss) before income taxes |
(1,606 | ) | 875 | (1,893 | ) | (9,850 | ) | ||||||
Income tax benefit (expense) |
— | — | — | 246 | |||||||||
Net income (loss) |
$ | (1,606 | ) | $ | 875 | $ | (1,893 | ) | $ | (9,604 | ) | ||
Net income (loss) per share—basic |
$ | (0.05 | ) | $ | 0.04 | $ | (0.06 | ) | $ | (0.36 | ) | ||
Net income (loss) per share—diluted |
$ | (0.05 | ) | $ | 0.04 | $ | (0.06 | ) | $ | (0.36 | ) | ||
During the third quarter of 2007, the company entered into a Memorandum of Understanding with one of its vendors in an effort to resolve a dispute between the parties regarding an outstanding receivable. The execution of the Memorandum of Understanding effectively changed the nature of the outstanding receivable such that it should no longer be considered a receivable balance. As a result, the company wrote off this "Other Receivable" of $3.6 million in the third quarter of 2007 against cost of sales negatively impacting our gross margin. We received credits under the agreement amounting to $0.1 million, $0.2 million, $0.2 million and $0.2 million in the quarters ended March 31, June 30, September 30 and December 31, 2008, respectively. We received credits under the agreement
F-39
EF JOHNSON TECHNOLOGIES, INC. AND SUBSIDIARIES
NOTES TO CONSOLIDATED FINANCIAL STATEMENTS (Continued)
(in thousands, except per share and per share date)
23. Unaudited Quarterly Financial Data: (Continued)
amounting to $0.1 million, $0.1 million, $0.04 million and $.03 million in the quarters ended March 31, June 30, September 30 and December 31, 2009, respectively.
During the fourth quarter of 2008, we incurred impairment charge against the intangibles of $3.5 million and a goodwill impairment loss of $14.9 million associated with the 3eTI reporting unit. A tax benefit of $0.6 million was recorded in the fourth quarter of 2008 primarily due to a reduction in deferred tax liabilities relating to the impairment charge for indefinite lived intangible assets associated with the 3eTI reporting unit.
During the fourth quarter of 2009 the Company wrote off the "X"-platform and older legacy service stock raw materials inventory for $4.1 million, thereby impacting the gross profit for the fourth quarter.
24. Subsequent events:
We have evaluated events occurring subsequent to the date of our financial statements and through the date our financial statements were issued. We have recognized the effects of all subsequent events that provide additional evidence about conditions that existed at our balance sheet date as of December 31, 2009, including estimates inherent in the process of preparing our financial statements. There were no non-recognized subsequent events to be disclosed in our financial statements.
F-40
EF JOHNSON TECHNOLOGIES INC. AND SUBSIDIARIES
SCHEDULE II—VALUATION AND QUALIFYING ACCOUNTS AND RESERVES
December 31, 2009, 2008 and 2007
| |
Balance at Beginning of Period |
Expense (Reversal) |
Charged to Other Accounts |
Deductions (Write-offs) |
Balance at End of Period |
||||||||||||
|---|---|---|---|---|---|---|---|---|---|---|---|---|---|---|---|---|---|
Allowance for Doubtful Accounts for the: |
|||||||||||||||||
Year Ended December 31, 2007 |
547,099 | 906,140 | — | 438,223 | 1,015,016 | ||||||||||||
Year Ended December 31, 2008 |
1,015,016 | 823,166 | — | 246,365 | 1,591,817 | ||||||||||||
Year Ended December 31, 2009 |
1,591,817 | 977,686 | — | 1,938,543 | 630,960 | ||||||||||||
Allowance for Sales Returns for the: |
|||||||||||||||||
Year Ended December 31, 2007 |
241,411 | 710,103 | — | 330,285 | 621,229 | ||||||||||||
Year Ended December 31, 2008 |
621,229 | (135,969 | ) | — | 108,266 | 376,994 | |||||||||||
Year Ended December 31, 2009 |
376,994 | 482,891 | — | 756 | 859,129 | ||||||||||||
Inventory Obsolescence Reserve for the: |
|||||||||||||||||
Year Ended December 31, 2007 |
798,796 | 2,487,194 | — | 315,180 | 2,970,810 | ||||||||||||
Year Ended December 31, 2008 |
2,970,810 | 3,865,094 | — | 3,675,327 | 3,160,577 | ||||||||||||
Year Ended December 31, 2009 |
3,160,577 | 3,237,939 | — | 4,861,527 | 1,536,989 | ||||||||||||
Valuation Allowance for Deferred Tax Asset for the: |
|||||||||||||||||
Year Ended December 31, 2007 |
3,757,612 | 27,766,385 | — | — | 31,523,997 | ||||||||||||
Year Ended December 31, 2008 |
31,523,997 | 249,265 | — | — | 31,773,262 | ||||||||||||
Year Ended December 31, 2009 |
31,773,262 | 4,983,334 | — | — | 36,756,596 | ||||||||||||
Allowance for Warranty Reserve for the: |
|||||||||||||||||
Year Ended December 31, 2007 |
1,412,185 | 7,433,638 | — | 5,043,117 | 3,802,706 | ||||||||||||
Year Ended December 31, 2008 |
3,802,706 | 3,667,800 | — | 4,354,610 | 3,115,896 | ||||||||||||
Year Ended December 31, 2009 |
3,115,896 | 1,805,907 | — | 2,321,803 | 2,600,000 | ||||||||||||
See report of independent registered public accounting firm
S-1