Attached files
Table of Contents
UNITED STATES
SECURITIES AND EXCHANGE COMMISSION
Washington, D.C. 20549
Form 10-K
| x | Annual Report pursuant to Section 13 or 15(d) of the Securities Exchange Act of 1934 |
For the fiscal year ended December 31, 2009
or
| ¨ | Transition Report Pursuant to Section 13 or 15(d) of the Securities Exchange Act of 1934 |
For the transition period from to
Commission file number 000-17377
Commonwealth Bankshares, Inc.
(Exact name of registrant as specified in its charter)
| Virginia | 54-1460991 | |
| (State or other jurisdiction of incorporation or organization) |
(I.R.S. Employer Identification No.) | |
| 403 Boush Street Norfolk, Virginia | 23510 | |
| (Address of principal executive offices) | (Zip Code) | |
Registrant’s telephone number, including area code: (757) 446-6900
Securities registered pursuant to Section 12(b) of the Act:
| Title of each class |
Name of each exchange on which registered | |
| Common Stock, par value $2.066 per share | The NASDAQ Global Select Market |
Securities registered pursuant to Section 12(g) of the Act:
None
Indicate by check mark if the registrant is a well-known seasoned issuer, as defined in Rule 405 of the Securities Act. Yes ¨ No x
Indicate by check mark if the registrant is not required to file reports pursuant to Section 13 or Section 15(d) of the Act. Yes ¨ No x
Indicate by check mark whether the registrant (1) has filed all reports required to be filed by Section 13 or 15(d) of the Securities Exchange Act of 1934 during the preceding 12 months (or for such shorter period that the registrant was required to file such reports), and (2) has been subject to such filing requirements for the past 90 days. Yes x No ¨
Indicate by check mark whether the registrant has submitted electronically and posted on its corporate Website, if any, every Interactive Data File required to be submitted and posted pursuant to Rule 405 of Regulation S-T (§232.405 of this chapter) during the preceding 12 months (or for such shorter period that the registrant was required to submit and post such files). Yes ¨ No ¨
Indicate by check mark if disclosure of delinquent filers pursuant to Item 405 of Regulation S-K is not contained herein, and will not be contained, to the best of registrant’s knowledge, in definitive proxy or information statements incorporated by reference in Part III of this Form 10-K or any amendment to this Form 10-K. x
Indicate by check mark whether the registrant is a large accelerated filer, an accelerated filer, a non-accelerated filer, or a smaller reporting company. See the definitions of “large accelerated filer,” “accelerated filer” and “smaller reporting company” in Rule 12b-2 of the Exchange Act (Check one):
| Large accelerated filer | ¨ | Accelerated filer | ¨ | |||
| Non-accelerated filer | ¨ (do not check if a smaller reporting company) | Smaller reporting company | x | |||
Indicate by check mark whether the registrant is a shell company (as defined in Rule 12b-2 of the Exchange Act). Yes ¨ No x
The aggregate market value of the voting and non-voting common equity held by non-affiliates of the registrant as of June 30, 2009: $27,392,876 (In calculating the aggregate market value, the registrant used the closing sale price of the registrant’s common stock on the NASDAQ Global Select Market on June 30, 2009 which was $5.12 per share, voting and non-voting stock held by non-affiliates of the registrant at June 30, 2009 was 5,350,171 shares).
The number of shares of common stock outstanding as of February 26, 2010: Common Stock, $2.066 Par Value - 6,888,451 shares
Table of Contents
Table of Contents
Form 10-K Annual Report
For the Year Ended December 31, 2009
Table of Contents
2
Table of Contents
Part I
The Company. The sole business of Commonwealth Bankshares, Inc. (the “Parent”) is to serve as a holding company for Bank of the Commonwealth (the “Bank”). The Parent was incorporated as a Virginia corporation on June 6, 1988, and on November 7, 1988 acquired the Bank.
Bank of the Commonwealth was formed on August 28, 1970 under the laws of Virginia. Since the Bank opened for business on April 14, 1971, its main banking and administrative office has been located in Norfolk, Virginia. The Bank currently operates four branches in Norfolk, six branches in Virginia Beach, four branches in Chesapeake, two branches in Portsmouth, one branch in Suffolk, one branch in Powells Point, North Carolina, one branch in Waves, North Carolina, one branch in Moyock, North Carolina and one branch in Kitty Hawk, North Carolina. The Bank has six subsidiaries, all incorporated under the laws of the Commonwealth of Virginia: BOC Title of Hampton Roads, Inc., T/A Executive Title Center, BOC Insurance Agencies of Hampton Roads, Inc., Commonwealth Financial Advisors, LLC, Community Home Mortgage of Virginia, Inc., T/A Bank of the Commonwealth Mortgage, Commonwealth Property Associates, LLC and WOV Properties, LLC.
The accompanying consolidated financial statements include the accounts of the Parent, the Bank and its subsidiaries, collectively referred to as the “Company.”
The Company conducts mortgage funding services through its wholly owned subsidiary Bank of the Commonwealth Mortgage, brokerage and investment advisory services through its wholly owned subsidiary Commonwealth Financial Advisors, LLC, insurance activities through its wholly owned subsidiary BOC Insurance Agencies of Hampton Roads, Inc., and title insurance services through its 91% owned subsidiary Executive Title Center. The Company has a 61% ownership in Commonwealth Property Associates, LLC. Commonwealth Property Associates, LLC is the sole owner of 3732 North Croatan Highway, Kitty Hawk, North Carolina. The Company currently leases this property to house its North Carolina branch headquarters. See Item 13 “Certain Relationships and Related Transactions, and Director Independence” for a discussion of this relationship. The Company is also the sole owner of WOV Properties, LLC. This subsidiary was created to hold, manage and ultimately dispose of select other real estate owned properties the Company has elected to acquire through, or in lieu of, foreclosure. The financial position and operating results of any one of these subsidiaries are not significant to the Company as a whole and are not considered principal activities of the Company at this time.
The Parent also owns one non-operating subsidiary, Commonwealth Bankshares Capital Trust II, that was formed in November 2005. The trust was formed for the purpose of issuing $20.0 million of trust preferred capital securities. The trust is an unconsolidated subsidiary of the Parent and its principal asset is $20.6 million of the Parent’s junior subordinated debt securities (referred to herein as “trust preferred capital notes”) that is reported as a liability of the Parent.
The Parent previously owned Commonwealth Bankshares Capital Trust I, a non-operating wholly owned subsidiary that was formed on November 15, 2000 for the purpose of issuing 1,457,000 shares of 8.0% cumulative preferred securities maturing October 15, 2031 with the option to call on or after October 15, 2006 (call price of $5.00 per share) for $7,285,000. In November 2006, the Parent called the preferred securities for redemption on December 15, 2006, at the liquidation amount of $5.00 per share. As of December 31, 2006, the Trust was dissolved.
Principal Market Area. The Bank concentrates its marketing efforts in the cities of Norfolk, Virginia Beach, Portsmouth, Chesapeake and Suffolk, Virginia and in Northeastern North Carolina. The Company’s present intention is to continue concentrating its banking activities in its current markets, which the Company believes are attractive areas in which to operate. We have a mortgage office in Gloucester, Virginia. We also have a title insurance office in Suffolk, Virginia.
Banking Service. Through its network of banking facilities, the Bank provides a wide range of commercial banking services to individuals and small to medium-sized businesses. The Bank conducts substantially all of the business operations of a typical independent, commercial bank, including the acceptance of checking and savings deposits, and the initiating of commercial, real estate, personal, home improvement, automobile and other installment and term loans. The Bank also offers other related services, such as home banking, trust, travelers’ checks, safe deposit, lock box, depositor transfer, customer note payment, collections, notary public, escrow, drive-in facility and other customary banking services.
Competition
The Bank encounters strong competition for its banking services within its primary market area. The Bank competes with large national and regional financial institutions, savings associations and other independent community banks, as well as credit unions, mutual funds and life insurance companies. The banking business in the Bank’s primary market area is highly competitive for both loans and deposits, and is dominated by a relatively small number of large banks with many offices operating over a wide geographic area. Among the advantages such large banks have over the Bank are their ability to launch and finance wide-ranging advertising campaigns and, by virtue of their greater total capitalization, to have substantially higher lending limits than the Bank.
Factors such as interest rates offered, the number and location of branches and the types of products offered, as well as the reputation of the institution affect competition for deposits and loans. The Bank competes by emphasizing customer service and technology; establishing long-term customer relationships; building customer loyalty; and providing products and services to address the specific needs of its customers. The Bank targets individual and small-to-medium sized business customers. No material part of the Bank’s business is dependent upon a single or a few customers, and the loss of any single customer would not have a materially adverse effect upon the Bank’s business.
Because federal regulation of financial institutions changes regularly and is the subject of constant legislative debate, we cannot foresee how federal regulation of financial institutions may change in the future. However, it is possible that current and future governmental regulatory and economic initiatives could impact the competitive landscape in the Bank’s markets.
Employees
As of December 31, 2009, the Company had 196 full-time equivalent employees. Management of the Company considers its relations with employees to be excellent. No employees are represented by a union or any similar group, and the Company has never experienced any strike or labor dispute.
3
Table of Contents
Regulation and Supervision
The references in this section to various aspects of supervision and regulation are brief summaries which do not purport to be complete and which are qualified in their entirety by reference to applicable laws, rules and regulations. Also, such laws, rules and regulations are continually under review by Congress and state legislatures and federal and state regulatory agencies. A change in laws, rules and regulations applicable to the Company or Bank could have a material effect on our business.
Troubled Condition of the Bank
The Company received a letter from the Federal Reserve Bank of Richmond (“FRB”) dated December 11, 2009 stating that the Bank is deemed to be in “troubled condition” within the meaning of federal statutes and regulations. As a result, the Parent and the Bank are subject to additional limitations and regulatory restrictions, including restrictions on future changes in senior executive management and directors, making “golden parachute” payments and incurring debt. Also as a result of the Bank’s troubled condition, each of the Parent and the Bank may not pay dividends to its shareholders (including payments by the Parent related to trust preferred securities), and may not purchase or redeem shares of its stock without prior approval of the FRB and the Commissioner of the Virginia State Corporation Commission – Bureau of Financial Institutions (“SCC”).
Commonwealth Bankshares, Inc.
Bank Holding Company Act. In order to acquire the shares of the Bank and thereby become a bank holding company within the meaning of the Bank Holding Company Act, the Parent was required to obtain approval from, and register as a bank holding company, with the Board of Governors of the Federal Reserve System (the “Federal Reserve”), and it is subject to ongoing regulation, supervision and examination by the Federal Reserve. The Parent is required to file with the Federal Reserve periodic and annual reports and other information concerning its own business operations and those of its subsidiaries. In addition, the Bank Holding Company Act requires a bank holding company to obtain Federal Reserve approval before it acquires, directly or indirectly, ownership or control of any voting shares of a second or subsequent bank if, after such acquisition, it would own or control more than 5.0% of such shares, unless it already owns or controls a majority of such voting shares. Federal Reserve approval must also be obtained before a bank holding company acquires all or substantially all of the assets of another bank or merges or consolidates with another bank holding company. Under the Bank Holding Company Act, the Federal Reserve may disapprove an application or approve an application subject to such conditions as it may deem advisable. Any acquisition by a bank holding company of more than 5.0% of the voting shares, or of all or substantially all of the assets, of a bank located in another state may not be approved by the Federal Reserve unless such acquisition is specifically authorized by the laws of that second state.
Unless it chooses to become a financial holding company, as further described below, a bank holding company is prohibited under the Bank Holding Company Act, with limited exceptions, from acquiring or obtaining direct or indirect ownership or control of more than 5.0% of the voting shares of any company which is not a bank, or from engaging in any activities other than those of banking or of managing or controlling banks or furnishing services to or performing services for its subsidiaries. An exception to these prohibitions permits a bank holding company to engage in, or acquire an interest in a company which engages in, activities which the Federal Reserve, after due notice and opportunity for hearing, by regulation or order has determined is so closely related to banking or of managing or controlling banks as to be proper incident thereto. A number of such activities have been determined by the Federal Reserve to be permissible, including servicing loans, performing certain data processing services, and acting as a fiduciary, investment or financial advisor.
As a matter of policy, the Federal Reserve expects a bank holding company to act as a source of financial and managerial strength to its subsidiary banks and to commit resources to support its subsidiary banks. Under this “source of strength” doctrine, the Federal Reserve may require a bank holding company to make capital injections into a troubled subsidiary bank. The Federal Reserve may also determine that the bank holding company is engaging in unsafe and unsound practices if it fails to commit resources to such a subsidiary bank. A capital injection or other financial or managerial support may be required at times when the bank holding company does not have the resources to provide it. Such capital injections in the form of loans are also subordinate to deposits and to certain other indebtedness of its subsidiary banks.
Our ability to redeem shares of Parent stock is limited under Federal Reserve regulations. A bank holding company may not, without providing prior notice to the Federal Reserve, purchase or redeem its own stock if the gross consideration to be paid, when added to the net consideration paid by the company for all purchases or redemptions by the company of its equity securities within the preceding 12 months, will equal 10.0% or more of the company’s consolidated net worth, unless it meets the requirements of a well capitalized and well managed organization. In February 2009, the Federal Reserve issued SR 09-4 which, among other things, requires all bank holding companies to consult with the Federal Reserve prior to redeeming stock without regard to the bank holding company’s capital status or regulations otherwise permitting redemptions without prior approval of the Federal Reserve. The Federal Reserve has not indicated whether SR 09-4 will be rescinded.
Dividend Restrictions. The ability of the Parent to pay dividends depends upon the amount of dividends declared by the Bank, and is subject to various laws and regulations, including requirements to maintain capital at or above regulatory minimums. Regulatory restrictions also exist with respect to the Bank’s ability to pay dividends. See Note 14 to Consolidated Financial Statements included as Exhibit 99.1 of this report.
Capital Requirements. The Federal Reserve Board and the Federal Deposit Insurance Corporation (the “FDIC”) have issued substantially similar risk-based and leverage capital guidelines applicable to banking organizations they supervise. Under the risk-based capital requirements of these federal bank regulatory agencies, the Company and the Bank are required to maintain a minimum ratio of total capital to risk-weighted assets of at least 8.0% and a minimum ratio of Tier 1 capital to risk-weighted assets of at least 4.0%. At least one half of the total capital must be Tier 1 capital,
4
Table of Contents
which includes common equity, retained earnings and qualifying perpetual preferred stock, less certain intangibles and other adjustments. The remainder may consist of Tier 2 capital, such as a limited amount of subordinated and other qualifying debt (including certain hybrid capital instruments), other qualifying preferred stock and a limited amount of the general loan loss allowance. At December 31, 2009, the total capital to risk-weighted asset ratio of the Company was 11.14% and the ratio of the Bank was 11.09%. At December 31, 2009, the Tier 1 capital to risk-weighted asset ratio was 9.85% for the Company and 9.80% for the Bank.
In addition, each of the federal regulatory agencies has established leverage capital ratio guidelines for banking organizations. These guidelines provide for a minimum Tier 1 leverage ratio of 4.0% for banks and bank holding companies. At December 31, 2009, the Tier 1 leverage ratio was 8.43% for the Company and 8.37% for the Bank. The guidelines also provide that banking organizations experiencing internal growth or making acquisitions must maintain capital positions substantially above the minimum supervisory levels, without significant reliance on intangible assets. In addition, the regulations of the bank regulators provide that concentration of credit risks arising from non-traditional activities, as well as an institution’s ability to manage those risks and other types of risks to which banking organizations may be exposed, are important factors to be taken into account by regulatory agencies in assessing an organization’s overall capital adequacy.
Virginia Financial Institution Holding Company Act. Under certain amendments to the Virginia Financial Institutions Holding Company Act that became effective July 1, 1983, no company, partnership or other business entity may acquire, or make any public offer to acquire, more than 5.0% of the stock of any Virginia financial institution, or any Virginia financial institution holding company, unless it first files an application with the SCC. The SCC is directed by the statute to solicit the views of the affected financial institution, or financial institution holding company, with respect to such stock acquisition, and is empowered to conduct an investigation during the 60 days following receipt of such an application. If the SCC takes no action within the prescribed period, or if during the prescribed period it issues notice of its intent not to disapprove an application, the acquisition may be completed.
Securities and Exchange Commission Regulation. The Company is required to make certain periodic filings with the Securities and Exchange Commission (“SEC”) as well as file certain reports on the occurrence of certain material events specified under the Securities Exchange Act of 1934 (“Exchange Act”). Specifically, the Company is required to file quarterly and annual reports with the SEC under Section 13 of the Exchange Act, furnish annual reports to stockholders prior to annual meetings of stockholders, and send proxy statements to stockholders prior to any stockholders’ meeting, all of which must comply with the provisions of the Exchange Act. In addition, directors, officers and certain stockholders must make detailed disclosures under the Exchange Act regarding their ownership of the Company’s common stock. As an Exchange Act reporting company, we are directly affected by the Sarbanes-Oxley Act of 2002 (the “Sarbanes-Oxley Act”), which seeks to improve corporate governance and reporting procedures by requiring expanded disclosure of our corporate operations and internal controls. We are already complying with SEC and other rules and regulations implemented pursuant to the Sarbanes-Oxley Act and intend to comply with any applicable rules and regulations implemented in the future. Although we have incurred, and expect to continue to incur, additional expense in complying with the provisions of the Sarbanes-Oxley Act and the resulting regulations, our management does not expect such compliance to have a material impact on our financial condition or results of operations in the future.
Emergency Economic Stabilization Act of 2008. In response to the financial crisis affecting the banking system and financial markets, the Emergency Economic Stabilization Act of 2008 (“EESA”), was enacted on October 3, 2008. The EESA authorizes the U.S. Treasury (“Treasury”), to provide up to $700 billion in funding to stabilize and provide liquidity to the financial markets. Pursuant to the EESA, the Treasury was initially authorized to use $350 billion for the Troubled Asset Relief Program (“TARP”). Of this amount, the Treasury allocated $250 billion to the TARP Capital Purchase Program described below. On January 15, 2009, the second $350 billion of TARP monies was released to the Treasury. On February 17, 2009, the American Recovery and Reinvestment of 2009 (“AARA”), was enacted which amended, in certain respects, the EESA and provided an additional $787 billion in economic stimulus funding.
Under the TARP Capital Purchase Program, the Treasury will invest up to $250 billion in senior preferred stock of U.S. banks and savings associations or their holding companies. Qualifying financial institutions may issue senior preferred stock with a value equal to not less than 1% of risk-weighted assets and not more than the lesser of $25 billion or 3% of risk-weighted assets. In conjunction with the issuance of the senior preferred stock, participating institutions must issue to the Treasury immediately exercisable 10-year warrants to purchase common stock with an aggregate market price equal to 15% of the amount of senior preferred stock. Participating financial institutions are required to adopt the Treasury’s standards for executive compensation and corporate governance for the period during which the Treasury holds equity issued under the TARP Capital Purchase Program. The Company is not participating in the TARP Capital Purchase Program.
Available Information. Any material the Company files with the SEC is available to be read and copied by the public at the SEC’s Public Reference Room at 100 F Street, NE, Washington, DC 20549. The public may obtain information on the operation of the Public Reference Room by calling the SEC at 1-800-SEC-0330. The SEC also maintains an internet site that contains reports, proxy information statements, and other information regarding issuers that file electronically with the SEC at http://www.sec.gov. The Company’s SEC filings are also available through our website at http://www.bankofthecommonwealth.com as of the day they are filed with the SEC. Copies of documents also can be obtained free of charge by writing to the Company’s Chief Financial Officer, Cynthia A. Sabol, at 403 Boush Street, Norfolk, VA 23510.
Bank of the Commonwealth
The Bank, as a member bank of the Federal Reserve System, is subject to regulation and examination by the Virginia State Corporation Commission and the Federal Reserve. In addition, the Bank is subject to the rules and regulations of the FDIC, which currently insures substantially all of the Bank’s deposits up to applicable limits by the Deposit Insurance Fund (“DIF”) of the FDIC and are subject to deposit insurance assessments to maintain the DIF.
5
Table of Contents
FDIC Insurance, Assessments and Regulation. The FDIC utilizes a risk-based assessment system that imposes insurance premiums based upon a risk matrix that takes into account a bank’s capital level and supervisory rating (“CAMELS rating”). The risk matrix utilizes four risk categories which are distinguished by capital levels and supervisory ratings. An institution’s assessment rate depends on the category to which it is assigned.
Pursuant to the Federal Deposit Insurance Reform Act of 2005 (“FDIRA”), the FDIC is authorized to set the reserve ratio for the DIF annually at between 1.15% and 1.50% of estimated insured deposits. The FDIC may increase or decrease the assessment rate schedule on a semi-annual basis. Pursuant to the EESA, the maximum deposit insurance amount has been increased from $100,000 to $250,000 per depositor. The EESA, as amended by the Helping Families Save Their Homes Act of 2009, provides that the basic deposit insurance limit will return to $100,000 after December 31, 2013. The legislation did not change coverage for retirement accounts, which continues to be $250,000.
The FDIC made several adjustments to the assessment rate during 2009 including a special assessment permitted under statutory authority granted in 2008. The assessment schedule published as of April 1, 2009 and effective for assessments on and after September 30, 2009 provides for assessment ranges, based upon risk assessment of each insured depository institution, of between $0.07 and $0.775 per $100 of domestic deposits.
In May 2009, the FDIC issued a final rule which levied a special assessment applicable to all insured depository institutions totaling 5 basis points of each institution’s total assets less Tier 1 capital as of June 30, 2009, not to exceed 10 basis points of domestic deposits. The special assessment was part of the FDIC’s efforts to rebuild the DIF. Deposit insurance expense during 2009 included approximately $500.0 thousand recognized in the second quarter related to the special assessment.
In November 2009, the FDIC issued a rule that required all insured depository institutions, with limited exceptions, to prepay their estimated risk-based assessments for the fourth quarter of 2009 and for all of 2010, 2011 and 2012. The FDIC also adopted a uniform three-basis point increase in assessment rates effective on January 1, 2011. Under the rule, an institution could apply to the FDIC for an exemption from all or part of the prepayment requirement. The Bank applied for and received a full exemption from the prepayment assessment, which would have required a payment to the FDIC of approximately $10.0 million in December 2009. Having been granted the exemption, the Bank will continue to pay its FDIC insurance premiums on a quarterly basis.
FDIC insurance expense totaled $1.9 million, $408.5 thousand and $73.8 thousand in 2009, 2008 and 2007, respectively. FDIC insurance expense includes deposit insurance assessments and Financing Corporation (“FICO”) assessments related to outstanding FICO bonds. The FICO is a mixed-ownership government corporation established by the Competitive Equality Banking Act of 1987 whose sole purpose was to function as a financing vehicle for the now defunct Federal Savings & Loan Insurance Corporation.
FDIRA also provided for a one-time credit for eligible institutions based on their assessment base as of December 31, 2006. Subject to certain limitations with respect to institutions that are exhibiting weakness, credits can be used to offset assessments until exhausted. The Bank’s one-time credit was approximately $125,000. FDIRA also provided for the possibility that the FDIC may pay dividends to insured institutions if the DIF reserve ration equals or exceeds 1.35% of estimated insured deposits.
Under the FDIRA, the FDIC may terminate deposit insurance upon a finding that the institution has engaged in unsafe and unsound practices, is in an unsafe or unsound condition to continue operations, or has violated any applicable law, regulation, rule, order or condition imposed by the FDIC.
If the FDIC is appointed the conservator or receiver of an insured depository institution upon its insolvency or in certain other events, the FDIC has the power, among other things: (1) to transfer any of the depository institution’s assets and liabilities to a new obligor without the approval of the depository institution’s creditors; (2) to enforce the terms of the depository institution’s contracts pursuant to their terms; or (3) to repudiate or disaffirm any contract or lease to which the depository institution is party, the performance of which is determined by the FDIC to be burdensome and the disaffirmation or repudiation of which is determined by the FDIC to promote the orderly administration of the depository institution.
The FDIRA requires that federal bank regulatory agencies prescribe standards, by regulations or guidelines, relating to internal controls, information systems and internal audit systems, loan documentation, credit underwriting, interest rate risk exposure, asset growth, asset quality, earnings, stock valuation and compensation, fees and benefits, and such other operational and managerial standards as the agencies deem appropriate. Guidelines adopted by the federal bank regulatory agencies establish general standards relating to internal controls and information systems, internal audit systems, loan documentation, credit underwriting, interest rate exposure, asset growth and compensation, fees and benefits. In general, the guidelines require, among other things, appropriate systems and practices to identify and manage the risk and exposures specified in the guidelines. The guidelines prohibit excessive compensation as an unsafe and unsound practice and describe compensation as excessive when the amounts paid are unreasonable or disproportionate to the services performed by an executive officer, employee, director or principal stockholder. In addition, the agencies adopted regulations that authorize, but do not require, an agency to order an institution that has been given notice by an agency that is not satisfying any of such safety and soundness standards to submit a compliance plan. If, after being so notified, an institution fails to submit an acceptable compliance plan or fails in any material respect to implement an acceptable compliance plan, the agency must issue an order directing action to correct the deficiency and may issue an order directing other actions of the types to which an undercapitalized institution is subject under the “prompt corrective action” provisions of FDIRA. See “Prompt Corrective Action” below. If an institution fails to comply with such an order, the agency may seek to enforce such order in judicial proceedings and to impose civil penalties.
In November 2008, the Board of Directors of the FDIC adopted a final rule relating to the Temporary Liquidity Guarantee Program (“TLG Program”). The TLG Program was announced by the FDIC in October 2008 as an initiative to counter the system-wide liquidity crisis in the nation’s financial sector. Under the TLG Program, the FDIC will (i) guarantee, through the earlier of maturity or December 31, 2012 (extended from June 30, 2012 by subsequent amendment), certain newly issued senior unsecured debt issued by participating institutions on or after October 14, 2008, and before October 31, 2009 (extended from June 30, 2009 by subsequent amendment) and (ii) provide full FDIC deposit insurance coverage for certain non-interest bearing transaction deposit accounts (as defined in the regulation) held at participating FDIC insured institutions through June 30, 2010 (extended from December 31, 2009, subject to an opt-out provision, by subsequent amendment). The Company elected to participate in both guarantee programs and did not opt out of the six-month extension of the transaction account guarantee program. Coverage under the TLG Program was available for the first 30 days without charge. The fee assessment for coverage of senior unsecured debt ranged from 50 basis points to 100 basis points per annum, depending on the initial maturity of the debt. The fee assessment for deposit insurance coverage was 10 basis points per quarter during 2009 on amounts in covered accounts exceeding $250,000. During the six-month extension period in 2010, the fee assessment increases to between 15 basis points and 25 basis points per quarter depending on the institution’s Risk Category of the risk-based premium system. The Company has thus far not issued any senior unsecured debt under the TLG Program. The Company does, however, have non-interest bearing transaction deposit accounts insured under the TLG Program and has been incurring related assessment charges since November 2008.
6
Table of Contents
The FDIRA provides that, in the event of the “liquidation or other resolution” of an insured depository institution, the claims of depositors of the institution, including the claims of the FDIC as subrogee of insured depositors, and certain claims for administrative expenses of the FDIC as a receiver, will have priority over other general unsecured claims against the institution. If an insured depository institution fails, insured and uninsured depositors, along with the FDIC, will have priority in payment ahead of unsecured, non-deposit creditors, including depositors whose deposits are payable only outside of the United States and the parent bank holding company, with respect to any extensions of credit they have made to such insured depository institution.
FDIC-insured depository institutions can be held liable for any loss incurred, or reasonably expected to be incurred, by the FDIC due to the default of another FDIC-insured depository institution controlled by the same bank holding company, or for any assistance provided by the FDIC to another FDIC-insured depository institution controlled by the same bank holding company that is in danger of default. “Default” means generally the appointment of a conservator or receiver. “In danger of default” means generally the existence of certain conditions indicating that default is likely to occur in the absence of regulatory assistance. Such a “cross-guarantee” claim against a depository institution is generally superior in right of payment to claims of the holding company and its affiliates against that depository institution. At this time, the Bank is the only insured depository institution controlled by the Company for this purpose. However, if the Company were to control other FDIC-insured depository institutions in the future, the cross-guarantee would apply to all such FDIC-insured depository institutions.
Monetary and Fiscal Policies. The commercial banking business is affected by the monetary policies adopted by the Federal Reserve. Changes in the discount rate on member bank borrowing, availability of borrowing at the “discount window,” open market operations, the imposition of any changes in reserve requirements against member banks’ deposits and certain borrowing by banks and their affiliates, and the limitation of interest rates which member banks may pay on deposits are some of the instruments of monetary policy available to the Federal Reserve. Taken together, these controls give the Federal Reserve a significant influence over the growth and profitability of all banks. Management of the Bank is unable to predict how the Federal Reserve’s monetary policies (or the fiscal policies or economic controls imposed by federal or state governments) will affect the business and earnings of the Bank or the Company, or what those policies or controls will be.
USA Patriot Act of 2001. In October 2001, the USA Patriot Act of 2001 (the “Patriot Act”) was enacted in response to the terrorist attacks in New York, Pennsylvania and Washington, D.C. which occurred on September 11, 2001. The Patriot Act is intended to strengthen the ability of U.S. law enforcement agencies and the intelligence communities to work cohesively to combat terrorism on a variety of fronts. The potential impact of the Patriot Act on financial institutions of all kinds is significant and wide ranging. The Patriot Act contains sweeping anti-money laundering and financial transparency laws and imposes various regulations, including standards for verifying client identification at account opening, and rules to promote cooperation among financial institutions, regulators and law enforcement entities in identifying parties that may be involved in terrorism or money laundering.
Community Reinvestment Act. The Community Reinvestment Act (“CRA”) imposes on financial institutions an affirmative and ongoing obligation to meet the credit needs of their local communities, including low and moderate-income neighborhoods, consistent with the safe and sound operation of those institutions. A financial institution’s efforts in meeting community credit needs are assessed based on 12 factors. These factors also are considered in evaluating mergers, acquisitions and applications to open a branch or facility. Following the Bank’s most recent scheduled compliance examination in February 2009, it received a CRA performance evaluation of “satisfactory”.
Federal Home Loan Bank of Atlanta. The Bank is a member of the Federal Home Loan Bank (“FHLB”) of Atlanta, which is one of 12 regional FHLBs that provide funding to their members for making housing loans as well as for affordable housing and community development loans. Each FHLB serves as a reserve, or central bank, for the members within its assigned region. Each is funded primarily from proceeds derived from the sale of consolidated obligations of the FHLB System. Each FHLB makes loans to members in accordance with policies and procedures established by the Board of Directors of the FHLB. As a member, the Bank must purchase and maintain stock in the FHLB of Atlanta. In 2004, the FHLB converted to its new capital structure, which established the minimum capital stock requirement for member banks as an amount equal to the sum of a membership requirement and an activity-based requirement. At December 31, 2009, the Bank held $7.1 million of FHLB of Atlanta stock.
Reporting Terrorist Activities. The Federal Bureau of Investigation (“FBI”) has sent, and will send, banking regulatory agencies lists of the names of persons suspected of involvement in terrorist activities. The Bank has been requested, and will be requested, to search its records for any relationships or transactions with persons on those lists. If the Bank finds any relationships or transactions, it must file a suspicious activity report with the Treasury Department and contact the FBI.
The Office of Foreign Assets Control (“OFAC”), which is a division of the Treasury Department, is responsible for helping to ensure that United States entities do not engage in transactions with “enemies” of the United States, as defined by various Executive Orders and Acts of Congress. OFAC has sent, and will send, banking regulatory agencies lists of names of persons and organizations suspected of aiding, harboring or engaging in terrorist acts. If the Bank finds a name on any transaction, account or wire transfer that is on an OFAC list, it must freeze such account, file a suspicious activity report with the Treasury Department and notify the FBI. The Bank has appointed an OFAC compliance officer to oversee the inspection of its accounts and the filing of any notifications. The Bank actively checks high-risk areas such as new accounts, wire transfers and customer files. The Bank performs these checks utilizing software, which is updated each time a modification is made to the lists of Specially Designated Nationals and Blocked Persons provided by OFAC and other agencies.
Consumer Protection. The Fair and Accurate Credit Transactions Act of 2003, which amended the Fair Credit Reporting Act, requires financial institutions to implement policies and procedures that track identity theft incidents; provide identity-theft victims with evidence of fraudulent transactions upon request; block from reporting to consumer reporting agencies credit information resulting from identity theft; notify customers of adverse information concerning the customer in consumer reporting agency reports; and notify customers when reporting negative information concerning the customer to a consumer reporting agency.
7
Table of Contents
Prompt Correction Action. The federal banking agencies have broad powers under current federal law to take prompt corrective action to resolve problems of insured depository institutions. The extent of these powers depends upon whether the institution in question is “well capitalized,” “adequately capitalized,” “undercapitalized,” “significantly undercapitalized” or “critically under capitalized.” These terms are defined under uniform regulations issued by each of the federal banking agencies regulating these institutions. An insured depository institution which is less than adequately capitalized must adopt an acceptable capital restoration plan, is subject to increased regulatory oversight and is increasingly restricted in the scope of its permissible activates. As of December 31, 2009, the Bank was considered “well capitalized.”
Gramm-Leach-Bliley Act of 1999 (“GLBA”). The GLBA implemented major changes to the statutory framework for providing banking and other financial services in the United States. The GLBA, among other things, eliminated many of the restrictions on affiliations among banks and securities firms, insurance firms and other financial service providers. A bank holding company that qualifies and elects to be a financial holding company is permitted to engage in activities that are financial in nature or incident or complimentary to financial activities. The activities that the GLBA expressly lists as financial in nature include insurance underwriting, sales and brokerage activities, financial and investment advisory services, underwriting services and limited merchant banking activities.
To become eligible for these expanded activities, a bank holding company must qualify as a financial holding company. To qualify as a financial holding company, each insured depository institution controlled by the bank holding company must be well-capitalized, well-managed and have at least a satisfactory rating under the CRA. In addition, the bank holding company must file with the Federal Reserve a declaration of its intention to become a financial holding company. While the Parent satisfies these requirements, the Parent has not elected to be treated as a financial holding company under the GLBA.
The GLBA has not had a material adverse impact on the Company’s or the Bank’s operations. To the extent that it allows banks, securities firms and insurance firms to affiliate, the financial services industry may experience further consolidation. The GLBA may have the result of increasing competition that the Bank faces from larger institutions and other companies that offer financial products and services that may have substantially greater financial resources than the Company or the Bank.
The GLBA and certain regulations issued by federal banking agencies also provide protections against the transfer and use by financial institutions of consumer nonpublic personal information. A financial institution must provide to its customers, at the beginning of the customer relationship and annually thereafter, the institution’s policies and procedures regarding the handling of customers’ nonpublic personal financial information. These privacy provisions generally prohibit a financial institution from providing a customer’s personal financial information to unaffiliated third parties other than permitted by law.
Check Clearing for the 21st Century Act (“Check 21”). Check 21 gives “substitute checks,” such as a digital image of a check and copies made from that image, the same legal standing as the original paper check. The major provisions of Check 21 include: allowing check truncation without making it mandatory; demanding that every financial institution communicate to account holders in writing a description of its substitute check processing program and their rights under the law; legalizing substitutions for and replacements of paper checks without agreement from consumers; retaining in place the previously-mandated electronic collection and return of checks between financial institutions only when individual agreements are in place; requiring that when account holders request verification, financial institutions produce the original check (or a copy that accurately represents the original) and demonstrate that the account debit was accurate and valid; and requiring recrediting of funds to an individual’s account on the next business day after a consumer proves that the financial institution has erred. This legislation has not significantly increased our capital spending.
Regulatory Reform. In June 2009, the President’s administration proposed a wide range of regulatory reforms that, if enacted, may have significant effects on the financial services industry in the United States. Significant aspects of the administration’s proposals that may affect the Company included, among others things, proposals: (i) to reassess and increase capital requirements for banks and bank holding companies and examine the types of instruments that qualify as regulatory capital; (ii) to create a federal consumer financial protection agency to be the primary federal consumer protection supervisor with broad examination, supervision and enforcement authority with respect to consumer financial products and services; and (iii) to further limit the ability of banks to engage transactions with affiliates.
The Congress, state lawmaking bodies and federal and state regulatory agencies continue to consider a number of wide-ranging and comprehensive proposals for altering the structure, regulation and competitive relationships of the nation’s financial institutions, including rules and regulations related to the administration’s proposals. Separate comprehensive financial reform bills intended to address the proposals set forth by the administration were introduced in both houses of Congress in the second half of 2009 and remain under review by both the U.S. House of Representatives and the U.S. Senate. In addition, both the U.S. Treasury Department and the Basel Committee have issued policy statements regarding proposed significant changes to the regulatory capital framework applicable to banking organizations. The Company cannot predict whether or in what form further legislation or regulations may be adopted or the extent to which the Company may be affected thereby.
On October 22, 2009, the Federal Reserve issued a comprehensive proposal on incentive compensation policies (the “Incentive Compensation Proposal”) intended to ensure that the incentive compensation policies of banking organizations do not undermine the safety and soundness of such organizations by encouraging excessive risk-taking. The Incentive Compensation Proposal, which covers all employees that have the ability to materially affect the risk profile of an organization, either individually or as part of a group, is based upon the key principles that a banking organization’s incentive compensation arrangements should (i) provide incentives that do not encourage risk-taking beyond the organization’s ability to effectively identify and manage risks, (ii) be compatible with effective internal controls and risk management, and (iii) be supported by strong corporate governance, including active and effective oversight by the organization’s board of directors. Banking organizations are instructed to begin an immediate review of their incentive compensation policies to ensure that they do not encourage excessive risk-taking and implement corrective programs as needed. Where there are deficiencies in the incentive compensation arrangements, they must be immediately addressed.
The Federal Reserve will review, as part of the regular, risk-focused examination process, the incentive compensation arrangements of banking organizations, such as the Company, that are not “large, complex banking organizations.” These reviews will be tailored to each organization
8
Table of Contents
based on the scope and complexity of the organization’s activities and the prevalence of incentive compensation arrangements. The findings of the supervisory initiatives will be included in reports of examination. Deficiencies will be incorporated into the organization’s supervisory ratings, which can affect the organization’s ability to make acquisitions and take other actions. Enforcement actions may be taken against a banking organization if its incentive compensation arrangements, or related risk-management control or governance processes, pose a risk to the organization’s safety and soundness and the organization is not taking prompt and effective measures to correct the deficiencies.
In addition, on January 12, 2010, the FDIC announced that it would seek public comment on whether banks with compensation plans that encourage risky behavior should be charged at higher deposit assessment rates than such banks would otherwise be charged.
The scope and content of the U.S. banking regulators’ policies on executive compensation are continuing to develop and are likely to continue evolving in the near future. It cannot be determined at this time whether compliance with such policies will adversely affect the Company’s ability to hire, retain and motivate its key employees.
In addition to the specific proposals described above, from time to time, various legislative and regulatory initiatives are introduced in Congress and state legislatures, as well as by regulatory agencies. Such initiatives may include proposals to expand or contract the powers of bank holding companies and depository institutions or proposals to substantially change the financial institution regulatory system. Such legislation could change banking statutes and the operating environment of the Company in substantial and unpredictable ways. If enacted, such legislation could increase or decrease the cost of doing business, limit or expand permissible activities or affect the competitive balance among banks, savings associations, credit unions, and other financial institutions. The Company cannot predict whether any such legislation will be enacted, and, if enacted, the effect that it, or any implementing regulations, would have on the financial condition or results of operations of the Company. A change in statutes, regulations or regulatory policies applicable to the Company or any of its subsidiaries could have a material effect on the business of the Company.
An investment in the Parent’s common stock involves significant risks inherent to the Company’s business. Like other bank holding companies, we are subject to a number of risks, many of which are outside of our control. If any of the events or circumstances described in the following risk factors actually occur, our business, financial condition, results of operations and prospects could be harmed. These risks are not the only ones that we may face. Other risks of which we are not aware, including those which relate to the banking and financial services industry in general and us in particular, or those which we do not currently believe are material, may harm our future business, financial condition, results of operations and prospects. Readers should consider carefully the following important factors in evaluating us, our business and an investment in our securities.
We may incur significant credit losses, particularly in light of current market conditions.
We take on credit risk by virtue of making loans and extending loan commitments and letters of credit. Our credit standards, procedures and policies may not prevent us from incurring substantial credit losses, particularly in light of market developments in recent years. During 2008 and 2009, we experienced deterioration in credit quality, particularly in certain real estate development loans, due, in part, to the impact resulting from the downturn in the prevailing economic, real estate and credit markets. This deterioration resulted in higher levels of non-performing assets, including other real estate owned and internally risk classified loans, thereby increasing our provision for loan losses and decreasing our operating income in 2008 and 2009. As of December 31, 2009, we had total non-performing assets of approximately $89.0 million, compared with approximately $52.0 million as of December 31, 2008 and approximately $5.7 million as of December 31, 2007. Given the current economic conditions and trends, management believes we may continue to experience credit deterioration and higher levels of non-performing loans in the near-term, which could likely have a materially adverse impact on our business, financial condition, results of operations and prospects.
A continuation or further deterioration of the current economic environment could adversely impact our financial condition and results of operations.
A continuation of the recent turbulence in significant portions of the global financial markets, particularly if it worsens, could impact the Company’s performance, both directly by affecting our revenues and the value of our assets and liabilities, and indirectly by affecting our counterparties and the economy generally. Dramatic declines in the housing market in the past two years have resulted in significant write-downs of asset values by financial institutions. Concerns about the stability of the financial markets generally have reduced the availability of funding to certain financial institutions, leading to a tightening of credit, reduction of business activity and increased market volatility. It is not clear at this time what impact existing or future liquidity and funding initiatives of the U.S. Treasury and other bank regulatory agencies will have on the financial markets and the financial services industry. The extreme levels of volatility and limited credit availability currently being experienced could continue to affect the U.S. banking industry and the broader U.S. and global economies, which would have an effect on all financial institutions, including the Company.
We may incur losses if we are unable to successfully manage interest rate risk.
Our profitability depends in substantial part upon the spread between the interest rates we earn on investments and loans and the interest rates we pay on deposits and other interest-bearing liabilities. These rates are normally in line with our competition and might vary based on the Asset/Liability Management Committee’s vision of the Company’s needs. Changes in interest rates will affect our operating performance and financial condition in diverse ways including the pricing of securities, loans and deposits, and the volume of loan originations in our mortgage banking business. We attempt to minimize our exposure to interest rate risk, but we will be unable to eliminate it. Our net interest spread depends on many factors that are partly or entirely outside our control, including competition, federal economic, monetary and fiscal policies, and economic conditions generally.
9
Table of Contents
Increased liquidity could have a negative impact on our financial condition.
Liquidity risk is the potential that the Company will be unable to meet its obligations as they come due, or capitalize on growth opportunities as they arise because of an inability to liquidate assets or obtain adequate funding in a timely basis, at a reasonable cost and within acceptable risk tolerances.
Liquidity is required to fund various obligations, including credit commitments to borrowers, other loan originations, withdrawals by depositors, repayment of borrowings, dividends to shareholders, operating expenses and capital expenditures.
Liquidity is derived primarily from retail deposit growth and retention; principal and interest payments on loans; principal and interest payments on investment securities; sale, maturity and prepayment of investment securities; net cash provided from operations and access to other funding sources.
Our access to funding sources in amounts adequate to finance our activities could be impaired by factors that affect us specifically or the financial services industry in general. Factors that could detrimentally impact our access to liquidity sources include a decrease in the level of our business activity due to a market downturn or adverse regulatory action against us. Our ability to borrow could also be impaired by factors that are not specific to us, such as a severe disruption of the financial markets or negative views and expectations about the prospects for the financial services industry as a whole as the recent turmoil faced by banking organizations in the domestic and worldwide credit markets deteriorates. Our ability to access financing could have an adverse effect on our financial condition.
General business and economic conditions may significantly affect our earnings.
Our business and earnings are sensitive to general business and economic conditions. A favorable business environment is generally characterized by, among other factors, economic growth, efficient capital markets, low inflation, high business and investor confidence and strong business earnings. Unfavorable or uncertain economic and market conditions can be caused by: declines in economic growth, business activity or investor or business confidence; limitations on the availability or increases in the cost of credit and capital; increases in volatility, inflation or interest rates; natural disasters; or a combination of these or other factors.
Since December 2007, the United States has been in a recession. Business activity across a wide range of industries and regions is greatly reduced and local governments and many businesses are experiencing serious difficulties due to the lack of consumer spending and the lack of liquidity in the credit markets. Unemployment has increased significantly. It is expected that the business environment will continue to deteriorate for the foreseeable future. There can be no assurance when these conditions will improve. The resulting economic pressure on consumers and lack of confidence in the financial market could adversely affect our business, financial condition and results of operations.
Dramatic declines in the housing market with falling home prices and increasing foreclosures, unemployment and under-employment, have negatively impacted the credit performance of real estate related loans and resulted in significant write-downs of asset values by financial institutions, including government sponsored entities. These write-downs, initially of asset-backed securities but spreading to other securities and loans, have caused many financial institutions to seek additional capital, to reduce or eliminate dividends, to merge with larger and stronger institutions and, in some cases, to fail. Reflecting concern about the stability of the financial markets generally and the strength of counterparties, many lenders and institutions investors have reduced or ceased providing funding to borrowers, including to other financial institutions. This market turmoil and tightening of credit have led to an increased level of commercial and consumer delinquencies, lack of consumer confidence, increased market volatility and widespread reduction of business activity generally.
The Company’s general financial performance, as well as the ability of borrowers to pay interest on and repay principal of outstanding loans and the value of collateral securing those loans, is highly dependent upon the business environment in the markets where the Company operates and in the United States as a whole. Declines in real estate values in the Company’s markets have adversely impacted results of operations. A continued decline in real estate values in the Company’s markets could have a further negative effect on results of operations, and a significant decline in real estate values would likely lead to increased delinquencies and credit quality issues in the Company’s loan portfolio. In addition, a prolonged economic downturn coupled with increased unemployment and decreased consumer spending could have a further negative effect on results of the Company’s operations through higher credit losses in the commercial loan, commercial real estate loan and commercial real estate construction loan portfolios.
The Bank is deemed to be in “troubled condition” within the meaning of federal statutes and regulations.
The Bank is deemed to be in “troubled condition” within the meaning of federal statutes and regulations. As a result, certain additional limitations and regulatory requirements apply to the Parent and the Bank with respect to, among other things, future changes in senior executive management and directors, the payment of, or the agreement to pay, certain severance payments to officers, directors and employees and incurring debt. Also as a result of being deemed to be in troubled condition, each of the Parent and the Bank may not pay dividends to its shareholders (including payments by the Parent related to trust preferred securities), and may not purchase or redeem its stock without prior approval of the FRB and the SCC.
We may be adversely affected by economic conditions in our market area.
Our current market areas are the South Hampton Roads portion of Virginia, which includes the cities of Norfolk, Chesapeake, Virginia Beach, Portsmouth and Suffolk and the Northeastern portion of North Carolina, which includes the Outer Banks. In the event of an economic downturn in these markets, the lack of geographic diversification could adversely affect the banking business and, consequently, our results of operations and financial condition. Changes in the economy may influence the growth rate of our loans and deposits, the quality of the loan portfolio, loan and deposit pricing and the performance of our mortgage banking and title insurance subsidiaries. A significant decline in general economic conditions caused by inflation, recession, unemployment or other factors beyond our control would impact these local economic conditions and the demand for banking products and services generally, which could negatively affect our financial condition and performance.
10
Table of Contents
Although we might not have significant credit exposure to all the businesses in our areas, the downturn in any of these businesses could have a negative impact on local economic conditions and real estate collateral values generally, which could negatively affect our profitability.
Our small to medium-sized business target market may have fewer financial resources to weather a downturn in the economy.
We target our commercial development and marketing strategy primarily to serve the banking and financial services needs of small and medium-sized businesses. These businesses generally have fewer financial resources in terms of capital or borrowing capacity than larger entities. If general economic conditions negatively impact this major economic sector in the markets we operate, our results of operations and financial condition may be adversely affected.
Our concentration of real estate loans subjects us to increased risks in the event real estate values continue to decline due to the economic recession, a further deterioration in the real estate markets or other causes.
We offer a variety of secured loans, including commercial lines of credit, commercial term loans, real estate, construction, home equity, consumer and other loans. Many of our loans are secured by real estate (both residential and commercial) in our market area. The current economic recession, deterioration in the real estate markets and increasing delinquencies and foreclosures have had an adverse effect on the collateral value for many of our loans and on the repayment ability of many of our borrowers. The continuation or further deterioration of these factors, including increasing foreclosures and unemployment, will continue to have the same or similar adverse effects. In addition, these factors could reduce the amount of loans we make to businesses in the construction and real estate industry, which could negatively impact our interest income and results of operations. A continued decline in real estate values could also lead to higher charge-offs in the event of defaults in our real estate loan portfolio. Similarly, the occurrence of a natural or manmade disaster in our market areas could impair the value of the collateral we hold for real estate secured loans. Any one or a combination of the factors identified above could negatively impact our business, financial condition, results of operations and prospects.
We have a concentration of credit exposure in commercial real estate.
At December 31, 2009, we had approximately $549.9 million in loans to borrowers in the commercial real estate industry, representing approximately 53.2% of our total loans outstanding as of that date. The real estate consists primarily of hotel/motel, condo conversion/construction and other commercial properties. These types of loans are generally viewed as having more risk of default than residential loans. They are also typically larger than residential real estate loans and consumer loans and depend on cash flows from the owner’s business or the property to service the debt. Cash flows may be affected significantly by general economic conditions, and a downturn in the local economy or in occupancy rates in the local economy where the property is located could increase the likelihood of default. Because our loan portfolio contains a number of commercial real estate loans with relatively large balances, the deterioration of one or a few of these loans could cause a significant increase in our percentage of non-performing loans. An increase in non-performing loans could result in a loss of earnings from these loans, an increase in the provision for loan losses and an increase in charge-offs, all of which could have a material adverse effect on our financial condition and results of operations.
Our commercial real estate loans have decreased 14.2% since December 31, 2008. Banking regulators are giving commercial real estate lending greater scrutiny, and may require banks with higher levels of commercial real estate loans to implement improved underwriting, internal controls, risk management policies and portfolio stress testing, as well as possibly higher levels of allowances for losses and capital levels as a result of commercial real estate lending growth and exposures.
If our allowance for loan losses becomes inadequate, our results of operations may be adversely affected.
We maintain an allowance for loan losses that we believe is a reasonable estimate of known and inherent losses in our loan portfolio. Through a periodic review and consideration of the loan portfolio, management determines the amount of the allowance for loan losses by considering general market conditions, credit quality of the loan portfolio, the collateral supporting the loans and performance of our customers relative to their financial obligations with us. The amount of future losses is susceptible to changes in economic, operating and other conditions, including changes in interest rates, which may be beyond our control, and these losses may exceed our current estimates. Rapidly growing loan portfolios are, by their nature, unseasoned. As a result, estimating loan loss allowances is more difficult, and may be more susceptible to changes in estimates, and to losses exceeding estimates, than more seasoned portfolios.
Although we believe the allowance for loan losses is a reasonable estimate of known and inherent losses in our loan portfolio, we cannot fully predict such losses or that our loan loss allowance will be adequate in the future. Excessive loan losses could have a material impact on our financial performance. Consistent with our loan loss reserve methodology, we expect to make additions to our loan loss reserve levels as a result of our loan growth, which may affect our short-term earnings.
Federal and state regulators periodically review our allowance for loan losses and may require us to increase our provision for loan losses or recognize further loan charge-offs, based on judgments different than those of our management. Any increase in the amount of our provision or loans charged-off as required by these regulatory agencies could have a negative effect on our operating results.
Our deposit insurance premiums could be substantially higher in the future, which could have a material adverse effect on our future earnings.
The FDIC insures deposits at FDIC insured depository institutions, including the Bank. Under current FDIC regulations, each insured depository institution is subject to a risk-based assessment system and, depending on its assigned risk category, is assessed insurance premiums based on the amount of deposits held. The FDIC charges insured financial institutions premiums to maintain the DIF at a certain level. Recent bank failures have reduced the DIF’s reserves to their lowest level in more than 15 years. On October 16, 2008, the FDIC published a restoration plan designed to replenish the DIF over a period of five years and to increase the deposit insurance reserve ratio to 1.15% of insured deposits by December 31, 2013.
11
Table of Contents
To implement the restoration plan, the FDIC changed both its risk-based assessment system and its base assessment rates. For the first quarter of 2009 only, the FDIC increased all FDIC deposit assessment rates by 7 basis points. On February 27, 2009, the FDIC amended the restoration plan to extend the restoration plan horizon to seven years. The amended restoration plan was accompanied by a final rule on March 4, 2009, which adjusted how the risk-based assessment system differentiates for risk and that set new assessment rates. Under the final rule, the base assessment rates increased substantially beginning April 1, 2009.
On May 22, 2009, the FDIC adopted a final rule imposing a 5 basis point special assessment on each insured depository institution’s assets minus Tier 1 capital, as of June 30, 2009. On November 17, 2009, the FDIC also published a final rule requiring insured depository institutions to prepay their estimated quarterly risk-based assessments for the fourth quarter of 2009 and for all of 2010, 2011 and 2012.
A change in the risk category assigned to our Bank, further adjustments to base assessment rates and additional special assessments could have a material adverse effect on our earnings, financial condition and results of operation.
Our future success is dependent on our ability to compete effectively in the highly competitive banking industry.
We face vigorous competition from other commercial banks and other financial institutions, including savings and loan associations, savings banks, finance companies and credit unions for deposits, loans and other financial services in our market area. A number of these banks and other financial institutions are significantly larger than we are and have substantially greater access to capital and other resources, as well as larger lending limits and branch systems, and offer a wider array of banking services. To a limited extent, we also compete with other providers of financial services, such as money market mutual funds, brokerage firms, consumer finance companies, insurance companies and governmental organizations which may offer more favorable financing than we can. Many of our non-bank competitors are not subject to the same extensive regulations that govern us. As a result, these non-bank competitors have advantages over us in providing certain services. This competition may reduce or limit our margins and our market share and may adversely affect our results of operations and financial condition.
Our profitability may suffer because of rapid and unpredictable changes in the highly regulated environment in which we operate.
The Company, primarily through the Bank, is subject to extensive federal and state regulation and supervision. Banking regulations are primarily intended to protect depositors’ funds, federal deposit insurance funds and the banking system as a whole, not security holders. These regulations affect the Company’s lending practices, capital structure, investment practices, dividend policy and growth, among other things. Congress and federal regulatory agencies continually review banking laws, regulations and policies for possible changes. It is likely that there will be significant changes to the banking and financial institutions regulatory regimes in the near future in light of the recent performance of and government intervention in the financial services sector. Changes to statutes, regulations or regulatory policies, including changes in interpretation or implementation of statutes, regulations or policies, could affect the Company in substantial and unpredictable ways. Such changes could subject the Company to additional costs, limit the types of financial services and products the Company may offer and/or increase the ability of non-banks to offer competing financial services and products, among other things. Failure to comply with laws, regulations or policies could result in sanctions by regulatory agencies, civil money penalties and/or reputation damage, which could have a material adverse effect on the Company’s business, financial condition and results of operations. While the Company has policies and procedures designed to prevent any such violations, there can be no assurance that such violations will not occur. See “Regulation and Supervision” for more information about applicable banking laws and regulations.
The Sarbanes-Oxley Act of 2002, and the related rules and regulations promulgated by the SEC and the NASDAQ Stock Market (“NASDAQ”) that are applicable to us, have increased the scope, complexity and cost of corporate governance, reporting and disclosure practices, including the cost of completing our audit and maintaining our internal controls. As a result, we may experience greater compliance costs.
We may not be able to manage risks inherent in our business, particularly given the recent turbulent and dynamic market conditions.
A comprehensive and well-integrated risk management function is essential for our business. We have adopted various policies, procedures and systems to monitor and manage risk. These policies, procedures and systems may be inadequate to identify and mitigate all risks inherent in our business. In addition, our business and the markets and industry in which we operate are continuously evolving. We may fail to understand fully the implications of changes in our business or the financial markets and fail to adequately or timely enhance our risk framework to address those changes, particularly given the recent turbulent and dynamic market conditions. If our risk framework is ineffective, either because it fails to keep pace with changes in the financial markets or in our business or for other reasons, we could incur losses and otherwise experience harm to our business.
A failure of the technology we use could harm our business and our information systems may experience a breach in security.
We rely heavily on communications and information systems to conduct our business and we depend heavily upon data processing, software, communication and information exchange from a number of vendors on a variety of computing platforms and networks and over the internet. We cannot be certain that all of our systems are entirely free from vulnerability to breaches of security or other technological difficulties or failures. A breach in the security of these systems could result in failures or disruptions in our customer relationship management, general ledger, deposit, loan and other information systems. A breach of the security of our information systems could damage our reputation, result in a loss of customer business, subject us to additional regulatory scrutiny and expose us to civil litigation and possible financial liability.
Furthermore, the computer systems and network infrastructure we use could be vulnerable to other unforeseen problems, such as damage from fire, privacy loss, telecommunications failure or other similar events which would also have an adverse impact on our financial condition and results of operations.
12
Table of Contents
An extended disruption of vital infrastructure and other business interruptions could negatively impact our business.
Our operations depend upon vital infrastructure components including, among other things, transportation systems, power grids and telecommunication systems. A disruption in our operations resulting from failure of transportation and telecommunication systems, loss of power, interruption of other utilities, natural disaster, fire, global climate changes, computer hacking or viruses, failure of technology, terrorist activity or the domestic and foreign response to such activity or other events outside of our control could have an adverse impact on the financial services industry as a whole and/or on our business. Our business recovery plan may not be adequate and may not prevent significant interruptions of our operations or substantial losses.
The Company’s controls and procedures may fail or be circumvented.
Management regularly reviews and updates the Company’s internal controls, disclosure controls and procedures, and corporate governance policies and procedures. Any system of controls, however well designed and operated, is based in part on certain assumptions and can provide only reasonable, not absolute, assurances that the objectives of the system are met. Any failure or circumvention of the Company’s controls and procedures or failure to comply with regulations related to controls and procedures could have a material adverse effect on the Company’s business, results of operations and financial condition.
The Federal Reserve may require us to commit capital resources to support our bank subsidiary.
As a matter of policy, the Federal Reserve, which examines us and our subsidiaries, expects a bank holding company to act as a source of financial and managerial strength to a subsidiary bank and to commit resources to support such subsidiary bank. Under the “source of strength” doctrine, the Federal Reserve may require a bank holding company to make capital injections into a troubled subsidiary bank and may charge the bank holding company with engaging in unsafe and unsound practices for failure to commit resources to such a subsidiary bank. A capital injection may be required at times when the holding company may not have the resources to provide it and therefore may be required to borrow the funds. Any loans by a holding company to its subsidiary bank are subordinate in right of payment to deposits and to certain other indebtedness of such subsidiary bank. In the event of a bank holding company’s bankruptcy, the bankruptcy trustee will assume any commitment by the holding company to a federal bank regulatory agency to maintain the capital of a subsidiary bank. Moreover, bankruptcy law provides that claims based on any such commitment will be entitled to a priority of payment over the claims of the institution’s general unsecured creditors, including the holders of its note obligations. Thus, any borrowing that must be done by the holding company in order to make the required capital injection becomes more difficult and expensive and will adversely impact the holding company’s cash flows, financial condition, results of operations and prospects.
Our ability to attract and retain customers and employees could be adversely affected to the extent our reputation is harmed.
Our ability to attract and retain customers and employees could be adversely affected to the extent our reputation is damaged. Our actual or perceived failure to address various issues could give rise to reputational risk that could cause harm to us and our business prospects, including failure to properly address operational risks. These issues also include, but are not limited to, legal and regulatory requirements; privacy; properly maintaining customer and associate personal information; record keeping; money-laundering; sales and trading practices; ethical issues; appropriately addressing potential conflicts of interest; and the proper identification of the legal, reputational, credit, liquidity and market risks inherent in our products.
We face substantial potential liability and significant regulatory action, which could have materially adverse financial consequences or cause significant reputational harm to us.
We face significant legal risks in our businesses, and the volume of claims and amount of damages and penalties claimed in litigation and regulatory proceedings against us and other financial institutions remain high and are increasing. Increased litigation costs, substantial legal liability or significant regulatory action against us, including regulatory action against us due to certain bank examination results, could have material adverse financial effects or cause significant reputational harm to us, which in turn could seriously impact our business prospects.
The Parent’s stock price can be volatile.
Stock price volatility may make it more difficult for you to resell your common stock when you want and at prices you find attractive. The Parent’s stock price can fluctuate significantly in response to a variety of factors including, among other things:
| • | Actual or anticipated variations in quarterly results of operations. |
| • | Recommendations by securities analysts. |
| • | Operating and stock price performance of other entities that investors deem comparable to the Company. |
| • | News reports relating to trends, concerns and other issues in the financial services industry. |
| • | Perceptions in the marketplace regarding the Company and/or its competitors. |
| • | New technology used, or services offered, by competitors. |
| • | Significant acquisitions or business combinations, strategic partnerships, joint ventures or capital commitments by or involving the Company or its competitors. |
| • | Changes in government regulations. |
| • | Geopolitical conditions such as acts or threats of terrorism or military conflicts. |
General market fluctuations, industry factors and general economic and political conditions and events, such as economic slowdowns or recessions, interest rate changes or credit loss trends, could also cause the Parent’s stock price to decrease regardless of operating results.
13
Table of Contents
The trading volume in the Parent’s common stock is less than that of other financial services companies.
Although the Parent’s common stock is listed for trading on the NASDAQ Global Select Market, the trading volume in its common stock is less than that of other financial services companies. A public trading market having the desired characteristics of depth, liquidity and orderliness depends on the presence in the marketplace of willing buyers and sellers of the Parent’s common stock at any given time. This presence depends on the individual decisions of investors and general economic and market conditions over which the Company has no control. Given the lower trading volume of the Parent’s common stock, significant sales of the Parent’s common stock, or the expectation of these sales, could cause the Parent’s stock price to fall.
An investment in the Parent’s common stock is not an insured deposit.
The Parent’s common stock is not a bank deposit and, therefore, is not insured against loss by the FDIC, any other deposit insurance fund or by any other public or private entity. Investment in the Parent’s common stock is inherently risky for the reasons described in this “Risk Factors” section and elsewhere in this report and is subject to the same market forces that affect the price of common stock in any company. As a result, if you acquire the Parent’s common stock, you could lose some or all of your investment.
Consumers may decide not to use banks to complete their financial transactions.
Technology and other changes are allowing parties to complete financial transactions that historically have involved banks through alternative methods. For example, consumers can now maintain funds that would have historically been held as bank deposits in brokerage accounts or mutual funds. Consumers can also complete transactions such as paying bills and/or transferring funds directly without the assistance of banks. The process of eliminating banks as intermediaries, known as “disintermediation,” could result in the loss of fee income, as well as the loss of customer deposits and the related income generated from those deposits. The loss of these revenue streams and the lower cost deposits as a source of funds could have a material adverse effect on the Company’s financial condition and results of operations.
We rely heavily on our management team and the unexpected loss of any of those personnel could adversely affect our operations; we depend on our ability to attract and retain key personnel.
We are a customer-focused and relationship-driven organization. Our success depends substantially on the banking relationships maintained with our customers and the skills and abilities of our executive and senior officers. We have entered into employment agreements with our executive officers and other senior officers. The existence of such agreements, however, does not necessarily assure that we will be able to continue to retain their services. The unexpected loss of any of our key employees could have a material adverse effect on our business and possibly result in reduced revenues and earnings. We do maintain key man life insurance on key officers to provide the Company with some financial protection.
Our business success is also dependent upon our ability to continue to attract, hire, motivate and retain skilled personnel to develop new customer relationships as well as new financial products and services. Many experienced banking professionals employed by our competitors are covered by agreements not to compete or solicit their existing customers if they were to leave their current employment. These agreements make the recruitment of these professionals more difficult. The market for these people is competitive, and we cannot assure you that we will be successful in attracting, hiring, motivating or retaining them.
Item 1B. Unresolved Staff Comments
None.
The listing below provides certain information with respect to our properties. The Company believes its facilities are in good operating condition, are suitable and adequate for its operational needs and are adequately insured.
Corporate Headquarters
403 Boush Street, Norfolk, Virginia (owned/leased)
Operational Office
221 W. Bute Street, Norfolk, Virginia (leased)
229 W. Bute Street, Suite 350, Norfolk, Virginia (leased)
Banking Offices
403 Boush Street, Norfolk, Virginia (owned/leased)
4101 Granby Street, Norfolk, Virginia (leased)
1901 E. Ocean View Avenue, Norfolk, Virginia (land leased, building owned)
229 W. Bute Street, Suite 320, Norfolk, Virginia (leased)
1217 Cedar Road, Chesapeake, Virginia (leased)
3343 Western Branch Boulevard, Chesapeake, Virginia (leased)
2600 Taylor Road, Chesapeake, Virginia (leased)
1304 Greenbrier Parkway, Chesapeake, Virginia (leased)
14
Table of Contents
4940 West Norfolk Road, Portsmouth, Virginia (owned)
1020 London Boulevard, Portsmouth, Virginia (owned)
3720 Virginia Beach Boulevard, Virginia Beach, Virginia (leased)
1124 First Colonial Road, Virginia Beach, Virginia (owned)
2712 North Mall Drive, Virginia Beach, Virginia (leased)
1870 Kempsville Road, Virginia Beach, Virginia (leased)
5460 Wesleyan Drive, Virginia Beach, Virginia (leased)
2261 Upton Drive, Virginia Beach, Virginia (land leased, building owned)
221 Western Avenue, Suffolk, Virginia (leased)
8468 Caratoke Highway, Powells Point, North Carolina (leased)
26006 NC Highway 12, St. Waves Plaza Unit 1, Waves, North Carolina (leased)
562 Caratoke Highway, Moyock, North Carolina (leased)
3732 North Croatan Highway, Kitty Hawk, North Carolina (owned/leased)
Mortgage Lending Offices
6558 Main Street, Suite 1, Gloucester, Virginia (leased)
3720 Virginia Beach Boulevard, Virginia Beach, Virginia (leased)
Title Offices
2484 Pruden Boulevard, Suite B, Suffolk, Virginia (leased)
Investment Offices
The investment company’s offices are located within the banking offices.
All leases are under long-term non-cancelable operating lease agreements with renewal options, at total annual rentals of approximately $2.3 million as of December 31, 2009. See Item 13. Certain Relationships and Related Transactions, and Director Independence (Business Relationships and Transactions with Management) of this Form 10-K for more information on the Company’s related party leases.
The Company is not a party to, nor is any of its property the subject of, any material pending legal proceedings incidental to its businesses other than those arising in the ordinary course of business. Although the amount of any ultimate liability with respect to such matters cannot be determined, in the opinion of management, any such liability will not have a material adverse effect on the consolidated financial position or results of operations of the Company.
Part II
Item 5. Market for Registrant’s Common Equity, Related Stockholder Matters and Issuer Purchases of Equity Securities
Market Information. The Company’s common stock trades on the NASDAQ Global Select Market under the symbol CWBS. Set forth below is high and low trading information for the common stock and dividends declared for each quarter during 2009 and 2008.
Common Stock Performance
| Common Stock Prices | Dividends Declared | |||||||||||||||||
| 2009 | 2008 | 2009 | 2008 | |||||||||||||||
| High | Low | High | Low | |||||||||||||||
| First Quarter |
$ | 7.00 | $ | 3.72 | $ | 19.50 | $ | 15.21 | $ | 0.0800 | $ | 0.0800 | ||||||
| Second Quarter |
$ | 5.75 | $ | 4.00 | $ | 17.10 | $ | 12.62 | $ | 0.0200 | $ | 0.0800 | ||||||
| Third Quarter |
$ | 7.90 | $ | 4.61 | $ | 14.99 | $ | 10.85 | $ | — | $ | 0.0800 | ||||||
| Fourth Quarter |
$ | 5.30 | $ | 1.38 | $ | 14.49 | $ | 6.75 | $ | — | $ | 0.0800 | ||||||
15
Table of Contents
Stock Performance Graph
The graph below presents five-year cumulative total return comparisons through December 31, 2009, in stock price appreciation and dividends for the Company’s common stock, the Standard & Poor’s 500 Stock Index (S & P 500) and the Keefe, Bruyette & Woods 50 Total Return Index (KBW 50). Effective December 31, 2009, the KBW50 Index is no longer being calculated and will be replaced with the KRX Index, which is a modified capitalization weighted index, created by Keefe, Bruyette & Woods, designed to effectively represent the performance of the broad and diverse U.S. Regional banking industry. Returns assume an initial investment of $100 at the market close on December 31, 2004 and reinvestment of dividends. The KBW 50 is a published industry index providing a market capitalization weighted measure of the total return of 50 money center and major regional U.S. banking companies. Values as of each year end of the $100 initial investment are shown in the table and graph below.
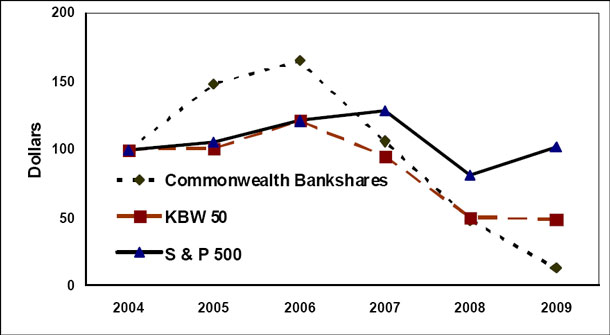
| Index |
2004 | 2005 | 2006 | 2007 | 2008 | 2009 | ||||||||||||
| Commonwealth Bankshares, Inc. |
$ | 100 | $ | 148 | $ | 165 | $ | 106 | $ | 48 | $ | 13 | ||||||
| KBW 50 |
100 | 101 | 121 | 95 | 50 | 49 | ||||||||||||
| S & P 500 |
100 | 105 | 121 | 128 | 81 | 102 | ||||||||||||
All share and per share amounts included in the Company’s Form 10-K and in the accompanying consolidated financial statements and footnotes have been restated for all periods presented to reflect the stock splits.
Stock Splits. On November 27, 2006, the Board of Directors approved an amendment to the Articles of Incorporation of the Company to increase the number of authorized shares of Common Stock from 16,500,000 to 18,150,000 shares, to reduce the par value of each share from $2.273 to $2.066 per share, and effect an eleven-for-ten stock split distributed on December 29, 2006 to stockholders of record on December 18, 2006.
On May 16, 2006, the Board of Directors approved an amendment to the Articles of Incorporation of the Company to increase the number of authorized shares of Common Stock from 15,000,000 to 16,500,000 shares, to reduce the par value of each share from $2.50 to $2.273 per share, and effect an eleven-for-ten stock split distributed on June 30, 2006 to stockholders of record on June 19, 2006.
Private Placement of Common Stock. On October 26, 2006, the Company completed a $27.5 million private placement of its common stock. Pursuant to the terms of the Private Placement Memorandum, dated August 30, 2006, the Company sold 1,163,461 shares of its common stock at $23.64 per share.
On June 27, 2005, the Company completed a $19.34 million private placement of its common stock. Pursuant to the terms of the Private Placement Memorandum, dated May 16, 2005, the Company sold 1,170,081 shares of its common stock at a price of $16.53 per share.
On October 14, 2004, the Company completed a $15 million private placement of its common stock. Pursuant to the terms of the Private Placement Memorandum, dated August 30, 2004, the Company sold 1,141,509 shares of its common stock at a price of $13.14 per share.
Anderson & Strudwick, Inc. acted as the Company’s exclusive placement agent for the three above mentioned private placements. The aggregate placement agent fee was 4.3%, 4.1% and 5.0%, respectively, of each offering’s gross proceeds, which amounted to $1.2 million, $793.6 thousand and $750.0 thousand, respectively, for the October 2006, June 2005 and October 2004 offerings.
The Company has used the net proceeds from the offerings for general corporate purposes, including the support of asset growth and increased lending limits of its bank subsidiary, Bank of the Commonwealth.
The offerings were made only to accredited investors, as such terms are defined in accordance with the Securities Act of 1933, as amended. The shares of common stock issued to the investors have not been registered under the Securities Act of 1933 or any state securities law. The Company relied on the exemption of the registration requirements of the Securities Act of 1933 by virtue of Section 4(2) thereof and Rule 506 of Regulation D promulgated thereunder. On August 16, 2007, the Company filed the final prospectus as part of its registration statement on Form S-3/A with the SEC registering the 1,163,461 shares of the common stock of Commonwealth Bankshares, Inc. that was issued as part of the October 26, 2006 private placement.
Holders of Record. The Company had 6,888,451 shares of common stock outstanding as of February 26, 2010, held by approximately 591 stockholders of record.
16
Table of Contents
Dividend Reinvestment and Stock Purchase Plan. In April 1999, the Company’s Board of Directors approved a Dividend Reinvestment and Stock Purchase Plan. Under this Plan, shares purchased from the Company with reinvested dividends are issued at a five percent (5.0%) discount from market value. The Plan also permits participants to make optional cash payments of up to $20.0 thousand per quarter for the purchase of additional shares of the Company’s common stock. These shares are issued at market value without incurring brokerage commissions. In addition, stockholders also have the option of having their cash dividends deposited directly into an account with Bank of the Commonwealth. Of the $685.7 thousand in dividends that were paid in 2009, $131.4 thousand were reinvested. In 2008, $2.2 million was paid in dividends with $518.7 thousand reinvested. In 2009, $27.6 thousand was invested through the optional cash payment plan compared to $225.8 thousand in 2008.
Dividend Information. The ability of the Company to pay dividends depends upon the amount of dividends declared by the Bank, which is limited by regulatory restrictions on the Bank’s ability to pay dividends. The Company has historically paid a quarterly dividend, which was suspended beginning with the Company’s third quarter of 2009. Currently, the Bank is deemed to be in troubled condition within the meaning of federal statutes and regulations, and each of the Parent and the Bank may not pay dividends to its shareholders (including payments by the Parent related to trust preferred securities). See Item 1. Business (Regulation and Supervision–Troubled Condition of the Bank) and Note 14 to Consolidated Financial Statements included as Exhibit 99.1 of this report.
Purchases of Equity Securities by the Issuer
We announced an open ended program in May 2007 by which we were authorized to repurchase an unlimited number of our own shares of common stock in open market and privately negotiated transactions. During 2009, the Company did not repurchase any of its own common stock. During 2008, we repurchased a total of 141,326 shares of our common stock at an average price of $14.53 per share. In 2007, 15,400 shares of our common stock were repurchased at an average price of $21.06 per share. We did not repurchase any shares of common stock other than through this publicly announced plan. There have been no transactions subsequent to those reported in our Form 10-Q for the quarter ended September 30, 2009.
17
Table of Contents
Item 6. Selected Financial Data
| Years Ended December 31, | ||||||||||||||||||||
| (in thousands, except per share data) |
2009 | 2008 | 2007 | 2006 | 2005 | |||||||||||||||
| Operating Results: |
||||||||||||||||||||
| Interest and dividend income |
$ | 65,968 | $ | 63,321 | $ | 62,083 | $ | 52,916 | $ | 34,289 | ||||||||||
| Interest expense |
29,799 | 29,563 | 28,184 | 22,797 | 12,742 | |||||||||||||||
| Net interest income |
36,169 | 33,758 | 33,899 | 30,119 | 21,547 | |||||||||||||||
| Provision for loan losses |
53,925 | 23,972 | 1,645 | 2,690 | 2,740 | |||||||||||||||
| Noninterest income |
3,528 | 4,864 | 5,181 | 5,059 | 3,893 | |||||||||||||||
| Noninterest expense |
25,112 | 20,357 | 20,329 | 16,967 | 12,638 | |||||||||||||||
| Income (loss) before income taxes and noncontrolling interest |
(39,340 | ) | (5,707 | ) | 17,106 | 15,521 | 10,062 | |||||||||||||
| Income tax expense (benefit) |
(13,596 | ) | (1,933 | ) | 5,927 | 5,405 | 3,419 | |||||||||||||
| Income (loss) before noncontrolling interest |
(25,744 | ) | (3,774 | ) | 11,179 | 10,116 | 6,643 | |||||||||||||
| Noncontrolling interest in subsidiaries |
(37 | ) | 35 | (12 | ) | (24 | ) | (9 | ) | |||||||||||
| Net income (loss) |
$ | (25,781 | ) | $ | (3,739 | ) | $ | 11,167 | $ | 10,092 | $ | 6,634 | ||||||||
| Per Share Data**: |
||||||||||||||||||||
| Basic earnings (loss) |
$ | (3.75 | ) | $ | (0.54 | ) | $ | 1.62 | $ | 1.86 | $ | 1.54 | ||||||||
| Diluted earnings (loss) |
$ | (3.75 | ) | $ | (0.54 | ) | $ | 1.60 | $ | 1.70 | $ | 1.36 | ||||||||
| Book value |
$ | 11.62 | $ | 15.53 | $ | 16.40 | $ | 15.08 | $ | 12.73 | ||||||||||
| Cash dividends |
$ | 0.10 | $ | 0.32 | $ | 0.28 | $ | 0.1991 | $ | 0.1736 | ||||||||||
| Closing stock price |
$ | 1.70 | $ | 7.17 | $ | 15.91 | $ | 25.00 | $ | 22.65 | ||||||||||
| Basic weighted average shares outstanding |
6,879,923 | 6,881,871 | 6,886,621 | 5,440,303 | 4,310,914 | |||||||||||||||
| Diluted weighted average shares outstanding |
6,879,923 | 6,906,474 | 6,973,570 | 5,999,436 | 5,055,552 | |||||||||||||||
| Shares outstanding at year-end |
6,888,451 | 6,851,417 | 6,915,587 | 6,844,975 | 4,928,992 | |||||||||||||||
| Year-End Balance: |
||||||||||||||||||||
| Assets |
$ | 1,276,503 | $ | 1,085,294 | $ | 843,138 | $ | 715,205 | $ | 549,454 | ||||||||||
| Federal funds sold |
2,103 | 550 | 158 | 2,031 | 1,159 | |||||||||||||||
| Loans * |
1,031,885 | 1,023,068 | 786,987 | 669,541 | 508,903 | |||||||||||||||
| Investment securities |
5,755 | 7,053 | 7,375 | 7,676 | 8,924 | |||||||||||||||
| Equity securities |
9,508 | 10,959 | 8,759 | 7,185 | 5,327 | |||||||||||||||
| Deposits |
1,080,896 | 763,006 | 572,296 | 487,175 | 383,890 | |||||||||||||||
| Stockholders’ equity |
80,038 | 106,372 | 113,414 | 103,225 | 62,730 | |||||||||||||||
| Average Balance: |
||||||||||||||||||||
| Assets |
$ | 1,138,260 | $ | 956,869 | $ | 773,756 | $ | 643,042 | $ | 455,833 | ||||||||||
| Federal funds sold |
2,179 | 504 | 1,058 | 1,778 | 971 | |||||||||||||||
| Loans * |
1,053,431 | 894,823 | 724,468 | 603,133 | 417,106 | |||||||||||||||
| Loans held for sale |
— | — | — | — | 11,747 | |||||||||||||||
| Investment securities |
5,749 | 7,402 | 7,298 | 8,525 | 6,026 | |||||||||||||||
| Equity securities |
9,486 | 9,527 | 7,893 | 6,599 | 4,625 | |||||||||||||||
| Deposits |
891,624 | 670,658 | 528,548 | 451,561 | 329,955 | |||||||||||||||
| Stockholders’ equity |
100,212 | 113,195 | 108,075 | 73,546 | 49,702 | |||||||||||||||
| Ratios: |
||||||||||||||||||||
| Return on average assets |
(2.26 | %) | (0.39 | %) | 1.44 | % | 1.57 | % | 1.46 | % | ||||||||||
| Return on average stockholders’ equity |
(25.73 | %) | (3.30 | %) | 10.33 | % | 13.72 | % | 13.35 | % | ||||||||||
| Dividend payout ratio *** |
N/M | N/M | 17.27 | % | 10.31 | % | 11.29 | % | ||||||||||||
| Year-end stockholders’ equity to total assets |
6.27 | % | 9.80 | % | 13.45 | % | 14.43 | % | 11.42 | % | ||||||||||
| Loan loss allowance to year-end loans * |
4.44 | % | 3.04 | % | 1.20 | % | 1.22 | % | 1.09 | % | ||||||||||
| Net interest margin (tax equivalent basis) |
3.30 | % | 3.69 | % | 4.57 | % | 4.86 | % | 4.90 | % | ||||||||||
| Efficiency ratio (tax equivalent basis) |
63.22 | % | 52.66 | % | 51.96 | % | 48.16 | % | 49.57 | % | ||||||||||
| * | Net of unearned income and loans held for sale. |
| ** | All share and per share amounts have been restated for all periods presented to reflect the eleven-for-ten stock split distributed on June 30, 2006 and the eleven-for-ten stock split distributed on December 29, 2006. |
| *** | N/M – not meaningful. |
18
Table of Contents
Item 7. Management’s Discussion and Analysis of Financial Condition and Results of Operations
This commentary provides an overview of the Company’s financial condition, changes in financial condition and results of operations for the years 2007 through 2009. This section of the Form 10-K should be read in conjunction with the Consolidated Financial Statements and related Notes thereto included as Exhibit 99.1 of this Form 10-K.
Forward-Looking Statements and Factors that Could Affect Future Results
Certain statements contained in this Annual Report on Form 10-K that are not statements of historical fact constitute forward-looking statements within the meaning of the Private Securities Litigation Reform Act of 1995 (the “Act”), notwithstanding that such statements are not specifically identified as such. In addition, certain statements may be contained in the Company’s future filings with the SEC, in press releases, and in oral and written statements made by or with the approval of the Company that are not statements of historical fact and constitute forward-looking statements within the meaning of the Act. Examples of forward-looking statements include, but are not limited to: (i) projections of revenues, expenses, income or loss, earnings or loss per share, the payment or nonpayment of dividends, capital structure and other financial items; (ii) statements of plans, objectives and expectations of the Company or its management or Board of Directors, including those relating to products or services; (iii) statements of future economic performance; and (iv) statements of assumptions underlying such statements. Words such as “believes”, “anticipates,” “expects,” “intends,” “targeted,” “continue,” “remain,” “will,” “should,” “may” and other similar expressions are intended to identify forward-looking statements but are not the exclusive means of identifying such statements.
Forward-looking statements involve risks and uncertainties that may cause actual results to differ materially from those in such statements. Factors that could cause actual results to differ from those discussed in the forward-looking statements include, but are not limited to:
| • | Local, regional, national and international economic conditions and the impact they may have on the Company and its customers and the Company’s assessment of that impact. |
| • | Volatility and disruption in national and international financial markets. |
| • | Government intervention in the U.S. financial system. |
| • | Changes in the level of non-performing assets and charge-offs. |
| • | Changes in estimates of future reserve requirements based upon the periodic review thereof under relevant regulatory and accounting requirements. |
| • | The effects of and changes in trade and monetary and fiscal policies and laws, including the interest rate policies of the Federal Reserve Board. |
| • | Inflation, interest rate, securities market and monetary fluctuations. |
| • | Political instability. |
| • | Acts of God or of war or terrorism. |
| • | The timely development and acceptance of new products and services and perceived overall value of these products and services by users. |
| • | Changes in consumer spending, borrowings and savings habits. |
| • | Changes in the financial performance and/or condition of the Company’s borrowers. |
| • | Technological changes. |
| • | Acquisitions and integration of acquired businesses. |
| • | The ability to increase market share and control expenses. |
| • | Changes in the competitive environment among bank holding companies and other financial service providers. |
| • | The effect of changes in laws and regulations (including laws and regulations concerning taxes, banking, securities and insurance) with which the Company and the Bank must comply. |
| • | The effect of changes in accounting policies and practices, as may be adopted by the regulatory agencies, as well as the Public Company Accounting Oversight Board, the Financial Accounting Standards Board and other accounting standard setters. |
| • | Changes in the Company’s organization, compensation and benefit plans. |
| • | The costs and effects of legal and regulatory developments including the resolution of legal proceedings or regulatory or other governmental inquiries and the results of regulatory examinations or reviews. |
| • | Greater than expected costs or difficulties related to the integration of new products and lines of business. |
| • | The Company’s success at managing the risks involved in the foregoing items. |
Forward-looking statements speak only as of the date on which such statements are made. The Company undertakes no obligation to update any forward-looking statement to reflect events or circumstances after the date on which such statement is made, or to reflect the occurrence of unanticipated events. In addition, as evidenced by a major increase in our loan losses, a continuation of the recent turbulence in significant portions of the global financial markets, particularly if it worsens, could continue to negatively impact our performance, both directly by affecting our revenues and the value of our assets and liabilities, and indirectly by affecting our counterparties and the economy generally. Dramatic declines in the housing market in the past two years have resulted in significant write-downs of asset values by financial institutions in the United States. Concerns about the stability of the U.S. financial markets generally have reduced the availability of funding to certain financial institutions, leading to a tightening of credit, reduction of business activity, and increased market volatility. In addition, our business and financial performance could be impacted as the financial industry restructures in the current environment, both by changes in the creditworthiness and performance of our counterparties and by changes in the competitive landscape.
19
Table of Contents
Results of Operations and Financial Condition of Commonwealth Bankshares, Inc. and Subsidiaries
Overview
Throughout 2009, difficult economic conditions continued to have a negative impact on businesses and consumers in our market area. This unprecedented economic environment has continued to negatively impact our loan portfolio, in particular commercial relationships secured by real estate. The financial weakening within the commercial real estate sector has resulted in significant deterioration in the credit quality of our loan portfolio, which is reflected by increases in non-performing and internally risk classified loans. In response to the prolonged economic downturn, continued economic uncertainties and the completion of an examination of the Bank conducted by the FRB, management and the Board elected to provide an additional $53.9 million to the Bank’s allowance for loan losses during the year ended December 31, 2009. This is an increase of $30.0 million over the comparable period in 2008. Addressing troubled credits quickly and conservatively has always been, and will continue to be, a top priority. At the same time, we have not lost sight of our fundamental belief in standing by our clients and our communities. Today’s environment requires stringent measures. We are committed to taking the actions necessary to withstand this difficult economic phase. We have proactively strengthened our balance sheet by focusing on reducing the level of non-performing assets, maintaining our “well capitalized” capital status, improving our liquidity position, maintaining an adequate allowance for loan losses, reducing expenses and returning to profitability in the future.
During 2008, the Company’s financial results were heavily impacted by the economic decline into a recessionary environment. Despite this obstacle, we were still able to accomplish a great deal in 2008. During the third quarter of 2008, the Company reached a significant milestone with total assets surpassing $1.0 billion. Total assets were $1.1 billion at December 31, 2008, an increase of 28.7% or $242.2 million from December 31, 2007. Loans reached a record $1.0 billion while total deposits grew 33.3% to end the year at a record $763.0 million. In addition, we completed the successful execution of our branch expansion strategy by building a franchise and infrastructure that will enhance the investment in our future and that can deliver long-term profitability and value for our shareholders. In 2008, we opened our third branch in North Carolina at 562 Caratoke Highway in Moyock, our sixth branch in Virginia Beach, Virginia in the Redmill area at 2261 Upton Drive, our first branch in Suffolk, Virginia at 221 Western Avenue and our fourth branch in North Carolina at 3732 North Croatan Highway in Kitty Hawk. The Company did not open any branches in 2009 and presently has no further plans for branch expansion.
In February 2007, we moved to our permanent branch in the Ocean View section of Norfolk, Virginia, at 1901 E. Ocean View Avenue, as well as our second branch in Portsmouth, Virginia at 1020 London Boulevard. In March 2007, we opened our first branch in North Carolina on Caratoke Highway in Powells Point. In May 2007, we opened our third branch in Chesapeake, Virginia at 2600 Taylor Road, across from the Chesapeake Square Mall. In July 2007, we opened our second branch in North Carolina in the St. Waves Plaza Shopping Center in Waves, North Carolina and our fourth branch in Chesapeake, Virginia at 1304 Greenbrier Parkway. In November 2007, we opened our fifth office in Virginia Beach, Virginia at 5460 Wesleyan Drive. Our second title office opened in May 2007 at 2484 Pruden Boulevard in Suffolk, Virginia.
For the year ended December 31, 2009, the Company reported a loss of $25.8 million, representing an increase in net loss of 589.5% from the $3.7 million loss reported for the comparable period in 2008. The net loss in 2008 represented a 133.5% decrease from the record earnings of $11.2 million reported for the year ended December 31, 2007. On a per share basis, diluted loss per share increased 594.4% to a loss of $3.75 per share for the year ended December 31, 2009. Diluted loss per share was $0.54 for the year ended December 31, 2008 a decrease of 133.8% from earnings of $1.60 for 2007. Book value per share for 2009, 2008 and 2007 was $11.62, $15.53 and $16.40, respectively. In 2009, total dividends paid to shareholders equaled $0.10 per share a decrease of 68.8% from $0.32 per share paid in 2008. Dividends paid in 2008 were up 14.3% from the $0.28 per share paid in 2007.
The Company’s key performance measures are down in comparison to prior years as a result of the current economic conditions, but the Company believes they are not reflective of our Company’s solid foundation and are down primarily due to the significant increase in the provision for loan losses. Return on average assets equaled (2.26%) in 2009 compared with (0.39%) in 2008 and 1.44% in 2007. Return on average equity equaled (25.73%) in 2009 compared with (3.30%) in 2008 and 10.33% in 2007. Total assets in 2009 grew to $1.3 billion, a 17.6% increase over the $1.1 billion at December 31, 2008. Total assets at December 31, 2008 were up 28.7% or $242.2 million from $843.1 million at December 31, 2007. Total loans, the Company’s largest and most profitable asset, ended the year at $1.0 billion, up $8.8 million or 0.9% from December 31, 2008. During 2008, total loans increased $236.1 million or 30.0% from $787.0 million at December 31, 2007.
Net Interest Income and Net Interest Margin
Net interest income, the fundamental source of the Company’s earnings, is defined as the difference between income on earning assets and the cost of funds supporting those assets. Significant categories of earning assets are loans and investment securities, while deposits and short-term borrowings represent the major portion of interest bearing liabilities. The level of net interest income is impacted primarily by variations in the volume and mix of these assets and liabilities, as well as changes in interest rates when compared to previous periods of operations.
Table 1 presents the average interest earning assets and average interest bearing liabilities, the average yields earned on such assets (on a tax equivalent basis) and rates paid on such liabilities, and the net interest margin for the indicated periods. The variance in interest income and expense caused by differences in average balances and rate is shown in Table 2.
Net interest income, on a taxable equivalent basis, for 2009 increased 7.1% or $2.4 million to $36.2 million. Net interest income for 2008 of $33.8 million decreased 0.4% or $148.6 thousand from 2007. The increase in net interest income for 2009 was primarily attributable to the increase in average interest earning assets which was partially offset by a decrease in the net interest margin. The decrease in net interest income for 2008 was primarily attributable to the strong growth in average interest earning assets, which was offset by the rapidly declining interest rate environment.
Average interest earning assets increased $183.0 million in 2009, $172.7 million in 2008 and $120.7 million in 2007. Average loans (excluding loans held for sale), a higher interest earning asset, accounted for 96.0% of average interest earning assets in 2009, 97.8% in 2008 and 97.6% in 2007. Due to the low interest rate environment, the presence in new markets as a result of our branch expansions and the efforts of our experienced loan officers, average loans increased $158.6 million in 2009, $170.4 million in 2008 and $121.3 million in 2007. Average investment securities, a lower yielding asset, decreased by $1.7 million in 2009, after increasing by $103.5 thousand in 2008 and decreasing by $1.2 million in 2007.
20
Table of Contents
The net interest margin is calculated by expressing tax-equivalent net interest income as a percentage of average interest earning assets, and represents the Company’s net yield on its earning assets. Net interest margin is an indicator of the Company’s effectiveness in generating income from its earning assets. The net interest margin is affected by the structure of the balance sheet as well as by competition and the economy. The spread that can be earned between interest earning assets and interest bearing liabilities is also dependent to a large extent on the slope of the yield curve. During 2007, the Federal Reserve decreased the federal funds rate by 50 basis points in the third quarter and another 50 basis points in the fourth quarter to end the year at 4.25%. During 2008, the Federal Reserve decreased the federal funds rate by 200 basis points in the first quarter, 25 basis points in the second quarter and 175 basis points in the fourth quarter to end the year at 0.25%. In addition, the Federal Reserve established a target range of 0.0% to 0.25% for the federal funds rate. During 2009, the federal funds rate remained unchanged for the entire year.
As of December 31, 2009, the net interest margin was 3.30% compared to 3.69% recorded in 2008 and 4.57% in 2007. The yield on our interest earning assets decreased 92 basis points to 6.01% for the year ended December 31, 2009. The average rate paid on our interest bearing liabilities decreased 72 basis points in 2009. Contributing to the compression of our margins was the decrease in interest rates, along with the continued pressure on deposit pricing and the pricing of some deposit products which lag the decrease in the prime rate, which has an immediate affect on variable loans. In addition, the competiveness for deposits resulting from the reduction in liquidity throughout the financial markets has kept rates at a high level relative to loan rates. Also contributing to the compression of our margins was the increase in the balance of non-accruing loans and the increased liquidity invested in overnight funds. A shift in the mix of funding sources was also a factor in the decline in the net interest margin. Time deposits, a higher cost funding source, made up 78.9% of the total interest bearing liabilities in 2009 compared to 69.5% in the comparable period in 2008.
As of December 31, 2008, the net interest margin of 3.69% represented a decrease of 88 basis points from the net interest margin of 4.57% recorded in 2007. As a result of the strong growth in average loans and decreased interest rates, the yield on our interest earning assets decreased 144 basis points to 6.93% for the year ended December 31, 2008. The average rate paid on our interest bearing liabilities decreased 85 basis points in 2008. Contributing to the decrease was the decrease in interest rates, along with continued pressure on deposit pricing and the pricing of some deposit products, which lag the decrease in the prime rate.
As of December 31, 2009, approximately 32.9% of the loan portfolio consisted of variable rate loans which can be repriced with prime within one year, down from 36.7% as of December 31, 2008. In a rising interest rate environment 32.9% of the variable loans will reprice, having a positive impact on interest income.
21
Table of Contents
Table 1: Average Balance Sheet and Net Interest Margin Analysis
| Years Ended December 31, | ||||||||||||||||||||||||||||||
| 2009 | 2008 | 2007 | ||||||||||||||||||||||||||||
| (dollars in thousands) |
Average Balance(1) |
Interest | Average Yield/ Rate(2) |
Average Balance(1) |
Interest | Average Yield/ Rate(2) |
Average Balance(1) |
Interest | Average Yield/ Rate(2) |
|||||||||||||||||||||
| Assets |
||||||||||||||||||||||||||||||
| Interest earning assets: |
||||||||||||||||||||||||||||||
| Loans (3)(4) |
$ | 1,053,431 | $ | 65,528 | 6.22 | % | $ | 894,823 | $ | 62,539 | 6.99 | % | $ | 724,468 | $ | 61,151 | 8.44 | % | ||||||||||||
| Investment securities (3) |
5,749 | 228 | 3.96 | % | 7,402 | 367 | 4.96 | % | 7,298 | 378 | 5.18 | % | ||||||||||||||||||
| Equity securities |
9,486 | 150 | 1.59 | % | 9,527 | 390 | 4.09 | % | 7,893 | 472 | 5.98 | % | ||||||||||||||||||
| Federal funds sold |
2,179 | 3 | 0.15 | % | 504 | 9 | 1.76 | % | 1,058 | 55 | 5.24 | % | ||||||||||||||||||
| Interest bearing deposits in banks |
235 | — | — | 300 | 7 | 2.32 | % | 578 | 31 | 5.32 | % | |||||||||||||||||||
| FRB reserve balance |
25,896 | 39 | 0.15 | % | 1,430 | 3 | 0.20 | % | — | — | — | |||||||||||||||||||
| Statutory trust |
619 | 39 | 6.35 | % | 619 | 39 | 6.39 | % | 619 | 39 | 6.33 | % | ||||||||||||||||||
| Other investments |
266 | 7 | 2.67 | % | 213 | 6 | 2.73 | % | 168 | 3 | 1.61 | % | ||||||||||||||||||
| Total interest earning assets |
1,097,861 | 65,994 | 6.01 | % | 914,818 | 63,360 | 6.93 | % | 742,082 | 62,129 | 8.37 | % | ||||||||||||||||||
| Noninterest earning assets: |
||||||||||||||||||||||||||||||
| Cash and due from banks |
2,943 | 5,932 | 9,031 | |||||||||||||||||||||||||||
| Premises and equipment, net |
36,355 | 33,129 | 18,808 | |||||||||||||||||||||||||||
| Other assets |
38,692 | 18,068 | 12,571 | |||||||||||||||||||||||||||
| Less: allowance for loan losses |
(37,591 | ) | (15,078 | ) | (8,736 | ) | ||||||||||||||||||||||||
| Total assets |
$ | 1,138,260 | $ | 956,869 | $ | 773,756 | ||||||||||||||||||||||||
| Liabilities and Equity |
||||||||||||||||||||||||||||||
| Interest bearing liabilities: |
||||||||||||||||||||||||||||||
| Interest bearing demand deposits |
$ | 64,230 | $ | 507 | 0.79 | % | $ | 71,924 | $ | 990 | 1.38 | % | $ | 86,483 | $ | 2,417 | 2.79 | % | ||||||||||||
| Savings deposits |
7,038 | 39 | 0.55 | % | 6,460 | 37 | 0.58 | % | 6,782 | 41 | 0.60 | % | ||||||||||||||||||
| Time deposits |
771,877 | 25,516 | 3.31 | % | 544,801 | 23,138 | 4.25 | % | 389,658 | 19,151 | 4.91 | % | ||||||||||||||||||
| Federal funds purchased |
— | — | — | 644 | 14 | 2.21 | % | — | — | — | ||||||||||||||||||||
| Short-term borrowings |
64,112 | 485 | 0.76 | % | 84,161 | 1,916 | 2.28 | % | 78,496 | 4,136 | 5.27 | % | ||||||||||||||||||
| Long-term debt |
50,124 | 1,938 | 3.87 | % | 55,296 | 2,151 | 3.89 | % | 27,678 | 1,133 | 4.09 | % | ||||||||||||||||||
| Trust preferred capital notes |
20,619 | 1,310 | 6.35 | % | 20,619 | 1,317 | 6.39 | % | 20,619 | 1,306 | 6.33 | % | ||||||||||||||||||
| Total interest bearing liabilities |
978,000 | 29,795 | 3.05 | % | 783,905 | 29,563 | 3.77 | % | 609,716 | 28,184 | 4.62 | % | ||||||||||||||||||
| Noninterest bearing liabilities: |
||||||||||||||||||||||||||||||
| Demand deposits |
48,479 | 47,474 | 45,625 | |||||||||||||||||||||||||||
| Other |
11,141 | 11,954 | 10,280 | |||||||||||||||||||||||||||
| Total liabilities |
1,037,620 | 843,333 | 665,621 | |||||||||||||||||||||||||||
| Equity: |
||||||||||||||||||||||||||||||
| Stockholders' equity |
100,212 | 113,195 | 108,075 | |||||||||||||||||||||||||||
| Noncontrolling interests |
428 | 341 | 60 | |||||||||||||||||||||||||||
| Total equity |
100,640 | 113,536 | 108,135 | |||||||||||||||||||||||||||
| Total liabilities and equity |
$ | 1,138,260 | $ | 956,869 | $ | 773,756 | ||||||||||||||||||||||||
| Net interest income (tax equivalent basis) |
$ | 36,199 | $ | 33,797 | $ | 33,945 | ||||||||||||||||||||||||
| Net interest margin (5) (tax equivalent basis) |
3.30 | % | 3.69 | % | 4.57 | % | ||||||||||||||||||||||||
| Average interest spread (6) (tax equivalent basis) |
2.96 | % | 3.16 | % | 3.75 | % | ||||||||||||||||||||||||
| (1) | Average balances are computed on daily balances and management believes such balances are representative of the operations of the Company. |
| (2) | Yield and rate percentages are all computed through the annualization of interest income and expenses versus the average balance of their respective accounts. |
| (3) | Tax equivalent basis. The tax equivalent adjustment to loans was $9 thousand, $15 thousand and $21 thousand for the years ended December 31, 2009, 2008 and 2007, respectively. The tax equivalent adjustment to investment securities was $17 thousand, $23 thousand and $25 thousand for the years ended December 31, 2009, 2008 and 2007, respectively. |
| (4) | Non-accrual loans are included in the average loan balances, and income on such loans is recognized on a cash basis. Loans are net of unearned income. |
| (5) | Net interest margin is net interest income, expressed as a percentage of average interest earning assets. |
| (6) | Interest spread is the average yield earned on interest earning assets, less the average rate incurred on interest bearing liabilities. |
22
Table of Contents
Table 2: Effect of Changes in Rate and Volume on Net Interest Income
As the largest component of income, net interest income represents the amount that interest and fees earned on loans and investments exceeds the interest costs of funds used to support these earning assets. Net interest income is determined by the relative levels, rates and mix of earning assets and interest bearing liabilities. The following table attributes changes in net interest income either to changes in average volume or to rate changes in proportion to the relationship of the absolute dollar amount of the change in each.
| Year Ended December 31, 2009 compared to Year Ended December 31, 2008 |
Year Ended December 31, 2008 compared to Year Ended December 31, 2007 |
Year Ended December 31, 2007 compared to Year Ended December 31, 2006 |
||||||||||||||||||||||||||||||||||
| Increase (Decrease) Due to: |
Interest Income/ Expense (Variance) |
Increase (Decrease) Due to: |
Interest Income/ Expense (Variance) |
Increase (Decrease) Due to: |
Interest Income/ Expense (Variance) |
|||||||||||||||||||||||||||||||
| (in thousands) | Volume | Rate | Volume | Rate | Volume | Rate | ||||||||||||||||||||||||||||||
| Interest Income: |
||||||||||||||||||||||||||||||||||||
| Loans |
$ | 7,874 | $ | (4,885 | ) | $ | 2,989 | $ | 5,169 | $ | (3,781 | ) | $ | 1,388 | $ | 10,216 | $ | (1,063 | ) | $ | 9,153 | |||||||||||||||
| Investment securities |
(73 | ) | (66 | ) | (139 | ) | 6 | (17 | ) | (11 | ) | (64 | ) | 11 | (53 | ) | ||||||||||||||||||||
| Equity securities |
(2 | ) | (238 | ) | (240 | ) | 157 | (239 | ) | (82 | ) | 77 | 12 | 89 | ||||||||||||||||||||||
| FRB reserve balance |
37 | (1 | ) | 36 | — | 3 | 3 | — | — | — | ||||||||||||||||||||||||||
| Federal funds sold |
(8 | ) | 2 | (6 | ) | (20 | ) | (26 | ) | (46 | ) | (38 | ) | 6 | (32 | ) | ||||||||||||||||||||
| Interest bearing deposits in banks |
(1 | ) | (6 | ) | (7 | ) | (11 | ) | (13 | ) | (24 | ) | 2 | 1 | 3 | |||||||||||||||||||||
| Other investments |
1 | — | 1 | 1 | 2 | 3 | — | (1 | ) | (1 | ) | |||||||||||||||||||||||||
| 7,828 | (5,194 | ) | 2,634 | 5,302 | (4,071 | ) | 1,231 | 10,193 | (1,034 | ) | 9,159 | |||||||||||||||||||||||||
| Interest Expense: |
||||||||||||||||||||||||||||||||||||
| Interest bearing demand deposits |
(97 | ) | (386 | ) | (483 | ) | (355 | ) | (1,072 | ) | (1,427 | ) | 427 | 367 | 794 | |||||||||||||||||||||
| Savings deposits |
3 | (1 | ) | 2 | (2 | ) | (2 | ) | (4 | ) | (6 | ) | (2 | ) | (8 | ) | ||||||||||||||||||||
| Time deposits |
5,079 | (2,701 | ) | 2,378 | 6,052 | (2,065 | ) | 3,987 | 3,007 | 1,073 | 4,080 | |||||||||||||||||||||||||
| Federal funds purchased |
(7 | ) | (7 | ) | (14 | ) | — | 14 | 14 | — | — | — | ||||||||||||||||||||||||
| Short-term borrowings |
(376 | ) | (1,055 | ) | (1,431 | ) | 323 | (2,543 | ) | (2,220 | ) | (131 | ) | (19 | ) | (150 | ) | |||||||||||||||||||
| Long-term debt |
(200 | ) | (13 | ) | (213 | ) | 1,071 | (53 | ) | 1,018 | 914 | 2 | 916 | |||||||||||||||||||||||
| Junior subordinated debt securities |
— | — | — | — | — | — | (117 | ) | (116 | ) | (233 | ) | ||||||||||||||||||||||||
| Trust preferred capital notes |
— | (7 | ) | (7 | ) | — | 11 | 11 | — | (11 | ) | (11 | ) | |||||||||||||||||||||||
| 4,402 | (4,170 | ) | 232 | 7,089 | (5,710 | ) | 1,379 | 4,094 | 1,294 | 5,388 | ||||||||||||||||||||||||||
| Increase (decrease) in net interest income |
$ | 3,426 | $ | (1,024 | ) | $ | 2,402 | $ | (1,787 | ) | $ | 1,639 | $ | (148 | ) | $ | 6,099 | $ | (2,328 | ) | $ | 3,771 | ||||||||||||||
Asset Quality Review and Credit Risk Management
In conducting business activities, the Company is exposed to the possibility that borrowers or counterparties may default on their obligations to the Company. Credit risk arises through the extension of loans, leases, certain securities and financial guarantees. To manage this risk, the Company establishes policies and procedures to manage both on and off-balance sheet risk and communicates and monitors the application of these policies and procedures throughout the Company. The Company’s credit risk is centered in its loan portfolio.
Provision and Allowance for Loan Losses
The provision for loan losses is the annual cost of maintaining an allowance for inherent credit losses. The amount of the provision each year and the level of the allowance are matters of judgment and are impacted by many factors, including actual credit losses during the period, the prospective view of credit losses, loan performance measures and trends (such as delinquencies and charge-offs), the economic environment and other factors, both internal and external that may affect the quality and future loss experience of the credit portfolio.
The Company continuously reviews its loan portfolio and maintains an allowance for loan losses sufficient to absorb losses inherent in the portfolio. In addition to the review of credit quality through an ongoing credit review process and a monthly review of impaired loans by management and the Board, the Company constructs a comprehensive allowance analysis for its loan portfolio at least quarterly. This analysis includes three basic elements; a general allowance, specific allowances for identified problem loans and an unallocated allowance representing estimations done pursuant to either Financial Accounting Standards Board (“FASB”) Accounting Standards Codification (“ASC”) Topic 450 “Accounting for Contingencies”, or FASB ASC Topic 310 “Accounting by Creditors for Impairment of a Loan”. The specific component relates to loans that are classified as doubtful, substandard or special mention. The general component covers non-classified loans and is based on historical loss experience adjusted for qualitative factors. Such qualitative factors management considers are the known and inherent risks in the loan portfolio, including adverse circumstances that may affect the ability of the borrower to repay interest and/or principal, the estimated value of collateral, an analysis of the levels and trends of delinquencies, level of concentrations and growth within the portfolio, and the level and trend of interest rates and the condition of the national and local economies. An unallocated component is maintained to cover uncertainties that could affect management’s estimate of probable losses. The unallocated component of the allowance reflects the margin of imprecision inherent in the underlying assumptions used in the methodologies for estimating specific and general losses in the portfolio. Management’s evaluation and resulting provision and allowance decisions are reviewed by the Board of Directors quarterly.
23
Table of Contents
The allowance for loan losses is increased by the provision for loan losses and reduced by loans charged-off, net of recoveries. The following table presents the Company’s loan loss experience for the past five years:
Table 3: Summary of Loan Loss Experience
| Years Ended December 31, | ||||||||||||||||||||
| (dollars in thousands) |
2009 | 2008 | 2007 | 2006 | 2005 | |||||||||||||||
| Allowance at beginning of period |
$ | 31,120 | $ | 9,424 | $ | 8,144 | $ | 5,523 | $ | 2,839 | ||||||||||
| Provision for loan losses |
53,925 | 23,972 | 1,645 | 2,690 | 2,740 | |||||||||||||||
| Charge-offs: |
||||||||||||||||||||
| Construction and development |
19,078 | — | — | — | — | |||||||||||||||
| Commercial |
2,599 | 1,090 | 363 | 39 | 71 | |||||||||||||||
| Commercial mortgage |
14,616 | 376 | — | 21 | — | |||||||||||||||
| Residential mortgage |
2,787 | 711 | — | 2 | 2 | |||||||||||||||
| Installment loans to individuals |
258 | 106 | 20 | 23 | 8 | |||||||||||||||
| Total loans charged-off |
39,338 | 2,283 | 383 | 85 | 81 | |||||||||||||||
| Recoveries: |
||||||||||||||||||||
| Construction and development |
1 | — | — | — | — | |||||||||||||||
| Commercial |
23 | 5 | 2 | — | — | |||||||||||||||
| Commercial mortgage |
— | — | 6 | 14 | — | |||||||||||||||
| Residential mortgage |
15 | — | — | — | 24 | |||||||||||||||
| Installment loans to individuals |
25 | 2 | 10 | 2 | 1 | |||||||||||||||
| Total recoveries |
64 | 7 | 18 | 16 | 25 | |||||||||||||||
| Net charge-offs |
39,274 | 2,276 | 365 | 69 | 56 | |||||||||||||||
| Allowance at end of period |
$ | 45,771 | $ | 31,120 | $ | 9,424 | $ | 8,144 | $ | 5,523 | ||||||||||
| Year end loans * |
$ | 1,031,885 | $ | 1,023,068 | $ | 786,987 | $ | 669,541 | $ | 508,903 | ||||||||||
| Ratio of allowance to year end loans |
4.44 | % | 3.04 | % | 1.20 | % | 1.22 | % | 1.09 | % | ||||||||||
| Average loans outstanding * |
$ | 1,053,431 | $ | 894,823 | $ | 724,468 | $ | 603,133 | $ | 417,106 | ||||||||||
| Ratio of net charge-offs to average loans outstanding |
3.73 | % | 0.25 | % | 0.05 | % | 0.01 | % | 0.01 | % | ||||||||||
| * | Net of unearned income and loans held for sale. |
The housing downturn and the financial market disruptions that began in the second half of 2007 continued to affect the economy and the financial services sector throughout 2008 and 2009. The housing downturn and the broader economic slowdown that accelerated during the second half of 2008 negatively impacted the credit quality of both our consumer and commercial portfolios. The market turbulence and economic uncertainty continued well into 2009, which led to additional provisions for loan losses.
As a result of the historical challenges facing the financial markets today, the Company made provisions for loan losses of $54.0 million in 2009 compared to $24.0 million in 2008, $1.6 million in 2007 and $2.7 million in each of 2006 and 2005. Net charge-offs in 2009 were $39.3 million compared to $2.3 million in 2008, $365.6 thousand in 2007, $68.8 thousand in 2006 and $56.2 thousand in 2005. This represents 3.73% of average loans outstanding in 2009, 0.25% in 2008, 0.05% in 2007 and 0.01% in each of 2006 and 2005. The contribution to the provision and the related increase in the allowance in 2009 was made in response to current market conditions, the current economic climate and the completion of an examination of the Bank conducted by the FRB. The contribution to the provision and the related increase in the allowance for 2008 was also due to the current market conditions and the overall growth in total loans of 30.0%. The contribution to the provision and the related increase in the allowance for 2007, 2006 and 2005 was due to the overall growth in total loans of 17.5%, 31.6% and 61.2%, respectively.
The allowance for loan losses at December 31, 2009 was $45.8 million, compared with $31.1 million at December 31, 2008, $9.4 million at December 31, 2007, $8.1 million at December 31, 2006 and $5.5 million at December 31, 2005. This represented 4.44% of year-end loans at December 31, 2009 compared with 3.04% of year-end loans at December 31, 2008, 1.20% of year-end loans at December 31, 2007, 1.22% of year-end loans at December 31, 2006 and 1.09% of year-end loans at December 31, 2005. Based on current expectations relative to portfolio characteristics and management’s comprehensive allowance analysis, management considers the level of the allowance to be adequate as of December 31, 2009.
24
Table of Contents
The following table shows the allocation of allowance for loan losses at the dates indicated. Notwithstanding these allocations, the entire allowance for loan losses is available to absorb charge-offs in any category of loan.
Table 4: Allocation of Allowance for Loan Losses
| December 31, | |||||||||||||||
| (in thousands) |
2009 | 2008 | 2007 | 2006 | 2005 | ||||||||||
| Construction and development |
$ | 12,467 | $ | 10,498 | $ | 2,166 | $ | 1,694 | $ | 1,012 | |||||
| Commercial |
6,666 | 12,645 | 962 | 1,090 | 549 | ||||||||||
| Commercial mortgage |
18,320 | 5,684 | 4,385 | 3,733 | 2,832 | ||||||||||
| Residential mortgage |
5,951 | 2,152 | 1,405 | 1,000 | 867 | ||||||||||
| Installment loans to individuals |
360 | 115 | 164 | 161 | 124 | ||||||||||
| Other |
7 | 22 | 10 | 12 | 5 | ||||||||||
| Unallocated |
2,000 | 4 | 332 | 454 | 134 | ||||||||||
| Total allowance for loan losses |
$ | 45,771 | $ | 31,120 | $ | 9,424 | $ | 8,144 | $ | 5,523 | |||||
Non-Performing Assets
Non-performing assets consist of loans accounted for on a non-accrual basis (as judgmentally determined by management based upon anticipated realization of interest income), loans which are contractually past due 90 days and other real estate owned. It is management’s practice to cease accruing interest on loans when payments are 90 days delinquent. However, management may elect to continue the accrual of interest when the estimated net realizable value of collateral is sufficient to cover the principal balance and accrued interest, and the loan is in the process of collection.
The following table presents information concerning non-performing assets for the periods indicated.
Table 5: Non-Performing Assets
| December 31, | |||||||||||||||
| (in thousands) |
2009 | 2008 | 2007 | 2006 | 2005 | ||||||||||
| Non-accrual loans: |
|||||||||||||||
| Construction and development |
$ | 45,483 | $ | 32,369 | $ | — | $ | — | $ | — | |||||
| Commercial |
3,395 | 1,797 | 256 | 884 | 110 | ||||||||||
| Commercial mortgage |
14,223 | 3,192 | 130 | 1,310 | — | ||||||||||
| Residential mortgage |
10,039 | 6,942 | 1,946 | — | — | ||||||||||
| Installment loans to individuals |
28 | 176 | 55 | 29 | 10 | ||||||||||
| 73,168 | 44,476 | 2,387 | 2,223 | 120 | |||||||||||
| Loans contractually past-due 90 days or more: |
|||||||||||||||
| Construction and development |
— | 1,056 | 437 | — | — | ||||||||||
| Commercial |
— | 368 | 588 | — | — | ||||||||||
| Commercial mortgage |
4,205 | 1,465 | — | — | — | ||||||||||
| Residential mortgage |
115 | 258 | 1,520 | — | — | ||||||||||
| Installment loans to individuals |
— | 17 | 32 | — | 1 | ||||||||||
| Other |
119 | 3 | 1 | 4 | 61 | ||||||||||
| 4,439 | 3,167 | 2,578 | 4 | 62 | |||||||||||
| Total non-performing loans |
77,607 | 47,643 | 4,965 | 2,227 | 182 | ||||||||||
| Other real estate owned |
11,380 | 4,314 | 717 | — | — | ||||||||||
| Total non-performing assets |
$ | 88,987 | $ | 51,957 | $ | 5,682 | $ | 2,227 | $ | 182 | |||||
25
Table of Contents
Non-performing assets were $89.0 million or 6.97% of total assets at December 31, 2009 compared to $52.0 million or 4.79% at December 31, 2008. Non-performing loans increased $29.9 million during the twelve months ended December 31, 2009 to $77.6 million. Non-performing loans at December 31, 2009 consist of 124 loans. The increase was reflective of the unprecedented economic environment which continues to negatively impact our loan portfolio, in particular commercial relationships secured by real estate. $74.1 million or 95.4% of total non-performing loans consist of 96 loans which are secured by real estate, of which $45.5 million are construction and development loans. Included in the category of construction and development are condominium projects totaling $8.4 million and residential lot loans of $4.7 million. The Company has added personnel to our Special Assets and Credit Administration areas to proactively and aggressively identify and address problem assets. In addition, the Company has strengthened its credit administration processes with the addition of a third-party loan review team which completed a comprehensive review of the construction, development and commercial real estate loan portfolios, with an emphasis on large loans and problem loans. This type of comprehensive review will be performed on a semi-annual basis for the foreseeable future. The Company has a Loan Impairment Committee to monitor non-performing assets, past due loans, identify potential problem credits and develop action plans to work through these loans as promptly as possible. As all non-performing loans are deemed impaired, the Committee has individually reviewed the underlying collateral value (less cost to sell) on each of these loans as a part of its analysis of impaired loans. As a result of this comprehensive analysis, $22.2 million in specific reserves for loan losses has been established for non-performing loans. Based on current collateral values, we believe our reserve is adequate to cover any short falls resulting from the sale of the underlying collateral. Based on current accounting and regulatory guidelines the Company has provided a reserve based on current market values for these impaired loans however, management plans to work with our customers to get through these unprecedented economic times and to minimize any potential credit exposure. Management has taken a proactive approach to monitoring these loans and will continue to actively manage these credits to minimize losses.
Non-accrual loans at December 31, 2009 totaled $73.2 million compared to $44.5 million at December 31, 2008. If all non-accrual loans had been performing fully, these loans would have contributed an additional $4.4 million to interest income in 2009, $2.1 million in 2008, $141.1 thousand in 2007, $58.5 thousand in 2006 and $24.8 thousand in 2005.
The Company is required to account for certain loan modifications or restructurings as troubled debt restructurings (“TDR”). In general, the modification or restructuring of a loan constitutes a TDR when we grant a concession to a borrower experiencing financial difficulty. TDR typically result from the Company’s loss mitigation activities and include rate reductions or other actions intended to minimize the economic loss and to avoid foreclosure or repossession of collateral. As of December 31, 2009, the Company’s TDR loans totaled $90.6 million. Of this total, approximately $68.2 million are in compliance with modified terms, $2.6 million are 30-89 days delinquent, $833.0 thousand are 90 days or more delinquent, and $18.9 million are classified as non-accrual. There were no TDR loans at any of the previous year-ends included in the preceding non-performing assets analysis.
Other real estate owned (“OREO”) at December 31, 2009 was $11.4 million, compared to $4.3 million at December 31, 2008, $717.4 thousand at December 31, 2007 and $0 at each of December 31, 2006 and 2005. The balance at December 31, 2009 was comprised of 39 properties of which 19 were residential. During the twelve months ended December 31, 2009, new foreclosures included 50 properties totaling $20.5 million, of which $12.6 million represented 35 residential properties. OREO sales for the twelve months ended December 31, 2009, consisted of 22 properties resulting in a net loss of $294.5 thousand. At December 31, 2009, there were two residential properties under contract for sale. Subsequent to December 31, 2009, one of the residential properties under contract for sale at December 31, 2009 sold resulting in no gain or loss on sale. The remaining properties are being actively marketed and management does not anticipate any material losses associated with these properties. As a direct result of the continued decline in the real estate market, the Company recorded losses of $694.5 thousand in its consolidated statement of operations for the twelve months ended December 31, 2009, due to valuation adjustments on 19 OREO properties. Asset quality continues to be a top priority for the Company. We continue to allocate significant resources to the expedient disposition and collection of non-performing and other lower quality assets.
USES OF FUNDS
Total average earning assets at December 31, 2009 increased 20.0% from year end 2008 compared with 2008’s increase of 23.3% from year end 2007’s increase of 19.4%. The increase in average earning assets over the last three years has been primarily attributable to the increase in the loan portfolio which has increased from $787.7 million in 2007 to $1.0 billion in 2009.
Loan Portfolio
The loan portfolio is the largest component of earning assets and accounts for the greatest portion of total interest income. As of December 31, 2009, total gross loans (excluding unearned income), were $1.0 billion, an $8.8 million or a 0.9% increase over year end 2008. Loan growth experienced from year end 2007 to year end 2008 was $236.9 million or 30.0%, from year end 2006 to year end 2007 was $117.5 million or 17.5% and from year end 2005 to year end 2006 was $160.5 million or 31.4%. The growth experienced during the past four years was achieved not only by the high loan demand generated by the low interest rate environment, the presence in new markets as a result of our branch expansion, but also by the efforts of the Company’s officers to develop new loan relationships combined with the support of existing customers. During 2006, the Company raised $27.5 million in additional capital allowing us to continue our strong growth momentum and allowing us to better serve our customers by increasing our legal lending limit to over $16.9 million as of December 31, 2009.
During the past four years, a considerable volume of new loan relationships have been developed with “old line and well-established” local businesses, who have transferred their relationships to the Company from other regional financial institutions that are experiencing further consolidation. This has been an excellent source of new business for the Bank, as customers still value the personal attention traditionally offered by a community bank.
The Company’s overall objective in managing loan portfolio risk is to minimize the adverse impact of any single event or set of occurrences. To achieve this objective, the Company strives to maintain a loan portfolio that is diverse in terms of loan type, industry concentration, geographic distribution and borrower concentration.
We continue to refine our credit standards to meet the changing economic environment. We have adjusted our underwriting criteria,
26
Table of Contents
increased the frequency of portfolio monitoring in certain high risk segments of the portfolio, increased our efforts in managing the credit exposure when we begin to see signs of deterioration, as well as enhanced our collection strategies in an attempt to mitigate losses. Senior level management is devoted to the management and/or collection of certain non-performing assets as well as certain performing loans. Furthermore, the Company has reallocated resources and staff to accomplish the aforementioned initiatives.
The table below classifies gross loans by major category and percentage distribution of gross loans at December 31 for each of the past five years.
Table 6: Loans By Classification
| December 31, | ||||||||||||||||||||||||||||||
| 2009 | 2008 | 2007 | 2006 | 2005 | ||||||||||||||||||||||||||
| (dollars in thousands) |
Amount | % | Amount | % | Amount | % | Amount | % | Amount | % | ||||||||||||||||||||
| Construction and development |
$ | 246,764 | 23.86 | % | $ | 294,649 | 28.73 | % | $ | 222,972 | 28.27 | % | $ | 178,805 | 26.64 | % | $ | 103,091 | 20.18 | % | ||||||||||
| Commercial |
73,504 | 7.11 | % | 79,466 | 7.75 | % | 71,172 | 9.02 | % | 57,092 | 8.50 | % | 51,896 | 10.16 | % | |||||||||||||||
| Commercial mortgage |
531,893 | 51.43 | % | 470,268 | 45.85 | % | 361,659 | 45.85 | % | 323,729 | 48.22 | % | 257,204 | 50.35 | % | |||||||||||||||
| Residential mortgage |
170,325 | 16.47 | % | 168,056 | 16.38 | % | 118,180 | 14.98 | % | 97,395 | 14.51 | % | 86,353 | 16.91 | % | |||||||||||||||
| Installment loans to individuals |
11,175 | 1.08 | % | 12,665 | 1.23 | % | 13,782 | 1.75 | % | 13,027 | 1.94 | % | 11,597 | 2.27 | % | |||||||||||||||
| Other |
472 | 0.05 | % | 627 | 0.06 | % | 1,033 | 0.13 | % | 1,267 | 0.19 | % | 659 | 0.13 | % | |||||||||||||||
| Total gross loans |
$ | 1,034,133 | 100.00 | % | $ | 1,025,731 | 100.00 | % | $ | 788,798 | 100.00 | % | $ | 671,315 | 100.00 | % | $ | 510,800 | 100.00 | % | ||||||||||
Construction and development loans decreased $47.9 million to $246.8 million in 2009 compared to an increase of $71.7 million to $294.7 million in 2008, a $44.2 million increase to $223.0 million in 2007 and a $75.7 million increase to $178.8 million in 2006. The Company makes loans primarily for the construction of one-to-four family residences and, to a lesser extent, multi-family dwellings. The Company also makes construction loans for office and warehouse facilities and other nonresidential projects, generally limited to borrowers that present other business opportunities for the Company.
The amounts, interest rates and terms for construction loans vary, depending upon market conditions, the size and complexity of the project, and the financial strength of the borrower and any guarantors of the loan. The term for the Company’s typical construction loan ranges from nine months to 15 months for the construction of an individual residence, and from 15 months to a maximum of three years for larger residential or commercial projects. The Company does not typically amortize its construction loans, and the borrower pays interest monthly on the outstanding principal balance of the loan. The interest rates on the Company’s construction loans are mostly variable. The Company does not generally finance the construction of commercial real estate projects built on a speculative basis. For residential builder loans, the Company limits the number of models and/or speculative units allowed depending on market conditions, the builder’s financial strength and track record and other factors. Construction loans for nonresidential projects and multi-unit residential projects are generally larger and involve a greater degree of risk to the Company than residential mortgage loans. The Company attempts to minimize such risks by (i) making construction loans in accordance with the Company’s underwriting standards and to established customers in its primary market area and (ii) by monitoring the quality, progress and cost of construction.
Loans in the commercial category, as well as commercial real estate mortgages, consist primarily of short-term (five year or less final maturity or five year rate call) and/or floating or adjustable rate commercial loans made to small to medium-sized companies. Total commercial loans increased 10.1% to $605.4 million in 2009 compared with an increase of 27.0% to $549.7 million in 2008, an increase of 13.7% to $432.8 million in 2007 and an increase of 23.2% to $380.8 million in 2006. Virtually all of the Company’s commercial real estate mortgage and construction loans relate to property in our market areas of Hampton Roads and Northeastern North Carolina which includes the cities of Norfolk, Virginia Beach, Chesapeake, Portsmouth and Suffolk, Virginia and the Outer Banks of North Carolina. As such, they are subject to risks relating to the general economic conditions in those markets, and the market for real estate in particular. These regions experienced solid economic activity during 2006. Beginning the second half of 2007 and continuing into 2008 and 2009, the economy in general declined into a recession. Although our local economy has not experienced the same dramatic decline seen in other regions in the U.S., our region experienced a significant downturn in real estate values. In response to the downturn, the Company has strengthened our underwriting practices and has been proactively monitoring and managing our existing portfolio.
Residential mortgage loans increased $2.3 million or 1.4% in 2009, compared to an increase of $49.9 million or 42.2% in 2008, an increase of $20.8 million or 21.3% in 2007, and an increase of $11.0 million or 12.8% to $97.4 million in 2006. The Company’s one-to-four family residential real estate loans are generally not the typical purchase money first mortgage loan or refinancing, but are loans made for other purposes and the collateral obtained is a first deed of trust on the residential property of the borrower. The underlying loan would have a final maturity much shorter than the typical first mortgage and may be a variable or fixed rate loan.
Consumer installment loans decreased $1.5 million or 11.8% in 2009, representing 1.1% of total gross loans at December 31, 2009. Consumer installment loans represented 1.2%, 1.8% and 1.9% of total gross loans as of December 31, 2008, 2007 and 2006, respectively.
To limit credit exposure, the Company obtains collateral to support credit extensions and commitments when deemed necessary. The most significant categories of collateral are real and personal property, cash on deposit and marketable securities. The Company obtains real property as security for some loans that are made on the basis of the general creditworthiness of the borrower and whose proceeds were not used for real estate related purposes.
A number of measures have been taken by the Company over the past several years to reduce overall exposure and earnings vulnerability in the real estate sectors of the Bank’s trade area. These measures include strengthening real estate underwriting, management review of policies and practices, and reducing higher risk concentrations within the real estate portfolio.
27
Table of Contents
The following table shows the maturity or period of re-pricing of gross loans outstanding as of December 31, 2009. Demand loans, as well as loans having no stated schedule of repayments and no stated maturity are reported as due within one year. Adjustable and floating-rate loans are included in the period in which interest rates are next scheduled to adjust rather than in which they contractually mature. Fixed rate loans are included in the period in which the final contractual repayment is due. Since the majority of the Company’s loan portfolio is short-term, the Company can re-price its portfolio more frequently to minimize long-term interest rate fluctuations and maintain a steady interest margin.
Table 7: Loan Maturities and Re-Pricing Schedule
| December 31, 2009 | ||||||||||||
| (in thousands) |
Within One Year |
After One But Within Five Years |
After Five Years |
Total | ||||||||
| Variable Rate: |
||||||||||||
| Construction and development |
$ | 112,979 | $ | 35,854 | $ | 6,893 | $ | 155,726 | ||||
| Commercial |
24,554 | 12,005 | 5,425 | 41,984 | ||||||||
| Commercial mortgage |
140,149 | 237,010 | 45,432 | 422,591 | ||||||||
| Residential mortgage |
58,465 | 48,090 | 11,908 | 118,463 | ||||||||
| Installment and other loans |
4,168 | 715 | 31 | 4,914 | ||||||||
| Total variable rate |
$ | 340,315 | $ | 333,674 | $ | 69,689 | $ | 743,678 | ||||
| Fixed Rate: |
||||||||||||
| Construction and development |
$ | 75,009 | $ | 9,954 | $ | 6,075 | $ | 91,038 | ||||
| Commercial |
8,213 | 10,942 | 12,365 | 31,520 | ||||||||
| Commercial mortgage |
45,413 | 27,116 | 36,773 | 109,302 | ||||||||
| Residential mortgage |
11,365 | 16,830 | 23,667 | 51,862 | ||||||||
| Installment and other loans |
1,142 | 2,899 | 2,692 | 6,733 | ||||||||
| Total fixed rate |
$ | 141,142 | $ | 67,741 | $ | 81,572 | $ | 290,455 | ||||
| Total |
$ | 481,457 | $ | 401,415 | $ | 151,261 | $ | 1,034,133 | ||||
Investments
The investment portfolio plays a role in the management of interest rate sensitivity of the Company and generates interest income. In addition, the portfolio serves as a source of liquidity and is used as needed to meet collateral requirements. The table below presents information pertaining to the composition of the securities portfolio. At year end 2009, 2008 and 2007, investment securities totaled $5.8 million, $7.1 million and $7.4 million, respectively.
Table 8: Composition of Investments
| December 31, | |||||||||
| (in thousands) |
2009 | 2008 | 2007 | ||||||
| Securities available for sale (1): |
|||||||||
| U. S. Government and agency securities |
$ | 4,503 | $ | 5,561 | $ | 5,539 | |||
| Mortgage-backed securities |
444 | 521 | 624 | ||||||
| State and municipal securities |
650 | 779 | 780 | ||||||
| 5,597 | 6,861 | 6,943 | |||||||
| Securities held to maturity (2): |
|||||||||
| Mortgage-backed securities |
158 | 191 | 241 | ||||||
| State and municipal securities |
— | — | 191 | ||||||
| 158 | 191 | 432 | |||||||
| Total investment securities |
$ | 5,755 | $ | 7,052 | $ | 7,375 | |||
| (1) | Carried at fair value. |
| (2) | Carried at cost, adjusted for amortization of premium or accretion of discount using the interest method. |
In managing the investment securities portfolio, management’s philosophy has been to provide the maximum return over the long term on funds invested while giving consideration to risk and other corporate objectives. During periods of increasing interest rates, the market value of the investment portfolio declines in relation to book value. During periods of declining interest rates, the opposite is true.
28
Table of Contents
Decisions to acquire investments of a particular type are based on an assessment of economic and financial conditions, including interest rate risk, liquidity, capital adequacy, the type of incremental funding available to support such assets and an evaluation of alternative loan or investment instruments.
Investment securities are purchased with the ability to hold until maturity and with the intent to hold for the foreseeable future. Management re-evaluates asset and liability strategies when economic and financial conditions fluctuate in a magnitude that might adversely impact the Company’s overall interest rate risk, liquidity or capital adequacy positions. Re-assessment may alter management’s intent to hold certain securities for the foreseeable future and result in repositioning a portion of the investment portfolio. Often, security sales are required to implement a change in strategy.
Management views the portfolio as diversified among several market sectors as summarized below:
| Sector |
% | ||
| Municipals |
20.0 | % | |
| Fixed Agency |
61.8 | % | |
| Floating MBS |
10.8 | % | |
| Floating CMO |
5.7 | % | |
| Fixed MBS |
1.4 | % | |
| Fixed CMO |
0.3 | % | |
| 100.0 | % | ||
The following table presents information on the maturities and weighted average yields of the Company’s investment securities at December 31, 2009. The weighted average yields are calculated on the basis of book value of the investment securities and on the interest income of the investments adjusted for amortization of premium and accretion of discount.
Table 9: Investment Maturities and Yields
| December 31, 2009 | ||||||||||||||||||
| Held to Maturity | Available for Sale | |||||||||||||||||
| (dollars in thousands) |
Amortized Cost |
Fair Value |
Weighted Average Yield |
Amortized Cost |
Fair Value |
Weighted Average Yield |
||||||||||||
| U.S. Government and agency: |
||||||||||||||||||
| Within one year |
$ | — | $ | — | — | $ | 3,500 | $ | 3,503 | 2.46 | % | |||||||
| After one year to five years |
— | — | — | 1,000 | 1,000 | 2.00 | % | |||||||||||
| After five years through ten years |
— | — | — | — | — | — | ||||||||||||
| After ten years |
— | — | — | — | — | — | ||||||||||||
| Total |
— | — | — | 4,500 | 4,503 | 2.36 | % | |||||||||||
| Mortgage-backed: |
||||||||||||||||||
| Within one year |
1 | 1 | 3.12 | % | 11 | 11 | 7.45 | % | ||||||||||
| After one year to five years |
143 | 143 | 5.10 | % | 401 | 409 | 3.52 | % | ||||||||||
| After five years through ten years |
14 | 14 | 2.26 | % | 22 | 24 | 6.60 | % | ||||||||||
| After ten years |
— | — | — | — | — | — | ||||||||||||
| Total |
158 | 158 | 4.84 | % | 434 | 444 | 3.77 | % | ||||||||||
| State and municipal: |
||||||||||||||||||
| Within one year |
— | — | — | 220 | 223 | 4.70 | % | |||||||||||
| After one year to five years |
— | — | — | 175 | 176 | 4.60 | % | |||||||||||
| After five years through ten years |
— | — | — | 250 | 251 | 4.55 | % | |||||||||||
| After ten years |
— | — | — | — | — | — | ||||||||||||
| Total |
— | — | — | 645 | 650 | 4.61 | % | |||||||||||
| Total securities |
$ | 158 | $ | 158 | 4.84 | % | $ | 5,579 | $ | 5,597 | 2.73 | % | ||||||
As of December 31, 2009, the overall portfolio has a yield of 3.96%, on a fully taxable equivalent basis. The portfolio has a weighted average repricing term of 1.4 years; 90.6% of total holdings are invested in fixed rate securities; and 97.3% of the portfolio is categorized as available for sale. As of December 31, 2009, the total portfolio, including both held to maturity and available for sale investments, currently contained an unrealized gain of $18.3 thousand.
Fixed agency holdings total $4.5 million par value, or 78.2% of the total holdings, and have a taxable equivalent yield to the effective maturity date of 2.36%. Municipal holdings total $645.0 thousand par value, or 11.2% of total holdings, and have a taxable equivalent yield to the effective maturity date of 6.68%. Management believes that the overall portfolio has good credit quality, as the majority of the issues are rated Aaa by Moody’s. The Company has one municipal holding with a total par value of $250.0 thousand in which the rating has been withdrawn by Moody’s as of December 31, 2009. This issue was previously rated Baa1 by Moody’s and therefore considered to be medium-grade and subject to moderate credit
29
Table of Contents
risk at the end of 2008. As the holding is a general obligation bond, it is backed by the full faith and credit of the municipality that issued it. The Company has two additional municipal holdings with a Moody’s rating of less than Aaa. The first municipal holding has a total par value of $175.0 thousand and has been rated Aa1 by Moody’s and therefore judged to be of high quality and subject to very low credit risk. The second municipal holding has a total par value of $220.0 thousand and has been rated A3 by Moody’s and therefore considered upper-medium grade and subject to low credit risk. Both holdings are general obligation bonds and backed by the full faith and credit of the municipality that issued them. The average duration date of the fixed agency and municipal portfolios is approximately 1.9 and 0.4 years, respectively.
Management frequently assesses the performance of the investment portfolio to ensure its yield and cash flow performances are consistent with the broad strategic plan of the Company. Flexibility is one of the hallmarks of the Company’s ability to meet the banking needs of its customers.
SOURCES OF FUNDS
Deposits
The Company’s predominant source of funds is depository accounts. The Company’s deposit base, which is provided by individuals and businesses located within the communities served, is comprised of demand deposits, savings and money market accounts, and time deposits. The Company’s balance sheet growth is largely determined by the availability of deposits in its markets, the cost of attracting the deposits and the prospects of profitably utilizing the available deposits by increasing the loan or investment portfolios.
Total deposits reached a record $1.1 billion as of December 31, 2009, an increase of 41.7% or $317.9 million over 2008. This is a continuation of the growth experienced in 2008 of $190.7 million or 33.3% to $763.0 million. Noninterest-bearing demand deposits decreased $2.3 million or 4.9% during 2009 following an increase of $6.0 million or 14.6% during 2008. Interest-bearing demand deposits increased $10.9 million or 16.7% during 2009 following a decrease of $12.4 million or 16.0% during 2008. Savings deposits increased $695.0 thousand or 10.9% during 2009 following an increase of $101.9 thousand or 1.6% during 2008. Management believes the overall growth in deposits is a result of the Company’s competitive interest rates on all deposit products, new branch locations, special deposit promotions and product enhancements, as well as the Company’s continued marketing efforts. Included in time deposits less than $100,000 as of December 31, 2009, 2008 and 2007 are $492.3 million, $362.7 million and $160.5 million, respectively, in broker certificates of deposits. The interest rates paid on these deposits are consistent, if not lower, than the market rates offered in our local area. Also included in time deposits less than $100,000 are CDARS (Certificate of Deposit Account Registry Service) and QwickRate deposits. As of December 31, 2009 and 2008, the Company had $0 and $4.7 million in CDARS deposits, respectively. As of December 31, 2009 and 2008, the Company had $37.4 million and $0 in QwickRate deposits, respectively.
Interest rates paid on specific deposit types are set by management and are determined based on (i) the interest rates offered by competitors, (ii) anticipated amount and timing of funding needs, (iii) availability of and cost of alternative sources of funding and (iv) anticipated future economic conditions and interest rates. Customer deposits are attractive sources of liquidity because of their stability, cost and the ability to generate fee income through the cross-sale of other services to the depositors. The Company will continue funding assets with deposit liability accounts and focus upon core deposit growth as its primary source of liquidity and stability.
The breakdown of deposits at December 31 for the three previous years is shown in the following table.
Table 10: Deposits by Classification
| December 31, | ||||||||||||||||||
| 2009 | 2008 | 2007 | ||||||||||||||||
| (dollars in thousands) |
Balance | % | Balance | % | Balance | % | ||||||||||||
| Noninterest-bearing demand deposits |
$ | 44,941 | 4.16 | % | $ | 47,259 | 6.19 | % | $ | 41,233 | 7.20 | % | ||||||
| Interest-bearing demand deposits |
76,218 | 7.05 | % | 65,312 | 8.56 | % | 77,750 | 13.59 | % | |||||||||
| Savings deposits |
7,101 | 0.65 | % | 6,406 | 0.84 | % | 6,304 | 1.10 | % | |||||||||
| Time deposits: |
||||||||||||||||||
| Less than $100,000 |
773,888 | 71.60 | % | 530,303 | 69.50 | % | 330,919 | 57.82 | % | |||||||||
| $100,000 or more |
178,748 | 16.54 | % | 113,726 | 14.91 | % | 116,090 | 20.29 | % | |||||||||
| $ | 1,080,896 | 100.00 | % | $ | 763,006 | 100.00 | % | $ | 572,296 | 100.00 | % | |||||||
Table 11: Maturities of Time Deposits $100,000 or More at December 31, 2009
| (in thousands) |
Amount | ||
| 3 months or less |
$ | 18,293 | |
| Over 3 through 12 months |
70,837 | ||
| Over 12 months |
89,618 | ||
| Total |
$ | 178,748 | |
30
Table of Contents
Borrowings
The Company’s ability to borrow funds through nondeposit sources provides additional flexibility in meeting the liquidity needs of customers while enhancing its cost of funds structure.
Purchased liabilities are composed of federal funds purchased, advances from the FHLB of Atlanta, advances from the Federal Reserve Discount Window, certificates of deposit of $100.0 thousand and over (large CDs) and broker certificates of deposits. The strong loan demand experienced over the last several years outpaced the Company’s increase in core deposits, and as a result purchased funds at December 31, 2009 equaled $756.0 million compared to $660.8 million in 2008 and $401.1 million in 2007, See Notes 7 and 8 in the Consolidated Financial Statements included as Exhibit 99.1 of this Form 10-K for additional disclosures related to borrowing arrangements.
On November 30, 2005, $20 million of trust preferred securities were placed through Commonwealth Bankshares Capital Trust II. The trust issuer has invested the total proceeds from the sale of the Trust Preferred in Junior Subordinated Deferrable Interest Debentures (the “Junior Subordinated Debentures”) issued by the Parent. The trust preferred securities pay cumulative cash distributions quarterly at an annual fixed rate equal to 6.265% through the interest payment date in December 2010 and a variable rate per annum, reset quarterly, equal to LIBOR plus 1.40%, thereafter. The dividends paid to holders of the trust preferred securities, which are recorded as interest expense, are deductible for income tax purposes. The trust preferred securities are redeemable on or after December 30, 2010, in whole or in part. Redemption is mandatory at December 30, 2035. The Parent has fully and unconditionally guaranteed the trust preferred securities through the combined operation of the debentures and other related documents. The Parent’s obligation under the guarantee is unsecured and subordinate to senior and subordinated indebtedness of the Parent.
In the fourth quarter of 2009, the Company elected to defer regularly scheduled interest payments on its outstanding Junior Subordinated Debentures relating to its trust preferred securities, as permitted under the indenture. The interest deferred under the indenture compounds quarterly at the interest rate then in effect. If the Company defers interest payments on the Junior Subordinated Debentures for more than 20 consecutive quarters, the Company would be in default under the governing agreements for such notes and the amount due under such agreements would be immediately due and payable.
As a result of the Bank being deemed to be in troubled condition within the meaning of federal statutes and regulations, the Company is restricted from making payments on its trust preferred securities and, therefore, is restricted from payments on the Junior Subordinated Debentures.
Noninterest Income
Total noninterest income decreased in 2009 to $3.5 million, a decrease of $1.2 million or 26.0% from the $4.8 million reported in 2008. Total noninterest income decreased $414.1 thousand or 8.0% in 2008 and increased $121.8 thousand or 2.4% in 2007. Service charges on deposit accounts decreased 9.8% in 2009, following an increase of 35.8% in 2008 and a decrease of 2.2% in 2007. Included in service charges on deposit accounts as of December 31, 2009, 2008 and 2007 were $1.1 million, $1.2 million and $792.9 thousand in non-sufficient funds (“NSF”) fees. Other service charges and fees increased 8.4% in 2009, 23.6% in 2008 and increased 26.5% in 2007. Included in other service charges and fees as of December 31, 2009, 2008 and 2007 were $461.3 thousand, $408.9 thousand and $344.0 thousand, respectively, in ATM fee income. The increases in ATM fee income are the result of the expansion of our branch and ATM networks as well as the record increases in deposits and the corresponding number of deposit accounts. The Company recorded losses on other real estate owned (OREO) totaling $989.0 thousand, $97.6 thousand and $0 for the years ended December 31, 2009, 2008 and 2007, respectively. For 2009, $694.5 thousand relates to losses resulting from valuation adjustments and the remaining $294.5 thousand relates to losses recorded on the sales of OREO properties. For 2008, $4.8 thousand relates to losses resulting from valuation adjustments and the remaining $92.8 thousand relates to loses recorded on the sales of OREO properties.
Revenues from Executive Title Center contributed $569.5 thousand, $806.4 thousand and $810.1 thousand to noninterest income during 2009, 2008 and 2007, respectively. Revenues from Commonwealth Financial Advisors, LLC contributed $337.9 thousand, $257.8 thousand and $857.2 thousand to noninterest income during 2009, 2008 and 2007, respectively. Also, included in noninterest income are revenues from the mortgage company which contributed $820.0 thousand, $1.1 million and $1.5 million to noninterest income for the years ended December 31, 2009, 2008 and 2007, respectively. Revenues mentioned above from our title and mortgage subsidiaries continue to be down over prior years due to the slow economy and the weak housing market.
Noninterest Expense
Noninterest expense represents the overhead expenses of the Company. One of the core operating principles of management continues to be the careful monitoring and control of these expenses. Total noninterest expense increased to $25.1 million in 2009 or 24.0% following increases of 0.1% and19.8% in 2008 and 2007, respectively. The ratio of noninterest expense to average total assets was 2.21%, 2.13% and 2.63% for the years ended December 31, 2009, 2008 and 2007, respectively. Cost associated with handling our substantial asset and liability growth, including the expansion of our branch network, resulted in increases to almost every component of noninterest expense. In addition, noninterest expense grew in 2009 due to the increased costs related to managing during this economic environment as further discussed below.
A key measure of overhead is the operating efficiency ratio. The operating efficiency ratio is calculated by dividing noninterest expense by net bank revenue on a tax equivalent basis. Efficiency gains can be achieved by controlling costs and generating more diverse and higher levels of noninterest revenues along with increasing our margins. The Company’s efficiency ratio (tax equivalent basis) was 63.22% for the year ended December 31, 2009, compared to 52.66% in 2008 and 51.96% in 2007. For the year ended December 31, 2009, the Company’s efficiency ratio was negatively impacted by the increase in losses on OREO, expenses related to OREO properties, FDIC insurance and legal expense related to loan colletctions.
Salaries and employee benefits, the largest component of noninterest expense, increased by 3.57% in 2009, following a decrease of 11.3% in 2008 and an increase of 18.3% in 2007. The increase in salaries and employee benefits was the result of the addition of several new positions, including the staff needed to operate the Bank’s two new branches that opened in late 2008 and an increase in certain employee benefit costs. These increases were offset by a reduction to accruals related to profit sharing and incentive expense and a reduction in volume-based commission expensed for the mortgage and investment services. The Company is currently servicing a record number of deposit and loan accounts. To support this growth,
31
Table of Contents
along with the legislation and requirements relating to the Sarbanes-Oxley Act, the Bank Secrecy Act, the Patriot Act, the Fair Credit Reporting Act, the Gramm Leach Bliley Act, and others, the Company had to deploy significant resources including additional employees who can devote the time and attention necessary to ensure ongoing compliance with each of these important policies. In addition, the Company has added personnel to its Special Assets and Credit Administration areas to proactively and aggressively identify and address problem assets. Salaries and benefit costs associated with the mortgage company were $722.5 thousand, $943.9 thousand and $1.2 million for the years ended December 31, 2009, 2008 and 2007, respectively. Salaries and benefit costs associated with the title company were $311.5 thousand, $326.1 thousand and $317.8 thousand for the years ended December 31, 2009, 2008 and 2007, respectively. Salaries and benefit costs associated with the investment company were $121.5 thousand, $234.6 thousand and $683.2 thousand for the years ended December 31, 2009, 2008 and 2007, respectively. Occupancy expense increased by 10.1% in 2009 following an increase of 48.2% in 2008 and 51.2% in 2007. The increases can be attributable to the opening of the six new branches in 2007, the four new branches opened in 2008, the improvements to several of the branch facilities, the cost of which qualified for capitalization, and the occupancy cost associated with the mortgage, title and investment companies. Other noninterest operating expenses, which include a grouping of numerous transactions relating to normal banking operations, increased $3.9 million or 74.3% in 2009 compared to a decrease of $208.9 thousand or 3.7% in 2008 and an increase of $661.4 thousand or 13.4% in 2007. The increase was comprised of increases in Bank Franchise Tax, expenses related to OREO properties, legal expenses related to loan collections, expenses related to loan reviews and FDIC insurance. Bank Franchise Tax, which is based largely on outstanding equity at year end, has increased 8.8%, 30.1% and 8.1% for 2009, 2008 and 2007, respectively as a result of our increased equity due to our earnings and capital the Company raised during the last several years. OREO expenses increased $2.1 million or 1924.1% compared to an increase of $108.0 thousand or 100% in 2008 with no expenses in 2007. The increase in OREO expenses is the direct result of the deterioration of the economy beginning in late 2008, which brought about the rapid decline in real estate values and record increases in foreclosed properties. Legal expenses related to loan collection costs were $462.8 thousand in 2009 as compared to almost no legal expenses in 2008 and 2007. This is the direct result of the unprecedented economic environment which continues to negatively impact our loan portfolio. Expenses related to a third-party loan review were $92.3 thousand in 2009 and $0 for each of 2008 and 2007. The Company has strengthened its credit administration processes with the addition of a third-party loan review team which completed a comprehensive review of our construction, development and commercial real estate loan portfolios, with an emphasis on large loans and problem loans. The Company plans for this type of review to be performed on a semi-annual basis for the foreseeable future. FDIC Insurance has increased 356.1%, 453.2% and 43.0% for 2009, 2008 and 2007, respectively. See “Regulation and Supervision” for more information about applicable FDIC insurance coverage and expense.
Income Taxes
The Company recorded an income tax benefit of $13.6 million and $1.9 million in 2009 and 2008, respectively, compared to income tax expense of $5.9 million in 2007. The Company’s effective tax rate for the years ended December 31, 2009, 2008 and 2007 was 34.6%, 33.9% and 34.6%, respectively. For more information on Income Tax Expense, see Note 12 of the Consolidated Financial Statements included as Exhibit 99.1 of this Form 10-K.
Dividends and Dividend Policy
The Company’s Board of Directors determines the amount of and whether or not to declare dividends. Such determinations by the Board take into account the Company’s financial condition, results of operations and other relevant factors, including any relevant regulatory restrictions. The Company’s only source of funds for cash dividends are dividends paid to the Company by the Bank. As a measure to preserve capital, the Board of Directors voted in July 2009 to defer the declaration of the quarterly dividend on the Company’s common stock for the foreseeable future. This action was aimed at managing the Company for long-term success and to further strengthen our balance sheet amidst the prolonged deterioration in the economy.
Currently, the Bank is deemed to be in troubled condition within the meaning of federal statutes and regulations, and each of the Parent and the Bank may not pay dividends to its shareholders. See Item 1. Business (Regulation and Supervision–Troubled Condition of the Bank).
In April 1999, the Company’s Board of Directors approved a Dividend Reinvestment and Stock Purchase Plan. Shares purchased from the Company with reinvested dividends are issued at a five percent (5%) discount from the market value. The plan also permits optional cash payments up to $20.0 thousand per quarter for the purchase of additional shares of common stock. These shares are issued at market value, without incurring brokerage commissions.
For the year ended December 31, 2009, the Company paid out quarterly cash dividends for a total of $0.10 per share or a 68.8% decrease from the year ended December 31, 2008. On February 27 and May 29, the Company paid dividends of $0.08 and $0.02 per share, respectively. In 2008, the Company paid a $0.08 cash dividend on each of February 29, May 30, August 29 and November 28, for a total of $0.32 paid out per share in 2008, an increase of 14.3% over 2007. In 2007, the Company paid a $0.06 cash dividend on February 28 and May 31, and increased the dividend 33.3% to $0.08, which was paid on August 31 and November 30 for a total of $0.28 per share paid out in 2007, an increase of 40.6% over 2006.
Capital Resources and Adequacy
Total stockholders’ equity at December 31, 2009 decreased 24.8% to $80.0 million compared to $106.4 million at December 31, 2008. During 2008, stockholders’ equity decreased 6.2% to $106.4 million compared to $113.4 million at December 31, 2007. During 2007, stockholders’ equity increased 9.9% from the $103.2 million at December 31, 2006. Contributing to the decrease in 2009 was our loss for the year of $25.8 million and the payment of dividends to stockholders of $685.7 thousand. Contributing to the decrease in 2008 was our loss of $3.7 million, the $2.1 million of common stock repurchased by the Company and the payment of dividends to stockholders of $2.2 million. Contributing to the increase in 2007 was our record earnings of $11.2 million.
The Federal Reserve, the Office of the Controller of the Currency and the FDIC have issued risk-based capital guidelines for U.S. banking organizations. These guidelines provide a capital framework that is sensitive to differences in risk profiles among banking companies. Risk-based capital ratios are another measure of capital adequacy. Under Federal Reserve Bank rules, the Company and the Bank were considered “well
32
Table of Contents
capitalized,” the highest category of capitalization defined by the regulators as of December 31, 2009. The Bank’s risk-adjusted capital ratios at December 31, 2009, were 9.80% for Tier 1 and 11.09% for total capital, well above the required minimums of 4.0% and 8.0%, respectively. These ratios are calculated using regulatory capital (either Tier 1 or total capital) as the numerator and both on and off-balance sheet risk-weighted assets as the denominator. Tier 1 capital consists primarily of common equity less goodwill and certain other intangible assets. Total capital adds certain qualifying debt instruments and a portion of the allowance for loan losses to Tier 1 capital. One of four risk weights, primarily based on credit risk, is applied to both on and off-balance sheet assets to determine the asset denominator.
In order to maintain a strong equity capital position and to protect against the risks of loss in the investment and loan portfolios and on other assets, management will continue to monitor the Bank’s capital position. Several measures have been or will be employed to maintain the Bank’s capital position, including but not limited to:
| • | Continuing its efforts to return all non-performing assets to performing status; |
| • | Monitoring the Bank’s growth; and |
| • | Continued utilization of its formal asset/liability policy. |
Once again, it should be noted that the Bank’s capital position has always exceeded and continues to exceed the minimum standards established by the regulatory authorities.
Liquidity
Bank liquidity is a measure of the ability to generate and maintain sufficient cash flows to fund operations and to meet financial obligations to depositors and borrowers promptly and in a cost-effective manner. Asset liquidity is provided primarily by maturing loans and investments, and by cash received from operations. Other sources of asset liquidity include readily marketable assets, especially short-term investments, and long-term investment securities that can serve as collateral for borrowings. On the liability side, liquidity is affected by the timing of maturing liabilities and the ability to generate new deposits or borrowings as needed.
The Company maintains a liquid portfolio of both assets and liabilities and attempts to mitigate the risk inherent in changing rates in this manner. Cash, interest bearing deposits in banks, federal funds sold and investments classified as available for sale totaled $191.1, $18.5 and $16.3 million as of December 31, 2009, 2008 and 2007, respectively. To provide liquidity for current ongoing and unanticipated needs, the Company maintains a portfolio of marketable investment securities, and structures and monitors the flow of funds from these securities and from maturing loans. The Company maintains access to short-term funding sources as well, including a federal funds line of credit with one correspondent bank up to $20.0 million and the ability to borrow from the Federal Home Loan Bank of Atlanta up to $168.8 million. As a result of the Company’s management of liquid assets, and the ability to generate liquidity through liability funding, including the use of broker certificates of deposit, management believes that the Company maintains overall liquidity sufficient to satisfy its depositor’s requirements and to meet customers’ credit needs.
The Company’s Asset/Liability Management Committee (“ALCO”) is responsible for formulating liquidity strategies, monitoring performance based on established objectives and approving new liquidity initiatives. ALCO’s overall objective is to optimize net interest income within the constraints of prudent capital adequacy, liquidity needs, the interest rate and economic outlook, market opportunities and customer requirements. General strategies to accomplish this objective include maintaining a strong balance sheet, achieving solid core deposit growth, taking on manageable interest rate risk and adhering to conservative financial management on a daily basis. These strategies are monitored regularly by ALCO and reviewed periodically with the Board of Directors.
Off-Balance Sheet Arrangements and Other Contractual Obligations
To meet the financing needs of customers, the Company is a party, in the normal course of business, to financial instruments with off-balance-sheet risk. These financial instruments include commitments to extend credit, commitments to sell loans and standby letters of credit. For further information on off-balance commitments see Note 21—Financial Instruments with Off-Balance Sheet Risk, in the Consolidated Financial Statements included as Exhibit 99.1 of this Form 10-K.
33
Table of Contents
The following table summarizes the Company’s significant contractual obligations, contingent obligations and certain other off-balance sheet commitments outstanding as of December 31, 2009:
Table 12: Contractual Obligations
| Payments due by period | |||||||||||||||
| (in thousands) |
Total | Less than 1 year |
1-3 years | 3-5 years | More than 5 years | ||||||||||
| Operating lease obligations |
$ | 18,040 | $ | 1,783 | $ | 3,387 | $ | 3,431 | $ | 9,439 | |||||
| Other liabilities on balance sheet under GAAP: |
|||||||||||||||
| Federal Home Loan Bank advances |
35,000 | 35,000 | — | — | — | ||||||||||
| Trust preferred capital notes |
20,619 | 20,619 | — | — | — | ||||||||||
| Long-term debt |
50,000 | — | — | — | 50,000 | ||||||||||
| Off-balance sheet commitments: |
|||||||||||||||
| Standby letters of credit |
10,360 | 10,081 | 279 | — | — | ||||||||||
| Commitments to extend credit |
36,770 | 36,770 | — | — | — | ||||||||||
| Total contractual obligations |
$ | 170,789 | $ | 104,253 | $ | 3,666 | $ | 3,431 | $ | 59,439 | |||||
Inflation
The Company carefully reviews Federal Reserve monetary policy in order to ensure an appropriate position between the cost and utilization of funds.
The effect of changing prices on financial institutions is typically different than on non-banking companies since virtually all of the Company’s assets and liabilities are monetary in nature. In particular, interest rates are significantly affected by inflation, but neither the timing nor the magnitude of the changes is directly related to price level indices. Accordingly, management believes the Company can best counter inflation over the long-term by managing net interest income and controlling net increases in noninterest income and expenses.
Critical Accounting Policies
Certain critical accounting policies affect the more significant judgments and estimates used in the preparation of the consolidated financial statements. The Company’s most critical accounting policy relates to the Company’s allowance for loan losses, which reflects the estimated losses resulting from the inability of the Company’s borrowers to make required loan payments. If the financial condition of the Company’s borrowers were to deteriorate resulting in an impairment of their ability to make payments, the Company’s estimates would be updated and additional provisions for loan losses may be required. Further discussion of the estimates used in determining the allowance for loan losses is contained in Note 1 to Consolidated Financial Statements included as Exhibit 99.1 of this Form 10-K.
Recent Accounting Pronouncements
On July 1, 2009, the Accounting Standards Codification became FASB’s officially recognized source of authoritative U.S. generally accepted accounting principles (“GAAP”) applicable to all public and non-public non-governmental entities, superseding existing FASB, American Institute of Certified Public Accountants, Emerging Issues Task Force and related literature. Rules and interpretive releases of the SEC under the authority of federal securities laws are also sources of authoritative GAAP for SEC registrants. All other accounting literature is considered non-authoritative. The switch to the ASC affects the way companies refer to U.S. GAAP in financial statements and accounting policies.
In June 2009, the FASB issued Statement of Financial Accounting Standards (“SFAS”) No. 168, “The FASB Accounting Standards Codification and the Hierarchy of Generally Accepted Accounting Principles, a Replacement of FASB Statement No. 162”, which was primarily codified into FASB ASC Topic 105 “Generally Accepted Accounting Standards”. This guidance will become the source of authoritative accounting principles recognized by the FASB to be applied by non-governmental entities in the preparation of financial statements in conformity with generally accepted accounting principles. Rules and interpretive releases of the SEC under authority of federal securities laws are also sources of authoritative guidance for SEC registrants. All guidance contained in the codification carries an equal level of authority. All non-grandfathered, non-SEC accounting literature not included in the codification is superseded and deemed non-authoritative. This guidance became effective for the Company’s financial statements for financial periods ending after September 15, 2009. Beginning in the third quarter of 2009, this guidance impacts the Company’s consolidated financial statements and related disclosures as all references to authoritative accounting literature reflect the newly adopted codification.
In June 2009, the FASB issued SFAS No. 167, “Amendments to FASB Interpretation No. 46(R)”, which was primarily codified into FASB ASC Topic 810 “Consolidation”. This guidance is a revision to pre-existing guidance pertaining to the consolidation and disclosures of variable interest entities. Specifically, it changes how a company determines when an entity that is insufficiently capitalized or is not controlled through voting (or similar rights) should be consolidated. The determination of whether a company is required to consolidate an entity is based on, among other things, an entity’s purpose and design and a company’s ability to direct the activities of the entity that most significantly impact the entity’s economic performance. The guidance requires additional disclosures about the reporting entity’s involvement with variable-interest entities and any significant changes in risk exposure due to that involvement as well as its affect on the entity’s financial statements. This guidance will be effective January 1, 2010. The Company does not anticipate that the adoption of this guidance will have a material impact on its consolidated financial statements.
34
Table of Contents
In June 2009, the FASB issued SFAS No. 166, “Accounting for Transfers of Financial Assets, an Amendment of FASB Statement No. 140”, which was primarily codified into FASB ASC Topic 860 “Transfers and Servicing”. This guidance amends prior accounting guidance to enhance reporting about transfers of financial assets, including securitizations, and where companies have continuing exposure to the risks related to transferred financial assets. This guidance eliminates the concept of a “qualifying special-purpose entity” and changes the requirements for derecognizing financial assets. The guidance also requires additional disclosures about all continuing involvements with transferred financial assets including information about gains and losses resulting from transfers during the period. This guidance will be effective January 1, 2010. The Company does not anticipate that the adoption of this guidance will have a material impact on its consolidated financial statements.
In May 2009, the FASB issued SFAS No. 165, “Subsequent Events”, which was primarily codified into FASB ASC Topic 855 “Subsequent Events”. This guidance is intended to establish general standards of accounting for and disclosure of events that occur after the balance sheet date but before financial statements are issued or are available to be issued. In particular, it establishes that the Company must evaluate subsequent events through the date the financial statements are issued, the circumstances under which a subsequent event should be recognized, and the circumstances for which a subsequent event should be disclosed. This guidance requires disclosure of the date through which an entity has evaluated subsequent events. This guidance became effective for the Company’s financial statements for financial periods ending after June 15, 2009. The adoption of this guidance did not have, and is not anticipated to have, a material impact on the Company’s consolidated financial statements.
In April 2009, the FASB issued SFAS No. 115-2 and SFAS No. 124-2, “Recognition and Presentation of Other-Than-Temporary Impairments” (“SFAS 115-2/124-2”), which was primarily codified into FASB ASC Topic 320 “Investments – Debt and Equity Securities”. This guidance for debt securities requires a write-down when fair value is below amortized cost in circumstances where: (1) an entity has the intent to sell a security; (2) it is more likely than not that an entity will be required to sell the security before recovery of its amortized cost basis; or (3) an entity does not expect to recover the entire amortized cost basis of the security. If an entity intends to sell a security or if it is more likely than not that the entity will be required to sell the security before recovery, an other-than-temporary impairment (“OTTI”) write-down is recognized in earnings equal to the entire difference between the security’s amortized cost basis and its fair value. If an entity does not intend to sell the security or it is not more likely than not that it will be required to sell the security before recovery, the OTTI write-down is separated into an amount representing credit loss, which is recognized in earnings, and an amount related to all other factors, which is recognized in other comprehensive income. This accounting standard does not amend existing recognition and measurement guidance related to OTTI write-downs of equity securities. This guidance also extends disclosure requirements related to debt and equity securities to interim reporting periods. This guidance became effective for the Company’s financial statements for financial periods ending after June 15, 2009. The adoption of the guidance did not have, and is not anticipated to have, a material impact on the Company’s consolidated financial statements.
In April 2009, the FASB issued SFAS No. 107-1 and APB 28-1, “Interim Disclosures about Fair Value of Financial Instruments”, which was primarily codified into FASB ASC Topic 825 “Financial Instruments”. This guidance requires disclosures about fair value of financial instruments in interim and annual financial statements. This guidance became effective for the Company’s financial statements for financial periods ending after June 15, 2009. The adoption of this guidance did not have, and is not anticipated to have, a material impact on the Company’s consolidated financial statements.
Item 7A. Quantitative and Qualitative Disclosures About Market Risk
The Company’s primary market risk is exposure to interest rate volatility. Fluctuations in interest rates will impact both the level of interest income and interest expense and the market value of the Company’s interest earning assets and interest bearing liabilities. Based on the nature of the Company’s operations, it is not subject to foreign currency exchange or commodity price risk. The Bank’s loan portfolio is concentrated primarily in the Hampton Roads and Northeastern North Carolina areas, including the cities of Norfolk, Virginia Beach, Chesapeake, Portsmouth and Suffolk, Virginia and the Outer Banks of North Carolina and is, therefore, subject to risks associated with these local economies. As of December 31, 2009, the Company does not have any hedging transactions in place such as interest rate swaps or caps.
The primary goal of the Company’s asset/liability management strategy is to optimize net interest income while limiting exposure to fluctuations caused by changes in the interest rate environment. The Company’s ability to manage its interest rate risk depends generally on the Company’s ability to match the maturities and re-pricing characteristics of its assets and liabilities while taking into account the separate goals of maintaining asset quality and liquidity and achieving the desired level of net interest income.
The Company’s management, guided by the ALCO, determines the overall magnitude of interest sensitivity risk and then formulates policies governing asset generation and pricing, funding sources and pricing, and off-balance sheet commitments. These decisions are based on management’s expectations regarding future interest rate movements, the state of the national and regional economy, and other financial and business risk factors.
The Company uses a variety of traditional and on-balance sheet tools to manage its interest rate risk. Gap analysis, which monitors the “gap” between interest-sensitive assets and liabilities, is one such tool. In addition, the Company uses simulation modeling to forecast future balance sheet and income statement behavior. By studying the effects on net interest income of rising, stable and falling interest rate scenarios, the Company can position itself to take advantage of anticipated interest rate movements, and protect itself from unanticipated interest rate movements, by understanding the dynamic nature of its balance sheet components.
Earnings Simulation Analysis: Management uses simulation analysis to measure the sensitivity of net interest income to changes in interest rates. The model calculates an earnings estimate based on current and projected balances and rates. This method is subject to the accuracy of the assumptions that underlie the process, but it provides a better analysis of the sensitivity of earnings to changes in interest rates than other analysis, such as the static gap analysis. Assumptions used in the model are derived from historical trends, peer analysis and management’s outlook. All maturities, calls and prepayments in the securities portfolio are assumed to be reinvested in like instruments. Mortgage loans and mortgage backed securities prepayment assumptions are based on industry estimates of prepayment speeds for portfolios with similar coupon ranges and seasoning.
35
Table of Contents
Different interest rate scenarios and yield curves are used to measure the sensitivity of earnings to changing interest rates. Interest rates on different asset and liability accounts move differently when the prime rate changes and are reflected in the different rate scenarios. Many factors affect the timing and magnitude of interest rate changes on financial instruments. Consequently, variations should be expected from the projections resulting from the controlled conditions of the simulation analysis.
The following table represents the interest rate sensitivity on net interest income for the Company for the twelve months following each of the two year ends 2009 and 2008, using different rate scenarios:
| Change in Prime Rate |
2009 % Change in Net Interest Income |
2008 % Change in Net Interest Income |
||||
| + 200 basis points |
19.29 | % | 5.68 | % | ||
| + 100 basis points |
9.75 | % | 3.18 | % | ||
| - 100 basis points |
(5.37 | %) | (4.14 | %) | ||
| - 200 basis points |
(5.47 | %) | (10.04 | %) |
Market Value Simulation: Market value simulation is used to calculate the estimated fair value of assets and liabilities over different interest rate environments. Market values are calculated based on discounted cash flow analysis. The net market value is the market value of all assets minus the market value of all liabilities. The change in net market value over different rate environments is an indication of the longer term interest rate risk in the balance sheet. Similar assumptions are used in the market value simulation as in the earnings simulation.
The following table reflects the change in net market value over different rate environments:
| Change in Prime Rate |
2009 % Change in Net Market Value |
2008 % Change in Net Market Value |
||||
| + 200 basis points |
(8.62 | %) | (12.40 | %) | ||
| + 100 basis points |
(3.44 | %) | (7.96 | %) | ||
| - 100 basis points |
8.83 | % | 12.90 | % | ||
| - 200 basis points |
25.64 | % | 26.53 | % |
Item 8. Financial Statements and Supplementary Data
The Company’s consolidated financial statements are included with this Form 10-K as Exhibit 99.1. Refer to the index to the Consolidated Financial Statements for the required information.
Item 9. Changes In and Disagreements With Accountants on Accounting and Financial Disclosure
None.
Item 9A. Controls and Procedures
Disclosure Controls and Procedures. The Company, under the supervision and with the participation of the Company’s management, including the Company’s Chief Executive Officer and the Chief Financial Officer, has evaluated the effectiveness of the Company’s disclosure controls and procedures (as defined in Rule 13a-15(e) and 15d-15(e) under the Exchange Act) as of the end of the period covered by this report. Among other factors in its evaluation, the Company considered the underlying reasons for the material weakness in internal control over financial reporting described below. Based on that evaluation, the Chief Executive Officer and the Chief Financial Officer have concluded that, as of December 31, 2009, the Company’s disclosure controls and procedures were effective to ensure that information required to be disclosed by the Company in reports that it files or submits under the Exchange Act is recorded, processed, summarized and reported within the time periods specified in SEC rules and forms and that such information is accumulated and communicated to the Company’s management, including the Company’s Chief Executive Officer and Chief Financial Officer, as appropriate to allow timely decisions regarding required disclosure. Because of the inherent limitations in all control systems, no evaluation of controls can provide absolute assurance that the Company’s disclosure controls and procedures will detect or uncover every situation involving the failure of persons within the Company to disclose material information otherwise required to be set forth in the Company’s periodic reports.
Management’s Report on Internal Control over Financial Reporting. Management of the Company is responsible for establishing and maintaining adequate internal control over financial reporting (as defined in Rule 13a-15(f) and 15d-15(f) under the Exchange Act). The Company’s internal control over financial reporting is designed to provide reasonable assurance to the Company’s management and board of directors regarding the reliability of financial reporting and preparation of financial statements for external purposes in accordance with generally accepted accounting principles.
Because of its inherent limitations, internal control over financial reporting may not prevent or detect misstatements. Therefore, even those systems determined to be effective can provide only reasonable assurance with respect to financial statement preparation and presentation.
Management assessed the effectiveness of the Company’s internal control over financial reporting as of December 31, 2009. In making this assessment, management used the criteria set forth by the Committee of Sponsoring Organizations of the Treadway Commission in Internal Control – Integrated Framework. Based on this assessment, management believes that, as of December 31, 2009, the Company’s internal control over financial reporting was ineffective based on those criteria.
36
Table of Contents
A material weakness is a deficiency, or a combination of deficiencies, in internal control over financial reporting, such that there is a reasonable possibility that a material misstatement of the company’s annual or interim financial statements will not be prevented or detected on a timely basis. Management previously disclosed a material weakness in internal control over financial reporting in its quarterly report on Form 10-Q/A filed on March 31, 2010 (the “Form 10-Q/A”) as a result of inadequate internal control policies related to the determination of the allowance for loan losses. Specifically, the Company’s policies and procedures did not provide for timely evaluation of management’s approach to assessing credit risk inherent in the Company’s loan portfolio or timely revision of that approach to reflect changes in the economic environment. The methodology and systems for the establishment of both general reserves and specific reserves on loans needed improvement in order to adequately estimate the expected losses in the Company’s loan portfolio. Further, the system for the identification and evaluation of nonaccrual and impaired loans and resulting implications to revenue recognition needed to be updated.
Remediation Plan
In response to the material weakness previously identified, the Company has implemented and will continue to reinforce the following remediation plan, which the Company believes has remediated the material weakness.
| • | Reviewed the overall loan loss provision process by assessing and enhancing the historical risk factors, recent trends in portfolio performance and economic forecasts used in determining the provision for loan losses. |
| • | Enhanced the methodology used in determining the provision for loan losses by assessing and updating related assumptions, valuations and judgments of management in light of the current economic and regulatory environment. |
| • | Ensured that the historical loss experience and all significant qualitative or environmental factors that affect the collectability of the portfolio have been appropriately considered. |
| • | Continued enhancement of training for its loan officers in the risk rating and problem loan identification process. Credit administration along with the Company’s independent loan review team will continue to have full authority in the final judgment of credit ratings. |
| • | Expanded the Company’s credit analysis department to ensure timely review of borrowers’ current financial conditions. |
| • | Hired a Chief Credit Officer in March 2010 to oversee and strengthen credit administration. |
| • | Implemented continual assessment of lending and credit administration policies and procedures, revising them as necessary to promote a culture that expects reliability and integrity of data. |
Through these steps, the Company believes it has appropriately addressed the material weakness in its internal control over financial reporting disclosed in its Form 10-Q/A. However, management feels that they have not had sufficient time to properly test the additional controls put in place to appropriately judge the effectiveness of internal control over financial reporting as of December 31, 2009. The Company cannot assure you that it or its independent accountants will not in the future identify further material weaknesses or significant deficiencies in the Company’s internal control over financial reporting that have not been discovered to date. In addition, the effectiveness of any system of internal controls is subject to inherent limitations and there can be no assurance that the Company’s internal control over financial reporting will prevent or detect all errors.
This annual report does not include an attestation report of the Company’s independent registered public accounting firm regarding internal control over financial reporting. Management’s report was not subject to attestation by the Company’s independent registered public accounting firm pursuant to temporary rules of the Securities and Exchange Commission that permit the Company to provide only management’s report in this annual report.
Changes in Internal Control over Financial Reporting. The only changes in our internal control over financial reporting that occurred during the quarter ended December 31, 2009 that have materially affected, or are reasonable likely to materially affect, our internal control over financial reporting, are summarized above in the discussion of the material weakness in internal control over financial reporting, as well as the related remediation plan. The Company expects the changes related to the remediation plan to materially affect and improve its internal control over financial reporting.
None.
PART III
Item 10. Directors, Executive Officers and Corporate Governance
The Board of Directors
Currently, the Board of the Parent is comprised of ten members who are divided into three classes. These directors serve for the terms of their respective classes, which expire in 2010, 2011 and 2012. The following table sets forth the current composition of the Board of Directors.
37
Table of Contents
| Class I (Term Expiring in 2010) |
Class II (Term Expiring in 2011) |
Class III (Term Expiring in 2012) | ||
| Morton Goldmeier | Herbert L. Perlin | Edward J. Woodard, Jr., CLBB | ||
| William D. Payne, M.D. | Kenneth J. Young | Laurence C. Fentriss | ||
| Richard J. Tavss | Thomas W. Moss, Jr. | Raju V. Uppalapati | ||
| E. Carlton Bowyer, Ph.D. | ||||
The following paragraphs set forth certain information, as of December 31, 2009, for each of the ten directors of Commonwealth Bankshares, Inc. In considering the directors’ individual experience, qualifications attributes and skills, the Board has concluded that the appropriate experience, qualifications, attributes and skills are represented for the Board as a whole and for each of the Board’s committees. In addition, each director possesses characteristics that led the Board to conclude that such person should serve as a director. The information presented below includes information each director has given us about his age, all positions he holds, his principal occupation and business experience for the past five years, and the names of other publicly–held companies of which he currently serves as a director or has served as a director during the past five years. In addition to the information presented below regarding each nominee’s specific experience, qualifications, attributes and skills that led our Board to the conclusion that he should serve as a director, we also believe that all of our director nominees have a reputation for integrity, honesty and adherence to high ethical standards. They each have demonstrated business acumen and an ability to exercise sound judgment as well as a commitment to service to the Company and our Board.
Class I
(Term Expiring in 2010)
Morton Goldmeier, 86, has served as President of Hampton Roads Management Associates, Inc., a real estate management company, since 1990. Mr. Goldmeier is also a retired partner and former Chairman of Goodman & Company, LLP, a regional certified public accounting and business advisory firm based in Norfolk, Virginia. Mr. Goldmeier brings to the Board over 40 years of experience in public accounting and extensive experience with public and financial accounting matters and strategic advisory services. He was an active member in the State and National CPA societies. Mr. Goldmeier has served as a director of the Parent and the Bank since 1988.
William D. Payne, M.D., 74, retired from Drs. Payne, Ives and Holland, Inc. in 2001 where he practiced surgery for 31 years. Dr. Payne brings to the Board leadership and management experience gained through managing his office practice and as manager of several commercial properties. Dr. Payne has served as a director of the Parent and the Bank since 1988.
Richard J. Tavss, 70, has served as Senior Counsel of Tavss Fletcher, Norfolk, Virginia, since 1977. Mr. Tavss has practiced law for over 46 years including representation of all types of businesses. He is also part owner and manager of several successful businesses. Through his legal career and business experience, Mr. Tavss has extensive expertise in business transactions and law that is invaluable to our Board. Mr. Tavss has served as a director of the Parent and the Bank since 1988.
E. Carlton Bowyer, Ph.D., 76, served as superintendent of the Virginia Beach School System before retiring in 1991. Dr. Bowyer was employed with the Virginia Beach School System for 31 years. During his 31 years, he was involved with the budget process, oversight of the accounting department and internal and external audits, corporate governance oversight and overall executive leadership and management. Prior to assuming the role of superintendent, he held the position of assistant superintendant for operational services where he supervised all purchasing, maintenance and construction for over 12 years. Additionally he served as associate superintendent. In this position, he supervised over 74 principals within the school system. Dr. Bowyer’s extensive background in education and administration provide our Board with leadership, management and consensus-building skills, particularly as applied to budget and accounting processes and workforce management. Dr. Bowyer served as a Virginia Beach Advisory Board director prior to becoming a director of the Parent and the Bank in 2001.
Class II
(Term Expiring in 2011)
Herbert L. Perlin, 69, has served as senior partner of Perlin Rossen & Associates LLC, a wealth management group located in Virginia Beach, Virginia, since 1983. Mr. Perlin provides financial consulting to corporate and individual business owners. He has over eight years of banking experience working with First Virginia Bank where he headed the real estate lending department and has taught tax and accounting classes at Tidewater Community College. Mr. Perlin brings to our Board in-depth knowledge of our local business markets and significant experience regarding real estate lending, personal and corporate finance, and tax. Mr. Perlin has served as a director of the Parent since 1988 and as a director of the Bank since 1987.
Kenneth J. Young, 59, has served as President of the Norfolk Tides and Albuquerque Isotopes baseball clubs and Ovations Food Services, since 1996. Mr. Young has owned and operated several successful businesses over the last 25 years. In addition, Mr. Young is a director of Progress Bank of Florida in Tampa, Florida where he also serves on its audit committee. Mr. Young brings to our Board a wide range of business expertise and management skills, and provides knowledge and insights developed from his experience serving on the board of directors of another financial institution. Mr. Young has served as a director of the Parent and the Bank since 1999.
Thomas W. Moss, Jr., 81, was elected Treasurer of the City of Norfolk in 2001. Mr. Moss was formerly Attorney, President and sole owner of Thomas W. Moss, Jr. PC and a former House Majority Leader and Speaker of the House of Delegates for the Commonwealth of Virginia. Mr.
38
Table of Contents
Moss served in the Virginia General Assembly for 34 years. Mr. Moss brings to the Board his experience as a legislator, including service on numerous committee memberships and chairmanships, which has strengthened his leadership and consensus-building skills. He also has public relations experience from running for and serving in, elected office. Mr. Moss contributes his significant connections throughout the Commonwealth of Virginia and his extensive public relations, legislative, leadership and consensus-building skills to our Board. Mr. Moss has served as a director of the Parent and the Bank since 1999.
Class III
(Term Expiring in 2012)
Edward J. Woodard, Jr., CLBB, 67, has served as President and Chief Executive Officer of the Bank since 1973 and as Chairman of the Board since 1988. He has served as Chairman of the Board, President and Chief Executive Officer of the Parent since 1988. Mr. Woodard is also President and Director of BOC Title of Hampton Roads, Inc., T/A Executive Title Center, BOC Insurance of Hampton Roads, Inc., Community Home Mortgage of Virginia, Inc., T/A Bank of the Commonwealth Mortgage and Commonwealth Financial Advisors, LLC, President of Boush Bank Building Corporation and a general partner in Boush Bank Building Associates. Prior to joining the Bank, Mr. Woodard served as an officer of First Virginia Bank of Tidewater for five years and as a manager of State Loan & Finance Management Corporation for five years. Mr. Woodard has served as President and Director of Tidewater Business Finance Corporation, a community development company specializing in SBA lending for over 25 years, and has also served as a director of the FHLB of Atlanta since November 2008. Mr. Woodard brings to our Board intimate knowledge of our business and operations, extensive experience in banking in the Tidewater region and expertise developed from service on the boards of directors of other banks and financial institutions. Mr. Woodard has served as a director of the Parent since 1988 and as a director of the Bank since 1973.
Laurence C. Fentriss, 55, has been Managing Partner of CBIA Advisors, Inc., a private equity fund, since 2006 and President and CEO of Acquiror, Inc., an investment company, since 1996. He is the past President of Anderson and Strudwick Investment Corporation, parent of Anderson and Strudwick, Inc., a full service brokerage and investment banking firm, and formerly co-founder of Baxter, Fentriss and Company, an investment banking firm. Mr. Fentriss has over 33 years in the banking industry and was formerly an officer of Crestar Bank. Mr. Fentriss serves as a director of ICBN Financial, a public company in Ontario, California. Mr. Fentriss is also a director of Gateway Bank, F.S.B., in San Francisco, California and Chairman of the Board of Progress Bank of Florida in Tampa, Florida. Mr. Fentriss has served as a director of the Parent and the Bank since 2001.
Raju V. Uppalapati, 47, has been the Chairman and CEO of RAVA Group since 2002. Mr. Uppalapati has been a partner of BD & A Realty & Construction, Inc., one of the largest Real Estate Developers in Eastern North Carolina since 1998 and has served as its CEO since 2003. In addition, he is the founder of several successful business start-ups involved in real estate, hospitality, financial, and technology sectors. Mr. Uppalapati brings extensive leadership and management experience to the Board, and his specific expertise in construction, development and real estate in our key banking markets provides our Board with key knowledge and insights that are particularly important in the current economic environment. Mr. Uppalapati has served as a director of the Parent and the Bank since September 2007.
Executive Officers of Commonwealth Bankshares, Inc. and Bank of the Commonwealth
In addition to Mr. Woodard, the following individuals serve as executive officers of the Company.
Cynthia A. Sabol, CPA, 47, assumed the role of Executive Vice President, Chief Financial Officer and Secretary of the Parent and Bank in February 2004. Ms. Sabol is also Director, Vice President, Secretary and Treasurer of BOC Title of Hampton Roads, Inc., T/A Executive Title Center, BOC Insurance of Hampton Roads, Inc., and Commonwealth Financial Advisors, LLC and Director, Vice President and Treasurer of Community Home Mortgage of Virginia, Inc., T/A Bank of the Commonwealth Mortgage. Prior to joining the Company, she worked at Hampton Roads Bankshares, Inc., a community bank located in Norfolk, Virginia, as Senior Vice President and Chief Financial Officer for ten years and as an executive with Ernst and Young, a public accounting firm, for nine years. Ms. Sabol is a certified public accountant and received a Bachelor of Science degree from the State University of New York at Albany.
Simon Hounslow, 45, Executive Vice President and Chief Lending Officer has been with the Bank since 1989. In December 2004, he was promoted from Senior Vice President to Executive Vice President and Chief Lending Officer. Mr. Hounslow has over 20 years in the banking industry, specializing in commercial, consumer and construction lending.
Stephen G. Fields, 46, joined the Company in December 2003 as Senior Vice President and Commercial Loan Officer. In December 2004, he was promoted to Executive Vice President and Commercial Loan Officer. Mr. Fields is also Director, Vice President and Secretary of Community Home Mortgage of Virginia, Inc., T/A Bank of the Commonwealth Mortgage and Director and Vice President of BOC Title of Hampton Roads, Inc., T/A Executive Title Center. Mr. Fields has 15 years of experience in the banking industry concentrating in commercial, consumer and construction lending. Prior to joining the Company, Mr. Fields worked at Bank of Hampton Roads, as Senior Vice President and Commercial Loan Officer for six years. Mr. Fields also worked six years as an examiner with the Federal Reserve Bank of Richmond.
Section 16(a) Beneficial Ownership Reporting Compliance
Section l6(a) of the Exchange Act requires directors, executive officers and persons who beneficially own more than 10.0% of the Company’s common stock to file initial reports of ownership and reports of changes in beneficial ownership with the SEC. Such persons are also required to furnish the Company with copies of all Section 16(a) forms they file.
Based solely on a review of the copies of such forms furnished to the Company, or written representations that no other reports were required, the Company believes that all Section 16 filing requirements applicable to its directors, officers and greater than 10.0% beneficial owners were complied with in 2009.
39
Table of Contents
Code of Ethics
We have adopted a Code of Ethics and Personal Conduct that applies to our principal executive officer, principal financial officer, principal accounting officer or controller, or persons performing similar functions. We will either post this Code on our Internet website at www.bankofthecommonwealth.com or, if not so posted, provide a copy of the Code to any person without charge upon written request to Cynthia A. Sabol, Executive Vice President and Chief Financial Officer, Commonwealth Bankshares, Inc., 403 Boush Street, Norfolk, VA 23510. We intend to provide any required disclosure of any amendment to or waiver from the Code that applies to our principal executive officer, principal financial officer, principal accounting officer or controller, or persons performing similar functions, on www.bankofthecommonwealth.com promptly following the amendment or waiver. We may elect to disclose any such amendment or waiver in a report on Form 8-K filed with the SEC either in addition to or in lieu of the website disclosure. The information contained on or connected to our Internet website is not incorporated by reference into this report and should not be considered part of this or any other report that we file with or furnish to the SEC.
Audit Committee and Audit Committee Financial Expert
The Company’s Board has a separately-designated standing Audit Committee established in accordance with Section 3(a)(58)(A) of the Exchange Act. The Audit Committee of the Board of Directors is currently composed of six non-employee directors. During 2009, the members of the Audit Committee were Morton Goldmeier, Thomas W. Moss, Jr., E. Carlton Bowyer, Ph.D., Herbert L. Perlin and Kenneth J. Young. In January 2010, William D. Payne, M.D. was appointed as an additional member of the Audit Committee. The Board has determined that Morton Goldmeier, Chairman of the Audit Committee, is an audit committee financial expert as defined by Item 407(d)(5)(ii) of Regulation S-K and that each member of the Audit Committee is independent within the meaning of Rule 5605(a)(2) of the Listing Rules of the NASDAQ and Rule 10A-3 under the Exchange Act.
Item 11. Executive Compensation
Compensation Discussion and Analysis
Overview of Compensation Program
The Personnel/Compensation Committee (the “Committee”) assists the Board of Directors in administering the policies governing the annual compensation paid to executive officers. The goal of the Committee is to motivate executives to achieve a range of performance consistent with the Company’s strategic and business plans approved by the Board of Directors while insuring that the financial costs of current or proposed compensation and benefit programs are reasonable and consistent with industry standards and shareholder interests. The Committee is comprised of five non-employee directors, William D. Payne, M.D., Chairman, E. Carlton Bowyer, Ph.D., Thomas W. Moss, Jr., Raju V. Uppalapati and Kenneth J. Young, each of whom is independent under the NASDAQ listing standards.
Compensation Philosophy
The Company’s executive compensation programs are designed to attract, motivate and retain executive talent with the skills, experience, motivation and commitment needed to optimize long-term shareholder value in a competitive environment. The executive compensation programs adopted by the Committee reflect the Committee’s belief that employee performance and achievement will result in long-term economic benefits to the Company, and that they will support the goal of increasing long-term shareholder value by achieving specific financial and strategic objectives.
The Company’s executive compensation programs are designed to:
| • | provide levels of base compensation that are competitive geographically and with comparable companies; |
| • | provide annual incentive compensation that varies in a consistent manner with the achievement of individual performance objectives and financial results of the Company without unreasonable risk-taking; and |
| • | provide long-term incentive compensation that focuses executive efforts on building long-term shareholder value through meeting longer-term financial and strategic goals. |
Compensation Program Components and Process
The primary elements of compensation for our executives include: salary, bonus, equity incentive awards, health, disability and life insurance, deferred supplemental compensation and perquisites. In designing and administering the Company’s executive compensation programs, the Committee attempts to strike an appropriate balance among these various elements, each of which is discussed in detail below. The Committee believes that executive compensation should be closely tied to financial and operational performance of the Company, as well as to the individual performance and responsibility level of the executives. The Committee also believes that executive compensation should contain an equity-based component in order to more closely align executive interests with those of shareholders.
Executive compensation is set at the regularly scheduled fall meeting of the Committee. The Chief Executive Officer does not make
40
Table of Contents
recommendations regarding or participate in the review of his compensation. With respect to the Company’s other executive officers, the Committee considers salary and incentive recommendations prepared by the Chief Executive Officer to establish compensation. Following extensive review and approval by the Committee, all issues pertaining to executive compensation are submitted to the full Board of Directors for its approval.
The Committee historically utilizes publicly available professional compensation surveys and labor market studies, including the Virginia Bankers Association’s Annual Executive Compensation and Benefits Survey, to make informed decisions regarding pay and benefit practices. Surveys prepared by management were used to periodically ensure that the Company is maintaining its labor market competitiveness. The Company has historically reviewed the executives’ salaries and benefits with those of executives in comparable positions within businesses of a similar size in the Company’s marketplace. While the Company does not set compensation at set percentage levels compared to the market, the Committee has historically sought to provide salary, incentive compensation opportunity and employee benefits that fall within the average practice of the Company’s competitors and the labor markets in which it participates, with the potential for higher than average compensation when the Company or the executive exceeds their performance goals. For 2009, executive compensation decisions were not based on any bench marking of peer institutions since the committee determined not to raise salaries or grant any equity awards for 2009.
Base Salary
Using the data obtained in the salary surveys, base pay for the Company’s executives is established based on the scope of their responsibilities, performance and the applicable competitive market compensation paid by other companies for similar positions. The subjective decisions regarding the amount and mix of compensation elements are primarily based upon an assessment of each executive’s leadership, performance and potential to enhance long-term shareholder value. Key factors include: the executive’s contribution to the Company’s financial results, and the executive’s effectiveness in leading initiatives to increase long-term shareholder value, productivity and revenue growth. Based on the overall financial performance of the Company, the committee decided that each of the named executive officers (“NEOs”) did not warrant a salary increase for 2009.
Performance Bonus
The Company maintains a management incentive cash bonus program to reward superior performance for the year. Executive bonuses are paid based on an evaluation of each executive’s current year performance, taking into consideration the Committee’s assessment of the overall financial, market and competitive performance of the Company and, for the commercial loan officers, their loan productivity and profitability levels. Cash bonuses are typically paid at the end of the fiscal year based on performance through the end of October of said year.
In establishing the Chief Executive Officer and Chief Financial Officer bonuses, in addition to the above, the Committee considers the level of and/or increases in return on average assets and return on average equity without encouraging short-term profitability through unreasonable risk-taking or a deterioration of long-term asset quality; consideration of individual as well as combined measures of progress of the Company including the quality of the loan and investment portfolio, desirable changes in capital ratios, the overall growth of the Company, the improvement of market share, the improvement in book value per share, the improvement in earnings per share, the level of non-performing loans, other real estate owned and other objectives as may be established by the Board of Directors; the SCC and Federal Reserves’ CAMELS ratings; and the compensation and benefit levels of comparable positions at peer institutions within the financial services industry operating in Virginia. There is no minimum or maximum bonus opportunity for the Chief Executive Officer and the Chief Financial Officer. The Committee determines the amount of the cash bonus based on its evaluation of all of these factors with no minimum target or maximum award in mind.
The executive commercial loan officers’, including the Chief Lending Officer, annual bonuses are set as a percentage of base salary and are tied to the achievement of several targets. The maximum potential bonus an executive commercial loan officer may be awarded is 50% of his base salary. The payout percentage is based on the officer’s average outstanding loan volume under management at the end of October of each year subject to increase or decrease based on satisfaction of the factors below. For every $2 million increase in average loan volume above the base volume of $10 million, the bonus will increase by 1% of the officer’s base salary beginning at 1%. In order to achieve the maximum bonus payout several factors will be considered: the Company must achieve certain profitability and performance levels which are set at the beginning of each year by the Committee; the credit quality of the commercial loan officer’s individual portfolio must be acceptable in the opinion of and based solely on the judgment of the President and Chief Executive Officer and the Committee; and management of the commercial loan officer’s loan portfolio regarding quality of loan write-ups, monitoring collateral and financial statement exceptions, monitoring past due loans and monitoring maturity issues, must meet or exceed established Company standards and be deemed acceptable by the President and Chief Executive Officer and the Committee. If the above goals are not met or performance is not in line with established Company standards, the bonus level, if any, awarded to the executive commercial loan officer is at the sole discretion of the Committee. Because the performance goals for 2009 were not met, no bonus awards were paid under the management incentive cash bonus program for 2009.
Equity Incentive Awards
The Company utilizes long-term equity incentive awards to promote the success of the Company and enhance its value by providing motivation for outstanding performance and employment longevity through linking the long-term personal interest of participants to those of the Company’s shareholders. The 2005 Stock Incentive Plan was approved by the shareholders at the Annual Meeting of Shareholders held on June 28, 2005 and provides for the issuance of restricted stock awards, stock options in the form of incentive stock options and non-statutory stock options, stock appreciation rights and other stock-based awards to employees and directors of the Company.
For the past several years, the Company has granted stock options as its only form of equity compensation. The Committee annually submits a recommendation in November to the Company’s Board of Directors regarding whether awards should be made for the fiscal year, and if so, the amount of award to be made to each participant. The total value of the awards and their effect on shareholder dilution is considered in determining the total amount of awards to be made for each fiscal year. Annual awards are generally made to individuals at the end of each fiscal year. These grants are made by the Board, based on recommendations submitted to the Committee by the Company’s Chief Executive Officer, except for his award
41
Table of Contents
which is determined by the Committee, based on the executive’s contribution to the success of the Company, taking into consideration competitive grant levels and total options granted as a percentage of shares outstanding. Each grant is designed to align the long-term interests of the executive with those of the shareholders.
Any such awards of stock options are made at or above the market price at the time of the award. In granting these awards, the Committee may establish any conditions or restrictions it deems appropriate. All stock options granted have a ten year life and are fully vested and exercisable at the date of grant. In an effort to minimize compensation expense given the difficult economic times and the financial results of the Company, the Committee thought it was appropriate not to grant stock options in 2009.
The Committee also considers the accounting implications of FASB ASC Topic 718 “Stock Compensation”, in its determination of the type and appropriate levels of long-term compensation. In 2007, the Committee gave serious consideration to the prospect of granting restricted stock awards as opposed to stock option grants, and determined that the subjective benefits and costs associated with stock option grants were more appropriate for the Company at the time. The Committee intends to continue to consider the benefits of alternative approaches to long-term compensation in order to select the method that will allow the Company to attract and retain highly skilled employees, and reward them for their continued employment with the Company and their hard work and commitment to the long-term success of the Company.
Deferred Supplemental Compensation
The Bank has entered into a deferred supplemental compensation agreement with each of the named executive officers of the Company to help retain the services of these key executives. Mr. Woodard entered into an amended and restated deferred supplemental compensation agreement, dated July 20, 2004, with the Bank. Under the supplemental agreement, upon the later of Mr. Woodard’s attaining the age of 65 or his retirement (or, if earlier, his death), Mr. Woodard or his beneficiary shall be entitled to payment from the Bank of: (i) $250,000 in 120 equal consecutive monthly installments of $2,083.33 each, (ii) $720,000 in 180 equal consecutive monthly installments of $4,000 each, and (iii) $540,000 in 180 equal consecutive monthly installments of $3,000 each, all three such payments being payable on the first day of each such month. Under the supplemental agreement, Mr. Woodard is obligated to make himself available to the Company after his retirement, so long as he receives payments under the supplemental agreement, for occasional consultation which the Company may reasonably request. Any amounts unpaid under the supplemental agreement may be forfeited, after notice to Mr. Woodard, in the event that the Board of Directors of the Company determines in good faith that Mr. Woodard is performing services of any kind for a firm or other entity competitive with the business of the Company during the period that he is receiving payments under the supplemental agreement.
The Company has also entered into amended deferred supplemental compensation agreements with Ms. Sabol, Mr. Hounslow and Mr. Fields. The terms and conditions of these amended agreements are virtually the same as those of Mr. Woodard’s deferred supplemental compensation agreement described above except for the amount of payment to which they are entitled. Under the supplemental agreement, Ms. Sabol is entitled to payment from the Bank of $1,500,000 in 180 equal consecutive monthly installments of $8,333.33 each. Mr. Hounslow and Mr. Fields are both entitled to $750,000 in 180 equal consecutive monthly installments of $4,166.67 each.
Supplemental Life Insurance
In addition to all payments described above, pursuant to an additional term life insurance policy, upon Mr. Woodard’s death, the Company shall pay to his beneficiary a lump sum payment of $250,000, payable on the first day of the second calendar month immediately following the date of death.
Supplemental Executive Retirement Plan
Effective February 1, 2002, the Company’s Board of Directors approved the Bank of the Commonwealth Supplemental Executive Retirement Plan, which is an executive deferred compensation plan in order to provide a select group of management and highly compensated executives the opportunity to elect to defer part or all of the compensation (including bonuses) payable to such executives during any plan year. Under this plan, a participant may designate a fixed dollar amount or a percentage to be deducted from his or her salary and/or bonus and then indicate how the deferred amount is to be invested between a fund that tracks the value of the Company’s stock and a simple interest bearing fund. The amount of deferred compensation in an executive’s account is held in a rabbi trust, but such amounts continue to be subject to the claims of the Bank’s general creditors until such time as they are distributed to the executive. Distributions are generally available at retirement age, death, or on account of disability. In addition, an executive who separates from service for a reason other than retirement, death, or disability, is entitled to receive distributions when he or she reaches age 65 (unless he or she dies or becomes disabled in the meantime, in which case benefits will be payable pursuant to the plan terms regarding such distributions). Distributions may be made in certain situations following a change of control. Distributions are generally made in the form of installment payments, although a distribution in a lump sum is available in limited situations. As of December 31, 2009, no executives were participating in this plan.
Perquisites and Other Employee Benefits
The Company provides the named executive officers with perquisites and other personal benefits that the Company and the Committee believe are reasonable and consistent with the Company’s overall compensation program to better enable the Company to attract and retain superior employees for key positions. The Company provides these perquisites as part of providing a competitive executive compensation program and for employee retention. The Committee periodically reviews the level of perquisites and other personal benefits provided to the executive officers.
The Company’s executive officers receive the fringe benefits normally provided by the Company to all other employees, including life, medical and disability insurance, participation in its 401(k) plan, paid time off and other Company-wide benefits which may be in effect from time to time. Prior to amendment effective December 29, 2009, the Company’s vacation and sick policy applicable to all employees and executive officers accumulated unused vacation and sick without limit and provided that, upon retirement or termination without cause, individuals would receive the
42
Table of Contents
value of accrued but unused vacation and sick either in the form of a lump sum cash payment or ongoing periodic payroll payments until paid in full. The Company accrued annually the cost of vacation and sick and expensed the amount for unused vacation and sick at the end of each year. While the amount of vacation provided under the policy varies based on several factors, all executive officers were and continue to be entitled to four weeks of vacation each year. As a result of the amendment, employees and executive officers can only carry over to the next year a total of ten days of unused vacation, however upon termination of employment the amount of earned and unused vacation at the date of termination is forfeited.
The Company amended the vacation and sick policy to eliminate the financial liability for unused vacation and sick beyond the limit. All employees and most executive officers were paid for accrued vacation and sick in December 2009; however, the Company determined not to pay at that time the amounts due to the named executive officers pending clarification of regulatory considerations which may be applicable to such payments. The amounts that would have been paid to each named executive officer if he or she had retired or terminated employment without cause as of December 31, 2009 are reflected in the Potential Payments Upon Termination or Change of Control Table on page 49. The Company anticipates paying these amounts during 2010.
In addition to these standard employee benefits, the executive officers are provided with the use of Company automobiles, and several named executive officers are provided with enhanced key-man long-term disability insurance and Mr. Woodard is provided a Company-paid membership to a country club for customer entertaining.
Employment Agreements
The Company has entered into employment agreements that include “change of control” provisions with certain key executives, including the named executive officers. The employment agreements are designed to promote stability and continuity of senior management. Information regarding applicable payments under such agreements for the named executive officers is provided on pages 47 and 48 under the sections “Employment Agreements” and “Potential Payments Upon Termination or Change of control.”
Tax and Accounting Implications
In designing its executive compensation programs, the Company takes into consideration the accounting and tax effect that each element will or may have on the Company and the executive officers as a group.
Beginning on January 1, 2006, the Company began accounting for stock-based payments including stock options, restricted stock or other equity awards in accordance with the requirements of FASB ASC Topic 718 “Stock Compensation”. In determining to grant only stock options instead of restricted stock or other forms of equity compensation, the Company considered the accounting impact and tax benefits, and has tried to minimize the overall equity compensation cost.
As part of its role, the Committee reviews and considers the deductibility of executive compensation under Section 162(m) of the Internal Revenue Code of 1986, as amended (the “Code”), which places a limitation on tax deductions of any publicly held corporation for individual compensation to certain executives of such corporation exceeding $1 million in any taxable year, unless the compensation is performance based. The Company believes that compensation paid under the management incentive plans are fully deductible for federal income tax purposes.
Mr. Woodard’s and Ms. Sabol’s employment agreements provide for a gross–up payment in the event any payment or distribution by the Company to or for the benefit of either executive, under a change of control, would be subject to the excise tax imposed by Section 4999 of the Code, to cover the excise tax imposed on the payments. If the severance exceeds certain limits as outlined under the Code, the Company may lose part of the deductibility of the severance for income tax purposes.
Generally, the Committee desires to maintain the tax deductibility of the compensation for executive officers to the extent it is feasible and consistent with the objectives of the Company’s executive compensation programs. The Committee considers ways to maximize the deductibility of executive compensation, but intends to retain the discretion it deems necessary to compensate executive officers in a manner commensurate with performance and the competitive environment for executive talent.
Risk Assessment
Our Audit Committee has initiated an ongoing assessment of our compensation practices in light of the risks in our operations. The Audit Committee, with the assistance of the Chief Financial Officer, has reviewed the Company’s different compensation policies and programs and concluded that the Company’s compensation practices do not encourage participants to take inappropriate risks that could be reasonably likely to result in a material adverse effect on the Company and its overall performance.
Compensation Committee Report
The Personnel/Compensation Committee of the Board of Directors has reviewed and discussed the Company’s Compensation Discussion and Analysis with management. Based on this review and discussion, the Compensation Committee recommended to the Board of Directors that the Compensation Discussion and Analysis be included in the Company’s Annual Report on Form 10-K for the year ended December 31, 2009, to be filed with the Securities and Exchange Commission.
The Personnel/Compensation Committee
William D. Payne, M.D., Chairman
E. Carlton Bowyer, Ph. D.
Thomas W. Moss, Jr.
Raju V. Uppalapati
Kenneth J. Young
43
Table of Contents
Summary Executive Compensation
The following table sets forth information for the years ended December 31, 2009, 2008 and 2007 regarding the compensation paid or accrued by the Company and its subsidiary for the Company’s named executive officers.
Summary Compensation Table for 2009
| Name and Principal Position |
Year | Salary (1) | Bonus (2) | Option Awards (3) |
Non-Equity Incentive Plan Compensation (2) |
Change in Pension Value and Nonqualified Deferred Compensation Earnings (4) |
All Other Compensation (5) |
Total ($) | |||||||||||||||
| Edward J. Woodard, Jr., CLBB |
2009 | $ | 571,250 | $ | — | $ | — | $ | — | $ | — | $ | 4,839 | $ | 576,089 | ||||||||
| 2008 | $ | 575,250 | $ | — | $ | — | $ | — | $ | 117,594 | $ | 6,339 | $ | 699,183 | |||||||||
| 2007 | $ | 475,500 | $ | 300,000 | $ | 1,890 | $ | — | $ | 160,526 | $ | 22,125 | $ | 960,041 | |||||||||
| Cynthia A. Sabol, CPA, |
2009 | $ | 212,000 | $ | — | $ | — | $ | — | $ | 45,152 | $ | 703 | $ | 257,855 | ||||||||
| 2008 | $ | 212,000 | $ | — | $ | — | $ | — | $ | 45,152 | $ | 5,425 | $ | 262,577 | |||||||||
| 2007 | $ | 200,000 | $ | 115,000 | $ | 1,890 | $ | — | $ | 27,353 | $ | 15,786 | $ | 360,029 | |||||||||
| Simon Hounslow, |
2009 | $ | 173,745 | $ | — | $ | — | $ | — | $ | 20,047 | $ | 825 | $ | 194,617 | ||||||||
| 2008 | $ | 173,745 | $ | — | $ | — | $ | — | $ | 20,047 | $ | 4,444 | $ | 198,236 | |||||||||
| 2007 | $ | 165,000 | $ | — | $ | 1,890 | $ | 82,500 | $ | 14,326 | $ | 14,848 | $ | 278,564 | |||||||||
| Stephen G. Fields, |
2009 | $ | 160,000 | $ | — | $ | — | $ | — | $ | 22,065 | $ | 520 | $ | 182,585 | ||||||||
| 2008 | $ | 160,000 | $ | — | $ | — | $ | — | $ | 22,065 | $ | 3,618 | $ | 185,683 | |||||||||
| 2007 | $ | 152,000 | $ | — | $ | 1,260 | $ | 76,000 | $ | 16,070 | $ | 15,092 | $ | 260,422 | |||||||||
| (1) | Includes fees paid to Mr. Woodard as a director of the Company in the amount of $71,250 for 2009, $75,250 for 2008 and $75,500 for 2007. |
| (2) | Awards under the Company’s management incentive cash bonus program are reported under the Bonus column for Mr. Woodard and Ms. Sabol as they are not considered incentive plan compensation. The annual cash bonus awards for Messrs. Hounslow and Fields are reported under the Non-Equity Incentive Plan Compensation column. No awards were earned under the management incentive cash bonus program for 2009 and 2008. |
| (3) | Reflects the grant date fair value of options granted to each NEO on December 11, 2007. Assumptions used in the calculation of these amounts are included in Note 18 in the Consolidated Financial Statements attached as Exhibit 99.1 to this Form 10-K as of December 31, 2009. |
| (4) | Reflects the increase in the NEOs accumulated benefits under his or her deferred supplemental compensation agreement. |
| (5) | For 2009, includes 401(k) matching contribution for each of the NEOs, and life insurance premium paid for the benefit of Mr. Woodard’s beneficiary. None of the NEOs received perquisites exceeding $10,000 in the aggregate for 2009. |
44
Table of Contents
Grants of Plan-Based Awards
The following table summarizes certain information with respect to plan-based awards granted to the named executive officers during or for the year ended December 31, 2009 under the Company’s management incentive cash bonus program, and reflects the amounts that could have been earned under each such award. No awards were earned under this program for 2009.
Grants of Plan-Based Awards for 2009
| Estimated Possible Payouts Under | ||||||||
| Non-Equity Incentive Plan Awards (1) | ||||||||
| Name |
Threshold ($) |
Target ($) |
Maximum ($) | |||||
| Edward J. Woodard, Jr., CLBB |
— | — | — | |||||
| Cynthia A. Sabol, CPA |
— | — | — | |||||
| Simon Hounslow |
$ | 1,737 | — | $ | 86,873 | |||
| Stephen G. Fields |
$ | 1,600 | — | $ | 80,000 | |||
| (1) | The maximum potential bonus under the Company’s management incentive cash bonus program an executive commercial loan officer may be awarded is 50% of his base salary. The payout percentage is based on the officer’s average outstanding loan volume under management at the end of October of each year subject to increase or decrease based on satisfaction of certain factors. For every $2 million increase in average loan volume above the base volume of $10 million, the bonus will increase by 1% of the officer’s base salary beginning at 1.0%. Because the performance criteria was not met for 2009 no cash bonuses were awarded for 2009 performance under this program. |
45
Table of Contents
Outstanding Equity Awards
The table below sets forth information regarding the outstanding equity awards as of December 31, 2009 held by each named executive officer. The Company has not granted any restricted stock.
Outstanding Equity Awards at 2009 Fiscal Year-End
Option Awards
| Name |
Number of Securities Underlying Unexercised Options (#) Exercisable (1) |
Option Exercise Price ($) |
Option Expiration Date | |||||
| Edward J. Woodard, Jr., CLBB |
6,050 | (2) | $ | 7.686 | 12/31/09 | |||
| 6,050 | (2) | 5.893 | 10/01/11 | |||||
| 5,324 | (2) | 15.950 | 12/30/13 | |||||
| 5,445 | (2) | 15.512 | 12/14/14 | |||||
| 36,300 | (3) | 19.008 | 09/26/15 | |||||
| 1,320 | (3) | 24.873 | 12/06/16 | |||||
| 3,630 | (2) | 15.512 | 12/14/14 | |||||
| 3,630 | (2) | 19.314 | 09/26/15 | |||||
| 3,630 | (3) | 21.694 | 11/15/15 | |||||
| 1,500 | (3) | 16.980 | 12/11/17 | |||||
| Cynthia A. Sabol, CPA |
7,260 | (2) | $ | 15.512 | 12/14/14 | |||
| 36,300 | (3) | 19.008 | 09/26/15 | |||||
| 1,320 | (3) | 24.873 | 12/06/16 | |||||
| 1,500 | (3) | 16.980 | 12/11/17 | |||||
| Simon Hounslow |
3,025 | (2) | $ | 7.686 | 12/31/09 | |||
| 3,025 | (2) | 5.893 | 10/01/11 | |||||
| 4,840 | (2) | 15.950 | 12/30/13 | |||||
| 6,050 | (2) | 15.512 | 12/14/14 | |||||
| 30,250 | (3) | 19.008 | 09/26/15 | |||||
| 1,320 | (3) | 24.873 | 12/06/16 | |||||
| 1,500 | (3) | 16.980 | 12/11/17 | |||||
| Stephen G. Fields |
6,050 | (2) | $ | 15.512 | 12/14/14 | |||
| 30,250 | (3) | 19.008 | 09/26/15 | |||||
| 550 | (3) | 24.873 | 12/06/16 | |||||
| 1,000 | (3) | 16.980 | 12/11/17 | |||||
| (1) | All options are immediately vested on the date of the grant. |
| (2) | Stock Options issued under the Company’s 1999 Stock Incentive Plan. |
| (3) | Stock Options issued under the Company’s 2005 Stock Incentive Plan. |
Option Exercises and Stock Vested
No options were exercised by the named executive officers during the last fiscal year. The Company has not granted any restricted stock.
46
Table of Contents
Deferred Supplemental Compensation
This table shows the accumulated benefit as of December 31, 2009 for each named executive officer under his or her deferred supplemental compensation agreement in effect at such time.
Pension Benefits (1)
| Name |
Plan Name (2) |
Present Value of Accumulated Benefit ($) |
Payments During Last Fiscal Year ($) | |||||
| Edward J. Woodard, Jr., CLBB |
Amended and Restated Deferred Supplemental Compensation Agreement | $ | 1,011,301 | $ | — | |||
| Cynthia A. Sabol, CPA |
Amended and Restated Deferred Supplemental Compensation Agreement | $ | 186,044 | $ | — | |||
| Simon Hounslow |
Amended and Restated Deferred Supplemental Compensation Agreement | $ | 113,192 | $ | — | |||
| Stephen G. Fields |
Amended and Restated Deferred Supplemental Compensation Agreement | $ | 100,376 | $ | — | |||
| (1) | The number of years of credited service are not relevant to the deferred supplemental compensation agreements, so the Number of Years of Credited Service column has been omitted. |
| (2) | The named executive officers are fully vested under the deferred supplemental compensation agreements. |
Employment Agreements
The Company has entered into employment agreements with Edward J. Woodard, Jr., CLBB, Chairman of the Board, President and Chief Executive Officer, dated November 21, 2006 and Cynthia A. Sabol, CPA, Executive Vice President and Chief Financial Officer, dated November 21, 2006. The agreements provide for Mr. Woodard’s and Ms. Sabol’s (each a “Senior Executive”) employment until the earlier of December 31, 2009, the Senior Executive’s death or disability; provided, however, the employment agreements allow for termination of employment by either the Company, or by the Senior Executive in the event of a “change of control” of the Company or the Bank, or by the Senior Executive for “Good Reason.” The Senior Executive’s employment agreement is renewed automatically each December 31 for an additional two-year term unless either party elects not to renew the agreement. The contracts were amended as of December 31, 2008, in order to comply with applicable provisions of Section 409A of the Code. Changes were made within the existing agreements to address time and form of payment requirements, but did not change the effective date or any substantive terms of the contract. As amended, these contracts provide that if the Senior Executive is considered a Key Employee under the definition of the Code, on the date of termination and employment is terminated for reasons other than death, no payment due under the contract shall commence until the first day of the seventh month following the date the Senior Executive’s employment terminates. The first payment shall include the six months of payments that the Senior Executive would have otherwise received.
Under each employment agreement, in the case of termination as a consequence of disability, the Company will continue to pay the Senior Executive his or her base salary and health and medical insurance for six months.
In the case of a termination by the Company prior to a “change of control,” but without “Cause,” the Senior Executive will be entitled to receive two times his or her annual base salary in effect on the date of termination, payable in 24 equal monthly installments. In addition, the Senior Executive would be eligible to continue to receive medical and other insurance benefits for a period of two years. In the event of a termination of employment by the Senior Executive for “Good Reason,” the Senior Executive will be entitled to receive 36 equal monthly payments, which, in total, equal his or her current annual base salary in effect on the date of termination. In addition, the Senior Executive would be eligible to continue to receive medical and other insurance benefits for a period of three years.
In the event of a termination of employment by the Company subsequent to a “change of control,” but without “Cause,” or by the Senior Executive within twelve months following a change of control, the Senior Executive would be entitled to receive in a lump sum payment, a salary continuance benefit in an amount equal to 2.99 times the Senior Executive’s base salary in effect at the date of termination, plus the highest annual bonus paid or payable for the two most recently completed years. In addition, the Senior Executive would be eligible to continue to receive all health and dental plans, disability, life insurance plans and all other welfare benefit plans for a period of three years. The severance payment could be increased (gross up payment) if it is determined that the severance payment together with any other payments or benefits would be subject to the excise tax imposed under the Code.
Under the agreements, a “change of control” will be deemed to have occurred upon one or more of the following occurring:
| • | The acquisition by any person of beneficial ownership of 25.0% or more of the then outstanding shares of the common stock of the Company; |
| • | A change in the majority of the members of the Board of Directors of either the Company or the Bank; |
| • | Approval by the shareholders of the Company of a reorganization, merger, share exchange or consolidation; or |
| • | Complete liquidation or dissolution of the Company or the Bank, or of the sale or other disposition of all or substantially all of the assets of the Company or the Bank. |
47
Table of Contents
Termination for “Cause” includes a termination of the Senior Executive for his or her failure to perform the required services, gross or willful neglect of duty or a legal or intentional act demonstrating bad faith. The term “Good Reason” is defined as: the assignment of duties to the Senior Executive by the Company which result in the Senior Executive having significantly less authority or responsibility than he or she had on the date of hire, without his or her express written consent; a reduction by the Company of the Senior Executive’s base salary; the requirement that the Senior Executive’s principal office location be moved or relocated to a location that is more than 35 miles from the current principal office location; or the Company’s failure to comply with any material terms of the agreement.
In addition to Mr. Woodard’s and Ms. Sabol’s employment agreements, the Company has entered into similar employment agreements with Simon Hounslow and Stephen G. Fields each dated May 18, 2004, and amended as of December 31, 2008, in order to comply with applicable provisions of Section 409A of the Code. The agreements provide for Mr. Hounslow’s, and Mr. Fields’ (each an “Executive”) employment to extend for a period of one year and to be renewed automatically each year unless either party elects not to renew the agreement, their death or disability. Additionally, the employment agreements allow for termination of employment by either the Company, or the Executive in the event of a “change of control” of the Company or the Bank, or by the Executive for “Good Reason.”
Under the employment agreements, in the case of a termination by the Company prior to a “change of control,” but not “for good cause,” Mr. Hounslow and Mr. Fields will each be entitled to receive 12 equal monthly payments, which in total, equal his annual base salary. In the event of a termination of the employment agreement by the Executive for “good reason,” by the Company subsequent to a “change of control,” but not “for good cause,” the Executive will be entitled to receive 60 equal monthly payments, which in total, equal the present value of one times the Executive’s base salary minus $1.00 at the time of termination. In addition, the Executive would be eligible to continue to participate in the Company’s medical and other insurance benefit programs for a period of up to six months.
Under the agreements, a “change of control” will be deemed to have occurred upon one or more of the following occurring:
| • | Any third party acquiring, or entering into a definitive agreement to acquire, more than 25.0% of the stock of either the Company or the Bank; |
| • | A change in the majority of the members of the Board of Directors of either the Company or the Bank during any one year period; or |
| • | The Company ceasing to be the owner of all of the Bank’s common stock, except for any directors’ qualifying shares. |
The term “for good cause”, includes a termination of the Executive for his failure to perform the required services, gross or willful neglect of his duty or a legal or intentional act demonstrating bad faith. The term “Good Reason” is defined as any assignment to the Executive of duties or responsibilities inconsistent with those in effect on the date of the agreement, the location of the Executive office and/or workplace for employer is moved or relocated to a site 25 miles or more from the location as of the date of this agreement, or a change of control of either the Company or the Bank.
Potential Payments Upon Termination or Change of Control
The table below shows the present value of estimated Company payments pursuant to the employment agreements outlined above, upon a termination of employment, including the Company gross-up payments for the excise tax on parachute payments upon a change of control, for each of the named executive officers. The payments represent the maximum possible payments under interpretations and assumptions most favorable to the Senior Executives and Executives. All termination events are assumed to occur at December 31, 2009. For the below calculations it is assumed the Senior Executives and Executives elected to receive a lump sum payment if the choice is given under the provisions of the agreements. Company payments to a terminated Senior Executive or Executive may be more or less than the amounts shown in the table if the termination of employment occurs in a later year or because of contingencies contained in the various agreements and plans. In addition to any payments provided for under the employment agreements, upon termination not for cause, each Senior Executive or Executive Officer is entitled to a cash payment for any accrued but unused vacation and sick as of the date of termination. There are no potential payments due to the named executive officers pursuant to the employment agreements under a termination of employment by the executives without good reason, termination of employment by Company with cause or upon death, except for the life insurance policies that will pay policy amounts to the executives’ beneficiaries in the event of death and the accrued vacation pay discussed above. No accelerated vesting of equity awards is reflected in the table below because all equity awards are vested at the date of grant.
The table below does not reflect any restrictions on Company payments pursuant to the employment contracts outlined above, including restrictions on golden parachute payments, due to the Bank being deemed to be in troubled condition within the meaning of federal statutes and regulations.
48
Table of Contents
Potential Payments Upon Termination or Change of Control Table
| Woodard | Sabol | Hounslow | Fields | |||||||||||||||
| Termination of Employment by Executive with Good Reason |
||||||||||||||||||
| Employment agreement: |
||||||||||||||||||
| Salary |
$ | 1,444,991 | $ | 612,676 | $ | 162,387 | $ | 149,541 | ||||||||||
| Welfare benefits |
23,369 | 39,638 | 4,260 | 6,494 | ||||||||||||||
| Accrued vacation/sick |
919,310 | 125,181 | 250,569 | 76,725 | ||||||||||||||
| Termination of Employment by Company without Cause |
||||||||||||||||||
| Employment agreement: |
||||||||||||||||||
| Salary |
977,025 | 414,259 | 171,529 | 157,960 | ||||||||||||||
| Welfare benefits |
15,831 | 26,852 | 4,260 | 6,494 | ||||||||||||||
| Accrued vacation/sick |
919,310 | 125,181 | 250,569 | 76,725 | ||||||||||||||
| Disability |
||||||||||||||||||
| Employment agreement: |
||||||||||||||||||
| Salary |
245,976 | 104,294 | 85,474 | 78,712 | ||||||||||||||
| Welfare benefits |
3,411 | 4,083 | 2,736 | 4,422 | ||||||||||||||
| Accrued vacation/sick |
919,310 | 125,181 | 250,569 | 76,725 | ||||||||||||||
| Change in Control |
||||||||||||||||||
| Employment agreement: |
||||||||||||||||||
| Salary |
1,470,938 | 633,880 | 162,387 | 149,541 | ||||||||||||||
| Welfare benefits |
23,369 | 39,638 | 4,260 | 6,494 | ||||||||||||||
| Excise Tax Gross-up |
518,232 | 212,690 | — | — | ||||||||||||||
| Accrued vacation/sick |
919,310 | 125,181 | 250,569 | 76,725 | ||||||||||||||
Stock Option and Employee Benefit Plans
401(k) Profit Sharing Plan. In 1993, the Bank adopted a 401(k) profit sharing plan qualified under Section 401(k) of the Code to replace its former profit sharing plan. Employees who have attained the age of 20 years and six months and completed three months of service with the Bank are eligible to participate in the 401(k) plan. Eligible employees who elect to participate may defer up to the maximum allowable as prescribed by law. The Bank may make a matching contribution, the amount of which, if any, will be determined by the Bank each year. The Bank contributed a matching contribution of $18.2 thousand to the 401(k) plan during 2009. The Bank may also make a discretionary profit sharing contribution in an amount, in any, determined by the Committee each year. The Bank did not make a profit sharing contribution for 2009. The Company offers its stock as an investment option under the 401(k) plan.
1999 Stock Incentive Plan. On June 1, 1999, the Company’s shareholders approved the Commonwealth Bankshares, Inc. 1999 Stock Incentive Plan. This plan provides for the issuance of up to the lesser of (i) 15.0% of the Company’s issued and outstanding common stock less the aggregate number of shares subject to issuance pursuant to options granted, or available for grant, under two of the Company’s prior plans or (ii) 350,000 shares. Of the aggregate number of shares of the Company’s common stock that could be subject to award under this plan, 60.0% were available for issuance to the Company’s non-employee directors, and 40.0% were available for issuance to the Company’s employees. All the employees of the Company and the Bank, and all other members of the Board of Directors of the Company, were eligible to receive awards under this plan. This plan expired in February 2009 and no new awards will be granted under this plan. The plan continues to govern all currently outstanding option awards granted under the plan.
The Bank of the Commonwealth Supplemental Executive Retirement Plan. Effective February 1, 2002, the Company’s Board of Directors approved the Bank of the Commonwealth Supplemental Executive Retirement Plan, which is an executive deferred compensation plan in order to provide a select group of management and highly compensated executives the opportunity to elect to defer part or all of the compensation (including bonuses) payable to such executives during any plan year. Under this plan, a participant may designate a fixed dollar amount or a percentage to be deducted from his or her salary and/or bonus and then indicate how the deferred amount is to be invested between a fund that tracks the value of the Company’s stock and a simple interest bearing fund. The amount of deferred compensation in an executive’s account is held in a rabbi trust, but such amounts continue to be subject to the claims of the Bank’s general creditors until such time as they are distributed to the executive. Distributions are generally available at retirement age, death, or on account of disability. In addition, an executive who separates from service for a reason other than retirement, death, or disability, is entitled to receive distributions when he or she reaches age 65 (unless he or she dies or becomes disabled in the meantime, in which case benefits will be payable pursuant to the plan terms regarding such distributions). Distributions may also be made in certain situations following a change of control. Distributions are generally made in the form of installment payments, although a distribution in a lump sum is available in limited situations. As of December 31, 2009, no executives were participating in this plan.
49
Table of Contents
2005 Stock Incentive Plan. On June 28, 2005, the Company’s shareholders approved the Commonwealth Bankshares, Inc. 2005 Stock Incentive Plan. The plan provides for the issuance of restricted stock awards, stock options in the form of incentive stock options and non-statutory stock options, stock appreciation rights and other stock-based awards to employees and directors of the Company. The plan makes available up to 556,600 shares for issuance to plan participants. The maximum number of shares that may be issued under the plan in connection with the exercise of incentive stock options, which are eligible for more favorable tax treatment, is 484,000 shares. The maximum number of shares with respect to which stock options, restricted stock awards, stock appreciation rights or other equity based awards may be granted under the plan in any calendar year to an employee is 90,750 shares.
Commonwealth Bankshares Employee Stock Purchase Plan. On June 26, 2007, the Company’s shareholders approved the Commonwealth Bankshares Employee Stock Purchase Plan. The plan offers eligible employees the opportunity to acquire a stock ownership in the Company through periodic payroll deductions that are applied towards the purchase of Company common stock at a discount of up to 15% of its market price. The plan makes available up to 400,000 shares of Company common stock for issuance to eligible employees. As of December 31, 2009, no shares have been issued under this plan.
Compensation Committee Interlocks and Insider Participation
No member of the Company’s Personnel/Compensation Committee has served as an officer or employee of the Company. During 2009, no executive officer of the Company served as a member of the compensation committee (or other board committee performing equivalent functions) of another entity, nor did any executive officer of the Company serve as a director of another entity, one of whose executive officers served on the Company’s Personnel/Compensation Committee. All five members of the Company’s Personnel/Compensation Committee have outstanding loans with the Company. Each of these loans was made in the ordinary course of business on substantially the same terms, including interest rates, collateral and repayment terms, as those prevailing at the time for comparable transactions with parties not related to the Bank and did not involve more than the normal risk of collectability or present other unfavorable features. See Item 13. “Certain Relationships and Related Transactions, and Director Independence” below for a discussion of transactions involving Mr. Uppalapati.
Director Compensation
The following table sets forth a summary of the compensation paid to non-employee directors in 2009:
Director Compensation for 2009
| Name (1) |
Fees Earned or Paid in Cash ($) (2) |
Total ($) | ||||
| E. Carlton Bowyer, Ph. D. |
$ | 51,750 | $ | 51,750 | ||
| Laurence C. Fentriss |
39,000 | 39,000 | ||||
| Morton Goldmeier |
47,500 | 47,500 | ||||
| Thomas W. Moss, Jr. |
46,250 | 46,250 | ||||
| William D. Payne, M.D. |
44,000 | 44,000 | ||||
| Herbert L. Perlin |
45,500 | 45,500 | ||||
| Richard J. Tavss |
47,250 | 47,250 | ||||
| Raju V. Uppalapati |
45,250 | 45,250 | ||||
| Kenneth J. Young |
40,500 | 40,500 | ||||
| (1) | Director fees paid to Edward J. Woodard, Jr., CLBB, Chairman of the Board, President and Chief Executive Officer are presented under the Salary column in the Summary Compensation Table on page 44. |
| (2) | Includes any fees deferred by the director. |
During 2009, each director of the Company was paid $2,000 for attendance at each Board meeting and $500 for attendance at each meeting of a committee of the Board of which he was a member except for the Executive Committee meetings for which the directors were paid $750 per meeting. Additionally, each director of the Company was paid a quarterly retainer of $3,000. The Company has a Director’s Deferred Compensation Plan, which allows directors to defer recognition of income on all or any portion of the directors’ fees they earn. During 2009, a total of $75.8 thousand was deferred by directors under this plan. The terms and conditions of the plan are very similar to the terms and conditions of the Bank’s Supplemental Executive Retirement Plan described under the “Stock Option and Employee Benefit Plans” section above.
Effective January 1, 2010, the fee for each Board meeting was decreased to $1,000, the committee meeting fees to $250, the Executive Committee fee to $375 and the quarterly retainer was reduced to $1,500.
50
Table of Contents
Item 12. Security Ownership of Certain Beneficial Owners and Management and Related Stockholder Matters
Securities Authorized for Issuance Under Equity Compensation Plans
The following table summarizes information, as of December 31, 2009, relating to the Company’s equity compensation plans, pursuant to which grants of options to acquire shares of common stock and other stock-based awards may be granted from time to time. See Note 18 to Consolidated Financial Statements attached as Exhibit 99.1 of the Form 10-K and Item 11. Executive Compensation (Stock Option and Employee Benefit Plans) of this Form 10-K for more information on the Company’s equity compensation plans.
Equity Compensation Plan Information as of December 31, 2009
| Plan category |
Number of securities to be issued upon exercise of outstanding options, warrants and rights (a) |
Weighted-average exercise price of outstanding options, warrants and rights (b) |
Number of securities remaining available for future issuance under equity compensation plans (excluding securities reflected in column (a)) (c) |
||||||
| Equity compensation plans approved by security holders |
431,262 | (1) | $ | 17.21 | 325,170 | (2) | |||
| Equity compensation plans not approved by security holders |
N/A | N/A | N/A | ||||||
| Total |
431,262 | (1) | $ | 17.21 | 325,170 | (2) | |||
| (1) | Consists entirely of shares of common stock underlying previously granted stock options that have not been exercised. All of these options were granted pursuant to the Company’s equity compensation plans. |
| (2) | Represents shares available for future awards under the Company’s equity compensation plans. |
51
Table of Contents
Security Ownership of Management
The following table sets forth for (1) each director, and named executive officer of the Company, and (2) all directors, and executive officers of the Company as a group: (i) the number of shares of Company common stock beneficially owned on February 15, 2010 and (ii) such person’s or group’s percentage ownership of outstanding shares of Company common stock on such date. All of the Company’s directors and named executive officers receive mail at the Company’s principal executive office at 403 Boush Street, Norfolk, Virginia 23510. Except as noted below, each person has sole voting and sole investment control with respect to the shares listed.
| Name |
Amount and Nature of Beneficial Ownership (1) |
Percent of Class (2) | ||||
| Directors: |
||||||
| E. Carlton Bowyer, Ph.D. |
21,231 | (3) | * | |||
| Laurence C. Fentriss |
494,800 | (4) | 7.17 | % | ||
| Morton Goldmeier |
161,715 | (5) | 2.34 | % | ||
| Thomas W. Moss, Jr. |
21,438 | (6) | * | |||
| William D. Payne, M.D. |
56,179 | (7) | * | |||
| Herbert L. Perlin |
78,920 | (8) | 1.14 | % | ||
| Richard J. Tavss |
319,416 | (9) | 4.63 | % | ||
| Raju V. Uppalapati |
9,862 | (10) | * | |||
| Edward J. Woodard, Jr., CLBB |
208,292 | (11) | 3.00 | % | ||
| Kenneth J. Young |
100,405 | (12) | 1.45 | % | ||
| Non-Director Executive Officers: |
||||||
| Cynthia A. Sabol, CPA |
48,250 | (13) | * | |||
| Simon Hounslow |
61,500 | (14) | * | |||
| Stephen G. Fields |
39,018 | (15) | * | |||
| All Directors and Executive Officers as a group (13 persons) |
1,621,026 | 22.45 | % | |||
| * | Percentage of ownership is less than 1.0% of the outstanding shares of common stock of the Company. |
| (1) | Beneficial ownership as reported in the above table has been determined in accordance with Rule 13d-3 under the Exchange Act and includes shares, where applicable, which an individual has the right to acquire within 60 days through the exercise of stock options. The above table includes 332,004 shares which can be acquired through the exercise of stock options. |
| (2) | Based on 6,888,451 issued and outstanding shares of common stock as of February 15, 2010. |
| (3) | Includes (i) 16,620 shares which Dr. Bowyer has the right to acquire through the exercise of stock options, and (ii) 555 shares registered in the name of Dr. Bowyer’s wife, for which Dr. Bowyer disclaims beneficial ownership. |
| (4) | Includes (i) 16,620 shares which Mr. Fentriss has the right to acquire through the exercise of stock options, (ii) 130,262 shares held in an IRA for the benefit of Laurence C. Fentriss, (iii) 47,488 shares held in the Bank of the Commonwealth Deferred Directors Compensation Plan for the benefit of Laurence C. Fentriss, and (iv) 155,695 shares registered in the name of Community Bank Investors of America, LP of which Mr. Fentriss is Managing Partner. |
| (5) | Includes (i) 16,620 shares which Mr. Goldmeier has the right to acquire through the exercise of stock options, and (ii) 19,324 shares owned by Mr. Goldmeier’s wife, for which Mr. Goldmeier disclaims beneficial ownership. |
52
Table of Contents
| (6) | Includes (i) 16,620 shares which Mr. Moss has the right to acquire through the exercise of stock options, and (ii) 4,134 shares owned jointly by Mr. Moss and his wife. |
| (7) | Includes (i) 16,620 shares which Dr. Payne has the right to acquire through the exercise of stock options, (ii) 1,969 shares registered in the name of Dr. Payne’s wife, for which Dr. Payne disclaims beneficial ownership, and (iii) 10,737 shares held in an IRA for the benefit of William D. Payne. |
| (8) | Includes (i) 16,620 shares which Mr. Perlin has the right to acquire through the exercise of stock options, (ii) 25,665 shares registered in the name of Herbert L. Perlin, Profit Sharing Trust, of which Mr. Perlin is Acting Trustee, (iii) 2,984 shares owned jointly by Mr. Perlin and his wife, (iv) 26,236 shares registered as the Perlin Revocable Living Trust, and (v) 22,951 shares pledged as collateral for a loan. |
| (9) | Includes (i) 16,620 shares which Mr. Tavss has the right to acquire through the exercise of stock options, (ii) 1,724 shares registered in the name of Richard J. Tavss, custodian for Bobbie J. Tavss, (iii) 1,025 shares registered in the name of Richard J. Tavss, custodian for Sanders T. Schoolar V, (iv) 895 shares registered in the name of Richard J. Tavss, custodian for Zachary I. Maiden, (v) 918 shares registered in the name of Richard J. Tavss, custodian for Taylor Tavss Scholar, (vi) 267 shares registered in the name of Richard J. Tavss, custodian for Richard T. Maiden, (vii) 267 shares registered in the name of Richard J. Tavss, custodian for Samantha R. Maiden, (viii) 48,276 shares registered in the name of Fletcher, Maiden & Reed PC 401(k) Plan for the benefit of Richard J. Tavss, (ix) 69,373 shares held in the Bank of the Commonwealth Deferred Directors Compensation Plan for the benefit of Richard J. Tavss, and (x) 1,871 shares registered in the name of Mr. Tavss’ wife, for which Mr. Tavss disclaims beneficial ownership. |
| (10) | Includes 1,000 shares which Mr. Uppalapati has the right to acquire through the exercise of stock options. |
| (11) | Includes (i) 66,829 shares which Mr. Woodard has the right to acquire through the exercise of stock options, (ii) 2,796 shares held in an IRA for the benefit of Edward J. Woodard, Jr., (iii) 128,495 shares held in the Bank of the Commonwealth Deferred Directors Compensation Plan for the benefit of Edward J. Woodard, Jr., (iv) 10,170 shares held in the Company’s 401(k) Profit Sharing Plan, and (v) 1 share registered in the name of Edward J. Woodard, Jr., custodian for T. Brandon Woodard. |
| (12) | Includes (i) 16,620 shares which Mr. Young has the right to acquire through the exercise of stock options, (ii) 6,353 shares representing the proceeds of a self directed IRA for the benefit of Kenneth J. Young, (iii) 8,202 shares owned jointly with Michael J. Young (son), (iv) 8,202 shares owned jointly with Benjamin C. Young (son), (v) 8,202 shares owned jointly with Jennifer M. Young (daughter), and (vi) 32,207 shares held in the Bank of the Commonwealth Deferred Directors Compensation Plan for the benefit of Kenneth J. Young. |
| (13) | Includes (i) 46,380 shares which Ms. Sabol has the right to acquire through the exercise of stock options, and (ii) 1,863 shares held in the Company’s 401(k) Profit Sharing Plan. |
| (14) | Includes 46,985 shares which Mr. Hounslow has the right to acquire through the exercise of stock options. |
| (15) | Includes (i) 37,850 shares which Mr. Fields has the right to acquire through the exercise of stock options, (ii) 16 shares registered in the name of Madison S. Fields (daughter), (iii) 16 shares registered in the name of Mr. Field’s wife, for which Mr. Fields disclaims beneficial ownership, and (iv) 1,123 shares held in the Company’s 401(k) Profit Sharing Plan. |
53
Table of Contents
Security Ownership of Certain Beneficial Owners
The following table sets forth certain information with respect to beneficial ownership of the Company’s common stock as of February 15, 2010 by each beneficial owner of more than 5.0% of the Company’s common stock based on currently available Schedules 13D and 13G filed with the SEC and the Company’s stock transfer records.
| Name and Address of Beneficial Owner |
Amount and Nature of Beneficial Ownership (1) |
Percent of Class (2) | ||||
| Wasatch Advisors, Inc. 150 Social Hall Ave. Salt Lake City, UT 84111 |
471,037 | 6.84 | % | |||
| Financial Stocks Capital Partners III L.P. 507 Carew Tower 441 Vine Street Cincinnati, Ohio 45202 |
461,718 | 6.70 | % | |||
| Laurence C. Fentriss 700 S. Harbor Island Blvd. Suite 232 Tampa, Florida 33602 |
494,800 | (3) | 7.17 | % | ||
| (1) | Beneficial ownership as reported in the above table has been determined in accordance with Rule 13d-3 under the Exchange Act and includes shares, where applicable, which an individual has the right to acquire within 60 days through the exercise of stock options. |
| (2) | Based on 6,888,451 issued and outstanding shares of common stock as of February 15, 2010. |
| (3) | See footnote 4 to the “Security Ownership of Management” table. |
Item 13. Certain Relationships and Related Transactions, and Director Independence
Loans to Officers and Directors
Certain directors and officers of the Parent and the Bank, members of their immediate families, and corporations, partnerships and other entities with which such persons are associated, are customers of the Bank. As such, some of these persons engaged in transactions with the Bank in the ordinary course of business during 2009, and will have additional transactions with the Bank in the future. All loans extended and commitments to lend by the Bank to such persons were made in the ordinary course of business upon substantially the same terms, including interest rates and collateral, as those prevailing at the time for comparable transactions with persons not related to the Bank and do not involve more than the normal risk of collectability or present other unfavorable features. As of December 31, 2009, the amount of loans from the Bank to all officers and directors of the Company and the Bank, and entities or persons with which they are associated, was approximately $37.1 million.
Business Relationships and Transactions with Management
In the ordinary course of business, the Company and the Bank engage in certain transactions with their officers and directors in which such officers and directors have a significant interest. All such transactions have been made on substantially the same terms as those prevailing at the time for comparable transactions with unaffiliated parties.
In 1984, the Bank entered into a lease with Boush Bank Building Associates, a Virginia limited partnership (the “Partnership”), to rent the headquarters building (the “Headquarters”) of the Company and the Bank, which is located at the corners of Freemason and Boush Streets, Norfolk, Virginia. The general partner of the Partnership is Boush Bank Building Corporation. The limited partners of the Partnership are Edward J. Woodard, Jr., CLBB, Chairman, President, CEO and director of the Company and the Bank, and the estates of George H. Burton and William P. Kellam, former directors. The lease requires the Bank to pay all taxes, maintenance and insurance. The original term of the lease was 23 years and 11 months, and began on December 19, 1984. Under the same terms and conditions of the original lease, the Bank has the option to extend the term for five additional periods of 5 years each. The Bank is currently under the first renewal option. In connection with this property, the lessor has secured financing in the form of a $1.6 million industrial development revenue bond from the Norfolk Redevelopment and Housing Authority payable in annual installments, commencing on January 1, 1987, at amounts equal to 3.0% of the then outstanding principal balance through the 25th year, when the unpaid balance will become due. In June 2009, this obligation was paid in full. Interest on this bond was payable monthly, at 68.6% of the prime rate of SunTrust Bank in Richmond, Virginia. Monthly rent paid by the Bank was previously equal to interest on the above bond, plus any interest associated with secondary financing provided the lessor by the Bank. Monthly rent paid by the Bank is currently equal to the interest associated with the secondary financing provided the lessor by the Bank. Aggregate rent payments for 2009 were $46.7 thousand. Beginning in 2011, the monthly rent paid by the Bank will equal the principal and interest payments associated with the secondary financing provided the lessor by the Bank. The Bank has the right to purchase, at its option, an undivided interest in the property at undepreciated original cost, and has been obligated to purchase in each January after December 31, 1986, an undivided interest in an amount equal to 90.0% of the legal amount allowed by banking regulations for investments in fixed properties, unless the Bank’s return on average assets is less than seven-tenths of one percent. Under this provision, the Bank has purchased 54.4% of this property for a total of $999.6 thousand. No purchases have been made after 1988. In the opinion of management of the
54
Table of Contents
Company, the terms of the lease are no less favorable than could be obtained from a non-related party in an arms-length transaction. Prior to executing the lease and before the holding company reorganization, the shareholders of the Bank owning a majority of Bank common stock consented to the foregoing lease.
In 1998, the Bank entered into a lease with respect to its branch at 1217 Cedar Road, Chesapeake, Virginia with Morton Realty Associates, a Virginia general partnership, and Richard J. Tavss and several other parties who share ownership and responsibility as landlord under the lease. Morton Goldmeier is a partner in Morton Realty Associates, one of the landlords under the lease, and is also a member of the Board of Directors of the Bank and the Company. Richard J. Tavss, also one of the landlords under the lease, is also a member of the Board of Directors of the Bank and the Company. Annual lease payments under the lease currently are $118.0 thousand. The original lease term ends July 31, 2010. The Board of Directors of the Company received two independent appraisals with respect to this property prior to entering into this lease. The Board and management believe the terms of this lease are no less favorable than could be obtained from a non-related party in an arms-length transaction.
In 2006, the Bank entered into a lease with respect to its branch at 8468 Caratoke Highway, Powells Point, North Carolina with RAVA Developments, LLC, a North Carolina limited liability company. RAVA Group, LLC, a North Carolina limited liability company, is the managing member of RAVA Developments, LLC. Raju V. Uppalapati is the Chairman and CEO of RAVA Group, LLC and is also a member of the Board of Directors of the Bank and the Parent. In 2007, the property was sold to Powells Point, LLC, a North Carolina limited liability company and the related lease was assigned. T. Brandon Woodard, JD, AMB is the sole member in Powells Point, LLC and is the son of Edward J. Woodard, Jr., CLBB, who is the Chairman, President, CEO and a director of the Bank and the Company. Annual lease payments under the lease currently are $108.0 thousand. The lease has an initial term of 15 years and runs through June 30, 2022. The Board and management believe the terms of this lease are no less favorable than could be obtained from a non-related party in an arms-length transaction.
In January 2007, the Bank entered into a lease with respect to its branch at 26006 NC Highway 12, St. Waves Plaza Unit 1, Waves, North Carolina with Noraj & Associates, Inc., a North Carolina corporation. Raju V. Uppalapati is the owner of Noraj & Associates, Inc. and is also a member of the Board of Directors of the Bank and the Parent. Annual lease payments under the lease currently are $48.9 thousand. The lease has an initial term of 10 years and runs through April 30, 2017. The Board and management believe the terms of this lease are no less favorable than could be obtained from a non-related party in an arms-length transaction.
In February 2007, the Bank entered into a lease with respect to its branch at 562 Caratoke Highway, Moyock, North Carolina with R&E Capital Investments, LLC, a North Carolina corporation. Raju V. Uppalapati is the managing member of R&E Capital Investments, LLC and is also a member of the Board of Directors of the Bank and the Parent. In late 2007, the property was sold to Moyock One, LLC, a North Carolina limited liability company and the related lease was assigned. T. Brandon Woodard, JD, AMB is a member with a 50% ownership in Moyock One, LLC and is the son of Edward J. Woodard, Jr., CLBB, who is the Chairman, President, CEO and a director of the Bank and the Company. RAVA Properties, LLC, a North Carolina limited liability company, is a member with a 50% ownership in Moyock One, LLC. Raju V. Uppalapati is the sole member of RAVA Properties, LLC. Annual lease payments under the lease currently are $47.8 thousand. The lease has an initial term of 10 years and runs through May 31, 2017. The Board and management believe the terms of this lease are no less favorable than could be obtained from a non-related party in an arms-length transaction.
In 2007, the Bank entered into a lease with respect to its North Carolina branch headquarters, which anticipates it will house offices for each of the Company’s subsidiaries, Bank of the Commonwealth Mortgage, Executive Title Center and Commonwealth Financial Advisors, LLC, at 3732 North Croatan Highway, Kitty Hawk, North Carolina with R&E Capital Investments, LLC, a North Carolina corporation. Raju V. Uppalapati is the managing member of R&E Capital Investments, LLC and is also a member of the Board of Directors of the Bank and the Parent. In 2008, the property was sold to Commonwealth Property Associates, LLC, a Virginia limited liability company and the related lease was assigned. Membership in Commonwealth Property Associates, LLC is comprised as follows: Bank of the Commonwealth (61.0%); RAVA Properties, LLC (20.0%), of which Raju V. Uppalapati is the sole member; Bobbie Joe Schooler (4.0%) and Besianne Tavss Maiden (4.0%), daughters of Richard J. Tavss, who is a member of the Board of Directors of the Bank and the Company; T. Brandon Woodard, JD, AMB (1.0%), son of Edward J. Woodard, Jr., CLBB, who is the Chairman, President, CEO and a director of the Bank and the Company; Jennifer Young (2.67%), Michael Young (2.67%) and Benjamin Young (2.66%), children of Kenneth J. Young, who is a member of the Board of Directors of the Bank and the Company; Madison S. Fields (0.50%) and Reagan S. Fields (0.50%), daughters of Stephen G. Fields, who is an Executive Vice President and Commercial Loan Officer of the Bank; and Simon Hounslow (1.00%), who is the Executive Vice President and Chief Lending Officer of the Bank. Annual lease payments under the lease currently are $223.3 thousand. The lease has an initial term of 15 years and runs through May 31, 2023. The Board and management believe the terms of this lease are no less favorable than could be obtained from a non-related party in an arms-length transaction. Commonwealth Property Associates, LLC entered into a sublease with BD&A Realty & Construction, Inc. to sublease approximately 2,700 square feet of the building. Raju V. Uppalapati is a partner in BD&A Realty & Construction, Inc. Annual rental income under the sublease currently is $48.6 thousand. The sublease has an initial term of three years and runs through May 31, 2011. Under the terms of the sublease, the tenant will have the option to extend the term for two additional periods of five years each. The Board and management believe the terms of this sublease are no less favorable than could be obtained from a non-related party in an arms-length transaction.
In 2007, the Bank signed a letter of intent and proposal to lease its branch at 221 Western Avenue, Suffolk, Virginia with Glenn Development, Inc., a Virginia corporation. In January 2008, Glenn Development, Inc. assigned the right to purchase and lease the property to Suffolk One, LLC, a Virginia limited liability company. T. Brandon Woodard, JD, AMB is the sole member in Suffolk One, LLC and is the son of Edward J. Woodard, Jr., CLBB, who is the Chairman, President, CEO and a director of the Bank and the Parent. Annual lease payments under the lease currently are $45.7 thousand. The lease has an initial term of 10 years and runs through March 31, 2018. The Board and management believe the terms of this lease are no less favorable than could be obtained from a non-related party in an arms-length transaction.
The Bank has also retained the Norfolk, Virginia law firm of Tavss Fletcher, of which Richard J. Tavss, a director of the Parent and the Bank, is senior counsel and one of seven partners in the firm, to perform certain legal services for the Company and the Bank. Since January 1, 2009, the Company has paid $526.8 thousand to Tavss Fletcher.
The Company does not have a formal written policy regarding the review of potential conflicts of interest between the Company and the Company’s directors, executive officers and their associates. However, the Board of Directors of the Parent is responsible for reviewing and approving, ratifying or disapproving any non-banking transactions with the Company in which directors, executive officers or their associates may participate.
55
Table of Contents
Director Independence
The Board has considered the relationships discussed above under “Business Relationships and Transactions with Management” and has determined that all non-employee directors, except for Richard J. Tavss, which comprise the majority of the Company’s Board, satisfy the independence requirements defined under Rule 5605(a)(2) of the Listing Rules of the Nasdaq Stock Market, Inc. and the Board determined that the relationships discussed above did not interfere with any director’s ability to exercise independent judgment as a director of the Parent. All members of the Nominating, Audit and Personnel/Compensation Committee are “independent directors,” as defined by Rule 5605(a)(2) of the Listing Rules of NASDAQ.
Item 14. Principal Accountant Fees and Services
The following table presents the fees billed for professional audit services rendered by Witt Mares, PLC for the audit of the Company’s annual financial statements for the years ended December 31, 2009 and 2008, and fees billed for other services rendered by Witt Mares, PLC during those periods. All such audit and non-audit services were pre-approved by the Audit Committee, which concluded that the provision of such services by Witt Mares, PLC was compatible with the maintenance of that firm’s independence in the conduct of their auditing functions.
| Year Ended December 31, | ||||||
| 2009 | 2008 | |||||
| Audit fees (1) |
$ | 118,350 | $ | 108,825 | ||
| Audit-related fees (2) |
2,549 | 3,815 | ||||
| Tax fees (3) |
18,265 | 10,000 | ||||
| $ | 139,164 | $ | 122,640 | |||
| (1) | Audit fees consist of audit and review services, attestation report on internal controls under SEC rules, consents and review of documents filed with the SEC. |
| (2) | Audit-related fees consist of consent opinions issued for filings of Forms S-3 and S-8. |
| (3) | Tax fees consist of preparation of federal and state tax returns and advise regarding tax compliance issues. |
Audit Committee Pre-Approval Policy
Pursuant to the terms of the Company’s Audit Committee Charter, the Audit Committee is responsible for the appointment, compensation and oversight of the work performed by the Company’s independent accountants. The Audit Committee must pre-approve all audit (including audit-related) and non-audit services performed by the independent accountants in order to assure that the provisions of such services do not impair the accountants’ independence. The Audit Committee may form and delegate authority to subcommittees consisting of one or more members when appropriate, including the authority to grant pre-approvals of audit and permitted non-audit services, provided that decisions of the subcommittee to grant pre-approval shall be presented to the full Audit Committee at its next scheduled meeting.
During 2009, the Audit Committee pre-approved 100% of non-audit services provided by Witt Mares, PLC. The Audit Committee has considered the provisions of these non-audit services by Witt Mares, PLC and has determined that the services are compatible with maintaining Witt Mares, PLC’s independence.
Part IV
Item 15. Exhibits, Financial Statement Schedules
(a) (1) The response to this portion of Item 15 is included in Item 8 above.
(a) (2) The response to this portion of Item 15 is included in Item 8 above.
(a) (3) Exhibits
The following exhibits are filed as part of this Form 10-K and this list includes the Exhibit Index.
| 3.1 |
Articles of Incorporation. Filed June 15, 1988, as Exhibit 3.1 to the Registrant’s Form S-4, and incorporated herein by reference. | |
| 3.2 |
Bylaws. Filed June 15, 1988, as Exhibit 3.2 to the Registrant’s Form S-4, and incorporated herein by reference. | |
| 3.3 |
Amendment to Articles of Incorporation dated July 28, 1989. Filed March 20, 1990, as Exhibit 3.3 to the Registrant’s Form 10-K, and incorporated herein by reference. | |
| 3.4 |
Amendment to Articles of Incorporation dated November, 2000. Filed November 20, 2000 as Exhibit 3.4 with the Company’s Form S-1, and incorporated herein by reference. | |
| 3.5 |
Amendment to Articles of Incorporation dated September 21, 2005. Filed March 30, 2006, as Exhibit 3.5 to the Registrant’s Form 10-K, and incorporated herein by reference. | |
56
Table of Contents
| 3.6 |
Amendment to Articles of Incorporation effective June 30, 2006. Filed March 15, 2007, as Exhibit 3.6 to the Registrant’s Form 10-K, and incorporated herein by reference. | |
| 3.7 |
Amendment to Articles of Incorporation effective December 29, 2006. Filed March 15, 2007, as Exhibit 3.7 to the Registrant’s Form 10-K, and incorporated herein by reference. | |
| Certain instruments relating to trust preferred securities not being registered have been omitted in accordance with Item 601(b)(4)(iii) of Regulation S-K. The registrant will furnish a copy of any such instrument to the SEC upon its request. | ||
| 10.1 |
Lease. Filed June 15, 1988, as Exhibit 10.1 to the Registrant’s Form S-4, and incorporated herein by reference. | |
| 10.5 |
Bank of the Commonwealth Directors’ Deferred Compensation Plan. Filed February 1, 2002, as Exhibit 4.1 to the Registrant’s Form S-8, and incorporated herein by reference. # | |
| 10.6 |
Bank of the Commonwealth Supplemental Executive Retirement Plan. Filed February 1, 2002, as Exhibit 4.2 to the Registrant’s Form S-8, and incorporated herein by reference. # | |
| 10.7 |
Deferred Supplemental Compensation Agreement with Edward J. Woodard, Jr. Filed March 21, 1989, as Exhibit 10.7 to the Registrant’s Form 10-K, and incorporated herein by reference. # | |
| 10.8 |
Summary of Management Incentive Cash Bonus Program. Filed March 16, 2009, as Exhibit 10.8 to the Registrant’s Form 10-K, and incorporated herein by reference. # | |
| 10.9 |
1999 Stock Incentive Plan. Filed August 6, 1999, as Exhibit 4.1 to the Registrant’s Form S-8, and incorporated herein by reference. # | |
| 10.10 |
Amendment to Deferred Supplemental Compensation Agreement with Edward J. Woodard, Jr. Filed March 30, 1994, as Exhibit 10.10 to Registrant’s Form 10-K, and incorporated herein by reference. # | |
| 10.11 |
2005 Stock Incentive Plan. Filed September 21, 2005, as Exhibit 99.0 to the Registrant’s Form S-8, and incorporated herein by reference. # | |
| 10.12 |
Form of Incentive Stock Option Agreement under 2005 Stock Incentive Plan. Filed March 16, 2009, as Exhibit 10.12 to the Registrant’s Form 10-K, and incorporated herein by reference. # | |
| 10.13 |
Form of Nonstatutory Stock Option Agreement under 2005 Stock Incentive Plan. Filed March 16, 2009, as Exhibit 10.13 to the Registrant’s Form 10-K, and incorporated herein by reference. # | |
| 10.14 |
Second amendment to deferred supplemental agreement dated December 27, 1978, with Edward J. Woodard, Jr. Filed April 2, 2001 as Exhibit 10.14 to the Registrant’s Form 10-KSB, and incorporated herein by reference. # | |
| 10.20 |
Amended Employment Agreement dated December 31, 2008 with Simon Hounslow. Filed March 16, 2009, as Exhibit 10.20 to the Registrant’s Form 10-K, and incorporated herein by reference. # | |
| 10.21 |
Amended Employment Agreement dated December 31, 2008 with Stephen G. Fields. Filed March 16, 2009, as Exhibit 10.21 to the Registrant’s Form 10-K, and incorporated herein by reference. # | |
| 10.22 |
Third Amended and Restated Deferred Supplemental Compensation Agreement with Edward J. Woodard, Jr. dated July 20, 2004. Filed March 30, 2005 as Exhibit 10.22 to the Registrant’s Form 10-KSB, and incorporated herein by reference. # | |
| 10.23 |
Third Amended and Restated Deferred Supplemental Compensation Agreement with Simon Hounslow dated April 11, 2008. Filed April 14, 2008 as Exhibit 99.2 to the Registrant’s Form 8-K, and incorporated herein by reference. # | |
| 10.24 |
Amended and Restated Deferred Supplemental Compensation Agreement with Cynthia A. Sabol dated April 11, 2008. Filed April 14, 2008 as Exhibit 99.1 to the Registrant’s Form 8-K and incorporated herein by reference. # | |
| 10.25 |
Amended and Restated Deferred Supplemental Compensation Agreement with Stephen G. Fields dated April 11, 2008. Filed April 14, 2008 as Exhibit 99.3 to the Registrant’s Form 8-K, and incorporated herein by reference. # | |
| 10.26 |
Amended Employment Agreement dated December 31, 2008 with Edward J. Woodard, Jr. Filed March 16, 2009, as Exhibit 10.26 to the Registrant’s Form 10-K, and incorporated herein by reference. # | |
| 10.27 |
Amended Employment Agreement dated December 31, 2008 with Cynthia A. Sabol. Filed March 16, 2009, as Exhibit 10.27 to the Registrant’s Form 10-K, and incorporated herein by reference. # | |
| 21.1 |
Subsidiaries of Registrant. * | |
57
Table of Contents
| 23.1 |
Consent of Witt Mares, PLC. * | |
| 24.1 |
Power of Attorney, included on the signature page herein. | |
| 31.1 |
Certification of Chief Executive Officer pursuant to Rule 13a-14(a). * | |
| 31.2 |
Certification of Principal Financial Officer pursuant to Rule 13a-14(a). * | |
| 32.1 |
Certification of CEO and CFO pursuant to 18 U.S.C. Section 1350.* | |
| 99.1 |
Consolidated Financial Statements. * | |
| * | Filed herewith. |
| # | Management contract or compensatory plan. |
58
Table of Contents
Pursuant to the requirements of Section 13 or 15(d) of the Securities Exchange Act, the Registrant has duly caused this report to be signed on its behalf by the undersigned, thereunto duly authorized.
| Commonwealth Bankshares, Inc. | ||||
| (Registrant) | ||||
| Date: March 31, 2010 | by: | /s/ Edward J. Woodard, Jr., CLBB | ||
| Edward J. Woodard, Jr., CLBB | ||||
| Chairman, President and Chief Executive Officer | ||||
| (Principal Executive Officer) | ||||
59
Table of Contents
Power of Attorney
KNOW ALL MEN BY THESE PRESENTS, that each person whose signature below constitutes and appoints Edward J. Woodard, Jr., CLBB and Cynthia A. Sabol, CPA and each of them individually, as his true and lawful attorney-in-fact and agent, with full power of substitution and resubstitution, for him and in his name, place and stead, in any and all capacities, to sign any and all amendments to this report, and to file the same, with all exhibits thereto, and other documents in connection therewith, with the Securities and Exchange Commission, granting unto said attorney-in-fact and agent full power and authority to do and perform each and every act and thing requisite and necessary to be done in connection therewith, as fully to all intents and purposes as he might or could do in person, hereby ratifying and confirming all that said attorney-in-fact and agent or his substitute or substitutes, may lawfully do or cause to be done by virtue hereof.
Pursuant to the requirements of the Securities Exchange Act of 1934, this report has been signed below by the following persons on behalf of the registrant and in the capacities and on the dates indicated.
| /s/ Edward J. Woodard, Jr., CLBB |
Date: March 31, 2010 | |
| Edward J. Woodard, Jr., CLBB | ||
| Chairman, President and Chief Executive Officer | ||
| (Principal Executive Officer) | ||
| /s/ Cynthia A. Sabol, CPA |
Date: March 31, 2010 | |
| Cynthia A. Sabol, CPA | ||
| Executive Vice President and Chief Financial Officer | ||
| (Principal Financial and Accounting Officer) | ||
| /s/ E. Carlton Bowyer, Ph.D. |
Date: March 31, 2010 | |
| E. Carlton Bowyer, Ph.D. | ||
| Director | ||
| /s/ Laurence C. Fentriss |
Date: March 31, 2010 | |
| Laurence C. Fentriss | ||
| Director | ||
| /s/ Morton Goldmeier |
Date: March 31, 2010 | |
| Morton Goldmeier | ||
| Director | ||
| /s/ Thomas W. Moss, Jr. |
Date: March 31, 2010 | |
| Thomas W. Moss, Jr. | ||
| Director | ||
| /s/ William D. Payne, M.D. |
Date: March 31, 2010 | |
| William D. Payne, M.D. | ||
| Director | ||
| /s/ Herbert L. Perlin |
Date: March 31, 2010 | |
| Herbert L. Perlin | ||
| Director | ||
| /s/ Richard J. Tavss |
Date: March 31, 2010 | |
| Richard J. Tavss | ||
| Director | ||
| /s/ Raju V. Uppalapati |
Date: March 31, 2010 | |
| Raju V. Uppalapati Director |
||
| /s/ Kenneth J. Young |
Date: March 31, 2010 | |
| Kenneth J. Young | ||
| Director | ||
60