Attached files
Exhibit 13
Uwharrie Capital Corp
2009
ANNUAL REPORT TO SHAREHOLDERS
30
[This page left blank intentionally]
31
UWHARRIE CAPITAL CORP AND SUBSIDIARIES
Description of Business
Uwharrie Capital Corp (the “Company”) is a North Carolina bank holding company. The Company was organized on July 1, 1993 to become the bank holding company for the Bank of Stanly (“Stanly”), a North Carolina commercial bank chartered on September 28, 1983, and its three wholly-owned subsidiaries, The Strategic Alliance Corporation, BOS Agency, Inc., and Gateway Mortgage, Inc., a mortgage origination company. The Company also owns two non-bank subsidiaries, Strategic Investment Advisors, Inc., and Uwharrie Mortgage, Inc.
Stanly engages in retail and commercial banking, with six banking offices in Stanly County. Stanly provides a wide range of banking services including deposit accounts, commercial, consumer, home equity and residential mortgage loans, safe deposit boxes, and electronic banking services.
On January 19, 2000, the Company completed its acquisition of Anson BanCorp, Inc. and its subsidiary, Anson Savings Bank. The savings bank retained its North Carolina savings bank charter and became a wholly-owned subsidiary of Uwharrie Capital Corp as Anson Bank & Trust Co. (“Anson”) and provides financial services to customers through one banking office in Anson County.
On April 10, 2003, the Company capitalized a new wholly-owned subsidiary bank, Cabarrus Bank & Trust Company (“Cabarrus”), located in Concord, North Carolina. As of that date, Cabarrus purchased two branch offices located in Cabarrus County from Stanly to begin its operation. Cabarrus operates as a commercial bank and provides a full range of banking services.
The Company and its subsidiaries are located in Stanly County, Anson County and Cabarrus County. However, the Company intends to prudently expand its service area to include the entire Uwharrie Lakes Region of North Carolina.
Depository services offered by the subsidiary banks include personal and commercial checking, savings, money market, certificates of deposit accounts and individual retirement accounts, all tailored to meet customers’ needs. The banks provide fixed and variable rate loans, which include mortgage, home equity, lines of credit, consumer and commercial loans. The banks also offer internet banking and 24-hour telephone banking, providing customers the convenience of access to account information, rate information and accessibility of funds transfers between accounts. Other services include MasterCard® credit cards and a Visa® check card which functions as a point-of-sale (POS) and automated teller machine (ATM) card. Customers can use the check card for purchases at virtually any merchant accepting Visa® and ATMs displaying the STAR® or CIRRUS® networks regionally and worldwide, respectively.
Strategic Investment Advisors Inc. provides portfolio management services to its customers. The Strategic Alliance Corporation (Strategic Alliance®) is a registered broker-dealer with the Financial Industry Regulatory Authority (FINRA). BOS Agency provides insurance products and is licensed in the state of North Carolina. Through Strategic Investment Group, a DBA for a partnership with UVEST Financial Services, Inc., securities and insurance products are offered including fixed annuities, long-term care, and life insurance products. Group insurance products are offered through an arrangement with Burchfield Insurance Group, Inc. and the Novus Group, Inc. as well as Medicare supplement products.
The Strategic Alliance Corporation. Member FINRA/SIPC.
Securities and insurance products are offered by, and Financial Consultants are registered with UVEST Financial Services, member FINRA/SIPC. UVEST, Strategic Investment Group and Uwharrie Capital Corp affiliates are independent entities. Securities and/or insurance products are not FDIC insured, are not deposits or other obligations of any depository institution, are not guaranteed by any depository institution and are subject to investment risks, including possible loss of the principal amount invested.
Bank of Stanly, Member FDIC, Equal Housing Lender.
Anson Bank & Trust Co., Member FDIC, Equal Housing Lender.
Cabarrus Bank & Trust Company, Member FDIC, Equal Housing Lender.
32
UWHARRIE CAPITAL CORP AND SUBSIDIARIES
Financial Highlights
| (Dollars in thousands except per share amounts) | 2009 | 2008 | Percent Increase (Decrease) |
||||||||
| For the year: |
|||||||||||
| Net income |
$ | 690 | $ | 2,029 | (65.99 | )% | |||||
| Net income available to common shareholders |
$ | 48 | $ | 2,016 | (97.62 | )% | |||||
| Basic net income per common share (1) |
$ | 0.01 | $ | 0.27 | (94.81 | )% | |||||
| Diluted net income per common share (1) |
$ | 0.01 | $ | 0.27 | (96.30 | )% | |||||
| Weighted average common shares outstanding (diluted) |
7,474,140 | 7,520,484 | (0.62 | )% | |||||||
| At year-end: |
|||||||||||
| Total assets |
$ | 477,846 | $ | 452,468 | 5.61 | % | |||||
| Total earning assets |
436,012 | 422,709 | 3.15 | % | |||||||
| Loans held for investment |
353,729 | 340,830 | 3.78 | % | |||||||
| Total interest-bearing liabilities |
385,433 | 362,346 | 6.37 | % | |||||||
| Shareholders’ equity |
44,024 | 41,233 | 6.77 | % | |||||||
| Book value per common share (1) |
$ | 4.47 | $ | 4.11 | 8.76 | % | |||||
| Averages for the year: |
|||||||||||
| Total assets |
$ | 471,729 | $ | 422,857 | 11.56 | % | |||||
| Total earning assets |
434,218 | 393,769 | 10.27 | % | |||||||
| Loans held for investment |
346,976 | 335,791 | 3.33 | % | |||||||
| Total interest-bearing liabilities |
378,411 | 342,341 | 10.54 | % | |||||||
| Shareholders’ equity |
43,182 | 32,245 | 33.92 | % | |||||||
| Financial ratios (in percentage): |
|||||||||||
| Return on average assets |
0.15 | % | 0.48 | % | |||||||
| Return on average shareholders’ equity |
1.60 | % | 6.29 | % | |||||||
| Average equity to average assets |
9.15 | % | 7.63 | % | |||||||
| Net interest margin (fully tax equivalent basis) |
4.12 | % | 4.13 | % | |||||||
| Allowance as % of loans at year-end |
1.49 | % | 1.28 | % | |||||||
| Allowance as % of nonperforming loans |
93.71 | % | 111.87 | % | |||||||
| Nonperforming loans to total loans |
1.59 | % | 1.14 | % | |||||||
| Nonperforming assets to total assets |
1.89 | % | 1.48 | % | |||||||
| Net loan charge-offs (recoveries) to average loans |
0.24 | % | 0.04 | % | |||||||
| (1) | Net income per share, book value per share, and shares outstanding at year-end have been adjusted to reflect the 3% stock dividends in 2008. |
Market for the Company’s Common Stock and Related Security Holder Matters
It is the philosophy of Uwharrie Capital Corp to promote a strong base of local shareholders. While bid and asked prices for the Company’s common stock are quoted on the Over the Counter Bulletin Board under the symbol UWHR, trading is sporadic with trades also taking place in privately negotiated transactions. Management makes every reasonable effort to match willing buyers with willing sellers as they become known for the purpose of private negotiations for the purchase and sale of the Company’s common stock.
The Board of Directors adopts a dividend policy on an annual basis. For 2009, Uwharrie Capital Corp did not declare a dividend. The Board of Directors will determine an appropriate dividend, if any, on an annual basis, consistent with the capital needs of the Company.
33
UWHARRIE CAPITAL CORP AND SUBSIDIARIES
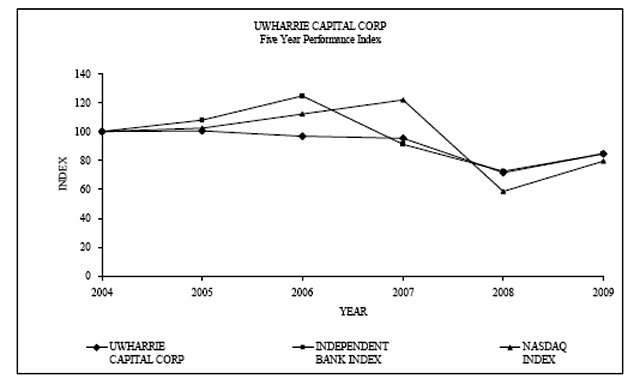
The following graph compares (i) the yearly change in the cumulative total shareholder return on the Company’s common stock with (ii) the cumulative return of The Carson Medlin Company Independent Bank Index, and (iii) the Nasdaq Composite. The graph assumes that the value of an investment in the Company’s common stock and in each index was $100 on December 31, 2004, and that all dividends were reinvested. The performance shown in the graph represents past performance and should not be considered the indication of future performance.
Shareholders needing information about purchasing or selling shares of Uwharrie Capital Corp should contact Tamara M. Singletary or Lisa E. Hartsell, Investor Relations at Uwharrie Capital Corp, 132 N. First Street, Post Office Box 338, Albemarle, NC 28002.
34
[This page left blank intentionally]
35

REPORT OF INDEPENDENT REGISTERED PUBLIC ACCOUNTING FIRM
To the Shareholders and Board of Directors
Uwharrie Capital Corp
Albemarle, North Carolina
We have audited the accompanying consolidated balance sheets of Uwharrie Capital Corp and Subsidiaries (the “Company”) as of December 31, 2009 and 2008, and the related consolidated statements of income, comprehensive income, changes in shareholders’ equity and cash flows for each of the years in the three-year period ended December 31, 2009. These consolidated financial statements are the responsibility of the Company’s management. Our responsibility is to express an opinion on these consolidated financial statements based on our audits.
We conducted our audits in accordance with the standards of the Public Company Accounting Oversight Board (United States). Those standards require that we plan and perform the audit to obtain reasonable assurance about whether the financial statements are free of material misstatement. We were not engaged to perform an audit of the Company’s internal control over financial reporting. Our audit included consideration of internal control over financial reporting as a basis for designing audit procedures that are appropriate in the circumstances, but not for the purpose of expressing an opinion on the effectiveness of the Company’s internal control over financial reporting. Accordingly, we express no such opinion. An audit also includes examining, on a test basis, evidence supporting the amounts and disclosures in the financial statements, assessing the accounting principles used and significant estimates made by management, as well as evaluating the overall financial statement presentation. We believe that our audits provide a reasonable basis for our opinion.
In our opinion, the consolidated financial statements referred to above present fairly, in all material respects, the financial position of Uwharrie Capital Corp and Subsidiaries as of December 31, 2009 and 2008, and the results of their operations and their cash flows for each of the years in the three-year period ended December 31, 2009, in conformity with accounting principles generally accepted in the United States of America.
As discussed in Note 1 to the consolidated financial statements, effective the quarter ended June 30, 2009 the Company changed its method of accounting for other-than temporary impairment of debt securities as a result of adopting new accounting guidance.

Southern Pines, North Carolina
March 23, 2010
36
UWHARRIE CAPITAL CORP AND SUBSIDIARIES
CONSOLIDATED BALANCE SHEETS
December 31, 2009 and 2008
| 2009 | 2008 | |||||||
| (dollars in thousands) | ||||||||
| ASSETS |
||||||||
| Cash and due from banks |
$ | 7,521 | $ | 2,931 | ||||
| Interest-earning deposits with banks |
3,338 | 10,353 | ||||||
| Securities available for sale, at fair value |
76,317 | 68,835 | ||||||
| Loans held for sale |
2,628 | 2,691 | ||||||
| Loans: |
||||||||
| Loans held for investment |
353,729 | 340,830 | ||||||
| Less allowance for loan losses |
(5,276 | ) | (4,361 | ) | ||||
| Net loans held for investment |
348,453 | 336,469 | ||||||
| Premises and equipment, net |
13,646 | 11,128 | ||||||
| Interest receivable |
2,077 | 2,027 | ||||||
| Federal Home Loan Bank stock |
3,201 | 2,284 | ||||||
| Bank owned life insurance |
5,714 | 5,511 | ||||||
| Goodwill |
987 | 987 | ||||||
| Other real estate owned |
3,419 | 2,816 | ||||||
| Prepaid assets |
2,617 | 696 | ||||||
| Other assets |
7,928 | 5,740 | ||||||
| Total assets |
$ | 477,846 | $ | 452,468 | ||||
| LIABILITIES |
||||||||
| Deposits: |
||||||||
| Demand noninterest-bearing |
$ | 44,924 | $ | 46,032 | ||||
| Interest checking and money market accounts |
137,708 | 117,325 | ||||||
| Savings deposits |
32,120 | 26,360 | ||||||
| Time deposits, $100,000 and over |
64,736 | 63,321 | ||||||
| Other time deposits |
97,286 | 100,589 | ||||||
| Total deposits |
376,774 | 353,627 | ||||||
| Short-term borrowed funds |
26,940 | 22,249 | ||||||
| Long-term debt |
26,643 | 32,502 | ||||||
| Interest payable |
396 | 502 | ||||||
| Other liabilities |
3,069 | 2,355 | ||||||
| Total liabilities |
433,822 | 411,235 | ||||||
| Off balance sheet items, commitments and contingencies (Note 12) |
||||||||
| SHAREHOLDERS’ EQUITY |
||||||||
| Preferred stock, no par value: 10,000,000 shares authorized; |
||||||||
| 10,000 shares of series A issued and outstanding |
10,000 | 10,000 | ||||||
| 500 shares of series B issued and outstanding |
500 | 500 | ||||||
| Discount on preferred stock |
(400 | ) | (500 | ) | ||||
| Common stock, $1.25 par value: 20,000,000 shares authorized; 7,593,929 shares issued and outstanding |
9,492 | 9,492 | ||||||
| Additional paid-in capital plus stock option surplus |
14,030 | 14,019 | ||||||
| Unearned ESOP compensation |
(667 | ) | (736 | ) | ||||
| Undivided profits |
10,056 | 10,008 | ||||||
| Accumulated other comprehensive income (loss) |
1,013 | (1,550 | ) | |||||
| Total shareholders’ equity |
44,024 | 41,233 | ||||||
| Total liabilities and shareholders’ equity |
$ | 477,846 | $ | 452,468 | ||||
The accompanying notes are an integral part of the consolidated financial statements.
37
UWHARRIE CAPITAL CORP AND SUBSIDIARIES
CONSOLIDATED STATEMENTS OF INCOME
Years Ended December 31, 2009, 2008 and 2007
| 2009 | 2008 | 2007 | ||||||||||
| (in thousands, except share and per share data) | ||||||||||||
| Interest Income |
||||||||||||
| Loans, including fees |
$ | 21,246 | $ | 22,780 | $ | 23,916 | ||||||
| Investment securities: |
||||||||||||
| US Treasury |
12 | 73 | 98 | |||||||||
| US Government agencies and corporations |
3,106 | 1,853 | 1,401 | |||||||||
| State and political subdivisions |
632 | 689 | 633 | |||||||||
| Other |
— | 84 | 128 | |||||||||
| Interest-earning deposits with banks and federal funds sold |
66 | 85 | 733 | |||||||||
| Total interest income |
25,062 | 25,564 | 26,909 | |||||||||
| Interest Expense |
||||||||||||
| Interest checking and money market accounts |
838 | 1,357 | 2,550 | |||||||||
| Savings deposits |
255 | 301 | 526 | |||||||||
| Time deposits $100,000 and over |
1,980 | 2,453 | 2,316 | |||||||||
| Other time deposits |
2,836 | 3,828 | 4,138 | |||||||||
| Short-term borrowed funds |
316 | 529 | 1,128 | |||||||||
| Long-term debt |
1,472 | 1,360 | 1,218 | |||||||||
| Total interest expense |
7,697 | 9,828 | 11,876 | |||||||||
| Net interest income |
17,365 | 15,736 | 15,033 | |||||||||
| Provision for loan losses |
1,732 | 969 | 15 | |||||||||
| Net interest income after provision for loan losses |
15,633 | 14,767 | 15,018 | |||||||||
| Noninterest Income |
||||||||||||
| Service charges on deposit accounts |
2,360 | 2,238 | 2,188 | |||||||||
| Other service fees and commissions |
2,273 | 2,777 | 3,097 | |||||||||
| Loss on sale of securities |
(711 | ) | — | (76 | ) | |||||||
| Loss on nonmarketable securities |
(172 | ) | — | — | ||||||||
| Loss on securities with other-than-temporary impairment |
(1,807 | ) | (158 | ) | — | |||||||
| Portion of loss recognized in other comprehensive income |
— | — | — | |||||||||
| Net impairment recognized in income |
(1,807 | ) | (158 | ) | — | |||||||
| Income from mortgage loan sales |
3,436 | 1,208 | 957 | |||||||||
| Other income |
445 | 532 | 424 | |||||||||
| Total noninterest income |
5,824 | 6,597 | 6,590 | |||||||||
| Noninterest Expense |
||||||||||||
| Salaries and employee benefits |
11,527 | 10,637 | 10,156 | |||||||||
| Net occupancy expense |
1,071 | 987 | 871 | |||||||||
| Equipment expense |
702 | 645 | 598 | |||||||||
| Data processing costs |
792 | 789 | 742 | |||||||||
| Professional fees and services |
968 | 687 | 720 | |||||||||
| Marketing and donations |
746 | 682 | 639 | |||||||||
| Electronic banking expense |
728 | 792 | 706 | |||||||||
| Software amortization and maintenance |
470 | 455 | 448 | |||||||||
| FDIC insurance |
958 | 128 | 66 | |||||||||
| Other noninterest expense |
2,968 | 2,729 | 2,416 | |||||||||
| Total noninterest expense |
20,930 | 18,531 | 17,362 | |||||||||
| Income before income taxes |
527 | 2,833 | 4,246 | |||||||||
| Income taxes |
(163 | ) | 804 | 1,287 | ||||||||
| Net income |
$ | 690 | $ | 2,029 | $ | 2,959 | ||||||
| Net income |
$ | 690 | $ | 2,029 | $ | 2,959 | ||||||
| Dividends on preferred stock |
(642 | ) | (13 | ) | — | |||||||
| Net Income available to common shareholders |
$ | 48 | $ | 2,016 | $ | 2,959 | ||||||
| Net income per common share |
||||||||||||
| Basic |
$ | 0.01 | $ | 0.27 | $ | 0.39 | ||||||
| Diluted |
$ | 0.01 | $ | 0.27 | $ | 0.39 | ||||||
| Weighted average common shares outstanding |
||||||||||||
| Basic |
7,474,140 | 7,482,488 | 7,603,494 | |||||||||
| Diluted |
7,474,140 | 7,520,484 | 7,706,832 | |||||||||
The accompanying notes are an integral part of the consolidated financial statements.
38
UWHARRIE CAPITAL CORP AND SUBSIDIARIES
CONSOLIDATED STATEMENTS OF COMPREHENSIVE INCOME
Years Ended December 31, 2009, 2008 and 2007
| 2009 | 2008 | 2007 | ||||||||||
| (in thousands) | ||||||||||||
| Net Income |
$ | 690 | $ | 2,029 | $ | 2,959 | ||||||
| Other comprehensive income (loss): |
||||||||||||
| Unrealized gains (losses) on available for sale securities |
1,637 | (3,315 | ) | 275 | ||||||||
| Related tax effect |
(621 | ) | 1,281 | (105 | ) | |||||||
| Reclassification of losses recognized in net income |
711 | — | 76 | |||||||||
| Related tax effect |
(274 | ) | — | (29 | ) | |||||||
| Reclassification of losses for which credit-related portion other-than-temporary impairment was recognized in net income |
1,807 | 158 | — | |||||||||
| Related tax effect |
(697 | ) | (61 | ) | — | |||||||
| Total other comprehensive income (loss) |
2,563 | (1,937 | ) | 217 | ||||||||
| Comprehensive income |
$ | 3,253 | $ | 92 | $ | 3,176 | ||||||
The accompanying notes are an integral part of the consolidated financial statements.
39
UWHARRIE CAPITAL CORP AND SUBSIDIARIES
CONSOLIDATED STATEMENTS OF CHANGES IN SHAREHOLDERS’ EQUITY
Years Ended December 31, 2009, 2008 and 2007
| Number Common Shares Issued |
Preferred Stock Series A |
Preferred Stock Series B |
Discount on Preferred Stock |
Common Stock |
Additional Paid-in Capital |
Unearned ESOP Compensation |
Undivided Profits |
Accumulated Other Comprehensive Income(Loss) |
Total | ||||||||||||||||||||||||||||
| (in thousands, except share data) | |||||||||||||||||||||||||||||||||||||
| Balance, December 31, 2006 |
7,423,550 | $ | — | $ | — | $ | — | $ | 9,279 | $ | 13,541 | $ | (859 | ) | $ | 7,502 | $ | 170 | $ | 29,633 | |||||||||||||||||
| Net income |
— | — | — | — | — | — | — | 2,959 | — | 2,959 | |||||||||||||||||||||||||||
| Other comprehensive income |
— | — | — | — | — | — | — | — | 217 | 217 | |||||||||||||||||||||||||||
| Release of ESOP shares |
— | — | — | — | — | 31 | 59 | — | — | 90 | |||||||||||||||||||||||||||
| Common stock issued pursuant to: |
|||||||||||||||||||||||||||||||||||||
| 3% stock dividend |
216,062 | — | — | — | 270 | 916 | — | (1,186 | ) | — | — | ||||||||||||||||||||||||||
| Stock options exercised |
12,764 | — | — | — | 16 | 20 | — | — | — | 36 | |||||||||||||||||||||||||||
| Tax benefit of stock options exercised |
— | — | — | — | — | 3 | — | — | — | 3 | |||||||||||||||||||||||||||
| Repurchase of common stock |
(237,669 | ) | — | — | — | (297 | ) | (1,107 | ) | — | — | — | (1,404 | ) | |||||||||||||||||||||||
| Cash paid fraction shares |
— | — | — | — | — | — | — | (9 | ) | — | (9 | ) | |||||||||||||||||||||||||
| Stock compensation expense |
— | — | — | — | — | 49 | — | — | — | 49 | |||||||||||||||||||||||||||
| Balance, December 31, 2007 |
7,414,707 | — | — | — | 9,268 | 13,453 | (800 | ) | 9,266 | 387 | 31,574 | ||||||||||||||||||||||||||
| Net income |
— | — | — | — | — | — | — | 2,029 | — | 2,029 | |||||||||||||||||||||||||||
| Other comprehensive income |
— | — | — | — | — | — | — | — | (1,937 | ) | (1,937 | ) | |||||||||||||||||||||||||
| Release of ESOP shares |
— | — | — | — | — | 14 | 64 | — | — | 78 | |||||||||||||||||||||||||||
| Common stock issued pursuant to: |
|||||||||||||||||||||||||||||||||||||
| 3% stock dividend |
220,738 | — | — | — | 276 | 718 | — | (994 | ) | — | — | ||||||||||||||||||||||||||
| Stock options exercised |
69,742 | — | — | — | 87 | 214 | — | — | — | 301 | |||||||||||||||||||||||||||
| Tax benefit of stock options exercised |
— | — | — | — | — | 26 | — | — | — | 26 | |||||||||||||||||||||||||||
| Repurchase of common stock |
(111,258 | ) | — | — | — | (139 | ) | (432 | ) | — | — | — | (571 | ) | |||||||||||||||||||||||
| Cash paid fractional shares |
— | — | — | — | — | — | — | (7 | ) | — | (7 | ) | |||||||||||||||||||||||||
| Stock compensation expense |
— | — | — | — | — | 26 | — | — | — | 26 | |||||||||||||||||||||||||||
| Adjustment to initially apply ASC 715-60 |
— | — | — | — | — | — | — | (273 | ) | — | (273 | ) | |||||||||||||||||||||||||
| Issue series A preferred stock to the Treasury |
— | 10,000 | — | — | — | — | — | — | — | 10,000 | |||||||||||||||||||||||||||
| Issue series B preferred stock to the Treasury |
— | — | 500 | — | — | — | — | — | — | 500 | |||||||||||||||||||||||||||
| Record Series B warrant expense |
— | — | — | (500 | ) | — | — | — | — | — | (500 | ) | |||||||||||||||||||||||||
| Record preferred stock dividend |
— | — | — | — | — | — | — | (13 | ) | — | (13 | ) | |||||||||||||||||||||||||
| Balance, December 31, 2008 |
7,593,929 | 10,000 | 500 | (500 | ) | 9,492 | 14,019 | (736 | ) | 10,008 | (1,550 | ) | 41,233 | ||||||||||||||||||||||||
40
UWHARRIE CAPITAL CORP AND SUBSIDIARIES
CONSOLIDATED STATEMENTS OF CHANGES IN SHAREHOLDERS’ EQUITY (Continued)
Years Ended December 31, 2009, 2008 and 2007
| Number Common Shares Issued |
Preferred Stock Series A |
Preferred Stock Series B |
Discount on Preferred Stock |
Common Stock |
Additional Paid-in Capital |
Unearned ESOP Compensation |
Undivided Profits |
Accumulated Other Comprehensive Income(Loss) |
Total | |||||||||||||||||||||||||
| (in thousands, except share data) | ||||||||||||||||||||||||||||||||||
| Balance, December 31, 2008 |
7,593,929 | $ | 10,000 | $ | 500 | $ | (500 | ) | $ | 9,492 | $ | 14,019 | $ | (736 | ) | $ | 10,008 | $ | (1,550 | ) | $ | 41,233 | ||||||||||||
| Net income |
— | — | — | — | — | — | — | 690 | — | 690 | ||||||||||||||||||||||||
| Other comprehensive income |
— | — | — | — | — | — | — | — | 2,563 | 2,563 | ||||||||||||||||||||||||
| Release of ESOP shares |
— | — | — | — | — | — | 69 | — | — | 69 | ||||||||||||||||||||||||
| Stock compensation expense |
— | — | — | — | — | 11 | — | — | — | 11 | ||||||||||||||||||||||||
| Record preferred stock dividend and discount accretion |
— | — | — | 100 | — | — | — | (642 | ) | — | (542 | ) | ||||||||||||||||||||||
| Balance, December 31, 2009 |
7,593,929 | $ | 10,000 | $ | 500 | $ | (400 | ) | $ | 9,492 | $ | 14,030 | $ | (667 | ) | $ | 10,056 | $ | 1,013 | $ | 44,024 | |||||||||||||
The accompanying notes are an integral part of the consolidated financial statements.
41
UWHARRIE CAPITAL CORP AND SUBSIDIARIES
CONSOLIDATED STATEMENTS OF CASH FLOWS
Years Ended December 31, 2009, 2008 and 2007
| 2009 | 2008 | 2007 | ||||||||||
| Cash flows from operating activities |
||||||||||||
| Net income |
$ | 690 | $ | 2,029 | $ | 2,959 | ||||||
| Adjustments to reconcile net income to net cash |
||||||||||||
| Provided by operating activities: |
||||||||||||
| Depreciation |
780 | 676 | 625 | |||||||||
| Net amortization of security premiums/discounts |
134 | (202 | ) | (220 | ) | |||||||
| Impairment of securities available for sale |
1,807 | 158 | — | |||||||||
| Net amortization of mortgage servicing rights |
868 | 471 | 407 | |||||||||
| Impairment of foreclosed real estate |
78 | 28 | — | |||||||||
| Provision for loan losses |
1,732 | 969 | 15 | |||||||||
| Deferred income taxes |
(737 | ) | (728 | ) | 205 | |||||||
| Stock compensation |
11 | 26 | 49 | |||||||||
| Net realized loss on sales / calls available for sale securities |
711 | — | 76 | |||||||||
| Income from mortgage loan sales |
(3,436 | ) | (1,208 | ) | (957 | ) | ||||||
| Proceeds from sales of loans held for sale |
144,761 | 55,198 | 45,603 | |||||||||
| Origination of loans held for sale |
(142,727 | ) | (54,328 | ) | (43,748 | ) | ||||||
| (Gain) loss on sale of premises, equipment and other assets |
(1 | ) | 5 | (26 | ) | |||||||
| Loss on nonmarketable securities |
172 | — | — | |||||||||
| Increase in cash surrender value of life insurance |
(203 | ) | (193 | ) | (185 | ) | ||||||
| Loss on sales of foreclosed real estate |
36 | 41 | 2 | |||||||||
| Release of ESOP Shares |
69 | 78 | 90 | |||||||||
| Net change in interest receivable |
(50 | ) | 28 | (280 | ) | |||||||
| Net change in other assets |
(3,652 | ) | 83 | (866 | ) | |||||||
| Net change in interest payable |
(106 | ) | (94 | ) | 93 | |||||||
| Net change in other liabilities |
714 | 584 | 302 | |||||||||
| Net cash provided by operating activities |
1,651 | 3,621 | 4,144 | |||||||||
| Cash flows from investing activities |
||||||||||||
| Proceeds from sales, maturities and calls of securities available for sale |
30,353 | 14,386 | 10,382 | |||||||||
| Purchase of securities available for sale |
(36,208 | ) | (35,329 | ) | (23,744 | ) | ||||||
| Net increase in loans |
(15,598 | ) | (21,837 | ) | (33,588 | ) | ||||||
| Proceeds from sale of premises, equipment and other assets |
1 | — | 87 | |||||||||
| Purchase of premises and equipment |
(3,298 | ) | (3,058 | ) | (758 | ) | ||||||
| Proceeds from sales of foreclosed real estate |
1,243 | 182 | 98 | |||||||||
| Investment in other assets |
(1,089 | ) | (569 | ) | — | |||||||
| Net increase in Federal Home Loan Bank stock |
(917 | ) | (147 | ) | (157 | ) | ||||||
| Net cash used by investing activities |
(25,513 | ) | (46,372 | ) | (47,680 | ) | ||||||
| Cash flows from financing activities |
||||||||||||
| Net increase in deposit accounts |
23,147 | 28,970 | 15,057 | |||||||||
| Net increase (decrease) in short-term borrowed funds |
4,691 | (9,679 | ) | 18,888 | ||||||||
| Net increase (decrease) in long-term debt |
(5,859 | ) | 3,392 | (7,598 | ) | |||||||
| Net proceeds from issuance of junior subordinated debt |
— | 7,419 | — | |||||||||
| Repurchases of common stock |
— | (571 | ) | (1,404 | ) | |||||||
| Net proceeds from issuance of preferred stock |
— | 10,000 | — | |||||||||
| Net proceeds from issuance of common stock |
— | 301 | 36 | |||||||||
| Tax benefit of stock options exercised |
— | 26 | 3 | |||||||||
| Dividend and discount accretion on preferred stock |
(542 | ) | (13 | ) | — | |||||||
| Cash paid for fractional shares |
— | (7 | ) | (9 | ) | |||||||
| Net cash provided by financing activities |
21,437 | 39,838 | 24,973 | |||||||||
| Decrease in cash and cash equivalents |
(2,425 | ) | (2,913 | ) | (18,563 | ) | ||||||
| Cash and cash equivalents, beginning of period |
13,284 | 16,197 | 34,760 | |||||||||
| Cash and cash equivalents, end of period |
$ | 10,859 | $ | 13,284 | $ | 16,197 | ||||||
| Supplemental disclosures of cash flow information |
||||||||||||
| Interest paid |
$ | 7,802 | $ | 9,922 | $ | 11,783 | ||||||
| Income taxes paid |
1,558 | 1,596 | 1,311 | |||||||||
| Supplemental schedule of non-cash activities |
||||||||||||
| Net change in fair value of securities available for sale, net of tax |
2,563 | (1,937 | ) | 217 | ||||||||
| Loans transferred to foreclosed real estate |
1,882 | 2,876 | 60 | |||||||||
| Mortgage servicing rights capitalized |
1,465 | 563 | 331 | |||||||||
| Preferred stock dividend accrued |
(68 | ) | (13 | ) | — | |||||||
| ASC 715-60 charged to retained earnings |
— | (273 | ) | — | ||||||||
The accompanying notes are an integral part of the consolidated financial statements.
42
UWHARRIE CAPITAL CORP AND SUBSIDIARIES
Notes to Consolidated Financial Statements
Note 1 - Significant Accounting Policies
Nature of Business
Uwharrie Capital Corp (the “Company”) was incorporated under North Carolina law for the purpose of becoming the holding company for Bank of Stanly (“Stanly”). On July 1, 1993, Stanly became a wholly-owned subsidiary of the Company through a one-for-one exchange of the common stock of Stanly for common stock of the Company.
Stanly was incorporated on September 28, 1983, under the laws of the State of North Carolina and began operations on January 26, 1984 in Albemarle, North Carolina. Deposits with Stanly are insured by the Federal Deposit Insurance Corporation (“FDIC”). Stanly is under regulation of the Federal Reserve, FDIC and the North Carolina State Banking Commission. Through its six branch locations in Stanly County, Stanly provides a wide range of deposit accounts, commercial, consumer, home equity and residential mortgage loans, safe deposit boxes and automated banking.
In 1987, Stanly established a wholly-owned subsidiary, BOS Agency, Inc. (“BOS Agency”), which engages in insurance product sales. In 1989, Stanly established a second wholly-owned subsidiary, BOS Financial Corporation, for the purpose of conducting business as a broker/dealer in securities. During 1993, BOS Financial Corporation changed its name to The Strategic Alliance Corporation (“Strategic Alliance”) and was registered as a broker/dealer and is regulated by the Financial Industry Regulatory Authority (“FINRA”).
The Company formed a new subsidiary, Strategic Investment Advisors, Inc. (“SIA”), during 1999 to provide investment advisory and asset management services. This subsidiary is registered as an investment advisor with the Securities and Exchange Commission.
On January 19, 2000, the Company completed its acquisition of Anson BanCorp, Inc. and its subsidiary, Anson Savings Bank. The savings bank retained its North Carolina savings bank charter and became a wholly-owned subsidiary of Uwharrie Capital Corp as Anson Bank & Trust Company (“Anson”), operating out of its main office branch in Wadesboro.
On August 4, 2000, Stanly acquired another subsidiary, Gateway Mortgage, Inc. (“Gateway”), a mortgage origination company.
On April 10, 2003, the Company capitalized a new wholly-owned subsidiary bank, Cabarrus Bank & Trust Company (“Cabarrus”), located in Concord, North Carolina. As of that date, Cabarrus purchased two branch offices located in Cabarrus County from Stanly to begin its operation. Cabarrus operates as a commercial bank and provides a full range of banking services.
On April 7, 2004 Uwharrie Mortgage, Inc. was established as a subsidiary of the Company to serve in the capacity of trustee and substitute trustee under deeds of trust.
Principles of Consolidation
The consolidated financial statements include the accounts of the Company, Stanly, Anson, Cabarrus, SIA and their subsidiaries, BOS Agency, Strategic Alliance and Gateway. All significant intercompany transactions and balances have been eliminated in consolidation.
43
UWHARRIE CAPITAL CORP AND SUBSIDIARIES
Notes to Consolidated Financial Statements
Note 1 - Significant Accounting Policies (Continued)
Use of Estimates
The preparation of financial statements, in conformity with accounting principles generally accepted in the United States of America, requires management to make estimates and assumptions that affect the reported amounts of assets and liabilities and the disclosure of contingent assets and liabilities at the date of the financial statements and the reported amounts of revenues and expenses during the reporting period. Actual results could differ from those estimates. Material estimates that are particularly susceptible to significant change relate to the determination of the allowance for loan losses.
Cash and Cash Equivalents
For the purpose of presentation in the consolidated statements of cash flows, cash and cash equivalents are defined as those amounts included in the balance sheet captions “Cash and due from banks” and “Interest-earning deposits with banks.”
Investment Securities Held To Maturity
Investment securities classified as held to maturity are debt securities the Company has both the intent and ability to hold to maturity regardless of changes in market conditions, liquidity needs or changes in general economic conditions. These securities are carried at cost adjusted for amortization of premium and accretion of discount, computed by the interest method over their contractual lives. Declines in the fair value of individual held to maturity securities below their cost that are other than temporary would result in write-downs of the individual securities to their fair value. Such write-downs would be included in earnings as realized losses. The Company had no securities held to maturity at December 31, 2009 and 2008.
Investment Securities Available for Sale
Investment securities available for sale consist of bonds and notes not classified as trading securities nor as held to maturity securities. Unrealized holding gains and losses on available for sale securities are reported as a net amount in other comprehensive income, net of income taxes. Gains and losses on the sale of available for sale securities are determined using the specific identification method. Declines in the fair value of individual available for sale securities below their cost that are other than temporary would result in write-downs of the individual securities to their fair value. Such write-downs would be included in earnings as realized losses. Premiums and discounts are recognized in interest income using the interest method over the period to maturity.
Loans Held for Sale
Loans originated and intended for sale in the secondary market are carried at the lower of cost or estimated fair value in the aggregate. Net unrealized losses, if any, are recognized through a valuation allowance by charges to income.
Loans
The Company grants mortgage, commercial and consumer loans to customers. The ability of the Company’s borrowers to honor their contracts is largely dependent upon the real estate and general economic conditions in the Company’s market area. Loans that management has the
44
UWHARRIE CAPITAL CORP AND SUBSIDIARIES
Notes to Consolidated Financial Statements
Note 1 - Significant Accounting Policies (Continued)
intent and ability to hold for the foreseeable future or until maturity or pay-off are reported at their outstanding unpaid principal balances adjusted for charge-offs, the allowance for loan losses, and any deferred fees or costs. Interest income is accrued on the unpaid principal balance. Loan origination fees, net of certain direct origination costs, are deferred and recognized as an adjustment of the related loan yield using the interest method.
The accrual of interest on mortgage and commercial loans is discontinued at the time the loan is 90 days delinquent unless the credit is well-secured and in process of collection. Credit card loans and other personal loans are typically charged off no later than 180 days past due. In all cases, loans are placed on nonaccrual or charged off at an earlier date if collection of principal or interest is considered doubtful.
All interest accrued but not collected for loans that are placed on nonaccrual or charged off is reversed against interest income. The interest on these loans is accounted for on the cash-basis or cost-recovery method until qualifying for return to accrual. Loans are returned to accrual status when all the principal and interest amounts contractually due are brought current and future payments are reasonably assured.
Allowance for Loan Losses
The allowance for loan losses is established as losses are estimated to have occurred through a provision for loan losses charged to earnings. Loan losses are charged against the allowance when management believes the uncollectibility of a loan balance is confirmed. Subsequent recoveries, if any, are credited to the allowance.
The allowance for loan losses is evaluated on a regular basis by management and is based upon management’s periodic review of the collectibility of the loans in light of historical experience, the nature and volume of the loan portfolio, adverse situations that may affect the borrower’s ability to repay, estimated value of any underlying collateral and prevailing economic conditions. This evaluation is inherently subjective as it requires estimates that are susceptible to significant revision as more information becomes available. In addition, regulatory examiners may require the Company to recognize adjustments to the allowance for loan losses based on their judgment about information available to them at the time of their assessment.
A loan is considered impaired when, based on current information and events, it is probable that the Company will be unable to collect the scheduled payments of principal or interest when due according to the contractual terms of the loan agreement. Factors considered by management in determining impairment include payment status, collateral value, and the probability of collecting scheduled principal and interest payments when due. Loans that experience insignificant payment delays and payment shortfalls generally are not classified as impaired. Management determines the significance of payment delays and payment shortfalls on a case-by-case basis, taking into consideration all of the circumstances surrounding the loan and the borrower, including the length of the delay, amount of the shortfall in relation to the principal and interest owed. Impairment is measured on a loan by loan basis for commercial and construction loans by either the present value of expected future cash flows discounted at the loan’s effective interest rate, the loan’s obtainable market price, or the fair value of the collateral if the loan is collateral dependent.
Large groups of smaller balance homogeneous loans are collectively evaluated for impairment. Accordingly, the Company does not separately identify individual consumer, residential and other loans for impairment disclosures.
45
UWHARRIE CAPITAL CORP AND SUBSIDIARIES
Notes to Consolidated Financial Statements
Note 1 - Significant Accounting Policies (Continued)
Servicing Rights
The Company capitalizes servicing rights when loans are either securitized or sold and the loan servicing is retained. The cost of servicing rights is amortized in proportion to and over the estimated period of net servicing revenues. The amortization of servicing rights is recognized in the statement of income as an offset to other noninterest income. Servicing assets are evaluated for impairment based upon the fair value. Fair value is determined using prices for similar assets with similar characteristics, when available, or based upon discounted cash flows using market-based assumptions. Impairment is recognized through a valuation allowance.
Transfers of Financial Assets
Transfers of financial assets are accounted for as sales when control over the assets has been surrendered. Control over transferred assets is deemed to be surrendered when (1) the assets have been isolated from the Company, (2) the transferee obtains the right (free of conditions that constrain it from taking advantage of that right) to pledge or exchange the transferred assets, and (3) the Company does not maintain effective control over the transferred assets through an agreement to repurchase them before their maturity.
Foreclosed Real Estate
Real estate properties acquired through foreclosure or other proceedings are initially recorded at fair value upon foreclosure, establishing a new cost basis. After foreclosure, valuations are performed and the foreclosed property is adjusted to the lower of cost or fair value of the properties, less costs to sell. Any write-down at the time of transfer to foreclosed properties is charged to the allowance for loan losses. Subsequent write-downs are charged to other expenses. Property is evaluated regularly to ensure that the recorded amount is supported by its current fair value.
Premises and Equipment
Premises and equipment are stated at cost less accumulated depreciation. Land is carried at cost. Additions and major replacements or betterments which extend the useful lives of premises and equipment are capitalized. Maintenance, repairs and minor improvements are expensed as incurred. Depreciation is computed principally by the straight-line method over estimated useful lives, except in the case of leasehold improvements, which are amortized over the term of the leases, if shorter. Useful lives range from five to seven years for furniture, fixtures and equipment, to ten to thirty-nine years for leasehold improvements and buildings, respectively. Upon retirement or other disposition of the assets, the cost and the related accumulated depreciation are removed from the accounts and any gains or losses are reflected in income.
Federal Home Loan Bank Stock
As a requirement for membership, the banks invest in the stock of the Federal Home Loan Bank of Atlanta (“FHLB”). This investment is carried at cost. Due to the redemption provisions of the FHLB, the Company estimated that fair value approximates cost and that this investment was not impaired.
46
UWHARRIE CAPITAL CORP AND SUBSIDIARIES
Notes to Consolidated Financial Statements
Note 1 - Significant Accounting Policies (Continued)
Goodwill
Goodwill resulted from the 2000 acquisition of Anson BanCorp, Inc. and its subsidiary, Anson Savings Bank. Goodwill is evaluated for impairment annually or more frequently if circumstances indicate potential impairment.
Stock-Based Compensation
The Company recognizes the cost of employee services received in exchange for an award of equity instruments in the financial statements over the period the employee is required to perform the services in exchange for the award (presumptively the vesting period). ASC 718 also requires measurement of the cost of employee services received in exchange for an award based on the grant-date fair value of the award. Excess tax benefits are reported as financing cash inflows in the consolidated statement of cash flows.
Income Taxes
The Company and its subsidiaries file a consolidated Federal income tax return and separate North Carolina income tax returns. The provision for income taxes in the accompanying consolidated financial statements is provided on a liability method whereby deferred tax assets are recognized for deductible temporary differences and operating loss and tax credit carryforwards and deferred tax liabilities are recognized for taxable temporary differences. Temporary differences are the differences between the reported amounts of assets and liabilities and their tax bases. Deferred tax assets are reduced by a valuation allowance when, in the opinion of management, it is more likely than not that some portion or all of the deferred tax assets will not be realized. Deferred tax assets and liabilities are adjusted for the effects of changes in tax laws and rates on the date of enactment.
Fair Value of Financial Instruments
The Company adopted the provisions of Accounting Standards Codification ASC 820 Fair Value Measurements and Disclosures and ASC 825, Financial Instruments on January 1, 2008.
ASC 820 defines fair value, establishes a framework for measuring fair value, and expands disclosures about fair value measurements. ASC 820 does not require any new fair value measurements, but clarifies and standardizes some divergent practices that have emerged since prior guidance was issued. ASC 820 creates a three-level hierarchy under which individual fair value estimates are to be ranked based on the relative reliability of the inputs used in the valuation.
ASC 820 defines fair value as the price that would be received to sell an asset or transfer a liability in an orderly transaction between market participants at the measurement date. When determining the fair value measurements for assets and liabilities, the Company considers the principal or most advantageous market in which those assets or liabilities are sold and considers assumptions that market participants would use when pricing those assets or liabilities. Fair values determined using Level 1 inputs rely on active and observable markets to price identical assets or liabilities. In situations where identical assets and liabilities are not traded in active markets, fair values may be determined based on Level 2 inputs, which exist when observable data exists for similar assets and liabilities. Fair values for assets and liabilities for which identical or similar assets and liabilities are not actively traded in observable markets are based on Level 3 inputs, which are considered to be unobservable.
47
UWHARRIE CAPITAL CORP AND SUBSIDIARIES
Notes to Consolidated Financial Statements
Note 1 - Significant Accounting Policies (Continued)
Among the Company’s assets and liabilities, investment securities available for sale are reported at their fair values on a recurring basis. Certain other assets are adjusted to their fair value on a nonrecurring basis, including loans held for sale, which are carried at the lower of cost or market; loan servicing rights, where fair value is determined using similar assets with similar characteristics, when available, or based upon discounted cash flows using market-based assumptions; foreclosed real estate, which is carried at lower of cost or fair market value and goodwill, which is periodically tested for impairment. Deposits, short-term borrowings and long-term obligations are not reported at fair value.
The Company does not record loans at fair value on a recurring basis. However, from time to time, a loan is considered impaired and an allowance for loan losses is established. Loans for which it is probable that payment of interest and principal will not be made in accordance with the contractual terms of the loan agreement are considered impaired. Once a loan is identified as individually impaired, management measures impairment in accordance with ASC 310, Receivables, Loan and Debt Securities. The fair value of impaired loans is estimated using one of several methods, including collateral value, market value of similar debt, enterprise value, liquidation value and discounted cash flows. Those impaired loans not requiring an allowance represent loans for which the fair value of the expected repayments or collateral exceed the recorded investments in such loans. At December 31, 2009, substantially all of the total impaired loans were evaluated based on the fair value of the collateral. When the fair value of the collateral is based on an observable market price or a current appraised value, the Company records the impaired loan as nonrecurring Level 2. When an appraised value is not available or management determines the fair value of the collateral is further impaired below the appraised value and there is no observable market price, the Company records the impaired loan as nonrecurring Level 3.
Comprehensive Income
The Company reports as comprehensive income all changes in shareholders’ equity during the year from sources other than shareholders. Other comprehensive income refers to all components (revenues, expenses, gains, and losses) of comprehensive income that are excluded from net income. The Company’s only component of other comprehensive income is unrealized gains and losses, net of income tax, on investment securities available for sale.
As of December 31, 2009 and December 31, 2008, total accumulated other comprehensive income (loss) was $1.0 million and $(1.6) million, respectively. The components of accumulated other comprehensive income at December 31, 2009 included $239,926 of unrealized gains and temporary unrealized losses net of tax, and non credit losses on five other than temporarily impaired investments of $(772,722) net of tax. Accumulated other comprehensive income at December 31, 2008 consisted of unrealized gains and temporary unrealized losses of $(1.6) million net of tax.
Earnings per Common Share
The Company issued 3% stock dividends in 2008 and 2007. There was not a stock dividend in 2009. All references in these consolidated financial statements to earnings per common share and weighted average common and common equivalent shares outstanding have been adjusted for the effect of these stock dividends. In 2009 and 2008 there were 280,715 and 189,866 options outstanding that were anti-dilutive, respectively. There were not any anti-dilutive stock options outstanding in 2007.
48
UWHARRIE CAPITAL CORP AND SUBSIDIARIES
Notes to Consolidated Financial Statements
Note 1 - Significant Accounting Policies (Continued)
Basic earnings per share (“EPS”) excludes dilution and is computed by dividing income available to common shareholders by the weighted-average number of common shares outstanding for the period. Diluted EPS reflects the potential dilution that could occur if securities or other contracts to issue common stock were exercised or converted into common stock or resulted in the issuance of common stock that then shared in the earnings of the entity. The ESOP effect is the yearly average of the unallocated ESOP shares.
The computation of weighted average shares used in the calculation of basic and dilutive earnings per share is summarized below:
| 2009 | 2008 | 2007 | |||||||
| Weighted average number of common shares used in computing basic net income per common share |
7,593,969 | 7,618,913 | 7,753,837 | ||||||
| Effect of ESOP shares |
(119,829 | ) | (136,425 | ) | (150,343 | ) | |||
| Adjusted weighted average number of common shares used in computing basic net income per common share |
7,474,140 | 7,482,488 | 7,603,494 | ||||||
| Effect of dilutive stock options |
— | 37,996 | 103,338 | ||||||
| Weighted average number of common shares and dilutive potential common shares used in computing diluted net income per common share |
7,474,140 | 7,520,484 | 7,706,832 | ||||||
Recent Accounting Pronouncements
ASC 105
In June 2009, the Financial Accounting Standards Board issued Accounting Standards Codification ASC 105. The FASB Accounting Standards Codification and the Hierarchy of Generally Accepted Accounting Principles as the single source of authoritative U.S. Generally Accepted Accounting Principles (GAAP) recognized by the FASB to be applied by nongovernmental entities. The Codification reorganizes all previous GAAP pronouncements into roughly 90 accounting topics and displays all topics using a consistent structure. All existing standards that were used to create the Codification have been superseded, replacing the previous references to specific Statements of Financial Accounting Standards (SFAS) with numbers used in the Codification’s structural organization. The guidance is effective for interim and annual periods ending after September 15, 2009. After September 15, only one level of authoritative GAAP exists, other than guidance issued by the Securities and Exchange Commission (SEC). All other accounting literature excluded from the Codification is considered non-authoritative. The adoption of the Codification does not have a material impact on the Company’s consolidated financial statements.
ASC 815
In March of 2008, the Financial Accounting Standards Board issued Accounting Standards Codification 815 (“ASC 815”), Derivative and Hedging. ASC 815 amends and expands the disclosure requirement for derivative instruments and hedging activities to provide users of financial statements with an enhanced understanding of the derivative instrument’s purpose,
49
UWHARRIE CAPITAL CORP AND SUBSIDIARIES
Notes to Consolidated Financial Statements
Note 1 - Significant Accounting Policies (Continued)
how it is accounted for, and its impact on the financial statements. The adoption of ASC 815 on January 1, 2009 did not have a material effect on the Company’s consolidated financial statements.
ASC 855
In May 2009, the Financial Accounting Standards Board issued Accounting Standards Codification (“ASC 855”), Subsequent Events. The guidance establishes general standards of accounting for and disclosure of subsequent events. Subsequent events are events that occur after the balance sheet date but before financial statements are issued or are available to be issued. The guidance is effective for interim or annual periods ending after June 15, 2009. The adoption of this guidance was not material to the Company’s consolidated financial statements.
FSP EITF 99-20-1
On January 12, 2009, the Financial Accounting Standards Board (“FASB”) issued FASB Staff Position, Emerging Issues Task Force (EITF) 99-20-1, Amendments to the Impairment Guidance of EITF Issue No. 99-20. FSP EITF 99-20-1 addresses certain practice issues in EITF No. 99-20, “Recognition of Interest Income and Impairment on Purchased Beneficial Interests and Beneficial Interests That Continue to Be Held by a Transferor in Securitized Financial Assets,” by making its other-than-temporary impairment assessment guidance consistent with SFAS No. 115, “Accounting for Certain Investments in Debt and Equity Securities.” FSP EITF 99-20-1 removes the reference to the consideration of a market participant’s estimates of cash flows in EITF 99-20, and instead requires an assessment of whether it is probable, based on current information and events, that the holder of the security will be unable to collect all amounts due according to the contractual terms. If it is probable that there has been an adverse change in estimated cash flows, other-than-temporary impairment is deemed to exist, and a corresponding loss shall be recognized in earnings equal to the entire difference between the investment’s carrying value and its fair value at the balance sheet date of the reporting period for which the assessment is made. This FSP is effective for interim and annual reporting periods ending after December 15, 2008, and shall be applied prospectively. The impact of adoption did not have a material impact on the Company’s consolidated financial statements.
In April 2009, the Financial Accounting Standards Board issued the following three FASB Staff Positions intended to provide additional application guidance and enhance disclosures regarding fair value measurements and impairments of securities:
ASC 820
ASC 820, “Fair Value and Disclosures,” provide additional guidance for estimating fair value in accordance with ASC 820 when the volume and level of activity for the asset or liability have decreased significantly. ASC 820 also provides guidance on identifying circumstances that indicate a transaction is not orderly. The provisions of ASC 820 are effective for the Company’s interim period ending on June 30, 2009.
ASC 825
ASC 825, “Financial Instruments,” requires disclosures about fair value of financial instruments in interim reporting periods of publicly traded companies that were previously only required to be disclosed in annual financial statements. The provisions of ASC 825 are effective for the Company’s interim period ending on June 30, 2009. As ASC 825 amends only the disclosure requirements about fair value of financial instruments in interim periods, the adoption of ASC 825 did not have a material effect on the Company’s statement of operations and balance sheet.
50
UWHARRIE CAPITAL CORP AND SUBSIDIARIES
Notes to Consolidated Financial Statements
Note 1 - Significant Accounting Policies (Continued)
ASC 320
ASC 320, “Investments, Debt Equity Securities” amends current other-than-temporary impairment guidance in GAAP for debt securities to make the guidance more operational and to improve the presentation and disclosure of other-than-temporary impairments on debt and equity securities in the financial statements. This ASC does not amend existing recognition and measurement guidance related to other-than-temporary impairments of equity securities. The Company adopted this as of June 30, 2009 and it did not have a material effect on the Company’s statement of operations and balance sheet.
SAB 111
The Securities and Exchange Commission (“SEC”) issued Staff Accounting Bulletin (“SAB”) No. 111 (FASB ASC 320-10-S99-1) on April 9, 2009 to amend Topic 5.M., “Other Than Temporary Impairment of Certain Investments in Debt and Equity Securities” and to supplement FSP SFAS 115-2 and SFAS 124-2. SAB 111 maintains the Staff’s previous views related to equity securities; however, debt securities are excluded from its scope. The SAB provides that “other-than-temporary” impairment is not necessarily the same as “permanent” impairment and unless evidence exists to support a value equal to or greater than the carrying value of the equity security investment, a write-down to fair value should be recorded and accounted for as a realized loss. The SAB was effective upon issuance and had no impact on the Company’s financial position.
From time to time the FASB issues exposure drafts of proposed statements of financial accounting standards. Such exposure drafts are subject to comment from the public, to revisions by the FASB and to final issuance by the FASB as statements of financial accounting standards. Management considers the effect of the proposed statements on the consolidated financial statements of the Company and monitors the status of changes to and proposed effective dates of exposure drafts.
Reclassification
Certain amounts in the 2008 and 2007 financial statements have been reclassified to conform to the 2009 presentation. The reclassifications had no effect on net income or shareholders’ equity as previously reported.
51
UWHARRIE CAPITAL CORP AND SUBSIDIARIES
Notes to Consolidated Financial Statements
Note 2 - Investment Securities
Carrying amounts and fair values of securities available for sale are summarized below:
| December 31, 2009 |
Amortized Cost |
Gross Unrealized Gains |
Gross Unrealized Losses |
Fair Value | ||||||||
| (dollars in thousands) | ||||||||||||
| U.S. Treasury |
$ | 3,024 | $ | — | $ | 5 | $ | 3,019 | ||||
| U.S. Government agencies |
20,736 | 246 | 11 | 20,971 | ||||||||
| Mortgage-backed securities and CMO’s |
34,186 | 1,056 | — | 35,242 | ||||||||
| Private label CMO’s |
7,468 | 117 | 85 | 7,500 | ||||||||
| State and political subdivisions |
9,276 | 309 | — | 9,585 | ||||||||
| Total securities available for sale |
$ | 74,690 | $ | 1,728 | $ | 101 | $ | 76,317 | ||||
| December 31, 2008 |
Amortized Cost |
Gross Unrealized Gains |
Gross Unrealized Losses |
Fair Value | ||||||||
| (dollars in thousands) | ||||||||||||
| U.S. Government agencies |
$ | 10,469 | $ | 229 | $ | 55 | $ | 10,643 | ||||
| Mortgage-backed securities and CMO’s |
33,149 | 691 | 225 | 33,615 | ||||||||
| Private label CMO’s |
11,351 | — | 3,570 | 7,781 | ||||||||
| State and political subdivisions |
16,396 | 417 | 17 | 16,796 | ||||||||
| Total securities available for sale |
$ | 71,365 | $ | 1,337 | $ | 3,867 | $ | 68,835 | ||||
At December 31, 2009 and 2008, the Company owned Federal Reserve stock reported at cost of $778,850 and $568,850 respectively and is included in other assets. Also at December 31, 2009 and 2008, the Company owned Federal Home Loan Bank Stock (FHLB) of $3.2 million and $2.3 million, respectively. The investments in Federal Reserve stock and FHLB stock are required investments related to the Company’s membership and borrowings with these banks.
Results from sales and calls of securities available for sale for the years ended December 31, 2009, 2008 and 2007 are as follows:
| 2009 | 2008 | 2007 | |||||||||
| (dollars in thousands) | |||||||||||
| Gross proceeds from sales and calls |
$ | 9,535 | $ | — | $ | 4,643 | |||||
| Realized gains from sales |
$ | 219 | $ | — | $ | — | |||||
| Realized losses from sales |
(930 | ) | — | (76 | ) | ||||||
| Net realized gains (losses) |
$ | (711 | ) | $ | — | $ | (76 | ) | |||
At December 31, 2009, 2008 and 2007 securities available for sale with a carrying amount of $11.4 million, $13.2 million and $15.2 million, respectively, were pledged as collateral on public deposits and for other purposes as required or permitted by law.
The following tables show the gross unrealized losses and fair value of investments, aggregated by investment category and length of time that individual securities have been in a continuous unrealized loss position, at December 31, 2009 and 2008. These unrealized losses on investment securities are a result of temporary fluctuations in the market prices due to a rise in interest rates, which will adjust if rates decline in a volatile market and are in no way a reflection of the quality of the investments. At December 31, 2009, the unrealized losses related to three U.S. Treasury notes, three U.S. Government Agencies and five mortgage backed securities and collateralized mortgage obligations “CMOs”.
52
UWHARRIE CAPITAL CORP AND SUBSIDIARIES
Notes to Consolidated Financial Statements
Note 2 - Investment Securities (Continued)
| Less than 12 Months | 12 Months or More | Total | ||||||||||||||||
| December 31, 2009 |
Fair Value |
Unrealized Losses |
Fair Value |
Unrealized Losses |
Fair Value |
Unrealized Losses | ||||||||||||
| (dollars in thousands) | ||||||||||||||||||
| Securities available for sale temporary impairment |
||||||||||||||||||
| U.S. Treasury |
$ | 3,019 | $ | 5 | $ | — | $ | — | $ | 3,019 | $ | 5 | ||||||
| U.S. Gov’t agencies |
10,327 | 11 | — | — | 10,327 | 11 | ||||||||||||
| Mortgage-backed securities and CMO’s |
— | — | 134 | — | 134 | — | ||||||||||||
| Private label CMO’s |
— | — | 1,625 | 85 | 1,625 | 85 | ||||||||||||
| State and political subdivisions |
— | — | — | — | — | — | ||||||||||||
| $ | 13,346 | $ | 16 | $ | 1,759 | $ | 85 | $ | 15,105 | $ | 101 | |||||||
| Other than Temporary Impairment |
||||||||||||||||||
| Private label CMO’s |
$ | — | $ | — | $ | 3,667 | $ | — | $ | 3,667 | $ | — | ||||||
| $ | — | $ | — | $ | 3,667 | $ | — | $ | 3,667 | $ | — | |||||||
| Less than 12 Months | 12 Months or More | Total | ||||||||||||||||
| December 31, 2008 |
Fair Value |
Unrealized Losses |
Fair Value |
Unrealized Losses |
Fair Value |
Unrealized Losses | ||||||||||||
| (dollars in thousands) | ||||||||||||||||||
| Securities available for sale temporary impairment |
||||||||||||||||||
| U.S. Gov’t agencies |
$ | 3,010 | $ | 55 | $ | — | $ | — | $ | 3,010 | $ | 55 | ||||||
| Mortgage-backed securities and CMO’s |
3,996 | 212 | 633 | 12 | 4,629 | 224 | ||||||||||||
| Private label CMO’s |
10,506 | 3,076 | 657 | 66 | 11,163 | 3,142 | ||||||||||||
| State and political subdivisions |
2,648 | 17 | — | — | 2,648 | 17 | ||||||||||||
| $ | 20,160 | $ | 3,360 | $ | 1,290 | $ | 78 | $ | 21,450 | $ | 3,438 | |||||||
| Other than Temporary Impairment |
||||||||||||||||||
| Private label CMO’s |
$ | 188 | $ | 429 | $ | — | $ | — | $ | 188 | $ | 429 | ||||||
| $ | 188 | $ | 429 | $ | — | $ | — | $ | 188 | $ | 429 | |||||||
The Company routinely conducts reviews to identify and evaluate each investment security to determine whether OTTI has occurred using several economic models. To determine if the unrealized loss is other-than-temporary, the Company projects total estimated defaults of the underlying troubled and non performing assets (mortgages) and multiply that calculated amount by an estimate of realizable value upon sale in the marketplace (severity) in order to determine the projected collateral loss. The Company also evaluates the current credit enhancement underlying the bond to determine the impact on cash flows. If the Company determines that a given position will be subject to a write-down, loss or decline in yield, the Company records the expected credit loss as a charge to earnings. In addition, the Company estimates the expected loss by taking into account observed performance of the underlying securities, industry studies, market forecasts, as well as our view of the economic outlook affecting bond collateral.
Based on these evaluations, the Company determined that five private label collateralized mortgage obligations were other-than-temporarily impairment at December 31, 2009, and reduced the carrying value of these instruments to fair value through a $1.8 million charge to earnings. These instruments were subsequently sold at a further loss of $93,621 during the first quarter of 2010.
53
UWHARRIE CAPITAL CORP AND SUBSIDIARIES
Notes to Consolidated Financial Statements
Note 2 – Investment Securities (Continued)
The following table summarizes cumulative credit other-than-temporary impairment losses recognized on debt securities held by the Company:
| 2009 | ||||
| (dollars in thousands) | ||||
| Balance, beginning of the period |
$ | — | ||
| Impairment losses recognized during the year |
1,807 | |||
| Realized losses from sales |
(124 | ) | ||
| Balance, end of year |
$ | 1,683 | ||
As of December 31, 2009 there are no unrealized loss components for these impaired securities and accumulated other comprehensive income.
Note 3 – Loans Held for Investment
The composition of net loans held for investment as of December 31, 2009 and 2008 is as follows:
| 2009 | 2008 | |||||||
| (dollars in thousands) | ||||||||
| Commercial |
$ | 51,723 | $ | 45,470 | ||||
| Real estate - construction |
44,976 | 50,661 | ||||||
| Real estate - residential |
144,154 | 139,346 | ||||||
| Real estate - commercial |
95,938 | 89,561 | ||||||
| Consumer |
16,628 | 15,499 | ||||||
| Other |
172 | 121 | ||||||
| 353,591 | 340,658 | |||||||
| Less: |
||||||||
| Allowance for loan losses |
(5,276 | ) | (4,361 | ) | ||||
| Deferred loan (fees) costs, net |
138 | 172 | ||||||
| Loans held for investment, net |
$ | 348,453 | $ | 336,469 | ||||
Although the subsidiary banks’ loan portfolios are diversified, there is a concentration of mortgage real estate loans, primarily one to four family residential mortgage loans, which represent 40.77% of total loans. Additionally, there is concentration in commercial loans secured primarily by real estate, to finance manufacturing buildings, shopping center locations, commercial land development, commercial buildings and equipment that comprise 27.13% of total loans. There is not a concentration of a particular type of credit in this group of commercial loans.
Impaired loans, which consisted of nonaccrual loans and other loans identified by management as impaired, totaled $24.1 million and $12.5 million at December 31, 2009 and 2008, respectively. The nonaccrual status of these loans had the effect of reducing net income by $246,395 in 2009 and $93,750 in 2008. Of the $24.1 million in impaired loans at December 31, 2009, $16.5 million carried allowances totaling $3.0 million while $7.6 million were evaluated and required no specific allowance. Of the $12.5 million in impaired loans at December 31, 2008, $9.0 million carried allowances totaling $2.3 million while $3.5 million required no specific allowance. There were credit card loans 90 days past due and still accruing of $16,635 and $2,710 at December 31, 2009 and 2008, respectively.
Restructured loans at December 31, 2009 totaled $2.4 million of which $2.3 million are included in impaired loans above.
54
UWHARRIE CAPITAL CORP AND SUBSIDIARIES
Notes to Consolidated Financial Statements
Note 3 – Loans Held for Investment (Continued)
The carrying value of foreclosed properties held as other real estate was $3.4 million and $2.8 million at December 31, 2009 and 2008, respectively.
The Company’s loan policies are written to address loan-to-value ratios and collateralization methods with respect to each lending category. Consideration is given to the economic and credit risk of lending areas and customers associated with each category.
Note 4 – Allowance for Loan Losses
Changes in the allowance for loan losses for the years ended December 31, 2009, 2008 and 2007 are presented below:
| 2009 | 2008 | 2007 | ||||||||||
| (dollars in thousands) | ||||||||||||
| Balance, beginning of year |
$ | 4,361 | $ | 3,510 | $ | 3,171 | ||||||
| Charge-offs |
(871 | ) | (288 | ) | (224 | ) | ||||||
| Recoveries |
54 | 170 | 548 | |||||||||
| Provision charged against income |
1,732 | 969 | 15 | |||||||||
| Balance, end of year |
$ | 5,276 | $ | 4,361 | $ | 3,510 | ||||||
Note 5 – Servicing Assets
Loans serviced for others are not included in the accompanying consolidated balance sheets. The unpaid principal balances of mortgage and other loans serviced for others were approximately $289 million and $228 million at December 31, 2009 and 2008, respectively. The carrying value of capitalized servicing rights, net of valuation allowances, is included in other assets. A summary of mortgage servicing rights follows:
| 2009 | 2008 | 2007 | ||||||||||
| (dollars in thousands) | ||||||||||||
| Beginning of year mortgage servicing rights: |
$ | 1,293 | $ | 1,321 | $ | 1,244 | ||||||
| Amounts capitalized |
1,465 | 563 | 484 | |||||||||
| Amortization |
(868 | ) | (471 | ) | (407 | ) | ||||||
| Impairment |
— | (120 | ) | — | ||||||||
| End of year |
$ | 1,890 | $ | 1,293 | $ | 1,321 | ||||||
Amortization expense is estimated as follows:
| Year ending December 31, | |||
| (dollars in thousands) | |||
| 2010 |
$ | 305 | |
| 2011 |
264 | ||
| 2012 |
224 | ||
| 2013 |
183 | ||
| 2014 |
142 | ||
| Thereafter |
772 | ||
| Total |
$ | 1,890 | |
55
UWHARRIE CAPITAL CORP AND SUBSIDIARIES
Notes to Consolidated Financial Statements
Note 6 – Premises and Equipment
The major classes of premises and equipment and the total accumulated depreciation at December 31, 2009 and 2008 are listed below:
| 2009 | 2008 | |||||
| (dollars in thousands) | ||||||
| Land |
$ | 4,081 | $ | 3,207 | ||
| Building and improvements |
10,012 | 8,402 | ||||
| Furniture and equipment |
5,598 | 5,391 | ||||
| 19,691 | 17,000 | |||||
| Less accumulated depreciation |
6,045 | 5,872 | ||||
| Total |
$ | 13,646 | $ | 11,128 | ||
Note 7 – Leases
The Company’s subsidiary, Bank of Stanly, had a noncancelable operating lease for a branch location in Albemarle that expired in 2008, with annual rental payments of $18,575. The lease has one five year renewal option at the expiration of the initial term. Bank of Stanly elected to go into a month to month lease and entered into an agreement to purchase the building for $300,000 in 2009. The lease payment remained the same during the finalization of the purchase. Bank of Stanly has also entered into a noncancelable operating lease for a branch location in Locust that expires in 2010 with annual rental payments of $41,856. The Company’s subsidiary, Cabarrus Bank and Trust has entered into a noncancelable operating lease for an administrative office location in Concord that expires in 2017 with annual rental payments of $59,850. The lease has two five year renewal options at the expiration of the initial term.
Future minimum lease payments under these leases for years subsequent to December 31, 2009 are as follows:
| Year ending December 31, | |||
| (dollars in thousands) | |||
| 2010 |
$ | 95 | |
| 2011 |
60 | ||
| 2012 |
60 | ||
| 2013 |
60 | ||
| 2014 |
60 | ||
| Thereafter |
159 | ||
| Total |
$ | 494 | |
Total rental expense related to the operating leases was $106,350, $120,281, and $76,449 for the years ended December 31, 2009, 2008 and 2007 respectively, and is included in occupancy expense.
56
UWHARRIE CAPITAL CORP AND SUBSIDIARIES
Notes to Consolidated Financial Statements
Note 8 – Deposits
The composition of deposits at December 31, 2009 and 2008 is as follows:
| 2009 | 2008 | |||||||||||
| Amount | Percentage of Total |
Amount | Percentage of Total |
|||||||||
| (dollars in thousands) | ||||||||||||
| Demand deposits |
$ | 44,924 | 12 | % | $ | 46,032 | 13 | % | ||||
| Interest checking and money market |
137,708 | 37 | % | 117,325 | 33 | % | ||||||
| Savings |
32,120 | 8 | % | 26,360 | 8 | % | ||||||
| Time deposits $100,000 and over |
64,736 | 17 | % | 63,321 | 18 | % | ||||||
| Other time deposits |
97,286 | 26 | % | 100,589 | 28 | % | ||||||
| Total |
$ | 376,774 | 100 | % | $ | 353,627 | 100 | % | ||||
The maturities of fixed-rate time deposits at December 31, 2009 are reflected in the table below:
| Year ending December 31, |
Time Deposits $100,000 and Over |
Other Time Deposits | ||||
| (dollars in thousands) | ||||||
| 2010 |
$ | 53,500 | $ | 78,857 | ||
| 2011 |
9,583 | 15,676 | ||||
| 2012 |
1,044 | 1,659 | ||||
| 2013 |
507 | 494 | ||||
| 2014 |
102 | 590 | ||||
| Thereafter |
— | 10 | ||||
| Total |
$ | 64,736 | $ | 97,286 | ||
57
UWHARRIE CAPITAL CORP AND SUBSIDIARIES
Notes to Consolidated Financial Statements
Note 9 – Short-Term Borrowed Funds
The following tables set forth certain information regarding the amounts, year-end weighted average rates, average balances, weighted average rate, and maximum month-end balances for short-term borrowed funds, at and during 2009 and 2008
| 2009 | 2008 | |||||||||||
| Amount | Rate | Amount | Rate | |||||||||
| (dollars in thousands) | ||||||||||||
| At year-end |
||||||||||||
| Federal funds purchased |
$ | — | 0.00 | % | $ | — | 0.00 | % | ||||
| Securities sold under repurchase agreements |
— | 0.00 | % | 1,463 | 0.92 | % | ||||||
| Master notes |
11,482 | 0.50 | % | 8,903 | 1.00 | % | ||||||
| Notes payable |
58 | 3.80 | % | 8 | 6.00 | % | ||||||
| Short-term line of credit |
— | 0.00 | % | 2,600 | 2.25 | % | ||||||
| Short-term advances from FHLB |
15,400 | 0.36 | % | 9,275 | 0.46 | % | ||||||
| $ | 26,940 | 0.42 | % | $ | 22,249 | 0.92 | % | |||||
| 2009 | 2008 | |||||||||||
| Amount | Rate | Amount | Rate | |||||||||
| (dollars in thousands) | ||||||||||||
| Average for the year |
||||||||||||
| Federal funds purchased |
$ | 273 | 1.05 | % | $ | 1,245 | 2.93 | % | ||||
| Securities sold under repurchase agreements |
669 | 0.89 | % | 1,354 | 1.37 | % | ||||||
| Master notes |
11,298 | 0.83 | % | 8,882 | 1.36 | % | ||||||
| Notes payable |
56 | 3.25 | % | 8 | 6.00 | % | ||||||
| Short-term line of credit |
724 | 1.68 | % | 703 | 3.18 | % | ||||||
| Short-term advances from FHLB |
11,401 | 1.70 | % | 7,278 | 4.46 | % | ||||||
| $ | 24,421 | 1.29 | % | $ | 19,470 | 2.72 | % | |||||
| 2009 | 2008 | |||||
| (dollars in thousands) | ||||||
| Maximum month-end balance |
||||||
| Federal funds purchased |
$ | 1,250 | $ | 6,050 | ||
| Securities sold under repurchase agreements |
1,740 | 1,752 | ||||
| Master notes |
12,559 | 11,657 | ||||
| Notes payable |
58 | 8 | ||||
| Short-term line of credit |
2,600 | 6,600 | ||||
| Short-term advances from FHLB |
24,275 | 14,000 | ||||
Federal funds purchased represent unsecured overnight borrowings from other financial institutions. Securities sold under repurchase agreements represent short-term borrowings collateralized by securities of the United States government or its agencies. Master notes represent an overnight investment in commercial paper issued by the Company to customers of its subsidiary banks, where an agreement is in place.
On September 25, 2007, the Company borrowed $6.6 million from a bank at an interest rate of prime less one percent. During 2008 principal payments were made on this note in the amount of $4.0 million. The remaining balance of $2.6 million was paid off during 2009.
58
UWHARRIE CAPITAL CORP AND SUBSIDIARIES
Notes to Consolidated Financial Statements
Note 9 – Short-Term Borrowed Funds (Continued)
The subsidiary banks have combined available lines of credit for federal funds in the amount of $18.8 million at December 31, 2009.
Note 10 – Long-Term Debt
The Company has a line of credit with the Federal Home Loan Bank secured by qualifying first lien and second mortgage loans, commercial real estate loans and investment securities with eligible collateral value of $79.6 million at December 31, 2009. The long-term advances under this line amounted to $19.0 million and $25.0 million at December 31, 2009 and 2008, respectively. Interest rates ranged from 1.57% to 5.50% in 2009 and from 2.96% to 7.52% in 2008. Two subsidiary banks also have standby letters of credit issued by the Federal Home Loan Bank to be used as collateral for public funds deposits. The amount of the letters of credit was $10.0 million at December 31, 2009.
During the second and third quarters of 2008, the Company began a private placement of up to 7,500 fixed rate junior subordinated debt securities at $1,000 per security with a required minimum investment of $50,000. These securities may be redeemed by the Company after June 30, 2010 and the final maturity date is June 30, 2015. The junior subordinated debt pays interest quarterly at an annual fixed rate of 5.75%. The proceeds of this private placement qualify and are included in the calculation of Tier 2 capital. At the end of the offering period the Company had raised $7.4 million that was outstanding at December 31, 2009.
On November 19, 2002, the Company executed a mortgage in the amount of $129,000 for the purchase of property for branch expansion. This loan bears interest at 6.00% and is to be paid in 60 quarterly installments of $3,277. The outstanding principal balance on this note was $82,781 at December 31, 2009.
On May 13, 2009, the Company executed a note payable in the amount of $200,000 for the purchase of existing leased office space. The note bears interest at 3.43% and is to be paid in four equal annual payments of $50,000. The outstanding balance of this note was $200,000 at December 31, 2009.
As of December 31, 2009, the scheduled maturities of these advances and notes payable are as follows:
| Year ending December 31, | |||
| (dollars in thousands) | |||
| 2011 |
$ | 10,059 | |
| 2012 |
3,059 | ||
| 2013 |
4,560 | ||
| 2014 |
1,510 | ||
| 2015 |
7,430 | ||
| Thereafter |
25 | ||
| Total |
$ | 26,643 | |
59
UWHARRIE CAPITAL CORP AND SUBSIDIARIES
Notes to Consolidated Financial Statements
Note 11 – Income Tax Matters
The significant components of income tax expense for the years ended December 31 are summarized as follows:
| 2009 | 2008 | 2007 | |||||||||
| (dollars in thousands) | |||||||||||
| Current tax expense: |
|||||||||||
| Federal |
$ | 428 | $ | 1,225 | $ | 844 | |||||
| State |
146 | 307 | 238 | ||||||||
| Total |
574 | 1,532 | 1,082 | ||||||||
| Deferred tax expense: |
|||||||||||
| Federal |
(620 | ) | (607 | ) | 198 | ||||||
| State |
(117 | ) | (121 | ) | 7 | ||||||
| Total |
(737 | ) | (728 | ) | 205 | ||||||
| Net provision for income taxes |
$ | (163 | ) | $ | 804 | $ | 1,287 | ||||
The difference between the provision for income taxes and the amounts computed by applying the statutory federal income tax rate of 34% to income before income taxes is summarized below:
| 2009 | 2008 | 2007 | ||||||||||
| (dollars in thousands) | ||||||||||||
| Tax computed at the statutory federal rate |
$ | 179 | $ | 963 | $ | 1,443 | ||||||
| Increases (decrease) resulting from: |
||||||||||||
| Tax exempt interest, net |
(269 | ) | (267 | ) | (245 | ) | ||||||
| State income taxes, net of federal benefit |
19 | 123 | 162 | |||||||||
| Other |
(92 | ) | (15 | ) | (73 | ) | ||||||
| Provision for income taxes |
$ | (163 | ) | $ | 804 | $ | 1,287 | |||||
Deferred income taxes reflect the net tax effects of temporary differences between the carrying amounts of assets and liabilities for financial reporting purposes and the amounts used for income tax purposes. Significant components of deferred taxes at December 31 are as follows:
60
UWHARRIE CAPITAL CORP AND SUBSIDIARIES
Notes to Consolidated Financial Statements
Note 11 – Income Tax Matters (Continued)
| 2009 | 2008 | 2007 | ||||||||||
| (dollars in thousands) | ||||||||||||
| Deferred tax assets relating to: |
||||||||||||
| Net unrealized loss on securities available for sale |
$ | — | $ | 979 | $ | — | ||||||
| Allowance for loan losses |
1,772 | 1,305 | 935 | |||||||||
| Deferred compensation |
635 | 494 | 357 | |||||||||
| Other |
462 | 126 | (10 | ) | ||||||||
| Total deferred tax assets |
2,869 | 2,904 | 1,282 | |||||||||
| Deferred tax liabilities relating to: |
||||||||||||
| Net unrealized gain on securities available for sale |
(613 | ) | — | (241 | ) | |||||||
| Premises and equipment |
(371 | ) | (301 | ) | (369 | ) | ||||||
| Deferred loans fees and costs |
(214 | ) | (213 | ) | (213 | ) | ||||||
| Loan servicing |
(158 | ) | (41 | ) | (78 | ) | ||||||
| Prepaid expenses |
(157 | ) | (138 | ) | (110 | ) | ||||||
| Other |
— | — | (8 | ) | ||||||||
| Total deferred tax liabilities |
(1,513 | ) | (693 | ) | (1,019 | ) | ||||||
| Net recorded deferred tax asset |
$ | 1,356 | $ | 2,211 | $ | 263 | ||||||
The net deferred tax asset is included in other assets on the accompanying consolidated balance sheets.
Note 12 – Commitments and Contingencies
Financial Instruments with Off-Balance Sheet Risk
The subsidiary banks are parties to financial instruments with off-balance sheet risk in the normal course of business to meet the financing needs of their customers. These financial instruments include commitments to extend credit, lines of credit and standby letters of credit. These instruments involve elements of credit risk in excess of amounts recognized in the accompanying financial statements.
The subsidiary banks’ risks of loss with the unfunded loans and lines of credit or standby letters of credit are represented by the contractual amount of these instruments. The Banks use the same credit policies in making commitments under such instruments as they do for on-balance sheet instruments. The amount of collateral obtained, if any, is based on management’s credit evaluation of the borrower. Collateral held varies, but may include accounts receivable, inventory, real estate and time deposits with financial institutions. Since many of the commitments are expected to expire without being drawn upon, the total commitment amounts do not necessarily represent future cash requirements. Credit card commitments are unsecured.
As of December 31, 2009 and 2008, outstanding financial instruments whose contract amounts represent credit risk were as follows:
| 2009 | 2008 | |||||
| (dollars in thousands) | ||||||
| Commitments to extend credit |
$ | 91,648 | $ | 79,649 | ||
| Credit card commitments |
8,697 | 10,923 | ||||
| Standby letters of credit |
881 | 981 | ||||
| $ | 101,226 | $ | 91,553 | |||
61
UWHARRIE CAPITAL CORP AND SUBSIDIARIES
Notes to Consolidated Financial Statements
Note 12 – Commitments and Contingencies (Continued)
Contingencies
In the normal course of business, the Company is involved in various legal proceedings. In the opinion of management, any liability resulting from such proceedings would not have a material adverse effect on the consolidated financial statements.
During 2009, the Company had entered into a contract to construct the new Locust branch office. At of December 31, 2009, there was $894,000 remaining on the contract. The branch will be opening in 2010.
Financial Instruments with Concentration of Credit Risk
The bank subsidiaries make commercial, agricultural, real estate mortgage, home equity and consumer loans primarily in Stanly, Anson and Cabarrus counties. A substantial portion of the Company’s customers’ ability to honor their contracts is dependent on the economy in these counties.
Although the Company’s composition of loans is diversified, there is some concentration of mortgage loans in the total portfolio. The Banks’ Policy is to abide by real estate loan-to-value margin limits corresponding to guidelines issued by the federal supervisory agencies on March 19, 1993. Lending policy for all loans requires that they be supported by sufficient cash flows. Credit losses related to this real estate concentration are consistent with credit losses experienced in the portfolio as a whole.
Note 13 – Related Party Transactions
The Company has granted loans to certain directors and executive officers and their related interests. Such loans are made on substantially the same terms, including interest rates and collateral, as those prevailing at the time for comparable transactions with other borrowers and, in management’s opinion, do not involve more than the normal risk of collectibility. All loans to directors and executive officers or their interests are submitted to the Board of Directors for approval. A summary of loans to directors, executive officers and their related interests follows:
(dollars in thousands)
| Balance at December 31, 2008 |
$ | 15,449 | ||
| Disbursements during the year |
7,221 | |||
| Collections during the year |
(7,881 | ) | ||
| Balance at December 31, 2009 |
$ | 14,789 | ||
At December 31, 2009, the Company had approved, but unused lines of credit, totaling $6.4 million to executive officers, directors, officers and their related interests.
62
UWHARRIE CAPITAL CORP AND SUBSIDIARIES
Notes to Consolidated Financial Statements
Note 14 – Shareholders’ Equity and Regulatory Matters
The Company, and its bank subsidiaries, are subject to certain requirements imposed by state and federal banking statutes and regulations. These requirements, among other things, establish minimum levels of capital, restrict the amount of dividends that may be distributed, and require that reserves on deposit liabilities be maintained in the form of vault cash or deposits with the Federal Reserve Bank.
The Company and its subsidiary banks are subject to federal regulatory risk-based capital guidelines for banks and bank holding companies. Each must meet specific capital guidelines that involve quantitative measure of assets, liabilities, and certain off-balance-sheet items as calculated under regulatory accounting practices which measure Total and Tier 1 Capital to risk-weighted assets and Tier 1 Capital to average assets. Quantitative measures established by regulation to ensure capital adequacy and the Company’s consolidated capital ratios are set forth in the table below. The Company expects to meet or exceed these minimums without altering current operations or strategy.
| Actual | Minimum For Capital Requirement |
Minimum to Be Well Capitalized Under Prompt Corrective Action Provisions |
||||||||||||||||
| Amount | Ratio | Amount | Ratio | Amount | Ratio | |||||||||||||
| (Dollars in thousands) |
||||||||||||||||||
| December 31, 2009 |
||||||||||||||||||
| Total Capital to Risk |
||||||||||||||||||
| Weighted Assets: |
||||||||||||||||||
| Consolidated |
$ | 54,052 | 14.0 | % | $ | 30,908 | 8.0 | % | $ | 38,635 | 10.0 | % | ||||||
| Bank of Stanly |
32,980 | 12.9 | % | 20,413 | 8.0 | % | 25,516 | 10.0 | % | |||||||||
| Anson Bank and Trust |
5,278 | 13.3 | % | 3,165 | 8.0 | % | 3,956 | 10.0 | % | |||||||||
| Cabarrus Bank and Trust |
12,260 | 13.8 | % | 7,120 | 8.0 | % | 8,901 | 10.0 | % | |||||||||
| Tier I Capital to Risk |
||||||||||||||||||
| Weighted Assets: |
||||||||||||||||||
| Consolidated |
42,024 | 10.9 | % | 15,454 | 4.0 | % | 23,181 | 6.0 | % | |||||||||
| Bank of Stanly |
29,782 | 11.7 | % | 10,206 | 4.0 | % | 15,310 | 6.0 | % | |||||||||
| Anson Bank and Trust |
4,795 | 12.1 | % | 1,582 | 4.0 | % | 2,374 | 6.0 | % | |||||||||
| Cabarrus Bank and Trust |
11,332 | 12.7 | % | 3,560 | 4.0 | % | 5,340 | 6.0 | % | |||||||||
| Tier I Capital to |
||||||||||||||||||
| Average Assets: |
||||||||||||||||||
| Consolidated |
42,204 | 8.8 | % | 19,086 | 4.0 | % | 23,857 | 5.0 | % | |||||||||
| Bank of Stanly |
29,782 | 9.4 | % | 12,709 | 4.0 | % | 15,887 | 5.0 | % | |||||||||
| Anson Bank and Trust |
4,795 | 8.8 | % | 2,171 | 4.0 | % | 2,714 | 5.0 | % | |||||||||
| Cabarrus Bank and Trust |
11,322 | 10.9 | % | 4,161 | 4.0 | % | 5,201 | 5.0 | % | |||||||||
63
UWHARRIE CAPITAL CORP AND SUBSIDIARIES
Notes to Consolidated Financial Statements
Note 14 – Shareholders’ Equity and Regulatory Matters (Continued)
| December 31, 2008 |
||||||||||||||||||
| Total Capital to Risk |
||||||||||||||||||
| Weighted Assets: |
||||||||||||||||||
| Consolidated |
$ | 53,368 | 14.4 | % | $ | 29,626 | 8.0 | % | $ | 37,033 | 10.0 | % | ||||||
| Bank of Stanly |
33,357 | 13.1 | % | 20,349 | 8.0 | % | 25,436 | 10.0 | % | |||||||||
| Anson Bank and Trust |
4,477 | 12.5 | % | 2,864 | 8.0 | % | 3,580 | 10.0 | % | |||||||||
| Cabarrus Bank and Trust |
12,170 | 15.4 | % | 6,327 | 8.0 | % | 7,908 | 10.0 | % | |||||||||
| Tier I Capital to Risk |
||||||||||||||||||
| Weighted Assets: |
||||||||||||||||||
| Consolidated |
41,736 | 11.3 | % | 14,813 | 4.0 | % | 22,220 | 6.0 | % | |||||||||
| Bank of Stanly |
30,176 | 11.9 | % | 10,174 | 4.0 | % | 15,261 | 6.0 | % | |||||||||
| Anson Bank and Trust |
4,061 | 11.3 | % | 1,432 | 4.0 | % | 2,148 | 6.0 | % | |||||||||
| Cabarrus Bank and Trust |
11,554 | 14.6 | % | 3,163 | 4.0 | % | 4,745 | 6.0 | % | |||||||||
| Tier I Capital to |
||||||||||||||||||
| Average Assets: |
||||||||||||||||||
| Consolidated |
41,736 | 9.5 | % | 17,519 | 4.0 | % | 21,899 | 5.0 | % | |||||||||
| Bank of Stanly |
30,176 | 10.1 | % | 11,901 | 4.0 | % | 14,876 | 5.0 | % | |||||||||
| Anson Bank and Trust |
4,061 | 8.6 | % | 1,892 | 4.0 | % | 2,365 | 5.0 | % | |||||||||
| Cabarrus Bank and Trust |
11,554 | 13.3 | % | 3,471 | 4.0 | % | 4,339 | 5.0 | % | |||||||||
As of December 31, 2009, the most recent notification from the Federal Deposit Insurance Corporation categorized all subsidiary banks as being well capitalized under the regulatory framework for prompt corrective action. There have been no conditions or events since such notification that management believes would have changed the categorizations.
On December 23, 2008, the Company entered into a letter agreement with the United States Department of Treasury to sell 10,000 shares of Fixed Rate Cumulative Perpetual Preferred Stock, Series A (the “Senior Preferred”) with a redemption value of $10.0 million. The Company also issued a warrant to the Treasury that was immediately exercised for 500 shares of Fixed Rate Cumulative Perpetual Preferred Stock, Series B (the “Warrant Preferred”) with redemption value of $500,000. Combined proceeds received for the issuance of both the Senior Preferred and the Warrant Preferred was $10.0 million, resulting in a net discount that has been allocated between the two issues based upon their relative fair values. As a condition of the Cumulative Perpetual Preferred Stock, the Company must obtain consent from the United States Department of the Treasury to repurchase its common stock or to pay a cash dividend. Furthermore, the Company has agreed to certain restrictions on executive compensation.
The Senior Preferred qualifies as Tier 1 capital and will pay cumulative dividends at a rate of 5% per year, for the first five years, and 9% per year thereafter. Under the terms of the agreement, the Senior Preferred may be redeemed with prior approval from the Federal Reserve in the first three years with the proceeds from the issuance of certain qualifying Tier 1 capital or after three years at par value plus accrued and unpaid dividends.
The Warrant Preferred also qualifies as Tier 1 capital and will pay cumulative dividends at a rate of 9% per year. Under the terms of the agreement, the Warrant Preferred may be redeemed after the Senior Preferred has been completely redeemed, at par value plus accrued and unpaid dividends. It is the Company’s intention to redeem both issues of preferred stock no later than the fifth anniversary of its issuance. Accordingly, the net discount of $500,000 is going to be amortized over five years. At December 31, 2009 the remaining discount was $400,000.
64
UWHARRIE CAPITAL CORP AND SUBSIDIARIES
Notes to Consolidated Financial Statements
Note 14 – Shareholders’ Equity and Regulatory Matters (Continued)
On December 31, 2008, the Company entered into agreements with its subsidiary banks to sell Fixed Rate Noncumulative Perpetual Preferred Stock to the Company to provide an avenue for pushing portions of the funds received from Company’s issuance of preferred stock down to the subsidiary bank level. At December 31, 2009, Uwharrie Capital Corp had invested $3.0 million in Stanly, $1.0 million in Anson and $3.0 million in Cabarrus.
All of the Company’s aforementioned investments in its subsidiary banks qualify for Tier 1 capital treatment and are included as such in their respective year end capital ratios.
For the reserve maintenance period in effect at December 31, 2009, the subsidiary banks were required to maintain reserve balances in cash or on deposit with the Federal Reserve Bank in the aggregate amount of $1.1 million as reserves on deposit liabilities.
Note 15 – Stock Matters
During 1996, the Company adopted the 1996 Incentive Stock Option Plan (“SOP”) and the Employee Stock Purchase Plan (“SPP”), under which options to purchase shares of the Company’s common stock may be granted to officers and eligible employees. Options granted under the SOP are exercisable in established increments according to vesting schedules, generally three to five years, and will expire if not exercised within ten years of the date of grant. Options granted under the SPP are fully vested at the date of grant and expire if not exercised within two years of the grant date. Both of these plans expired in 2006. At December 31, 2009, the SOP had 268,355 shares still outstanding and the SPP had no options outstanding.
During 2006, the Company adopted the 2006 Incentive Stock Option Plan (“SOP II”) and the Employee Stock Purchase Plan (“SPP II”), under which options to purchase shares of the Company’s common stock may be granted to officers and eligible employees. Options granted under the SOP II are exercisable in established increments according to vesting schedules, generally three to five years, and will expire if not exercised within ten years of the date of grant. Options granted under the SPP II are fully vested at the date of grant and expire if not exercised within two years of the grant date. At December 31, 2009, the SOP II had 12,360 shares outstanding and the SPP II had no options outstanding.
Employee Stock Plans
Activity under all option plans, reflecting the effects of the 3% stock dividends issued in 2008 and 2007, are as follows:
| 2009 | 2008 | 2007 | ||||||||||||||||
| Number of Shares |
Weighted Average Exercise Price |
Number of Shares |
Weighted Average Exercise Price |
Number of Shares |
Weighted Average Exercise Price | |||||||||||||
| Options outstanding at the beginning of the year |
459,856 | $ | 4.54 | 519,328 | $ | 4.47 | 551,613 | $ | 4.46 | |||||||||
| Options granted |
— | — | 12,360 | 5.34 | — | — | ||||||||||||
| Options exercised |
— | — | (71,824 | ) | 4.19 | (13,538 | ) | 2.66 | ||||||||||
| Forfeitures |
(179,141 | ) | 4.22 | (8 | ) | 4.28 | (18,747 | ) | 5.30 | |||||||||
| Options outstanding at the end of the year |
280,715 | $ | 4.75 | 459,856 | $ | 4.54 | 519,328 | $ | 4.48 | |||||||||
| Options exercisable at the end of the year |
270,827 | $ | 4.73 | 431,470 | $ | 4.49 | 487,281 | $ | 4.42 | |||||||||
65
UWHARRIE CAPITAL CORP AND SUBSIDIARIES
Notes to Consolidated Financial Statements
Note 15 – Stock Matters (Continued)
At December 31, 2009, total options outstanding at December 31, 2009 included 280,715 options exercisable at a range of $4.21 to $5.35 per share with a weighted average expected term of 2.92 years. Exercisable options at December 31, 2009 included 270,827 options exercisable at a range of $4.21 to $5.35 per share. At December 31, 2009, authorized shares of common stock reserved for future grants of options totaled 154,971 under the SOP II, and 103,234 under the SPP II.
The fair market value of each option award is estimated on the date of grant using the Black-Scholes option pricing model. There were no shares granted during the twelve months ended December 31, 2009 under the SOP II. There were 12,360 shares granted in 2008.
The following is a summary of stock option activity for the year ended December 31, 2009:
| Shares | Weighted Average Exercise Price |
Aggregate Intrinsic Value (in thousands) | |||||||
| Outstanding at December 31, 2008 |
459,856 | $ | 4.54 | ||||||
| Granted |
— | ||||||||
| Exercised |
— | ||||||||
| Forfeited |
(179,141 | ) | 4.22 | ||||||
| Outstanding at December 31, 2009 |
280,715 | 4.75 | $ | — | |||||
| Options exercisable at December 31, 2009 |
270,827 | 4.73 | — | ||||||
A summary of the status of the Company’s non-vested stock options as of December 31, 2009, and changes during the year then ended is presented below:
| Shares | Weighted Average Grant Date Fair Value | |||||
| Non-vested December 31, 2008 |
28,386 | $ | 1.49 | |||
| Granted |
— | — | ||||
| Vested |
(18,498 | ) | 1.43 | |||
| Forfeited |
— | — | ||||
| Non-vested December 31, 2009 |
9,888 | 1.60 | ||||
The grant date fair value of stock options vested over the twelve months ended December 31, 2009, 2008 and 2007 was $26,438, $22,478 and $42,231 respectively.
As of December 31, 2009, there was $11,590 of total unrecognized compensation cost related to non-vested share-based compensation arrangements granted under all of the Company’s stock benefit plans. That cost is expected to be recognized over a weighted-average period of 3.3 years.
The Company funds the option shares from authorized but unissued shares. The Company does not typically purchase shares to fulfill the obligations of the stock benefit plans. Company policy does allow option holders to exercise options with seasoned shares.
For the twelve months ended December 31, 2008 and 2007 the intrinsic value of options exercised was $74,409 and $38,055, respectively. There were no options exercised in 2009.
66
UWHARRIE CAPITAL CORP AND SUBSIDIARIES
Notes to Consolidated Financial Statements
Note 15 – Stock Matters (Continued)
Stock Repurchase Program
On February 21, 1995, the Company’s Board of Directors authorized and approved a Stock Repurchase Program, to be reaffirmed annually, pursuant to which the Company may repurchase shares of the Company’s common stock for the primary purpose of providing liquidity to its shareholders. Pursuant to stock repurchase authorizations and limitations, the Company purchased 111,258 shares during 2008 at an aggregate purchase price of $570,839. There were no shares repurchased during 2009.
Note 16 – Employee and Director Benefit Plans
Employees’ Savings Plus and Profit Sharing Plan
The Company has established an associate tax deferred savings plan under Section 401(k) of the Internal Revenue Code of 1986. All associates who are scheduled to work 500 hours or more are eligible to participate upon completion of six months of employment.
The Company’s annual contribution to the plan was $210,884 in 2009, $206,478 in 2008 and $192,776 in 2007, determined as follows:
| • | A matching contribution equivalent to 50% of the first 6% of each associate’s compensation contributed to the plan. |
| • | A discretionary contribution, subject to approval by the Board of Directors, limited to an amount not to exceed the maximum amount deductible for income tax purposes. |
Directors’ Deferred Compensation Plan
On March 1, 1994, the Company established a Directors’ Deferred Compensation Plan in accordance with the laws of the State of North Carolina under which each Director could elect to defer receipt for services rendered to the Company as a Director during the term of his or her service by entering into a written deferred compensation election. This plan was closed to new participants in 2001; subsequently, only two directors continued to defer receipt of fees in 2007 and one director continued in 2008. The balance in deferred directors’ compensation, not yet disbursed, was $165,487 at December 31, 2008. The plan has now been terminated and all funds have been disbursed. Expense for the years ended December 31, 2009, 2008 and 2007 was $12,078, $12,298 and $12,956, respectively.
Employee Stock Ownership Plan
The Company established an Employee Stock Ownership Plan (“ESOP”) to benefit all qualified employees. The ESOP purchased 293,216 dividend adjusted shares of common stock in 1999 with proceeds received from a loan of $1.2 million from the Company. The loan is to be repaid over eighteen years with interest at 8%. The loan may be prepaid without penalty. The unallocated shares of stock held by the ESOP are pledged as collateral for the loan. The ESOP is funded by contributions made by the Company and its subsidiaries in amounts sufficient to retire the debt. At December 31, 2009, the outstanding balance of the loan is $666,636 and is presented as a reduction of shareholders’ equity.
67
UWHARRIE CAPITAL CORP AND SUBSIDIARIES
Notes to Consolidated Financial Statements
Note 16 – Employee and Director Benefit Plans (Continued)
Shares released as the debt is repaid and earnings from the common stock held by the ESOP are allocated among active participants on the basis of compensation in the year of allocation. Benefits vest 100% as they are allocated to participants. Dividends on unallocated shares may be used by the ESOP to repay the loan to the Company and are not reported as dividends in the financial statements. Dividends on allocated or committed to be allocated shares are credited to the accounts of the participants and reported as dividends in the consolidated financial statements.
Expenses of $350,068, $326,633 and $317,256 during the years ended December 31, 2009, 2008 and 2007, respectively, have been incurred in connection with the ESOP. At December 31, 2009, 333,353 shares held by the ESOP, including additional shares purchased, have been released or committed to be released to the ESOP’s participants for purposes of computing earnings per share. The fair value of the unallocated shares amounted to approximately $525,676 at December 31, 2009.
Supplemental Executive Retirement Plan
The Company has implemented a non-qualifying deferred compensation plan for certain executive officers. Certain of the plan benefits will accrue and vest during the period of employment, and will be paid in fixed monthly benefit payments for up to ten years commencing with the officer’s retirement at any time after attainment of the age specified in the officer’s plan agreement. The plan also provides for payment of death benefits and for payment of disability benefits in the event the officer becomes permanently disabled prior to attainment of retirement age.
Effective December 31, 2008, this plan was amended and restated to comply with Section 409A of the Internal Revenue Code. The participants’ account liability balances as of December 31, 2008 could be transferred into a trust fund, where investments will be participant-directed. The plan is structured as a defined contribution plan and the Company’s expected annual funding contribution for the participants has been calculated through the participant’s expected retirement date. Under terms of the agreement, the Company has reserved the absolute right, at its sole discretion, to either fund or refrain from funding the plan. The plan also provides for payment of death benefits and for payment of disability benefits in the event the officer becomes permanently disabled prior to attainment of retirement age.
During 2009, 2008 and 2007 a provision of $500,800, $383,800 and $199,328, respectively, was expensed for future benefits to be provided under the plan. The liability accrued for compensation deferred under the plan amounts to $2.0 million and $1.5 million at December 31, 2009 and 2008, respectively.
Split-Dollar Life Insurance
The Company has entered into Life Insurance Endorsement Method Split-Dollar Agreements with certain officers. Under these agreements, upon death of the officer, the Company first recovers the cash surrender value of the contract and then shares the remaining death benefits from insurance contracts, which are written with different carriers, with the designated beneficiaries of the officers. The death benefit to the officers’ beneficiaries is a multiple of base salary at the time of the agreements. The Company, as owner of the policies, retains an interest in the life insurance proceeds and a 100% interest in the cash surrender value of the policies. During 2009 and 2008, the expense associated with these policies was $35,829 and $64,130, respectively.
68
UWHARRIE CAPITAL CORP AND SUBSIDIARIES
Notes to Consolidated Financial Statements
Note 17 – Fair Values of Financial Instruments and Interest Rate Risk
ASC 825, “Disclosures about Fair Value of Financial Instruments,” requires disclosure of the fair value of financial assets and financial liabilities, including those that are not measured and reported at fair value on a recurring basis or non-recurring basis.
The fair value estimates presented below are made at December 31, based on relevant market information and information about the financial instruments. Fair value estimates are intended to represent the price an asset could be sold at or the price a liability could be settled for. However, given there is no active market or observable market transactions for many of the Company’s financial instruments, the Company has made estimates of many of these fair values which are subjective in nature, involve uncertainties and matters of significant judgment and therefore cannot be determined with precision. Changes in assumptions could significantly affect the estimated values. The estimated fair values disclosed in the following table do not represent market values of all assets and liabilities of the Company and should not be interpreted to represent the underlying value of the Company. The following table reflects a comparison of carrying amounts and the estimated fair value of the financial instruments as of December 31, 2009 and 2008.
| 2009 | 2008 | |||||||||||
| Carrying Amount |
Estimated Fair Value |
Carrying Amount |
Estimated Fair Value | |||||||||
| (dollars in thousands) | ||||||||||||
| Financial Assets |
||||||||||||
| Cash and cash equivalents |
$ | 10,859 | $ | 10,896 | $ | 13,284 | $ | 13,284 | ||||
| Securities available for sale |
76,317 | 76,317 | 68,835 | 68,835 | ||||||||
| Loans held for investment, net |
348,453 | 363,619 | 336,469 | 354,083 | ||||||||
| Loans held for sale |
2,628 | 2,634 | 2,691 | 2,691 | ||||||||
| FHLB Stock |
3,201 | 3,201 | 2,284 | 2,284 | ||||||||
| Bank-owned life insurance |
5,714 | 5,714 | 5,511 | 5,511 | ||||||||
| Accrued interest receivables |
2,077 | 2,077 | 2,027 | 2,027 | ||||||||
| Financial Liabilities |
||||||||||||
| Deposits |
$ | 376,774 | $ | 400,997 | $ | 353,627 | $ | 354,589 | ||||
| Short-term borrowings |
26,940 | 26,940 | 22,249 | 22,249 | ||||||||
| Long-term debt |
26,643 | 28,173 | 32,502 | 33,306 | ||||||||
| Accrued interest payable |
396 | 396 | 502 | 502 | ||||||||
The carrying amount of cash and cash equivalents and accrued interest approximate their fair values due to the short period of time until their expected realization. Securities available for sale are carried at fair value based on quoted market prices. See Note 2. The carrying amount of bank-owned life insurance is the current cash value. It is not practicable to determine fair value of Federal Home Loan Bank stock due to restrictions placed on its transferability and it is presented at its carrying value.
The following methods and assumptions were used by the Company in estimating the fair value of the financial instruments:
| • | Loans – The fair value of loans is estimated based on discounted expected cash flows using the current interest rates at which similar loans would be made. Loans held for sale, which represent current mortgage production forward sales not yet delivered, are valued based on current market prices. The fair value of loans held for investment does not consider the lack of liquidity and uncertainty in the market that would affect the valuation under ASC 820. |
69
UWHARRIE CAPITAL CORP AND SUBSIDIARIES
Notes to Consolidated Financial Statements
Note 17 – Fair Values of Financial Instruments and Interest Rate Risk (Continued)
| • | Deposits – The fair value of checking, savings and money market deposit is deemed equal to the amount payable on demand. The fair value of certificates of deposit is estimated based on discounted cash flow analyses using offered market rates. |
| • | Borrowings – The fair value disclosed for short-term borrowings, which are composed of overnight borrowings and debt due within one year approximate the carrying value for such debt. The estimated fair value for long-term borrowings are estimated based on discounted cash flow analyses using offered market rates. |
At December 31, 2009, the subsidiary banks had outstanding standby letters of credit and commitments to extend credit. These off-balance sheet financial instruments are generally exercisable at the market rate prevailing at the date the underlying transaction will be completed; therefore, they were deemed to have no current fair value. See Note 12.
The following table provides fair value information for assets and liabilities measured at fair value on a recurring basis as of December 31, 2009 and 2008:
| December 31, 2009 (dollars in thousands) | ||||||||||||
| Total | Level 1 | Level 2 | Level 3 | |||||||||
| Securities available for sale: |
||||||||||||
| US Treasury |
$ | 3,019 | $ | 3,019 | $ | — | $ | — | ||||
| US Gov’t |
20,971 | 20,971 | — | — | ||||||||
| Mortgage-backed securities and CMO’s |
35,242 | — | 35,242 | — | ||||||||
| Private label CMO’s |
7,500 | — | 7,500 | — | ||||||||
| State and political subdivisions |
9,585 | — | 9,585 | — | ||||||||
| Total assets at fair value |
$ | 76,317 | $ | 23,990 | $ | 52,327 | $ | — | ||||
| Total liabilities at fair value |
$ | — | $ | — | $ | — | $ | — | ||||
| December 31, 2008 (dollars in thousands) | ||||||||||||
| Total | Level 1 | Level 2 | Level 3 | |||||||||
| Securities available for sale: |
||||||||||||
| US Gov’t |
$ | 10,643 | $ | 10,643 | $ | — | $ | — | ||||
| Mortgage-backed securities and CMO’s |
33,615 | — | 33,615 | — | ||||||||
| Private label CMO’s |
7,781 | — | 7,593 | 188 | ||||||||
| State and political subdivisions |
16,796 | — | 16,796 | — | ||||||||
| Total assets at fair value |
$ | 68,835 | $ | 10,643 | $ | 58,004 | $ | 188 | ||||
| Total liabilities at fair value |
$ | — | $ | — | $ | — | $ | — | ||||
70
UWHARRIE CAPITAL CORP AND SUBSIDIARIES
Notes to Consolidated Financial Statements
Note 17 – Fair Values of Financial Instruments and Interest Rate Risk (Continued)
The following table provides reconciliation for all assets and liabilities measured at fair value on a recurring basis using significant unobservable inputs (level 3) during 2009:
(dollars in thousands)
| Balance December 31, 2008 |
$ | 188 | ||
| Total realized losses included in earnings |
(94 | ) | ||
| Sales |
(94 | ) | ||
| Transfers into level 3 |
3,667 | |||
| Write-down to market value |
(1,682 | ) | ||
| Transfers into level 2 |
(1,985 | ) | ||
| Balance at December 31, 2009 |
$ | — | ||
Investment securities available for sale having a Level 3 value of $188,111 at December 31, 2008 were disposed of during the first quarter of 2009 with an additional loss of $93,714.
Prices for US Treasury and government agency securities are readily available in the active markets in which those securities are traded, and the resulting fair values are shown in the ‘Level 1 input’ column. Prices for mortgage-backed securities and for state, county and municipal securities are obtained for similar securities, and the resulting fair values are shown in the ‘Level 2 input’ column. Prices for non-marketable investments are determined based on various assumptions that are not observable. The fair values for these investment securities are shown in the ‘Level 3 input’ column. Non-marketable investment securities, which are carried at their purchase price, include those that may only be redeemed by the issuer.
71
UWHARRIE CAPITAL CORP AND SUBSIDIARIES
Notes to Consolidated Financial Statements
Note 17 – Fair Values of Financial Instruments and Interest Rate Risk (Continued)
The Company may be required, from time to time, to measure certain assets at fair value on a nonrecurring basis in accordance with U.S. generally accepted accounting principles. These include assets that are measured at the lower of cost or market that were recognized at fair value below cost at the end of the period. Assets measured at fair value on a nonrecurring basis are included in the table below as of December 31, 2009 and December 31, 2008:
| December 31, 2009 (dollars in thousands) | ||||||||||||
| Total | Level 1 | Level 2 | Level 3 | |||||||||
| Loans |
$ | 13,519 | $ | — | $ | 13,519 | $ | — | ||||
| Loans held for sale |
2,628 | — | 2,628 | — | ||||||||
| Other real estate owned |
3,419 | — | 3,419 | — | ||||||||
| Mortgage servicing rights |
1,890 | — | — | 1,890 | ||||||||
| Total assets at fair value |
$ | 21,456 | $ | — | $ | 19,566 | $ | 1,890 | ||||
| Total liabilities at fair value |
$ | — | $ | — | $ | — | $ | — | ||||
| December 31, 2008 (dollars in thousands) | ||||||||||||
| Total | Level 1 | Level 2 | Level 3 | |||||||||
| Loans |
$ | 6,688 | $ | — | $ | 6,688 | $ | — | ||||
| Loans held for sale |
2,691 | — | 2,691 | — | ||||||||
| Mortgage servicing rights |
1,293 | — | — | 1,293 | ||||||||
| Total assets at fair value |
$ | 10,672 | $ | — | $ | 9,379 | $ | 1,293 | ||||
| Total liabilities at fair value |
$ | — | $ | — | $ | — | $ | — | ||||
ASC 825 allows an entity to elect to measure certain financial assets and liabilities at fair value with changes in fair value recognized in the income statement each period. The statement also requires additional disclosures to identify the effects of an entity’s fair value election on its earnings. Upon the adoption of ASC 825, the Company did not elect to report any assets and liabilities at fair value.
Interest Rate Risk
The Company assumes interest rate risk (the risk that general interest rate levels will change) in the course of its normal operations. As a result, fair values of the Company’s financial instruments will change when interest rate levels change and that change may be either favorable or unfavorable to the Company. Management attempts to match maturities of assets and liabilities to the extent believed necessary to minimize interest rate risk. However, borrowers with fixed rate obligations are more likely to prepay in a falling rate environment and less likely to prepay in a rising rate environment. Conversely, depositors who are receiving fixed rates are more likely to withdraw funds before maturity in a rising rate environment and less likely to do so in a falling rate environment. Management monitors rates and maturities of assets and liabilities and attempts to minimize interest rate risk by adjusting terms of new loans and deposits and by investing in securities with terms that mitigate the Company’s overall interest rate risk.
72
UWHARRIE CAPITAL CORP AND SUBSIDIARIES
Notes to Consolidated Financial Statements
Note 18 – Parent Company Financial Data
The following is a summary of the condensed financial statements of Uwharrie Capital Corp:
Condensed Balance Sheets
| December 31, | ||||||
| 2009 | 2008 | |||||
| (dollars in thousands) | ||||||
| Assets |
||||||
| Cash and demand deposits with bank subsidiaries |
$ | 408 | $ | 3,297 | ||
| Interest-earning deposits with bank subsidiaries |
12,030 | 10,157 | ||||
| Investments in: |
||||||
| Bank subsidiaries |
47,908 | 45,348 | ||||
| Nonbank subsidiaries |
358 | 331 | ||||
| Other assets |
2,556 | 1,387 | ||||
| Total assets |
$ | 63,260 | $ | 60,520 | ||
| Liabilities and shareholders’ equity |
||||||
| Master notes |
$ | 11,482 | $ | 8,903 | ||
| Long-term debt |
— | 2,600 | ||||
| Junior subordinated debentures |
7,419 | 7,419 | ||||
| Other liabilities |
335 | 365 | ||||
| Shareholders’ equity |
44,024 | 41,233 | ||||
| Total liabilities and shareholders’ equity |
$ | 63,260 | $ | 60,520 | ||
Condensed Statement of Operations
| 2009 | 2008 | 2007 | ||||||||||
| (dollars in thousands) | ||||||||||||
| Equity in earnings of subsidiaries |
$ | 1,260 | $ | 2,738 | $ | 3,734 | ||||||
| Interest income |
113 | 133 | 493 | |||||||||
| Management and service fees |
5,468 | 4,464 | 4,227 | |||||||||
| Other income |
91 | 94 | 119 | |||||||||
| Interest expense |
(533 | ) | (535 | ) | (1,029 | ) | ||||||
| Other operating expense |
(6,122 | ) | (5,230 | ) | (4,978 | ) | ||||||
| Income tax benefit |
413 | 365 | 393 | |||||||||
| Net income |
$ | 690 | $ | 2,029 | $ | 2,959 | ||||||
73
UWHARRIE CAPITAL CORP AND SUBSIDIARIES
Notes to Consolidated Financial Statements
Note 18 – Parent Company Financial Data (Continued)
Condensed Statements of Cash Flows
| 2009 | 2008 | 2007 | ||||||||||
| (dollars in thousands) | ||||||||||||
| Cash flows from operating activities |
||||||||||||
| Net income |
$ | 690 | $ | 2,029 | $ | 2,959 | ||||||
| Adjustments to reconcile net income to net cash |
||||||||||||
| Provided (used) by operating activities: |
||||||||||||
| Equity in earnings of subsidiaries |
(1,260 | ) | (2,738 | ) | (3,734 | ) | ||||||
| (Increase) decrease in other assets |
(753 | ) | (2,012 | ) | 618 | |||||||
| Increase (decrease) in other liabilities |
(30 | ) | (72 | ) | 304 | |||||||
| Net cash provided (used) by operating activities |
(1,353 | ) | (2,793 | ) | 147 | |||||||
| Cash flows from investing activities |
||||||||||||
| Dividends received from subsidiaries |
900 | 200 | 1,800 | |||||||||
| Net cash provided by investing activities |
900 | 200 | 1,800 | |||||||||
| Cash flows from financing activities |
||||||||||||
| Net increase (decrease) in master notes |
2,579 | (727 | ) | 3,022 | ||||||||
| Net increase (decrease) in long-term debt |
(2,600 | ) | (4,000 | ) | 4,600 | |||||||
| Net decrease in subordinated debentures |
— | — | (5,155 | ) | ||||||||
| Net proceeds from issuance of junior subordinated debentures |
— | 7,419 | — | |||||||||
| Repurchase of common stock |
— | (571 | ) | (1,404 | ) | |||||||
| Net proceeds from issuance of preferred stock |
— | 10,500 | — | |||||||||
| Proceeds from issuance of common stock |
— | 301 | 36 | |||||||||
| Preferred stock purchased from bank subsidiaries |
— | (7,000 | ) | — | ||||||||
| Dividends on preferred stock |
(542 | ) | (13 | ) | — | |||||||
| Tax benefit of stock options exercised |
— | 26 | 3 | |||||||||
| Cash paid for fractional shares |
— | (7 | ) | (9 | ) | |||||||
| Net cash provided (used) by financing activities |
(563 | ) | 5,928 | 1,093 | ||||||||
| Net increase (decrease) in cash and cash equivalents |
(1,016 | ) | 3,335 | 3,040 | ||||||||
| Cash and cash equivalents at beginning of period |
13,454 | 10,119 | 7,079 | |||||||||
| Cash and cash equivalents at end of period |
$ | 12,438 | $ | 13,454 | $ | 10,119 | ||||||
74
UWHARRIE CAPITAL CORP AND SUBSIDIARIES
Notes to Consolidated Financial Statements
Note 19 – Quarterly Financial Data
| First | Second | Third | Fourth | |||||||||||||
| (in thousands, except per share data) | ||||||||||||||||
| 2009 |
||||||||||||||||
| Interest income |
$ | 6,374 | $ | 6,182 | $ | 6,226 | $ | 6,280 | ||||||||
| Interest expense |
(2,087 | ) | (1,996 | ) | (1,929 | ) | (1,685 | ) | ||||||||
| Net interest income |
4,287 | 4,186 | 4,297 | 4,595 | ||||||||||||
| Provision for loan losses |
(372 | ) | (196 | ) | (295 | ) | (869 | ) | ||||||||
| Net interest income after provision for loan losses |
3,915 | 3,990 | 4,002 | 3,726 | ||||||||||||
| Noninterest income |
2,324 | 2,173 | 1,633 | (306 | ) | |||||||||||
| Noninterest expense |
(4,879 | ) | (5,281 | ) | (5,315 | ) | (5,455 | ) | ||||||||
| Income before taxes |
1,360 | 882 | 320 | (2,035 | ) | |||||||||||
| Income taxes |
455 | 259 | 30 | (907 | ) | |||||||||||
| Net income (loss) |
$ | 905 | $ | 623 | $ | 290 | $ | (1,128 | ) | |||||||
| Dividends on preferred stock |
(162 | ) | (160 | ) | (159 | ) | (161 | ) | ||||||||
| Net income (loss) available to common Shareholders |
$ | 743 | $ | 463 | $ | 131 | $ | (1,289 | ) | |||||||
| Net income (loss) per common share |
||||||||||||||||
| Basic |
$ | 0.10 | $ | 0.06 | $ | 0.02 | $ | (0.17 | ) | |||||||
| Diluted |
$ | 0.10 | $ | 0.06 | $ | 0.02 | $ | (0.17 | ) | |||||||
| First | Second | Third | Fourth | |||||||||||||
| (in thousands, except per share data) | ||||||||||||||||
| 2008 |
||||||||||||||||
| Interest income |
$ | 6,697 | $ | 6,382 | $ | 6,267 | $ | 6,218 | ||||||||
| Interest expense |
(2,804 | ) | (2,429 | ) | (2,347 | ) | (2,248 | ) | ||||||||
| Net interest income |
3,893 | 3,953 | 3,920 | 3,970 | ||||||||||||
| Provision for loan losses |
(86 | ) | (171 | ) | (529 | ) | (183 | ) | ||||||||
| Net interest income after provision for loan losses |
3,807 | 3,782 | 3,391 | 3,787 | ||||||||||||
| Noninterest income |
1,865 | 1,895 | 1,650 | 1,345 | ||||||||||||
| Noninterest expense |
(4,523 | ) | (4,532 | ) | (4,542 | ) | (5,092 | ) | ||||||||
| Income before taxes |
1,149 | 1,145 | 499 | 40 | ||||||||||||
| Income taxes |
374 | 373 | 156 | (99 | ) | |||||||||||
| Net income |
$ | 775 | $ | 772 | $ | 343 | $ | 139 | ||||||||
| Dividends on preferred stock |
— | — | — | (13 | ) | |||||||||||
| Net income available to common Shareholders |
$ | 775 | $ | 772 | $ | 343 | $ | 126 | ||||||||
| Net income per common share |
||||||||||||||||
| Basic |
$ | 0.10 | $ | 0.10 | $ | 0.05 | $ | 0.02 | ||||||||
| Diluted |
$ | 0.10 | $ | 0.10 | $ | 0.05 | $ | 0.02 | ||||||||
75
UWHARRIE CAPITAL CORP AND SUBSIDIARIES
Selected Financial Data
Selected Financial Data
(in thousands except per share and shares outstanding information)
| 2009 | 2008 | 2007 | 2006 | 2005 | ||||||||||||||||
| Summary of Operations |
||||||||||||||||||||
| Interest income |
$ | 25,062 | $ | 25,564 | $ | 26,909 | $ | 24,353 | $ | 19,161 | ||||||||||
| Interest expense |
7,697 | 9,828 | 11,876 | 10,702 | 6,630 | |||||||||||||||
| Net interest income |
17,365 | 15,736 | 15,033 | 13,651 | 12,531 | |||||||||||||||
| Provision for loan losses |
1,732 | 969 | 15 | 298 | 755 | |||||||||||||||
| Noninterest income |
5,824 | 6,597 | 6,590 | 5,469 | 4,351 | |||||||||||||||
| Noninterest expense |
20,930 | 18,531 | 17,362 | 15,918 | 14,087 | |||||||||||||||
| Income taxes |
(163 | ) | 804 | 1,287 | 833 | 523 | ||||||||||||||
| Net income |
$ | 690 | $ | 2,029 | $ | 2,959 | $ | 2,071 | $ | 1,517 | ||||||||||
| Per Common Share |
||||||||||||||||||||
| Net income - basic (1) |
$ | 0.01 | $ | 0.27 | $ | 0.39 | $ | 0.27 | $ | 0.19 | ||||||||||
| Net income - diluted (1) |
0.01 | 0.27 | 0.39 | 0.26 | 0.19 | |||||||||||||||
| Book value (1) |
4.47 | 4.11 | 4.14 | 3.76 | 3.51 | |||||||||||||||
| Weighted Average Shares |
||||||||||||||||||||
| Outstanding: |
||||||||||||||||||||
| Basic (1) |
7,474,140 | 7,482,488 | 7,603,494 | 7,685,978 | 7,683,316 | |||||||||||||||
| Diluted (1) |
7,474,140 | 7,520,484 | 7,706,832 | 7,802,102 | 7,870,576 | |||||||||||||||
| Ratios |
||||||||||||||||||||
| Return on average assets |
0.15 | % | 0.48 | % | 0.75 | % | 0.56 | % | 0.45 | % | ||||||||||
| Return on average equity |
1.60 | % | 6.29 | % | 9.73 | % | 7.32 | % | 5.58 | % | ||||||||||
| Average equity to average assets |
9.15 | % | 7.63 | % | 7.73 | % | 7.67 | % | 8.14 | % | ||||||||||
| Selected Year-end Balances |
||||||||||||||||||||
| Assets |
$ | 477,846 | $ | 452,468 | $ | 411,944 | $ | 383,261 | $ | 350,190 | ||||||||||
| Loans held for investment |
353,729 | 340,830 | 321,987 | 288,135 | 272,842 | |||||||||||||||
| Securities |
76,317 | 68,835 | 51,005 | 37,150 | 35,016 | |||||||||||||||
| Deposits |
376,774 | 353,627 | 324,657 | 309,600 | 273,976 | |||||||||||||||
| Borrowed funds |
53,583 | 54,751 | 53,619 | 42,329 | 47,007 | |||||||||||||||
| Shareholders’ equity |
44,024 | 41,233 | 31,574 | 29,633 | 27,453 | |||||||||||||||
| Selected Average Balances |
||||||||||||||||||||
| Assets |
$ | 471,729 | $ | 422,857 | $ | 393,188 | $ | 368,781 | $ | 334,193 | ||||||||||
| Loans held for investment |
346,976 | 335,791 | 308,149 | 293,394 | 267,164 | |||||||||||||||
| Securities |
78,049 | 48,926 | 41,188 | 35,227 | 29,038 | |||||||||||||||
| Deposits |
369,957 | 337,384 | 312,261 | 289,742 | 254,591 | |||||||||||||||
| Borrowed funds |
55,084 | 50,643 | 48,075 | 48,510 | 50,265 | |||||||||||||||
| Shareholders’ equity |
43,182 | 32,245 | 30,402 | 28,299 | 27,187 | |||||||||||||||
| (1) | Net income per share, book value per share, weighted average shares outstanding and shares outstanding at year-end for 2005 through 2008 have been adjusted to reflect 3% stock dividends issued in 2008, 2007, 2006, and 2005. There was not a stock dividend issued in 2009. |
76
UWHARRIE CAPITAL CORP AND SUBSIDIARIES
Management’s Discussion And Analysis of Financial Condition And Results of Operations
A discussion and analysis of the Company’s operating results and financial condition are presented in the following narrative and financial tables. The comments are intended to supplement and should be reviewed in conjunction with the consolidated financial statements and notes thereto appearing on pages 37 - 76. References to changes in assets and liabilities represent end of period balances unless otherwise noted. All references in this Annual Report to net income per share and weighted average common and common equivalent shares outstanding have been adjusted to reflect 3% stock dividends in 2008 and 2007. Statements contained in this Annual Report, which are not historical facts, are forward-looking statements, as that term is defined in the Private Securities Litigation Reform Act of 1995. Amounts herein could vary as a result of market and other factors. Such forward-looking statements are subject to risks and uncertainties which could cause actual results to differ materially from those currently anticipated due to a number of factors, which include, but are not limited to, factors discussed in documents filed by the Company with the Securities and Exchange Commission from time to time. Such forward-looking statements may be identified by the use of such words as “believe,” “expect,” “anticipate,” “should,” “might,” “planned,” “estimated,” and “potential.” Examples of forward-looking statements include, but are not limited to, estimates with respect to the financial condition, expected or anticipated revenue, results of operations and business of the Company that are subject to various factors which could cause actual results to differ materially from these estimates. These factors include, but are not limited to, general economic conditions, changes in interest rates, deposit flows, loan demand, real estate values, and competition; changes in accounting principles, policies, or guidelines; changes in legislation or regulation; and other economic, competitive, governmental, regulatory, and technological factors affecting the Company’s operations, pricing, products and services.
Financial Condition at December 31, 2009 and December 31, 2008
The Company’s total assets increased $25.3 million or 5.6% from $452.5 million at December 31, 2008 to $477.8 million at December 31, 2009. This increase resulted primarily from a $12.9 million increase in loans held for investment and a $7.5 million increase in securities available for sale.
Cash and cash equivalents decreased $2.4 million during the year ended December 31, 2009. Cash and due from banks increased $4.6 million, while interest-earning deposits with banks declined $7.0 million.
Investment securities increased $7.5 million or 10.9%, from $68.8 million at December 31, 2008 to $76.3 million at December 31, 2009. As a result of the financial markets dislocations which occurred in the second half of 2008, the Company had $2.5 million in net unrealized losses at December 31, 2008. Actions taken by the Federal Reserve have mostly stabilized the markets and brought about the resumption of more rational pricing. As a result, on December 31, 2009, the Company had net unrealized gains of $1.6 million. The Company evaluated its entire investment portfolio for other than temporary impairments. Management believes that all of the unrealized losses are only temporary with the exception of a portion of the private label CMO investment portfolio. The Company owns $7.5 million in whole loan private label CMOs. Based on the erosion of the underlying collateral, management determined that an impairment charge was warranted. Thus, the Company recorded $1.8 million in impairments on this portion of the portfolio during 2009. Subsequent to year end, management made the decision to sell the entire private label CMO portfolio realizing an additional loss of approximately $94 thousand. During the year, the Company purchased $35.9 million in new securities, had $5.5 million in municipal bonds called and sold $5.0 million in securities. For the twelve months ended December 31, 2009 the Company had net realized losses of $711 thousand.
77
UWHARRIE CAPITAL CORP AND SUBSIDIARIES
Management’s Discussion And Analysis of Financial Condition And Results of Operations
Loans held for investment increased $12.9 million from $340.8 million at December 31, 2008 to $353.7 million at December 31, 2009. The Company experienced positive growth trends in the commercial, consumer, residential real estate and commercial real estate loans at a growth rate of 13.8%, 7.3%, 3.5% and 7.1%, respectively. These positive trends were offset by an 11.2% decline in real estate construction. Loans held for sale decreased 2.3% or $63 thousand during the year. The allowance for loan losses was $5.3 million at December 31, 2009, which represents 1.49% of the loan portfolio, an increase from $4.4 million or 1.28% at December 31, 2008.
Premises and equipment increased $2.5 million or 22.6% during 2009. The Company completed the purchase of a tract of land in Locust and began construction of a new branch to be completed during 2010. The Company purchased a branch office building that had been leased for a long period of time. Also, the Company purchased two other buildings to be used for future office space.
Other changes in our consolidated assets are related to interest receivable, Federal Home Loan Bank stock, bank owned life insurance, other real estate owned and other assets. Bank owned life insurance and interest receivable increased $203 thousand and $50 thousand, respectively, while other real estate owned increased $603 thousand. The Company did have an investment of $172 thousand in common stock of the parent company of Silverton Bank. On May 1, 2009, the Office of the Comptroller of the Currency closed Silverton Bank, and the Federal Deposit Insurance Corporation (“FDIC”) was appointed receiver. The Company has written off this investment as of March 31, 2009. Federal Home Loan Bank stock increased $917 thousand because member institutions are required to increase their ownership as they increase their utilization of FHLB borrowings. The Company was also required to increase their ownership in Federal Reserve Bank stock by $210 thousand during the year. Other assets increased $2.1 million for the year. At the end of 2009, the FDIC required all financial institutions to prepay their FDIC assessments for the next three years. The Company’s prepayment amount totaled $2.1 million resulting in the increase in other assets.
Customer deposits continued to be our principal funding source in 2009, allowing us to fund the growth in assets discussed above. At December 31, 2009, deposits from our customers totaled $376.8 million, an increase of $23.2 million, or 6.6%, from $353.6 million at December 31, 2008. Interest checking and money market accounts and savings deposits increased $20.4 million and $5.8 million, respectively, while time deposits and demand, noninterest-bearing decreased $1.9 million and $1.1 million, respectively.
During 2009 the Company’s net borrowings decreased by $1.2 million. Borrowings consist of both short-term and long-term borrowed funds. The Company utilizes both short-term and long-term advances from the Federal Home Loan Bank. At December 31, 2009, $34.4 million of the total borrowings of $53.6 million were attributed to Federal Home Loan Bank advances.
At December 31, 2009, total shareholders’ equity was $44.0 million, an increase of $2.8 million from December 31, 2008. Net income for the period was $690 thousand. Unrealized gains on investment securities, net of tax improved $2.6 million. These increases were offset as the Company also recorded $542 thousand in dividends and discount accretions on the series A and B preferred stock for the twelve month period. At December 31, 2009, the Company and its subsidiary banks exceeded all applicable regulatory capital requirements.
78
UWHARRIE CAPITAL CORP AND SUBSIDIARIES
Management’s Discussion And Analysis of Financial Condition And Results of Operations
Results of Operations for the Years Ended December 31, 2009 and 2008
Earnings
Uwharrie Capital Corp reported net income of $690 thousand for the twelve months ended December 31, 2009, as compared to $2.0 million or the twelve months ended December 31, 2008, a decrease of $1.3 million. Net income available to common shareholders was $48 thousand or $0.01 per common share at December 31, 2009, compared to $2.0 million or $0.27 per common share at December 31, 2008. Net income available to common shareholders is net income less any dividends and discount accretions on preferred stock related to the $10 million of capital received from the United States Department of the Treasury under the capital purchase program in December 2008.
Net Interest Income
As with most financial institutions, the primary component of earnings for our banks is net interest income. Net interest income is the difference between interest income, principally from loan and investment securities portfolios, and interest expense, principally on customer deposits and borrowings. Changes in net interest income result from changes in volume, spread and margin. For this purpose, volume refers to the average dollar level of interest-earning assets and interest-bearing liabilities, spread refers to the difference between the average yield on interest-earning assets and the average cost of interest-bearing liabilities, and margin refers to net interest income divided by average interest-earning assets. Margin is influenced by the level and relative mix of interest-earning assets and interest-bearing liabilities, as well as by levels of noninterest bearing liabilities and capital.
Net interest income increased $1.7 million to $17.4 million for 2009 compared to the $15.7 million earned in 2008. During the year ended December 31, 2009 our growth in the volume of interest-earning assets outpaced the growth in interest-bearing liabilities by $1.4 million. The average yield on our interest-earning assets decreased 74 basis points to 5.89%, while the average rate we paid for our interest-bearing liabilities decreased 84 basis points. The Company’s assets that are interest rate sensitive adjust at the time the Federal Reserve Open Market Committee adjusts interest rates while interest-bearing time deposits adjust at the time of maturity. These decreases resulted in an increase of 10 basis points in our interest rate spread, from 3.76% in 2008 to 3.86% in 2009. Our net interest margin for 2009 was 4.12%, compared to 4.13% in 2008. Financial Table 1 on page 87 presents a detailed analysis of the components of the Company’s net interest income while Financial Table 2 on page 88 summarizes the effects on net interest income from changes in interest rates and in the dollar volume of the components of interest-earning assets and interest bearing liabilities.
Provision for Loan Losses
The provision for loan losses was $1.7 million and $1.0 million for the twelve months ended December 31, 2009 and 2008 respectively. There were net loan charge-offs of $817 thousand for the twelve months ended December 31, 2009 as compared with net loan charge-offs of $118 thousand during the same period of 2008. Refer to the Asset Quality discussion beginning on page 82 for further information.
Noninterest Income
The Company generates most of its revenue from net interest income; however, diversification of our earnings base is of major importance to our long term success. Noninterest income
79
UWHARRIE CAPITAL CORP AND SUBSIDIARIES
Management’s Discussion And Analysis of Financial Condition And Results of Operations
decreased 12.1%, from $6.6 million in 2008 to $5.8 million in 2009, a decrease of $773 thousand. Service charges on deposit accounts produced earnings of $2.4 million an increase of 5.5%. The Company also benefited from an increase in income from mortgage loan sales of $2.2 million resulting from an increase in mortgage loan originations. The rate reductions during 2008 by the Federal Reserve attributed to this increase 2009. These increases were offset by a decrease in other service fees and commissions of $504 thousand. Income generated from brokerage commissions and asset management fees decreased $389 thousand to $1.3 million, while other banking fees decreased $115 thousand or 10.1% during 2009. The recent downturn in the economy and the impact it has had on the overall stock market was the attributing factor to the decline in brokerage commissions and asset management fees. The Company had realized losses on the securities available for sale of $711 thousand and a loss of $172 thousand on the aforementioned Silverton Bank stock. As previously discussed, the Company recorded an additional other-than-temporary impairment of $1.8 million during 2009 compared to $158 thousand in 2008.
Noninterest Expense
Noninterest expense for the year ended December 31, 2009 was $20.9 million compared to $18.5 million for the same period of 2008, an increase of $2.4 million. Salaries and employee benefits, the largest component of noninterest expense, increased $890 thousand, from $10.6 million for the period ending December 31, 2008 to $11.5 million for the same period in 2009. This increase is attributable to normal salary increases, additions to staff and higher benefit expenses. Net occupancy and equipment expense had a combined increase of $141 thousand. Professional fees and services increased $281 thousand FDIC assessment costs also increased $830 thousand during the twelve month ending December 31, 2009. Not only has the assessment rate charged by the FDIC to all FDIC-insured financial institutions increased, but also the Company received and utilized FDIC credits that reduced its assessment charges during 2008. Other noninterest expense increased $239 thousand for the comparable twelve month period. The table on page 91 reflects the additional breakdown of other noninterest expense.
Income Tax Expense
The Company had an income tax benefit of $163 thousand for 2009 compared to income tax expense of $804 thousand in 2008 at an effective tax rate of 28.38%. Income taxes computed at the statutory rate are reduced primarily by the eligible amount of interest earned on state and municipal securities and income earned on bank owned life insurance.
Results of Operations for the Years Ended December 31, 2008 and 2007
Earnings
The Company earned net income of $2.0 million, or $0.27, per basic common share for 2008 as compared with net income of $2.9 million, or $0.39 per basic common share, in 2007.
Net Interest Income
Net interest income increased $703 thousand to $15.7 million for 2008 compared to the $15.0 million earned in 2007. During the year ended December 31, 2008 our growth in the volume of interest-earning assets outpaced the growth in interest-bearing liabilities by $970 thousand. The average yield on our interest-earning assets decreased 86 basis points to 6.63%, while the average rate we paid for our interest-bearing liabilities decreased 92 basis points. The
80
UWHARRIE CAPITAL CORP AND SUBSIDIARIES
Management’s Discussion And Analysis of Financial Condition And Results of Operations
Company’s assets that are interest rate sensitive adjust at the time the Federal Reserve Open Market Committee adjusts interest rates while interest-bearing time deposits adjust at the time of maturity. These decreases resulted in an increase of 6 basis points in our interest rate spread, from 3.70% in 2007 to 3.76% in 2008. Our net interest margin for 2008 was 4.13%, compared to 4.24% in 2007. Financial Table 1 on page 87 presents a detailed analysis of the components of the Company’s net interest income while Financial Table 2 on page 88 summarizes the effects on net interest income from changes in interest rates and in the dollar volume of the components of interest-earning assets and interest bearing liabilities.
Provision for Loan Losses
The provision for loan losses was $969 thousand and $15 thousand for the twelve months ended December 31, 2008 and 2007 respectively. There were net loan charge-offs of $118 thousand for the twelve months ended December 31, 2008 as compared with net loan recoveries of $324 thousand during the same period of 2007. Refer to the Asset Quality discussion beginning on page 82 for further information.
Noninterest Income
The Company generates most of its revenue from net interest income; however, diversification of our earnings base is of major importance to our long term success. Noninterest income increased 2.5%, from $6.6 million in 2007 to $6.8 million in 2008, an increase of $165 thousand. Service charges on deposit accounts grew $50 thousand to $2.2 million. Other income increased $108 thousand for the year ended December 31, 2008. The Company owns shares of VISA® stock and also owned MasterCard® stock. VISA® redeemed a portion of this stock during the first quarter of 2008 resulting in other income of $59 thousand. We sold all of the shares of MasterCard® during second quarter of 2008 producing other income of $162 thousand. This income was the primary factor behind the growth in other income. The Company also benefited from an increase in income from mortgage loan sales of $251 thousand resulting from an increase in mortgage loan originations. The rate reductions during the year by the Federal Reserve attributed to this increase. These increases were offset by a decrease in other service fees and commissions of $320 thousand. Income generated from brokerage commissions and asset management fees decreased $260 thousand to $2.8 million, while other banking fees decreased $60 thousand or 5.0% during 2008. The recent downturn in the economy and the impact it has had on the overall stock market was the attributing factor to the decline in brokerage commissions and asset management fees.
Noninterest Expense
Noninterest expense increased $1.3 million to $18.7 million in 2008 compared to $17.4 million in 2007. Salaries and employee benefits, the largest component of noninterest expense, increased $481 thousand, from $10.1 million in 2007 to $10.6 million in 2008. Additions at the executive and bank support staff levels, together with normal salary increases, primarily account for this increase. Net occupancy expense increased $116 thousand during the year due to the afore- mentioned renovations on an office building. Other noninterest expense increased $478 thousand for the year, including electronic banking expense, a major component of this category, which increased by $86 thousand. Increased usage of electronic banking products is the reason for the increase. Loan collection expense increased $132 thousand during the period. A large majority of this increase was related to one loan relationship.
81
UWHARRIE CAPITAL CORP AND SUBSIDIARIES
Management’s Discussion And Analysis of Financial Condition And Results of Operations
Income Tax Expense
The Company had income tax expense of $804 thousand for 2008 at an effective tax rate of 28.38% compared to income tax expense of $1.3 million in 2007 at an effective tax rate of 30.31%. Income taxes computed at the statutory rate are reduced primarily by the eligible amount of interest earned on state and municipal securities and income earned on bank owned life insurance. The growth in nontaxable income outpaced the growth in taxable income resulting in the decrease in the effective tax rate.
Asset Quality
The Company’s allowance for loan losses is established through charges to earnings in the form of a provision for loan losses. The allowance is increased by provisions charged to operations and by recoveries of amounts previously charged off, and reduced by loans charged off. Management evaluates the adequacy of the allowance at least quarterly. In evaluating the adequacy of the allowance, management considers the following: the growth, composition and industry diversification of the portfolio; historical loan loss experience; current delinquency levels; adverse situations that may affect a borrower’s ability to repay; estimated value of any underlying collateral; prevailing economic conditions and other relevant factors. The Company’s credit administration function, through a review process, validates the accuracy of the initial risk grade assessment. In addition, as a given loan’s credit quality improves or deteriorates, the credit administration department has the responsibility to change the borrower’s risk grade accordingly. For loans determined to be impaired, the allowance is based either on discounted cash flows using the loan’s initial effective interest rate or on the fair value of the collateral for certain collateral dependent loans. This evaluation is inherently subjective, as it requires material estimates, including the amounts and timing of future cash flows expected to be received on impaired loans, which may be susceptible to significant change. In addition, regulatory agencies, as an integral part of their examination process, periodically review the allowance for loan losses and may require additions for estimated losses based upon judgments different from those of management.
Management uses a risk-grading program to facilitate the evaluation of probable inherent loan losses and the adequacy of the allowance for loan losses. In this program, risk grades are initially assigned by loan officers and reviewed and monitored by credit administration. The Company strives to maintain its loan portfolio in accordance with conservative loan underwriting policies that result in loans specifically tailored to the needs of its market area. Every effort is made to identify and minimize the credit risks associated with such lending strategies. The Company has no foreign loans and does not engage in significant lease financing or highly leveraged transactions. The Company follows a loan review program designed to evaluate the credit risk in the loan portfolio. This process includes the maintenance of an internally classified watch list that is designed to help management assess the overall quality of the loan portfolio and the adequacy of the allowance for loan losses. In establishing the appropriate classification for specific assets, management considers, among other factors, the estimated value of the underlying collateral, the borrower’s ability to repay, the borrower’s payment history and the current delinquent status. As a result of this process, certain loans are categorized as substandard, doubtful or loss and reserves are allocated based on management’s judgment and historical experience.
The allowance for loan losses represents management’s best estimate of an appropriate amount to provide for known and inherent losses in the loan portfolio in the normal course of business. While management believes that it uses the best information available to establish the allowance for loan losses, future adjustments to the allowance may be necessary and
82
UWHARRIE CAPITAL CORP AND SUBSIDIARIES
Management’s Discussion And Analysis of Financial Condition And Results of Operations
results of operations could be adversely affected if circumstances differ from the assumptions used in making the determinations. Furthermore, while management believes it has established the allowance for loan losses in conformity with generally accepted accounting principles, there can be no assurance that regulators, in reviewing the Company’s portfolio, will not require an adjustment to the allowance for loan losses. In addition, because future events affecting borrowers and collateral cannot be predicted with certainty, there can be no assurance that the existing allowance for loan losses is adequate or that increases will not be necessary, should the quality of any loans deteriorate as a result of the factors discussed herein. Any material increase in the allowance for loan losses may adversely affect the Company’s financial condition and results of operations.
The provision for loan losses increased from $1.0 million in 2008 to $1.7 million in 2009, an increase of $763 thousand. This increase is a result of managements’ impairment evaluations and the increase in impaired reserves deemed necessary. During the year, impaired loans, which include all loans in nonaccrual status and other loans deemed by management to be impaired, were $24.1 million at December 31, 2009 compared to $12.5 million at December 31, 2008 resulting in an increase of $11.6 million. The increase in the level of impaired loans primarily resulted from five customer relationships that are included in impaired loans totaling $8.9 million. One of these relationships totaling $1.3 million was in nonaccrual at December 31, 2009. Total nonaccrual loans, which are a component of impaired loans, increased from $3.9 million at December 31, 2008 to $5.6 million at December 31, 2009. The Company had two relationships of $313 thousand that were in nonaccrual at the end of the year that have now been foreclosed and are currently included in other real estate owned. The Company had net loan charge-offs in 2009 and 2008 of $817 thousand and $118 thousand, respectively.
The allowance expressed as a percentage of gross loans held for investment increased 21 basis points from 1.28% at December 31, 2008 to 1.49% at December 31, 2009. The allowance, as a percentage of total impaired loans, decreased from 53.3% at December 31, 2008 to 49.5% at December 31, 2009. Likewise, the portion of the allowance specifically allocable to impaired loans decreased from 18.5% at December 31, 2008 to 10.8% at December 31, 2009. Nonperforming loans, which consist solely of nonaccrual loans, to total loans increased from 1.14% at December 31, 2008, to 1.59% at the end of 2009. The total allowance relative to non-performing loans decreased from 111.87% at the end of 2008 to 93.71% at this year end. Even in these difficult economic times, delinquencies have remained relatively constant and management believes the current level of allowance for loan losses to be adequate at this time.
83
UWHARRIE CAPITAL CORP AND SUBSIDIARIES
Management’s Discussion And Analysis of Financial Condition And Results of Operations
The following nonperforming loan table shows the comparison for the past five years:
Nonperforming Assets
(dollars in thousands)
| At December 31, | ||||||||||||||||||||
| 2009 | 2008 | 2007 | 2006 | 2005 | ||||||||||||||||
| Nonperforming Assets: |
||||||||||||||||||||
| Nonaccrual loans |
$ | 5,630 | $ | 3,898 | $ | 1,795 | $ | 1,211 | $ | 1,875 | ||||||||||
| Other real estate owned |
3,419 | 2,816 | 163 | 203 | 169 | |||||||||||||||
| Total nonperforming assets |
$ | 9,049 | $ | 6,714 | $ | 1,958 | $ | 1,414 | $ | 2,044 | ||||||||||
| Accruing loans past due 90 days or more |
$ | 17 | $ | 3 | $ | — | $ | 500 | $ | 339 | ||||||||||
| Allowance for loan losses |
5,276 | 4,361 | 3,510 | 3,171 | 4,482 | |||||||||||||||
| Nonperforming loans to total loans |
1.59 | % | 1.14 | % | 0.56 | % | 0.42 | % | 0.69 | % | ||||||||||
| Allowance for loan losses to total loans |
1.49 | % | 1.28 | % | 1.09 | % | 1.10 | % | 1.64 | % | ||||||||||
| Nonperforming assets to total loans and |
2.56 | % | 1.97 | % | 0.61 | % | 0.49 | % | 0.75 | % | ||||||||||
| Nonperforming assets to total assets |
1.89 | % | 1.48 | % | 0.48 | % | 0.37 | % | 0.58 | % | ||||||||||
| Allowance for loan losses to nonperforming loans |
93.71 | % | 111.87 | % | 195.57 | % | 261.78 | % | 239.09 | % | ||||||||||
Capital Resources
The Company continues to maintain good capital ratios that support its asset growth. The capital position is maintained through the retention of earnings and controlled growth. Regulatory agencies divide capital into Tier I (consisting of shareholders’ equity less ineligible intangible assets and accumulated other comprehensive income and allowable portions of trust preferred securities) and Tier II (consisting of the allowable portion of the reserve for loan losses and certain long-term debt) and measure capital adequacy by applying both capital levels to a banking company’s risk-adjusted assets and off-balance sheet items. In addition to these capital ratios, regulatory agencies have established a Tier I leverage ratio that measures Tier I capital to average assets less ineligible intangible assets.
Regulatory guidelines require a minimum of total capital to risk-adjusted assets ratio of 8% with one-half consisting of tangible common shareholders’ equity and a minimum Tier I leverage ratio of 4%. Banks which meet or exceed a Tier I ratio of 6%, a total capital ratio of 10% and a Tier I leverage ratio of 5% are considered well capitalized by regulatory standards. At December 31, 2009, the Company and its subsidiary banks were all well capitalized.
The Company expects to continue to exceed these minimums without altering current operations or strategy. Note 14 to the Consolidated Financial Statements presents additional information regarding the Company’s and its subsidiary banks’ capital ratios.
Dividends
The Board of Directors of Uwharrie Capital Corp declared a 3% stock dividend in 2008 and 2007. All references in this Annual Report to net income per share and weighted average
84
UWHARRIE CAPITAL CORP AND SUBSIDIARIES
Management’s Discussion And Analysis of Financial Condition And Results of Operations
common and common equivalent shares outstanding reflect the effects of these stock dividends. There was not a dividend declared in 2009.
Liquidity
Liquidity, the ability to raise cash when needed without adversely impacting profits, is managed primarily by the selection of asset mix and the maturity mix of liabilities. Maturities and the marketability of securities and other funding sources provide a source of liquidity to meet deposit fluctuations. Maturities in the securities portfolio, presented in Financial Table 4 on page 90, are supported by cash flows from mortgage-backed securities that have longer-term contractual maturities.
Other funding sources at year-end 2009 included $18.8 million in federal funds lines of credit from correspondent banks and approximately $35.2 million of remaining credit availability from the Federal Home Loan Bank. The Company may also borrow from the Federal Reserve Bank discount window. Growth in deposits is typically the primary source of funding for loans, supported by long-term credit available from the Federal Home Loan Bank.
At December 31, 2009, borrowings from federal funds lines and the issuance of commercial paper amounted to $11.5 million, while other short-term borrowings totaled $15.4 million. Long-term debt at that date consisted of advances of $19.0 million from the Federal Home Loan Bank, junior subordinated debt of $7.4 million, a mortgage payable of $74 thousand and a note payable for the purchase of a building of $150 thousand.
Management believes that the Company’s current sources of funds provide adequate liquidity for its current cash flow needs.
Contractual Obligations
The following table reflects the contractual obligations of the Company outstanding as of December 31, 2009.
| Payments Due by Period (in thousands) | |||||||||||||||
| Total | On Demand or less than 1 year |
1-3 Years | 4-5 Years | After 5 Years | |||||||||||
| Contractual Obligations |
|||||||||||||||
| Short-term debt |
$ | 26,940 | $ | 26,940 | $ | — | $ | — | $ | — | |||||
| Long-term debt |
26,643 | — | 13,118 | 13,500 | 25 | ||||||||||
| Operating leases |
494 | 95 | 120 | 279 | — | ||||||||||
| Building construction |
894 | 894 | — | — | — | ||||||||||
| Total contractual cash obligations, excluding deposits |
54,971 | 27,929 | 13,238 | 13,779 | 25 | ||||||||||
| Deposits |
376,774 | 347,109 | 27,962 | 1,703 | — | ||||||||||
| Total contractual cash obligations, including deposits |
$ | 431,745 | $ | 375,038 | $ | 41,200 | $ | 15,482 | $ | 25 | |||||
85
UWHARRIE CAPITAL CORP AND SUBSIDIARIES
Management’s Discussion And Analysis of Financial Condition And Results of Operations
Critical Accounting Policy
The Company’s most significant critical accounting policy is the determination of its allowance for loan losses. A critical accounting policy is one that is both very important to the portrayal of the Company’s financial condition and results, and requires management’s most difficult, subjective and/or complex judgments. What makes these judgments difficult, subjective and/or complex is the need to make estimates about the effects of matters that are inherently uncertain. Refer to the discussion within Allowance for Loan Losses and in Note 1 to the consolidated financial statements for a comprehensive discussion regarding this accounting policy.
Off-Balance Sheet Arrangements
The Company has various financial instruments (outstanding commitments) with off-balance sheet risk that are issued in the normal course of business to meet the financing needs of its customers. See Note 12 to the consolidated financial statements for more information regarding these commitments and contingent liabilities.
Interest Rate Sensitivity
The major component of income for the Company is net interest income, the difference between yield earned on assets and interest paid on liabilities. This differential or margin can vary over time as changes in interest rates occur. The volatility of changes in this differential can be measured by the timing (or repricing) difference between maturing assets and liabilities.
To identify interest rate sensitivity, a common measure is a gap analysis, which reflects the difference or gap between rate sensitive assets and liabilities over various time periods. Gap analysis at December 31, 2009 is reflected in Financial Table 3 on page 89. While management reviews this information, it has implemented the use of a simulation model which calculates expected net interest income based on projected interest-earning assets, interest-bearing liabilities and interest rates and provides a more relevant view of interest rate risk than traditional gap tables. The simulation allows comparison of flat, rising and falling rate scenarios to determine sensitivity of earnings to changes in interest rates.
The Company models immediate rising and declining rate shocks of 2% on its subsidiary banks as preferred by regulators. The most recent consolidated 2% rate shock projections from the asset liability model, measured over a twelve-month period, indicate a negative impact of 13.20% on net interest income in a rates down scenario and a negative impact of 6.69% on net interest income in a rates up environment. Two of the subsidiary banks are asset sensitive and typically have some negative impact when rates decline, since the majority of interest bearing assets will reprice more quickly than the interest bearing liabilities. The other bank is liability sensitive, with the opposite effect, and the blend provides some balance in the consolidated results.
The principal goals of the Company’s asset liability management are the maintenance of adequate liquidity and the management of interest rate risk. Interest rate risk management attempts to balance the effects of interest rate changes on interest-sensitive assets and liabilities to protect net interest income from wide fluctuations that could result from changes in interest rates. The Company’s Asset Liability Management Committee monitors market changes in interest rates and assists with pricing loan and deposit products consistent with funding source needs and asset growth projections.
86
UWHARRIE CAPITAL CORP AND SUBSIDIARIES
Management’s Discussion And Analysis of Financial Condition And Results of Operations
Financial Table 1
Average Balances and Net Interest Income Analysis
(dollars in thousands)
| 2009 | 2008 | 2007 | |||||||||||||||||||||||||
| Average Balance |
Interest Income/ Expense |
Average Yield/ Rate (1) |
Average Balance |
Interest Income/ Expense |
Average Yield/ Rate (1) |
Average Balance |
Interest Income Expense |
Average Yield Rate (1) |
|||||||||||||||||||
| Interest-earning assets |
|||||||||||||||||||||||||||
| Taxable securities |
$ | 63,934 | 3,128 | 4.89 | % | $ | 36,573 | $ | 2,021 | 5.53 | % | $ | 30,364 | $ | 1,711 | 5.63 | % | ||||||||||
| Non-taxable securities (1) |
14,115 | 622 | 7.17 | % | 14,738 | 678 | 7.49 | % | 12,847 | 549 | 6.95 | % | |||||||||||||||
| Short-term investments |
6,334 | 66 | 1.04 | % | 5,386 | 85 | 1.58 | % | 14,219 | 733 | 5.16 | % | |||||||||||||||
| Taxable loans (2) |
345,448 | 21,020 | 6.08 | % | 332,986 | 22,592 | 6.78 | % | 304,195 | 23,724 | 7.80 | % | |||||||||||||||
| Non-taxable loans (1) |
4,387 | 226 | 8.38 | % | 4,086 | 188 | 7.49 | % | 3,954 | 192 | 7.90 | % | |||||||||||||||
| Total interest-earning assets |
434,218 | 25,062 | 5.89 | % | 393,769 | 25,564 | 6.63 | % | 365,579 | 26,909 | 7.49 | % | |||||||||||||||
| Non-earning assets |
|||||||||||||||||||||||||||
| Cash and due from banks |
7,057 | 9,964 | 11,253 | ||||||||||||||||||||||||
| Premises and equipment, net |
12,616 | 9,735 | 8,694 | ||||||||||||||||||||||||
| Interest receivable and other |
17,838 | 9,389 | 7,662 | ||||||||||||||||||||||||
| Total non-earning assets |
37,511 | 29,088 | 27,609 | ||||||||||||||||||||||||
| Total assets |
$ | 471,729 | $ | 422,857 | $ | 393,188 | |||||||||||||||||||||
| Interest-bearing liabilities |
|||||||||||||||||||||||||||
| Savings deposits |
$ | 30,912 | $ | 255 | 0.82 | % | $ | 26,246 | $ | 301 | 1.15 | % | $ | 26,635 | $ | 526 | 1.97 | % | |||||||||
| Interest checking & MMDA |
120,307 | 838 | 0.70 | % | 109,469 | 1,357 | 1.24 | % | 102,643 | 2,550 | 2.48 | % | |||||||||||||||
| Time deposits |
172,108 | 4,816 | 2.80 | % | 155,983 | 6,281 | 4.03 | % | 136,217 | 6,454 | 4.74 | % | |||||||||||||||
| Total deposits |
323,327 | 5,909 | 1.83 | % | 291,698 | 7,939 | 2.72 | % | 265,495 | 9,530 | 3.59 | % | |||||||||||||||
| Short-term borrowed funds |
24,092 | 316 | 1.31 | % | 19,453 | 529 | 2.72 | % | 27,742 | 1,128 | 4.07 | % | |||||||||||||||
| Long-term debt |
30,992 | 1,472 | 4.75 | % | 31,190 | 1,360 | 4.36 | % | 20,333 | 1,218 | 5.99 | % | |||||||||||||||
| Total interest-bearing liabilities |
378,411 | 7,697 | 2.03 | % | 342,341 | 9,828 | 2.87 | % | 313,570 | 11,876 | 3.79 | % | |||||||||||||||
| Noninterest liabilities |
|||||||||||||||||||||||||||
| Transaction deposits |
46,630 | 45,685 | 46,766 | ||||||||||||||||||||||||
| Interest payable and other |
3,506 | 2,586 | 2,450 | ||||||||||||||||||||||||
| Total liabilities |
428,547 | 390,612 | 362,786 | ||||||||||||||||||||||||
| Shareholders’ equity |
43,182 | 32,245 | 30,402 | ||||||||||||||||||||||||
| Total liabilities and shareholders equity |
$ | 471,729 | $ | 422,857 | $ | 393,188 | |||||||||||||||||||||
| Interest rate spread |
3.86 | % | 3.76 | % | 3.70 | % | |||||||||||||||||||||
| Net interest income and net interest margin |
$ | 17,365 | 4.12 | % | $ | 15,736 | 4.13 | % | $ | 15,033 | 4.24 | % | |||||||||||||||
| 1) | Yields related to securities and loans exempt from federal and/or state income taxes are stated on a fully tax-equivalent basis, assuming a 38.55% tax rate. |
| 2) | Nonaccrual loans are included in loans, net of unearned income. |
87
UWHARRIE CAPITAL CORP AND SUBSIDIARIES
Management’s Discussion And Analysis of Financial Condition And Results of Operations
Financial Table 2
Volume and Rate Variance Analysis
(dollars in thousands)
| 2009 Versus 2008 | 2008 Versus 2007 | |||||||||||||||||||||||
| Volume | Rate | Net Change | Volume | Rate | Net Change | |||||||||||||||||||
| Interest-earning assets |
||||||||||||||||||||||||
| Taxable securities |
$ | 1,425 | $ | (318 | ) | $ | 1,107 | $ | 346 | $ | (36 | ) | $ | 310 | ||||||||||
| Non-taxable securities |
(28 | ) | (28 | ) | (56 | ) | 84 | 45 | 129 | |||||||||||||||
| Short-term investments |
12 | (31 | ) | (19 | ) | (297 | ) | (351 | ) | (648 | ) | |||||||||||||
| Taxable loans |
802 | (2,374 | ) | (1,572 | ) | 2,099 | (3,231 | ) | (1,132 | ) | ||||||||||||||
| Non-taxable loans |
15 | 23 | 38 | 6 | (10 | ) | (4 | ) | ||||||||||||||||
| Total interest-earning assets |
2,226 | (2,728 | ) | (502 | ) | 2,238 | (3,583 | ) | (1,345 | ) | ||||||||||||||
| Interest-bearing liabilities |
||||||||||||||||||||||||
| Savings deposits |
46 | (92 | ) | (46 | ) | (6 | ) | (219 | ) | (225 | ) | |||||||||||||
| Transaction and MMDA deposits |
105 | (624 | ) | (519 | ) | 127 | (1,320 | ) | (1,193 | ) | ||||||||||||||
| Other time deposits |
550 | (2,015 | ) | (1,465 | ) | 866 | (1,039 | ) | (173 | ) | ||||||||||||||
| Short-term borrowed funds |
93 | (306 | ) | (213 | ) | (281 | ) | (318 | ) | (599 | ) | |||||||||||||
| Long-term debt |
(9 | ) | 121 | 112 | 562 | (420 | ) | 142 | ||||||||||||||||
| Total interest-bearing liabilities |
785 | (2,916 | ) | (2,131 | ) | 1,268 | (3,316 | ) | (2,048 | ) | ||||||||||||||
| Net interest income |
$ | 1,441 | $ | 188 | $ | 1,629 | $ | 970 | $ | (267 | ) | $ | 703 | |||||||||||
The above table analyzes the dollar amount of changes in interest income and interest expense for major components of interest-earning assets and interest-bearing liabilities. The table distinguishes between (i) changes attributable to volume (changes in volume multiplied by the prior period’s rate), (ii) changes attributable to rate (changes in rate multiplied by the prior period’s volume), and (iii) net change (the sum of the previous columns). The change attributable to both rate and volume (changes in rate multiplied by changes in volume) has been allocated equally to the change attributable to volume and the change attributable to rate.
88
UWHARRIE CAPITAL CORP AND SUBSIDIARIES
Management’s Discussion And Analysis of Financial Condition And Results of Operations
Financial Table 3
Interest Rate Sensitivity Analysis
(dollars in thousands)
| 1-90 Day Position |
3-6 Month Position |
6-12 Month Position |
1-5 Year Position |
> 5 Year Position |
Total Position |
|||||||||||||||||||
| Interest-earning assets |
||||||||||||||||||||||||
| Interest-earning deposits with banks |
$ | 1,841 | $ | 747 | $ | 750 | — | $ | — | $ | 3,338 | |||||||||||||
| Investment securities |
2,806 | 2,903 | 3,372 | 32,906 | 34,330 | 76,317 | ||||||||||||||||||
| FHLB and other stock |
— | — | — | — | 4,480 | 4,480 | ||||||||||||||||||
| Loans held for sale |
2,628 | — | — | — | — | 2,628 | ||||||||||||||||||
| Loans held for investment |
106,712 | 33,915 | 50,511 | 123,949 | 38,642 | 353,729 | ||||||||||||||||||
| Total interest-earning assets |
113,987 | 37,565 | 54,633 | 156,855 | 77,452 | 440,492 | ||||||||||||||||||
| Interest-bearing liabilities |
||||||||||||||||||||||||
| Deposits |
39,334 | 45,919 | 68,035 | 104,281 | 74,281 | 331,850 | ||||||||||||||||||
| Short-term borrowed funds |
20,890 | 50 | 6,000 | — | — | 26,940 | ||||||||||||||||||
| Long-term debt |
— | — | — | 19,188 | 7,455 | 26,643 | ||||||||||||||||||
| Total interest-bearing liabilities |
60,224 | 45,969 | 74,035 | 123,469 | 81,736 | 385,433 | ||||||||||||||||||
| Interest sensitivity GAP per period |
$ | 53,763 | $ | (8,404 | ) | $ | (19,402 | ) | $ | 33,386 | $ | (4,284 | ) | $ | 55,059 | |||||||||
| Cumulative interest sensitivity GAP |
$ | 53,763 | $ | 45,359 | $ | 25,957 | $ | 59,343 | $ | 55,059 | $ | 55,059 | ||||||||||||
| Ratios |
||||||||||||||||||||||||
| Cumulative gap as a percentage of total interest-earning assets |
12.21 | % | 10.30 | % | 5.89 | % | 13.47 | % | 12.50 | % | 12.50 | % | ||||||||||||
| Cumulative interest-earning assets as a percentage of interest-bearing liabilities |
189.27 | % | 142.71 | % | 114.40 | % | 119.54 | % | 114.28 | % | 114.28 | % | ||||||||||||
89
UWHARRIE CAPITAL CORP AND SUBSIDIARIES
Management’s Discussion And Analysis of Financial Condition And Results of Operations
Financial Table 4
Investment Securities Portfolio Analysis
(dollars in thousands)
| December 31, 2009 | |||||||||
| Amortized Cost |
Estimated Fair Value |
Book Yield(1) |
|||||||
| Securities available for sale |
|||||||||
| U. S. Treasury |
|||||||||
| Due after one but within five years |
3,024 | 3,019 | 1.50 | % | |||||
| U.S. Government agencies |
|||||||||
| Due after one but within five years |
15,485 | 15,722 | 3.51 | % | |||||
| Due after five but within ten years |
5,251 | 5,249 | 3.80 | % | |||||
| 20,736 | 20,971 | 3.58 | % | ||||||
| Mortgage-backed securities |
|||||||||
| Due after one year but within five years |
265 | 269 | 4.00 | % | |||||
| Due after five but within ten year |
8,311 | 8,676 | 4.42 | % | |||||
| Due after ten years |
25,610 | 26,297 | 4.78 | % | |||||
| 34,186 | 35,242 | 4.69 | % | ||||||
| Private label CMO’s |
|||||||||
| Due after ten years |
7,468 | 7,500 | 7.40 | % | |||||
| State and political |
|||||||||
| Due within one year |
576 | 577 | 3.73 | % | |||||
| Due after one but within five years |
3,886 | 4,024 | 6.18 | % | |||||
| Due after five but within ten year |
2,113 | 2,213 | 6.96 | % | |||||
| Due after ten years |
2,701 | 2,771 | 7.36 | % | |||||
| 9,276 | 9,585 | 6.55 | % | ||||||
| Total Securities available for sale |
|||||||||
| Due within one year |
576 | 577 | 3.74 | % | |||||
| Due after one but within five years |
22,660 | 23,034 | 3.74 | % | |||||
| Due after five but within ten year |
15,675 | 16,138 | 4.60 | % | |||||
| Due after ten years |
35,779 | 36,568 | 5.54 | % | |||||
| $ | 74,690 | $ | 76,317 | 4.78 | % | ||||
| 1) | Yields on securities and investments exempt from federal and/or state income taxes are stated on a fully tax- equivalent basis, assuming a 38.55% tax rate. |
90
UWHARRIE CAPITAL CORP AND SUBSIDIARIES
Management’s Discussion And Analysis of Financial Condition And Results of Operations
Financial Table 5
Noninterest Income
(dollars in thousands)
| Year Ended December 31, | ||||||||||||
| 2009 | 2008 | 2007 | ||||||||||
| Service charges on deposit accounts |
$ | 2,360 | $ | 2,238 | $ | 2,188 | ||||||
| Other banking fees |
1,023 | 1,138 | 1,198 | |||||||||
| Asset management fees |
1,054 | 1,396 | 1,473 | |||||||||
| Brokerage commissions |
196 | 243 | 426 | |||||||||
| Other noninterest income |
480 | 578 | 400 | |||||||||
| Core noninterest income |
5,113 | 5,593 | 5,685 | |||||||||
| Income from mortgage loan sales |
3,436 | 1,208 | 957 | |||||||||
| Security gains (losses) |
(711 | ) | — | (76 | ) | |||||||
| Loss on nonmarketable securities |
(172 | ) | — | — | ||||||||
| Total other-than-temporary impairment loss |
(1,807 | ) | (158 | ) | — | |||||||
| Portion of loss recognized in other comprehensive income |
— | — | — | |||||||||
| Net impairment recognized in other comprehensive income |
(1,807 | ) | (158 | ) | — | |||||||
| Gains (losses) from sale of OREO |
(36 | ) | (41 | ) | (2 | ) | ||||||
| Other gains (losses) from sale of assets |
1 | (5 | ) | 26 | ||||||||
| Total noninterest income |
$ | 5,824 | $ | 6,597 | $ | 6,590 | ||||||
Financial Table 6
Other Noninterest Expense
(dollars in thousands)
| Year Ended December 31, | |||||||||
| 2009 | 2008 | 2007 | |||||||
| Office supplies and printing |
$ | 335 | $ | 286 | $ | 277 | |||
| Postage |
200 | 200 | 173 | ||||||
| Telephone and data lines |
237 | 244 | 232 | ||||||
| Loan collection cost |
185 | 292 | 140 | ||||||
| Foreclosed real estate expense |
219 | 55 | 6 | ||||||
| Shareholder relations expense |
187 | 185 | 175 | ||||||
| Dues and subscriptions |
161 | 147 | 127 | ||||||
| Subordinated debt issue costs |
27 | 16 | 130 | ||||||
| Other |
1,417 | 1,304 | 1,156 | ||||||
| Total other noninterest expense |
$ | 2,968 | $ | 2,729 | $ | 2,416 | |||
91
UWHARRIE CAPITAL CORP AND SUBSIDIARIES
Management’s Discussion And Analysis of Financial Condition And Results of Operations
Financial Table 7
Loan Portfolio Composition
(dollars in thousands)
| At December 31, | |||||||||||||||||||||
| 2009 | 2008 | 2007 | |||||||||||||||||||
| Amount | % of Total Loans |
Amount | % of Total Loans |
Amount | % of Total Loans |
||||||||||||||||
| Loan type: |
|||||||||||||||||||||
| Commercial |
$ | 51,723 | 14.63 | % | $ | 45,470 | 13.35 | % | $ | 37,724 | 11.72 | % | |||||||||
| Real estate - construction |
44,976 | 12.72 | % | 50,661 | 14.87 | % | 46,546 | 14.46 | % | ||||||||||||
| Real estate - residential |
144,154 | 40.77 | % | 139,346 | 40.90 | % | 135,842 | 42.21 | % | ||||||||||||
| Real estate - commercial |
95,938 | 27.13 | % | 89,561 | 26.29 | % | 86,593 | 26.90 | % | ||||||||||||
| Consumer |
16,628 | 4.70 | % | 15,499 | 4.55 | % | 15,022 | 4.67 | % | ||||||||||||
| Other |
172 | 0.05 | % | 121 | 0.04 | % | 143 | 0.04 | % | ||||||||||||
| Total loans |
353,591 | 100.00 | % | 340,658 | 100.00 | % | 321,870 | 100.00 | % | ||||||||||||
| Less: |
|||||||||||||||||||||
| Allowance for loan losses |
(5,276 | ) | (4,361 | ) | (3,510 | ) | |||||||||||||||
| Unearned net loan fees |
138 | 172 | 117 | ||||||||||||||||||
| Net loans |
$ | 348,453 | $ | 336,469 | $ | 318,477 | |||||||||||||||
| At December 31, | ||||||||||||||
| 2006 | 2005 | |||||||||||||
| Amount | % of Total Loans |
Amount | % of Total Loans |
|||||||||||
| Loan type: |
||||||||||||||
| Commercial |
$ | 36,406 | 12.64 | % | $ | 37,299 | 13.68 | % | ||||||
| Real estate—construction |
27,342 | 9.49 | % | 21,206 | 7.78 | % | ||||||||
| Real estate—residential |
126,111 | 43.79 | % | 116,715 | 42.81 | % | ||||||||
| Real estate—commercial |
84,744 | 29.43 | % | 83,861 | 30.76 | % | ||||||||
| Consumer |
13,262 | 4.60 | % | 13,479 | 4.94 | % | ||||||||
| Other |
133 | 0.05 | % | 72 | 0.03 | % | ||||||||
| Total loans |
287,998 | 100.00 | % | $ | 272,632 | 100.00 | % | |||||||
| Less: |
||||||||||||||
| Allowance for loan losses |
(3,171 | ) | (4,482 | ) | ||||||||||
| Unearned net loan fees |
137 | 210 | ||||||||||||
| Net loans |
$ | 284,964 | $ | 268,360 | ||||||||||
92
UWHARRIE CAPITAL CORP AND SUBSIDIARIES
Management’s Discussion And Analysis of Financial Condition And Results of Operations
Financial Table 8
Selected Loan Maturities
(dollars in thousands)
| December 31, 2009 | ||||||||||||
| One Year or Less |
One to Five Years |
Over Five Years |
Total | |||||||||
| Commercial and agricultural |
$ | 26,385 | $ | 19,285 | $ | 6,053 | $ | 51,723 | ||||
| Real estate – construction |
26,896 | 13,379 | 4,701 | 44,976 | ||||||||
| Total selected loans |
$ | 53,281 | $ | 32,664 | $ | 10,754 | $ | 96,699 | ||||
| Fixed rate loans |
$ | 21,740 | $ | 93,114 | $ | 55,972 | $ | 170,826 | ||||
| Sensitivity to rate changes: |
||||||||||||
| Variable interest rates |
$ | 185,531 | $ | — | $ | — | $ | 185,531 | ||||
93
UWHARRIE CAPITAL CORP AND SUBSIDIARIES
Management’s Discussion And Analysis of Financial Condition And Results of Operations
Financial Table 9
Activity in the Allowance for Loan Loss
(dollars in thousands)
| At or for the Year Ended December 31, | ||||||||||||||||||||
| 2009 | 2008 | 2007 | 2006 | 2005__ | ||||||||||||||||
| Allowance for loan losses at beginning of year |
$ | 4,361 | $ | 3,510 | $ | 3,171 | $ | 4,482 | $ | 4,983 | ||||||||||
| Provision for loan losses |
1,732 | 969 | 15 | 298 | 755 | |||||||||||||||
| Loan charge-offs: |
||||||||||||||||||||
| Commercial |
39 | 122 | — | 1,533 | 1,124 | |||||||||||||||
| Real estate |
692 | 15 | — | 14 | — | |||||||||||||||
| Consumer |
140 | 151 | 224 | 140 | 254 | |||||||||||||||
| Total charge-offs |
871 | 288 | 224 | 1,687 | 1,378 | |||||||||||||||
| Recoveries of loans previously charged off: |
||||||||||||||||||||
| Commercial |
19 | 120 | 440 | 34 | 3 | |||||||||||||||
| Real estate |
14 | — | — | — | — | |||||||||||||||
| Consumer |
21 | 50 | 108 | 44 | 119 | |||||||||||||||
| Total recoveries |
54 | 170 | 548 | 78 | 122 | |||||||||||||||
| Net charge-offs (recoveries) |
817 | 118 | (324 | ) | 1,609 | 1,256 | ||||||||||||||
| Allowance for loan losses at end of year |
$ | 5,276 | $ | 4,361 | $ | 3,510 | $ | 3,171 | $ | 4,482 | ||||||||||
| Net (charge-offs) recoveries as a percent of average loans |
0.24 | % | 0.04 | % | 0.11 | % | (0.55 | )% | (0.47 | )% | ||||||||||
94
UWHARRIE CAPITAL CORP AND SUBSIDIARIES
Management’s Discussion And Analysis of Financial Condition And Results of Operations
Financial Table 10
Allocation of the Allowance for Loan Losses
(dollars in thousands)
| At December 31, | ||||||||||||||||||
| 2009 | 2008 | 2007 | ||||||||||||||||
| Amount | % of Total Loans (1) |
Amount | % of Total Loans (1) |
Amount | % of Total Loans (1) |
|||||||||||||
| Commercial |
$ | 449 | 14.63 | % | $ | 288 | 13.35 | % | $ | 326 | 11.72 | % | ||||||
| Real estate - construction |
1,373 | 12.72 | % | 1,232 | 14.87 | % | 325 | 14.46 | % | |||||||||
| Real estate - residential |
1,477 | 40.77 | % | 1,180 | 40.90 | % | 922 | 42.21 | % | |||||||||
| Real estate - commercial |
1,541 | 27.13 | % | 1,385 | 26.29 | % | 1,715 | 26.90 | % | |||||||||
| Consumer loans |
436 | 4.70 | % | 276 | 4.55 | % | 222 | 4.67 | % | |||||||||
| Other |
— | 0.05 | % | — | 0.04 | % | — | 0.04 | % | |||||||||
| Unallocated |
— | 0.00 | % | — | — | % | — | — | % | |||||||||
| Total loans |
$ | 5,276 | 100.00 | % | $ | 4,361 | 100.00 | % | $ | 3,510 | 100.00 | % | ||||||
| At December 31, | ||||||||||||
| 2006 | 2005 | |||||||||||
| Amount | % of Total Loans (1) |
Amount | % of Total Loans (1) |
|||||||||
| Commercial |
$ | 356 | 12.64 | % | $ | 2,474 | 13.68 | % | ||||
| Real estate - construction |
255 | 9.49 | % | 101 | 7.78 | % | ||||||
| Real estate - residential |
1,235 | 43.79 | % | 323 | 42.81 | % | ||||||
| Real estate - commercial |
1,123 | 29.43 | % | 1,159 | 30.76 | % | ||||||
| Consumer |
202 | 4.60 | % | 369 | 4.94 | % | ||||||
| Other |
— | 0.05 | % | — | — | % | ||||||
| Unallocated |
— | — | % | 56 | 0.03 | % | ||||||
| Total loans |
$ | 3,171 | 100.00 | % | $ | 4,482 | 100.00 | % | ||||
| (1) | Represents total of all outstanding loans in each category as a percent of total loans outstanding. |
95
UWHARRIE CAPITAL CORP AND SUBSIDIARIES
Management’s Discussion And Analysis of Financial Condition And Results of Operations
Financial Table 11
Maturities of Time Deposits
(dollars in thousands)
| 3 Months or Less |
Over 3 Months to 6 Months |
Over 6 Months to 12 Months |
Over 12 Months |
Total | |||||||||||
| Time Deposits of $100,000 or more |
$ | 14,669 | $ | 15,516 | $ | 23,315 | $ | 11,236 | $ | 64,736 | |||||
| Other Time Deposits |
20,201 | 25,576 | 33,080 | 18,429 | 97,286 | ||||||||||
| $ | 34,870 | $ | 41,092 | $ | 56,395 | $ | 29,665 | $ | 162,022 | ||||||
Financial Table 12
Securities Performance Ratios
| At December 31, | |||||||||||||||
| 2009 | 2008 | 2007 | 2006 | 2005 | |||||||||||
| Return on average assets |
0.15 | % | 0.48 | % | 0.75 | % | 0.56 | % | 0.45 | % | |||||
| Return on average equity |
1.60 | % | 6.29 | % | 9.73 | % | 7.32 | % | 5.58 | % | |||||
| Equity to average assets ratio |
9.15 | % | 7.63 | % | 7.73 | % | 7.67 | % | 8.14 | % | |||||
96
UWHARRIE CAPITAL CORP
Board of Directors
| W. Stephen Aldridge, III President Stanly Funeral Home, Inc.
Joe S. Brooks Board Vice Chairman Owner and Manager Brothers Precision Tool Co.
Ronald T. Burleson Partner Thurman Burleson and Sons Farm
Bill C. Burnside, DDS Sole Proprietor Dental Practice
Charles F. Geschickter, III President and Chief Executive Officer ST Motorsports, Inc.; JTG Racing, Inc.
Thomas M. Hearne, Jr. Geopavement Engineer NC Department of Transportation |
Charles D. Horne President Hornwood, Inc.
W. Kenneth Huntley President Huntley Oil & Gas Co., Inc.
Joseph R. Kluttz, Jr. Secretary and Treasurer Albemarle Insurance Agency, Inc
Lee Roy Lookabill, Jr. President Anson Real Estate and Insurance Co., Inc.
W. Chester Lowder Director of Livestock Program Public Policy Division NC Farm Bureau Federation, Inc.
Barry S. Moose Division Engineer NC Department of Transportation |
Timothy J. Propst Executive Vice President Propst Construction Co., Inc.
Susan J. Rourke President and Owner U.S. Land Management Co.
Donald P. Scarborough Board Chairman President and Owner Plank Road Realty, Inc.
John W. Shealy, Jr. President Capital Concrete Co.
Edward B. Tyson Retired Superintendent of Kannapolis City Schools | ||
| Executive Officers
| ||||
| Roger L. Dick President and Chief Executive Officer Uwharrie Capital Corp
Brendan P. Duffey Executive Vice President and Chief Operating Officer Uwharrie Capital Corp
Robert O. Bratton Chief Financial Officer Uwharrie Capital Corp
Barbara S. Williams Executive Vice President and Controller Uwharrie Capital Corp |
Christy D. Stoner President and Chief Executive Officer The Strategic Alliance Corporation, BOS Agency, Inc. Chief Executive Officer Strategic Investment Advisors, Inc. Executive Vice President Marketing Uwharrie Capital Corp
Jeffrey M. Talley President Strategic Investment Advisors, Inc. |
Dana A. Maness President Anson Bank & Trust Co.
W.D. “Bill” Lawhon, Jr. President and Chief Executive Officer Bank of Stanly
Patricia K. Horton President and Chief
Executive Officer | ||
97