Attached files
Table of Contents
UNITED STATES
SECURITIES AND EXCHANGE COMMISSION
Washington, D.C. 20549
Form 10-K
(Mark One)
| x | ANNUAL REPORT PURSUANT TO SECTION 13 OR 15(d) OF THE SECURITIES EXCHANGE ACT OF 1934 |
For the fiscal year ended January 1, 2010
OR
| ¨ | TRANSITION REPORT PURSUANT TO SECTION 13 OR 15(d) OF THE SECURITIES EXCHANGE ACT OF 1934 |
For the transition period from to
Commission file number 000-50646
Ultra Clean Holdings, Inc.
(Exact name of Registrant as specified in its charter)
| Delaware | 61-1430858 | |
| (State or other jurisdiction of incorporation or organization) |
(IRS Employer Identification No.) | |
| 26462 Corporate Avenue Hayward, California |
94545 | |
| (Address of principal executive offices) | (Zip Code) | |
Registrant’s telephone number, including area code:
(510) 576-4400
Securities registered pursuant to Section 12(b) of the Act:
| Title of Each Class |
Name of Each Exchange on Which Registered | |
| Common Stock, $0.001 par value | The NASDAQ Global Market LLC |
Securities registered pursuant to Section 12(g) of the Act:
None
Indicate by check mark if the registrant is a well-known seasoned issuer, as defined in Rule 405 of the Securities Act. Yes ¨ No x
Indicate by check mark if the registrant is not required to file reports pursuant to Section 13 or Section 15(d) of the Act. Yes ¨ No x
Indicate by check mark whether the registrant (1) has filed all reports required to be filed by Section 13 or 15(d) of the Securities Exchange Act of 1934 during the preceding 12 months (or for such shorter period that the registrant was required to file such reports), and (2) has been subject to such filing requirements for the past 90 days. Yes x No ¨
Indicate by check mark whether the registrant has submitted electronically and posted on its corporate Web site, if any, every Interactive Data File required to be submitted and posted pursuant to Rule 405 of Regulation S-T (§ 232.405 of this chapter) during the preceding 12 months (or for such shorter period that the registrant was required to submit and post such files). Yes ¨ No ¨
Indicate by check mark if disclosure of delinquent filers pursuant to Item 405 of Regulation S-K is not contained herein, and will not be contained to the best of registrant’s knowledge, in definitive proxy or information statements incorporated by reference in Part III of this Form 10-K or any amendment to this Form 10-K. ¨
Indicate by check mark whether the registrant is a large accelerated filer, an accelerated filer, a non-accelerated filer, or a smaller reporting company. See the definitions of “large accelerated filer,” “accelerated filer” and “smaller reporting company” in Rule 12b-2 of the Exchange Act. (Check one):
| Large accelerated filer | ¨ | Accelerated filer | ¨ | |||
| Non-accelerated filer | x (Do not check if a smaller reporting company) | Smaller reporting company | ¨ | |||
Indicate by check mark whether the registrant is a shell company (as defined by Rule 12b-2 of the Act). Yes ¨ No x
The aggregate market value of the voting and non-voting stock held by non-affiliates of the Registrant, based on the closing sale price of the Registrant’s common stock on July 3, 2009, as reported on the NASDAQ Global Market, was approximately $46.9 million. Shares of common stock held by each executive officer and director and by each person who may be deemed to be an affiliate of the Registrant have been excluded from this computation. The determination of affiliate status for this purpose is not necessarily a conclusive determination for other purposes.
Number of shares of the registrant’s common stock outstanding as of February 26, 2010: 21,545,881
Portions of the registrant’s definitive proxy statement to be delivered to stockholders in connection with the 2010 annual meeting of stockholders are incorporated by reference in Part III of this Form 10-K.
Table of Contents
| Page | ||||
| PART I | ||||
| Item 1 |
Business | 3 | ||
| Item 1A |
Risk Factors | 10 | ||
| Item 1B |
Unresolved Staff Comments | 20 | ||
| Item 2 |
Properties | 20 | ||
| Item 3 |
Legal Proceedings | 21 | ||
| Item 4 |
Reserved | 21 | ||
| PART II | ||||
| Item 5 |
22 | |||
| Item 6 |
Selected Consolidated Financial Data | 23 | ||
| Item 7 |
Management’s Discussion and Analysis of Financial Condition and Results of Operations | 24 | ||
| Item 7A |
Quantitative and Qualitative Disclosures About Market Risk | 34 | ||
| Item 8 |
Financial Statements and Supplementary Data | 35 | ||
| Item 9 |
Changes in and Disagreements With Accountants on Accounting and Financial Disclosure | 58 | ||
| Item 9A |
Controls and Procedures | 58 | ||
| Item 9B |
Other Information | 58 | ||
| PART III | ||||
| Item 10 |
Directors and Executive Officers of the Registrant | 59 | ||
| Item 11 |
Executive Compensation | 59 | ||
| Item 12 |
Security Ownership of Certain Beneficial Owners and Management and Related Stockholder Matters |
59 | ||
| Item 13 |
Certain Relationships and Related Transactions | 60 | ||
| Item 14 |
Principal Accountant Fees and Services | 60 | ||
| PART IV | ||||
| Item 15 |
Exhibits, Financial Statement Schedules | 61 | ||
2
Table of Contents
This Annual Report on Form 10-K contains forward-looking statements regarding future events and our future results. These statements are based on current expectations, estimates, forecasts, and projections about the industries in which we operate and the beliefs and assumptions of our management. Words such as “expects,” “anticipates,” “targets,” “goals,” “projects,” “intends,” “plans,” “believes,” “seeks,” “estimates,” “continues,” “may,” variations of such words, and similar expressions are intended to identify such forward-looking statements. These forward-looking statements include, but are not limited to, statements concerning the following: projections of our financial performance, our anticipated growth and trends in our business, levels of capital expenditures, the adequacy of our capital resources to fund operations and growth, our ability to compete effectively with our competitors, our strategies and ability to protect our intellectual property, future acquisitions, customer demand, our manufacturing and procurement process, employee matters, supplier relations, foreign operations (including our operations in China), the legal and regulatory backdrop (including environmental regulation), our exposure to market risks and other characterizations of future events or circumstances described in this Annual Report. Readers are cautioned that these forward-looking statements are only predictions and are subject to risks, uncertainties, and assumptions that are difficult to predict, including those identified below, under “Risk Factors,” and elsewhere herein. Therefore, actual results may differ materially and adversely from those expressed in any forward-looking statements. We undertake no obligation to revise or update any forward-looking statements for any reason.
| Item 1. | Business |
Overview
We are a leading developer and supplier of critical subsystems, primarily for the semiconductor capital equipment industry. We also leverage the specialized skill sets required to support semiconductor capital equipment to serve the technologically similar markets in the flat panel, medical, energy and research industries, collectively referred to as “Other Addressed Industries”. We develop, design, prototype, engineer, manufacture and test subsystems which are highly specialized and tailored to specific steps in the semiconductor manufacturing process as well as the manufacturing processes in Other Addressed Industries. Our revenue is derived from the sale of gas delivery systems and other critical subsystems including chemical mechanical planarization (CMP) subsystems, chemical delivery modules, top-plate assemblies, frame assemblies, process modules and other high level assemblies.
Our customers are primarily original equipment manufacturers (OEMs) in the industries we support. We provide our customers complete subsystem solutions that combine our expertise in design, test, component characterization and highly flexible manufacturing operations with quality control and financial stability. This combination helps us to drive down total manufacturing costs, reduce design-to-delivery cycle times and maintain high quality standards for our customers. We believe these characteristics, as well as our standing as a leading supplier of gas delivery systems and other critical subsystems, place us in a strong position to benefit from the growing demand for subsystem outsourcing.
We had sales of $159.8 million, $266.9 million and $403.8 million for the 2009, 2008 and 2007 fiscal years, respectively. Our three largest customers in 2009 were Applied Materials, Inc., Intuitive Surgical, Inc. and Lam Research Corporation. To date, we have shipped substantially all of our products to customers in the United States. We conduct our operating activities primarily through our wholly owned subsidiaries, Ultra Clean Technology Systems and Service, Inc., Ultra Clean Technology (Shanghai) Co., Ltd and Ultra Clean Micro-Electronics Equipment (Shanghai) Co., Ltd. Our international sales represented 2.2%, 1.8% and 2.2% of sales for the years ended January 1, 2010, January 2, 2009 and December 28, 2007, respectively.
Ultra Clean Holdings, Inc. (Ultra Clean) was founded in November 2002 for the purpose of acquiring Ultra Clean Technology Systems and Service Inc. Ultra Clean Technology Systems and Service, Inc. was founded in 1991 by Mitsubishi Corporation and was operated as a subsidiary of Mitsubishi until November 2002, when it
3
Table of Contents
was acquired by Ultra Clean Holdings, Inc. Ultra Clean Holdings, Inc. became a publicly traded company in March 2004. In June 2006, we completed the acquisition of Sieger Engineering, Inc. to better enhance our position as a subsystem supplier to the semiconductor, research, flat panel, energy and medical equipment industries. Ultra Clean Technology (Shanghai) Co., Ltd and Ultra Clean Micro-Electronics Equipment (Shanghai) Co., Ltd. were established in 2005 and 2007, respectively, to facilitate our operations in China. Ultra Clean Asia Pacific, Pte, Ltd., was established in fiscal 2008 to facilitate our operations in Singapore.
Our Solution
We are a leading developer and supplier of critical subsystems for the semiconductor capital equipment industry and Other Addressed Industries. Our products enable our OEM customers to realize lower manufacturing costs and reduced design-to-delivery cycle times while maintaining quality standards. We offer our customers:
An integrated outsourced solution for gas delivery systems and other critical subsystems. We provide our OEM customers a complete outsourced solution for the development, design, prototyping, engineering, manufacturing and testing of advanced gas delivery systems and other critical subsystems. We combine highly specialized engineering and manufacturing capabilities to produce high performance products that are customized to meet the needs of our customers, as well as their respective end users. We manage supply chain logistics in an effort to reduce the overall number of suppliers and inventory levels that our customers would otherwise be required to manage. We also believe we are often in a position to negotiate reduced component prices due to our large volume orders.
Improved design-to-delivery cycle times. Our strong relationships with our customers and intimate familiarity with their products and requirements help us reduce design-to-delivery cycle times for gas delivery systems or other critical subsystems. We have optimized our supply chain management, design and manufacturing coordination and controls to respond rapidly to order requests, enabling us to decrease design-to-delivery cycle times for our customers.
Component neutral design and manufacturing. We do not manufacture any of the components within our gas delivery systems and other critical subsystems ourselves. Our component neutral position enables us to recommend components on the basis of technology, performance and cost and to optimize our customers’ overall designs based on these criteria. Furthermore, our neutral approach allows us to maintain close relationships with a wide range of component suppliers.
Component testing capabilities. We utilize our engineering expertise to test and characterize key components and subsystems. We have made significant investments in advanced analytical and automated test equipment to test and qualify key components. We can perform diagnostic tests, design verification and failure analysis for customers and suppliers. Our analytical and testing capabilities enable us to evaluate multiple supplier component technologies and provide customers with a wide range of appropriate component and design choices for their subsystems.
Increased integration with OEMs through local presence. Our local presence in close proximity to the facilities of most of our OEM customers enables us to remain closely integrated with their design, development and implementation teams. This level of integration enables us to respond quickly and efficiently to customer changes and requests.
Precision machining capabilities. We manufacture high quality, precision machined parts using state of the art equipment capable of efficiently providing complex parts with exacting tolerance. Our diverse precision fabrication equipment enables us to manufacture a broad range of machined parts using a broad range of materials, from exotic metals to basic plastics. Our manufacturing capabilities include horizontal and vertical milling, turning and welding.
4
Table of Contents
Our Strategy
Our objective is to maintain our position as a leading developer and supplier of gas delivery systems and become a leading developer and supplier of other critical subsystems, primarily for the semiconductor capital equipment and Other Addressed Industries. Our strategy is comprised of the following key elements:
Continue to expand our market share with Semiconductor Capital Equipment OEMs. We believe that the increase in outsourcing among OEMs creates a significant market opportunity for us to grow our business with existing and new customers. While gas delivery systems are already largely outsourced, we believe our customers will continue to outsource other critical subsystems at a rapid pace and that we are well positioned to capture a significant portion of these new outsourcing opportunities. We believe that our continued focus on efficient manufacturing, reduced design-to-delivery cycle times and quality and reliability will also allow us to gain market share.
Continue to expand our market share in Other Addressed Markets: We believe we can leverage the attributes and skill sets which allow us to succeed in the Semiconductor Capital Equipment industry to increase our market share in technologically similar markets including research, flat panel, energy and medical equipment.
Leverage our expanding geographic presence in lower cost manufacturing regions. In March 2005, we completed construction of a manufacturing facility in Shanghai, China, allowing us to expand production in a low cost region. In November 2007, we completed construction of a second manufacturing facility in Shanghai, China to house our precision machined parts and subsystem assembly operations. These facilities put us in close proximity to the manufacturing facilities of potential customers and their end users. In Singapore, we opened a procurement office in October 2008 and in November 2009 we expanded our operations by opening a manufacturing facility.
Drive profitable growth with our flexible cost structure. We implement cost containment and capacity enhancement initiatives throughout the semiconductor capital equipment demand cycle and benefit greatly from our supply chain efficiencies. In addition, we believe our Shanghai and Singapore facilities position us to respond effectively to future business demands.
Continue to selectively pursue strategic acquisitions.
We may choose to further accelerate the growth of our business by selectively pursuing strategic acquisitions. We will continue to consider acquisitions that will enable us to expand our geographic presence, secure new customers and diversify into complementary products and markets as well as broaden our technological capabilities in semiconductor capital equipment manufacturing.
Products
We develop, design, prototype, engineer, manufacture and test subsystems, primarily for the semiconductor capital equipment, flat panel, medical, energy and research industries. A majority of our products consist of gas delivery systems that enable the precise delivery of numerous specialty gases used in a majority of the key steps in the semiconductor manufacturing process, including deposition, etch, cleaning and annealing. Our gas delivery systems control the flow, pressure, sequencing and mixing of specialty gases into and out of the reaction chambers of semiconductor manufacturing tools. Our products also include other critical subsystems, including chemical mechanical planarization modules, chemical delivery modules, top-plate assemblies, frame assemblies and process modules.
Gas delivery systems: A typical gas delivery system consists of one or more gas lines, comprised of several filters, mass flow controllers, regulators, pressure transducers and valves, associated interconnect tubing and an integrated electronic and/or pneumatic control system. These systems are mounted on a pallet and are typically enclosed in a sheet metal encasing. Our gas delivery system designs are developed in collaboration with our
5
Table of Contents
customers and are customized to meet the needs of specific OEMs. We do not sell standard systems. Our customers either specify the particular brands of components they want incorporated into a particular system or rely on our design expertise and component characterization capabilities to help them select the appropriate components for their particular system.
Chemical delivery modules: Chemical delivery modules deliver gases and reactive chemicals from a centralized subsystem to the reaction chamber and may include gas delivery systems, as well as liquid and vapor delivery systems.
Top-plate assemblies: Top-plate assemblies form the top portion of the reaction chamber within which gases controlled by our gas delivery systems react to form thin films or etch films on the wafer.
Frame assemblies: Frame assemblies are steel tubing that form the support structure to which all other assemblies are attached and include pneumatic harnesses and cables that connect other critical subsystems together.
Process modules: Process modules refer to the larger subsystems of semiconductor manufacturing tools that process integrated circuits onto wafers. Process modules include several smaller subsystems such as the frame assembly, top-plate assembly and gas and chemical delivery modules, as well as the chamber and electronic, pneumatic and mechanical subsystems.
Other high level assemblies: Other high level assemblies refer to large subsystems used in semiconductor manufacturing, research, flat panel, energy and medical equipment industries.
Customers
We sell our products to semiconductor capital equipment, flat panel, medical, energy and research industries. The majority of our revenue is in the semiconductor capital equipment industry, which is highly concentrated, and we are therefore highly dependent upon a small number of customers. Our three largest customers in 2009 were Applied Materials, Inc., Intuitive Surgical, Inc., and Lam Research Corporation, each of which accounted for more than 10% of our total sales in 2009 and 2008. As a group these three customers accounted for 79% and 81% of the Company’s sales for 2009 and 2008, respectively. In 2007, Applied Materials, Inc., Lam Research Corporation and Novellus Systems, Inc. each accounted for more than 10% of our total sales and as a group accounted for 84% of total sales. The level of our customer concentration has slightly declined in recent years due to our growth into adjacent markets, a trend which we expect to continue as we reinforce and expand our relationship with new, potentially significant customers.
We have successfully qualified as a supplier with each of our customers. This lengthy qualification process involves the inspection and audit of our facilities and evaluation by our customers of our engineering, documentation, manufacturing and quality control processes and procedures before that customer places orders for our products. Our customers generally place orders with suppliers who have met and continue to meet their qualification criteria.
Sales and Support
We sell our products through our direct sales force which, as of January 1, 2010, consisted of a total of 40 sales directors, account managers and sales support staff. Our sales directors are responsible for establishing sales strategy and setting the objectives for specific customer accounts. Each account manager is dedicated to a specific customer account and is responsible for the day-to-day management of that customer. Account managers work closely with customers and in many cases provide on-site support. Account managers often attend customers’ internal meetings related to production and engineering design and quality to ensure that customer expectations are interpreted and communicated properly to our operations group. Account managers also work with our customers to identify and meet their cost and design-to-delivery cycle time objectives.
6
Table of Contents
We have dedicated account managers responsible for new business development for gas delivery systems and other critical subsystems. Our new business development account managers initiate and develop long-term, multilevel relationships with customers and work closely with customers on new business opportunities throughout the design-to-delivery cycle. Our sales force includes technical sales support for order placement, spare parts quotes and production status updates. We have a technical sales representative located at each of our manufacturing facilities. In addition, we have developed a service and support infrastructure to provide our customers with service and support 24 hours a day, seven days a week. Our dedicated field service engineers provide customer support through the performance of on-site installation, servicing and repair of our subsystems.
Technology Development
We engage in ongoing technology development efforts in order to remain a technology leader for gas delivery systems and to further develop our expertise in other critical subsystems. In addition, our design engineering and new product engineering groups support our technology development activities. Our technology development group works closely with our customers to identify and anticipate changes and trends in next-generation equipment. Our technology development group participates in customer technology partnership programs that focus on process application requirements for gas delivery systems and other critical subsystems. These development efforts are designed to meet specific customer requirements in the areas of subsystem design, materials, component selection and functionality. Our technology development group also works directly with our suppliers to help them identify new component technologies and make necessary changes in, and enhancements to, the components that we integrate into our products. Our analytical and testing capabilities enable us to evaluate multiple supplier component technologies and provide customers with a wide range of appropriate component and design choices for their gas delivery systems and other critical subsystems. Our analytical and testing capabilities also help us anticipate technological changes and the requirements in component features for next-generation gas delivery systems and other critical subsystems. We are also developing additional features to improve the performance and functionality of our gas delivery systems and other critical subsystems. Our technology development and new product engineering expenses were approximately $3.2 million, $2.9 million and $3.0 million for the 2009, 2008 and 2007 fiscal years, respectively. We perform our technology development activities principally at our facilities in Hayward, California.
Intellectual Property
Our success depends in part on our ability to maintain and protect our proprietary technology and to conduct our business without infringing the proprietary rights of others. Our business is largely dependent upon our design, engineering, manufacturing and testing know-how. We also rely on a combination of trade secrets and confidentiality provisions, and to a much lesser extent, patents, copyrights and trademarks, to protect our proprietary rights. As of January 1, 2010, we had six issued United States patents, all of which expire in 2018, and we had six United States patent applications pending. None of our issued patents are material to our business. Intellectual property that we develop on behalf of our customers is generally owned exclusively by those customers.
We routinely require our employees, suppliers and potential business partners to enter into confidentiality and non-disclosure agreements before we disclose to them any sensitive or proprietary information regarding our products, technology or business plans. We require employees to assign to us proprietary information, inventions and other intellectual property they create, modify or improve.
Competition
Our industry is highly fragmented. When we compete for new business, we face competition from other suppliers of gas delivery systems and other critical subsystems as well as the internal manufacturing groups of OEMs. In addition, OEMs that have elected to outsource their gas delivery systems and other critical subsystems could elect in the future to develop and manufacture these subsystems internally, leading to further competition. Our principal competitors for our gas delivery systems are Ichor Systems, Inc., Advanced Integration Technologies, Precision Flow Technologies (PFT) and Intega, a subsidiary of Air Liquide, and our principal
7
Table of Contents
competitors for other critical subsystems are Flextronics International Ltd., Fox Semicon Integrated Technology Inc., Sanmina-SCI Corporation and Benchmark Electronics. Some of these competitors have substantially greater financial, technical, manufacturing and marketing resources than we do. We expect our competitors to continue to improve the performance of their current products and to introduce new products or new technologies that could adversely affect sales of our current and future products. In addition, the limited number of potential customers in our industry further intensifies competition. The primary competitive factors in our industry are price, technology, quality, design-to-delivery cycle time, reliability in meeting product demand, service and historical customer relationships. We anticipate that increased competitive pressures will cause intensified price-based competition and we may have to reduce the prices of our products. In addition, we expect to face new competitors as we enter new markets.
Employees
As of January 1, 2010, we had 901 employees, of which 191 were temporary. Of our total employees, there were 52 in engineering, 8 in technology development, 40 in sales and support, 556 in direct manufacturing, 168 in indirect manufacturing and 77 in executive and administrative functions. These figures include 271 employees in Shanghai, China and 21 employees in Singapore. None of our employees is represented by a labor union and we have not experienced any work stoppages.
Governmental Regulation and Environmental Matters
Our operations are subject to federal, state and local regulatory requirements and foreign laws relating to environmental, waste management and health and safety matters, including measures relating to the release, use, storage, treatment, transportation, discharge, disposal and remediation of contaminants, hazardous substances and wastes, as well as practices and procedures applicable to the construction and operation of our facilities. Our past or future operations may result in exposure to injury or claims of injury by employees or the public which may result in material costs and liabilities to us. Although some risk of costs and liabilities related to these matters is inherent in our business, we believe that our business is operated in substantial compliance with applicable regulations. However, new, modified or more stringent requirements or enforcement policies could be adopted, which could adversely affect us.
Available Information
We file with the SEC annual reports on Form 10-K, quarterly reports on Form 10-Q and current reports on Form 8-K pursuant to Section 13(a) or 15(d) of the Securities Exchange Act of 1934, as amended, or the Exchange Act. You may read and copy any materials we file with the SEC at the public reference facilities maintained by the SEC at Room 1024, Judiciary Plaza, 100 F Street, N.E., Washington, D.C. 20549. You may also request copies of all or any portion of such material from the SEC at prescribed rates. Please call the SEC at 1-800-SEC-0330 for further information on the operation of the public reference room. In addition, materials filed electronically with the SEC are available at the SEC’s website at http://www.sec.gov.
In addition, we make available free of charge, on or through our website at http://www.uct.com, our annual, quarterly and current reports and any amendments to those reports, as soon as reasonably practicable after electronically filing such reports with, or furnishing them to, the SEC. This website address is intended to be an inactive textual reference only; none of the information contained on our website is part of this report or is incorporated by reference herein.
8
Table of Contents
Executive Officers
Set forth below is information concerning our executive officers as of February 26, 2010:
| Name |
Age | Position | ||
| Clarence L. Granger |
61 | Chairman & Chief Executive Officer | ||
| David Savage |
48 | President and Chief Operating Officer | ||
| Kevin C. Eichler |
50 | Senior Vice President and Chief Financial Officer | ||
| Bruce Wier |
62 | Senior Vice President of Engineering | ||
| Deborah Hayward |
48 | Senior Vice President of Sales |
Clarence L. Granger has served as our Chairman & Chief Executive Officer since October 2006, as our Chief Executive Officer since November 2002, as Chief Operating Officer from March 1999 to November 2002 and as a member of our board of directors since May 2002. Mr. Granger served as our Executive Vice President and Chief Operating Officer from January 1998 to March 1999 and as our Executive Vice President of Operations from April 1996 to January 1998. Prior to joining Ultra Clean in April 1996, he served as Vice President of Media Operations for Seagate Technology from 1994 to 1996. Prior to that, Mr. Granger worked for HMT Technology as Chief Executive Officer from 1993 to 1994, as Chief Operating Officer from 1991 to 1993 and as President from 1989 to 1994. Prior to that, Mr. Granger worked for Xidex as Vice President and General Manager, Thin Film Disk Division, from 1988 to 1989, as Vice President, Santa Clara Oxide Disk Operations, from 1987 to 1988, as Vice President, U.S. Tape Operations, from 1986 to 1987 and as Director of Engineering from 1983 to 1986. Mr. Granger holds a master of science degree in industrial engineering from Stanford University and a bachelor of science degree in industrial engineering from the University of California at Berkeley.
David Savage has served as our President and Chief Operating Officer since January 2008. Before joining Ultra Clean, Mr. Savage was Chief Executive Officer of Litel Instruments, Inc., a semiconductor optical metrology business from March 2007 to July 2007. Prior to Litel, Mr. Savage was the President, Electronics Division of Meggitt USA, Inc. where he led a division focusing on high performance sensors from September 2002 to March 2007. Prior to Meggitt, Mr. Savage founded and served as Chief Executive Officer of DigMedia, a media delivery business focused on broadband service providers from October 1998 to August 2002. Mr. Savage holds a bachelor degree in metallurgical engineering from Sheffield Hallam University in Sheffield, England.
Kevin C. Eichler has served as our Senior Vice President and Chief Financial Officer since July 2009. Prior to joining Ultra Clean, Mr. Eichler served on the Board of Directors of Ultra Clean from February 2004 to July 2009. Mr. Eichler was the Senior Vice President and Chief Financial Officer of Credence Systems from January 2008 to November 2008, and the Executive Vice President of Operations and Chief Financial Officer of MarketTools from March 2006 to December 2007. He served as the Vice President and Chief Financial Officer of MIPS Technologies from June 1998 to February 2006. Prior to that, he held management positions with several technology companies including Visigenic Software, NeXT Software and Microsoft. Mr. Eichler is on the board of directors of SupportSoft, Inc. (Nasdaq: SPRT) and Magma Design Automation, Inc. (Nasdaq: LAVA). Mr. Eichler holds a bachelor of science degree in accounting from St. John’s University.
Bruce Wier has served as our Senior Vice President of Engineering since January 2007 and Vice President of Engineering since February 2000. Mr. Wier served as our Director of Design Engineering from July 1997 to February 2000. Prior to joining Ultra Clean in July 1997, Mr. Wier was the Engineering Manager for the Oxide Etch Business Unit at Lam Research from April 1993 to June 1997. Prior to that, Mr. Wier was the Senior Project Engineering Manager at Genus from May 1990 to April 1993, the Mechanical Engineering Manager at Varian Associates from November 1985 to May 1990, and the Principal Engineer/Project Manager at Eaton Corporation from February 1981 to November 1985. Mr. Wier is also on the board of directors of, and is the Chief Financial Officer for, Acorn Travel, a travel company formed by his wife in 1999. Mr. Wier holds a bachelor of science degree cum laude in mechanical engineering from Syracuse University.
9
Table of Contents
Deborah Hayward has served as our Senior Vice President of Sales since January 2007 and Vice President of Sales since October 2002. Ms. Hayward served as our Senior Sales Director from May 2001 to October 2002, as Sales Director from February 1998 to May 2001 and as a major account manager from October 1995 to February 1998. Prior to joining Ultra Clean in 1995, she was a customer service manager and account manager at Brooks Instruments from 1985 to 1995.
| Item 1A. | Risk Factors |
We are exposed to risks associated with the global economy.
The global economy has contributed to slowdowns in the industries in which we operate. Reduced growth and uncertainty regarding future growth in economies throughout the world have caused companies to reduce capital investment and may in the future cause further reduction of such investments. Economic uncertainty has led to low consumer confidence levels and has caused and may in the future cause our customers to push out, cancel, or refrain from placing orders with us, which in turn has reduced and may in the future reduce our sales and negatively impact our cash flow. Our sales were $72.8 million in the fourth quarter of 2009 compared to $47.1 million for the fourth quarter of 2008 and $159.8 million for fiscal year 2009 compared to $266.9 million for fiscal year 2008. We incurred a net loss of $20.0 million for the year ended January 1, 2010. While it appears that the economy has entered a period of gradual recovery, we may experience future economic slowdowns and significant fluctuations in customer orders. Also, as a result of the global economy, certain of our suppliers have been or may be forced out of business, which would require us to either procure products from high-cost suppliers, or if no additional suppliers exist, to reconfigure the design and manufacture of our products, and we may be unable to fulfill some customer orders. Furthermore, the tightening of credit in financial markets may delay or prevent our customers from securing funding adequate to operate their businesses and purchase our products.
Furthermore, the equity and credit markets have been experiencing a high level of volatility and disruption. The market for new equity and debt financing is limited and in some cases not available at all. There is also uncertainty that lenders will satisfy their commitments under existing facilities. If current levels of market disruption and volatility continue or worsen, we may not be able to draw upon our revolving credit facility, incur additional debt or raise new equity in the event we need to do so. These conditions and uncertainty about future economic conditions make it challenging for us to forecast our operating results, make business decisions, and identify the risks that may affect our business, financial condition and results of operations. If we are not able to timely and appropriately adapt to changes resulting from the difficult macroeconomic environment, our business, financial condition and results of operations could be adversely affected.
The highly volatile nature of the industries we serve could harm our operating results.
Our business and operating results depend in significant part upon capital expenditures by manufacturers in the semiconductor capital equipment, flat panel, medical, energy and research industries, which in turn depend upon the current and anticipated market demand for such products. Historically, the industries we serve (in particular the semiconductor industry) have been highly cyclical, with recurring periods of over-supply of products that have had a severe negative effect on the demand for capital equipment used to manufacture such products. We have experienced and anticipate that we will continue to experience significant fluctuations in customer orders for our products through such cycles. Slowdowns in the industries we serve have had, and future slowdowns may also have, a material adverse effect on our operating results. During periods of decreasing demand for our products, we must be able to appropriately align our cost structure with prevailing market conditions, effectively manage our supply chain and motivate and retain employees. During periods of increasing demand, we must increase manufacturing capacity and inventory to meet customer demands, effectively manage our supply chain and attract, retain and motivate a sufficient number of qualified employees. If we are not able to timely and appropriately adapt to the changes in our business environment, our results of operations will be harmed. Also, the cyclical and volatile nature of the industries we serve make future revenues, results of operations and net cash flows difficult to estimate.
10
Table of Contents
We rely on a small number of customers for a significant portion of our sales, and any impairment of our relationships with these customers would adversely affect our business.
A relatively small number of OEM customers have historically accounted for a significant portion of our sales, and we expect this trend to continue. Our three largest customers in 2009 were Applied Materials, Inc., Intuitive Surgical, Inc., and Lam Research Corporation, each of which accounted for more than 10% of our total sales in 2009 and 2008. As a group these three customers accounted for 79% and 81% of the Company’s sales for 2009 and 2008, respectively. In 2007, Applied Materials, Inc., Lam Research Corporation and Novellus Systems, Inc. accounted for more than 10% of our total sales and as a group accounted for 84% of total sales. Because of the small number of OEMs in the markets we serve, most of which are already our customers, it would be difficult to replace lost revenue resulting from the loss of, or the reduction, cancellation or delay in purchase orders by any one of these customers. Our customer contracts generally do not require them to place any orders with us. Consolidation among our customers, or a decision by any one or more of our customers to outsource all or most manufacturing and assembly work to a single equipment manufacturer, may further concentrate our business in a limited number of customers and expose us to increased risks relating to dependence on an even smaller number of customers.
In addition, by virtue of our customers’ size and the significant portion of revenue that we derive from them, they are able to exert significant influence and pricing pressure in the negotiation of our commercial agreements and the conduct of our business with them. We may also be asked to accommodate customer requests that extend beyond the express terms of our agreements in order to maintain our relationships with our customers. If we are unable to retain and expand our business with these customers on favorable terms, our business and operating results will be adversely affected.
We have had to qualify, and are required to maintain our status, as a supplier for each of our customers. This is a lengthy process that involves the inspection and approval by a customer of our engineering, documentation, manufacturing and quality control procedures before that customer will place volume orders. Our ability to lessen the adverse effect of any loss of, or reduction in sales to, an existing customer through the rapid addition of one or more new customers is minimal because of these qualification requirements. Consequently, our business, operating results and financial condition would be adversely affected by the loss of, or any reduction in orders by, any of our significant customers.
Our quarterly revenue and operating results fluctuate significantly from period to period, and this may cause volatility in our common stock price.
Our quarterly revenue and operating results have fluctuated significantly in the past, and we expect them to continue to fluctuate in the future for a variety of reasons which may include:
| • | demand for and market acceptance of our products as a result of the cyclical nature of the industries we serve or otherwise, often resulting in reduced sales during industry downturns and increased sales during periods of industry recovery; |
| • | overall economic conditions; |
| • | changes in the timing and size of orders by our customers; |
| • | cancellations and postponements of previously placed orders; |
| • | pricing pressure from either our competitors or our customers, resulting in the reduction of our product prices; |
| • | disruptions or delays in the manufacturing of our products or in the supply of components or raw materials that are incorporated into or used to manufacture our products, thereby causing us to delay the shipment of products; |
| • | decreased margins for several or more quarters following the introduction of new products, especially as we introduce new subsystems; |
11
Table of Contents
| • | delays in ramp-up in production, low yields or other problems experienced at our manufacturing facilities in China; |
| • | changes in design-to-delivery cycle times; |
| • | inability to reduce our costs quickly in step with reductions in our prices or in response to decreased demand for our products; |
| • | changes in our mix of products sold; |
| • | write-offs of excess or obsolete inventory; |
| • | one-time expenses or charges associated with failed acquisition negotiations or completed acquisitions; |
| • | announcements by our competitors of new products, services or technological innovations, which may, among other things, render our products less competitive; and |
| • | geographic mix of worldwide earnings. |
As a result of the foregoing, we believe that quarter-to-quarter comparisons of our revenue and operating results may not be meaningful and that these comparisons may not be an accurate indicator of our future performance. Changes in the timing or terms of a small number of transactions could disproportionately affect our operating results in any particular quarter. Moreover, our operating results in one or more future quarters may fail to meet the expectations of securities analysts or investors. If this occurs, we would expect to experience an immediate and significant decline in the trading price of our common stock.
We have established, and as markets will allow, intend to expand our operations in Asia, which exposes us to risks associated with operating in a foreign country.
We intend to expand, as markets will allow, our operations in Asia, which includes China and Singapore. Our total assets in Asia at January 1, 2010 were $27 million.
We are exposed to political, economic, legal and other risks associated with operating in Asia, including:
| • | foreign currency exchange fluctuations; |
| • | political, civil and economic instability; |
| • | tariffs and other barriers; |
| • | timing and availability of export licenses; |
| • | disruptions to our and our customers’ operations due to the outbreak of communicable diseases, such as SARS and avian flu; |
| • | disruptions in operations due to the weakness of China’s domestic infrastructure, including transportation and energy; |
| • | difficulties in developing relationships with local suppliers; |
| • | difficulties in attracting new international customers; |
| • | difficulties in accounts receivable collections; |
| • | difficulties in staffing and managing a distant international subsidiary and branch operations; |
| • | the burden of complying with foreign and international laws and treaties; |
| • | difficulty in transferring funds to other geographic locations; and |
| • | potentially adverse tax consequences. |
Our operations in Asia also subject us to U.S. laws governing the export of equipment. These laws are complex and require us to obtain clearances for the export to Asia of certain equipment. We may fail to comply with these laws and regulations, which could require us to cease use of certain equipment and expose us to fines or penalties.
12
Table of Contents
Over the past several years the Chinese government has pursued economic reform policies, including the encouragement of private economic activity and greater economic decentralization. The Chinese government may not continue these policies or may significantly alter them to our detriment from time to time without notice. Changes in laws and regulations or their interpretation, the imposition of confiscatory taxation policies, new restrictions on currency conversion or limitations on sources of supply could materially and adversely affect our Chinese operations, which could result in the partial or total loss of our investment in that country and materially and adversely affect our future operating results.
Third parties have claimed and may in the future claim we are infringing their intellectual property, which could subject us to litigation or licensing expenses, and we may be prevented from selling our products if any such claims prove successful.
We have in the past and may in the future receive claims that our products, processes or technologies infringe the patents or other proprietary rights of third parties. In addition, we may be unaware of intellectual property rights of others that may be applicable to our products. Any litigation regarding our patents or other intellectual property could be costly and time-consuming and divert our management and key personnel from our business operations, any of which could have a material adverse effect on our business and results of operations. The complexity of the technology involved in our products and the uncertainty of intellectual property litigation increase these risks. Claims of intellectual property infringement may also require us to enter into costly license agreements. However, we may not be able to obtain licenses on terms acceptable to us, or at all. We also may be subject to significant damages or injunctions against the development, manufacture and sale of certain of our products if any such claims prove successful.
We are subject to order and shipment uncertainties and any significant reductions, cancellations or delays in customer orders could cause our revenue to decline and our operating results to suffer.
Our revenue is difficult to forecast because we generally do not have a material backlog of unfilled orders and because of the short time frame within which we are often required to design, produce and deliver products to our customers. Most of our revenue in any quarter depends on customer orders for our products that we receive and fulfill in the same quarter. We do not have long-term purchase orders or contracts that contain minimum purchase commitments from our customers. Instead, we receive non-binding forecasts of the future volume of orders from our customers. Occasionally, we order and build component inventory in advance of the receipt of actual customer orders. Customers may cancel order forecasts, change production quantities from forecasted volumes or delay production for reasons beyond our control. Furthermore, reductions, cancellations or delays in customer order forecasts usually occur without penalty to, or compensation from, the customer. Reductions, cancellations or delays in forecasted orders could cause us to hold inventory longer than anticipated, which could reduce our gross profit, restrict our ability to fund our operations and cause us to incur unanticipated reductions or delays in revenue. If we do not obtain orders as we anticipate, we could have excess component inventory for a specific product that we would not be able to sell to another customer, likely resulting in inventory write-offs, which could have a material adverse effect on our business, financial condition and operating results. In addition, because many of our costs are fixed in the short term, we could experience deterioration in our gross profit when our production volumes decline.
The manufacturing of our products is highly complex, and if we are not able to manage our manufacturing and procurement process effectively, our business and operating results will suffer.
The manufacturing of our products is a highly complex process that involves the integration of multiple components and requires effective management of our supply chain while meeting our customers’ design-to-delivery cycle time requirements. Through the course of the manufacturing process, our customers may modify design and system configurations in response to changes in their own customers’ requirements. In order to rapidly respond to these modifications and deliver our products to our customers in a timely manner, we must effectively manage our manufacturing and procurement process. If we fail to manage this process effectively, we risk losing customers and damaging our reputation. In addition, if we acquire inventory in excess of demand or
13
Table of Contents
that does not meet customer specifications, we could incur excess or obsolete inventory charges. These risks are even greater during an economic downturn as we are currently experiencing and as we continue to expand our business beyond gas delivery systems into new subsystems. In this economic downturn, certain of our suppliers may be forced out of business, which would require us to either procure product from higher-cost suppliers or, if no additional suppliers exist, reconfigure the design and manufacture of our products. This could limit our growth and have a material adverse effect on our business, financial condition and operating results.
OEMs may not continue to outsource other critical subsystems, which would adversely impact our operating results.
The success of our business depends on OEMs continuing to outsource the manufacturing of critical subsystems. Most of the largest OEMs have already outsourced production of a significant portion of their critical subsystems. If OEMs do not continue to outsource critical subsystems for their capital equipment, our revenue would be significantly reduced, which would have a material adverse effect on our business, financial condition and operating results. In addition, if we are unable to obtain additional business from OEMs, even if they continue to outsource their production of critical subsystems, our business, financial condition and operating results could be adversely affected.
If our new products are not accepted by OEMs or if we are unable to maintain historical margins on our new products, our operating results would be adversely impacted.
We design, develop and market critical subsystems to OEMs. Sales of new products are expected to make up an increasing part of our total revenue. The introduction of new products is inherently risky because it is difficult to foresee the adoption of new standards, coordinate our technical personnel and strategic relationships and win acceptance of new products by OEMs. We may not be able to recoup design and development expenditures if our new products are not accepted by OEMs. Newly introduced products typically carry lower gross margins for several or more quarters following their introduction. If any of our new subsystems is not successful in the market, or if we are unable to obtain gross margins on new products that are similar to the gross margins we have historically achieved, our business, operating results and financial condition could be adversely affected.
We may not be able to integrate efficiently the operations of past and future acquired businesses.
We have made, and may in the future consider making, additional acquisitions of, or significant investments in, businesses that offer complementary products, services, technologies or market access. For example, we acquired Sieger Engineering, Inc. in June 2006. If we are to realize the anticipated benefits of past and future acquisitions or investments, the operations of these companies must be integrated and combined efficiently with our own. The process of integrating supply and distribution channels, computer and accounting systems, and other aspects of operations, while managing a larger entity, have and will present a significant challenge to our management. In addition, it is not certain that we will be able to incorporate different financial and reporting controls, processes, systems and technologies into our existing business environment. The difficulties of integration may increase because of the necessity of combining personnel with varied business backgrounds and combining different corporate cultures and objectives. We may assume substantial debt and incur substantial costs associated with these activities and we may suffer other material adverse effects from these integration efforts which could materially reduce our earnings, even over the long-term. We may not succeed with the integration process and we may not fully realize the anticipated benefits of the business combinations. The dedication of management resources to such integration or divestitures may detract attention from the day-to-day business, and we may need to hire additional management personnel to manage our acquisitions successfully.
In addition, we frequently evaluate acquisitions of, or significant investments in, complementary companies, assets, businesses and technologies. Even if an acquisition or other investment is not completed, we may incur significant management time and effort and financial cost in evaluating such acquisition or investment, which has
14
Table of Contents
in the past had, and could in the future have, an adverse effect on our results of operations. Furthermore, due to the limited liquidity in the credit market, the financing of any such acquisition may be difficult to obtain, and the terms of such financing may be less favorable.
Our business is largely dependent on the know-how of our employees, and we generally do not have a protected intellectual property position.
Our business is largely dependent upon our design, engineering, manufacturing and testing know-how. We rely on a combination of trade secrets and contractual confidentiality provisions and, to a much lesser extent, patents, copyrights and trademarks to protect our proprietary rights. Accordingly, our intellectual property position is more vulnerable than it would be if it were protected by patents. If we fail to protect our proprietary rights successfully, our competitive position could suffer, which could harm our operating results. We may be required to spend significant resources to monitor and protect our proprietary rights, and, in the event we do not detect infringement of our proprietary rights, we may lose our competitive position in the market if any such infringement occurs. In addition, competitors may design around our technology or develop competing technologies and know-how.
If we do not keep pace with developments in the industries we serve and with technological innovation generally, our products may not be competitive.
Rapid technological innovation in the markets we serve requires us to anticipate and respond quickly to evolving customer requirements and could render our current product offerings and technology obsolete. Technological innovations are inherently complex. We must devote resources to technology development in order to keep pace with such rapidly evolving technologies. We believe that our future success will depend upon our ability to design, engineer and manufacture products that meet the changing needs of our customers. This requires that we successfully anticipate and respond to technological changes in design, engineering and manufacturing processes in a cost-effective and timely manner. If we are unable to integrate new technical specifications into competitive product designs, develop the technical capabilities necessary to manufacture new products or make necessary modifications or enhancements to existing products, our business prospects could be harmed.
The timely development of new or enhanced products is a complex and uncertain process which requires that we:
| • | design innovative and performance-enhancing features that differentiate our products from those of our competitors; |
| • | identify emerging technological trends in the industries we serve, including new standards for our products; |
| • | accurately identify and design new products to meet market needs; |
| • | collaborate with OEMs to design and develop products on a timely and cost-effective basis; |
| • | ramp-up production of new products, especially new subsystems, in a timely manner and with acceptable yields; |
| • | successfully manage development production cycles; and |
| • | respond effectively to technological changes or product announcements by others. |
The industries in which we participate are highly competitive and rapidly evolving, and if we are unable to compete effectively, our operating results would be harmed.
Although we have not faced competition in the past from the largest subsystem and component manufacturers in the industries we serve, these suppliers could compete with us in the future. Increased
15
Table of Contents
competition has in the past resulted, and could in the future result, in price reductions, reduced gross margins or loss of market share, any of which would harm our operating results. We are subject to pricing pressure as we attempt to increase market share with our existing customers. Competitors may introduce new products for the markets currently served by our products. These products may have better performance, lower prices and achieve broader market acceptance than our products. Further, OEMs typically own the design rights to their products and may provide these designs to other subsystem manufacturers. If our competitors obtain proprietary rights to these designs such that we are unable to obtain the designs necessary to manufacture products for our OEM customers, our business, financial condition and operating results could be adversely affected.
Our competitors may have greater financial, technical, manufacturing and marketing resources than we do. As a result, they may be able to respond more quickly to new or emerging technologies and changes in customer requirements, devote greater resources to the development, promotion, sale and support of their products, and reduce prices to increase market share. Moreover, there may be merger and acquisition activity among our competitors and potential competitors that may provide our competitors and potential competitors an advantage over us by enabling them to expand their product offerings and service capabilities to meet a broader range of customer needs. Further, if one of our customers develops or acquires the internal capability to develop and produce critical subsystems that we produce, the loss of that customer could have a material adverse effect on our business, financial condition and operating results. The introduction of new technologies and new market entrants may also increase competitive pressures.
We must achieve design wins to retain our existing customers and to obtain new customers.
New capital equipment typically has a lifespan of several years, and OEMs frequently specify which systems, subsystems, components and instruments are to be used in their equipment. Once a specific system, subsystem, component or instrument is incorporated into a piece of capital equipment, it will likely continue to be incorporated into that piece of equipment for at least several months before the OEM switches to the product of another supplier.
Accordingly, it is important that our products are designed into the new capital equipment of OEMs, which we refer to as a design win, in order to retain our competitive position with existing customers and to obtain new customers.
We incur technology development and sales expenses with no assurance that our products will ultimately be designed into an OEM’s capital equipment. Further, developing new customer relationships, as well as increasing our market share at existing customers, requires a substantial investment of our sales, engineering and management resources without any assurance from prospective customers that they will place significant orders. We believe that OEMs often select their suppliers and place orders based on long-term relationships. Accordingly, we may have difficulty achieving design wins from OEMs that are not currently our customers. Our operating results and potential growth could be adversely affected if we fail to achieve design wins with leading OEMs.
We may not be able to respond quickly enough to increases in demand for our products.
Demand shifts in the industries we serve are rapid and difficult to predict, and we may not be able to respond quickly enough to an increase in demand. Our ability to increase sales of our products depends, in part, upon our ability to:
| • | mobilize our supply chain in order to maintain component and raw material supply; |
| • | optimize the use of our design, engineering and manufacturing capacity in a timely manner; |
| • | deliver our products to our customers in a timely fashion; |
| • | expand, if necessary, our manufacturing capacity; and |
| • | maintain our product quality as we increase production. |
16
Table of Contents
If we are unable to respond to rapid increases in demand for our products on a timely basis or to manage any corresponding expansion of our manufacturing capacity effectively, our customers could increase their purchases from our competitors, which would adversely affect our business.
Our dependence on our suppliers may prevent us from delivering an acceptable product on a timely basis.
We rely on both single-source and sole-source suppliers, some of whom are relatively small, for many of the components we use in our products. In addition, our customers often specify components of particular suppliers that we must incorporate into our products. Our suppliers are under no obligation to provide us with components. As a result, the loss of or failure to perform by any of these providers could adversely affect our business and operating results. The risk of such a loss is particularly high as a result of the current economic downturn, as many of our suppliers have announced poor operating results and have limited access to capital. In addition, the manufacturing of certain components and subsystems is an extremely complex process. Therefore, if a supplier were unable to provide the volume of components we require on a timely basis and at acceptable prices, we would have to identify and qualify replacements from alternative sources of supply. The process of qualifying new suppliers for these complex components is lengthy and could delay our production, which would adversely affect our business, operating results and financial condition. We may also experience difficulty in obtaining sufficient supplies of components and raw materials in times of significant growth in our business. For example, we have in the past experienced shortages in supplies of various components, such as mass flow controllers, valves and regulators, and certain prefabricated parts, such as sheet metal enclosures, used in the manufacture of our products. In addition, one of our competitors manufactures mass flow controllers that may be specified by one or more of our customers. If we are unable to obtain these particular mass flow controllers from our competitor or convince a customer to select alternative mass flow controllers, we may be unable to meet that customer’s requirements, which could result in a loss of market share.
Defects in our products could damage our reputation, decrease market acceptance of our products, cause the unintended release of hazardous materials and result in potentially costly litigation.
A number of factors, including design flaws, material and component failures, contamination in the manufacturing environment, impurities in the materials used and unknown sensitivities to process conditions, such as temperature and humidity, as well as equipment failures, may cause our products to contain undetected errors or defects. Problems with our products may:
| • | cause delays in product introductions and shipments; |
| • | result in increased costs and diversion of development resources; |
| • | cause us to incur increased charges due to unusable inventory; |
| • | require design modifications; |
| • | decrease market acceptance of, or customer satisfaction with, our products, which could result in decreased sales and product returns; or |
| • | result in lower yields for semiconductor manufacturers. |
If any of our products contain defects or have reliability, quality or compatibility problems, our reputation might be damaged and customers might be reluctant to buy our products. We may also face a higher rate of product defects as we increase our production levels. Product defects could result in the loss of existing customers or impair our ability to attract new customers. In addition, we may not find defects or failures in our products until after they are installed in a manufacturer’s fabrication facility. We may have to invest significant capital and other resources to correct these problems. Our current or potential customers also might seek to recover from us any losses resulting from defects or failures in our products. Hazardous materials flow through and are controlled by our products and an unintended release of these materials could result in serious injury or death. Liability claims could require us to spend significant time and money in litigation or pay significant damages.
17
Table of Contents
We have outstanding indebtedness; the restrictive covenants under our debt agreements may limit our ability to expand or pursue our business strategy; if we are forced to prepay some or all of this indebtedness our financial position would be severely and adversely affected.
We have outstanding indebtedness. At the end of our fiscal 2010, our long-term debt was $13.1 million and our short-term debt was $2.0 million, for an aggregate total of $15.1 million. Our loan agreement, as amended on February 4, 2009, requires compliance with certain financial covenants, including maintenance of a minimum monthly tangible net worth and a minimum monthly liquidity coverage ratio. The covenants contained in our line of credit with the bank also restrict our ability to take certain actions, including our ability to:
| • | incur additional indebtedness; |
| • | pay dividends and make distributions in respect of our capital stock; |
| • | redeem capital stock; |
| • | make investments or other restricted payments outside the ordinary course of business; |
| • | engage in transactions with stockholders and affiliates; |
| • | create liens; |
| • | sell or otherwise dispose of assets; |
| • | make payments on our other debt, other than in the ordinary course; and |
| • | engage in certain mergers and acquisitions. |
We are currently in compliance with the financial and reporting covenants in our loan agreement. We cannot assure you that we will meet these financial covenants in subsequent periods. If we are unable to meet any covenants, we cannot assure you that the bank will grant waivers or amend the covenants, or that the bank will not terminate the agreement, preclude further borrowings or require us to immediately repay any outstanding borrowings. As long as our indebtedness remains outstanding, the restrictive covenants could impair our ability to expand or pursue our business strategies or obtain additional funding. Forced prepayment of some or all of our indebtedness would reduce our available cash balances and have an adverse impact on our operating and financial performance.
We may not be able to fund our future capital requirements from our operations, and financing from other sources may not be available on favorable terms or at all.
We made capital expenditures of $0.7 million during fiscal 2009, related to the development of our manufacturing facilities in China and Singapore. The amount of our future capital requirements will depend on many factors, including:
| • | general worldwide financial market conditions; |
| • | the cost required to ensure access to adequate manufacturing capacity; |
| • | the timing and extent of spending to support product development efforts; |
| • | the timing of introductions of new products and enhancements to existing products; |
| • | changing manufacturing capabilities to meet new customer requirements; and |
| • | market acceptance of our products. |
Although we amended our loan agreement and extended the maturity of our credit facility through January 29, 2012, we may need to raise additional funds through public or private equity or debt financing if our current cash and cash flow from operations are insufficient to fund our future activities. Due to very limited liquidity in the credit market, we may not be able to obtain additional debt financing when and if necessary in a
18
Table of Contents
timely manner. In addition, banks have sometimes been unable or unwilling to satisfy their obligations under existing credit arrangements. Access to capital markets has recently been unavailable to most companies such as ours and there can be no assurance as to when the capital markets will recover. Equity financing, when and if available, could be dilutive to holders of our common stock, and debt financings would likely involve covenants that restrict our business operations. If we cannot raise funds on acceptable terms, if and when needed, we may not be able to develop or enhance our products, take advantage of future opportunities, grow our business or respond to competitive pressures or unanticipated requirements, any of which could adversely affect our business, operating results and financial condition.
The technology labor market is very competitive, and our business will suffer if we are unable to hire and retain key personnel.
Our future success depends in part on the continued service of our key executive officers, as well as our research, engineering, sales, manufacturing and administrative personnel, most of whom are not subject to employment or non-competition agreements. In addition, competition for qualified personnel in the technology industry is intense, and we operate in geographic locations in which labor markets are particularly competitive. Our business is particularly dependent on expertise which only a very limited number of engineers possess. The loss of any of our key employees and officers, including our Chief Executive Officer, Chief Operating Officer or any of our Senior Vice Presidents, or the failure to attract and retain new qualified employees, would adversely affect our business, operating results and financial condition.
Fluctuations in currency exchange rates may adversely affect our financial condition and results of operations.
Our international sales are denominated primarily, though not entirely, in U.S. dollars. Many of the costs and expenses associated with our Chinese subsidiaries and Singapore subsidiary are paid in Chinese Renminbi and Singapore dollars, respectively, and we expect our exposure to Chinese Renminbi and Singapore dollars to increase as we ramp up production in those facilities. In addition, purchases of some of our components are denominated in Japanese Yen and Euro. Changes in exchange rates among other currencies in which our revenue or costs are denominated and the U.S. dollar may affect our revenue, cost of sales and operating margins. While fluctuations in the value of our revenue, cost of sales and operating margins as measured in U.S. dollars have not materially affected our results of operations historically, we do not currently hedge our exchange exposure, and exchange rate fluctuations could have an adverse effect on our financial condition and results of operations in the future.
If environmental contamination were to occur in one of our manufacturing facilities, we could be subject to substantial liabilities.
We use substances regulated under various foreign, domestic, federal, state and local environmental laws in our manufacturing facilities. Our failure or inability to comply with existing or future environmental laws could result in significant remediation liabilities, the imposition of fines or the suspension or termination of the production of our products. In addition, we may not be aware of all environmental laws or regulations that could subject us to liability.
If our facilities were to experience catastrophic loss due to natural disasters, our operations would be seriously harmed.
Our facilities could be subject to a catastrophic loss caused by natural disasters, including fires and earthquakes. We have facilities in areas with above average seismic activity, such as our manufacturing facility in South San Francisco, California and our new manufacturing and headquarters facilities in Hayward, California. If any of our facilities were to experience a catastrophic loss, it could disrupt our operations, delay production and shipments, reduce revenue and result in large expenses to repair or replace the facility. In
19
Table of Contents
addition, we have in the past experienced, and may in the future experience, extended power outages at our facilities. We do not carry insurance policies that cover potential losses caused by earthquakes or other natural disasters or power loss.
The market for our stock is subject to significant fluctuation.
The size of our public market capitalization is relatively small, and the volume of our shares that are traded is low. The market price of our common stock could be subject to significant fluctuations. Among the factors that could affect our stock price are:
| • | quarterly variations in our operating results; |
| • | our ability to successfully introduce new products and manage new product transitions; |
| • | changes in revenue or earnings estimates or publication of research reports by analysts; |
| • | speculation in the press or investment community; |
| • | strategic actions by us or our competitors, such as acquisitions or restructurings; |
| • | announcements relating to any of our key customers, significant suppliers or the semiconductor manufacturing and capital equipment industry generally; |
| • | general market conditions; |
| • | the effects of war and terrorist attacks; and |
| • | domestic and international economic factors unrelated to our performance. |
The stock markets in general, and the markets for technology stocks in particular, have experienced extreme volatility that has often been unrelated to the operating performance of particular companies. These broad market fluctuations may adversely affect the trading price of our common stock.
We must maintain effective controls.
The Sarbanes-Oxley Act of 2002 requires, among other things, that we maintain effective disclosure controls and procedures and internal control over financial reporting. In order to maintain and improve the effectiveness of our disclosure controls and procedures and internal control over financial reporting, significant resources and management oversight are required. As a result, our management’s attention might be diverted from other business concerns, which could have a material adverse effect on our business, financial condition and operating results. Any failure by us to maintain adequate controls or to adequately implement new controls could harm our operating results or cause us to fail to meet our reporting obligations. Inferior internal controls could also cause investors to lose confidence in our reported financial information, which could adversely affect the trading price of our common stock. In addition, we might need to hire additional accounting and financial staff with appropriate public company experience and technical accounting knowledge, and we might not be able to do so in a timely fashion.
| Item 1B. | Unresolved Staff Comments |
None.
| Item 2. | Properties |
In September 2007, we entered into a facility lease agreement for approximately 104,000 square feet of office space in Hayward, California. We moved into the new facility in July 2008 and use this space as the new headquarters for our principal administrative, sales and support, engineering and technology development facilities and for manufacturing purposes. This lease will expire in February 2015. We also have manufacturing
20
Table of Contents
and engineering facilities in South San Francisco and Sacramento. In South San Francisco we lease approximately 90,000 square feet under 4 leases with varying expiration dates and extension periods. Approximately 12,300 square feet in South San Francisco is a neat room facility and 1,300 square feet is a clean room manufacturing facility. In Sacramento, we lease approximately 20,000 square feet under a lease that expires in May of 2010 with one five-year extension. We also have manufacturing facilities in Austin, Texas, Tualatin, Oregon and Shanghai, China. In Austin, we lease approximately 42,000 square feet of commercial space under a lease that expires on August 31, 2010 with a one-year extension. Approximately 6,800 square feet in Austin is a clean room manufacturing facility. In Shanghai, we lease approximately 132,000 square feet of commercial space under two leases which expire on June 30, 2013 and February 28, 2011. Approximately 11,000 square feet of this space is a clean room facility. In Singapore, we lease approximately 35,000 square feet under a lease that expires in October 2014. In Tualatin, we lease approximately 28,000 square feet of commercial space under a lease that expires in October, 2010. Approximately 6,800 square feet in Tualatin is a clean room manufacturing facility. Subsequent to our fiscal 2008 year end we vacated this facility and are currently looking to sublease this space.
The table below lists our properties as of February 26, 2010:
| Location |
Principal Use |
Square Footage | Ownership | ||||
| Hayward, California |
Headquarters, manufacturing, sales, engineering, technology development | 104,000 | Leased | ||||
| South San Francisco, California |
Manufacturing, engineering | 90,000 | Leased | (1) | |||
| Sacramento, California |
Manufacturing | 20,000 | Leased | ||||
| Austin, Texas |
Manufacturing, engineering | 42,000 | Leased | ||||
| Tualatin, Oregon |
Vacant with plans to sublet | 28,000 | Leased | ||||
| Singapore Science Park III, Singapore |
Customer support | 35,000 | Leased | ||||
| Shanghai, China |
Manufacturing, customer support | 132,000 | Leased |
| (1) | The Company leases a facility from an entity controlled by one of the Company’s directors. The Company incurred rent expense resulting from the lease of this facility of $0.3 million in the year ended January 1, 2010 and $0.3 million in the year ended January 2, 2009. |
| Item 3. | Legal Proceedings |
From time to time, we are subject to various legal proceedings and claims, either asserted or unasserted, that arise in the ordinary course of business. Although the outcome of the various legal proceedings and claims cannot be predicted with certainty, we have not had a history of outcomes to date that have been material to the statement of operations and do not believe that any of these proceedings or other claims will have a material adverse effect on our consolidated financial condition or results of operations.
| Item 4. | Reserved |
21
Table of Contents
| Item 5. | Market for Registrant’s Common Equity, Related Stockholder Matters, and Issuer Purchases of Equity Securities |
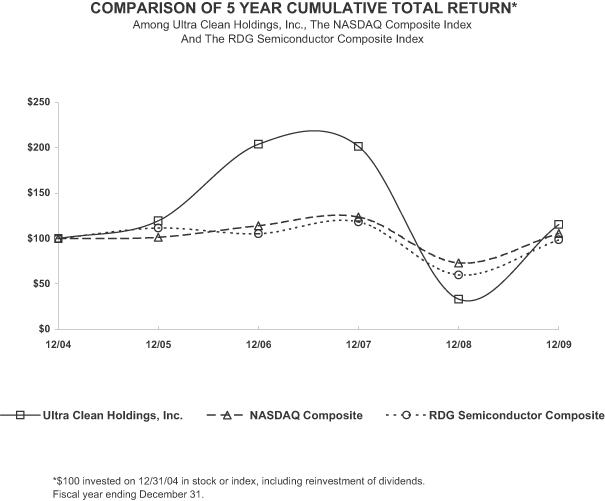
Our common stock has been traded on the NASDAQ Global Market under the symbol “UCTT” since March 25, 2004. The following table sets forth for the periods indicated the high and low closing sales prices per share of our common stock as reported by the NASDAQ Global Market:
| High | Low | |||||
| Fiscal year 2008 First quarter |
$ | 12.20 | $ | 8.98 | ||
| Second quarter |
$ | 11.49 | $ | 8.08 | ||
| Third quarter |
$ | 8.38 | $ | 6.02 | ||
| Fourth quarter |
$ | 5.41 | $ | 1.03 | ||
| Fiscal year 2009 First quarter |
$ | 2.03 | $ | 0.94 | ||
| Second quarter |
$ | 3.03 | $ | 1.17 | ||
| Third quarter |
$ | 5.62 | $ | 2.25 | ||
| Fourth quarter |
$ | 7.40 | $ | 5.30 | ||
To date, we have not declared or paid cash dividends to our stockholders and we do not intend to do so for the foreseeable future in order to retain earnings for use in our business. Our credit facility limits our ability to pay dividends. As of February 26, 2010, we had approximately 7 stockholders of record.
22
Table of Contents
| Item 6. | Selected Consolidated Financial Data |
You should read the following tables in conjunction with other information contained under “Management’s Discussion and Analysis of Financial Condition and Results of Operations,” our consolidated financial statements and related notes and other financial information contained elsewhere in this Annual Report.
Statements of Operations Data (in thousands):
| Years Ended | |||||||||||||||||||
| 1/1/2010 | 1/02/2009 | 12/28/2007 | 12/29/2006* | 12/30/2005 | |||||||||||||||
| Consolidated Statements of Operations Data: |
|||||||||||||||||||
| Sales |
$ | 159,757 | $ | 266,919 | $ | 403,807 | $ | 337,228 | $ | 147,535 | |||||||||
| Cost of goods sold |
151,741 | 241,453 | 346,347 | 286,542 | 127,459 | ||||||||||||||
| Gross profit |
8,016 | 25,466 | 57,460 | 50,686 | 20,076 | ||||||||||||||
| Operating expenses |
24,091 | 32,869 | 33,953 | 25,352 | 17,515 | ||||||||||||||
| Impairment of goodwill |
— | 34,063 | — | — | — | ||||||||||||||
| Impairment of long-lived assets |
— | 21,017 | — | — | — | ||||||||||||||
| Income (loss) from operations |
(16,075 | ) | (62,483 | ) | 23,507 | 25,334 | 2,561 | ||||||||||||
| Other income (expense) |
(791 | ) | (870 | ) | (1,797 | ) | (1,758 | ) | 147 | ||||||||||
| Income (loss) before income taxes |
(16,866 | ) | (63,353 | ) | 21,710 | 23,576 | 2,708 | ||||||||||||
| Income tax provision (benefit) |
3,160 | (10,936 | ) | 5,817 | 7,266 | 705 | |||||||||||||
| Net income (loss) |
$ | (20,026 | ) | $ | (52,417 | ) | $ | 15,893 | $ | 16,310 | $ | 2,003 | |||||||
| Net income (loss) per share: |
|||||||||||||||||||
| Basic |
$ | (0.94 | ) | $ | (2.43 | ) | $ | 0.75 | $ | 0.85 | $ | 0.12 | |||||||
| Diluted |
$ | (0.94 | ) | $ | (2.43 | ) | $ | 0.72 | $ | 0.83 | $ | 0.12 | |||||||
| Shares used in computation: |
|||||||||||||||||||
| Basic |
21,403 | 21,542 | 21,293 | 19,220 | 16,241 | ||||||||||||||
| Diluted |
21,403 | 21,542 | 22,118 | 19,649 | 17,169 | ||||||||||||||
| * | The results for the year ended December 29, 2006 include the activity of UCT-Sieger beginning June 30, 2006, the date of acquisition. |
Consolidated Balance Sheet Data (in thousands):
| 1/1/2010 | 1/02/2009 | 12/28/2007 | 12/29/2006 | 12/30/2005 | |||||||||||
| Cash & cash equivalents |
$ | 26,697 | $ | 29,620 | $ | 33,447 | $ | 23,321 | $ | 10,663 | |||||
| Working capital |
61,411 | 73,197 | 80,498 | 71,587 | 33,889 | ||||||||||
| Total assets |
131,310 | 117,411 | 195,027 | 187,047 | 75,009 | ||||||||||
| Bank borrowings and long-term debt |
15,100 | 18,471 | 22,211 | 31,564 | 2,343 | ||||||||||
| Short-and long-term rent obligations |
762 | 388 | 1,062 | 379 | 354 | ||||||||||
| Total stockholders’ equity |
61,179 | 78,399 | 129,488 | 107,168 | 55,281 | ||||||||||
23
Table of Contents
| Item 7. | Management’s Discussion and Analysis of Financial Condition and Results of Operations |
This section and other parts of this Annual Report on Form 10-K contain forward-looking statements that involve risks and uncertainties. Forward-looking statements can also be identified by words such as “anticipates,” “expects,” “believes,” “plans,” “predicts,” and similar terms. Forward-looking statements are not guarantees of future performance and the Company’s actual results may differ significantly from the result discussed in the forward-looking statements. Factors that might cause such differences include, but are not limited to, those discussed in “Item 1A — Risk Factors” above. The following discussion should be read in conjunction with the consolidated financial statement and notes thereto included in Item 8 of this report. The Company assumes no obligation to revise or update any forward-looking statements for any reason, except as required by law.
Overview
We are a leading developer and supplier of critical subsystems, primarily for the semiconductor capital equipment industry. We also leverage the specialized skill sets required to support semiconductor capital equipment to serve the technologically similar markets in the flat panel, medical, energy and research industries, collectively referred to as “Other Addressed Industries”. We develop, design, prototype, engineer, manufacture and test subsystems which are highly specialized and tailored to specific steps in the semiconductor manufacturing process as well as the manufacturing process in Other Addressed Industries. Our revenue is derived primarily from the sale of gas delivery systems and other critical subsystems including chemical mechanical planarization (“CMP”) subsystems, chemical delivery modules, top-plate assemblies, frame assemblies, process modules and other high level assemblies.
The global economy has contributed to slowdowns in the industries in which we operate. Reduced growth and uncertainty regarding future growth in economies throughout the world have caused companies to reduce capital investment and may in the future cause further reduction of such investments. Economic uncertainty has led to low consumer confidence levels and has caused and may in the future cause our customers to push out, cancel, or refrain from placing orders with us, which in turn has reduced and may in the future reduce our sales and negatively impact our cash flow. Our sales were $159.8 million in fiscal year 2009 compared to $266.9 million for fiscal year 2008. Our three largest customers in 2009 were Applied Materials, Inc., Intuitive Surgical, Inc., and Lam Research Corporation, each of which accounted for more than 10% of our total sales in 2009 and 2008. As a group these three customers accounted for 79% and 81% of the Company’s sales for 2009 and 2008, respectively. In 2007, Applied Materials, Inc., Lam Research Corporation and Novellus Systems, Inc. each accounted for more than 10% of our total sales and as a group accounted for 84% of total sales. We incurred a net loss of $20.0 million for 2009, however, we expect a positive yet challenging environment for fiscal 2010 as the company ramps for its expected higher sequential revenues in the first quarter of 2010.
24
Table of Contents
Results of Operations
The following table sets forth income statement data for the periods indicated as a percentage of revenue:
| Year Ended | |||||||||
| January 1, 2010 |
January 2, 2009 |
December 28, 2007 |
|||||||
| Sales |
100.0 | % | 100.0 | % | 100.0 | % | |||
| Cost of goods sold |
95.0 | % | 90.5 | % | 85.8 | % | |||
| Gross profit |
5.0 | % | 9.5 | % | 14.2 | % | |||
| Operating expenses: |
|||||||||
| Research and development |
2.0 | % | 1.1 | % | 0.7 | % | |||
| Sales and marketing |
2.9 | % | 2.2 | % | 1.5 | % | |||
| General and administrative |
10.1 | % | 9.1 | % | 6.2 | % | |||
| Impairment of goodwill |
— | 12.7 | % | — | |||||
| Impairment of long-lived assets |
— | 7.8 | % | — | |||||
| Total operating expenses |
15.0 | % | 32.9 | % | 8.4 | % | |||
| Income (loss) from operations |
(10.0 | )% | (23.4 | )% | 5.9 | % | |||
| Interest and other income (expense), net |
(0.5 | )% | (0.3 | )% | (0.4 | )% | |||
| Income (loss) before provision (benefit) for income taxes |
(10.5 | )% | (23.7 | )% | 5.5 | % | |||
| Income tax provision (benefit) |
2.0 | % | (4.1 | )% | 1.4 | % | |||
| Net income (loss) |
(12.5 | )% | (19.6 | )% | 3.9 | % | |||
Year Ended January 1, 2010 Compared With Year Ended January 2, 2009
Sales
Sales for the year ended January 1, 2010 decreased $107.1 million, or 40.1%, to $159.8 million from $266.9 million for the year ended January 2, 2009. The change in sales reflects a decrease in semi-conductor equipment and non-semiconductor demand as a result of the overall slowdown in the global economy. We expect sequential revenues to be higher in the first quarter of 2010.
Gross Profit
Cost of goods sold consists primarily of purchased materials, inventory write-downs, labor and overhead, including depreciation, associated with the design and manufacture of products sold. Gross profit for the year ended January 1, 2010 decreased to $8.0 million, or 5.0% of sales, from $25.5 million, or 9.5% of sales, for the year ended January 2, 2009. The decrease in gross profit was due primarily to declining unit volume manufactured due to declining sales during fiscal year 2009 and lower factory utilization in 2009 compared to 2008.
Research and Development Expense
Research and development expense consists primarily of activities related to new component testing and evaluation, test equipment, design and implementation, new product design and testing and other product development activities. Research and development expense increased slightly to $3.2 million, or 2.0% of sales, for the year ended January 1, 2010 compared to $2.9 million, or 1.1% of sales for the year ended January 2, 2009. The increase in expense is primarily due to the reassignment of existing resources to new product development activities.
25
Table of Contents
Sales and Marketing Expense
Sales and marketing expense consists primarily of salaries and commissions paid to our sales and service employees, salaries paid to our engineers who work with our sales and service employees to help determine the components and configuration requirements for new products and other costs related to the sales of our products. Sales and marketing expense was $4.7 million and $5.7 million for the years ended January 1, 2010 and January 2, 2009, respectively. The decrease in spending was due primarily to reduced headcount related expenses as a result of reduced headcount, salary reductions and lower sales commissions. As a percentage of sales, sales and marketing expense increased to 2.9% for the year ended January 1, 2010 compared to 2.2% for the year ended January 2, 2009 due to the lower revenue base in 2009 compared as to 2008.
General and Administrative Expense
General and administrative expense consists primarily of salaries and overhead of our administrative staff and professional fees. General and administrative expense decreased to $16.2 million, or 10.1% of sales, for the year ended January 1, 2010, from $24.2 million, or 9.1% of sales, for the year ended January 2, 2009. The decrease in expense is due to primarily to reduced payroll and related benefit costs due to decreases in headcount and salary reductions.
Impairment of goodwill and long-lived assets
During 2008, as a result of our annual impairment test of goodwill, we determined that the carrying amount of certain reporting units exceeded their fair value resulting in impairment charges of $34.1 million to goodwill (See Note 5 to Consolidated Financial Statements for additional discussion).
During the fourth quarter of fiscal 2008, we determined that an adverse change in our business climate required us to test the recoverability of our long-lived assets. As a result of these tests we determined that the carrying amount of certain reporting units had exceeded their fair value resulting in impairment charges of $10.7 million for other intangible assets and $10.4 million for property, plant and equipment. (See Note 5 to Consolidated Financial Statements for further discussion).
Interest and Other Income (Expense), net
Interest and other income (expense), net for fiscal year 2009 was $(0.8) million compared to $(0.9) million for fiscal 2008. Components of interest and other income (expense) relate primarily to the interest expense incurred for debt financing. Interest expense for fiscal 2009 was $0.8 million compared to $1.1 million in 2008. The decrease in 2009 was due primarily to a decrease in interest rates on debt. As a result of a new loan agreement with our credit facility in the first quarter of 2009, the average interest rates on our debt have remained flat during the year and are similar to the average interest rates applied on our debt facilities during the same period in the prior year. Interest expense was lower for fiscal year 2009 compared to 2008 due primarily to lower average debt balances.
Income Tax Provision
Our effective tax rate for the year ended January 1, 2010 was 18.7% compared to an income tax benefit of 17.3% for the year ended January 2, 2009. Our effective tax rate is substantially impacted by several items including Section 199 deduction for domestic production activities, state taxes and the effect of foreign operations, as well as a change in our geographic mix of US and China earnings.
Year Ended January 2, 2009 Compared With Year Ended December 28, 2007
Sales
Sales for the year ended January 2, 2009 decreased $136.9 million, or 33.9%, to $266.9 million from $403.8 million for the year ended December 28, 2007. The decrease in sales reflected a decrease in semi-conductor equipment demand as a result of the overall slowdown in the industry, partially offset by sequential minor increases in non-semiconductor revenue.
26
Table of Contents
Gross Profit
Gross profit for the year ended January 2, 2009 decreased to $25.5 million, or 9.5% of sales, from $57.5 million, or 14.2% of sales, for the year ended December 28, 2007. The decrease in gross profit was due primarily to declining unit volume manufactured due to declining sales during fiscal year 2008, lower factory utilization, costs associated with the centralization and closure of our facilities and employee severance charges resulting from a series of reductions in force.
Research and Development Expense
Research and development expense remained relatively flat decreasing to $2.9 million, or 1.1% of sales, for the year ended January 2, 2009 compared to $3.0 million, or 0.7% of sales for the year ended December 28, 2007. The increase as a percentage of sales was due primarily to a lower revenue base in 2008 as compared to 2007.
Sales and Marketing Expense
Sales and marketing expense was $5.7 million and $5.9 million for the years ended January 2, 2009 and December 28, 2007, respectively. The decreased spending was due primarily to reduced travel expense and sales commissions offset by an increase in severance payments. As a percentage of sales, sales and marketing expense increased to 2.2% for the year ended January 2, 2009 compared to 1.5% for the year ended December 28, 2007 due to the lower revenue base in 2008 compared as to 2007.
General and Administrative Expense
General and administrative expense decreased to $24.2 million, or 9.1% of sales, for the year ended January 2, 2009, from $25.1 million, or 6.2% of sales, for the year ended December 28, 2007. The decrease in spending was due to lower outside service costs of approximately $3.1 million resulting from reduced accounting and consulting costs related to SOX 404 compliance and reduced legal fees. This decrease was partially offset by increases in facility expenses related to the move to our new facility in Hayward, California in mid-fiscal 2008, higher depreciation costs due to the implementation of our new ERP system in late fiscal 2007 and employee severance charges resulting from a series of reductions in force.
Impairment of goodwill and long-lived assets
During fiscal 2008, as a result of our annual impairment test of goodwill, we determined that the carrying amount of certain reporting units exceeded their fair value resulting in impairment charges of $34.1 million to goodwill (See Note 5 to Consolidated Financial Statements for additional discussion).
During the fourth quarter of fiscal 2008, we determined that an adverse change in our business climate required us to test the recoverability of our long-lived assets. As a result of these tests we determined that the carrying amount of certain reporting units had exceeded their fair value resulting in impairment charges of $10.7 million for other intangible assets and $10.4 million for property, plant and equipment. (See Note 5 to Consolidated Financial Statements for further discussion).
Interest and Other Income (Expense), net
Interest and other income (expense), net for fiscal 2008 was $(0.9) million compared to $(1.8) million in 2007. Components of interest and other income (expense) related primarily to the interest expense incurred for debt financing. Interest expense for fiscal 2008 was $1.1 million compared to $2.2 million in 2007. The decrease in 2008 was due primarily to a decrease in interest rates on debt. This decrease in interest expense was partially offset by a decrease in interest income of approximately $0.3 million.
27
Table of Contents
Income Tax Provision
Our effective tax rate for fiscal year 2008 was a benefit of 17.3% compared to 26.8% for fiscal year 2007. Our effective tax rate was substantially impacted by several items including Section 199 deduction for domestic production activities, state taxes and the effect of foreign operations, and in the fourth quarter of fiscal 2008, our effective tax rate was impacted by the impairment of goodwill for which there is no tax benefit. The decreased rate in 2008 reflected primarily the impact of our goodwill impairment charge as well as a change in our geographic mix of US and China earnings.
Critical Accounting Policies, Significant Judgments and Estimates
Our consolidated financial statements have been prepared in accordance with accounting principles generally accepted in the United States, which requires us to make estimates and judgments that affect the reported amounts of assets, liabilities, revenue and expenses and related disclosure at the date of our financial statements. On an on-going basis, we evaluate our estimates and judgments, including those related to sales, inventories, intangible assets, stock compensation and income taxes. We base our estimates and judgments on historical experience and on various other factors that we believe to be reasonable under the circumstances, the results of which form the basis of our judgments about the carrying values of assets and liabilities that are not readily apparent from other sources. Actual results may differ from these estimates. We consider certain accounting policies related to revenue recognition, inventory valuation, accounting for income taxes, business combinations, valuation of intangible assets and goodwill and equity incentives to employees to be critical policies due to the estimates and judgments involved in each.
Revenue Recognition
Our revenue is highly concentrated in four OEM customers in the semiconductor capital equipment, energy, flat panel and medical industries. Our standard arrangement for our customers includes a signed purchase order or contract, no right of return of delivered products and no customer acceptance provisions. Revenue from sales of products is recognized when:
| • | we enter into a legally binding arrangement with a customer; |
| • | we ship the products; |
| • | customer payment is deemed fixed or determinable and free of contingencies or significant uncertainties; and |
| • | collection is reasonably assured. |
Revenue is generally recognized upon shipment of the product. In arrangements which specify title transfer upon delivery, revenue is not recognized until the product is delivered. In addition, if we have not fulfilled the terms of the agreement at the time of shipment, revenue recognition is deferred until completion.
We assess collectability based on the creditworthiness of the customer and past transaction history. We perform on-going credit evaluations of, and do not require collateral from, our customers. We have not experienced significant collection losses in the past. A significant change in the liquidity or financial position of any one customer could make it more difficult for us to assess collectability.
Inventory Valuation
We write down the carrying value of our inventory to net realizable value for estimated obsolescence or unmarketable inventory in an amount equal to the difference between the cost of inventory and its estimated realizable value based upon assumptions about future demand and market conditions. If actual demand and market conditions are less favorable than those projected by management, additional inventory write-downs could be required. We assess the valuation of all inventories, including raw materials, work-in-process, finished goods and spare parts on a periodic basis. Obsolete inventory or inventory in excess of our estimated usage is
28
Table of Contents
written-down to its estimated market value less costs to sell, if less than its cost. The inventory write-downs are recorded as an inventory valuation allowance established on the basis of obsolete inventory or specific identified inventory in excess of established usage. Inherent in our estimates of market value in determining inventory valuation are estimates related to economic trends, future demand for our products and technological obsolescence of our products. If actual market conditions are less favorable than our projections, additional inventory write-downs may be required. If the inventory value is written down to its net realizable value, and subsequently there is an increased demand for the inventory at a higher value, the increased value of the inventory is not realized until the inventory is sold either as a component of a subsystem or as separate inventory. For the years ended January 1, 2010 and January 2, 2009, we wrote off $0.5 million and $0.7 million, respectively, in inventory determined to be obsolete.
Accounting for Income Taxes
The determination of our tax provision is subject to judgments and estimates. The carrying value of our net deferred tax assets, which is made up primarily of tax deductions, assumes we will be able to generate sufficient future income to fully realize these deductions. In determining whether the realization of these deferred tax assets may be impaired, we make judgments with respect to whether we are likely to generate sufficient future taxable income to realize these assets. Based on our recent historical operating results and our outlook for fiscal 2009 and beyond, we determined it is more likely than not that our deferred tax assets will not be realized. As such, in the second quarter of 2009, we recorded a tax valuation allowance reducing our deferred tax asset value of $7.0 million to zero with a corresponding non-cash charge. For fiscal 2009 we recorded a tax valuation allowance totaling $8.7 million. Although we believe we have adequately reserved for our uncertain tax positions, no assurance can be given that the final tax outcome of these matters will not be different. We adjust these reserves in light of changing facts and circumstances, such as the closing of a tax audit or the refinement of an estimate. To the extent that the final tax outcome of these matters is different than the amounts recorded, such differences will impact the provision for income taxes in the period in which such determination is made. The provision for income taxes includes the impact of reserve provisions and changes to reserves that are considered appropriate, as well as the related net interest.
We file income tax returns in the U.S. federal jurisdiction, various states and foreign jurisdictions. We are currently under examination by the Internal Revenue Service for the tax years 2006 and 2008. The outcome of the examination is not known, and therefore, we are unable to estimate the effect of the audit to our financial position, results of operations or cash flows.
The Company’s 2005 and 2006 state income tax returns are currently under examination by the California Franchise Tax Board (“CFTB”). The Company is currently open to audit under the statute of limitations by the Internal Revenue Service for fiscal years 2004 through 2008 and the Company’s state income tax returns are open to audit under the statute of limitations for the fiscal years 2005 through 2008.
Business Combinations
In accordance with business combination accounting, we allocate the purchase price of acquired companies to the tangible and intangible assets acquired and liabilities assumed based on their estimated fair values. We may engage third-party appraisal firms to assist management in determining the fair values of acquired intangible assets such as trade name and customer relationships. Such valuations require management to make significant estimates and assumptions. Management makes estimates of fair value based upon assumptions believed to be reasonable. These estimates are based on historical experience and information obtained from the management of the acquired companies and are inherently uncertain.
Valuation of Goodwill and Long-lived Assets
We evaluate our intangible assets in accordance with the FASB’s guidance regarding accounting for the impairment of goodwill, at least annually, for indications of impairment whenever events or changes in
29
Table of Contents
circumstances indicate that the carrying value may not be recoverable, such as an adverse change in our business climate or a decline in the overall industry, that would more likely than not reduce the fair value of a reporting unit below its carrying amount. The Company’s only intangible asset is Tradename. Factors we consider important that could trigger an impairment review include significant under-performance relative to historical or projected future operating results, significant changes in the manner of our use of the acquired assets or the strategy for our overall business, or significant negative industry or economic trends. The provisions of the FASB’s guidance regarding accounting for the impairment of goodwill require an impairment test annually or more frequently if impairment indicators arise. In testing for a potential impairment, the provisions of the FASB’s guidance regarding accounting for the impairment of goodwill require the application of a fair value based test at the reporting unit level. We operate in one reportable segment and have one reporting unit. Therefore, all goodwill is considered enterprise goodwill and the first step of the impairment test prescribed by the FASB’s guidance regarding accounting for the impairment of goodwill requires a comparison of our fair value to our book value. If the estimated fair value is less than the book value, the FASB’s guidance regarding accounting for the impairment of goodwill requires an estimate of the fair value of all identifiable assets and liabilities of the business, in a manner similar to a purchase price allocation for an acquired business. This estimate requires valuations of certain internally generated and unrecognized intangible assets such as in-process research and development and developed technology. Potential goodwill impairment is measured based upon this two-step process.
In accordance with the FASB’s guidance regarding accounting for the impairment or disposal of long-lived assets, the Company tests other long-lived assets, including property, equipment and leasehold improvements and other intangible assets subject to amortization, for recoverability whenever events or changes in circumstances indicate that the carrying value of those assets may not be recoverable. The Company assesses the recoverability of an asset group by determining if the carrying value of the asset group exceeds the sum of the projected undiscounted cash flows expected to result from the use and eventual disposition of the assets over the remaining economic life of the primary asset in the asset group. If the recoverability test indicates that the carrying value of the asset group is not recoverable, the Company will estimate the fair value of the asset group using the income approach, which is the present value technique used to measure the fair value of future cash flow produced by each asset group, and compare it to its carrying value. The excess of the carrying value over the fair value is allocated pro rata to derive the adjusted carrying value. The adjusted carrying value of each asset in the asset group is not reduced below its fair value.
See additional disclosure of these analyses in Note 5 to our Consolidated Financial Statements including the impairment charges recorded during the fiscal year 2008.
The process of evaluating the potential impairment of goodwill or long-lived assets is subjective and requires significant judgment on matters such as, but not limited to, the reporting unit at which goodwill should be measured for impairment and the asset group to be tested for recoverability. The Company is also required to make estimates that may significantly impact the outcome of the analyses. Such estimates include, but are not limited to, future operating performance and cash flows, cost of capital, terminal values, control premiums and remaining economic lives of assets.
Equity Incentives to Employees
We have accounted for stock-based compensation under the FASB’s guidance regarding stock-based compensation and the SEC’s guidance requiring the use of option pricing models that were not developed for use in valuing employee stock options. The Black-Scholes option-pricing model that we use was developed for use in estimating the fair value of short-lived exchange traded options that have no vesting restrictions and are fully transferable. In addition, option-pricing models require the input of highly subjective assumptions, including the option’s expected life and the price volatility of underlying stock. Our expected stock price volatility assumption was determined using the historical volatility of our common stock. We determined that historical volatility reflects market conditions and is a good indicator of future volatility. Our expected term represents the period
30
Table of Contents
that our stock-based awards are expected to be outstanding and was determined based on our historical experience with similar awards, giving consideration to the contractual terms of the stock-based awards and vesting schedules. See Note 9 of Notes to Consolidated Financial Statements for a detailed description.
Unaudited Quarterly Financial Results
The following tables set forth statement of operations data, in thousands, for the periods indicated. The information for each of these periods is unaudited and has been prepared on the same basis as our audited consolidated financial statements included herein and includes all adjustments, consisting only of normal recurring adjustments that we consider necessary for a fair presentation of our unaudited operations data for the periods presented. Historical results are not necessarily indicative of the results to be expected in the future (in thousands):
| First Quarter |
Second Quarter |
Third Quarter |
Fourth Quarter |
Fiscal Year |
||||||||||||||||
| 2009 |
||||||||||||||||||||
| Sales |
$ | 22,400 | $ | 23,252 | $ | 41,324 | $ | 72,781 | $ | 159,757 | ||||||||||
| Gross profit (loss) |
$ | (2,870 | ) | $ | (854 | ) | $ | 3,283 | $ | 8,457 | $ | 8,016 | ||||||||
| Net income (loss) |
$ | (7,040 | ) | $ | (14,063 | ) | $ | (1,418 | ) | $ | 2,495 | $ | (20,026 | ) | ||||||
| 2008 |
||||||||||||||||||||
| Sales |
$ | 92,357 | $ | 67,364 | $ | 60,128 | $ | 47,070 | $ | 266,919 | ||||||||||
| Gross profit |
$ | 12,060 | $ | 7,522 | $ | 5,468 | $ | 416 | $ | 25,466 | ||||||||||
| Net income (loss) |
$ | 1,889 | $ | (162 | ) | $ | (1,928 | ) | $ | (52,216 | ) | $ | (52,417 | ) | ||||||
Our operating results for fiscal 2009 reflect a downturn in the semiconductor capital equipment industry beginning in the second quarter of 2008.
Liquidity and Capital Resources
We have required capital principally to fund our working capital needs, satisfy our debt obligations, maintain our equipment and purchase new capital equipment. As of January 1, 2010, we had cash of $26.7 million compared to $29.6 million as of January 2, 2009.
For the year ended January 1, 2010 we generated cash from operating activities of $1.1 million compared to $11.6 million for the year ended January 2, 2009. Operating cash flow in 2009 was unfavorably impacted by our net loss of $20.0 million, an increase in accounts receivable of $21.0 million, an increase in inventory of $7.2 million and a decrease in other liabilities of $385,000. Operating cash flows were favorably impacted by net non-cash activity of $12.3 million, including depreciation and amortization of $2.3 million, stock-based compensation of $2.7 million and increased net deferred income taxes of $7.4 million, an increase in accounts payable of $34.8 million and a decrease in prepaid expenses and other of $2.8 million.
Net cash used in investing activities for the year ended January 1, 2010 decreased $8.7 million to $0.7 million from $9.4 million in the year ended January 2, 2009. Investing activities in 2008 were high due primarily to our investment in equipment and leasehold improvements for our new Hayward, California facility.
Net cash used in financing activities for the year ended January 1, 2010 decreased $2.7 million to $3.3 million from $6.0 million in the year ended January 2, 2009. Our use of cash in financing activities was primarily due to net principal payments on short-term debt of $3.4 million.
During fiscal 2008 and 2009, we took steps to reduce our operating costs in line with our declining revenues in the form of factory shutdowns, reductions in headcount and other cost-cutting measures. We anticipate that our existing cash balance and operating cash flow, together with available borrowings under our credit facility as amended on February 4, 2009 (see “Borrowing Arrangements” below), will be sufficient to meet our working
31
Table of Contents
capital requirements and technology development projects for at least the next twelve months. The adequacy of these resources to meet our liquidity needs beyond that period will depend on our growth, the state of the worldwide economy, the cyclical expansion or contraction of the semiconductor capital equipment industry and the other industries we serve and capital expenditures required to meet possible increased demand for our products.
Borrowing Arrangements
In the second quarter of 2006, the Company entered into a borrowing arrangement and a term loan (“Loan Agreement”). The Loan Agreement provided senior secured credit facilities in an aggregate principal amount of up to $32.5 million, consisting of a $25.0 million Revolving Line of Credit and a $7.5 million term loan (“Original Term Loan”). On February 4, 2009, the Company amended its Loan Agreement resulting in a reduction of the revolving credit facility from $25.0 million to $20.0 million while extending its maturity to January 29, 2012, and instituting a new $3.0 million, three-year term loan, as amended, also maturing on January 29, 2012. The Original Term Loan expired on June 29, 2009. The outstanding balance of the new term loan as of January 1, 2010 was approximately $2.1 million. The aggregate amount of the revolving credit facility is subject to a borrowing base equal to 80% of eligible accounts receivable and 45% of eligible inventory (total eligible inventory not to exceed $2.5 million) and is secured by substantially all of our assets. The revolving credit facility bears interest per annum at a variable rate equal to the greater of the bank’s stated prime rate or 4% plus a margin of 25 basis points. The new term loan, as amended, bears interest per annum at a variable rate equal to the greater of the bank’s stated prime rate or 4% plus a margin of 75 basis points. The revolving credit facility contains certain reporting and financial covenants, including minimum tangible net worth and liquidity ratios that must be met on a monthly basis in order for the Company to remain in compliance. We are currently in compliance with all covenants in our Loan Agreement. The outstanding balance of the Revolving Line of Credit as of January 1, 2010 was approximately $11.5 million.
Interest rates on outstanding loans under the revolving credit facility and the term loan ranged from 3.5% to 4.75% per annum during fiscal year 2009 and were 4.25% and 4.75% per annum, respectively, as of January 1, 2010.
The Company also has a $5.0 million equipment loan that is secured by certain of its equipment and expires in May 2011. The interest rate and outstanding balance on the equipment loan was 7.6% and $1.5 million, respectively, as of January 1, 2010.
The combined balance outstanding on the Loan Agreement and equipment loan at January 1, 2010 was $15.1 million.
Capital Expenditures
Capital expenditures were $0.8 million in the year ended January 1, 2010, primarily due to the fixed assets acquired from Allegro for our Singapore location. See Note 2 for further discussion. We made capital expenditures of $9.4 million in the year ended January 2, 2009, $7.7 million of which was used for our new headquarters in Hayward, California and $1.7 million was used for expansion of our facilities in China. Capital expenditures of $7.8 million in the year ended December 28, 2007 was used primarily for facilities expansion in China and the implementation of our new ERP system which went live during the fourth quarter of 2007.
32
Table of Contents
Contractual Obligations
Other than operating leases for certain equipment and real estate, we have no off-balance sheet transactions, unconditional purchase obligations or similar instruments and, other than the revolving credit facility described above, are not a guarantor of any other entities’ debt or other financial obligations. The following table summarizes our future minimum lease payments and principal payments under debt obligations as of January 1, 2010 (in thousands):
| 2010 | 2011 | 2012 | 2013 | 2014 | Thereafter | Total | |||||||||||||||
| Capital lease |
$ | 6 | $ | 6 | $ | 6 | $ | 7 | $ | 3 | $ | — | $ | 28 | |||||||
| Operating lease(1) |
3,645 | 3,035 | 2,648 | 2,456 | 2,234 | 467 | 14,485 | ||||||||||||||
| Borrowing arrangements |
2,008 | 1,443 | 11,649 | — | — | — | 15,100 | ||||||||||||||
| Purchase obligations |
16,492 | — | — | — | — | — | 16,492 | ||||||||||||||
| Total(2) |
$ | 22,151 | $ | 4,484 | $ | 14,303 | $ | 2,463 | $ | 2,237 | $ | 467 | $ | 46,105 | |||||||
| (1) | Operating lease expense reflects (a) the lease for our headquarters facility in Hayward, California; (b) the lease for a manufacturing facility in Portland, Oregon that expires on October 31, 2010 net of estimated sublease rental income; (c) the leases for manufacturing facilities in South San Francisco that expire from 2010 through 2013; (d) the leases for manufacturing facilities in Austin, Texas that expire in 2010 and 2011. |
| (2) | As a result of the implementation of FASB’s guidance regarding accounting for uncertainty in income taxes, we have recorded an additional tax liability to offset the recognition of previously recorded excess tax benefits. Because of the uncertainty surrounding the future payment of these liabilities, the amount has been excluded from the table above. |
Recently Issued Accounting Standards
During the second quarter of 2009, the Company adopted the FASB’s guidance regarding the disclosures about fair value of financial instruments, which requires disclosure about fair value of financial instruments in interim and annual financial statements. This guidance also amends previous guidance regarding interim financial reporting, to require those disclosures in summarized financial information at interim reporting periods. The adoption of this guidance had no financial impact on the Company’s condensed consolidated financial statements or related footnotes.
In May 2009, the FASB issued its guidance regarding subsequent events, which established general accounting standards and disclosure for subsequent events. The Company adopted this guidance during its second quarter of 2009.
In June 2009, the FASB issued guidance regarding accounting standards codification and the hierarchy of generally accepted accounting principles. This guidance has become the single official source of authoritative U.S. GAAP (other than guidance issued by the SEC), superseding existing FASB, American Institute of Certified Public Accountants, Emerging Issues Task Force (“EITF”), and related literature. One level of authoritative U.S. GAAP will exist, and all other literature will be considered non-authoritative. The Company has adopted this guidance and has updated its disclosures to conform to the Codification in this Form 10Q.
During the first quarter of 2009 the Company adopted the FASB’s guidance regarding the determination of the useful life of intangible assets which amends the factors an entity should consider in developing renewal or extension assumptions used in determining the useful life of recognized intangible assets under the FASB’s guidance regarding goodwill and other intangible assets. The adoption of this guidance had no financial impact on the Company’s condensed consolidated financial statements or related footnotes.
In April 2009, the FASB issued guidance regarding the determining fair value when the volume and level of activity for the asset or liability have significantly decreased and identifying transactions that are not orderly which provides additional guidance for estimating fair value when the market activity for an asset or liability has
33
Table of Contents
declined significantly. During the quarter ended June 26, 2009, we adopted this guidance, which did not have a financial impact on the Company’s condensed consolidated financial statements or related footnotes.
In September 2006, the FASB issued guidance regarding the fair value measurements which defines fair value, establishes a framework and gives guidance regarding the methods used for measuring fair value, and expands disclosures about fair value measurements. During the first quarter of 2009 the Company adopted this guidance for the Company’s non-financial assets and non-financial liabilities without impact to our condensed consolidated financial statements or related footnotes.
| Item 7A. | Quantitative and Qualitative Disclosures About Market Risk |
Market risk represents the risk of changes in value of financial instruments caused by fluctuations in interest rates and foreign exchange rates.
Foreign Exchange Rates
Currently, a significant majority of our sales and arrangements with third-party suppliers provide for pricing and payment in US dollars, and, therefore, are not subject to material exchange rate fluctuations. Therefore, we do not expect foreign currency exchange rate fluctuations to have a material effect on our results of operations. Increases in the value of the United States’ dollar relative to other currencies would make our products more expensive, which could negatively impact our ability to compete. Conversely, decreases in the value of the US dollar relative to other currencies could result in our suppliers raising their prices in order to continue doing business with us.
Interest Rates
Our interest rate risk relates primarily to our third party debt which totals $15.1 million and carries interest rates pegged to the LIBOR and PRIME rates. An immediate increase in interest rates of 100 basis points would increase our interest expense by approximately $38,000 per quarter. This would be partially offset by increased interest income on our invested cash. Conversely, an immediate decline of 100 basis points in interest rates would decrease our interest expense by approximately $38,000 per quarter. This would be partially offset by decreased interest income on our invested cash.
34
Table of Contents
| Item 8. | Financial Statements and Supplementary Data |
INDEX TO CONSOLIDATED FINANCIAL STATEMENTS
| 36 | ||
| Consolidated Balance Sheets as of January 1, 2010 and January 2, 2009 |
37 | |
| 38 | ||
| 39 | ||
| 40 | ||
| 41 |
35
Table of Contents
REPORT OF INDEPENDENT REGISTERED PUBLIC ACCOUNTING FIRM
To the Board of Directors and Stockholders of Ultra Clean Holdings, Inc.:
We have audited the accompanying consolidated balance sheets of Ultra Clean Holdings, Inc. and subsidiaries (the “Company”) as of January 1, 2010 and January 2, 2009, and the related consolidated statements of operations, stockholders’ equity, and cash flows for each of the three years in the period ended January 1, 2010. These financial statements are the responsibility of the Company’s management. Our responsibility is to express an opinion on these financial statements based on our audits.
We conducted our audits in accordance with the standards of the Public Company Accounting Oversight Board (United States). Those standards require that we plan and perform the audit to obtain reasonable assurance about whether the financial statements are free of material misstatement. An audit includes examining, on a test basis, evidence supporting the amounts and disclosures in the financial statements. The Company is not required to have, nor were we engaged to perform, an audit of its internal control over financial reporting. Our audits included consideration of internal control over financial reporting as a basis for designing audit procedures that are appropriate in the circumstances, but not for the purpose of expressing an opinion on the effectiveness of the Company’s internal control over financial reporting. Accordingly, we express no such opinion. An audit also includes assessing the accounting principles used and significant estimates made by management, as well as evaluating the overall financial statement presentation. We believe that our audits provide a reasonable basis for our opinion.
In our opinion, such consolidated financial statements present fairly, in all material respects, the financial position of Ultra Clean Holdings, Inc. and subsidiaries at January 1, 2010 and January 2, 2009, and the results of their operations and their cash flows for each of the three years in the period ended January 1, 2010, in conformity with accounting principles generally accepted in the United States of America.
/s/ Deloitte & Touche LLP
San Jose, California
March 29, 2010
36
Table of Contents
Ultra Clean Holdings, Inc.
| January 1, 2010 | January 2, 2009 | |||||||
| (In thousands, except share amounts) | ||||||||
| ASSETS |
||||||||
| Current assets: |
||||||||
| Cash and cash equivalents |
$ | 26,697 | $ | 29,620 | ||||
| Accounts receivable, net of allowance of $529 and $406, respectively |
34,787 | 13,790 | ||||||
| Inventory |
46,976 | 39,814 | ||||||
| Deferred income taxes |
— | 2,451 | ||||||
| Prepaid expenses and other |
6,005 | 8,817 | ||||||
| Total current assets |
114,465 | 94,492 | ||||||
| Equipment and leasehold improvements, net |
7,450 | 8,954 | ||||||
| Purchased intangibles, net |
8,987 | 8,987 | ||||||
| Other non-current assets |
408 | 4,978 | ||||||
| Total assets |
$ | 131,310 | $ | 117,411 | ||||
| LIABILITIES & STOCKHOLDERS’ EQUITY |
||||||||
| Current liabilities: |
||||||||
| Bank borrowings |
$ | 2,008 | $ | 5,736 | ||||
| Accounts payable |
46,098 | 11,275 | ||||||
| Accrued compensation and related benefits |
2,378 | 2,320 | ||||||
| Deferred rent, current portion |
740 | 401 | ||||||
| Other current liabilities |
1,830 | 1,563 | ||||||
| Total current liabilities |
53,054 | 21,295 | ||||||
| Long-term debt |
13,092 | 12,735 | ||||||
| Deferred rent and other liabilities |
3,985 | 4,982 | ||||||
| Total liabilities |
70,131 | 39,012 | ||||||
| Commitments and contingencies (See Note 13) |
||||||||
| Stockholders’ equity: |
||||||||
| Preferred stock — $0.001 par value, 10,000,000 authorized; none outstanding |
— | — | ||||||
| Common stock — $0.001 par value, 90,000,000 authorized; 21,484,178 and 21,287,700 shares issued and outstanding, in 2009 and 2008, respectively |
96,563 | 93,757 | ||||||
| Common shares held in treasury, at cost, 601,944 shares in 2009 and 2008, respectively |
(3,337 | ) | (3,337 | ) | ||||
| Accumulated Deficit |
(32,047 | ) | (12,021 | ) | ||||
| Total stockholders’ equity |
61,179 | 78,399 | ||||||
| Total liabilities and stockholders’ equity |
$ | 131,310 | $ | 117,411 | ||||
(See notes to consolidated financial statements)
37
Table of Contents
Ultra Clean Holdings, Inc.
Consolidated Statements of Operations
| Twelve Months Ended | ||||||||||||
| January 1, 2010 | January 2, 2009 | December 28, 2007 | ||||||||||
| (In thousands, except per share amounts) | ||||||||||||
| Sales |
$ | 159,757 | $ | 266,919 | $ | 403,807 | ||||||
| Cost of goods sold |
151,741 | 241,453 | 346,347 | |||||||||
| Gross profit |
8,016 | 25,466 | 57,460 | |||||||||
| Operating expenses: |
||||||||||||
| Research and development |
3,212 | 2,904 | 2,985 | |||||||||
| Sales and marketing |
4,693 | 5,739 | 5,914 | |||||||||
| General and administrative |
16,186 | 24,226 | 25,054 | |||||||||
| Impairment of goodwill |
— | 34,063 | — | |||||||||
| Impairment of long-lived assets |
— | 21,017 | — | |||||||||
| Total operating expenses |
24,091 | 87,949 | 33,953 | |||||||||
| Income (loss) from operations |
(16,075 | ) | (62,483 | ) | 23,507 | |||||||
| Interest and other expense, net |
(791 | ) | (870 | ) | (1,797 | ) | ||||||
| Income (loss) before provision (benefit) for income taxes |
(16,866 | ) | (63,353 | ) | 21,710 | |||||||
| Income tax provision (benefit) |
3,160 | (10,936 | ) | 5,817 | ||||||||
| Net income (loss) |
$ | (20,026 | ) | $ | (52,417 | ) | $ | 15,893 | ||||
| Net income (loss) per share: |
||||||||||||
| Basic |
$ | (0.94 | ) | $ | (2.43 | ) | $ | 0.75 | ||||
| Diluted |
$ | (0.94 | ) | $ | (2.43 | ) | $ | 0.72 | ||||
| Shares used in computing net income (loss) per share |
||||||||||||
| Basic |
21,403 | 21,542 | 21,293 | |||||||||
| Diluted |
21,403 | 21,542 | 22,118 | |||||||||
(See notes to consolidated financial statements)
38
Table of Contents
Ultra Clean Holdings, Inc.
Consolidated Statements of Stockholders’ Equity
| Common Stock | Deferred Stock-based Compensation |
Retained Earnings/ (Accumulated Deficit) |
Total Stockholders’ Equity |
||||||||||||||||
| Shares | Amount | ||||||||||||||||||
| (in thousands, except per share amounts) | |||||||||||||||||||
| Balance, December 29, 2006 |
21,080,540 | $ | 82,198 | $ | (152 | ) | $ | 25,122 | $ | 107,168 | |||||||||
| Issuance of restricted common stock |
25,000 | — | — | — | — | ||||||||||||||
| Net issuance under employee stock plans, including tax benefits of $1,323 |
457,296 | 3,759 | — | — | 3,759 | ||||||||||||||
| Amortization of stock-based compensation |
— | 3,162 | 125 | — | 3,287 | ||||||||||||||
| Provision for FIN 48 |
— | — | — | (619 | ) | (619 | ) | ||||||||||||
| Net income |
— | — | — | 15,893 | 15,893 | ||||||||||||||
| Balance, December 28, 2007 |
21,562,836 | 89,119 | (27 | ) | 40,396 | 129,488 | |||||||||||||
| Issuance of restricted common stock |
37,500 | — | — | — | — | ||||||||||||||
| Repurchase of common stock |
(601,944 | ) | (3,337 | ) | — | — | (3,337 | ) | |||||||||||
| Net issuance under employee stock plans, including tax benefits of $112 |
289,308 | 1,126 | — | — | 1,126 | ||||||||||||||
| Amortization of stock-based compensation |
— | 3,512 | 27 | — | 3,539 | ||||||||||||||
| Net loss |
— | — | — | (52,417 | ) | (52,417 | ) | ||||||||||||
| Balance January 2, 2009 |
21,287,700 | 90,420 | — | (12,021 | ) | 78,399 | |||||||||||||
| Issuance of restricted common stock |
60,000 | — | — | — | — | ||||||||||||||
| Issuance under employee stock plans |
136,478 | 101 | — | — | 101 | ||||||||||||||
| Amortization of stock-based compensation |
— | 2,705 | — | — | 2,705 | ||||||||||||||
| Net loss |
— | — | — | (20,026 | ) | (20,026 | ) | ||||||||||||
| Balance January 1, 2010 |
21,484,178 | $ | 93,226 | $ | — | $ | (32,047 | ) | $ | 61,179 | |||||||||
(See notes to consolidated financial statements)
39
Table of Contents
Ultra Clean Holdings, Inc.
Consolidated Statements of Cash Flows
| Twelve Months Ended | ||||||||||||
| January 1, 2010 |
January 2, 2009 |
December 28, 2007 |
||||||||||
| (In thousands) | ||||||||||||
| Cash flows from operating activities: |
||||||||||||
| Net income (loss) |
$ | (20,026 | ) | $ | (52,417 | ) | $ | 15,893 | ||||
| Adjustments to reconcile net income to net cash provided by (used in) operating activities: |
||||||||||||
| Depreciation and amortization |
2,279 | 5,599 | 4,375 | |||||||||
| Deferred income tax |
7,363 | (5,225 | ) | (903 | ) | |||||||
| Excess tax benefit from stock-based compensation |
— | 112 | (1,323 | ) | ||||||||
| Stock-based compensation |
2,705 | 3,539 | 3,287 | |||||||||
| Changes in and impairment of goodwill and long-lived assets |
— | 55,214 | — | |||||||||
| Changes in assets and liabilities: |
||||||||||||
| Accounts receivable |
(20,997 | ) | 21,055 | 9,698 | ||||||||
| Inventory |
(7,162 | ) | 9,528 | (1,933 | ) | |||||||
| Prepaid expenses and other |
2,812 | (5,029 | ) | (266 | ) | |||||||
| Other non-current assets |
(341 | ) | 333 | 112 | ||||||||
| Accounts payable |
34,786 | (25,562 | ) | (772 | ) | |||||||
| Accrued compensation and related benefits |
57 | (686 | ) | (1,015 | ) | |||||||
| Income taxes payable |
— | 322 | (4,921 | ) | ||||||||
| Other current liabilities |
(385 | ) | 4,799 | 1,288 | ||||||||
| Net cash provided by operating activities |
1,091 | 11,582 | 23,520 | |||||||||
| Cash flows from investing activities: |
||||||||||||
| Purchases of equipment and leasehold improvements |
(738 | ) | (9,448 | ) | (7,707 | ) | ||||||
| Proceeds from sale of equipment |
— | — | 27 | |||||||||
| Net cash used in acquisition |
— | — | (46 | ) | ||||||||
| Net cash used in investing activities |
(738 | ) | (9,448 | ) | (7,726 | ) | ||||||
| Cash flows from financing activities: |
||||||||||||
| Principal payments on capital lease obligations |
(6 | ) | (12 | ) | (67 | ) | ||||||
| Proceeds from bank borrowings |
5,500 | — | — | |||||||||
| Principal payments on short-term debt |
(8,872 | ) | (1,315 | ) | — | |||||||
| Principal payments on long-term debt |
— | (2,425 | ) | (9,353 | ) | |||||||
| Excess tax benefit from stock-based compensation |
— | (112 | ) | 1,323 | ||||||||
| Repurchase of common stock |
— | (3,337 | ) | — | ||||||||
| Proceeds from issuance of common stock |
102 | 1,240 | 2,429 | |||||||||
| Net cash used in financing activities |
(3,276 | ) | (5,961 | ) | (5,668 | ) | ||||||
| Net increase (decrease) in cash |
(2,923 | ) | (3,827 | ) | 10,126 | |||||||
| Cash and cash equivalents at beginning of year |
29,620 | 33,447 | 23,321 | |||||||||
| Cash and cash equivalents at end of year |
$ | 26,697 | $ | 29,620 | $ | 33,447 | ||||||
| Supplemental cash flow information: |
||||||||||||
| Income taxes paid |
$ | — | $ | 1,100 | $ | 10,249 | ||||||
| Interest paid |
$ | 821 | $ | 1,175 | $ | 2,242 | ||||||
| Non-cash investing and financing activities: |
||||||||||||
| Restricted stock issued |
$ | 334 | $ | 394 | $ | 335 | ||||||
| Fixed asset purchases included in accounts payable |
$ | 37 | $ | 20 | $ | 6 | ||||||
(See notes to consolidated financial statements)
40
Table of Contents
Ultra Clean Holdings, Inc.
Notes to Consolidated Financial Statements
1. Organization and Significant Accounting Policies
Organization — Ultra Clean Holdings, Inc. (the “Company”) is a leading developer and supplier of critical subsystems, producing primarily gas delivery systems, chemical mechanical planarization (“CMP”) subsystems, chemical delivery modules, frame and top plate assemblies and process modules. The Company serves the semiconductor capital equipment, research, flat panel, energy and medical equipment industries. The Company’s products improve efficiency and reduce the costs of our customers’ design and manufacturing processes. The Company’s customers are primarily original equipment manufacturers (“OEMs”) in the industries the Company serves.
Use of Accounting Estimates — The presentation of financial statements in conformity with GAAP requires management to make estimates and assumptions that affect the reported amounts of assets and liabilities, and disclosures of contingent liabilities at the date of the financial statements and the reported amounts of revenues and expenses during the reporting period. The Company bases its estimates and judgments on historical experience and on various other assumptions that it believes are reasonable under the circumstances. However, future events are subject to change and the best estimates and judgments routinely require adjustment. Actual amounts may differ from those estimates.
Certain Significant Risks and Uncertainties — The Company operates in a dynamic industry and, accordingly, can be affected by a variety of factors. For example, any of the following areas could have a negative effect on the Company in terms of its future financial position, results of operations or cash flows: the general state of the U.S. and world economies, the highly cyclical nature of the industries the Company serves; the loss of any of a small number of customers; ability to obtain additional financing; pursuing acquisition opportunities; regulatory changes; fundamental changes in the technology underlying semiconductor, research, flat panel, energy and medical equipment manufacturing processes or manufacturing equipment; the hiring, training and retention of key employees; successful and timely completion of product design efforts; and new product design introductions by competitors.
Concentration of Credit Risk — Financial instruments which subject the Company to concentrations of credit risk consist principally of cash and cash equivalents and accounts receivable. The Company sells its products primarily to semiconductor capital equipment manufacturers in the United States. The Company performs credit evaluations of its customers’ financial condition and generally requires no collateral.
The Company had significant sales to three customers: Applied Materials, Inc., Intuitive Surgical, Inc. and Lam Research Corporation each of which accounted for 10% or more of sales for the year ended January 1, 2010. Sales to each of these customers as a percentage of total sales were as follows:
| Fiscal Year Ended | |||||||||
| 2009 | 2008 | 2007 | |||||||
| Customer A |
41 | % | 51 | % | 43 | % | |||
| Customer B |
23 | % | 20 | % | 29 | % | |||
| Customer C |
15 | % | 10 | % | 4 | % | |||
| Total |
79 | % | 81 | % | 76 | % | |||
Four customers each had individual accounts receivable balances greater than 10% as of January 1, 2010 with a combined total of 88%.
Fair Value of Financial Instruments — Our financial instruments consist of cash and cash equivalents, accounts receivable, accounts payable and bank borrowings. The carrying value of these instruments approximates their fair value because of their short-term nature.
41
Table of Contents
Ultra Clean Holdings, Inc.
Notes to Consolidated Financial Statements—(Continued)
Fiscal Year — The Company uses a 52-53 week fiscal year ending on the Friday nearest December 31. All references to quarters refer to fiscal quarters and all references to years refer to fiscal years.
Inventories — Inventories are stated at the lower of standard cost (which approximates actual cost on a first-in, first-out basis) or market. The Company evaluates the valuation of all inventories, including raw materials, work-in-process, finished goods and spare parts on a periodic basis. Obsolete inventory or inventory in excess of management’s estimated usage is written-down to its estimated market value less costs to sell, if less than its cost. Inherent in the estimates of market value are management’s estimates related to economic trends, future demand for products, and technological obsolescence of the Company’s products.
Inventory write downs inherently involve judgments as to assumptions about expected future demand and the impact of market conditions on those assumptions. Although the Company believes that the assumptions it used in estimating inventory write downs are reasonable, significant changes in any one of the assumptions in the future could produce a significantly different result. There can be no assurances that future events and changing market conditions will not result in significant increases in inventory write downs.
At January 1, 2010 and January 2, 2009, inventory balances were $47.0 million and $39.8 million, respectively, net of reserves of $4.8 million and $4.3 million, respectively. The inventory write-downs are recorded as an inventory valuation allowance established on the basis of obsolete inventory or specific identified inventory in excess of estimated usage.
Equipment and Leasehold Improvements — Equipment and leasehold improvements are stated at cost, or, in the case of equipment under capital leases, the present value of future minimum lease payments at inception of the related lease. Depreciation and amortization are computed using the straight-line method over the lesser of the estimated useful lives of the assets or the terms of the leases. Useful lives range from three to fifteen years.
Product Warranty — The Company provides a warranty on its products for a period of up to two years, and provides for warranty costs at the time of sale based on historical activity. Determination of the provisions requires the Company to make estimates of product return rates and expected costs to repair or replace the products under warranty. If actual return rates and/or repair and replacement costs differ significantly from these estimates, adjustments to recognize additional cost of sales may be required in future periods. The warranty reserve is included in other current liabilities on the consolidated balance sheet. Product warranty cost activity consisted of the following (in thousands):
| Year Ended | ||||||||||||
| January 1, 2010 |
January 2, 2009 |
December 28, 2007 |
||||||||||
| Beginning Balance |
$ | 164 | $ | 220 | $ | 344 | ||||||
| Additions related to sales |
75 | 136 | 109 | |||||||||
| Warranty costs incurred |
(127 | ) | (192 | ) | (233 | ) | ||||||
| Ending Balance |
$ | 112 | $ | 164 | $ | 220 | ||||||
Income Taxes — We utilize the asset and liability method of accounting for income taxes, under which deferred taxes are determined based on the temporary differences between the financial statement and tax basis of assets and liabilities using tax rates expected to be in effect during the years in which the basis differences reverse. A valuation allowance is recorded when it is more likely than not that some of the deferred tax assets will not be realized.
42
Table of Contents
Ultra Clean Holdings, Inc.
Notes to Consolidated Financial Statements—(Continued)
Income tax positions must meet a more-likely-than-not recognition threshold to be recognized. Income tax positions that previously failed to meet the more-likely-than-not threshold are recognized in the first subsequent financial reporting period in which that threshold is met. Previously recognized tax positions that no longer meet the more-likely-than-not threshold are derecognized in the first subsequent financial reporting period in which that threshold is no longer met. We recognize potential accrued interest and penalties related to unrecognized tax benefits within the consolidated statements of income as income tax expense.
Based on the Company’s recent historical operating results and its outlook for 2009 and beyond, the Company determined it is more likely than not that its deferred tax assets will not be realized. As such, in the second quarter of 2009, the Company recorded a tax valuation allowance reducing its deferred tax asset value of $7.0 million to zero with a corresponding non-cash charge. For 2009 the Company recorded a tax valuation allowance totaling $8.7 million.
The calculation of the Company’s tax liabilities involves dealing with uncertainties in the application of complex tax regulations. The Company records liabilities for anticipated tax audit issues based on its estimate of whether, and the extent to which, additional taxes may be due. Actual tax liabilities may be different than the recorded estimates and could result in an additional charge or benefit to the tax provision in the period when the ultimate tax assessment is determined.
The Company has ongoing audits by various state and foreign taxing jurisdictions. Management believes that it has adequately provided for any adjustments that may result from these examinations, however, the outcome of tax audits cannot be predicted with certainty.
Stock-based compensation and deferred stock-based compensation
The Company maintains stock-based compensation plans which allow for the issuance of equity-based awards to executives and certain employees. These equity-based awards include stock options, restricted stock awards and restricted stock units. The Company also maintains an employee stock purchase plan (“ESPP”) that provides for the issuance of shares to all eligible employees of the Company at a discounted price.
Stock-based compensation expense includes compensation costs related to estimated fair values of stock options and awards granted.Stock-based compensation expense from stock options and the related income tax benefit recognized were $2.7 million and $0.5 million, respectively, for fiscal year 2009, and $3.5 million and $0.6 million, respectively, for the fiscal year 2008 and $3.0 million and $0.8 million, respectively, for fiscal year 2007. The estimated fair value of the Company’s equity-based awards, net of expected forfeitures, is amortized over the awards’ vesting period on a straight-line basis over a weighted average period of four years and will be adjusted for subsequent changes in estimated forfeitures and future option grants.
Determining Fair Value
Valuation and amortization method. The Company estimates the fair value of stock options granted using the Black-Scholes option valuation model and a single option award approach. All options are amortized over the requisite service periods of the awards, which are generally the vesting periods, and are amortized using the straight-line basis method.
Expected term. The expected term of options granted represents the period of time that they are expected to be outstanding. The Company estimates the expected term of options granted based on historical exercise patterns, which the Company believes are representative of future behavior.
43
Table of Contents
Ultra Clean Holdings, Inc.
Notes to Consolidated Financial Statements—(Continued)
Expected volatility. The Company estimates the volatility of its common stock in the Black-Scholes option valuation at the date of grant based on historical volatility rates over the expected term.
Risk-free interest rate. The Company bases the risk-free interest rate in the Black-Scholes option valuation model on the implied yield in effect at the time of option grant on U.S. Treasury zero-coupon issues with equivalent remaining term.
Dividend yield. The Company has never paid any cash dividends on its common stock and does not anticipate paying any cash dividends in the foreseeable future. Consequently, the Company uses an expected dividend yield of 0.0% in the Black-Scholes option valuation model.
Forfeiture rate. The FASB’s guidance regarding stock-based compensation requires the Company to estimate forfeitures at the time of grant and revise those estimates in subsequent periods if actual forfeitures differ from those estimates.
The exercise price of each stock option equals the market price of the Company’s stock on the date of grant. The weighted average estimated fair value of employee stock option grants for the fiscal years 2009, 2008 and 2007 was $0.79, $4.71 and $7.26, respectively. Generally, options vest over four years and expire no later than ten years from the grant date. The weighted average assumptions used in the model are outlined in the following table:
| Year Ended | |||||||||
| January 1, | January 2, | December 28, | |||||||
| 2010 | 2009 | 2007 | |||||||
| Dividend yield |
0.0 | % | 0.0 | % | 0.0 | % | |||
| Expected volatility |
70.0 | % | 50.0 | % | 50.0 | % | |||
| Risk-free interest rate |
2.2 | % | 2.8 | % | 4.25 | % | |||
| Expected life (in years) |
5.6 | 5.0 | 5.0 | ||||||
The following table summarizes the Company’s restricted stock units and restricted stock awards activity for the fiscal year 2009 (in thousands):
| Number of Shares |
Weighted Average Grant Date Fair Value(1) | ||||
| Unvested at January 2, 2009 |
448 | — | |||
| Granted |
184 | — | |||
| Vested |
(155 | ) | — | ||
| Forfeited |
(118 | ) | — | ||
| Unvested at January 1, 2010 |
359 | — | |||
|
(1) There is no weighted fair value associated with these restricted stock awards. | |||||
During fiscal years 2009, 2008 and 2007, the Company recorded $2.2 million, $3.0 million and $2.4 million, respectively, of stock-based compensation expense, net of tax, associated with employee and director stock plans and employee stock purchase plan programs. As of January 1, 2010, there was $3.1 million, net of forfeitures of $1.8 million, of unrecognized compensation cost related to employee and director stock which is expected to be recognized on a straight-line basis over a weighted average period of approximately three years, and will be adjusted for subsequent changes in estimated forfeitures and future option grants.
44
Table of Contents
Ultra Clean Holdings, Inc.
Notes to Consolidated Financial Statements—(Continued)
Total stock-based compensation during the fiscal years 2009, 2008 and 2007, respectively, to various operating expense categories was as follows (in thousands):
| Year Ended | ||||||||||||
| January 1, 2010 |
January 2, 2009 |
December 28, 2007 |
||||||||||
| Cost of goods sold(1) |
$ | 822 | $ | 1,009 | $ | 915 | ||||||
| Sales and marketing |
225 | 246 | 203 | |||||||||
| Research and development |
22 | 87 | 111 | |||||||||
| General and administrative |
1,636 | 2,197 | 2,073 | |||||||||
| 2,705 | 3,539 | 3,302 | ||||||||||
| Income tax benefit |
(506 | ) | (612 | ) | (885 | ) | ||||||
| Net stock-based compensation expense |
$ | 2,199 | $ | 2,927 | $ | 2,417 | ||||||
|
(1) As of January 1, 2010 and January 2, 2009, there were no stock-based compensation expenses capitalized in inventory. |
| |||||||||||
Impairment of Goodwill and Other Long-lived Assets — Purchased intangibles consist of Tradename acquired as part of a purchase business combination.
Ultra Clean Technology Systems and Service, Inc. was founded in 1991 by Mitsubishi Corporation and was operated as a subsidiary of Mitsubishi until November 2002, when it was acquired by the Company. As part of the Ultra Clean Technology Systems and Services acquisition in November 2002, the Company allocated the purchase price to the tangible and intangible assets acquired, liabilities assumed, and in-process research and development based on their estimated fair values. Such valuations required management to make significant estimates and assumptions, especially with respect to intangible assets.
Critical estimates in valuing certain intangible assets include, but are not limited to: future expected cash flows from customer contracts; acquired developed technologies and patents; expected costs to develop the in-process research and development into commercially viable products and estimated cash flows from the projects when completed; the market position of the acquired products; and assumptions about the period of time the Tradename will continue to be used in the Company’s product portfolio. Based upon these estimates, the Tradename asset was assigned an indefinite life.
Goodwill represents the excess of the purchase price over the fair value of tangible and identifiable intangible assets acquired. Goodwill is not amortized, but rather tested for impairment. The provisions of FASB’s guidance regarding accounting for goodwill impairment require an annual goodwill impairment test or more frequently if impairment indicators arise. In testing for a potential impairment of goodwill, the provisions of the FASB’s guidance regarding accounting for goodwill impairment require the application of a fair value based test at the reporting unit level. The Company operates in one reporting segment which has one reporting unit. Therefore, all goodwill is considered enterprise goodwill and the first step of the impairment test is a comparison of fair value to book value of the Company. If the estimated fair value of the Company is less than the book value, an estimate is required of the fair value of all identifiable assets and liabilities of the business, in a manner similar to a purchase price allocation for an acquired business. This estimate requires valuations of certain internally generated and unrecognized intangible assets such as in-process research and development and developed technology. Potential goodwill impairment is measured based upon this two-step process. In the event that the Company determines that the value of goodwill has become impaired, the Company will incur an accounting charge for the amount of impairment during the period in which such determination is made.
45
Table of Contents
Ultra Clean Holdings, Inc.
Notes to Consolidated Financial Statements—(Continued)
The Company evaluates the impairment of long-lived assets, based on the projection of undiscounted cash flows whenever events or changes in circumstances indicate that the carrying amounts of such assets may not be recoverable. The Company assesses the recoverability of an asset group by determining whether the carrying value exceeds the sum of the projected undiscounted cash flows expected to result from the use and the eventual disposition of the assets over the remaining useful life of the asset group. If the recoverability test indicates that the carrying value of the asset group is not recoverable, the Company will estimate the fair value of the asset group and compare it to its carrying value. The excess of the carrying value over the fair value is allocated pro rata to derive the adjusted carrying value. The adjusted carrying value of each asset in the asset group is not reduced below its fair value.
Management performed the annual impairment test of its long-lived assets as of January 1, 2010, and determined that its long-lived assets were not impaired.
The process of evaluating the potential impairment of goodwill or long-lived assets is subjective and requires significant judgment on matters such as, but not limited to, the reporting unit at which goodwill should be measured for impairment and the asset group to be tested for recoverability. The Company is also required to make estimates that may significantly impact the outcome of the analyses. Such estimates include, but are not limited to, future operating performance and cash flows, cost of capital, terminal values, control premiums and remaining economic lives of assets.
Revenue Recognition — Product revenue is generally recorded upon shipment. In arrangements that specify title transfer upon delivery, revenue is not recognized until the product is delivered. The Company recognizes revenue when persuasive evidence of an arrangement exists, shipment has occurred, price is fixed or determinable and collectability is reasonably assured. If the Company has not substantially completed a product or fulfilled the terms of a sales agreement at the time of shipment, revenue recognition is deferred until completion. Our standard arrangement for our customers includes a signed purchase order or contract, no right of return of delivered products and no customer acceptance provisions.
The Company assesses collectability based on the credit worthiness of the customer and past transaction history. The Company performs on-going credit evaluations of customers and does not require collateral from customers.
Research and Development Costs — Research and development costs are expensed as incurred.
Net Income (loss) per Share — Basic net income (loss) per share is computed by dividing net income (loss) by the weighted average number of shares outstanding for the period. Diluted net income (loss) per share is calculated by dividing net income (loss) by the weighted average number of common shares outstanding and common equivalent shares from dilutive stock options and restricted stock using the treasury stock method, except when anti-dilutive (see Note 10 to Consolidated Financial Statements).
Comprehensive Income — The Company reports by major components and as a single total, the change in its net assets during the period from non-owner sources. Comprehensive income (loss) for all periods presented was the same as net income (loss).
Segments — The FASB’s guidance regarding disclosure about segments in an enterprise and related information establishes standards for the reporting by public business enterprises of information about reportable segments, products and services, geographic areas, and major customers. The method for determining what information to report is based on the manner in which management organizes the reportable segments within the
46
Table of Contents
Ultra Clean Holdings, Inc.
Notes to Consolidated Financial Statements—(Continued)
Company for making operational decisions and assessments of financial performance. The Company’s chief operating decision-maker is considered to be the Chief Executive Officer. The Company operates in one reporting segment.
Recently Issued Accounting Standards — During the second quarter of 2009, the Company adopted the FASB’s guidance regarding the disclosures about fair value of financial instruments, which requires disclosure about fair value of financial instruments in interim and annual financial statements. This guidance also amends previous guidance regarding interim financial reporting, to require those disclosures in summarized financial information at interim reporting periods. The adoption of this guidance had no financial impact on the Company’s condensed consolidated financial statements or related footnotes.
In June 2009, the FASB issued guidance regarding accounting standards codification and the hierarchy of generally accepted accounting principles. This guidance has become the single official source of authoritative U.S. GAAP (other than guidance issued by the SEC), superseding existing FASB, American Institute of Certified Public Accountants, Emerging Issues Task Force (“EITF”), and related literature. One level of authoritative U.S. GAAP will exist, and all other literature will be considered non-authoritative. The Company has adopted this guidance and has updated its disclosures to conform to the Codification in this Form 10K.
During the first quarter of 2009 the Company adopted the FASB’s guidance regarding the determination of the useful life of intangible assets which amends the factors an entity should consider in developing renewal or extension assumptions used in determining the useful life of recognized intangible assets under the FASB’s guidance regarding goodwill and other intangible assets. The adoption of this guidance had no financial impact on the Company’s condensed consolidated financial statements or related footnotes.
In April 2009, the FASB issued guidance regarding the determining fair value when the volume and level of activity for the asset or liability have significantly decreased and identifying transactions that are not orderly which provides additional guidance for estimating fair value when the market activity for an asset or liability has declined significantly. During the quarter ended June 26, 2009, we adopted this guidance, which did not have a financial impact on the Company’s condensed consolidated financial statements or related footnotes.
In September 2006, the FASB issued guidance regarding the fair value measurements which defines fair value, establishes a framework and gives guidance regarding the methods used for measuring fair value, and expands disclosures about fair value measurements. During the first quarter of 2009 the Company adopted this guidance for the Company’s non-financial assets and non-financial liabilities without impact to our condensed consolidated financial statements or related footnotes.
2. Acquisition of fixed assets
In the fourth quarter of fiscal 2009, the Company acquired the fixed assets of Allegro Manufacturing Pte, Ltd., a company located in Singapore. The Company paid $480,000 in cash for the installed equipment in a 35,000 square foot facility that the Company will occupy as part of the agreement with Allegro. The Company determined that the amount paid approximated the fair market value of the acquired assets, and, therefore, no intangible assets were recorded.
3. Restructuring
During the first quarter of 2009, the Company recorded restructuring charges related to consolidation of its Portland, Oregon facilities. Restructuring charges were recorded as general and administrative expense of
47
Table of Contents
Ultra Clean Holdings, Inc.
Notes to Consolidated Financial Statements—(Continued)
$215,000 based on the estimated fair value of the non-cancelable lease costs, less estimated future sublease income, which will be paid over the estimated vacancy periods through fiscal 2010. The Company’s estimated costs to exit these facilities are based on available commercial data.
During fiscal 2009 the Company made payments of $236,000 and reversed $45,000 of estimated future sublease income due to the continued vacancy of the facility. The balance of the restructuring accrual as of January 1, 2010 is $0.1 million.
The actual loss incurred in exiting these facilities could be different from the Company’s estimates.
4. Balance Sheet Information
Inventory consisted of the following (in thousands):
| January 1, 2010 |
January 2, 2009 |
|||||||
| Raw materials |
$ | 36,587 | $ | 32,464 | ||||
| Work in process |
14,071 | 10,008 | ||||||
| Finished goods |
1,154 | 1,672 | ||||||
| 51,812 | 44,144 | |||||||
| Reserve for excess and obsolete |
(4,836 | ) | (4,330 | ) | ||||
| Net |
$ | 46,976 | $ | 39,814 | ||||
Equipment and leasehold improvements, net, consisted of the following (in thousands):
| January 1, 2010 |
January 2, 2009 |
|||||||
| Computer equipment and software |
$ | 6,057 | $ | 5,858 | ||||
| Furniture and fixtures |
802 | 425 | ||||||
| Machinery and equipment |
5,465 | 5,368 | ||||||
| Leasehold improvements |
9,577 | 10,893 | ||||||
| 21,901 | 22,544 | |||||||
| Accumulated depreciation and amortization |
(14,451 | ) | (13,590 | ) | ||||
| Total |
$ | 7,450 | $ | 8,954 | ||||
5. Impairment of Goodwill and Long-lived Assets
Goodwill
As part of the Company’s annual review for impairment of goodwill during the fourth quarter of 2008, the Company determined that a significant adverse change to its business environment had occurred, which required that it evaluate the carrying value of its goodwill for impairment. The Company concluded that, under the income or the market approach, the fair value of the reporting unit was below its carrying value. As a result the Company recorded impairment charges of $34.1 million for goodwill.
48
Table of Contents
Ultra Clean Holdings, Inc.
Notes to Consolidated Financial Statements—(Continued)
Long-lived Assets (Other intangible assets, property and equipment and leasehold improvements)
In accordance with the FASB’s guidance regarding accounting for the impairment or disposal of long-lived assets, at the end of fiscal 2009 the Company assessed the useful lives of its Tradename purchased intangible asset, property, plant and equipment and concluded that they were reasonable and that the life of the intangible asset is still not determinable.
In connection with completing the Company’s goodwill impairment analysis during the fourth quarter of 2008, it reviewed its other long-lived assets, including property, equipment and leasehold improvements and other intangible assets that are subject to amortization for recoverability. As a result of this analysis the Company recorded impairment charges of $21.1 million, consisting of $10.4 million of the remaining net carrying value of its Customer List purchased intangible as well as $10.7 million of certain equipment and leasehold improvements.
The following tables provide a summary of the carrying amounts of purchased intangibles (in thousands):
| Gross Carrying Amount |
Accumulated Amortization |
Impairment | Net Carrying Amount |
Weighted Average Years | ||||||||||||
| Year Ended January 1, 2010 |
||||||||||||||||
| Tradenames |
$ | 8,987 | $ | — | $ | — | $ | 8,987 | * | |||||||
| Total |
$ | 8,987 | $ | — | $ | — | $ | 8,987 | ||||||||
| Year Ended January 2, 2009 |
||||||||||||||||
| Customer List |
$ | 13,800 | $ | (3,375 | ) | $ | (10,425 | ) | $ | — | ||||||
| Tradenames |
9,787 | (800 | ) | — | 8,987 | * | ||||||||||
| Total |
$ | 23,587 | $ | (4,175 | ) | $ | (10,425 | ) | $ | 8,987 | ||||||
| * | Tradename associated with Ultra Clean Technology Systems and Service, Inc. has an indefinite life. |
Amortization expense related to purchased intangibles was zero, $1.4 million and $1.4 million in fiscal 2009, fiscal 2008 and fiscal 2007, respectively.
6. Debt and Lease Obligations
In the second quarter of 2006, the Company entered into a borrowing arrangement and a term loan (“Loan Agreement”). The Loan Agreement provided senior secured credit facilities in an aggregate principal amount of up to $32.5 million, consisting of a $25.0 million Revolving Line of Credit and a $7.5 million term loan (“Original Term Loan”).
On February 4, 2009, the Company amended its Loan Agreement resulting in a reduction of the revolving credit facility from $25.0 million to $20.0 million while extending its maturity to January 29, 2012, and instituting a new $3.0 million, three-year term loan, as amended, also maturing on January 29, 2012. The Original Term Loan expired on June 29, 2009. The outstanding balance of the new term loan as of January 1, 2010 was approximately $2.1 million. The aggregate amount of the revolving credit facility is subject to a borrowing base equal to 80% of eligible accounts receivable and 45% of eligible inventory (total eligible inventory not to exceed $2.5 million) and is secured by substantially all of our assets. The revolving credit facility bears interest per annum at a variable rate equal to the greater of the bank’s stated prime rate or 4% plus a margin of 25 basis points. The new term loan, as amended, bears interest per annum at a variable rate equal to the greater of the bank’s stated prime rate or 4% plus a margin of 75 basis points. The revolving credit facility
49
Table of Contents
Ultra Clean Holdings, Inc.
Notes to Consolidated Financial Statements—(Continued)
contains certain reporting and financial covenants, including minimum tangible net worth and liquidity ratios that must be met on a monthly basis in order for the Company to remain in compliance. The Company is currently in compliance with all covenants in its Loan Agreement. The outstanding balance of the Revolving Line of Credit as of January 1, 2010 was approximately $11.5 million.
Interest rates on outstanding loans under the revolving credit facility and the term loan ranged from 3.5% to 4.75% per annum, during fiscal year 2009. The interest rates on the revolving credit facility and the term loan was 4.25% and 4.75% per annum, respectively, as of January 1, 2010.
The Company also has a $5.0 million equipment loan that is secured by certain of its equipment and expires May 2011. The interest rate and outstanding balance on the equipment loan was 7.6% and $1.5 million, respectively, as of January 1, 2010.
The combined balance outstanding on the Loan Agreement and equipment loan at January 1, 2010 was $15.1 million.
The Company leases certain equipment under capital lease arrangements. In addition, the Company leases its corporate and regional offices as well as some of its office equipment under non-cancelable operating leases. The Company has a renewal option for its leased facilities in South San Francisco, Hayward, California; Austin, Texas; Tualatin, Oregon (which we do not expect to renew); and Shanghai, China.
The following table summarizes our future minimum lease payments and principal payments under debt obligations as of January 1, 2010 (in thousands):
| 2010 | 2011 | 2012 | 2013 | 2014 | Thereafter | Total | |||||||||||||||
| Capital lease |
$ | 6 | $ | 6 | $ | 6 | $ | 7 | $ | 3 | $ | — | $ | 28 | |||||||
| Operating lease(1) |
3,645 | 3,035 | 2,648 | 2,456 | 2,234 | 467 | 14,485 | ||||||||||||||
| Borrowing arrangements |
2,008 | 1,443 | 11,649 | — | — | — | 15,100 | ||||||||||||||
| Total |
$ | 5,659 | $ | 4,484 | $ | 14,303 | $ | 2,463 | $ | 2,237 | $ | 467 | $ | 29,613 | |||||||
| (1) | Operating lease expense reflects (a) the lease for our headquarters facility in Hayward, California; (b) the lease for a manufacturing facility in Portland, Oregon that expires on October 31, 2010; (c) the leases for manufacturing facilities in South San Francisco expire in 2010; (d) the leases for manufacturing facilities in Austin, Texas that expire in 2010 and 2011. We have options to renew certain of the leases in South San Francisco, Hayward and Austin which we expect to exercise. |
The cost of equipment under the capital leases included in property and equipment at January 1, 2010 and January 2, 2009, was approximately $0.1 million and $0.1 million, respectively. Net book value of leased equipment at January 1, 2010 and January 2, 2009, was approximately $28,000 and $12,000, respectively.
Rental expense for fiscal years 2009, 2008 and 2007 was approximately $3.7 million, $3.3 million and $2.9 million, respectively. Included within deferred rent and other liabilities in 2009 and 2008 were $4.7 million and $4.9 million of deferred rent, respectively.
50
Table of Contents
Ultra Clean Holdings, Inc.
Notes to Consolidated Financial Statements—(Continued)
7. Income Taxes
The provision for taxes on income consisted of the following (in thousands):
| Year Ended | ||||||||||||
| January 1, 2010 |
January 2, 2009 |
December 28, 2007 |
||||||||||
| Current: |
||||||||||||
| Federal |
$ | (4,547 | ) | $ | (6,530 | ) | $ | 5,220 | ||||
| State |
40 | 42 | 1,512 | |||||||||
| Foreign |
304 | 313 | — | |||||||||
| Total current |
(4,203 | ) | (6,175 | ) | 6,732 | |||||||
| Deferred: |
||||||||||||
| Federal |
6,054 | (3,681 | ) | (867 | ) | |||||||
| State |
1,279 | (1,050 | ) | (48 | ) | |||||||
| Foreign |
30 | (30 | ) | — | ||||||||
| Total deferred |
7,363 | (4,761 | ) | (915 | ) | |||||||
| Total provision (benefit) |
$ | 3,160 | $ | (10,936 | ) | $ | 5,817 | |||||
Significant components of net deferred tax assets and deferred tax liabilities for federal and state income taxes were as follows (in thousands):
| Year Ended | ||||||||
| January 1, 2010 |
January 2, 2009 |
|||||||
| Net current deferred tax asset (liability): |
||||||||
| Inventory valuation and basis difference |
$ | 2,050 | $ | 1,962 | ||||
| Other accrued expenses |
578 | 489 | ||||||
| State taxes |
(115 | ) | — | |||||
| 2,513 | 2,451 | |||||||
| Net non-current deferred tax asset (liability): |
||||||||
| Deferred rent |
224 | 261 | ||||||
| Other accrued expenses |
2,515 | 2,317 | ||||||
| Depreciation |
2,206 | 2,135 | ||||||
| Net operating losses |
1,939 | 888 | ||||||
| State taxes |
(822 | ) | (689 | ) | ||||
| Tax credits |
162 | — | ||||||
| 6,224 | 4,912 | |||||||
| Net deferred tax assets |
8,737 | 7,363 | ||||||
| Valuation allowance |
(8,737 | ) | — | |||||
| Net valuation allowance |
$ | — | $ | 7,363 | ||||
51
Table of Contents
Ultra Clean Holdings, Inc.
Notes to Consolidated Financial Statements—(Continued)
The effective tax rate differs from the federal statutory tax rate as follows:
| Year Ended | |||||||||
| January 1, 2010 |
January 2, 2009 |
December 28, 2007 |
|||||||
| Federal income tax provision at statutory rate |
(35.0 | )% | (35.0 | )% | 35.0 | % | |||
| State income taxes, net of federal benefit |
(3.2 | )% | (3.6 | )% | 4.0 | % | |||
| Effect of foreign operations |
0.9 | % | 0.3 | % | (11.3 | )% | |||
| Impairment of goodwill and long-lived assets |
— | 20.7 | % | — | |||||
| Valuation allowance |
51.6 | % | — | — | |||||
| Other |
4.4 | % | 0.3 | % | (0.9 | )% | |||
| Effective income tax rate |
18.7 | % | (17.3 | )% | 26.8 | % | |||
All foreign earnings are considered to be permanently reinvested.
Based on the Company’s recent historical operating results and its outlook for 2010 and beyond, the Company determined it is more likely than not that its deferred tax assets will not be realized. As such, in the second quarter of 2009, the Company recorded a tax valuation allowance reducing its deferred tax asset value of $7.0 million to zero with a corresponding non-cash charge. For 2009 the Company recorded a tax valuation allowance totaling $8.7 million.
The following table summarizes the activity related to the Company’s unrecognized tax benefits (in thousands):
| Balance as of December 29, 2006 |
$ | 827 | ||
| Increases related to current year tax positions |
27 | |||
| Settlement of tax |
(25 | ) | ||
| Expiration of the statute of limitations for the assessment of taxes |
(79 | ) | ||
| Balance as of December 28, 2007 |
$ | 750 | ||
| Increases related to current year tax positions |
34 | |||
| Expiration of the statute of limitations for the assessment of taxes |
(356 | ) | ||
| Balance as of January 2, 2009 |
$ | 428 | ||
| Increases related to prior year tax positions |
522 | |||
| Expiration of the statute of limitations for the assessment of taxes |
(30 | ) | ||
| Balance as of January 1, 2010 |
$ | 920 | ||
The Company’s gross liability for unrecognized tax benefits as of January 1, 2010, January 2, 2009 and December 28, 2007, was $920,000, $428,000 and $750,000. Increases or decreases to interest and penalties on uncertain tax positions are included in income tax provision (benefit) in the Consolidated Statements of Operations. Interest related to uncertain tax positions were $262,000 as of January 1, 2010, $78,000 as of January 2, 2009 and $79,000 as of December 28, 2007. Although it is possible some of the unrecognized tax benefits could be settled within the next twelve months, the Company cannot reasonably estimate the outcome at this time.
The Company’s 2005 and 2006 state income tax returns are currently under examination by the California Franchise Tax Board (“CFTB”) and the Company’s 2006 and 2008 tax returns are currently under examination by the Internal Revenue Service. The Company is currently open to audit under the statute of limitations by the
52
Table of Contents
Ultra Clean Holdings, Inc.
Notes to Consolidated Financial Statements—(Continued)
Internal Revenue Service for fiscal years 2004 through 2008 and the Company’s state income tax returns are open to audit under the statute of limitations for the fiscal years 2005 through 2008. The Company is also subject to examination in various other jurisdictions for various periods.
The Company is currently experiencing a tax holiday related to its Singapore subsidiary that will expire for tax years beginning January 2015.
8. Stockholders’ Equity
Stock Repurchase Plan — On July 24, 2008, the Board of Directors approved a stock repurchase program for up to $10.0 million. The Company commenced the repurchase of its common stock on August 4, 2008, the total number of shares repurchased and related cost of the stock repurchase program were 601,994 shares at a cost of $3,337,000, or an average cost of $5.54 per share.
9. Employee Benefit Plans
Stock Options — On February 20, 2003, the Company adopted the 2003 Stock Incentive Plan (the “2003 Incentive Plan”) which was subsequently amended and restated. The Company has reserved 4,515,239 shares of its common stock for issuance under the 2003 Incentive Plan, as amended and restated. The 2003 Incentive Plan provides for the issuance of options and other stock-based awards. Options are generally granted at fair value at the date of grant as determined by the Board of Directors, have terms up to ten years and generally vest over four years. At January 1, 2010, 267,543 shares were available for future grants under the 2003 Incentive Plan.
Option activity under the 2003 Incentive Plan is as follows:
| Shares | Weighted Average Exercise Price |
Weighted Average Remaining Contractual Life |
Aggregate Intrinsic Value | ||||||||
| (In thousands) | |||||||||||
| Outstanding, December 29, 2006 |
2,916,144 | 6.41 | 8.29 | $ | 17,543 | ||||||
| Granted |
530,100 | 14.79 | |||||||||
| Exercised |
(440,861 | ) | 5.02 | ||||||||
| Cancelled |
(77,547 | ) | 10.31 | ||||||||
| Outstanding, December 28, 2007 |
2,927,836 | $ | 8.03 | 7.70 | $ | 13,597 | |||||
| Granted |
102,000 | 8.83 | |||||||||
| Exercised |
(241,976 | ) | 4.33 | ||||||||
| Cancelled |
(641,978 | ) | 9.70 | ||||||||
| Outstanding, January 2, 2009 |
2,145,882 | $ | 8.03 | 6.65 | $ | 360 | |||||
| Granted |
1,204,292 | 1.63 | |||||||||
| Exercised |
(14,312 | ) | 1.07 | ||||||||
| Cancelled |
(441,400 | ) | 7.96 | ||||||||
| Outstanding, January 1, 2010 |
2,894,462 | $ | 5.38 | 6.99 | $ | 8,543 | |||||
| Options exerciseable, January 1, 2010 |
1,583,950 | $ | 7.23 | ||||||||
53
Table of Contents
Ultra Clean Holdings, Inc.
Notes to Consolidated Financial Statements—(Continued)
The following table summarizes information with respect to options outstanding and exercisable at January 1, 2010:
| Range of Exercise Price |
Shares Outstanding |
Weighted Average Remaining Average Life (Years) |
Weighted Average Exercise Price |
Shares Exercisable |
Weighted Average Exercise Price | |||||||
| $1.00–3.99 |
1,454,397 | 7.76 | $ | 1.31 | 350,947 | $ | 1.00 | |||||
| $4.00–6.99 |
554,330 | 5.41 | 6.48 | 543,830 | 6.48 | |||||||
| $7.00–7.99 |
82,132 | 4.45 | 7.00 | 78,632 | 7.00 | |||||||
| $8.00–8.99 |
298,399 | 6.38 | 8.53 | 265,387 | 8.54 | |||||||
| $9.00–14.90 |
505,204 | 7.26 | 13.76 | 345,154 | 13.80 | |||||||
| Grand Total |
2,894,462 | 6.99 | $ | 5.38 | 1,583,950 | $ | 7.23 | |||||
Restricted Stock Units and Restricted Stock Awards — In fiscal 2009, 2008 and 2007, the Company granted 37,500, 37,500 and 25,000 shares, respectively, of common stock to its board members under the 2003 Incentive Plan. These restricted shares vested 365 days from the date of grant. During the second quarter of 2009 the Company granted 22,500 shares of common stock to a board member under the 2003 Incentive Plan. These shares vested over a three month period. The total unamortized expense of the Company’s unvested restricted stock awards as of January 1, 2010, is less than $0.1 million. During the first quarter of fiscal 2008, the Company began granting Restricted Stock Units (RSU’s) to employees as part of the Company’s long term equity compensation plan. These RSU’s are granted to employees with a per share or unit purchase price of zero dollars and either have time based or performance based vesting. RSU’s typically vest over three years, subject to the employee’s continued service with the Company. The expected cost of the grant is recognized over the service period, and is reduced for estimated forfeitures. During the year ended January 1, 2010, the Company approved and granted 123,833 RSU’s to employees with a weighted average fair value of $3.54 per share. As of January 1, 2010, $1.2 million of unrecognized stock-based compensation cost related to RSU’s remains to be amortized and is expected to be recognized over an estimated period of 1 year.
For the fiscal years 2009, 2008 and 2007, the Company expensed $1.1 million, $1.1 million and $0.3 million, respectively, to compensation expense related to the vesting of restricted stock. The unvested amount is subject to forfeiture, until the common stock is fully vested. At January 1, 2010, 359,000 shares were subject to repurchase.
54
Table of Contents
Ultra Clean Holdings, Inc.
Notes to Consolidated Financial Statements—(Continued)
The following table summarizes the Company’s restricted stock unit and restricted stock award activity for the year ended January 1, 2010 (in thousands):
| Number of Shares |
|||
| Unvested restricted stock units and restricted stock awards at December 28, 2007 |
41 | ||
| Granted |
492 | ||
| Vested |
(41 | ) | |
| Forfeited |
(44 | ) | |
| Unvested restricted stock units and restricted stock awards at January 2, 2009 |
448 | ||
| Granted |
184 | ||
| Vested |
(155 | ) | |
| Forfeited |
(118 | ) | |
| Unvested restricted stock units and restricted stock awards at January 1, 2010 |
359 | ||
Employee Stock Purchase Plan — In 2004 the Company adopted an Employee Stock Purchase Plan (“ESPP”) and is authorized to issue 555,343 shares of common stock under the ESPP. The ESPP permits employees to purchase common stock at a discount through payroll withholdings at certain specified dates (purchase period) within a defined offering period. The purchase price is 95% of the fair market value of the common stock at the end of the purchase period and is intended to qualify as an “employee stock purchase plan” under Section 423 of the Internal Revenue Code. There were 27,410 shares issued under the ESPP during the year ended January 1, 2010.
Employee Savings and Retirement Plan — The Company sponsors a 401(k) savings and retirement plan (the “401(k) Plan”) for all employees who meet certain eligibility requirements. Participants could elect to contribute to the 401(k) Plan, on a pre-tax basis, from 2-19% of their salary up to a maximum of $15,500. The Company may make matching contributions of up to 6% of employee contributions based upon eligibility. The Company made approximately $0.1 million, $0.9 million, and $0.6 million discretionary employer contributions to the 401(k) Plan in the years ended January 1, 2010, January 2, 2009 and December 28, 2007, respectively.
55
Table of Contents
Ultra Clean Holdings, Inc.
Notes to Consolidated Financial Statements—(Continued)
10. Net Income (Loss) Per Share
The following is a reconciliation of the numerators and denominators used in computing basic and diluted net income (loss) per share (in thousands):
| Year Ended | ||||||||||||
| January 1, 2010 |
January 2, 2009 |
December 28, 2007 |
||||||||||
| Numerator: |
||||||||||||
| Net income (loss) |
$ | (20,026 | ) | $ | (52,417 | ) | $ | 15,893 | ||||
| Denominator: |
||||||||||||
| Shares used in computation — basic: |
||||||||||||
| Weighted average common shares outstanding |
21,403 | 21,564 | 21,333 | |||||||||
| Weighted average common shares outstanding subject to repurchase |
— | (22 | ) | (40 | ) | |||||||
| Shares used in computing basic net income (loss) per share |
21,403 | 21,542 | 21,293 | |||||||||
| Shares used in computation — diluted: |
||||||||||||
| Weighted average common shares outstanding |
21,403 | 21,542 | 21,293 | |||||||||
| Dilutive effect of common shares outstanding subject to repurchase |
— | — | 40 | |||||||||
| Dilutive effect of options outstanding |
— | — | 785 | |||||||||
| Shares used in computing diluted net income (loss) per share |
21,403 | 21,542 | 22,118 | |||||||||
| Net income (loss) per share — basic |
$ | (0.94 | ) | $ | (2.43 | ) | $ | 0.75 | ||||
| Net income (loss) per share — diluted |
$ | (0.94 | ) | $ | (2.43 | ) | $ | 0.72 | ||||
The Company had securities outstanding which could potentially dilute basic earnings per share in the future, but the incremental shares from the assumed exercise of these securities were excluded in the computation of diluted net income (loss) per share, as their effect would have been anti-dilutive. Such outstanding securities consist of the following (in thousands):
| Year Ended | ||||||
| January 1, 2010 |
January 2, 2009 |
December 28, 2007 | ||||
| Outstanding options |
2,894 | 1,229 | 499 | |||
11. Related Party Transactions
The Company leases a facility from an entity controlled by one of the Company’s board members. The Company incurred rent expense resulting from the lease of this facility of $0.3 million, $0.3 million and $0.1 million for the years ended January 1, 2010, January 2, 2009 and December 28, 2007, respectively.
The spouse of one of the Company’s executives is the sole owner of the Company’s primary travel agency. The Company incurred fees for travel-related services, including the cost of airplane tickets, of $0.2 million, $0.3 million and $0.4 million for the years ended January 1, 2010, January 2, 2009 and December 28, 2007, respectively.
56
Table of Contents
Ultra Clean Holdings, Inc.
Notes to Consolidated Financial Statements—(Continued)
In November 2002, the Company entered into an agreement with a key executive of the Company to defer payment of $265,000 in compensation until November 15, 2009. Under this arrangement the Company pays interest of 2.7% per annum, payable on June 30 and December 31 of each year. The amounts owed under this arrangement may be prepaid by the Company at the discretion of the board of directors. The principal amount owed under this arrangement is contained within Capital lease obligations and other liabilities on the balance sheet of the Company.
12. Segment Information
The Company operates in one reportable segment and is engaged in the development, manufacture and supply of critical subsystems for the semiconductor capital equipment, flat panel, medical, energy and research industries. The nature of the Company’s products and production processes as well as type of customers and distribution methods is consistent among all of the Company’s products. The Company’s foreign operations are conducted primarily through its wholly-owned subsidiary in China. The Company’s principal markets include North America, Europe and Asia. Sales by geographic area represent sales to unaffiliated customers.
All information on sales by geographic area is based upon the location to which the products were shipped. The following table sets forth revenue by geographic area (in thousands):
| Year Ended | |||||||||
| Sales |
January 1, 2010 |
January 2, 2009 |
December 28, 2007 | ||||||
| United States |
$ | 156,295 | $ | 262,168 | $ | 395,039 | |||
| Export sales to Europe and Asia |
3,462 | 4,751 | 8,768 | ||||||
| Total |
$ | 159,757 | $ | 266,919 | $ | 403,807 | |||
At January 1, 2010 and January 2, 2009, approximately $1.7 million and $1.6 million, respectively, of the Company’s long-lived assets were located in China and Singapore, and the remaining balances were located in the United States.
13. Commitments and Contingencies
The Company had commitments to purchase inventory totaling approximately $16.5 million at January 1, 2010.
In September 2007, the Company entered into a facility lease agreement for approximately 104,000 square feet of office space in Hayward, California and began moving into the new facility towards the latter part of the second quarter of 2008. In lieu of a cash security deposit, the Company established an irrevocable standby letter of credit in the amount of $156,000 naming the landlord of the new facility as the beneficiary. Pursuant to the lease agreement, the Company received approximately $4.1 million in tenant improvement allowances and will receive incentives of approximately $1.2 million in rent abatements over the first two years of the lease. The Company has received $1.2 million in incentives as of January 1, 2010. The operating lease term for the new facility commenced on April 1, 2008, and will continue through April 1, 2015, with minimum monthly lease payments beginning at $119,000 and escalating annually after the first two years. The Company’s total future minimum lease payments over the term of the lease will be approximately $10.2 million.
From time to time, we are subject to various legal proceedings and claims, either asserted or unasserted, that arise in the ordinary course of business. Although the outcome of the various legal proceedings and claims cannot be predicted with certainty, the Company has not had a history of outcomes to date that have been material to the statement of operations and does not believe that any of these proceedings or other claims will have a material adverse effect on its consolidated financial condition or results of operations.
57
Table of Contents
| Item 9. | Changes in and Disagreements With Accountants on Accounting and Financial Disclosure |
Not Applicable
| Item 9A. | Controls and Procedures |
This annual report does not include an attestation report of the company’s registered public accounting firm regarding internal control over financial reporting. Management’s report was not subject to attestation by the company’s registered public accounting firm pursuant to temporary rules of the Securities and Exchange Commission that permit the company to provide only management’s report in this annual report.
Disclosure Controls and Procedures
We maintain disclosure controls and procedures that are designed to provide reasonable assurance that information required to be disclosed in our filings with the SEC under the Securities Exchange Act of 1934 (the “Exchange Act”) is recorded, processed, summarized and reported within the time periods specified in the SEC’s rules and forms and that such information is accumulated and communicated to management, including our chief executive officer (“CEO”) and chief financial officer (“CFO”), as appropriate, to allow for timely decisions regarding required disclosure. In designing and evaluating the disclosure controls and procedures, management recognizes that any controls and procedures, no matter how well designed and operated, can provide only reasonable assurance of achieving the desired control objectives, and management is required to apply its judgment in evaluating the cost-benefit relationship of possible controls and procedures.
As required by SEC Rule 13a-15(b), in connection with filing this Annual Report on Form 10-K, management conducted an evaluation, with the participation of our CEO and CFO, of the effectiveness of the design and operation of our disclosure controls and procedures, as such term is defined under Rule 13a-15(e) promulgated under the Exchange Act, as of January 1, 2010, the end of the period covered by this report. Based upon our evaluation, our CEO and CFO concluded that our disclosure controls and procedures were effective as of January 1, 2010.
Management’s Report on Internal Control Over Financial Reporting
Our management is responsible for establishing and maintaining adequate internal control over financial reporting, as such term is defined under Rule 13a-15(f) promulgated under the Exchange Act. Because of its inherent limitations, internal control over financial reporting may not prevent or detect misstatements. Also, projections of any evaluation of effectiveness to future periods are subject to the risk that controls may become inadequate because of changes in conditions, or that the degree of compliance with the policies or procedures may deteriorate.
Under the supervision and with the participation of our management, including our CEO and CFO, we conducted an assessment of the effectiveness of our internal control over financial reporting as of January 1, 2010. Based on our evaluation under the framework in Internal Control — Integrated Framework , management has concluded that our internal control over financial reporting was effective as of January 1, 2010.
Changes in Internal Control Over Financial Reporting
There have been no material changes in our internal controls over financial reporting during the last fiscal quarter that have materially affected, or are reasonably likely to materially affect, our internal controls over financial reporting, except to remediate the material weakness we identified as of January 2, 2009, which was related to year end physical inventory count procedures and computation inventory reserves. With regard to this material weakness we have implemented and executed our remediation plan, and as of January 1, 2010, this material weakness was successfully tested and deemed remediated.
| Item 9B. | Other Information |
None.
58
Table of Contents
Pursuant to Paragraph G(3) of the General Instructions to Form 10-K, portions of the information required by Part III of Form 10-K are incorporated by reference from our definitive Proxy Statement to be filed with the SEC in connection with our 2010 Annual Meeting of Stockholders.
| Item 10. | Directors and Executive Officers of the Registrant |
The information required by this item concerning directors, including our audit committee financial expert, is incorporated by reference to the section entitled, “Election of Directors” in our definitive Proxy Statement for the 2010 Annual Meeting of Stockholders.
For information with respect to Executive Officers, see Part I, Item 1 of this Annual Report on Form 10-K, under “Executive Officers.”
The information required by the item with respect to Section 16(a) beneficial reporting compliance is incorporated by reference to the section entitled, “Section 16(a) Beneficial Ownership Reporting Compliance” in our definitive Proxy Statement for the 2010 Annual Meeting of Stockholders.
We have adopted a code of ethics that is designed to qualify as a “code of ethics” within the meaning of Section 406 of the Sarbanes-Oxley Act of 2002 and the rules promulgated thereunder. This code of ethics is available on our website at www.uct.com. To the extent required by law, any amendments to, or waivers from, any provision of the code of ethics will be promptly disclosed to the public. To the extent permitted by such legal requirements, we intend to make such public disclosure by posting the relative material on our website in accordance with SEC rules.
| Item 11. | Executive Compensation |
The information required by this item is incorporated by reference to the sections entitled “Executive Officer Compensation” and “Election of Directors” in the Company’s definitive Proxy Statement for the 2010 Annual Meeting of Stockholders.
| Item 12. | Security Ownership of Certain Beneficial Owners and Management and Related Stockholder Matters |
The information required by this item is incorporated by reference to the sections entitled “Security Ownership of Certain Beneficial Owners and Management” in the Company’s definitive Proxy Statement for the 2010 Annual Meeting of Stockholders.
This table summarizes our equity plan information as of January 1, 2010:
| Plan Category |
(a) Number of Securities to be Issued Upon Exercise of Outstanding Options, Warrants and Rights |
(b) Weighted-Average Exercise Price of Outstanding Options, Warrants and Rights |
(c) Number of Securities Remaining Available for Future Issuance Under Equity Compensation Plans (Excluding Securities Reflected in Column (a)) | ||||
| Equity compensation plans approved by security holders:(1) |
2,894,462 | $ | 5.38 | 2,894,462 | |||
| Equity compensation plans not approved by security holders |
— | — | — | ||||
| Total |
2,894,462 | 5.38 | 2,894,462 | ||||
59
Table of Contents
| (1) | Consists of the Amended and Restated Stock Incentive Plan and, for purposes of column (c), the Employee Stock Purchase Plan. The number of shares available under our Amended and Restated Stock Incentive Plan automatically increases each year, beginning January 1, 2005 through January 1, 2014, by an amount equal to the lesser of (i) 370,228 shares, (ii) 2% of the number of shares of the common stock outstanding on the date of the increase or (iii) an amount determined by the Board of Directors. |
| Item 13. | Certain Relationships and Related Transactions |
The information required by this item is incorporated by reference to the section entitled “Certain Relationships and Related Transactions” in the Company’s definitive Proxy Statement for the 2010 Annual Meeting of Stockholders.
| Item 14. | Principal Accountant Fees and Services |
The information required by this item is incorporated by reference to the section entitled “Ratification of the Appointment of Our Independent Registered Public Accounting Firm” in the Company’s definitive Proxy Statement for the 2010 Annual Meeting of Stockholders.
60
Table of Contents
| Item 15. | Exhibits, Financial Statement Schedules |
(a) The following documents are filed as part of this Form 10-K:
1. Financial Statements:
| Form 10-K Page No. | ||
| 36 | ||
| 37 | ||
| 38 | ||
| 39 | ||
| 40 | ||
| 41 |
2. Financial statement schedules not listed have been omitted because they are not applicable or required, or the information required to be set forth therein is included in the Consolidated Financial Statements or Notes thereto.
3. Exhibits
61
Table of Contents
Exhibit Index
| Exhibit |
Description | |
| 2.1 | Agreement and Plan of Merger dated as of October 30, 2002, among Ultra Clean Holdings, Inc., Ultra Clean Technology Systems and Service, Inc., Mitsubishi Corporation, Mitsubishi International Corporation and Clean Merger Company(a) | |
| 2.2 | Agreement and Plan of Merger and Reorganization dated as of June 29, 2006 by and among Sieger Engineering, Inc., Leonid Mezhvinsky, Ultra Clean Holdings, Inc., Bob Acquisition Inc., Pete Acquisition LLC, Leonid and Inna Mezhvinsky as trustees of the Revocable Trust Agreement of Leonid Mezhvinsky and Inna Mezhvinsky dated April 26, Joe and Jenny Chen as trustees of the Joe Chen and Jenny Chen Revocable Trust dated 2002, Victor Mezhvinsky, Victor Mezhvinsky as trustee of the Joshua Mezhvinsky 2004 Irrevocable Trust under Agreement dated June 4, 2004, David Hongyu Wu and Winnie Wei Zhen Wu as trustees of the Chen Minors Irrevocable Trust, Frank Moreman and Leonid Mezhvinsky as Sellers’ Agent(g) | |
| 3.1 | Amended and Restated Certificate of Incorporation of Ultra Clean Holdings, Inc.(b) | |
| 3.2 | Amended and Restated Bylaws of Ultra Clean Holdings, Inc.(i) | |
| 4.1 | Amended and Restated Registration Rights Agreement dated as of June 29, 2006 among Ultra Clean, FP-Ultra Clean L.L.C. and the Sieger Shareholders(g) | |
| 10.1 | Employment Agreement dated November 15, 2002 between Clarence L. Granger and Ultra Clean Holdings, Inc.(a) | |
| 10.2 | Offer letter dated as of December 7, 2007 between Ultra Clean and David Savage(h) | |
| 10.3 | Agreement to Preserve Corporate Opportunity dated as of June 29, 2006 between Ultra Clean and Leonid Mezhvinsky(g) | |
| 10.4 | Amended and Restated 2003 Stock Incentive Plan(d) | |
| 10.5 | Form of Stock Option Agreement(c) | |
| 10.6 | Loan and Security Agreement dated as of June 29, 2006 among Silicon Valley Bank, Ultra Clean Technology Systems and Service, Inc., Bob Acquisition Inc. and Pete Acquisition LLC as amended through February 4, 2009 (l) | |
| 10.7 | Unconditional Guaranty by Ultra Clean in favor of Silicon Valley Bank dated as of June 29, 2006(g) | |
| 10.8 | Securities Pledge Agreement dated as of June 29, 2006 between Silicon Valley Bank and Ultra Clean(g) | |
| 10.9 | Intellectual Property Security Agreement dated as of June 29, 2006 between Silicon Valley Bank and Ultra Clean(g) | |
| 10.10 | Intellectual Property Security Agreement dated as of June 29, 2006 between Silicon Valley Bank and Ultra Clean Technology(g) | |
| 10.11 | Employee Stock Purchase Plan (Restated as of October 21, 2004)(e) | |
| 10.12 | Form of Indemnification Agreement between Ultra Clean Holdings, Inc. and each of its directors and executive officers(b) | |
| 10.13 | Amendment No. 1 to Employment Agreement between Clarence L. Granger and Ultra Clean Holdings, Inc. dated March 2, 2004(b) | |
| 10.14 | Amendment No. 2 to Employment Agreement between Clarence L. Granger and Ultra Clean Holding, Inc. dated May 9, 2005(f) | |
62
Table of Contents
| Exhibit |
Description | |
| 10.15 | Form of Award Agreement(c) | |
| 10.16 | Severance Policy for Executive Officers (revised) (l) | |
| 10.17 | Form of Restricted Stock Unit Award Agreement(j) | |
| 10.18 | Separation Agreement dated as of December 31, 2007 between the Company and Leonid Mezhvinsky(k) | |
| 10.19 | Change of Control Severance Agreement dated as of July 28, 2008 by and between Ultra Clean Holdings, Inc. and Clarence L. Granger (l) | |
| 10.20 | Change of Control Severance Agreement dated as of July 28, 2008 by and between Ultra Clean Holdings, Inc. and David Savage (l) | |
| 10.22 | Change of control Severence Agreement dated as of July 21, 2009 by and between Ultra Clean Holdings, Inc. and Kevin C. Eichler (m) | |
| 10.23 | Separation and Release Agreement between Ultra Clean Holdings, Inc. and Jack Sexton (n) | |
63
Table of Contents
| Exhibit | Description | |
| 21.1 | Subsidiaries of Ultra Clean Holdings, Inc. | |
| 23.1 | Consent of Independent Registered Public Accounting Firm | |
| 24.1 | Power of Attorney (included on signature page) | |
| 31.1 | Certification of Chief Executive Officer pursuant to Section 302 of the Sarbanes-Oxley Act of 2002. | |
| 31.2 | Certification of Chief Financial Officer pursuant to Section 302 of the Sarbanes-Oxley Act of 2002. | |
| 32.1 | Certification of Chief Executive Officer pursuant to 18 U.S.C. Section 1350, as adopted pursuant to Section 906 of the Sarbanes-Oxley Act of 2002. | |
| 32.2 | Certification of Chief Financial Officer pursuant to 18 U.S.C. Section 1350, as adopted pursuant to Section 906 of the Sarbanes-Oxley Act of 2002. | |
| (a) | Filed as an exhibit to the Registrant’s Registration Statement on Form S-1 (File No. 333-11904), filed January 14, 2004. |
| (b) | Filed as an exhibit to Amendment No. 2 to the Registrant’s Registration Statement on Form S-1/A (File No. 333-11904), filed March 2, 2004. |
| (c) | Filed as an exhibit to Amendment No. 3 to the Registrant’s Registration Statement on Form S-1/A (File No. 333-11904), filed March 8, 2004. |
| (d) | Filed as an exhibit to the Registrant’s Registration Statement on Form S-8 (File No. 333-114051), filed March 30, 2004. |
| (e) | Filed as an exhibit to the Registrant’s Quarterly Report on Form 10-Q for the three months ended September 30, 2004. |
| (f) | Filed as an exhibit to the Registrant’s Current Report on Form 8-K, filed May 13, 2005. |
| (g) | Filed as an exhibit to the Registrant’s Current Report on Form 8-K, filed July 6, 2006. |
| (h) | Filed as an exhibit to the Registrant’s Current Report on Form 8-K, filed December 12, 2007. |
| (i) | Filed as an exhibit to the Registrant’s Current Report on Form 8-K, filed August 3, 2009. |
| (j) | Filed as an exhibit to the Registrant’s Annual Report on Form 10-K for the year ended December 28, 2008. |
| (k) | Filed as an exhibit to the Registrant’s Quarterly Report on Form 10-Q for the three months ended March 28, 2008. |
| (l) | Filed as an exhibit to the Registrant’s Annual Report on Form 10-K for the year ended January 2, 2009. |
| (m) | Filed as an exhibit to the Registrant’s Quarterly Report on Form 10-Q for the three months ended October 2, 2009. |
| (n) | Filed as an exhibit to the Registrant’s Quarterly Report on Form 10-Q for the three months ended July 3, 2009. |
64
Table of Contents
SIGNATURES
Pursuant to the requirements of Section 13 or 15(d) of the Securities Exchange Act of 1934, the Registrant has duly caused this Report to be signed on its behalf by the undersigned, thereunto duly authorized.
| Ultra Clean Holdings, Inc. | ||
| By: |
/s/ CLARENCE L. GRANGER | |
| Clarence L. Granger | ||
| Chairman & Chief Executive Officer | ||
Date: March 29, 2010
KNOW ALL PERSONS BY THESE PRESENTS, that each person whose signature appears below constitutes and appoints Clarence L. Granger and Kevin C. Eichler, and each of them, as his true and lawful attorneys-in-fact and agents, with full power of substitution and re-substitution, for him in any and all capacities, to sign any and all amendments to this Annual Report on Form 10-K and to file the same, with all exhibits thereto, and other documents in connection therewith, with the Securities and Exchange Commission hereby ratifying and confirming that each of said attorneys-in-fact and agents, or his substitute or substitutes, may lawfully do or cause to be done by virtue hereof.
Pursuant to the requirements of the Securities Exchange Act of 1934, this Report has been signed below by the following persons on behalf of the Registrant and in the capacities and on the dates indicated.
| Signature |
Title |
Date | ||
| /s/ CLARENCE L. GRANGER |
Chairman & Chief Executive | March 29, 2010 | ||
| Clarence L. Granger | Officer (Principal Executive Officer) and Director | |||
| /s/ KEVIN C. EICHLER |
Senior Vice President and Chief | March 29, 2010 | ||
| Kevin C. Eichler | Financial Officer (Principal Financial Officer and Principal Accounting Officer) | |||
| /s/ LEONID MEZHVINSKY |
Director | March 29, 2010 | ||
| Leonid Mezhvinsky | ||||
| /s/ JOHN CHENAULT |
Director | March 29, 2010 | ||
| John Chenault | ||||
| /s/ SUSAN H. BILLAT |
Director | March 29, 2010 | ||
| Susan H. Billat | ||||
| /s/ DAVID T. IBNALE |
Director | March 29, 2010 | ||
| David T. IbnAle | ||||
65
Table of Contents
Exhibit Index
| Exhibit |
Description | |
| 2.1 | Agreement and Plan of Merger dated as of October 30, 2002, among Ultra Clean Holdings, Inc., Ultra Clean Technology Systems and Service, Inc., Mitsubishi Corporation, Mitsubishi International Corporation and Clean Merger Company(a) | |
| 2.2 | Agreement and Plan of Merger and Reorganization dated as of June 29, 2006 by and among Sieger Engineering, Inc., Leonid Mezhvinsky, Ultra Clean Holdings, Inc., Bob Acquisition Inc., Pete Acquisition LLC, Leonid and Inna Mezhvinsky as trustees of the Revocable Trust Agreement of Leonid Mezhvinsky and Inna Mezhvinsky dated April 26, Joe and Jenny Chen as trustees of the Joe Chen and Jenny Chen Revocable Trust dated 2002, Victor Mezhvinsky, Victor Mezhvinsky as trustee of the Joshua Mezhvinsky 2004 Irrevocable Trust under Agreement dated June 4, 2004, David Hongyu Wu and Winnie Wei Zhen Wu as trustees of the Chen Minors Irrevocable Trust, Frank Moreman and Leonid Mezhvinsky as Sellers’ Agent(g) | |
| 3.1 | Amended and Restated Certificate of Incorporation of Ultra Clean Holdings, Inc.(b) | |
| 3.2 | Amended and Restated Bylaws of Ultra Clean Holdings, Inc.(i) | |
| 4.1 | Amended and Restated Registration Rights Agreement dated as of June 29, 2006 among Ultra Clean, FP-Ultra Clean L.L.C. and the Sieger Shareholders(g) | |
| 10.1 | Employment Agreement dated November 15, 2002 between Clarence L. Granger and Ultra Clean Holdings, Inc.(a) | |
| 10.2 | Offer letter dated as of December 7, 2007 between Ultra Clean and David Savage(h) | |
| 10.3 | Agreement to Preserve Corporate Opportunity dated as of June 29, 2006 between Ultra Clean and Leonid Mezhvinsky(g) | |
| 10.4 | Amended and Restated 2003 Stock Incentive Plan(d) | |
| 10.5 | Form of Stock Option Agreement(c) | |
| 10.6 | Loan and Security Agreement dated as of June 29, 2006 among Silicon Valley Bank, Ultra Clean Technology Systems and Service, Inc., Bob Acquisition Inc. and Pete Acquisition LLC as amended through February 4, 2009 (l) | |
| 10.7 | Unconditional Guaranty by Ultra Clean in favor of Silicon Valley Bank dated as of June 29, 2006(g) | |
| 10.8 | Securities Pledge Agreement dated as of June 29, 2006 between Silicon Valley Bank and Ultra Clean(g) | |
| 10.9 | Intellectual Property Security Agreement dated as of June 29, 2006 between Silicon Valley Bank and Ultra Clean(g) | |
| 10.10 | Intellectual Property Security Agreement dated as of June 29, 2006 between Silicon Valley Bank and Ultra Clean Technology(g) | |
| 10.11 | Employee Stock Purchase Plan (Restated as of October 21, 2004)(e) | |
| 10.12 | Form of Indemnification Agreement between Ultra Clean Holdings, Inc. and each of its directors and executive officers(b) | |
| 10.13 | Amendment No. 1 to Employment Agreement between Clarence L. Granger and Ultra Clean Holdings, Inc. dated March 2, 2004(b) | |
| 10.14 | Amendment No. 2 to Employment Agreement between Clarence L. Granger and Ultra Clean Holding, Inc. dated May 9, 2005(f) | |
66
Table of Contents
| Exhibit |
Description | |
| 10.15 | Form of Award Agreement(c) | |
| 10.16 | Severance Policy for Executive Officers (revised) (l) | |
| 10.17 | Form of Restricted Stock Unit Award Agreement(j) | |
| 10.18 | Separation Agreement dated as of December 31, 2007 between the Company and Leonid Mezhvinsky(k) | |
| 10.19 | Change of Control Severance Agreement dated as of July 28, 2008 by and between Ultra Clean Holdings, Inc. and Clarence L. Granger (l) | |
| 10.20 | Change of Control Severance Agreement dated as of July 28, 2008 by and between Ultra Clean Holdings, Inc. and David Savage (l) | |
| 10.22 | Change of control Severence Agreement dated as of July 21, 2009 by and between Ultra Clean Holdings, Inc. and Kevin C. Eichler (m) | |
| 10.23 | Separation and Release Agreement between Ultra Clean Holdings, Inc. and Jack Sexton (n) | |
67
Table of Contents
| Exhibit |
Description | |
| 21.1 | Subsidiaries of Ultra Clean Holdings, Inc. | |
| 23.1 | Consent of Independent Registered Public Accounting Firm | |
| 24.1 | Power of Attorney (included on signature page) | |
| 31.1 | Certification of Chief Executive Officer pursuant to Section 302 of the Sarbanes-Oxley Act of 2002. | |
| 31.2 | Certification of Chief Financial Officer pursuant to Section 302 of the Sarbanes-Oxley Act of 2002. | |
| 32.1 | Certification of Chief Executive Officer pursuant to 18 U.S.C. Section 1350, as adopted pursuant to Section 906 of the Sarbanes-Oxley Act of 2002. | |
| 32.2 | Certification of Chief Financial Officer pursuant to 18 U.S.C. Section 1350, as adopted pursuant to Section 906 of the Sarbanes-Oxley Act of 2002. | |
| (a) | Filed as an exhibit to the Registrant’s Registration Statement on Form S-1 (File No. 333-11904), filed January 14, 2004. |
| (b) | Filed as an exhibit to Amendment No. 2 to the Registrant’s Registration Statement on Form S-1/A (File No. 333-11904), filed March 2, 2004. |
| (c) | Filed as an exhibit to Amendment No. 3 to the Registrant’s Registration Statement on Form S-1/A (File No. 333-11904), filed March 8, 2004. |
| (d) | Filed as an exhibit to the Registrant’s Registration Statement on Form S-8 (File No. 333-114051), filed March 30, 2004. |
| (e) | Filed as an exhibit to the Registrant’s Quarterly Report on Form 10-Q for the three months ended September 30, 2004. |
| (f) | Filed as an exhibit to the Registrant’s Current Report on Form 8-K, filed May 13, 2005. |
| (g) | Filed as an exhibit to the Registrant’s Current Report on Form 8-K, filed July 6, 2006. |
| (h) | Filed as an exhibit to the Registrant’s Current Report on Form 8-K, filed December 12, 2007. |
| (i) | Filed as an exhibit to the Registrant’s Current Report on Form 8-K, filed August 3, 2009. |
| (j) | Filed as an exhibit to the Registrant’s Annual Report on Form 10-K for the year ended December 28, 2008. |
| (k) | Filed as an exhibit to the Registrant’s Quarterly Report on Form 10-Q for the three months ended March 28, 2008. |
| (l) | Filed as an exhibit to the Registrant's Annual Report on Form 10-K for the year ended January 2, 2009. |
| (m) | Filed as an exhibit to the Registrant’s Quarterly Report on Form 10-Q for the three months ended October 2, 2009. |
| (n) | Filed as an exhibit to the Registrant’s Quarterly Report on Form 10-Q for the three months ended July 3, 2009. |
68