Attached files
| file | filename |
|---|---|
| EX-23 - EXHIBIT 23 - BCB BANCORP INC | ex23.htm |
| EX-32 - EXHIBIT 32 - BCB BANCORP INC | ex32.htm |
| EX-13 - EXHIBIT 13 - BCB BANCORP INC | ex13.htm |
| EX-31.1 - EXHIBIT 31.1 - BCB BANCORP INC | ex31_1.htm |
| EX-31.2 - EXHIBIT 31.2 - BCB BANCORP INC | ex31_2.htm |
UNITED
STATES
SECURITIES
AND EXCHANGE COMMISSION
Washington,
D.C. 20549
FORM
10-K
(Mark
One)
T Annual Report Pursuant To
Section 13 Or 15(D) Of The Securities Exchange Act of 1934
For the
fiscal ended December 31, 2009.
or
o Transition Report Pursuant To Section
13 Or 15(D) Of The Securities Exchange Act of 1934
For the
transition period from ______________ to ______________.
Commission
file number: 000-50275
BCB
BANCORP, INC.
(Exact
name of registrant as specified in its charter)
|
New Jersey
|
26-0065262
|
|
|
(State
or other jurisdiction of incorporation or organization)
|
(I.R.S.
Employer Identification No.)
|
|
|
104-110 Avenue C, Bayonne, New
Jersey
|
07002
|
|
|
(Address
of principal executive offices)
|
(Zip
Code)
|
Registrant's
telephone number, including area code: (201)
823-0700
Securities
registered pursuant to Section 12(b) of the Act:
|
Title of each class
|
Name of each exchange on which
registered
|
|
|
Common
Stock, $0.01 par value
|
The
NASDAQ Stock Market, LLC
|
Securities
registered pursuant to Section 12(g) of the Act: None
Indicate
by check mark if the registrant is a well-known seasoned issuer, as defined in
Rule 405 of the Securities Act.
YES o
NO T
Indicate
by check mark if the registrant is not required to file reports pursuant to
Section 13 or Section 15(d) of the Act.
YES o NO T
Indicate
by check mark whether the Registrant (1) has filed all reports required to be
filed by Section 13 or 15(d) of the Securities Exchange Act of 1934 during the
preceding 12 months (or for such shorter period that the registrant was required
to file such reports), and (2) has been subject to such filing requirements for
the past 90 days.
YES T NO
o
Indicate by check mark if disclosure of
delinquent filers pursuant to Item 405 of Regulation S-K (§229.405 of this
chapter) is not contained herein, and will not be contained, to the best of
registrant’s knowledge, in definitive proxy or information statements
incorporated by reference in Part III of this Form 10-K or any amendment to this
Form 10-K.T
Indicate
by check mark whether the Registrant has submitted electronically and posted on
its corporate website, if any, every Interactive Data File required to be
submitted and posted pursuant to Rule 405 of Regulation S-T during the preceding
12 months (or such shorter period that the Registrant was required to submit and
post such files). YES o NO
o
Indicate
by check mark whether the registrant is a large accelerated filer, an
accelerated filer, a non-accelerated filer, or a smaller reporting
company. See definitions of “large accelerated filer,” “accelerated
filer” and “smaller reporting company” in Rule 12b-2 of the Exchange Act. (Check
one):
|
Large accelerated filer
o
|
Accelerated
filer o
|
Non-accelerated
filer o
|
Smaller reporting
company T
|
|
|
(Do
not check if a smaller reporting company)
|
Indicate by check mark whether the
registrant is a shell company (as defined in Rule 12b-2 of the
Act). YES o NO
T
The
aggregate market value of the voting and non-voting common equity held by
non-affiliates of the Registrant, computed by reference to the last sale price
on June 30, 2009, as reported by the Nasdaq Capital Market, was approximately
$32.2 million.
As of
March 1, 2010, there were issued 5,201,502 shares of the Registrant’s Common
Stock.
DOCUMENTS
INCORPORATED BY REFERENCE:
(1) Proxy
Statement for the 2010 Annual Meeting of Stockholders of the Registrant (Part
III).
(2)
Annual Report to Stockholder (Part II and IV).
2
TABLE OF CONTENTS
|
Item
|
Page
Number
|
|||
|
ITEM 1.
|
1
|
|||
|
ITEM 1A.
|
29
|
|||
|
ITEM 1B.
|
33
|
|||
|
ITEM 2.
|
33
|
|||
|
ITEM 3.
|
33
|
|||
|
ITEM 4.
|
33
|
|||
|
ITEM 5.
|
34
|
|||
|
ITEM 6.
|
36
|
|||
|
ITEM 7.
|
37
|
|||
|
ITEM 7A.
|
54
|
|||
|
ITEM 8.
|
55
|
|||
|
ITEM 9.
|
56
|
|||
|
ITEM 9A.(T.)
|
56
|
|||
|
ITEM 9B.
|
57
|
|||
|
ITEM 10.
|
57
|
|||
|
ITEM 11.
|
58
|
|||
|
ITEM 12.
|
58
|
|||
|
ITEM 13.
|
58
|
|||
|
ITEM 14.
|
58
|
|||
|
ITEM 15.
|
58
|
This report on Form 10-K contains
forward-looking statements that are based on assumptions and may describe future
plans, strategies and expectations of BCB Bancorp, Inc. and subsidiaries. This
document may include forward-looking statements within the meaning of Section
27A of the Securities Act of 1933 and Section 21E of the Securities Exchange Act
of 1934. These forward-looking statements, which are based on certain
assumptions and describe future plans, strategies, and expectations of the
Company, are generally identified by use of the words “anticipate,” “believe,”
“estimate,” “expect,” “intend,” “plan,” “project,” “seek,” “strive,” “try,” or
future or conditional verbs such as “will,” “would,” “should,” “could,” “may,”
or similar expressions. Although we believe that our plans, intentions and
expectations, as reflected in these forward-looking statements are reasonable,
we can give no assurance that these plans, intentions or expectations will be
achieved or realized. By identifying these statements for you in this
manner, we are alerting you to the possibility that our actual results and
financial condition may differ, possibly materially, from the anticipated
results and financial condition indicated in these forward-looking statements.
Important factors that could cause our actual results and financial condition to
differ from those indicated in the forward-looking statements include, among
others, those discussed below and under “Risk Factors” in Part I,
Item 1A of this Annual Report on Form 10-K. You should not place undue
reliance on these forward-looking statements, which reflect our expectations
only as of the date of this report. We do not assume any obligation to revise
forward-looking statements except as may be required by law.
PART I
|
ITEM
1.
|
BUSINESS
|
BCB Bancorp,
Inc.
BCB
Bancorp, Inc. (the “Company”) is a New Jersey corporation, which on May 1, 2003
became the holding company parent of BCB Community Bank (the “Bank”). The
Company has not engaged in any significant business activity other than owning
all of the outstanding common stock of BCB Community Bank. Our executive office
is located at 104-110 Avenue C, Bayonne, New Jersey 07002. Our telephone number
is (201) 823-0700. At December 31, 2009 we had $631.5 million in
consolidated assets, $463.7 million in deposits and $51.4 million in
consolidated stockholders’ equity. The Company is subject to extensive
regulation by the Board of Governors of the Federal Reserve System.
BCB Community
Bank
BCB
Community Bank, formerly known as Bayonne Community Bank, was chartered as a New
Jersey bank on October 27, 2000, and we opened for business on November 1,
2000. We changed our name from Bayonne Community Bank to BCB
Community Bank in April of 2007. We operate through three branches in Bayonne
and Hoboken, New Jersey and through our executive office located at 104-110
Avenue C, Bayonne, New Jersey 07002. Our deposit accounts are insured by the
Federal Deposit Insurance Corporation (FDIC) and we are a member of the Federal
Home Loan Bank System.
We are a
community-oriented financial institution. Our business is to offer FDIC-insured
deposit products and to invest funds held in deposit accounts at the Bank,
together with funds generated from operations, in investment securities and
loans. We offer our customers:
|
|
·
|
loans,
including commercial and multi-family real estate loans, one- to
four-family mortgage loans, home equity loans, construction loans,
consumer loans and commercial business loans. In recent years
the primary growth in our loan portfolio has been in loans secured by
commercial real estate and multi-family
properties;
|
|
|
·
|
FDIC-insured
deposit products, including savings and club accounts, non-interest
bearing accounts, money market accounts, certificates of deposit and
individual retirement accounts; and
|
|
|
·
|
retail
and commercial banking services including wire transfers, money orders,
traveler’s checks, safe deposit boxes, a night depository, federal payroll
tax deposits, bond coupon redemption and automated teller
services.
|
Recent
Developments
On June
29, 2009, BCB Bancorp, Inc., (the “Company”), the parent company of BCB
Community Bank, and Pamrapo Bancorp, Inc., (“Pamrapo”), the parent company of
Pamrapo Savings Bank, S.L.A., jointly announced the signing of an Agreement and
Plan of Merger, dated as of June 29, 2009 (the “Merger Agreement”) pursuant to
which Pamrapo will merge with and into the Company. Pamrapo Savings Bank,
S.L.A., (“Pamrapo Bank”), a New Jersey-chartered stock savings and loan
association and a wholly-owned subsidiary of Pamrapo, and BCB
Community
Bank, a New Jersey-chartered bank and a wholly-owned subsidiary of the Company
(“BCB Bank”), will also enter into a subsidiary agreement and plan of merger
that provides for the merger of Pamrapo Bank with and into BCB Bank, with BCB
Bank as the surviving institution.
Pursuant
to the terms of the Merger Agreement, shareholders of Pamrapo will receive 1.0
share of Company common stock for each share of Pamrapo common stock. In
addition, all outstanding unexercised options to purchase Pamrapo common stock
will be converted into options to purchase Company common stock.
On
December 17, 2009, at a special meeting of stockholders, the stockholders of BCB
Bancorp, Inc., (the “Company”) approved the adoption of the Agreement and Plan
of Merger, as amended, by and between the Company and Pamrapo Bancorp Inc. In
addition, at the special meeting of stockholders, the Company approved an
amendment to the Company’s certificate of incorporation to increase the
authorized shares of the Company’s common stock to 20 million
shares.
On
February 11, 2010, at a special meeting of stockholders, the stockholders of
Pamrapo Bancorp, Inc., approved the adoption of the Agreement and Plan of
Merger, as amended, by and between Pamrapo Bancorp Inc., and BCB Bancorp,
Inc.
The
transaction is expected to close by the end of the second quarter of 2010,
pending regulatory approvals and the satisfaction of other customary closing
conditions.
Business
Strategy
Our
business strategy is to operate as a well-capitalized, profitable and
independent community-oriented financial institution dedicated to providing
quality customer service. Managements’ and the Board of Directors’
extensive knowledge of the Hudson County market differentiates us from our
competitors. Our business strategy incorporates the following elements:
maintaining a community focus, focusing on profitability, continuing our growth,
concentrating on real estate based lending, capitalizing on market dynamics,
providing attentive and personalized service and attracting highly qualified and
experienced personnel.
Maintaining a community
focus. Our management and Board of Directors have strong ties
to the Bayonne community. Many members of the management team are
Bayonne natives and are active in the community through non-profit board
membership, local business development organizations, and industry
associations. In addition, our board members are well established
professionals and business people in the Bayonne area. Management and
the Board are interested in making a lasting contribution to the Bayonne
community and have succeeded in attracting deposits and loans through attentive
and personalized service.
Focusing on
profitability. On an operational basis, we achieved
profitability in our tenth month of operation. For the year ended December 31,
2009, our return on average equity was 7.34% and our return on average assets
was 0.61%. Our earnings per diluted share decreased from $1.20 for the year
ended December 31, 2005 to $0.80 for the year ended December 31, 2009. Although
earnings per share results have come under pressure recently, primarily as a
result of the pervasive economic downturn in both the national and local economy
as well as
several
one-time events, management is committed to maintaining profitability by
diversifying the products, pricing and services we offer.
Continuing our
growth. We have consistently increased our
assets. From December 31, 2005 to December 31, 2009, our assets have
increased from $466.2 million to $631.5 million. Over the same time
period, our loan balances have increased from $284.5 million to $401.9 million,
while deposits have increased from $362.9 million to $463.7 million. In
addition, we have maintained our asset quality ratios while growing the loan
portfolio. At December 31, 2009, our non-performing assets to total assets ratio
was 2.09%.
Concentrating on real estate-based
lending. A primary focus of our business strategy is to
originate loans secured by commercial and multi-family
properties. Such loans provide higher returns than loans secured by
one- to four-family real estate. As a result of our underwriting
practices, including debt service requirements for commercial real estate and
multi-family loans, management believes that such loans offer us an opportunity
to obtain higher returns.
Capitalizing on market
dynamics. The consolidation of the banking industry in Hudson County has
created the need for a customer focused banking institution. This
consolidation has moved decision making away from local, community-based banks
to much larger banks headquartered outside of New Jersey.
Providing attentive and personalized
service. Management believes that providing attentive and
personalized service is the key to gaining deposit and loan relationships in
Bayonne and its surrounding communities. Since we began operations,
our branches have been open seven (7) days a week.
Attracting highly experienced and
qualified personnel. An important part of our strategy
is to hire bankers who have prior experience in the Hudson County market as well
as pre-existing business relationships. Our management team has an
average of 30 years of banking experience, while our lenders and branch
personnel have significant prior experience at community banks and regional
banks in Hudson County. Management believes that its knowledge of the
Hudson County market has been a critical element in the success of BCB Community
Bank. Management’s extensive knowledge of the local communities has
allowed us to develop and implement a highly focused and disciplined approach to
lending and has enabled the Bank to attract a high percentage of low cost
deposits.
Our Market
Area
We are
located in the City of Bayonne and Hoboken, Hudson County, New
Jersey. The Bank’s locations are easily accessible to provide
convenient services to businesses and individuals throughout our market
area.
Our
market area includes the City of Bayonne, Jersey City and portions of Hoboken,
New Jersey. These areas are all considered “bedroom” or “commuter” communities
to Manhattan. Our market area is well-served by a network of arterial
roadways including Route 440 and the New Jersey Turnpike.
Our
market area has a high level of commercial business
activity. Businesses are concentrated in the service sector and
retail trade areas. Major employers in our market area include
Bayonne Medical Center and the Bayonne Board of Education.
Competition
The
banking business in New Jersey is extremely competitive. We compete for deposits
and loans with existing New Jersey and out-of-state financial institutions that
have longer operating histories, larger capital reserves and more established
customer bases. Our competition includes large financial service companies and
other entities in addition to traditional banking institutions such as savings
and loan associations, savings banks, commercial banks and credit
unions.
Our
larger competitors have a greater ability to finance wide-ranging advertising
campaigns through their greater capital resources. Our marketing efforts depend
heavily upon referrals from officers, directors, stockholders, selective
advertising in local media and direct mail solicitations. We compete for
business principally on the basis of personal service to customers, customer
access to our officers and directors and competitive interest rates and
fees.
In the
financial services industry in recent years, intense market demands,
technological and regulatory changes and economic pressures have eroded industry
classifications that were once clearly defined. Banks have diversified their
services, increased rates paid on deposits and become more cost effective as a
result of competition with one another and with new types of financial service
companies, including non-banking competitors. Some of the results of these
market dynamics in the financial services industry have been a number of new
bank and non-bank competitors, increased merger activity, and increased customer
awareness of product and service differences among competitors.
Lending
Activities
Analysis of Loan Portfolio.
Set forth below is selected data relating to the composition of our loan
portfolio by type of loan as a percentage of the respective
portfolio.
|
At December 31,
|
||||||||||||||||||||||||||||||||||||||||
|
2009
|
2008
|
2007
|
2006
|
2005
|
||||||||||||||||||||||||||||||||||||
|
Amount
|
Percent
|
Amount
|
Percent
|
Amount
|
Percent
|
Amount
|
Percent
|
Amount
|
Percent
|
|||||||||||||||||||||||||||||||
|
Type
of loans:
|
(Dollars
in Thousands)
|
|||||||||||||||||||||||||||||||||||||||
|
Real
estate loans:
|
||||||||||||||||||||||||||||||||||||||||
|
One-
to four-family
|
$ | 76,490 | 18.70 | % | $ | 74,039 | 17.94 | % | $ | 55,248 | 14.96 | % | $ | 43,993 | 13.64 | % | $ | 34,901 | 12.11 | % | ||||||||||||||||||||
|
Construction
|
51,330 | 12.55 | 62,483 | 15.14 | 49,984 | 13.53 | 38,882 | 12.06 | 28,743 | 9.98 | ||||||||||||||||||||||||||||||
|
Home
equity
|
34,298 | 8.39 | 38,065 | 9.22 | 35,397 | 9.58 | 32,321 | 10.02 | 24,297 | 8.43 | ||||||||||||||||||||||||||||||
|
Commercial
and multi-family
|
223,792 | 54.71 | 223,179 | 54.07 | 208,108 | 56.35 | 192,141 | 59.60 | 185,170 | 64.26 | ||||||||||||||||||||||||||||||
|
Commercial
business
|
22,487 | 5.50 | 14,098 | 3.42 | 19,873 | 5.38 | 14,705 | 4.56 | 14,578 | 5.06 | ||||||||||||||||||||||||||||||
|
Consumer
|
641 | 0.15 | 920 | 0.21 | 739 | 0.20 | 396 | 0.12 | 456 | 0.16 | ||||||||||||||||||||||||||||||
|
Total
|
409,038 | 100.00 | % | 412,784 | 100.00 | % | 369,349 | 100.00 | % | 322,438 | 100.00 | % | 288,145 | 100.00 | % | |||||||||||||||||||||||||
|
Less:
|
||||||||||||||||||||||||||||||||||||||||
|
Deferred
loan fees, net
|
522 | 654 | 630 | 575 | 604 | |||||||||||||||||||||||||||||||||||
|
Allowance
for loan losses
|
6,644 | 5,304 | 4,065 | 3,733 | 3,090 | |||||||||||||||||||||||||||||||||||
|
Total
loans, net
|
$ | 401,872 | $ | 406,826 | $ | 364,654 | $ | 318,130 | $ | 284,451 | ||||||||||||||||||||||||||||||
Loan
Maturities. The following table sets forth the contractual
maturity of our loan portfolio at December 31, 2009. The amount shown
represents outstanding principal balances. Demand loans, loans having
no stated schedule of repayments and no stated maturity and overdrafts are
reported as being due in one year or less. Variable-rate loans are
shown as due at the time of repricing. The table does not include
prepayments or scheduled principal repayments.
|
Due
within
1 Year
|
Due
after 1
through
5 Years
|
Due
after
5 Years
|
Total
|
|||||||||||||
|
(In
Thousands)
|
||||||||||||||||
|
One-
to four-family
|
$ | 2,632 | $ | 10,369 | $ | 63,489 | $ | 76,490 | ||||||||
|
Construction
|
45,452 | 2,105 | 3,773 | 51,330 | ||||||||||||
|
Home
equity
|
506 | 4,286 | 29,506 | 34,298 | ||||||||||||
|
Commercial
and multi-family
|
20,126 | 44,375 | 159,291 | 223,792 | ||||||||||||
|
Commercial
business
|
13,892 | 6,279 | 2,316 | 22,487 | ||||||||||||
|
Consumer
|
310 | 331 | — | 641 | ||||||||||||
|
Total
amount due
|
$ | 82,918 | $ | 67,745 | $ | 258,375 | $ | 409,038 | ||||||||
Loans with Predetermined or Floating
or Adjustable Rates of Interest. The following table sets
forth the dollar amount of all loans at December 31, 2009 that are due after
December 31, 2010, and have predetermined interest rates and that have
floating or adjustable interest rates.
|
Fixed Rates
|
Floating
or Adjustable Rates
|
Total
|
||||||||||
|
(In
Thousands)
|
||||||||||||
|
One-
to four-family
|
$ | 41,394 | $ | 32,464 | $ | 73,858 | ||||||
|
Construction
|
2,598 | 3,280 | 5,878 | |||||||||
|
Home
equity
|
26,944 | 6,848 | 33,792 | |||||||||
|
Commercial
and multi-family
|
40,113 | 163,553 | 203,666 | |||||||||
|
Commercial
business
|
5,198 | 3,397 | 8,595 | |||||||||
|
Consumer
|
331 | — | 331 | |||||||||
|
Total
amount due
|
$ | 116,578 | $ | 209,542 | $ | 326,120 | ||||||
The Bank
has strengthened certain loan underwriting criteria in an effort to more
prudently make loan facility determinations and mitigate increased potential
loan loss provisions prospectively.
Commercial and Multi-family Real
Estate Loans. Our commercial and multi-family real estate loans are
secured by commercial real estate (for example, shopping centers, medical
buildings, retail offices) and multi-family residential units, consisting of
five or more units. Permanent loans on commercial and multi-family properties
are generally originated in amounts up to 75% of the appraised value of the
property. Our commercial real estate loans are secured by improved property such
as office buildings, retail stores, warehouses, church buildings and other
non-residential buildings. Commercial and multi-family real estate loans are
generally made at rates that adjust above the five year U.S. Treasury interest
rate, with terms of up to 25 years, or are balloon loans with fixed interest
rates which generally mature in three to five years with principal amortization
for a period of up to 30 years. Our largest commercial loan had a principal
balance of $2.9 million at December 31, 2009, was secured by a mixed use
property comprised of residential and commercial facilities, and was performing
in accordance with its terms on that date. Our largest multi-family loan had a
principal balance of $4.4 million at December 31, 2009. This loan is
presently under the terms of a work-out plan paying interest only at a reduced
rate, and has performed according to its adjusted terms since institution of
the
work-out
plan. This plan is temporary in nature and any interest not received presently
as a result of the work-out terms will be capitalized at the conclusion of such
plan.
Loans
secured by commercial and multi-family real estate are generally larger and
involve a greater degree of risk than one- to four-family residential mortgage
loans. The borrower’s creditworthiness and the feasibility and cash
flow potential of the project is of primary concern in commercial and
multi-family real estate lending. Loans secured by income properties are
generally larger and involve greater risks than residential mortgage loans
because payments on loans secured by income properties are often dependent on
the successful operation or management of the properties. As a
result, repayment of such loans may be subject to a greater extent than
residential real estate loans to adverse conditions in the real estate market or
the economy. We intend to continue emphasizing the origination of
loans secured by commercial real estate and multi-family
properties.
One- to Four-Family Lending.
Our one- to four-family residential mortgage loans are secured by property
located in the State of New Jersey. We generally originate one- to four-family
residential mortgage loans in amounts up to 80% of the lesser of the appraised
value or selling price of the mortgaged property without requiring mortgage
insurance. We will originate loans with loan to value ratios up to
90% provided the borrowers obtain private mortgage insurance. We
originate both fixed rate and adjustable rate loans. One- to
four-family loans may have terms of up to 30 years. The majority of
one- to four-family loans we originate for retention in our portfolio have terms
no greater than 15 years. We offer adjustable rate loans with fixed
rate periods of up to five years, with principal and interest calculated using a
maximum 30-year amortization period. We offer these loans with a fixed rate for
the first five years with repricing following every year after the initial
period. Adjustable rate loans may adjust up to 200 basis points annually and 600
basis points over the term of the loan. We also broker for a third
party lender one- to four-family residential loans, which are primarily fixed
rate loans with terms of 30 years. Our loan brokerage activities
permit us to offer customers longer-term fixed rate loans we would not otherwise
originate while providing a source of fee income. During 2009, we
brokered $16.9 million in one- to four-family loans and recognized gains of
$225,000 from the sale of such loans.
All of
our one- to four-family mortgages include “due on sale” clauses, which are
provisions giving us the right to declare a loan immediately payable if the
borrower sells or otherwise transfers an interest in the property to a third
party.
Property
appraisals on real estate securing our single-family residential loans are made
by state certified and licensed independent appraisers approved by our Board of
Directors. Appraisals are performed in accordance with applicable regulations
and policies. At our discretion, we obtain either title insurance
policies or attorneys’ certificates of title on all first mortgage real estate
loans originated. We also require fire and casualty insurance on all
properties securing our one- to four-family loans. We also require
the borrower to obtain flood insurance where appropriate. In some
instances, we charge a fee equal to a percentage of the loan amount commonly
referred to as points.
Construction Loans. We offer
loans to finance the construction of various types of commercial and residential
property. We originated $16.0 million of such loans during the
year
ended
December 31, 2009. Construction loans to builders generally are
offered with terms of up to eighteen months and interest rates are tied to the
prime rate plus a margin. These loans generally are offered as
adjustable rate loans. We will originate residential construction
loans for individual borrowers and builders, provided all necessary plans and
permits are in order. Construction loan funds are disbursed as the
project progresses. At December 31, 2009, our largest construction loan was
$5.0 million, of which $2.1 million was disbursed. This construction loan
has been made for the construction of twelve residential condominiums. At
December 31, 2009, this loan was performing in accordance with its
terms.
Construction
financing is generally considered to involve a higher degree of risk of loss
than long-term financing on improved, occupied real estate. Risk of
loss on a construction loan is dependent largely upon the accuracy of the
initial estimate of the property’s value at completion of construction and
development and the estimated cost (including interest) of
construction. During the construction phase, a number of factors
could result in delays and cost overruns. If the estimate of
construction costs proves to be inaccurate, we may be required to advance funds
beyond the amount originally committed to permit completion of the
project. Additionally, if the estimate of value proves to be
inaccurate, we may be confronted, at or prior to the maturity of the loan, with
a project having a value which is insufficient to assure full
repayment.
Home Equity Loans and Home Equity Lines of
Credit. We offer home equity loans and lines of credit that
are secured by the borrower’s primary residence. Our home equity
loans can be structured as loans that are disbursed in full at closing or as
lines of credit. Home equity loans and lines of credit are offered
with terms up to 15 years. Virtually all of our home equity loans are
originated with fixed rates of interest and home equity lines of credit are
originated with adjustable interest rates tied to the prime
rate. Home equity loans and lines of credit are underwritten under
the same criteria that we use to underwrite one- to four-family
loans. Home equity loans and lines of credit may be underwritten with
a loan-to-value ratio of 80% when combined with the principal balance of the
existing mortgage loan. At the time we close a home equity loan or
line of credit, we file a mortgage to perfect our security interest in the
underlying collateral. At December 31, 2009, the outstanding balances
of home equity loans and lines of credit totaled $34.3 million, or 8.39% of our
loan portfolio.
Commercial Business
Loans. Our commercial business loans are underwritten on the
basis of the borrower’s ability to service such debt from income. Our
underwriting standards for commercial business loans include a review of the
applicant’s tax returns, financial statements, credit history and an assessment
of the applicant’s ability to meet existing obligations and payments on the
proposed loan based on cash flow generated by the applicant’s
business. Commercial business loans are generally made to small and
mid-sized companies located within the State of New Jersey. In most cases, we
require collateral of real estate, equipment, accounts receivable, inventory,
chattel or other assets before making a commercial business loan. Our
largest commercial business loan at December 31, 2009 had a principal balance of
$2.7 million and was secured by marketable equity securities. We have also
received personal guarantees from the borrower, principals of the borrower and a
director of BCB Bancorp, Inc.
Commercial
business loans generally have higher rates and shorter terms than one- to
four-family residential loans, but they may also involve higher average balances
and a higher
risk of
default since their repayment generally depends on the successful operation of
the borrower’s business.
Consumer Loans. We
make various types of secured and unsecured consumer loans and loans that are
collateralized by new and used automobiles. Consumer loans generally have terms
of three years to ten years.
Consumer
loans are advantageous to us because of their interest rate sensitivity, but
they also involve more credit risk than residential mortgage loans because of
the higher potential for default, the nature of the collateral and the
difficulty in disposing of the collateral.
The
following table shows our loan origination, purchase, sale and repayment
activities for the periods indicated.
|
Years
Ended December 31,
|
||||||||||||||||||||
|
2009
|
2008
|
2007
|
2006
|
2005
|
||||||||||||||||
|
(In
Thousands)
|
||||||||||||||||||||
|
Beginning
of period
|
$ | 412,784 | $ | 369,349 | $ | 322,438 | $ | 288,145 | $ | 249,315 | ||||||||||
|
Originations by Type:
|
||||||||||||||||||||
|
Real
estate mortgage:
|
||||||||||||||||||||
|
One-
to four-family residential
|
19,509 | 9,683 | 6,454 | 9,203 | 4,299 | |||||||||||||||
|
Construction
|
16,060 | 15,591 | 48,415 | 34,889 | 35,765 | |||||||||||||||
|
Home
equity
|
3,015 | 9,699 | 14,512 | 15,821 | 13,998 | |||||||||||||||
|
Commercial
and multi-family
|
33,809 | 63,601 | 55,892 | 51,542 | 70,471 | |||||||||||||||
|
Commercial
business
|
17,843 | 11,624 | 16,987 | 7,946 | 8,968 | |||||||||||||||
|
Consumer
|
132 | 492 | 215 | 222 | 203 | |||||||||||||||
|
Total
loans originated
|
90,368 | 110,690 | 142,475 | 119,623 | 133,704 | |||||||||||||||
|
Purchases:
|
||||||||||||||||||||
|
Real
estate mortgage:
|
||||||||||||||||||||
|
One-
to four-family residential
|
— | — | — | — | — | |||||||||||||||
|
Construction
|
1,744 | 113 | 3,726 | 4,870 | 3,645 | |||||||||||||||
|
Home
equity
|
— | — | — | — | — | |||||||||||||||
|
Commercial
and multi-family
|
— | — | 5,267 | 1,737 | — | |||||||||||||||
|
Commercial
business
|
— | — | 600 | 400 | 1,000 | |||||||||||||||
|
Consumer
|
— | — | — | — | — | |||||||||||||||
|
Total
loans purchased
|
1,744 | 113 | 9,593 | 7,007 | 4,645 | |||||||||||||||
|
Sales:
|
||||||||||||||||||||
|
Real
estate mortgage:
|
||||||||||||||||||||
|
One-
to four-family residential
|
— | — | — | — | — | |||||||||||||||
|
Construction
|
1,238 | 2,523 | 5,040 | 2,044 | 1,273 | |||||||||||||||
|
Home
equity
|
— | — | — | — | — | |||||||||||||||
|
Commercial
and multi-family
|
— | — | 1,275 | 3,388 | — | |||||||||||||||
|
Commercial
business
|
— | — | — | — | — | |||||||||||||||
|
Consumer
|
— | — | — | — | — | |||||||||||||||
|
Total
loans sold
|
1,238 | 2,523 | 6,315 | 5,432 | 1,273 | |||||||||||||||
|
Principal
repayments
|
94,549 | 63,651 | 97,396 | 86,905 | 98,246 | |||||||||||||||
|
Transfer
of loans to real estate owned
|
71 | 1,194 | 1,446 | — | — | |||||||||||||||
|
Total
reductions
|
94,620 | 64,845 | 98,842 | 92,337 | 99,519 | |||||||||||||||
|
Net
(decrease) increase
|
(3,746 | ) | 43,435 | 46,911 | 34,293 | 38,830 | ||||||||||||||
|
Ending
balance
|
$ | 409,038 | $ | 412,784 | $ | 369,349 | $ | 322,438 | $ | 288,145 | ||||||||||
Loan Approval Authority and
Underwriting. We establish various lending limits for executive
management and also maintain a loan committee. The loan committee is comprised
of the Chairman of the Board, the President, the Senior Lending Officer and five
non-employee
members
of the Board of Directors. The President or the Senior Lending
Officer, together with one other loan officer, have authority to approve
applications for real estate loans up to $500,000, other secured loans up to
$500,000 and unsecured loans up to $25,000. The loan committee considers all
applications in excess of the above lending limits and the entire board of
directors ratifies all such loans.
Upon
receipt of a completed loan application from a prospective borrower, a credit
report is ordered. Income and certain other information is verified. If
necessary, additional financial information may be requested. An appraisal is
required for the underwriting of all one- to four-family loans. We
may rely on an estimate of value of real estate performed by our Senior Lending
Officer for home equity loans or lines of credit of up to
$250,000. Appraisals are processed by state certified independent
appraisers approved by the Board of Directors.
An
attorney’s certificate of title is required on all newly originated real estate
mortgage loans. In connection with refinancing and home equity loans
or lines of credit in amounts up to $250,000, we will obtain a record owner’s
search in lieu of an attorney’s certificate of title. Borrowers also
must obtain fire and casualty insurance. Flood insurance is also required on
loans secured by property that is located in a flood zone.
Loan Commitments. Written
commitments are given to prospective borrowers on all approved real estate
loans. Generally, we honor commitments for up to 60 days from the date of
issuance. At December 31, 2009, our outstanding loan origination commitments
totaled $7.2 million, standby letters of credit totaled $471,000,
outstanding construction loans in progress totaled $5.4 million and undisbursed
lines of credit totaled $11.9 million.
Loan
Delinquencies. We send a notice of nonpayment to borrowers
when their loan becomes 15 days past due. If such payment is not
received by month end, an additional notice of nonpayment is sent to the
borrower. After 60 days, if payment is still delinquent, a notice of
right to cure default is sent to the borrower giving 30 additional days to bring
the loan current before foreclosure is commenced. If the loan continues in a
delinquent status for 90 days past due and no repayment plan is in effect,
foreclosure proceedings will be initiated. In an effort to more closely monitor
the performance of our loan portfolio and asset quality, the Bank has created
various concentration of credit reports, specifically as it relates to our
construction and commercial real estate portfolios. These reports stress test
declining values in the aforementioned portfolios up to and including a 25%
value deprecation to the original appraised value to ascertain our potential
exposure.
Loans are
reviewed and are placed on a non-accrual status when the loan becomes more than
90 days delinquent or when, in our opinion, the collection of additional
interest is doubtful. Interest accrued and unpaid at the time a loan is placed
on nonaccrual status is charged against interest income and the accrual of
interest income is discontinued. Income is subsequently recognized only to the
extent that cash payments are received until delinquency status is reduced to
less than ninety days, in which case the loan is returned to accrual
status. At December 31, 2009, we had $11.9 million in non-accruing
loans. Our largest exposure of non-performing loans at that date consisted of
two loans, with one specific borrower with a combined principal balance of $3.0
million, collateralized by two multi-unit apartment complexes whose total
appraised value was approximately $6.9 million as of that date. Another loan
relationship consisting of two
loans
with one specific borrower and a balance of $2.3 million is also in non-accrual
status. This borrower is in foreclosure and while there has been a certain level
of depreciation of the underlying collateral, the Bank believes that upon
conveyance and disposition of the properties, the Bank will not incur a loss on
these facilities.
A loan is
considered impaired when it is probable the borrower will not repay the loan
according to the original contractual terms of the loan agreement. We have
determined that first mortgage loans on one- to four-family properties and all
consumer loans represent large groups of smaller-balance homogeneous loans that
are collectively evaluated. Additionally, we have determined that an
insignificant delay (less than 90 days) will not cause a loan to be classified
as impaired and a loan is not impaired during a period of delay in payment, if
we expect to collect all amounts due including interest accrued at the
contractual interest rate for the period of delay. We independently
evaluate all loans identified as impaired. We estimate credit losses on impaired
loans based on the present value of expected cash flows or the fair value of the
underlying collateral if the loan repayment will be derived from the sale or
operation of such collateral. Impaired loans, or portions of such loans, are
charged off when we determine that a realized loss has occurred. Until such
time, an allowance for loan losses is maintained for estimated losses. Cash
receipts on impaired loans are applied first to accrued interest receivable
unless otherwise required by the loan terms, except when an impaired loan is
also a nonaccrual loan, in which case the portion of the receipts related to
interest is recognized as income. At December 31, 2009, we had twenty-six loans
totaling $15.4 million which are classified as impaired and on which loan loss
allowances totaling $1.4 million have been established. During 2009,
interest income of $464,000 was recognized on impaired loans during the time of
impairment.
The
following table sets forth delinquencies in our loan portfolio as of the dates
indicated:
|
At
December 31, 2009
|
At
December 31, 2008
|
|||||||||||||||||||||||||||||||
|
60-89
Days
|
90
Days or More
|
60-89
Days
|
90
Days or More
|
|||||||||||||||||||||||||||||
|
Number
of
Loans
|
Principal
Balance
of
Loans
|
Number
of
Loans
|
Principal
Balance
of
Loans
|
Number
of
Loans
|
Principal
Balance
of
Loans
|
Number
of
Loans
|
Principal
Balance
of
Loans
|
|||||||||||||||||||||||||
|
(Dollars
in Thousands)
|
||||||||||||||||||||||||||||||||
|
Real estate mortgage:
|
||||||||||||||||||||||||||||||||
|
One-
to four-family
residential
|
3 | $ | 3,973 | 5 | $ | 1,559 | 3 | $ | 1,507 | 4 | $ | 1,213 | ||||||||||||||||||||
|
Construction
|
— | — | 7 | 4,343 | 1 | 360 | — | — | ||||||||||||||||||||||||
|
Home
equity
|
2 | 517 | 2 | 251 | — | — | — | — | ||||||||||||||||||||||||
|
Commercial
and multi-family
|
5 | 2,729 | 8 | 5,280 | 2 | 265 | 5 | 2,515 | ||||||||||||||||||||||||
|
Total
|
10 | 7,219 | 22 | 11,433 | 6 | 2,132 | 9 | 3,728 | ||||||||||||||||||||||||
|
Commercial
business
|
1 | 369 | 1 | 500 | — | — | — | — | ||||||||||||||||||||||||
|
Consumer
|
— | — | — | — | — | — | — | — | ||||||||||||||||||||||||
|
Total
delinquent loans
|
11 | $ | 7,588 | 23 | $ | 11,933 | 6 | $ | 2,132 | 9 | $ | 3,728 | ||||||||||||||||||||
|
Delinquent
loans to total loans
|
1.86 | % | 2.92 | % | 0.51 | % | 0.90 | % | ||||||||||||||||||||||||
|
At
December 31, 2007
|
At
December 31, 2006
|
|||||||||||||||||||||||||||||||
|
60-89
Days
|
90
Days or More
|
60-89
Days
|
90
Days or More
|
|||||||||||||||||||||||||||||
|
Number
of
Loans
|
Principal
Balance
of
Loans
|
Number
of
Loans
|
Principal
Balance
of
Loans
|
Number
of
Loans
|
Principal
Balance
of
Loans
|
Number
of
Loans
|
Principal
Balance
of
Loans
|
|||||||||||||||||||||||||
|
(Dollars
in Thousands)
|
||||||||||||||||||||||||||||||||
|
Real estate mortgage:
|
||||||||||||||||||||||||||||||||
|
One-
to four-family
residential
|
— | $ | — | 1 | $ | 319 | — | $ | — | — | $ | — | ||||||||||||||||||||
|
Construction
|
— | — | 1 | 1,247 | 1 | 1,356 | — | — | ||||||||||||||||||||||||
|
Home
equity
|
— | — | 1 | 149 | — | — | — | — | ||||||||||||||||||||||||
|
Commercial
and multi-family
|
2 | 1,770 | 5 | 2,558 | — | — | 1 | 307 | ||||||||||||||||||||||||
|
Total
|
2 | 1,770 | 8 | 4,273 | 1 | 1,356 | 1 | 307 | ||||||||||||||||||||||||
|
Commercial
business
|
— | — | — | — | — | — | — | — | ||||||||||||||||||||||||
|
Consumer
|
— | — | — | — | 1 | 2 | 1 | 16 | ||||||||||||||||||||||||
|
Total
delinquent loans
|
2 | $ | 1,770 | 8 | $ | 4,273 | 2 | $ | 1,358 | 2 | $ | 323 | ||||||||||||||||||||
|
Delinquent
loans to total loans
|
0.48 | % | 1.16 | % | 0.42 | % | 0.10 | % | ||||||||||||||||||||||||
|
At
December 31, 2005
|
||||||||||||||||
|
60-89
Days
|
90
Days or More
|
|||||||||||||||
|
Number
of
Loans
|
Principal
Balance
of
Loans
|
Number
of
Loans
|
Principal
Balance
of
Loans
|
|||||||||||||
|
(Dollars
in Thousands)
|
||||||||||||||||
|
Real estate mortgage:
|
||||||||||||||||
|
One-
to four-family residential
|
— | $ | — | 1 | $ | 79 | ||||||||||
|
Construction
|
— | — | — | — | ||||||||||||
|
Home
equity
|
— | — | — | — | ||||||||||||
|
Commercial
and multi-family
|
— | — | 4 | 803 | ||||||||||||
|
Total
|
— | — | 5 | 882 | ||||||||||||
|
Commercial
business
|
— | — | 1 | 150 | ||||||||||||
|
Consumer
|
— | — | — | — | ||||||||||||
|
Total
delinquent loans
|
— | $ | — | 6 | $ | 1,032 | ||||||||||
|
Delinquent
loans to total loans
|
— | % | 0.36 | % | ||||||||||||
The table
below sets forth the amounts and categories of non-performing assets in the
Bank’s loan portfolio. Loans are placed on non-accrual status when delinquent
more than 90 days or when the collection of principal and/or interest become
doubtful. For all years presented, BCB Community Bank has had no
troubled debt restructurings (which involve forgiving a portion of interest or
principal on any loans or making loans at a rate materially less than that of
market rates). Foreclosed assets include assets acquired in
settlement of loans.
|
At
December 31,
|
||||||||||||||||||||
|
2009
|
2008
|
2007
|
2006
|
2005
|
||||||||||||||||
|
(Dollars
in Thousands)
|
||||||||||||||||||||
|
Non-accruing loans:
|
||||||||||||||||||||
|
One-
to four-family residential
|
$ | 1,559 | $ | 1,213 | $ | 319 | $ | — | $ | — | ||||||||||
|
Construction
|
4,343 | — | 1,247 | — | — | |||||||||||||||
|
Home
equity
|
251 | — | 149 | — | — | |||||||||||||||
|
Commercial
and multi-family
|
5,280 | 2,515 | 2,039 | 307 | 637 | |||||||||||||||
|
Commercial
business
|
500 | — | — | — | 150 | |||||||||||||||
|
Consumer
|
— | — | — | 16 | — | |||||||||||||||
|
Total
|
11,933 | 3,728 | 3,754 | 323 | 787 | |||||||||||||||
|
Accruing loans delinquent more than 90
days:
|
||||||||||||||||||||
|
One-
to four-family residential
|
— | — | — | — | — | |||||||||||||||
|
Construction
|
— | — | — | — | — | |||||||||||||||
|
Home
equity
|
— | — | — | — | — | |||||||||||||||
|
Commercial
and multi-family
|
— | — | 519 | — | 166 | |||||||||||||||
|
Commercial
business
|
— | — | — | — | — | |||||||||||||||
|
Consumer
|
— | — | — | — | 79 | |||||||||||||||
|
Total
|
— | — | 519 | — | 245 | |||||||||||||||
|
Total
non-performing loans
|
11,933 | 3,728 | 4,273 | 323 | 1,032 | |||||||||||||||
|
Foreclosed
assets
|
1,270 | 1,435 | 287 | — | — | |||||||||||||||
|
Total
non-performing assets
|
$ | 13,203 | $ | 5,163 | $ | 4,560 | $ | 323 | $ | 1,032 | ||||||||||
|
Total
non-performing assets as a percentage of total assets
|
2.09 | % | 0.89 | % | 0.81 | % | 0.06 | % | 0.22 | % | ||||||||||
|
Total
non-performing loans as a percentage of total loans
|
2.92 | % | 0.90 | % | 1.16 | % | 0.10 | % | 0.36 | % | ||||||||||
For the
year ended December 31, 2009, gross interest income which would have been
recorded had our non-accruing loans been current in accordance with their
original terms amounted to $1.1 million. We received and recorded
$282,000 in interest income for such loans for the year ended December 31,
2009.
Classified
Assets. Our policies provide for a classification system for
problem assets. Under this classification system, problem assets are
classified as “substandard,” “doubtful,” “loss” or “special
mention.” An asset is considered substandard if it is inadequately
protected by its current net worth and paying capacity of the borrower or of the
collateral pledged, if any. Substandard assets include those characterized by
the “distinct possibility” that “some loss” will be sustained if the
deficiencies are not corrected. Assets classified as doubtful have
all the weaknesses inherent in those classified substandard with the added
characteristic that the weakness present makes “collection or liquidation in
full” on the basis of currently existing facts, conditions, and values, “highly
questionable and improbable.” Assets classified as loss are those
considered “uncollectible” and of such little value that their continuance as
assets without the establishment of a specific loss reserve is not warranted,
and the loan, or a portion thereof, is charged-off. Assets may be
designated special mention because of potential weaknesses that do not currently
warrant classification in one of the aforementioned categories.
When we
classify problem assets, we may establish general allowances for loan losses in
an amount deemed prudent by management. General allowances represent
loss allowances which have been established to recognize the inherent risk
associated with lending activities, but which, unlike specific allowances, have
not been allocated to particular problem assets. A portion of general loss
allowances established to cover possible losses related to assets classified as
substandard or doubtful may be included in determining our regulatory capital.
Specific valuation allowances for loan losses generally do not qualify as
regulatory capital. At December 31, 2009, we had $500,000 in assets classified
as doubtful, all of which was classified as impaired, $11.0 million in
assets classified as substandard, of which $8.2 million was classified as
impaired and $18.6 million in assets classified as special mention, of which
$6.7 million was classified as impaired. The loans classified as substandard
represent primarily commercial loans secured either by residential real estate,
commercial real estate or heavy equipment. The loans that have been
classified substandard were classified as such primarily because either updated
financial information has not been timely provided, or the collateral underlying
the loan is in the process of being revalued.
Allowances for Loan
Losses. A provision for loan losses is charged to operations
based on management’s evaluation of the losses that may be incurred in our loan
portfolio. The evaluation, including a review of all loans on which
full collectability of interest and principal may not be reasonably assured,
considers: (1) the risk characteristics of the loan portfolio; (2) current
economic conditions; (3) actual losses previously experienced; (4) the level of
loan growth; and (5) the existing level of reserves for loan losses that are
probable and estimable.
We
monitor our allowance for loan losses and make additions to the allowance as
economic conditions dictate. Although we maintain our allowance for loan losses
at a level that we consider adequate for the inherent risk of loss in our loan
portfolio, future losses could exceed estimated amounts and additional
provisions for loan losses could be required. In addition, our
determination of the amount of the allowance for loan losses is subject to
review by the New Jersey Department of Banking and Insurance and the FDIC, as
part of their examination process. After a review of the information available,
our regulators might require the establishment of an additional allowance. Any
increase in the loan loss allowance required by regulators would have a negative
impact on our earnings.
The
following table sets forth an analysis of the Bank’s allowance for loan
losses.
| Years Ended December 31, | ||||||||||||||||||||
|
2009
|
2008
|
2007
|
2006
|
2005
|
||||||||||||||||
|
(Dollars
in Thousands)
|
||||||||||||||||||||
|
Balance
at beginning of period
|
$ | 5,304 | $ | 4,065 | $ | 3,733 | $ | 3,090 | $ | 2,506 | ||||||||||
|
Charge-offs:
|
||||||||||||||||||||
|
One-
to four-family residential
|
— | — | — | — | — | |||||||||||||||
|
Construction
|
— | 90 | 270 | — | — | |||||||||||||||
|
Home
equity
|
— | — | — | — | — | |||||||||||||||
|
Commercial
and multi-family
|
205 | — | — | — | — | |||||||||||||||
|
Commercial
business
|
— | 3 | — | 66 | 522 | |||||||||||||||
|
Consumer
|
7 | 8 | 15 | 1 | 24 | |||||||||||||||
|
Total
charge-offs
|
212 | 101 | 285 | 67 | 546 | |||||||||||||||
|
Recoveries
|
2 | 40 | 17 | 85 | 12 | |||||||||||||||
|
Net
charge-offs (recoveries)
|
210 | 61 | 268 | (18 | ) | 534 | ||||||||||||||
|
Provisions
charged to operations
|
1,550 | 1,300 | 600 | 625 | 1,118 | |||||||||||||||
|
Ending
balance
|
$ | 6,644 | $ | 5,304 | $ | 4,065 | $ | 3,733 | $ | 3,090 | ||||||||||
|
Ratio
of non-performing assets to total assets at the end of
period
|
2.09 | % | 0.89 | % | 0.81 | % | 0.06 | % | 0.22 | % | ||||||||||
|
Allowance
for loan losses as a percent of total loans outstanding
|
1.62 | % | 1.28 | % | 1.10 | % | 1.16 | % | 1.07 | % | ||||||||||
|
Ratio
of net charge-offs (recoveries) during the period to total loans
outstanding at end of the period
|
0.05 | % | 0.01 | % | 0.07 | % | (0.01 | )% | 0.19 | % | ||||||||||
|
Ratio
of net charge-offs (recoveries) during the period to non-performing
loans
|
1.79 | % | 1.64 | % | 6.27 | % | (5.57 | )% | 51.74 | % | ||||||||||
Allocation of the Allowance for Loan
Losses. The following table illustrates the allocation of the
allowance for loan losses for each category of loan. The allocation
of the allowance to each category is not necessarily indicative of future loss
in any particular category and does not restrict our use of the allowance to
absorb losses in other loan categories.
|
At
December 31,
|
||||||||||||||||||||||||||||||||||||||||
|
2009
|
2008
|
2007
|
2006
|
2005
|
||||||||||||||||||||||||||||||||||||
|
Amount
|
Percent
of Loans in each Category in Total
Loans
|
Amount
|
Percent
of Loans in each Category in Total
Loans
|
Amount
|
Percent
of Loans in each Category in Total
Loans
|
Amount
|
Percent
of Loans in each Category in Total
Loans
|
Amount
|
Percent
of Loans in each Category in Total
Loans
|
|||||||||||||||||||||||||||||||
|
(Dollars
in Thousands)
|
||||||||||||||||||||||||||||||||||||||||
|
Type
of loan:
|
||||||||||||||||||||||||||||||||||||||||
|
One-
to four-family
|
$ | 430 | 18.70 | % | $ | 688 | 17.94 | % | $ | 221 | 14.96 | % | $ | 69 | 13.64 | % | $ | 76 | 12.11 | % | ||||||||||||||||||||
|
Construction
|
1,437 | 12.55 | 941 | 15.14 | 885 | 13.53 | 1,068 | 12.06 | 329 | 9.98 | ||||||||||||||||||||||||||||||
|
Home
equity
|
186 | 8.39 | 167 | 9.22 | 172 | 9.58 | 126 | 10.02 | 91 | 8.43 | ||||||||||||||||||||||||||||||
|
Commercial
and multi-family
|
4,184 | 54.71 | 3,175 | 54.07 | 2,476 | 56.35 | 2,285 | 59.60 | 2,180 | 64.26 | ||||||||||||||||||||||||||||||
|
Commercial
business
|
365 | 5.50 | 216 | 3.42 | 262 | 5.38 | 168 | 4.56 | 401 | 5.06 | ||||||||||||||||||||||||||||||
|
Consumer
|
42 | 0.15 | 117 | 0.21 | 49 | 0.20 | 17 | 0.12 | 13 | 0.16 | ||||||||||||||||||||||||||||||
|
Total
|
$ | 6,644 | 100.00 | % | $ | 5,304 | 100.00 | % | $ | 4,065 | 100.00 | % | $ | 3,733 | 100.00 | % | $ | 3,090 | 100.00 | % | ||||||||||||||||||||
Investment
Activities
Investment Securities. We are
required under federal regulations to maintain a minimum amount of liquid assets
that may be invested in specified short-term securities and certain other
investments. The level of liquid assets varies depending upon several factors,
including: (i) the yields on investment alternatives, (ii) our judgment as
to the attractiveness of the yields then available in relation to other
opportunities, (iii) expectation of future yield levels, and (iv) our
projections as to the short-term demand for funds to be used in loan origination
and other activities. Investment securities, including mortgage-backed
securities, are classified at the time of purchase, based upon management’s
intentions and abilities, as securities held-to-maturity or securities available
for sale. Debt securities acquired with the intent and ability to hold to
maturity are classified as held-to-maturity and are stated at cost and adjusted
for amortization of premium and accretion of discount, which are computed using
the level yield method and recognized as adjustments of interest income. All
other and equity debt securities are classified as available for sale to serve
principally as a source of liquidity.
Current
regulatory and accounting guidelines regarding investment securities require us
to categorize securities as held-to-maturity, available for sale or trading. As
of December 31, 2009, we had $132.6 million of securities classified as
held-to-maturity, $1.3 million in securities classified as available for sale,
and no securities classified as trading. Securities classified as
available for sale are reported for financial reporting purposes at the fair
value with net changes in the fair value from period to period included as a
separate component of stockholders’ equity, net of income taxes. At December 31,
2009, our securities classified as held-to-maturity had a fair value of
$133.1 million. Changes in the fair value of securities classified as
held-to-maturity do not affect our income, unless we determine there to be an
other-than-temporary impairment for those securities in an unrealized loss
position. At December 31, 2008, the Bank recorded such a charge of $2.9 million
on a $3.0 million investment in FNMA preferred stock. At December 31, 2009,
management concluded that all unrealized losses were temporary in nature since
they are related to interest rate fluctuations rather than any underlying credit
quality of the issuers. Additionally, the Company has no plans to sell these
securities and has concluded that it is unlikely it would have to sell these
securities prior to the anticipated recovery of the unrealized losses. During
the year ended December 31, 2009, we had no securities sales.
At
December 31, 2009, our investment policy allowed investments in instruments such
as: (i) U.S. Treasury obligations; (ii) U.S. federal agency or
federally sponsored agency obligations; (iii) mortgage-backed securities;
and (iv) certificates of deposit. The Board of Directors may
authorize additional investments. At December 31, 2009, our U.S.
Government agency securities totaled $98.0 million, all of which were classified
as held-to-maturity and which primarily consisted of callable securities issued
by government sponsored enterprises.
As a
source of liquidity and to supplement our lending activities, we have invested
in residential mortgage-backed securities. Mortgage-backed securities
generally yield less than the loans that underlie such securities because of the
cost of payment guarantees or credit enhancements that reduce credit
risk. Mortgage-backed securities can serve as collateral for
borrowings and, through repayments, as a source of
liquidity. Mortgage-backed securities represent a participation
interest in a pool of single-family or other type of
mortgages. Principal and interest payments are passed from the
mortgage originators, through intermediaries
(generally
government-sponsored enterprises) that pool and repackage the participation
interests in the form of securities, to investors, like us. The
government-sponsored enterprises guarantee the payment of principal and interest
to investors and include Freddie Mac, Ginnie Mae, and Fannie Mae.
Mortgage-backed
securities typically are issued with stated principal amounts. The
securities are backed by pools of mortgage loans that have interest rates that
are within a set range and have varying maturities. The underlying
pool of mortgages can be composed of either fixed rate or adjustable rate
mortgage loans. Mortgage-backed securities are generally referred to
as mortgage participation certificates or pass-through
certificates. The interest rate risk characteristics of the
underlying pool of mortgages (i.e., fixed rate or adjustable rate) and the
prepayment risk, are passed on to the certificate holder. The life of
a mortgage-backed pass-through security is equal to the life of the underlying
mortgages. Expected maturities will differ from contractual
maturities due to scheduled repayments and because borrowers may have the right
to call or prepay obligations with or without prepayment penalties.
Securities
Portfolio. The following table sets forth the carrying value
of our securities portfolio and Federal funds at the dates
indicated.
|
At
December 31,
|
||||||||||||
|
2009
|
2008
|
2007
|
||||||||||
|
(In
Thousands)
|
||||||||||||
|
Securities
available for sale:
|
||||||||||||
|
Equity
securities
|
$ | 1,346 | $ | 888 | $ | 2,056 | ||||||
|
Securities
held to maturity:
|
||||||||||||
|
U.S.
Government and Agency securities
|
98,023 | 98,607 | 130,156 | |||||||||
|
Mortgage-backed
securities
|
34,621 | 42,673 | 34,861 | |||||||||
|
Total
securities held to maturity
|
132,644 | 141,280 | 165,017 | |||||||||
|
Money
market funds
|
— | — | 3,500 | |||||||||
|
FHLB
stock
|
5,714 | 5,736 | 5,560 | |||||||||
|
Total
investment securities
|
$ | 139,704 | $ | 147,904 | $ | 176,133 | ||||||
The
following table shows our securities held-to-maturity purchase, sale and
repayment activities for the periods indicated.
|
Years
Ended December 31,
|
||||||||||||
|
2009
|
2008
|
2007
|
||||||||||
|
(In
Thousands)
|
||||||||||||
|
Purchases:
|
||||||||||||
|
Fixed-rate
|
$ | 147,647 | $ | 60,606 | $ | 37,338 | ||||||
|
Total
purchases
|
$ | 147,647 | $ | 60,606 | $ | 37,338 | ||||||
|
Sales:
|
||||||||||||
|
Fixed-rate
|
$ | — | $ | — | $ | — | ||||||
|
Total
sales
|
$ | — | $ | — | $ | — | ||||||
|
Principal
Repayments:
|
||||||||||||
|
Repayment
of principal
|
$ | 155,553 | $ | 84,400 | $ | 21,010 | ||||||
|
Increase
(decrease) in other items, net
|
730 | (58 | ) | 17 | ||||||||
|
Net
(decreases) increases
|
$ | (8,636 | ) | $ | (23,850 | ) | $ | 16,345 | ||||
Maturities of Securities
Portfolio. The following table sets forth information
regarding the scheduled maturities, carrying values, estimated market values,
and weighted average yields for the Bank’s securities portfolio at December 31,
2009 by contractual maturity. The following table does not take into
consideration the effects of scheduled repayments or the effects of possible
prepayments.
|
As
of December 31, 2009
|
||||||||||||||||||||||||||||||||||||||||||||
|
Within
one year
|
More
than
One to five years
|
More
than five to
ten years
|
More
than ten years
|
Total
investment
securities
|
||||||||||||||||||||||||||||||||||||||||
|
Carrying
Value
|
Average
Yield
|
Carrying
Value
|
Average
Yield
|
Carrying
Value
|
Average
Yield
|
Carrying
Value
|
Average
Yield
|
Fair
Value
|
Carrying Value
|
Average
Yield
|
||||||||||||||||||||||||||||||||||
|
(Dollars
in Thousands)
|
||||||||||||||||||||||||||||||||||||||||||||
|
U.S.
government agency securities
|
$ | - | - | % | $ | 3,315 | 5.00 | % | $ | 515 | 1.22 | % | $ | 94,193 | 4.09 | % | $ | 96,888 | $ | 98,023 | 4.11 | % | ||||||||||||||||||||||
|
Mortgage-backed
securities
|
346 | 3.64 | 39 | 6.00 | 6,783 | 5.03 | 27,453 | 5.29 | 36,162 | 34,621 | 5.22 | |||||||||||||||||||||||||||||||||
|
Total
investment securities
|
$ | 346 | 3.64 | % | $ | 3,354 | 5.01 | % | $ | 7,298 | 4.76 | % | $ | 121,646 | 4.36 | % | $ | 133,050 | $ | 132,644 | 4.40 | % | ||||||||||||||||||||||
Sources of
Funds
Our major
external source of funds for lending and other investment purposes are
deposits. Funds are also derived from the receipt of payments on
loans, prepayment of loans, maturities of investment securities and
mortgage-backed securities and borrowings. Scheduled loan principal repayments
are a relatively stable source of funds, while deposit inflows and outflows and
loan prepayments are significantly influenced by general interest rates and
market conditions.
Deposits. Consumer
and commercial deposits are attracted principally from within our primary market
area through the offering of a selection of deposit instruments including
demand, NOW, savings and club accounts, money market accounts, and term
certificate accounts. Deposit account terms vary according to the
minimum balance required, the time period the funds must remain on deposit, and
the interest rate.
The
interest rates paid by us on deposits are set at the direction of our senior
management. Interest rates are determined based on our liquidity
requirements, interest rates paid by our competitors, our growth goals, and
applicable regulatory restrictions and requirements. At December 31,
2009, we had no brokered deposits.
Deposit
Accounts. The following table sets forth the dollar amount of
deposits in the various types of deposit programs we offered as of the dates
indicated.
|
December 31,
|
||||||||||||||||||||||||
|
2009
|
2008
|
2007
|
||||||||||||||||||||||
|
|
||||||||||||||||||||||||
|
Weighted
Average Rate(1)
|
Amount
|
Weighted
Average Rate(1)
|
Amount
|
Weighted
Average Rate(1)
|
Amount
|
|||||||||||||||||||
| (Dollars in Thousands) | ||||||||||||||||||||||||
|
Demand
|
— | % | $ | 37,082 | — | % | $ | 30,561 | — | % | $ | 35,897 | ||||||||||||
|
NOW
|
1.22 | 34,270 | 1.25 | 25,843 | 1.40 | 20,260 | ||||||||||||||||||
|
Money
market
|
1.94 | 33,656 | 2.79 | 19,539 | 4.14 | 27,697 | ||||||||||||||||||
|
Savings
and club accounts
|
1.12 | 108,170 | 1.36 | 99,586 | 1.71 | 100,441 | ||||||||||||||||||
|
Certificates
of deposit
|
3.19 | 250,560 | 4.13 | 234,974 | 4.82 | 214,524 | ||||||||||||||||||
|
Total
|
2.44 | % | $ | 463,738 | 2.84 | % | $ | 410,503 | 3.30 | % | $ | 398,819 | ||||||||||||
__________
(1) Represents
the average rate paid during the year.
The
following table sets forth our deposit flows during the periods
indicated.
|
Years
Ended December 31,
|
||||||||||||
|
2009
|
2008
|
2007
|
||||||||||
|
(Dollars
in Thousands)
|
||||||||||||
|
Beginning
of period
|
$ | 410,503 | $ | 398,819 | $ | 382,747 | ||||||
|
Net
deposits
|
43,097 | 107 | 3,135 | |||||||||
|
Interest
credited on deposit accounts
|
10,138 | 11,577 | 12,937 | |||||||||
|
Total
increase in deposit accounts
|
53,235 | 11,684 | 16,072 | |||||||||
|
Ending
balance
|
$ | 463,738 | $ | 410,503 | $ | 398,819 | ||||||
|
Percent
increase
|
12.97 | % | 2.93 | % | 4.20 | % | ||||||
Jumbo Certificates of
Deposit. As of December 31, 2009, the aggregate amount of
outstanding certificates of deposit in amounts greater than or equal to $100,000
was approximately $142.3 million. The following table indicates the
amount of our certificates of deposit of $100,000 or more by time remaining
until maturity.
|
At December 31, 2009
|
||||
|
Maturity Period
|
(In
Thousands)
|
|||
|
Within
three months
|
$ | 44,400 | ||
|
Three
through twelve months
|
63,654 | |||
|
Over
twelve months
|
34,277 | |||
|
Total
|
$ | 142,331 | ||
The
following table presents, by rate category, our certificate of deposit accounts
as of the dates indicated.
|
At
December 31,
|
|||||||||||||||||||||||||
|
2009
|
2008
|
2007
|
|||||||||||||||||||||||
|
Amount
|
Percent
|
Amount
|
Percent
|
Amount
|
Percent
|
||||||||||||||||||||
|
(Dollars
in Thousands)
|
|||||||||||||||||||||||||
|
Certificate
of deposit rates:
|
|||||||||||||||||||||||||
| 1.00% - 1.99% | $ | 111,078 | 44.33 | % | $ | 245 | 0.10 | % | $ | 929 | 0.43 | % | |||||||||||||
| 2.00% - 2.99% | 56,002 | 22.35 | 42,847 | 18.23 | 698 | 0.33 | |||||||||||||||||||
| 3.00% - 3.99% | 47,731 | 19.05 | 107,017 | 45.54 | 41,048 | 19.14 | |||||||||||||||||||
| 4.00% - 4.99% | 33,619 | 13.42 | 74,084 | 31.53 | 64,688 | 30.15 | |||||||||||||||||||
| 5.00% - 5.99% | 2,130 | 0.85 | 10,781 | 4.60 | 107,161 | 49.95 | |||||||||||||||||||
|
Total
|
$ | 250,560 | 100.00 | % | $ | 234,974 | 100.00 | % | $ | 214,524 | 100.00 | % | |||||||||||||
The
following table presents, by rate category, the remaining period to maturity of
certificate of deposit accounts outstanding as of December 31,
2009.
|
Maturity
Date
|
|||||||||||||||||||||
|
1
Year
or
Less
|
Over
1
to
2 Years
|
Over
2
to
3 Years
|
Over
3
Years
|
Total
|
|||||||||||||||||
|
(In
Thousands)
|
|||||||||||||||||||||
|
Interest
rate:
|
|||||||||||||||||||||
| 1.00% - 1.99% | $ | 107,524 | $ | 2,843 | $ | 711 | $ | — | $ | 111,078 | |||||||||||
| 2.00% - 2.99% | 45,041 | 5,527 | 2,388 | 3,046 | 56,002 | ||||||||||||||||
| 3.00% - 3.99% | 11,338 | 3,370 | 1,342 | 31,681 | 47,731 | ||||||||||||||||
| 4.00% - 4.99% | 28,742 | 4,786 | 91 | — | 33,619 | ||||||||||||||||
| 5.00% - 5.99% | 2,044 | 86 | — | — | 2,130 | ||||||||||||||||
|
Total
|
$ | 194,689 | $ | 16,612 | $ | 4,532 | $ | 34,727 | $ | 250,560 | |||||||||||
Borrowings. Our
advances from the FHLB of New York are secured by a pledge of our stock in the
FHLB of New York, cash, investment securities and a blanket pledge on our
residential mortgage portfolio. Each FHLB credit program has its own interest
rate, which may be fixed or adjustable, and range of maturities. If the need
arises, we may also access the Federal Reserve Bank discount window to
supplement our supply of funds that we can loan and to meet deposit withdrawal
requirements. During the year ended December 31, 2009 we utilized
short term borrowings in the form of an overnight line of credit with the FHLB
of New York on a very limited basis and during the year ended December 31, 2008
we utilized this line more extensively. Our maximum short-term borrowings
outstanding during 2009 was $4.0 million. At December 31, 2009, we had the
ability to borrow approximately $119.5 million under our credit facilities with
the FHLB of New York. Additionally, at December 31, 2009 we had a trust
preferred debenture of $4.1 million which has been callable at the Company’s
option since June 17, 2009, and quarterly thereafter.
The
following table sets forth information concerning balances and interest rates on
our short-term borrowings at the dates and for the periods
indicated.
|
At
or For the Years Ended December 31,
|
||||||||||||
|
2009
|
2008
|
2007
|
||||||||||
|
(Dollars
in Thousands)
|
||||||||||||
|
Balance
at end of period
|
$ | — | $ | 2,000 | $ | — | ||||||
|
Average
balance during period
|
$ | 38 | $ | 4,796 | $ | — | ||||||
|
Maximum
outstanding at any month end
|
$ | — | $ | 20,500 | $ | — | ||||||
|
Weighted
average interest rate at end of period
|
— | 0.44 | % | — | ||||||||
|
Average
interest rate during period
|
0.51 | % | 1.23 | % | — | |||||||
Employees
At
December 31, 2009, we had 63 full-time and 28 part-time
employees. None of our employees is represented by a collective
bargaining group. We believe that our relationship with our employees
is good.
Subsidiaries
We have one non-bank
subsidiary. BCB Holding Company Investment Corp. was established in
2004 for the purpose of holding and investing in securities. Only
securities authorized to be purchased by BCB Community Bank are held by BCB
Holding Company Investment Corp. At December 31, 2009, this company
held $124.7 million in securities.
Supervision and
Regulation
Bank
holding companies and banks are extensively regulated under both federal and
state law. These laws and regulations are intended to protect
depositors, not shareholders. To the extent that the following
information describes statutory and regulatory provisions, it is qualified in
its entirety by reference to the particular statutory and regulatory
provisions. Any change in the applicable law or regulation may have a
material effect on the business and prospects of the Company and the
Bank.
Bank Holding Company
Regulation. As a bank holding company registered under the Bank Holding
Company Act of 1956, as amended, the Company is subject to the regulation and
supervision applicable to bank holding companies by the Board of Governors of
the Federal Reserve System. The Company is required to file with the
Federal Reserve annual reports and other information regarding its business
operations and those of its subsidiaries.
The Bank
Holding Company Act requires, among other things, the prior approval of the
Federal Reserve in any case where a bank holding company proposes to
(i) acquire all or substantially all of the assets of any other bank,
(ii) acquire direct or indirect ownership or control of more than 5% of the
outstanding voting stock of any bank (unless it owns a majority of such
company’s voting shares) or (iii) merge or consolidate with any other bank
holding company. The Federal Reserve will not approve any
acquisition, merger, or consolidation that would have a substantially
anti-competitive effect, unless the anti-competitive impact of the proposed
transaction is clearly outweighed by a greater public interest in meeting the
convenience and needs of the community to be served. The Federal
Reserve also considers
capital
adequacy and other financial and managerial resources and future prospects of
the companies and the banks concerned, together with the convenience and needs
of the community to be served, when reviewing acquisitions or
mergers.
The Bank
Holding Company Act generally prohibits a bank holding company, with certain
limited exceptions, from (i) acquiring or retaining direct or indirect ownership
or control of more than 5% of the outstanding voting stock of any company which
is not a bank or bank holding company, or (ii) engaging directly or indirectly
in activities other than those of banking, managing or controlling banks, or
performing services for its subsidiaries, unless such non-banking business is
determined by the Federal Reserve to be so closely related to banking or
managing or controlling banks as to be properly incident thereto.
The Bank
Holding Company Act has been amended to permit bank holding companies and banks,
which meet certain capital, management and Community Reinvestment Act standards,
to engage in a broader range of non-banking activities. In addition,
bank holding companies which elect to become financial holding companies may
engage in certain banking and non-banking activities without prior Federal
Reserve approval. At this time, the Company has elected not to become
a financial holding company, as it does not engage in any activities not
permissible for banks.
There are
a number of obligations and restrictions imposed on bank holding companies and
their depository institution subsidiaries by law and regulatory policy that are
designed to minimize potential loss to the depositors of such depository
institutions and the FDIC insurance funds in the event the depository
institution is in danger of default. Under a policy of the Federal
Reserve with respect to bank holding company operations, a bank holding company
is required to serve as a source of financial strength to its subsidiary
depository institutions and to commit resources to support such institutions in
circumstances where it might not do so absent such policy. The
Federal Reserve also has the authority under the Bank Holding Company Act to
require a bank holding company to terminate any activity or to relinquish
control of a non-bank subsidiary upon the Federal Reserve’s determination that
such activity or control constitutes a serious risk to the financial soundness
and stability of any bank subsidiary of the bank holding company.
Capital Adequacy Guidelines for Bank
Holding Companies. The Federal Reserve has adopted risk-based capital
guidelines for bank holding companies. The risk-based capital guidelines are
designed to make regulatory capital requirements more sensitive to differences
in risk profile among banks and bank holding companies, to account for
off-balance sheet exposure, and to minimize disincentives for holding liquid
assets. Under these guidelines, assets and off-balance sheet items are assigned
to broad risk categories each with appropriate weights. The resulting capital
ratios represent capital as a percentage of total risk-weighted assets and
off-balance sheet items.
The
Company is subject to regulatory capital requirements and guidelines imposed by
the Federal Reserve, which are substantially similar to those imposed by the
FDIC on depository institutions within their jurisdictions. At December 31,
2009, BCB Bancorp, Inc., was considered to be a well capitalized Bank Holding
Company.
The
Federal Reserve may set higher capital requirements for holding companies whose
circumstances warrant it. For example, holding companies experiencing
internal growth or making acquisitions are expected to maintain strong capital
positions substantially above the minimum supervisory levels, without
significant reliance on intangible assets.
From time
to time, the Federal Reserve Board and the other federal bank regulatory
agencies propose changes to, and issue interpretations of, risk-based capital
guidelines and related reporting instructions. Such changes or interpretations
could, if implemented in the future, affect the Company’s capital ratios and
risk-adjusted assets.
Bank Regulation. As a New
Jersey-chartered commercial bank, the Bank is subject to the regulation,
supervision, and examination of the New Jersey Department of Banking and
Insurance. As an FDIC-insured institution, we are subject to the
regulation, supervision and examination of the FDIC, an agency of the federal
government. The regulations of the FDIC and the New Jersey Department of Banking
and Insurance impact virtually all of our activities, including the minimum
level of capital we must maintain, our ability to pay dividends, our ability to
expand through new branches or acquisitions and various other
matters.
Insurance of Deposit
Accounts. BCB Community Bank is a
member of the Deposit Insurance Fund, which is administered by the FDIC. Deposit
accounts at BCB Community Bank are insured by the FDIC, generally up to a
maximum of $250,000 for each separately insured depositor and up to a maximum of
$250,000 for self-directed retirement accounts. The FDIC increased the deposit
insurance available on all deposit accounts to $250,000, effective until
December 31, 2013. In addition, certain noninterest-bearing
transaction accounts maintained with financial institutions participating in the
FDIC’s Temporary Liquidity Guarantee Program are fully insured regardless of the
dollar amount until June 30, 2010.
The FDIC
imposes an assessment against institutions for deposit insurance. On February
27, 2009, the FDIC issued a final rule that alters the way the FDIC calculates
federal deposit insurance assessment rates beginning in the second quarter of
2009 and thereafter. Under the rule, the FDIC first establishes an institution’s
initial base assessment rate. This initial base assessment rate ranges,
depending on the risk category of the institution, from 12 to 45 basis points.
The FDIC then adjusts the initial base assessment (higher or lower) to obtain
the total base assessment rate. The adjustments to the initial base assessment
rate are based upon an institution’s levels of unsecured debt, secured
liabilities, and brokered deposits. The total base assessment rate ranges from 7
to 77.5 basis points of the institution’s deposits. Additionally, on May 22,
2009, the FDIC issued a final rule that imposed a special 5 basis points
assessment on each FDIC-insured depository institution's assets, minus its Tier
1 capital on June 30, 2009, which was collected on September 30, 2009. The
special assessment is capped at 10 basis points of an institution's domestic
deposits. Future special assessments could also be assessed. Based upon BCB
Community Bank’s FDIC premium assessment for the second quarter of 2009
increased by approximately $504,000, including the special
assessment.
The FDIC
has adopted a final rule pursuant to which all insured depository institutions
were required to prepay their estimated assessments for the fourth quarter of
2009, and for all of 2010, 2011 and 2012. Under the rule, this pre-payment was
due on December 30, 2009. The assessment rate for the fourth quarter
of 2009 and for 2010 was based on each institution’s total
base
assessment rate for the third quarter of 2009, modified to assume that the
assessment rate in effect on September 30, 2009 had been in effect for the
entire third quarter, and the assessment rate for 2011 and 2012 will be equal to
the modified third quarter assessment rate plus an additional 3 basis points. In
addition, each institution’s base assessment rate for each period was calculated
using its third quarter assessment base, adjusted quarterly for an estimated 5%
annual growth rate in the assessment base through the end of 2012. Our
prepayment amount was approximately $2.4 million.
Insurance of deposits may be terminated
by the FDIC upon a finding that an institution has engaged in unsafe or unsound
practices, is in an unsafe or unsound condition to continue operations or has
violated any applicable law, regulation, rule, order or condition imposed by the
FDIC. We do not currently know of any practice, condition or violation that may
lead to termination of our deposit insurance.
In addition to the FDIC assessments,
the Financing Corporation (“FICO”) is authorized to impose and collect, with the
approval of the FDIC, assessments for anticipated payments, issuance costs and
custodial fees on bonds issued by the FICO in the 1980s to recapitalize the
former Federal Savings and Loan Insurance Corporation. The bonds issued by the
FICO are due to mature in 2017 through 2019. For the quarter ended December 31,
2009, the annualized FICO assessment was equal to 1.06 basis points for each
$100 in domestic deposits maintained at an institution.
Temporary Liquidity Guarantee
Program. On October 14, 2008, the FDIC announced a new program
– the Temporary Liquidity Guarantee Program, which guarantees newly issued
senior unsecured debt of a participating organization, up to certain limits
established for each institution, issued between October 14, 2008 and June 30,
2009. The FDIC will pay the unpaid principal and interest on FDIC-guaranteed
debt instruments upon the uncured failure of the participating entity to make
timely payments of principal or interest in accordance with the terms of the
instrument. The guarantee will remain in effect until June 30, 2012. In return
for the FDIC’s guarantee, participating institutions will pay the FDIC a fee
based on the amount and maturity of the debt. We opted not to participate in
this part of the Temporary Liquidity Guarantee Program.
The other part of the Temporary
Liquidity Guarantee Program provides full federal deposit insurance coverage for
noninterest-bearing transaction deposit accounts, regardless of dollar amount,
until December 31, 2009. An annualized 10 basis point assessment on balances in
noninterest-bearing transaction accounts that exceed the existing deposit
insurance limit of $250,000 will be assessed on a quarterly basis to insured
depository institutions that have not opted out of this component of the
Temporary Liquidity Guarantee Program. We opted to participate in this component
of the Temporary Liquidity Guarantee Program. On August 26, 2009, the FDIC
extended the program until June 30, 2010. Institutions had until November 2,
2009 to decide whether they would opt out of the extension which takes effect on
January 1, 2010. An annualized assessment rate between 15 and 25 basis points on
balances in noninterest-bearing transaction accounts that exceed the existing
deposit insurance limit of $250,000 will be assessed depending on the
institution’s risk category. We opted into the extension.
U.S. Treasury’s Troubled Asset
Relief Program Capital Purchase Program. The
Emergency Economic Stabilization Act of 2008, which was enacted on October 3,
2008, provides the U.S. Secretary of the Treasury with broad authority to
implement certain actions to help restore stability and liquidity to U.S.
financial markets. One of the programs resulting from the legislation is the
Troubled Asset Relief Program Capital Purchase Program (“CPP”), which provides
direct equity investment by the U.S. Treasury Department in perpetual preferred
stock of qualified financial institutions. The program is voluntary and requires
an institution to comply with a number of restrictions and provisions, including
limits on executive compensation, stock redemptions and declaration of
dividends. The CPP provides for a minimum investment of one percent of total
risk-weighted assets and a maximum investment equal to the lesser of three
percent of total risk-weighted assets or $25 billion. Participation in the
program is not automatic and is subject to approval by the U.S. Treasury
Department. We opted not to participate in the CPP.
Capital Adequacy Guidelines.
The FDIC has promulgated risk-based capital rules, which are designed to make
regulatory capital requirements more sensitive to differences in risk profile
among banks, to account for off-balance sheet exposure, and to minimize
disincentives for holding liquid assets. Under these rules, assets
and off-balance sheet items are assigned to broad risk categories, each with
appropriate weights. The resulting capital ratios represent capital
as a percentage of total risk-weighted assets and off-balance sheet items. These
rules are substantially similar to the Federal Reserve rules discussed
above.
In
addition to the risk-based capital rules, the FDIC has adopted a minimum Tier 1
capital (leverage) ratio. This measurement is substantially similar
to the Federal Reserve leverage capital measurement discussed
above. At December 31, 2009, the Bank’s ratio of total capital to
risk-weighted assets was 14.37%. Our Tier 1 capital to risk-weighted assets was
13.11%, and our Tier 1 capital to average assets was 8.68%.
Dividends. The
Bank may pay dividends as declared from time to time by the Board of Directors
out of funds legally available, subject to certain
restrictions. Under the New Jersey Banking Act of 1948, as amended,
the Bank may not pay a cash dividend unless, following the payment, the Bank’s
capital stock will be unimpaired and the Bank will have a surplus of no less
than 50% of the Bank capital stock or, if not, the payment of the dividend will
not reduce the surplus. In addition, the Bank cannot pay dividends in
amounts that would reduce the Bank’s capital below regulatory imposed
minimums.
The USA PATRIOT
Act
In
response to the terrorist events of September 11, 2001, the Uniting and
Strengthening America by Providing Appropriate Tools Required to Intercept and
Obstruct Terrorism Act of 2001, or the USA PATRIOT Act, was signed into law on
October 26, 2001. The USA PATRIOT Act gave the federal government new powers to
address terrorist threats through enhanced domestic security measures, expanded
surveillance powers, increased information sharing and broadened anti-money
laundering requirements. For years, financial institutions such as
the Bank have been subject to federal anti-money laundering
obligations. As such, the Bank does not believe the USA PATRIOT Act
will have a material impact on its operations.
Sarbanes-Oxley Act of
2002
The
Sarbanes-Oxley Act of 2002 (“Sarbanes-Oxley”), contains a broad range of
legislative reforms intended to address corporate and accounting
fraud. In addition to the establishment of a new accounting oversight
board that will enforce auditing, quality control and independence standards and
will be funded by fees from all publicly traded companies, Sarbanes-Oxley places
certain restrictions on the scope of services that may be provided by accounting
firms to their public company audit clients. Any non-audit services
being provided to a public company audit client will require preapproval by the
company’s audit committee. In addition, Sarbanes-Oxley makes certain
changes to the requirements for audit partner rotation after a period of
time. Sarbanes-Oxley requires chief executive officers and chief
financial officers, or their equivalent, to certify to the accuracy of periodic
reports filed with the Securities and Exchange Commission, subject to civil and
criminal penalties if they knowingly or willingly violate this certification
requirement. The Company’s Chief Executive Officer and Principal
Accounting Officer have signed certifications to this Form 10-K as required by
Sarbanes-Oxley. In addition, under Sarbanes-Oxley, counsel will be
required to report evidence of a material violation of the securities laws or a
breach of fiduciary duty by a company to its chief executive officer or its
chief legal officer, and, if such officer does not appropriately respond, to
report such evidence to the audit committee or other similar committee of the
board of directors or the board itself.
Under
Sarbanes-Oxley, longer prison terms will apply to corporate executives who
violate federal securities laws; the period during which certain types of suits
can be brought against a company or its officers is extended; and bonuses issued
to top executives prior to restatement of a company’s financial statements are
now subject to disgorgement if such restatement was due to corporate
misconduct. Executives are also prohibited from trading the company’s
securities during retirement plan “blackout” periods, and loans to company
executives (other than loans by financial institutions permitted by federal
rules and regulations) are restricted. In addition, a provision
directs that civil penalties levied by the Securities and Exchange Commission as
a result of any judicial or administrative action under Sarbanes-Oxley be
deposited to a fund for the benefit of harmed investors. The Federal
Accounts for Investor Restitution provision also requires the Securities and
Exchange Commission to develop methods of improving collection
rates. The legislation accelerates the time frame for disclosures by
public companies, as they must immediately disclose any material changes in
their financial condition or operations. Directors and executive
officers must also provide information for most changes in ownership in a
company’s securities within two business days of the change.
Sarbanes-Oxley
also increases the oversight of, and codifies certain requirements relating to,
audit committees of public companies and how they interact with the company’s
“registered public accounting firm.” Audit Committee members must be
independent and are absolutely barred from accepting consulting, advisory or
other compensatory fees from the issuer. In addition, companies must
disclose whether at least one member of the committee is a “financial expert”
(as such term is defined by the Securities and Exchange Commission) and if not,
why not. Under Sarbanes-Oxley, a company’s registered public
accounting firm is prohibited from performing statutorily mandated audit
services for a company if such company’s chief executive officer, chief
financial officer, comptroller, chief accounting officer or any person serving
in equivalent positions had been employed by such firm and participated in the
audit of such
company
during the one-year period preceding the audit initiation
date. Sarbanes-Oxley also prohibits any officer or director of a
company or any other person acting under their direction from taking any action
to fraudulently influence, coerce, manipulate or mislead any independent
accountant engaged in the audit of the company’s financial statements for the
purpose of rendering the financial statements materially
misleading. Sarbanes-Oxley also requires the Securities and Exchange
Commission to prescribe rules requiring inclusion of any internal control report
and assessment by management in the annual report to
shareholders. Sarbanes-Oxley requires the company’s registered public
accounting firm that issues the audit report to attest to and report on
management’s assessment of the company’s internal controls.
Under
Section 404 of the Sarbanes-Oxley Act of 2002, we are required to conduct a
comprehensive review and assessment of the adequacy of our existing financial
systems and controls. For the year ending December 31, 2010, we
expect that our auditors will have to audit our internal control over financial
reporting.
AVAILABILITY
OF ANNUAL REPORT
Our
Annual Report is available on our website, www.bcbbancorp.com. We
will also provide our Annual Report on Form 10-K free of charge to
shareholders who write to the Corporate Secretary at 104-110 Avenue C, Bayonne,
New Jersey 07002.
|
ITEM 1A.
|
RISK
FACTORS
|
The
following are the risk factors relating to BCB Bancorp, Inc. In addition, the
risks related to the merger with Pamrapo Bancorp, Inc., as disclosed in our
Joint Proxy Statement/Prospectus dated November 9, 2009, remain in
effect.
Our
loan portfolio consists of a high percentage of loans secured by commercial real
estate and multi-family real estate. These loans are riskier than
loans secured by one- to four-family properties.
At December 31, 2009, $223.8 million,
or 54.7% of our loan portfolio consisted of commercial and multi-family real
estate loans. We intend to continue to emphasize the origination of
these types of loans. These loans generally expose a lender to
greater risk of nonpayment and loss than one- to four-family residential
mortgage loans because repayment of the loans often depends on the successful
operation and income stream of the borrower’s business. Such loans
typically involve larger loan balances to single borrowers or groups of related
borrowers compared to one- to four-family residential mortgage
loans. Consequently, an adverse development with respect to one loan
or one credit relationship can expose us to a significantly greater risk of loss
compared to an adverse development with respect to a one- to four-family
residential mortgage loan.
We
may not be able to successfully maintain and manage our growth.
Since December 31, 2005, our assets
have grown at a compound annual growth rate of 7.9%, our loan balances have
grown at a compound annual growth rate of 9.0% and our deposits have grown at a
compound annual growth rate of 6.3%. Our ability to continue to grow
depends, in part, upon our ability to expand our market presence, successfully
attract core deposits, and identify attractive commercial lending
opportunities.
We cannot be certain as to our ability
to manage increased levels of assets and liabilities. We may be
required to make additional investments in equipment and personnel to manage
higher asset levels and loans balances, which may adversely impact our
efficiency ratio, earnings and shareholder returns.
If
our allowance for loan losses is not sufficient to cover actual loan losses, our
earnings could decrease.
Our loan
customers may not repay their loans according to the terms of their loans, and
the collateral securing the payment of their loans may be insufficient to assure
repayment. We may experience significant credit losses, which could have a
material adverse effect on our operating results. We make various assumptions
and judgments about the collectability of our loan portfolio, including the
creditworthiness of our borrowers and the value of the real estate and other
assets serving as collateral for the repayment of many of our loans. In
determining the amount of the allowance for loan losses, we review our loans and
our loss and delinquency experience, and we evaluate economic conditions. If our
assumptions prove to be incorrect, our allowance for loan losses may not cover
losses in our loan portfolio at the date of the financial statements. Material
additions to our allowance would materially decrease our net
income. At December 31, 2009, our allowance for loan losses totaled
$6.6 million, representing 1.62% of total loans.
While we have only been operating
for nine years, we have experienced significant growth in our loan
portfolio, particularly our loans secured by commercial real
estate. Although we believe we have underwriting standards to manage
normal lending risks, and although we had $13.2 million, or 2.09% of total
assets consisting of non-performing assets at December 31, 2009, it is difficult
to assess the future performance of our loan portfolio due to the relatively
recent origination of many of these loans. We can give you no
assurance that our non-performing loans will not increase or that our
non-performing or delinquent loans will not adversely affect our future
performance.
In
addition, federal and state regulators periodically review our allowance for
loan losses and may require us to increase our allowance for loan losses or
recognize further loan charge-offs. Any increase in our allowance for loan
losses or loan charge-offs as required by these regulatory agencies could have a
material adverse effect on our results of operations and financial
condition.
We
depend primarily on net interest income for our earnings rather than fee
income.
Net interest income is the most
significant component of our operating income. We do not rely on
traditional sources of fee income utilized by some community banks, such as fees
from sales of insurance, securities or investment advisory products or
services. For the years ended December 31, 2009 and 2008, our net
interest income was $19.4 million and $20.0 million,
respectively. The amount of our net interest income is influenced by
the overall interest rate environment, competition, and the amount of
interest-earning assets relative to the amount of interest-bearing
liabilities. In the event that one or more of these factors were to
result in a decrease in our net interest income, we do not have significant
sources of fee income to make up for decreases in net interest
income.
If
Our Investment in the Federal Home Loan Bank of New York is Classified as
Other-Than-Temporarily Impaired or as Permanently Impaired, Our Earnings and
Stockholders’ Equity Could Decrease
We own common stock of the Federal Home
Loan Bank of New York (FHLB-NY). We hold the FHLB-NY common stock to
qualify for membership in the Federal Home Loan Bank System and to be eligible
to borrow funds under the FHLB-NY’s advance program. The aggregate cost and fair
value of our FHLB-NY common stock as of December 31, 2009 was $5.7 million based
on its par value. There is no market for our FHLB-NY common stock.
Recent published reports indicate that
certain member banks of the Federal Home Loan Bank System may be subject to
accounting rules and asset quality risks that could result in materially lower
regulatory capital levels. In an extreme situation, it is possible that the
capitalization of a Federal Home Loan Bank, including the FHLB-NY, could be
substantially diminished or reduced to zero. Consequently, we believe that there
is a risk that our investment in FHLB-NY common stock could be deemed
other-than-temporarily impaired at some time in the future, and if this occurs,
it would cause our earnings and stockholders’ equity to decrease by the
after-tax amount of the impairment charge.
Fluctuations
in interest rates could reduce our profitability.
We
realize income primarily from the difference between the interest we earn on
loans and investments and the interest we pay on deposits and borrowings. The
interest rates on our assets and liabilities respond differently to changes in
market interest rates, which means our interest-bearing liabilities may be more
sensitive to changes in market interest rates than our interest-earning assets,
or vice versa. In either event, if market interest rates change, this “gap”
between the amount of interest-earning assets and interest-bearing liabilities
that reprice in response to these interest rate changes may work against us, and
our earnings may be negatively affected.
We are
unable to predict fluctuations in market interest rates, which are affected by,
among other factors, changes in the following:
|
|
·
|
inflation
rates;
|
|
|
·
|
business
activity levels;
|
|
|
·
|
money
supply; and
|
|
|
·
|
domestic
and foreign financial markets.
|
The value of our investment portfolio
and the composition of our deposit base are influenced by prevailing market
conditions and interest rates. Our asset-liability management strategy, which is
designed to mitigate the risk to us from changes in market interest rates, may
not prevent changes in interest rates or securities market downturns from
reducing deposit outflow or from having a material adverse effect on our results
of operations, our financial condition or the value of our
investments.
Adverse
events in New Jersey, where our business is concentrated, could adversely affect
our results and future growth.
Our business, the location of our
branches and the real estate collateralizing our real estate loans are
concentrated in New Jersey. As a result, we are exposed to geographic
risks. The occurrence of an economic downturn in New Jersey, or
adverse changes in laws or regulations in New Jersey could impact the credit
quality of our assets, the business of our customers and our ability to expand
our business.
Our success significantly depends upon
the growth in population, income levels, deposits and housing in our market
area. If the communities in which we operate do not grow or if
prevailing economic conditions locally or nationally are unfavorable, our
business may be negatively affected. In addition, the economies of
the communities in which we operate are substantially dependent on the growth of
the economy in the State of New Jersey. To the extent that economic
conditions in New Jersey are unfavorable or do not continue to grow as
projected, the economy in our market area would be adversely
affected. Moreover, we cannot give any assurance that we will benefit
from any market growth or favorable economic conditions in our market area if
they do occur.
In addition, the market value of the
real estate securing loans as collateral could be adversely affected by
unfavorable changes in market and economic conditions. As of December
31, 2009, approximately 94.3% of our total loans were secured by real
estate. Adverse developments affecting commerce or real estate values
in the local economies in our primary market areas could increase the credit
risk associated with our loan portfolio. In addition, substantially all of our
loans are to individuals and businesses in New Jersey. Our business customers
may not have customer bases that are as diverse as businesses serving regional
or national markets. Consequently, any decline in the economy of our market area
could have an adverse impact on our revenues and financial
condition. In particular, we may experience increased loan
delinquencies, which could result in a higher provision for loan losses and
increased charge-offs. Any sustained period of increased non-payment,
delinquencies, foreclosures or losses caused by adverse market or economic
conditions in our market area could adversely affect the value of our assets,
revenues, results of operations and financial condition.
We
operate in a highly regulated environment and may be adversely affected by
changes in federal, state and local laws and regulations.
We are
subject to extensive regulation, supervision and examination by federal and
state banking authorities. Any change in applicable regulations or federal,
state or local legislation could have a substantial impact on us and our
operations. Additional legislation and regulations that could significantly
affect our powers, authority and operations may be enacted or adopted in the
future, which could have a material adverse effect on our financial condition
and results of operations. Further, regulators have significant discretion and
authority to prevent or remedy unsafe or unsound practices or violations of laws
by banks and bank holding companies in the performance of their supervisory and
enforcement duties. The exercise of regulatory authority may have a negative
impact on our results of operations and financial condition.
Like
other bank holding companies and financial institutions, we must comply with
significant anti-money laundering and anti-terrorism laws. Under
these laws, we are required, among other things, to enforce a customer
identification program and file currency transaction and suspicious activity
reports with the federal government. Government agencies have
substantial discretion to impose significant monetary penalties on institutions
which fail to comply with these laws or make required
reports. Because we operate our business in the highly urbanized
greater Newark/New York City metropolitan area, we may be at greater risk of
scrutiny by government regulators for compliance with these laws.
|
ITEM
1B.
|
UNRESOLVED STAFF
COMMENTS
|
None.
|
ITEM
2.
|
PROPERTIES
|
At
December 31, 2009, we conducted our business from our executive office located
at 104-110 Avenue C, Bayonne, New Jersey, and our three branch offices, which
are located in Bayonne and Hoboken. The aggregate book value of our premises and
equipment was $5.4 million at December 31, 2009. We own our
executive office facility and lease our three branch offices.
|
ITEM
3.
|
LEGAL
PROCEEDINGS
|
We are
involved, from time to time, as plaintiff or defendant in various legal actions
arising in the normal course of its business. At December 31, 2009,
we were not involved in any material legal proceedings the outcome of which
would have a material adverse affect on our financial condition or results of
operations.
|
ITEM
4.
|
RESERVED
|
PART II
|
ITEM 5.
|
MARKET
FOR REGISTRANT’S COMMON EQUITY, RELATED STOCKHOLDER MATTERS AND ISSUER
PURCHASES OF EQUITYSECURITIES
|
BCB
Bancorp, Inc.’s common stock trades on the Nasdaq Global Market under the symbol
“BCBP.” In order to list common stock on the Nasdaq Global Market,
the presence of at least three registered and active market makers is required
and BCB Bancorp, Inc. has at least three market makers.
The
following table sets forth the high and low closing prices for BCB Bancorp, Inc.
common stock for the periods indicated. As of December 31, 2009, there were
4,657,906 shares of BCB Bancorp, Inc. common stock
outstanding. At December 31, 2009, BCB Bancorp, Inc. had
approximately 1,500 stockholders of record.
|
Fiscal 2009
|
High
|
Low
|
Cash Dividend Declared
|
|||||||||
|
Quarter
Ended December 31, 2009
|
$ | 9.72 | $ | 7.76 | $ | 0.12 | ||||||
|
Quarter
Ended September 30, 2009
|
10.42 | 7.31 | 0.12 | |||||||||
|
Quarter
Ended June 30, 2009
|
10.40 | 8.75 | 0.12 | |||||||||
|
Quarter
Ended March 31, 2009
|
10.99 | 8.50 | 0.12 | |||||||||
|
Fiscal 2008
|
High
|
Low
|
Cash Dividend Declared
|
|||||||||
|
Quarter
Ended December 31, 2008
|
$ | 13.25 | $ | 9.98 | $ | 0.12 | ||||||
|
Quarter
Ended September 30, 2008
|
14.87 | 12.61 | 0.10 | |||||||||
|
Quarter
Ended June 30, 2008
|
14.86 | 13.25 | 0.10 | |||||||||
|
Quarter
Ended March 31, 2008
|
15.67 | 13.00 | 0.09 | |||||||||
Please
see “Item 1. Business—Bank Regulation—Dividends” for a discussion of
restrictions on the ability of the Bank to pay the Company
dividends.
Compensation
Plans
Set forth
below is information as of December 31, 2009 regarding equity compensation plans
that have been approved by shareholders. The Company has no equity
based benefit plans that were not approved by shareholders.
|
Plan
|
Number of securities to be issued upon exercise of
outstanding options and rights
|
Weighted average
Exercise price(2)
|
Number of securities remaining available for
issuance under plan
|
|
Equity compensation plans approved by
shareholders
|
279,500(1)
|
$ 10.38
|
3,906
|
|
Equity compensation plans not approved by
shareholders
|
—
|
—
|
-0-
|
|
Total
|
279,500
|
$ 10.38
|
3,906
|
_____________________________
|
(1)
|
Consists
of options to purchase (i) 76,555 shares of common stock under the 2002
Stock Option Plan and (ii) 202,945 shares of common stock under the 2003
Stock Option Plan.
|
|
(2)
|
The
weighted average exercise price reflects the exercise prices ranging from
$9.34 to $15.65 per share for options granted under the 2003 Stock Option
Plan and ranging from $5.29 to $15.65 per share for options under the 2002
Stock Option Plan.
|
Stock
Performance Graph
Set forth hereunder is a stock
performance graph comparing (a) the cumulative total return on the common stock
for the period beginning with the closing sales price on January 1, 2005 through
December 31, 2009, (b) the cumulative total return on all publicly traded
commercial bank stocks over such period, and (c) the cumulative total return of
Nasdaq Market Index over such period. Cumulative return assumes the reinvestment
of dividends, and is expressed in dollars based on an assumed investment of
$100.
|
BCB BANCORP,
INC.
|
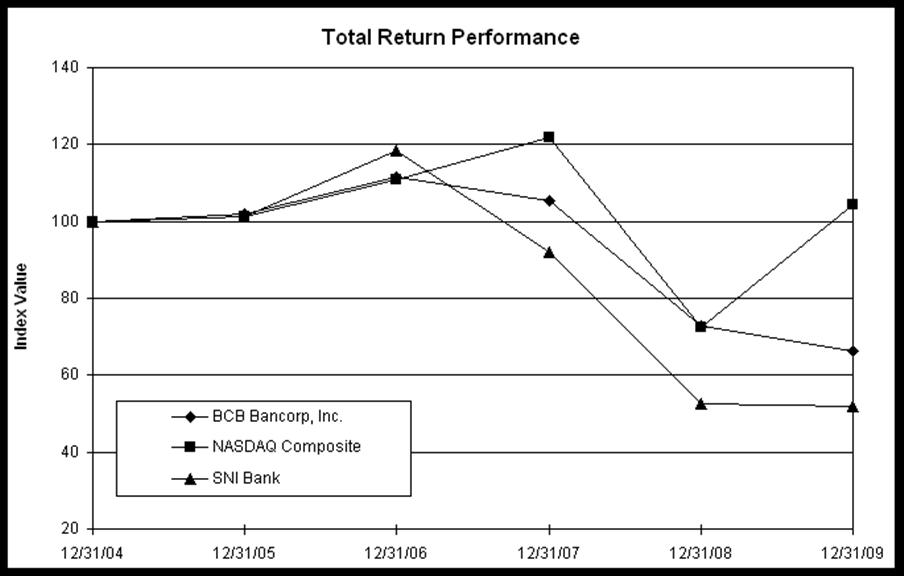
| Period Ending | ||||||||||||||||||||||||
|
Index
|
12/31/04
|
12/31/05
|
12/31/06
|
12/31/07
|
12/31/08
|
12/31/09
|
||||||||||||||||||
|
BCB
Bancorp, Inc.
|
100.00 | 101.83 | 111.57 | 105.52 | 72.68 | 66.18 | ||||||||||||||||||
|
NASDAQ
Composite
|
100.00 | 101.37 | 111.03 | 121.92 | 72.49 | 104.31 | ||||||||||||||||||
|
SNL
Bank
|
100.00 | 101.36 | 118.57 | 92.14 | 52.57 | 52.03 | ||||||||||||||||||
On November 20, 2007, the Company
announced a third stock repurchase plan to repurchase 5% or 234,002 shares of
the Company’s common stock. Set forth below is information regarding
purchases of our common stock made by or on behalf of the Company during the
fourth quarter of 2009.
|
Period
|
Total number of shares
purchased
|
Average price per share
paid
|
Total number of shares purchased as part of a
publicly announced program
|
Number of shares remaining to be purchased under
program
|
||||||||||||
|
October 1-31
|
— | $ | — | — | 133,983 | |||||||||||
|
November 1-30
|
563 | 9.10 | 563 | 133,420 | ||||||||||||
|
December 1-31
|
1,000 | 8.50 | 1,563 | 132,420 | ||||||||||||
|
Total
|
1,563 | $ | 8.72 | — | — | |||||||||||
|
ITEM
6.
|
SELECTED CONSOLIDATED
FINANCIAL DATA
|
The
following tables set forth selected consolidated historical financial and other
data of BCB Bancorp, Inc. at and for the years ended December 31, 2009, 2008,
2007, 2006 and 2005. The information is derived in part from, and
should be read together with, the audited Consolidated Financial Statements and
Notes thereto of BCB Bancorp, Inc. Per share data has been adjusted for all
periods to reflect the common stock dividends paid by the Company.
|
Selected
financial condition data at December 31,
|
||||||||||||||||||||
|
2009
|
2008
|
2007
|
2006
|
2005
|
||||||||||||||||
|
(In
Thousands)
|
||||||||||||||||||||
|
Total
assets
|
$ | 631,503 | $ | 578,624 | $ | 563,477 | $ | 510,835 | $ | 466,242 | ||||||||||
|
Cash
and cash equivalents
|
67,347 | 6,761 | 11,780 | 25,837 | 25,147 | |||||||||||||||
|
Securities,
held to maturity
|
132,644 | 141,280 | 165,017 | 148,672 | 140,002 | |||||||||||||||
|
Loans
receivable
|
401,872 | 406,826 | 364,654 | 318,130 | 284,451 | |||||||||||||||
|
Deposits
|
463,738 | 410,503 | 398,819 | 382,747 | 362,851 | |||||||||||||||
|
Borrowings
|
114,124 | 116,124 | 114,124 | 74,124 | 54,124 | |||||||||||||||
|
Stockholders’
equity
|
51,391 | 49,715 | 48,510 | 51,963 | 47,847 | |||||||||||||||
|
Selected
operating data for the year ended December 31,
|
||||||||||||||||||||
|
2009
|
2008
|
2007
|
2006
|
2005
|
||||||||||||||||
|
(In
thousands, except for per share amounts)
|
||||||||||||||||||||
|
Net
interest income
|
$ | 19,384 | $ | 19,960 | $ | 17,173 | $ | 17,784 | $ | 15,883 | ||||||||||
|
Provision
for loan losses
|
1,550 | 1,300 | 600 | 625 | 1,118 | |||||||||||||||
|
Non-interest
income (loss)
|
931 | (2,054 | ) | 1,092 | 1,260 | 915 | ||||||||||||||
|
Non-interest
expense
|
12,396 | 11,314 | 10,718 | 9,632 | 8,206 | |||||||||||||||
|
Income
tax
|
2,621 | 1,820 | 2,509 | 3,220 | 2,745 | |||||||||||||||
|
Net
income
|
$ | 3,748 | $ | 3,472 | $ | 4,438 | $ | 5,567 | $ | 4,729 | ||||||||||
|
Net
income per share:
|
||||||||||||||||||||
|
Basic
|
$ | 0.81 | $ | 0.75 | $ | 0.92 | $ | 1.11 | $ | 1.25 | ||||||||||
|
Diluted
|
$ | 0.80 | $ | 0.74 | $ | 0.90 | $ | 1.08 | $ | 1.20 | ||||||||||
|
Dividends
declared per share
|
$ | 0.48 | $ | 0.41 | $ | 0.32 | $ | 0.30 | $ | — | ||||||||||
|
At
or for the Years Ended December 31,
|
||||||||||||||||||||
|
2009
|
2008
|
2007
|
2006
|
2005
|
||||||||||||||||
|
Selected
Financial Ratios and Other Data:
|
||||||||||||||||||||
|
Return
on average assets (ratio of net income to average total
assets)
|
0.61 | % | 0.60 | % | 0.83 | % | 1.13 | % | 1.14 | % | ||||||||||
|
Return
on average stockholders’ equity (ratio of net income to average
stockholders’ equity)
|
7.34 | 7.00 | 8.86 | 11.12 | 16.00 | |||||||||||||||
|
Non-interest
income (loss) to average assets
|
0.15 | (0.36 | ) | 0.20 | 0.26 | 0.21 | ||||||||||||||
|
Non-interest
expense to average assets
|
2.03 | 1.97 | 1.99 | 1.96 | 1.98 | |||||||||||||||
|
Net
interest rate spread during the period
|
2.88 | 3.09 | 2.71 | 3.19 | 3.69 | |||||||||||||||
|
Net
interest margin (net interest income to average interest earning
assets)
|
3.24 | 3.54 | 3.26 | 3.69 | 3.98 | |||||||||||||||
|
Ratio
of average interest-earning assets to average interest-bearing
liabilities
|
114.07 | 115.05 | 116.94 | 118.09 | 112.33 | |||||||||||||||
|
Cash
dividend payout ratio
|
59.26 | 54.67 | 34.78 | 26.98 | — | |||||||||||||||
|
Asset
Quality Ratios:
|
||||||||||||||||||||
|
Non-performing
loans to total loans at end of period
|
2.92 | 0.90 | 1.16 | 0.10 | 0.36 | |||||||||||||||
|
Allowance
for loan losses to non-performing loans at end of period
|
55.68 | 142.27 | 95.13 | 1,155.73 | 299.42 | |||||||||||||||
|
Allowance
for loan losses to total loans at end of period
|
1.62 | 1.28 | 1.10 | 1.16 | 1.07 | |||||||||||||||
|
Capital
Ratios:
|
||||||||||||||||||||
|
Stockholders’
equity to total assets at end of period
|
8.14 | 8.59 | 8.61 | 10.17 | 10.26 | |||||||||||||||
|
Average
stockholders’ equity to average total assets
|
8.35 | 8.61 | 9.32 | 10.19 | 7.14 | |||||||||||||||
|
Tier
1 capital to average assets
|
8.68 | 9.22 | 8.81 | 10.91 | 7.75 | |||||||||||||||
|
Tier
1 capital to risk weighted assets
|
13.11 | 13.38 | 13.05 | 15.36 | 11.59 | |||||||||||||||
|
ITEM
7.
|
MANAGEMENT’S
DISCUSSION AND ANALYSIS OF FINANCIALCONDITION AND RESULTS OF
OPERATIONS
|
General
This
discussion, and other written material, and statements management may make, may
contain certain forward-looking statements regarding the Company’s prospective
performance and strategies within the meaning of Section 27A of the Securities
Act of 1933, as amended, and Section 21E of the Securities Exchange Act of 1934,
as amended. The Company intends such forward-looking statements to be
covered by the safe harbor provisions for forward-looking statements contained
in the Private Securities Litigation Reform Act of 1995, and is including this
statement for purposes of said safe harbor provisions.
Forward-looking
information is inherently subject to risks and uncertainties, and actual results
could differ materially from those currently anticipated due to a number of
factors, which include, but are not limited to, factors discussed in the
Company’s Annual Report on Form 10-K and in other documents filed by the Company
with the Securities and Exchange Commission. Forward-looking statements, which
are based on certain assumptions and describe future plans, strategies and
expectations of the Company, are generally identified by the use of the words
“plan,” “believe,” “expect,” “intend,” “anticipate,” “estimate,” “project,”
“may,” “will,” “should,” “could,” “predicts,” “forecasts,” “potential,” or
“continue” or similar terms or the
negative
of these terms. The Company’s ability to predict results or the
actual effects of its plans or strategies is inherently uncertain. Accordingly,
actual results may differ materially from anticipated results.
Factors
that could have a material adverse effect on the operations of the Company and
its subsidiaries include, but are not limited to, changes in market interest
rates, general economic conditions, legislation, and regulation; changes in
monetary and fiscal policies of the United States Government, including policies
of the United States Treasury and Federal Reserve Board; changes in the quality
or composition of the loan or investment portfolios; changes in deposit flows,
competition, and demand for financial services, loans, deposits and investment
products in the Company’s local markets; changes in accounting principles and
guidelines; war or terrorist activities; and other economic, competitive,
governmental, regulatory, geopolitical and technological factors affecting the
Company’s operations, pricing and services.
Readers
are cautioned not to place undue reliance on these forward-looking statements,
which speak only as of the date of this discussion. Although the
Company believes that the expectations reflected in the forward-looking
statements are reasonable, the Company cannot guarantee future results, levels
of activity, performance or achievements. Except as required by
applicable law or regulation, the Company undertakes no obligation to update
these forward-looking statements to reflect events or circumstances that occur
after the date on which such statements were made.
Critical Accounting
Policies
Critical
accounting policies are those accounting policies that can have a significant
impact on the Company’s financial position and results of operations that
require the use of complex and subjective estimates based upon past experiences
and management’s judgment. Because of the uncertainty inherent in such
estimates, actual results may differ from these estimates. Below are
those policies applied in preparing the Company’s consolidated financial
statements that management believes are the most dependent on the application of
estimates and assumptions. For additional accounting policies, see
Note 2 of “Notes to Consolidated Financial Statements.”
Allowance
for Loan Losses
Loans
receivable are presented net of an allowance for loan losses. In
determining the appropriate level of the allowance, management considers a
combination of factors, such as economic and industry trends, real estate market
conditions, size and type of loans in portfolio, nature and value of collateral
held, borrowers’ financial strength and credit ratings, and prepayment and
default history. The calculation of the appropriate allowance for
loan losses requires a substantial amount of judgment regarding the impact of
the aforementioned factors, as well as other factors, on the ultimate
realization of loans receivable.
Other-than-Temporary
Impairment of Securities
If the fair value of a security is less
than its amortized cost, the security is deemed to be impaired. Management
evaluates all securities with unrealized losses quarterly to determine if such
impairments are “temporary” or other-than-temporary” in accordance with
Accounting
Standards
Codification (“ASC”) Topic 320, Investments – Debt and Equity
Securities. Accordingly, temporary impairments are accounted for based
upon the classification of the related securities as either available for sale
or held to maturity. Temporary impairments on available for sale securities are
recognized, on a tax-effected basis, through Other Comprehensive Income (“OCI”)
with offsetting entries adjusting the carrying value of the securities and the
balance of deferred taxes. Conversely, the carrying values of held to maturity
securities are not adjusted for temporary impairments. Information concerning
the amount and duration of temporary impairments on both available for sale and
held to maturity securities is generally disclosed in the notes to the
consolidated financial statements.
Other-than-temporary
impairments are accounted for based upon several considerations. First,
other-than-temporary impairments on equity securities and on debt securities
that the Company has decided to sell as of the close of a fiscal period, or
will, more likely than not, be required to sell prior to the full recovery of
fair value to a level equal to or exceeding amortized cost, are recognized in
earnings. If neither of these conditions regarding the likelihood of the sale of
debt securities are applicable, then the other-than-temporary impairment is
bifurcated into credit-related and noncredit-related components. A
credit-related impairment generally represents the amount by which the present
value of the cash flows that are expected to be collected on a debt security
fall below its amortized cost. The noncredit-related component represents the
remaining portion of the impairment not otherwise designated as credit-related.
Credit-related, other-than-temporary impairments are recognized in earnings and
noncredit-related, other-than-temporary impairments are recognized in OCI.
Equity securities on which there is an unrealized loss that is deemed
other-than-temporary are written down to fair value with the write-down
recognized in earnings.
Financial
Condition
Comparison
at December 31, 2009 and at December 31, 2008
Since we
commenced operations in 2000 we have sought to grow our assets and deposit base
consistent with our capital requirements. We offer competitive loan and deposit
products and seek to distinguish ourselves from our competitors through our
service and availability. Total assets increased by $52.9 million or 9.1% to
$631.5 million at December 31, 2009 from $578.6 million at December 31, 2008 as
the Company continued to grow the Bank’s balance sheet through growth in the
Bank’s deposit base.
Total cash and cash equivalents
increased by $60.5 million or 889.7% to $67.3 million at December 31, 2009 from
$6.8 million at December 31, 2008 reflecting management’s decision to increase
liquid assets pending acceptable investment opportunities in either loans or
investment securities when appropriate. The increase in cash and cash
equivalents resulted primarily from proceeds received on those investment
securities whose call options were exercised by their issuing agencies.
Securities held-to-maturity decreased by $8.7 million or 6.2% to $132.6 million
at December 31, 2009 from $141.3 million at December 31, 2008. The decrease was
primarily attributable to call options exercised on $145.6 million of callable
agency securities and $9.9 million of repayments and prepayments in the mortgage
backed securities portfolio during the year ended December 31, 2009, partially
offset by purchases of $145.8 million of callable agency securities and $1.9
million in mortgage backed securities.
Loans receivable decreased by $4.9
million or 1.2% to $401.9 million at December 31, 2009 from $406.8 million at
December 31, 2008. The decrease resulted primarily from an $8.1 million decrease
in real estate mortgages comprising residential, commercial, construction and
participation loans with other financial institutions, net of amortization, a
$4.0 million increase in consumer loans, net of amortization, and a $1.3 million
increase in the allowance for loans losses, partially offset by an $8.4 million
increase in commercial loans comprising business loans and commercial lines of
credit, net of amortization. At December 31, 2009, the allowance for loan losses
was $6.6 million or 1.62% of loans receivable.
Deposit liabilities increased by $53.2
million or 13.0% to $463.7 million at December 31, 2009 from $410.5 million at
December 31, 2008. The increase resulted primarily from an increase of $15.6
million or 6.6% in time deposits to $250.6 million from $235.0 million, an
increase of $29.1 million or 38.3% in demand deposits to $105.0 million from
$75.9 million and an increase of $8.6 million or 8.6% in savings and club
accounts to $108.2 million from $99.6 million. The Bank has been able to achieve
overall growth in deposits through competitive pricing on select deposit
products.
Total borrowings decreased by $2.0
million or 1.7% to $114.1 million at December 31, 2009 from $116.1 million at
December 31, 2008. The decrease in borrowings reflects the repayment of
overnight Federal Home Loan Bank borrowings, previously used as a liquidity
source to augment deposits as a funding source for the Bank.
Total stockholders’ equity increased by
$1.7 million or 3.4% to $51.4 million at December 31, 2009 from $49.7 million at
December 31, 2008. The increase in stockholders’ equity primarily reflects net
income of $3.75 million for the year ended December 31, 2009 and the exercise of
stock options during the year to purchase 11,933 shares of the Company’s common
stock for a total of approximately $63,000, partially offset by the repurchase
of 4,072 shares of the Company’s common stock in the stock repurchase plans in
place and undertaken during the year totaling $39,000 and cash dividends paid to
shareholders during the year totaling $2.2 million. At December 31, 2009 the
Bank’s Tier 1 leverage, Tier 1 risk-based and Total risk-based capital ratios
were 8.68%, 13.11%, and 14.37% respectively.
Analysis of Net Interest
Income
Net
interest income is the difference between interest income on interest-earning
assets and interest expense on interest-bearing liabilities. Net
interest income depends on the relative amounts of interest-earning assets and
interest-bearing liabilities and the interest rates earned or paid on them,
respectively.
The
following tables set forth balance sheets, average yields and costs, and certain
other information for the periods indicated. All average balances are
daily average balances. The yields set forth below include the effect
of deferred fees, discounts and premiums, which are included in interest
income.
|
At December 31, 2009
|
Year ended December 31,
2009
|
Year ended December 31,
2008
|
||||||||||||||||||||||||||||||
|
Actual
Balance
|
Actual
Yield/
Cost
|
Average
Balance
|
Interest
earned/paid
|
Average
Yield/
Cost (5)
|
Average
Balance
|
Interest earned/paid
|
Average
Yield/
Cost (5)
|
|||||||||||||||||||||||||
|
Interest-earning
assets:
|
(Dollars
in Thousands)
|
|||||||||||||||||||||||||||||||
|
Loans
receivable (1)
|
$ | 412,791 | 6.63 | % | $ | 412,297 | $ | 27,349 | 6.63 | % | $ | 393,198 | $ | 27,248 | 6.96 | % | ||||||||||||||||
|
Investment
securities(2)
|
139,704 | 4.69 | 139,150 | 6,982 | 5.02 | 161,281 | 9,185 | 5.70 | ||||||||||||||||||||||||
|
Interest-earning
deposits
|
63,760 | 0.07 | 47,365 | 47 | 0.10 | 10,034 | 190 | 1.89 | ||||||||||||||||||||||||
|
Total
interest-earning assets
|
616,255 | 5.51 | % | 598,812 | 34,378 | 5.74 | % | 564,513 | 36,623 | 6.49 | % | |||||||||||||||||||||
|
Interest-earning
liabilities:
|
||||||||||||||||||||||||||||||||
|
Interest-bearing
demand deposits
|
$ | 34,270 | 1.23 | % | $ | 32,287 | $ | 395 | 1.22 | % | $ | 23,930 | $ | 300 | 1.25 | % | ||||||||||||||||
|
Money
market deposits
|
33,656 | 1.48 | 24,885 | 482 | 1.94 | 26,697 | 746 | 2.79 | ||||||||||||||||||||||||
|
Savings
deposits
|
108,170 | 1.10 | 103,406 | 1,157 | 1.12 | 100,754 | 1,370 | 1.36 | ||||||||||||||||||||||||
|
Certificates
of deposit
|
250,560 | 2.57 | 250,221 | 7,984 | 3.19 | 220,375 | 9,106 | 4.13 | ||||||||||||||||||||||||
|
Borrowings
|
114,124 | 4.28 | 114,162 | 4,976 | 4.36 | 118,920 | 5,141 | 4.32 | ||||||||||||||||||||||||
|
Total
interest-bearing liabilities
|
540,780 | 2.48 | % | 524,961 | 14,994 | 2.86 | % | 490,676 | 16,663 | 3.40 | % | |||||||||||||||||||||
|
Net
interest income
|
$ | 19,384 | $ | 19,960 | ||||||||||||||||||||||||||||
|
Interest
rate spread(3)
|
3.03 | % | 2.88 | % | 3.09 | % | ||||||||||||||||||||||||||
|
Net
interest margin(4)
|
3.24 | % | 3.54 | % | ||||||||||||||||||||||||||||
|
Ratio
of interest-earning assets to interest-bearing liabilities
|
113.96 | % | 114.07 | % | 115.05 | % | ||||||||||||||||||||||||||
|
___________________________
|
|
(1)
|
Excludes
allowance for loan losses.
|
|
(2)
|
Includes
Federal Home Loan Bank of New York
stock.
|
|
(3)
|
Interest
rate spread represents the difference between the average yield on
interest-earning assets and the average cost of interest-bearing
liabilities.
|
|
(4)
|
Net
interest margin represents net interest income as a percentage of average
interest-earning assets.
|
|
(5)
|
Average
yields are computed using annualized interest income and expense for the
periods.
|
|
Year ended December 31,
2007
|
||||||||||||
|
Average
Balance
|
Interest
earned/paid |
Average
Yield/
Cost (5) |
||||||||||
|
(Dollars
in Thousands)
|
||||||||||||
|
Interest-earning
assets:
|
||||||||||||
|
Loans
receivable (1)
|
$ | 339,057 | $ | 24,365 | 7.19 | % | ||||||
|
Investment
securities(2)
|
161,707 | 8,843 | 5.47 | |||||||||
|
Interest-earning
deposits
|
26,010 | 1,182 | 4.54 | |||||||||
|
Total
interest-earning assets
|
526,774 | 34,390 | 6.53 | % | ||||||||
|
Interest-earning
liabilities:
|
||||||||||||
|
Interest-bearing
demand deposits
|
$ | 21,076 | $ | 294 | 1.40 | % | ||||||
|
Money
market deposits
|
17,212 | 712 | 4.14 | |||||||||
|
Savings
deposits
|
108,921 | 1,866 | 1.71 | |||||||||
|
Certificates
of deposit
|
209,828 | 10,109 | 4.82 | |||||||||
|
Borrowings
|
93,412 | 4,236 | 4.54 | |||||||||
|
Total
interest-bearing liabilities
|
450,449 | 17,217 | 3.82 | % | ||||||||
|
Net
interest income
|
$ | 17,173 | ||||||||||
|
Interest
rate spread(3)
|
2.71 | % | ||||||||||
|
Net
interest margin(4)
|
3.26 | % | ||||||||||
|
Ratio
of interest-earning assets to interest-bearing liabilities
|
116.94 | % | ||||||||||
|
_____________________________
|
|
(1)
|
Excludes
allowance for loan losses.
|
|
(2)
|
Includes
Federal Home Loan Bank of New York
stock.
|
|
(3)
|
Interest
rate spread represents the difference between the average yield on
interest-earning assets and the average cost of interest-bearing
liabilities.
|
|
(4)
|
Net
interest margin represents net interest income as a percentage of average
interest-earning assets.
|
|
(5)
|
Average
yields are computed using annualized interest income and expense for the
periods.
|
Rate/Volume
Analysis
The table
below sets forth certain information regarding changes in our interest income
and interest expense for the periods indicated. For each category of
interest-earning assets and interest-bearing liabilities, information is
provided on changes attributable to (i) changes in average volume (changes in
average volume multiplied by old rate); (ii) changes in rate (change in rate
multiplied by old average volume); (iii) changes due to combined changes in rate
and volume; and (iv) the net change.
|
Years Ended
December 31,
|
||||||||||||||||||||||||||||||||
|
2009 vs. 2008
|
2008 vs. 2007
|
|||||||||||||||||||||||||||||||
|
Increase/(Decrease)
|
Increase/(Decrease)
|
|||||||||||||||||||||||||||||||
|
Due to
|
Total
|
Due to
|
Total
|
|||||||||||||||||||||||||||||
|
Rate/
|
Increase
|
Rate/
|
Increase
|
|||||||||||||||||||||||||||||
|
Volume
|
Rate
|
Volume
|
(Decrease)
|
Volume
|
Rate
|
Volume
|
(Decrease)
|
|||||||||||||||||||||||||
|
(In
Thousands)
|
||||||||||||||||||||||||||||||||
|
Interest
income:
|
||||||||||||||||||||||||||||||||
|
Loans
receivable
|
$ | 1,156 | (1,147 | ) | (48 | ) | (39 | ) | $ | 3,891 | $ | (869 | ) | $ | (139 | ) | $ | 2,883 | ||||||||||||||
|
Investment
securities
|
(1,123 | ) | (1,071 | ) | 131 | (2,063 | ) | (23 | ) | 366 | (1 | ) | 342 | |||||||||||||||||||
|
Interest-earning
deposits with other banks
|
707 | (180 | ) | (670 | ) | (143 | ) | (726 | ) | (689 | ) | 423 | (992 | ) | ||||||||||||||||||
|
Total
interest-earning assets
|
740 | (2,398 | ) | (587 | ) | (2,245 | ) | 3,142 | (1,192 | ) | 283 | 2,233 | ||||||||||||||||||||
|
Interest
expense:
|
||||||||||||||||||||||||||||||||
|
Interest-bearing
demand accounts
|
105 | (7 | ) | (3 | ) | 95 | 40 | (30 | ) | (4 | ) | 6 | ||||||||||||||||||||
|
Money
market
|
(51 | ) | (229 | ) | 16 | (264 | ) | 392 | (231 | ) | (127 | ) | 34 | |||||||||||||||||||
|
Savings
and club
|
36 | (243 | ) | (6 | ) | (213 | ) | (140 | ) | (385 | ) | 29 | (496 | ) | ||||||||||||||||||
|
Certificates
of Deposits
|
1,233 | (2,074 | ) | (281 | ) | (1,122 | ) | 508 | (1,439 | ) | (72 | ) | (1,003 | ) | ||||||||||||||||||
|
Borrowed
funds
|
(205 | ) | 42 | (2 | ) | (165 | ) | 1,157 | (198 | ) | (54 | ) | 905 | |||||||||||||||||||
|
Total
interest-bearing liabilities
|
1,118 | (2,511 | ) | (276 | ) | (1,669 | ) | 1,957 | (2,283 | ) | (228 | ) | (554 | ) | ||||||||||||||||||
|
Change
in net interest income
|
$ | (378 | ) | $ | 113 | $ | (311 | ) | $ | (576 | ) | $ | 1,185 | $ | 1,091 | $ | 511 | $ | 2,787 | |||||||||||||
Results
of Operations for the Years Ended December 31, 2009 and 2008
Net
income increased by $276,000 or 8.0% to $3.75 million for the year ended
December 31, 2009 from $3.47 million for the year ended December 31, 2008. The
increase in net income resulted primarily from an increase in non-interest
income (loss), partially offset by a decrease in net interest income and
increases in the provision for loan losses, non-interest expense and income
taxes. Net interest income decreased by $576,000 or 2.9% to $19.4 million for
the year ended December 31, 2009 from $20.0 million for the year ended December
31, 2008. The decrease in net interest income resulted primarily from a decrease
in the average yield on interest earning assets to 5.74% for the year ended
December 31, 2009 from 6.49% for the year ended December 31, 2008, partially
offset by an increase of $34.3 million or 6.1% in the average balance of
interest earning assets to $598.8 million for the year ended December 31, 2009
from $564.5 million for the year ended December 31, 2008. The average balance of
interest bearing liabilities increased by $34.3 million or 7.0% to $525.0
million at December 31, 2009 from $490.7 million at December 31, 2008 while the
average cost of interest bearing liabilities decreased to 2.86% for the year
ended December 31, 2009 from 3.40% for the year ended December 31, 2008. As a
result of the aforementioned, our net interest margin decreased to 3.24% for the
year ended December 31, 2009 from 3.54% for the year ended December 31,
2008.
The increase in non-interest income
(loss) resulted primarily from the absence of the other than temporary
impairment (OTTI) charge of $2.9 million on a $3.0 million investment in Federal
National Mortgage Association (FNMA) preferred stock which occurred during the
year ended December 31, 2008. The increase in non-interest expense resulted
primarily from merger related expenses relating to the business combination
transaction with Pamrapo Bancorp, Inc. It is anticipated that this transaction
will be completed by the end of the second quarter of 2010. Additionally, there
was an increase in our FDIC assessments due to a one-time special FDIC
assessment which totaled $282,000 for the Bank that all financial institutions
were required to pay during the third quarter of 2009 and an increase in FDIC
assessment rates during the year ended December 31, 2009.
Interest
income on loans receivable increased by $101,000 or 0.4% to $27.3 million for
the year ended December 31, 2009 from $27.2 million for the year ended December
31, 2008. The increase was primarily due to an increase in average loans
receivable of $19.1 million or 4.9% to $412.3 million for the year ended
December 31, 2009 from $393.2 million for the year ended December 31, 2008,
partially offset by a decrease in the average yield on loans receivable to 6.63%
for the year ended December 31, 2009 from 6.96% for the year ended December 31,
2008. The increase in the average balance of loans reflects management’s
philosophy of deploying funds in higher yielding instruments, specifically
commercial real estate loans, in an effort to achieve higher returns. The
decrease in average yield reflects the competitive price environment prevalent
in the Bank’s primary market area for commercial and construction loans as well
as the effect of the actions taken by the Federal Open Market Committee to
maintain interest rates at their diminished levels during 2009.
Interest income on securities decreased
by $2.2 million or 23.9% to $7.0 million for the year ended December 31, 2009
from $9.2 million for the year ended December 31, 2008. The decrease was
primarily attributable to a decrease in the average balance of securities of
$22.1 million or 13.7% to $139.2 million for the year ended December 31, 2009
from $161.3 million for the year ended December 31, 2008 and a decrease in the
average yield on securities to 5.02% for the year ended December 31, 2009 from
5.70% for the year ended December 31, 2008. The decrease in average balances
reflects the issuing agencies decision to exercise their call options on a
select number of securities which resulted in decreases to the investment
portfolio. The decrease in average yield reflects the lower interest rate
environment prevalent for investment securities for the year ended December 31,
2009.
Interest income on other
interest-earning assets consisting primarily of interest earning demand deposits
decreased by $143,000 or 75.3% to $47,000 for the year ended December 31, 2009
from $190,000 for the year ended December 31, 2008. This decrease was primarily
due to a decrease in the average yield on other interest-earning assets to 0.10%
for the year ended December 31, 2009 from 1.89% for the year ended December 31,
2008, partially offset by an increase in the average balance of other interest
earning assets of $37.4 million or 374.0% to $47.4 million for the year ended
December 31, 2009 from $10.0 million for the year ended December 31,
2008.
Total interest expense decreased by
$1.7 million or 10.2% to $15.0 million for the year ended December 31, 2009 from
$16.7 million for the year ended December 31, 2008. This
decrease
resulted primarily from a decrease in the average cost of interest bearing
liabilities to 2.86% for the year ended December 31, 2009 from 3.40% for the
year ended December 31, 2008 and a decrease in the average balance of average
borrowings of $4.7 million or 4.0% to $114.2 million for the year ended December
31, 2009 from $118.9 million for the year ended December 31, 2008, partially
offset by an increase in the average balance of total interest bearing deposit
liabilities of $39.0 million or 10.5% to $410.8 million for the year ended
December 31, 2009 from $371.8 million for the year ended December 31,
2008.
The provision for loan losses totaled
$1.55 million and $1.30 million for the years ended December 31, 2009 and 2008,
respectively. The provision for loan losses is established based upon
management’s review of the Bank’s loans and consideration of a variety of
factors including, but not limited to, (1) the risk characteristics of the loan
portfolio, (2) current economic conditions, (3) actual losses previously
experienced, (4) the significant level of loan growth and (5) the existing level
of reserves for loan losses that are probable and estimable. During 2009, the
Bank experienced $210,000 in net charge-offs (consisting of $212,000 in
charge-offs and $2,000 in recoveries). During 2008, the Bank experienced $61,000
in net charge-offs (consisting of $101,000 in charge-offs and $40,000 in
recoveries). The Bank had non-accrual loans totaling $11.9 million at December
31, 2009 and $3.7 million at December 31, 2008. The allowance for loan losses
stood at $6.6 million or 1.62% of gross total loans at December 31, 2009 as
compared to $5.3 million or 1.28% of gross total loans at December 31, 2008. The
amount of the allowance is based on estimates and the ultimate losses may vary
from such estimates. Management assesses the allowance for loan losses on a
quarterly basis and makes provisions for loan losses as necessary in order to
maintain the adequacy of the allowance. While management uses available
information to recognize loses on loans, future loan loss provisions may be
necessary based on changes in the aforementioned criteria. In addition, various
regulatory agencies, as an integral part of their examination process,
periodically review the allowance for loan losses and may require the Bank to
recognize additional provisions based on their judgment of information available
to them at the time of their examination. Management believes that the allowance
for loan losses was adequate at both December 31, 2009 and 2008.
We had total non-interest income of
$931,000 for the year ended December 31, 2009 compared to a loss of $2.1 million
for the year ended December 31, 2008. The increase in non-interest income
resulted primarily from the absence of the OTTI charge of $2.9 million on a $3.0
million investment in FNMA preferred stock which occurred during the year ended
December 31, 2008, as well as an $88,000 increase in gain on sales of loans
originated for sale to $225,000 for the year ended December 31, 2009 from
$137,000 for the year ended December 31, 2008, and a $12,000 increase in gain on
sale of real estate owned, partially offset by a decrease of $30,000 or 4.1% in
fees, service charges and other income to $693,000 for the year ended December
31, 2009 from $723,000 for the year ended December 31, 2008. The increase in
gain on sale of loans originated for sale reflects the lower interest rate
environment for the refinancing of one-to four-family residential real estate
properties during 2009.
Total non-interest expense increased by
$1.1 million or 9.7% to $12.4 million for the year ended December 31, 2009 from
$11.3 million for the year ended December 31, 2008. The increase in non-interest
expense resulted primarily from an increase in merger related expenses of
$476,000 or 276.7% to $648,000 for the year ended December 31, 2009, from
$172,000 for
the year
ended December 31, 2008 relating to the business combination transaction with
Pamrapo Bancorp, Inc. It is anticipated that this transaction will be completed
by the end of the second quarter of 2010. Salaries and employee benefits expense
decreased by $89,000 or 1.6% to $5.4 million for the year ended December 31,
2009 from $5.5 million for the year ended December 31, 2008. This decrease
occurred despite a slight increase in full time equivalent employees to
eighty-eight (88) at December 31, 2009 from eighty-five (85) at December 31,
2008 and from ninety-three (93) at December 31, 2007. Occupancy expense
increased by $63,000 or 5.9% to $1.12 million for the year ended December 31,
2009 from $1.06 million for the year ended December 31, 2008. Equipment expense
increased by $105,000 or 5.2% to $2.1 million for the year ended December 31,
2009 from $2.0 million for the year ended December 31, 2008. The primary
component of this expense item is data service provider expense which increases
with the growth of the Bank’s assets. Advertising expense increased by $32,000
or 13.3% to $273,000 for the year ended December 31, 2009 from $241,000 for the
year ended December 31, 2008. Professional fees increased by $146,000 or 45.8%
to $465,000 for the year ended December 31, 2009 from $319,000 for the year
ended December 31, 2008. The increase in professional fees resulted primarily
from an increase in legal fees in conjunction with various representations of
legal issues encountered in the normal course of a growing franchise. Directors’
fees increased by $44,000 or 12.5% to $395,000 for the year ended December 31,
2009 from $351,000 for the year ended December 31, 2008. Regulatory assessments
increased by $841,000 to $1.1 million for the year ended December 31, 2009 from
$296,000 for the year ended December 31, 2008. This increase occurred primarily
as a result of an increase in FDIC assessment rates during 2009 and a special
one-time assessment which totaled $282,000 that all financial institutions were
required to pay during the third quarter of 2009. Other non-interest expense
increased by $24,000 or 3.0% to $829,000 for the year ended December 31, 2009
from $805,000 for the year ended December 31, 2008. Other non-interest expense
is comprised of stationary, forms and printing, check printing, correspondent
bank fees, telephone and communication, shareholder relations and other fees and
expenses.
Income tax expense increased by
$801,000 or 44.0% to $2.62 million for the year ended December 31, 2009 from
$1.82 million for the year ended December 31, 2008 reflecting increased pre-tax
income earned during 2009. The consolidated effective income tax rate for the
year ended December 31, 2009 was 41.2% and for the year ended December 31, 2008
was 34.4%. The increase in the consolidated effective income tax rate relates
primarily to the increase of merger related expenses of $476,000 or 276.7% to
$648,000 for the year ended December 31, 2009 from $172,000 for the year ended
December 31, 2008 and the lack of deductibility for a portion of these expenses
for income tax purposes.
Results
of Operations for the Years Ended December 31, 2008 and 2007
Net income decreased by $970,000 or
21.8% to $3.47 million for the year ended December 31, 2008 from $4.44 million
for the year ended December 31, 2007. The decrease in net income resulted
primarily from a decrease in non-interest income and increases in the provision
for loan losses and non-interest expense, partially offset by an increase in net
interest income and a decrease in income taxes. Net interest income increased by
$2.8 million or 16.3% to $20.0 million for the year ended December 31, 2008 from
$17.2 million for the year ended December 31, 2007. The increase in net interest
income resulted primarily from an increase of
$37.7
million or 7.2% in the average balance of interest earning assets to $564.5
million for the year ended December 31, 2008 from $526.8 million for the year
ended December 31, 2007 and an increase in the average yield on interest earning
assets to 6.49% for the year ended December 31, 2008 from 6.53% for the year
ended December 31, 2007. The average balance of interest bearing liabilities
increased by $40.3 million or 8.9% to $490.7 million at December 31, 2008 from
$450.4 million at December 31, 2007 while the average cost of interest bearing
liabilities decreased to 3.40% for the year ended December 31, 2008 from 3.82%
for the year ended December 31, 2007. As a result of the aforementioned, our net
interest margin increased to 3.54% for the year ended December 31, 2008 from
3.26% for the year ended December 31, 2007.
The decrease in non-interest income
resulted primarily from an OTTI charge of $2.9 million on a $3.0 million
investment in FNMA preferred stock. The increase in non-interest expense
reflected a change to income resulting from the discovery of a deposit fraud
scheme by a commercial client of the Bank. The Bank recorded a $560,000 loss in
other non-interest expense related to this incident. The Bank and Company
anticipate that any future recoveries may partially offset this loss; however
there can be no assurance of the level or probability of any recovery. The Bank
and the Company have notified its insurance carriers.
Interest income on loans receivable
increased by $2.8 million or 11.5% to $27.2 million for the year ended December
31, 2008 from $24.4 million for the year ended December 31, 2007. The increase
was primarily due to an increase in average loans receivable of $54.1 million or
16.0% to $393.2 million for the year ended December 31, 2008 from $339.1 million
for the year ended December 31, 2007, partially offset by a decrease in the
average yield on loans receivable to 6.96% for the year ended December 31, 2008
from 7.19% for the year ended December 31, 2007. The increase in the average
balance of loans reflects management’s philosophy of deploying funds in higher
yielding instruments, specifically commercial real estate loans, in an effort to
achieve higher returns. The decrease in average yield reflects the competitive
price environment prevalent in the Bank’s primary market area for commercial and
construction loans as well as the effect of the actions taken by the Federal
Open Market Committee to reduce interest rates during 2008.
Interest income on securities increased
by $342,000 or 3.9% to $9.2 million for the year ended December 31, 2008 from
$8.8 million for the year ended December 31, 2007. The increase was primarily
attributable to an increase in the average yield on securities to 5.70% for the
year ended December 31, 2008 from 5.47% for the year ended December 31, 2007,
partially offset by a slight decrease in the average balance of securities of
$426,000 or 0.3% to $161.3 million for the year ended December 31, 2008 from
$161.7 million for the year ended December 31, 2007. The decrease in average
balances reflects the issuing agencies decision to exercise their call options
on a select number of securities which resulted in decreases to the investment
portfolio. The increase in average yield reflects the fact that the exercise of
call options discussed above occurred on seasoned securities whose yield was
less than those securities remaining in the investment portfolio.
Interest income on other
interest-earning assets consisting primarily of federal funds sold decreased by
$992,000 or 83.9% to $190,000 for the year ended December 31, 2008 from
$1.2
million
for the year ended December 31, 2007. This decrease was primarily due to an
decrease in the average balance of other interest-earning assets of $16.0
million or 61.5% to $10.0 million for the year ended December 31, 2008 from
$26.0 million for the year ended December 31, 2007 and a decrease in the average
yield on other interest-earning assets to 1.89% for the year ended December 31,
2008 from 4.54% for the year ended December 31, 2007. As a result of the lower
interest rate environment for overnight deposits during the year ended December
31, 2008, a decrease in the average balance resulted, as management deployed
funds into loans in an effort to achieve higher returns.
Total interest expense decreased by
$554,000 or 3.2% to $16.7 million for the year ended December 31, 2008 from
$17.2 million for the year ended December 31, 2007. This decrease resulted
primarily from a decrease in the average cost of interest bearing liabilities to
3.40% for the year ended December 31, 2008 from 3.82% for the year ended
December 31, 2007, partially offset by an increase in the balance of total
interest bearing deposit liabilities of $14.8 million or 4.1% to $371.8 million
for the year ended December 31, 2008 from $357.0 million for the year ended
December 31, 2007, and an increase in the balance of average borrowings of $25.5
million or 27.3% to $118.9 million for the year ended December 31, 2008, from
$93.4 million for the year ended December 31, 2007.
The provision for loan losses totaled
$1.3 million and $600,000 for the years ended December 31, 2008 and 2007,
respectively. The provision for loan losses is established based upon
management’s review of the Bank’s loans and consideration of a variety of
factors including, but not limited to, (1) the risk characteristics of the loan
portfolio, (2) current economic conditions, (3) actual losses previously
experienced, (4) the significant level of loan growth and (5) the existing level
of reserves for loan losses that are probable and estimable. During 2008, the
Bank experienced $61,000 in net charge-offs (consisting of $101,000 in
charge-offs and $40,000 in recoveries). During 2007, the Bank experienced
$268,000 in net charge-offs (consisting of $285,000 in charge-offs and $17,000
in recoveries). The Bank had non-accrual loans totaling $3.7 million at December
31, 2008 and $3.8 million at December 31, 2007. The allowance for loan losses
stood at $5.3 million or 1.28% of gross total loans at December 31, 2008 as
compared to $4.1 million or 1.10% of gross total loans at December 31, 2007. The
amount of the allowance is based on estimates and the ultimate losses may vary
from such estimates. Management assesses the allowance for loan losses on a
quarterly basis and makes provisions for loan losses as necessary in order to
maintain the adequacy of the allowance. While management uses available
information to recognize loses on loans, future loan loss provisions may be
necessary based on changes in the aforementioned criteria. In addition, various
regulatory agencies, as an integral part of their examination process,
periodically review the allowance for loan losses and may require the Bank to
recognize additional provisions based on their judgment of information available
to them at the time of their examination. Management believes that the allowance
for loan losses was adequate at both December 31, 2008 and 2007.
Total non-interest income decreased by
$3.2 million to a loss of $2.1 million for the year ended December 31, 2008 from
income of $1.1 million for the year ended December 31, 2007. The decrease in
non-interest income resulted primarily from an OTTI charge of $2.9 million on a
$3.0 million investment in FNMA preferred stock as well as a $283,000 decrease
in gain on sales of loans originated for sale to $137,000 for the year ended
December 31, 2008 from $420,000 for
the year
ended December 31, 2007, and a $12,000 decrease in gain on sale of real estate
owned, partially offset by a $64,000 or 9.7% increase in fees, service charges
and other income to $723,000 for the year ended December 31, 2008 from $659,000
for the year ended December 31, 2007. The decrease in gain on sale of loans
originated for sale reflects the softening one-to four-family residential real
estate market during 2008.
Total non-interest expense increased by
$596,000 or 5.6% to $11.3 million for the year ended December 31, 2008 from
$10.7 million for the year ended December 31, 2007. The increase in non-interest
expense resulted primarily from the discovery of a deposit fraud scheme by a
commercial client of the Bank during 2008. The Bank recorded a $560,000 loss
related to this incident. The Bank and Company anticipate that future recoveries
may partially offset this loss; however there can be no assurance of the level
or probability of any recovery. The Bank and the Company have notified its
insurance carrier. Salaries and employee benefits expense decreased by $207,000
or 3.6% to $5.5 million for the year ended December 31, 2008 from $5.7 million
for the year ended December 31, 2007. This decrease resulted from a decrease in
full time equivalent employees to eighty-five (85) at December 31, 2008 from
ninety-three (93) at December 31, 2007 and from eighty-seven (87) at December
31, 2006. Occupancy expense increased by $59,000 or 5.9% to $1.1 million for the
year ended December 31, 2008 from $1.0 million for the year ended December 31,
2007. Equipment expense increased by $113,000 or 5.9% to $2.0 million for the
year ended December 31, 2008 from $1.9 million for the year ended December 31,
2007. The primary component of this expense item is data service provider
expense which increases with the growth of the Bank’s assets. Advertising
expense decreased by $85,000 or 26.1% to $241,000 for the year ended December
31, 2008 from $326,000 for the year ended December 31, 2007. Professional fees
increased by $60,000 or 23.2% to $319,000 for the year ended December 31, 2008
from $259,000 for the year ended December 31, 2007. Directors’ fees increased by
$86,000 or 32.5% to $351,000 for the year ended December 31, 2008 from $265,000
for the year ended December 31, 2007. The increase in directors’ fees is
primarily attributable to the institution of a retainer paid to the directorate
of the Holding Company in the year ended December 31, 2008, compared to no such
payment in the year ended December 31, 2007. Regulatory assessments increased by
$63,000 or 27.0% to $296,000 for the year ended December 31, 2008 from $233,000
for the year ended December 31, 2007. The primary reason for the increase in
regulatory assessments is due to the increase in the deposit base upon which the
assessment is predicated. Other non-interest expense decreased by $225,000 or
21.8% to $805,000 for the year ended December 31, 2008 from $1.0 million for the
year ended December 31, 2007. The decrease in other non-interest expense is
primarily attributable to the fact that increased expenses were realized during
the year ended December 31, 2007 with the opening of our fourth office in
Hoboken, while no such additional expense was necessary during the year ended
December 31, 2008. Other non-interest expense is comprised of stationary, forms
and printing, check printing, correspondent bank fees, telephone and
communication, shareholder relations and other fees and expenses.
Income tax expense decreased $689,000
or 27.5% to $1.8 million for the year ended December 31, 2008 from $2.5 million
for the year ended December 31, 2007 reflecting decreased pre-tax income earned
during the former time period. The consolidated effective income tax rate for
the year ended December 31, 2008 was 34.4% and for the year ended December 31,
2007 was 36.1%.
Liquidity and Capital
Resources
Our
funding sources include income from operations, deposits and borrowings and
principal payments on loans and investment securities. While
maturities and scheduled amortization of loans and securities are predictable
sources of funds, deposit outflows and mortgage prepayments are greatly
influenced by the general level of interest rates, economic conditions and
competition.
Our
primary investing activities are the origination of commercial and multi-family
real estate loans, one- to four-family mortgage loans, construction, commercial
business and consumer loans, as well as the purchase of mortgage-backed and
other investment securities. During 2009 loan originations totaled $90.4 million
compared to $110.7 million and $142.5 million for 2008 and 2007, respectively.
Management continues to emphasize prudent loan origination policies and
practices as it continues its efforts to increase total assets by emphasizing
the origination of commercial and multi-family lending operations.
During
2009, cash flow provided by the calls, maturities and principal repayments and
prepayments received on securities held-to-maturity amounted to $155.6 million
compared to $84.4 million and $21.0 million in 2008 and 2007. Deposit growth
provided $53.2 million, $11.7 million and $16.1 million of funding to facilitate
asset growth for the years ending December 31, 2009, 2008 and 2007,
respectively. Borrowings decreased $2.0 million in 2009 with the
repayment of $2.0 million of short-term borrowings through the
FHLB.
Loan
Commitments. In the ordinary course of business the Bank
extends commitments to originate residential and commercial loans and other
consumer loans. Commitments to extend credit are agreements to lend to a
customer as long as there is no violation of any condition established in the
contract. Commitments generally have fixed expiration dates or other
termination clauses and may require payment of a fee. Since the Bank
does not expect all of the commitments to be funded, the total commitment
amounts do not necessarily represent future cash requirements. The
Bank evaluates each customer’s creditworthiness on a case-by-case basis.
Collateral may be obtained based upon management’s assessment of the customers’
creditworthiness. Commitments to extend credit may be written on a
fixed rate basis exposing the Bank to interest rate risk given the possibility
that market rates may change between the commitment date and the actual
extension of credit. The Bank had outstanding commitments to
originate and fund loans of approximately $25.0 million and $46.1 million at
December 31, 2009 and 2008, respectively.
The
following table sets forth our contractual obligations and commercial
commitments at December 31, 2009.
|
Payments
due by period
|
||||||||||||||||||||
|
Contractual
obligations
|
Total
|
Less
than 1 Year
|
1-3
Years
|
More
than 3-5
Years
|
More
than 5 Years
|
|||||||||||||||
|
(In
Thousands)
|
||||||||||||||||||||
|
Borrowed
money
|
$ | 114,124 | $ | — | $ | — | $ | — | $ | 114,124 | ||||||||||
|
Lease
obligations
|
3,872 | 366 | 481 | 330 | 2,695 | |||||||||||||||
|
Certificates
of deposit
|
250,560 | 194,689 | 21,144 | 34,676 | 51 | |||||||||||||||
|
Total
|
$ | 368,556 | $ | 195,055 | $ | 21,625 | $ | 35,006 | $ | 116,870 | ||||||||||
Recent Accounting
Pronouncements
In June
2009, the FASB issued guidance on accounting for transfers of financial assets.
This guidance prescribes the information that a reporting entity must provide in
its financial reports about a transfer of financial assets; the effects of a
transfer on its financial position, financial performance and cash flows; and a
transferor’s continuing involvement in transferred financial assets.
Specifically, among other aspects, this guidance amends accounting for transfers
and servicing of financial assets and extinguishments of liabilities, by
removing the concept of a qualifying special-purpose entity and removes the
exception from applying guidance on the variable interest entities that are
qualifying special-purpose entities. It also modifies the financial-components
approach and is effective for fiscal years beginning after November 15, 2009.
The adoption of this guidance is not expected to have a material impact on our
consolidated financial statements.
In June
2009, the FASB issued guidance on the consolidation of variable interest
entities to require an enterprise to determine whether it’s variable interest or
interests give it a controlling financial interest in a variable interest
entity. The primary beneficiary of a variable interest entity is the enterprise
that has both (1) the power to direct the activities of a variable interest
entity that most significantly impact the entity’s economic performance and (2)
the obligation to absorb losses of the entity that could potentially be
significant to the variable interest entity or the right to receive benefits
from the entity that could potentially be significant to the variable interest
entity. This guidance also requires ongoing reassessments of whether an
enterprise is the primary beneficiary of a variable interest entity. This
guidance is effective for fiscal years beginning after November 15, 2009. The
adoption of this guidance is not expected to have a material impact on our
consolidated financial statements.
In August
2009, the FASB issued ASU 2009-05, Fair Value Measurements and
Disclosures (Topic 820): Measuring Liabilities at Fair
Value. The amendments within ASU 2009-05 clarify that in
circumstances in which a quoted price in an active market for the identical
liability is not available, a reporting entity is required to measure fair value
using one or more of the following techniques: (1) A valuation technique that
uses: (a) the quoted price of the identical liability when traded as an asset,
or (b) quoted prices for similar liabilities or similar liabilities when traded
as assets or another valuation technique that is consistent with the principles
of Topic 820. Two examples would be an income approach, such as a present value
technique, or a market approach, such as a technique that is based on the amount
at the measurement date that the reporting entity would pay to transfer the
identical liability or would receive to enter into the
identical
liability. When estimating the fair value of a liability, a reporting entity is
not required to include a separate input or adjustment to other inputs relating
to the existence of a restriction that prevents the transfer of the liability.
Both a quoted price in an active market for the identical liability at the
measurement date and the quoted price for the identical liability when traded as
an asset in an active market when no adjustments to the quoted price of the
asset are required are Level 1 fair value measurements. This guidance is
effective for the first reporting period (including interim periods) beginning
after issuance. The adoption of this ASU did not have a material impact on our
consolidated financial statements.
In
October 2009, the FASB issued ASU 2009-15, Accounting for Own-Share Lending
Arrangements in Contemplation of Convertible Debt Issuance or Other
Financing. The ASU amends ASC Topic 470 and provides guidance
for accounting and reporting for own-share lending arrangements issued in
contemplation of a convertible debt issuance. At the date of
issuance, a share-lending arrangement entered into on an entity’s own shares
should be measured at fair value in accordance with Topic 820 and recognized as
an issuance cost, with an offset to additional paid-in
capital. Loaned shares are excluded from basic and diluted earnings
per share unless default of the share-lending arrangement occurs. The
amendments also require several disclosures including a description and the
terms of the arrangement and the reason for entering into the
arrangement. The effective dates of the amendments are dependent upon
the date the share-lending arrangement was entered into and include
retrospective application for arrangements outstanding as of the beginning of
fiscal years beginning on or after December 15, 2009. The adoption of this
guidance is not expected to have a material impact on our consolidated financial
statements.
In
October 2009, the FASB issued ASU 2009-16, Transfers and Servicing (Topic 860) -
Accounting for Transfers of Financial Assets. This Update amends the
Codification for the issuance of FASB Statement No. 166, Accounting for
Transfers of Financial Assets-an amendment of FASB Statement No. 140. The
amendments in this Update improve financial reporting by eliminating the
exceptions for qualifying special-purpose entities from the consolidation
guidance and the exception that permitted sale accounting for certain mortgage
securitizations when a transferor has not surrendered control over the
transferred financial assets. In addition, the amendments require enhanced
disclosures about the risks that a transferor continues to be exposed to because
of its continuing involvement in transferred financial assets. Comparability and
consistency in accounting for transferred financial assets will also be improved
through clarifications of the requirements for isolation and limitations on
portions of financial assets that are eligible for sale accounting. This Update
is effective at the start of a reporting entity’s first fiscal year beginning
after November 15, 2009. Early application is not permitted. The
adoption of this guidance is not expected to have a material impact on our
consolidated financial statements.
In
October 2009, the FASB issued ASU 2009-17, Consolidations (Topic 810) -
Improvements to Financial Reporting by Enterprises Involved with Variable
Interest Entities. This Update amends the Codification for the
issuance of FASB Statement No. 167, Amendments to FASB Interpretation
No. 46(R). The amendments in this Update replace the quantitative-based
risks and rewards calculation for determining which reporting entity, if any,
has a controlling financial interest in a variable interest entity with an
approach focused on identifying which reporting entity has the power to direct
the activities of a variable interest entity that most
significantly
impact the entity’s economic performance and (1) the obligation to absorb losses
of the entity or (2) the right to receive benefits from the entity. An approach
that is expected to be primarily qualitative will be more effective for
identifying which reporting entity has a controlling financial interest in a
variable interest entity. The amendments in this Update also require
additional disclosures about a reporting entity’s involvement in variable
interest entities, which will enhance the information provided to users of
financial statements. This Update is effective at the start of a reporting
entity’s first fiscal year beginning after November 15, 2009. Early
application is not permitted. The adoption of this guidance is not expected to
have a material impact on our consolidated financial statements.
In
January 2010, the FASB issued ASU 2010-01, Equity (Topic 505) - Accounting for
Distributions to Shareholders with Components of Stock and
Cash. The amendments in this Update clarify that the stock
portion of a distribution to shareholders that allows them to elect to receive
cash or stock with a potential limitation on the total amount of cash that all
shareholders can elect to receive in the aggregate is considered a share
issuance that is reflected in earnings per share prospectively and is not a
stock dividend. This Update codifies the consensus reached in EITF
Issue No. 09-E, “Accounting for Stock Dividends, Including Distributions to
Shareholders with Components of Stock and Cash.” This Update is effective for
interim and annual periods ending on or after December 15, 2009, and should be
applied on a retrospective basis. The adoption of this ASU did not have a
material impact on our consolidated financial statements.
In
January 2010, The FASB has issued ASU 2010-06, Fair Value Measurements and
Disclosures (Topic 820): Improving Disclosures about Fair Value Measurements.
This ASU requires some new disclosures and clarifies some existing
disclosure requirements about fair value measurement as set forth in
Codification Subtopic 820-10. The FASB’s objective is to improve these
disclosures and, thus, increase the transparency in financial reporting.
Specifically, ASU 2010-06 amends Codification Subtopic 820-10 to now require
that a reporting entity disclose separately the amounts of significant transfers
in and out of Level 1 and Level 2 fair value measurements and describe the
reasons for the transfers; and present separately information about purchases,
sales, issuances and settlements in the reconciliation for fair value
measurements using significant unobservable inputs. In addition, ASU 2010-06
clarifies the requirements of the following existing disclosures:
|
|
·
|
For
purposes of reporting fair value measurement for each class of assets and
liabilities, a reporting entity needs to use judgment in determining the
appropriate classes of assets and liabilities;
and
|
|
|
·
|
A
reporting entity should provide disclosures about the valuation techniques
and inputs used to measure fair value for both recurring and nonrecurring
fair value measurements.
|
ASU
2010-06 is effective for interim and annual reporting periods beginning after
December 15, 2009, except for the disclosures about purchases, sales, issuances,
and settlements in the roll forward of activity in Level 3 fair value
measurements. Those disclosures are effective for fiscal years beginning after
December 15, 2010, and for interim periods within those fiscal years.
Early
adoption
is permitted. The adoption of this guidance is not expected to have a material
impact on our consolidated financial statements.
In
February 2010, the FASB issued ASU 2010-09, Subsequent Events (Topic 855)
Amendments to Certain Recognition and Disclosure Requirements. The
amendment addresses potential conflicts between the requirements to disclose the
date that the financial statements are issued and guidance of the Securities and
Exchange Commission (“SEC”). The update provides the following amendments: (1)
An entity that is an SEC Filer is required to evaluate subsequent events through
the date that the financial statements are issued. (2) The glossary of Topic 855
is amended to include the definition of an SEC filer. An SEC filer is an entity
that is required to file or furnish its financial statement with either the SEC
or, with respect to an entity subject to Section 12(i) of the Securities
Exchange Act of 1934, as amended, the appropriate agency under that Section. It
does not include an entity that is not otherwise an SEC filer whose financial
statements are included in a submission by another SEC filer. (3) An entity that
is an SEC filer is not required to disclose the date through which subsequent
events have been evaluated. This change alleviates potential conflicts between
Subtopic 855-10 and the SEC’s requirements. (4) The glossary of Topic 855 is
amended to remove the definition of public entity. (5) The scope of the
reissuance disclosure requirement is refined to include revised financial
statements only. Revised financial statements include financial statements
revised either as a result of correction of an error or retrospective
application of U.S. generally accepted accounting principles. All of the
amendments in this Update were effective upon issuance of the Update. The
adoption of this ASU did not have a material impact on our consolidated
financial statements.
|
ITEM
7A.
|
QUANTITATIVE
AND QUALITATIVE DISCLOSURES ABOUTMARKET
RISK
|
Management of Market
Risk
Qualitative
Analysis. The majority of our assets and liabilities are
monetary in nature. Consequently, one of our most significant forms
of market risk is interest rate risk. Our assets, consisting
primarily of mortgage loans, have longer maturities than our liabilities,
consisting primarily of deposits. As a result, a principal part of
our business strategy is to manage interest rate risk and reduce the exposure of
our net interest income to changes in market interest
rates. Accordingly, our Board of Directors has established an
Asset/Liability Committee which is responsible for evaluating the interest rate
risk inherent in our assets and liabilities, for determining the level of risk
that is appropriate given our business strategy, operating environment, capital,
liquidity and performance objectives, and for managing this risk consistent with
the guidelines approved by the Board of Directors. Senior management
monitors the level of interest rate risk on a regular basis and the
Asset/Liability Committee, which consists of senior management and outside
directors operating under a policy adopted by the Board of Directors, meets as
needed to review our asset/liability policies and interest rate risk
position.
Quantitative
Analysis. The following table presents the Company’s net
portfolio value (“NPV”). These calculations were based upon
assumptions believed to be fundamentally sound, although they may vary from
assumptions utilized by other financial institutions. The information
set forth below is based on data that included all financial instruments as of
December 31, 2009. Assumptions have been made by the Company relating
to interest rates,
loan
prepayment rates, core deposit duration, and the market values of certain assets
and liabilities under the various interest rate scenarios. Actual
maturity dates were used for fixed rate loans and certificate
accounts. Investment securities were scheduled at either the maturity
date or the next scheduled call date based upon management’s judgment of whether
the particular security would be called in the current interest rate environment
and under assumed interest rate scenarios. Variable rate loans were
scheduled as of their next scheduled interest rate repricing
date. Additional assumptions made in the preparation of the NPV table
include prepayment rates on loans and mortgage-backed securities, core deposits
without stated maturity dates were scheduled with an assumed term of 48 months,
and money market and noninterest bearing accounts were scheduled with an assumed
term of 24 months. The NPV at “PAR” represents the difference between
the Company’s estimated value of assets and estimated value of liabilities
assuming no change in interest rates. The NPV for a decrease of 100
to 300 basis points has been excluded since it would not be meaningful in the
interest rate environment as of December 31, 2009. The following sets
forth the Company’s NPV as of December 31, 2009.
| Change in | Net Portfolio | $ Change from | % Change from |
NPV
as a % of Assets
|
||||||||||||||||
|
calculation
|
Value | PAR |
PAR
|
NPV
Ratio
|
Change
|
|||||||||||||||
| +300bp | $ | 28,182 | $ | (13,908 | ) | -33.04 | % | 4.80 | % | (176 | )bp | |||||||||
| +200bp | 35,714 | (6,376 | ) | -15.15 | 5.89 | (67 | ) | |||||||||||||
| +100bp | 40,718 | (1,372 | ) | -3.26 | 6.51 | (5 | ) | |||||||||||||
|
PAR
|
42,090 | — | — | 6.56 | — | |||||||||||||||
| -100bp | — | — | — | — | — | |||||||||||||||
| -200bp | — | — | — | — | — | |||||||||||||||
| -300bp | — | — | — | — | — | |||||||||||||||
__________
bp-basis
points
The table
above indicates that at December 31, 2009, in the event of a 100 basis point
increase in interest rates, we would experience a 3.26% decrease in
NPV.
Certain
shortcomings are inherent in the methodology used in the above interest rate
risk measurement. Modeling changes in NPV require making certain
assumptions that may or may not reflect the manner in which actual yields and
costs respond to changes in market interest rates. In this regard,
the NPV table presented assumes that the composition of our interest-sensitive
assets and liabilities existing at the beginning of a period remains constant
over the period being measured and assumes that a particular change in interest
rates is reflected uniformly across the yield curve regardless of the duration
or repricing of specific assets and liabilities. Accordingly,
although the NPV table provides an indication of our interest rate risk exposure
at a particular point in time, such measurements are not intended to and do not
provide a precise forecast of the effect of changes in market interest rates on
our net interest income, and will differ from actual results.
|
ITEM
8.
|
FINANCIAL STATEMENTS
AND SUPPLEMENTARY DATA
|
The
financial statements identified in Item 15(a)(1) hereof are included as Exhibit
13 and are incorporated hereunder.
|
ITEM
9.
|
CHANGES
IN AND DISAGREEMENTS WITH ACCOUNTANTS ONACCOUNTING AND FINANCIAL
DISCLOSURE
|
The
required Disclosure is incorporated by reference to the BCB Bancorp, Inc. Proxy
Statement for the 2010 Annual Meeting of Stockholders.
|
ITEM
9A.(T)
|
CONTROLS AND
PROCEDURES
|
(a) Evaluation
of disclosure controls and procedures.
Under the
supervision and with the participation of our management, including our Chief
Executive Officer, Chief Financial Officer and Principal Accounting Officer, we
evaluated the effectiveness of the design and operation of our disclosure
controls and procedures (as defined in Rule 13a-15(e) and 15d-15(e) under the
Exchange Act) as of the end of the fiscal year (the “Evaluation Date”). Based
upon that evaluation, the Chief Executive Officer, Chief Financial Officer and
Principal Accounting Officer concluded that, as of the Evaluation Date, our
disclosure controls and procedures were effective in timely alerting them to the
material information relating to us (or our consolidated subsidiaries) required
to be included in our periodic SEC filings.
(b) Management’s
Annual Report on Internal Control over Financial Reporting
Management
of BCB Bancorp, Inc., and subsidiaries (the “Company”) is responsible for
establishing and maintaining adequate internal control over financial reporting.
The Company’s system of internal control is designed under the supervision of
management, including our Chief Executive Officer and Chief Operating Officer,
to provide reasonable assurance regarding the reliability of our financial
reporting and the preparation of the Company’s consolidated financial statements
for external reporting purposes in accordance with U.S. generally accepted
accounting principles (“GAAP”).
Our
internal control over financial reporting includes policies and procedures that
pertain to the maintenance of records that, in reasonable detail, accurately and
fairly reflect transactions and dispositions of assets; provide reasonable
assurances that transactions are recorded as necessary to permit preparation of
consolidated financial statements in accordance with GAAP, and that receipts and
expenditures are made only in accordance with the authorization of management
and the Board of Directors; and provide reasonable assurance regarding
prevention or timely detection of unauthorized acquisition, use, or disposition
of the Company’s assets that could have a material effect on our consolidated
financial statements.
Because
of its inherent limitations, internal control over financial reporting may not
prevent or detect misstatements. Projections on any evaluation of effectiveness
to future periods are subject to the risk that the controls may become
inadequate because of changes in conditions or that the degree of compliance
with policies and procedures may deteriorate.
As of
December 31, 2009, management assessed the effectiveness of the Company’s
internal control over financial reporting based upon the framework established
in Internal
Control – Integrated
Framework issued by the Committee of Sponsoring Organizations of the
Treadway Commission (COSO). Based upon its assessment, management believes that
the Company’s internal control over financial reporting as of December 31, 2009
is effective using these criteria. This annual report does not include an audit
report of the Company’s registered public accounting firm regarding internal
control over financial reporting. Management’s report was not subject to audit
by the Company’s registered public accounting firm pursuant to temporary rules
of the Securities and Exchange Commission that permit the company to provide
only management’s report in this annual report.
(c) Changes
in Internal Controls over Financial Reporting.
There
were no significant changes made in our internal controls during the period
covered by this report or, to our knowledge, in other factors that has
materially affected or is reasonably likely to materially affect, the Company’s
internal control over financial reporting.
See the
Certifications pursuant to Section 302 of the Sarbanes-Oxley Act of
2002.
|
ITEM
9B.
|
OTHER
INFORMATION
|
None.
PART III
|
ITEM
10.
|
DIRECTORS, EXECUTIVE
OFFICERS AND CORPORATE
GOVERNANCE
|
The
Company has adopted a Code of Ethics that applies to the Company’s principal
executive officer, principal financial officer, principal accounting officer or
controller or persons performing similar functions. The Code of
Ethics is available for free by writing to: President and Chief
Executive Officer, BCB Bancorp, Inc., 104-110 Avenue C, Bayonne, New Jersey
07002. The Code of Ethics was filed as an exhibit to the Form 10-K
for the year ended December 31, 2004.
The
“Proposal I—Election of Directors” section of the Company’s definitive Proxy
Statement for the Company’s 2010 Annual Meeting of Stockholders (the “2010 Proxy
Statement”) is incorporated herein by reference in response to the disclosure
requirements of Items 401, 405, 406, 407(d)(4) and 407(d)(5) of Regulation
S-K.
The
information concerning directors and executive officers of the Company under the
caption “Proposal I-Election of Directors” and information under the captions
“Section 16(a) Beneficial Ownership Compliance” and “The Audit Committee” of the
2010 Proxy Statement is incorporated herein by reference.
There
have been no changes during the last year in the procedures by which security
holders may recommend nominees to the Company’s board of
directors.
|
ITEM
11.
|
EXECUTIVE
COMPENSATION
|
The
“Executive Compensation” section of the Company’s 2010 Proxy Statement is
incorporated herein by reference.
|
ITEM 12.
|
SECURITY OWNERSHIP OF CERTAIN
BENEFICIAL OWNERS AND MANAGEMENT AND RELATED
STOCKHOLDER
MATTERS
|
The
“Proposal I—Election of Directors” section of the Company’s 2010 Proxy Statement
is incorporated herein by reference.
|
ITEM
13.
|
CERTAIN
RELATIONSHIPS AND RELATED TRANSACTIONS, AND DIRECTOR
INDEPENDENCE
|
The
“Transactions with Certain Related Persons” section and “Proposal I-Election of
Directors—Board Independence” of the Company’s 2010 Proxy Statement is
incorporated herein by reference.
|
ITEM
14.
|
PRINCIPAL ACCOUNTANT
FEES AND SERVICES
|
Information
required by Item 14 is incorporated by reference to the Company’s Proxy
Statement for the 2010 Annual Meeting of Stockholders, “Proposal II-Ratification
of the Appointment of Independent Auditors—Fees Paid to ParenteBeard
LLC.”
PART IV
|
ITEM
15.
|
EXHIBITS AND FINANCIAL
STATEMENT SCHEDULES
|
(a)(1) Financial
Statements
The
exhibits and financial statement schedules filed as a part of this Form 10-K are
as follows:
|
|
(A)
|
Report
of Independent Registered Public Accounting
Firm
|
|
|
(B)
|
Consolidated
Statements of Financial Condition as of December 31, 2009 and
2008
|
|
|
(C)
|
Consolidated
Statements of Income for each of the Years in the Three-Year period ended
December 31, 2009
|
|
|
(D)
|
Consolidated
Statements of Changes in Stockholders’ Equity for each of the Years in the
Three-Year period ended December 31,
2009
|
|
|
(E)
|
Consolidated
Statements of Cash Flows for each of the Years in the Three-Year period
ended December 31, 2009
|
|
|
(F)
|
Notes
to Consolidated Financial
Statements
|
|
(a)(2)
|
Financial Statement
Schedules
|
All
schedules are omitted because they are not required or applicable, or the
required information is shown in the consolidated statements or the notes
thereto.
|
(b)
|
Exhibits
|
|
|
3.1
|
Certificate
of Incorporation of BCB Bancorp,
Inc.****
|
|
|
3.2
|
Bylaws
of BCB Bancorp, Inc.**
|
|
|
3.3
|
Specimen
Stock Certificate*
|
|
|
10.1
|
BCB
Community Bank 2002 Stock Option
Plan***
|
|
|
10.2
|
BCB
Community Bank 2003 Stock Option
Plan***
|
|
|
10.3
|
2005
Director Deferred Compensation
Plan****
|
|
|
10.4
|
Change
in Control Agreement with Donald Mindiak*******
|
|
|
10.5
|
Change
in Control Agreement with James E. Collins*******
|
|
|
10.6
|
Change
in Control Agreement with Thomas M. Coughlin*******
|
|
|
10.7
|
Executive
Agreement with Donald Mindiak*******
|
|
|
10.8
|
Executive
Agreement with James E. Collins*******
|
|
|
10.9
|
Executive
Agreement with Thomas M. Coughlin*******
|
|
|
10.10
|
Amendment
to 2002 and 2003 Stock Option
Plans******
|
|
|
13
|
Consolidated
Financial Statements
|
|
|
14
|
Code
of Ethics***
|
|
|
21
|
Subsidiaries
of the Company****
|
|
|
23
|
Consent
of Independent Registered Public Accounting
Firm
|
|
|
31.1
|
Certification
of Chief Executive Officer pursuant to Section 302 of the Sarbanes-Oxley
Act of 2002
|
|
|
31.2
|
Certification
of Principal Accounting Officer pursuant to Section 302 of the
Sarbanes-Oxley Act of 2002
|
|
|
32
|
Certification
of Chief Executive Officer and Principal Accounting Officer pursuant to
Section 906 of the Sarbanes-Oxley Act of
2002
|
__________________
|
*
|
Incorporated
by reference to the Form 8-K-12g3 filed with the Securities and Exchange
Commission on May 1, 2003.
|
|
**
|
Incorporated
by reference to the Form 8-K filed with the Securities and Exchange
Commission on October 12, 2007.
|
|
***
|
Incorporated
by reference to the Annual Report on Form 10-K for the year ended December
31, 2004.
|
|
****
|
Incorporated
by reference to the Company’s Registration Statement on Form S-1, as
amended, (Commission File Number 333-128214) originally filed with the
Securities and Exchange Commission on September 9,
2005.
|
|
*****
|
Incorporated
by reference to Exhibit 10.10 to the Current Report on Form 8-K filed with
the Securities and Exchange Commission on November 10,
2005.
|
|
******
|
Incorporated
by reference to the Annual Report on Form 10-K for the year ended December
31, 2005.
|
|
*******
|
Incorporated
by reference to Exhibit 10.4, 10.5, 10.6, 10.7, 10.8 and 10.9 to the
Current Report on Form 8-K filed with the Securities and Exchange
Commission on December 15,
2008.
|
Signatures
Pursuant
to the requirements of Section 13 of the Securities Exchange Act of 1934, the
Registrant has duly caused this report to be signed on its behalf by the
undersigned, thereunto duly authorized.
|
BCB
BANCORP, INC.
|
|||
|
Date: March
30, 2010
|
By:
|
/s/ Donald Mindiak
|
|
|
Donald
Mindiak
|
|||
|
President,
Chief Executive Officer
|
|||
|
and
Chief Financial Officer
|
|||
|
(Duly
Authorized Representative)
|
Pursuant to the requirements of the
Securities Exchange of 1934, this report has been signed below by the following
persons on behalf of the Registrant and in the capacities and on the dates
indicated.
|
Signatures
|
Title
|
Date
|
||
|
/s/ Donald Mindiak
|
President,
Chief Executive
|
March
30, 2010
|
||
|
Donald
Mindiak
|
Officer,
Chief Financial Officer
|
|||
|
and
Director (Principal Executive Officer)
|
||||
|
/s/ Thomas M. Coughlin
|
Vice
President, Chief Operating
|
March
30, 2010
|
||
|
Thomas
M. Coughlin
|
Officer
(Principal Accounting
|
|||
|
Officer)
and Director
|
||||
|
/s/ Mark D. Hogan
|
Chairman
of the Board
|
March
30, 2010
|
||
|
Mark
D. Hogan
|
||||
|
/s/ Robert Ballance
|
Director
|
March
30, 2010
|
||
|
Robert
Ballance
|
||||
|
/s/ Judith Q. Bielan
|
Director
|
March
30, 2010
|
||
|
Judith
Q. Bielan
|
||||
|
/s/ Joseph J. Brogan
|
Director
|
March
30, 2010
|
||
|
Joseph
J. Brogan
|
||||
|
/s/ James E. Collins
|
Director
|
March
30, 2010
|
||
|
James
E. Collins
|
||||
|
/s/ Joseph Lyga
|
Director
|
March
30, 2010
|
||
|
Joseph
Lyga
|
||||
|
/s/ Alexander Pasiechnik
|
Director
|
March
30, 2010
|
||
|
Alexander
Pasiechnik
|
||||
|
/s/ August Pellegrini, Jr.
|
Director
|
March
30, 2010
|
||
|
August
Pellegrini, Jr.
|
||||
|
/s/ Joseph
Tagliareni_______
|
Director
|
March
30, 2010
|
||
|
Joseph
Tagliareni
|
EXHIBIT
INDEX
|
|
3.1
|
Certificate
of Incorporation of BCB Bancorp,
Inc.****
|
|
|
3.2
|
Bylaws
of BCB Bancorp, Inc.**
|
|
|
3.3
|
Specimen
Stock Certificate*
|
|
|
10.1
|
BCB
Community Bank 2002 Stock Option
Plan***
|
|
|
10.2
|
BCB
Community Bank 2003 Stock Option
Plan***
|
|
|
10.3
|
2005
Director Deferred Compensation
Plan****
|
|
|
10.4
|
Change
in Control Agreement with Donald Mindiak*******
|
|
|
10.5
|
Change
in Control Agreement with James E. Collins*******
|
|
|
10.6
|
Change
in Control Agreement with Thomas M. Coughlin*******
|
|
|
10.7
|
Executive
Agreement with Donald Mindiak*******
|
|
|
10.8
|
Executive
Agreement with James E. Collins*******
|
|
|
10.9
|
Executive
Agreement with Thomas M. Coughlin*******
|
|
|
10.10
|
Amendment
to 2002 and 2003 Stock Option
Plans******
|
|
|
Consolidated
Financial Statements
|
|
|
14
|
Code
of Ethics***
|
|
|
21
|
Subsidiaries
of the Company****
|
|
|
Consent
of Independent Registered Public Accounting
Firm
|
|
|
Certification
of Chief Executive Officer pursuant to Section 302 of the Sarbanes-Oxley
Act of 2002
|
|
|
Certification
of Principal Accounting Officer pursuant to Section 302 of the
Sarbanes-Oxley Act of 2002
|
|
|
Certification
of Chief Executive Officer and Principal Accounting Officer pursuant to
Section 906 of the Sarbanes-Oxley Act of
2002
|
|
*
|
Incorporated
by reference to the Form 8k-12g3 filed with the Securities and Exchange
Commission on May 1, 2003.
|
|
**
|
Incorporated
by reference to the Form 8-K filed with the Securities and Exchange
Commission on October 12, 2007.
|
|
***
|
Incorporated
by reference to the Annual Report on Form 10-K for the year ended December
31, 2004.
|
|
****
|
Incorporated
by reference to the Company’s Registration Statement on Form S-1, as
amended, (Commission File Number 333-128214) originally filed with the
Securities and Exchange Commission on September 9,
2005.
|
|
*****
|
Incorporated
by reference to Exhibit 10.10 to the Current Report on Form 8-K filed with
the Securities and Exchange Commission on November 10,
2005.
|
|
******
|
Incorporated
by reference to the Annual Report on Form 10-K for the year ended December
31, 2005.
|
|
*******
|
Incorporated
by reference to Exhibit 10.4, 10.5, 10.6, 10.7, 10.8 and 10.9 to the
CurrentReport
on Form 8-K filed with the Securities and Exchange Commission on
December
15, 2008.
|
63