Attached files
| file | filename |
|---|---|
| EX-23.1 - EXHIBIT 23.1 - TRI VALLEY CORP | tv231ex.htm |
| EX-10.4 - EXHIBIT 10.4 - TRI VALLEY CORP | tv104ex.htm |
| EX-31.2 - EXHIBIT 31.2 - TRI VALLEY CORP | tv312ex.htm |
| EX-31.1 - EXHIBIT 31.1 - TRI VALLEY CORP | tv311ex.htm |
| EX-10.3 - EXHIBIT 10.3 - TRI VALLEY CORP | tv103ex.htm |
| EX-99.1 - EXHIBIT 99.1 - TRI VALLEY CORP | tv991ex.htm |
| EX-32.2 - EXHIBIT 32.2 - TRI VALLEY CORP | tv322ex.htm |
| EX-23.3 - EXHIBIT 23.3 - TRI VALLEY CORP | tv233ex.htm |
| EX-99.2 - EXHIBIT 99.2 - TRI VALLEY CORP | tv992ex.htm |
| EX-32.1 - EXHIBIT 32.1 - TRI VALLEY CORP | tv321ex.htm |
| EX-23.2 - EXHIBIT 23.2 - TRI VALLEY CORP | tv232ex.htm |
SECURITIES AND EXCHANGE COMMISSION
Washington, D.C. 20549
FORM 10-K
ANNUAL REPORT PURSUANT TO SECTION 13 OR 15(d)
OF THE SECURITIES EXCHANGE ACT OF 1934
|
For the Fiscal Year Ended December 31, 2009
|
Commission File No. 001-31852
|
TRI-VALLEY CORPORATION
(Exact Name of Registrant as Specified in its Charter)
|
Delaware
|
94-1585250
|
|
(State or other jurisdiction of incorporation or organization)
|
(I.R.S. Employer Identification No.)
|
4550 California Avenue, Suite 600, Bakersfield, California 93309
(Address of Principal Executive Offices)
Registrant's Telephone Number Including Area Code: (661) 864-0500
Securities Registered Pursuant to Section 12(b) of the Act:
|
Title of each class
|
Name of exchange on which registered
|
|
Common Stock, $0.001 par value
|
NYSE Amex, LLC
|
Securities Registered Pursuant to Section 12(g) of the Act: None
Indicate by check mark if the registrant is a well-known seasoned issuer, as defined in Rule 405 of the Securities Act
Yes o No x
Indicate by check mark if the registrant is not required to file reports pursuant to Section 13 or Section 15(d) of the Act. Yes o Nox
Indicate by check mark whether the registrant (1) has filed all reports required to be filed by Section 13 or 15(d) of the Securities Exchange Act of 1934 during the preceding 12 months (or for such shorter period that the registrant was required to file such reports), and (2) has been subject to such requirement for the past 90 days.
Yes x No o
Indicate by check mark whether the registrant has submitted electronically and posted on its corporate Web site, if any, every Interactive Data File required to be submitted and posted pursuant to Rule 405 of Regulation S-T (§232.405 of this chapter) during the preceding 12 months (or for such shorter period that the registrant was required to submit and post such files). Yes o Nox
Indicate by check mark if disclosure of delinquent filers pursuant to Item 405 of Regulations S-K (§229.405 of this chapter) is not contained herein, and will not be contained, to the best of registrant’s knowledge, in definitive proxy or information statements incorporated by reference in Part III of this Form 10-K or any amendment to this Form 10-K. o
Indicate by check mark whether the registrant is a large accelerated filer, an accelerated filer, a non-accelerated filer, or a smaller reporting company.
Large accelerated filer o Accelerated filer x Non-accelerated filer o Smaller reporting company o
Indicate by check mark whether the registrant is a shell company (as defined in Rule 12b-2 of the Act).
Yeso Nox
As of March 22, 2010, 33,398,904 shares of common stock were outstanding.
The aggregate market value of the common shares of Tri-Valley Corporation held by non-affiliates on the last day of the registrant’s most recently completed second fiscal quarter was approximately $24 million.
DOCUMENTS INCORPORATED BY REFERENCE: None
TABLE OF CONTENTS
|
PART I
|
||
|
ITEM 1
|
Business
|
1
|
|
Competition
|
2
|
|
|
Governmental Regulation
|
2
|
|
|
Environmental Regulation
|
2
|
|
|
Employees
|
3
|
|
|
Available Information
|
3
|
|
|
ITEM 1A
|
Risk Factors
|
4
|
|
ITEM 1B
|
Unresolved Staff Comments
|
6
|
|
ITEM 2
|
Properties
|
7
|
|
Oil and Gas
|
7
|
|
|
Minerals
|
12
|
|
|
ITEM 3
|
Legal Proceedings
|
14
|
|
PART II
|
||
|
ITEM 5
|
Market Price of the Registrant's Common Stock and Related Security Holder Matters
|
15
|
|
Performance Graph
|
15
|
|
|
Equity Compensation Plan Information
|
16
|
|
|
ITEM 6
|
Selected Historical Financial Data
|
17
|
|
ITEM 7
|
Management's Discussion and Analysis of Financial Condition and Results of Operations
|
17
|
|
Notice Regarding Forward-Looking Statements
|
17
|
|
|
Overview
|
17
|
|
|
Critical Accounting Policies
|
18
|
|
|
Other Significant Accounting Polices
|
19
|
|
|
Accounting for Oil and Gas Producing Activities
|
20
|
|
|
Rig Operations
|
20
|
|
|
Mining Activity
|
20
|
|
|
Results of Operations
|
21
|
|
|
Financial Condition
|
23
|
|
|
Operating Activities
|
24
|
|
|
Investing Activities
|
24
|
|
|
Financing Activities
|
24
|
|
|
Liquidity and Capital Resources
|
24
|
|
|
ITEM 7A
|
Quantitative and Qualitative Disclosures About Market Risk
|
24
|
|
ITEM 8
|
Financial Statements
|
25
|
|
ITEM 9A
|
Controls and Procedures
|
58
|
|
Evaluation of Disclosure Controls
|
58
|
|
|
Management’s Report on Internal Control over Financial Reporting
|
58
|
|
|
Changes in Internal Control
|
59
|
|
|
Remediation of Material Weaknesses in Internal Control over Financial Reporting
|
59
|
|
|
PART III
|
||
|
ITEM 10
|
Directors and Executive Officers
|
62
|
|
ITEM 11
|
Executive Compensation
|
67
|
|
Compensation Discussion and Analysis
|
67
|
|
|
Personnel and Compensation Committee Report
|
71
|
|
|
Summary Compensation Table
|
72
|
|
|
Employment Agreement with Our Chief Executive Officer
|
72
|
|
|
Aggregated 2009 Option Exercises and Year-End Values
|
73
|
|
|
Option Grants During the Fiscal Year Ended December 31, 2009 to Named Executive Officers
|
74
|
|
|
Outstanding Equity Awards Table to Named Executive Officers and Directors
|
75
|
|
|
Compensation of Directors
|
76
|
|
|
ITEM 12
|
Security Ownership of Certain Beneficial Owners and Management
|
77
|
|
ITEM 13
|
Certain Relationships and Related Transactions
|
78
|
|
ITEM 14
|
Principal Accounting Fees and Services
|
78
|
|
ITEM 15
|
Exhibits and Financial Statement Schedules
|
79
|
|
SIGNATURES
|
80
|
|
ii
PART I
ITEM 1. BUSINESS
Tri-Valley Corporation (“Tri-Valley”, “TVC”, or “the Company”) is a Delaware corporation which currently conducts its operations through five wholly-owned subsidiaries. TVC’s principal offices are located at 4550 California Avenue, Suite 600, Bakersfield, California 93309; telephone (661) 864-0500.
GENERAL
The Company's five subsidiaries are:
|
|
•
|
Tri-Valley Oil & Gas Co. (“TVOG”)—conducts our hydrocarbon (crude oil and natural gas) business. TVOG derives its revenue from crude oil and natural gas drilling.
|
|
|
•
|
Select Resources Corporation, Inc. (“Select”)—conducts our precious metals and industrial minerals business. Select holds and develops three major mineral assets in the State of Alaska.
|
|
|
•
|
Great Valley Production Services, LLC (“GVPS”)—conducts our oil production services, well work over services, and the business of refurbishment of oilfield equipment.
|
|
|
•
|
Great Valley Drilling Company, LLC (“GVDC”)—formed to operate an oil drilling rig in the State of Nevada.
|
|
|
•
|
Tri-Valley Power Corporation—is inactive at the present time.
|
|
Tri-Valley's businesses are organized into four operating segments:
|
|
|
-
|
Oil and Gas Operations—This segment represents our oil and gas business. Further, during 2009, this segment generated 74% of the Company’s revenues from operations.
|
|
-
|
Rig Operations—This segment consists of drilling rig operations and also includes income from the rental and sale of oil field equipment.
|
|
-
|
Minerals—This segment represents our precious metal and industrial mineral prospects. In the past, it has generated revenues from pilot-scale mining projects and subcontracting exploration and business development projects. This segment holds title to land or leases in the State of Alaska. There was no significant precious metals activity in 2009.
|
|
-
|
Drilling and Development—This segment includes revenue received from crude oil and natural gas drilling and development operations performed for joint venture partners.
|
For additional information regarding Tri-Valley's current developments and segments, please see PART II, ITEM 7. MANAGEMENT'S DISCUSSION AND ANALYSIS OF FINANCIAL CONDITION and Note 16 to the Consolidated Financial Statements.
Marketing
We sell all of our crude oil production to Santa Maria Refining Company and to Kern Oil & Refining Co.; and all of our natural gas production to DMJ Gas Marketing Consultants, LLC; and California Energy Exchange Corporation.
1
Executive Management Changes
Mr. Maston N. Cunningham joined the Company on January 15, 2009, as Vice President of Corporate Development. He was subsequently promoted to President and Chief Operating Officer in May 2009. In January 2010, the Company announced that Mr. Cunningham would succeed Mr. F. Lynn Blystone as Chief Executive Officer on or before March 31, 2010.
On March 5, 2010, Mr. F. Lynn Blystone retired from his positions as Chief Executive Officer and Chairman of the Board of Directors of the Company. Mr. G. Thomas Gamble, Director and Vice Chairman of the Board of Directors, was elected Chairman of the Board of Directors of the Company, replacing Mr. Blystone as Chairman; Mr. Cunningham was elected Chief Executive Officer and President of the Company, replacing Mr. Blystone as Chief Executive Officer.
On October 1, 2009, Mr. John E. Durbin joined the Company as Chief Financial Officer, succeeding Mr. Arthur M. Evans. On March 5, 2010, Mr. Durbin was elected Chief Financial Officer and Treasurer.
On October 1, 2009, Mr. Arthur M. Evans was named Chief Compliance Officer for Tri-Valley Corporation. Mr. Evans left the Company on February 25, 2010, when the Company’s compliance function was outsourced to legal counsel.
COMPETITION
The crude oil and natural gas businesses are highly competitive. Competition is particularly intense to acquire desirable producing properties, to acquire crude oil and natural gas exploration prospects or properties with known reserves, suitable for enhanced development and production efforts, and to hire qualified and experienced human resources. Our competitors include the major integrated energy companies, as well as numerous independent oil and gas companies, individual proprietors, and drilling programs. Many of these competitors possess and employ financial and human resources substantially greater than ours. Our competitors may also have a superior capability for evaluating, bidding, and acquiring desirable producing properties and exploration prospects.
We also face significant competition in our precious metals and minerals business. Competition is particularly intense to acquire mineral prospects and deposits suitable for exploration and development, to acquire reserves, and to hire qualified and experienced human resources. Our competitors in mineral property exploration, acquisition, development, and production include the major mining companies in addition to numerous intermediate and junior mining companies, mineral property investors and individual proprietors.
GOVERNMENTAL REGULATION
Petroleum exploration, development, storage, and sales activities are extensively regulated at both the federal and state levels in the United States. Likewise, the same is true for the exploration, development, and operation of minerals and precious metals properties. Legislation affecting our businesses is under ongoing review for amendment or expansion, frequently increasing the related regulatory burden. Numerous departments and agencies, both federal and state, are authorized by statute to issue, and have issued, rules and regulations affecting the crude oil, natural gas, minerals, and precious metals industries. Compliance with these rules and regulations is often difficult and costly, and there are substantial penalties for noncompliance. State statutes and regulations require permits for drilling operations, drilling bonds, and reports concerning operations. Our operations are also subject to numerous laws and regulations governing plugging and abandonment, the discharge of materials into the environment, or otherwise relating to environmental protection. The heavy regulatory burden on our businesses increases the cost of doing business and, consequently, affects our profitability. Given the uncertainty of the regulatory environment, we cannot predict the impact of governmental regulation on our financial condition or operating results.
ENVIRONMENTAL REGULATION
Our crude oil and natural gas operations are subject to risks of fire, explosions, blow-outs, pipe failure, abnormally-pressured formations, and environmental hazards such as oil spills, natural gas leaks, ruptures, or discharges of toxic gases, the occurrence of any of which could result in substantial losses due to injury or loss of life, severe damage to, or destruction of property, natural resources, and equipment, pollution or other environmental damage, clean-up responsibilities, regulatory investigation and penalties, and suspension of operations. We have contracted a credentialed specialist in health, safety, environmental, and permitting functions, and, in accordance with customary
2
industry practice, we maintain insurance against these kinds of risks. Our insurance coverage may not cover all losses in the event of a drilling or production catastrophe.
Crude oil and natural gas operations can result in liability under federal, state, and local environmental regulations for activities involving, among other things, water pollution and hazardous waste transport, storage, and disposal. Such liability can attach not only to the operator of record of the well, but also to other parties that may be deemed to be current or prior operators or owners of the wells or the equipment involved. Numerous governmental agencies issue rules and regulations to implement and enforce such laws, which are often difficult and costly to comply with and which carry substantial administrative, civil, and criminal penalties and, in some cases, injunctive relief for failure to comply. Some laws, rules, and regulations relating to the protection of the environment may, in certain circumstances, impose "strict liability" for environmental contamination. These laws can render a person or company liable for environmental and natural resource damages, cleanup costs, and, in the case of oil spills, consequential damages without regard to negligence or fault. Other laws, rules, and regulations may require the rate of oil and gas production to be below the economically optimal rate or may even prohibit exploration or production activities in environmentally sensitive areas. In addition, these laws often require some form of remedial action, such as closure of inactive pits and plugging of abandoned wells, to prevent pollution from former or suspended operations.
Compliance with environmental requirements, including financial assurance requirements and the costs associated with the cleanup of any spill, could have a material adverse effect on our capital expenditures or earnings. These laws and regulations have not had a material effect on the Company to date. Nevertheless, environmental laws and changes in environmental laws have the potential to adversely affect operations. At this time, we have no plans to make any material capital expenditures for environmental control facilities.
Our precious metals and minerals exploration and property development activities in Alaska are subject to various federal and state laws and regulations governing the protection of the environment. These laws and regulations are continually changing, are generally becoming more restrictive, and have the potential to adversely affect our minerals exploration and property development activities.
EMPLOYEES
We had a total of thirty-two employees on March 26, 2010.
AVAILABLE INFORMATION
We file annual and quarterly reports, proxy statements, and other information with the Securities and Exchange Commission (“the SEC”) using the SEC's EDGAR system. The SEC maintains a website on the Internet at http://www.sec.gov that contains all of the Company’s filings. These filings may be downloaded free of charge. One may also read and/or copy any of our SEC filings in its Public Reference Room at 100 F Street, NE, Washington, DC 20549. Our common stock is listed on the NYSE Amex, LLC, under the ticker symbol “TIV”. Please contact the SEC at 1-800-SEC-0330 for further information about their Public Reference Room. Tri-Valley Corporation’s website may be accessed at http://www.tri-valleycorp.com.
We furnish our shareholders with a copy of our Annual Report on Form 10-K which contains audited financial statements and such other reports as we, from time to time, may deem appropriate or as may be required by law. We use the calendar year as our fiscal year.
3
ITEM 1A. RISK FACTORS
You should carefully consider the following risk factors in addition to the other information included in this Annual Report on Form 10-K. Each of these risk factors could adversely affect our business, operating results, and financial condition, as well as, adversely affect the value of an investment in our common stock.
Changing global and local commodity pricing strongly impacts the Company’s operating results.
Our operating results depend heavily upon our ability to market our crude oil and natural gas production at favorable prices. The factors influencing the prices of the commodities we sell are beyond our control, including changes in consumption patterns, global and local economic conditions, production disruptions, OPEC actions, and other factors that impact supply and demand for oil and gas. Lower crude oil and natural gas prices may reduce the amount of these commodities we can economically develop and produce, and, in turn, may have a material, adverse effect on the carrying value of our assets, reserves, and operating results.
Any material change in the factors and assumptions underlying our estimates of crude oil and natural gas reserves could impair the quantity and value of those reserves.
Our proved crude oil and natural gas reserves depend on estimates that include reservoir characteristics and recoverability, as well as capital and operating costs. Any changes in the factors and assumptions underlying our estimates of these items could result in a material, negative impact to the volume of reserves reported.
Unless we successfully add to our existing proved reserves, our future crude oil and natural gas production will decline, resulting in an adverse impact to our business.
The rate of production from crude oil and natural gas properties generally declines as reserves are depleted. Except to the extent that we perform successful exploration, development, or acquisition activities, or through engineering studies, identify additional or secondary recovery reserves, our proved reserves will decline as we produce crude oil and natural gas. Likewise, if we are not successful in replacing the crude oil and natural gas we produce with good prospects for future production, our business will experience reduced cash flow and results of operations. As our rates of production have been relatively low, our risk of reserve depletion is, likewise, low for the immediate future. We have a current need for development capital. Without such capital, our ability to increase production will be hindered.
Crude oil and natural gas drilling and production activities are subject to numerous mechanical and environmental risks that could reduce production.
In addition to the risk that no commercially productive crude oil or natural gas reservoirs may be found, our operations may be curtailed, delayed, or canceled. Title problems, weather conditions, compliance with governmental regulations, mechanical difficulties, and shortages or delays in the delivery of drilling rigs and other equipment may limit our ability to develop, produce, or market our reserves.
Drilling for crude oil and natural gas may result in losses, not only as a result of drilling dry wells but also from wells that are productive but produce insufficient net revenues to be profitable on a full-cost basis. Likewise, our properties may be susceptible to hydrocarbon drainage from production by other operators on adjacent properties.
Our business operating risks include, but are not limited to, the risks of fire, explosions, blow-outs, pipe failure, abnormally-pressured formations; as well as environmental hazards, such as oil spills, natural gas leaks, ruptures, or discharges of toxic gases, the occurrence of any of which could result in substantial losses. In accordance with customary industry practice, we maintain insurance against these kinds of risks, but our level of insurance may not cover all losses in the event of a drilling or production catastrophe. Insurance is not available for all operational risks, such as risks that we will drill a dry hole, fail in an attempt to complete a well, or have problems maintaining production from existing wells.
Crude oil and natural gas operations can result in liability under federal, state, and local environmental regulations for activities involving, among other things, water pollution and hazardous waste transport, storage, and disposal. Such liability can attach to the operator of record of the well and also to other parties that may be deemed to be current or prior operators or owners of the wells or the equipment involved. Thus, environmental laws could subject us to liabilities for environmental damages even where we are not the operator who caused the environmental damage.
4
Future governmental and environmental regulations may increase our costs of production, impact or limit our current business plans, and reduce demand for our products.
As explained in detail in PART I, ITEM 1. GOVERNMENTAL REGULATION and in ITEM 1. ENVIRONMENTAL REGULATION, United States exploration for the production and sale of crude oil and natural gas is extensively regulated at both the federal and state levels. Our oil and gas business is subject to numerous laws and regulations relating to the protection of the environment. These laws and regulations continue to increase in both number and complexity and affect our operations. Any change in such laws, rules, regulations, or interpretations, may have a material, adverse effect on our revenues, operating income, and cash flow.
Additionally, we could be adversely affected by potential legislation that seeks to control or reduce emissions of “greenhouse gases” or use of fossil fuels, the adoption of which may increase our costs to find, develop, and produce crude oil and natural gas in the future.
Currently pending lawsuits threaten to limit potential development of a significant and valuable heavy oil project.
There are currently two legal actions pending against us that may result in the termination of leases to properties in our Pleasant Valley Project. Please see PART I, ITEM 3. LEGAL PROCEEDINGS. Drilling and production operations have not yet commenced on one of these leases, and operations on the other leases are currently suspended, pending the installation of an improved electric distribution system that is required by a local regulatory body. We believe that the leases have significant potential for development, but if the lessors are successful in terminating the oil and gas leases, our potential for future development in the Pleasant Valley Field will be significantly impaired. We are vigorously pursuing and defending these lawsuits, as we believe that we have valid claims and defenses. The litigation involves two of our three leases in the Pleasant Valley Field.
Our drilling rig operations have not had significant consistent revenue.
Although our drilling rig operations began in 2006, to date, we have not realized an economic rig utilization rate. Demand continues to be very weak, and we have idled our sole drilling rig. We have no employees devoted to this business. Future drilling rig operations may not be profitable due to the entry of new, lower-cost competitors and continued weak demand.
Our minerals business has not yet realized significant revenue and is not presently profitable.
Select Resources Corporation, Inc., was formed in late 2004 to manage our precious metals and industrial minerals properties in Alaska. The precious metal properties will require additional investment to discover and delineate sufficient mineral resources to justify any future commercial development. The calcium carbonate industrial minerals property could be returned to commercial production if sufficient purchase commitments are secured. To date, we have realized no significant revenue and cannot predict when, if ever, we may see significant returns from our precious metal and mineral investments.
The value of our minerals business depends on numerous factors not under our control.
The economic value of our minerals business may be adversely affected by changes in commodity prices for gold and calcium carbonate, increases in production and/or capital costs, and increased environmental or permitting requirements by federal and state governments. If our mineral properties commence production, our operating results and cash flow may be impaired by reductions in forecast grade or tonnage of the deposits, dilution of the mineral content of the ore, reduction in recovery rates, and a reduction in reserves, as well as unforeseen delays in the development of our projects. Finally, new competitors able to operate at lower costs may enter the industry.
The value of our minerals business may be adversely affected by risks and hazards associated with the mining industry that may not be fully covered by insurance.
Our minerals business is subject to a number of risks and hazards including, but not limited to, environmental hazards, industrial accidents, unusual or unexpected geologic formations, and unanticipated hydrologic conditions, including flooding and periodic interruptions caused by inclement or hazardous weather conditions.
We have contracted a credentialed specialist in health, safety, environmental, and permitting functions. For some of these risks, we maintain insurance to protect against these losses at levels consistent with our historical experience,
5
industry practice, and circumstances surrounding each identified risk. Insurance against environmental risks is generally either unavailable or, we believe, unaffordable; and, therefore, we do not maintain environmental insurance. Occurrence of events for which we are not insured may impair the value of our minerals business.
Risks Involved in Our Business Generally
Forward Looking Statements
Some of the information in this Annual Report Form 10-K contains forward-looking statements that involve substantial risks and uncertainties. You can identify these statements by forward-looking words, such as “may,” “will,” “expect,” “anticipate,” “believe,” “estimate”, and “continue,” or similar words. You should read statements that contain these words carefully because they:
• discuss our future expectations
• contain projections of our future results of operations or of our financial condition
• state other “forward-looking” information.
We believe it is important to communicate our expectations. However, there may be events in the future that we are not able to accurately predict and/or over which we have no control. The risk factors listed in this section, other risk factors about which we may not be aware, as well as, any cautionary language in this report, provide examples of risks, uncertainties, and events that may cause our actual results to differ materially from the expectations we describe in our forward-looking statements. You should be aware that the occurrence of the events described in these risk factors could have an adverse effect on our business, results of operations, and financial condition.
Ability to Operate as a Going Concern: If we are unable to obtain additional funding, our business will be materially impaired.
The Company remains dependent on capital formation for funding its operating and general and administrative requirements for 2010. Availability of capital is dependent on many external factors, such as the current economic climate and interest rates, among others, and may not be available to the Company when needed. Important sources for capital in the past have been investment in the TVC OPUS 1 Drilling Program, L.P. and the private placement of our restricted common stock. Although we have been successful in the past at attracting sufficient capital, we do not have certainty that additional financing will be available when needed on acceptable terms. Insufficient financing may prevent or limit us from implementing our business strategy.
Our cash balance as of December 31, 2009, was $0.3 million. Current liabilities were $12.3 million on that date. It should be noted, however, that Accounts Payable to Joint Venture Partners comprised $5.0 million of the $12.3 million in total current liabilities and were offset by $6.5 million in Accounts Receivable from Joint Venture Partners in total current assets on that date. See Note 11 to our consolidated financial statements for the years ended December 31, 2009, and 2008, for additional discussion. In light of this and other factors, our independent accountant has included a going concern qualification in its report on our financial statements for the year ended December 31, 2009, noting that our ability to continue as a going concern is dependent on additional sources of capital and the success of our business strategy. See Note 15 to our consolidated financial statements for the years ended December 31, 2009, and 2008.
ITEM 1B. UNRESOLVED STAFF COMMENTS
None
6
ITEM 2. PROPERTIES
Our principal properties consist of proven and unproven crude oil and natural gas properties; mining claims on unproven precious metals properties; and a fee interest in an industrial minerals property.
OIL AND GAS
The following properties are operated by the Company and have been funded in part by the TVC OPUS 1 Drilling Program, L.P.:
Pleasant Valley: This property is located in Ventura County, California, in the Oxnard Oil Field where we are in the early stages of developing and producing heavy oil from the Upper Vaca Tar Formation. The California State Department of Oil and Gas and Geothermal Resources has published estimates that the Upper Vaca Tar has over 400 million barrels of original oil in place (OOIP), of which we and our partners control about 128 million barrels of OOIP attributable to Pleasant Valley as estimated by an independent reserves engineering firm in October 2009. During 2007, we drilled a total of seven horizontal wells and installed temporary production facilities; and in 2008, we commenced cyclic steaming operations. During 2009, production was curtailed periodically to accommodate installation of larger diameter flow lines, production manifolds, and artificial lift equipment on three of the seven wells; and to test steam injection parameters on individual wells. Smaller diameter tubing was also installed in all seven wells to achieve better steam distribution.
Our plans for 2010 include the drilling of a horizontal injector well that will be paired with an existing horizontal producing well to test Steam-Assisted-Gravity-Drainage (SAGD) technology for future deployment to fully develop and produce the Upper Vaca Tar. We also plan this year to convert a vertical well to a water disposal well to eliminate the cost of offsite water disposal once regulatory approval of our application is received.
Temblor Valley West/South Belridge Field: The South Belridge Properties are located in Kern County, California, west of Bakersfield, and include a total of 56 wells; six producing, one active injection well, and 49 idle wells. Five wells were drilled in 2007, and these wells extended the known oil-bearing formations to the west by over a half mile. Oil production on the Property comes from the Etchegoin Formation. Attempts in prior years to increase production by cyclic steaming of the Lower Diatomite Formation and a pilot waterflood of the Etchegoin Formation proved unsuccessful. We are currently evaluating other options for these Properties, including possible divestiture.
Temblor Valley East/Edison Field: This property is located in Kern County, California, east of Bakersfield and consists of the Shield and Arms Lease which includes two producing wells, one injection well, and three idle wells. The two producing wells were completed in the Olcese Formation and are produced by beam pump. We are currently evaluating other options for this Property, including possible divestiture.
Moffat Ranch: This gas field is located in the southern area of the “California Gas Country” in Madera County in central California. The gas field consists of one producing well and three idle wells. In late 2007, Tri-Valley drilled the deepest wellbore penetration in the field to below 10,000 feet to evaluate more than 14 potential producing horizons. Two of these potential gas zones were evaluated for productive potential in 2007, and one was successfully tested at over one million cubic feet per day. In 2008, attempts to restore the three idle wells to production were unsuccessful. We have plans to rework one of our idle wells in the second quarter of 2010.
Ekho: The Ekho No. 1 exploratory well, located north of Bakersfield in Kern County, California, was originally drilled by the Company to 19,088 feet in 2000 and encountered hydrocarbons in tight formations in the lower zones of the well. In 2005, we hydraulically fractured the Vedder Zone between 18,018 and 18,525 feet, injecting approximately 5,000 barrels of fluid which carried approximately 118,000 pounds of bauxite propping material. While successful mechanically, the fracturing operation did not result in producing hydrocarbons at commercial rates from the Vedder Zone. This well still has multiple targets which can be evaluated in the future, and we will continue to look for new technologies that could allow the Vedder Zone to produce commercially.
Sunrise Natural Gas Project: This project is located just north of Bakersfield, California, in the City of Delano and consists of one vertical well and one horizontal well that were drilled by the Company in 2000 and 2003, respectively, and which encountered “tight” natural gas in the McClure Shale at approximately 8,200 feet. We believe the McClure Shale may hold up to three trillion cubic feet of natural gas in the mapped area of closure. In 2005, we hydraulically fractured 1,000 feet of the 3,000 foot horizontal portion of a well bore in the tight McClure Shale utilizing gelled diesel that carried in approximately 138,000 pounds of sand. Again, while mechanically successful like the Ekho Project, the fracturing operation did not result in the well producing hydrocarbons from the McClure Shale at commercial rates. We will continue to review all available technologies to bring the Sunrise Natural Gas Project potential to commercial realization given the volume of natural gas in place in the tight reservoir.
7
In addition, Tri-Valley currently operates the following properties:
Rio Vista Field: The Rio Vista Field is located in Solano County, in northern California, and we operate four producing gas wells and two idle wells on two separate leases in this field. These two separate leases are the Hanson and the Webb Tract.
Dutch Slough Field: The Dutch Slough Field is located in Contra Costa County in northern California, where we operate one producing gas well and two idle wells on the Martin-Severin Lease in this field.
Edison Field (Race Track Hill Area): The Edison Field Property is located east of Bakersfield, California, and contains seven idle wells that offset a successful cyclic steaming operation in the Santa Margarita Formation. We have obtained 29 individual well drilling permits for this property and plan to reactivate production on this lease in 2010 with cyclic steaming operations in the second quarter of the year. We also plan to drill up to 20 new wells beginning in the third quarter of 2010. This property, when fully developed, has the potential to produce approximately 3.7 million barrels of oil for Tri-Valley’s interest, based upon an independent engineering report completed in January 2010.
Proved Reserves
We have retained the services of Mr. Leland B. Cecil, P.E., an independent petroleum engineer based in Bakersfield, California, and AJM Petroleum Consultants of Calgary, Alberta, Canada, to estimate the Company’s net share of Proved and Prospective Reserves at December 31, 2009. Proved Reserve estimates are classified as either Developed or Undeveloped Reserves. Prospective Reserves are differentiated as Probable Reserves and Possible Reserves. The estimates were prepared according to the guidelines established by the U.S. Securities and Exchange Commission (“the SEC”) and the Financial Accounting Standards Board (“FASB”) for valuation of crude oil and natural gas reserves.
Proved Reserves are those quantities of crude oil and natural gas, which, by analysis of geoscience and engineering data, can be estimated with reasonable certainty to be economically producible from a given date forward, from known reservoirs, and under existing economic conditions, operating methods, and government regulations, prior to the time at which contracts providing the right to operate expire, unless evidence indicates that renewal is reasonably certain, regardless of whether deterministic or probabilistic methods are use for the estimation. Projects to extract the hydrocarbons must have commenced, or the operator must be reasonably certain it will commence the projects within a reasonable time. Proved Reserves are further classified as either Developed or Undeveloped. Proved Developed Reserves are Proved Reserves that can be expected to be recovered through existing wells with existing equipment and operating methods or in which the cost of the required equipment is relatively minor compared to the cost of a new well, and through installed extraction equipment and infrastructure operational at the time of the reserves estimate if the extraction is by means not involving a well. Proved Undeveloped Reserves are Proved Reserves that are expected to be recovered from new wells on undrilled acreage, or from existing wells where a relatively major expenditure is required for recompletion.
Prospective Reserves are differentiated according to reservoir characteristics and exhibited recovery from efforts analogous to the subject properties. Probable Reserves are those additional reserves that are less certain to be recovered than Proved Reserves but which, together with Proved Reserves, are as likely as not to be recovered. Probable reserves may be assigned to areas of a reservoir adjacent to Proved Reserves where data control or interpretations of available data are less certain, even if the interpreted reservoir continuity of structure or productivity does not meet the reasonable certainty criterion. Likewise, Probable Reserves may be assigned to areas that are structurally higher than the proved area if these areas are in communication with the proved reservoir. Finally, Possible Reserves are those additional reserves that are less certain to be recovered than Probable Reserves. Possible Reserves may be assigned to areas of a reservoir adjacent to Probable Reserves where data control and interpretations of available data are progressively less certain. Frequently, this will be in areas where geoscience and engineering data are unable to define clearly the area and vertical limits of commercial production from the reservoir by a defined project. Possible Reserves also include incremental quantities associated with a greater percentage recovery of the hydrocarbons in place than the recovery quantities assumed for Probable Reserves.
Engineering estimates of the quantities of proved reserves are inherently imprecise and represent only approximate amounts because of the judgments involved in developing such information.
8
Our estimated future net recoverable crude oil and natural gas reserves as of December 31, 2009, 2008, and 2007, were as follows:
|
Year Ending
|
BBL
|
MCF
|
||
|
Crude Oil
|
Natural Gas
|
|||
|
December 31, 2009
|
Developed
|
282,271
|
395,252
|
|
|
Undeveloped
|
2,738,439
|
0
|
||
|
Net Proved
|
3,020,710
|
395,252
|
||
|
Probable
|
760,000
|
0
|
||
|
Possible
|
6,045,425
|
42,008
|
||
|
Net Prospective
|
6,805,425
|
42,008
|
||
|
December 31, 2008
|
Developed
|
0
|
695,931
|
|
|
Undeveloped
|
0
|
0
|
||
|
Net Proved
|
0
|
695,931
|
||
|
Probable
|
0
|
0
|
||
|
Possible
|
0
|
0
|
||
|
Net Prospective
|
0
|
0
|
||
|
December 31, 2007
|
Developed
|
372,048
|
791,128
|
|
|
Undeveloped
|
0
|
0
|
||
|
Net Proved
|
372,048
|
791,128
|
||
|
Probable
|
0
|
0
|
||
|
Possible
|
0
|
0
|
||
|
Net Prospective
|
0
|
0
|
||
|
December 31, 2006
|
Developed
|
275,452
|
787,017
|
|
|
Undeveloped
|
0
|
0
|
||
|
Net Proved
|
275,452
|
787,017
|
||
|
Probable
|
0
|
0
|
||
|
Possible
|
0
|
0
|
||
|
Net Prospective
|
0
|
0
|
||
Economics for determined reserves in 2009 were formulated from market conditions that existed during the twelve months of the year. Product sale prices were calculated from applicable prices posted on the first day of the calendar months. Operating expenses were normalized for a twelve month moving average. No consideration was given to potential future inflation of either product sale prices or costs relative to future operation. The present value of projected future net income was calculated at an annual discount rate of 10%. On this basis, future net revenue to be derived from our Proved Developed and Undeveloped crude oil and natural gas reserves was $44.2 million at December 31, 2009.
Using year-end 2008 crude oil and natural gas prices and prevailing levels of lease operating expenses, the estimated present value of the future net revenue to be derived from our proved developed and undeveloped crude oil and natural gas reserves, discounted at 10%, was $1.7 million at December 31, 2008, and $12.3 million at December 31, 2007. The precipitous drop in crude oil reported reserves from the end of 2007 to the end of 2008 was due to the
9
collapse of crude oil prices in the second half of 2008. This resulted in the proved producing reserves on our producing oil wells at the time to be written down to zero in the reserve report.
On December 31, 2008, the SEC issued Release No. 33-8995 amending its oil and natural gas reporting requirements for oil and natural gas producing companies. The effective date of the new accounting and disclosure requirements is for annual reports filed for fiscal years ending on or after December 31, 2009. Among other things Release No. 33-8995:
|
·
|
Revises a number of definitions relating to proved oil and natural gas reserves to make them consistent with the Petroleum Resource Management System, which includes certain non-traditional resources in proved reserves.
|
|
·
|
Permits the use of new technologies for determining proved oil and natural gas reserves.
|
|
·
|
Requires the use of average prices for the trailing twelve-month period in the estimation of oil and natural gas reserve quantities and for companies using the full cost method of accounting, in computing the Ceiling Limitation, in place of a single day price as of the end of the fiscal year.
|
|
·
|
Permits the disclosure in filings with the SEC of probable and possible reserves and reserves sensitivity to changes in prices.
|
|
·
|
Requires additional disclosures (outside of the financial statements) regarding the status of undeveloped reserves and changes in status of these from period to period.
|
|
·
|
Requires a discussion of the internal controls in place to assure objectivity in the reserve estimation process and disclosure of the technical qualifications of the technical person having primarily responsibility for preparing the reserve estimates.
|
Companies are not permitted to use the new SEC requirements for fiscal years ending prior to December 31, 2009. We have evaluated the effect that adoption of the final rule will have on our financial statements and oil and natural gas reserve estimates and disclosures. Based on a review by our independent petroleum engineer, we believe that, if the new requirements had been in effect for our fiscal 2008, our reported natural gas and crude oil reserves would have been substantially higher than those reported under the currently applied SEC standards. Notably, the use of trailing twelve month average prices instead of year end prices would have dramatically increased the value of our reserves. In fiscal 2008, the prices we received for oil production varied from a high of $123.13 per barrel to a low of $26.15 per barrel, with the year end price on which reserves were calculated being $30.13 per barrel.
The unaudited supplemental information attached to the consolidated financial statements provides more information on crude oil and natural gas reserves and estimated values.
The following table sets forth the net quantities of natural gas and crude oil that we produced during:
|
Year Ended December 31,
|
|||
|
2009
|
2008
|
2007
|
|
|
Natural Gas (MCF)
|
32,076
|
102,070
|
45,928
|
|
Crude Oil (BBL)
|
21,092
|
26,299
|
7,006
|
10
The following table sets forth our average sales price and average production (lifting) cost per unit of crude oil and natural gas produced during:
|
Year Ended December 31,
|
||||||||||||||||||||||||
|
2009
|
2008
|
2007
|
||||||||||||||||||||||
|
Gas (MCF)
|
Oil (BBL)
|
Gas (MCF)
|
Oil (BBL)
|
Gas (MCF)
|
Oil (BBL)
|
|||||||||||||||||||
|
Sales Price
|
$ | 3.55 | $ | 35.74 | $ | 8.07 | $ | 90.10 | $ | 7.15 | $ | 58.23 | ||||||||||||
|
Production Costs
|
$ | 2.91 | $ | 69.68 | $ | 1.67 | $ | 37.45 | $ | 1.55 | $ | 16.28 | ||||||||||||
|
Net Profit
|
$ | 0.64 | $ | (33.94 | ) | $ | 6.40 | $ | 52.65 | $ | 5.60 | $ | 41.95 | |||||||||||
|
As of December 31, 2009, we had the following gross and net position in wells and developed acreage:
|
|
Wells (1)
|
Acres (2)
|
|||||
|
Gross
|
Net
|
Gross
|
Net
|
|||
|
79
|
22.81
|
3,730
|
1,044
|
All of our producing wells and acres where the Company has a working interest are located within California.
|
(1)
|
"Gross" wells represent the total number of producing wells in which we have a working interest. "Net" wells represent the number of gross producing wells multiplied by the percentages of the working interests which we own. "Net wells" recognizes only those wells in which we hold an earned working interest. Working interests earned at payout have not been included.
|
|
(2)
|
"Gross" acres represent the total acres in which we have a working interest. "Net" acres represent the aggregate of the working interests which we own in the gross acres.
|
The following table sets forth the number of productive and dry exploratory and development wells which we drilled during:
|
Year Ended December 31,
|
|||
|
2009
|
2008
|
2007
|
|
|
Exploratory
|
|||
|
Producing
|
-0-
|
-0-
|
-0-
|
|
Dry
|
-0-
|
-0-
|
-0-
|
|
Total
|
-0-
|
-0-
|
-0-
|
|
Development
|
|||
|
Producing
|
-0-
|
-6-
|
-5-
|
|
Dry
|
-0-
|
-0-
|
-0-
|
|
Total
|
-0-
|
-6-
|
-5-
|
The following table sets forth information regarding undeveloped oil and gas acreage in which we had an interest on December 31, 2009:
|
State
|
Gross Acres
|
Net Acres
|
||
|
California
|
22,465
|
19,373
|
||
11
Our undeveloped acreage is held pursuant to leases from landowners. Such leases have varying dates of execution and generally expire one to five years after the date of the lease without drilling or unitization into an offsetting producing well. In the next three years, the following lease gross acreage expires:
|
Expires in 2010
|
7,268 acres
|
|
Expires in 2011
|
1,089 acres
|
|
Expires in 2012
|
8,678 acres
|
MINERALS
Our wholly-owned subsidiary, Select Resources Corporation, Inc., holds and maintains two precious metal properties and an industrial minerals property in the State of Alaska. The Richardson and Shorty Creek precious metal properties are exploration stage gold properties which require additional capital to fully evaluate their gold and minerals potential. There is no assurance that a commercially-viable mineral deposit exists on either of these precious metal properties. Current economic conditions point towards continued strength for precious metal prices, and we plan to maintain a strong focus on these properties.
Our industrial minerals property, the Admiral Calder Quarry (“Calder”), contains over 25 million tons of high grade minable resource in place according to our independent engineering estimates and was partially developed and produced for a short time by the previous owner. Select acquired Calder in 2005 but has neither mined nor sold any product from the property.
Shorty Creek: In January 2005, we acquired the Shorty Creek property (“Shorty”) which is located in the Tolovana District about 60 miles northwest of Fairbanks, Alaska, along the paved, all-weather Elliot Highway that is the principal route used to access the North Slope petroleum production areas. Shorty has been described by a state geologist of Alaska as perhaps the best drill–ready gold exploration project in the state; and it directly offsets, and is on trend with, International Tower Hill’s ongoing exploration drilling program at its Livengood Gold Project which has so far defined 12.5 million ounces of gold (indicated and inferred).
Shorty Creek is a gold or possible polymetalic exploration project where we have conducted previous campaigns of exploration work that included geochemical sampling and drilling which have identified anomalous concentrations of gold, copper, molybdenum, and their pathfinder elements.
In 2005 we carried out geophysical and satellite interpretation programs over a large portion of Shorty Creek and a multi-element soil auger geochemical program extending over one of four distinctive aeromagnetic anomalies, covering an area approximately of one mile, resulting in the identification of five precious metal and base metal anomalies. This same year we acquired mineral rights to 178 State of Alaska mining claims through staking and lease arrangements from Gold Range Ltd., covering approximately 17 square miles. In 2009, additional property was acquired through contractors, essentially doubling Shorty’s property position to about 40 square miles, and was based on geophysics and third-party gold geochemistry.
Also in 2009, we acquired regional geochemistry data from the State of Alaska and an interpretation of that data by the University of Alaska which significantly enhanced the potential of Shorty Creek. The State’s geochemistry data was collected over a 1,000 square mile area that includes Shorty Creek. From this data, the University determined that the highest two-and-one-quarter percent (2.25%) concentrations of precious and base metals are clustered in a 45 square mile area and about eighty-five percent (85%) of this cluster lies within the boundaries of the Shorty Creek prospect.
To date, we have not identified proven or probable mineral reserves on Shorty Creek. Based on archived data, including the State of Alaska geochemistry data and the University of Alaska study, significant mineralization has been identified on the property; and if determined to be of adequate size, quality, and spatial distribution, the final extent of this mineralization could prove to be economic in the future. Further exploration is required before a final evaluation as to the economic and technical feasibility can be determined. To that end, we have contracted Avalon Development Corporation to prepare an NI 43-101 (Canadian form) report for Shorty Creek which should be completed in the second quarter of 2010 and continue to pursue options for funding additional exploration work on the property.
12
The following table sets forth the information regarding the acreage position of the Shorty Creek claim block as of December 31, 2009:
|
Gross Acres
|
Net Acres
|
|
24,440
|
24,440
|
Richardson: The Richardson Property (“Richardson”) is located in the Richardson District, one of the most prospective and underexplored gold exploration districts in east-central Alaska. Our claims are located near the all-weather paved Richardson Highway, about seventy miles southeast of Fairbanks, Alaska, and just south of the nearby Trans-Alaska Pipeline corridor that provides access to our claims from the north. We acquired the bulk of the Richardson property in 1987, and it covers 29,640 acres of land, all of which is owned by the State of Alaska.
The Richardson Project is an early-stage gold exploration project with past placer production and pilot-size lode gold production. Geophysical and geochemical signatures are consistent with intrusion-related gold systems. Nine highly prospective zones have been identified in previous exploration programs carried out by the Company and previous owners.
In late 2005, we initiated geophysical and satellite interpretation programs over the entire Richardson Property and a multi-element soil auger geochemical program, extending along approximately 4.5-miles of the Richardson Lineament that appears to extend 12 to 15 miles in length. The survey found six precious metal and other element anomalies. We also conducted 3,050 feet of diamond drilling in the Democrat Mine area which indicated gold and silver mineralization.
To date, we have no proven or probable mineral reserves on Richardson and have contracted with Avalon Development Corporation to produce an NI 43-101 report (Canadian form) that will be prepared in 2010 after completion of a similar report for Shorty Creek.
The following table sets forth the information regarding the acreage position of our Richardson, Alaska, claim block as of December 31, 2009:
|
Gross Acres
|
Net Acres
|
|
29,640
|
28,821
|
Industrial Minerals: Our industrial minerals project is the Admiral Calder calcium carbonate quarry (“Calder”) located in Alaska on the northwest end of Prince of Wales Island, approximately 150 air miles south of Juneau and 88 air miles northwest of Ketchikan. Independent estimates conclude that Calder may hold in excess of 25 million tons of high chemical grade, high brightness, and high whiteness calcium carbonate resource in place. By some authorities, Calder has the potential to be “a world class producer of calcium carbonate for several markets” (Harben and Lobdell, Peter Harben, Inc. 2005).
Select paid $3.0 million in 2005 to acquire Calder from Sealaska Corporation, which had invested approximately $20 million to partially delineate and develop the mineral deposit, including installations of mining materials handling equipment, marine loading facilities, and other infrastructure on the property. The quarry covers only 15 acres, but the entire property covers 572 acres of patented mining ground and includes all operating permits and tideland leases. Less than 10% of the acreage has been explored, and geologic mapping suggests substantially more resources exist on the property. The property has been in a “care and maintenance” mode since 2005 while we pursued additional capital, potential partners, and calcium carbonate product customers that would facilitate restarting quarry operations. Improved global economic conditions in the future should stimulate demand for calcium carbonate which is a key ingredient in over 1,200 products including paper and paints. Industrial minerals projects such as Calder must be competitive with other producers in terms of quality, volume, and CIF pricing to gain customers. Calder’s seaside location and marine loading facilities offer a distinct competitive advantage.
In 2009, Select continued negotiations with prospective buyers for calcium carbonate who had obtained product quality tests from outside parties. These tests confirmed the extremely high quality of the calcium carbonate in the size range of over ten microns and also better quantified the reduced whiteness and brightness for the two micron size fraction. In 2010, we are pursuing options to monetize Calder, including: 1) redevelopment of the quarry; 2) outright sale or lease; 3) joint venture; or a combination of these three options.
13
The following table sets forth the information regarding the acreage position of our Admiral Calder Property as of December 31, 2009:
|
Gross Acres
|
Net Acres
|
|
572
|
572
|
ITEM 3. LEGAL PROCEEDINGS
Other than ordinary routine litigation incidental to our business, certain additional material litigation follows:
Tri-Valley Corporation v. Hansen et al., No. 56-2009-00345844-CU-OR-VTA, Superior Court, Ventura County, California.
On May 29, 2009, we filed a quiet title action against the lessors of our Scholle-Livingston oil and gas lease. On July 2, 2009, the defendants filed a cross complaint. Our action seeks to quiet title to our oil and gas lease by affirming the validity of the lease, and the cross-complaint seeks to terminate the lease. Our present intention is to develop this lease as part of our Pleasant Valley Project. Although we have yet to commence drilling or production operations on this lease, we believe it has significant and valuable heavy oil deposits. The present status of the action is that the parties are in the process of discovery, with a trial date scheduled for May 24, 2010. We are vigorously pursuing this lawsuit as we believe that we have valid claims and defenses.
Lenox v. Tri-Valley Corporation, No. 56-2009-00358492-CU-OR-VTA, Superior Court, Ventura County, California
On September 25, 2009, the lessors of our Lenox and Snodgrass oil and gas leases filed a quiet title action against us. Our answer to the action was filed on November 6, 2009. The principal relief sought by lessors is for a declaration of quiet title by declaring a termination of our Lenox and Snodgrass oil and gas leases in our Pleasant Valley Project. Our present intention is to develop these leases as part of our Pleasant Valley Project which we believe has significant and valuable heavy oil deposits. We drilled one well and reworked several others on these leases. However, operations are currently suspended pending the installation of an improved electric distribution system that is required by a local regulatory body in order to address air emissions requirements. The present status of the action is that initial pleadings have been exchanged, and the process of discovery is the likely next step for the parties. However, at this time, neither party has propounded discovery on the other. We are vigorously defending this lawsuit as we believe that we have valid claims and defenses.
14
PART II
ITEM 5. MARKET PRICE FOR REGISTRANT’S COMMON EQUITY AND RELATED SECURITY HOLDER MATTERS
Our common stock trades on the NYSE Amex, LLC, under the ticker symbol “TIV”. The following table shows the high and low sales prices and high and low closing prices reported for the years ended December 31, 2009, and 2008:
| Sales Prices | Closing Prices | |||
| High | Low | High | Low | |
| 2009 | ||||
| Fourth Quarter | $3.80 | $1.58 | $3.51 | $1.63 |
| Third Quarter | $3.59 | $0.83 | $3.10 | $0.83 |
| Second Quarter | $1.56 | $0.93 | $1.38 | $0.93 |
| First Quarter | $1.95 | $0.97 | $1.95 | $1.01 |
| 2008 | ||||
| Fourth Quarter | $6.30 | $1.46 | $6.17 | $1.51 |
| Third Quarter | $8.59 | $6.00 | $8.14 | $6.15 |
| Second Quarter | $9.73 | $5.70 | $9.15 | $5.77 |
| First Quarter | $7.50 | $4.85 | $7.25 | $5.03 |
As of December 31, 2009, we estimated that approximately 4,500 shareholders in the United States and several foreign countries held our common stock.
We historically have paid no dividends, and at this time, we do not plan to pay any dividends in the immediate future. In 2009, trading volume exceeded 49 million shares.
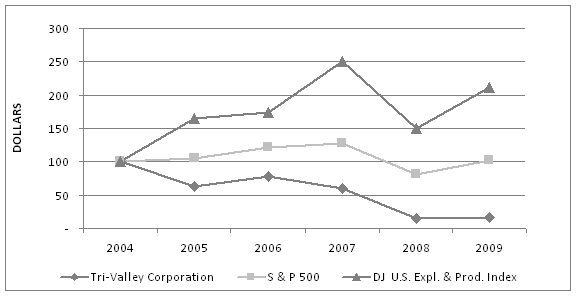
PERFORMANCE GRAPH
The following table compares the performance of Tri-Valley Corporation’s common stock with the performance of the Standard & Poor’s 500 Composite Stock Index and the Dow Jones U. S. Exploration and Production Index from December 31, 2004, through December 31, 2009. The table shows the performance of our common stock relative to two broad-based stock performance indices. The information is included for historical comparative purposes only and should not be considered indicative of future stock performance. The table and graph compare the yearly percentage change in the cumulative total stockholder return on $100 invested in our common stock with the cumulative total return of the two stock indices.
15
The stock performance graph assumes for comparison that the value of the Company’s common stock and of each index was $100 on December 31, 2004, and that all dividends were reinvested. Past performance is not necessarily an indicator of future results.
|
December 31,
|
||||||||||||||||||||||||
|
2004
|
2005
|
2006
|
2007
|
2008
|
2009
|
|||||||||||||||||||
|
Tri-Valley Corporation
|
$ | 100.0 | $ | 63.6 | $ | 77.6 | $ | 60.5 | $ | 14.7 | $ | 16.0 | ||||||||||||
|
S & P 500
|
$ | 100.0 | $ | 104.9 | $ | 121.5 | $ | 128.2 | $ | 80.7 | $ | 102.1 | ||||||||||||
|
DJ U.S. Expl. & Prod. Index
|
$ | 100.0 | $ | 165.0 | $ | 174.0 | $ | 250.0 | $ | 150.0 | $ | 211.0 | ||||||||||||
EQUITY COMPENSATION PLAN INFORMATION
The following table sets forth, for the Company's equity compensation plans, the number of options and restricted stock outstanding under such plans, the weighted-average exercise price of outstanding options, and the number of shares that remain available for issuance under such plans, as of December 31, 2009.
|
Total securities to be issued upon exercise of outstanding options or vesting of restricted stock
|
|||||||||
|
Plan category
|
Number
|
Weighted-average exercise price
|
Securities remaining available for future issuance under equity compensation plans (excluding securities reflected in column (a))
|
||||||
|
(a)
|
(b)
|
(c)
|
|||||||
|
Equity compensation plans approved by security holders
|
2,490,500 | $3.93 | 1,349,350 | ||||||
|
Equity compensation plans not approved by security holders
|
0 | 0 | 0 | ||||||
|
Total
|
2,490,500 | $3.93 | 1,349,350 | ||||||
16
ITEM 6. SELECTED HISTORICAL FINANCIAL DATA
|
Income Statement Data
|
|||||
|
2009
|
2008
|
2007
|
2006
|
2005
|
|
|
Revenues
|
1,448,001
|
8,124,700
|
11,016,107
|
4,936,723
|
12,526,110
|
|
Operating Income (Loss)
|
(10,661,937)
|
(14,209,174)
|
(8,746,830)
|
(5,881,276)
|
(4,919,707)
|
|
Loss from Discontinued Operations
|
-
|
-
|
-
|
(4,774,840)
|
(4,810,364)
|
|
Gain on Sale of Discontinued Operations
|
-
|
-
|
-
|
9,715,604
|
|
|
Income (Loss) before Minority Interest
|
(10,661,937)
|
(14,478,178)
|
(8,746,830)
|
(940,512)
|
(9,730,071)
|
|
Minority Interest
|
-
|
(269,005)
|
(139,939)
|
(27,341)
|
|
|
Net Loss
|
(10,661,937)
|
(14,209,174)
|
(8,606,891)
|
(913,171)
|
(9,730,071)
|
|
Basic Earnings per Share:
|
|||||
|
Loss from Continuing Operations
|
(0.33)
|
(0.54)
|
(0.35)
|
(0.25)
|
(0.22)
|
|
Income (Loss) from Discontinued Operations, Net
|
-
|
-
|
-
|
0.21
|
(0.21)
|
|
Basic Earnings Per Share:
|
(0.33)
|
(0.54)
|
(0.35)
|
(0.04)
|
(0.43)
|
|
Balance Sheet Data
|
|||||
|
2009
|
2008
|
2007
|
2006
|
2005
|
|
|
Property, Plant and Equipment, net
|
8,180,405
|
9,921,501
|
16,232,653
|
12,076,043
|
13,635,981
|
|
Total Assets
|
15,532,330
|
17,470,721
|
25,254,895
|
28,654,125
|
19,738,730
|
|
Current Liabilities
|
12,324,563
|
5,154,323
|
10,296,665
|
9,046,945
|
7,637,645
|
|
Long Term Obligations
|
1,746,662
|
2,165,578
|
2,596,101
|
2,963,562
|
4,528,365
|
|
Minority Interest
|
-
|
3,334,596
|
249,945
|
5,410,746
|
-
|
|
Stockholder's Equity
|
1,461,105
|
6,816,225
|
12,112,184
|
11,232,872
|
7,572,720
|
No cash dividends have been declared.
ITEM 7. MANAGEMENT’S DISCUSSION AND ANALYSIS OF FINANCIAL CONDITION
NOTICE REGARDING FORWARD-LOOKING STATEMENTS
This report contains forward-looking statements. The words, "anticipate," "believe," "expect," "plan," "intend," "estimate," "project," "could," "may," "foresee," and similar expressions are intended to identify forward-looking statements. These statements include information regarding expected development of the Company's business, lending activities, relationship with customers, and development in the oil and gas industry. Should one or more of these risks or uncertainties occur, or should underlying assumptions prove incorrect, actual results may vary materially and adversely from those anticipated, believed, estimated, or otherwise indicated.
OVERVIEW
Prices for crude oil tend to be influenced by large, national state oil companies based upon global supply and demand, while natural gas prices seem to be more dependent on national and local conditions. We expect that natural gas prices will hold steady over the next two years. If, however, prices should fall, due to new regulatory measures or the discovery of new and easily producible reserves, our revenue from crude oil and natural gas sales would also fall.
We continue grading and prioritizing our proprietary geologic library, which contains over 700 leads and prospects, in the State of California for exploratory drilling. We use our library, seismic database, and other geoscientific data as resources for determining future opportunities for potential exploration.
We believe we have acquired an inventory of under-explored and under-exploited properties with the potential to yield significant returns upon development. Our future results will depend on our success in finding new reserves, in commercially developing those reserves, and in developing the reserves we currently have. There can be no assurance as to the revenue we ultimately derive from any new discoveries. We do not engage in hedging activities and do not use commodity futures or forward contracts for commodity price risk management.
CRITICAL ACCOUNTING POLICIES
We prepare Consolidated Financial Statements for inclusion in this Report in accordance with accounting principles that are generally accepted in the United States ("GAAP"). Note 2 to our Consolidated Financial Statements
17
(contained in Item 8 of this Annual Report) contains a comprehensive discussion of our significant accounting policies. Critical accounting policies are those that may have a material impact on our financial statements and also require management to exercise significant judgment due to a high degree of uncertainty at the time the estimate is made. Our senior management has discussed the development and selection of our accounting policies, related accounting estimates and disclosures with the Audit Committee of our Board of Directors.
Preparation of our Consolidated Financial Statements under GAAP requires management to make estimates and assumptions that affect reported assets, liabilities, revenues, expenses, and some narrative disclosures. The estimates that are most critical to our Consolidated Financial Statements involve oil and gas reserves and impairment of oil and gas properties.
Oil and Gas Reserves. Estimates of our proved crude oil and gas reserves included in this report are prepared in accordance with GAAP and SEC guidelines and were based on evaluations prepared by independent petroleum engineers with respect to our properties. The accuracy of a reserve report estimate is a function of:
- The quality and quantity of available data;
- The interpretation of that data;
- The accuracy of various mandated economic assumptions; and
- The judgment of the persons preparing the estimate.
Because these estimates depend on many assumptions, all of which may substantially differ from actual future results, reserve estimates will be different from the quantities of oil and gas that are ultimately recovered. In addition, results of drilling, testing and production after the date of an estimate may justify material revisions to the estimate.
It should not be assumed that the present value of future net cash flows included in this Report as of December 31, 2009, is the current market value of our estimated proved reserves. Changes in crude oil and gas prices can cause revisions in our estimates if the sales price on which reserves are based makes it uneconomical to continue producing the reserves based on our current production costs. In 2008 and 2007, our average and year-end price received for natural gas was significantly higher than our average production costs, and it appeared unlikely that natural gas prices would fall far enough to result in an impairment based on historic prices. However, a significant fall in the price of crude oil in 2008 caused a reduction in our crude oil reserves and resulted in recording an impairment expense as discussed below. Because of the 2008 impairment of crude oil reserves to a value of zero, no further reduction was possible.
Estimates of proved reserves materially impact depletion expense. If the estimates of proved reserves decline, the rate at which we record depletion expense will increase, reducing future net income. Such a decline may result from lower market prices, which may make it uneconomical to drill for and produce higher cost fields. In addition, a decline in proved reserve estimates may impact the outcome of our assessment of its crude oil and natural gas producing properties for impairment.
Impairment of Proved Crude Oil and Natural Gas Properties. We review our long-lived proved properties, consisting of crude oil and natural gas reserves, at least annually and record impairments to those properties, whenever management determines that events or circumstances indicate that the recorded carrying value of the properties may not be recoverable. Proved crude oil and natural gas properties are reviewed for impairment by depletable field pool, which is the lowest level at which depletion of proved properties is calculated. Management assesses whether or not an impairment provision is necessary based upon its outlook for future commodity prices and net cash flows that may be generated by the properties. We determine that a property is impaired when prices being paid for crude oil or natural gas no longer make drilling or continued production profitable on that property. A dramatic price decrease in crude oil and natural gas prices during the second half of 2008 required the Company to impair reserves and record an impairment expense of $4.8 million for the year for proved properties. Price increases in prior years did reduce the instances where impairment of reserves appeared to be required; however, we did record impairment expense of $4.8 million in 2008 and $0.5 million in 2007, as a result of reducing potential future recoverable reserves. These assets are expected to remain impaired. We do not currently expect that changes in the price of natural gas would result in impairment of our natural gas properties because our production costs are significantly less than historic market prices. However, if natural gas prices in Northern California fall below our historic production costs of $1.50 to $1.60 per mcf, more of our proved developed reserves could become impaired. This, in turn, would reduce our estimates of future revenue, our proved reserve estimates, and our profitability.
18
OTHER SIGNIFICANT ACCOUNTING POLICIES
Successful Efforts Method of Accounting. We utilize the successful efforts method of accounting for crude oil and natural gas activities, as opposed to the alternate acceptable full cost method. In general, we believe that, during periods of active exploration, net assets and net income are more conservatively measured under the successful efforts method of accounting for crude oil and natural gas producing activities than under the full cost method. The critical difference between the successful efforts method of accounting and the full cost method of accounting is as follows: Under the successful efforts method, exploratory dry holes and geological and geophysical exploration costs are charged against earnings during the periods in which they occur; whereas, under the full cost method of accounting, such costs and expenses are capitalized as assets, pooled with the costs of successful wells, and charged against the earnings of future periods as a component of depletion expense.
Stock-Based Compensation. We adopted Financial Accounting Standards Board (FASB) Accounting Codification (ASC) Topic 718, Stock Compensation, to account for our Stock Option Plan, beginning January 1, 2006. This standard requires us to measure the cost of employee services received in exchange for an award of equity instruments, based on the grant date fair value of the award. The modified prospective method was selected. Under this method, we recognized stock option compensation expense as if we had applied the fair value method to account for unvested stock options from the original effective date. Stock option compensation expense was recognized from the date of grant to the vesting date. The fair value of each option award was estimated on the date of grant using the Black-Scholes option pricing model that used the following assumptions: Expected volatilities were based on the historical volatility of our stock; we used historical data to estimate option exercises and employee terminations within the valuation model; the expected term of options granted was based on historical exercise behavior and represented the period of time that options granted were expected to be outstanding. The Company used this methodology for valuing the stock option grants issued during 2009; the risk free rate for periods within the contractual life of the option was based on U.S. Treasury rates in effect at the time of grant.
Deferred Tax Asset Valuation Allowance. We adopted Financial Accounting Standards Board (FASB) Accounting Codification (ASC) Topic 740, to account for income taxes. We maintain a valuation allowance against our deferred tax assets, which result from net operating losses and statutory depletion carry forwards from prior years. ASC 740, Income Taxes, requires that the Company continually assess both positive and negative evidence to determine whether it is more likely than not that the deferred tax asset can be realized prior to its expiration. Considerable judgment is required in determining when these events may occur and whether recovery of an asset is more likely than not. Additionally, our federal and state income tax returns are generally not filed before the financial statements are prepared. Therefore, we estimate the tax basis of our assets and liabilities at the end of each calendar year, as well as, the effects of tax rate changes, tax credits, and tax credit carry forwards. Due to uncertainties involved with tax matters, the future effective tax rate may vary significantly from the estimated current year effective tax rate. ASC 740 clarifies the accounting for income taxes by prescribing the minimum recognition threshold as an uncertain tax position is required to meet before tax benefits associated with such uncertain tax positions are recognized in the financial statements. As of December 31, 2009, the Company has concluded that more likely than not it will not realize its gross deferred tax asset position, after giving consideration to relevant facts and circumstances. See Note 7 to our Consolidated Financial Statements.
We will continue to monitor company-specific, crude oil and natural gas industry economic factors and will reassess the likelihood that the Company’s net operating loss and statutory depletion carry forwards will be utilized prior to their expiration.
Commitments and Contingencies. We adopted Financial Accounting Standards Board (FASB) Accounting Codification (ASC) Topic 450, to account for commitments and contingencies. We make judgments and estimates regarding possible liabilities for litigation and environmental remediation on a quarterly basis. Management’s judgment is based on the advice and opinions of legal counsel and other advisers and the interpretation of laws and regulations, which can be interpreted differently by regulators or courts of the law. We have no ongoing environmental remediation. We routinely have clean-up and maintenance obligations in connection with crude oil and natural gas drilling and production activities, but we have never had a material environmental liability or claim. Actual costs can vary from such estimates for a variety of reasons. Environmental remediation liabilities are subject to change because of changes in laws and regulations; additional information obtained relating to the extent and nature of site contamination and improvements in technology. In accordance with ASC 450, a liability is recorded for these types of contingencies if the Company determines the loss to be both probable and reasonably estimated. A change in estimate could impact our oil and gas operating costs and the liability, if applicable, recorded on our balance sheet. See Note 11 of Notes to Consolidated Financial Statements included in Item 8 of our Consolidated Financial Statements for additional information regarding the Company’s commitments and contingencies.
19
ACCOUNTING FOR OIL AND GAS PRODUCING ACTIVITIES
Revenue Recognition: Crude oil and natural gas revenues from producing wells are recognized when title and risk of loss is transferred to the purchaser of the crude oil or natural gas.
Accounting for Suspended Well Costs: We adopted Financial Accounting Standards Board (FASB) Accounting Codification (ASC) Topic 932, to account for oil and gas production. Under this guidance, management is required to expense the capitalized costs of drilling an exploratory well if proved reserves are not found, unless reserves are found and the enterprise is making sufficient progress on assessing the reserves and the economic and operating viability of the project.
Oil and Gas Production: The Company sells its production at the monthly spot price. In 2008 and 2007, we sold our natural gas 100% on the spot market. Because we expected natural gas prices to hold steady, we sold 100% of our production on the spot market again in 2009. Thus, a drop in the price of natural gas in 2010 could possibly have a greater impact on us than if we entered into some fixed price contracts for sale of future production.
Our proved hydrocarbon reserves were valued using a standardized measure of discounted future net cash flows of $46.7 million at December 31, 2009, and $1.7 million at December 31, 2008, compared with $12.3 million and $6.1 million at December 31, 2007, and 2006, after taking into account a 10% discount rate and also taking into consideration the effect of income tax. Estimates such as these are subject to numerous uncertainties inherent in the estimation of quantities of proved reserves.
RIG OPERATIONS
In 2006, we created two new subsidiaries, Great Valley Production Services, LLC (“GVPS”), and Great Valley Drilling Company, LLC (“GVDC”). At year-end 2009, both companies were wholly-owned by the Company and inactive. Our sole drilling rig is presently idle, and we are exploring its sale.
MINING ACTIVITY
Precious Metals
In 2009, the monthly average price of gold fluctuated from $858.69 to $1,134.72, averaging $972.35 for the whole year.
The recent response by the federal government to the economic downturn appears to indicate that there may be continued strength for precious metal prices. The Company plans to maintain a strong focus on these properties.
Industrial Minerals
The Admiral Calder calcium carbonate quarry in Alaska (100% owned and managed by Select) is in a care-and- maintenance status. Select continued its market and operational assessment studies for the quarry's product as it is considered to be in the top one percent of high grade chemical and high brightness calcium carbonate deposits in the world and one of the few deposits to be directly on tidewater. Repair and maintenance activities at the site were initiated in 2007, expanded in 2008, and continued in 2009.
20
RESULTS OF OPERATIONS
We lost approximately $10.7 million in 2009 compared with losses of $14.2 million in 2008 and $8.6 million in 2007. Total revenue was $1.4 million in 2009 compared with revenues of $8.1 million in 2008 and $11.0 million in 2007.
Revenues
The Company identifies reportable operating segments by business or service provided. The Company includes revenues from external customers as well as revenues from transactions with other operating segments in its measure of segment profit or loss. The Company also allocates interest revenue and expense, DD&A, and other operating expenses in its measure of segment profit or loss.
The following table sets forth our revenues by segment for 2009, 2008, and 2007 in thousands of U.S. Dollars.
|
2009
|
2008
|
2007
|
||||||||||
| $ | % | $ | % | $ | % | |||||||
|
Oil and Gas
|
||||||||||||
|
Sales
|
1,036 | 72% | 3,759 | 46% | 1,083 | 10% | ||||||
|
Partnership Income
|
30 | 2% | - | 0% | 30 | 1% | ||||||
|
Total Oil and Gas Revenues
|
1,066 | 74% | 3,759 | 46% | 1,113 | 11% | ||||||
|
Rig Operations
|
- | 0% | 1,451 | 18% | 2,727 | 25% | ||||||
|
Minerals
|
47 | 3% | 142 | 2% | 580 | 5% | ||||||
|
Drilling and Devlopement
|
- | 0% | 2,589 | 32% | 6,132 | 55% | ||||||
|
Non-Segmented Items (Interest and Other)
|
335 | 23% | 184 | 2% | 464 | 4% | ||||||
|
Total Revenue
|
$ 1,448 | 100% | $ 8,125 | 100% | $ 11,016 | 100% | ||||||
Oil and Gas includes our share of revenues from crude oil and natural gas wells, on which Tri-Valley Oil & Gas Co. serves as operator. It also includes revenues as well as interest revenue attributable to our crude oil and natural gas operations, which we include in Interest Income on the Statement of Operations.
In 2009, total revenue from Oil and Gas decreased by 71.6% from 2008. The decrease of $2.7 million in crude oil revenue primarily resulted from halts in production during the second quarter at the Pleasant Valley Property.
In 2008, total revenue from Oil and Gas increased by 237% from 2007. The increase of $2.6 million in crude oil revenue was a result of increased oil prices and increased oil production primarily in the Pleasant Valley wells.
In 2007, revenues from Oil and Gas were $1.1 million or 9% lower than 2006. Most of this decrease was a result of declining production in the Martin-Severins, Webb Tract, and Hanson wells.
In 2006, we acquired drilling rigs and began Rig Operations through our subsidiaries, Great Valley Production Services, LLC, and Great Valley Drilling Company, LLC. There were no Rig Operations during 2009, as weak demand continued to idle our sole rig with no revenue for the year. Our revenues from Rig Operations decreased from $2.7 million in 2007 to $1.5 million in 2008. This resulted from the sale of our GVPS rigs and the idling of our GVDC rig for most of the year.
In each of the years 2008 and 2007, a significant source of revenue for the Company had been crude oil and natural gas Drilling and Development. There was no Drilling and Development revenue for 2009, given no drilling activity during the year. Revenues from our Drilling and Development segment decreased from $6.1 million in 2007 to $2.6 million in 2008. This resulted from a decrease in the number of wells drilled in 2008.
Minerals revenue declined by 67% in 2009 compared with 2008. In 2008, the Minerals segment revenue was $0.1 million for consulting services performed compared with $0.6 million in 2007, a decrease of $0.5 million or 75%.
21
Costs and Expenses
The following table sets forth our operating costs and expenses in thousands of U.S. Dollars:
|
2009
|
2008
|
2007
|
||||||||||
|
Oil and Gas Operations
|
5,936 | 6,069 | 1,141 | |||||||||
|
Rig Operations
|
442 | 1,424 | 2,142 | |||||||||
|
Minerals
|
247 | 371 | 618 | |||||||||
|
Drilling and Development
|
63 | 1,815 | 5,011 | |||||||||
|
Non-Segmented Items (G&A, Stock Options Expense
|
||||||||||||
|
Investment and Other)
|
5,422 | 12,924 | 10,851 | |||||||||
|
Total Costs and Expenses:
|
$ | 12,110 | $ | 22,603 | $ | 19,763 | ||||||
Total costs and expenses were $12.1 million for the year ended December 31, 2009, compared with $22.6 million for the year ended December 31, 2008. This reduction was primarily attributable to a decrease in expenses in Rig Operations and in Drilling and Development. Costs and expenses for the year ended December 31, 2007, were $19.8 million compared with $22.6 million in 2008.
Oil and Gas Operations costs and expenses for the year ended December 31, 2009, were $6.0 million compared with $6.1 million for year ended December 31, 2008. In 2008, Oil and Gas Operations costs and expenses were $4.9 million higher than for the year ended December 31, 2007. The $4.9 million increase was primarily due to impairment expense of $4.8 million. Because of the dramatic price decrease in crude oil and natural gas prices during the second half of 2008, the Company was required to record impairment for its proved reserves.
Rig Operations costs and expenses decreased by $1.0 million compared with the year ended December 31, 2008. The main component of rig costs and expenses is depreciation, and our Rig Operations were idle during 2009. 2008 Rig Operations costs and expenses were $1.4 million, a decrease of $0.7 million from 2007, due to a lack of demand for rigs and the idling of our GVDC rig for most of the year.
Costs and expenses for Minerals decreased by $0.1 million at December 31, 2009, from the year ended December 31, 2008. Minerals costs and expenses were $0.4 million in 2008, compared with $0.6 million in 2007, primarily due to an overall decrease in activity.
In 2009, Drilling and Development costs and expenses declined by $1.8 million from 2008 levels, as activity was halted, and the main component comprising costs and expenses was depreciation. Drilling and Development costs and expenses were $1.8 million in 2008, compared with $5.0 million for year ended 2007, due to a decrease in drilling turnkey wells.
Non-Segmented Items
The largest component of Non-Segmented Items costs and expenses was General and Administrative expense in 2009. As activity levels slowed during the year, overall costs declined. For the year ended December 31, 2009, Non-Segmented Items costs and expenses were $7.4 million lower than during the year ended December 31, 2008. General and Administrative expenses were $0.2 million higher in 2008 compared with 2007 due to higher salary, insurance, and legal expense resulting from an overall increase in activity.
Interest expense for 2009 was $0.2 million, a decrease of $0.01 million from the prior year. This reduction was attributable to a reduction in debt. Total Company interest expense for 2008 was $0.2 million, versus $0.3 million for 2007. That decrease was, likewise, due to a reduction in debt.
22
The following table summarizes our total operating income (loss) from continuing operations by segment in thousands of U.S. Dollars:
|
2009
|
2008
|
2007
|
||||||||||
|
Oil and Gas
|
(4,870 | ) | (2,310 | ) | (28 | ) | ||||||
|
Rig Operations
|
(442 | ) | 27 | 585 | ||||||||
|
Minerals
|
(200 | ) | (229 | ) | (38 | ) | ||||||
|
Drilling and Development
|
(63 | ) | 774 | 1,121 | ||||||||
|
Non-Segmented Items (G&A, Stock Options Expense
|
||||||||||||
|
Investment and Other)
|
(5,086 | ) | (12,740 | ) | (10,387 | ) | ||||||
|
Total Operating Income (Loss)
|
$ | (10,661 | ) | $ | (14,478 | ) | $ | (8,747 | ) | |||
FINANCIAL CONDITION
BALANCE SHEET
Cash at December 31, 2009, was $0.3 million, a $1.7 million decrease from 2008. At December 31, 2008, we had $2.0 million in cash and $0.9 million in restricted cash, compared with $7.7 million at December 31, 2007. $3.7 million of the cash at year end 2007 was restricted for use by the TVC OPUS 1 Drilling Program, L.P. All of the $2.0 million in cash at December 31, 2008, was unrestricted for the use of Tri-Valley Corporation. The decrease in cash from 2008 to 2009 was due primarily to increased lease operating activity. Proved Properties decreased from $0.2 million in 2008 to $0.02 million in 2009, due to impairment. Proved Properties decreased from $2.1 million in 2007 to $0.2 million in 2008, due to an impairment of $4.8 million. Unproved Properties decreased from $2.4 million in 2007 to $1.6 million in 2008 as a result of Unproved Properties at Pleasant Valley and Moffat Ranch being reclassified as Proved. Unproved Properties decreased $0.1 million in 2009 from $1.6 million in 2008 due to impairment. Rigs decreased from $6.7 million in 2007 to $1.5 million in 2008, due primarily to the sale of rigs previously owned by Great Valley Production Services, LLC. In 2009, Rigs decreased $0.4 million as a result of depreciation. Accounts Receivable TVOG Production Accrual increased from zero in 2007 to $1.0 million in 2008 due to an increase in production at the Pleasant Valley lease, which resulted in revenue being received the following year. Accounts Receivable TVOG Production Accrual decreased $1.0 million from December 31, 2008, to December 31, 2009, as a result of a decreased production. Accounts Receivable – Trade decreased $0.3 million from year end 2007 to year end 2008 due to a change in marketing channel. There was no material change in Accounts Receivable – Trade from year end 2008 to year end 2009. Investment in Marketable Securities decreased by $0.4 million from 2007 to 2008 because of a decrease in the value of the investment in Duluth Metals common stock. In 2009, the Company sold its investment in Duluth Metals common stock. (See Note 13 to the consolidated financial statements.) Accounts Receivable from Joint Venture Participants increased from $4.0 million in 2008 to $6.5 million in 2009 due to increased lease operating activity. (See Note 11 to the consolidated financial statements.)
Notes Payable decreased from $2.8 million in 2007 to $2.2 million in 2008 and to $1.8 million in 2009. These steady decreases were due to pay downs. (See Note 4 to the consolidated financial statements.)
Accounts Payable to Joint Venture Participants increased from $0.9 million in 2008 to $5.0 million in 2009. The increase was due to additional OPUS contributions of $4.1 million during the year.
Trade - Accounts Payable and Accrued Expenses decreased from $5.7 million in 2007 to $3.9 million in 2008, due to reductions of our balances with vendors. However, reduced production revenues and reduced funding in 2009 resulted in an increase of $1.9 million from the previous year.
Shareholder Equity decreased from $12.1 million in 2007 to $6.8 million in 2008. This was primarily due to a Net Loss of $14.2 million, Stock Issuance Cost of $1.3 million, and Other Comprehensive Income Loss of $0.2 million, offset by issuance of common stock of $10.8 million. In 2008, the Company sold its interest in Great Valley Production Services, LLC. The sale of the interest in GVPS, less minority interest earnings, accounted for $3.3 million in Minority Interest on the balance sheet during 2008. At December 31, 2009, Shareholder Equity decreased $5.4 million from the previous year end to $1.5 million. This was attributable to a loss of $10.6 million which was offset by the issuance of stock during the year.
23
CONSOLIDATED STATEMENT OF CASH FLOWS
OPERATING ACTIVITIES
Net Cash Used in Operating Activities was $2.7 million in 2009, compared with $17.1 million in 2008. Net Loss decreased from $14.2 million in 2008 to $10.7 million in 2009. The decrease in Net Loss was related primarily to the impairment of Proved Properties and Rigs in the prior year. Stock-Based Compensation Costs decreased from $0.7 million in 2008 to $0.6 million in 2009. We adopted Financial Accounting Standards Board (FASB) Accounting Codification (ASC) Topic 718, Share Based Compensation, which required expensing of stock options.
In 2009, $3.0 million was provided by an increase in Accounts Payable, compared to $2.0 million used by a decrease in Accounts Payable in 2008. The 2009 increase in Accounts Payable was due to a low cash balance, resulting from increased lease operating activities and reduced financing.
INVESTING ACTIVITIES
Net Cash Used by Investing Activities in 2009 was $3.2 million compared to Cash Used of $0.3 million for the same period in 2008. In 2009, $3.2 million was used to purchase the outside third party interest in Great Valley Production Services, LLC. Expenditures for capital equipment were $0.5 million in 2009, compared with $7.3 million in 2008. The decrease was due to a reduction in capital spending at the Pleasant Valley Lease.
FINANCING ACTIVITIES
Net Cash Provided by Financing Activities was $4.2 million in 2009, compared with $11.7 million for the period ending December 31, 2008. Principal Payments on Long-Term Debt used $0.4 million in 2009, compared with $0.5 million in 2008. Net Proceeds from the Sale of Minority Interest in Great Valley Production Services, LLC, were zero in 2009, compared with $3.6 million in 2008. Net Proceeds from the Issuance of Common Stock and Stock Options were $4.6 million in 2009 versus $8.6 million in 2008.
LIQUIDITY AND CAPITAL RESOURCES
The recoverability of our crude oil and natural gas reserves depends on future events, including obtaining adequate financing for our exploration and development program, successfully completing our planned drilling program, and achieving a level of operating revenues that is sufficient to support our cost structure. The Company had a cash balance of $2.0 million at December 31, 2008, which, subsequently, decreased to $0.3 million at year end 2009. Current liabilities at December 31, 2008, were $5.2 million which, subsequently, increased to $12.3 million at December 31, 2009. The Company remains dependent upon continued capital formation to cover operating and general and administrative expenses for fiscal 2010.
To date, the primary source for the Company’s capital has been investors in the TVC OPUS 1 Drilling Program, L.P. and the private placement of our common stock. Although we have always been successful in the past at attracting sufficient capital, we cannot be certain that additional financing will be available when needed. Insufficient funds may prevent us from continuing our operations.
The ability of the Company to continue as a going concern is dependent on additional sources of capital and the success of the Company’s plan. The financial statements do not include any adjustments that might be necessary if the Company is unable to continue as a going concern.
ITEM 7A. QUANTITATIVE AND QUALITATIVE DISCLOSURES ABOUT MARKET RISK
Crude Oil and Natural Gas Prices. Our financial condition, results of operations, and capital resources are highly dependent upon the prevailing market prices of, and demand for, crude oil and natural gas. These commodity prices are subject to wide fluctuations and market uncertainties due to a variety of factors that are beyond our control. We cannot predict future crude oil and natural gas prices with any degree of certainty. Sustained declines in crude oil and natural gas prices may adversely affect our financial condition and results of operations and may also reduce the amount of net crude oil and natural gas reserves that we can produce economically. We do not engage in hedging activities or purchases and sales of commodity futures contracts.
24
ITEM 8. FINANCIAL STATEMENTS
TRI-VALLEY CORPORATION
INDEX
|
Page
|
|
|
Report of Independent Registered Public Accounting Firm
|
26
|
|
Consolidated Balance Sheets at December 31, 2009, and 2008
|
27
|
|
Consolidated Statements of Operations for the Years Ended
|
|
|
December 31, 2009, 2008, and 2007
|
29
|
|
Consolidated Statements of Changes in Shareholders' Equity for the
|
|
|
Years Ended December 31, 2009, 2008, and 2007
|
30
|
|
Consolidated Statements of Cash Flows for the Years Ended
|
|
|
December 31, 2009, 2008, and 2007
|
31
|
|
Notes to Consolidated Financial Statements
|
33
|
|
Supplemental Information about Oil and Gas Producing
|
|
|
Activities (Unaudited)
|
53
|
25
REPORT OF INDEPENDENT REGISTERED
PUBLIC ACCOUNTING FIRM
To the Board of Directors and
Shareholders of Tri-Valley Corporation
We have audited the accompanying balance sheets of Tri-Valley Corporation as of December 31, 2009 and 2008, and the related statements of income, stockholders’ equity and comprehensive income, and cash flows for each of the years in the three-year period ended December 31, 2009. Tri-Valley Corporation’s management is responsible for these financial statements. Our responsibility is to express an opinion on these financial statements based on our audits.
We conducted our audits in accordance with the standards of the Public Company Accounting Oversight Board (United States). Those standards require that we plan and perform the audit to obtain reasonable assurance about whether the financial statements are free of material misstatement. An audit includes examining, on a test basis, evidence supporting the amounts and disclosures in the financial statements. An audit also includes assessing the accounting principles used and significant estimates made by management, as well as evaluating the overall financial statement presentation. We believe that our audits provide a reasonable basis for our opinion.
In our opinion, the financial statements referred to above present fairly, in all material respects, the financial position of Tri-Valley Corporation as of December 31, 2009 and 2008, and the results of its operations and its cash flows for each of the years in the three-year period ended December 31, 2009 in conformity with accounting principles generally accepted in the United States of America.
The accompanying financial statements have been prepared assuming that the Company will continue as a going concern. As discussed in Note 15 to the financial statements, the Company is dependent on raising additional capital; however, certain factors, such as the economic climate and interest rates, which directly affect the supply of capital, are beyond the Company’s control. As such, the Company has no certainty that capital will be available when needed, and these conditions raise substantial doubt about its ability to continue as a going concern. The financial statements do not include any adjustments that might result from the outcome of this uncertainty.
We also have audited, in accordance with the standards of the Public Company Accounting Oversight Board (United States), Tri-Valley Corporation’s internal control over financial reporting as of December 31, 2009, based on criteria established in Internal Control—Integrated Framework issued by the Committee of Sponsoring Organizations of the Treadway Commission (COSO), and our report dated March 26, 2010 expressed an adverse opinion.
BROWN ARMSTRONG
ACCOUNTANCY CORPORATION
/s/ Brown Armtrong Accountancy Corporation
Bakersfield, California
March 26, 2010
26
TRI-VALLEY CORPORATION
CONSOLIDATED BALANCE SHEETS
|
December 31, 2009
|
December 31, 2008
|
|||||||
|
(Audited)
|
(Audited)
|
|||||||
|
Current Assets:
|
||||||||
|
Cash
|
$ | 290,926 | $ | 2,000,787 | ||||
|
Accounts Receivable TVOG Production Accrual
|
33,623 | 963,413 | ||||||
|
Accounts Receivable - Trade
|
63,151 | 61,851 | ||||||
|
Accounts Receivable from Joint Venture Partners (Note 11)
|
6,505,092 | 3,988,754 | ||||||
|
Accounts Receivable - Other
|
25,717 | |||||||
|
Prepaid Expenses
|
16,889 | 12,029 | ||||||
|
Total Current Assets:
|
6,935,398 | 7,026,834 | ||||||
|
Property and Equipment - Net
|
||||||||
|
Proved Properties
|
25,265 | 153,546 | ||||||
|
Unproved Properties
|
1,551,998 | 1,616,919 | ||||||
|
Rigs
|
1,132,847 | 1,538,752 | ||||||
|
Other Property and Equipment
|
5,470,295 | 6,612,284 | ||||||
|
|
||||||||
|
Total Property and Equipment - Net (Note 3)
|
8,180,405 | 9,921,501 | ||||||
|
Other Assets
|
||||||||
|
Deposits
|
172,913 | 122,913 | ||||||
|
Investment in Marketable Securities (Note 13)
|
- | 32,668 | ||||||
|
Investments in Joint Venture Partnerships
|
17,400 | 17,400 | ||||||
|
Deferred Tax Asset
|
- | 123,079 | ||||||
|
Goodwill
|
212,414 | 212,414 | ||||||
|
Other
|
13,800 | 13,913 | ||||||
|
Total Other Assets
|
416,527 | 522,387 | ||||||
|
Total Assets
|
$ | 15,532,330 | $ | 17,470,721 | ||||
|
The accompanying notes are an integral part of these financial statements.
|
||||||||
27
TRI-VALLEY CORPORATION
CONSOLIDATED BALANCE SHEETS
|
LIABILITIES AND STOCKHOLDERS' EQUITY
|
||||||||
|
December 31, 2009
|
December 31, 2008
|
|||||||
|
(Audited)
|
(Audited)
|
|||||||
|
Current Liabilities
|
||||||||
|
Notes Payable (Note 4)
|
$ | 439,482 | $ | 389,648 | ||||
|
Accounts Payable to Joint Venture Partners (Note 11)
|
5,072,307 | 912,173 | ||||||
|
Trade - Accounts Payable and Accrued Expenses
|
5,962,774 | 3,852,502 | ||||||
|
Non Trade - Accounts Payable (Note 5)
|
850,000 | - | ||||||
|
Total Current Liabilities
|
12,324,563 | 5,154,323 | ||||||
|
Non-Current Liabilities
|
||||||||
|
Asset Retirement Obligation (Note 11)
|
351,013 | 327,845 | ||||||
|
Long-Term Portion of Notes Payable (Note 4)
|
1,395,649 | 1,837,733 | ||||||
|
Total Non-Current Liabilities
|
1,746,662 | 2,165,578 | ||||||
|
Total Liabilities
|
14,071,225 | 7,319,901 | ||||||
|
Minority Interest
|
- | 3,334,596 | ||||||
|
Stockholder' Equity
|
||||||||
|
Common Stock, $.001 par value; 100,000,000 shares
|
||||||||
|
authorized; 33,190,462* and 27,438,367 as of December 31, 2009 and
|
||||||||
|
December 31, 2008, respectively.
|
33,190 | 27,438 | ||||||
|
Less: Common Stock in Treasury, at cost; 100,025 shares
|
(13,370) | (13,370) | ||||||
|
Capital in Excess of Par Value
|
51,469,228 | 46,558,354 | ||||||
|
Additional Paid in Capital - Warrants
|
- | 360,842 | ||||||
|
Additional Paid in Capital - Stock Options
|
2,429,722 | 1,869,997 | ||||||
|
Accumulated Deficit
|
(52,457,665) | (41,795,727) | ||||||
|
Accumulated Other Comprehensive Income
|
(191,309) | |||||||
|
Total Stockholders' Equity
|
1,461,105 | 6,816,225 | ||||||
|
Total Liabilities and Stockholders' Equity
|
$ | 15,532,330 | $ | 17,470,721 | ||||
* Includes 5,153,332 contingently issuable shares at December 31, 2009, as per the Company’s contingent stock agreement for unregistered shares; those shares were, subsequently approved by the NYSE Amex, LLC, on January 5, 2010.
The accompanying notes are an integral part of these financial statements.
28
TRI-VALLEY CORPORATION
CONSOLIDATED STATEMENTS OF OPERATIONS
|
2009
|
2008
|
2007
|
||||||||||
|
Revenues
|
||||||||||||
|
Sale of Oil and Gas
|
$ | 1,035,916 | $ | 3,322,353 | $ | 761,279 | ||||||
|
Rig Income
|
- | 1,450,907 | 2,726,692 | |||||||||
|
Partnership Income
|
30,000 | - | 30,000 | |||||||||
|
Interest Income
|
10,295 | 39,273 | 282,785 | |||||||||
|
Drilling and Development
|
- | 2,588,650 | 6,131,613 | |||||||||
|
Gain on Sale of Asset
|
258,797 | - | - | |||||||||
|
Other Income
|
112,993 | 723,517 | 1,083,738 | |||||||||
|
Total Revenue
|
$ | 1,448,001 | $ | 8,124,700 | $ | 11,016,107 | ||||||
|
Costs and Expenses
|
||||||||||||
|
Mining Exploration Expenses
|
$ | - | $ | 386,994 | $ | 391,255 | ||||||
|
Production Costs
|
1,608,181 | 1,291,115 | 430,068 | |||||||||
|
Drilling and Development
|
- | 1,815,085 | 5,010,799 | |||||||||
|
Rig Operating Expenses
|
- | 1,109,399 | 1,374,649 | |||||||||
|
General & Administrative
|
7,592,575 | 10,523,490 | 10,372,892 | |||||||||
|
Interest
|
204,741 | 217,748 | 258,829 | |||||||||
|
Investment
|
269,005 | 168,702 | 203,782 | |||||||||
|
Depreciation, Depletion & Amortization
|
1,778,539 | 1,905,854 | 1,238,733 | |||||||||
|
Impairment Loss
|
422,590 | 5,184,492 | 481,930 | |||||||||
|
Loss on Available for Sale Securities
|
200,985 | - | - | |||||||||
|
Bad Debt
|
33,322 | - | - | |||||||||
| - | ||||||||||||
|
Total Costs and Expenses
|
$ | 12,109,938 | $ | 22,602,879 | $ | 19,762,937 | ||||||
|
Loss Before Minority Interest
|
$ | (10,661,937) | $ | (14,478,179) | $ | (8,746,830) | ||||||
|
Minority Interest
|
- | (269,005) | (139,939) | |||||||||
|
Net Loss
|
$ | (10,661,937) | $ | (14,209,174) | $ | (8,606,891) | ||||||
|
Basic Net Loss Per Share:
|
||||||||||||
|
Basic Loss Per Common Share (Note 6)
|
$ | (0.33) | $ | (0.54) | $ | (0.35) | ||||||
|
Weighted Average Number of Shares Outstanding
|
32,629,389 | 26,664,682 | 24,723,766 | |||||||||
|
Weighted Potentially Dilutive Shares Outstanding
|
35,159,148 | 29,515,887 | 28,061,401 | |||||||||
The accompanying notes are an integral part of these financial statements.
29
TRI-VALLEY CORPORATION
CONSOLIDATED STATEMENTS OF CHANGES IN STOCKHOLDERS' EQUITY
|
Total
Common
Shares
|
Treasure
Shares
|
Per
Value
|
Capital in
Excess of
Par Value
|
Additional Paid in Warrants & Stock Options
|
Accumulated
Deficit
|
Treasury
Stock
|
Other
Comprehensive Income
|
Stockholders’
Equity
|
||||||||||||||||||||||
|
Balance at December 31, 2006
|
23,546,655 | 100,025 | 23,407 | 28,692,780 | 1,509,717 | (18,979,662) | (13,370) | - | 11,232,872 | |||||||||||||||||||||
|
Issuance of common stock
|
1,530,529 | - | 9,479,833 | - | - | - | - | 9,479,833 | ||||||||||||||||||||||
|
Stock issuance costs
|
- | - | 1,670 | (1,081,900) | - | - | - | - | (1,080,230) | |||||||||||||||||||||
|
Warrants (see note 10)
|
- | - | - | - | 1,073,654 | - | - | - | 1,073,654 | |||||||||||||||||||||
|
Stock based compensation (see note 5)
|
- | - | - | - | - | - | - | - | ||||||||||||||||||||||
|
Unrealized gain on marketable securities
|
- | - | - | - | - | - | - | 12,945 | 12,945 | |||||||||||||||||||||
|
Net loss
|
(8,606,891) | - | (8,606,891) | |||||||||||||||||||||||||||
|
Balance at December 31, 2007
|
$ | 25,077,184 | $ | 100,025 | $ | 25,077 | $ | 37,090,713 | $ | 2,583,371 | $ | (27,586,553) | $ | (13,370) | $ | 12,945 | $ | 12,112,183 | ||||||||||||
|
Issuance of common stock
|
2,361,183 | - | - | 10,815,816 | - | - | - | - | 10,815,816 | |||||||||||||||||||||
|
Stock issuance costs
|
- | - | 2,361 | (1,348,176) | - | - | - | - | (1,345,815) | |||||||||||||||||||||
|
Warrants (see note 10)
|
- | - | - | - | (421,887) | - | - | - | (421,887) | |||||||||||||||||||||
|
Stock based compensation (see note 5)
|
- | - | - | - | 69,356 | - | - | - | 69,356 | |||||||||||||||||||||
|
Unrealized gain on marketable securities
|
- | - | - | - | - | - | - | (204,254) | (204,254) | |||||||||||||||||||||
|
(Net of tax $123,079)
|
- | - | - | - | - | - | - | - | - | |||||||||||||||||||||
|
Net loss
|
- | - | - | - | - | (14,209,173) | (14,209,173) | |||||||||||||||||||||||
|
Balance at December 31, 2008
|
27,438,367 | 100,025 | 27,438 | 46,558,353 | 2,230,840 | (41,795,726) | (13,370) | (191,309) | 6,816,226 | |||||||||||||||||||||
|
Issuance of common stock
|
5,752,095 | - | - | 6,045,360 | - | - | - | - | 6,045,360 | |||||||||||||||||||||
|
Stock issuance costs
|
- | - | 5,751 | (1,134,485) | - | - | - | - | (1,128,734) | |||||||||||||||||||||
|
Warrants (see note 10)
|
- | - | - | - | (360,842) | - | - | - | (360,842) | |||||||||||||||||||||
|
Stock based compensation (see note 5)
|
- | - | - | - | 559,725 | - | - | - | 559,725 | |||||||||||||||||||||
|
Realized gain on marketable securities
|
- | - | - | - | - | - | - | 191,309 | 191,309 | |||||||||||||||||||||
|
Net loss
|
- | - | - | - | - | (10,661,940) | - | - | (10,661,940) | |||||||||||||||||||||
|
Balance at December 31, 2009
|
33,190,462 | 100,025 | 33,189 | 51,469,228 | 2,429,723 | (52,457,666) | (13,370) | - | 1,461,104 | |||||||||||||||||||||
The accompanying notes are an integral part of these financial statements.
30
TRI-VALLEY CORPORATION
CONSOLIDATED STATEMENTS OF CASH FLOWS
|
For the Years Ended December 31,
|
||||||||||||
|
2009
|
2008
|
2007
|
||||||||||
|
Cash Flows from Operating Activities:
|
||||||||||||
|
Net Loss
|
$ | (10,661,937) | $ | (14,209,173) | $ | (8,606,891) | ||||||
|
Adjustments to Reconcile Net (Loss) to Net Cash
|
||||||||||||
|
provided (used) by Operating Activities:
|
||||||||||||
|
Depreciation, Depletion and Amortization
|
1,778,539 | 1,905,854 | 1,238,733 | |||||||||
|
Impairment, Dry Hole and Other Disposals of Property
|
422,590 | 5,184,492 | 481,930 | |||||||||
|
Minority Interest
|
- | (269,005) | (139,939) | |||||||||
|
Loss on Buyback of Minority Interest
|
- | 168,702 | 169,374 | |||||||||
|
Stock-based Compensation Costs, Net of Taxes
|
521,374 | 745,640 | 831,752 | |||||||||
|
Warrants Costs from Issuance of Restricted Common Stock
|
- | (374,867) | 384,352 | |||||||||
|
Marketable Securities
|
- | - | (380,000) | |||||||||
|
(Gain) or Loss on Sale of Property
|
(258,797) | (773,565) | - | |||||||||
|
Bad Debt Expense
|
33,322 | - | - | |||||||||
|
Director Stock Compensation
|
23,400 | 93,480 | 112,428 | |||||||||
|
Changes in Operating Capital:
|
||||||||||||
|
(Increase) or Decrease in Accounts Receivable
|
846,048 | (711,743) | 63,757 | |||||||||
|
(Increase) or Decrease in Prepaid Expenses
|
(4,860) | - | 30,500 | |||||||||
|
(Increase) or Decrease in Deposits and Other Assets
|
(49,887) | 222,359 | (28,939) | |||||||||
|
Increase or (Decrease) in Income Taxes Payable
|
- | - | - | |||||||||
|
Increase or (Decrease) in Accounts Payable, Deferred Revenue and Accrued Expenses
|
2,960,272 | (2,088,814) | 3,704,199 | |||||||||
|
Increase or (Decrease) in Amounts Payable to Joint Venture Partners and Related Parties
|
4,160,134 | 630,754 | 604 | |||||||||
|
Increase or (Decrease) in Accounts Receivable from Joint Venture Partners
|
(2,516,338) | (7,660,681) | (1,736,982) | |||||||||
|
Net Cash Provided (Used in) Operating Activities
|
(2,746,140) | (17,136,567) | (3,875,122) | ) | ||||||||
|
Cash Provided (Used) by Investing Actives
|
||||||||||||
|
Proceeds from the Sale of Property
|
287,084 | 7,388,654 | - | |||||||||
|
Buyback of Minority Interest in GVD/GVP
|
(3,334,595) | (418,647) | (5,019,440) | |||||||||
|
Proceeds from the Sale of Marketable Securities.
|
146,071 | 79,998 | - | |||||||||
|
Member Captial Distributions
|
- | - | (170,796) | |||||||||
|
Capital Expenditures
|
(465,153) | (7,306,831) | (5,853,593) | |||||||||
|
(Investment in) Marketable Securities
|
200,985 | - | (47,056) | |||||||||
| - | ||||||||||||
|
Net Cash Provided (Used) by Investing Activities
|
(3,165,608) | (256,826) | (11,090,885) | |||||||||
31
CONSOLIDATED STATEMENTS OF CASH FLOWS (Continued)
|
For the Years Ended December 31,
|
|||||
|
2009
|
2008
|
2007
|
|||
|
Cash Provided (Used) by Investing Actives
|
|||||
|
Principal Payments on Long-Term Debt
|
(392,249)
|
(530,328)
|
(1,109,241)
|
||
|
Net Proceeds from the Sale of Minority Interest
|
-
|
3,603,600
|
-
|
||
|
Net Proceeds from the Issuance of Warrants
|
-
|
-
|
268,197
|
||
|
Net Proceeds from the Issuance of Stock Options
|
21,500
|
39,150
|
-
|
||
|
Net Proceeds from the Issuance of Common Stock
|
4,572,636
|
8,614,066
|
7,876,529
|
||
|
Net Cash Provided (Used) by Financing Activities
|
4,201,887
|
11,726,488
|
7,035,485
|
||
|
Net Increase (Decrease) in Cash and Cash Equivalents:
|
(1,709,861)
|
(5,666,905)
|
(7,930,522)
|
||
|
Cash at the Beginning Year
|
2,000,787
|
7,667,693
|
15,598,215
|
||
|
Cash at End of Year
|
290,926
|
2,000,787
|
7,667,693
|
||
|
Interest paid
|
204,741
|
217,748
|
258,829
|
||
|
Income Taxes Paid
|
-
|
-
|
-
|
||
|
Non Cash Investing and Financing
|
|||||
|
Property Purchased with Debt
|
-
|
-
|
31,948
|
||
The accompanying notes are an integral part of these financial statements.
32
TRI-VALLEY CORPORATION
NOTES TO CONSOLIDATED FINANCIAL STATEMENTS
NOTE 1 – GENERAL
History and Business Activity
Tri-Valley Corporation (“Tri-Valley”, “TVC” or “the Company”) is a Delaware corporation which currently conducts its operations through five wholly-owned subsidiaries. TVC’s principal offices are located at 4550 California Avenue, Suite 600, Bakersfield, California 93309; telephone (661) 864-0500.
GENERAL
The Company's five subsidiaries are:
|
|
•
|
Tri-Valley Oil & Gas Co. (“TVOG”)—conducts our hydrocarbon (crude oil and natural gas) business. TVOG derives its revenue from crude oil and natural gas drilling.
|
|
|
•
|
Select Resources Corporation, Inc. (“Select”)—conducts our precious metals and industrial minerals business. Select holds and develops three major mineral assets in the State of Alaska.
|
|
|
•
|
Great Valley Production Services, LLC (“GVPS”)—conducts our oil production services, well work over services, and the business of refurbishment of oilfield equipment.
|
|
|
•
|
Great Valley Drilling Company, LLC (“GVDC”)—formed to operate an oil drilling rig in the State of Nevada.
|
|
|
•
|
Tri-Valley Power Corporation—is inactive at the present time.
|
|
Tri-Valley's businesses are organized into four operating segments:
|
|
|
-
|
Oil and Gas Operations—This segment represents our oil and gas business. Further, during 2009, this segment generated 74% of the Company’s revenues from operations.
|
|
-
|
Rig Operations—This segment consists of drilling rig operations and also includes income from the rental and sale of oil field equipment.
|
|
-
|
Minerals—This segment represents our precious metal and mineral prospects. In the past, it has generated revenues from pilot-scale mining projects and subcontracting exploration and business development projects. This segment holds title to land or leases in the State of Alaska. There was no significant precious metals activity in 2009.
|
|
-
|
Drilling and Development—This segment includes revenue received from crude oil and natural gas drilling and development operations performed for joint venture partners.
|
For additional information regarding Tri-Valley’s current developments and segments, please see PART II, ITEM 7. MANAGEMENT’S DISCUSSION AND ANALYSIS OF FINANCIAL CONDITION and Note 16 to the Consolidated Financial Statements.
Subsequent Events
Subsequent events have been evaluated through March 23, 2010, which is the date the financial statements were issued. Please see PART II, ITEM 8 FINANCIAL STATEMENTS, NOTE 15 – SUBSEQUENT EVENTS.
33
NOTE 2 - SUMMARY OF SIGNIFICANT ACCOUNTING POLICIES
This summary of significant accounting policies of Tri-Valley Corporation is presented to assist in understanding the Company's financial statements. The financial statements and notes are representations of the Company's management which is responsible for their integrity and objectivity. These accounting policies conform to accounting principles generally accepted in the United States of America and have been consistently applied in the preparation of the financial statements.
Principles of Consolidation
The consolidated financial statements include the accounts of the Company, its wholly-owned subsidiaries, TVOG, Select, GVDC, GVPS, and Tri-Valley Corporation. Other partnerships in which the Company has an operating or nonoperating interest, in which the Company is not the primary beneficiary, and has less than 51% ownership, are proportionately combined. These include the TVC OPUS 1 Drilling Program, L.P., Martins-Severin, Martins-Severin Deep, and Tri-Valley Exploration 1971-1 Partnership. All material intra- and intercompany accounts and transactions have been eliminated in combination and consolidation.
Use of Estimates in the Preparation of Financial Statements
The preparation of our consolidated financial statements in conformity with accounting principles generally accepted in the United States of America requires management to make estimates and assumptions that affect the reported assets, liabilities, revenues, expenses, and some narrative disclosures. Actual results could differ from those estimates. The estimates that are most critical to our consolidated financial statements involve crude oil and natural gas reserves, recoverability, impairment of reserves, and useful lives of assets.
Crude Oil and Natural Gas Reserves. Estimates of our proved crude oil and natural gas reserves included in this Report are prepared in accordance with GAAP and SEC guidelines and were based on evaluations audited by independent petroleum engineers with respect to our major properties. The accuracy of a reserve report estimate is a function of:
- The quality and quantity of available data;
- The interpretation of that data;
- The accuracy of various mandated economic assumptions; and
- The judgment of the petroleum engineers preparing the estimate.
Because these estimates depend on many assumptions, all of which may substantially differ from future actual results, reserve estimates will be different from the quantities of crude oil and natural gas that are ultimately recovered. In addition, results of drilling, testing, and production after the date of an estimate may justify material revisions to the estimate.
It should not be assumed that the present value of future net cash flows included in this Report as of December 31, 2009, is the current market value of our estimated proved reserves. In accordance with SEC requirements, we have based the estimated present value of future net cash flows from proved reserves on prices and costs averaged over the course of the past year. Actual future prices and cost may be materially higher or lower than the prices and costs as of the date of the estimate.
Estimates of proved reserves materially impact depletion expense. If the estimates of proved reserves decline, the rate at which we record depletion expense will increase, reducing future net income. Such a decline may result from lower market prices, which may make it uneconomical to drill for and produce higher cost fields. In addition, a decline in proved reserve estimates may impact the outcome of our assessment of crude oil and natural gas producing properties for impairment.
34
NOTE 2 - SUMMARY OF SIGNIFICANT ACCOUNTING POLICIES (Continued)
Asset Retirement Obligations. We have adopted Financial Accounting Standards Board (FASB) Accounting Codification (ASC) Topic 410, to account for asset retirement obligations. Under this guidance, management is required to make judgments based on historical experience and future expectations regarding the future abandonment cost of its crude oil and natural gas properties and equipment, as well as, an estimate of the discount rate to be used in order to bring the estimated future cost to a present value. The discount rate is based on the risk-free interest rate which is adjusted for our credit worthiness. The adjusted risk-free rate is then applied to the estimated abandonment costs to arrive at the obligation existing at the end of the period under review. We review our estimate of the future obligation quarterly and accrue the estimated obligation based on the above.
Cash Equivalent and Short-Term Investments
Cash equivalents include cash on hand and on deposit and highly liquid debt instruments with original maturities of three months or less.
Goodwill
The consolidated financial statements include the net assets purchased of Tri-Valley Corporation’s wholly-owned crude oil and natural gas subsidiary, TVOG. Net assets are carried at their fair market value at the acquisition date. We have adopted Financial Accounting Standards Board (FASB) Accounting Codification (ASC) Topic 350, to account for goodwill. Under ASC 350, goodwill is a non-amortizable asset and is subject to a periodic review for impairment. Prior to the implementation of ASC 350, the Company had goodwill of $0.2 million that was being amortized. The carrying amount of goodwill is evaluated periodically. Factors used in the evaluation include the Company’s ability to raise capital as a public company and anticipated cash flows from operating and non-operating mineral properties.
Accounts Receivable from/Payable to Joint Venture Partners
Advances received by the Company from joint venture partners for contract drilling projects, which are to be spent by the Company on behalf of the joint venture partners, are classified within operating inflows on the basis that they do not meet the definition of financing or investing activities. When the cash advances are spent, the payable is reduced accordingly. As expenses for additional operations are incurred, any expenses yet to be funded by joint venture partners become receivables from the joint venture partners due to the Company. Joint venture partner advances do not contribute to the Company's operating profits and are accounted for on the balance sheet as either receivables from, or payables to, the joint venture partners. The Company’s receivables from joint venture partners are, in effect, collateralized by the joint venture partners’ interests.
Revenue Recognition
Sale of Crude Oil and Natural Gas
Crude oil and natural gas revenues are recognized as the title and risk of loss transfers to a third party purchaser, net of royalties, discounts, and allowances, as applicable.
Drilling and Development
Crude oil and natural gas projects are developed by the Company for sale to industry partners and drilling investors. These projects are usually exploratory and include the costs of leasing, acquisition, and other geological and geophysical costs (hereafter referred to as “GGLA”), plus a profit to the Company. Prior to 2002, the Company recognized revenue and profit from projects when sold, irrespective of drilling commencement (“spudding”).
Starting in 2002, the Company changed its project offerings by inclusion of estimated costs of drilling in addition to GGLA costs. This offering is termed a “turnkey” exploratory drilling opportunity because drilling investors are charged only one certain amount in return for Tri-Valley drilling a well to an agreed depth. The drilling investor is charged the total “turnkey” amount and is not liable for any additional costs associated with drilling to the agreed
35
NOTE 2 - SUMMARY OF SIGNIFICANT ACCOUNTING POLICIES (Continued)
depth. Once the well is drilled to the agreed depth and revenue has been recognized, the drilling partners own 75% of the well, and Tri-Valley owns 25% of the well. If the well has been spudded, and the well is not drilled to the agreed depth or goes unlogged, Tri-Valley is responsible to drill another well to the agreed depth per the “turnkey” contract. The drilling partners are not obligated for any additional costs to drill another well for more than the original “turnkey” amount. Once the well is spudded, drilling investor money is not refundable. In conformity with the guidelines provided in ASC 605, Tri-Valley recognizes revenue when it is realized and earned.
Tri-Valley considers “turnkey” revenue to be earned when the well is logged. Amounts charged are included in an Authority for Expenditure (AFE), which is a budget for each project well. Tri-Valley prepares the AFE and bears all risk of well completion to the agreed total depth. If the well is drilled to the agreed total depth for actual costs less than the AFE amount, the Company realizes a profit. Conversely, if actual costs exceed the AFE, Tri-Valley realizes a loss and is liable for all costs beyond the “turnkey” amount.
Drilling Agreements/Joint Ventures
The Company frequently participates in drilling agreements, whereby it acts as operator of drilling and producing activities. As operator, TVOG is liable for the activities of these ventures.
Impairment of Long-Lived and Intangible Assets/Proved Crude Oil and Natural Gas Properties
Long-Lived and Intangible Assets. The Company evaluates its long-lived assets (property, plant, and equipment) and definite-lived intangible assets for impairment whenever indicators of impairment exist, or when it commits to sell the asset. The accounting standards require that if the sum of the undiscounted expected future cash flows from a long-lived asset or definite-lived intangible asset is less than the carrying value of that asset, an asset impairment charge must be recognized. The amount of the impairment charge is calculated as the excess of the asset’s carrying value over its fair value, which generally represents the discounted future cash flows from that asset, or in the case of assets the Company evaluates for sale, at fair value less costs to sell. A number of significant assumptions and estimates are involved in developing operating cash flow forecasts for the Company’s discounted cash flow model, sales volumes and prices, costs to produce, working capital changes, and capital spending requirements. The Company considers historical experience and all available information at the time the fair values of its assets are estimated. However, fair values that could be realized in an actual transaction may differ from those used to evaluate the impairment of long-lived assets and definite-lived intangible assets. Therefore, assumptions and estimates used in the determination of impairment losses may affect the carrying value of long-lived and intangible assets and possible impairment expense in the Company’s Consolidated Financial Statements.
Impairment of Proved Crude Oil and Natural Gas Properties. We review our long-lived proved properties, consisting of crude oil and natural gas reserves, at least annually and record impairments to those properties, whenever management determines that events or circumstances indicate that the recorded carrying value of the properties may not be recoverable. Proved crude oil and natural gas properties are reviewed for impairment by depletable field pool, which is the lowest level at which depletion of proved properties are calculated. Management assesses whether or not an impairment provision is necessary based upon its outlook of future commodity prices and net cash flows that may be generated by the properties. We determine that a property is impaired when prices being paid for crude oil or natural gas make it no longer profitable to drill on, or to continue production on, that property. Price increases over the past three years have reduced the instances where impairment of reserves appeared to be required.
If hydrocarbon prices, particularly natural gas prices, in Northern California begin to fall in the future, more of our proved developed reserves may become impaired. Such impairment would reduce our estimates of future revenue, our proved reserve estimates, and, potentially, our profitability.
Crude Oil and Natural Gas Property and Equipment (Successful Efforts)
The Company accounts for its crude oil and natural gas exploration and development costs using the successful efforts method. Under this method, costs to acquire mineral interests in crude oil and natural gas properties, to drill and complete exploratory wells that find proved reserves, and to drill and complete development wells are capitalized. Exploratory dry-hole costs, geological and geophysical costs, and costs of carrying and retaining unproved properties are expensed when incurred, except those GGLA expenditures incurred on behalf of joint venture drilling projects, which the Company defers until the GGLA is sold at the completion of project funding and the target project is drilled.
36
NOTE 2 - SUMMARY OF SIGNIFICANT ACCOUNTING POLICIES (Continued)
Expenditures incurred in drilling exploratory wells are accumulated as work in process until the Company determines whether the well has encountered commercial crude oil and natural gas reserves.
If the well has encountered commercial reserves, the accumulated cost is transferred to crude oil and natural gas properties; otherwise, the accumulated cost, net of salvage value, is charged to dry hole expense. If the well has encountered commercial reserves but cannot be classified as proved within one year after discovery, then the well is considered to be impaired, and the capitalized costs (net of any salvage value) of drilling the well are charged to expense. In 2009, 2008, and 2007 there was $0.4 million, $5.2 million, and $0.5 million, respectively, charged to expense for impairment of exploratory well costs. These impairments charges were related to crude oil and natural gas property impairments and do not include additional impairment charges related to equipment. Depletion, depreciation, and amortization of crude oil and natural gas producing properties are computed on an aggregate basis using the units-of-production method, based upon estimated proved developed reserves.
At December 31, 2009, and 2008, the Company carried unproved property costs of $1.55 million and $1.60 million, respectively. Generally accepted accounting principles require periodic evaluation of these costs on a project-by-project basis in comparison to their estimated value. These evaluations will be affected by the results of exploration activities, commodity price outlooks, planned future sales, or expiration of all or a portion of the leases, contracts, and permits appurtenant to such projects. If the quantity of potential reserves determined by such evaluations is not sufficient to fully recover the cost invested in each project, the Company will recognize non-cash charges in the earnings of future periods.
Capitalized costs relating to proved properties are depleted using the unit-of-production method, based on proved reserves. Costs of significant non-producing properties, wells in the process of being drilled, and development projects are excluded from depletion until such time as the related project is completed and proved reserves are established or, if unsuccessful, impairment is determined.
Upon the sale of crude oil and natural gas reserves in place, costs, less accumulated amortization of such properties, are removed from the accounts, and the resulting gain or loss on sale is reflected in operations. Impairment of non-producing leasehold costs and undeveloped mineral and royalty interests are assessed periodically on a property-by-property basis, and any impairment in value is charged to expense.
In addition, we assess the capitalized costs of unproved properties periodically to determine whether their value has been impaired below the capitalized costs. We recognize a loss to the extent that such impairment is indicated. In making these assessments, we consider factors such as exploratory drilling results, future drilling plans, and lease expiration terms. When an entire interest in an unproved property is sold, gain or loss is recognized, taking into consideration any recorded impairment. When a partial interest in an unproved property is sold, the amount is treated as a reduction of the cost of the interest retained, with excess revenue and carrying costs being recognized. Upon abandonment of properties, the reserves are deemed fully depleted, and any unamortized costs are recorded in the statement of operations under leases sold, relinquished, and impaired.
Mineral Properties
The Company has invested in several mineral properties with exploration potential. All mineral claim acquisition costs and exploration and development expenditures are charged to expense as incurred. We capitalize acquisition and exploration costs only after persuasive engineering evidence is obtained to support recoverability of these costs (ideally upon determination of proven and/or probable reserves based upon dense drilling samples and feasibility studies by a recognized independent engineer). Currently, no amounts have been capitalized.
Other Properties and Equipment
Properties and equipment are depreciated using the straight-line method over the following estimated useful lives:
|
Office furniture and fixtures
Vehicles, machinery, and equipment
Building
|
3 - 7 years
5 - 10 years
15 years
|
Leasehold improvements are amortized over the life of the lease.
37
NOTE 2 - SUMMARY OF SIGNIFICANT ACCOUNTING POLICIES (Continued)
Maintenance and repairs which neither materially add to the value of the property nor appreciably prolong its life are charged to expense as incurred. Gains or losses on dispositions of property and equipment other than crude oil and natural gas properties are reflected in operations.
Concentration of Credit Risk and Fair Value of Financial Instruments
The Company places its temporary cash investments with high credit quality financial institutions and limits the amount of credit exposure to any one financial institution. Total uninsured cash at 2009 year end was $0.3 million.
Fair value of financial instruments is estimated to approximate the related book value, unless otherwise indicated, based on market information available to the Company.
Stock Based Compensation Plans /Share-Based Payment
The Company has adopted Financial Accounting Standards Board (FASB) Accounting Codification (ASC) Topic 718, to account for stock based compensation plans. This Statement focuses primarily on the accounting for transactions in which an entity obtains employee services in share-based payment transactions. ASC 718 requires companies to recognize in the statement of operations the cost of employee services received in exchange for awards of equity instruments based on the grant-date fair value of those awards. This Statement was adopted in the first quarter of 2006. The Company used the modified prospective method, whereby the Company expensed the remaining portion of the requisite service under previously-granted, unvested awards outstanding as of January 1, 2006, and new share-based payment awards granted or modified after January 1, 2006. The Company used the Black-Scholes valuation method to estimate the fair value of its options. See Note 5 to the Consolidated Financial Statements in Item 8 for a further discussion related to the Company’s Stock Incentive Plan.
|
December 31,
|
December 31,
|
December 31,
|
|||||
|
2009
|
2008
|
2007
|
|||||
|
Net Income
|
As Reported
|
(10,661,937)
|
(14,209,174)
|
(8,606,891)
|
|||
|
Add: Stock-based compensation expense included in reported
|
|||||||
|
net income, net of tax benefit:
|
521,374
|
745,640
|
831,752
|
||||
|
Deduct: Stock-based compensation expense determined under
|
|||||||
|
fair value based method for all awards, net of tax
|
(521,374)
|
(745,640)
|
(831,752)
|
||||
|
Pro forma
|
(10,661,937)
|
(14,209,174)
|
(8,606,891)
|
||||
|
Earnings Per Share
|
As Reported
|
(0.33)
|
(0.54)
|
(0.35)
|
|||
|
Pro forma
|
(0.33)
|
(0.54)
|
(0.35)
|
38
NOTE 2 - SUMMARY OF SIGNIFICANT ACCOUNTING POLICIES (Continued)
Warrants are accounted for under the guidelines established by the Financial Accounting Standards Board (FASB) Accounting Codification (ASC) Topic 505. The Company calculates the fair value of warrants issued with the convertible instruments using the Black-Scholes valuation method, using the same assumptions used for valuing employee stock options for purposes of (ASC) 718, except that the expected life of the warrant is used. Under these guidelines, the Company allocates the value of the proceeds received. The price allocated for the warrants is calculated by subtracting the current market price of the stock from the total proceeds of the sale of the restricted stock with the warrant attached. The allocated fair value is recorded as Capital Paid In – Warrants. This allocated fair value of the proceeds from the sale of warrants is subtracted from the value of the warrants using the Black-Scholes valuation method to calculate the stock issuance expense.
Treasury Stock
The Company records acquisition of its capital stock for treasury at cost. Differences between proceeds for reissuance of treasury stock and average cost are charged to retained earnings or credited thereto to the extent of prior charges and thereafter to capital in excess of par value.
Recent Accounting Pronouncements
In January 2010, the Financial Accounting Standards Board (FASB) issued Accounting Standards Update (ASU) No. 2010-03, “Oil and Gas Reserve Estimation and Disclosures.” This ASU amends the FASB’s Accounting Standards Codification (ASC) Topic 932, “Extractive Activities-Oil and Gas” to align the accounting requirements of Topic 932 with the Securities and Exchange Commission’s final rule, “Modernization of the Oil and Gas Reporting Requirements” issued on December 31, 2008. In summary, the revisions in ASU 2010-3 modernize the disclosure rules to better align with current industry practices and expand the disclosure requirements for equity method investments so that more useful information is provided. More specifically, the main provisions include the following:
|
·
|
An expanded definition of oil and gas producing activities to include nontraditional resources such as bitumen extracted from oil sands.
|
|
·
|
The use of an average of the first-day-of-the-month price for the 12-month period, rather than a year-end price for determining whether reserves can be produced economically.
|
|
·
|
Amended definitions of key terms such as “reliable technology” and “reasonable certainty” which are used in estimating proved oil and gas reserve quantities.
|
|
·
|
A requirement for disclosing separate information about reserve quantities and financial statement amounts for geographical areas representing 15 percent or more of proved reserves.
|
|
·
|
Clarification that an entity’s equity investments must be considered in determining whether it has significant oil and gas activities and a requirement to disclose equity method investments in the same level of detail as required for consolidated investments.
|
This ASU is effective for annual reporting periods ended on or after December 31, 2009, and it requires (1) the effect of the adoption to be included within each of the dollar amounts and quantities disclosed, (2) qualitative and quantitative disclosure of the estimated effect of adoption on each of the dollar amounts and quantities disclosed, if significant and practical to estimate and (3) the effect of adoption on the financial statements, if significant and practical to estimate. Adoption of these requirements did significantly impact our reported reserves.
The FASB issued ASU No. 2009-01 in June 2009. This Update, also issued as FASB Statement of Financial Accounting Standards (SFAS) No. 168, “The FASB Accounting Standards Codification and the Hierarchy of Generally Accepted Accounting Principles,” is effective for financial statements issued after September 15, 2009. Update 2009-01 requires that the FASB’s ASC become the sole source of authoritative U.S. generally accepted accounting principles recognized by the FASB for nongovernmental entities. We adopted this Update effective July 1, 2009.
39
NOTE 2 - SUMMARY OF SIGNIFICANT ACCOUNTING POLICIES (Continued)
On September 30, 2009, the Company adopted Statement of Financial Accounting Standards No. 168, The FASB Accounting Standards Codification TM and The Hierarchy of Generally Accepted Accounting Principles (“ASC” or “Codification” – a replacement of FASB Statement No.162). The Codification became the source of authoritative generally accepted accounting principles recognized by the Financial Accounting Standards Board (“FASB”) to be applied by nongovernmental entities. Rules and interpretive releases of the U.S. Securities and Exchange Commission (the “SEC”) under authority of federal securities laws are also sources of authoritative GAAP for SEC registrants. The Codification supersedes all existing non-SEC accounting and reporting standards. All other non-grandfathered, non-SEC accounting literature not included in the Codification is non-authoritative. GAAP is not intended to be changed as a result of this statement, but will change the way the guidance is organized and presented. The Company has implemented the Codification in the consolidated financial statements by providing references to the ASC topics.
In May 2009, the FASB issued FASB ASC 855-10-05, “Subsequent Events”, formerly referenced as SFAS No. 165, “Subsequent Events” to establish general standards of accounting for and disclosure of subsequent events. FASB ASC 855 renames the two types of subsequent events as recognized subsequent events or non-recognized subsequent events and to modify the definition of the evaluation period for subsequent events as events or transactions that occur after the balance sheet date, but before the financial statements are issued. This will require entities to disclose the date, through which an entity has evaluated subsequent events and the basis for that date (the issued date for public companies). FASB ASC 855 is effective for interim or annual financial periods ending after June 15, 2009. The Company adopted FASB ASC 855 during the quarter ended June 30, 2009. The required disclosures of the statement have been incorporated into the Company’s consolidated financial statements.
We adopted FSP No. FAS 157-4, Determining Fair Value When the Volume and Level of Activity for the Asset or Liability Have Significantly Decreased and Identifying Transactions That Are Not Orderly (currently included in ASC 820-10-65-4) as of June 30, 2009. This FSP provides guidance for estimating the fair value of an asset or liability when the volume and level of activity for the asset or liability have significantly decreased, as well as guidance on identifying circumstances that indicate a transaction is not orderly. It also requires disclosure in interim and annual periods of the inputs and valuation techniques used to measure fair value and a discussion of changes in valuation techniques and related inputs, if any, during the period. The adoption of this statement did not have a significant impact on our consolidated financial statements.
We have adopted Financial Accounting Standards Board (FASB) Accounting Codification (ASC) Topic 805, to account forBusiness Combinations. These statements significantly change the accounting for business combinations and noncontrolling interests. Among other things, these statements require more assets acquired and liabilities assumed to be measured at fair value as of the acquisition date, liabilities related to contingent consideration to be re-measured to fair value each subsequent reporting period, an acquirer in pre-acquisition periods to expense all acquisition-related costs, and noncontrolling interests in subsidiaries initially to be measured at fair value and to be presented separately in the financial statements. The adoption of this statement did not have a significant impact on our consolidated financial statements.
We have adopted Financial Accounting Standards Board (FASB) Accounting Codification (ASC) Topic 805, Accounting for Assets Acquired and Liabilities Assumed in a Business Combination that Arise from Contingencies, on January 1, 2009. This ASC requires assets acquired and liabilities assumed in a business combination that arise from contingencies to be recognized at fair value if fair value can be reasonably estimated. If fair value of such assets and liabilities cannot be reasonably estimated, the assets or liabilities would generally be recognized in accordance with (ASC) Topic 450, “Accounting for Contingencies”, and Reasonable Estimation of the Amount of a Loss. Further, this ASC requires contingent consideration arrangements of an acquiree assumed by the acquirer in a business combination to be initially recognized and subsequently measured at fair value in accordance with (ASC) 718. The adoption of this (ASC) did not have a significant impact on our consolidated financial statements.
40
NOTE 3 – PROPERTY AND EQUIPMENT
|
Property, Plant and Equipment consist of the following:
|
||||||||
|
2009
|
2008
|
|||||||
|
Oil and Gas - California
|
||||||||
|
Proved Properties, Gross
|
$ | 1,071,216 | $ | 1,175,566 | ||||
|
Accumulated Depletion
|
(1,045,951) | (1,022,021) | ||||||
|
Proved Properties, Net
|
25,265 | 153,545 | ||||||
|
Unproved Properties
|
1,551,998 | 1,616,919 | ||||||
|
Total Oil and Gas Properties
|
1,577,263 | 1,770,464 | ||||||
|
Other Property and Equipment
|
||||||||
|
Land
|
21,281 | 21,281 | ||||||
|
Building
|
45,124 | 45,124 | ||||||
|
Machinery & Equipment
|
7,698,587 | 7,601,054 | ||||||
|
Rigs
|
2,170,419 | 2,170,411 | ||||||
|
Vehicles
|
890,272 | 890,272 | ||||||
|
Transmission Tower
|
- | 51,271 | ||||||
|
Office Furniture and Equipment
|
154,816 | 154,624 | ||||||
|
Total Other Property and Equipment, Gross
|
10,980,499 | 10,934,037 | ||||||
|
Accumulated Depreciation
|
(4,377,357) | (2,783,000) | ||||||
|
Total Other Property and Equipment, Net
|
6,603,142 | 8,151,037 | ||||||
|
Property, Plant and Equipment, Net
|
$ | 8,180,405 | $ | 9,921,501 | ||||
Depreciation and depletion expense for the year ended December 31, 2009, was $1.8 million, and for the year ended December 31, 2008, was $1.9 million. The carrying amount of assets pledged as collateral for the year ended December 31, 2009, was $2.7 million. In 2008, the carrying amount of assets pledged as collateral was $3.1 million.
41
|
NOTE 4 - NOTES PAYABLE
|
||||||||
|
2009
|
2008
|
|||||||
|
Note payable to Rabobank dated October 5, 2005. The note is secured by a vehicle at an interest rate of 6.5%, payable in 60 monthly installments of $599.
|
$ | 5,813 | $ | 12,380 | ||||
|
Note payable to Jim Burke Ford dated November 18, 2005; secured by a vehicle; interest at 6.49%; payable in 60 monthly installments of $714.
|
7,602 | 15,387 | ||||||
|
Note payable to Sealaska Corporation dated July 15, 2005; secured by mining machines and equipment; imputed interest at 7.5%; payable in 10 yearly installments of $200,000. Face amount was $2,000,000 before the imputed interest discount of $627,184 which
|
944,551 | 1,029,405 | ||||||
|
Note payable to Three Way Chevrolet dated April 03, 2006; secured by a vehicle; interest at 5.90%; payable in 60 monthly installments of $577.
|
8,865 | 15,073 | ||||||
|
Note payable to Three Way Chevrolet dated February 24, 2006; secured by a vehicle; interest at 9.86%; payable in 60 monthly installments of $1,324.
|
- | 31,937 | ||||||
|
Note payable to Moss Family Trust dated February 14, 2006; secured by 200,000 shares of Tri Valley corporation unregistered restricted common stock; interest at 12.00%; payable in 60 monthly installments of $13,747.
|
190,604 | 323,876 | ||||||
|
Note payable to Moss Family Trust dated March 8, 2006; secured by 80,000 shares of Tri Valley corporation unregistered restricted common stock; interest at 12.00%; payable in 60 monthly installments of $5,728
|
79,418 | 134,948 | ||||||
|
Note payable to Three Way Chevrolet dated January 22, 2007; secured by a vehicle; interest at 6.90%; payable in 60 monthly installments of $622.
|
14,450 | 20,685 | ||||||
|
Note payable to Gary D, Borgna and Julie R. Borgna, and Equipment 2000 dated December 30, 2006; secured by Rig Equipment; imputed interest at 8.00%; payable in 120 monthly installments of $9,100 and a payment of $300,000 paid January 3, 2007. Face amount
|
583,828 | 643,690 | ||||||
|
Total Debt at December 31, 2009
|
1,835,131 | 2,227,381 | ||||||
|
Less Current Portion
|
439,482 | 389,648 | ||||||
|
Long-Term Portion of Notes Payable
|
$ | 1,395,649 | $ | 1,837,733 | ||||
|
Maturities of long-term debt for the years subsequent to December 31, 2009 are as
follows:
|
||||||||
| 2010 | 439,483 | |||||||
| 2011 | 280,142 | |||||||
| 2012 | 226,419 | |||||||
| 2013 | 243,345 | |||||||
| 2014-2016 | 645,743 | |||||||
| $ | 1,835,131 | |||||||
42
NOTE 5 - RELATED PARTY TRANSACTIONS
Non Trade - Accounts Payable
At December 31, 2009, the Company had a related-party payable of $0.8 million to Mr. G. Thomas Gamble, Director and Vice Chairman of the Board of Directors, and our largest shareholder. This payable resulted from Mr. Gamble’s ordinary, intended purchase of the Company’s common stock. When it was determined that the intended purchase of shares did not satisfy NYSE Amex, LLC, exchange requirements, the Company did not provide timely notice to Mr. Gamble. Upon such notification, the Company offered Mr. Gamble a refund of his investment funds. The Company remains in negotiation with Mr. Gamble on this transaction.
Employee Stock Options
The Company has a qualified and a nonqualified stock option plan, which provides for the granting of options to key employees, consultants, and non employee directors of the Company. The 2009 stock option expense was $0.5 million.
The purpose of the Company's stock option plans is to further the interest of the Company by enabling officers, directors, employees and consultants of the Company to acquire an interest in the Company by ownership of its stock through the exercise of stock options granted under its stock option plan which are vested in one to four years.
The option price, number of shares and grant date are determined at the discretion of the Company’s board of directors. The 1998 stock option plan was supplemented with the 2005 plan. All newly issued stock option grants are issued from the 2005 plan. The 2005 plan provides for the issuance of 2,625,000 stock options with 1,349,350 remaining to be issued as of December 31, 2009. Options granted under the plans are exercisable upon vesting. The vesting dates are determined in the stock option award and the contractual life is up to ten years. The plan expires in October 2015.
The fair value of each option grant is estimated on the date of grant using the Black-Scholes American option-pricing model with the following weighted-average assumptions used for grants in 2009.
|
Year
|
Expected Life
|
Expected Dividends
|
Expected Volatility
|
Risk-Free Interest Rates
|
||||
|
2009
|
3.00
|
None
|
115%
|
1.0%
|
The expected exercise life is based on management estimates of future attrition and early exercise rates after giving consideration to recent employee exercise behavior. Expected dividend yield is based on the Company’s dividend history and anticipated dividend policy. Expected volatility is based on historical volatility for the Company’s common stock. The risk-free interest rate is based on a yield curve of interest rates at the time of the grant based on the contractual life of the option.
43
NOTE 5 - RELATED PARTY TRANSACTIONS (Continued)
Employee Stock Options (continued)
The following table summarizes information about fixed stock options outstanding at December 31, 2009:
|
Range of Exercise Prices
|
Number Outstanding
at December 31, 2009
|
Number Outstanding & exercisable
at December 31, 2009
|
Weighted-Average
Remaining Contractual Life
|
Weighted-Average
Exercise Price
|
Intrinsic Value(1) at December 31,
2009
(in thousands)
|
||||||||||||||
| $ | .50 - $10.00 | 2,490,500 | 1,849,000 |
3.8 years
|
$ | 3.89 | $ | 826 | |||||||||||
(1) Based on the difference between the exercise price per share and the $1.96 market price per share as of December 31, 2009
The following table summarizes information about fixed stock options outstanding at December 31, 2008:
|
Number Outstanding
|
Number Outstanding & exercisable
|
Weighted-Average
|
Weighted-Average
|
Intrinsic Value(1) at December 31,
|
|||||||||||||||
|
Range of Exercise Prices
|
at December 31, 2008
|
at December 31, 2008
|
Remaining Contractual Life
|
Exercise Price
|
2008
(in thousands)
|
||||||||||||||
| $ | .50 - $10.00 | 2,405,350 | 1,860,350 |
3.5 years
|
$ | 3.49 | $ | 590 | |||||||||||
(1) Based on the difference between the exercise price per share and the $1.80 market price per share as of December 31, 2008
The following table summarizes information about fixed stock options outstanding at December 31, 2007:
|
Number Outstanding
|
Number Outstanding & exercisable
|
Weighted-Average
|
Weighted-Average
|
Intrinsic Value(1) at December 31,
|
|||||||||||||||
|
Range of Exercise Prices
|
at December 31, 2007
|
at December 31, 2007
|
Remaining Contractual Life
|
Exercise Price
|
2007
(in thousands)
|
||||||||||||||
| $ | .50 - $10.00 | 2,967,350 | 2,417,850 |
3.8 years
|
$ | 2.64 | $ | 11,509 | |||||||||||
(1) Based on the difference between the exercise price per share and the $7.40 market price per share as of December 31, 2007
44
NOTE 5 - RELATED PARTY TRANSACTIONS (Continued)
Employee Stock Options (continued)
Unrecognized Compensation Expense. At December 31, 2009 there was $1.2 million of unrecognized compensation expense related to unvested awards granted under the Company’s stock option plan. This amount is expected to be charged to expense over a weighted-average period of two years.
A summary of the status of the Company's fixed stock option plan as of December 31, 2009, 2008, and 2007 and changes during the years ending on those dates is presented below:
|
2009
|
2008
|
2007
|
||||||||||||||||||||||
|
Weighted
|
Weighted
|
Weighted
|
||||||||||||||||||||||
|
Average
|
Average
|
Average
|
||||||||||||||||||||||
|
Exercise
|
Exercise
|
Exercise
|
||||||||||||||||||||||
|
Shares
|
Price
|
Shares
|
Price
|
Shares
|
Price
|
|||||||||||||||||||
|
Fixed Options
|
||||||||||||||||||||||||
|
Outstanding at beginning of year:
|
2,405,350 | $ | 4.37 | 2,967,350 | $ | 3.50 | 2,914,850 | $ | 2.67 | |||||||||||||||
|
Granted
|
595,000 | $ | 1.52 | 350,000 | $ | 6.06 | 700,000 | $ | 7.41 | |||||||||||||||
|
Exercised
|
(63,000) | $ | 0.69 | (796,000) | $ | 1.29 | (440,000) | $ | 1.99 | |||||||||||||||
|
Forfeited
|
(446,850) | $ | 3.56 | (116,000) | $ | 8.41 | (207,500) | $ | 8.26 | |||||||||||||||
|
Outstanding at end of year
|
2,490,500 | $ | 3.93 | 2,405,350 | $ | 4.37 | 2,967,350 | $ | 3.50 | |||||||||||||||
|
Options exercisable at year-end
|
1,849,000 | $ | 3.89 | 1,860,850 | $ | 3.49 | 2,417,850 | $ | 2.64 | |||||||||||||||
|
Weighted-average fair value of
|
||||||||||||||||||||||||
|
options granted during the year:
|
$1.11 | $1.89 | $4.00 | |||||||||||||||||||||
|
Available for issuance
|
1,349,350 | 1,597,500 | 1,831,500 | |||||||||||||||||||||
A summary of the status of the Company’s non-vested options as of January 1, 2009 and changes during the year ended December 31, 2009, is presented below:
|
Number of Shares
|
Weighted-Average Grant-Date Fair Value
|
|||||||
|
Non-vested at January 1, 2009
|
545,000 | $ | 2.12 | |||||
|
Granted
|
595,000 | $ | 1.11 | |||||
|
Vested
|
(114,000 | ) | $ | 0.99 | ||||
|
Forfeited
|
(384,500 | ) | $ | 1.36 | ||||
|
Non-vested at December 31, 2009
|
641,500 | $ | 1.84 | |||||
45
NOTE 5 - RELATED PARTY TRANSACTIONS (Continued)
Partnerships
Tri-Valley sells oil and gas drilling prospects and equipment to partnerships that are sponsored by Tri-Valley and sold to private investors for the purpose of oil and gas drilling and development. The Company accounts for these partnerships on the pro rata combination method. Drilling and development revenue related to the TVC OPUS 1 Drilling Program, L.P. for the fiscal year ended December 31, 2009, 2008, and 2007, follows:
|
December 31,
|
||||||||||||
|
2009
|
2008
|
2007
|
||||||||||
|
Drilling and Development Revenue
|
$ | - | $ | 2,588,650 | $ | 6,131,613 | ||||||
|
Drilling and Development Costs
|
$ | - | $ | 1,815,085 | $ | 5,010,799 | ||||||
|
Oil and gas income from the Tri-Valley Oil & Gas Exploration Programs 1971-1 for fiscal year-ended December 31, 2009, 2008, and 2007, follows:
|
||||||||||||
|
Partnership Income, Net of Expenses
|
$ | 30,000 | $ | - | $ | 30,000 | ||||||
At December 31, 2009, Accounts Receivable from Joint Venture Partners were $6.5 million; Accounts Payable to Joint Venture Partners were $5.1 million. The difference of $1.4 million represents a net receivable from the joint venture partners to the Company. With participation from joint venture partners in the TVC OPUS 1 Drilling Program, L.P., during 2010, the Company will formulate a plan for the development and financing of the Pleasant Valley project to provide the optimal economic return and liquidity for the OPUS investors. Among the Company’s objectives from this plan will be the consolidation and elimination of any receivables and payables among the joint venture partners and the Company. (See Note 11 for further discussion.)
NOTE 6 – EARNINGS PER SHARE
|
Full Year Basic
|
Weighted
|
Weighted Average
|
||||||
|
Earnings (Loss)
|
Average Shares
|
Potentially Dilutive
|
||||||
|
Year
|
Per Share
|
Outstanding
|
Shares Outstanding
|
|||||
|
2009
|
$ | (0.33) | 32,629,389 | 35,159,148 | ||||
|
2008
|
$ | (0.54) | 26,664,682 | 29,515,887 | ||||
|
2007
|
$ | (0.35) | 24,723,766 | 28,061,401 | ||||
The diluted earnings per share amounts are based on weighted-average shares outstanding plus common stock equivalents. Common stock equivalents include stock options and awards and common stock warrants. Common stock equivalents excluded from the calculation of diluted earnings per share due to the effect was anti-dilutive.
46
NOTE 7 - INCOME TAXES
As of December 31, 2009, the Company had available net operating loss carry forwards for federal and state tax purposes of $36.2 million and $32.0 million, respectively, which begin to expire in 2025 and 2015, respectively. The Company also had available as of December 31, 2008, federal and state statutory depletion allowance carry forwards of $1.8 million, which do not expire.
|
December 31,
|
December 31,
|
December 31,
|
||||||||||
|
2009
|
2008
|
2007
|
||||||||||
|
Net operating loss carry forwards
|
19,741,824 | 14,813,815 | 9,219,236 | |||||||||
|
Statutory depletion carry forwards
|
531,400 | 684,835 | 540,330 | |||||||||
|
Unrealized loss on investment available for sale.
|
- | 123,079 | - | |||||||||
| 20,273,224 | 15,621,729 | 9,759,566 | ||||||||||
|
Less: deferred tax asset valuation allowance
|
(20,273,224) | (15,498,650) | (9,759,566) | |||||||||
|
Net deferred tax assets
|
$ | - | $ | 123,079 | $ | - | ||||||
NOTE 8 - MAJOR CUSTOMERS
Crude Oil and Natural Gas
We sell substantially all of our crude oil and natural gas production to Santa Maria Refining Company; Kern Oil & Refining Co.; DMJ Gas Marketing Consultants, LLC; and California Energy Exchange Corporation. All of our crude oil and natural gas is sold at spot market.
NOTE 9 - FINANCIAL INFORMATION RELATING TO INDUSTRY SEGMENTS
The Company reports operating segments according to Financial Accounting Standards Board (FASB) Accounting Codification (ASC) Topic 280, “Segment Reporting”.
The Company identifies reportable segments by product. The Company includes revenues from both external customers and revenues from transactions with other operating segments in its measure of segment profit or loss. The Company also includes interest revenue and expense, DD&A, and other operating expenses in its measure of segment profit or loss.
The Companies’ total reportable segment revenue and segment net income (loss) do not correspond with the enterprises consolidated revenue and consolidated income (loss) before income taxes. The Company’s segment revenue excludes other income and partnership income which are not affiliated with external customers, when compared to the enterprises consolidated revenue. The company’s segment net income (loss) does not include minority interest when compared to the enterprise’s consolidated income (loss) before income taxes.
|
The Company’s operations are classified into four principal segments:
|
|
|
-
|
Oil and gas operations represent our oil and gas business. Further, during 2009, this segment generated 74% of the Company’s revenues from operations.
|
|
-
|
Rig operations consist of drilling rig operations and also include income from the rental and sale of oil field equipment.
|
|
-
|
Minerals represent our precious metal and mineral prospects. This segment holds title to land or leases in the State of Alaska. There was no significant precious metals activity in 2009.
|
|
-
|
Drilling and development includes revenues received from crude oil and natural gas drilling and development operations performed for joint venture partners.
|
47
NOTE 9 - FINANCIAL INFORMATION RELATING TO INDUSTRY SEGMENTS (Continued)
|
Non
|
||||||
|
Oil and Gas
|
Rig
|
Drilling and
|
Segmented
|
|||
|
Production
|
Operations
|
Minerals
|
Development
|
Items
|
Total
|
|
|
Year Ended December 31, 2009:
|
||||||
|
Revenue
|
1,066,000
|
-
|
47,100
|
-
|
334,900
|
1,448,000
|
|
Interest Expense
|
72,373
|
50,445
|
81,923
|
-
|
-
|
204,741
|
|
Operating Income (Loss)
|
(4,900,000)
|
(442,000)
|
(200,100)
|
(63,000)
|
(5,056,900)
|
(10,662,000)
|
|
Expenditures for Segment Assets:
|
465,153
|
-
|
-
|
-
|
-
|
465,153
|
|
Depreciation, Depletion, & Amortization
|
1,025,827
|
442,447
|
247,308
|
62,957
|
-
|
1,778,539
|
|
Total Assets
|
5,952,959
|
1,660,500
|
1,447,387
|
168,241
|
6,303,242
|
15,532,330
|
|
|
||||||
|
Net (Loss):
|
(4,900,000)
|
(442,000)
|
(200,100)
|
(63,000)
|
(5,056,900)
|
(10,662,000)
|
|
Non
|
||||||
|
Oil and Gas
|
Rig
|
Drilling and
|
Segmented
|
|||
|
|
Production
|
Operations
|
Minerals
|
Development
|
Items
|
Total
|
|
Year Ended December 31, 2008:
|
||||||
|
Revenue
|
3,759,000
|
1,451,000
|
142,000
|
2,589,000
|
184,000
|
8,125,000
|
|
Interest Expense
|
79,084
|
53,858
|
84,805
|
-
|
-
|
217,747
|
|
Operating Income (Loss)
|
(2,310,000)
|
27,000
|
(229,000)
|
774,000
|
(12,740,000)
|
(14,478,000)
|
|
Expenditures for Segment Assets:
|
6,103,164
|
1,203,667
|
-
|
-
|
15,296,048
|
22,602,879
|
|
Depreciation, Depletion, & Amortization
|
929,518
|
734,991
|
241,345
|
-
|
-
|
1,905,854
|
|
Total Assets
|
9,102,943
|
2,340,362
|
1,816,206
|
-
|
4,211,210
|
17,470,721
|
|
|
||||||
|
Net (Loss):
|
(2,310,000)
|
27,000
|
(229,000)
|
774,000
|
(12,740,000)
|
(14,478,000)
|
|
Non
|
||||||
|
Oil and Gas
|
Rig
|
Drilling and
|
Segmented
|
|||
|
Production
|
Operations
|
Minerals
|
Development
|
Items
|
Total
|
|
|
Year Ended December 31, 2007:
|
||||||
|
Revenue
|
1,113,000
|
2,727,000
|
580,000
|
6,132,000
|
464,000
|
11,016,000
|
|
Interest Expense
|
101,322
|
71,859
|
85,644
|
-
|
-
|
258,825
|
|
Operating Income (Loss)
|
(28,000)
|
585,000
|
(38,000)
|
1,121,000
|
(10,387,000)
|
(8,747,000)
|
|
Expenditures for Segment Assets:
|
2,280,187
|
3,471,352
|
-
|
-
|
-
|
5,751,539
|
|
Depreciation, Depletion, & Amortization
|
229,354
|
766,905
|
242,474
|
-
|
-
|
1,238,733
|
|
Total Assets
|
23,033,171
|
(139,739)
|
2,361,463
|
-
|
-
|
25,254,895
|
|
|
||||||
|
Net (Loss):
|
(28,000)
|
585,000
|
(38,000)
|
1,121,000
|
(10,387,000)
|
(8,747,000)
|
48
NOTE 10 - COMMON STOCK, WARRANTS, AND MINORITY INTEREST
Common Stock
During 2009, the Company issued the following shares of common stock. All of these securities were issued pursuant to privately-negotiated transactions in reliance on the exemption from registration requirements contained in Section 4(2) of the Securities Act of 1933.
|
-
|
During the year, Directors and employees of the Company exercised stock options previously granted. The new shares issued pursuant to the Stock Option Plan amounted to 54,763 shares.
|
|
-
|
The Company issued 90,000 shares to four consultants for services.
|
|
-
|
The Company issued 2,000 shares each to six Board Members for services rendered.
|
|
-
|
The Company issued 140,000 shares as security for the Moss Family Trust notes payable.
|
|
-
|
The remaining 5,653,332 shares were sold in private placements at prices of $1.00 to $2.00 per share for a total consideration of $7.7 million, or a weighted average price of $1.45. Of the 5,653,332 shares issued; 5,153,332 shares were contingently issuable shares at December 31, 2009, as per the Company’s contingent stock agreement for unregistered shares. Those shares were, subsequently, approved by the NYSE Amex, LLC, on January 5, 2010.
|
|
-
|
During the year, the common stock issuance cost was $1.1 million.
|
During 2008, the Company issued the following shares of common stock. All of these securities were issued pursuant to privately-negotiated transactions in reliance on the exemption from registration requirements contained in Section 4(2) of the Securities Act of 1933.
|
-
|
During the year, Directors and employees of the Company exercised stock options previously granted. The new shares issued pursuant to the Stock Option Plan amounted to 632,979 shares.
|
|
-
|
The Company issued 946 shares to one employee in lieu of salary at the closing market price of $7.40 for a total consideration of $7,000.
|
|
-
|
The Company issued 2,000 shares each to seven Board Members for services rendered.
|
|
-
|
The remaining 1,713,258 shares were sold in private placements at prices of $4.00 to $8.00 per share for a total consideration of $9.3 million, or a weighted average price of $5.45.
|
|
-
|
During the year the common stock issuance cost was $1.3 million.
|
Warrants
During 2009, the Company issued no new warrants, and at year end 2009, the Company had no warrants outstanding.
During 2007, the Company issued warrants to accredited investors in conjunction with the sale of restricted common stock. 291,443 warrants were attached to these restricted shares. The warrants are exercisable for a period of two years from the date of issuance. The warrants are exercisable at $7.00 to $10.00, depending on when they were issued. The warrants were valued using the Black-Scholes option-pricing model, which resulted in charges to additional paid in capital of $0.6 million and resulted in charges to stock issuance expense of $0.3 million.
49
NOTE 10 - COMMON STOCK, WARRANTS, AND MINORITY INTEREST (Continued)
Warrants are accounted for under the guidelines established by ASC 505. The Company calculates the fair value of warrants issued with the convertible instruments using the Black-Scholes valuation method, using the same assumptions used for valuing employee options for purposes of ASC 718, except that the expected life of the warrant is used. Under these guidelines, the Company allocates the value of the proceeds received. The price allocated for the warrants is calculated by subtracting the current market price of the stock from the total proceeds of the sale of the restricted stock with the warrant attached. The allocated fair value is recorded as capital paid in – warrants. This allocated fair value of the proceeds from the sale of warrants is subtracted from the value of the warrants using the Black-Scholes valuation method to calculate the stock issuance expense.
Minority Interest from the Sale and Purchase of Interest in Subsidiaries
During 2006, the Company sold 49% of the interest in GVPS to 35 individuals for $3.9 million. Also during 2006, the Company sold 49% of the interest in GVDC to 15 individuals for $1.6 million. The total minority interest for these two LLC’s was $5.4 million, which is being consolidated under ASC 810, “Consolidation of Variable Interest Entities”. In 2007, the Company bought back all of the minority interest in GVDC making it 100% owned by Tri-Valley at year-end 2007. The Company bought back 39% of the minority interest in GVPS, making it owned 90% by Tri-Valley and a minority interest of 10% owned by outside third parties. The company recorded an investment expense of 0.2 million during the year due the buyback of minority interest above par value.
During 2008, the Company bought back the remaining 10% of the minority interest in GVPS, making it 100% owned by Tri-Valley by the end of the second quarter. Starting in the 3rd quarter, the Company sold new interests in GVPS to 13 individuals for $3.6 million. A total of 26% of the interest has been sold as of year-end 2008.
During 2009, the Company bought back the 26% of the minority interest in GVPS, issued during 2008, making it 100% owned by Tri-Valley by the end of the year.
NOTE 11 - COMMITMENTS AND CONTINGENCIES
Contingencies
The Company is subject to possible loss contingencies pursuant to federal, state and local environmental laws and regulations. These include existing and potential obligations to investigate the effects of the release of certain hydro-carbons or other substances at various sites; to remediate or restore these sites; and to compensate others for damages and to make other payments as required by law or regulation. These obligations relate to sites owned by the Company or others, and are associated with past and present oil and gas operations.
The amount of such obligations is indeterminate and will depend on such factors as the unknown nature and extent of contamination, the unknown timing, extent and method of remedial actions which may be required, the determination of the Company's liability in proportion to other responsible parties, and the state of the law.
Natural Gas Contracts
The Company sells its gas under three separate gas contracts. During 2009, 2008, and 2007, the Company sold all of its produced gas under these agreements. The terms of the agreements are identical among the contracts. During 2009, 2008, and 2007, the terms of the agreements were as follows: 100% of the produced gas was sold at the monthly spot price.
Accounts Receivable from/Accounts Payable to Joint Venture Partners
As discussed in PART II, ITEM 7, Financial Condition, the Company receives advances from joint venture partners, which represent funds raised to drill wells. During the period required to drill and equip the well, the Company acts as operator and as operator while the well is produced. The Company is obligated to use these funds for expenditures of the joint venture project.
50
NOTE 11 - COMMITMENTS AND CONTINGENCIES (Continued)
Contractual Obligations and Contingent Liabilities and Commitments
The table below presents our fixed, non-cancelable contractual obligations and commitments primarily related to our outstanding purchase orders, certain capital expenditures and lease arrangements as of December 31, 2009:
|
Payments Due by Period
|
||||||||||||||||||||||||
|
Less Than
|
1 - 3 | 3 -5 |
After 5
|
Total
|
||||||||||||||||||||
|
1 Year
|
Years
|
Years
|
Years
|
Payments
|
||||||||||||||||||||
|
Long term Debt
|
(1) | 439,483 | 749,906 | 645,743 | - | 1,835,132 | ||||||||||||||||||
|
Operating Lease Commitments
|
(2) | 185,640 | 46,410 | - | - | 232,050 | ||||||||||||||||||
|
F. Lynn Blystone, Chairman &
|
||||||||||||||||||||||||
|
Chief Executive Officer Contract
|
(3) | 360,000 | 360,000 | - | - | 720,000 | ||||||||||||||||||
|
Total Contractual Cash obligations:
|
$ | 985,123 | $ | 1,156,316 | $ | 645,743 | $ | - | $ | 2,787,182 | ||||||||||||||
|
(1)
|
Represents cash obligations for principal payments and interest payments on various loans that are all secured by the asset financed. For further detail, see Note 4 to the Consolidated Financial Statements.
|
|
(2)
|
Lease agreement of corporate headquarters in Bakersfield, California, lease terms are until March 2011 at a monthly payment of $15,470.
|
|
(3)
|
Employment contract with F. Lynn Blystone: At December 31, 2009, we had an Employment Agreement with Mr. F. Lynn Blystone, our Chief Executive Officer, with a termination date of January 1, 2011. The terms of the contract were for a base salary amount of $210,000 per year, plus 5,000 shares of our common stock at the end of each year of service. Mr. Blystone was also entitled to a bonus (not to exceed $25,000) equal to 10% of net operating cash flow before taxes, including interest income and excluding debt service. Mr. Blystone was also entitled to a bonus of four percent of the Company's annual net after-tax income. The total of the bonuses from cash flow and from net income could not exceed $50,000 per year, although the Board of Directors might authorize additional bonuses and compensation if it so desired. The Employment Agreement also provided for a severance payment to Mr. Blystone if he was terminated within 12 months after a sale of control of the Company. The severance payment was limited to the lesser of $150,000 or an amount calculated pursuant to any rules or regulation promulgated by any regulatory agency having jurisdiction over the Company, plus a pro-rata bonus calculated from cash flow and from net income with a total limit remaining at $50,000. For purposes of the severance provision, a sale of control was deemed to be the sale of ownership of 30% of the issued and outstanding stock of Tri-Valley Corporation or the acquisition of sufficient stock of the Company to elect or appoint a majority of the members of the Board of Directors of the Company. Please see Note 16 – Subsequent Events.
|
Asset Retirement Obligations
The following table summarizes the Company’s asset retirement obligation transactions recorded in accordance with the provisions of ASC 410 during the years ended December 31, 2009, 2008, and 2007.
51
NOTE 11 - COMMITMENTS AND CONTINGENCIES (Continued)
|
December 31,
|
December 31,
|
December 31,
|
|||||||||||||
|
2009
|
2008
|
2007
|
|||||||||||||
|
Beginning Asset Retirement Obligation
|
$ | 327,845 | $ | 240,394 | $ | 216,714 | |||||||||
|
Liabilities Assumed in Acquisitions
|
- | 33,341 | (2) | 2,380 | (1) | ||||||||||
|
Accretion of Discount
|
23,168 | 54,110 | 21,300 | ||||||||||||
|
Ending Asset Retirement Obligation
|
$ | 351,013 | $ | 327,845 | $ | 240,394 | |||||||||
|
|
(1)
|
The Company’s portion of the liability for the plugging and abandonment of wells drilled from the Temblor Valley and Pleasant Valley acquisitions.
|
|
|
(2)
|
The Company’s portion of the liability for the plugging and abandonment of wells drilled from the Pleasant Valley and Moffat Ranch acquisitions.
|
NOTE 12 – ACQUISITIONS AND DISPOSITIONS
Disposition of Non-Core Assets
On December 31, 2009, the Company sold communication towers acquired in upper New York State in 1998 for a total consideration of $0.3 million to K2 Towers, LLC, a Delaware limited liability company with headquarters in Cleveland, Ohio. The assets were acquired in 1998 for a total purchase price of $0.05 million.
NOTE 13 – INVESTMENT
In the second quarter of 2007, the Company received 150,000 stock options for Duluth Metals common stock for providing executive and geological services for Duluth Metals. The stock options are exercisable at $0.30 Canadian. During the fourth quarter of 2007, the options were exercised and converted into stock at a cost of $0.05 million. During 2008, 30,000 shares of stock were sold. During 2009, the remaining 120,000 shares were sold at an average price of $1.24. The Company follows the Financial Accounting Standards Board (FASB) Accounting Codification (ASC) Topic 320, to account for investments. ASC 320 requires companies to classify their investments as trading, available-for-sale or held-to-maturity. The Company’s securities consist of stock which has been classified as available-for-sale. These are recorded in the financial statements at fair market value and any unrealized gains (losses) will be reported as “other comprehensive income” a component of shareholder equity. When the security is eventually sold, any realized gains or losses are recognized as a component of net income or loss. Realized gains or losses on “available for sale” securities are the difference between the proceeds and the original cost. As a result of the fourth quarter sale off there was a realized loss calculated as follows:
|
2009 Sale of
|
|||
|
Duluth Metals
|
|||
|
Net Cost of Equities:
|
$ | 347,056 | |
|
Proceeds from Sale
|
146,071 | ||
|
Realized Loss:
|
$ | 200,985 | |
This investment was translated into U.S. Dollars in accordance with ASC 830, “Foreign Currency Matters.” The investment was translated at the rate of exchange on the balance sheet date.
52
NOTE 14 – IMPAIRMENT OF LONG-LIVED ASSETS
We participate in a capital intensive industry. At times, our investments become impaired when our reserve estimates are revised downward, when crude oil prices or natural gas prices decline significantly for long periods of time, or when a decision to dispose of an asset leads to a write-down to its fair market value. We may also invest large amounts of money in exploration projects which, if exploratory drilling proves unsuccessful or not viable in the near future, could lead to a material impairment of leasehold values. Impairments in 2009 totaled $0.4 million which were primarily related to an impairment of $0.3 million of our natural gas properties and an impairment of $0.1 million of unproved reserves.
NOTE 15 – GOING CONCERN
The Company had a cash balance of $0.2 million as of December 31, 2009, which has subsequently decreased. Current liabilities as of December 31, 2009, were $12.3 million which has subsequently increased. It should be noted, however, that Accounts Payable to Joint Venture Partners comprised $5.0 million of the $12.3 million in total current liabilities and were offset by $6.5 million in Accounts Receivable from Joint Venture Partners. See Note 11 to our consolidated financial statements for the years ended December 31, 2009, and 2008, for additional discussion.
The accompanying financial statements have been prepared assuming that the Company will continue as a going concern. The Company is dependent on raising additional capital; however, certain factors, such as the economic climate and interest rates, which directly affect the supply of capital, are beyond the Company’s control. As such, the Company has no certainty that capital will be available when needed; and these conditions raise substantial doubt about its ability to continue as a going concern.
In December 2009, the Company engaged the services of an investment banking firm to act as financial advisor for Tri-Valley Corporation. During fiscal 2010, the Company intends to market securities in discreet tranches or offerings with an aggregate value up to $20 million. In that respect, an initial tranche of $5-6 million is expected to close prior to March 31, 2010. The financial statements do not include any adjustments that might be necessary if the Company is unable to continue as a going concern.
NOTE 16 – SUBSEQUENT EVENTS
Executive Retirement Agreement and General Release with Mr. F. Lynn Blystone
On March 5, 2010, the Company executed an Executive Retirement Agreement and General Release (“Executive Agreement and Release”) with Mr. F. Lynn Blystone, Chairman of the Board of Directors of the Company and Chief Executive Officer. The Executive Agreement and Release provided for Mr. Blystone’s retirement from the Company and all Company subsidiary positions and termination of his Employment Agreement with the Company, originally executed on January 1, 2008. Further, the Executive Agreement and Release included an Employment Agreement Payment comprised of accrued gross wages and unpaid vacation as of March 5, 2010, in the amount of $39,691, as well as, a Settlement Payment of $136,083 to be paid in two installments of $48,583 no later than September 15, 2010, and $87,500 no later than January 15, 2011, along with the assignment of an existing key man insurance policy and associated cash value of $38,917, as of March 5, 2010. In exchange for Mr. Blystone’s surrender of all outstanding Company issued stock options on March 5, 2010, the Executive Agreement and Release provided for a grant to Mr. Blystone of a warrant to purchase 700,000 Tri-Valley Corporation common shares at a purchase price of $1.85 per share. The required disclosures of the Executive Agreement and Release have been incorporated into the Company’s consolidated financial statements.
SUPPLEMENTAL INFORMATION (UNAUDITED)
The following estimates of proved oil and gas reserves, both developed and undeveloped, represent interests owned by the Company located solely in the United States.
Disclosures of oil and gas reserves, which follow, are based on estimates prepared by independent petroleum engineers for the years ended December 31, 2009, 2008, and 2007. Such analyses are subject to numerous uncertainties inherent in the estimation of quantities of proved reserves and in the projection of future rates of production and the timing of development expenditures. These estimates do not include probable or possible reserves.
53
SUPPLEMENTAL INFORMATION (UNAUDITED) (Continued)
These estimates are furnished and calculated in accordance with requirements of the Financial Accounting Standards Board and the Securities and Exchange Commission ("SEC"). Because of unpredictable variances in expenses and capital forecasts, crude oil and natural gas price changes, largely influenced and controlled by U.S. and foreign government actions, and the fact that the basis for such estimates vary significantly, management believes the usefulness of these projections is limited. Estimates of future net cash flows presented do not represent management's assessment of future profitability or future cash flows to the Company. Management's investment and operating decisions are based upon reserve estimates that include proved reserves as well as probable reserves, and upon different price and cost assumptions from those used here.
It should be recognized that applying current costs and prices and a 10 percent standard discount rate does not convey fair market value. The discounted amounts arrived at are only one measure of the value of proved reserves.
Capitalized costs relating to oil and gas producing activities and related accumulated depletion, depreciation and amortization were as follows:
|
December 31,
2009
|
December 31,
2008
|
December 31,
2007
|
||||||||||
|
Aggregated Capitalized Costs:
|
||||||||||||
|
Proved Properties
|
1,071,216 | 1,175,566 | 3,026,660 | |||||||||
|
Unproved Properties
|
1,551,998 | 1,616,919 | 2,414,843 | |||||||||
|
Accumulated Depletion, Depreciation and Amortization
|
(1,045,951) | (1,022,021) | (882,753) | |||||||||
|
Net Capitalized Assets
|
$ | 1,577,263 | $ | 1,770,464 | $ | 4,558,750 | ||||||
Results of Operations from Oil and Gas Producing Activities
The results of operations from oil and gas producing activities are as follows:
|
December 31,
2009
|
December 31,
2008
|
December 31,
2007
|
||||||||||
|
Sales to Unaffiliated Parties
|
$ | 1,035,916 | $ | 3,322,353 | $ | 791,279 | ||||||
|
Production Costs
|
(1,608,181) | (1,291,115) | (430,068) | |||||||||
|
Depletion, Depreciation and Amortization
|
(23,168) | (164,993) | (229,354) | |||||||||
| (595,433) | 1,866,245 | 131,857 | ||||||||||
|
Income Tax Expense
|
- | - | - | |||||||||
|
Results of Operations from Activities before
|
||||||||||||
|
Extraordinary Items (Excluding Corporate
|
||||||||||||
|
Overhead and Interest Costs)
|
$ | (595,433) | $ | 1,866,245 | $ | 131,857 | ||||||
54
SUPPLEMENTAL INFORMATION (UNAUDITED) (Continued)
Changes in Estimated Reserve Quantities
The net interest in estimated quantities of proved developed and undeveloped reserves of crude oil and natural gas at December 31, 2009, 2008, and 2007, and changes in such quantities during each of the years then ended, were as follows:
|
December 31, 2009
|
December 31, 2008
|
December 31, 2007
|
||||||
|
Oil (BBL)
|
Gas (MCF)
|
Oil (BBL)
|
Gas (MCF)
|
Oil (BBL)
|
Gas (MCF)
|
|||
|
Proved Developed and
|
||||||||
|
Undeveloped Reserves:
|
||||||||
|
Beginning of year
|
-
|
695,931
|
372,048
|
791,129
|
275,452
|
787,017
|
||
|
Revisions (a), (b), (d), (e), (h), (i)
|
3,041,802
|
(268,603)
|
(345,749)
|
(50,115)
|
(44,447)
|
20,299
|
||
|
Purchase (f)
|
-
|
-
|
-
|
-
|
148,049
|
-
|
||
|
Improved Recovery ( c ), (g)
|
-
|
-
|
-
|
56,987
|
-
|
29,741
|
||
|
Production
|
(21,092)
|
(32,076)
|
(26,299)
|
(102,070)
|
(7,006)
|
(45,928)
|
||
|
End of Year
|
3,020,710
|
395,252
|
-
|
695,931
|
372,048
|
791,129
|
||
|
Proved Developed Reserves:
|
||||||||
|
Beginning of Year
|
-
|
695,931
|
372,048
|
791,128
|
275,452
|
787,017
|
||
|
End of Year
|
282,271
|
395,252
|
-
|
695,931
|
372,048
|
791,129
|
||
(a) In 2009, our estimated proved developed and undeveloped oil reserves were revised upward by 3,041,802 as a result of improved pricing and performance at our Edison, Belridge and Pleasant Valley leases.
(b) In 2009, our estimated proved developed and undeveloped gas reserves were decreased by 268,603 mcf due to evaluations at our Hanson lease.
(c) In 2008, our estimated proved reserves were reduced by 49,771 mcf from current evaluations of the Hanson Lease and Webb Tract # 1 wells. Gas reserve estimates of 344 mcf for one small, non-operated lease were reduced to zero.
(d) In December 2008, the average oil price for properties we operated was $30.126, which is $53.372 lower than the previous year evaluation average oil price of $83.498 (a decrease of 63.92%). Due to the dramatic drop in oil prices, all producing properties in which Tri-Valley held interests at year end were operating at uneconomic levels when assessed applying the parameters prescribed by the rules of the Securities and Exchange Commission. As a result, at year end, oil reserves were reduced by 345,749 barrels, to zero (a 100% decrease).
(e) In 2008, completion of wells in the Moffat Ranch Field and extended production of the Martins-Severin # 6 and Webb Tract # 2 wells increased reserves by 56,982 mcf.
(f) In 2007, 44,448 barrels of oil, previously classified as proved undeveloped, were eliminated from reserves because wells drilled did not justify further development in Kern County, California.
(g) In 2007, our estimated proved developed producing gas reserves were revised upward by 20,299 mcf as a result of improved performance on a producing lease in Solano County, California.
(h) In 2007, we drilled and completed an oil well in Ventura County, California. Two additional wells drilled in Ventura County in 2007 were completed as oil wells in 2008.
(i) In 2007, improved recovery estimates on proved developed producing gas wells resulted from a partially successful recompletion and improved performance from leases in Contra Costa County, California.
55
SUPPLEMENTAL INFORMATION (UNAUDITED) (Continued)
Standardized Measure of Discounted Future Net Cash Flows Relating To Proved Oil and Gas Reserves
A standardized measure of discounted future net cash flows is presented below for the years ended December 31, 2009, 2008, and 2007.
The future net cash inflows are developed as follows:
|
|
(1)
|
Estimates are made of quantities of proved reserves and the future periods during which they are expected to be produced based on year-end economic conditions.
|
|
|
(2)
|
The estimated future production of proved reserves is priced on the basis of year-end prices.
|
|
|
(3)
|
The resulting future gross revenue streams are reduced by estimated future costs to develop and to produce proved reserves, based on year end cost estimates.
|
|
|
(4)
|
The resulting future net revenue streams are reduced to present value amounts by applying a ten percent discount.
|
Disclosure of principal components of the standardized measure of discounted future net cash flows provides information concerning the factors involved in making the calculation. In addition, the disclosure of both undiscounted and discounted net cash flows provides a measure of comparing proved oil and gas reserves both with and without an estimate of production timing. The standardized measure of discounted future net cash flows relating to proved reserves reflects income taxes.
|
December 31,
2009
|
December 31,
2008
|
December 31,
2007
|
||||||||||
|
Future cash in Flows
|
$ | 160,584,010 | $ | 4,911,415 | $ | 36,745,611 | ||||||
|
Future Production and Development Costs
|
(55,032,917) | (1,406,356) | (12,714,080) | |||||||||
|
Future Income Tax Expenses
|
(14,622,750) | (200,908) | (1,568,917) | |||||||||
|
Future Net Cash Flows
|
90,928,343 | 3,304,151 | 22,462,614 | |||||||||
|
10% Annual Discount for Estimated Timing of Cash Flows
|
46,676,521 | 1,557,893 | 10,138,224 | |||||||||
|
Standardized Measure of Discounted Future Net Cash Flow
|
44,251,822 | 1,746,258 | 12,324,390 | |||||||||
Refer to the following table for analysis in changes in standardized measure.
Changes in Standardized Measure of Discounted Future Net Cash Flow from Proved Reserve Quantities
This statement discloses the sources of changes in the standardized measure from year to year. The amount reported as "Net changes in prices and production costs" represents the present value of changes in prices and production costs multiplied by estimates of proved reserves as of the beginning of the year. The "accretion of discount" was computed by multiplying the ten percent discount factor by the standardized measure as of the beginning of the year. The "Sales of oil and gas produced, net of production costs" is expressed in actual dollar amounts. "Revisions of previous quantity estimates" is expressed at year-end prices.
The "Net change in income taxes" is computed as the change in present value of future income taxes.
56
SUPPLEMENTAL INFORMATION (UNAUDITED) (Continued)
|
December 31,
2009
|
December 31,
2008
|
December 31,
2007
|
||||||||||
|
Standardized Measure - Beginning of Period
|
$ | 1,746,258 | $ | 12,324,390 | $ | 6,121,295 | ||||||
|
Sales of oil and gas produced, net of production costs
|
(329,949) | (3,090,340) | (690,155) | |||||||||
|
Revisions of estimates of reserves provided in prior years:
|
||||||||||||
|
Net Changes in Prices
|
54,439,800 | 973,607 | 8,801,793 | |||||||||
|
Revisions of Previous Quantity Estimates
|
1,416,000 | 2,641,502 | 1,641,446 | |||||||||
|
Extensions and Discoveries
|
107,819,000 | 86,986 | 4,718,914 | |||||||||
|
Property Acquisition
|
- | - | - | |||||||||
|
Accretion of Discount
|
(52,792,287) | 1,485,846 | (15,970,845) | |||||||||
|
Changes in Production and development Costs
|
(64,700,000) | (11,307,724) | 6,855,893 | |||||||||
|
Net Change in Income Taxes
|
(3,347,000) | (1,368,009) | 846,049 | |||||||||
|
Net Increase (Decrease)
|
42,505,546 | (10,578,132) | 6,203,095 | |||||||||
|
Standardized Measure - End of Period
|
$ | 44,251,822 | $ | 1,746,258 | $ | 12,324,390 | ||||||
Quarterly Financial Data (unaudited)
|
2009
|
|||||||||||||||
| First |
Second
|
Third
|
Fourth
|
||||||||||||
| Quarter |
Quarter
|
Quarter
|
Quarter
|
||||||||||||
|
Operating Revenue
|
359,770 | 509,713 | 450,291 | 128,227 | |||||||||||
|
Net Income (Loss)
|
(3,053,839) | (2,189,288) | (2,726,063) | (2,692,747) | |||||||||||
|
Net Income per Common Share Basic
|
$ | (0.11) | $ | (0.08) | $ | (0.09) | $ | (0.05) | |||||||
| 2008 | |||||||||||||||
|
First
|
Second
|
Third
|
Fourth
|
||||||||||||
|
Quarter
|
Quarter
|
Quarter
|
Quarter
|
||||||||||||
|
Operating Revenue
|
1,678,847 | 2,262,189 | 1,425,456 | 2,758,206 | |||||||||||
|
Net Income (Loss)
|
(2,107,883) | (3,340,668) | (1,197,399) | (7,832,228) | |||||||||||
| Net Income per Common Share Basic | $ | (0.09) | $ | (0.13) | $ | (0.05) | $ | (0.27) | |||||||
| 2007 | |||||||||||||||
|
First
|
Second
|
Third
|
Fourth
|
||||||||||||
|
Quarter
|
Quarter
|
Quarter
|
Quarter
|
||||||||||||
|
Operating Revenue
|
1,516,300 | 1,299,709 | 3,912,591 | 4,004,721 | |||||||||||
|
Net Income (Loss)
|
(2,402,019) | (2,810,243) | (1,038,643) | (2,355,986) | |||||||||||
| Net Income per Common Share Basic | $ | (0.09) | $ | (0.11) | $ | (0.05) | $ | (0.10) | |||||||
57
ITEM 9A. CONTROLS AND PROCEDURES
EVALUATION OF DISCLOSURE CONTROLS
The Company conducted an evaluation, under the supervision and with the participation of the Company’s principal executive officer and principal financial officer, of the effectiveness of the design and operation of the Company’s disclosure controls and procedures (as defined in the Securities Exchange Act of 1934 Rules 13a-15(e) and 15d-15(e)) as of December 31, 2009.
Based upon that evaluation, the Chief Executive Officer and Chief Financial Officer concluded that the Company’s disclosure controls and procedures as of the end of the period covered by this report were not effective as of December 31, 2009, as discussed in Management’s Report on Internal Control.
Limitations on the Effectiveness of Controls
Our management, including our Chief Executive and Chief Financial Officers, does not expect that our Disclosure Controls or our internal control over financial reporting will prevent all error and all fraud. A control system, no matter how well conceived and operated, can provide only reasonable, but not absolute, assurance that the objectives of a control system are met. Further, any control system reflects limitations on resources, and the benefits of a control system must be considered relative to its costs. Because of the inherent limitations in all control systems, no evaluation of controls can provide absolute assurance that all control issues and instances of fraud, if any, within Tri-Valley Corporation have been detected. These inherent limitations include the realities that judgments in decision-making can be faulty and that breakdowns can occur because of simple error or mistake. Additionally, controls can be circumvented by the individual acts of some persons, by collusion of two or more people, or by management override of a control. A design of a control system is also based upon certain assumptions about potential future conditions; over time, controls may become inadequate because of changes in conditions, or the degree of compliance with the policies or procedures may deteriorate. Because of the inherent limitations in a cost-effective control system, misstatements due to error or fraud may occur and may not be detected.
MANAGEMENT’S REPORT ON INTERNAL CONTROL OVER FINANCIAL REPORTING
Our management is responsible for establishing and maintaining adequate internal control over financial reporting, as defined by SEC rules adopted under the Securities Exchange Act of 1934, as amended. Our internal control over financial reporting is designed to provide reasonable assurance regarding the reliability of financial reporting and the preparation of financial statements for external purposes in accordance with generally accepted accounting principles. It consists of policies and procedures that:
|
•
|
Pertain to the maintenance of records that, in reasonable detail, accurately and fairly reflect the transactions and dispositions of our assets;
|
||
|
•
|
Provide reasonable assurance that transactions are recorded as necessary to permit preparation of the financial statements in accordance with generally accepted accounting principles, and that our receipts and expenditures are being made only in accordance with authorizations of our management and directors; and
|
||
|
•
|
Provide reasonable assurance regarding prevention or timely detection of unauthorized acquisition, use or disposition of our assets that could have a material effect on the financial statements.
|
Under the supervision and with the participation of management, including the Chief Executive and the Chief Financial Officers, we made an assessment of the effectiveness of our internal control over financial reporting as of December 31, 2009. In making this assessment, we used the criteria established in Internal Control — Integrated Framework issued by the Committee of Sponsoring Organizations of the Treadway Commission (COSO). Based on our evaluation, we concluded that our internal control over financial reporting was not effective as of December 31, 2009. A material weakness is a deficiency, or combination of deficiencies, in internal control over financial reporting, such that there is a reasonable possibility that a material misstatement of the Company’s annual or interim financial statements will not be prevented or detected on a timely basis. A significant deficiency is a deficiency, or combination of control deficiencies, in internal control over financial reporting that is less severe than a material weakness, yet important enough to merit attention by those responsible for oversight of the Company’s financial reporting.
58
In connection with management’s assessment of our internal control over financial reporting, we identified the following material weaknesses in our internal control over financial reporting as of December 31, 2009:
|
1)
|
We did not maintain effective controls over several aspects of cash management. The system of controls over existence and valuation was not followed to ensure that cash was properly managed and that cash disbursements were properly authorized and recorded. Some bank reconciliations were not timely prepared. An unreconciled bank balance may expose the Company to fraud and a material misstatement of cash balances. Control deviations for cash disbursements may expose the Company to fraud and material misstatement of expense accounts.
|
||
|
2)
|
We did not maintain effective controls related to the authorization and recording of equity transactions. The system of controls over existence, valuation, and completeness was not followed to ensure proper support and approval was documented.
|
||
|
3)
|
We did not maintain effective controls over the valuation of property, plant, and equipment. The system of controls over valuation of fixed assets to properly account for the depreciation of those assets was not followed. Incorrect valuation of assets may expose the Company to material misstatement of depreciation expense.
|
||
Because of the material weaknesses described above, management has concluded that we did not maintain effective internal controls over financial reporting as of December 31, 2009, based on the Internal Control — Integrated Framework issued by COSO.
CHANGES IN INTERNAL CONTROL
There have not been any changes in the Company’s internal control over financial reporting during the fiscal quarter ended December 31, 2009, that have materially affected, or are reasonably likely to materially affect, the Company’s internal control over financial reporting.
REMEDIATION OF MATERIAL WEAKNESSES IN INTERNAL CONTROL OVER FINANCIAL REPORTING
It is management’s goal to remediate these material weaknesses as soon as feasible during 2010.
|
•
|
Management will communicate its endorsement and reinforce its commitment to maintaining sound and effective internal controls with all staff;
|
||
|
•
|
Management will strive to fully staff and train accounting professionals, so that sufficient preparation time and review time will be available to increase the accuracy level of financial transactions.
|
||
|
•
|
Management will review and improve procedures to reduce the likelihood of errors in recording financial transactions.
|
We estimate that these remedial efforts will result in additional costs of approximately $0.2 million for additional accounting staff and training in 2010.
59
REPORT OF INDEPENDENT REGISTERED PUBLIC ACCOUNTING FIRM
To the Board of Directors and
Stockholders of Tri Valley Corporation
We have audited Tri-Valley Corporation’s internal control over financial reporting as of December 31, 2009, based on criteria established in Internal Control—Integrated Framework issued by the Committee of Sponsoring Organizations of the Treadway Commission (COSO). Tri-Valley Corporation’s management is responsible for maintaining effective internal control over financial reporting and for its assessment of the effectiveness of internal control over financial reporting, included in the accompanying report from management. Our responsibility is to express an opinion on the company’s internal control over financial reporting based on our audit.
We conducted our audit in accordance with the standards of the Public Company Accounting Oversight Board (United States). Those standards require that we plan and perform the audit to obtain reasonable assurance about whether effective internal control over financial reporting was maintained in all material respects. Our audit of internal control over financial reporting included obtaining an understanding of internal control over financial reporting, assessing the risk that a material weakness exists, and testing and evaluating the design and operating effectiveness of internal control based on the assessed risk. Our audit also included performing such other procedures as we considered necessary in the circumstances. We believe that our audit provides a reasonable basis for our opinion.
A company’s internal control over financial reporting is a process designed to provide reasonable assurance regarding the reliability of financial reporting and the preparation of financial statements for external purposes in accordance with generally accepted accounting principles. A company’s internal control over financial reporting includes those policies and procedures that (1) pertain to the maintenance of records that, in reasonable detail, accurately and fairly reflect the transactions and dispositions of the assets of the company; (2) provide reasonable assurance that transactions are recorded as necessary to permit preparation of financial statements in accordance with generally accepted accounting principles, and that receipts and expenditures of the company are being made only in accordance with authorizations of management and directors of the company; and (3) provide reasonable assurance regarding prevention or timely detection of unauthorized acquisition, use, or disposition of the company’s assets that could have a material effect on the financial statements.
Because of its inherent limitations, internal control over financial reporting may not prevent or detect misstatements. Also, projections of any evaluation of effectiveness to future periods are subject to the risk that controls may become inadequate because of changes in conditions, or that the degree of compliance with the policies or procedures may deteriorate.
A material weakness is a control deficiency, or combination of deficiencies, in internal control over financial reporting, such that there is a reasonable possibility that a material misstatement of the Company’s annual or interim financial statements will not be prevented or detected on a timely basis. The following material weaknesses have been identified and included in management’s assessment: Lack of controls or ineffective application of controls related to the initiation, recording, processing, monitoring, and approving of certain transactions related to preparation and review of documentation to support the financial statements. These material weaknesses were considered in determining the nature, timing, and extent of audit tests applied in our audit of the 2009 financial statements, and this report does not affect our report dated March 26, 2010 on those financial statements.
60
In our opinion, because of the effect of the material weaknesses described above on the achievement of the objectives of the control criteria, Tri-Valley Corporation has not maintained effective internal control over financial reporting as of December 31, 2009, based on criteria established in Internal Control—Integrated Framework issued by the Committee of Sponsoring Organizations of the Treadway Commission (COSO).
We have also audited, in accordance with the standards of the Public Company Accounting Oversight Board (United States), the balance sheets and the related statements of income, stockholders’ equity and comprehensive income, and cash flows of Tri-Valley Corporation, and our report dated March 26, 2010 expressed an unqualified opinion.
BROWN ARMSTRONG
ACCOUNTANCY CORPORATION
/s/ Brown Armstrong Accountancy Corporation
Bakersfield, California
March 26, 2010
61
PART III
ITEM 10. DIRECTORS AND EXECUTIVE OFFICERS OF THE REGISTRANT
All of our Directors serve one year terms from the time of their election to the time their successor is elected and qualified. The following information is furnished with respect to each Director and Executive Officer who served as such during the fiscal year ended December 31, 2009:
|
Year First
|
||||||
|
Became Director or
|
Position With
|
|||||
|
Name of Director
|
Age
|
Executive Officer
|
Company
|
|||
|
F. Lynn Blystone
|
74
|
1974
|
Chairman of the Board, Chief Executive Officer, Director, Tri-Valley Corporation, Chief Executive Officer and Director, Tri-Valley Oil & Gas Co.
|
|||
|
Chief Executive Officer, Director, Select Resources Corporation
|
||||||
|
Loren J. Miller(1)(4)
|
64
|
1992
|
Director
|
|||
|
Henry Lowenstein, Ph.D.(2)(3)
|
55
|
2005
|
Director
|
|||
|
G. Thomas Gamble(1)(2)(4)
|
48
|
2006
|
Director
|
|||
|
Paul W. Bateman(1)(4)
|
52
|
2007
|
Director
|
|||
|
Edward M. Gabriel(3)
|
59
|
2007
|
Director
|
|||
|
James S. Mayer(4)
|
52
|
2008
|
Director
|
|||
|
Maston N. Cunningham
|
57
|
2009
|
President and Chief Operating Officer, Tri-Valley Corporation
|
|||
|
John E. Durbin
|
55
|
2009
|
Chief Financial Officer and Treasurer
|
|||
|
Arthur M. Evans
|
61
|
2005
|
Chief Compliance Officer
|
|||
|
Joseph R. Kandle
|
67
|
1999
|
President, Tri-Valley Oil & Gas Co.
|
|||
|
James G. Bush
|
60
|
2007
|
President, Select Resources Corporation, Inc.
|
|||
(1)- Member of Audit Committee
(2)- Member of Personnel and Compensation Committee
(3)- Member of Nominating and Corporate Governance Committee
(4)- Member of Finance Committee
62
|
F. Lynn Blystone - 74
|
Chairman of the Board of Directors & Chief Executive Officer of Tri-Valley Corporation; Tri-Valley Power Corporation; Tri-Valley Oil & Gas Co.; Select Resources Corporation, Inc.; Great Valley Drilling Company, LLC; and Great Valley Production Services, LLC; all of which are wholly-owned subsidiaries of Tri-Valley Corporation.
Bakersfield, California
|
1974
|
||||
|
Mr. Blystone became President of Tri-Valley Corporation in October, 1981, and was nominally Vice President from July to October, 1981. His background includes institutional management, venture capital, and various management functions for a mainline pipeline contractor, including the Trans-Alaska Pipeline System (TAPS). He has founded, managed, and sold companies in several fields, including Learjet charter, commercial construction, municipal finance, and land development. He is also president of a family corporation, Bandera Land Company, Inc., with real estate interests in Orange County, California. A graduate of Whittier College, California, he did graduate work at George Williams College, Illinois, in organization management.
|
||||||
|
James S. Mayer – 52
|
Director
|
2008
|
||||
|
Since 2007, Mr. Mayer has been the President of Pinnacle Capital Management, LLC, an investment strategy and corporate advisory firm. He formerly served as a First Vice President, Investments, for Citigroup Global Markets, Inc., from 2005-2006, and as Vice President, Alternative Investments, for Merrill Lynch from 1999-2005 and Vice President, Special Investments, for Merrill Lynch from 1997-1999. He also served as Director, International Business Development, for Perkin-Elmer Corporation from 1980-1993. Mr. Mayer holds a Bachelor’s Degree in Chemistry from State University of New York with graduate studies in corporate finance, investment banking, alternative investments and corporate strategy. He serves on the Finance Committee. Mr. Mayer was appointed to the Board of Directors in August 2008. He is an independent member of our Board of Directors.
|
||||||
|
Loren J. Miller, CPA – 64
|
Director
|
1992
|
||||
|
Mr. Miller served as Treasurer of the Jankovich Company from 2001 until his retirement in 2008. Prior to Treasurer, he served in other positions at Jankovich from 1994 to 2001. He served successively as Vice President & Chief Financial Officer of Hershey Oil Corporation from 1987 to 1990 and Mock Resources from 1991 to 1992. He was Senior Financial Vice President & General Manager of Tosco Production Finance Corporation from 1975 to 1986 and was a Senior Auditor for the accounting firm of Touche Ross & Company from 1968 to 1973. Mr. Miller is a member of Financial Executive International, the nation’s leading senior financial executive organization and is a Past President of the Los Angeles Chapter. He is experienced in exploration, production, product trading, refining, and distribution, as well as, corporate finance. He holds a Bachelor of Science in Accounting and an M.B.A. in Finance from the University of Southern California. Mr. Miller is an independent member of our Board of Directors.
|
||||||
|
Henry Lowenstein, Ph.D. - 55
|
Director
|
2005
|
||||
|
Dr. Lowenstein is Professor of Management at the E. Craig Wall Sr. College of Business Administration, Coastal Carolina University, Conway, South Carolina, since 2007, and from 2007 to 2009 was Dean of the College. Prior to joining the Coastal Carolina University, he was Dean of Business and Public Administration at California State University, Bakersfield, from 2000 to 2007. Dr. Lowenstein has a broad background in management within business, academic, government, and public service organizations. He has served as an experienced reviewer, consultant, and on a number of committees for AACSB International, the top accreditation agency for business schools worldwide. Previous academic positions include universities in Illinois, Virginia, and West Virginia. Locally, he is Chairman of the Board of the Ocean View Memorial Foundation of Myrtle Beach, South Carolina. Dr. Lowenstein has published in the fields of human resource management, public policy, and transportation. During his business career, he was a corporate officer for Kemper Group-Insurance and Financial Services, Dominion Bankshares Corporation, and Americana Furniture, Inc. He previously served as a management analyst for the Executive Office of the President of the United States, Office of Management and Budget, during the Gerald Ford Administration. Dr. Lowenstein received his Ph.D. in Labor and Industrial Relations from the University of Illinois; an M.B.A. from George Washington University; and a Bachelor of Science in Business Administration from Virginia Commonwealth University. Dr. Lowenstein is an independent member of our Board of Directors. He is chairman of both the Personnel and Compensation Committee and the Nominating and Corporate Governance Committee.
|
||||||
63
|
G. Thomas Gamble - 48
|
Director & Vice Chairman of the Board of Directors
|
2006
|
||||
|
Mr. Gamble is a businessman with active investments beyond Tri-Valley Corporation in agriculture, critically acknowledged wine production across several labels, and educational services. He has successfully participated in the creation, operation, and disposition of several businesses. His various businesses have received recognition from both the California State Senate and the U.S. House of Representatives, including “Business of the Year” in 2005. In addition to his Tri-Valley board duties, Mr. Gamble currently serves as director of, and is an original investor in, Boston Reed College, which provides educational opportunities in a growing number of states for busy adults seeking stable and growing careers in the health care industry. Mr. Gamble is significant investor in both Tri-Valley and its OPUS drilling partnership. Mr. Gamble graduated from the University of California, Los Angeles, and is an independent member of our Board of Directors.
|
||||||
|
Paul W. Bateman - 52
|
Director
|
2007
|
||||
|
Mr. Bateman is President of the Klein & Saks Group, a Washington, D.C.-based firm that advises clients, principally in the mining and metals industries, on public policy matters. He joined the firm in 1994 and became its President in 1997. A graduate of Whittier College, he began his career in the late 1970’s, as an aide to then President Richard Nixon. In 1981, he joined the White House Staff under President Reagan and, subsequently, served in that Administration in senior positions at the Departments of Commerce and Treasury. From 1989 to 1993, he served on President George H. W. Bush's White House Staff as Deputy Assistant to the President for Management. Since 2005, Mr. Bateman has been the Chairman and Chief Executive of the International Cyanide Management Institute, which administers a voluntary industry program aimed at improving the management of cyanide used in gold mining. He is a member of the Economic Club of New York, the nation's leading nonpartisan speaking forum, and was its President from 2004-2007. He is the past Chairman of the Reform Institute, a nonpartisan think tank.. Mr. Bateman is an independent member of our Board of Directors.
|
||||||
|
Edward M. Gabriel - 59
|
Director
|
2007
|
||||
|
Ambassador Gabriel is the former U.S. Ambassador to the Kingdom of Morocco, and, since 2002, is President and CEO of a Washington, D.C.-based strategic business counseling company, The Gabriel Company, LLC. Ambassador Gabriel brings a diverse background in a variety of petroleum and other energy sources. Ambassador Gabriel’s experience is both domestic and international, with extensive relationships with the U.S. and Middle Eastern governments, and investment capital companies interested in energy projects. He is a member of the advisory board of Guggenheim Partners, a private wealth management firm. His career includes senior management positions with firms such as CONCORD, and the Madison Public Affairs Group, where he advised Fortune 100 Companies on multi-national matters in technology, energy, banking, environmental, and tax policy. Ambassador Gabriel served the Federal Energy Administration/U.S. Department of Energy as Senior Economic Analyst. He serves as Vice-Chairman of the American Task Force for Lebanon and is a Visiting Fellow at the Center for Strategic and International Studies. He is also on the board of directors of the American School of Tangier and the Casablanca American School. He is a Bachelor of Sciences graduate of Gannon University, where he was also awarded an honorary Doctorate of Laws. Ambassador Gabriel is an independent member of the Tri-Valley board of directors.
|
||||||
64
|
Maston N. Cunningham - 57
|
President and Chief Operating Officer of Tri-Valley Corporation
Bakersfield, California
|
2009
|
|
|
Mr. Cunningham became President & Chief Operating Officer of Tri-Valley Corporation in May 2009 after joining the company as Vice President for Corporate Development after ending an early retirement that commenced in 2002 following his distinguished 22-year international career with Occidental Petroleum Corporation (Oxy) that included over 15 years in Pakistan, Peru and Ecuador. In 1996, he was appointed President & General Manager of Oxy’s Ecuadorian subsidiary where he led a successful oil exploration and development program, and restructuring of the business unit that included renegotiation of its Oriente Basin Block 15 contract to increase oil reserves, production and profitability. He was co-founder and first president of ASOPEC, an Ecuadorian petroleum industry association that spearheaded the industry’s efforts to secure government approval for construction of a private $1.1 billion heavy oil pipeline and marine terminal to facilitate additional heavy oil development in the Oriente Basin. Following government approval in early 2001, the pipeline, known as Oleoducto de Crudos Pesados or OCP and designed to transport up to 450,000 barrels per day over a 300-mile route from eastern Ecuador over the Andes Mountains to the Pacific Coast for export, was constructed and began operating in late 2003. During his four-year tenure in Ecuador, Mr. Cunningham was responsible for increasing Block 15’s daily oil production from approximately 16,000 to over 30,000 barrels per day; and by 2004 following his departure, production had further expanded to over 100,000 barrels per day with additional investments by Oxy facilitated by new capacity on the OCP pipeline. He was also responsible for obtaining ISO 14001 certification in 1997 for Block 15’s Environmental Management System which, at the time, was the first Oxy operation worldwide to obtain this certification, the first enterprise in Ecuador to be certified, and only the third oil and gas operation certified in South America. Mr. Cunningham is a past president of the Association of American Chambers of Commerce in Latin America (AACCLA), a leading regional trade advocacy organization affiliated with the US Chamber of Commerce in Washington, D.C. that serves as the umbrella for AmCham’s in 21 countries whose 20,000 members manage over 80 percent of U.S. investment in the region. AACCLA has been a major advocate for the North American Free Trade Agreement (NAFTA) and other bilateral trade agreements and business facilitation pacts between the US and countries in the region. He currently serves as treasurer on the Board of Trustees of the Pan American Development Foundation (PADF), an affiliate of the Organization of American States (OAS) in Washington, D.C., which implements over $50 million of projects annually to assist disadvantaged people in the hemisphere through public and private grants. He is a graduate of Trinity University and received an M.B.A. from the University of Texas at Austin. Mr. Cunningham is also a Certified Public Accountant and fluent in Spanish.
|
|||
|
John E. Durbin - 55
|
Chief Financial Officer and Treasurer of Tri-Valley Corporation; Tri-Valley Oil & Gas Co.; Tri-Valley Power Corporation; and Select Resources Corporation, Inc., all of which are wholly-owned subsidiaries of Tri-Valley Corporation.
Bakersfield, California
|
2009
|
|
|
Prior to joining Tri-Valley Corporation as Chief Financial Officer in October 2009, a majority of Mr. Durbin’s 30-year career was spent in various senior management positions in finance and treasury with subsidiaries of Conoco Inc., and The DuPont Company. During his career, he has worked internationally from assignments in Bermuda, Switzerland, and Brazil. In August 2002, he was elected Assistant Treasurer, Risk Management, for ConocoPhillips in Houston, Texas, and was responsible for the design and implementation of an Enterprise Risk Management Program across the corporation. After opting for early retirement from ConocoPhillips in March 2005, he relocated to Rio de Janeiro, Brazil, and founded JED Consulting LLC to provide capital formation and business consulting services for select private clients in such areas as gasoline refining, sugar cane optimization, and iron ore development. After returning to the U.S. late in 2008, he joined Utah-based, U.S. coal producer, America West Resources, Inc., in January 2009 as Chief Financial Officer. Mr. Durbin holds a Bachelor of Science in Finance from Montana State University, Bozeman, and an M.B.A. in International Financial Management from the Thunderbird School of Global Management in Glendale, Arizona. He is multilingual with abilities in Arabic, French, German, Italian, Portuguese, Russian, and Spanish. He holds memberships in the Brazil-Texas Chamber of Commerce (BRATECC), the Financial Executives Networking Group (FENG), and the Association for Financial Professionals (AFP).
|
|||
65
|
Arthur M. Evans, CPA, CMA, CFM - 61
|
Chief Compliance Officer and Secretary of Tri-Valley Corporation; Secretary of Tri-Valley Oil & Gas Co., Select Resources Corporation, Inc.; Great Valley Drilling Company, LLC; and Great Valley Production Services, LLC; Chief Financial Officer of Great Valley Drilling Company, LLC; and Great Valley Production Services, LLC; all of which are wholly-owned subsidiaries of Tri-Valley Corporation.
Bakersfield, California
|
2005
|
|
|
Mr. Evans was named as Tri-Valley Corporation’s Chief Financial Officer in November 2005 and as Chief Compliance Officer in October 2009. Prior to coming to Tri-Valley, Art was a self-employed financial consultant from 2000 to 2005. Mr. Evans has a full range of accounting, mergers and acquisitions, and financial management experience in several industries as well as oil, gas, and mining with Fortune 500 companies, as well as, independent companies, like Tri-Valley. He held several senior financial management positions with Getty Oil and Texaco. He holds a B.S. in accounting from Weber State University, a M.B.A. in finance from Golden State University and a M.S. in systems management from the University of Southern California. His professional designations include Certified Public Accountant, Certified Management Accountant and Certified Financial Manager.
|
|||
|
Joseph R. Kandle - 67
|
Senior Vice President, Corporate Development, of Tri-Valley Corporation; President and Chief Operating Officer of Tri-Valley Oil & Gas Co.; President of Great Valley Drilling Company, LLC; and Great Valley Production Services, LLC; all of which are wholly-owned subsidiaries of Tri-Valley Corporation.
Bakersfield, California
|
1998
|
|
|
Mr. Kandle was named as President of Tri-Valley Oil & Gas Co. in February 1999 after joining the Company in June 1998 as Vice President, Engineering. From 1995 to 1998, he was employed as a petroleum engineer for R & R Resources. He was self-employed as a consulting petroleum engineer from 1994 to 1995. He served as Vice President, Engineering, for Atlantic Oil Company from 1983 to 1994. From 1981 to 1983, Mr. Kandle was Vice President for Star Resources. He held the position of Vice President & Chief Engineer for Great Basins Petroleum from 1973 to 1981. Mr. Kandle began his career with Mobil Oil from 1965 to 1973, after graduating from the Montana School of Mines in 1965.
|
|||
| James G. Bush - 60 |
President of Select Resources Corporation, Inc., a wholly-owned subsidiary of Tri-Valley Corporation.
Bakersfield, California
|
2007
|
|
|
Mr. Bush joined the Company in June 2007, and brings a wide range of experience with over 30 years in the natural resource industry (oil, gas, and minerals), the consulting business, and in heavy industry. Prior to joining Tri-Valley, Jim spent ten years with the U.S. Department of Energy’s Pacific Northwest National Laboratory as a Manager of Business and Technology Development from 1996 to 2007, and the preceding ten years with ICF Kaiser Engineers. Prior to those assignments, he worked for Atlantic Richfield (on- and offshore Alaska and Texas), Aspen Exploration, and the Anaconda Copper Mining Company. His areas of expertise include oil and gas exploration and drilling, uranium exploration and drilling, and metals exploration, with particular expertise in gold placer exploration and mining (he was the finding geologist for Alaska’s Valdez Creek Gold Mine). Mr. Bush received his Bachelor of Science degree in Geology from Ohio State University and his Master of Science from the South Dakota School of Mines and Technology. Mr. Bush is certified by the American Institute of Professional Geologists and is a registered geologist in the States of Alaska and Washington. Mr. Bush also served three years in the U.S. Navy Seabees.
|
|||
66
Audit Committee
The Independent Directors who serve on the Audit Committee are: Loren J. Miller, Chairman; Paul W. Bateman, and G. Thomas Gamble. The Board of Directors has determined that Loren J. Miller is considered to be the Audit Committee Financial Expert. His biography may be found above.
Finance Committee
The Independent Directors who serve on the Finance Committee are: G. Thomas Gamble, Chairman; Loren J. Miller, Paul W. Bateman, and James S. Mayer.
Personnel and Compensation Committee
The Independent Directors who serve on the Personnel and Compensation Committee are: Dr. Henry Lowenstein, Chairman, and G. Thomas Gamble.
Nominating and Corporate Governance Committee
The Independent Directors who serve on the Nominating and Corporate Governance Committee are: Dr. Henry Lowenstein, Chairman, and Edward M. Gabriel.
Compliance with Section 16(a) of the Exchange Act
During 2009, our former Chief Executive Officer, Mr. F. Lynn Blystone, failed to file Form 4 Reports for acquisition of common stock pursuant to exercises of stock options in transactions that were exempt from Section 16(b) of the Securities Exchange Act under Rule 16-b-6. With the exception of the preceding and based solely on the information furnished to the Company, we believe that no person failed to file required Section 16(a) reports on a timely basis during 2009.
Code of Ethics
We have adopted a code of ethics that applies to our directors, officers and employees. The code is also posted on our website (www.tri-valleycorp.com).
ITEM 11. EXECUTIVE COMPENSATION
COMPENSATION DISCUSSION AND ANALYSIS
The core mission of Tri-Valley Corporation is to increase the value and liquidity of Tri-Valley stock in order to build the wealth of Tri-Valley Corporation shareholders. To fulfill this mission, we have developed a business strategy to identify, obtain, and transform exploration projects of exceptional size and potential where exploration, discovery, and operational success may substantially grow the intrinsic value of the Company and market value of its stock to investors.
Tri-Valley strives to incorporate a “team” approach to its business in order to achieve strong operating and financial results. Consistent with this philosophy, Tri-Valley maintains a policy of executive compensation commensurate with long-term risk value assumed by Tri-Valley Corporation shareholders. Consequently, the Tri-Valley Chief Executive Officer’s compensation starts with base cash compensation, recognized to be below comparative peer corporate levels, but which, when coupled with stock options, may result in competitive to above-competitive levels
of compensation at some future date. As such, a significant portion of executive compensation is “at risk” and directly tied to the market performance of Tri-Valley’s stock.
The philosophy of modest base salary coupled with options has now been implemented in the recruitment and retention of all executive management in Tri-Valley and its subsidiary companies. This approach has proven successful in attracting key talented individuals with major industry experience who share the Company’s long-term shareholder value philosophy and performance motivation. Given the competitive human talent market and industry within which Tri-Valley Corporation operates, equity options are now being used to secure key staff and operating personnel within the organization as a means of defining total, potential executive compensation.
67
Overview of Tri-Valley Corporation Executive Compensation Program
This Compensation Discussion and Analysis (CD&A) reviews the compensation policies and decisions of the Personnel and Compensation Committee with respect to the following individuals:
F. Lynn Blystone, Chairman of the Board of Directors and Chief Executive Officer, Tri-Valley Corporation
Maston N. Cunningham, President and Chief Operating Officer, Tri-Valley Corporation
John E. Durbin, Chief Financial Officer and Treasurer, Tri-Valley Corporation
Joseph R. Kandle, President and Chief Operating Officer, Tri-Valley Oil & Gas Co.
James C. Kromer, Vice President, Operations, Tri-Valley Oil & Gas Co.
James G. Bush, President, Select Resources Corporation, Inc.
Arthur M. Evans, Chief Compliance Officer and Secretary, Tri-Valley Corporation
The Tri-Valley Corporation executive compensation program has fixed compensation elements, which comprise base salary and benefits, as well as variable compensation elements related to performance. Each compensation component is described in further detail below.
Objectives of Tri-Valley Corporation Executive Compensation Program
Tri-Valley Corporation believes the skill and dedication of Tri-Valley Corporation executive officers and other management personnel are critical factors impacting Tri-Valley Corporation’s long-term success in meeting its business objectives, as well as, fostering growth and profitability. Accordingly, the Personnel and Compensation Committee has designed Tri-Valley Corporation’s compensation program in accordance with the Company’s compensation philosophy, the objectives of which are to:
|
•
|
motivate and retain Tri-Valley Corporation current executive officers,
|
|
|
•
|
attract new executives with the requisite skill sets to implement and achieve Tri-Valley Corporation’s business strategy, and
|
|
|
•
|
align executive compensation with the attainment of strategic business objectives that increase shareholder value.
|
Setting Executive Compensation and Role of the Personnel and Compensation Committee, Management, and Board of Directors
The Personnel and Compensation Committee reviews, monitors, evaluates, and recommends Tri-Valley Corporation executive compensation policies and programs to the Board of Directors. The Committee recommends both current compensation levels, as well as, short- and long-term incentives for Tri-Valley executives to the Board. In order to perform its function, the Personnel and Compensation Committee relies, in part, on input from the Chief Executive Officer and from other members of senior management in determining the human talent needs of the Company. Input from the Human Resources Department of Tri-Valley Corporation is important in determining the availability of talent and from the Chief Financial Officer in determining the budgetary resources of the company for compensation.
Use of Benchmarking and Peer Company Comparisons
The Personnel and Compensation Committee strives to support an executive compensation program that is structured to provide Tri-Valley executive officers with compensation packages which are commensurate with the Corporation’s size and scope of responsibilities and which are sufficient to retain and motivate personnel considered essential. To achieve this objective, the Personnel and Compensation Committee compares all compensation components for executive management with data for similar positions at other competitive organizations in Tri-Valley’s industry that are similar in number of employees, level of operations, gross revenue, and total assets.
The Personnel and Compensation Committee uses nationally recognized compensation surveys to assess the broader market competitiveness of executive compensation. This data is the product of published and private surveys representing compensation amounts for similar positions within Tri-Valley’s industry. The Personnel and Compensation Committee uses data from these surveys to provide an additional reference point against which to
68
compare the competitiveness of executive compensation. Collectively, this competitive market data provides a frame of reference for the Personnel and Compensation Committee when evaluating executive compensation.
These results may assure shareholders that Tri-Valley Corporation provides fair and competitive executive compensation. They provide further assurance that compensation for Company executives is aligned with performance for the Company’s shareholders.
Section 162(m). The Company believes that all compensation paid or payable to its executive officers covered under Section 162(m) of the Internal Revenue Code will qualify for deductibility under such Section.
Compensation Components
Tri-Valley Corporation executive and key management compensation is comprised of three major components: (1) base salary evaluated annually by the Personnel and Compensation Committee, with recommendations to the Board as appropriate; (2) non-guaranteed annual cash bonuses awarded on the basis of individual performance, as well as, the performance of the company; and (3) long-term equity-based incentives, typically delivered through stock option and/or restricted stock grants also awarded on the basis of individual performance and the performance of the company. Tri-Valley Corporation executive officers may also be eligible for other elements of indirect compensation, comprised of health and welfare benefits, retirement and savings plans, and certain perquisites. These are provided on a non-discriminatory basis to all of Tri-Valley Corporation employees. The Personnel and Compensation Committee considers each of these elements when evaluating the overall compensation program design.
Base Salary
The Personnel and Compensation Committee establishes base salaries that are sufficient to attract, retain, and motivate individuals with the qualities it believes are essential for Tri-Valley’s long-term financial success and that are, likewise, competitive in the Company’s marketplace and industry. An executive officer’s base salary reflects the officer’s responsibilities, risk, tenure, job performance, and direct competition for the executive officer’s services. The Personnel and Compensation Committee reviews the base salaries of each executive officer, including the Chief Executive Officer, on an annual basis. In addition to these annual reviews, the Personnel and Compensation Committee may at any time review the salary of an executive officer who has received a significant promotion, whose responsibilities have been increased significantly, or who is the object of competitive pressure. Any adjustments are based on the results of reviews of market salary data, increases in the cost of living, job performance of the executive officer over time, and the expansion of duties and responsibilities, if any. No pre-determined weight, formula, or emphasis is placed on any one of these factors.
Annual Cash Bonus Awards
Guaranteed Bonuses. There are no guaranteed annual bonuses per the employment contracts of all Tri-Valley executives.
Annual Incentive Compensation. Annual cash bonus awards are subjective and not guaranteed. If distributed, annual cash bonus awards are intended to compensate, and thus provide incentives to, individuals for exceptional effort and job performance, thereby facilitating Tri-Valley Corporation’s continued growth and success by providing rewards that are commensurate with individual achievement. Cash bonus awards are favored by the Personnel and Compensation Committee in situations where it believes that an executive is worthy of an incentive-based award and when it believes that the base salary of such executive is not at the level of competitiveness that the Personnel and Compensation Committee feels appropriate. The Personnel and Compensation Committee considers the achievements of the Company, and the employee’s contribution thereto, in order to determine the level of the cash bonus, if any, to be awarded. The Personnel and Compensation Committee’s considerations focus on Tri-Valley Corporation earnings, the return on shareholders’ equity, the growth in proved oil and gas reserves, and the successful completion of specific projects to determine the level of bonus awards, if any.
Long-Term Equity Based Incentives
Stock option and restricted stock awards are utilized for aligning the executives’ interests with those of the shareholders by giving each executive an individual direct ownership in Tri-Valley Corporation. The Company further believes these awards serve as an incentive to remain with Tri-Valley Corporation, as unvested stock grants and options are forfeited should the executive terminate his or her employment. The Personnel and Compensation
69
Committee focuses on the Company’s earnings, the return on shareholders’ equity, growth in proved oil and gas reserves, and the successful completion of specific projects to determine the level of stock option and restricted awards, if any.
Other Benefits
In addition to base salaries, annual cash bonus awards, and long-term equity-based incentives, Tri-Valley Corporation provides the following other forms of compensation:
|
•
|
401(K) Profit Sharing Plan. The Company has a Defined Contribution (DC) Profit Sharing/401(K) Plan, designed to assist employees in providing for their retirement. The Company contributes to the Plan, in cash, at the rate of three percent (3%) of an employee’s wages or salary. The Company’s contributions to the Plan vest immediately upon receipt.
|
|
|
•
|
Health and Welfare Benefits. Tri-Valley Corporation employees are eligible to participate in medical, dental, vision, life insurance, and tax-advantaged healthcare accounts to meet their health and welfare needs. These benefits are provided on a competitive basis for human talent within the Company’s marketplace and industry. This is a fixed component of compensation, and the benefits are provided on a non-discriminatory basis to all employees.
|
|
Employment Agreements, Severance Benefits, and Change in Control Provisions
Tri-Valley Corporation maintains employment and other compensatory agreements with certain of its corporate officers to cover performance over a fixed period of time. Certain provisions contained in these agreements, such as change-in-control provisions are essential to retaining Company human talent and protecting stockholders’ interests. The Company believes it is appropriate to compensate individuals to refrain from working with competitors following termination, and its compensation enhances the enforceability of such agreements. These executive agreements and Tri-Valley Corporation severance terminology are described in more detail elsewhere within this report. These agreements provide for severance compensation to be paid should the officer’s employment terminate under certain defined conditions, such as among others, following a corporate change, involuntary termination, termination by us for “cause,” death or disability, each as defined in the applicable executive’s agreement.
The employment and other compensation agreements among the Company and the Named Executive Officers and the related severance provisions are designed to provide incentive to those officers to remain in Tri-Valley’s employment. Tri-Valley Corporation agreements with the Named Executive Officers provide different types of compensation for terminations with cause, termination without cause, and for circumstances involving a change of control of the Company. By providing minimal or no benefits in the cases of voluntary resignation or termination with cause, the Named Executive Officers are motivated to remain with the Company and perform their duties as required. On the other hand, security is provided through extra compensation and benefits in the event of termination without cause or in conjunction with a change in control.
Stock Ownership Guidelines and Hedging Prohibition
Tri-Valley Corporation Insider Trading Policy prohibits Company executive officers from entering into certain types of derivative transactions related to Tri-Valley Corporation common stock.
Tax Treatment of Executive Compensation Decisions
In designing Tri-Valley Corporation executive compensation programs, the Personnel and Compensation Committee considers the effects of Section 162(m) of the Internal Revenue Code, which denies publicly-held companies a tax deduction for annual compensation in excess of one million Dollars ($1,000,000) paid to their Chief Executive Officer or any of the corporation’s four other most-highly-compensated corporate officers, other than the Chief Financial Officer, who is employed on the last day of a given year, unless their compensation is based on performance criteria that are established by a committee of outside directors and approved, as to their material terms, by Tri-Valley Corporation stockholders. The Company has in the past, and may from time to time in the future, pay compensation that is not deductible to Tri-Valley Corporation executive officers.
70
Accounting Treatment of Executive Compensation Decisions
The Company accounts for stock-based awards on their grant date fair value, as determined under ASC 718. Compensation expense for these awards, to the extent such awards are expected to vest, is recognized on a straight-line basis over the requisite service period of the award (or to an employee’s eligible retirement date, if earlier). If the award is subject to a performance condition, however, the cost will vary based on the Company’s estimate of the number of shares that ultimately will vest over the requisite service or other period over which the performance condition is expected to be achieved. In connection with its approval of stock-based awards, the Personnel and Compensation Committee is cognizant of, and sensitive to, the impact of such awards on stockholder dilution. The Personnel and Compensation Committee also endeavors to avoid stock-based awards made subject to a market condition, which may result in an expense that must be marked-to-market on a quarterly basis. The accounting treatment for stock-based awards does not otherwise impact the Personnel and Compensation Committee’s recommendations to the Board of Directors.
PERSONNEL AND COMPENSATION COMMITTEE REPORT
The Personnel and Compensation Committee has reviewed and discussed the foregoing Compensation Discussion and Analysis with management, and based upon such review and discussion, it has recommended to the Board of Directors that the Compensation Discussion and Analysis be included in the Company’s Annual Report on Form 10-K.
Submitted by the Personnel and Compensation Committee of the Board of Directors.
Dr. Henry Lowenstein, Chairman
G. Thomas Gamble
71
Summary Compensation Table
The following table summarizes the compensation of the executive officers of the Company and its subsidiaries for the fiscal years ended December 31, 2009, 2008, and 2007:
|
(a)
Name
|
(b)
Fiscal Year
Ending
|
(c)
Salary
|
(d)
Stock
Awards (1)
|
(e)
Option
Awards (2)
|
(f)
Company
401(K)
Contribution
|
Total
Compensation
|
||||||||||||
|
F. Lynn Blystone, CEO
|
12/31/09
|
$ | 210,000 | $ | 6,650 | $ | - | $ | 7,366 | $ | 224,016 | |||||||
|
12/31/08
|
$ | 210,000 | $ | 38,950 | $ | - | $ | 6,300 | $ | 255,250 | ||||||||
|
12/31/07
|
$ | 159,000 | $ | 37,000 | $ | - | $ | 4,770 | $ | 200,770 | ||||||||
|
Maston N. Cunningham, President & COO
|
12/31/09
|
$ | 171,025 | $ | - | $ | 41,641 | $ | 4,175 | $ | 216,841 | |||||||
|
John E. Durbin, CFO
|
12/31/09
|
$ | 45,000 | $ | - | $ | 33,600 | $ | 450 | $ | 79,050 | |||||||
|
Arthur M. Evans, CCO
|
12/31/09
|
$ | 149,625 | $ | - | $ | 30,586 | $ | 5,481 | $ | 185,692 | |||||||
|
12/31/08
|
$ | 138,407 | $ | - | $ | 42,430 | $ | 4,152 | $ | 184,989 | ||||||||
|
12/31/07
|
$ | 120,000 | $ | - | $ | 17,000 | $ | 3,600 | $ | 140,600 | ||||||||
|
Joseph R. Kandle, President, TVOG
|
12/31/09
|
$ | 210,700 | $ | - | $ | 7,560 | $ | 6,571 | $ | 224,831 | |||||||
|
12/31/08
|
$ | 180,350 | $ | 5,922 | $ | 3,780 | $ | 5,410 | $ | 195,462 | ||||||||
|
12/31/07
|
$ | 170,000 | $ | - | $ | - | $ | 5,100 | $ | 175,100 | ||||||||
|
James G. Bush, President, Select
|
12/31/09
|
$ | 171,662 | $ | - | $ | 96,260 | $ | 5,349 | $ | 273,271 | |||||||
|
12/31/08
|
$ | 169,758 | $ | - | $ | 84,980 | $ | 5,093 | $ | 259,831 | ||||||||
|
12/31/07
|
$ | 112,560 | $ | - | $ | 96,000 | $ | 3,377 | $ | 211,937 | ||||||||
|
James C. Kromer, VP Operations, TVOG
|
12/31/09
|
$ | 116,800 | $ | - | $ | 33,600 | $ | 2,670 | $ | 153,070 | |||||||
|
|
||||||||||||||||||
(1) Stock awards are valued at the closing market price on the date of issuance.
(2) Stock option awards are valued on the date of grant using the Black-Scholes model. See Note 5 to
the Consolidated Financial Statements in Item 7.
EMPLOYMENT AGREEMENT WITH OUR CHIEF EXECUTIVE OFFICER
In 2009, we had an Employment Agreement with Mr. F. Lynn Blystone, our Chief Executive Officer. The terms of the contract were for a base salary amount of $210,000 per year, plus 5,000 shares of our common stock at the end of each year of service. Mr. Blystone was also entitled to a bonus (not to exceed $25,000) equal to 10% of net operating cash flow before taxes, including interest income and excluding debt service. Mr. Blystone was also entitled to a bonus of four percent of the Company's annual net after-tax income. The total of the bonuses from cash flow and from net income could not exceed $50,000 per year, although the Board of Directors could authorize additional bonuses and compensation if it so desired. The Employment Agreement also provided for a severance payment to Mr. Blystone if he was terminated within 12 months after a sale of control of the Company. The severance payment was limited to the lesser of $150,000 or an amount calculated pursuant to any rules or regulation promulgated by any regulatory agency having jurisdiction over the Company, plus a pro-rata bonus calculated from cash flow and from net income with a total limit remaining at $50,000. For purposes of the severance provision, a sale of control was deemed to be the sale of ownership of 30% of the issued and outstanding stock of Tri-Valley Corporation or the acquisition of sufficient stock of the Company to elect or appoint a majority of the members of the Board of Directors of the Company.
In 2009, we carried key man life insurance of $0.5 million on Mr. Blystone's life. Mr. Blystone retired from his positions with Company on March 5, 2010. See Note 16 to our Consolidated Financial Statements.
72
Employee Pension, Profit Sharing, or Other Retirement Plans
During 2005, the Company established a 401(K) Profit Sharing Plan, allowing for the deferral of employee income. The Plan provides for the Company to contribute three percent of employee gross wages. For the year ended December 31, 2009, the Company contributed $0.1 million to the Plan.
AGGREGATED 2009 OPTION EXERCISES AND YEAR-END VALUES
The following table summarizes the number and value of all unexercised stock options held by the Named Executive Officers and the Directors at the end of 2009.
|
( a )
|
(b)
|
(c)
|
(d)
|
(e)
|
||||||||||||
|
Name
|
Shares Acquired
On Exercise (#)
|
Value Realized ($)
|
Number of Securities
Underlying Unexercised
Options at FY End Exercisable/
Unexercisable
|
Value of Unexercised In
The Money Options at FY End ($)
Exercisable/ Unexercisable
|
||||||||||||
|
F. Lynn Blystone
|
41,000 | $ | 32,595 | 550,000/0 | $ | 326,000/$0 | ||||||||||
|
Maston N. Cunningham
|
0 | 0 | 65,000/135,000 | $ | 48,050/$103,950 | |||||||||||
|
John E. Durbin
|
0 | 0 | 10,000/90,000 | $ | 0/$0 | |||||||||||
|
Arthur M. Evans
|
5,000 | $ | 9,500 | 93,500/11,500 | $ | 14,150/$3,300 | ||||||||||
|
G. Thomas Gamble
|
0 | 0 | 80,000/0 | $ | 0/$0 | |||||||||||
|
Paul W. Bateman
|
0 | 0 | 60,000/40,000 | $ | 0/$0 | |||||||||||
|
Edward M. Gabriel
|
0 | 0 | 60,000/40,000 | $ | 0/$0 | |||||||||||
|
Joseph R. Kandle
|
0 | 0 | 281,000/4,000 | $ | 154,500/$0 | |||||||||||
|
James G. Bush
|
43,000/74,000 | $ | 8,500/$0 | |||||||||||||
|
Henry Lowenstein
|
100,000/0 | $ | 0/$0 | |||||||||||||
|
Loren J. Miller
|
0 | 0 | 0/0 | $ | 0/$0 | |||||||||||
|
James S. Mayer
|
0 | 0 | 40,000/60,000 | $ | 0/$0 | |||||||||||
*Based on a fair market value of $1.96 per share, which was the closing price of the Company's Common Stock on the NYSE Amex, LLC on December 31, 2009.
73
OPTION GRANTS DURING THE FISCAL YEAR ENDED DECEMBER 31, 2009, TO NAMED EXECUTIVE OFFICERS
The following table sets forth information regarding options for the purchase of shares granted during the fiscal year ended December 31, 2009, to the Named Executive Officers.
|
% of Total
|
Market Value
|
|||||||||||||
|
Number of Shares
|
Options Granted
|
Exercise Price
|
of Securities
|
|||||||||||
|
Underlying Options
|
to Employees
|
Per Share
|
Underlying
|
Expiration
|
||||||||||
|
Name
|
Granted
|
in Fiscal Year
|
($/Security)
|
Options(6)
|
Date
|
|||||||||
|
Maston N. Cunningham(1)
|
100,000
|
16.8%
|
$1.28
|
$ 68,000 |
1/2014
|
|||||||||
|
Maston N. Cunningham(2)
|
100,000
|
16.8%
|
$1.10
|
$ 86,000 |
5/2014
|
|||||||||
|
James G. Bush(3)
|
10,000
|
1.7%
|
$1.10
|
$ 8,600 |
5/2014
|
|||||||||
|
Arthur M. Evans(3)
|
10,000
|
1.7%
|
$1.10
|
$ 8,600 |
5/2014
|
|||||||||
|
James C. Kromer(4)
|
100,000
|
16.8%
|
$1.23
|
$ 73,000 |
5/2014
|
|||||||||
|
John E. Durbin(5)
|
100,000
|
16.8%
|
$2.42
|
$ 0 |
10/2014
|
|||||||||
| (1 | ) |
The options were granted January 14, 2009, and 40,000 options were vested as of December 31, 2009
|
|
| (2 | ) |
The options were granted May 15, 2009, and 25,000 options were vested as of December 31, 2009.
|
|
| (3 | ) |
The options were granted May 18, 2009, and all options were vested as of December 31, 2009.
|
|
| (4 | ) |
The options were granted May 18, 2009, and 30,000 options were vested as of December 31, 2009.
|
|
| (5 | ) |
The options were granted October 1, 2009, and 10,000 options were vested as of December 31, 2009.
|
|
| (6 | ) |
Based on the difference between the exercise price per share and the market price of $1.96 per share as of December 31, 2009
|
74
OUTSTANDING EQUITY AWARDS TABLE TO NAMED EXECUTIVE OFFICERS AND DIRECTORS
|
Name
|
Number of Securities Underlying
|
Option Exercise
|
Option Expiration
|
||||||||||
|
Unexercised Options
|
Price
|
Date
|
|||||||||||
|
Exercisable
|
Unexercisable
|
||||||||||||
|
( a )
|
(b)
|
(c)
|
(d)
|
(e)
|
|||||||||
|
Paul W. Bateman
|
60,000 | 40,000 | $ | 6.37 |
8/2/2017
|
||||||||
|
F. Lynn Blystone
|
50,000 | 0 | $ | 2.43 |
9/16/2010
|
||||||||
| 200,000 | 0 | $ | 1.22 |
11/16/2010
|
|||||||||
| 300,000 | 0 | $ | 1.35 |
10/22/2011
|
|||||||||
|
James G. Bush
|
30,000 | 70,000 | $ | 7.88 |
5/23/2017
|
||||||||
| 3,000 | 4,000 | $ | 6.10 |
7/3/2013
|
|||||||||
| 10,000 | 0 | $ | 1.10 |
5/18/2014
|
|||||||||
|
Maston N. Cunningham
|
40,000 | 60,000 | $ | 1.28 |
1/14/2014
|
||||||||
| 25,000 | 75,000 | $ | 1.10 |
5/15/2014
|
|||||||||
|
John E. Durbin
|
10,000 | 90,000 | $ | 2.42 |
10/1/2014
|
||||||||
|
Arthur M. Evans
|
40,000 | 0 | $ | 9.55 |
11/18/2015
|
||||||||
| 20,000 | 0 | $ | 5.03 |
1/23/2017
|
|||||||||
| 6,000 | 4,000 | $ | 6.10 |
7/3/2017
|
|||||||||
| 22,500 | 7,500 | $ | 1.51 |
12/18/2017
|
|||||||||
| 5,000 | 0 | $ | 1.10 |
5/18/2014
|
|||||||||
|
Edward M. Gabriel
|
60,000 | 40,000 | $ | 6.49 |
8/1/2017
|
||||||||
|
G. Thomas Gamble
|
80,000 | 0 | $ | 6.35 |
5/8/2016
|
||||||||
|
Joseph R. Kandle
|
50,000 | 0 | $ | 2.43 |
9/16/2010
|
||||||||
| 150,000 | 0 | $ | 1.22 |
11/16/2010
|
|||||||||
| 75,000 | 0 | $ | 1.35 |
10/22/2011
|
|||||||||
|
James C. Kromer
|
30,000 | 70,000 | $ | 1.23 |
5/18/2014
|
||||||||
|
Henry Lowenstein
|
100,000 | 0 | $ | 6.35 |
5/9/2016
|
||||||||
|
James S. Mayer
|
40,000 | 60,000 | $ | 7.25 |
8/14/2013
|
||||||||
|
Loren J. Miller
|
0 | 0 | 0 |
0
|
|||||||||
75
COMPENSATION OF DIRECTORS
The Company compensates non-employee directors for their service on the board of directors.
The following table sets forth information regarding the compensation paid to outside directors in 2009:
|
(a)
Name
|
(b)
Fees
|
(c)
Stock
Awards (1)
|
(d)
Option
Awards (2)
|
(e)
Total
Compensation
|
||||||||||||
|
Paul W. Bateman
|
$ | 10,750 | $ | 3,900 | $ | 40,100 | $ | 54,750 | ||||||||
|
Edward M. Gabriel
|
$ | 8,250 | $ | 3,900 | $ | 40,800 | $ | 52,950 | ||||||||
|
G. Thomas Gamble
|
$ | 14,750 | $ | 3,900 | $ | - | $ | 18,650 | ||||||||
|
|
||||||||||||||||
|
Dr. Henry Lowenstein
|
$ | 13,750 | $ | 3,900 | $ | - | $ | 17,650 | ||||||||
|
James S. Mayer
|
$ | 8,250 | $ | 3,900 | $ | 45,000 | $ | 57,150 | ||||||||
|
Loren J. Miller
|
$ | 11,000 | $ | 3,900 | $ | - | $ | 14,900 | ||||||||
|
(1)
|
This column represents the Dollar amount recognized for financial statement reporting purposes with respect to the 2009 fiscal year for the fair value of stock granted in 2009. Fair value is initially calculated using the closing price of our stock on the date of grant. In 2009, each Director was granted 2,000 shares of common stock on January 2, 2009, for services rendered in 2008. The initial value of the stock granted to each director on that date was $3,900, based on a closing market price of $1.95 per share.
|
|
(2)
|
Stock option awards relate to the accounting expense for options vested in accordance with ASC 718, which requires the expensing of equity stock awards based on the grant date of the option. The grant date for Mr. Mayer is August 14, 2008; Mr. Bateman is August 2, 2007; Mr. Gabriel is August 1, 2007; for Mr. Gamble and Dr. Lowenstein, the grant date was May 6, 2006.
|
Each Director is compensated at the rate of $2,000 per board meeting and $500 for each committee meeting as of December 31, 2009.
76
ITEM 12. SECURITY OWNERSHIP OF CERTAIN BENEFICIAL OWNERS AND MANAGEMENT
As of December 31, 2009, there were 33,190,462 shares of the Company's common stock issued and outstanding. The following persons were known by the Company to be the beneficial owners of more than 5% of such issued and outstanding common stock:
|
Number of
|
Percent of
|
|||
|
Name and Address
|
Shares
|
Total
|
||
|
G. Thomas Gamble
P.O. Box 128
Oakville, CA 94562
|
3,005,650(1)
|
9.0%
|
|
(1)
|
Includes 80,000 shares of stock Mr. Gamble has the right to acquire upon the exercise of options.
|
The following table sets forth the beneficial ownership of the Company's common stock as of December 31, 2009 by each Director, by each of the Executive Officers named in Item 11, by the Executive Officer named in Item 10, and by Directors as a group:
|
Number of
|
Percent of
|
|||
|
Directors and Executive Officers
|
Shares (1)
|
Total (2)
|
||
|
F. Lynn Blystone
|
1,051,853
|
3.1%
|
||
|
Maston N. Cunningham
|
200,000
|
0.6%
|
||
|
John E. Durbin
|
100,000
|
0.3%
|
||
|
Arthur M. Evans
|
115,000
|
0.3%
|
||
|
G. Thomas Gamble
|
3,005,650
|
9.0%
|
||
|
Paul W. Bateman
|
105,000
|
0.3%
|
||
|
Edward M. Gabriel
|
104,000
|
0.3%
|
||
|
Joseph R. Kandle
|
360,946
|
1.1%
|
||
|
James G. Bush
|
120,500
|
0.4%
|
||
|
Henry Lowenstein, Ph.D.
|
107,200
|
0.3%
|
||
|
Loren J. Miller
|
249,236
|
0.8%
|
||
|
James S. Mayer
|
102,000
|
0.3%
|
||
|
James C. Kromer
|
100,000
|
0.3%
|
77
Directors and Executive Officers (continued)
|
Number of
|
Percent of
|
|||
|
Shares
|
Total
|
|||
|
Total Group (All Directors and
|
||||
|
Executive Officers - 13 Persons)
|
5,721,385
|
17.1%
|
|
(1)
|
Includes shares which the listed shareholder has the right to acquire from options as follows: F. Lynn Blystone 550,000; Arthur M. Evans 105,000; G. Thomas Gamble 80,000; Joseph R. Kandle 285,000; Dr. Henry Lowenstein 100,000; Paul W. Bateman 100,000; Edward M. Gabriel 100,000; James S. Mayer 100,000; James G. Bush 120,500; Maston N. Cunningham 200,000; James C. Kromer 100,000; and John E. Durbin 100,000.
|
|
(2)
|
Based on total issued and outstanding shares of 33,190,462 as of December 31, 2009. The persons named herein have sole voting and investment power with respect to all shares of common stock shown as beneficially owned by them, subject to community property laws where applicable.
|
ITEM 13. CERTAIN RELATIONSHIPS AND RELATED TRANSACTIONS
At December 31, 2009, the Company had a related-party payable of $850,000 to Mr. G. Thomas Gamble, Director and Vice Chairman of the Board of Directors, and our largest shareholder. This payable resulted from Mr. Gamble’s ordinary, intended purchase of the Company’s common stock. When it was determined that the intended purchase of shares did not satisfy NYSE Amex, LLC, exchange requirements, the Company did not provide timely notice to Mr. Gamble. Upon such notification, the Company offered Mr. Gamble a refund of his investment funds. The Company remains in negotiation with Mr. Gamble on this transaction.
ITEM 14. PRINCIPAL ACCOUNTANT FEES AND SERVICES
|
YEAR
|
AUDIT SERVICES
|
TAX SERVICES
|
AUDIT RELATED
|
|||||
| $ | $ | $ | ||||||
|
2009
|
$106,012 | $70,689 | $25,931 | |||||
|
2008
|
$103,607 | $28,226 | $32,303 | |||||
|
2007
|
$132,592 | $60,390 | $54,202 |
All of our auditors were full time, permanent employees of the accounting firm auditing our financial statements.
Policy on Audit Committee Pre-Approval of Audit and Permissible Non-Audit Services of Independent Auditors
The Audit Committee pre-approves all audit and non-audit services provided by the independent auditors prior to the engagement of the independent auditors with respect to such services. The Chairman of the Audit Committee has been delegated the authority by the Committee to pre-approve interim services by the independent auditors, other than the annual exam. The Chairman must report all such pre-approvals to the entire Audit Committee at the next committee meeting.
78
ITEM 15. EXHIBITS AND FINANCIAL STATEMENT SCHEDULES
|
Exhibit
|
|
|
Number
|
Description of Exhibit
|
|
3.1
|
Amended and Restated Certificate of Incorporation, incorporated by reference to Exhibit A of the Company’s 2000 Proxy Statement and Definitive Schedule 14A, filed with the SEC on July 26, 2000.
|
|
3.2
|
Amended and Restated Bylaws, incorporated by reference to Exhibit 3.3 of the Company's Form 10-Q for the quarter ended September 30, 2007, filed with the SEC on November 9, 2007.
|
|
4.1
|
Rights Agreement, incorporated by reference to Exhibit 4.1 of the Company’s Form S-3, filed with the SEC on December 2, 2009.
|
|
10.1
|
Employment Agreement with F. Lynn Blystone, executed on March 10, 2009, incorporated by reference to Exhibit 10.1 of the Company’s Form 10-K for the year ended December 31, 2008, filed with the SEC on March 30, 2009.
|
|
10.2
|
Tri-Valley Corporation 2005 Stock Option Plan, as amended, incorporated by reference to Exhibit A of the Company’s 2007 Proxy Statement and Definitive Schedule 14A, filed with the SEC on August 2, 2007.
|
|
10.3
|
Tri-Valley Corporation 2010 Sample Indemnification Agreement for Directors, Officers, Employees, or Agents of the Company, filed herewith.
|
|
10.4
|
Executive Retirement Agreement and General Release with F. Lynn Blystone, executed on March 5, 2010, filed herewith.
|
|
23.1
|
Consent of Independent Petroleum Engineers and Geologists, Cecil Engineering, Inc., dated March 2, 2010, filed herewith.
|
| 23.2 | Consent of Independent Petroleum Engineers and Geologists, AJM Petroleum Consultants, dated March 8, 2010, filed herewith. |
|
23.3
|
Consent of Brown Armstrong Paulden McCown Starbuck Thornburgh & Keeter Accountancy Corporation, dated March 26, 2010, filed herewith.
|
| 31.1 | Certification Pursuant to Rule 13a-14(a) / 15d-14(a), filed herewith. |
|
31.2
|
Certification Pursuant to Rule 13a-14(a) / 15d-14(a), filed herewith.
|
|
32.1
|
Certification Pursuant to 18 U.S.C. §1350, filed herewith.
|
| 32.2 | Certification Pursuant to 18 U.S.C. §1350, filed herewith. |
|
99.1
|
AJM Petroleum Consultants, Reserve Estimation and Economic Evaluation, Executive Summary, dated December 31, 2009, filed herewith.
|
|
99.2
|
Leland B. Cecil, P.E., Evaluation of Oil and Gas Reserves, Tri-Valley Oil & Gas Co., Executive Summary, dated December 31, 2009, filed herewith.
|
79
SIGNATURES
Pursuant to the requirements of Section 13 or 15(d) of the Securities Exchange Act of 1934, the Registrant has duly caused this report to be signed on its behalf by the undersigned, thereunto duly authorized.
| March 26, 2010 |
By: /s/ Maston N. Cunningham
|
|
|
Maston N. Cunningham
|
||
|
Chief Executive Officer and President
|
||
| March 26, 2010 |
By: /s/ John E. Durbin
|
|
|
John E. Durbin
|
||
|
Chief Financial Officer
|
Pursuant to the requirements of the Securities Exchange Act of 1934, this Report has been signed below by the following persons on behalf of the Registrant and in the capacities and on the dates included:
|
March 26, 2010
|
By: /s/ Paul W. Bateman
|
||
|
Paul W. Bateman, Director
|
|||
| March 26, 2010 |
By: /s/ Edward M. Gabriel
|
||
|
Edward M. Gabriel, Director
|
|||
| March 26, 2010 |
By: /s/ G. Thomas Gamble
|
||
|
G. Thomas Gamble,
Director & Chairman of the Board of Directors
|
|||
| March 26, 2010 |
By: /s/ Henry Lowenstein
|
||
|
Henry Lowenstein, Ph.D., Director
|
|||
| March 26, 2010 |
By: /s/ James S. Mayer
|
||
|
James S. Mayer, Director
|
|||
| March 26, 2010 |
By: /s/ Loren J. Miller
|
||
|
Loren J. Miller, Director
|
80