Attached files
Table of Contents
UNITED STATES
SECURITIES AND EXCHANGE COMMISSION
Washington, D.C. 20549
Form 10-K
(Mark One)
| x | ANNUAL REPORT PURSUANT TO SECTION 13 OR 15(d) OF THE SECURITIES EXCHANGE ACT OF 1934 |
For the fiscal year ended December 31, 2009
Or
| ¨ | TRANSITION REPORT PURSUANT TO SECTION 13 OR 15(d) OF THE SECURITIES EXCHANGE ACT OF 1934 |
For the transition period from to
Commission file number 001-33405
Dreams, Inc.
(Exact name of registrant as specified in its charter)
| Utah | 87-0368170 | |
| (State or other jurisdiction of incorporation or organization) |
(I.R.S. Employer Identification No.) |
| 2 South University Drive, suite 325 Plantation, Florida | 33324 | |
| (Address of principal executive offices) | (Zip Code) |
Registrant’s telephone number (954) 377-0002
Securities registered pursuant to Section 12(b) of the Act:
| Title of each class |
Name of each exchange on which registered | |
| Common stock, no par value | American Stock Exchange |
Securities registered pursuant to Section 12(g) of the Act:
None
(Title of class)
Indicate by check mark if the registrant is a well-known seasoned issuer, as defined in Rule 405 of the Securities Act. ¨ Yes x No
Indicate by check mark if the registrant is not required to file reports pursuant to Section 13 or Section 15(d) of the Act. ¨ Yes x No
Indicate by check mark whether the registrant (1) has filed all reports required to be filed by Section 13 or 15(d) of the Securities Exchange Act of 1934 during the preceding 12 months (or for a shorter period that the registrant was required to file such reports), and (2) has been subject to such filing requirements for the past 90 days. x Yes ¨ No
Indicate by check mark whether the registrant has submitted electronically and posted on its corporate Web site, if any, every Interactive Data File required to be submitted and posted pursuant to Rule 405 of Regulation S-T during the preceding 12 months (or for such shorter period that the registrant was required to submit and post such files). ¨ Yes ¨ No
Indicate by check mark if disclosure of delinquent filers pursuant to Item 405 of Regulation S-K is not contained herein, and will not be contained, to the best of registrant’s knowledge, in definitive proxy or information statements incorporated by reference in Part III of this Form 10-K or any amendment to this Form 10-K. x
Indicate by check mark whether the registrant is a large accelerated filer, an accelerated filer, a non-accelerated filer, or a smaller reporting company. See the definitions of “large accelerated filer”, “accelerated filer”, “non-accelerated filer”, and “smaller reporting company” in Rule 12b-2 of the Exchange Act. (Check one):
| Large accelerated filer | ¨ | Accelerated filer | ¨ | |||
| Non-accelerated filer | ¨ | Smaller reporting company | x | |||
Indicate by check mark whether the registrant is a shell company (as defined in Rule 12b-2 of the Act.) ¨ Yes x No
The aggregate market value of the voting and non-voting common equity held by non-affiliates as of the closing price of such shares on the last business day of the registrant’s most recently completed second fiscal quarter was approximately $8,400,000.
The number of shares outstanding of the registrant’s common stock as of March 1, 2010 is 37,646,811.
DOCUMENTS INCORPORATED BY REFERENCE—NONE
Table of Contents
FORM 10-K
i
Table of Contents
Part I
| Item 1. | BUSINESS. |
Introduction.
As used in this Form 10-K “we”, “our”, “us”, “the Company” and “Dreams” refer to Dreams, Inc. and its subsidiaries unless the context requires otherwise.
Overview
Dreams, Inc., headquartered in Plantation, Florida is a Utah Corporation which was formed on April 9, 1980, and has evolved into the premier vertically integrated licensed sports products firm in the industry. This has previously been accomplished, in part, via organic growth and strategic acquisitions. Our continuing pursuit of this dual strategy should result in our becoming a principal leader and a consolidator in this highly fragmented industry. We believe our senior management and corporate infrastructure is well suited to acquire both large and small industry competitors.
Specifically, we are engaged in multiple aspects of the licensed sports products and autographed memorabilia industry through a variety of distribution channels.
We generate revenues principally from:
| • | Our twelve (12) company-owned Field of Dreams stores; (reported in retail segment) |
| • | Our six (6) company-owned FansEdge stores; (reported in retail segment) |
| • | Our e-commerce component featuring www.FansEdge.com and others; (reported in retail segment) |
| • | Our athlete and web syndication sites; (reported in retail segment) |
| • | Our catalogues; (reported in retail segment) |
| • | Our manufacturing/distribution of sports memorabilia products, custom acrylic display cases and framing; (reported in mfg/wholesale segment) |
| • | Our running of sports memorabilia /collectible trade shows; (reported in mfg/wholesale segment) |
| • | Our franchise program through the eight (8) Field of Dreams franchise stores presently operating*; (reported in other income) and |
| • | Our representation and corporate marketing of individual athletes*(reported in other income). |
| * | revenues not material to the overall consolidated results. |
Organic Growth (dollar amounts in thousands)
Key components of our organic growth strategy include building brand recognition; improving sales conversion rates both in our stores and web sites; continuing our execution of multi-channel retailing under our FansEdge brand; aggressively marketing our web syndication services, which has met with early success, exploring additional distribution channels for our products; and cross pollinating corporate assets among our various operating divisions. Management believes that there remain significant benefits to cross pollinating the various corporate assets and leveraging the vertically integrated model that has been constructed over the years.
In particular, we have had success with the marketing of our products on-line via FansEdge.com and the complement of each of our web properties. The Company’s sales associated with these e-commerce initiatives have grown from $4,000 in 2004 to $60,000 in 2009, placing it at number 363 in 2005, number 289 in 2006, number 216 in 2007, and number 217 in 2008 of the largest Internet retailers in the nation (2009 ranking is forthcoming). This remains the fastest growing area of the Company.
The Company has drawn on a complete spectrum of competencies it has developed to support its flagship online brand, FansEdge. This has allowed the Company to leverage the investments made during the past several years by marketing a proven range of services to third parties that include; managed hosting, custom site design and development, customer service, order fulfillment, purchasing, inventory management, marketing, merchandising, and analytics and reporting. The Company calls the compilation of e-commerce services described above, Web Syndication and believes there are significant growth opportunities that exist in the marketplace. Our current web syndication portfolio consists of some of the best known brands and properties in the country, including JC Penney, AOL Sports, Majestic Athletic and the Philadelphia Eagles, to name a few.
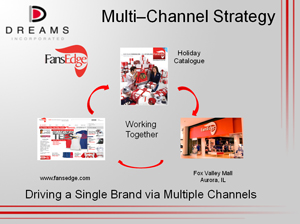
Commencing in June 2008 and continuing throughout the fall of 2008, we opened (6) six FansEdge stores in the greater Chicago, IL area. This was in support of our Multi-channel Retailing strategy; whereby we market a single brand via multiple channels. We are pleased with the results to date of our FansEdge brick & mortar stores. They have performed well during the slow economy as we believe they offer approachable price points for the consumer. They cross market with the on-line Fansedge.com site and benefit by a high-tech inter-active kiosk used in each of the six (6) FansEdge stores.
1
Table of Contents
During the year ended December 31, 2009, the Company closed five (5) under-performing Field of Dreams stores (Westfarms, Pier 39, Scottsdale Fashion, Fashion Valley, North Bridge) and has closed three (3) more during the first quarter of 2010. We will continue to monitor the results of the existing stores to ensure that they are providing us with the desired results.
Our proprietary e-commerce platform has also enabled us to fuel a state-of-the-art in-store interactive Kiosk for ordering products. These Kiosks are in each of the new FansEdge stores and are providing a unique shopping experience for our customers by allowing them to access the entire Company portfolio of more than 200,000 product offerings. In fact, for 2009, we saw an average of 20% contribution to the individual store sales from the Kiosks. In addition, we are experiencing higher conversion rates on-line in the Chicago market for our FansEdge.com site due to the brand recognition provided by the physical stores presence throughout the Chicago land area. The Company will seek joint venture deals with national retailers who are seeking to add a broader range of merchandising options to their customers by placing our kiosks within their store footprint. In October 2009, we installed our kiosks in six (6) Philadelphia Eagles team stores in the greater Philadelphia market.
We believe this expansion of our revenue producing footprint will serve us well as we navigate our business models through the challenging economy and look to distinguish ourselves from our competitors.
Objective
Our overall objective is twofold; to become the premier multi-channel retailer in the team licensed products industry under our FansEdge brand; and become the leading online syndicator for sports related properties.
Analysis
We review our operations based on both our financial results and various non -financial measures. Management’s focus in reviewing performance begins with growth in sales, margin integrity and operating income. On the expense side, with a majority of our sales being achieved as an on-line retailer of licensed sports products, we spend a disproportionate amount of our operating expenses in internet marketing. Therefore, we continuously monitor the return on investment of these particular expenses. Non-financial measures which management reviews include: unique visitors to our web sites, foot traffic in our stores, sales conversion rates and average sold unit prices.
We believe the implementation of our Multi-channel Retailing strategy will strengthen our FansEdge brand in the marketplace, and that we are well positioned to capture increased activity of on-line retail purchases. Industry experts and analysts state that currently, only 6-7% of all retail sales are being conducted on-line and are anticipated to increase.
With the continued growth of our Web Syndication business model, which grew from 31 clients in 2008 to 50 clients in 2009, and revenues from syndication growing from $3,000 in 2008 to over $17,000 in 2009, we are leveraging the Company’s investment in its broad inventory by offering the items to multiple sites simultaneously. This should improve our inventory turnover, increase our absorption rates and reduce inventory carrying costs.
Historically, the fourth quarter of the fiscal year (October to December) has accounted for a greater proportion of our operating income than have each of the other three quarters of our fiscal year. This is primarily due to increased activities as a result of the holiday season. We expect that we will continue to experience quarterly variations and operating results principally as a result of the seasonal nature of our industry. Management continues to seek ways to shift expenses from the non-holiday quarters to the busier holiday quarter in order to improve cash flow. Other factors also cause a significant fluctuation of our quarterly results, including the timing of special events, the general popularity of a specific team that plays in a championship or an individual athlete who enters their respective sports’ Hall of Fame, the amount and timing of new sales contributed by new web syndication accounts, new stores, the timing of personal appearances by particular athletes and general economic conditions. Additional factors may cause fluctuations and expenses, including the costs associated with the opening of new stores, the integration of acquired businesses and stores into our operations , the general health of the economy, and corporate expenses needed to support our expansion and growth strategy.
Conclusion
We set ourselves apart from other companies with our diversified product and services line, our proprietary e-commerce platform, as well as our relationships with sports leagues, agents and athletes. Management believes we can continue to capture market share and become a consolidator in the highly fragmented licensed sports products industry, especially on-line.
2
Table of Contents
Current Landscape
Dreams presently operates in two business segments:
| • | Retail. Our retail segment is made up of many locations for our inventory. Revenues are achieved by moving inventory through our sales channels to reach and expand our customer base. These channels include the internet, stores and our catalogues. The retail segment is comprised of twelve (12) Company owned and operated Field of Dreams® retail stores, the six (6) Company owned and operated FansEdge retail stores and catalogues and e-Commerce sites featuring FansEdge.com and ProSportsMemorabilia.com. The e-commerce component of the segment consists primarily of two e-commerce retailers along with a growing portfolio of athlete and syndicated web sites selling a diversified selection of sports licensed products and memorabilia on the Internet and has represented the fastest growing area of the Company. |
| • | Manufacturing/Distribution. The manufacturing/distribution segment represents the manufacturing and wholesaling of sports and celebrity memorabilia products, custom framing and acrylic display cases. These operations are conducted through Mounted Memories™. |
Retail Segment.
Brick & Mortar Channel
As of March 1, 2010 we owned and operated nine (9) Field of Dreams® retail stores and six (6) FansEdge stores. Three (3) of our leases for Field of Dreams stores came to term between January 31, 2010 and February 28, 2010, and were not renewed and the stores were closed. The Company will continue to evaluate the opening of new retail stores under the FansEdge brand. Stores typically are located in high traffic areas in regional shopping malls. The stores average approximately 1,000-2,500 square feet. We pay a 1% royalty fee to MCA Universal Licensing for the use of the “Field of Dreams” trademark relating to sales generated in our Field of Dreams stores. Effective December 31, 2005, the parties extended the exclusive licensing agreement for an additional five-year term. During the year ended December 31, 2009 and 2008, we incurred royalty fees of $125 and $165, respectively.
This segment prides itself on being the ultimate, corporate-owned licensed sports products and celebrity gift stores in the country. This goal has been achieved by:
| • | Incorporating technology into the retail shopping experience (Inter-active kiosks); |
| • | Staying ahead of the competition by offering innovative and fresh products; |
| • | Offering unrivaled service and product knowledge communicated through the best personnel in the industry; |
| • | Implementing management, product and financial controls to ensure maximum profitability. |
A store typically has a full-time manager and a full time assistant manager in addition to hourly personnel, most of who work part-time. The number of hourly sales personnel in each store fluctuates depending upon our seasonal needs. Our stores are generally open seven days per week and ten hours per day.
Set forth below is a listing of our stores as of March 1, 2010, their location and the date opened or acquired.
| STORE NAME |
LOCATION |
DATE OPENED OR ACQUIRED | ||
| Field of Dreams: | ||||
| Park Meadows Mall | Denver, CO | March 2002 | ||
| Woodfield Mall | Schaumberg, IL | October 2002 | ||
| Garden State Plaza | Paramus, NJ | May 2003 | ||
| Cherry Creek Mall | Denver, CO | May 2004 | ||
| The Rio Hotel | Las Vegas, NV | December 2006 | ||
| Smith & Wollensky Plaza | Las Vegas, NV | December 2006 | ||
| Caesars Palace Forum Shops | Las Vegas, NV | December 2006 | ||
| Boca Town Center | Boca Raton, FL | June 2007 | ||
| Florida Mall | Orlando, FL | July 2007 | ||
| Fans Edge: | ||||
| Fox Valley Mall | Aurora, IL | June 2008 | ||
| Northbridge Mall | Chicago, IL | August 2008 | ||
| Orland Square | Orland Pk, IL | September 2008 | ||
| Lincolnwood Mall | Lincolnwood, IL | September 2008 | ||
| Woodfield Mall | Schaumberg, IL | October 2008 | ||
| River Oaks Mall | Calumet City, IL | October 2008 | ||
3
Table of Contents
E-Commerce Channel
The Company sells officially licensed products and authentic autographed memorabilia of the NFL, MLB, NHL, NBA, NCAA and NASCAR via our e-commerce channel with our feature sites Fansedge.com and ProSportsMemorabilia.com leading the way.
Our focus is on providing the best customer experience in the online sports-licensed products and memorabilia vertical.
These e-commerce channels have provided for the fastest growing area of the Company with revenues climbing from approximately $4,000 in 2004 to $60,000 in 2009.
E-commerce products are marketed through a series of company-owned and syndicated websites that offer customers a daily selection of items from more than 200 teams and over 1,300 different athletes. This division sells over 200,000 products across categories such as apparel, auto accessories, autographed memorabilia, collectibles, headwear, home and office items, jewelry and watches, tailgate and stadium gear, and DVD’s. These online properties represent several of the leading brand names in this market including, but not limited to:
Big Box Retailer Sites – (JC Penney)
Professional Sports Team Sites – (Philadelphia Eagles, Washington Wizards)
Content Sites – (AOL Fanhouse, Pro Football Weekly, Football.com, Covers, Topix)
Fantasy Sites – (Open Sports, Rotohog, Fanball, Rotowire, Fantasy Players)
Newspaper Sites – (Baltimore Sun, Tucson.com, OC Register, Houston Chronicle, BostonGlobe.com)
Player Sites – (Dan Marino, Larry Bird, Ben Roethlisberger, Dick Butkus, Pete Rose, Andre Dawson)
Miscellaneous Sites – (Majestic Athletic, Orange Bowl Stadium, Fandalia, The Sporting News, Tuff Stuff)
Beginning in January 2008, the Company began marketing its web syndication services to third parties. Web Syndication is when website material is made available to multiple other sites. This arrangement benefits both the Company providing content/products and the websites displaying it. The Company’s list of syndication clients has grown from 31 in 2008, to 50 in 2009, with associated revenues of $3,000 in 2008 and over $17,000 in 2009. The Company has drawn on the complete spectrum of competencies it developed to support its flagship online brand, FansEdge. These services include: managed hosting, custom site design and development, customer service, order fulfillment, purchasing, inventory management, marketing, merchandising, analytics and reporting. The Company calls the compilation of e-commerce services described above, Web Syndication and believes there are significant growth opportunities that exist in the marketplace.
In addition, FansEdge maintains strategic alliances with Amazon.com and WalMart.com in which our FansEdge and ProTeam brands and their products are sold in the apparel and sporting section of the Amazon.com, and WalMart.com websites. Amazon, with an audience of more than 50 million active customer accounts, affords us national brand prominence for our FansEdge.com brand. On August 31, 2009, WalMart announced the launch of the “WalMart Marketplace” whereby they selected a few retailers based on their strong customer service track records and large assortments of quality brands and products to enhance the WalMart on-line experience. Pro Team, a Dreams, Inc. brand, was chosen to provide their vast array of sports licensed products.
E-commerce orders are fulfilled by shipping products from its own warehouse facilities in Sunrise, Florida, Chicago, Illinois, Las Vegas, Nevada and Denver, Colorado, and from suppliers via drop-ship agreements. In 2009, one supplier represented 18% of the Company’s total purchases. Our distribution network enables us to provide prompt delivery service to our online customers. It is our goal to be the market leader by shipping orders the same day they are received.
4
Table of Contents
This channel’s strategy is to be the best at what they do within the sports-licensed products and memorabilia vertical. Tactics employed to execute this strategy include:
| • | Applying critical expertise to improve logistics and provide the best possible customer experience; |
| • | Strengthening brands by continually expanding catalogs and reinforcing market positioning in response to market demand; |
| • | Efficiently transforming shoppers into customers and effectively turning customers into repeat customers; and |
| • | Operating with optimal efficiencies realized through superior market expertise and technology, total commitment to both quality, accuracy, and timely fulfillment. |
Manufacturing/Distribution Segment.
Mounted Memories.
Mounted Memories (“MMI”) celebrating its 21st anniversary this year, is one of the largest wholesalers of authentic sports and celebrity memorabilia products, custom framing and acrylic display cases in the country. The Company maintains exclusive and non-exclusive agreements with numerous athletes who frequently provide autographs and/ or game used memorabilia at agreed upon terms. In addition to its relationships with various athletes and their representatives, MMI holds licenses with different sports leagues which allow for the manufacture and distribution of a wide array of products. Licenses are currently held with MLB, MLBPA, NFL, NBA, NHL, Golden Bear (Jack Nicklaus), Signature Product (Elvis Presley), NASCAR and a variety of NASCAR teams and drivers and many more. MMI has diversified into obtaining several celebrity licenses to compliment their sports licenses during the past year.

Specifically, MMI strives to enhance its market leading position by executing against the following objectives:
| • | Further expand distribution channels and deepen existing customer relationships. |
| • | Expand and diversify product lines by adding new licenses and bringing new products to market. |
| • | Continue to pursue exclusive licensing and memorabilia opportunities. |
| • | Enhance manufacturing efficiencies. |
| • | Provide strategic advantages to company owned retail properties by offering exclusively manufactured items. |
MMI has been in business since 1989 and has achieved its industry leading status fundamentally due to a combination of its licenses and its strict authenticity policies. The only sports memorabilia products sold by MMI are those produced by MMI through private or public signings organized by MMI or purchased from an authorized agent of MMI and witnessed by an MMI and /or league representative. In addition to sports and celebrity memorabilia products, MMI manufactures a large selection and supply of custom acrylic display cases, with over 50 combinations of materials, colors and styles. The primary raw material used in the production process is acrylic. There are many vendors who sell plastic throughout South Florida. The Company seeks to obtain the best pricing through competitive vendor bidding. The Company does not produce the helmets, footballs, baseballs or other objects which are autographed. Those products are available through numerous suppliers. No individual supplier represented more than ten percent of the Company’s total year ended December 31, 2009 or 2008 purchases.
MMI has one of the most advanced and effective fulfillment processes in the industry and utilizes the most current shipping software to assist in the process. MMI operates out of a 50,000 square foot facility and will continue to invest in technologies that enhance its competitive manufacturing and distribution advantages. In April of 2009, the previously acquired Schwartz Sports Company was merged into MMI.
5
Table of Contents
The Greene Organization.
The Greene Organization since 1991 has been engaged in athlete representation and corporate sports marketing of individual athletes. This boutique division provides athletes with all “off-field” activities including but not limited to; personal appearances, product endorsements, book publishing deals, public/private autograph signings, licensing and marketing opportunities. As a result, over the years, The Greene Organization has become a portal for numerous corporate clients who regularly contract this division to identify a professional athlete to enhance their company’s profile, products and or services. Recently, The Greene Organization added Andre Dawson, the sole inductee into the 2010 National Baseball Hall of Fame as a client. In addition, the auction arm of this division, SCAC (Sports Collectibles and Auction Company) provides complete auction services to charities and organizations throughout the country. Warren H. Greene, president of The Greene Organization, is the brother-in-law of the Company’s president.
Competition.
The Company’s retail stores compete with other retail establishments, including the Company’s franchise stores and other stores that sell sports related merchandise, memorabilia and similar products. The success of our stores depends, in part, on the quality, availability and the varied selection of authentic products as well as providing strong customer service.
Our e-commerce business competes with a variety of online and multi-channel competitors including mass merchants, fan shops, major sporting goods chains and online retailers. We believe the principal competitive factors are product selection, price, customer service and support, web site features and functionality, and delivery performance.
MMI competes with several major companies and numerous individuals in the sports and celebrity memorabilia industry such as Steiner Sports and Upper Deck Authenticated. MMI believes it competes well within the industry because of the reputation it has established in its 21-year existence. MMI focuses on ensuring authenticity and providing the best possible customer service. MMI has concentrated on maintaining and selling memorabilia items of athletes and celebrities that have a broad national appeal. MMI believes it maintains its competitive edge because of its long established relationships with numerous high profile athletes, each of the major sports leagues and several of the largest sports agencies. Several of its competitors tend to focus on specific regional markets due to their relationships with sports franchises in their immediate markets. The success of those competitors typically depends on the athletic performance of those specific franchises. Additionally, MMI typically focuses on the three core sports that provide the greatest source of industry revenue, baseball, football and NASCAR.
Within the acrylic display case line of business, MMI competes with other companies which mass produce cases. MMI does not compete with companies which custom design one-of-a-kind cases. MMI believes that because it is one of the country’s largest acrylic case manufacturers, it is price competitive due to its ability to purchase large quantities of material and pass the savings on to customers.
The Greene Organization competes with other companies which provide “off-field” services to athletes, some of which are much larger and better capitalized, including traditional sports agencies such as International Management Group.
Dreams Franchise Corp. (DFC) competes with other larger, more well-known and substantially better funded franchisors for the sale of franchises. Field of Dreams® stores compete with other retail establishments of all kinds. The Company believes that the principal competitive factors in the sale of franchises are franchise sales price, services rendered, public awareness and acceptance of trademarks and franchise agreement terms.
Employees.
The Company employs 255 full-time employees and 61part-time employees. None of our employees are represented by a labor union and we believe that our employee relations are good.
Seasonality.
Our business is highly seasonal with operating results varying from quarter to quarter. We have historically experienced higher revenues in the October – December quarter, primarily due to holiday sales. Approximately 50% and 43% of our annual revenues were generated during this quarter for 2009 and 2008. Management believes that the percentage of revenues in the holiday quarter will increase in future years as we focus on and grow the retail segment. As a result, we may incur additional expenses during our holiday quarter, including higher inventory of product and additional staffing in anticipation of increased sales activity.
6
Table of Contents
| Item 1A. | Risk Factors. |
Not required for smaller reporting companies.
| Item 1B. | Unresolved Staff Comments. |
None.
| Item 2. | Properties. |
We do not own any real property. The Company leases its corporate office and primary manufacturing/warehouse facility in Plantation, Florida and Sunrise, Florida, respectively. The corporate office lease is for approximately 8,000 square feet of office space and expires in June 2011, and has total occupancy costs of approximately, $22 per month. The Company’s principal executive and accounting offices are located at the Plantation, Florida facility.
Our primary manufacturing/warehouse facility is located in Sunrise, Florida and has approximately 50,000 square feet of office, manufacturing and warehousing space. The lease is for a 10 year term expiring in 2012 with total occupancy costs of approximately $40 per month with 3% annual increases. We also lease a warehouse facility in Denver, Colorado which has approximately 1,500 square feet and a warehouse facility in Las Vegas, NV which has approximately 12,000 square feet that have occupancy costs of $1 and $13 per month, respectively.
Our eighteen (18) company-owned stores currently lease their facilities, with lease terms (including renewal options) expiring in various years through September 2018 with initial terms of 7 to 10 years.
To support our Internet division growth, we lease a 207,000 square foot facility in Northbrook, IL with a termination date of May 31, 2014 and a monthly occupancy cost of approximately, $120.
All in all, we believe our current facilities are adequate for our operations for the foreseeable future.
| Item 3. | Legal Proceedings. |
None.
| Item 4. | Removed and Reserved |
7
Table of Contents
Part II
| Item 5. | Market for the registrant’s common equity, related stockholder matters and Issuer purchases of equity securities. |
As of January 17, 2009, the Company’s common stock is listed on the NYSE Amex Equities Exchange as a result of an acquisition by the NYSE of the American Stock Exchange. From April 16, 2007 to January 16, 2009, the Company’s common stock was listed on the American Stock Exchange (Amex), an international, technologically advanced auction market, under the symbol “DRJ”. The high and low bids of the Company’s common stock for each quarter during the year ended December 31, 2009, and the year ended December 31, 2008, are as follows:
Year Ended December 31, 2009
| High Bid Price | Low Bid Price | |||||
| First Quarter |
$ | .51 | $ | .30 | ||
| Second Quarter |
.47 | .21 | ||||
| Third Quarter |
1.74 | .34 | ||||
| Fourth Quarter |
1.68 | $ | .81 | |||
Year Ended December 31, 2008
| High Bid Price | Low Bid Price | |||||
| First Quarter |
$ | 1.90 | $ | 1.14 | ||
| Second Quarter |
1.62 | .95 | ||||
| Third Quarter |
1.38 | .56 | ||||
| Fourth Quarter |
.90 | .24 | ||||
The records of Fidelity Transfer, the Company’s transfer agent, indicate that there are 372 record owners of the Company’s common stock as of March 1, 2010. Because many of our shares of common stock are held by brokers, and other institutions on behalf of stockholders, we are unable to determine the total number of stockholders represented by these record holders. However, we believe there are more than 1,800 beneficial holders of our common stock. On March 1, 2010, the high bid price was $1.71 and the low bid price was $1.54 for the Company’s common stock.
Dividend Policy
The Company has never paid dividends and we intend to retain future earnings to finance the expansion of our operations and for general corporate purposes. In addition, our current loan and security agreement with Comerica Bank prohibits the Company from paying cash dividends.
8
Table of Contents
Issuance of Unregistered Securities
The Company issued 87,573 unregistered common shares as a result of options that were exercised during the reporting period. There were no issuances of unregistered securities during the year ended December 31, 2008.
All of the common stock issued for the above transactions were not registered under the Securities Act of 1933 (the “Act”) and were issued pursuant to an exemption from registration under Section 4 (2) of the Act.
EQUITY COMPENSATION PLAN INFORMATION
| Number of securities to be issued upon exercise of outstanding options, warrants and rights |
Weighted – average exercise price of outstanding options, warrants and rights |
Number of securities remaining available for future issuances under equity compensation plans (excluding securities reflected in column (a)) | |||||
| (a) | (b) | (c) | |||||
| Equity Compensation Plans Approved by Security Holders |
1,255,559 | $ | .52 | 1,244,441 | |||
| Equity Compensation Plans Not Approved by Security Holders |
*319,995 | $ | .60 | 0 | |||
| * | Represents options granted during the previous four-years to employees and consultants prior to the adoption of the Company’s 2006 Equity Incentive Plan which was approved by the shareholders in January 2007. |
| Item 6. | Selected Financial Data. |
Not required for smaller reporting companies.
| Item 7. | Management’s Discussion and Analysis of Financial Condition and Results of Operations. |
SPECIAL NOTE REGARDING FORWARD-LOOKING STATEMENTS
Certain statements in this Form 10-K under “Management’s Discussion and Analysis of Financial Condition and Results of Operations” constitute “forward-looking” statements within the meaning of the Private Securities Litigation Reform Act of 1995. Such forward-looking statements involve known and unknown risks, uncertainties and other factors which may cause the actual results, performance or achievements of the Company to be materially different from any future results, performance or achievements expressed or implied by such forward-looking statements. Such statements are indicated by words or phrases such as “anticipates,” “projects,” “management believes,” “Dreams believes,” “intends,” “expects,” and similar words or phrases. Such factors include, among others, the following: competition; seasonality; success of operating initiatives; new product development and introduction schedules; acceptance of new product offerings; franchise sales; advertising and promotional efforts; adverse publicity; expansion of the franchise chain; availability, locations and terms of sites for franchise development; changes in business strategy or development plans; availability and terms of capital including the continuing availability of our credit facility with Comerica Bank or a similar facility with another financial institution; labor and employee benefit costs; changes in government regulations; and other factors particular to the Company.
Should one or more of these risks, uncertainties or other factors materialize, or should underlying assumptions prove incorrect, actual results, performance, or achievements of Dreams may vary materially from any future results, performance or achievements expressed or implied by such forward-looking statements. All subsequent written and oral forward-looking statements attributable to Dreams or persons acting on our behalf are expressly qualified in their entirety by the cautionary statements in this paragraph. Dreams disclaims any obligation to publicly announce the results of any revisions to any of the forward-looking statements contained herein to reflect future events or developments.
Management’s Overview
Dreams, Inc., headquartered in Plantation, Florida is a Utah Corporation which was formed on April 9, 1980, and has evolved into the premier vertically integrated licensed sports products firm in the industry. This has previously been accomplished, in part, via organic growth and strategic acquisitions. Our continuing pursuit of this dual strategy should result in our becoming a principal leader and a consolidator in this highly fragmented industry. We believe our senior management and corporate infrastructure is well suited to acquire both large and small industry competitors.
9
Table of Contents
Specifically, we are engaged in multiple aspects of the licensed sports products and autographed memorabilia industry through a variety of distribution channels.
We generate revenues principally from:
| • | Our twelve (12) company-owned Field of Dreams stores; (reported in retail segment) |
| • | Our six (6) company-owned FansEdge stores; (reported in retail segment) |
| • | Our e-commerce component featuring www.FansEdge.com and others; (reported in retail segment) |
| • | Our athlete and web syndication sites; (reported in retail segment) |
| • | Our catalogues; (reported in retail segment) |
| • | Our manufacturing/distribution of sports memorabilia products, custom acrylic display cases and framing; (reported in mfg/wholesale segment) |
| • | Our running of sports memorabilia /collectible trade shows; (reported in mfg/wholesale segment) |
| • | Our franchise program through the eight (8) Field of Dreams franchise stores presently operating*; (reported in other income) and |
| • | Our representation and corporate marketing of individual athletes*(reported in other income). |
| * | revenues not material to the overall consolidated results. |
Organic Growth
Key components of our organic growth strategy include building brand recognition; improving sales conversion rates both in our stores and web sites; continuing our execution of multi-channel retailing under our FansEdge brand; aggressively marketing our web syndication services, which has met with early success, exploring additional distribution channels for our products; and cross pollinating corporate assets among our various operating divisions. Management believes that there remain significant benefits to cross pollinating the various corporate assets and leveraging the vertically integrated model that has been constructed over the years.
In particular, we have had success with the marketing of our products on-line via FansEdge.com and the complement of each of our web properties. The Company’s sales associated with these e-commerce initiatives have grown from $4,000 in 2004 to $60,000 in 2009, placing it at number 363 in 2005, number 289 in 2006, number 216 in 2007, and number 217 in 2008 of the largest Internet retailers in the nation (2009 ranking is forthcoming). This remains the fastest growing area of the Company and will remain its primary focus.
The Company has drawn on a complete spectrum of competencies it developed to support its flagship online brand, FansEdge. This has allowed the Company to leverage the investments made during the past several years by marketing a proven range of services to third parties that include; managed hosting, custom site design and development, customer service, order fulfillment, purchasing, inventory management, marketing, merchandising, and analytics and reporting. The Company calls the compilation of e-commerce services described above, Web Syndication and believes there are significant growth opportunities that exist in the marketplace. Our current web syndication portfolio consists of some of the best known brands and properties in the country, including JC Penney, AOL Sports, Majestic Athletic and the Philadelphia Eagles, to name a few.
Commencing in June 2008 and continuing throughout the fall of last year, we opened (6) six FansEdge stores in the greater Chicago, IL area. This was in support of our Multi-channel Retailing strategy; whereby we market a single brand via multiple channels. We are pleased with the results to date of our FansEdge brick & mortar stores. They have performed well during the slow economy as we believe they offer approachable price points for the consumer. They cross market with the on-line Fansedge.com site and our FansEdge catalogue. The stores also benefit by a high-tech inter-active kiosk used in each of the six (6) FansEdge stores.
10
Table of Contents
During the year ended December 31, 2009, the Company closed five (5) under-performing Field of Dreams stores (Westfarms, Pier 39, Scottsdale Fashion, Fashion Valley, North Bridge) and has closed three (3) more during the first quarter of 2010. We will continue to monitor the results of the existing stores to ensure that they are providing us with the desired results.
Our proprietary e-commerce platform has also enabled us to fuel a state-of-the-art in-store interactive Kiosk for ordering products. These Kiosks are in each of the new FansEdge stores and are providing a unique shopping experience for our customers by allowing them to access the entire Company portfolio of more than 200,000 product offerings. In fact, for 2009, we saw an average of 20% contribution to the individual store sales from the Kiosks. In addition, we are experiencing higher conversion rates on-line in the Chicago market for our FansEdge.com site due to the brand recognition provided by the physical stores presence throughout the Chicago land area. The Company believes it can seek joint venture deals with national retailers who are seeking to add a broader range of merchandising options to their customers by placing our kiosks within their store footprint. In October 2009, we installed our kiosks in six (6) Philadelphia Eagles team stores in the greater Philadelphia market.
We believe this expansion of our revenue producing footprint will serve us well as we navigate our business models through the challenging economy and look to distinguish ourselves from our competitors.
Objective
Our overall objective is twofold; to become the premier multi-channel retailer in the team licensed products industry under our FansEdge brand; and become the leading online syndicator for sports related properties.
Analysis
We review our operations based on both our financial results and various non -financial measures. Management’s focus in reviewing performance begins with growth in sales, margin integrity and operating income. On the expense side, with a majority of our sales being achieved as an on-line retailer of licensed sports products, we spend a disproportionate amount of our operating expenses in internet marketing. Therefore, we continuously monitor the return on investment of these particular expenses. Non-financial measures which management reviews include: unique visitors to our web sites, foot traffic in our stores, sales conversion rates and average sold unit prices.
We believe the implementation of our Multi-channel Retailing strategy will strengthen our FansEdge brand in the marketplace, and that we are well positioned to capture increased activity of on-line retail purchases. Industry experts and analysts state that currently, only 6-7% of all retail sales are being conducted on-line and are anticipated to increase.
With the continued growth of our Web Syndication business model which grew from 31 clients in 2008, to 50 clients in 2009, and revenues from syndication growing from $3,000 in 2008 to over $17,000 in 2009, we are leveraging the Company’s investment in its broad inventory by offering the items to multiple sites simultaneously. This should improve our inventory turnover, increase our absorption rates and reduce inventory carrying costs.
Historically, the fourth quarter of the fiscal year (October to December) has accounted for a greater proportion of our operating income than have each of the other three quarters of our fiscal year. This is primarily due to increased activities as a result of the holiday season. We expect that we will continue to experience quarterly variations and operating results principally as a result of the seasonal nature of our industry. Management continues to seek ways to shift expenses from the non-holiday quarters to the busier holiday quarter in order to improve cash flow. Other factors also cause a significant fluctuation of our quarterly results, including the timing of special events, the general popularity of a specific team that plays in a championship or an individual athlete who enters their respective sports’ Hall of Fame, the amount and timing of new sales contributed by new web syndication accounts, new stores, the timing of personal appearances by particular athletes and general economic conditions. Additional factors may cause fluctuations and expenses, including the costs associated with the opening of new stores, the integration of acquired businesses and stores into our operations , the general health of the economy, and corporate expenses to support our expansion and growth strategy.
Conclusion
We set ourselves apart from other companies with our diversified product and services line, our proprietary e-commerce platform, as well as our relationships with sports leagues, agents and athletes. Management believes we can continue to capture market share and become a consolidator in the highly fragmented licensed sports products industry, especially on-line. We are continuing to review our operational expenses and examining ways to reduce costs on a going-forward basis. With the slow economy, we continue to manage our capital conservatively and analyze each of our commitments to identify areas where we can improve the profitability and or cash flow of our business.
GENERAL
As used in this Form 10-K “we”, “our”, “us”, “the Company” and “Dreams” refer to Dreams, Inc. and its subsidiaries unless the context requires otherwise.
11
Table of Contents
Use of Estimates and Critical Accounting Policies
The preparation of financial statements in conformity with accounting principles generally accepted in the United States of America requires management to make estimates and assumptions that affect the reported amounts of assets and liabilities and disclosure of contingent assets and liabilities at the date of the consolidated financial statements and the reported amounts of revenues and expenses during the reporting periods. Actual results could differ from those estimates.
Significant estimates underlying the accompanying consolidated financial statements include: the determination of the lower of cost or market adjustment for inventory; sales returns; the allowance for doubtful accounts; the recoverability of long-lived and intangible assets; the determination of deferred income taxes, including related valuation allowances; the accrual for actual, pending or threatened litigation, claims and assessments; and assumptions related to the determination of stock-based compensation
In an on-going basis, the Company reviews its outstanding customer receivables for collectability. Adjustments to the allowance account are made according to current knowledge. Additionally, management reviews the composition of its inventory no less than annually. Reserves are adjusted accordingly. On a quarterly basis, the Company also evaluates its ability to realize its deferred tax assets and whether or not a valuation allowance is necessary.
The Company has both Goodwill and other long-lived intangible assets which are not amortized. As prescribed by the FASB, the Company evaluates the carrying value of these assets for impairment. Significant economic changes may require the Company to recognize impairment. As of December 31, 2009, no impairment has been necessary, yet the Company has taken a write down to Goodwill in the amount of $64 due to the closing of stores previously acquired that had Goodwill associated with the original purchase during the second quarter of 2009.
Management believes that the following may involve a higher degree of judgment or complexity:
Collectibility of Accounts Receivable
The Company’s allowance for doubtful accounts is based on management’s estimates of the creditworthiness of its customers, current economic conditions and historical information, and, in the opinion of management, is believed to be an amount sufficient to respond to normal business conditions. Should business conditions deteriorate or any major customer default on its obligations to the Company, this allowance may need to be significantly increased, which would have a negative impact upon the Company’s operations. The Company’s current allowance for doubtful accounts is $35.
| December 31, 2009 |
December 31, 2008 | |||||
| Accounts receivable |
$ | 5,377 | $ | 3,389 | ||
| Allowance for doubtful accounts |
35 | 76 | ||||
| Accounts receivable, net |
$ | 5,342 | $ | 3,313 | ||
Reserves on Inventories
The Company establishes a reserve based on historical experience and specific reserves when it is apparent that the expected realizable value of an inventory item falls below its original cost. A charge to operations results when the estimated net realizable value of inventory items declines below cost. Management regularly reviews the Company’s investment in inventories for declines in value. Adjustments are made to the reserve based on a number of factors, such as, players changing teams, falling out of favor with the public, incurring an injury, etc. These negative situations may impact valuation. However, dynamics that could increase inventory value, like the death of an athlete, do not result in writing up of inventory values. The Company’s current reserve for inventory obsolescence is $470.
| December 31, 2009 |
December 31, 2008 | |||||
| Inventory |
$ | 27,063 | $ | 31,456 | ||
| Reserves for inventory obsolescence |
470 | 335 | ||||
| Inventory, net |
$ | 26,593 | $ | 31,121 | ||
Income Taxes
Significant management judgment is required in developing the Company’s provision for income taxes, including the determination of deferred tax assets and liabilities and any valuation allowances that might be required against the deferred tax assets. The Company evaluates quarterly its ability to realize its deferred tax assets and adjusts the amount of its valuation allowance, if necessary. The Company provides a valuation allowance against its deferred tax assets when it believes that it is more likely than not that the asset will not be realized. The Company has prepared an analysis based upon historical data and forecasted earnings projections to determine its ability to realize its net deferred tax asset. After consideration of all the evidence, both positive and negative, management has determined that a valuation allowance of $187 as of December 31, 2009 and $187 as of December 31, 2008, was necessary.
12
Table of Contents
Goodwill and Unamortized Intangible Assets
In accordance with FASB Accounting Standards Codification Topic 350-20-35 Intangibles-Goodwill and Other > Goodwill > Subsequent Measure, the Company evaluates the carrying value of goodwill as of December 31 of each year and between annual evaluations if events occur or circumstances change that would more likely than not reduce the fair value of the reporting unit below its carrying amount. Such circumstances could include, but are not limited to, (1) a significant adverse change in legal factors or in business climate, (2) unanticipated competition, or (3) an adverse action or assessment by a regulator. When evaluating whether goodwill is impaired, the Company compares the fair value of the reporting unit to which the goodwill is assigned to its carrying amount, including goodwill. If the carrying amount of a reporting unit exceeds its fair value, then the amount of the impairment loss must be measured. The impairment loss would be calculated by comparing the implied fair value of the reporting unit’s goodwill to its carrying amount. In calculating the implied fair value of goodwill, the fair value of the reporting unit is allocated to all of the other assets and liabilities of that unit based on their fair value. The excess of the fair value of a reporting unit over the amount assigned to its other assets and liabilities is the implied fair value of goodwill. An impairment loss would be recognized when the carrying amount of goodwill exceeds it implied fair value.
The Company’s evaluations of the carrying amount of goodwill were completed as of December 31, 2009 in accordance with Topic 350-20-35, resulted in no impairment losses. During the quarter ended June 30, 2009, the Company closed one of its retail stores. As a result of the store closing, the Company wrote off approximately $64 of goodwill recorded in the original acquisition of this store in November of 2006.
Revenue Recognition
The Company recognizes retail (including e-commerce sales and web syndication sales) and wholesale/distribution revenues at the later of (a) the time of shipment or (b) when title passes to the customers, all significant contractual obligations have been satisfied and collection of the resulting receivable is reasonably assured. Retail revenues and wholesale/distribution are recognized at the time of sale. Return allowances, which reduce gross sales, are estimated using historical experience.
Revenues from the sale of franchises are deferred until the Company fulfills its obligations under the franchise agreement and the franchised unit opens. The franchise agreements provide for continuing royalty fees based on a percentage of gross receipts.
Management fee revenue related to the representation and marketing of professional athletes is recognized when earned and is reflected net of its related costs of sales. The majority of the revenue generated from the representation and marketing of professional athletes relates to services as an agent. In these arrangements, the Company is not the primary obligor in these transactions but rather only receives a net agent fee.
Revenues from industry trade shows are recognized at the time of the show when tickets are submitted for autographs or actual product purchases take place. In instances when the Company receives pre-payments for show autographs, the Company records these amounts as deferred revenue.
The Company partnered in a corporate rebate program with a national consumer goods retailer. The Company issued rebate coupons for which it was pre-paid 50% of the coupon value. Certificates redeemed through March 31, 2009, were recognized as revenue in the period. Additionally, a breakage model was projected for the program’s eight month term, based upon redemption totals redeemed through April 27, 2009, the program’s termination date. Thus, the Company recognized breakage revenue over the seven months (September 2008 – March 09), of the program. The balance of certificates redeemed during the program’s last month (April 09), were relieved from deferred revenue and recognized in our manufacturing/wholesale revenues for the quarter ended June 30, 2009.
The Company had approximately $592 in orders not yet shipped as of December 31, 2009.
13
Table of Contents
RESULTS OF OPERATIONS
The following table presents our historical operating results for the periods indicated as a percentage of net sales:
| Year Ended December 31 2009 |
Year Ended December 31, 2008 |
||||
| Net Sales |
1.00 | 1.00 | |||
| COGS |
.53 | .54 | |||
| Gross Profit |
.47 | .46 | |||
| *Operating Expenses |
.42 | .46 | |||
| Operating Income/(Loss) |
.05 | (.02 | ) | ||
| Other (Expenses)/Income |
.00 | .00 | |||
| Income(Loss) Before Taxes |
.01 | (.04 | ) | ||
| Net Income (Loss) |
.00 | (.02 | ) |
| * | Does not include depreciation. |
| ** | The above table may not foot due to rounding. |
RESULTS OF OPERATIONS - TWELVE MONTHS ENDED DECEMBER 31, 2009 AS COMPARED TO THE TWELVE MONTHS ENDED DECEMBER 31, 2008.
Revenues. Total revenues increased 4.3% to $85,535 during the twelve months ended December 31, 2009, from $81,982 during the same period ended December 31, 2008. This increase was attributed to an increase in retail revenues generated through on-line sales.
Manufacturing and distribution revenues decreased 31.6% to $15,730 during the twelve months ended December 31, 2009, from $23,000 during the same period ended December 31, 2008. Net revenues reported, after elimination of intercompany sales, decreased 36.6% to $11,470 during the twelve months ended December 31, 2009, from $18,116 during the same period ended December 31, 2008. This segment was impacted by the slow economy.
Retail operation revenues increased 16.4% to $73,711 during the twelve months ended December 31, 2009, from $63,320 during the same period ended December 31, 2008. This increase was attributed to the continuing growth the Company is experiencing with its on-line properties, specifically, their web syndication sites. The Internet division contributed $59,700 for the twelve months ended December 31, 2009 of the retail sales, up 27.9% from $46,900 for the same period last year. The Field of Dreams and FansEdge stores generated $14,011 for the twelve months ended December 31, 2009, versus $16,400 for the same period last year.
Costs and expenses. Total costs of sales for the twelve months ended December 31, 2009 was $45,123, versus $44,716 for the same period in 2008. As a percentage of total sales, costs were 52.7% and 54.5% for the twelve months ended December 31, 2009 and December 2008, respectively.
Costs of sales of manufacturing/distribution products were $5,497 for the twelve month period ended December 31, 2009, versus $9,348 for the same twelve month period in 2008, or a 41.1% decrease. This decrease was a result of lower manufacturing/distribution product sales. As a percentage of total manufacturing/distribution sales, costs were 62.0% and 40.2% for the twelve months ended December 31, 2009 and December 31, 2008, respectively. During 2008, we recorded $740 in sales associated with a corporate sponsorship program at higher than historical gross margins. After elimination of intercompany sales, as a percentage of total manufacturing/distribution sales, costs were 47.9% and 51.6%, respectively.
Cost of sales of retail products were $39,626 for the twelve month period ended December 31, 2009, versus $35,368 for the same twelve month period in 2008, or a 12.0% increase. This increase is attributable to an overall increase in retail sales. As a percentage of total sales, costs were 53.8% and 55.8% for the twelve months ended December 31, 2009 and December 2008, respectively.
Operating expenses decreased 4.4% to $36,226 for the twelve month period ended December 31, 2009, versus $37,925 for the same period in 2008. The current period figures included some one-time, non-cash charges including, $220 for leasehold improvement write-offs due to the early closing of a few Field of Dreams stores; and $260 in stock option expenses associated with stock option grants to certain employees, consultants and Directors. As a percentage of sales, operating expenses were 42.2% and 46.2% for the twelve month periods ended December 31, 2009 and December 31, 2008, respectively. The Company benefited from a series of corporate savings initiatives it had enacted starting in the second quarter of 2009.
14
Table of Contents
Interest expense, net. Net interest expense was $1,268 for the twelve months ended December 31, 2009, versus $926 for the same period last year. This increase is a result of higher interest rates charged by the Company’s senior lender during the remaining six-months of the reporting period and the Company recorded $90 in interest expense associated with a restructuring fee imposed on it by its senior lender.
Provision for income taxes. The Company recorded a one-time, non-cash, additional tax expense of $350 as a result of cumulative differences in deferred taxes. The cumulative timing differences in the deferred tax benefits associated with federal and state net operating loss carry-forwards and a return to profitability of the operations were the catalysts for the current period effective tax rate being 81%. The Company expects its 2010 tax rate to be similar to historic corporate federal & state tax rates that approximate 40%. The Company recognized a current income tax expense of $9 and a deferred tax expense of $702 for the twelve month period ended December 31, 2009, versus an income tax benefit of $1,400 for the same period in 2008 as the Company returned to profitability for the current year. Each quarter, the Company evaluates whether the realizability of its net deferred tax assets is more likely than not. Should the Company determine that a valuation reserve is necessary, it would have a material impact on the Company’s operations. The Company has prepared an analysis based upon historical data and forecasted earnings projections to determine its ability to realize its net deferred tax asset. After consideration of all of the evidence, management has determined that a valuation allowance of $187 is necessary for the twelve months ended December 31, 2009 and $187 for the twelve months ended December 31, 2008.
LIQUIDITY AND CAPITAL RESOURCES
Our primary sources of liquidity during the twelve months ended December 31, 2009, are the cash flows generated daily from our operating subsidiaries; availability under our $20,000 senior revolving credit facility and available cash.
The balance sheet as of December 31, 2009 reflects working capital of $9,903 versus working capital of $8,175 at December 31, 2008. At December 31, 2009, the Company’s cash was $582 compared to $498 at December 31, 2008. Please note that the Company is not negatively impacted by the cash balance of $582 as it has sufficient access to capital under its revolving credit facility with its senior lender. As a lead-in to the holiday season, the Company draws down on its line of credit to make inventory purchases so it is properly positioned to support the increased sales activity experienced during the quarter ended December 31. The increased throughput results in significant pay-downs to the line balances; and the yearly cycle starts anew. Net accounts receivable at December 31, 2009 were $5,342 compared to $3,313 at December 31, 2008.
Use of Funds
Cash provided by operations amounted to $5,249 for the twelve months ended December 31, 2009, compared to $5,835 cash used in operations during the same period of 2008. The Company was able to significantly reduce its inventory levels as it created incremental distribution channels for its products. This in turn, provided for shorter cycles from inventory investment to cash conversion. The Company was also successful integrating numerous corporate savings initiatives that resulted in improvements to its cash flow and profitability.
Cash used in investing activities was $919 for the twelve months ended December 31, 2009 and $2,873 cash used in investing activities for the same period ended December 31, 2008. The Company reduced its capital expenditures for the current period, without any negative impact to operations.
Cash used in financing activities was $4,064 for the twelve months ended December 31, 2009, versus $7,605 cash provided by financing activities for the same period in 2008.
Alleviation of the Going Concern
In 2008, the Company incurred a loss from operations, had a decrease in operational cash flows, and was in violation of its debt covenants. These factors raised substantial doubt about the Company’s ability to continue as a going concern.
Such doubt was alleviated during 2009 due to the receipt of all necessary waivers from the Bank, as well as effective implementation of Management’s plans to reduce its operating expenses and capital expenditures, restructure its commitments, convert its existing inventory into cash and conservatively manage its cash resulting in positive cash flows from operations and a return to profitability. Management believes that profits, operating cash flow and available credit resources will be adequate to make repayments of indebtedness, meet working capital needs, satisfy the needs of its operations, and meet anticipated capital expenditures during the next twelve months ending December 31, 2010.
Other Activity
Effective June 30, 2009, the Company extended its credit facilities of $21,000 with its senior lender until June 2010, had its 2009 business plan approved and funded, and received waivers for its fourth quarter 2008 covenant breaches. By way of background, during the first quarter of 2009, the Company disclosed that it was out of compliance with certain financial performance covenants with its Bank from the fourth quarter of 2008 and that it was determining a course of action to remedy the situation.
On June 6, 2007, the Company entered into a three-year loan and security agreement with Comerica Bank. Comerica provided the Company with $18,000 in credit facilities; consisting of a $15,000 revolver and a $3,000 “acquisition line” to fund the cash portion of future strategic acquisitions. The loan remains secured by all of the assets of the Company and its divisions. The interest rate on outstanding loan balances was prime but, with the new extension has been increased to prime plus a 3.25% margin, currently 6.5%. The weighted average interest rate was 4.75% and the average loan balance was $17,500 during the year. The advance rates for eligible accounts receivable is 80% and 60.0% for the Company’s eligible inventories. As of December 31, 2009, the Company had $8,815 outstanding on the revolver and $444 outstanding on the acquisition line.
The credit facility requires that certain performance financial covenants be met on a monthly and or quarterly and or yearly basis. These modified financial covenants consist of a maximum quarterly Debt to Tangible Net Worth ratio, a minimum monthly EBITDA figure, and a minimum quarterly Tangible Net Worth amount. All of which have been met for the entire year ended December 31, 2009.
15
Table of Contents
Below are the (3) three performance financial covenant details with actual results at month and or quarter and or year end. (Dollars in whole numbers)
| (1) | Maintain, as of the last day of each fiscal quarter, commencing with the fiscal quarter ending March 31, 2009; a ratio of Debt to Tangible Net Worth (for the four quarter period ending on such date) of not more than the following: |
| Covenant | Actual | |||
| March 31, 2009 |
3.2 to 1.0 | 3.18 | ||
| June 30, 2009 |
3.7 to 1.0 | 3.43 | ||
| September 30, 2009 |
4.35 to 1.0 | 3.93 | ||
| December 31, 2009 and the last day of each fiscal quarter thereafter |
2.8 to 1.0 | 2.48 |
| (2) | Maintain, as of the last day of each month, commencing April 30, 2009, EBITDA (on a year to date basis) of not less the following: |
| Covenant | Actual | |||||
| April 30, 2009 |
(1,367,000 | ) | (1,315,458 | ) | ||
| May 31, 2009 |
(2,278,000 | ) | (1,915,374 | ) | ||
| June 30, 2009 |
(2,576,000 | ) | (2,139,609 | ) | ||
| July 31, 2009 |
(2,835,000 | ) | (2,628,957 | ) | ||
| August 31, 2009 |
(3,099,000 | ) | (2,655,264 | ) | ||
| September 30, 2009 |
(3,069,000 | ) | (2,569,444 | ) | ||
| October 31, 2009 |
(2,926,000 | ) | (2,230,487 | ) | ||
| November 30, 2009 |
(2,008,000 | ) | (545,369 | ) | ||
| December 31, 2009 |
1,998,000 | 3,962,645 |
| (3) | Maintain, as of the last day of each fiscal quarter, commencing with the fiscal quarter ending March 31, 2009, Tangible Net Worth of not less than the following: |
| Covenant | Actual | |||
| March 31, 2009 |
10,000,000 | 10,071,000 | ||
| June 30, 2009 |
8,600,000 | 9,136,873 | ||
| September 30, 2009 |
7,600,000 | 8,507,935 | ||
| December 31, 2009 and the last day of each fiscal quarter thereafter |
10,200,000 | 11,678,511 |
Analysis
We are continuing to review our operational expenses and examining ways to reduce costs on a going-forward basis. With the slow economy, we are managing our capital conservatively and analyzing each of our commitments to identify areas where we can improve the profitability and or cash flow of our business.
Summary
Management believes that future funds generated from our operations and available borrowing capacity will be sufficient to fund our debt service requirements, working capital requirements and our budgeted capital expenditure requirements for the foreseeable future.
Off-balance sheet arrangements
We have not created and are not a party to any special purpose or off-balance sheet entities for the purpose of raising capital, incurring debt or operating our business.
Except as described herein, our management is not aware of any known trends or demands, commitments, events or uncertainties, as they relate to liquidity which could negatively affect our ability to operate and grow as planned, other than those previously disclosed.
16
Table of Contents
NEW ACCOUNTING PRONOUNCEMENTS
In September 2006, the Financial Accounting Standards Board (“FASB”) issued guidance now codified as FASB ASC Topic 820, “Fair Value Measurements and Disclosures,” which defines fair value, establishes a framework for measuring fair value and expands disclosures about fair value measurements. The pronouncement is effective for fiscal years beginning after November 15, 2007, and interim periods within those fiscal years. In February 2008, the FASB released additional guidance now codified under FASB ASC Topic 820, which provides for delayed application of certain guidance related to non-financial assets and non-financial liabilities, except for items that are recognized or disclosed at fair value in the financial statements on a recurring basis (at least annually), until fiscal years beginning after November 15, 2008, and interim periods within those years. Pursuant to the requirements of FASB ASC Topic 820, we adopted the provisions of Topic 820 with respect to our non-financial assets and non-financial liabilities effective April 1, 2009. The implementation of this pronouncement had no impact on our consolidated financial position, results of operations or cash flows.
In January 2010, the FASB amended guidance now codified as FASB ASC Topic 810, “Consolidation.” FASB ASC Topic 810 changes the accounting and reporting for minority interests, which will be recharacterized as non-controlling interests and classified as a component of equity. The amendment of FASB ASC Topic 810-10 establishes the accounting and reporting guidance for noncontrolling interests and changes in ownership interests of a subsidiary. FASB ASC Topic 810 is effective for us on a prospective basis for business combinations with an acquisition date beginning in the first quarter of fiscal year 2010. The adoption of FASB ASC Topic 810 as amended did not have an impact on our consolidated financial statements.
In June 2008, the FASB issued guidance now codified as FASB ASC Topic 260, “Earnings Per Share.” Under FASB ASC Topic 260, unvested share-based payment awards that contain rights to receive non-forfeitable dividends (whether paid or unpaid) are participating securities, and should be included in the two-class method of computing earnings per share. As of April 1, 2009, we implemented FASB ASC Topic 260 which requires us to treat unvested shares of restricted stock as participating securities in accordance with the two-class method in the calculation of both basic and diluted earnings per share. We had no shares of unvested restricted stock as of December 31, 2009 so the retrospective application of FASB ASC Topic 260 had no effect on our earnings per share for the year ended December 31, 2009.
In December 2008, the FASB issued guidance now codified as FASB ASC Topic 805, “Business Combinations” which requires that business combinations will result in assets and liabilities of an acquired business being recorded at their fair values as of the acquisition date, with limited exceptions. Certain forms of contingent consideration and certain acquired contingencies will be recorded at fair value at the acquisition date. FASB ASC Topic 805 also states acquisition costs will generally be expensed as incurred and restructuring costs will be expensed separately from the business combination in periods after the acquisition date. We will be required to apply this new standard prospectively to business combinations for which the acquisition date is on or after April 1, 2009. The adoption of FASB ASC Topic 805 did not have an impact on our consolidated financial statements.
Effective January 1, 2009, we adopted FASB guidance now codified as FASB ASC Topic 718-740, “Compensation – Stock Compensation, Income Taxes.” FASB ASC Topic 718-740 requires us to recognize a realized income tax benefit associated with dividends or dividend equivalents paid on non-vested equity-classified employee share-based payment awards that are charged to retained earnings as an increase to additional paid-in capital. The adoption of FASB ASC Topic 718-740 did not have a material impact on our financial position, results of operations or cash flows.
In April 2009, the FASB issued guidance now codified as FASB ASC Topic 825, “Financial Instruments,” which amends previous Topic 825 guidance to require disclosures about fair value of financial instruments in interim as well as annual financial statements. This pronouncement is effective for periods ending after June 15, 2009. The adoption of this pronouncement did not have an impact on our consolidated financial position, results of operations or cash flows.
In May 2009, the FASB issued guidance now codified as FASB ASC Topic 855, “Subsequent Events,” which establishes general standards of accounting for, and disclosures of, events that occur after the balance sheet date but before financial statements are issued or are available to be issued. Although there is new terminology, the standard is based on the same principles as those that currently exist in the auditing standards. The standard, which includes a new required disclosure of the date through which an entity has evaluated subsequent events, is effective for interim or annual periods ending after June 15, 2009. We adopted FASB ASC Topic 855 on June 30, 2009 with no material effects to the financial results of the Company.
In June 2009, the FASB issued guidance now codified as FASB ASC Topic 105, “Generally Accepted Accounting Principles,” as the single source of authoritative non-governmental U.S. GAAP. FASB ASC Topic 105 does not change current U.S. GAAP, but is intended to simplify user access to all authoritative U.S. GAAP by providing all authoritative literature related to a particular topic in one place. All existing accounting standard documents will be superseded and all other accounting literature not included in the FASB Codification will be considered non-authoritative. These provisions of FASB ASC Topic 105 are effective for interim and annual periods ending after September 15, 2009 and, accordingly, are effective for us for the current fiscal reporting period. The adoption of this pronouncement did not have an impact on our financial condition or results of operations, but will impact our financial reporting process by eliminating all references to pre-codification standards. On the effective date of this Statement, the Codification superseded all then-existing non-SEC accounting and reporting standards, and all other non-grandfathered non-SEC accounting literature not included in the Codification became non-authoritative.
17
Table of Contents
In January 2010, the FASB amended its guidance now codified as FASB ASC Topic 505-20, “Equity – Stock Dividends and Stock Splits,” to clarify that the stock portion of a distribution to shareholders that allows them to elect to receive cash or stock with a limit on the amount of cash that will be distributed is not a stock dividend for purposes of applying Topics 505 and 260. These provisions of FASB ASC Topic 505 are effective for interim and annual periods ending after December 15, 2009 and, accordingly, are effective for us for the current fiscal reporting period. The adoption of this pronouncement did not have an impact on our financial condition or results of operations as we do not currently have distributions that allow shareholders such an election.
A variety of proposed or otherwise potential accounting standards are currently under study by standard-setting organizations and various regulatory agencies. Because of the tentative and preliminary nature of these proposed standards, management has not determined whether implementation of such proposed standards would be material to our consolidated financial statements.
| Item 7A. | Quantitative and Qualitative Disclosures About Market Risk. |
Market risk generally represents the risk of loss that may result from the potential change in value of a financial instrument as a result of fluctuations in interest rates and market prices. We do not currently have any trading derivatives nor do we expect to have any in the future. We have established policies and internal processes related to the management of market risks, which we use in the normal course of our business operations.
Interest Rate Risk. We have interest rate risk, in that borrowings under our credit facility with Comerica Bank are based on variable market interest rates. As of December 31, 2009, we had $9,000 of variable rate debt outstanding under our credit facility with Comerica Bank. Presently, the revolving credit line bears interest at the prime rate plus a 3.25% margin. A hypothetical 10% increase in our credit facility’s weighted average interest rate of 7.15% per annum for the year ended December 31, 2009 would correspondingly decrease our pre-tax earnings and our operating cash flows by approximately $89.
Intangible Asset Risk. We have a substantial amount of intangible assets. We are required to perform goodwill impairment tests whenever events or circumstances indicate that the carrying value may not be recoverable from estimated future cash flows. As a result of our periodic evaluations, we may determine that the intangible asset values need to be written down to their fair values, which could result in material changes that could be adverse to our operating results and financial position. Although at December 31, 2009 we believed our intangible assets were recoverable, changes in the economy, the business in which we operate and our own relative performance could change the assumptions used to evaluate intangible asset recoverability. We continue to monitor those assumptions and their effect on the estimated recoverability of our intangible assets.
Foreign Currency Exchange Rate Risk.
None.
Commodity Price Risk.
None.
| Item 8. | Financial Statements and Supplementary Data. |
The financial statements required by this Item 8 are included at the end of this Report beginning on page F-1 as follows:
| Page | ||
| AUDITED FINANCIAL STATEMENTS: |
||
| F-1 to F-2 | ||
| Consolidated Balance Sheets as of December 31, 2009 and December 31, 2008 |
F-3 | |
| F-4 | ||
| F-5 | ||
| F-6 | ||
| F-7 | ||
| F-22 | ||
18
Table of Contents
| Item 9. | Changes in and Disagreements with Accountants on Accounting and Financial Disclosure. |
None.
| Item 9A. | Controls and Procedures. |
Conclusion Regarding the Effectiveness of Disclosure Controls and Procedures
We carried out an evaluation as required by paragraph (b) of Rule 13a-15 and 15d-15 of the Exchange Act, under the supervision and with the participation of our management, including our Chief Executive Officer and Chief Financial Officer, of the effectiveness of our disclosure controls and procedures, as defined in Rules 13a-15(e) and 15d-15(e) under the Exchange Act as of December 31, 2009. Based upon that evaluation, our Chief Executive Officer and Chief Financial Officer concluded that our disclosure controls and procedures were effective.
Report of Management on Internal Controls Over Financial Reporting.
Management is responsible for establishing and maintaining adequate internal control over financial reporting for the Company. Management conducted an assessment of the effectiveness of the Company’s internal control over financial reporting as of December 31, 2009, utilizing the framework established in Internal Control – Integrated Framework issued by the Committee of Sponsoring Organizations of the Treadway Commission (COSO). Based on this assessment, management has determined that the Company’s internal control over financial reporting as of December 31, 2009, is effective.
A control system, no matter how well conceived and operated, can provide only reasonable, not absolute, assurance that the objectives of the control system are met. Management necessarily applied its judgment in assessing the benefits of controls relative to their costs. Because of the inherent limitations in all control systems, no evaluation of controls can provide absolute assurance that all control issues and instances of fraud, if any, within the Company have been detected. The design of any system of controls is based in part upon certain assumptions about the likelihood of future events, and there can be no assurance that any design will succeed in achieving its stated goals under all potential future conditions, regardless of how remote. Because of the inherent limitations in a control system, misstatements due to error or fraud may occur and may not be detected.
This annual report does not include an attestation report of the company’s registered public accounting firm regarding internal controls over financial reporting. Management’s report was not subject to attestation by the company’s registered public accounting firm pursuant to temporary rules of the Securities and Exchange Commission that permit the company to provide only management’s report in this annual report.
Changes in Internal Control Over Financial Reporting. There have been no changes in our internal controls over financial reporting that occurred during the fourth fiscal quarter of 2009 that have materially affected, or are reasonably likely to materially affect, our internal control over financial reporting.
| Item 9B. | Other Information. |
On December 15, 2009, the Company held an Annual Meeting of its Stockholders in Plantation, FL. There were two proposals voted upon at the meeting; to elect directors to each serve until the next Annual Meeting of Stockholders of the Company and until their successors have been duly elected and qualified; and to ratify the appointment of Kramer, Weisman & Associates as independent auditors for the Company for the year ending December 31, 2009. Both proposals passed with 88% approval.
The following individuals were re-elected as Directors for another year:
| Name |
Votes For | Votes Against/Withheld | ||
| Sam D. Battistone |
33,387,724 | 58,765 | ||
| Ross Tannenbaum |
33,395,447 | 51,042 | ||
| Dale Larsson |
33,379,338 | 67,151 | ||
| David Malina |
33,379,338 | 67,151 | ||
| Steven Rubin |
33,377,620 | 68,869 |
19
Table of Contents
Part III
| Item 10. | Directors, Executive Officers and Corporate Governance. |
Directors and Officers. The Directors and Executive Officers of the Company and the positions held by each of them are as follows. All directors serve until the Company’s next annual meeting of shareholders.
| Name |
Age | Serving as Director/Officer of the Company Since |
Position Held With | |||
| Sam D. Battistone |
70 | 1982 | Chairman/Director | |||
| Ross Tannenbaum |
47 | 1998 | President/CEO/Director | |||
| David M. Greene |
47 | 2001 | Senior V. P. /Corporate Secretary | |||
| Dale Larsson |
65 | 1982 | Director | |||
| Kevin Bates |
42 | 2006 | Divisional President - Retail | |||
| Mitch Adelstein |
44 | 2006 | Divisional President -Manufacturing | |||
| Dorothy Sillano |
52 | 2006 | V.P. / Chief Financial Officer | |||
| David Malina |
65 | 2006 | Director | |||
| Steven Rubin |
48 | 2006 | Director | |||
| Manoharan Sivashanmugam |
39 | 2007 | Chief Information Officer |
Biographical Information.
Sam D. Battistone. Sam D. Battistone has been Chairman of the Board since our inception. Mr. Battistone served as president until November 1998. He also served as the Chairman and CEO of Pro Stars, Inc. from January 2005 until he resigned his position in January 2007. He was the principal owner, founder and served as Chairman of the Board, President and Governor of the New Orleans Jazz and Utah Jazz of the National Basketball Association (NBA) from 1974 to 1986. In 1983, he was appointed by the Commissioner of the NBA to the Advisory committee of the Board of Governors of the NBA. He held that position until the Company sold its interest in the team. He served as a founding director of Sambo’s Restaurants, Inc. and in each of the following capacities, from time to time, from 1967 to 1979: President, Chief Executive Officer, Vice-Chairman and Chairman of the Board of Directors. During that period, Sambo’s grew from a regional operation of 59 restaurants to a national chain of more than 1,100 units in 47 states. From 1971 to 1973, he served on the Board of Directors of the National Restaurant Association.
Ross Tannenbaum. Mr. Tannenbaum has served as President and a Director of the Company since November 1998. From August 1994 to November 1998, Mr. Tannenbaum was President, director and one-third owner of MMI. From May 1992 to July 1994, Mr. Tannenbaum was a co-founder of Video Depositions of Florida. From 1986 to 1992, Mr. Tannenbaum served in various capacities in the investment banking division of City National Bank of Florida. Mr. Tannenbaum earned a B.A. from the University of Florida in 1984. Mr. Tannenbaum is the brother-in-law of David M. Greene, the Company’s Senior Vice President.
David M. Greene. David M. Greene has been Senior Vice President of Finance & Strategic Planning since June 2001 and our Corporate Secretary since August 2004. From May 1992 to May 2001, he was the President of Florida Tool & Gauge, Inc., an aerospace manufacturing company located in Fort Lauderdale, Florida that provided precision machined jet and rocket engine components for the Department of Defense, Pratt & Whitney Aircraft and NASA. From April 1987 to April 1992, he served as President of GGH Consultants, Inc., an investment and business consulting company that provided private and public companies with equity and debt financings, M & A advice, Initial Public Offering and Secondary Offering consultation. From May 1984 to March 1987, he worked as an investment executive at the investment banking firm of Drexel, Burnham, Lambert, Inc. in New York City and Ft. Lauderdale, Florida. Mr. Greene earned a B.A. from Tufts University in 1984 and a MBA from Nova University in 1993. Mr. Greene is the brother-in-law of Ross Tannenbaum, the Company’s President.
Dale E. Larsson. Mr. Larsson has served as Director of our Company since 1982. From 1982 until September 1998, Mr. Larsson was our Secretary-Treasurer. Mr. Larsson served as a Director and CFO of Pro Stars, Inc. from January 2005 until he resigned his positions in January 2007. Mr. Larsson graduated from Brigham Young University in 1971 with a degree in business. From 1972 to 1980, Mr. Larsson served as controller of Invest West Financial Corporation; a Santa Barbara, California based Real Estate Company. From 1980 to 1981, he was employed by Invest West Financial Corporation as a real estate representative. From 1981 to 1982, he served as the corporate controller of WMS Famco, a Nevada corporation based in Salt Lake City, Utah, which engaged in the business of investing in land, restaurants and radio stations. Since 1998, Mr. Larsson has also served as the controller of Dreamstar, Inc., an investment and Retail Sports Memorabilia Company.
20
Table of Contents
Kevin Bates. Kevin Bates founded FansEdge® in 1998, serving as its CEO. When Dreams, Inc. acquired FansEdge in 2003, he became President of our e-commerce division and now serves as President of our retail division. From 1996 to 1999, Mr. Bates was President of Galvin and Wright, Inc., a consulting firm based in Glenview, Illinois. Prior to that he worked on a contract basis for a wide range of firms including Republic Mortgage Insurance Company of Winston-Salem, North Carolina, Allegiance Health Care of McGaw Park, Illinois, Cincinnati Bell Information Systems of Itasca, Illinois, A.C. Nielson of Bannockburn, Illinois, and others. Mr. Bates holds a B.S. degree in computer science from Northern Illinois University in DeKalb, Illinois. He also holds various technology certificates from DePaul University in Chicago, Illinois, and Internet Webmaster E-commerce Professional from Net Guru Technologies of Oak Brook, Illinois.
Mitch Adelstein. Mitch Adelstein was the founder of Mounted Memories in 1989 and has served as its president since its inception. He is considered a true pioneer of the sports collectibles industry with over 30 years of sports collectible and memorabilia knowledge. Mr. Adelstein has been responsible for all new product designs and day-to-day activities of Mounted Memories for the past 18 years. In 1998, Mounted Memories was acquired by Dreams, Inc. at which time Mr. Adelstein remained on as a member of the management team, until he was renamed its president in 2000. Under Mr. Adelstein, Mounted Memories has evolved into the leader in the autographed sports memorabilia and collectibles industry.
Dorothy Sillano. Ms. Sillano was promoted to Vice President and Chief Financial Officer of the Company in November 2007 after having served as the Company’s Controller since August 2005. From January 1987 until November 1996, Ms. Sillano was Second Vice President of Accounting at Chase Personal Financial Services, the upscale mortgage division of JP Morgan Chase. From 1997 through 1999, Ms. Sillano was the Controller of First American lending, a sub-prime auto finance company. From 2000 through May 2005, Ms. Sillano held the positions of Controller, acting CFO and CFO at three private educational institutions. Also, during this period, she served as a Sarbanes-Oxley consultant with MSI Consulting, Inc. In December 1990, Ms. Sillano earned a B.B.A. in Accounting from Florida Atlantic University, became a Certified Public Accountant in 1991 and was conferred with a MBA from DeVry University in July 2005.
David Malina. Mr. Malina was named as a director of the Company in November 2006 and is currently Vice President of Business Development for Ladenburg Thalmann & Company, Inc., a full service investment banking and brokerage firm that has recently relocated its headquarters to Miami, Florida. From 2003 to 2006, Mr. Malina was corporate Vice President in charge of Investor Relations and Corporate Communications for IVAX Corporation, a multinational pharmaceutical company, with direct operations in 39 countries, sales in over 80 countries, and over 7000 employees. IVAX was sold to Teva Pharmaceuticals Industries Ltd in January 2006 for an enterprise value of $9.9 billion. Prior to his employment at IVAX, Mr. Malina was a Managing Director at the Kriegsman Group, a boutique investment bank in Los Angles, California that specialized in health care. From 1974 to 2000, Mr. Malina was a highly regarded screenplay and teleplay writer working for the major film studios and television networks and producing luminaries such as David Geffin, Arnold Koppelson, Roger Birnbaum, Larry Turman, and Frank Price. Mr. Malina is an honors graduate of the Wharton School at the University of Pennsylvania and attended graduate school at the London School of Economics and Political Science.
Steven Rubin. Mr. Rubin was named a director of the Company in November 2006. Mr. Rubin has served as Executive Vice President - Administration of OPKO Health, Inc., since May 2007 and a director of OPKO since February 2007. Mr. Rubin served as the Senior Vice President, General Counsel and Secretary of IVAX from August 2001 until September 2006. Mr. Rubin currently serves on the board of directors of Safestitch Medical, Inc., a medical device company, PROLOR Biotech, Inc., a development stage biopharmaceutical company, Kidville, Inc. (OTCBB:KVIL), which operates large, upscale facilities, catering to newborns through five-year-old children and their families and offers a wide range of developmental classes for newborns-5 year olds, Non-Invasive Monitoring Systems, Inc., a medical device company, Cardo Medical, Inc., an early-stage orthopedic medical device company specializing in designing, developing and marketing reconstructive joint devices and spinal surgical devices (OTCBB:CDOM), Castle Brands, Inc., a developer and marketer of premium brand spirits, SearchMedia Holdings Limited (NYSE Amex:IDI), a multi-platform media advertising company and in China, Cocrystal Discovery, Inc., a privately held biopharmaceutical company, and Neovasc, Inc., a company developing and marketing medical specialty vascular devices. Mr. Rubin holds a B.A. in Economics from Tulane University and a J.D. from the University of Florida.
Manoharan Sivashanmugam. Mr. Sivashanmugam was named the Company’s Chief Information Officer in March 2007. From January 2001 to November 2006, he served in the capacity of Vice President of Technology for uBid.com; a leading retail auction and e-Commerce site specializing in computer and consumer electronic sales with nearly $1 Billion in annual revenues. The uBid.com site attracts over 5 million registered users with daily orders exceeding 10,000. From January 2000 to December 2000, he was a co-founder and Director of Development for Fansedge.com; a company that was purchased by Dreams, Inc. in October 2003. From September 1996 to January 2000, he was the Technical Project Manager for Whittman-Hart in Chicago, Illinois, the premier consulting agency providing integrated solutions across all industry verticals using emerging and legacy technologies. Mr. Sivashanmugam is an expert in application development for online auction engines, internet business-to-business and business-to-consumer, manufacturing, financial and sports information systems and online retailing. He is proficient with all major technology platforms. He received both a Master of Science degree in Computer Science and a Bachelor of Science degree in Physics from the University of Madras, India.
21
Table of Contents
Background and Qualifications of Directors.
When considering whether directors and nominees have the experience, qualifications, attributes and skills, taken as a whole, to enable the Board of Directors to satisfy its oversight responsibilities effectively in light of the Company’s business and structure, the Nominating and Corporate Governance Committee focuses primarily on each person’s background and experience as reflected in the information discussed in each of the directors’ individual biographies set forth above. We believe that our directors provide an appropriate mix of experience and skills relevant to the size and nature of our business. As more specifically described in the biographies set forth above, our directors possess relevant knowledge and experience, industry-specific and otherwise, in the licensed sports products, autographed memorabilia, finance and business fields generally, which we believe enhances the Board’s ability to oversee, evaluate and direct our overall corporate strategy. The Nominating and Corporate Governance Committee annually reviews and makes recommendations to the Board regarding the composition and size of the Board so that the Board consists of members with the proper expertise, qualifications, attributes, skills, and personal and professional backgrounds needed by the Board, consistent with applicable regulatory requirements.
Code of Ethics.
We have adopted a code of ethics for our officers and directors. The Code of Ethics was approved by our Board of Directors in June 2004 and is posted on our web site. We will also disclose any amendments or waivers to our Code of Ethics on our website www.dreamscorp.com.
Independence of the Board.
The Board of Directors has determined that the following four individuals of its five member board are independent as defined under the federal securities laws, and the rules of the NYSE Amex Equities Exchange: Mr. Battistone, Mr. Larsson. Mr.Malina and Mr. Rubin.
Committees of the Board of Directors.
Until the creation and adoption of the Company’s audit committee in March of 2007, the Board of Directors acted as our Audit Committee. In addition to the audit committee, in March of 2007, the Company established a Compensation Committee and a Nominating and Corporate Governance Committee. Each of these charters meets the requirements of the NYSE Amex Equities Exchange.
Audit Committee
The Audit Committee presently consists of Messrs. Larsson, Battistone and Malina; with Mr. Larsson serving as chairman. The Audit Committee is responsible for monitoring and reviewing our financial statements and internal controls over financial reporting. In addition, they recommend the selection of the independent auditors and consult with management and our independent auditors prior to the presentation of financial statements to shareholders and the filing of our forms 10-Q and 10-K. Our Board has determined that Mr. Dale Larsson qualifies as an “audit committee financial expert” as defined under the federal securities laws. The Audit Committee’s responsibilities are set forth in an Audit Committee Charter, a copy of which is currently available from the Company and is posted on our web site at www.dreamscorp.com. The Audit committee had (4) four meetings during 2009.
Compensation Committee
The Compensation Committee presently consists of Messrs. Larsson and Malina. The Compensation Committee is responsible for reviewing and recommending to the Board of Directors the compensation and over-all benefits of our executive officers, including administering the Company’s Equity Incentive Stock Option Plan. The Compensation Committee Charter, a copy of which is currently available from the Company, is posted on our web site at www.dreamscorp.com.
Nominating and Corporate Governance Committee
The Nominating and Corporate Governance Committee presently consists of Messrs. Battistone and Rubin. The Nominating and Corporate Governance Committee is responsible for identifying prospective qualified Board of Director candidates as well as those names submitted by our shareholders. In addition, this committee provides recommendations to the Board of Directors as to a proper set of corporate governance guidelines and principles to adopt. The Nominating and Corporate Governance Committee Charter, a copy of which is currently available from the Company, and is posted on our web site at www.dreamscorp.com
Compliance With Section 16(a) of the Exchange Act. Based solely upon a review of Forms 3 and 4 and amendments thereto furnished to the Company under Rule 16a-3(d) of the Securities Exchange Act of 1934, as amended (the “Exchange Act”) during twelve months ended December 31, 2009 and amendments thereto furnished to the Company with respect to the twelve months ended December 31, 2008, the Company is not aware of any person that failed to file on a timely basis, as disclosed in the aforementioned Forms, reports required by Section 16(a) of the Exchange Act during the year ended December 31, 2009.
22
Table of Contents
| Item 11. | Executive Compensation. |
Employment Agreements
We do not currently have employment contracts in place with any of our Named Executive Officers, other than Kevin Bates. It is the position of the Compensation Committee to explore whether it is strategically favorable for the Company to enter into employment contracts with various key executives. Set forth below is a description of those employment contracts currently in place with our NEO’s.
Kevin Bates and the Company entered into a 3-year employment agreement, in June 2007, where Mr. Bates is to serve as the president of all of Dreams Retail operations. The base salary, effective April 1, 2007, is $350,000 with annual CPI increases. In addition, Mr. Bates is entitled to a 5% performance bonus based on the EBIT (earnings before interest and taxes) up to the first $10 million and 3% thereafter of all of Dreams Retail operations. This employment agreement replaces the 20% EBIT (earnings before interest and taxes) that the Company was contractually obligated to pay to Mr. Bates pursuant to the original stock purchase agreement when Dreams acquired FansEdge in October of 2003. For the first four years following the acquisition, the Company has provided the former shareholders of FansEdge with a 25% of the EBIT (earnings before interest and taxes) and has recorded these payments as additional purchase price consideration for fiscal years 2004 through 2007.
23
Table of Contents
2009 Compensation Tables.
Summary Compensation Table as of December 31, 2009 (Dollar amounts in whole numbers)
| Name and Principal Position |
Year | Salary ($) |
Bonus ($) |
Stock Awards ($) |
Option Awards ($) |
All Other Compensation ($) |
Total ($) | |||||||
| Ross Tannenbaum PEO |
2009 | 333,000 | 69,161 | 9,600 | 411,761 | |||||||||
| David M. Greene Senior V.P Finance |
2009 | 157,500 | 27,914 | 7,200 | 192,614 | |||||||||
| Kevin Bates Division President |
2009 | 324,000 | 225,000 | 25,186 | 574,186 | |||||||||
| Mitch Adelstein Division President |
2009 | 194,400 | 33,623 | 7,200 | 235,223 | |||||||||
| Dorothy Sillano V.P, PFO |
2009 | 130,500 | 9,753 | 140,253 | ||||||||||
| Mano Sivashanmugam CIO |
2009 | 162,000 | 10,026 | 172,026 | ||||||||||
Outstanding Equity Awards At December 31, 2009 Table
| Option Awards | Stock Awards | |||||||||||||||||
| Number of Securities Underlying Unexercised Options (#) |
Number of Securities Underlying Unexercised Options (#) |
Equity Incentive Plan Awards: Number of Securities Underlying Unexercised Unearned Options (#) |
Option Exercise Price ($) |
Option Expiration Date |
Number of Shares or Units of Stock That Have Not Vested (#) |
Market Value of Shares or Units of Stock That Have Not Vested ($) |
Equity Incentive Plan Awards: Number of Unearned Shares, Units or Other rights That Have Not Vested (#) |
Equity Incentive Plan Awards: Market or Payout Value of Unearned Shares, Units or Other rights That Have Not Vested ($) | ||||||||||
| Name |
Exercisable | Unexercisable | ||||||||||||||||
| Ross Tannenbaum |
153,692 | .45 | 6/12 | |||||||||||||||
| PEO |
||||||||||||||||||
| David Greene |
68,083 | .41 | 6/12 | |||||||||||||||
| Senior V.P. |
||||||||||||||||||
| Kevin Bates |
166,667 | .60 | 2/11 | |||||||||||||||
| Division President |
||||||||||||||||||
| Mitch Adelstein |
82,009 | .41 | 6/12 | |||||||||||||||
| Division President |
||||||||||||||||||
| Dorothy Sillano |
23,790 | .41 | 6/12 | |||||||||||||||
| PFO |
||||||||||||||||||
| Mano Sivashanmugam |
24,455 | .41 | 6/12 | |||||||||||||||
| CIO |
||||||||||||||||||
DIRECTOR COMPENSATION
| Name |
Year | Fees Earned or Paid in Cash ($) |
Stock Awards ($) |
Option Awards ($) |
Total ($) | |||||
| Sam Battistone |
2009 | 8,200 | 8,200 | |||||||
| Dale Larsson |
2009 | 12,300 | 12,300 | |||||||
| Steven Rubin |
2009 | 8,200 | 8,200 | |||||||
| David Malina |
2009 | 8,200 | 8,200 |
24
Table of Contents
| Item 12. | Security Ownership of Certain Beneficial Owners and Management and Related Stockholder Matters. |
Principal Shareholders.
The following table sets forth as of March 1, 2010 the number of the Company’s common stock beneficially owned by persons who own five percent or more of the Company’s voting stock, by each director, by each executive officer, and by all executive officers and directors as a group. The table presented below includes shares issued and outstanding and options exercisable within 60 days.
| Name and Address of Beneficial Owner(1) |
Number of Shares Owned |
Percent of Class |
||||
| Sam D. Battistone |
1,922,839 | (2)(3) | 5.1 | % | ||
| Ross Tannenbaum |
7,827,515 | (4) | 20.8 | % | ||
| Mano Sivashanmugam |
29,455 | (5) | * | |||
| Dorothy Sillano |
24,539 | (6) | * | |||
| Dale Larsson 1776 North State Street, ste #160 Orem, UT 84057 |
124,809 | (7) | * | |||
| Mitch Adelstein |
404,521 | (8) | 1.1 | % | ||
| Kevin Bates |
249,614 | (9) | * | |||
| David M. Greene |
468,083 | (10) | 1.2 | % | ||
| Steven Rubin 4400 Biscayne Blvd Miami, FL 33137 |
72,051 | (11) | * | |||
| David Malina 4400 Biscayne Blvd Miami, FL 33137 |
40,000 | (12) | * | |||
| The Frost Group, LLC 4400 Biscayne Blvd, 15th Floor Miami, FL 33137 |
5,128,205 | 14.0 | % | |||
| All Executive Officers and Directors as a group (10 persons) (13) |
11,163,426 | 29.7 | % | |||
See footnotes below.
| * | Less than 1.0% |
| (1) | Unless otherwise indicated, the address for each person is 2 South University Drive, suite 325 Plantation, Florida 33324. |
| (2) | Excludes 146,112 shares owned by the following family members of which Mr. Battistone disclaims beneficial ownership: |
| Name |
Number of Shares Owned | |
| Kelly Battistone |
43,752 | |
| Dann Battistone |
33,334 | |
| Mark Battistone |
7,242 | |
| Cindy Battistone Hill |
40,250 | |
| Signature, Inc. |
21,534 |
| (3) | Includes 20,000 shares which are the subject of stock options. |
| (4) | Includes 153,692 shares which are the subject of stock options. |
| (5) | Includes 24,455 shares which are the subject of stock options. |
| (6) | Includes 23,789 shares which are the subject of stock options. |
| (7) | Includes 30,000 shares which are the subject of stock options. |
| (8) | Includes 82,009 shares which are the subject of stock options. |
| (9) | Includes 166,667 shares which are the subject of stock options. |
| (10) | Includes 68,083 shares which are the subject of stock options. |
| (11) | Mr. Rubin is a member of The Frost Group, LLC. He disclaims beneficial ownership of the securities held by The Frost Group, LLC except to the extent of his pecuniary interest therein. Also, includes 40,000 shares which are the subject of stock options. |
| (12) | Includes 40,000 shares which are the subject of stock options. |
| (13) | The directors and officers have sole voting and investment power as to the shares beneficially owned by them. |
25
Table of Contents
| Item 13. | Certain Relationships and Related Transactions, and Director Independence. |
None.
Director Independence
The Board of Directors has determined that four individuals of its five member board are independent as defined under federal securities laws, including the rules of the NYSE Amex Equities Exchange: Mr. Larsson, Mr. Battistone, Mr. Malina and Mr. Rubin.
| Item 14. | Principal Accountant Fees and Services. (dollars in whole numbers) |
The following table shows what Kramer, Weisman and Associates and Friedman, Cohen, Taubman & Company billed for the audit and other services for the year ended December 31, 2009 and for the year ended December 31, 2008, respectively.
| Year Ended 12/31/ 2009 |
Year Ended 12/31/08 | |||||
| Audit Fees |
$ | 62,500 | $ | 90,000 | ||
| Audit-Related Fees |
— | — | ||||
| Tax Fees |
— | — | ||||
| All Other Fees |
— | — | ||||
| Total |
$ | 62,500 | $ | 90,000 | ||
Audit Fees—This category includes the audit of the Company’s annual financial statements, review of financial statements included in the Company’s Form 10-Q Quarterly Reports and services that are normally provided by the independent auditors in connection with engagements for those years.
Audit-Related Fees—N/A
Tax Fees—N/A
Overview—The Company’s Audit Committee, reviews, and in its sole discretion pre-approves, our independent auditors’ annual engagement letter including proposed fees and all audit and non-audit services provided by the independent auditors. Accordingly, all services described under “Audit Fees,” “Audit-Related Fees,” and “Tax Fees” were pre-approved by our Company’s Audit Committee. The Audit Committee may not engage the independent auditors to perform the non-audit services proscribed by law or regulation. The Company’s Audit Committee may delegate pre-approval authority to a member of the Board of Directors, and authority delegated in such manner must be reported at the next scheduled meeting of the Board of Directors.
Part IV
| Item 15. | Exhibits and Financial Statement Schedules. |
(a) Financial Statements.
| Financial Statements Included in this Report |
Page | |
| F-1 to F-2 | ||
| Consolidated Balance Sheets as of December 31, 2009 and December 31, 2008 |
F-3 | |
| F-4 | ||
| F-5 | ||
| F-6 | ||
| F-7 | ||
| F-22 | ||
26
Table of Contents
(b) Exhibits
| Exhibit No. |
||
| 3.1 | Restated Articles of Incorporation, dated June 8, 1989 (1) | |
| 3.2 | Articles of Amendment, dated March 28, 1996 (1) | |
| 3.3 | Articles of Amendment, dated January 14, 1999 (1) | |
| 3.4 | Articles of Amendment to the Revised Articles of Incorporation, dated April 5, 2005 (2) | |
| 3.5 | Certificate of Amendment to the Certificate of Incorporation, dated January 25, 2007 (3) | |
| 3.6 | Bylaws (1) | |
| 4 | Dreams, Inc. Equity Incentive Plan (3) | |
| 10.1 | Amended and Restated Letter Agreement dated June 30, 2009 (4) | |
| 21 | Subsidiaries of the Company | |
| 23 | Consent of former Independent Auditors | |
| 31.1 | Certification of the Principal Executive Officer Pursuant to Section 302 of the Sarbanes-Oxley Act of 2002 | |
| 31.2 | Certification of the Principal Financial Officer Pursuant to Section 302 of the Sarbanes-Oxley Act of 2002 | |
| 32.1 | Certification of the Chief Executive Officer Pursuant to Section 906 of the Sarbanes-Oxley Act of 2002. (This exhibit shall not be deemed “filed” for the purposes of Section 18 of the Securities Exchange Act of 1934, as amended or otherwise subject to the liability of that section. Further, this exhibit shall not be deemed incorporated by reference into any other filing under the Security Act of 1933, as amended, or by the Security Exchange Act of 1934, as amended.) | |
| 32.2 | Certification of the Chief Financial Officer Pursuant to Section 906 of the Sarbanes-Oxley Act of 2002. (This exhibit shall not be deemed “filed” for the purposes of Section 18 of the Securities Exchange Act of 1934 as amended or otherwise subject to the liability of that section. Further, this exhibit shall not be deemed incorporated by reference into any other filing under the Security Act of 1933, as amended, or by the Security Exchange Act of 1934, as amended.) | |
| (1) | Filed with the Company’s Form 10-SB on September 7, 1999, and incorporated by this reference. |
| (2) | Filed with the Company’s Form SB-2/A on April 5, 2005, and incorporated by this reference. |
| (3) | Filed as an exhibit with the Company’s Form 8-k on January 29, 2007, and incorporated by this reference. |
| (4) | Filed with the Company’s Form 10-Q on August 14, 2009, and incorporated by this reference. |
27
Table of Contents
Pursuant to the requirements of Section 13 or 15 (d) of the Securities Exchange Act of 1934, the registrant has duly caused this report to be signed on its behalf by the undersigned, thereunto duly authorized.
| DREAMS, INC., a Utah corporation | ||
| By: | /S/ ROSS TANNENBAUM | |
| Dated: | Ross Tannenbaum President, Chief Executive Officer
March 29, 2010 | |
Pursuant to the requirements of the Securities Exchange Act of 1934, this report has been signed below by the following persons on behalf of the Registrant and in the capacities and on the dates indicated.
| By: | /S/ ROSS TANNENBAUM | |
| Ross Tannenbaum, Chief Executive Officer and a Director | ||
| Dated: | March 29, 2010 | |
| By: | /S/ DOROTHY SILLANO | |
| Dorothy Sillano, V.P. and Chief Financial Officer (principal financial officer) | ||
| Dated: | March 29, 2010 | |
| By: | /S/ SAM BATTISTONE | |
| Sam Battistone, Director | ||
| Dated: | March 29, 2010 | |
| By: | /S/ DALE E. LARSSON | |
| Dale E. Larsson, Director | ||
| Dated: | March 29, 2010 | |
| By: | /S/ DAVID MALINA | |
| David Malina, Director | ||
| Dated: | March 29, 2010 | |
| By: | /S/ STEVEN RUBIN | |
| Steven Rubin, Director | ||
| Dated: | March 29, 2010 | |
28
Table of Contents

REPORT OF INDEPENDENT REGISTERED PUBLIC ACCOUNTING FIRM
To the Board of Directors and Stockholders
Dreams, Inc. and Subsidiaries:
We have audited the accompanying consolidated balance sheets of Dreams, Inc. and Subsidiaries (the “Company”) as of December 31, 2008 and 2007, and the related consolidated statements of operations, stockholders’ equity, and cash flows for the year ended December 31, 2008 and the nine months ended December 31, 2007. These financial statements are the responsibility of the Company’s management. Our responsibility is to express an opinion on these financial statements based on our audits.
We conducted our audits in accordance with the standards of the Public Company Accounting Oversight Board (United States). Those standards require that we plan and perform the audit to obtain reasonable assurance about whether the financial statements are free of material misstatement. The Company is not required to have, nor were we engaged to perform, an audit of its internal control over financial reporting. Our audit included consideration of internal control over financial reporting as a basis for designing audit procedures that are appropriate in the circumstances, but not for the purpose of expressing an opinion on the effectiveness of the Company’s internal control over financial reporting. Accordingly, we express no such opinion. An audit also includes examining, on a test basis, evidence supporting the amounts and disclosures in the financial statements, assessing the accounting principles used and significant estimates made by management, as well as evaluating the overall financial statement presentation. We believe that our audits provide a reasonable basis for our opinion.
In our opinion, such consolidated financial statements present fairly, in all material respects, the financial position of Dreams, Inc. and Subsidiaries as of December 31, 2008 and 2007, and the results of their operations and their cash flows for the year ended December 31, 2008 and the nine months ended December 31, 2007, in conformity with accounting principles generally accepted in the United States of America.
The accompanying consolidated financial statements have been prepared assuming that the Company will continue as a going concern. As discussed in Note 18 to the consolidated financial statements, the Company incurred a net loss in 2008, is in violation of its debt covenants, and is experiencing difficulty generating sufficient cash flows to sustain its operations. These factors, among others, raise substantial doubt about the Company’s ability to continue as a going concern. Management’s plans in regard to this matter are also described in Note 19. The consolidated financial statements do not include any adjustments that might result from the outcome of this uncertainty.
As discussed in Note 1 to the consolidated financial statements, effective September 12, 2007 the Company changed its fiscal year to begin on January 1 and end on December 31.
| /s/ Friedman, Cohen, Taubman and Company |
| Friedman, Cohen, Taubman and Company, LLC |
| April 14, 2009 |

F-1
Table of Contents
REPORT OF INDEPENDENT REGISTERED PUBLIC ACCOUNTING FIRM
To the Board of Directors and Shareholders of
Dreams, Inc. and Subsidiaries
We have audited the accompanying consolidated balance sheet of Dreams, Inc. and Subsidiaries as of December 31, 2009 and the related consolidated statements of operations, changes in stockholders’ equity, and cash flows for the years then ended. These consolidated financial statements are the responsibility of the Company’s management. Our responsibility is to express an opinion on these consolidated financial statements based on our audit. The consolidated financial statements of Dreams, Inc. and Subsidiaries as of December 31, 2008 were audited by other auditors, whose report dated April 14, 2009, expressed an unqualified opinion and included an explanatory paragraph regarding the Company’s ability to continue as a going concern.
We conducted our audits in accordance with the standards of the Public Company Accounting Oversight Board (United States). Those standards require that we plan and perform the audit to obtain reasonable assurance about whether the financial statements are free of material misstatement. The Company is not required to have, nor were we engaged to perform, an audit of its internal control over financial reporting. Our audit included consideration of internal control over financial reporting as a basis for designing audit procedures that are appropriate in the circumstances, but not for the purposes of expressing an opinion on the effectiveness of the Company’s internal control over financial reporting. Accordingly, we express no such opinion. An audit includes examining on a test basis, evidence supporting the amount and disclosures in the consolidated financial statements. An audit also includes assessing the accounting principles used and significant estimates made by management, as well as evaluating the overall financial statement presentation. We believe that our audits provide a reasonable basis for our opinion.
In our opinion, the consolidated financial statements referred to above present fairly, in all material respects, the financial position of Dreams, Inc. and Subsidiaries as of December 31, 2009 and, and the consolidated results of their operations and their consolidated cash flows for the years then ended, in conformity with accounting principles generally accepted in the United States of America.
/s/ Kramer Weisman and Associates, LLP
March 29, 2010
Davie, Florida
F-2
Table of Contents
Consolidated Balance Sheets
(Dollars in Thousands, except share amounts)
| December 31, 2009 |
December 31, 2008 |
|||||||
| ASSETS |
||||||||
| Current assets: |
||||||||
| Cash |
$ | 582 | $ | 498 | ||||
| Accounts receivable, net |
5,342 | 3,313 | ||||||
| Inventories |
26,593 | 31,121 | ||||||
| Prepaid expenses and deposits |
2,331 | 1,863 | ||||||
| Deferred tax asset |
1,068 | 636 | ||||||
| Total current assets |
35,916 | 37,431 | ||||||
| Property and equipment, net |
4,654 | 5,476 | ||||||
| Deferred loan costs |
21 | 44 | ||||||
| Goodwill, net |
8,650 | 8,715 | ||||||
| Other intangible assets, net |
5,329 | 5,472 | ||||||
| Deferred tax asset |
823 | 1,776 | ||||||
| Other assets |
9 | 9 | ||||||
| Total Assets |
$ | 55,402 | $ | 58,923 | ||||
| LIABILITIES AND STOCKHOLDERS’ EQUITY |
||||||||
| Current liabilities: |
||||||||
| Accounts payable |
$ | 9,516 | $ | 7,522 | ||||
| Accrued liabilities |
4,583 | 6,060 | ||||||
| Current portion of long-term debt |
1,116 | 1,255 | ||||||
| Borrowings against line of credit |
9,066 | 12,556 | ||||||
| Term Note |
444 | — | ||||||
| Deferred credits |
1,288 | 1,863 | ||||||
| Total current liabilities |
26,013 | 29,256 | ||||||
| Long-term debt, less current portion |
913 | 1,876 | ||||||
| Capital lease obligation |
137 | 75 | ||||||
| Long-term deferred tax liability |
2,681 | 2,500 | ||||||
| Borrowings against line of credit |
— | — | ||||||
| Total Liabilities |
29,744 | 33,707 | ||||||
| Minority Interest in subsidiary |
— | 4 | ||||||
| Stockholders’ equity: |
||||||||
| Preferred stock authorized 10,000,000 shares; issued and 0 outstanding shares as of December 31, 2009 and December 31, 2008. |
— | — | ||||||
| Common stock and additional paid-in capital, no par value; authorized 100,000,000, and 100,000,000 shares; issued and outstanding 37,615,786 and 37,566,614 shares as of December 31, 2009, and December 31, 2008, respectively. |
35,635 | 35,339 | ||||||
| Treasury stock 38,400 issued and 0 as of December 31, 2009 and December 31, 2008. |
(46 | ) | (46 | ) | ||||
| Accumulated deficit |
(9,931 | ) | (10,081 | ) | ||||
| Total stockholders’ equity |
25,658 | 25,212 | ||||||
| Total liabilities and stockholders’ equity |
$ | 55,402 | $ | 58,923 | ||||
F-3
Table of Contents
Consolidated Statements of Operations
For the Year Ended December 31, 2009 and the Year Ended December 31, 2008.
(Dollars in Thousands, except share and earnings per share amounts)
| Year ended December 31, 2009 |
Year ended December 31, 2008 |
|||||||
| Revenues: |
||||||||
| Manufacturing/Distribution |
$ | 11,470 | $ | 18,116 | ||||
| Retail |
73,711 | 63,320 | ||||||
| Other |
354 | 546 | ||||||
| Total revenues |
$ | 85,535 | $ | 81,982 | ||||
| Expenses: |
||||||||
| Cost of sales—manufacturing/distribution |
$ | 5,497 | $ | 9,348 | ||||
| Cost of sales—retail |
39,626 | 35,368 | ||||||
| Operating expenses |
36,226 | 37,925 | ||||||
| Depreciation and amortization |
1,819 | 1,347 | ||||||
| Total expenses |
$ | 83,168 | $ | 83,988 | ||||
| Income / (loss) from operations |
$ | 2,367 | $ | (2,006 | ) | |||
| Interest (expense), net |
(1,268 | ) | (926 | ) | ||||
| Other (expense) / income |
(238 | ) | (55 | ) | ||||
| Income / (loss) before income taxes |
$ | 861 | $ | (2,987 | ) | |||
| Provision for Income tax (expense)/benefit: |
||||||||
| Current |
(9 | ) | 1,373 | |||||
| Deferred |
(702 | ) | – | |||||
| Net income / (loss) |
$ | 150 | $ | (1,614 | ) | |||
| Basic and diluted income / (loss) per share |
$ | 0.00 | $ | (0.04 | ) | |||
| Basic weighted average common shares outstanding |
37,537,838 | 37,545,576 | ||||||
| Potentially dilutive weighted average shares outstanding |
37,624,552 | 37,545,576 | ||||||
The accompanying notes are an integral part of these consolidated financial statements.
F-4
Table of Contents
Consolidated Statements of Stockholders’ Equity
For the Year Ended December 31, 2009 and the Year Ended December 31, 2008.
(Dollars in Thousands, except share and earnings per share amounts)
| Shares Outstanding | Common Stock & Additional Paid-In-Capital |
Treasury Stock |
Accumulated Deficit |
Total Stockholders’ Equity |
||||||||||||||
| Balance as of December 31, 2007 |
37,702,523 | $ | 35,213 | — | $ | (8,467 | ) | $ | 26,746 | |||||||||
| Share Based Compensation Expense |
— | 47 | — | — | 47 | |||||||||||||
| Stock Options Converted/shares Issued |
2,499 | 2 | — | — | 2 | |||||||||||||
| Treasury stock |
(38,400 | ) | — | (46 | ) | — | (46 | ) | ||||||||||
| Pro Stars Acquisition |
(139,408 | ) | 39 | — | — | 39 | ||||||||||||
| BoD Stock Option Expense |
— | 20 | — | — | 20 | |||||||||||||
| Acquisition Stock Option Expense |
— | 18 | — | — | 18 | |||||||||||||
| Net Income/(loss) |
— | — | — | (1,614 | ) | (1,614 | ) | |||||||||||
| Balance as of December 31, 2008 |
37,527,214 | $ | 35,339 | $ | (46 | ) | $ | (10,081 | ) | $ | 25,212 | |||||||
| Share Based Compensation Expense |
— | 224 | — | — | 224 | |||||||||||||
| Stock Options Converted/shares Issued |
87,573 | 36 | — | — | 36 | |||||||||||||
| BoD Stock Option Expense |
— | 36 | — | — | 36 | |||||||||||||
| Net Income/(loss) |
— | — | — | 150 | 150 | |||||||||||||
| Balance as of December 31, 2009 |
37,615,786 | $ | 35,635 | $ | (46 | ) | $ | (9,931 | ) | $ | 25,658 | |||||||
The accompanying notes are an integral part of these consolidated financial statements.
F-5
Table of Contents
Consolidated Statements of Cash Flows
For the Year Ended December 31, 2009 and the Year Ended December 31, 2008.
Dollars in Thousands
| Year Ended December 31, 2009 |
Year Ended December 31, 2008 |
|||||||
| Cash Flows from Operating Activities |
||||||||
| Net Income (Loss) |
$ | 150 | $ | (1,614 | ) | |||
| Adjustments to reconcile net Income (loss) to net cash used in operating activities: |
||||||||
| Depreciation |
1,674 | 1,288 | ||||||
| Amortization |
145 | 59 | ||||||
| Loan cost amortization |
118 | 49 | ||||||
| Net loss from the disposal of property and equipment |
158 | (2 | ) | |||||
| Write down of goodwill |
65 | — | ||||||
| Minority interest in net income of consolidated subsidiary |
4 | — | ||||||
| Stock based compensation |
260 | 48 | ||||||
| Deferred tax expense/(benefit), net |
702 | (823 | ) | |||||
| (Increase) decrease in: |
||||||||
| Accounts receivable |
(2,029 | ) | 1,081 | |||||
| Inventories |
4,528 | (6,802 | ) | |||||
| Prepaid expenses and deposits |
(468 | ) | 136 | |||||
| Increase (decrease) in: |
||||||||
| Accounts payable |
1,994 | (3,592 | ) | |||||
| Accrued liabilities |
(1,477 | ) | 3,660 | |||||
| Deferred revenues |
(575 | ) | 677 | |||||
| Net cash provided by/ (used in) operating activities |
$ | 5,249 | $ | (5,835 | ) | |||
| Cash Flows from Investing Activities |
||||||||
| Purchase of property and equipment |
(919 | ) | (2,873 | ) | ||||
| Net cash (used in) investing activities |
$ | (919 | ) | $ | (2,873 | ) | ||
| Cash Flows from Financing Activities |
||||||||
| Proceeds from Line of Credit |
59,692 | 37,811 | ||||||
| Paydown on Line of Credit |
(62,748 | ) | (30,262 | ) | ||||
| Deferred loan costs |
(95 | ) | (38 | ) | ||||
| Payment of minority interest |
— | (61 | ) | |||||
| Proceeds from stock option exercise |
36 | — | ||||||
| Repayment of Capital lease |
(29 | ) | (18 | ) | ||||
| Purchase of treasury stock |
(46 | ) | — | |||||
| Borrowings on Notes Payable |
— | 1,399 | ||||||
| Repayment of Notes payable |
(1,102 | ) | (1,180 | ) | ||||
| Net cash (used in) provided by financing activities |
$ | (4,064 | ) | $ | 7,605 | |||
| Net increase (decrease) in cash |
84 | (1,103 | ) | |||||
| Cash at beginning of period |
498 | 1,601 | ||||||
| Cash at end of period |
$ | 582 | $ | 498 | ||||
| Cash paid for interest |
1,148 | 916 | ||||||
| Cash paid for income taxes |
— | 101 | ||||||
| Supplemental Disclosure of Non Cash Investing and Financing Activity |
||||||||
| PP & E acquired under capital lease |
91 | — | ||||||
| Reversed NP to Fashion Valley |
— | 50 | ||||||
| Notes Payable for Inventory acquisition |
— | 899 | ||||||
F-6
Table of Contents
Notes to Consolidated Audited Financial Statements
(Dollars in Thousands, except share and earnings per share amounts)
1. Nature of Business and Summary of Significant Accounting Policies
Description of Business
Dreams, Inc. and its subsidiaries (collectively the “Company”) are principally engaged in the manufacturing, distributing, retailing and selling of sports licensed products, memorabilia and acrylic display cases via multiple channels. The Company is also in the business of operating retail stores and websites selling memorabilia and licensed sports products, as well as athlete representation and corporate marketing of individual athletes. The Company’s customers are located throughout the United States of America.
Principals of Consolidation
The accompanying consolidated audited financial statements include the accounts of the Company and its wholly-owned subsidiaries. All material inter-company transactions and accounts have been eliminated in consolidation.
Cash
Cash is defined as highly liquid investments with original maturities of three months or less and consist of amounts held as bank deposits.
Accounts Receivable
The Company’s accounts receivable principally result from uncollected royalties from Field of Dreams® franchisees and from credit sales to third-party customers from its wholesale operations and recently, some web syndication clients, and credit card transactions from the internet division. The Company’s allowance for doubtful accounts is based on management’s estimates of the creditworthiness of its customers, current economic conditions and historical information, and, in the opinion of management is believed to be set at an amount sufficient to respond to normal business conditions. Should such conditions deteriorate or any major credit customer default on its obligations to the Company, this allowance may need to be increased which may have an adverse impact on the Company’s operations. The Company reviews its accounts receivable aging on a regular basis to determine if any of the receivables are past due. The Company writes off all uncollectible trade receivables against its allowance for doubtful accounts. As of December 31, 2009 and December 31, 2008, the allowance for doubtful accounts was $34 and $76, respectively.
Revenue Recognition
The Company recognizes retail (including e-commerce sales and web syndication sales) and wholesale/distribution revenues at the later of (a) the time of shipment or (b) when title passes to the customers, all significant contractual obligations have been satisfied and collection of the resulting receivable is reasonably assured. Retail revenues and wholesale/distribution revenues are recognized at the time of sale. Sales completed but not shipped at year-end are considered deferred revenue.
Revenues from the sale of franchises are deferred until the Company fulfills its obligations under the franchise agreement and the franchised unit opens. The franchise agreements provide for continuing royalty fees based on a percentage of gross receipts.
Management fee revenue related to the representation and marketing of professional athletes is recognized when earned and is reflected net of its related costs of sales. The majority of the revenue generated from the representation and marketing of professional athletes relates to services as an agent. In these arrangements, the Company is not the primary obligor in these transactions but rather only receives a net agent fee.
Revenues from industry trade shows are recognized at the time of the show when tickets are submitted for autographs or actual product purchases take place. In instances when the Company receives pre-payments for show autographs, the Company records these amounts as deferred revenue.
The Company partnered in a corporate rebate program with a national consumer goods retailer. The Company issued rebate coupons for which it was pre-paid 50% of the coupon value. Certificates redeemed through March 31, 2009, were recognized as revenue in the current period. Additionally, a breakage model was projected for the program’s eight month term, based upon redemption totals through April 27, 2009 and the remainder of revenue was recognized during 2009.
The Company had approximately $592 in unshipped orders as of December 31, 2009.
F-7
Table of Contents
Dreams, Inc. and Subsidiaries
Notes to Consolidated Audited Financial Statements—(Continued)
(Dollars in Thousands, except share and earnings per share amounts)
Shipping and Handling Costs
Costs incurred for shipping and handling associated with a sale are included in cost of sales in the period when the sale occurred. Amounts billed to a customer for shipping and handling is reported as revenue.
Advertising and Promotional Costs
All advertising and promotional costs associated with advertising and promoting the Company’s lines of business are expensed in the period incurred and included in operating expenses. For the years ended December 31, 2009 and December 31, 2008, these expenses were $5,876 and $7,100, respectively.
Inventories
Inventories, consisting primarily of licensed sports products, sports memorabilia products and acrylic cases, are valued at the lower of cost or market, using the specific identification and average cost methods.
Property and Equipment
Property and equipment is stated at cost. Depreciation is provided for using the straight-line method over the estimated useful lives of the assets ranging from three to seven years. Leasehold improvements are amortized over the remaining lease period or the estimated useful life of the improvements, whichever is less. Maintenance and repairs are charged to expense as incurred and major renewals and betterments are capitalized.
Goodwill and Intangible Assets
In June 2001, the Financial Accounting Standards Board approved the issuance of ASC Topic 350, “Intangible Goodwill and Other,” which established accounting and reporting requirements for goodwill and other intangible assets. The standard requires that all intangible assets acquired that are obtained through contractual or legal right, or are capable of being separately sold, transferred, licensed, rented or exchanged must be recognized as an asset apart from goodwill. Goodwill and intangibles with indefinite lives are no longer amortized, but are subject to an annual assessment for impairment by applying a fair value based test.
The Company applied the provisions of ASC Topic 350 beginning on April 1, 2001 and during the years ended December 31, 2009 and December 31, 2008, performed fair value based impairment tests on its goodwill and other indefinite lived intangible assets and determined no impairment was necessary.
Long-Lived Assets
Long-lived assets and certain non-amortizable intangible assets to be held and used are reviewed for impairment whenever events or changes in circumstances indicate that the carrying amount of such assets may not be recoverable. Determination of recoverability is based on an estimate of undiscounted future cash flows resulting from the use of such asset and eventual disposition. Measurement of an impairment loss for long-lived assets and certain identifiable intangible assets that management expects to hold and use is based on the fair value of the asset. Long-lived assets and certain identifiable intangible assets to be disposed of are reported at the lower of carrying amount or fair value less costs to sell.
Fair Value of Financial Instruments
The Company adopted ASC topic 820, “Fair Value Measurements and Disclosures” (ASC 820), formerly SFAS No. 157 “Fair Value Measurements,” effective January 1, 2009. ASC 820 defines “fair value” as the price that would be received for an asset or paid to transfer a liability (an exit price) in the principal or most advantageous market for the asset or liability in an orderly transaction between market participants on the measurement date. There was no impact relating to the adoption of ASC 820 to the Company’s financial statements.
ASC 820 also describes three levels of inputs that may be used to measure fair value:
| • | Level 1: Observable inputs that reflect unadjusted quoted prices for identical assets or liabilities traded in active markets. |
| • | Level 2: Inputs other than quoted prices included within Level 1 that are observable for the asset or liability, either directly or indirectly. |
| • | Level 3: Inputs that are generally unobservable. These inputs may be used with internally developed methodologies that result in management’s best estimate of fair value. |
Financial instruments consist principally of cash, accounts receivable, bank line of credit, prepaid expenses, accounts payable, and accrued liabilities. The carrying amounts of such financial instruments in the accompanying balance sheets approximate their fair values due to their relatively short- term nature. The fair value of long-term debt is based on current rates at which the Company could borrow funds with similar remaining maturities. The carrying amounts approximate fair value. It is management’s opinion that the Company is not exposed to any significant currency or credit risks arising from these financial instruments.
F-8
Table of Contents
Dreams, Inc. and Subsidiaries
Notes to Consolidated Audited Financial Statements—(Continued)
(Dollars in Thousands, except share and earnings per share amounts)
Income Taxes
The Company accounts for income taxes under FASB Codification Topic 740-10-25 (“ASC 740-10-25”). Under ASC 740-10-25, deferred tax assets and liabilities are recognized for the future tax consequences attributable to differences between the financial statement carrying amounts of existing assets and liabilities and their respective tax bases. Deferred tax assets and liabilities are measured using enacted tax rates expected to apply to taxable income in the years in which those temporary differences are expected to be recovered or settled. Under ASC 740-10-25, the effect on deferred tax assets and liabilities of a change in tax rates is recognized in income in the period that includes the enactment date.
Earnings per share:
Earnings per share are reported pursuant to the provisions of FASB ASC 210. Accordingly, basic earnings per share reflects the weighted average number of shares outstanding during the year, and diluted shares adjusts that figure by the additional hypothetical shares that would be outstanding if all exercisable outstanding common stock equivalents with an exercise price below the current market value of the underlying stock were exercised. Common stock equivalents consist of stock options and warrants. Basic earnings per share are computed by dividing net earnings available to common shareholders by the weighted average number of shares outstanding during the period. Diluted earnings per share are computed assuming the exercise of stock options under the treasury stock method and the related income taxes effects, if not anti-dilutive. For loss periods common share equivalents are excluded from the calculation, as the effect would be anti-dilutive. The following tabulation reflects the number of shares utilized to determine basic and diluted earnings per share for the years ended December 31, 2009 and 2008:
| 2009 | 2008 | |||||
| Basic weighted-average common shares outstanding |
37,537,838 | 37,545,576 | ||||
| Dilutive effect of stock plans and other options |
86,714 | 0 | ||||
| Dilutive weighted-average shares outstanding |
37,624,552 | 37,545,576 |
Stock Compensation
Effective April 1, 2006, the Company adopted the provisions of, and accounted for stock-based compensation in accordance with FASB Accounting Standards Codification, Topic 718 Compensation – Stock Compensation. Under the fair value recognition provisions of Topic 718, stock-based compensation cost is measured at the grant date based on the fair value of the award over the requisite service period, which is the vesting period. The Company elected the modified-prospective method of adoption, under which prior periods are not revised for comparative purposes. The Company has elected the graded-vesting attribution method for recognizing stock-based compensation expense over the requisite service period for each separately vesting tranche of awards as though the awards were, in substance, multiple awards. The valuation provisions of Topic 718 apply to new grants and to grants that were outstanding as of the effective date and are subsequently modified.
For the year ended December 31, 2009, the Company recorded $260 of pre-tax share-based compensation expense under FAS No. 123(R), as part of operating expense in the Company’s Consolidated Statement of Operations. This expense was offset by a $104 deferred tax benefit for non-qualified share–based compensation. For the year ended December 31, 2008, the Company recorded $48 of pre-tax share-based compensation expense; which was offset by a $19 deferred tax benefit.
Share-Based Compensation Awards
The following disclosure provides information regarding the Company’s share-based compensation awards, all of which are classified as equity awards in accordance with FASB Accounting Standards Codification, Topic 718 Compensation – Stock Compensation:
Stock Options - The Company grants stock options to employees that allow them to purchase shares of the Company’s common stock. Options are also granted to outside members of the Board of Directors of the Company as well as independent contractors. The Company determines the fair value of stock options at the date of grant using the Black-Scholes valuation model. Options generally vest immediately, however, the Company has granted options that vest over three to five years. Awards generally expire three to five years after the date of grant.
On June 19, 2009, the Company granted 1,164,352 incentive stock options (ISO’s) under the Company’s Equity Compensation Plan to employees (1,045,058 options), outside Directors (90,000 options) and independent contractors (29,294 options). Each of the stock options have a (3) three-year term and are immediately vested. All of these options have an exercise price between $.41- $.45.
As of December 31, 2009, vested options totaled 1,443,474 with an average price of $.53. Unvested options totaled 22,171. Total outstanding options that were “in the money” at December 31, 2009 were 1,437,312 with an average price per option of $.49. Of those options, the vested “in the money” options totaled 1,415,141 with an average price of $.48 and the “in the money” unvested options totaled 22,171.
F-9
Table of Contents
Dreams, Inc. and Subsidiaries
Notes to Consolidated Audited Financial Statements—(Continued)
(Dollars in Thousands, except share and earnings per share amounts)
During the twelve months ended December 31, 2009; there were 1,166,526 options granted, 90,388 options expired, 9,668 options cancelled, and 87,573 options exercised. The Company received $36 from exercised options during the period.
The following table summarizes the stock option activity from January 1, 2009, through December 31, 2009:
| Options | Exercisable Price | Weighted Av. Exercise Price | ||||||
| January 1, 2009 |
486,748 | $ | .60 - $2.75 | $ | .97 | |||
| Granted |
1,166,526 | $ | .41 - .45 | $ | .42 | |||
| Expired |
90,388 | $ | .41 - $1.50 | $ | 1.49 | |||
| Cancelled |
9,668 | $ | .60 - $2.75 | $ | 2.24 | |||
| Exercised |
87,573 | $ | .41 | $ | .41 | |||
| December 31, 2009 |
1,465,645 | $ | .41 - $2.75 | $ | .57 | |||
The following table breaks down the number of outstanding options with their corresponding contractual life as well as the exerciseable weighted average (WA), outstanding exercise price, number of vested options with the corresponding exercise price by price range.
Options Breakdown by Range at 12/31/09
| Outstanding |
Exerciseable | |||||||||
| Range |
Outstanding Options |
Remaining Contractual Life |
WA Outstanding Exercise Price |
Vested Options |
WA Vested Exercise Price | |||||
| $0.41 to $1.19 |
1,473,312 | 2.1 | .49 | 1,415,141 | .48 | |||||
| $1.20 to $2.75 |
28,333 | 1.5 | 2.67 | 28,333 | 2.67 | |||||
| $.41 to $2.75 |
1,465,645 | 2.1 | .53 | 1,443,474 | .53 | |||||
At December 31, 2009, exercisable options had aggregate intrinsic values of $1,630.
Deferred Compensation
During the quarter ended June 30, 2009, the Company entered into a deferred compensation agreement with participating employees, through a voluntary program, which provided for a 12% accrued annual interest rate and incentive stock options (ISO’s). The deferred compensation which totaled $1,100, along with accrued interest amounts were paid in full during the month of December 2009. As a result, the Company recorded $42 in interest expense for the twelve months ended December 31, 2009.
Use of Estimates
The preparation of financial statements in conformity with accounting principles generally accepted in the United States of America requires management to make estimates and assumptions that affect the reported amounts of assets and liabilities and disclosure of contingent assets and liabilities at the date of the consolidated financial statements and the reported amounts of revenues and expenses during the reporting periods. Actual results could differ from those estimates.
Significant estimates underlying the accompanying consolidated financial statements include: the determination of the lower of cost or market adjustment for inventory; sales returns; the allowance for doubtful accounts; the recoverability of long-lived and intangible assets; the determination of deferred income taxes, including related valuation allowances; the accrual for actual, pending or threatened litigation, claims and assessments; and assumptions related to the determination of stock-based compensation
In an on-going basis, the Company reviews its outstanding customer receivables for collectability. Adjustments to the allowance account are made according to current knowledge. Additionally, management reviews the composition of its inventory no less than annually. Reserves are adjusted accordingly. On a quarterly basis, the Company also evaluates its ability to realize its deferred tax assets and whether or not a valuation allowance is necessary.
The Company has both Goodwill and other long-lived intangible assets which are not amortized. As prescribed by the FASB, the Company evaluates the carrying value of these assets for impairment. Significant economic changes may require the Company to recognize impairment. As of December 31, 2009, no impairment has been necessary, yet the Company has taken a write down to Goodwill in the amount of $64 due to the closing of stores previously acquired that had Goodwill associated with the original purchase during the second quarter of 2009.
Subsequent Events
The Company has evaluated subsequent events through the time of the filing of these consolidated financial statements. No material subsequent events have occurred since December 31, 2009 that require recognition or disclosure in these financial statements.
F-10
Table of Contents
Dreams, Inc. and Subsidiaries
Notes to Consolidated Audited Financial Statements—(Continued)
(Dollars in Thousands, except share and earnings per share amounts)
NEW ACCOUNTING PRONOUNCEMENTS
In September 2006, the Financial Accounting Standards Board (“FASB”) issued guidance now codified as FASB ASC Topic 820, “Fair Value Measurements and Disclosures,” which defines fair value, establishes a framework for measuring fair value and expands disclosures about fair value measurements. The pronouncement is effective for fiscal years beginning after November 15, 2007, and interim periods within those fiscal years. In February 2008, the FASB released additional guidance now codified under FASB ASC Topic 820, which provides for delayed application of certain guidance related to non-financial assets and non-financial liabilities, except for items that are recognized or disclosed at fair value in the financial statements on a recurring basis (at least annually), until fiscal years beginning after November 15, 2008, and interim periods within those years. Pursuant to the requirements of FASB ASC Topic 820, we adopted the provisions of Topic 820 with respect to our non-financial assets and non-financial liabilities effective April 1, 2009. The implementation of this pronouncement had no impact on our consolidated financial position, results of operations or cash flows.
In January 2010, the FASB amended guidance now codified as FASB ASC Topic 810, “Consolidation.” FASB ASC Topic 810 changes the accounting and reporting for minority interests, which will be recharacterized as non-controlling interests and classified as a component of equity. The amendment of FASB ASC Topic 810-10 establishes the accounting and reporting guidance for noncontrolling interests and changes in ownership interests of a subsidiary. FASB ASC Topic 810 is effective for us on a prospective basis for business combinations with an acquisition date beginning in the first quarter of fiscal year 2010. The adoption of FASB ASC Topic 810 as amended did not have an impact on our consolidated financial statements.
In June 2008, the FASB issued guidance now codified as FASB ASC Topic 260, “Earnings Per Share.” Under FASB ASC Topic 260, unvested share-based payment awards that contain rights to receive non-forfeitable dividends (whether paid or unpaid) are participating securities, and should be included in the two-class method of computing earnings per share. As of April 1, 2009, we implemented FASB ASC Topic 260 which requires us to treat unvested shares of restricted stock as participating securities in accordance with the two-class method in the calculation of both basic and diluted earnings per share. We had no shares of unvested restricted stock as of December 31, 2009 so the retrospective application of FASB ASC Topic 260 had no effect on our earnings per share for the year ended December 31, 2009.
In December 2008, the FASB issued guidance now codified as FASB ASC Topic 805, “Business Combinations” which requires that business combinations will result in assets and liabilities of an acquired business being recorded at their fair values as of the acquisition date, with limited exceptions. Certain forms of contingent consideration and certain acquired contingencies will be recorded at fair value at the acquisition date. FASB ASC Topic 805 also states acquisition costs will generally be expensed as incurred and restructuring costs will be expensed separately from the business combination in periods after the acquisition date. We will be required to apply this new standard prospectively to business combinations for which the acquisition date is on or after April 1, 2009. The adoption of FASB ASC Topic 805 did not have an impact on our consolidated financial statements.
Effective January 1, 2009, we adopted FASB guidance now codified as FASB ASC Topic 718-740, “Compensation – Stock Compensation, Income Taxes.” FASB ASC Topic 718-740 requires us to recognize a realized income tax benefit associated with dividends or dividend equivalents paid on non-vested equity-classified employee share-based payment awards that are charged to retained earnings as an increase to additional paid-in capital. The adoption of FASB ASC Topic 718-740 did not have a material impact on our financial position, results of operations or cash flows.
In April 2009, the FASB issued guidance now codified as FASB ASC Topic 825, “Financial Instruments,” which amends previous Topic 825 guidance to require disclosures about fair value of financial instruments in interim as well as annual financial statements. This pronouncement is effective for periods ending after June 15, 2009. The adoption of this pronouncement did not have an impact on our consolidated financial position, results of operations or cash flows.
In May 2009, the FASB issued guidance now codified as FASB ASC Topic 855, “Subsequent Events,” which establishes general standards of accounting for, and disclosures of, events that occur after the balance sheet date but before financial statements are issued or are available to be issued. Although there is new terminology, the standard is based on the same principles as those that currently exist in the auditing standards. The standard, which includes a new required disclosure of the date through which an entity has evaluated subsequent events, is effective for interim or annual periods ending after June 15, 2009. We adopted FASB ASC Topic 855 on June 30, 2009 with no material effects to the financial results of the Company.
F-11
Table of Contents
Dreams, Inc. and Subsidiaries
Notes to Consolidated Audited Financial Statements—(Continued)
(Dollars in Thousands, except share and earnings per share amounts)
In June 2009, the FASB issued guidance now codified as FASB ASC Topic 105, “Generally Accepted Accounting Principles,” as the single source of authoritative non-governmental U.S. GAAP. FASB ASC Topic 105 does not change current U.S. GAAP, but is intended to simplify user access to all authoritative U.S. GAAP by providing all authoritative literature related to a particular topic in one place. All existing accounting standard documents will be superseded and all other accounting literature not included in the FASB Codification will be considered non-authoritative. These provisions of FASB ASC Topic 105 are effective for interim and annual periods ending after September 15, 2009 and, accordingly, are effective for us for the current fiscal reporting period. The adoption of this pronouncement did not have an impact on our financial condition or results of operations, but will impact our financial reporting process by eliminating all references to pre-codification standards. On the effective date of this Statement, the Codification superseded all then-existing non-SEC accounting and reporting standards, and all other non-grandfathered non-SEC accounting literature not included in the Codification became non-authoritative.
In January 2010, the FASB amended its guidance now codified as FASB ASC Topic 505-20, “Equity – Stock Dividends and Stock Splits,” to clarify that the stock portion of a distribution to shareholders that allows them to elect to receive cash or stock with a limit on the amount of cash that will be distributed is not a stock dividend for purposes of applying Topics 505 and 260. These provisions of FASB ASC Topic 505 are effective for interim and annual periods ending after December 15, 2009 and, accordingly, are effective for us for the current fiscal reporting period. The adoption of this pronouncement did not have an impact on our financial condition or results of operations as we do not currently have distributions that allow shareholders such an election.
A variety of proposed or otherwise potential accounting standards are currently under study by standard-setting organizations and various regulatory agencies. Because of the tentative and preliminary nature of these proposed standards, management has not determined whether implementation of such proposed standards would be material to our consolidated financial statements.
Reclassifications
Certain reclassifications have been made to the prior year consolidated financial statements to conform to the current year presentation.
2. Acquisition of Businesses
General Statement
Upon the closing of an acquisition, management estimates the fair values of the acquired assets and liabilities and consolidates the acquisition as quickly as possible. However, it routinely takes time to obtain all of the pertinent information to finalize the acquired company’s balance sheet and supporting schedules and to adjust the acquired company’s accounting policies, procedures, books and records to the Company’s standards. As a result, it may take several quarters before the Company is able to finalize those initial fair value estimates. Accordingly, it is not uncommon for initial estimates to be subsequently revised.
3. Concentration of Credit Risk
Cash
The Company maintains cash accounts in financial institutions that were guaranteed by the Federal Deposit Insurance Corporation (“FDIC”) up to $100; as of October 2008, up to $250. At times, cash balances may be in excess of the amounts insured by the FDIC. The Company had not experienced any losses in such accounts until it was notified on September 24, 2008 that the Silver State Bank in Henderson, Nevada was closed by the FDIC. As a result of this notification, the Company booked a $50 reserve against the $240 Certificate of Deposit held at this institution. The Company received the $100 insured portion during the first quarter of 2009 and an additional $26 as of December 31, 2009. We will continue to receive pro-rata distributions upon the liquidation of Bank assets in 2010.
Accounts receivable
The Company believes that credit risk is limited due to the large number of entities comprising the Company’s customer base and the diversified industries in which the Company operates. The Company performs certain credit evaluation procedures and does not require collateral. The Company believes that credit risk is limited because the Company routinely assesses the financial strength of its customers, and based upon factors surrounding the credit risk of customers, establishes an allowance for uncollectible accounts and, as a consequence, believes that its accounts receivable credit risk exposure beyond such allowances is limited.
F-12
Table of Contents
Dreams, Inc. and Subsidiaries
Notes to Consolidated Audited Financial Statements—(Continued)
(Dollars in Thousands, except share and earnings per share amounts)
4. Inventories
The components of inventories as of:
| December 31, 2009 |
December 31, 2008 | |||||
| Raw materials |
$ | 393 | $ | 362 | ||
| Work in process |
80 | 78 | ||||
| Finished goods, net |
26,120 | 30,681 | ||||
| Total |
$ | 26,593 | $ | 31,121 | ||
The reserve for slow moving inventory was $470 at December 31, 2009 and $334 at December 31, 2008.
5. Property and Equipment
The components of property and equipment as of:
| December 31, 2009 |
December 31, 2008 |
|||||||
| Leasehold improvements |
$ | 2,108 | $ | 2,358 | ||||
| Machinery and equipment |
1,218 | 1,278 | ||||||
| Office and other equipment and fixtures |
1,338 | 1,219 | ||||||
| Transportation equipment |
72 | 72 | ||||||
| Computer Software |
3,333 | 2,705 | ||||||
| Computer equipment |
2,331 | 2,040 | ||||||
| 10,400 | 9,672 | |||||||
| Less accumulated depreciation |
(5,746 | ) | (4,196 | ) | ||||
| $ | 4,654 | $ | 5,476 | |||||
The depreciation expense for the year ended December 31, 2009 was $1,395 and at December 31, 2008 was $1,300. An additional $158 was recognized as the write off of abandoned property during the year ended December 31, 2009.
6. Intangible Goodwill and Other
During the year ended December 31, 2009, the Company closed one of its retail stores. As a result of the store closing, the Company wrote off approximately $65 of goodwill recorded in the original acquisition of this store in November, 2006.
The changes in the carrying amounts of goodwill are as follows:
| Total | ||||
| Balance as of December 31, 2008 |
$ | 8,715 | ||
| Close of FOD store |
(65 | ) | ||
| Balance as of December 31, 2009 |
$ | 8,650 | ||
F-13
Table of Contents
Dreams, Inc. and Subsidiaries
Notes to Consolidated Audited Financial Statements—(Continued)
(Dollars in Thousands, except share and earnings per share amounts)
The following table provides information about changes relating to intangible assets for the Year ended December 31, 2009 and December 31, 2008:
| December 31, 2009 | |||||||||
| Weighted Avg. Useful Life | Gross Carrying Value | Accum. Amortization | Net | ||||||
| Finite-lived intangible assets: |
|||||||||
| Non-compete agreement |
2.3 | 325 | (242 | ) | 83 | ||||
| Other |
1.5 | 67 | (19 | ) | 48 | ||||
| Trademarks |
39 | 3,886 | (92 | ) | 3,794 | ||||
| 4,238 | (353 | ) | 3,925 | ||||||
| Indefinite-lived intangible assets: |
|||||||||
| Franchise licenses |
130 | — | 130 | ||||||
| Other |
1,275 | — | 1,275 | ||||||
| Total |
5,472 | (353 | ) | 5,329 | |||||
| December 31, 2008 | |||||||||
| Weighted Avg. Useful Life | Gross Carrying Value | Accum. Amortization | Net | ||||||
| Finite-lived intangible assets: |
|||||||||
| Non-compete agreement |
5.4 | 325 | (206 | ) | 119 | ||||
| Other |
2.2 | 67 | (5 | ) | 62 | ||||
| 392 | (211 | ) | 181 | ||||||
| Indefinite-lived intangible assets: |
|||||||||
| Trademarks |
3,886 | — | 3,886 | ||||||
| Franchise licenses |
130 | — | 130 | ||||||
| Other |
1,275 | — | 1,275 | ||||||
| Total |
5,683 | (211 | ) | 5,472 | |||||
Amortization expense for the year ended December 31, 2009 was $145 and December 31, 2008 was $59.
7. Line of Credit
Effective June 30, 2009, the Company extended its credit facilities of $21,000 with its senior lender until June 2010, had its 2009 business plan approved and funded, and received waivers for its fourth quarter 2008 covenant breaches. By way of background, during the first quarter of 2009, the Company disclosed that it was out of compliance with certain financial performance covenants with its Bank from the fourth quarter of 2008 and that it was determining a course of action to remedy the situation.
On June 6, 2007, the Company entered into a three-year loan and security agreement with Comerica Bank. Comerica provided the Company with $18,000 in credit facilities; consisting of a $15,000 revolver and a $3,000 “acquisition line” to fund the cash portion of future strategic acquisitions. The loan remains secured by all of the assets of the Company and its divisions. The interest rate on outstanding loan balances was prime; but with the extension has been increased to prime plus a 3.25% margin, currently 6.5%. The weighted average interest rate was 4.75% and the average loan balance was $17,500 during the year. The advance rates for eligible accounts receivable is 80% and 60.0% for the Company’s eligible inventories. As of December 31, 2009, the Company had $8,815 outstanding on the revolver and $444 outstanding on the acquisition line.
The credit facility requires that certain performance financial covenants be met on a monthly and or quarterly basis. These modified financial covenants consist of a maximum quarterly Debt to Tangible Net Worth ratio, a minimum monthly EBITDA figure, and a minimum quarterly Tangible Net Worth amount. All of which have been met by the Company for the first nine months of this year. Below are the (3) three performance financial covenant details with actual results at month and or quarter end and or year end. (Dollars in whole numbers). All of which have been met for the entire year ended December 31, 2009.
| (1) | Maintain, as of the last day of each fiscal quarter, commencing with the fiscal quarter ending March 31, 2009; a ratio of Debt to Tangible Net Worth (for the four quarter period ending on such date) of not more than the following: |
| Covenant | Actual | |||
| March 31, 2009 |
3.2 to 1.0 | 3.18 | ||
| June 30, 2009 |
3.7 to 1.0 | 3.43 | ||
| September 30, 2009 |
4.35 to 1.0 | 3.93 | ||
| December 31, 2009 and the last day of each fiscal quarter thereafter |
2.8 to 1.0 | 2.48 |
F-14
Table of Contents
Dreams, Inc. and Subsidiaries
Notes to Consolidated Audited Financial Statements—(Continued)
(Dollars in Thousands, except share and earnings per share amounts)
| (2) | Maintain, as of the last day of each month, commencing April 30, 2009, EBITDA (on a year to date basis) of not less than the following: |
| Covenant | Actual | |||||
| April 30, 2009 |
(1,367,000 | ) | (1,315,458 | ) | ||
| May 31, 2009 |
(2,278,000 | ) | (1,915,374 | ) | ||
| June 30, 2009 |
(2,576,000 | ) | (2,139,609 | ) | ||
| July 31, 2009 |
(2,835,000 | ) | (2,628,957 | ) | ||
| August 31, 2009 |
(3,099,000 | ) | (2,655,264 | ) | ||
| September 30, 2009 |
(3,069,000 | ) | (2,569,444 | ) | ||
| October 31, 2009 |
(2,926,000 | ) | (2,230,487 | ) | ||
| November 30, 2009 |
(2,008,000 | ) | (545,369 | ) | ||
| December 31, 2009 |
1,998,000 | 3,962,645 |
| (3) | Maintain, as of the last day of each fiscal quarter, commencing with the fiscal quarter ending March 31, 2009, Tangible Net Worth of not less than the following: |
| Covenant | Actual | |||
| March 31, 2009 |
10,000,000 | 10,071,000 | ||
| June 30, 2009 |
8,600,000 | 9,136,873 | ||
| September 30, 2009 |
7,600,000 | 8,507,935 | ||
| December 31, 2009 and the last day of each fiscal quarter thereafter |
10,200,000 | 11,678,511 |
8. Accrued Liabilities
Accrued liabilities consisted of the following at:
| December 31, 2009 |
December 31, 2008 | |||||
| Payroll costs (including bonuses and commissions) |
$ | 511 | $ | 660 | ||
| Accrued royalties |
196 | 264 | ||||
| Accrued site commissions |
1,253 | — | ||||
| Other accrued expenses |
2,023 | 5,136 | ||||
| $ | 4,583 | $ | 6,060 | |||
9. Notes Payable
Notes payable consists of the following at:
| December 31, 2009 |
December 31, 2008 |
|||||
| Note payable to seller of Field of Dreams store; unsecured, due December 2009, monthly payments of $5,822 including interest at 7% annually (paid January 2010) |
31 | 68 | ||||
| Note payable, unsecured, due February 2011, monthly payments $7,320 including interest at 6.0% annually. |
99 | 178 | ||||
| Note payable, unsecured, due January 2011, monthly payments of $8,247, including interest at 6% annually |
104 | 193 | ||||
| Note payable, unsecured, due August 2012, with interest at 7%. There are no monthly payments due. Can be redeemed after 1 year |
80 | 80 | ||||
| Note payable, unsecured, due August 2012, with interest at 7%. There are no monthly payments due. Can be redeemed after 3 years |
220 | 220 | ||||
| Note payable, unsecured, due August 2012, with interest at 7%. There are no monthly payments due. Can be redeemed after 3 years |
100 | 100 | ||||
| Notes payable, unsecured, due August 2012, with interest at 7%. There are no monthly payments due. Can be redeemed after 3 years |
200 | 200 | ||||
| Note payable, unsecured, due August 2012, with interest at 7%. There are no monthly payments due. Can be redeemed after 3 years |
518 | 518 | ||||
| Note payable, unsecured, due April 2010, with interest at 5.5% |
102 | 899 | ||||
| Note payable, unsecured, due April 2012, with no stated interest rate. Payments made annually now and until maturity between $100,000 and $300,000 |
575 | 675 | ||||
| 2,029 | 3,131 | |||||
| Less current portion |
(1,116 | ) | (1,255 | ) | ||
| 913 | 1,876 | |||||
Interest expense on the notes for the years ended December 31, 2009 was $121 and December 31, 2008 was $119.
For notes that have no stated interest rates, the Company has imputed a rate of 6%.
F-15
Table of Contents
Dreams, Inc. and Subsidiaries
Notes to Consolidated Audited Financial Statements—(Continued)
(Dollars in Thousands, except share and earnings per share amounts)
10. Stockholders’ Equity
Common Stock: As of December 31, 2009 and December 31, 2008, the Company had 100,000,000 and 100,000,000 shares authorized and 37,615,784 and 37,528,214 common shares issued and outstanding.
Preferred Stock: As of December 31, 2009 and December 31, 2008, the Company had 10,000,000 shares authorized and -0- preferred shares issued and outstanding for both periods.
Stock Options: The following table summarizes information about the stock options outstanding:
| Stock Options | ||||||
| Shares | Wtd. Avg. Exercise Price | |||||
| Outstanding at December 31, 2007 |
437,750 | .97 | ||||
| Granted | 70,000 | $ | 1.08 | |||
| Exercised | (2,499 | ) | .60 | |||
| Expired/Canceled | (18,503 | ) | .60 | |||
| Outstanding at December 31, 2008 |
486,748 | .98 | ||||
| Granted |
1,166,526 | .42 | ||||
| Exercised | (87,573 | ) | .41 | |||
| Expired | (90,388 | ) | 1.49 | |||
| Canceled | (9,668 | ) | 2.24 | |||
| Outstanding at December 31, 2009 |
1,465,645 | .57 | ||||
Options exercisable as of December 31, 2009 and December 31, 2008, were 1,443,474, and 431,411, respectively. The weighted average fair value of options granted during the twelve months ended December 31, 2009 was $0.42 and for December 31, 2008 was $1.08.
11. Income Taxes
The components of the income tax provision (benefit) are as follows:
| Year ended December 31, 2009 |
Year ended December 31, 2008 |
||||||
| Current: |
|||||||
| Federal tax expense/ (benefit) |
$ | (459 | ) | ||||
| State tax expense/ (benefit) |
5 | 34 | |||||
| Deferred: |
|||||||
| Federal tax expense/ (benefit) |
384 | (858 | ) | ||||
| State tax expense/ (benefit) |
317 | (90 | ) | ||||
| $ | 706 | $ | (1,373 | ) | |||
F-16
Table of Contents
Dreams, Inc. and Subsidiaries
Notes to Consolidated Audited Financial Statements—(Continued)
(Dollars in Thousands, except share and earnings per share amounts)
Deferred income taxes reflect the net tax effects of temporary differences between the carrying amount of assets and liabilities for financial reporting purposes and the amounts used for income tax purposes. Significant components of the Company’s net deferred income taxes are as follows:
Deferred Tax Asset (Liability):
| Year ended December 31, 2009 |
Year ended December 31, 2008 |
|||||||
| Current |
||||||||
| Allowance for doubtful accounts |
$ | 13 | $ | 30 | ||||
| Inventory reserve |
187 | 137 | ||||||
| Inventory capitalization adjustment |
778 | 442 | ||||||
| Accrued expenses |
90 | 27 | ||||||
| 1,068 | 636 | |||||||
| Long-term |
||||||||
| Stock options |
181 | 65 | ||||||
| Federal and states NOL carry-forward |
458 | 1,535 | ||||||
| Capital loss carry-forward |
187 | 187 | ||||||
| Alternative Minimum Tax credit |
163 | 176 | ||||||
| Charitable contributions |
21 | 0 | ||||||
| Depreciation and amortization |
(2,681 | ) | (2,500 | ) | ||||
| Less valuation allowance |
(187 | ) | (187 | ) | ||||
| $ | (1,858 | ) | $ | (724 | ) | |||
FASB ASC 740-10 requires a valuation allowance to reduce the deferred tax assets reported, if based on the weight of evidence, it is more likely than not that some portion or the entire deferred tax asset will not be realized. After consideration of all the evidence, both positive and negative, management has determined that a valuation allowance of $187 and $187 as of December 31, 2009 and December 31, 2008 is necessary to reduce the deferred tax assets to the amount that will more likely than not be realized. The change in the valuation allowance for the current year is $0.
Effective January 1, 2007, the Company adopted the provisions of FASB ASC 740-10-50, “Accounting for Uncertainty in Income Taxes”. The Interpretation provides clarification on accounting for uncertainty in income taxes recognized in an enterprise’s financial statements. The Interpretation prescribes a recognition threshold and measurement attribute for the financial statement recognition and measurement of a tax position taken or expected to be taken in a tax return, and also provides guidance on derecognition, classification, interest and penalties, accounting in interim periods, disclosure and transition. As a result of the Company’s evaluation of the implementation of ASC 740-10-50, no significant income tax uncertainties were identified. Therefore, the Company recognized no adjustment for unrecognized income tax benefits for the year ended December 31, 2009. The tax years subject to examination by the taxing authorities are the years ended December 31, 2009, and December 31, 2008.
In May 2007, the FASB issued FASB Staff Position (“FSP”) FIN 48-1 “Definition of Settlement in FASB Interpretation No. 48” (FSP FIN 48-1). Now codified FASB ASC 740-10-25-9 provides guidance on how to determine whether a tax position is effectively settled for purpose of recognizing previously unrecognized tax benefits. FSP FIN 48-1 is effective retroactively to January 1, 2007. The implementation of this standard did not have a material impact on our consolidated financial position or results of operation.
F-17
Table of Contents
Dreams, Inc. and Subsidiaries
Notes to Consolidated Audited Financial Statements—(Continued)
(Dollars in Thousands, except share and earnings per share amounts)
The reconciliation of income tax computed at the U.S. federal statutory rate to income tax expense for the years ended December 31, 2009, December 31, 2008 and December 31, 2007 is as follows:
| Year ended December 31, 2009 |
Year ended December 31, 2008 |
|||||
| Tax at U.S. statutory rate |
34 | % | (34 | )% | ||
| State taxes, net of federal benefit |
6 | (6 | ) | |||
| Non-deductible items |
3 | 1 | ||||
| Other |
38 | (8 | ) | |||
| 81 | % | (47 | )% | |||
The increase in the tax rate for 2009 was the result of timing differences involving the Company’s computation of the capitalization of inventory under IRS Section 263A and the reversal of certain tax benefits used in the previous year as the Company returned to profitability.
At December 31, 2009, the company will have federal net operating loss carry-forward of approximately $1,041. The Company also has state operating loss carry-forwards of approximately $1,777. The federal and state net operating losses expire by 2028.
12. 401 (k) Plan
The Company participates in a 401 (k) defined contribution plan (the “Plan”) under Section 401 (k) of the Internal Revenue Code. The Plan is available to all employees over the age of 21 with at least one year of service and 1,000 hours worked. Eligible participants may contribute up to 50% of their pretax earnings. Participants are immediately vested. The Company does not contribute to the Plan.
13. Commitments and Contingencies
Operating Leases
As of December 31, 2009, the Company leases office, warehouse and retail space under operating leases. The leases expire over the next eight years and some contain provisions for certain annual rental escalations, and renewal options for additional periods. Rent expense is computed on the straight-line method over the lease term period.
The future aggregate minimum annual lease payments under the Company’s non-cancellable operating leases are as follows:
| Calendar Year |
||
| 2010 | 3,240 | |
| 2011 | 2,859 | |
| 2012 | 2,614 | |
| 2013 | 2,434 | |
| 2014 | 1,499 | |
| Thereafter | 2,266 | |
| Total minimum lease commitments | 14,912 |
Rent expense charged to operations for the years ended December 31, 2009 and December 31, 2008, were $4,987 and $5,300, respectively. The Company was a named party in a breach of contract suit by a former landlord. The Company believes the claim without merit and will defend itself vigorously. No outcome can be determined at this time.
Capital Leases
The Company has entered into capital leases for computer and warehouse equipment. The leases require monthly payments of approximately $2 and expire in 2011 and 2012. The interest rate on this capital leases range from 4%-12%. The Company’s obligations under capital leases as of December 31, 2009 are not significant.
F-18
Table of Contents
Dreams, Inc. and Subsidiaries
Notes to Consolidated Audited Financial Statements—(Continued)
(Dollars in Thousands, except share and earnings per share amounts)
Future minimum payments required under the capital leases consist of the following as of December 31, 2009:
| Year Ending December 31, |
Amount | ||
| 2010 |
59 | ||
| 2011 |
58 | ||
| 2012 |
42 | ||
| Total |
159 | ||
| Less Amount representing interest |
(22 | ) | |
| Present Value of net minimum lease payments |
137 | ||
Future Contractual Payments to Athletes
As of December 31, 2009, the Company had several agreements with athletes to provide autographs in the future and the rights to produce and sell certain products. The autographs are received by the Company as a part of inventory products and re sold throughout the Company’s distribution channels. The future aggregate minimum payments to athletes under contractual agreements are as follows:
| Calendar Year |
||
| 2010 | 493,095 | |
| 2011 | 275,000 | |
14. Related Party Transactions
None.
15. Business Segment Information
The Company has two reportable segments as identified by information reviewed by the Company’s chief operating decision makers (CODM) and is comprised of our CEO and SVP Finance of Dreams, Inc. The divisions whose customers are reseller’s of our goods have their results reflected in the manufacturing/distribution segment. The retail segment is made up of many locations for our inventory. Revenues are achieved by moving inventory through our sales channels to reach and expand our customer base. These channels include the Internet, stores and our catalogues. Hence, customers who are the end users of our goods have their results reflected in our retail segment.
The Manufacturing/Distribution segment represents the manufacturing and wholesaling of sports memorabilia products and acrylic display cases. Sales are handled primarily through in-house salespersons that sell to specialty retailers and other distributors in the United States. The Company’s manufacturing and distributing facilities are located in the United States. The majority of the Company’s products are manufactured in these facilities.
The Retail Operations segment is multi-channel and comprised of traditional brick and mortar stores, catalogues and Internet sites:
Brick and Mortar
As of December 31, 2009, the Company owned and operated (12) twelve Field of Dreams® stores offering a selection of sports & entertainment memorabilia and collectibles and (6) six FansEdge stores offering an array of sports licensed products. The Company has multiple stores in the Chicago and Las Vegas markets.
Catalogues
The Company publishes and distributes a FansEdge catalogue two times a year.
Internet
The Company’s e-commerce components feature FansEdge.com and ProSportsMemorabilia.com along with a complement of athlete and syndicated web sites including, but not limited to: www.danmarino.com, www.jcp.com, and www.philadelphiaeagles.com. These e-commerce retailers sell a diversified selection of sports licensed products and autographed memorabilia on the web. These e-commerce operations have provided for the fastest growing area of our retail segment.
F-19
Table of Contents
Dreams, Inc. and Subsidiaries
Notes to Consolidated Audited Financial Statements—(Continued)
(Dollars in Thousands, except share and earnings per share amounts)
All of the Company’s revenue generated during the twelve months ended December 31, 2009 and December 31, 2008, was derived in the United States and all of the Company’s assets are located in the United States.
Summarized financial information concerning the Company’s reportable segments is shown in the following tables. Corporate related items, results of insignificant operations and income and expenses not allocated to reportable segments are included in the reconciliations to consolidated results table.
Segment information for the years ended December 31, 2009 and December 31, 2008, was as follows:
| Twelve Months Ended: |
Manufacturing/ Distribution |
Retail Operations |
Total | |||||||
| December 31, 2009 |
||||||||||
| Net sales |
$ | 15,730 | 73,711 | 89,441 | ||||||
| Intersegment net sales |
(4,260 | ) | 0 | (4,260 | ) | |||||
| Operating earnings |
342 | 4,797 | 5,139 | |||||||
| Total assets |
18,920 | 31,648 | 50,568 | |||||||
| Twelve Months Ended: |
Manufacturing/ Distribution |
Retail Operations |
Total | |||||||
| December 31, 2008 |
||||||||||
| Net sales |
$ | 23,122 | 63,385 | 86,507 | ||||||
| Intersegment net sales |
(5,006 | ) | — | (5,006 | ) | |||||
| Operating earnings / (loss) |
12,600 | (355 | ) | 846 | ||||||
| Total assets |
17,334 | 30,790 | 48,134 | |||||||
Reconciliation to consolidated amounts is as follows:
| Year ended December 31, 2009 |
Year ended December 31, 2008 |
|||||||
| Revenues: |
||||||||
| Total revenues for reportable segments |
$ | 89,441 | $ | 86,507 | ||||
| Other revenues |
354 | 481 | ||||||
| Eliminations of intersegment revenues |
(4,260 | ) | (5,006 | ) | ||||
| Total consolidated revenues |
$ | 85,535 | $ | 81,982 | ||||
| Pre-tax earnings / (loss): |
||||||||
| Total earnings for reportable segments |
$ | 5,139 | $ | 846 | ||||
| *Other (loss) / income |
(3,011 | ) | (2,907 | ) | ||||
| Interest (expense) |
(1,268 | ) | (926 | ) | ||||
| Total income (loss) before income taxes |
$ | 861 | $ | (2,987 | ) | |||
| * | These are “unallocated” costs and expenses that have not been allocated to the reportable segments. Some examples of these unallocated overhead costs which are consistent with the Company’s internal accounting policies are executive salaries and benefits; corporate office occupancy costs; professional fees, bank charges; certain insurance policy premiums and public relations/investor relations expenses. |
F-20
Table of Contents
Dreams, Inc. and Subsidiaries
Notes to Consolidated Audited Financial Statements—(Continued)
(Dollars in Thousands, except share and earnings per share amounts)
16. Minority Interest
As a result of our Asset Purchase Agreement with Pro-Star, Inc. effective December 26, 2006, Dreams received 86.5% of the Caesars Forum Shops Field of Dreams store; 89% of the Rio Hotel Field of Dreams store; 90.5% of the Smith & Wollensky Field of Dreams store; and 88.125% of the marketing venture known as “Stars Live 365”. The Company records all of the revenues generated from these operations and then records a “minority interest expense” representing the limited partners’ earned pro-rata share of the actual profits. The minority interest expense at December 31, 2009 was $3 and is included in accrued liabilities at year end. For December 31, 2008, it was approximately $55 and was included in accrued liabilities at year end. Dreams will have an on-going obligation to make quarterly distributions on a pro-rata basis depending on the actual profitability of each of the three stores and Stars Live 365.
Effective August 29, 2007, the Company bought back 6.5% interest in the Caesars Forum Shops Field of Dreams store from an individual for $40. As a result, the Company’s interest in the Caesars store is now 93%.
17. Valuation and Qualifying Accounts
We maintain an allowance for doubtful accounts that is recorded as a contra asset to our accounts receivable balance. The following table sets forth the change in each of those reserves for the years ended December 31, 2009 and December 31, 2008.
| Allowance for accounts receivable |
||||
| Balance as of December 31, 2008 |
$ | 76 | ||
| Provision |
69 | |||
| Write offs |
(110 | ) | ||
| Balance as of December 31, 2009 |
$ | 35 | ||
18. Going Concern
In 2008, the Company incurred a loss from operations, had a decrease in operational cash flows, and was in violation of its debt covenants. These factors raised substantial doubt about the Company’s ability to continue as a going concern.
Such doubt was alleviated during 2009 due to the receipt of all necessary waivers from the Bank, as well as effective implementation of Management’s plans to reduce its operating expenses and capital expenditures, restructure its commitments, convert its existing inventory into cash and conservatively manage its cash resulting in positive cash flows from operations and a return to profitability. Management believes that profits, operating cash flow and available credit resources will be adequate to make repayments of indebtedness, meet working capital needs, satisfy the needs of its operations, and meet anticipated capital expenditures during the next twelve months ending December 31, 2010.
F-21
Table of Contents
Dreams, Inc. and Subsidiaries
Notes to Consolidated Audited Financial Statements—(Continued)
(Dollars in Thousands, except share and earnings per share amounts)
TWELVE MONTHS ENDED DECEMBER 31, 2009 QUARTERLY FINANCIAL INFORMATION (Unaudited)
| Three Months Ended: |
*December 31, 2009 | September 30, 2009 | June 30, 2009 | March 31, 2009 | |||||||||
| Net Sales |
$ | 43,272 | 15,226 | 12,192 | 14,845 | ||||||||
| Cost of Goods Sold |
22,950 | 8,072 | 6,276 | 7,823 | |||||||||
| Gross Profit |
20,322 | 7,154 | 5,916 | 7,022 | |||||||||
| Operating Expenses (1) |
14,245 | 8,034 | 7,494 | 8,496 | |||||||||
| Operating Income/(Loss) |
6,077 | (880 | ) | (1,578 | ) | (1,474 | ) | ||||||
| Other Income (Expenses) |
(7 | ) | 0 | 8 | 0 | ||||||||
| Interest Expense |
482 | 413 | 197 | 175 | |||||||||
| Income (Loss) Before Taxes |
5,588 | (1,293 | ) | (1,783 | ) | (1,649 | ) | ||||||
| (Provision) Benefit for income taxes |
(2,587 | ) | 507 | 710 | 660 | ||||||||
| Net Income (loss) |
3,001 | (786 | ) | (1,073 | ) | (989 | ) | ||||||
| Earnings (loss) per common share, basic |
.08 | (.02 | ) | (.03 | ) | (.03 | ) | ||||||
| Earnings (loss) per common share, diluted |
.08 | (.02 | ) | (.03 | ) | (.03 | ) | ||||||
| Weighted Average shares Outstanding: |
|||||||||||||
| Basic |
37,545,576 | 37,534,911 | 37,528,214 | 37,528,214 | |||||||||
| Diluted |
37,669,586 | 37,775,895 | 37,528,214 | 37,528,214 | |||||||||
| * | The Company’s business is seasonal and it generates a considerable portion of its revenues during the holiday quarter ending December 31. Therefore, quarterly operating results are not necessarily indicative of the results that may be expected for the full fiscal year. |
| (1) | May not include depreciation or amortization. |
TWELVE MONTHS ENDED DECEMBER 31, 2008 QUARTERLY FINANCIAL INFORMATION (Unaudited)
| Three Months Ended: |
*December 31, 2008 | September 30, 2008 | June 30, 2008 | March 31, 2008 | |||||||||
| Net Sales |
$ | 35,403 | 14,400 | 13,650 | 18,518 | ||||||||
| Cost of Goods Sold |
19,209 | 7,856 | 7,683 | 9,969 | |||||||||
| Gross Profit |
16,194 | 6.544 | 5,967 | 8,549 | |||||||||
| Operating Expenses (1) |
14,333 | 8,230 | 7,301 | 8,514 | |||||||||
| Operating Income/(Loss) |
1,861 | (1,686 | ) | (1,334 | ) | 35 | |||||||
| Other Income (Expenses) |
1 | (35 | ) | (32 | ) | (37 | ) | ||||||
| Interest Expense |
281 | 273 | 224 | 148 | |||||||||
| Income (Loss) Before Taxes |
1,581 | (1,994 | ) | (1,590 | ) | (150 | ) | ||||||
| (Provision) Benefit for income taxes |
(181 | ) | 1,004 | 763 | 119 | ||||||||
| Net Income (loss) |
1,400 | (990 | ) | (827 | ) | (31 | ) | ||||||
| Earnings (loss) per common share, basic |
.04 | (.04 | ) | (.03 | ) | (.00 | ) | ||||||
| Earnings (loss) per common share, diluted |
.04 | (.04 | ) | (.03 | ) | (.00 | ) | ||||||
| Weighted Average shares Outstanding: |
|||||||||||||
| Basic |
37,545,576 | 37,533,238 | 37,556,376 | 37,703,211 | |||||||||
| Diluted |
37,669,586 | 37,662,780 | 37,718,100 | 37,876,886 | |||||||||
| * | The Company’s business is seasonal and it generates a considerable portion of its revenues during the holiday quarter ending December 31. Therefore, quarterly operating results are not necessarily indicative of the results that may be expected for the full fiscal year. |
| (1) | May not include depreciation or amortization. |
F-22
Table of Contents
Exhibit Index
| Exhibit |
Description | |
| 21 | Subsidiaries of the Company | |
| 23 | Consent of former Independent Auditors | |
| 31.1 | Certification of the Principal Executive Officer Pursuant to Section 302 of the Sarbanes-Oxley Act of 2002 | |
| 31.2 | Certification of the Principal Financial Officer Pursuant to Section 302 of the Sarbanes-Oxley Act of 2002 | |
| 32.1 | Certification of the Chief Executive Officer Pursuant to Section 906 of the Sarbanes-Oxley Act of 2002. (This exhibit shall not be deemed “filed” for the purposes of Section 18 of the Securities Exchange Act of 1934, as amended or otherwise subject to the liability of that section. Further, this exhibit shall not be deemed incorporated by reference into any other filing under the Security Act of 1933, as amended, or by the Security Exchange Act of 1934, as amended.) | |
| 32.2 | Certification of the Chief Financial Officer Pursuant to Section 906 of the Sarbanes-Oxley Act of 2002. (This exhibit shall not be deemed “filed” for the purposes of Section 18 of the Securities Exchange Act of 1934 as amended or otherwise subject to the liability of that section. Further, this exhibit shall not be deemed incorporated by reference into any other filing under the Security Act of 1933, as amended, or by the Security Exchange Act of 1934, as amended.) | |