Attached files
Table of Contents
UNITED STATES
SECURITIES AND EXCHANGE COMMISSION
Washington, D. C. 20549
FORM 10-K
(Mark One)
| þ | ANNUAL REPORT PURSUANT TO SECTION 13 OR 15(d) OF THE SECURITIES EXCHANGE ACT OF 1934 |
For the fiscal year ended December 31, 2009
OR
| ¨ | TRANSITION REPORT PURSUANT TO SECTION 13 OR 15(d) OF THE SECURITIES EXCHANGE ACT OF 1934 |
For the transition period from to
Commission File Number 1-15773
Cadence Financial Corporation
(Exact name of registrant as specified in its charter)
| Mississippi | 64-0694775 | |
| (State or Other Jurisdiction of Incorporation or Organization) |
(I.R.S. Employer Identification No.) | |
| 301 East Main Street, Starkville, Mississippi | 39759 | |
| (Address of Principal Executive Offices) | (Zip Code) | |
Registrant’s telephone number, including area code:
(662) 323-1341
Securities registered pursuant to Section 12(b) of the Act:
| Common stock, $1 par value | The NASDAQ Global Select Market | |
| (Title of Class) | (Exchange on Which Registered) |
Securities registered pursuant to Section 12(g) of the Act: None
Indicate by check mark if the registrant is a well-known seasoned issuer, as defined in Rule 405 of the Securities Act. Yes ¨ No x
Indicate by check mark if the registrant is not required to file reports pursuant to Section 13 or Section 15(d) of the Act. Yes ¨ No x
Indicate by check mark whether the registrant (1) has filed all reports required to be filed by Section 13 or 15(d) of the Securities Exchange Act of 1934 during the preceding 12 months (or for such shorter period that the registrant was required to file such reports), and (2) has been subject to such filing requirements for the past 90 days. Yes x No ¨
Indicate by check mark whether the registrant has submitted electronically and posted on its corporate Web site, if any, every Interactive Data File required to be submitted and posted pursuant to Rule 405 of Regulation S-T (§232.405 of this chapter) during the preceding 12 months (or for such shorter period that the registrant was required to submit and post such files). Yes ¨ No ¨
Indicate by check mark if disclosure of delinquent filers pursuant to Item 405 of Regulation S-K is not contained herein, and will not be contained, to the best of registrant’s knowledge, in definitive proxy or information statements incorporated by reference in Part III of this Form 10-K or any amendment to this Form 10-K. ¨
Indicate by check mark whether the registrant is a large accelerated filer, an accelerated filer, a non-accelerated filer or a smaller reporting company. See definition of “accelerated filer”, “large accelerated filer” and “smaller reporting company” in Rule 12b-2 of the Exchange Act.
| Large accelerated filer ¨ | Accelerated filer ¨ | Non-accelerated filer x | Smaller reporting company ¨ |
Indicate by check mark whether the registrant is a shell company (as defined in Rule 12b-2 of the Act). Yes ¨ No x
Aggregate market value of the voting stock held by nonaffiliates as of June 30, 2009, was approximately $23,611,093, based on most recent sale.
The number of shares outstanding of the registrant’s common stock as of February 28, 2010 is 11,912,564 shares.
Documents incorporated by reference
Portions of the Corporation’s proxy statement for the 2010 annual meeting of shareholders expected to be filed on or before March 29, 2010 are incorporated by reference into Part III and portions of the Corporation’s annual report to shareholders are incorporated by reference into Part IV.
Table of Contents
INDEX
PART I
Forward-Looking Statements
This report, other reports filed by the Corporation under the Securities Exchange Act of 1934, as amended (the “Exchange Act”) and any other written or oral statement by or on behalf of the Corporation may contain forward-looking statements and information based on management’s beliefs, expectations and conclusions, drawn from certain assumptions and information currently available. The Private Securities Litigation Act of 1995 encourages the disclosure of forward-looking information by management by providing a safe harbor for such information. This discussion includes “forward-looking statements” within the meaning of Section 27A of the Securities Act of 1933, as amended, and Section 21E of the Exchange Act. Although we believe that the expectations and conclusions reflected in such forward-looking statements are reasonable, such forward-looking statements are based on numerous assumptions (some of which may prove to be incorrect) and are subject to risks and uncertainties, which could cause the actual results to differ materially from our expectations. The words “anticipate,” “believe,” “estimate,” “expect,” “objective,” “project,” “forecast,” “goal” and similar expressions contained in the reports and statements referenced above are intended to identify forward-looking statements. In addition to any assumptions and other factors referred to specifically in connection with forward-looking statements, factors that could cause our actual results to differ materially from those contemplated in any forward-looking statements include, among others, increased competition, regulatory factors, economic conditions, changing interest rates, changing market conditions, availability or cost of capital, changes in accounting standards and practices, employee workforce factors, ability to achieve cost savings and enhance revenues, the assimilation of acquired operations and establishing credit practices and efficiencies therein, acts of war or acts of terrorism or geopolitical instability and other effects of legal and administrative proceedings, changes in federal, state or local laws and regulations and other factors identified in Item 1A, “Risk Factors,” and Item 7A, “Quantitative and Qualitative Disclosures about Market Risk” of this report and that may be discussed from time to time in other reports filed with the Securities and Exchange Commission (“SEC”) subsequent to this report. Readers are cautioned
2
Table of Contents
not to place undue reliance on any forward-looking statements made by or on behalf of the Corporation. Any such statement speaks only as of the date the statement was made. We undertake no obligation to update or revise any forward-looking statements, whether as a result of changes in actual results, changes in assumptions or other factors affecting such statements.
Cadence Financial Corporation
Cadence Financial Corporation (the “Corporation”) is a bank holding company organized under the laws of the State of Mississippi in 1984. The Corporation’s assets consist primarily of its investment in Cadence Bank, N.A. (“Cadence” or the “Bank”), a national banking corporation, and its primary activities are conducted through Cadence. Cadence and its subsidiaries are collectively referred to herein as “Cadence”.
The Corporation’s principal executive offices are located at 301 East Main Street, Starkville, MS 39759, and its telephone number is 662-323-1341.
Cadence Bank, N.A.
Cadence is engaged in general banking business and activities closely related to banking, as permitted by the banking laws and regulations of the United States.
Cadence provides a variety of wholesale and retail financial services, including mortgage loans, investment services and trusts. Cadence’s customer base is well diversified and consists of business, agriculture, government, education and individual accounts in the states of Alabama, Florida, Georgia, Mississippi and Tennessee. Profitability and growth have been important goals throughout Cadence’s history. To maintain such growth and profitability, given a relatively slow economy and low loan demand in its core Mississippi market area, the Corporation began to expand into higher growth markets. As part of this business strategy, the Corporation acquired Enterprise Bancshares in Tennessee in 2004, SunCoast Bank in Florida in 2006, and Seasons Bank in Georgia in 2006. Cadence has also opened new branches in Hoover, Alabama and Brentwood and Franklin, Tennessee.
Mississippi. Cadence is the largest commercial bank domiciled in the north central “Golden Triangle” area of Mississippi. In Mississippi, a total of nineteen banking facilities and an operations/administration center serve the communities of Aberdeen, Amory, Brooksville, Columbus, Hamilton, Maben, New Hope, Philadelphia, West Point and Starkville. This area extends into six Mississippi counties with a radius of approximately 65 miles from the main office in Starkville.
Alabama. Cadence also serves the Tuscaloosa and Hoover, Alabama areas with seven banking facilities.
Tennessee. Cadence has five banking facilities and an operations/data center in the Memphis, Tennessee area, and two banking facilities in the Brentwood and Franklin, Tennessee areas.
Florida. Cadence has three banking facilities in Sarasota and Bradenton, Florida.
Georgia. Cadence has two banking facilities in Blairsville and Blue Ridge, Georgia.
The following chart reflects, as of December 31, 2009, the distribution of total assets, loans, deposits and branches in the states in which Cadence conducts its business:
| State |
Assets | Loans | Deposits | Branches | ||||||||
| Alabama |
11 | % | 18 | % | 12 | % | 18 | % | ||||
| Florida |
8 | % | 12 | % | 11 | % | 8 | % | ||||
| Georgia |
2 | % | 3 | % | 2 | % | 5 | % | ||||
| Mississippi |
52 | % | 30 | % | 55 | % | 50 | % | ||||
| Tennessee |
27 | % | 37 | % | 20 | % | 19 | % | ||||
| 100 | % | 100 | % | 100 | % | 100 | % | |||||
Other Operations. Cadence has two active wholly-owned subsidiaries, NBC Service Corporation (“Service”), and NBC Insurance Services of Alabama, Inc. (“Insurance”). Service was formed to provide additional financial services that otherwise might not be provided by Cadence. For 2009, its primary activity was limited to its investment in Commerce National Insurance Company (“CNIC”). CNIC is a credit life insurance company whose primary source of income is from investment income on securities held in its portfolio. In 2002, Cadence discontinued selling credit life insurance on loans. As a result, the Corporation plans to allow CNIC’s outstanding insurance policies to run-off over the next several years or sell the insurance portion of the business, if possible, and then to dissolve and liquidate CNIC. Insurance was formed in 1999 for the purpose of selling annuity products in the state of Alabama. For 2009, its activities were insignificant.
3
Table of Contents
Galloway-Chandler-McKinney Insurance Agency, Inc. (“GCM”) was a wholly-owned subsidiary of Cadence that operated as an independent insurance agency, with its primary source of revenue coming from commissions and premiums on the sale of property and casualty insurance, title insurance, life insurance, annuities and other commercial lines. On August 31, 2009, the Bank completed the disposition of the assets used in and liabilities arising from GCM’s operations to four limited liability companies established by former owners and employees of GCM. Subsequent to the sale, the name of GCM was changed to Cadence Insurance Services of Mississippi, Inc., and it became inactive.
Competition
Cadence encounters strong competition in each of its markets, based upon interest rates offered on deposit accounts, interest rates charged on loans, other credit and service charges relating to loans, the quality and scope of services provided, the convenience of banking facilities and, in the case of loans to commercial borrowers, relative lending limits.
Cadence currently serves six counties and ten municipalities in north central Mississippi. In this area, the Bank competes directly with numerous banking institutions, credit unions, finance companies, brokerage firms and mortgage companies. The competing banking institutions range in asset size from approximately $729 million to in excess of $140 billion (size of parent companies). Cadence is the largest bank domiciled in its immediate service area in Mississippi.
Cadence also serves the cities of Tuscaloosa and Hoover, Alabama; Memphis, Brentwood and Franklin, Tennessee; Sarasota and Bradenton, Florida; and Blairsville and Blue Ridge, Georgia. In these markets, Cadence competes with numerous financial institutions ranging in asset size from approximately $221 million to $2.3 trillion (based on the size of parent companies). Cadence also competes with numerous credit unions, finance companies, brokerage firms and mortgage companies in these markets.
In recent years, mergers and acquisitions have led to greater concentration in the banking industry, placing added competitive pressure on Cadence’s core banking products and services. Consolidation efforts continued during 2009 as the challenges of the liquidity crises and market disruption led to redistribution of deposits and certain banking assets to stronger and larger financial institutions. Financial institutions with liquidity challenges sought mergers, and the deposits and certain banking assets of the 140 banks that failed during 2009, representing approximately $171 billion in total assets, were redistributed through the Federal Deposit Insurance Corporation’s least-cost resolution process. Additionally, the conversion of traditional investment banks to bank holding companies also affected the competitive landscape. These factors intensified the concentration of the industry and placed increased competitive pressure on Cadence’s core banking products and services.
Refer to “Item 1A - Risk Factors,” for discussion of the Corporation’s risks related to competition.
Supervision and Regulation
The Corporation and Cadence are subject to an extensive regulatory framework of state and federal banking laws and regulations which impose specific requirements and restrictions on, and provide for general regulatory oversight with respect to, virtually all aspects of operations. To the extent that the following summary describes statutory or regulatory provisions, it is not intended to be comprehensive and is qualified in its entirety by reference to the full text of the statutes, regulations and regulatory agency policies to which such discussion refers. We cannot predict changes in the applicable laws, regulations and regulatory agency policies, yet such changes may have a material effect on the Corporation’s business, financial condition or results of operations. U. S. Federal regulation of banks, bank holding companies and financial holding companies is intended primarily for the protection of depositors, the Deposit Insurance Fund and the banking system as a whole, rather than for the protection of security holders and creditors.
Bank Holding Company Act and Gramm-Leach-Bliley Act. The Corporation is a bank holding company within the meaning of the Bank Holding Company Act of 1956 (the “BHC Act”) and is registered as such with the Board of Governors of the Federal Reserve System (the “Federal Reserve”).
The BHC Act restricts the Corporation’s non-banking activities to those that are determined by the Federal Reserve to be financial in nature, incidental to such financial activity or complementary to a financial activity. The BHC Act does not place territorial restrictions on the activities of non-bank subsidiaries of holding companies. Cadence is subject to limitations with respect to transactions with affiliates.
The BHC Act further requires every holding company to obtain the prior approval of the Federal Reserve before acquiring substantially all the assets of or direct or indirect ownership or control of more than 5% of the voting shares of any bank that is not already majority-owned. The BHC Act also prohibits a holding company, with certain exceptions, from engaging in or acquiring direct or indirect control of more than 5% of the voting shares of any company engaged in non-banking activities. One of the principal exceptions to these prohibitions is for engaging in or acquiring shares of a company engaged in activities found by the Federal Reserve by order or regulation to be closely related to banking or managing banks. The BHC Act permits the acquisition by a holding company of more than 5% of the outstanding voting shares of a bank located outside the state in which the operations of its banking subsidiaries are principally conducted, subject to certain
4
Table of Contents
state laws, including the establishment by states of a minimum age of their local banks before such banks can be acquired by an out-of-state institution. The BHC Act and regulations of the Federal Reserve also prohibit a holding company and its subsidiaries from engaging in certain tie-in arrangements in connection with any extension of credit or provision of any property or services.
In addition, and subject to certain exceptions, the BHC Act and the Change in Bank Control Act require Federal Reserve approval prior to any person or company acquiring “control” of a holding company. Control is conclusively presumed to exist if an individual or company acquires 25% or more of any class of voting securities of a bank holding company. Control is refutably presumed to exist if a person acquires 10% or more, but less than 25%, of any class of voting securities and either the company has registered securities under Section 12 of the Exchange Act or no other person owns a greater percentage of that class of voting securities immediately after the transaction.
A bank holding company may engage in permissible activities including factoring accounts receivable, acquiring and servicing loans, leasing personal property, performing certain data processing services, acting as agent or broker in selling credit life insurance and certain other types of insurance in connection with credit transactions, and conducting certain insurance underwriting activities. The BHC Act does not place territorial limitations on permissible nonbanking activities of bank holding companies. Despite prior approval, the Federal Reserve has the power to order any bank holding company or its subsidiaries to terminate any activity or to terminate its ownership or control of any subsidiary when the Federal Reserve has reasonable grounds to believe that continuation of such activity or such ownership or control constitutes a serious risk to the financial soundness, safety, or stability of any bank subsidiary of the bank holding company. Bank holding companies are required to file with the Federal Reserve an annual report and such other information as may be required. The Federal Reserve also performs examinations of bank holding companies and has the authority to regulate provisions of certain holding company debt.
The BHC Act requires every bank holding company to obtain the prior approval of the Federal Reserve before: (1) it may acquire direct or indirect ownership or control of any voting shares of any bank if, after such acquisition, the bank holding company will directly or indirectly own or control more than 5.0% of the voting shares of the bank; (2) it or any of its subsidiaries, other than a bank, may acquire all or substantially all of the assets of any bank; or (3) it may merge or consolidate with any other bank holding company.
The BHC Act further provides that the Federal Reserve may not approve any transaction that would result in a monopoly or would be in furtherance of any combination or conspiracy to monopolize or attempt to monopolize the business of banking in any section of the United States, or the effect of which may be substantially to lessen competition or to tend to create a monopoly in any section of the country, or that in any other manner would be in restraint of trade, unless the anticompetitive effects of the proposed transaction are clearly outweighed by the public interest in meeting the convenience and needs of the community to be served. The Federal Reserve is also required to consider the financial and managerial resources and future prospects of the bank holding companies and banks concerned and the convenience and needs of the community to be served. Consideration of financial resources generally focuses on capital adequacy, and consideration of convenience and needs issues includes the parties’ performance under the Community Reinvestment Act of 1977 (the “CRA”), both of which are discussed below.
The Gramm-Leach-Bliley Financial Modernization Act of 1999 (the “GLB Act”) also permits securities brokerage firms and insurance companies to own banks and bank holding companies. The GLB Act also seeks to streamline and coordinate functional regulation of banking activities by bank regulators, securities activities by securities regulators, and insurance activities by insurance regulators.
Under the GLB Act, a national bank may engage in expanded financial activities through a “financial subsidiary,” provided the aggregate assets of all of its financial subsidiaries do not exceed the lesser of 45 percent of the bank’s assets or $50 billion. A financial subsidiary may underwrite any financial product other than insurance and may sell any financial product, including title insurance. A national bank itself may not sell title insurance, however, unless the state in which the bank is located permits state banks to sell title insurance.
In accordance with Federal Reserve policy, the Corporation is expected to act as a source of financial strength to its subsidiaries. The Federal Reserve may require a holding company to terminate any activity or relinquish control of a non-bank subsidiary (other than a non-bank subsidiary of a bank) upon the Federal Reserve’s determination that such activity or control constitutes a serious risk to the financial soundness or stability of any subsidiary depository institution of the holding company. Further, federal bank regulatory authorities have additional discretion to require a holding company to divest itself of any bank or non-bank subsidiary if the agency determines that divestiture may aid the depository institution’s financial condition.
FDIC. Cadence is a member of the Federal Deposit Insurance Corporation (“FDIC”), and as such, its deposits are insured by the FDIC to the extent provided by law.
5
Table of Contents
Under the Federal Deposit Insurance Act (“FDIA”), insurance of deposits may be terminated by the FDIC upon a finding that the institution has engaged in unsafe and unsound practices, is in an unsafe or unsound condition to continue operations, or has violated any applicable law, regulation, rule, order, or condition imposed by the FDIC.
The FDIA, as amended by Financial Deposit Insurance Corporation Improvement Act of 1991 (“FDICIA”) and the Riegle Community Development and Regulatory Improvement Act of 1994, requires the federal bank regulatory agencies to prescribe standards, by regulations or guidelines, relating to internal controls, information systems and internal audit systems, loan documentation, credit underwriting, interest rate risk exposure, asset growth, asset quality, earnings, stock valuation and compensation, fees and benefits and such other operational and managerial standards as the agencies deem appropriate. In 1995, the federal bank regulatory agencies adopted guidelines prescribing safety and soundness standards pursuant to FDICIA, as amended. The guidelines establish general standards relating to internal controls and information systems, internal audit systems, loan documentation, credit underwriting, interest rate exposure, asset growth and compensation, fees and benefits. In general, the guidelines require, among other things, appropriate systems and practices to identify and manage the risk and exposures specified in the guidelines. The guidelines prohibit excessive compensation as an unsafe and unsound practice and describe compensation as excessive when the amounts paid are unreasonable or disproportionate to the services performed by an executive officer, employee, director, or principal stockholder. In addition, the agencies adopted regulations that authorize, but do not require, an agency to order an institution that has been given notice by an agency that it is not satisfying any of such safety and soundness standards to submit a compliance plan. If, after being so notified, an institution fails to submit an acceptable compliance plan or fails in any material respect to implement an acceptable compliance plan, the agency must issue an order directing action to correct the deficiency and may issue an order directing other actions of the types to which an undercapitalized institution is subject under the “prompt corrective action” provisions of FDICIA. If an institution fails to comply with such an order, the agency may seek to enforce such order in judicial proceedings and to impose civil money penalties. The federal bank regulatory agencies also proposed guidelines for asset quality and earning standards.
The Omnibus Budget Reconciliation Act of 1993 provides that deposits and certain claims for administrative expenses and employee compensation against an insured depository institution would be afforded a priority over other general unsecured claims against such an institution in the “liquidation or other resolution” of such an institution by any receiver.
OCC. Dividends paid by the Corporation are substantially provided from dividends from Cadence. Generally, the approval of the Office of the Comptroller of the Currency (the “OCC”) is required if the total of all dividends declared by a bank in any calendar year exceeds the total of its net profits for that year combined with its retained net profits of the preceding two years. For 2010, without approval from the OCC, Cadence does not have the ability to pay dividends to the Corporation. In May 2009, the Corporation’s Board of Directors voted to suspend paying cash dividends on common stock until further notice.
The OCC is the primary supervisory authority for Cadence. The OCC regulates or monitors virtually all areas of operations, including security devices and procedures, adequacy of capitalization and loss reserves, loans, investments, borrowings, deposits, mergers, issuance of securities, payment of dividends, interest rates payable on deposits, interest rates or fees chargeable on loans, establishment of branches, corporate reorganizations, maintenance of books and records, and adequacy of staff training to carry on safe lending and deposit gathering practices. The OCC also imposes limitations on the aggregate investment by a national bank in real estate, bank premises, and furniture and fixtures. In addition to regular examinations, each national bank must furnish to its regulator quarterly reports containing a full and accurate statement of its affairs.
Capital and Operational Requirements. The Federal Reserve, FDIC and OCC have established risk-based capital guidelines for holding companies, such as the Corporation, and for the subsidiary banks of holding companies, such as Cadence. The capital-based regulatory framework contains five categories of compliance with regulatory capital requirements, including “well capitalized,” “adequately capitalized,” “undercapitalized,” “significantly undercapitalized,” and “critically undercapitalized.” However, a bank’s primary regulator has the ability to impose higher ratios if the regulator believes the bank’s risk profile is higher than it considers appropriate.
The FDIC, OCC and Federal Reserve have historically had common capital adequacy guidelines involving minimum leverage capital and risk-based capital requirements. The leverage capital requirement establishes a minimum ratio of capital as a percentage of total assets. The FDIC, OCC and Federal Reserve require institutions to maintain a minimum leverage ratio of Tier 1 capital to total average assets based on the institution’s rating under the international bank rating system, commonly referred to as the “CAMELS” rating system. “CAMELS” is an acronym for “Capital Adequacy, Asset Quality, Management Quality, Earnings, Liquidity and Sensitivity to Market Risk.” Institutions with a CAMELS rating of 1 that are not anticipating or experiencing significant growth and have well-diversified risk are required to maintain a minimum leverage ratio of 3 percent. An additional 100 to 200 basis points are required for all but these most highly rated institutions.
The risk-based capital requirement also establishes a minimum ratio of capital as a percentage of total assets, but gives weight to the relative risk of each asset. The FDIC, OCC and Federal Reserve require institutions to maintain a minimum ratio of Tier 1 capital to risk-weighted assets of 4 percent. Banks must also maintain a minimum ratio of total capital to risk-weighted assets of 8 percent.
6
Table of Contents
As part of an agreement entered into with the OCC in April 2009, Cadence was required to achieve by September 30, 2009, and maintain on an ongoing basis, a Tier 1 leverage ratio of 8.0% and a total risk-based capital ratio of 12.0%. As of December 31, 2009, Cadence had a Tier 1 leverage ratio of 6.0% and a total risk-based capital ratio of 10.2% and, therefore, was not in compliance with the OCC’s mandated capital ratios and may be subject to further enforcement action by the OCC.
Refer to “Item 1A - Risk Factors,” for discussion of the Corporation’s risks relating to Cadence’s formal agreement with the OCC.
Other Banking Regulations. Banks are subject to the provisions of Sections 23A and 23B of the Federal Reserve Act. Section 23A places limits on the amount of loans or extensions of credit to, investments in, or certain other transactions with affiliates and on the amount of advances to third parties collateralized by the securities or obligations of affiliates. Section 23B, among other things, prohibits an institution from engaging in certain transactions with affiliates unless the transactions are on terms substantially the same, or at least as favorable to the institution, as those prevailing at the time for comparable transactions with non-affiliated companies.
Cadence is subject to certain restrictions on extensions of credit to executive officers, directors, certain principal shareholders and their related interests. Such extensions of credit (i) must be made on substantially the same terms, including interest rates and collateral, as those prevailing at the time for comparable transactions with third parties, and (ii) must not involve more than the normal risk of repayment or present other unfavorable features.
National banks, like Cadence, are required by the National Bank Act to adhere to branch office banking laws of the states in which they operate. Furthermore, federal legislation permits interstate branching. The law also permits out of state acquisitions by bank holding companies (subject to veto by state law), interstate branching by banks if allowed by state law, interstate merging by banks, and de novo branching by national banks if allowed by state law. Effective June 1, 1997, the Interstate Banking Act allows banks with different home states to merge, unless a particular state opts out of the statute. The Interstate Banking Act also permits national and state banks to establish de novo branches in another state if the state law applies equally to all banks and expressly permits all out-of-state banks to establish de novo branches.
The CRA requires that, in connection with examinations of financial institutions within their respective jurisdictions, the Federal Reserve, the FDIC or the OCC shall evaluate the record of the financial institutions in meeting the credit needs of their local communities, including low and moderate income neighborhoods, consistent with the safe and sound operation of those institutions. These factors are also considered in evaluating mergers, acquisitions and applications to open a branch or facility.
Interest and certain other charges collected or contracted by banks are often subject to state usury laws and certain federal laws concerning interest rates. The loan operations are also subject to certain federal laws applicable to credit transactions. These include but are not limited to: (i) the federal Truth-In-Lending Act, governing disclosures of credit terms to consumer borrowers; (ii) the Home Mortgage Disclosure Act of 1975, requiring financial institutions to provide information to enable the public and public officials to determine whether a financial institution will be fulfilling its obligation to help meet the housing needs of the community it serves; (iii) the Equal Credit Opportunity Act, prohibiting discrimination on the basis of race, creed or other prohibited factors in extending credit; and (iv) the rules and regulations of the various federal agencies charged with the responsibility of implementing such federal laws. The deposit operations also are subject to certain laws and regulations, including but not limited to, the Right to Financial Privacy Act, which imposes a duty to maintain confidentiality of consumer financial records and prescribes procedures for complying with administrative subpoenas of financial records, and the Electronic Funds Transfer Act and Regulation E issued by the Federal Reserve to implement that act, which governs automatic deposits to and withdrawals from deposit accounts and customers’ rights and liabilities arising from the use of automated teller machines and other electronic banking services.
CNIC and Insurance are subject to a variety of regulations by applicable state agencies. These agencies set reserve requirements and reporting standards and establish regulations, all of which affect business operations.
In 2001, the Uniting and Strengthening America by Providing Appropriate Tools Required to Intercept and Obstruct Terrorism Act of 2001 (the “USA Patriot Act”) was signed into law. The USA Patriot Act broadened anti-money laundering requirements on financial institutions, including national banks such as Cadence. Among its provisions, the USA Patriot Act requires a financial institution: (i) to establish an anti-money laundering program; (ii) to establish due diligence policies, procedures and controls with respect to its private banking accounts and correspondent banking accounts involving foreign individuals and certain foreign banks; and (iii) to avoid establishing, maintaining, administering or managing correspondent accounts in the United States for, or on behalf of, a foreign bank that does not have a physical presence in any country. In addition, the USA Patriot Act contains a provision encouraging cooperation among financial institutions, regulatory authorities and law enforcement authorities with respect to individuals, entities and organizations engaged in, or reasonably suspected of engaging in, terrorist acts or money laundering activities.
7
Table of Contents
Public Company Regulations. The Corporation’s common stock is registered with the Securities and Exchange Commission (“SEC”) under the Exchange Act. Consequently, the Corporation is subject to the information, proxy solicitation, insider trading and other restrictions and requirements of the SEC under the Exchange Act.
The Corporation’s common stock is traded on The NASDAQ Global Select Market (“NASDAQ”) and is subject to the rules and by-laws of NASDAQ. Penalties for violations of the rules can result in fines for the Corporation and in certain cases the suspension of trading in the Corporation’s common stock or delisting.
In 2002, the Sarbanes-Oxley Act of 2002 (the “Sarbanes-Oxley Act”) was signed into law. The Sarbanes-Oxley Act attempts to strengthen the independence of public company auditors by, among other things, (i) prohibiting public company auditors from providing certain non-audit services to their audit clients, (ii) requiring a company’s audit committee to pre-approve all audit and non-audit services being provided by its independent auditor, (iii) requiring the rotation of audit partners and (iv) prohibiting an auditor from auditing a client that has as its chief executive officer, chief financial officer, chief accounting officer or controller a person that was employed by the auditor during the previous year.
The Sarbanes-Oxley Act also seeks to enhance the responsibility of corporate management by, among other things, (i) requiring the chief executive officer and chief financial officer of public companies to provide certain certifications in their companies’ periodic reports regarding the accuracy of the periodic reports filed with the SEC, (ii) prohibiting officers and directors of public companies from fraudulently influencing an accountant engaged in the audit of the company’s financial statements, (iii) requiring chief executive officers and chief financial officers to forfeit certain bonuses in the event of a misstatement of financial results, (iv) prohibiting officers and directors found to be unfit from serving in a similar capacity with other public companies and (v) prohibiting officers and directors from trading in the company’s equity securities during pension blackout periods. In addition, public companies with securities listed on a national securities exchange or association must satisfy the following additional requirements: (i) the company’s audit committee must appoint and oversee the company’s auditors; (ii) each member of the company’s audit committee must be independent; (iii) the company’s audit committee must establish procedures for receiving complaints regarding accounting, internal accounting controls and audit-related matters; (iv) the company’s audit committee must have the authority to engage independent advisors; and (v) the company must provide appropriate funding to its audit committee, as determined by the audit committee.
The Sarbanes-Oxley Act contains several provisions intended to enhance the quality of financial disclosures of public companies, including provisions that (i) require that financial disclosures reflect all material correcting adjustments identified by the company’s auditors, (ii) require the disclosure of all material off-balance sheet transactions, (iii) require the reconciliation by public companies of pro forma financial information to financial statements prepared in accordance with generally accepted accounting principles, (iv) with certain limited exceptions, including an exception for financial institutions making loans in compliance with federal banking regulations, prohibit a public company from making personal loans to its officers and directors, (v) with certain limited exceptions, require directors, officers and principal shareholders of public companies to report a change in their ownership in the company’s securities within two business days of the change, (vi) require a company’s management to provide a report of management’s assessment of the internal controls of the company in the company’s annual report and requires an opinion from the company’s independent auditors on the effectiveness of the company’s internal control over financial reporting, (vii) require public companies to adopt codes of conduct and ethics for senior executive officers and (viii) require a public company to disclose whether the company’s audit committee has a financial expert as a member.
The Sarbanes-Oxley Act imposes criminal liability for certain acts, including altering documents involving federal investigations, bankruptcy proceedings, and corporate audits and the act increases the penalties for certain offenses, including mail and wire fraud. In addition, the Sarbanes-Oxley Act gives added protection to corporate whistle-blowers.
Recent Regulatory Developments. In response to the worsening financial and economic conditions in late 2008, the Emergency Economic Stabilization Act of 2008 (the “Emergency Economic Stabilization Act”) was signed into law. Among other things the Emergency Economic Stabilization Act granted the U.S. Treasury the power, under a program called the Troubled Asset Relief Program (“TARP”), to purchase assets and equity from financial institutions in order to strengthen their financial position and the economy as a whole. Part of TARP included the Capital Purchase Program (“CPP”) where the U.S. Treasury could purchase preferred stock and equity warrants from qualifying institutions in exchange for direct capital infusion.
On January 9, 2009, the Corporation completed the sale of $44 million of non-voting preferred stock to the U. S. Treasury under the CPP. These senior preferred shares pay a cumulative annual dividend at a 5% rate for the first five years and will reset to a rate of 9% after five years if not redeemed by the Corporation prior to that time. In connection with the issuance of the senior preferred shares, the Corporation also issued to the U. S. Treasury a warrant to purchase the Corporation’s common stock up to a maximum of 15% of the senior preferred amount, or $6.6 million.
Institutions participating in CPP, like us, must comply with certain restrictions under the terms of the program. For so long as any preferred stock issued under the CPP remains outstanding, we are prohibited from increasing dividends on our common stock. We are also prohibited from making certain repurchases of equity securities, including our common stock, without the U.S. Treasury’s prior consent until the third anniversary of the U.S. Treasury’s investment or until the U.S. Treasury has transferred all of the preferred stock it purchased under the CPP to third parties.
8
Table of Contents
Additional restrictions were placed on us under the American Recovery and Reinvestment Act of 2009 (the “ARRA”). Under the ARRA, institutions participating in TARP are restricted in their ability to pay bonuses and so-called “golden parachutes” to senior executives and certain other employees. ARRA also requires greater participation of shareholders in executive pay decisions. On June 10, 2009, the U.S. Treasury released an interim final rule (the “IFR”), effective June 15, 2009, that provided guidance on the compensation and governance standards for TARP recipients, and promulgated regulations to implement the restrictions and standards set forth in Section 7001 of the ARRA. Among other things, the IFR and the ARRA significantly expanded the executive compensation restrictions previously imposed by the Emergency Economic Stabilization Act. Such restrictions apply to any entity that has received or will receive financial assistance under TARP, and shall generally continue to apply for as long as any obligation arising from financial assistance provided under TARP, including preferred stock issued under the CPP, remains outstanding. These ARRA restrictions shall not apply to any TARP recipient during such time when the federal government (i) only holds any warrants to purchase common stock of such recipient or (ii) does not hold any preferred stock or warrants to purchase common stock of such recipient. On December 7, 2009, the U.S. Treasury published technical amendments to the IFR. As a result of our participation in the CPP, the restrictions and standards set forth in Section 7001 of the ARRA, as well as the IFR promulgated by the U.S. Treasury apply to us.
Future Legislation. Changes to the laws of the states in which the Corporation and its subsidiaries do business could affect the operating environment of bank holding companies and their subsidiaries in substantial and unpredictable ways. Moreover, in light of recent events and current conditions in the U. S. financial markets and economy, Congress and regulators have continued to increase their focus on the regulation of the financial services industry. The Corporation cannot accurately predict whether legislative changes will occur or, if they occur, the ultimate effect they would have upon the financial condition or results of operations of the Corporation.
Governmental Monetary Policies
As a bank chartered under the laws of the United States, Cadence is a member of the Federal Reserve System. Its earnings are affected by the fiscal and monetary policies of the Federal Reserve System, which regulates the national money supply in order to mitigate recessionary and inflationary pressures. The techniques used by the Federal Reserve System include setting the reserve requirements of depository institutions and establishing the discount rate on member bank borrowings. The Federal Reserve System also conducts open market operations in United States government securities. Refer to “Item 1A - Risk Factors,” for a discussion of the Corporation’s risks relating to governmental monetary policies.
Sources and Availability of Funds
The materials essential to the business of the Corporation and its subsidiaries consist primarily of funds derived from deposits and other borrowings in the financial markets. The availability of funds is primarily dependent upon the economic policies of the government, the economy in general and the institution’s ability to compete in its markets. Refer to “Item 1A - Risk Factors,” for discussion of the Corporation’s risks relating to governmental monetary policy, economic conditions, and competition.
Seasonality
Neither the Corporation nor any of its subsidiaries are engaged in a business that is seasonal in nature.
Dependence Upon A Single Customer
Neither the Corporation nor any of its subsidiaries are dependent upon a single customer or any small group of customers.
Available Information
The Corporation maintains an Internet address at www.cadencebanking.com. The Corporation makes available, free of charge on or through its Internet website, access to the Corporation’s annual report on Form 10-K, quarterly reports on Form 10-Q and current reports on Form 8-K, and all amendments thereto filed pursuant to Section 13(a) of the Exchange Act. These documents are made available on the Corporation’s website as soon as reasonably practicable after such material is filed with or furnished to the SEC. The Corporation is not incorporating the information on that website into this report, and the website and the information appearing on the website are not included in, and are not a part of, this report.
You may also request a copy of these filings, at no cost, by writing or telephoning the Corporation at the following address:
ATTENTION: Mr. Richard T. Haston
Cadence Financial Corporation
301 East Main Street
P.O. Box 1187
Starkville, MS 39759
(662) 323-1341
9
Table of Contents
Additionally, the public may read and copy any materials the Corporation files with the SEC at the SEC’s Public Reference Room at 100 F Street, NE, Washington, DC 20549. The public may obtain information on the operation of the Public Reference Room by calling the SEC at 1-800-SEC-6330. Additionally, the SEC maintains an Internet site that contains reports, proxy and information statements, and other information regarding issuers that file electronically with the SEC. The Internet address of such site is http://www.sec.gov.
Personnel
At December 31, 2009, Cadence had 428 full-time employees. The Corporation, Service, Insurance and CNIC had no employees at December 31, 2009.
Executive Officers of the Registrant
The executive officers of the Corporation and a brief description of their principal employment during the last five years are listed below:
| Name and Title |
Age | Five-Year Experience | ||
| L. F. Mallory, Jr. Chairman and Chief Executive Officer, Cadence Financial Corporation and Cadence |
67 | Chairman and Chief Executive Officer, Cadence Financial Corporation and Cadence, since 1993 | ||
| Mark A. Abernathy President and Chief Operating Officer and Chairman of Executive Committee, Cadence Financial Corporation and Cadence |
53 | President and Chief Operating Officer, Cadence Financial Corporation and Cadence, since 1997; Chairman of Executive Committee, Cadence Financial Corporation and Cadence, since 2006 | ||
| Richard T. Haston Executive Vice President, Chief Financial Officer, Secretary and Treasurer, Cadence Financial Corporation; Executive Vice President, Chief Financial Officer, and Secretary, Cadence |
63 | Executive Vice President, Chief Financial Officer, Secretary and Treasurer, Cadence Financial Corporation, since May 2008; Executive Vice President, Chief Financial Officer, and Assistant Secretary, Cadence Financial Corporation, from July 2005 - May 2008; Executive Vice President, Chief Financial Officer, Treasurer, and Assistant Secretary, Cadence Financial Corporation, from January 1997 - July 2005; Executive Vice President, Chief Financial Officer, and Secretary, Cadence, since May 2008; Executive Vice President and Chief Financial Officer, Cadence, from 1996 - May 2008 | ||
| John R. Davis Vice President, Cadence Financial Corporation; Executive Vice President and Manager of Consumer Financial Services, Cadence |
54 | Vice President, Cadence Financial Corporation, since January 1999; Executive Vice President and Manager of Consumer Financial Services, Cadence, since December 2005; Senior Vice President and Trust Officer, Cadence, from January 1999 - December 2005 | ||
Officers of the Corporation are elected annually by the Board of Directors at its January meeting and serve at the discretion of the Board of Directors.
There are many risks and uncertainties related to the Corporation’s business that may adversely affect our business operations. Additional risks and uncertainties not presently known to us or that we currently deem immaterial also may adversely affect our business operations. Any of the following risks could negatively impact our business, results of operations and financial condition. The risks discussed below also include forward-looking statements, and actual results may differ materially from those discussed. See “Forward-Looking Statements” above.
The current economic environment poses significant challenges for us and our industry and could adversely affect our financial condition and results of operations.
We are operating in a challenging and uncertain economic environment, including generally uncertain national and local conditions. Financial institutions like us continue to be affected by sharp declines in the real estate market and constrained financial markets. Dramatic declines in the housing market over the past year, including falling home prices and increasing
10
Table of Contents
delinquencies, foreclosures and unemployment, have resulted in significant write-downs of asset values by many financial institutions, including us. Concerns over the stability of the financial markets and the economy and the need to protect capital have resulted in decreased lending by financial institutions to their clients and to each other. This market turmoil and tightening of credit has led to increased commercial and consumer deficiencies, lack of consumer confidence, increased market volatility and widespread reduction in general business activity. The resulting economic pressure on consumers and businesses and the lack of confidence in the financial markets may adversely affect our business, financial condition and results of operations.
Continued economic uncertainty, declines in real estate values, constrained financial markets, housing market decline and financial stress on borrowers as a result of the uncertain economic environment could continue to have an adverse effect on our borrowers or their clients, adversely affecting our financial condition and results of operations. We cannot predict when economic conditions are likely to improve. We may also face additional risks in connection with the current economic environment, including the following:
| • | Economic conditions that negatively affect housing prices and the job market have caused, and may continue to cause, the credit quality of our loan portfolios to deteriorate, and that deterioration in credit quality has had, and could continue to have, a negative effect on our business and results of operations. |
| • | Market developments may affect consumer confidence levels and may cause adverse changes in payment patterns, causing increases in delinquencies and default rates on loans and other credit facilities. |
| • | The value of our securities portfolio may decline. |
| • | We face increased regulation of our industry, and compliance with that regulation has increased our costs and increased compliance challenges and may continue to do so. |
As these conditions or similar ones continue to exist or worsen, we could experience continuing or increased adverse effects on our financial condition and results of operations.
We are heavily regulated, and that regulation could limit or restrict our activities and adversely affect our earnings.
We operate in a highly regulated industry and are subject to examination, supervision, and comprehensive regulation by various federal and state agencies, including the OCC, the Federal Reserve, the FDIC, and to a limited degree, the regulators in the states in which our branches are located. Our compliance with these regulations is costly and may restrict some of our activities, including payment of dividends, mergers and acquisitions, investments, loans and interest rates and locations of offices. As further discussed below, we are also subject to capitalization guidelines established by our regulators, which require us to maintain certain levels of capital to support our business.
In light of current conditions in the global financial markets and the global economy, regulators have increased their focus on the regulation of the financial services industry. In recent months, the U.S. financial regulators responding to directives of the Obama Administration and Congress have intervened on an unprecedented scale. New legislative proposals continue to be introduced in the U.S. Congress that could further substantially increase regulation of the financial services industry and impose restrictions on the operations and general ability of firms within the industry to conduct business consistent with historical practices, including with respect to compensation, interest rates and the effect of bankruptcy proceedings on consumer real property mortgages. Further, federal and state regulatory agencies may adopt changes to their regulations and/or change the manner in which existing regulations are applied. We cannot predict the substance or effect of pending or future legislation or regulation or the application of laws and regulation to us. Compliance with current and potential regulation and scrutiny may significantly increase our costs, impede the efficiency of our internal business processes, require us to increase our regulatory capital and limit our ability to pursue business opportunities in an efficient manner by requiring us to expend significant time, effort and resources to ensure compliance. Additionally, evolving regulations concerning executive compensation may impose limitations on us that affect our ability to compete successfully for executive and management talent.
On June 17, 2009, the Obama Administration proposed a white paper, “Financial Regulatory Reform—A New Foundation: Rebuilding Financial Supervision and Regulation,” that provides recommendations for overhauling the nation’s financial regulatory system in the wake of the global financial crisis. The plan urges Congress and regulators to adopt sweeping changes to financial sector regulation and oversight, dramatically increasing the federal government’s role in nearly every aspect of the financial markets. The administration proposes both new substantive authorities and practices in government regulation and supervision, and a restructuring of the regulatory system, including the creation of new federal agencies, offices and councils. If this proposal or some other similar proposal is adopted, it may result in additional restrictions, oversight or costs that may have an adverse effect on our business, results of operations or the price of our common stock.
11
Table of Contents
In addition, given the current economic and financial environment, our regulators may elect to alter standards or the interpretation of the standards used to measure regulatory compliance or to determine the adequacy of liquidity, certain risk management or other operational practices for financial services companies in a manner that impacts our ability to implement our strategy and could affect us in substantial and unpredictable ways and could have an adverse effect on our business, financial condition and results of operations. Furthermore, the regulatory agencies have extremely broad discretion in their interpretation of the regulations and laws and their interpretation of the quality of our loan portfolio, securities portfolio and other assets. If any regulatory agency’s assessment of the quality of our assets differs from our assessment, we may be required to take additional charges that would have the effect of materially reducing our earnings, capital ratios and stock price.
We have entered into a formal written agreement with the OCC that requires us to take specified actions.
The OCC, Cadence’s primary governmental regulator, reviews us annually. In this examination, the OCC reviews our business, including credit and other risks, accounting issues, operational matters, internal controls and management systems. Those reviews have required us to enhance our operational, risk management and internal control practices, planning processes, procedures and policies.
Following our most recent OCC review, we entered into an agreement with the OCC on April 17, 2009. In this agreement, we committed to enhance Cadence’s existing practices and procedures in several areas, including the following: strategic planning, credit risk management, other real estate owned, criticized assets, internal loan review, internal audit, commercial real estate concentration risk management, brokered deposits, and financial subsidiaries. As a result of entering into a written agreement with the OCC, we are deemed to be in a “troubled condition” under applicable banking laws. Consequently, we will not be eligible for expedited processing of branch applications and other regulatory approvals, and we will be required to obtain OCC or FDIC approval before making severance payments to departing executives and adding new directors or senior executives. Cadence’s regulators have considerable discretion in whether to grant required approvals, and we may not be able to obtain approvals if requested.
As of September 30, 2009, and December 31, 2009, in connection with such agreement, we did not meet certain capital ratios that were imposed upon Cadence by the OCC, although management believes we complied in all other material respects with such agreement. As a result of not meeting such capital ratios, the OCC has broad authority to take additional adverse actions against both the Corporation and Cadence. For more information see – “We are required to maintain high capital levels” below.
We are required to maintain high capital levels.
As previously disclosed, the OCC has required Cadence to achieve as of September 30, 2009, and maintain on an ongoing basis, a Tier 1 leverage ratio of 8.0% and a total risk-based capital ratio of 12.0%. These capital ratios are higher than the regulatory capital ratios required to meet “well-capitalized” standards in a stable economy. As of September 30, 2009, and December 31, 2009, Cadence had a Tier 1 leverage ratio of 5.9% and 6.0%, respectively, and a total risk-based capital ratio of 10.1% and 10.2%, respectively, and, therefore, was not in compliance with the OCC’s mandated capital ratios. Because Cadence is not in compliance with the written agreement with the OCC, the OCC has available a broad range of adverse actions, including imposing a consent order and taking control of Cadence. Management has been taking action and implementing programs to comply with the requirements of the OCC and believes that it has complied in all material respects with the agreement with the OCC with the exception of such ratios. The OCC may determine, however, in its sole discretion, to take additional enforcement action as discussed above, any of which could further limit the Corporation’s and Cadence’s businesses and negatively affect their ability to implement their business plan, the Corporation’s ability to pay dividends on its common stock and preferred stock, the value of the Corporation’s common stock and preferred stock, and the financial condition and results of operations of both the Corporation and Cadence.
Our loan portfolio is highly concentrated in commercial real estate in certain geographic areas.
Commercial real estate and farm loans totaled $612.7 million as of December 31, 2009. Additionally, construction and development loans totaled $166.2 million as of December 31, 2009. Our construction and development loan portfolio includes residential and non-residential construction and development loans. Our residential construction and development portfolio consists mainly of loans for the construction, development, and improvement of residential lots, homes, and subdivisions. Our non-residential construction and development portfolio consists mainly of loans for the construction and development of office buildings, hotels, and other non-residential commercial properties. Our commercial real estate and farm loan portfolio consists primarily of loans secured by office buildings, retail centers, warehouses, farm land and other commercial properties located primarily in our Mississippi, Memphis, Florida, Tuscaloosa, and Nashville market areas. The regional economic conditions in areas in which we conduct our business have an impact on the demand for our products and services as well as the ability of our customers to repay loans, the value of the collateral securing loans and the stability of our deposit funding sources.
12
Table of Contents
Commercial real estate loans are typically larger than residential real estate loans and consumer loans and depend on sales, in the case of construction and development loans, and cash flows, in the case of other commercial real estate loans, from the property to service the debt. Sales and cash flows have been and may continue to be adversely affected by general economic conditions, and a further deterioration in the markets where our collateral is located could increase the likelihood of default. Because our loan portfolio contains a significant number of commercial real estate loans with relatively large balances, the deterioration of a few of these loans has caused and could continue to cause increases in our non-performing loan balances. An increase in non-performing loans could result in a loss of earnings from these loans, an increase in the provision for loan losses and an increase in charge-offs, all of which could have a material adverse effect on our financial condition and results of operations.
The level of our commercial real estate loan portfolio has subjected us to additional regulatory scrutiny.
The concentration of residential construction and development in our commercial real estate loan portfolio is a primary factor that led to our agreement with the OCC. The FDIC, the Federal Reserve and the OCC have promulgated joint guidance on sound risk management practices for financial institutions like Cadence with concentrations in commercial real estate lending. Under the guidance, management should employ heightened risk management practices including board and management oversight and strategic planning, enhancement of underwriting standards, risk assessment and monitoring through market analysis and stress testing. While we believe we have implemented and are continuing to implement policies and procedures with respect to our commercial real estate loan portfolio consistent with this guidance and with the requirements of the OCC agreement, the OCC could require us to implement additional policies and procedures consistent with their interpretation of the guidance that could result in additional costs to us or restrict our business in a manner that could have a material adverse effect on our results of operations.
Our allowance for loan losses may not be adequate to cover actual losses.
If our allowance for loan losses is not sufficient to cover actual loan losses, our earnings could decrease. Management maintains an allowance for loan losses based upon, among other things:
| • | historical experience; |
| • | repayment capacity of borrowers; |
| • | an evaluation of local, regional and national economic conditions; |
| • | regular reviews of delinquencies and loan portfolio quality; |
| • | collateral evaluations; |
| • | current trends regarding the volume and severity of problem loans; |
| • | the existence and effect of concentrations of credit; |
| • | results of regulatory examinations; and |
| • | from time to time, the advice of consultants. |
Based on those factors, management makes various assumptions and judgments about the ultimate collectibility of the respective loan portfolios. The determination of the appropriate level of the allowance for loan losses inherently involves a high degree of subjectivity and requires management to make significant estimates of current credit risks and future trends, all of which may undergo material changes. In addition, our Board of Directors and the OCC periodically review our allowance for loan losses and may require an increase in the provision for possible loan losses or the recognition of further loan charge-offs. The OCC judgments may differ from those of our management. The amount of future loan losses is susceptible to changes in economic, operating and other conditions, which may be beyond our control, including changes in interest rates, and these losses may exceed current estimates. Federal regulatory agencies, as an integral part of their examination process, review our loans and allowance for loan losses. There can be no assurance that we will not need to increase our allowance for loan losses or that regulators will not require an increase in our allowance. Either of these occurrences could materially and adversely affect our financial condition and results of operations.
13
Table of Contents
We are subject to restrictions on executive compensation as a result of our participation in the CPP.
Under the terms of the CPP, the U.S. Treasury has imposed specified standards for executive compensation and corporate governance for the period during which the U.S. Treasury holds any equity or warrants issued pursuant to the CPP. These standards generally apply to our chief executive officer, chief financial officer, chief operating officer, and the two next most highly compensated senior executive officers. The standards include:
| • | ensuring that incentive compensation for senior executives does not encourage unnecessary and excessive risks that threaten our value; |
| • | required clawback of any bonus or incentive compensation paid to a senior executive based on statements of earnings, gains or other criteria that are later proven to be materially inaccurate; |
| • | prohibition on making golden parachute payments to senior executives; and |
| • | an agreement not to deduct for tax purposes executive compensation in excess of $500,000 for each senior executive. |
Under the ARRA, further compensation restrictions, including significant limitations on incentive compensation, have been imposed on our senior executive officers and most highly compensated employees. Those restrictions, and any future restrictions on executive compensation that may be adopted, could adversely affect our ability to hire and retain senior executive officers.
Competition in the banking industry is intense and may adversely affect our profitability.
The banking business is highly competitive, and we experience competition from many other financial institutions in our markets. We compete with commercial banks, credit unions, savings and loan associations, mortgage banking firms, consumer finance companies, securities brokerage firms, insurance companies, money market funds, and other mutual funds, as well as other regional, super-regional, national and international financial institutions that operate offices in our markets and elsewhere. Moreover, this highly competitive industry could become even more competitive as a result of legislative, regulatory and technological changes and continued consolidation. Many of our competitors have fewer regulatory constraints, and some have lower cost structures. In recent years, competition has intensified as a result of consolidation efforts. During 2009, competition continued to intensify as the challenges of the liquidity crises and market disruption led to further redistribution of deposits and certain banking assets to stronger and larger financial institutions. We expect this trend to continue. The competitive landscape was also affected by the conversion of traditional investment banks to bank holding companies during the liquidity crises due to the access it provides to government-sponsored sources of liquidity.
We compete with these institutions both in attracting deposits and in making loans. Price competition for loans might result in us originating fewer loans, or earning less on our loans, and price competition for deposits might result in a decrease in our total deposits or higher rates on our deposits. We have to attract our client base from other existing financial institutions and from new residents. Many of our competitors are well-established, larger financial institutions. We may face a competitive disadvantage as a result of our smaller size and inability to spread our marketing costs across a broader market. Our ability to compete successfully depends on a number of factors, including, among other things, concentrating our marketing efforts in our communities with local advertisements, personal contacts, and greater flexibility and responsiveness in working with local clients. Failure to perform in any of these areas could significantly weaken our competitive position, which could adversely affect our growth and profitability, which could materially and adversely affect our financial condition and results of operations.
Operating results may require us to raise additional capital, but that capital may not be available or may be dilutive.
As part of an agreement entered into with the OCC in April 2009, Cadence was required to achieve by September 30, 2009, and maintain on an ongoing basis, a Tier 1 leverage ratio of 8.0% and a total risk-based capital ratio of 12.0%. As of December 31, 2009, Cadence had a Tier 1 leverage ratio of 6.0% and a total risk-based capital ratio of 10.2%. As a result of our 2009 losses and Cadence’s requirement for additional capital to meet these higher ratios, we have a need to raise additional capital. We are currently seeking to raise this capital through all available sources, including public or private equity offerings. Our ability to raise capital will depend on conditions in the capital markets, which are outside of our control, and on our financial performance. Accordingly, we cannot be assured of our ability to raise capital when needed or on favorable terms. If we cannot raise additional capital when needed, we could be subject to increased regulatory supervision and the imposition of restrictions on our growth and business. Any additional capital that we generate in the future, whether through exchange offers, underwritten offerings of common stock, or other public or private transactions, would be dilutive to our common shareholders and may reduce the market price of our common stock. Our inability to raise capital could materially and adversely affect our business, financial condition, or results of operations.
14
Table of Contents
Liquidity needs could adversely affect our results of operations and financial condition.
Cadence’s primary sources of funds are client deposits, maturing or called securities and loan repayments. While scheduled loan repayments are a relatively stable source of funds, they are subject to the ability of borrowers to repay the loans. The ability of borrowers to repay loans can be adversely affected by a number of factors outside of our control, including changes in economic conditions, adverse trends or events affecting business industry groups, reductions in real estate values or markets, business closings or lay-offs, inclement weather, natural disasters and international instability. Additionally, deposit levels may be affected by a number of factors, including rates paid by competitors, general interest rate levels, returns available to clients on alternative investments, financial condition or regulatory status of Cadence, actions by the OCC and general economic conditions. Accordingly, we may be required from time to time to rely on secondary sources of liquidity to meet withdrawal demands or otherwise fund operations. Those sources may include Federal Home Loan Bank (“FHLB”) advances, federal funds lines of credit from correspondent banks, and the Federal Reserve discount window.
Our financial flexibility will be constrained if we continue to incur losses and are unable to maintain our access to funding or if adequate financing is not available at acceptable interest rates. We may seek additional debt in the future. Additional borrowings, if sought, may not be available to us or, if available, may not be available on reasonable terms. If additional financing sources are unavailable, or are not available on reasonable terms, our financial condition, results of operations, growth and future prospects could be materially adversely affected. Finally, if we are required to rely more heavily on more expensive funding sources to support future growth, our revenues may not increase proportionately to cover our costs. In addition, we may be required to slow or discontinue capital expenditures or make other investments or liquidate assets should those sources not be adequate. Until Cadence maintains a Tier 1 leverage ratio of 8.0% and a total risk-based capital ratio of 12% established by the OCC, Cadence is expecting to continue to reduce its loan portfolio and the interest income related thereto.
The preferred stock sold to the U. S. Treasury may impact net income available to our common shareholders, and the warrant may be dilutive to our common shareholders.
On January 9, 2009, we completed the sale of $44 million of non-voting preferred stock to the U. S. Treasury under the CPP. These senior preferred shares pay a cumulative annual dividend at a 5% rate for the first five years and will reset to a rate of 9% after five years if not redeemed by us prior to that time. In connection with the issuance of the senior preferred shares, we also issued to the U. S. Treasury a warrant to purchase our common stock up to a maximum of 15% of the senior preferred amount, or $6.6 million. Such capital has increased our equity and the number of dilutive outstanding common shares. In addition, the dividends declared and the accretion of discount on the senior preferred shares reduces the net income available to our common shareholders and earnings per common share. The senior preferred shares will also receive preferential treatment in the event of our liquidation, dissolution or winding up. Additionally, the ownership interest of our existing common shareholders will be diluted to the extent the warrant we issued to the U. S. Treasury is exercised.
We may not be permitted to repurchase the U. S. Treasury’s CPP investment if and when we request approval to do so.
While it is our plan to repurchase the securities sold to the U. S. Treasury, in whole or in part, as soon as is practicable, we must establish to our regulators’ satisfaction that we have satisfied all of the conditions to repurchase and must obtain the approval of the Federal Reserve and the U. S. Treasury. There can be no assurance that we will be able to repurchase the U. S. Treasury’s investment in our non-voting preferred stock. In addition to limiting our ability to return capital to our shareholders, the U. S. Treasury’s investment could limit our ability to retain key executives and other key employees, and limit our ability to develop business opportunities.
If we are unable to repurchase the U. S. Treasury’s investment after five years, the cost of this capital will increase substantially.
If we are unable to redeem the senior preferred shares sold to the U. S. Treasury prior to January 9, 2014, the cost of this capital will increase substantially on that date, from 5.0% per annum to 9.0% per annum. Depending on our financial condition at the time, this increase in the annual dividend rate on the senior preferred shares could have a material negative effect on our liquidity.
We face litigation and legal liability risks.
We have been named, from time to time, as a defendant in various legal actions, including arbitrations and other litigation arising in connection with our activities. Threatened legal actions could include claims for substantial compensatory and/or punitive damages or claims for indeterminate amounts of damages. We are also subject to risk from potential employee misconduct, including non-compliance with policies and improper use or disclosure of confidential information. We maintain reserves for certain claims if deemed appropriate based upon our assessment of the claims. Whether any particular claims and legal actions are founded or unfounded, if such claims and legal actions are not resolved in our favor they may
15
Table of Contents
result in significant financial liability and/or adversely affect how the market perceives us and our products and services, as well as impact customer demand for those products and services. Any financial liability for which we have not adequately maintained reserves, and/or any reputation damage from such claims and legal actions, could materially and adversely affect our business, financial condition or results of operations.
16
Table of Contents
Actions of the U.S. Treasury, the Federal Reserve and other governmental and regulatory bodies for the purpose of stabilizing the financial markets may not achieve the intended effect.
Recent legislative and regulatory initiatives to address difficult market and economic conditions may not stabilize the U.S. banking system. On October 3, 2008, President Bush signed into law the Emergency Economic Stabilization Act in response to the current crisis in the financial sector and on February 17, 2009, President Obama signed into law the ARRA. The U.S. Treasury and banking regulators have implemented a number of programs under this legislation to address capital and liquidity issues in the banking system. There can be no assurance, however, as to the actual impact that the Emergency Economic Stabilization Act or the ARRA will have on the financial markets, including the extreme levels of volatility and limited credit availability currently being experienced. The failure of the Emergency Economic Stabilization Act or the ARRA to help stabilize the financial markets and a continuation or worsening of current financial market conditions could have a material adverse effect on our business, financial condition, results of operations, access to credit or the value of our securities.
These programs and measures also subject participating financial institutions, like us, to additional restrictions, oversight and costs that may have an adverse effect on our business, financial condition, results of operations or the price of our common stock. In particular, the ARRA amended the executive compensation provisions of the Emergency Economic Stabilization Act, under which TARP was established. These amendments apply not only to future participants under TARP, but also apply retroactively to companies like us that are current TARP participants. The full scope and effect of these amendments is uncertain and difficult to predict. The ARRA directs the Secretary of the U.S. Treasury to adopt standards that implement the amended provisions of the Emergency Economic Stabilization Act and directs the SEC to issue rules in connection with some of the amended provisions. While the U.S. Treasury has adopted interim final rules, the full scope and effect of the new standards and rules is not fully known.
Changes in monetary policy and interest rates could adversely affect our profitability.
Our results of operations are affected by credit policies of monetary authorities, particularly the Federal Reserve. Our profitability depends to a significant extent on our net interest income. Net interest income is the difference between income generated from interest-earning assets and interest expense on funding those assets. Our net interest income has declined in recent periods due to a decline in interest rates and a reduction in interest earning assets. Interest rates are highly sensitive to many factors that are beyond our control, including general economic conditions and policies of various governmental and regulatory agencies. Changes in monetary policy, including changes in interest rates, could influence not only the interest we receive on loans and securities and the interest we pay on deposits and borrowings, but those changes could also affect our ability to originate loans and obtain deposits, and the average duration of our mortgage-backed securities portfolio.
Our net interest income will be adversely affected if market interest rates change such that the interest we pay on deposits and borrowings increases faster than the interest earned on loans and investments. Changes in interest rates could also adversely affect the income of some of our noninterest income sources. For example, if mortgage interest rates increase, the demand for residential mortgage loans will likely decrease, which will have an adverse effect on our mortgage loan fee income. Declines in security values could further reduce our trust and investment income.
In light of changing conditions in the national economy and in the financial markets, particularly the uncertain economic environment, the continuing threat of terrorist acts and the current military operations in the Middle East, we cannot predict possible future changes in interest rates, which may negatively affect our deposit levels, our loan demand and our business and earnings. Furthermore, the actions of the United States and other governments in response to ongoing economic crisis may result in currency fluctuations, exchange controls, market disruption and other adverse effects.
We may be required to pay significantly higher FDIC premiums in the future.
Recent insured institution failures, as well as deterioration in banking and economic conditions, have significantly increased the loss provisions of the FDIC, resulting in a decline in the designated reserve ratio to historical lows. The FDIC expects a higher rate of insured institution failures in the next few years compared to recent years. Therefore, the reserve ratio may continue to decline. Additionally, the Emergency Economic Stabilization Act temporarily increased the limit on FDIC coverage to $250,000 through December 31, 2009, which was extended to December 13, 2013 on May 20, 2009. These developments will cause the premiums assessed on us by the FDIC to increase and materially increase other expenses. Our FDIC insurance related costs totaled approximately $4.3 million for 2009. We anticipate that 2010 costs will remain high and are unable to predict the impact of FDIC insurance costs in future periods if the economic crisis continues.
We are a bank holding company and depend on our subsidiaries for dividends, distributions and other payments.
The Corporation is a company separate and apart from Cadence, and we must provide for our own liquidity. Substantially all of our revenues are obtained from dividends declared and paid by Cadence. Cadence’s ability to declare and pay dividends is
17
Table of Contents
limited by its obligations to maintain sufficient capital and by other general restrictions on its dividends that are applicable to our subsidiaries that are regulated by various regulatory authorities. Under regulations controlling national banks, the payment of dividends by a bank without prior approval from the OCC is limited in amount to the current year’s net profit and the retained net earnings of the two preceding years. At December 31, 2009, without approval from the OCC, Cadence does not have the ability to pay dividends to the Corporation. The Federal Reserve has issued policy statements generally requiring insured banks and bank holding companies to pay dividends only out of current operating earnings.
Our inability to hire or retain key professionals, management and staff could adversely affect our revenues and net income.
We rely on key personnel to manage and operate our business, including major revenue generating functions such as the loan and deposit portfolios. The loss of key staff may adversely affect our ability to maintain and manage these portfolios effectively, which could negatively affect our revenues.
The ARRA has imposed significant limitations on executive compensation for recipients, like us, of funds under the CPP, which may make it more difficult for us to retain and recruit key personnel. Our success depends to a significant degree upon our ability to attract and retain qualified management, loan origination, finance, administrative, marketing and technical personnel and upon the continued contributions of our management and personnel. In particular, our success has been and continues to be highly dependent upon the abilities of our key executives, including our chairman and chief executive officer, our president and chief operating officer and chief financial officer.
An interruption or breach in security with respect to our information systems, as well as information systems of our outsourced service providers, could have a material adverse effect on our financial condition and results of operations.
We rely heavily on communications and information systems to conduct our business. Any failure, interruption or breach in security with respect to our information system, as well as information systems of our outsourced service providers, could damage our reputation, result in a loss of client business, subject us to additional regulatory scrutiny, or expose us to civil litigation, any of which could result in failures or disruptions in our client relationship management, general ledger, deposit, loan and other systems resulting in a material adverse effect on our financial condition and results of operations.
We have a significant deferred tax asset and cannot assure that it will be fully realized.
We had net deferred tax assets of $31.1 million as of December 31, 2009. We established a valuation allowance of $601,000 relating to our state operating loss carryforwards as of December 31, 2009. We have not established a valuation allowance against our federal net deferred tax assets because we believe that it is more likely than not that all of these assets will be realized. In evaluating the need for a valuation allowance, we estimated future taxable income based on management approved forecasts. This process required significant judgment by management about matters that are by nature uncertain. If future events differ significantly from our current forecasts, we may need to adjust our valuation allowance, which could have a material adverse effect on our results of operations and financial condition.
ITEM 1B - UNRESOLVED STAFF COMMENTS
Not applicable.
At December 31, 2009, Cadence’s properties consisted of 38 full-service bank branches (including the main office in Starkville, Mississippi), of which 30 are owned premises and 8 are leased from third parties. Cadence also owns two operations centers in Starkville, Mississippi and Memphis, Tennessee. The Corporation, Service, Insurance and CNIC did not own or lease any properties at December 31, 2009.
In the opinion of management, all properties are in good condition and are adequate to meet the needs of the communities they serve.
In the normal course of business, the Corporation and its subsidiaries from time to time are involved in legal proceedings. In view of the inherent difficulty of predicting the outcome of such matters, the Corporation cannot state what the eventual outcome of any such matters will be; however, based on current knowledge and after consultation with legal counsel, management believes that there are no pending proceedings to which either the Corporation or any of its subsidiaries are a party that upon resolution are expected to have a material adverse effect upon the Corporation’s or its subsidiaries’ financial condition or results of operations.
18
Table of Contents
PART II
ITEM 5 - MARKET FOR REGISTRANT’S COMMON EQUITY, RELATED SHAREHOLDER MATTERS AND ISSUER PURCHASES OF EQUITY SECURITIES
Market Information
Common stock market prices for the year ended December 31, 2009 are included in “Item 7—Management’s Discussion and Analysis of Financial Condition and Results of Operations,” under the caption, “Market Information.”
Number of Security Holders
The Corporation had 2,379 security holders of record as of December 31, 2009.
Dividends
Dividends on common stock were declared quarterly in 2008 and the first quarter of 2009, and totaled as follows. On May 5, 2009, the Corporation’s Board of Directors voted to suspend paying cash dividends on common stock until further notice.
| (In Thousands) | ||||||
| For the Twelve Months Ended | ||||||
| December 31, | ||||||
| 2009 | 2008 | |||||
| Dividends declared, $0.05 per share |
$ | 595 | $ | — | ||
| Dividends declared, $0.60 per share |
$ | — | $ | 7,144 | ||
Effective January 9, 2009, and continuing for so long as any preferred stock issued under the CPP remains outstanding, the Corporation is prohibited, without the consent of the U. S. Treasury, from increasing dividends on its common stock.
Performance Graph
The Securities and Exchange Commission requires that the Corporation include in its annual report on Form 10-K a line graph presentation comparing cumulative, five-year shareholder returns on an indexed basis with a performance indicator of the overall stock market and either a nationally recognized industry standard or an index of peer companies selected by the Corporation. The broad market index used in the graph is the NASDAQ Market Index. The Corporation has used Hemscott Industry Group 413 – Regional-Southeast Banks as its peer group index in previous years but has elected to use the SNL Southeast Bank Index as its peer group index for 2009 and future years. Thus, both peer indices are presented below. The Corporation has chosen to include the NASDAQ Bank Index as additional comparison.
The graph assumes that $100 was invested in shares of the relevant issuers on December 31, 2004, and all dividends were immediately invested in additional shares. The value of the initial $100 investment is shown at one-year intervals, for a five-year period ending December 31, 2009. For purposes of constructing this data, the returns of each component issuer have been weighted according to that issuer’s market capitalization.
19
Table of Contents
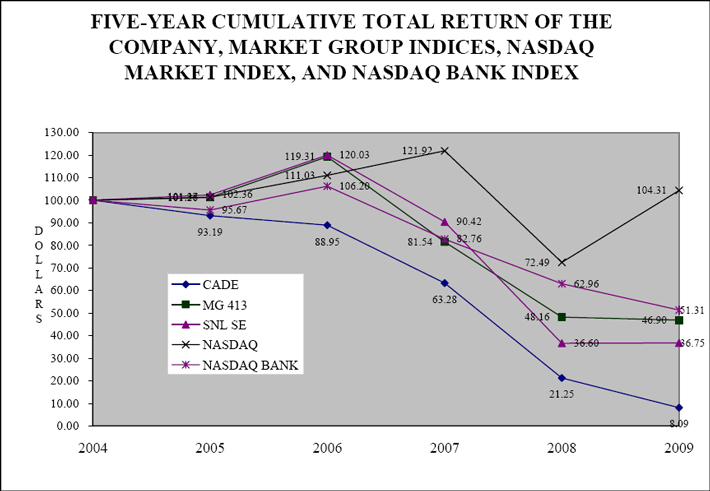
20
Table of Contents
ITEM 6 - SELECTED FINANCIAL DATA
| Years Ended December 31, | |||||||||||||||||
| 2009 | 2008 | 2007 | 2006 | 2005 | |||||||||||||
| (In thousands, except per share data) | |||||||||||||||||
| INCOME DATA |
|||||||||||||||||
| Interest and fees on loans |
$ | 61,802 | $ | 81,533 | $ | 99,591 | $ | 74,182 | $ | 53,035 | |||||||
| Interest and dividends on securities |
18,320 | 20,832 | 21,552 | 21,500 | 19,480 | ||||||||||||
| Other interest income |
357 | 358 | 809 | 1,152 | 577 | ||||||||||||
| Total interest income |
80,479 | 102,723 | 121,952 | 96,834 | 73,092 | ||||||||||||
| Interest expense |
35,047 | 47,330 | 64,845 | 46,512 | 27,970 | ||||||||||||
| Net interest income |
45,432 | 55,393 | 57,107 | 50,322 | 45,122 | ||||||||||||
| Provision for loan losses |
79,328 | 28,599 | 8,130 | 1,656 | 2,128 | ||||||||||||
| Net interest income (loss) after provision for loan losses |
(33,896 | ) | 26,794 | 48,977 | 48,666 | 42,994 | |||||||||||
| Service charges on deposit accounts |
8,375 | 9,133 | 9,295 | 8,878 | 7,952 | ||||||||||||
| Other income |
12,328 | 8,829 | 3,190 | 6,683 | 7,428 | ||||||||||||
| Total noninterest income |
20,703 | 17,962 | 12,485 | 15,561 | 15,380 | ||||||||||||
| Salaries and employee benefits |
27,176 | 27,142 | 27,283 | 25,711 | 21,896 | ||||||||||||
| Occupancy and equipment expense |
7,659 | 7,607 | 7,962 | 6,464 | 5,891 | ||||||||||||
| Other expenses |
92,093 | 19,092 | 14,476 | 13,645 | 13,183 | ||||||||||||
| Total noninterest expenses |
126,928 | 53,841 | 49,721 | 45,820 | 40,970 | ||||||||||||
| Income (loss) from continuing operations, before income taxes |
(140,121 | ) | (9,085 | ) | 11,741 | 18,407 | 17,404 | ||||||||||
| Income tax expense (benefit) |
(30,130 | ) | (5,303 | ) | 2,458 | 4,719 | 4,176 | ||||||||||
| Net income (loss) from continuing operations |
$ | (109,991 | ) | $ | (3,782 | ) | $ | 9,283 | $ | 13,688 | $ | 13,228 | |||||
| PER SHARE DATA |
|||||||||||||||||
| Net income (loss) from continuing operations - basic |
$ | (9.23 | ) | $ | (0.32 | ) | $ | 0.78 | $ | 1.33 | $ | 1.62 | |||||
| Net income (loss) from continuing operations - diluted |
(9.23 | ) | (0.32 | ) | 0.78 | 1.33 | 1.62 | ||||||||||
| Dividends |
0.05 | 0.60 | 1.00 | 1.00 | 0.98 | ||||||||||||
| FINANCIAL DATA |
|||||||||||||||||
| Total assets |
$ | 1,844,455 | $ | 1,979,269 | $ | 1,984,155 | $ | 1,899,948 | $ | 1,446,117 | |||||||
| Net loans |
1,048,055 | 1,307,599 | 1,322,921 | 1,210,710 | 851,332 | ||||||||||||
| Total deposits |
1,499,810 | 1,461,159 | 1,425,566 | 1,460,523 | 1,121,684 | ||||||||||||
| Long-term obligations (1) |
115,928 | 181,431 | 94,284 | 110,832 | 126,779 | ||||||||||||
| Total shareholders’ equity |
119,754 | 185,565 | 194,370 | 191,265 | 116,984 | ||||||||||||
| (1) | Long-term obligations are defined as those obligations with maturities in excess of one year. The Corporation’s long-term obligations consist of certain term repurchase agreements (included in the “Federal funds purchased and securities sold under agreements to repurchase” caption on our consolidated balance sheets), subordinated debentures, and certain Federal Home Loan Bank borrowings (included in the “Other borrowed funds” caption on our consolidated balance sheets). |
21
Table of Contents
SUPPLEMENTAL STATISTICAL INFORMATION
I. DISTRIBUTION OF ASSETS, LIABILITIES, AND STOCKHOLDERS’ EQUITY; INTEREST RATES AND INTEREST DIFFERENTIAL
A. Average balance sheets (consolidated):
The following table presents, for the years indicated, condensed daily average balance sheet information.
| (In Thousands) | |||||||||
| 2009 | 2008 | 2007 | |||||||
| Assets: |
|||||||||
| Cash and due from banks |
$ | 25,967 | $ | 38,836 | $ | 46,604 | |||
| Securities: |
|||||||||
| Taxable |
369,295 | 325,761 | 333,481 | ||||||
| Tax-exempt |
56,965 | 110,691 | 104,995 | ||||||
| Total securities |
426,260 | 436,452 | 438,476 | ||||||
| Federal funds sold and other interest-bearing assets |
160,353 | 17,774 | 17,444 | ||||||
| Loans |
1,237,411 | 1,350,870 | 1,284,762 | ||||||
| Less allowance for loan losses |
37,826 | 14,126 | 12,641 | ||||||
| Net loans |
1,199,585 | 1,336,744 | 1,272,121 | ||||||
| Other assets |
117,139 | 161,429 | 153,974 | ||||||
| Total Assets |
$ | 1,929,304 | $ | 1,991,235 | $ | 1,928,619 | |||
| Liabilities and Shareholders’ Equity: |
|||||||||
| Deposits: |
|||||||||
| Noninterest-bearing |
$ | 176,370 | $ | 180,286 | $ | 175,196 | |||
| Interest-bearing |
1,328,433 | 1,238,156 | 1,248,812 | ||||||
| Total deposits |
1,504,803 | 1,418,442 | 1,424,008 | ||||||
| Federal funds purchased and securities sold under agreements to repurchase |
88,749 | 104,334 | 95,406 | ||||||
| Borrowed funds |
184,840 | 266,024 | 197,681 | ||||||
| Other liabilities |
10,573 | 11,921 | 19,663 | ||||||
| Total liabilities |
1,788,965 | 1,800,721 | 1,736,758 | ||||||
| Shareholders’ equity |
140,339 | 190,514 | 191,861 | ||||||
| Total Liabilities and Shareholders’ Equity |
$ | 1,929,304 | $ | 1,991,235 | $ | 1,928,619 | |||
22
Table of Contents
B. Analysis of Net Interest Earnings
The table below shows, for the periods indicated, an analysis of net interest earnings, including the average amount of interest-earning assets and interest-bearing liabilities outstanding during the period, the interest earned or paid on such amounts, the average yields/rates paid and the net yield on interest-earning assets:
| (In Thousands) Average Balance | |||||||||
| 2009 | 2008 | 2007 | |||||||
| EARNING ASSETS |
|||||||||
| Loans |
$ | 1,237,411 | $ | 1,350,870 | $ | 1,284,762 | |||
| Federal funds sold and other interest-bearing assets |
160,353 | 17,774 | 17,444 | ||||||
| Securities: |
|||||||||
| Taxable |
369,295 | 325,761 | 333,481 | ||||||
| Tax-exempt |
56,965 | 110,691 | 104,995 | ||||||
| Totals |
1,824,024 | 1,805,096 | 1,740,682 | ||||||
| INTEREST-BEARING LIABILITIES |
|||||||||
| Interest-bearing deposits |
1,328,433 | 1,238,156 | 1,248,812 | ||||||
| Borrowed funds, federal funds purchased and securities sold under agreements to repurchase |
273,589 | 370,358 | 293,087 | ||||||
| Totals |
1,602,022 | 1,608,514 | 1,541,899 | ||||||
| Net Amounts |
$ | 222,002 | $ | 196,582 | $ | 198,783 | |||
| ($ In Thousands) Income/Expense |
Yields Earned And Rates Paid (%) | ||||||||||||||
| 2009 | 2008 | 2007 | 2009 | 2008 | 2007 | ||||||||||
| EARNING ASSETS |
|||||||||||||||
| Loans |
$ | 61,802 | $ | 81,533 | $ | 99,591 | 4.99 | 6.04 | 7.75 | ||||||
| Federal funds sold and other interest-bearing assets |
357 | 358 | 809 | 0.22 | 2.00 | 4.64 | |||||||||
| Securities: |
|||||||||||||||
| Taxable |
16,026 | 16,296 | 17,173 | 4.34 | 5.00 | 5.15 | |||||||||
| Tax-exempt |
2,294 | 4,536 | 4,379 | 4.03 | 4.10 | 4.17 | |||||||||
| Totals |
80,479 | 102,723 | 121,952 | 4.41 | 5.68 | 7.01 | |||||||||
| INTEREST-BEARING LIABILITIES |
|||||||||||||||
| Interest-bearing deposits |
27,656 | 35,682 | 49,945 | 2.08 | 2.88 | 4.00 | |||||||||
| Borrowed funds, federal funds purchased and securities sold under agreements to repurchase |
7,391 | 11,648 | 14,900 | 2.70 | 3.15 | 5.08 | |||||||||
| Totals |
35,047 | 47,330 | 64,845 | 2.19 | 2.94 | 4.21 | |||||||||
| Net interest income |
$ | 45,432 | $ | 55,393 | $ | 57,107 | |||||||||
| Net yield on earning assets |
2.49 | 3.07 | 3.28 | ||||||||||||
| (1) | Interest and yields on tax-exempt obligations are not on a fully taxable equivalent basis. |
| (2) | For the purpose of these computations, nonaccruing loans are included in the average loan balances outstanding. |
| (3) | Interest income on loans includes related fees. |
23
Table of Contents
C. Increase (Decrease) in Interest Income and Interest Expense
The following table analyzes the year-to-year changes in both the rate and volume components of net interest income at December 31:
| (In Thousands) 2009 Over 2008 Change Due To: |
(In Thousands) 2008 Over 2007 Change Due To: |
|||||||||||||||||||||||
| Total | Rate | Volume | Total | Rate | Volume | |||||||||||||||||||
| EARNING ASSETS |
||||||||||||||||||||||||
| Loans |
$ | (19,731 | ) | $ | (13,304 | ) | $ | (6,427 | ) | $ | (18,058 | ) | $ | (23,550 | ) | $ | 5,492 | |||||||
| Federal funds sold and other interest-bearing assets |
(135 | ) | 22 | (157 | ) | (478 | ) | (604 | ) | 126 | ||||||||||||||
| Securities: |
||||||||||||||||||||||||
| Taxable |
(270 | ) | 75,864 | (76,134 | ) | (877 | ) | (398 | ) | (479 | ) | |||||||||||||
| Tax-exempt |
(2,242 | ) | (76 | ) | (2,166 | ) | 157 | (70 | ) | 227 | ||||||||||||||
| Totals |
$ | (22,378 | ) | $ | 62,506 | $ | (84,884 | ) | $ | (19,256 | ) | $ | (24,622 | ) | $ | 5,366 | ||||||||
| INTEREST-BEARING LIABILITIES |
||||||||||||||||||||||||
| Interest-bearing deposits |
$ | (8,026 | ) | $ | (10,882 | ) | $ | 2,856 | $ | (14,263 | ) | $ | (13,841 | ) | $ | (422 | ) | |||||||
| Interest on borrowed funds, federal funds purchased and securities sold under agreements to repurchase |
(4,257 | ) | (1,505 | ) | (2,752 | ) | (3,252 | ) | (10,625 | ) | 7,373 | |||||||||||||
| Totals |
$ | (12,283 | ) | $ | (12,387 | ) | $ | 104 | $ | (17,515 | ) | $ | (24,466 | ) | $ | 6,951 | ||||||||
| (1) | Change in volume is the change in volume times the previous year’s rate. |
| (2) | Change in rate is the change in rate times the previous year’s balance. |
| (3) | The change in interest due to both rate and volume has been allocated to volume and rate changes in proportion to the relationship of the absolute dollar amounts of change to each. |
II. INVESTMENT PORTFOLIO
A. The following tables present the book values of securities as of the dates indicated:
| (In Thousands) December 31, | |||||||||
| 2009 | 2008 | 2007 | |||||||
| U. S. Treasury |
$ | 321 | $ | 326 | $ | 300 | |||
| U. S. Government agencies and mortgage-backed securities |
266,195 | 310,615 | 311,459 | ||||||
| States and political subdivisions |
30,791 | 107,804 | 113,048 | ||||||
| Other |
48,756 | 17,684 | 18,284 | ||||||
| Total book value |
$ | 346,063 | $ | 436,429 | $ | 443,091 | |||
24
Table of Contents
B. The following table sets forth the maturities of investment and mortgage-backed securities (carrying values) at December 31, 2009, and the weighted-average yield of such securities:
| ($ In Thousands) Weighted-Average Yield |
||||||||||||||||||
| 0 - 1 Year |
Yield (%) |
1 - 5 Years |
Yield (%) |
5-10 Years |
Yield (%) |
|||||||||||||
| Securities: |
||||||||||||||||||
| U. S. Treasury |
$ | 212 | 2.59 | % | $ | 109 | 3.80 | % | $ | — | — | |||||||
| U. S. Government agencies |
2,058 | 4.79 | % | 6,970 | 4.11 | % | 5,707 | 3.59 | % | |||||||||
| Nontaxable municipals |
— | — | 184 | 6.48 | % | 2,505 | 6.13 | % | ||||||||||
| Taxable municipals |
41 | 4.25 | % | 202 | 4.81 | % | 7,844 | 5.35 | % | |||||||||
| Other |
— | — | 300 | 7.11 | % | — | — | |||||||||||
| Total |
$ | 2,311 | $ | 7,765 | $ | 16,056 | ||||||||||||
| 10+ Years |
Yield (%) |
|||||||||||||||||
| U. S. Government agencies |
$ | 24,173 | 3.42 | % | ||||||||||||||
| Nontaxable municipals |
1,000 | 9.73 | % | |||||||||||||||
| Taxable municipals |
19,015 | 5.74 | % | |||||||||||||||
| Other |
48,456 | 3.91 | % | |||||||||||||||
| Total |
$ | 92,644 | ||||||||||||||||
| Book Value |
Yield (%) |
|||||||||||||||||
| Mortgage-backed securities |
$ | 227,287 | 4.82 | % | ||||||||||||||
NOTE: Interest and yields on tax-exempt obligations are on a taxable equivalent basis, at the statutory rate of 38.25%.
Average yield on floating rate securities was determined using the current yield.
Table includes securities classified as available-for-sale and held-to-maturity at carrying values.
All mortgage-backed securities are backed by U. S. Government agencies.
| C. | Investment securities in excess of 10% of shareholders’ equity. |
At December 31, 2009, there were no securities from any issuers in excess of 10% of shareholders’ equity that were not securities of the U. S. Government or U. S. Government agencies or corporations.
25
Table of Contents
III. LOAN PORTFOLIO
| A. | Type of loans |
The amount of loans outstanding by type at the indicated dates are shown in the following table:
| (In Thousands) December 31, | |||||||||||||||
| Type |
2009 | 2008 | 2007 | 2006 | 2005 | ||||||||||
| Commercial, financial and agricultural |
$ | 204,862 | $ | 244,213 | $ | 265,707 | $ | 257,661 | $ | 209,017 | |||||
| Real estate - construction |
166,212 | 351,935 | 431,814 | 347,568 | 143,729 | ||||||||||
| Real estate - mortgage |
690,678 | 684,827 | 586,909 | 559,604 | 457,453 | ||||||||||
| Installment loans to individuals |
21,133 | 32,388 | 37,121 | 38,833 | 40,825 | ||||||||||
| Other |
8,592 | 14,966 | 16,296 | 19,280 | 9,620 | ||||||||||
| Total loans |
$ | 1,091,477 | $ | 1,328,329 | $ | 1,337,847 | $ | 1,222,946 | $ | 860,644 | |||||
| B. | Maturities and sensitivities of loans to changes in interest rates |
The following table sets forth as of December 31, 2009, the amount of loans due in the periods indicated:
| (In Thousands) | ||||||||||||
| Type |
Due Within 1 Year |
Due After 1 Year Through 5 Years |
Due After 5 Years |
Total | ||||||||
| Commercial, financial and agricultural |
$ | 117,542 | $ | 83,388 | $ | 3,932 | $ | 204,862 | ||||
| Real estate - construction |
125,696 | 39,467 | 1,049 | 166,212 | ||||||||
| $ | 243,238 | $ | 122,855 | $ | 4,981 | $ | 371,074 | |||||
| Type |
Due Within 1 Year |
Due After 1 Year Through 5 Years |
Due After 5 Years |
Total | ||||||||
| Loans with: |
||||||||||||
| Predetermined interest rates |
$ | 180,863 | $ | 112,621 | $ | 4,981 | $ | 298,465 | ||||
| Floating interest rates |
62,375 | 10,234 | — | 72,609 | ||||||||
| $ | 243,238 | $ | 122,855 | $ | 4,981 | $ | 371,074 | |||||
26
Table of Contents
| C. | Non-performing loans |
| 1. | The following table states the aggregate amount of loans that were non-performing on the dates indicated: |
| (In Thousands) December 31, | |||||||||||||||
| Type |
2009 | 2008 | 2007 | 2006 | 2005 | ||||||||||
| Loans accounted for on a non-accrual basis |
$ | 41,096 | $ | 23,761 | $ | 3,460 | $ | 1,435 | $ | 498 | |||||
| Accruing loans past due 90 days or more |
5,582 | 3,467 | 5,493 | 1,146 | 2,043 | ||||||||||
| Renegotiated “troubled” debt |
23,505 | 4,397 | 180 | 151 | 73 | ||||||||||
| 2. | There were no loan concentrations in excess of 10% of total loans at December 31, 2009. However, lending activities are affected by the economic trends within the areas served by the Corporation and its subsidiaries. These economic trends, in turn, can be influenced by the areas’ larger employers and industries, such as Mississippi State University and Columbus Air Force Base in Mississippi; University of Alabama and Mercedes-Benz Automotive Plant in Alabama; Federal Express and Auto Zone in Tennessee; and the tourism industry in Florida. |
| 3. | There were no outstanding foreign loans at December 31, 2009. |
| 4. | Loans classified for regulatory purposes or for internal credit review purposes that have not been disclosed in the table above do not represent or result from trends or uncertainties that management expects will materially impact the financial condition of the Corporation or the Bank, or their future operating results, liquidity or capital resources. |
| 5. | If all nonaccrual loans had been current throughout their terms, management estimates that interest income would have increased by approximately $3.5 million for the year ended December 31, 2009. |
| 6. | Management stringently monitors loans that are classified as non-performing. Non-performing loans include nonaccrual loans, loans past due 90 days or more, and loans renegotiated or restructured because of a debtor’s financial difficulties. Loans are generally placed on non-accrual status if any of the following events occur: (a) the classification of a loan as non-accrual internally or by regulatory examiners, (b) delinquency on principal for 90 days or more unless management is in the process of collection, (c) a balance remains after repossession of collateral, (d) notification of bankruptcy, or (e) management judges that non-accrual status is appropriate. |
| 7. | At December 31, 2009, the recorded investment in loans identified as impaired totaled approximately $67.8 million. The allowance for loan losses related to these loans approximated $11.4 million. The average recorded investment in impaired loans during the year ended December 31, 2009, was $72.4 million. For the year ended December 31, 2009, management estimates that the amount of income recognized on impaired loans was approximately $1.7 million. |
| D. | Other interest-bearing assets |
| There | were no other interest-bearing non-performing assets at December 31, 2009. |
27
Table of Contents
IV. SUMMARY OF LOAN LOSS EXPERIENCE
A. The following table shows changes in the Corporation’s allowance for loan losses for the periods indicated:
| ($ In Thousands) Years Ended December 31, |
||||||||||||||||||||
| 2009 | 2008 | 2007 | 2006 | 2005 | ||||||||||||||||
| Beginning balance |
$ | 20,730 | $ | 14,926 | $ | 12,236 | $ | 9,312 | $ | 10,914 | ||||||||||
| Allowance of acquired entity |
— | — | — | 3,116 | — | |||||||||||||||
| 20,730 | 14,926 | 12,236 | 12,428 | 10,914 | ||||||||||||||||
| Charge-offs: |
||||||||||||||||||||
| Domestic: |
||||||||||||||||||||
| Commercial, financial and agricultural |
(8,143 | ) | (1,582 | ) | (2,547 | ) | (749 | ) | (1,320 | ) | ||||||||||
| Real estate |
(49,944 | ) | (21,000 | ) | (2,952 | ) | (526 | ) | (1,373 | ) | ||||||||||
| Installment loans and other |
(755 | ) | (1,339 | ) | (1,999 | ) | (1,358 | ) | (1,927 | ) | ||||||||||
| Total charge-offs |
(58,842 | ) | (23,921 | ) | (7,498 | ) | (2,633 | ) | (4,620 | ) | ||||||||||
| Recoveries: |
||||||||||||||||||||
| Domestic: |
||||||||||||||||||||
| Commercial, financial and agricultural |
1,224 | 379 | 408 | 259 | 52 | |||||||||||||||
| Real estate |
695 | 322 | 1,171 | 119 | 348 | |||||||||||||||
| Installment loans and other |
287 | 425 | 479 | 407 | 490 | |||||||||||||||
| Total recoveries |
2,206 | 1,126 | 2,058 | 785 | 890 | |||||||||||||||
| Net charge-offs |
(56,636 | ) | (22,795 | ) | (5,440 | ) | (1,848 | ) | (3,730 | ) | ||||||||||
| Provision charged to operations |
79,328 | 28,599 | 8,130 | 1,656 | 2,128 | |||||||||||||||
| Ending balance |
$ | 43,422 | $ | 20,730 | $ | 14,926 | $ | 12,236 | $ | 9,312 | ||||||||||
| Ratio of net charge-offs to average loans outstanding |
4.58 | 1.69 | 0.42 | 0.19 | 0.46 | |||||||||||||||
Estimated charge-offs in 2010 are as follows: commercial, financial and agricultural - $2.5 million; real estate - $21.0 million; and installment loans and other - $1.0 million.
The following table indicates the ratio of allowance for loan losses to loans outstanding at year-end:
| December 31, | ||||||||||
| 2009 | 2008 | 2007 | 2006 | 2005 | ||||||
| Ratio of allowance for loan losses to loans outstanding at year end |
3.98 | 1.56 | 1.12 | 1.00 | 1.08 | |||||
| B. | Determination of Allowance for Loan Losses |
The determination of the allowance for loan losses requires significant judgment. The balance of the allowance for loan losses reflects management’s best estimate of probable loan losses related to specifically identified loans, as well as probable incurred loan losses in the remaining portfolio. Reference should be made to Note A.6. (“Allowance for Loan Losses”) in the Notes to Consolidated Financial Statements and to “Item 7 - Management’s Discussion and Analysis of Financial Condition and Results of Operations.”
28
Table of Contents
The following schedule sets forth the components of the allowance for loan losses for the periods indicated. This allocation is based upon the consistent, quarterly evaluation of the adequacy of the allowance for loan losses. The entire allowance for loan losses is available to absorb loan losses in any category.
| 2009 | 2008 | 2007 | ||||||||||||||||
| (In thousands) |
Loan Balance |
Allowance for Loan Losses |
Loan Balance |
Allowance for Loan Losses |
Loan Balance |
Allowance for Loan Losses | ||||||||||||
| Allocated component: |
||||||||||||||||||
| Impaired loans |
$ | 67,785 | $ | 11,407 | $ | 59,664 | $ | 10,075 | $ | 23,824 | $ | 4,396 | ||||||
| Pooled loans |
1,023,692 | 29,275 | 1,268,665 | 6,655 | 1,314,023 | 5,668 | ||||||||||||
| Unallocated component |
— | 2,740 | — | 4,000 | — | 4,862 | ||||||||||||
| Totals |
$ | 1,091,477 | $ | 43,422 | $ | 1,328,329 | $ | 20,730 | $ | 1,337,847 | $ | 14,926 | ||||||
| 2006 | 2005 | |||||||||||||||||
| (In thousands) |
Loan Balance |
Allowance for Loan Losses |
Loan Balance |
Allowance for Loan Losses | ||||||||||||||
| Allocated component: |
||||||||||||||||||
| Impaired loans |
$ | 13,577 | $ | 2,113 | $ | 10,544 | $ | 1,293 | ||||||||||
| Pooled loans |
1,209,369 | 7,603 | 850,100 | 6,435 | ||||||||||||||
| Unallocated component |
— | 2,520 | — | 1,584 | ||||||||||||||
| Totals |
$ | 1,222,946 | $ | 12,236 | $ | 860,644 | $ | 9,312 | ||||||||||
The measurement of impaired loans is based on the present value of expected future cash flows discounted at the loan’s effective interest rate or the loan’s observable market price, or based on the fair value of the collateral if the loan is collateral-dependent. When management’s measured value of the impaired loan is less than the recorded investment in the loan, the amount of the impairment is recorded as a specific reserve. These specific reserves are determined on an individual loan basis based on our current evaluation of our loss exposure for each credit, given the payment status, financial condition of the borrower and value of any underlying collateral.
We also maintain a general reserve for each loan type in the loan portfolio. Within each loan type, the portfolio is further segmented by risk ratings and by delinquency status. In determining the amount of the general reserve portion of our allowance for loan losses, we consider factors such as our historical loan loss experience, the growth, composition and diversification of our loan portfolio, current delinquency levels, adverse situations that may affect the borrower’s ability to repay, estimated value of the underlying collateral, the results of recent regulatory examinations and general economic conditions.
The unallocated portion of our allowance is determined based on various factors, including general economic conditions of our market area, the growth, composition and diversification of our loan portfolio, types of collateral securing our loans, the experience level of our lending officers and staff, the quality of our credit risk management and the results of independent third party reviews of our classification of credits.
| C. | Loans and Risk Descriptions |
Real Estate Loans
The Bank originates loans secured by commercial real estate, one-to-four family residential properties, and multi-family dwelling units (5 or more units). At December 31, 2009, these loans totaled $793.6 million, or approximately 73% of the Bank’s loan portfolio.
The Bank originates commercial real estate loans of up to 80% of the appraised value. Currently, it is the Corporation’s policy to originate these loans only to carefully selected borrowers and on properties in the market area. Of primary concern in commercial real estate lending are the borrower’s credit worthiness and the feasibility and cash flow potential of the project. To monitor cash flows of borrowers, annual financial statements are obtained from the borrower and loan guarantors, if any.
The Bank originates loans secured by first and junior liens on one-to-four family residences in its lending areas. Typically, such loans are single-family homes that serve as the primary residence of the borrower. Generally, these loans are originated in amounts up to 80% of the appraised value or selling price of the property. See Note D in the Notes to Consolidated Financial Statements for additional information related to these loans.
29
Table of Contents
Loans for multi-family (5 or more units) residential properties are generally secured by apartment buildings. Loans secured by income generating properties are generally larger and involve greater risk than residential loans because payments are often dependent on the successful operation or management of the properties. As a result, these types of loans may be more sensitive to adverse conditions in the real estate market or the economy. Cash flow and financial statements are obtained from the borrowers and any guarantors. Also, rent rolls are often obtained.
Consumer and Other Loans
Cadence offers consumer loans in the form of home improvement loans, mobile home loans, automobile loans and unsecured personal loans. These loans totaled $20.2 million, or 2% of total loans, at December 31, 2009. Consumer loans are originated in order to provide a wide range of financial services to customers.
In connection with consumer loan applications, the borrower’s income statement and credit bureau report are reviewed. In addition, the relationship of the loan to the value of the collateral is considered. All automobile loan applications are reviewed, as well as the value of the collateral securing the loan. Cadence intends to continue to emphasize the origination of consumer loans. Management believes that its loan loss experience in connection with its consumer loan portfolio is favorable in comparison to industry averages.
The Bank makes commercial business loans on both a secured and unsecured basis with terms generally not exceeding five years. Non-real estate commercial loans primarily consist of short-term loans for working capital purposes, inventories, seasonal loans, lines of credit and equipment loans. A personal guaranty of payment by the principals of any borrowing entity is often required and the financial statements and income tax returns of the entity and its guarantors are reviewed. At December 31, 2009, commercial business loans represented $185.5 million, or approximately 17%, of the Bank’s total loan portfolio.
V. DEPOSITS
| ($ In Thousands) | ||||||||||||||||||
| 2009 | 2008 | 2007 | ||||||||||||||||
| Amount | Rate | Amount | Rate | Amount | Rate | |||||||||||||
| A. Average deposits: |
||||||||||||||||||
| Domestic: |
||||||||||||||||||
| Noninterest-bearing |
$ | 176,370 | — | $ | 177,670 | — | $ | 175,196 | — | |||||||||
| Interest-bearing demand (1) |
562,253 | 1.15 | % | 526,918 | 1.80 | % | 489,136 | 2.95 | % | |||||||||
| Savings |
43,887 | 0.43 | % | 40,261 | 0.58 | % | 42,310 | 0.78 | % | |||||||||
| Time |
722,293 | 2.91 | % | 670,977 | 3.87 | % | 717,366 | 4.91 | % | |||||||||
| Foreign |
N/A | N/A | N/A | |||||||||||||||
| Total |
$ | 1,504,803 | $ | 1,415,826 | $ | 1,424,008 | ||||||||||||
| (1) | Includes Money Market accounts |
| B. | Other categories - None |
| C. | Foreign deposits - Not applicable |
30
Table of Contents
| D. | Time certificates of deposit of $100,000 or more and maturities at December 31, 2009: |
| (In Thousands) | |||||||||||||||
| Total | 3 Months or Less |
3 Months Through 6 Months |
6 Months Through 12 Months |
Over 12 Months | |||||||||||
| Time certificates of deposit of $100,000 or more |
$ | 374,351 | $ | 102,099 | $ | 67,275 | $ | 147,185 | $ | 57,792 | |||||
| E. | Foreign office time deposits of $100,000 or more - Not applicable |
VI. RETURN ON EQUITY AND ASSETS
The following financial ratios are presented for analytical purposes:
| December 31, | |||||||||
| 2009 | 2008 | 2007 | |||||||
| Return on assets (net income divided by total average assets) |
(5.8 | )% | (0.2 | )% | 0.5 | % | |||
| Return on equity (net income divided by average equity) |
(80.0 | ) | (1.8 | ) | 5.1 | ||||
| Dividend payout ratio (dividends per share divided by basicnet income per share) |
* | * | * | * | 122.0 | ||||
| Equity to asset ratio (average equity divided by average total assets) |
7.3 | 9.6 | 9.9 | ||||||
** For the years ended December 31, 2009 and 2008, dividends paid exceeded net income.
VII. SHORT-TERM BORROWINGS
| ($ In Thousands) | ||||||||||||
| 2009 | 2008 | 2007 | ||||||||||
| Balance at year end |
$ | 37,432 | $ | 48,527 | $ | 57,060 | ||||||
| Weighted average interest rate at year end |
0.96 | % | 0.92 | % | 3.40 | % | ||||||
| Maximum amount outstanding at any month end for the year |
$ | 42,283 | $ | 75,068 | $ | 57,060 | ||||||
| Average amount outstanding during the year |
38,749 | 54,334 | 45,406 | |||||||||
| Weighted average interest rate during the year |
0.98 | % | 1.81 | % | 3.58 | % | ||||||
Note: Short–term borrowings include federal funds purchased and securities sold under agreements to repurchase (excluding certain term repurchase agreements).
ITEM 7 - MANAGEMENT’S DISCUSSION AND ANALYSIS OF FINANCIAL CONDITION AND RESULTS OF OPERATIONS
The following provides a narrative discussion and analysis of the financial condition, changes in financial condition and results of operations of the Corporation. You should read this discussion in conjunction with the Consolidated Financial Statements, including the notes thereto, and the Supplemental Financial Data included elsewhere in this report.
Introduction and Management Overview
The Corporation is a bank holding company that owns Cadence. Cadence operates in the states of Mississippi, Alabama, Tennessee, Florida and Georgia. Cadence’s primary business is providing traditional commercial and retail banking services to customers. Cadence also provides other financial services, including trust services, mortgages and investment products. Our stock is traded on The NASDAQ Global Select Market (“NASDAQ”) under the ticker symbol of “CADE”.
Like most community banks, we derive most of our income from interest we receive on our loans and investments. Our primary source of funds for making these loans and investments is our deposits, on which we pay interest. Consequently, one of the key measures of our success is our amount of net interest income. Another key measure is the spread between the yield we earn on these interest-earning assets and the rate we pay on our interest-bearing liabilities.
31
Table of Contents
Noninterest income includes fees from service charges on deposit accounts, trust, investment activities and other customer services which Cadence provides. Results of operations are also affected by the provision for loan losses and noninterest expenses such as salaries, employee benefits, occupancy and other operating expenses, including taxes.
Economic conditions, competition, the regulatory environment, and the monetary and fiscal policies of the federal government in general, significantly affect financial institutions, including Cadence. Lending and deposit activities and fee income generation are influenced by the level of business spending and investment, consumer income, spending and savings, capital market activities, competition among financial institutions, customer preferences, interest rate conditions, employment levels, prevailing market rates on competing products in Cadence’s market areas, and the general state of the economy in our market areas.
Summary of Year Ended December 31, 2009
Participation in CPP. In January 2009, we sold 44,000 shares of non-voting Series A preferred stock, for an aggregate purchase price of $44.0 million, and issued a warrant to purchase up to 1,145,833 shares of our common stock to the U.S. Treasury under the CPP.
Sale of Assets and Liabilities of GCM. On August 31, 2009, we completed the disposition of the assets used in and liabilities arising from GCM’s operations to four limited liability companies established by former owners and employees of GCM. The total purchase price of the assets sold, net of liabilities assumed, was approximately $5.5 million. For the year ended December 31, 2009, we recognized a gain of approximately $613,000 on this transaction.
Net Interest Income. Our net interest income declined from $55.4 million in 2008 to $45.4 million in 2009. For 2009, our net interest margin was 2.49%, compared to 3.07% for 2008. Our loan yields declined by 105 basis points between 2008 and 2009, partly due to the 400 basis point reduction in the federal funds rate during 2008. Our yield on earning assets declined by 127 basis points between 2008 and 2009, but was offset slightly by a 1.0% increase in average earning assets.
Provision for Loan Losses. Our provision for loan losses was $79.3 million for 2009, as compared to $28.6 million for 2008. We incurred $56.6 million in net charge-offs in 2009, compared to $22.8 million in 2008. Also, we significantly increased our allowance for loan losses during 2009. Our allowance for loan losses was $43.4 million at December 31, 2009, compared with our allowance for loan losses at December 31, 2008 of $20.7 million. We have experienced an increase in non-performing loans, mostly due to real estate construction and development loans. During 2009, we had increased weakness in our Middle Tennessee market.
Other Income (Noninterest Income). Our noninterest income, exclusive of securities gains and losses, remained relatively unchanged from 2008 to 2009.
Other Expense (Noninterest Expense). During 2009, total noninterest expenses increased by $73.1 million, compared to 2008. Included in this increase is a $66.5 million impairment loss on goodwill. The remaining $6.6 million increase resulted primarily from increases in FDIC insurance premiums, increased expenses relating to other real estate owned (“OREO”), a loss on early extinguishment of debt, and expenses associated with our efforts to raise capital that were suspended during the third quarter.
Net Income/(Loss). For 2009, we reported a net loss applicable to common shareholders of $112.2 million, or $(9.42) per common share, compared to a net loss of $3.4 million, or $(0.28) per common share, for 2008.
Loan Portfolio. As of December 31, 2009, our loan portfolio was $1.091 billion, distributed among commercial real estate loans, commercial and industrial loans, 1-4 family mortgages and consumer loans. As of December 31, 2009, our loan portfolio was composed of approximately 57.0% variable rate loans and 43.0% fixed rate loans. Beginning in the third quarter of 2008, we made a concerted effort to reduce our concentration in commercial real estate loans, particularly residential construction and development loans, which typically have higher yields but also higher risk. Overall, our average loan balances declined by approximately $113.5 million, or 8.4%, from 2008 to 2009, from $1.351 billion for 2008 to $1.237 billion for 2009.
Investment Portfolio. The average balance of our investment portfolio was $426.3 million for 2009, compared to $436.5 million for 2008, representing a decrease of $10.2 million, or 2.3%. However, our yield on securities declined by 47 basis points to 4.30% over this same period.
Federal Funds Sold and Other Interest-Bearing Assets. Our average balances in federal funds sold and other interest-bearing assets increased significantly from 2008 to 2009, from $17.8 million to $160.4 million. This variance resulted from our intentionally building liquidity by accumulating deposits and investing in short-term assets. Our yields on these assets declined from 2.00% for 2008 to 0.22% for 2009, which negatively affected our overall yield on earning assets.
32
Table of Contents
Deposits. Our overall cost of funds declined by 75 basis points between 2008 and 2009. Average interest-bearing deposits increased 7.3% to $1.328 billion for 2009, compared to $1.238 billion for 2008, somewhat offset by a decline of $96.8 million, or 26.1%, in average borrowed funds.
During the first quarter of 2009, we accumulated an additional $166 million in deposits. During the third quarter of 2009, we used a portion of those funds to repay FHLB borrowings. Also, during the third quarter of 2009, we evaluated our investment portfolio and determined that we were not receiving the full tax benefit of holding tax-exempt securities, due to the losses being generated from operations. Thus, with the approval of the Board of Directors, we sold most of those securities and invested the proceeds into taxable securities to generate higher levels of taxable income. The funds remaining from our investment portfolio transactions and our accumulation of deposits were held at December 31, 2009, in our Federal Reserve account.
Outlook for 2010
Our most significant challenges for 2010 are credit quality and raising capital. We have taken an aggressive stance in addressing credit issues in our loan portfolio to minimize future risks. We have increased our focus on underwriting standards and have revamped our loan policy. We also have a special assets team in place to manage workout situations and to assist in the timely disposition of defaulted assets. Our management information systems relating to loan concentrations provide us with current and detailed information about the status of the loans in our portfolio. We feel that these steps place us in the best position possible to manage credit quality; however, credit quality will remain an issue as long as current economic trends, including increasing unemployment rates and declining real estate prices, continue.
We expect our loan portfolio balance to decline slightly during the first part of 2010, as we continue to reduce our lending exposure to commercial real estate loans and face the challenges of the current economic environment. Currently, we expect that interest rates will remain flat for at least the first two quarters of 2010. We based our 2010 projections, budgets and goals on these expectations. If these trends move differently than expected in either direction or speed, they could have a material impact on our financial condition and results of operations. The areas of our operations most directly impacted would be the net interest margin, loan and deposit growth and the provision for loan losses.
We also expect our wholesale borrowing costs to continue to decline in 2010. We intend to use our excess liquidity to absorb maturing wholesale liabilities to reduce interest expense.
As part of an agreement entered into with the OCC in April 2009, the Bank was required to achieve by September 30, 2009, and maintain on an ongoing basis, a Tier 1 leverage ratio of 8.0% and a total risk-based capital ratio of 12.0%. As of December 31, 2009, the Bank had a Tier 1 leverage ratio of 6.0% and a total risk-based capital ratio of 10.2%. As a result of our 2009 losses and the Bank’s requirement for additional capital to meet these higher ratios, we have a need to raise additional capital. We are currently seeking to raise this capital through all available sources, including public or private equity offerings. It is difficult in the current economic environment for financial institutions to raise capital; however, we will continue our efforts to raise capital and meet the required capital ratios during our 2010 fiscal year. Any capital raise that would exceed NASDAQ guidelines would require prior shareholder approval.
We will also continue our efforts to control noninterest expenses by working to achieve maximum efficiencies within our franchise. We have commissioned an earnings improvement project, which is currently in process, to look aggressively at reducing our overhead expenses during 2010 and forward. We continue to leverage the investments in infrastructure that we have made over the past few years and believe that they will continue to have a positive impact on our costs going forward. Reducing our efficiency ratio remains a key objective. However, our noninterest expenses for 2010 will continue to be negatively affected by significant FDIC insurance premiums and costs associated with OREO.
We remain focused on our strategy to build future earnings and understand that improved asset quality and margin growth are the keys to achieving that strategy. We are managing our credit problems aggressively and refining our risk management processes in order to enhance our future earnings. Additionally, we plan to raise capital to meet our capital ratio requirements imposed by the OCC.
Critical Accounting Policies and Other Accounting Issues
Our accounting and financial reporting policies conform to United States generally accepted accounting principles and, where applicable, to general practices within the banking industry. Note A of the Notes to Consolidated Financial Statements contains a summary of our accounting policies. Management is of the opinion that Note A, read in conjunction with all other information in this report, including this Management’s Discussion and Analysis, is sufficient to provide the reader with the information needed to understand our financial condition and results of operations.
33
Table of Contents
Critical Accounting Policies
We believe that the areas of the financial statements that require the most difficult, subjective and complex judgments, and therefore contain the most critical accounting estimates, are as follows:
| • | the provision for loan losses and the resulting allowance for loan losses; |
| • | the liability and expense relating to our pension and other postretirement benefit plans; |
| • | issues relating to other-than-temporary impairment losses in the securities portfolio; |
| • | goodwill and other intangible assets; and |
| • | income taxes. |
Provision/Allowance for Loan Losses. Our allowance for loan losses is established through charges to earnings in the form of a provision for loan losses. The allowance for loan losses is maintained at a level that we believe is adequate to absorb all probable losses on loans inherent in the loan portfolio as of the reporting date. Events that are not within our control, such as changes in economic factors, could change subsequent to the reporting date and could cause our allowance for loan losses to be over or understated. The amount of the allowance is affected by loan charge-offs, which decrease the allowance; recoveries on loans previously charged off, which increase the allowance; and the provision for loan losses charged to earnings, which increases the allowance. In determining the provision for loan losses, we monitor fluctuations in the allowance resulting from actual charge-offs and recoveries and review the size and composition of the loan portfolio in light of current and anticipated economic conditions. If actual losses exceed the amount of the allowance for loan losses, our earnings could be adversely affected.
The allowance for loan losses represents management’s estimate of the amount necessary to provide for losses inherent in the loan portfolio in the normal course of business. Due to the uncertainty of risks in the loan portfolio, the allowance necessary to absorb loan losses is an estimate, based on management’s judgment, using the information available at the reporting date. The allowance for loan losses is also subject to regulatory examinations and determination by the regulatory agencies as to its adequacy.
The allowance for loan losses is comprised of the following three components: specific reserves, general reserves and unallocated reserves. Generally, all loans that are identified as impaired are reviewed on a quarterly basis in order to determine whether a specific reserve is required. A loan is considered impaired when, based on current information, it is probable that we will not receive all amounts due in accordance with the contractual terms of the loan agreement. Once a loan has been identified as impaired, management measures impairment in accordance with ASC Topic 310, “Receivables.” The measurement of impaired loans is based on the present value of expected future cash flows discounted at the loan’s effective interest rate or the loan’s observable market price, or based on the fair value of the collateral if the loan is collateral-dependent. When management’s measured value of the impaired loan is less than the recorded investment in the loan, the amount of the impairment is recorded as a specific reserve. These specific reserves are determined on an individual loan basis based on our current evaluation of our loss exposure for each credit, given the payment status, financial condition of the borrower and value of any underlying collateral. Loans for which specific reserves are provided are excluded from the general reserve and unallocated reserve calculations described below. Changes in specific reserves from period to period are the result in changes in the circumstances of individual loans such as charge-offs, pay-offs, changes in collateral values or other factors.
We also maintain a general reserve for each loan type in the loan portfolio. Within each loan type, the portfolio is further segmented by risk ratings and by delinquency status. In determining the amount of the general reserve portion of our allowance for loan losses, we consider factors such as our historical loan loss experience, the growth, composition and diversification of our loan portfolio, current delinquency levels, adverse situations that may affect the borrower’s ability to repay, estimated value of the underlying collateral, the results of recent regulatory examinations and general economic conditions. Through the second quarter of 2009, general reserves for these loans were based upon three-year historical loss rates. Beginning in the third quarter of 2009, general reserves for these loans are based upon historical loss rates from the most recent three years (twelve quarters), with the more recent quarters receiving the most weight. Management believes that this method of weighting the latest quarters is more representative of the current economic cycle. We use this information to set the general reserve portion of the allowance for loan losses at a level we deem prudent.
Because there are additional risks of losses that cannot be quantified precisely or attributed to particular loans or types of loans, including general economic and business conditions and credit quality trends, we have established an unallocated portion of the allowance for loan losses based on our evaluation of these risks. The unallocated portion of our allowance is determined based on various factors, including general economic conditions of our market area, the growth, composition and diversification of our loan portfolio, types of collateral securing our loans, the experience level of our lending officers and staff, the quality of our credit risk management and the results of independent third party reviews of our classification of credits. The unallocated portion of the allowance for loan losses was $2.7 million, or 6.3% of the total allowance, as of December 31, 2009, and $4.0 million, or 19.3% of the total allowance, as of December 31, 2008.
34
Table of Contents
Based on an evaluation of the loan portfolio, management presents a quarterly review of the allowance for loan losses to the Bank’s executive committee and our full Board of Directors, indicating any change in the allowance for loan losses since the last review and any recommendations as to adjustments in the allowance for loan losses. This evaluation is inherently subjective as it requires estimates that are susceptible to significant revision as more information becomes available or as events change. The allowance for loan losses was $43.4 million as of December 31, 2009, compared to $20.7 million as of December 31, 2008. This increase reflects further deterioration in our loan portfolio, due primarily to the lack of demand for residential housing, as well as an overall decline in the value of real estate. This also resulted in the significant increase in net charge-offs.
Pension and Other Postretirement Benefit Plans. Another area that requires subjective and complex judgments is the liability and expense relating to our pension and other postretirement benefit plans. We maintain several benefit plans for our employees. They include a defined benefit pension plan, a defined contribution pension plan, a 401(k) plan and a deferred compensation plan. We make all contributions to these plans when they are due.
The defined benefit pension plan is the only plan that requires multiple assumptions to determine the liability under the plan. This plan has been frozen to new participants for several years. Management evaluates, reviews with the plan actuaries, and updates as appropriate the assumptions used in the determination of pension liability, including the discount rate, the expected rate of return on plan assets, and increases in future compensation. Actual experience that differs from the assumptions could have a significant effect on our financial position and results of operations. The discount rate and the expected rate of return on the plan assets have a significant impact on the actuarially computed present value of future benefits that is recorded on the financial statements as a liability, together with the corresponding pension expense.
In selecting the expected rate of return, management, in consultation with the plan trustees, selected a rate based on assumptions compared to recent returns and economic forecasts. We consider the current allocation of the portfolio and the probable rates of return of each investment type. In selecting the appropriate discount rate, management, with the assistance of actuarial consultants, performs an analysis of the plan’s projected benefit cash flows against discount rates from a national Pension Discount Curve (a yield curve used to measure pension liabilities). Based on the analysis, management used discount rates of 5.75% in 2007, 6.0% in 2008, and 6.25% in 2009. We used expected rates of return of 7.5% for 2007 and 2008, and 7.00% in 2009. From a historical perspective, the rates of return on the plan were 7.6% for 2007, (21.7%) for 2008, and 23.8% for 2009. Additionally, our philosophy has been to fund the plan annually to the maximum amount deductible under the Internal Revenue Service (“IRS”) rules. As of December 31, 2009, the plan had a current accumulated benefit obligation of approximately $10.5 million, and plan assets with a fair value of approximately $12.1 million.
ASC Topic 715, “Compensation-Retirement Benefits,” requires us to recognize the funded status of the plan (defined as the difference between the fair value of plan assets and the projected benefit obligation) on the balance sheet and to recognize in other comprehensive income any gains or losses and prior service costs or benefits not included as components of periodic benefit cost. Detailed information on our pension plan and the related impacts of these changes on the amounts recorded in our financial statements can be found in Note M (Employee Benefits) of the Notes to Consolidated Financial Statements.
Other-Than-Temporary Impairment of Investment Securities. A third area that requires subjective and complex judgments on the part of management is the review of the investments in the investment portfolio for other-than-temporary impairments. ASC Topic 320, “Investments – Debt and Equity Securities,” requires us to review our investment portfolio and determine if it has impairment losses that are other-than-temporary. In making its determination, management considers the following items:
| • | the length of time and extent to which the current market value is less than cost; |
| • | evidence of a forecasted recovery; |
| • | financial condition and the industry environment of the issuer, including whether the issuer is a government or government-backed agency (all of the mortgage-backed securities and collateralized mortgage obligations in our portfolio are issued by government-backed agencies); |
| • | downgrades of the securities by rating agencies; |
| • | whether there has been a reduction or elimination of dividends or interest payments; |
| • | whether we have the intent or ability to hold the securities for a period of time sufficient to allow for anticipated recovery of fair value; and |
| • | interest rate trends that may impact recovery and realization. |
As of December 31, 2009, our investment portfolio included certain securities that were impaired by definition, but based on our review and consideration of the criteria listed above, we determined that none of the impairments were other-than-temporary.
35
Table of Contents
During the first quarter of 2007, we recognized a $5.1 million impairment loss relating to certain collateralized mortgage obligations and mortgage-backed securities.
Goodwill and Other Intangible Assets. ASC Topic 350, “Intangibles – Goodwill and Other,” eliminated the requirement to amortize goodwill; however, it does require periodic testing for impairment using a two-step approach. The first step is to determine whether impairment could exist. If the results of the first step of testing indicate that impairment does not exist, the test is complete. If the results of the first step indicate that impairment could exist, the second step of testing must be performed. We engaged an outside consulting firm to perform the appropriate testing. We completed our periodic impairment test in accordance with ASC Topic 350 as of September 30, 2008. Based on the results of the first step of testing, we concluded that no impairment writedown was warranted as of September 30, 2008.
ASC Topic 350 requires that goodwill be tested for impairment between annual tests if an event occurs or circumstances change that would more likely than not reduce the fair value of a reporting unit below its carrying amount. Several events occurred during the first quarter of 2009 that we believed triggered an additional test of goodwill for impairment. These events included our results of operations for the three months ended March 31, 2009, the changes in credit quality of our loan portfolio, and the continued general decline in the economy. We engaged an outside consultant to perform this additional goodwill impairment testing. Due primarily to the decline in the market value of our stock and the decline in prices paid in comparable bank acquisition transactions between December 31, 2008 and March 31, 2009, the first step of the goodwill impairment test indicated that potential impairment existed and the second step of testing should be performed to determine the amount of impairment. In the second step of the test, our consolidated balance sheet was marked to market to determine the current fair value of the goodwill that should be recorded on the balance sheet. As a result of this testing, we concluded that our goodwill was fully impaired as of March 31, 2009, and we recognized a goodwill impairment charge of $66.8 million ($304,000 of which related to GCM Insurance) for the quarter ended March 31, 2009. This charge eliminated all goodwill previously reflected on our balance sheet.
Income Taxes. The calculation of our income tax provision is complex and requires the use of estimates and judgment in its determination. We are subject to the income tax laws of the various jurisdictions where we conduct business, and we estimate income tax expense based on amounts expected to be owed to these various tax jurisdictions. We assess the appropriate tax treatment of transactions and filing positions after considering statutes, regulations, judicial precedent and other pertinent information, and we maintain tax accruals consistent with our evaluation. Changes in the estimate of accrued taxes occur periodically due to changes in tax rates, interpretations of tax laws, the status of examinations by the taxing authorities, and newly enacted statutory, judicial, and regulatory guidance that could affect the relative merits of the tax positions. These changes, when they occur, impact accrued taxes and can materially affect our operating results. For additional information, see Note J (Income Taxes) of the Notes to Consolidated Financial Statements.
Other Accounting Issues
We own NBC Capital Corporation (MS) Statutory Trust I (the “Trust”), which was organized under the laws of the State of Connecticut for the purpose of issuing trust preferred securities (“TPSs”). In accordance with ASC Topic 810, “Consolidation,” the Trust, which is considered a variable interest entity, is not consolidated into our financial statements because the only activity of the variable interest entity is the issuance of TPSs.
Comparison of Results of Operations for the Years ended December 31, 2009, 2008 and 2007
Net Income/(Loss)
For 2009, we reported a net loss applicable to common shareholders of $112.2 million, or $(9.42) per common share, compared to a net loss of $3.4 million, or $(0.28) per common share, for 2008, and net income of $9.8 million, or $0.82 per common share, in 2007.
Net Interest Income
Net interest income, the primary source of our earnings, represents income generated from earning assets, less the interest expense of funding those assets. Changes in net interest income may be divided into two components: (1) the change in average earning assets (volume component) and (2) the change in the net interest spread (rate component). Net interest spread represents the difference between yields on earning assets and rates paid on interest-bearing liabilities. Net interest margin is net interest income divided by average earning assets.
Net interest income decreased by $10.0 million, or 18.0%, from $55.4 million in 2008 to $45.4 million in 2009. For 2009, the net interest margin declined to 2.49%, compared to 3.07% for 2008.
Average earning assets increased from $1.81 billion in 2008 to $1.82 billion in 2009, an increase of $18.9 million, or 1.0%. This increase is due to an increase in federal funds sold and other interest-bearing assets, from $17.8 million in 2008 to $160.4 million in 2009, as we intentionally built liquidity by accumulating deposits and investing in short-term assets. The increase was offset somewhat by the $113.5 million decrease in average loan balances between 2008 and 2009 and a $10.2 million decline in average investment securities.
36
Table of Contents
In analyzing the rate component of net interest income, from 2008 to 2009, we lost 127 basis points of yield on our earning assets. However, during this period, the cost of funds decreased by 75 basis points. Our loan portfolio, which is comprised of approximately 57.0% variable rate loans, reflected a yield decrease from 6.04% to 4.99% from 2008 to 2009. The yield on our investment securities portfolio also declined from 2008 to 2009, from 4.77% to 4.30%. However, our cost of deposits declined from 2.88% to 2.08%, and our cost of other borrowings declined from 3.15% to 2.70%.
Our loan yields and margin were also impacted by the reversal of interest income on loans that were placed on non-accrual status. During 2009, these reversals of interest income totaled $1,539,000, compared to $1,139,000 for 2008. This difference amounted to three basis points of yield on our loan portfolio and two basis points on our margin. We are continuing to reduce our exposure to commercial real estate loans, including residential construction and development loans, which typically have higher yields but also carry higher risk.
Net interest income decreased by $1.7 million, or 3.0%, from $57.1 million in 2007 to $55.4 million in 2008. Average earning assets increased from $1.74 billion in 2007 to $1.81 billion in 2008, an increase of $64.4 million, or 3.7%. During this period, the net interest margin declined to 3.07%, compared to 3.28% for 2007.
In analyzing the rate component of net interest income, from 2007 to 2008, we lost 133 basis points of yield on our earning assets. However, during this period, the cost of funds decreased by 127 basis points. Our loan portfolio reflected a yield decrease from 7.75% to 6.04% from 2007 to 2008, due to the 400 basis point reduction in interest rates in 2008. The yield on our investment securities portfolio also declined from 2007 to 2008, from 4.92% to 4.77%. However, our cost of deposits declined from 4.00% to 2.88%, and our cost of other borrowings declined from 5.08% to 3.15%.
The reversals of interest income on loans that were placed on non-accrual status also impacted our loan yields and margin. During 2008, these reversals of interest income totaled $1,139,000, compared to $461,000 for 2007. This difference amounted to five basis points of yield on our loan portfolio and four basis points on our margin.
The increase of $64.4 million in our average earning asset balances between 2007 and 2008 is attributable primarily to a $66.1 million increase in average loan balance. From 2007 to 2008, the average balance of interest-bearing deposits decreased by $10.7 million, and the average balance of other borrowings increased by $77.3 million.
The following table shows, for the periods indicated, an analysis of net interest income, including the average amount of earning assets and interest-bearing liabilities outstanding during the period, the interest earned or paid on such amounts, the average yields/rates paid and the net yield on earning assets on both a book and tax equivalent basis:
| ($ in Thousands) Average Balance | |||||||||
| Year Ended 12/31/09 |
Year Ended 12/31/08 |
Year Ended 12/31/07 | |||||||
| EARNING ASSETS: |
|||||||||
| Net loans |
$ | 1,237,411 | $ | 1,350,870 | $ | 1,284,762 | |||
| Federal funds sold and other interest-bearing assets |
160,353 | 17,774 | 17,444 | ||||||
| Securities: |
|||||||||
| Taxable |
369,295 | 325,761 | 333,481 | ||||||
| Tax-exempt |
56,965 | 110,691 | 104,995 | ||||||
| Totals |
1,824,024 | 1,805,096 | 1,740,682 | ||||||
| INTEREST-BEARING LIABILITIES: |
|||||||||
| Interest-bearing deposits |
1,328,433 | 1,238,156 | 1,248,812 | ||||||
| Borrowed funds, federal funds purchased and securities sold under agreements to repurchase and other interest-bearing liabilities |
273,589 | 370,358 | 293,087 | ||||||
| Totals |
1,602,022 | 1,608,514 | 1,541,899 | ||||||
| Net amounts |
$ | 222,002 | $ | 196,582 | $ | 198,783 | |||
37
Table of Contents
| ($ in Thousands) Interest For | |||||||||
| Year Ended 12/31/09 |
Year Ended 12/31/08 |
Year Ended 12/31/07 | |||||||
| EARNING ASSETS: |
|||||||||
| Net loans |
$ | 61,802 | $ | 81,533 | $ | 99,591 | |||
| Federal funds sold and other interest-bearing assets |
357 | 358 | 809 | ||||||
| Securities: |
|||||||||
| Taxable |
16,026 | 16,296 | 17,173 | ||||||
| Tax-exempt |
2,294 | 4,536 | 4,379 | ||||||
| Totals |
80,479 | 102,723 | 121,952 | ||||||
| INTEREST-BEARING LIABILITIES: |
|||||||||
| Interest-bearing deposits |
27,656 | 35,682 | 49,945 | ||||||
| Borrowed funds, federal funds purchased and securities sold under agreements to repurchase and other interest-bearing liabilities |
7,391 | 11,648 | 14,900 | ||||||
| Totals |
35,047 | 47,330 | 64,845 | ||||||
| Net amounts |
$ | 45,432 | $ | 55,393 | $ | 57,107 | |||
| Yields Earned And Rates Paid (%) | |||||||||
| Year Ended 12/31/09 |
Year Ended 12/31/08 |
Year Ended 12/31/07 | |||||||
| EARNING ASSETS: |
|||||||||
| Net loans |
4.99 | 6.04 | 7.75 | ||||||
| Federal funds sold and other interest-bearing assets |
0.22 | 2.00 | 4.64 | ||||||
| Securities: |
|||||||||
| Taxable |
4.34 | 5.00 | 5.15 | ||||||
| Tax-exempt |
4.03 | 4.10 | 4.17 | ||||||
| Totals |
4.41 | 5.68 | 7.01 | ||||||
| INTEREST-BEARING LIABILITIES: |
|||||||||
| Interest-bearing deposits |
2.08 | 2.88 | 4.00 | ||||||
| Borrowed funds, federal funds purchased and securities sold under agreements to repurchase and other interest-bearing liabilities |
2.70 | 3.15 | 5.08 | ||||||
| Totals |
2.19 | 2.94 | 4.21 | ||||||
| Net amounts |
2.49 | 3.07 | 3.28 | ||||||
| Note: Yields on a tax equivalent basis would be: |
|||||||||
| Tax-exempt securities |
6.20 | 6.31 | 6.42 | ||||||
| Total earning assets |
4.48 | 5.83 | 7.14 | ||||||
| Net yield on earning assets |
2.56 | 3.20 | 3.42 | ||||||
Provision for Loan Losses
We use our provision for loan losses to replenish the allowance for loan losses on our balance sheet. Based on our evaluation of the risk exposure contained in the loan portfolio, management believes that the level of the allowance is adequate. The Board of Directors reviews and approves management’s evaluation. This is an ongoing process through which we review and determine the amount of the provision on a quarterly basis. The provision for loan losses increased from $8.1 million in 2007 to $28.6 million in 2008 and to $79.3 million in 2009. We incurred $56.6 million in net charge-offs in 2009, compared to $22.8 million in 2008 and $5.4 million in 2007. Also, we significantly increased our allowance for loan losses over this period. Our allowance for loan losses was $43.4 million at December 31, 2009, compared with $20.7 million at December 31, 2008, and $14.9 million at December 31, 2007. Please see the “Financial Condition” section of this Management’s Discussion and Analysis for additional discussion of the allowance for loan losses.
38
Table of Contents
Other Income (Noninterest Income)
Other income refers to our noninterest income, which includes various service charges, fees and commissions. One of our strategic objectives has been, and continues to be, the diversification of our other income sources so that we can be less dependent on net interest income. Our other income, exclusive of securities gains and losses, decreased by $47,000, or 0.3%, from 2008 to 2009. The following table presents for the periods indicated the major categories of noninterest income and the changes between periods:
| (In thousands) |
2009 | 2008 | Change | |||||||
| Service charges on deposit accounts |
$ | 8,375 | $ | 9,133 | $ | (758 | ) | |||
| Other service charges and fees |
3,218 | 3,294 | (76 | ) | ||||||
| Trust Department income |
2,121 | 2,305 | (184 | ) | ||||||
| Mortgage loan fees |
1,056 | 1,156 | (100 | ) | ||||||
| Securities gains (losses), net |
3,173 | 385 | 2,788 | |||||||
| Other |
2,760 | 1,689 | 1,071 | |||||||
| Total other income |
$ | 20,703 | $ | 17,962 | $ | 2,741 | ||||
Our service charges on deposit accounts declined by $758,000, or 8.3%, from 2008 to 2009. This decline was due primarily to fewer insufficient funds fees charged in 2009. Our other service charges and fees, Trust Department income, and mortgage loan fees all declined slightly from 2008 to 2009, affected by a variety of factors. Other service charges and fees (specifically retail investment income) and Trust Department income were impacted by lower investment balances and activity reflecting the downturn of the equity markets during much of 2009, and mortgage loan fees were affected by fewer loan closings during 2009. The increase in other noninterest income resulted primarily from a $599,000 gain on the sale of an unused banking facility in our Mississippi market, insurance proceeds from a bank owned life insurance policy of approximately $645,000, a $150,000 reversal of an accrual that was established at the time of our most recent acquisition, and a gain of approximately $145,000 on the sale of our student loan portfolio. The other income balances reflected above do not include other income related to GCM Insurance and the sale of its assets ($4.0 million for 2009 and $5.0 million for 2008).
We recognized $3.2 million in net securities gains during 2009, compared with $385,000 in net securities gains during 2008. There were two primary reasons for this increase in securities gains. First, we liquidated virtually all of our tax-exempt securities portfolio during the third quarter of 2009. Because our operations were generating losses, we were not receiving the full tax benefit of holding these securities. Second, as of September 30, 2009, our securities portfolio included a significant amount of unrealized gains. If rates begin to increase, these gains will begin diminishing. As a result, we decided to take approximately $2.1 million of these gains in the fourth quarter of 2009.
Our other income, exclusive of securities gains and losses, decreased by $22,000, or 0.1%, from 2007 to 2008. The following table presents for the periods indicated the major categories of noninterest income and the changes between periods:
| (In thousands) |
2008 | 2007 | Change | ||||||||
| Service charges on deposit accounts |
$ | 9,133 | $ | 9,295 | $ | (162 | ) | ||||
| Other service charges and fees |
3,294 | 3,337 | (43 | ) | |||||||
| Trust Department income |
2,305 | 2,558 | (253 | ) | |||||||
| Mortgage loan fees |
1,156 | 1,690 | (534 | ) | |||||||
| Securities gains (losses), net |
385 | (17 | ) | 402 | |||||||
| Impairment loss on securities |
— | (5,097 | ) | 5,097 | |||||||
| Other |
1,689 | 719 | 970 | ||||||||
| Total other income |
$ | 17,962 | $ | 12,485 | $ | 5,477 | |||||
Trust Department income declined by 9.9%, because of lower asset balances under management, reflecting the downturn of the equity markets during the year. Mortgage loan fees declined by 31.6%, as a result of reduced home sales and demand for refinancing. The increase in other noninterest income between 2007 and 2008 resulted primarily from a $232,000 gain on the sale of an asset held by the Corporation; a $443,000 gain on the sale of a previously closed branch property in Mississippi; and $110,000 in proceeds from the redemption of stock in VISA. Changes in other accounts were not individually material. The other income balances reflected above do not include other income related to GCM Insurance and the sale of its assets ($5.0 million for both 2008 and 2007).
We recognized $385,000 in net securities gains during 2008, compared with $17,000 in net securities losses during 2007. During the first quarter of 2007, we recognized a $5.1 million impairment loss on certain collateralized mortgage obligations (“CMOs”) and mortgage-backed securities. Those securities were sold in early April and the proceeds reinvested in agency securities.
39
Table of Contents
Other Expense (Noninterest Expense)
Noninterest expense represents ordinary overhead expenses and, from time to time, any impairments to goodwill or other intangibles. These expenses increased by $73.1 million, or 135.7%, from 2008 to 2009. The following table presents for the periods indicated the major categories of noninterest expense and the changes between periods:
| (In thousands) |
2009 | 2008 | Change | |||||||
| Salaries |
$ | 21,784 | $ | 22,386 | $ | (602 | ) | |||
| Employee benefits |
5,392 | 4,756 | 636 | |||||||
| Net occupancy |
3,696 | 3,723 | (27 | ) | ||||||
| Furniture and equipment |
3,963 | 3,884 | 79 | |||||||
| Communications |
1,142 | 1,194 | (52 | ) | ||||||
| Data processing |
1,711 | 1,566 | 145 | |||||||
| Professional fees |
4,397 | 2,415 | 1,982 | |||||||
| FDIC insurance |
4,280 | 923 | 3,357 | |||||||
| Intangible amortization |
619 | 890 | (271 | ) | ||||||
| Loss on sale of assets/other real estate owned |
3,617 | 3,413 | 204 | |||||||
| Impairment loss on goodwill |
66,542 | — | 66,542 | |||||||
| Other |
9,785 | 8,691 | 1,094 | |||||||
| Total other expense |
$ | 126,928 | $ | 53,841 | $ | 73,087 | ||||
Salaries expense declined by 2.7% from 2008 to 2009 due to the suspension of employee raises in 2009 and a reduction in the number of employees. Employee benefits expense increased by 13.3% from 2008 to 2009 as a result of higher pension cost caused by a larger than expected number of plan participants exiting the plan and a lower amount of deferred salary cost associated with our lending staff due to the large reduction in loan volume during 2009. The $2.0 million, or 82.1%, increase in professional fees from 2008 to 2009 is due to increased legal fees associated with OREO, the outsourcing of our internal audit function, and expenses relating to our efforts to raise capital that were suspended during the third quarter of 2009. FDIC insurance premiums increased by $3.4 million in 2009, and we expect these higher premiums to continue into 2010. In accordance with the provisions of ASC Topic 350 and based on the results of a third party analysis, we recognized a $66.8 million impairment loss on goodwill as of March 31, 2009. This impairment charge eliminated all goodwill from our balance sheet, including approximately $304,000 relating to GCM Insurance (reflected in discontinued operations on the consolidated statements of income). Our other noninterest expenses increased by $1.1 million, or 12.6%, in 2009. This increase is primarily due to $934,000 in losses on extinguishment of debt during 2009, as we prepaid several of our FHLB advances. The other expense balances reflected above do not include other expenses related to GCM Insurance and the sale of its assets ($3.6 million for 2009 and $4.5 million for 2008).
Noninterest expenses increased by $4.1 million, or 8.3%, from 2007 to 2008. The following table presents for the periods indicated the major categories of noninterest expense and the changes between periods:
| (In thousands) |
2008 | 2007 | Change | |||||||
| Salaries |
$ | 22,386 | $ | 22,409 | $ | (23 | ) | |||
| Employee benefits |
4,756 | 4,874 | (118 | ) | ||||||
| Net occupancy |
3,723 | 4,162 | (439 | ) | ||||||
| Furniture and equipment |
3,884 | 3,800 | 84 | |||||||
| Communications |
1,194 | 1,215 | (21 | ) | ||||||
| Data processing |
1,566 | 1,674 | (108 | ) | ||||||
| Professional fees |
2,415 | 1,704 | 711 | |||||||
| FDIC insurance |
923 | 248 | 675 | |||||||
| Intangible amortization |
890 | 1,328 | (438 | ) | ||||||
| Loss on sale of assets/other real estate owned |
3,413 | 180 | 3,233 | |||||||
| Other |
8,691 | 8,127 | 564 | |||||||
| Total other expense |
$ | 53,841 | $ | 49,721 | $ | 4,120 | ||||
The 10.5% decrease in net occupancy expense is mostly due to a decrease in premises rental expense and depreciation. Professional fees increased by 41.7% in 2008, due to increased legal fees associated with OREO, attorney consultations regarding our participation in the CPP, and the outsourcing of a portion of our credit review function. FDIC insurance premiums increased by $675,000 in 2008. Prior to 2008, Cadence paid the majority of its FDIC insurance premiums using credits with the FDIC; however, these credits were depleted in early 2008. Due to the increased number of properties foreclosed on by Cadence, we incurred increased legal fees, appraisal fees and other maintenance and holding expenses, as
40
Table of Contents
well as losses on sales of OREO. These expenses totaled approximately $4.1 million in 2008, compared with $463,000 in 2007. The most significant component of this increase is a $2.7 million writedown representing a decline in market value of OREO property that we held and had not yet sold. This writedown is reflected in the “loss on sale of assets/other real estate owned” category of noninterest expense. None of the changes in the other expense categories were considered to be individually material. The other expense balances reflected above do not include other expenses related to GCM Insurance and the sale of its assets ($4.5 million for 2008 and $4.3 million for 2007).
Changes in our income tax expense (benefits) have generally paralleled changes in income. The income tax benefits for 2008 and 2009 result from the losses recognized for the periods, as well as the tax benefits of our tax-exempt income.
Financial Condition as of December 31, 2009
Summary
Total assets were $1.844 billion as of December 31, 2009, compared to $1.979 billion as of December 31, 2008. Our loan portfolio balance was $1.091 billion as of December 31, 2009, compared to $1.328 billion as of December 31, 2008, a decrease of $236.9 million, or 17.8%. Our investment portfolio balance was $346.1 million as of December 31, 2009, compared to $436.4 million as of December 31, 2008, a decrease of $90.4 million, or 20.7%. Total deposits were $1.500 billion as of December 31, 2009, compared to $1.461 billion as of December 31, 2008, an increase of $38.7 million, or 2.6%. Shareholders’ equity was $119.8 million as of December 31, 2009, compared to $185.6 million as of December 31, 2008, a decrease of $65.8 million, or 35.5%.
Loan Portfolio and Allowance for Loan Losses
Historically, our lending focus has been distributed among commercial real estate, commercial and industrial loans, 1-4 family mortgages and consumer loans. Total commercial and industrial loans, which consist primarily of short-term loans for working capital purposes, inventories, seasonal loans, lines of credit and equipment loans, accounted for 17.0% of our loan portfolio as of December 31, 2009, compared to 16.5% as of December 31, 2008. Total real estate loans, which are secured by commercial real estate, one-to-four family residential properties and multi-family dwelling units, accounted for 72.7% of our loan portfolio as of December 31, 2009, compared to 76.0% as of December 31, 2008. Total consumer loans, which consist of home improvement, mobile home, automobile and unsecured personal loans, made up 1.8% of our loan portfolio as of December 31, 2009, compared to 2.3% as of December 31, 2008. See Note D in the Notes to Consolidated Financial Statements for additional information regarding our loan portfolio.
Our loan portfolio declined by $236.9 million, or 17.8%, during 2009. We are continuing to reduce our concentration in commercial real estate loans, particularly residential construction and development loans.
During 2009, the allowance for loan losses increased by $22.7 million, or 109.5%, from $20.7 million to $43.4 million. This increase reflects further deterioration in our loan portfolio, due primarily to the lack of demand for residential housing, as well as an overall decline in the value of real estate. This also resulted in the significant increase in net charge-offs. See Note D in the Notes to Consolidated Financial Statements for additional information concerning the transactions in the allowance for loan losses for the three-year period ended December 31, 2009.
Higher-Risk Loans
Our loan portfolio does not include several types of loans generally considered higher-risk, such as option adjustable-rate mortgage loans, junior lien mortgages, high loan-to-value mortgages, interest-only loans, subprime loans, and loans with teaser rates. Management believes that the highest risk loans in our portfolio are our construction and land development loans.
We entered the Memphis, Birmingham, and Middle Tennessee markets late in the most recent real estate boom cycle. Consequently, our build-up in our construction and land development portfolio and the subsequent lack of demand for residential real estate due to declines in the mortgage markets caused our loan quality to deteriorate. In mid-2008, we established a moratorium on residential construction and development lending. From December 31, 2008 to December 31, 2009, we reduced our exposure in our construction and land development portfolio by $185.7 million, or 52.8%.
41
Table of Contents
The following table reflects the composition of our construction and land development portfolio by market:
| (In thousands) | As of December 31, 2009 |
As of December 31, 2008 |
||||||||||
| Balance | % | Balance | % | |||||||||
| Birmingham |
$ | 17,043 | 10.3 | % | $ | 24,470 | 7.0 | % | ||||
| Florida |
25,600 | 15.4 | % | 30,673 | 8.7 | % | ||||||
| Georgia |
10,820 | 6.5 | % | 12,883 | 3.7 | % | ||||||
| Memphis |
29,816 | 18.0 | % | 86,615 | 24.6 | % | ||||||
| Middle Tennessee |
43,420 | 26.1 | % | 142,895 | 40.6 | % | ||||||
| Mississippi |
29,796 | 17.9 | % | 38,508 | 10.9 | % | ||||||
| Tuscaloosa |
9,717 | 5.8 | % | 15,892 | 4.5 | % | ||||||
| Total |
$ | 166,212 | 100.0 | % | $ | 351,936 | 100.0 | % | ||||
During 2009, we have charged off approximately $38.8 million related to loans in this segment of our portfolio. As of December 31, 2009, our allowance for loan losses includes approximately $22.8 million allocated to construction and land development loans.
All commercial real estate loans, exclusive of the loans discussed above, total approximately $466.3 million as of December 31, 2009. Of this total, 54% represent owner occupied commercial real estate, and 46% represent non-owner occupied commercial real estate.
We have implemented additional risk management procedures focusing on real estate loans, so that we will reduce potential future losses. The moratorium on residential construction and development lending is continuing. We have tightened our underwriting standards for all commercial real estate loans and are not renewing certain loans to move them out of our portfolio. We are conducting builder/developer stress tests for any relationships of one million dollars or greater, and our loan officers are focusing more time on managing and reviewing existing loans, including stress testing, clearing exceptions, and collecting these loans.
We are beginning to see some positive signs in these portfolios; however, we are not ready to say that they have turned upward. We remain very proactive in monitoring these credits across our system since they represent the biggest risk to our future earnings.
Delinquent and Nonperforming Assets
We have several procedures that are designed to maintain the overall quality of our loan portfolio. We have established underwriting guidelines followed by our management and delinquency levels are monitored by our executive committee and reviewed by the Board of Directors for any negative or adverse trends. There can be no assurance, however, that our loan portfolio will not become subject to increasing pressures from deteriorating borrower credit due to general economic conditions.
Trends in delinquency ratios represent an indicator, among other considerations, of credit risk within the loan portfolio. Nonperforming loans include nonaccrual loans, loans past due 90 days or more, and loans renegotiated or restructured because of a debtor’s financial difficulties.
We generally place loans on nonaccrual status if any of the following events occur:
| • | the classification of a loan as nonaccrual internally or by regulatory examiners; |
| • | delinquency on principal for 90 days or more unless management is in the process of collection; |
| • | a balance remains after repossession of collateral; |
| • | notification of bankruptcy; or |
| • | management judges that nonaccrual status is appropriate. |
Cash payments received while a loan is classified as nonaccrual are recorded as a reduction of principal as long as doubt exists as to collection. We are sometimes required to revise the interest rate or repayment terms in a troubled debt restructuring.
We obtain appraisals on loans secured by real estate with principal amounts in excess of $250,000 and may update those appraisals for loans categorized as nonperforming loans and potential problem loans. In instances where updated appraisals reflect reduced collateral values, we evaluate the borrower’s overall financial condition to determine the need, if any, for possible writedowns or appropriate additions to the allowance for loan losses. We record real estate acquired through foreclosure at fair value at the time of acquisition, less estimated costs to sell the property.
42
Table of Contents
The following table presents information regarding nonperforming assets as of the dates indicated:
| As of December 31, | ||||||
| (Dollars in thousands) | 2009 | 2008 | ||||
| Nonaccrual loans |
$ | 41,096 | $ | 23,761 | ||
| Accruing loans past due 90 days or more |
5,582 | 3,467 | ||||
| Restructured loans |
23,505 | 4,397 | ||||
| Total nonperforming loans |
70,183 | 31,625 | ||||
| Other real estate |
34,259 | 18,691 | ||||
| Total nonperforming assets |
$ | 104,442 | $ | 50,316 | ||
Nonperforming assets were $104.4 million as of December 31, 2009, compared to $50.3 million as of December 31, 2008. Our ratio of nonperforming assets to total loans and other real estate was 9.28% as of December 31, 2009, compared to 3.74% as of December 31, 2008. The increase in nonperforming assets in 2009 was due primarily to the continued decline in the economy, resulting in continued deterioration in the construction and development sector of our loan portfolio. As of December 31, 2009, other real estate was comprised primarily of residential real estate developments in various stages of completion.
We follow a loan review program designed to evaluate the credit risk in our loan portfolio. Through this loan review process, we maintain an internally classified watch list which helps management assess the overall quality of the loan portfolio and the adequacy of the allowance for loan losses. Loans included on the watch list that are not otherwise classified show warning elements where the present status portrays one or more deficiencies that require attention in the short term or where pertinent ratios of the loan account have weakened to a point where more frequent monitoring is warranted. These loans do not have all of the characteristics of a classified loan (substandard or doubtful) but do show weakened elements compared to those of a satisfactory credit.
In establishing the appropriate classification for specific assets, we consider, among other factors, the estimated value of the underlying collateral, the borrower’s ability to repay, the borrower’s repayment history and the current delinquent status. As a result of this process, loans are classified as substandard, doubtful or loss.
Loans classified as “substandard” are those loans with clear and defined weaknesses such as a highly leveraged position, unfavorable financial ratios, uncertain repayment sources or poor financial condition which may jeopardize the repayment of the debt as contractually agreed. They are characterized by the distinct possibility that we will sustain some losses if the deficiencies are not corrected. Loans classified as “doubtful” are those loans which have characteristics similar to substandard loans but with an increased risk that collection or liquidation in full is highly questionable and improbable. Loans classified as “loss” are those loans that are in the process of being charged off. Once a loan is deemed uncollectible as contractually agreed, the loan is charged off either partially or in-full against the allowance for loan losses.
Investment Portfolio
The investment portfolio serves as a source of liquidity and earnings and is used to manage interest rate risk and to ensure that collateral is available for pledging requirements. Our investment portfolio primarily consists of agency mortgage-backed securities, pooled government guaranteed SBA loans and taxable and non-taxable municipal securities. Securities within the portfolio are classified as held-to-maturity or available-for-sale. As of December 31, 2009, we had no securities classified as trading. Fair values of securities are based on quoted market prices where available. If quoted market prices are not available, estimated fair values are based on quoted market prices of comparable securities.
Securities available-for-sale are carried at fair value with unrealized holding gains and losses reported as a separate component of shareholders’ equity called accumulated other comprehensive income. Securities that are held as available-for-sale are used as a part of our asset/liability management strategy. Securities may be sold in response to interest rate changes, changes in liquidity needs, changes in tax strategies, changes in prepayment risk or changes to underlying bank funding. Available-for-sale securities were $330.1 million as of December 31, 2009, compared to $398.7 million as of December 31, 2008. As of December 31, 2009, $227.3 million, or 68.9%, of the available-for-sale securities were invested in mortgage-backed securities, compared to $220.5 million, or 55.3%, as of December 31, 2008. The remainder of the available-for-sale portfolio was invested primarily in government securities.
Securities held-to-maturity are carried at amortized historical cost. Securities that we have the intent and ability to hold until maturity or on a long-term basis are classified as held-to-maturity. Held-to-maturity securities were $2.7 million as of
43
Table of Contents
December 31, 2009, compared to $21.4 million as of December 31, 2008. All of the securities in the held-to-maturity category were issued by state and municipal subdivisions. During the third quarter of 2009, we evaluated our portfolio and determined that we were not receiving the full tax benefit of holding tax-exempt securities, based on our year-to-date results of operations. Thus, with the approval of the Board of Directors, we sold most of those securities and invested the proceeds into higher-yielding taxable securities. These securities are reflected in the “securities available-for-sale” caption on our consolidated balance sheet as of December 31, 2009.
See Note C in the Notes to Consolidated Financial Statements for additional information concerning our investment portfolio.
Deposits
Deposits are our primary source of funds, and we rely on our banking centers and branches to attract and retain those deposits. We offer a variety of products, which consist of noninterest-bearing and interest checking accounts, money market and savings accounts and certificates of deposit. Deposits are gathered from individuals, partnerships and corporations in our market areas. From time to time, we also purchase brokered deposits.
Our deposits totaled $1.500 billion as of December 31, 2009, compared to $1.461 billion as of December 31, 2008. This increase resulted from a $49.1 million, or 3.8%, increase in interest-bearing deposits, offset slightly by a $10.5 million, or 5.8%, decrease in noninterest-bearing deposits. As of December 31, 2009, core deposits (which consist of all deposits other than brokered deposits, 50% of time deposits $100,000 and greater and 50% of public funds) were $1.195 billion, or 79.7% of total deposits, while non-core deposits, including brokered deposits, made up 20.3% of total deposits.
The interest rates we pay are based on the competitive environments in each of our markets. We manage our interest expense through weekly deposit pricing reviews that compare our deposit rates with the competition and wholesale alternatives. The rising cost of our deposits over the past few years reflects the impact of the increase in the Federal Funds rate from 2006 through 2008. In addition, we have at times offered special products or attractive rates so that our deposits will keep up with our need for liquidity. The average cost of deposits, including noninterest-bearing deposits, for the year ended December 31, 2009, was 1.84%, compared to 2.52% for the year ended December 31, 2008.
Borrowings, Repurchase Agreements and Junior Subordinated Debentures
We use borrowings to supplement deposits in funding our lending and investing activities. From December 31, 2008 to December 31, 2009, federal funds purchased and securities sold under agreements to repurchase declined by $11.1 million, or 11.3%. Also during 2009, other borrowed funds (primarily FHLB advances) declined by $92.3 million, or 48.9%. These declines were primarily the result of rising deposits, which provided us with a less expensive and more stable funding source than wholesale borrowings. We intend to use our excess liquidity to absorb our maturing wholesale borrowings to reduce interest expense.
In addition to the borrowings and repurchase agreements discussed above, on December 20, 2003, the Corporation issued $30.9 million of floating rate junior subordinated deferrable interest debentures to the Trust. The debentures are the sole asset of the Trust. The net proceeds received by the Corporation from the issuance of the debentures were used for our acquisition of Enterprise Bancshares, Inc. The Trust issued $30.0 million of TPSs to investors. The Corporation’s obligations under the debentures and related documents, taken together, constitute a full and unconditional guarantee by the Corporation of the Trust’s obligations under the TPSs. The TPSs are redeemable at the Corporation’s option on or after December 30, 2008, on any interest payment date. The TPSs must be redeemed upon maturity of the debentures in 2033. Interest on the debentures and TPSs is the three month London Interbank Offer Rate (“LIBOR”) plus 2.85% and is payable quarterly.
The Trust is a statutory business trust organized for the sole purpose of issuing trust securities and investing the proceeds in our junior subordinated debentures. The TPSs represent preferred beneficial interests in the assets of the Trust and are subject to mandatory redemption upon payment of the junior subordinated debentures held by the Trust. We own the common securities of the Trust. The Trust’s ability to pay amounts due on the TPSs depends solely on our making payment on the related junior subordinated debentures. The debentures, which are the only assets of the Trust, are subordinate and junior in right of payment to all of our present and future senior indebtedness.
Under the provisions of the issue of the junior subordinated debentures, we have the right to defer payment of interest on the debentures at any time, or from time to time, for periods not exceeding five years. If interest payments on the junior subordinated debentures are deferred, the distributions on the TPSs will also be deferred. However, the interest due would continue to accrue during any such interest payment deferral period.
44
Table of Contents
Shareholders’ Equity
Shareholders’ equity was $119.7 million as of December 31, 2009, compared to $185.6 million as of December 31, 2008. Our ratio of average shareholders’ equity to average assets decreased to 7.3% as of December 31, 2009, compared to 9.6% as of December 31, 2008. On January 9, 2009, we sold $44 million of non-voting Series A preferred stock to the U.S. Treasury under the CPP. During 2009, we reported a net loss applicable to common shareholders of $112.2 million. Included in this amount are the payment of $1.9 million in preferred dividends and $408,000 of discount accretion related to the Series A preferred stock. Also, we declared common dividends to our shareholders of $595,000 for the first quarter of 2009. Finally, an increase in the market value of our available-for-sale investment securities and an adjustment to our pension liability caused our accumulated other comprehensive income to increase from $237,000 at December 31, 2008, to $2.6 million at December 31, 2009.
Dividends paid by the Corporation are provided from dividends received from the Bank. Under regulations controlling national banks, the payment of dividends by a bank without prior approval from the OCC is limited in amount to the current year’s net profit and the retained net earnings of the two preceding years. At December 31, 2008 and 2009, without approval from the OCC, the Bank does not have the ability to pay dividends to the Corporation. On May 5, 2009, our Board of Directors voted to suspend paying cash dividends on common stock until further notice.
Regulatory Capital
The Bank is subject to the capital adequacy requirements of the OCC. The Corporation, as a bank holding company, is subject to the capital adequacy requirements of the Federal Reserve. Failure to meet minimum capital requirements can initiate certain mandatory and possibly additional discretionary actions by regulators that, if undertaken, could have a direct material effect on our consolidated financial statements. Under capital adequacy guidelines and the regulatory framework for prompt corrective action, the Corporation and Cadence must meet specific capital guidelines that involve quantitative measures of assets, liabilities and certain off-balance sheet items as calculated under regulatory accounting practices. Capital amounts and classifications are also subject to qualitative judgment by regulators about components, risk weightings, and other related factors.
The risk-based capital requirements of the Federal Reserve and the OCC define capital and establish minimum capital requirements in relation to assets and off-balance sheet exposure, adjusted for credit risk. The risk-based capital standards currently in effect are designed to make regulatory capital requirements more sensitive to differences in risk profiles among bank holding companies and banks, to account for off-balance sheet exposure and to minimize disincentives for holding liquid assets. Assets and off-balance sheet items are assigned to broad risk categories, each with appropriate relative risk weights. The resulting capital ratios represent capital as a percentage of total risk-weighted assets and off-balance sheet items. For additional information, see Note O (Regulatory Matters) of the Notes to Consolidated Financial Statements.
The following table reflects the Tier 1 risk-based capital, total risk-based capital and Tier 1 leverage ratios for the Corporation and the Bank as of December 31, 2009:
| Corporation | Bank | |||||
| Total risk-based |
10.9 | % | 10.2 | % | ||
| Tier 1 risk-based |
9.6 | 8.9 | ||||
| Tier 1 leverage |
6.3 | 6.0 |
As part of an agreement entered into with the OCC in April 2009, the Bank was required to achieve by September 30, 2009, and maintain on an ongoing basis, a Tier 1 leverage ratio of 8.0% and a total risk-based capital ratio of 12.0%. As of December 31, 2009, the Bank had a Tier 1 leverage ratio of 6.0% and a total risk-based capital ratio of 10.2%. As a result of our 2009 losses and the Bank’s requirement for additional capital to meet these higher ratios, we have a need to raise additional capital. We are currently seeking to raise this capital through all available sources, including public or private equity offerings. However, at this time, there can be no assurance as to the availability or terms upon which this capital might be available.
Liquidity, Inflation, and Asset/Liability Management
Liquidity may be defined as our ability to meet cash flow requirements created by decreases in deposits and/or other sources of funds or increases in loan demand. We have not experienced any problems with liquidity during 2009 and anticipate that all liquidity requirements will be met in the future. Our traditional sources of funds from deposit growth, maturing loans and investments, wholesale borrowing lines and earnings have generally allowed us to consistently generate sufficient funds to meet our daily operational liquidity needs. As the result of a $236.9 million decrease in loans and a $38.7 million increase in deposits in 2009 from 2008, our loan/deposit ratio declined from 90.1% in 2008 to 72.8% in 2009. Our total funding sources include not only deposits, but also federal funds purchased, securities sold under agreements to repurchase, FHLB
45
Table of Contents
borrowings and Federal Reserve borrowings. When we include these sources of funding with deposits, our loans to total funding ratio declined from 76.0% in 2008 to 64.9% in 2009. Management’s target loans to deposits ratio is in the range of 75-85%, and our goal is to limit wholesale funding to no more than 25% of total assets.
We offer retail repurchase agreements to accommodate excess funds of some of our larger depositors. Management believes that these repurchase agreements stabilize traditional deposit sources as opposed to risking the potential loss of these funds to alternative investment arrangements. Retail repurchase agreements, which we view as a source of funds, totaled $48.5 million and $37.4 million at December 31, 2008 and 2009, respectively. The level of retail repurchase agreement activity is limited by the availability of investment portfolio securities to be pledged against the accounts and our asset/liability funding policy. Because of the limited amount of retail repurchase agreements and the fact that the underlying securities remain under our control, we do not consider the exposure for this service material.
In March 2008, we restructured a $25.0 million repurchase transaction initially entered into in December 2006. This transaction is a standard repurchase transaction with a fixed rate of 4.10% and a thirty-three month term. The transaction has a quarterly call option after nine months. In September 2007, we entered into a $25.0 million structured repurchase transaction. This transaction was a standard repurchase transaction with a fixed rate of 4.255% and a forty-two month term. The transaction has a quarterly call option after one year.
We believe that traditional sources of cash flow, along with additional wholesale borrowings, if necessary, will provide the cash to allow us to meet our obligations with no adverse effect on liquidity. At December 31, 2009, we had a $37.3 million available line of credit from the Federal Reserve and other unused short-term borrowing lines (federal funds purchased lines) of approximately $55.0 million from upstream correspondent banks. As of December 31, 2009, we had $95.0 million in outstanding FHLB borrowings.
In December 2007, we extended a secured line of credit with an upstream correspondent that provided us access to borrow up to $30.0 million. These borrowings would have been used to finance acquisitions and for other general corporate purposes, provided that the borrowings used for purposes other than acquisitions did not exceed $15.0 million. We did not borrow funds under this line and terminated this agreement in February 2009, because the upstream correspondent decided to exit this line of business and we had adequate liquidity at the Corporation level to meet our cash needs.
We have no plans to refinance or redeem any liabilities other than normal maturities and payments relating to the FHLB borrowings. We do not have plans at this time for any discretionary spending that would have a material impact on liquidity. Under regulations controlling bank holding companies and national banks, the Bank is limited in the amount it can lend to the Corporation, and those loans are required to be on a fully secured basis. At December 31, 2009, there were no loans between the Bank and the Corporation.
Because the majority of assets and liabilities of a financial institution are monetary in nature, a financial institution differs greatly from most commercial and industrial companies, which have significant investments in fixed assets or inventories. Fluctuations in interest rates and actions of the Federal Reserve to regulate the national money supply to mitigate recessionary and inflationary pressures have a greater effect on a financial institution’s profitability than do higher costs for goods and services.
The primary objective of rate sensitivity management is to maintain net interest income growth while reducing exposure to adverse fluctuations in rates. The Asset/Liability Management Committee of the Board of Directors evaluates and analyzes our pricing, asset/liability maturities and growth, and balance sheet mix strategies in an effort to make informed decisions that will increase income and limit interest rate risk. The Committee uses simulation modeling as a guide for decision-making and to forecast changes in net income and the economic value of equity under assumed fluctuations in interest rate levels.
Due to the potential volatility of interest rates, our goal is to stabilize the net interest margin by maintaining a relatively neutral rate sensitive position. As of December 31, 2009, our balance sheet reflected approximately $114.8 million more in rate sensitive liabilities than assets that were scheduled to reprice within one year. This represents 6.22% of our total assets and indicates that we are in a liability-sensitive position. This computation results from a static gap analysis that weights assets and liabilities equally. Management believes that interest rates will remain flat for at least the first two quarters of 2010 and that our current position is appropriate for this rate environment. Management does not believe that it is in our best interest to speculate on changes in interest rate levels. Although earnings could be enhanced if predictions were correct, if interest rates move against predictions, then the Bank’s earnings will be less than predicted.
During 2009, we maintained a consistent and disciplined asset/liability management policy focusing on interest rate risk and sensitivity.
Off-Balance Sheet Arrangements and Contractual Obligations
During 2008, we hedged a portion of our floating rate prime based lending portfolio using floating to fixed interest rate swaps. These transactions were initiated to protect us from future downward fluctuations in the prime rate and to help ensure
46
Table of Contents
a more consistent cash flow from interest earned by our prime based lending portfolio. The transactions were cash flow hedges as defined by ASC Topic 815, “Derivatives and Hedging,” and they were accounted for in accordance with that guidance. As of December 31, 2009, we have no outstanding swaps.
The following table reflects our contractual obligations as of December 31, 2009:
| (In thousands) |
Total | Due in less than 1 year |
Due in 1-3 years |
Due in 3-5 years |
Due after 5 years | ||||||||||
| FHLB advances |
$ | 95,000 | $ | 35,000 | $ | 15,000 | $ | 20,000 | $ | 25,000 | |||||
| Subordinated debentures |
30,928 | — | — | — | 30,928 | ||||||||||
| Operating leases |
15,285 | 1,691 | 3,097 | 2,782 | 7,715 | ||||||||||
| Federal funds purchased and securities sold under agreements to repurchase |
87,432 | 37,432 | 50,000 | — | — | ||||||||||
| Other borrowings |
1,640 | 1,640 | — | — | — | ||||||||||
| Total contractual obligations |
$ | 230,285 | $ | 75,763 | $ | 68,097 | $ | 22,782 | $ | 63,643 | |||||
The following table reflects our other commercial commitments as of December 31, 2009:
| (In thousands) |
Total | Expires in less than 1 year |
Expires in 1-3 years |
Expires in 3-5 years |
Expires after 5 years | ||||||||||
| Lines of credit (unfunded commitments) |
$ | 162,029 | $ | 105,755 | $ | 12,222 | $ | 9,014 | $ | 35,038 | |||||
| Standby letters of credit |
12,086 | 5,223 | 3,836 | 3,027 | — | ||||||||||
| Total commercial commitments |
$ | 174,115 | $ | 110,978 | $ | 16,058 | $ | 12,041 | $ | 35,038 | |||||
Market Information
Our stock is listed on the NASDAQ and is traded under the symbol CADE. Registrar and Transfer Company acts as our transfer agent. The following table sets forth, for the periods indicated, the range of sales prices of our common stock as reported on NASDAQ for 2008 and 2009 and the dividends declared for each period.
| YEAR |
QUARTER |
HIGH | LOW | CASH DIVIDEND DECLARED PER QUARTER | |||||||
| 2008 |
First |
$ | 16.99 | $ | 13.88 | $ | 0.25 | ||||
| Second |
16.87 | 10.50 | 0.25 | ||||||||
| Third |
12.30 | 8.27 | 0.05 | ||||||||
| Fourth |
10.39 | 4.10 | 0.05 | ||||||||
| 2009 |
First |
$ | 5.56 | $ | 3.05 | $ | 0.05 | ||||
| Second |
5.29 | 1.94 | — | ||||||||
| Third |
2.53 | 1.48 | — | ||||||||
| Fourth |
2.15 | 1.29 | — | ||||||||
On May 5, 2009, our Board of Directors voted to suspend paying cash dividends on common stock until further notice.
ITEM 7A - QUANTITATIVE AND QUALITATIVE DISCLOSURES ABOUT MARKET RISK
The Corporation is exposed only to U.S. dollar interest rate changes and, accordingly, we manage exposure by considering the possible changes in the net interest margin. We do not have any trading instruments nor do we classify any portion of our investment portfolio as held for trading. In 2007 and 2008, we entered into floating to fixed interest rate swaps to hedge a portion of our floating rate prime based lending portfolio. We had no outstanding hedges as of December 31, 2009. The transactions were cash flow hedges as defined by ASC Topic 815, “Derivatives and Hedging,” and were accounted for under that guidance. These transactions were in line with our asset/liability strategy and were entered into to help protect the Corporation against an unexpected downturn in short-term interest rates. As we continue to enhance our asset/liability management, we will continue to look for opportunities to protect the Corporation from unexpected changes in interest rates. We have no exposure to foreign currency exchange rate risk, commodity price risk, and other market risks.
47
Table of Contents
The following table reflects the year-end position of our interest-earning assets and interest-bearing liabilities, which can either reprice or mature within the designated time period. The interest rate sensitivity gaps can vary from day-to-day and are not necessarily a reflection of the future. In addition, certain assets and liabilities within the same designated time period may nonetheless reprice at different times and at different levels.
| ($ In Thousands) December 31, 2009 Interest Sensitive Within (Cumulative) |
||||||||||||||||
| Three Months | Twelve Months | Five Years | Total | |||||||||||||
| Interest-earning assets: |
||||||||||||||||
| Loans |
$ | 563,918 | $ | 727,598 | $ | 1,003,233 | $ | 1,091,477 | ||||||||
| Investment and mortgage-backed securities |
33,666 | 90,137 | 211,835 | 346,063 | ||||||||||||
| Federal funds sold and other |
30,125 | 50,103 | 50,103 | 50,103 | ||||||||||||
| $ | 627,709 | $ | 867,838 | $ | 1,265,171 | $ | 1,487,643 | |||||||||
| Interest-bearing liabilities: |
||||||||||||||||
| Deposits |
$ | 439,024 | $ | 852,639 | $ | 1,397,025 | $ | 1,499,810 | ||||||||
| Borrowed funds |
70,000 | 130,000 | 190,000 | 215,000 | ||||||||||||
| $ | 509,024 | $ | 982,639 | $ | 1,587,025 | $ | 1,714,810 | |||||||||
| Sensitivity gap: |
||||||||||||||||
| Dollar amount |
$ | 118,685 | $ | (114,801 | ) | $ | (321,854 | ) | $ | (227,167 | ) | |||||
| Percent of total interest-earning assets |
18.91 | % | -13.23 | % | -25.44 | % | -15.27 | % | ||||||||
The matching of assets and liabilities may be analyzed by examining the extent to which such assets and liabilities are “interest rate sensitive” and by monitoring an institution’s interest rate sensitivity “gap.” An asset or liability is said to be interest rate sensitive within a specific time period if it will mature or reprice within that time period. The interest rate sensitivity gap is defined as the difference between the amounts of interest-earning assets and interest-bearing liabilities anticipated, based upon certain assumptions, to mature or reprice within that time period. A gap is considered positive when the amount of interest rate sensitive assets maturing within a specific time frame exceeds the amount of interest rate sensitive liabilities maturing within that same time frame. During a period of falling interest rates, a negative gap would tend to result in an increase in net interest income while a positive gap would tend to adversely affect net interest income. In a rising interest rate environment, an institution with a positive gap would generally be expected, absent the effects of other factors, to experience a greater increase in the yield of its assets relative to the costs of its liabilities and thus an increase in the institution’s net interest income would result.
At December 31, 2009, total interest-earning assets maturing or repricing within one year were less than interest-bearing liabilities maturing or repricing within the same time period by approximately $114.8 million (cumulative), representing a negative cumulative one-year gap of 13.2% of earning assets. Management believes this position to be acceptable in the current interest rate environment.
Banking regulators have issued advisories concerning the management of interest rate risk (“IRR”). The regulators consider effective interest rate management an essential component of safe and sound banking practices. To monitor our IRR, our interest rate management practices include (a) risk management, (b) risk monitoring and (c) risk control as described below.
Risk management consists of a system in which a measurement is taken of the amount of earnings at risk when interest rates change. We first prepare a “base strategy,” which is the position of the Bank and its forecasted earnings based upon the current interest rate environment or most likely interest rate environment. The IRR is then measured based upon hypothetical changes in interest rates by measuring the impact such a change will have on the “base strategy.”
Risk monitoring consists of evaluating the “base strategy” and the assumptions used in its development based upon the current interest rate environment. This evaluation is performed quarterly by management or more often in a rapidly changing interest rate situation and monitored by the Asset/Liability Management Committee of Cadence’s Board of Directors.
Risk control consists of setting policies and parameters regarding interest rates and performing simulations based on trends and projections. Interest rate risk is managed based upon our tolerance for interest rate exposure and the resulting effect on net interest income and the economic value of equity. A balance sheet and income statement simulation model is prepared monthly, using current month end data. A base case simulation is prepared monthly using current month growth trends, projected forward and a flat rate forecast. Two additional interest rate shock simulations are prepared, one showing rates rising 200 basis points and one showing a 200 basis point decline in rates. Our policy is that a 200 basis point shock in rates should not cause the projection of net interest income to change by more than 15% and cause the economic value of equity to change by more that than +25% and –20%. The December 2009 model reflects net interest income under this scenario increasing by 7.92% with a 200 basis point upward shock of rates and decreasing 5.59% if rates are shocked down 200 basis points. At December 31, 2009, a 200 basis point immediate increase in interest rates would have resulted in a 7.72% increase in market value of equity, and a 200 basis point instant decrease would have resulted in a 12.68% decrease in market value of equity. At December 31, 2009, we are within policy on both of these tests, and management believed that changes in net interest income and market value of equity, as reflected in our models, were acceptable.
48
Table of Contents
ITEM 8 - FINANCIAL STATEMENTS AND SUPPLEMENTARY DATA
REPORT OF INDEPENDENT REGISTERED PUBLIC ACCOUNTING FIRM
To the Audit Committee of the Board of Directors and Shareholders
Cadence Financial Corporation
We have audited the accompanying consolidated balance sheets of Cadence Financial Corporation and subsidiaries as of December 31, 2009 and 2008, and the related consolidated statements of income, changes in shareholders’ equity and comprehensive income, and cash flows for each of the three years in the period ended December 31, 2009. We also have audited Cadence Financial Corporation’s internal control over financial reporting as of December 31, 2009, based on criteria established in “ Internal Control – Integrated Framework” issued by the Committee of Sponsoring Organizations of the Treadway Commission (COSO). Cadence Financial Corporation’s management is responsible for these financial statements, for maintaining effective internal control over financial reporting, and for its assessment of the effectiveness of internal control over financial reporting, included in the accompanying “Management’s Report on Internal Control Over Financial Reporting.” Our responsibility is to express an opinion on these financial statements and an opinion on the Corporation’s internal control over financial reporting based on our audits.
We conducted our audits in accordance with the standards of the Public Company Accounting Oversight Board (United States). Those standards require that we plan and perform the audits to obtain reasonable assurance about whether the financial statements are free of material misstatement and whether effective internal control over financial reporting was maintained in all material respects. Our audits of the financial statements included examining, on a test basis, evidence supporting the amounts and disclosures in the financial statements, assessing the accounting principles used and significant estimates made by management, and evaluating the overall financial statement presentation. Our audit of internal control over financial reporting included obtaining an understanding of internal control over financial reporting, assessing the risk that a material weakness exists, and testing and evaluating the design and operating effectiveness of internal control based on the assessed risk. Our audits also included performing such other procedures as we considered necessary in the circumstances. We believe that our audits provide a reasonable basis for our opinions.
A company’s internal control over financial reporting is a process designed to provide reasonable assurance regarding the reliability of financial reporting and the preparation of financial statements for external purposes in accordance with generally accepted accounting principles. A company’s internal control over financial reporting includes those policies and procedures that (1) pertain to the maintenance of records that, in reasonable detail, accurately and fairly reflect the transactions and dispositions of the assets of the company; (2) provide reasonable assurance that transactions are recorded as necessary to permit preparation of financial statements in accordance with generally accepted accounting principles, and that receipts and expenditures of the company are being made only in accordance with authorizations of management and directors of the company; and (3) provide reasonable assurance regarding prevention or timely detection of unauthorized acquisition, use, or disposition of the company’s assets that could have a material effect on the financial statements.
Because of its inherent limitations, internal control over financial reporting may not prevent or detect misstatements. Also, projections of any evaluation of effectiveness to future periods are subject to the risk that controls may become inadequate because of changes in conditions, or that the degree of compliance with the policies or procedures may deteriorate.
In our opinion, the financial statements referred to above present fairly, in all material respects, the consolidated financial position of Cadence Financial Corporation and subsidiaries as of December 31, 2009 and 2008, and the results of their operations and their cash flows for each of the three years in the period ended December 31, 2009, in conformity with accounting principles generally accepted in the United States of America. Also in our opinion, Cadence Financial Corporation maintained, in all material respects, effective internal control over financial reporting as of December 31, 2009, based on criteria established in “Internal Control – Integrated Framework” issued by the Committee of Sponsoring Organizations of the Treadway Commission (COSO).
/s/ T. E. Lott & Company
Columbus, Mississippi
March 29, 2010
49
Table of Contents
CADENCE FINANCIAL CORPORATION
CONSOLIDATED BALANCE SHEETS
DECEMBER 31, 2009 AND 2008
| 2009 | 2008 | |||||||
| (In thousands) | ||||||||
| ASSETS |
||||||||
| Cash and due from banks |
$ | 17,450 | $ | 37,207 | ||||
| Interest-bearing deposits with banks |
249,460 | 14,403 | ||||||
| Federal funds sold |
30,125 | 9,623 | ||||||
| Total cash and cash equivalents |
297,035 | 61,233 | ||||||
| Securities available-for-sale |
330,079 | 398,702 | ||||||
| Securities held-to-maturity (estimated fair value of $2,741 in 2009 and $22,115 in 2008) |
2,671 | 21,358 | ||||||
| Other securities |
13,313 | 16,369 | ||||||
| Total securities |
346,063 | 436,429 | ||||||
| Loans |
1,091,477 | 1,328,329 | ||||||
| Less allowance for loan losses |
(43,422 | ) | (20,730 | ) | ||||
| Net loans |
1,048,055 | 1,307,599 | ||||||
| Interest receivable |
7,338 | 9,714 | ||||||
| Premises and equipment |
31,247 | 33,409 | ||||||
| Goodwill and other intangible assets |
1,384 | 68,849 | ||||||
| Other assets |
113,333 | 62,036 | ||||||
| Total Assets |
$ | 1,844,455 | $ | 1,979,269 | ||||
| LIABILITIES AND SHAREHOLDERS’ EQUITY |
||||||||
| Liabilities: |
||||||||
| Noninterest-bearing deposits |
$ | 170,722 | $ | 181,191 | ||||
| Interest-bearing deposits |
1,329,088 | 1,279,968 | ||||||
| Total deposits |
1,499,810 | 1,461,159 | ||||||
| Interest payable |
2,046 | 2,892 | ||||||
| Federal funds purchased and securities sold under agreements to repurchase |
87,432 | 98,527 | ||||||
| Subordinated debentures |
30,928 | 30,928 | ||||||
| Other borrowed funds |
96,640 | 188,938 | ||||||
| Other liabilities |
7,845 | 11,260 | ||||||
| Total liabilities |
1,724,701 | 1,793,704 | ||||||
| Shareholders’ equity: |
||||||||
| Preferred stock - $10 par value, authorized 10,000,000 shares in 2009; issued 44,000 shares in 2009 |
42,097 | — | ||||||
| Common stock - $1 par value, authorized 50,000,000 shares in 2009 and 2008; issued 11,912,564 shares in 2009 and 11,914,814 shares in 2008 |
11,913 | 11,915 | ||||||
| Surplus |
95,931 | 93,438 | ||||||
| Retained earnings (accumulated deficit) |
(32,832 | ) | 79,975 | |||||
| Accumulated other comprehensive income |
2,645 | 237 | ||||||
| Total shareholders’ equity |
119,754 | 185,565 | ||||||
| Total Liabilities and Shareholders’ Equity |
$ | 1,844,455 | $ | 1,979,269 | ||||
The accompanying notes are an integral part of these statements.
50
Table of Contents
CADENCE FINANCIAL CORPORATION
CONSOLIDATED STATEMENTS OF INCOME FOR
YEARS ENDED DECEMBER 31,
| (Amounts in thousands, except per share data) |
2009 | 2008 | 2007 | ||||||||
| INTEREST INCOME |
|||||||||||
| Interest and fees on loans |
$ | 61,802 | $ | 81,533 | $ | 99,591 | |||||
| Interest and dividends on securities |
|||||||||||
| Taxable |
16,026 | 16,296 | 17,173 | ||||||||
| Tax-exempt |
2,294 | 4,536 | 4,379 | ||||||||
| Other interest income |
357 | 358 | 809 | ||||||||
| Total interest income |
80,479 | 102,723 | 121,952 | ||||||||
| INTEREST EXPENSE |
|||||||||||
| Interest on time deposits of $100,000 or greater |
12,474 | 15,116 | 18,838 | ||||||||
| Interest on other deposits |
15,182 | 20,566 | 31,107 | ||||||||
| Interest on borrowed funds |
7,391 | 11,648 | 14,900 | ||||||||
| Total interest expense |
35,047 | 47,330 | 64,845 | ||||||||
| Net interest income |
45,432 | 55,393 | 57,107 | ||||||||
| Provision for loan losses |
79,328 | 28,599 | 8,130 | ||||||||
| Net interest income (loss) after provision for loan losses |
(33,896 | ) | 26,794 | 48,977 | |||||||
| OTHER INCOME |
|||||||||||
| Service charges on deposit accounts |
8,375 | 9,133 | 9,295 | ||||||||
| Other service charges and fees |
3,218 | 3,294 | 3,337 | ||||||||
| Trust Department income |
2,121 | 2,305 | 2,558 | ||||||||
| Mortgage loan fees |
1,056 | 1,156 | 1,690 | ||||||||
| Securities gains (losses), net |
3,173 | 385 | (17 | ) | |||||||
| Impairment loss on securities |
— | — | (5,097 | ) | |||||||
| Other income |
2,760 | 1,689 | 719 | ||||||||
| Total other income |
20,703 | 17,962 | 12,485 | ||||||||
| OTHER EXPENSE |
|||||||||||
| Salaries |
21,784 | 22,386 | 22,409 | ||||||||
| Employee benefits |
5,392 | 4,756 | 4,874 | ||||||||
| Net occupancy |
3,696 | 3,723 | 4,162 | ||||||||
| Furniture and equipment |
3,963 | 3,884 | 3,800 | ||||||||
| Communications |
1,142 | 1,194 | 1,215 | ||||||||
| Data processing |
1,711 | 1,566 | 1,674 | ||||||||
| Professional fees |
4,397 | 2,415 | 1,704 | ||||||||
| FDIC insurance |
4,280 | 923 | 248 | ||||||||
| Intangible amortization |
619 | 890 | 1,328 | ||||||||
| Loss on sale of assets/other real estate owned |
3,617 | 3,413 | 180 | ||||||||
| Impairment loss on goodwill |
66,542 | — | — | ||||||||
| Other expense |
9,785 | 8,691 | 8,127 | ||||||||
| Total other expense |
126,928 | 53,841 | 49,721 | ||||||||
(Continued)
51
Table of Contents
CADENCE FINANCIAL CORPORATION
CONSOLIDATED STATEMENTS OF INCOME FOR
YEARS ENDED DECEMBER 31,
| (Amounts in thousands, except per share data) |
2009 | 2008 | 2007 | ||||||||
| Income (loss) from continuing operations, before income taxes |
$ | (140,121 | ) | $ | (9,085 | ) | $ | 11,741 | |||
| Income tax expense (benefit) |
(30,130 | ) | (5,303 | ) | 2,458 | ||||||
| Net income (loss) from continuing operations |
(109,991 | ) | (3,782 | ) | 9,283 | ||||||
| Income from discontinued operations |
441 | 710 | 840 | ||||||||
| Income tax expense |
384 | 284 | 330 | ||||||||
| Net income from discontinued operations |
57 | 426 | 510 | ||||||||
| Net income (loss) |
(109,934 | ) | (3,356 | ) | 9,793 | ||||||
| Preferred stock dividends and accretion of discount |
2,278 | — | — | ||||||||
| Net income (loss) applicable to common shareholders |
$ | (112,212 | ) | $ | (3,356 | ) | $ | 9,793 | |||
| Net income (loss) per share from continuing operations - basic and diluted |
$ | (9.23 | ) | $ | (0.32 | ) | $ | 0.78 | |||
| Net income (loss) per share from discontinued operations - basic and diluted |
$ | — | $ | 0.04 | $ | 0.04 | |||||
| Net income (loss) per share - basic and diluted |
$ | (9.23 | ) | $ | (0.28 | ) | $ | 0.82 | |||
| Net income (loss) applicable to common shareholders per share - basic and diluted |
$ | (9.42 | ) | $ | (0.28 | ) | $ | 0.82 | |||
The accompanying notes are an integral part of these statements.
52
Table of Contents
CADENCE FINANCIAL CORPORATION
CONSOLIDATED STATEMENTS OF CHANGES IN SHAREHOLDERS’ EQUITY
YEARS ENDED DECEMBER 31, 2009, 2008, AND 2007
| (In thousands) |
Comprehensive Income |
Preferred Stock |
Common Stock |
Surplus | Retained Earnings |
Accumulated Other Comprehensive Income (Loss) |
Total | |||||||||||||||||||
| Balance, January 1, 2007 |
$ | — | $ | 11,889 | $ | 93,122 | $ | 92,947 | $ | (6,693 | ) | $ | 191,265 | |||||||||||||
| Comprehensive income: |
||||||||||||||||||||||||||
| Net income for 2007 |
$ | 9,793 | — | — | — | 9,793 | — | 9,793 | ||||||||||||||||||
| Net change in unrealized gains (losses) on securities available-for-sale, net of tax |
5,273 | — | — | — | — | 5,273 | 5,273 | |||||||||||||||||||
| Net change in unrealized gains (losses) on derivative transactions |
63 | — | — | — | — | 63 | 63 | |||||||||||||||||||
| Net change in pension liability |
(268 | ) | — | — | — | — | (268 | ) | (268 | ) | ||||||||||||||||
| Comprehensive income |
$ | 14,861 | ||||||||||||||||||||||||
| Cash dividends declared, $1.00 per share |
— | — | — | (11,897 | ) | — | (11,897 | ) | ||||||||||||||||||
| Net performance share activity |
— | 12 | 234 | — | — | 246 | ||||||||||||||||||||
| Unearned compensation relating to performance shares |
— | — | (105 | ) | — | — | (105 | ) | ||||||||||||||||||
| Balance, December 31, 2007 |
$ | — | $ | 11,901 | $ | 93,251 | $ | 90,843 | $ | (1,625 | ) | $ | 194,370 | |||||||||||||
| Cumulative-effect adjustment for ASC Subtopic 715-60 adoption |
— | — | — | (368 | ) | — | (368 | ) | ||||||||||||||||||
| Comprehensive income (loss): |
||||||||||||||||||||||||||
| Net loss for 2008 |
$ | (3,356 | ) | — | — | — | (3,356 | ) | — | (3,356 | ) | |||||||||||||||
| Net change in unrealized gains (losses) on securities available-for-sale, net of tax |
2,920 | — | — | — | — | 2,920 | 2,920 | |||||||||||||||||||
| Net change in unrealized gains (losses) on derivative transactions |
94 | — | — | — | — | 94 | 94 | |||||||||||||||||||
| Net change in pension liability |
(1,152 | ) | — | — | — | — | (1,152 | ) | (1,152 | ) | ||||||||||||||||
| Comprehensive income (loss) |
$ | (1,494 | ) | |||||||||||||||||||||||
| Cash dividends declared, $0.60 per share |
— | — | — | (7,144 | ) | — | (7,144 | ) | ||||||||||||||||||
| Net performance share activity |
— | 14 | 213 | — | — | 227 | ||||||||||||||||||||
| Unearned compensation relating to performance shares |
— | — | (26 | ) | — | — | (26 | ) | ||||||||||||||||||
| Balance, December 31, 2008 |
$ | — | $ | 11,915 | $ | 93,438 | $ | 79,975 | $ | 237 | $ | 185,565 | ||||||||||||||
(Continued)
53
Table of Contents
CADENCE FINANCIAL CORPORATION
CONSOLIDATED STATEMENTS OF CHANGES IN SHAREHOLDERS’ EQUITY
YEARS ENDED DECEMBER 31, 2009, 2008, AND 2007
| (In thousands) |
Comprehensive Income |
Preferred Stock |
Common Stock |
Surplus | Retained Earnings |
Accumulated Other Comprehensive Income (Loss) |
Total | |||||||||||||||||||
| Balance, December 31, 2008 (brought forward) |
$ | — | $ | 11,915 | $ | 93,438 | $ | 79,975 | $ | 237 | $ | 185,565 | ||||||||||||||
| Comprehensive income (loss): |
||||||||||||||||||||||||||
| Net loss for 2009 |
$ | (109,934 | ) | — | — | — | (109,934 | ) | — | (109,934 | ) | |||||||||||||||
| Net change in unrealized gains (losses) on securities available-for-sale, net of tax |
1,548 | — | — | — | — | 1,548 | 1,548 | |||||||||||||||||||
| Net change in pension liability |
860 | — | — | — | — | 860 | 860 | |||||||||||||||||||
| Comprehensive income (loss) |
$ | (107,526 | ) | |||||||||||||||||||||||
| Issuance of preferred stock and warrants |
41,689 | — | 2,311 | — | — | 44,000 | ||||||||||||||||||||
| Preferred stock discount accretion |
408 | — | — | (408 | ) | — | — | |||||||||||||||||||
| Preferred stock dividends declared |
— | — | — | (1,870 | ) | — | (1,870 | ) | ||||||||||||||||||
| Common stock cash dividends declared, $0.05 per share |
— | — | — | (595 | ) | — | (595 | ) | ||||||||||||||||||
| Net performance share activity |
— | (2 | ) | (42 | ) | — | — | (44 | ) | |||||||||||||||||
| Unearned compensation relating to performance shares |
— | — | 224 | — | — | 224 | ||||||||||||||||||||
| Balance, December 31, 2009 |
$ | 42,097 | $ | 11,913 | $ | 95,931 | $ | (32,832 | ) | $ | 2,645 | $ | 119,754 | |||||||||||||
The accompanying notes are an integral part of these statements.
54
Table of Contents
CADENCE FINANCIAL CORPORATION
CONSOLIDATED STATEMENTS OF CASH FLOWS FOR
YEARS ENDED DECEMBER 31,
| (Amounts in thousands) |
2009 | 2008 | 2007 | |||||||||
| CASH FLOWS FROM OPERATING ACTIVITIES |
||||||||||||
| Net income (loss) |
$ | (109,934 | ) | $ | (3,356 | ) | $ | 9,793 | ||||
| Adjustments to reconcile net income (loss) to net cash provided by (used in) operating activities: |
||||||||||||
| Depreciation and amortization |
3,451 | 3,845 | 4,565 | |||||||||
| Deferred income taxes |
(25,088 | ) | (2,025 | ) | (2,424 | ) | ||||||
| Provision for loan losses |
79,328 | 28,599 | 8,130 | |||||||||
| Increase in cash value of life insurance, net |
(875 | ) | (683 | ) | (681 | ) | ||||||
| Securities amortization and accretion, net |
1,291 | 331 | 698 | |||||||||
| Net performance share activity |
180 | 201 | 141 | |||||||||
| Loss (gain) on sale of securities, net |
(3,173 | ) | (390 | ) | 17 | |||||||
| Impairment loss on securities |
— | — | 5,097 | |||||||||
| Impairment loss on goodwill |
66,542 | — | — | |||||||||
| Gain on sale of GCM assets |
(613 | ) | — | — | ||||||||
| (Increase) decrease in interest receivable |
2,376 | 3,486 | (855 | ) | ||||||||
| (Increase) decrease in loans held for sale |
2,010 | 452 | 909 | |||||||||
| (Increase) decrease in other assets |
(27,569 | ) | (13,879 | ) | (6,131 | ) | ||||||
| Increase (decrease) in interest payable |
(846 | ) | (1,740 | ) | (2,248 | ) | ||||||
| Increase (decrease) in other liabilities |
(1,567 | ) | (436 | ) | (753 | ) | ||||||
| Net cash provided by (used in) operating activities |
(14,487 | ) | 14,405 | 16,258 | ||||||||
| CASH FLOWS FROM INVESTING ACTIVITIES |
||||||||||||
| Net cash proceeds from sale of GCM assets |
242 | — | — | |||||||||
| Purchases of securities available-for-sale |
(573,096 | ) | (213,680 | ) | (308,303 | ) | ||||||
| Purchases of securities held-to-maturity |
— | (4,000 | ) | — | ||||||||
| Purchases of other securities |
(27 | ) | (2,400 | ) | (11,494 | ) | ||||||
| Proceeds from sales of securities available-for-sale |
145,031 | 24,497 | 6,738 | |||||||||
| Proceeds from sales of securities held-to-maturity |
16,138 | 279 | — | |||||||||
| Proceeds from sales of securities held-for-trading |
— | — | 161,391 | |||||||||
| Proceeds from redemption of other securities |
3,083 | 2,480 | 6,336 | |||||||||
| Proceeds from maturities and calls of securities available-for-sale |
502,036 | 199,264 | 145,443 | |||||||||
| Proceeds from maturities and calls of securities held-to-maturity |
2,983 | 3,296 | 704 | |||||||||
| Proceeds from maturities and calls of securities held-for-trading |
— | — | 7,069 | |||||||||
| (Increase) decrease in loans |
178,206 | (13,729 | ) | (121,250 | ) | |||||||
| (Additions) disposals of premises and equipment |
(41 | ) | (159 | ) | (6,205 | ) | ||||||
| Net cash provided by (used in) investing activities |
274,555 | (4,152 | ) | (119,571 | ) | |||||||
| CASH FLOWS FROM FINANCING ACTIVITIES |
||||||||||||
| Increase (decrease) in deposits |
38,651 | 35,593 | (34,957 | ) | ||||||||
| Issuance of preferred stock and warrants |
44,000 | — | — | |||||||||
| Dividends paid on preferred stock |
(1,870 | ) | — | — | ||||||||
| Dividends paid on common stock |
(595 | ) | (7,144 | ) | (11,897 | ) | ||||||
| Net change in federal funds purchased and securities sold under agreements to repurchase |
(11,095 | ) | (8,533 | ) | 26,222 | |||||||
| Net change in short-term FHLB borrowings |
(20,000 | ) | (165,972 | ) | 128,972 | |||||||
| Proceeds from issuance of long-term debt |
35,000 | 170,000 | — | |||||||||
| Repayment of long-term debt |
(108,357 | ) | (25,361 | ) | (36,134 | ) | ||||||
| Net cash provided by (used in) financing activities |
(24,266 | ) | (1,417 | ) | 72,206 | |||||||
| Net increase (decrease) in cash and cash equivalents |
235,802 | 8,836 | (31,107 | ) | ||||||||
| Cash and cash equivalents at beginning of year |
61,233 | 52,397 | 83,504 | |||||||||
| Cash and cash equivalents at end of year |
$ | 297,035 | $ | 61,233 | $ | 52,397 | ||||||
The accompanying notes are an integral part of these statements.
55
Table of Contents
CADENCE FINANCIAL CORPORATION
NOTES TO CONSOLIDATED FINANCIAL STATEMENTS
NOTE A - SUMMARY OF ACCOUNTING POLICIES
Cadence Financial Corporation (the “Corporation”) and its subsidiaries follow accounting principles generally accepted in the United States of America, including, where applicable, general practices within the banking industry.
1. Basis of Presentation
The consolidated financial statements include the accounts of the Corporation and Cadence Bank, N.A. (“Cadence” or the “Bank”), a wholly-owned subsidiary of the Corporation, Enterprise Bancshares, Inc. (“Enterprise”), a wholly-owned subsidiary of the Corporation, Cadence Insurance Services of Mississippi, Inc. (formerly Galloway-Chandler-McKinney Insurance Agency, Inc. (“GCM”)), a wholly-owned subsidiary of Cadence, NBC Insurance Services of Alabama, Inc., a wholly-owned subsidiary of Cadence, NBC Service Corporation, a wholly-owned subsidiary of Cadence, and Commerce National Insurance Company (“CNIC”), a wholly-owned subsidiary of NBC Service Corporation.
Significant intercompany accounts and transactions have been eliminated in consolidation.
Certain amounts reported in prior years have been reclassified to conform to the 2009 presentation. These reclassifications did not significantly impact the Corporation’s consolidated financial condition or results of operations.
The Financial Accounting Standards Board (“FASB”) Accounting Standards Codification (“ASC”) Topic 855, “Subsequent Events,” requires companies to disclose the date through which subsequent events have been evaluated by management. The Corporation’s management has evaluated the effect of subsequent events on these financial statements through the date the financial statements were issued.
2. Nature of Operations
The Corporation is a bank holding company. Its primary asset is its investment in Cadence, its subsidiary bank. Cadence operates under a national bank charter and is subject to regulation by the Office of the Comptroller of the Currency. Cadence provides full banking services in five southeastern states as follows: the north central region of Mississippi; the Tuscaloosa and Hoover (Birmingham MSA), Alabama market areas; the Memphis, Tennessee market area; the Brentwood and Franklin (Nashville MSA), Tennessee market area; the Sarasota (Sarasota-Bradenton-Venice MSA), Florida market area; and the cities of Blairsville and Blue Ridge in northeast Georgia.
Enterprise is an inactive subsidiary of the Corporation. Effective August 31, 2009, Cadence completed the disposition of the assets used in and liabilities arising from GCM’s operations. See Note B for additional information relating to this transaction. Subsequent to the sale, the name of the company was changed to Cadence Insurance Services of Mississippi, Inc., and it became inactive.
NBC Insurance Services of Alabama, Inc., sells annuity contracts in Alabama. The primary asset of NBC Service Corporation is its investment in CNIC, a wholly-owned life insurance company.
3. Estimates
The preparation of financial statements in conformity with accounting principles generally accepted in the United States of America requires management to make estimates and assumptions that affect the reported amounts of assets and liabilities and disclosure of contingent assets and liabilities at the date of the financial statements and the reported amounts of revenues and expenses during the reporting period. Actual results could differ from those estimates.
4. Securities
Securities are accounted for as follows:
Securities Available-for-Sale
Securities classified as available-for-sale are those securities that are intended to be held for an indefinite period of time, but not necessarily to maturity. Any decision to sell a security classified as available-for-sale would be based on various factors, including movements in interest rates, liquidity needs, security risk assessments, changes in the mix of assets and liabilities and other similar factors. These securities are carried at their estimated fair value, and the net unrealized gain or loss is reported as accumulated other comprehensive income (loss), net of tax, until realized. Premiums and discounts are recognized in interest income using the interest method.
56
Table of Contents
Gains and losses on the sale of securities available-for-sale are determined using the adjusted cost of the specific security sold.
Securities Held-to-Maturity
Securities classified as held-to-maturity are those securities for which there is a positive intent and ability to hold to maturity. These securities are carried at cost adjusted for amortization of premium and accretion of discount, computed by the interest method.
Trading Account Securities
Trading account securities are securities that are held for the purpose of selling them at a profit. There were no trading account securities on hand at December 31, 2009 and 2008.
Other Securities
Other securities are carried at cost and are restricted in marketability. Other securities consist of required investments in the Federal Home Loan Bank (“FHLB”) and Federal Reserve Bank.
Derivative Instruments
Derivative instruments are accounted for under the requirements of ASC Topic 815, “Derivatives and Hedging.”
During 2008 and 2009, the Corporation hedged a portion of its floating rate prime based lending portfolio using two floating to fixed interest rate swaps. These transactions were cash flow hedges as defined by ASC Topic 815 and were accounted for under that guidance. As of December 31, 2009, the Corporation had no outstanding swaps.
For the year ended December 31, 2008, $94,000 in unrealized gains (net of tax) was recorded as an adjustment to accumulated other comprehensive income (loss) for the change in fair value of the Corporation’s outstanding swaps.
5. Loans
Loans are carried at the principal amount outstanding adjusted for the allowance for loan losses, net deferred origination fees, and unamortized discounts and premiums. Interest income on loans is recognized based on the principal balance outstanding and the stated rate of the loan.
A loan is considered to be impaired when it appears probable that the entire amount contractually due will not be collected. Factors considered in determining impairment include payment status, collateral values, and the probability of collecting scheduled payments of principal and interest when due. Generally, impairment is measured on a loan-by-loan basis using the fair value of the supporting collateral.
Loans are generally placed on a nonaccrual status when principal or interest is past due ninety days or when specifically determined to be impaired. When a loan is placed on nonaccrual status, interest accrued but not received is generally reversed against interest income. If collectibility is in doubt, cash receipts on nonaccrual loans are used to reduce principal rather than recorded as interest income. Past due status is determined based upon contractual terms.
Loan origination fees and certain direct origination costs are capitalized and recognized as an adjustment of the yield on the related loan. Premiums and discounts on purchased loans are recognized as an adjustment of yield over the contractual life of the loan.
Fees on mortgage loans sold individually in the secondary market, including origination fees, service release premiums, processing and administrative fees, and application fees, are recognized as other income in the period in which the loans are sold. These loans are underwritten to the standards of upstream correspondents and are held on the Corporation’s consolidated balance sheets until the loans are sold.
6. Allowance for Loan Losses
The allowance for loan losses is established through charges to earnings in the form of a provision for loan losses. The allowance for loan losses is maintained at a level that management believes is adequate to absorb all probable losses on loans inherent in the loan portfolio as of the reporting date. Events that are not within the Bank’s control, such as changes in economic factors, could change subsequent to the reporting date and could cause the allowance for loan losses to be over or understated. The amount of the allowance is affected by loan charge-offs, which decrease the allowance; recoveries on loans previously charged off, which increase the allowance; and the provision for loan losses charged to earnings, which increases the allowance. In determining the provision for loan losses, management monitors fluctuations in the allowance resulting from actual charge-offs and recoveries and reviews the size and composition of the loan portfolio in light of current and anticipated economic conditions.
57
Table of Contents
The allowance for loan losses is comprised of the following three components: specific reserves, general reserves and unallocated reserves. Generally, all loans that are identified as impaired are reviewed on a quarterly basis in order to determine whether a specific reserve is required. A loan is considered impaired when, based on current information, it is probable that we will not receive all amounts due in accordance with the contractual terms of the loan agreement. Once a loan has been identified as impaired, management measures impairment in accordance with ASC Topic 310, “Receivables.” The measurement of impaired loans is based on the present value of expected future cash flows discounted at the loan’s effective interest rate or the loan’s observable market price, or based on the fair value of the collateral if the loan is collateral-dependent. When management’s measured value of the impaired loan is less than the recorded investment in the loan, the amount of the impairment is recorded as a specific reserve. These specific reserves are determined on an individual loan basis based on management’s current evaluation of the loss exposure for each credit, given the payment status, financial condition of the borrower and value of any underlying collateral. Loans for which specific reserves are provided are excluded from the general reserve and unallocated reserve calculations described below. Changes in specific reserves from period to period are the result in changes in the circumstances of individual loans such as charge-offs, pay-offs, changes in collateral values or other factors.
A general reserve is also maintained for each loan type in the loan portfolio. Within each loan type, the portfolio is further segmented by risk ratings and by delinquency status. In determining the amount of the general reserve portion of the allowance for loan losses, management considers factors such as historical loan loss experience, the growth, composition and diversification of the loan portfolio, current delinquency levels, adverse situations that may affect the borrower’s ability to repay, estimated value of the underlying collateral, the results of recent regulatory examinations and general economic conditions. Through the second quarter of 2009, general reserves for these loans were based upon three-year historical loss rates, with each year being weighted equally. Beginning in the third quarter of 2009, general reserves for these loans are based upon historical loss rates from the most recent three years (twelve quarters), with the more recent quarters receiving the most weight. Management believes that this method of weighting the latest quarters is more representative of the current economic cycle. Management uses this information to set the general reserve portion of the allowance for loan losses at a level it deems prudent.
Because there are additional risks of losses that cannot be quantified precisely or attributed to particular loans or types of loans, including general economic and business conditions and credit quality trends, management has established an unallocated portion of the allowance for loan losses based on its evaluation of these risks. The unallocated portion of the allowance is determined based on various factors, including general economic conditions of the Bank’s market area, the growth, composition and diversification of the loan portfolio, types of collateral securing the loans, the experience level of lending officers and staff, the quality of credit risk management and the results of independent third party reviews of management’s classification of credits.
Based on an evaluation of the loan portfolio, management presents a quarterly review of the allowance for loan losses to the Bank’s executive committee and the full Board of Directors, indicating any change in the allowance for loan losses since the last review and any recommendations as to adjustments in the allowance for loan losses. This evaluation is inherently subjective as it requires estimates that are susceptible to significant revision as more information becomes available or as events change.
7. Premises and Equipment
Premises and equipment are stated at cost, less accumulated depreciation and amortization. Depreciation and amortization are determined using the straight-line method at rates calculated to depreciate or amortize the cost of assets over their estimated useful lives.
Maintenance and repairs of property and equipment are charged to operations, and major improvements are capitalized. Upon retirement, sale, or other disposition of property and equipment, the cost and accumulated depreciation are eliminated from the accounts, and any gains or losses are included in operations.
8. Other Real Estate
Other real estate consists of properties acquired through foreclosure and, as held for sale property, is recorded at the lower of the outstanding loan balance or current appraisal less estimated costs to sell. Any write-down to fair value required at the time of foreclosure is charged to the allowance for loan losses. Subsequent gains or losses on other real estate resulting from the sale of the property or additional valuation allowances required due to further declines in market value are reported in other noninterest income or expenses.
58
Table of Contents
9. Goodwill and Other Intangible Assets
ASC Topic 350, “Intangibles-Goodwill and Other,” eliminated the requirement to amortize goodwill; however, it does require periodic testing for impairment using a two-step approach. The first step is to determine whether impairment could exist. If the results of the first step of testing indicate that impairment does not exist, the test is complete. If the results of the first step indicate that impairment could exist, the second step of testing must be performed. The Corporation engaged an outside consulting firm to perform the appropriate testing. The Corporation’s periodic impairment test in accordance with ASC Topic 350 was completed as of September 30, 2008. The results of the first step of testing indicated that no impairment writedown was warranted as of September 30, 2008.
ASC Topic 350 requires that goodwill be tested for impairment between annual tests if an event occurs or circumstances change that would more likely than not reduce the fair value of a reporting unit below its carrying amount. Several events occurred during the first quarter of 2009 that management believed triggered an additional test of goodwill for impairment. These events included the Corporation’s results of operations for the three months ended March 31, 2009, the changes in credit quality of the Corporation’s loan portfolio, and the continued general decline in the economy. The Corporation engaged an outside consultant to perform this additional goodwill impairment testing. Due primarily to the decline in the market value of the Corporation’s stock and the decline in prices paid in comparable bank acquisition transactions between December 31, 2008 and March 31, 2009, the first step of the goodwill impairment test indicated that potential impairment existed and the second step of testing should be performed to determine the amount of impairment. In the second step of the test, the Corporation’s consolidated balance sheet was marked to market to determine the current fair value of the goodwill that should be recorded on the balance sheet. As a result of this testing, management concluded that our goodwill was fully impaired as of March 31, 2009, and a goodwill impairment charge of $66.8 million ($304,000 of which related to GCM) was recognized for the quarter ended March 31, 2009. This charge eliminated all goodwill previously reflected on the Corporation’s balance sheet.
Other identifiable intangible assets consist primarily of the core deposit premium arising from acquisitions. The core deposit premium was established using the discounted cash flow approach and is being amortized using an accelerated method over the estimated remaining life of the acquired core deposits.
10. Income Taxes
The calculation of the Corporation’s income tax provision is complex and requires the use of estimates and judgment in its determination. The Corporation is subject to the income tax laws of the various jurisdictions where it conducts business, and income tax expense is estimated based on amounts expected to be owed to these various tax jurisdictions. Management assesses the appropriate tax treatment of transactions and filing positions after considering statutes, regulations, judicial precedent and other pertinent information, and tax accruals are maintained consistent with this evaluation. Changes in the estimate of accrued taxes occur periodically due to changes in tax rates, interpretations of tax laws, the status of examinations by the taxing authorities, and newly enacted statutory, judicial, and regulatory guidance that could affect the relative merits of the tax positions.
Income taxes are provided for the tax effects of the transactions reported in the financial statements and consist of taxes currently payable or receivable plus deferred taxes related primarily to differences between the bases of assets and liabilities as measured by income tax laws and their bases as reported in the financial statements. The deferred tax assets and liabilities represent the future tax consequences of those differences, which will either be taxable or deductible when the assets and liabilities are recovered or settled. Tax credits are recognized as a reduction of the current tax provision in the period they may be utilized.
The Corporation and its subsidiaries file consolidated income tax returns. The subsidiaries provide for income taxes on a separate return basis and remit to the Corporation amounts determined to be payable.
11. Trust Assets
Except for amounts included in deposits, assets of the Trust Department are not included in the accompanying consolidated balance sheets.
12. Advertising Costs
Advertising costs are expensed in the period in which they are incurred. For the years ended December 31, 2009, 2008, and 2007, the Corporation expensed $724,000, $904,000, and $734,000, respectively, related to advertising costs.
13. Employee Benefits
Employees hired prior to January 1, 2001, participate in a noncontributory defined benefit pension plan. The plan calls for benefits to be paid to eligible employees at retirement based primarily upon years of service and compensation. Contributions
59
Table of Contents
to the plan reflect benefits attributed to employees’ services to date, as well as services expected to be provided in the future. The annual pension cost charged to expense is actuarially determined in accordance with the provisions of ASC Topic 715, “Compensation-Retirement Benefits.” The plan was amended effective January 1, 2001, to close participation in the plan. Employees hired subsequent to December 31, 2000, are not eligible to participate.
On January 1, 2001, the Corporation and its subsidiaries adopted a defined contribution profit sharing plan. Employer contributions are made annually equal to 3% of each participant’s base pay. Participant accounts are 100% vested upon completion of five years of service. Effective January 1, 2008, the plan was frozen, and employees hired subsequent to December 31, 2007, are not eligible to participate. Current participant accounts will continue to share in the earnings of the plan, and the accounts will be available to participants at retirement in accordance with the plan documents.
The Corporation and its subsidiaries provide a deferred compensation arrangement (401(k)) plan whereby employees contribute a percentage of their compensation. Prior to January 1, 2008, the plan provided for matching contributions of fifty percent of employee contributions of six percent or less for employees with less than twenty years of service. For employees with service of twenty years or more, the matching contribution was seventy-five percent of employee contributions of six percent or less. Effective January 1, 2008, the plan provides for a 100% match of employee contributions up to six percent of employee compensation, and the matching contributions are immediately vested at 100%. Effective June 1, 2009, the Corporation suspended its 401(k) matching contributions.
Employees participate in a nonleveraged Employee Stock Ownership Plan (“ESOP”) through which common stock of the Corporation is purchased at its market price for the benefit of employees. Effective January 1, 2001, the ESOP was amended to freeze the plan and to allow no new entrants into the ESOP. All participants at December 31, 2000, became 100% vested in their accounts. The ESOP is accounted for in accordance with ASC Subtopic 718-40.
The Corporation has a supplemental retirement plan that originated from an acquired bank for certain directors and officers of that acquired bank. Life insurance contracts have been purchased which may be used to fund payments under the plans. The annual cost charged to expense and the estimated present value of the projected payments are actuarially determined in accordance with the provisions of ASC Topic 715.
In 1998, the Corporation entered into agreements with certain senior officers to establish an indexed retirement plan (an unqualified supplemental retirement plan). Benefit amounts were based on additional earnings from bank owned life insurance (“BOLI”) policies compared to the yield on treasury securities. In 2008, as part of the plan amendments required for compliance with Regulation 409A, the payments to participants on this plan were changed from variable payment amounts to fixed payment amounts to begin on a monthly basis at age 65. The annual cost charged to expense and the estimated present value of the projected payments are determined in accordance with the provisions of ASC Topic 715.
The Corporation provides a voluntary deferred compensation plan for certain of its executive and senior officers. Under this plan, the participants may defer up to 25% of their annual compensation. The Corporation may, but is not obligated to contribute to the plan. Amounts contributed to this plan are credited to a separate account for each participant and are subject to a risk of loss in the event of the Corporation’s insolvency. The Corporation made no contributions to this plan in 2007, 2008 or 2009.
The Corporation provides an employee phantom stock plan whereby 11,245 units or phantom shares of the Corporation’s stock have been assigned for the benefit of certain key employees. Under the terms of the plan, retirement or similar payments will be equal to the fair market value of the stock plus all cash dividends paid since the adoption of the agreement. An expense was recorded at the establishment date based on the market value of the stock. Any increase or decrease in the value of the stock is recorded as an adjustment to employee benefits expense.
As of January 1, 2008, the Corporation adopted ASC Subtopic 715-60 (formerly Emerging Issues Task Force Issue No. 06-4, “Accounting for Deferred Compensation and Postretirement Benefit Aspects of Endorsement Split-Dollar Life Insurance Arrangements”). Under the terms of an endorsement arrangement, an employer owns and controls a policy that will provide future postretirement benefits to an employee. ASC Subtopic 715-60 requires that a liability be recognized for the postretirement benefit obligation, together with related postretirement benefit expense, based on the substantive agreement with the employee. As of January 1, 2008, the Corporation recorded a cumulative-effect debit adjustment to retained earnings of approximately $368,000 related to the adoption of ASC Subtopic 715-60. Related postretirement benefit expense is recorded monthly.
14. Other Assets
Financing costs related to the issuance of junior subordinated debentures have been capitalized and are being amortized over the life of the instruments and are included in other assets.
The Corporation has invested in a low income housing partnership as a 99% limited partner. The partnership has qualified to receive annual low income housing federal tax credits that are recognized as a reduction of current tax expense. The investment is accounted for using the equity method.
60
Table of Contents
The Corporation invests in BOLI, which involves the purchasing of life insurance on a chosen number of employees. The Corporation is the owner of the policies and, accordingly, the cash surrender value of the policies is included in other assets, and increases in cash surrender values are reported as income.
15. Stock Options/Performance Share Grants
The Corporation accounts for stock options in accordance with ASC Topic 718, “Compensation-Stock Compensation.” This guidance requires that the fair value of equity instruments exchanged for employee service (as determined on the grant date of the award) be recognized as compensation cost over the period during which an employee is required to provide service in exchange for the award – the requisite service period (usually the vesting period). Changes in fair value during the requisite service period are recognized as compensation cost over that period.
In 2006, the Corporation’s shareholders adopted a new Long-Term Incentive Compensation Plan. This plan gave the Compensation Committee of the Board of Directors additional alternatives for using share-based compensation. During 2007 and 2008, under the provisions of the Long-Term Incentive Compensation Plan, the Compensation Committee granted performance shares of stock to certain eligible employees. The shares vest in equal amounts over a four-year period after they are earned. See Note L of these Consolidated Financial Statements for additional information concerning performance shares.
16. Cash Flows
For purposes of reporting cash flows, cash and cash equivalents include cash on hand and amounts due from banks, interest-bearing deposits with banks, and federal funds sold. Generally, federal funds are sold for one to seven day periods.
17. Net Income Per Share
Basic net income per share computations are based upon the weighted average number of common shares outstanding during the periods. Diluted net income per share computations are based upon the weighted average number of common shares outstanding during the periods plus the dilutive effect of outstanding stock options.
Performance shares outstanding are included in the average diluted shares outstanding until the performance targets have been achieved. Once the performance has been attained and the shares are vesting over a time period, they are included in average primary shares outstanding.
61
Table of Contents
Presented below is a summary of the components used to calculate basic and diluted net income per share for the years ended December 31, 2009, 2008, and 2007:
| Years Ended December 31, | |||||||||||
| (In thousands, except per share data) |
2009 | 2008 | 2007 | ||||||||
| Basic Net Income (Loss) Per Share |
|||||||||||
| Weighted average common shares outstanding |
11,913 | 11,907 | 11,896 | ||||||||
| Net income (loss) from continuing operations |
$ | (109,991 | ) | $ | (3,782 | ) | $ | 9,283 | |||
| Net income from discontinued operations |
57 | 426 | 510 | ||||||||
| Net income (loss) |
(109,934 | ) | (3,356 | ) | 9,793 | ||||||
| Net income (loss) applicable to common shareholders |
$ | (112,212 | ) | $ | (3,356 | ) | $ | 9,793 | |||
| Basic net income (loss) per share from continuing operations |
$ | (9.23 | ) | $ | (0.32 | ) | $ | 0.78 | |||
| Basic net income (loss) per share from discontinued operations |
— | 0.04 | 0.04 | ||||||||
| Basic net income (loss) per share |
(9.23 | ) | (0.28 | ) | 0.82 | ||||||
| Basic net income (loss) per share applicable to common shareholders |
$ | (9.42 | ) | $ | (0.28 | ) | $ | 0.82 | |||
| Diluted Net Income (Loss) Per Share |
|||||||||||
| Weighted average common shares outstanding |
11,913 | 11,907 | 11,896 | ||||||||
| Net effect of weighted average outstanding but unearned performance shares |
1 | 24 | 17 | ||||||||
| Net effect of the assumed exercise of stock options based on the treasury stock method |
— | — | 2 | ||||||||
| Total weighted average common shares and common stock equivalents outstanding |
11,914 | 11,931 | 11,915 | ||||||||
| Net income (loss) from continuing operations |
$ | (109,991 | ) | $ | (3,782 | ) | $ | 9,283 | |||
| Net income from discontinued operations |
57 | 426 | 510 | ||||||||
| Net income (loss) |
(109,934 | ) | (3,356 | ) | 9,793 | ||||||
| Net income (loss) applicable to common shareholders |
$ | (112,212 | ) | $ | (3,356 | ) | $ | 9,793 | |||
| Diluted net income (loss) per share from continuing operations |
$ | (9.23 | ) | $ | (0.32 | ) | $ | 0.78 | |||
| Diluted net income (loss) per share from discontinued operations |
— | 0.04 | 0.04 | ||||||||
| Diluted net income (loss) per share |
(9.23 | ) | (0.28 | ) | 0.82 | ||||||
| Diluted net income (loss) per share applicable to common shareholders |
$ | (9.42 | ) | $ | (0.28 | ) | $ | 0.82 | |||
18. Off-Balance Sheet Financial Instruments
In the ordinary course of business, the Corporation enters into off-balance sheet financial instruments consisting of commitments to extend credit, credit card lines, standby letters of credit and commitments to purchase securities. Such financial instruments are recorded in the financial statements when they are exercised.
19. Business Segments
ASC Topic 280, “Segment Reporting,” requires public companies to report (i) certain financial and descriptive information about their reportable operating segments (as defined) and (ii) certain enterprise-wide financial information about products and services, geographic areas, and major customers. Management believes the Corporation’s principal activity is commercial banking and that other activities are not considered significant segments.
20. Recent Accounting Pronouncements
In January 2010, the FASB issued Accounting Standards Update (“ASU”) No. 2010-16, “Improving Disclosures about Fair Value Measurements” (ASC Subtopic 820-10). This guidance requires additional disclosures concerning transfers into and out of Levels 1 and 2 of the fair value measurement hierarchy and activity in Level 3 measurements. ASU No. 2010-16 also clarifies existing disclosure requirements regarding the level of disaggregation and inputs and valuation techniques. ASU No. 2010-16 is generally effective for reporting periods beginning after December 15, 2010. The Corporation is currently reviewing the impact of ASC Subtopic 820-10 on its financial statement disclosures.
NOTE B - DISCONTINUED OPERATIONS
On August 31, 2009, the Bank completed the disposition of the assets used in and liabilities arising from GCM’s operations to four limited liability companies established by former owners and employees of GCM. The total purchase price of the assets sold, net of liabilities assumed, was approximately $5.5 million.
As a result of this transaction, the consolidated statements of income have been restated for all periods to reflect GCM’s operations as discontinued operations. The net income from discontinued operations for the year ended December 31, 2009, includes a gain on sale of approximately $613,000.
62
Table of Contents
Summarized financial information for discontinued operations is as follows:
| Year Ended December 31, | ||||||||||
| (In thousands) | 2009 | 2008 | 2007 | |||||||
| Income |
$ | 3,448 | $ | 5,164 | $ | 5,161 | ||||
| Expense |
3,620 | 4,454 | 4,321 | |||||||
| Income (loss) from discontinued operations |
(172 | ) | 710 | 840 | ||||||
| Gain on sale |
613 | — | — | |||||||
| Income tax expense |
384 | 284 | 330 | |||||||
| Net income from discontinued operations |
$ | 57 | $ | 426 | $ | 510 | ||||
NOTE C - SECURITIES
A summary of amortized cost and estimated fair value of securities available-for-sale and securities held-to-maturity at December 31, 2009 and 2008, follows:
| December 31, 2009 | ||||||||||||
| (In thousands) |
Amortized Cost |
Gross Unrealized Gains |
Gross Unrealized Losses |
Estimated Fair Value | ||||||||
| Securities available-for-sale: |
||||||||||||
| U. S. Treasury securities |
$ | 310 | $ | 11 | $ | — | $ | 321 | ||||
| Obligations of other U. S. government agencies |
38,675 | 467 | 234 | 38,908 | ||||||||
| Obligations of states and municipal subdivisions |
27,402 | 915 | 197 | 28,120 | ||||||||
| Mortgage-backed securities |
219,635 | 8,358 | 706 | 227,287 | ||||||||
| Other securities |
34,848 | 694 | 99 | 35,443 | ||||||||
| $ | 320,870 | $ | 10,445 | $ | 1,236 | $ | 330,079 | |||||
| Securities held-to-maturity: |
||||||||||||
| Obligations of states and municipal subdivisions |
$ | 2,671 | $ | 70 | $ | — | $ | 2,741 | ||||
| December 31, 2008 | ||||||||||||
| Securities available-for-sale: |
||||||||||||
| U. S. Treasury securities |
$ | 310 | $ | 16 | $ | — | $ | 326 | ||||
| Obligations of other U. S. government agencies |
88,593 | 1,567 | — | 90,160 | ||||||||
| Obligations of states and municipal subdivisions |
86,940 | 582 | 1,076 | 86,446 | ||||||||
| Mortgage-backed securities |
213,736 | 6,736 | 17 | 220,455 | ||||||||
| Other securities |
1,685 | 3 | 373 | 1,315 | ||||||||
| $ | 391,264 | $ | 8,904 | $ | 1,466 | $ | 398,702 | |||||
| Securities held-to-maturity: |
||||||||||||
| Obligations of states and municipal subdivisions |
$ | 21,358 | $ | 757 | $ | — | $ | 22,115 | ||||
The scheduled maturities of securities available-for-sale and securities held-to-maturity at December 31, 2009 were as follows:
| Available-for-Sale | Held-to-Maturity | |||||||||||
| (In thousands) |
Amortized Cost |
Estimated Fair Value |
Amortized Cost |
Estimated Fair Value | ||||||||
| Due in one year or less |
$ | 2,250 | $ | 2,311 | $ | — | $ | — | ||||
| Due after one year through five years |
7,152 | 7,465 | — | — | ||||||||
| Due after five years through ten years |
14,247 | 14,385 | 1,671 | 1,726 | ||||||||
| Due after ten years |
42,738 | 43,188 | 1,000 | 1,015 | ||||||||
| Mortgage-backed securities and other securities |
254,483 | 262,730 | — | — | ||||||||
| $ | 320,870 | $ | 330,079 | $ | 2,671 | $ | 2,741 | |||||
63
Table of Contents
Gross gains of $3,616,000, $440,000, and $124,000, and gross losses of $874,000, $50,000, and $141,000, were realized on securities available-for-sale in 2009, 2008, and 2007, respectively.
During the third quarter of 2009, management evaluated the Corporation’s portfolio and determined that the full tax benefit of tax-exempt securities was not being received, based on the Corporation’s losses. Thus, with the approval of the Board of Directors, the Corporation sold most of those securities, with a total carrying value of approximately $18.6 million, and realized gross and net gains of $431,000. The proceeds were invested into higher-yielding taxable securities, which are reflected as “securities available-for-sale” on the Corporation’s consolidated balance sheet as of December 31, 2009.
The Corporation recognized a $5.1 million impairment loss in the first quarter of 2007 relating to certain collateralized mortgage obligations and mortgage-backed securities. These securities were sold early in the second quarter of 2007, and the proceeds were invested in agency securities.
Securities with a carrying value of $250.2 million and $319.8 million at December 31, 2009 and 2008, respectively, were pledged to secure public and trust deposits, FHLB borrowings, repurchase agreements and for other purposes as required or permitted by law.
The details concerning securities classified as available-for-sale with unrealized losses as of December 31, 2009 and 2008, were as follows:
| Losses < 12 Months | Losses 12 Months or > | Total | ||||||||||||||||
| (In thousands) |
Fair Value | Gross Unrealized Losses |
Fair Value | Gross Unrealized Losses |
Fair Value | Gross Unrealized Losses | ||||||||||||
| 2009 |
||||||||||||||||||
| Obligations of other U.S. government agencies |
$ | 13,801 | $ | 234 | $ | — | $ | — | $ | 13,801 | $ | 234 | ||||||
| Obligations of states and municipal subdivisions |
— | — | 803 | 197 | 803 | 197 | ||||||||||||
| Mortgage-backed securities |
41,164 | 706 | — | — | 41,164 | 706 | ||||||||||||
| Other securities |
— | — | 529 | 99 | 529 | 99 | ||||||||||||
| $ | 54,965 | $ | 940 | $ | 1,332 | $ | 296 | $ | 56,297 | $ | 1,236 | |||||||
| 2008 |
||||||||||||||||||
| Obligations of other U.S. government agencies |
$ | — | $ | — | $ | — | $ | — | $ | — | $ | — | ||||||
| Obligations of states and municipal subdivisions |
33,898 | 1,055 | 1,217 | 21 | 35,115 | 1,076 | ||||||||||||
| Mortgage-backed securities |
2,315 | 17 | — | — | 2,315 | 17 | ||||||||||||
| Other securities |
336 | 150 | 477 | 223 | 813 | 373 | ||||||||||||
| $ | 36,549 | $ | 1,222 | $ | 1,694 | $ | 244 | $ | 38,243 | $ | 1,466 | |||||||
There were no securities classified as held-to-maturity with unrealized losses as of December 31, 2009 or 2008.
As of December 31, 2009, approximately 16% of the number of securities in the investment portfolio reflected an unrealized loss. Management does not believe any individual security with an unrealized loss as of December 31, 2009, is other-than-temporarily impaired, as discussed in more detail below:
Obligations of Other U. S. Government Agencies The unrealized losses on the Corporation’s investments in obligations of other U. S. government agencies were caused by interest rate fluctuations. Because none of these investments have been downgraded by rating agencies and the Corporation has the ability and intent to hold these investments until a recovery of fair value, which may be maturity, the Corporation does not consider these investments to be other-than-temporarily impaired as of December 31, 2009.
Obligations of States and Municipal Subdivisions The unrealized losses on the Corporation’s investments in obligations of states and municipal subdivisions were caused by interest rate fluctuations. Because none of these investments have been downgraded by rating agencies and the Corporation has the ability and intent to hold these investments until a recovery of fair value, which may be maturity, the Corporation does not consider these investments to be other-than-temporarily impaired as of December 31, 2009.
64
Table of Contents
Mortgage-Backed Securities Contractual cash flows of these investments are guaranteed by an agency of the U.S. government. Accordingly, it is expected that the securities would not be settled at a price less than the amortized cost of the Corporation’s investment, unless they have early prepayments that would place any unamortized premium at risk. The total amount of unamortized premium at December 31, 2009, is not material to the Corporation. Because the Corporation has the ability and intent to hold these investments until a recovery of fair value, which may be maturity, the Corporation does not consider these investments to be other-than-temporarily impaired as of December 31, 2009.
Other Securities The unrealized losses on the Corporation’s investments in other securities primarily relate to various mutual funds held in deferred compensation accounts. The amount of these securities and the related unrealized losses are not material and the Corporation has the ability and intent to hold the investments until a recovery of fair value; thus, the Corporation does not consider these investments to be other-than-temporarily impaired as of December 31, 2009.
NOTE D - LOANS
Loans outstanding included the following types:
| December 31, | ||||||||
| (In thousands) |
2009 | 2008 | ||||||
| Commercial and industrial |
$ | 185,466 | $ | 219,236 | ||||
| Personal |
20,177 | 30,921 | ||||||
| Real estate: |
||||||||
| Construction |
30,000 | 179,381 | ||||||
| Commercial real estate |
612,707 | 670,595 | ||||||
| Real estate secured by residential properties |
129,040 | 130,060 | ||||||
| Mortgage |
21,889 | 29,702 | ||||||
| Total real estate |
793,636 | 1,009,738 | ||||||
| Other |
92,198 | 68,434 | ||||||
| 1,091,477 | 1,328,329 | |||||||
| Allowance for loan losses |
(43,422 | ) | (20,730 | ) | ||||
| $ | 1,048,055 | $ | 1,307,599 | |||||
Transactions in the allowance for loan losses are summarized as follows:
| Years Ended December 31, | |||||||||
| (In thousands) |
2009 | 2008 | 2007 | ||||||
| Balance at beginning of year |
$ | 20,730 | $ | 14,926 | $ | 12,236 | |||
| Additions: |
|||||||||
| Provision for loan losses charged to operating expense |
79,328 | 28,599 | 8,130 | ||||||
| Recoveries of loans previously charged off |
2,206 | 1,126 | 2,058 | ||||||
| 81,534 | 29,725 | 10,188 | |||||||
| Deductions: |
|||||||||
| Loans charged off |
58,842 | 23,921 | 7,498 | ||||||
| 58,842 | 23,921 | 7,498 | |||||||
| Balance at end of year |
$ | 43,422 | $ | 20,730 | $ | 14,926 | |||
At December 31, 2009, 2008, and 2007, the recorded investment in loans considered to be impaired (as defined in ASC Topic 310) totaled approximately $67.8 million, $59.7 million, and $23.8 million, respectively. The allowance for loan losses related to these loans approximated $11.4 million, $10.1 million, and $4.4 million at December 31, 2009, 2008, and 2007, respectively. The average recorded investment in impaired loans during the years ended December 31, 2009, 2008, and 2007 was approximately $72.4 million, $35.5 million, and $17.2 million, respectively. For the years ended December 31, 2009 and 2008, management estimates that the amount of income recognized on impaired loans was approximately $1.7 million and $1.5 million, respectively. For the year ended December 31, 2007, the amount of income recognized on impaired loans was
65
Table of Contents
immaterial. At December 31, 2009, 2008, and 2007, nonaccrual loans amounted to approximately $64.6 million, $28.2 million, and $3.6 million, respectively (balances include restructured loans of $23.5 million, $4.4 million, and $124,000, respectively). At December 31, 2009, 2008, and 2007, loans past due ninety days or more and still accruing interest amounted to approximately $5.6 million, $3.5 million, and $5.5 million, respectively (December 31, 2007 balance includes restructured loans of $56,000).
Generally, mortgage loans are originated in amounts up to 80% of the appraised value or selling price of the property. However, certain loans may allow the borrower to borrow more than 80% of the appraised value, often without buying private mortgage insurance, therefore subjecting the Corporation to greater credit risk. The amount of residential mortgage loans with loan-to-value ratios greater than 80% was approximately $9.5 million and $8.4 million as of December 31, 2009 and 2008, respectively.
NOTE E - PREMISES AND EQUIPMENT
Premises and equipment are stated at cost, less accumulated depreciation and amortization as follows:
| Estimated Useful Lives |
December 31, | |||||||||
| (In thousands) |
In Years | 2009 | 2008 | |||||||
| Premises: |
||||||||||
| Land |
— | $ | 12,962 | $ | 13,130 | |||||
| Buildings, construction and improvements |
10 - 50 | 28,223 | 29,082 | |||||||
| 41,185 | 42,212 | |||||||||
| Equipment |
3 - 10 | 15,026 | 14,822 | |||||||
| 56,211 | 57,034 | |||||||||
| Less accumulated depreciation and amortization |
(24,964 | ) | (23,625 | ) | ||||||
| $ | 31,247 | $ | 33,409 | |||||||
The amount charged to operating expenses for depreciation was $2,494,000 for 2009, $2,658,000 for 2008, and $2,832,000 for 2007.
NOTE F - DEPOSITS
The aggregate amount of time deposits in denominations of $100,000 or more as of December 31, 2009 and 2008, was $374,251,000 and $425,901,000, respectively.
At December 31, 2009, the scheduled maturities of time deposits included in interest-bearing deposits were as follows:
| Year |
Amount | ||
| (In thousands) | |||
| 2010 |
$ | 590,240 | |
| 2011 |
88,892 | ||
| 2012 |
10,198 | ||
| 2013 |
6,196 | ||
| 2014 |
6,199 | ||
| Thereafter |
1,568 | ||
NOTE G - BORROWED FUNDS
Federal funds purchased and securities sold under agreements to repurchase, excluding the term repurchase transactions discussed in the following paragraphs, generally mature within one to seven days from the transaction date. Securities underlying the repurchase agreements remain under the control of the Corporation.
In September 2007, the Corporation entered into a $25.0 million structured repurchase transaction. This transaction is a standard repurchase transaction with a fixed rate of 4.255% and a forty-two month term. The transaction has a quarterly call option after one year.
In March 2008, the Corporation restructured a $25.0 million repurchase transaction initially entered into in December 2006. This transaction is a standard repurchase transaction with a fixed rate of 4.10% and a thirty-three month term. The transaction has a quarterly call option after nine months.
66
Table of Contents
Information concerning federal funds purchased and securities sold under agreements to repurchase is summarized as follows:
| ($ In thousands) |
2009 | 2008 | ||||||
| Balance at year end |
$ | 87,432 | $ | 98,527 | ||||
| Average balance during the year |
88,749 | 104,334 | ||||||
| Average interest rate during the year |
2.81 | % | 2.99 | % | ||||
| Maximum month-end balance during the year |
$ | 92,283 | $ | 125,068 | ||||
Repurchase agreements are treated as collateralized financing obligations and are reflected as a liability in the consolidated financial statements.
On December 30, 2003, the Corporation issued $30.9 million of floating rate junior subordinated deferrable interest debentures to the NBC Capital Corporation (MS) Statutory Trust I (“Trust”), a Connecticut business trust, in which the Corporation owns all of the common equity. The debentures are the sole asset of the Trust. The net proceeds received by the Corporation from the issuance of the debentures were used for the Enterprise acquisition. The Trust issued $30.0 million of Trust Preferred Securities (“TPSs”) to investors. The Corporation’s obligations under the debentures and related documents, taken together, constitute a full and unconditional guarantee by the Corporation of the Trust’s obligations under the TPSs. The TPSs are redeemable at the Corporation’s option on or after December 30, 2008, on any interest payment date. The TPSs must be redeemed upon maturity of the debentures in 2033. Interest on the debentures and TPSs is the three month London Interbank Offer Rate (“LIBOR”) plus 2.85% and is payable quarterly.
With the 2004 acquisition of Enterprise, the Corporation assumed the liability for an additional $6.2 million in subordinated debentures issued to support TPSs. As a result, the Corporation became the sole shareholder of Enterprise (TN) Statutory Trust I, a Connecticut business trust. The TPSs were fully redeemed in December 2007, and the trust was dissolved in January 2008.
In accordance with ASC Topic 810, “Consolidation,” neither of the above-referenced trusts are consolidated into the financial statements of the Corporation.
Other borrowed funds consisted of the following at December 31:
| (In thousands) |
2009 | 2008 | ||||
| FHLB advances |
$ | 95,000 | $ | 188,357 | ||
| Treasury tax and loan note |
1,640 | 581 | ||||
| $ | 96,640 | $ | 188,938 | |||
Advances due to the FHLB consist of term borrowings with maturity dates ranging from October 2010 to January 2019. Interest is payable monthly at rates ranging from 1.90% to 3.32%. Advances due to the FHLB are collateralized by FHLB stock and specific loans totaling $357.0 million as of December 31, 2009. The treasury tax and loan note generally matures within one to sixty days from the transaction date. Interest is paid at an adjustable rate as set by the U. S. Government.
Annual principal repayment requirements on FHLB borrowings at December 31, 2009, were as follows:
| Year |
Amount | ||
| (In thousands) | |||
| 2010 |
$ | 35,000 | |
| 2011 |
15,000 | ||
| 2012 |
— | ||
| 2013 |
20,000 | ||
| 2014 |
— | ||
| Thereafter |
25,000 | ||
| $ | 95,000 | ||
In December 2007, the Corporation extended a revolving credit agreement (the “Agreement”) that provided the Corporation with access to borrow up to $30.0 million. These borrowings could have been used to finance acquisitions and for other general corporate purposes, provided that the borrowings used for purposes other than acquisitions did not exceed $15.0 million. Interest on each borrowing would have been paid at the lender’s base rate or at LIBOR, plus 1.25% annually. The Corporation also paid a commitment fee, accruing at the annual rate of 0.15%, on the daily amount of the unused commitment. Borrowings were contingent on the Corporation’s ability to maintain various operational and financial covenants, unless the Corporation was granted a waiver. The Corporation had pledged 605,000 shares of Cadence stock as collateral for these borrowings and had covenanted to pledge shares with a minimum book value of $75.0 million. The Corporation had no outstanding borrowings under the Agreement as of December 31, 2008, and the Corporation terminated the Agreement in February 2009.
67
Table of Contents
NOTE H - OTHER ASSETS AND OTHER LIABILITIES
Other assets and other liabilities at December 31, 2009 and 2008, consisted of the following:
| December 31, | ||||||
| (In thousands) |
2009 | 2008 | ||||
| Other assets: |
||||||
| Cash surrender value of life insurance |
$ | 23,255 | $ | 23,584 | ||
| Deferred income tax benefits |
31,111 | 7,514 | ||||
| Other real estate |
34,259 | 18,691 | ||||
| Prepaid expenses and other |
24,708 | 12,247 | ||||
| $ | 113,333 | $ | 62,036 | |||
| Other liabilities: |
||||||
| Accrued expenses |
$ | 4,047 | $ | 5,366 | ||
| Pension obligation |
581 | 2,242 | ||||
| Other |
3,217 | 3,652 | ||||
| $ | 7,845 | $ | 11,260 | |||
NOTE I - COMPREHENSIVE INCOME
In the calculation of comprehensive income, certain reclassification adjustments are made to avoid double counting amounts that are displayed as part of net income for a period that also had been displayed as part of other comprehensive income. The disclosures of the reclassification amounts are as follows:
| Years Ended December 31, | ||||||||||||
| (In thousands) |
2009 | 2008 | 2007 | |||||||||
| Net change in unrealized gains (losses) on securities: |
||||||||||||
| Net unrealized gains (losses) on securities available-for-sale |
$ | 5,679 | $ | 5,119 | $ | 3,425 | ||||||
| Reclassification adjustment for (gains) losses on securities available-for-sale |
(3,173 | ) | (390 | ) | 5,114 | |||||||
| Net change in unrealized gains (losses) on securities available-for-sale before tax |
2,506 | 4,729 | 8,539 | |||||||||
| Income tax: |
||||||||||||
| Net unrealized gains (losses) on securities available-for-sale |
(2,172 | ) | (1,958 | ) | (1,310 | ) | ||||||
| Reclassification adjustment for (gains) losses on securities available-for-sale |
1,214 | 149 | (1,956 | ) | ||||||||
| Total income tax |
(958 | ) | (1,809 | ) | (3,266 | ) | ||||||
| Net change in unrealized gains (losses) on securities |
$ | 1,548 | $ | 2,920 | $ | 5,273 | ||||||
The balances in accumulated other comprehensive income as of December 31, 2009, are as follows:
| Pension liability |
$ | (3,000 | ) | |
| Unrealized gains on securities available-for-sale |
5,645 | |||
| Total accumulated other comprehensive income |
$ | 2,645 | ||
68
Table of Contents
NOTE J - INCOME TAXES
The provision for income taxes including the tax effects of securities transactions (2009—$1,214,000; 2008—$149,000; 2007—($1,956,000)) was as follows:
| Years Ended December 31, | ||||||||||||
| (In thousands) |
2009 | 2008 | 2007 | |||||||||
| Current: |
||||||||||||
| Federal |
$ | (4,644 | ) | $ | (1,180 | ) | $ | 4,872 | ||||
| State |
(907 | ) | (767 | ) | 340 | |||||||
| Deferred |
(24,796 | ) | (3,072 | ) | (2,424 | ) | ||||||
| Valuation allowance |
601 | — | — | |||||||||
| Total income tax benefit |
$ | (29,746 | ) | $ | (5,019 | ) | $ | 2,788 | ||||
The difference between the total expected tax expense at the federal tax rate and the reported income tax expense is as follows:
| Years Ended December 31, | ||||||||||||
| (In thousands) |
2009 | 2008 | 2007 | |||||||||
| Tax on income before income taxes |
$ | (48,712 | ) | $ | (2,727 | ) | $ | 4,405 | ||||
| Increase (decrease) resulting from: |
||||||||||||
| Tax-exempt income |
(888 | ) | (1,908 | ) | (1,829 | ) | ||||||
| Nondeductible expenses |
70 | 186 | 251 | |||||||||
| Goodwill impairment charge |
23,290 | — | — | |||||||||
| State income taxes, net of federal benefit |
(2,731 | ) | (604 | ) | 221 | |||||||
| Tax credits |
(172 | ) | (172 | ) | (291 | ) | ||||||
| Other, net |
(603 | ) | 206 | 31 | ||||||||
| $ | (29,746 | ) | $ | (5,019 | ) | $ | 2,788 | |||||
The components of the net deferred tax asset included in the consolidated balance sheets are as follows:
| December 31, | ||||||||
| (In thousands) |
2009 | 2008 | ||||||
| Deferred tax assets: |
||||||||
| Allowance for loan losses |
$ | 16,826 | $ | 7,929 | ||||
| Deferred compensation |
1,025 | 1,370 | ||||||
| Pension |
225 | 877 | ||||||
| Net operating loss carryforwards |
14,806 | 792 | ||||||
| Other |
4,211 | 2,818 | ||||||
| Total deferred tax assets |
37,093 | 13,786 | ||||||
| Deferred tax liabilities: |
||||||||
| Premises and equipment |
(227 | ) | (812 | ) | ||||
| FHLB stock |
(218 | ) | (490 | ) | ||||
| Core deposit intangible premium |
(527 | ) | (757 | ) | ||||
| Unrealized gain on securities available-for-sale |
(3,554 | ) | (2,977 | ) | ||||
| Other |
(855 | ) | (1,236 | ) | ||||
| Total deferred tax liabilities |
(5,381 | ) | (6,272 | ) | ||||
| Net temporary differences |
31,712 | 7,514 | ||||||
| Valuation allowance |
(601 | ) | — | |||||
| Net deferred tax asset |
$ | 31,111 | $ | 7,514 | ||||
At December 31, 2009, the Corporation had state net operating loss carryforwards of $2.6 million, with varying expiration dates. The Corporation reviewed its deferred tax assets, including these carryforwards, to determine whether it is more likely than not that some portion of the deferred tax assets would not be realized. Based on this review, the Corporation established a valuation allowance of $601,000 for the tax benefit of a portion of these carryforwards as of December 31, 2009.
ASC Topic 740, “Income Taxes,” implements accounting requirements associated with uncertainty in income taxes and requires a company to evaluate whether the tax position taken by a company will more likely than not be sustained upon examination by the appropriate taxing authorities. This is the minimum recognition threshold and measurement methodology
69
Table of Contents
required for a tax position taken or expected to be taken in a tax return to be recognized in the financial statements. It also provides guidance for derecognition, classification, interest and penalties, accounting in interim periods, and disclosure. As of December 31, 2009, the Corporation had no uncertain tax positions that qualify for either recognition or disclosure in the consolidated financial statements.
NOTE K - GOODWILL AND OTHER INTANGIBLE ASSETS
The following table summarizes goodwill and intangible assets at December 31:
| (In thousands) |
2009 | 2008 | ||||
| Core deposit intangible, net of accumulated amortization |
$ | 1,360 | $ | 1,980 | ||
| Trademarks, net of accumulated amortization |
24 | 24 | ||||
| Total intangible assets |
1,384 | 2,004 | ||||
| Goodwill |
— | 66,845 | ||||
| Total goodwill and intangible assets |
$ | 1,384 | $ | 68,849 | ||
The amortization expense relating to intangible assets was $619,000, $890,000, and $1,328,000 for 2009, 2008, and 2007, respectively.
As discussed in Note A, ASC Topic 350 requires that goodwill be tested for impairment between annual tests if an event occurs or circumstances change that would more likely than not reduce the fair value of a reporting unit below its carrying amount. As a result of this testing, management concluded that our goodwill was fully impaired as of March 31, 2009, and a goodwill impairment charge of $66.8 million ($304,000 of which related to GCM) was recognized for the quarter ended March 31, 2009. This charge eliminated all goodwill previously reflected on the Corporation’s balance sheet.
Estimated intangible assets amortization expense for the next five years and thereafter is:
| Year |
Amount | ||
| (In thousands) | |||
| 2010 |
$ | 450 | |
| 2011 |
333 | ||
| 2012 |
249 | ||
| 2013 |
191 | ||
| 2014 |
79 | ||
| Thereafter |
58 | ||
NOTE L - PERFORMANCE SHARES AND STOCK OPTIONS
The Corporation has one active Long Term Incentive Compensation Plan (the “LTIP”), administered by the Compensation Committee of the Board of Directors. Under the LTIP, 750,000 shares of common stock have been reserved for issuance to the Corporation’s eligible employees, as well as the directors and employees of certain of the Corporation’s affiliates. The form of share awards that may be awarded under the LTIP include the following: (i) incentive stock options under Section 422 of the Internal Revenue Code, as amended (the “Code”); (ii) non-statutory stock options not covered by Section 422 of the Code; (iii) stock appreciation rights, granting the recipient the right to receive an excess in the fair market value of shares of common stock over a specified exercise price; (iv) restricted stock, which will be non-transferable until it vests over time; (v) qualified performance-based incentives to employees who qualify as covered employees within the meaning of Section 162(m) of the Code; and (vi) performance shares, consisting of common stock, cash, or a combination of common stock and cash.
In 2007 and 2008, under the provisions of the LTIP, the Compensation Committee awarded performance shares of stock to certain eligible employees. No awards were granted in 2009. The shares vest in equal amounts over a four-year period after they are earned.
70
Table of Contents
A summary of the Corporation’s performance share activity for the years ended December 31, 2009, 2008 and 2007, follows:
| 2009 | 2008 | 2007 | ||||||||||
| Shares outstanding, beginning of year |
46,632 | 35,450 | 18,750 | |||||||||
| Shares granted |
— | 79,332 | 70,300 | |||||||||
| Shares forfeited |
(4,250 | ) | (68,150 | ) | (53,600 | ) | ||||||
| Shares outstanding, end of year |
42,382 | 46,632 | 35,450 | |||||||||
| Shares earned, beginning of year |
44,632 | 30,950 | 18,750 | |||||||||
| Shares earned |
— | 13,682 | 15,200 | |||||||||
| Shares forfeited |
(2,250 | ) | — | (3,000 | ) | |||||||
| Shares earned, end of year |
42,382 | 44,632 | 30,950 | |||||||||
| Shares unearned, end of year |
— | 2,000 | 4,500 | |||||||||
| Shares outstanding, end of year |
42,382 | 46,632 | 35,450 | |||||||||
| Compensation expense for year |
$ | 166,652 | $ | 202,354 | $ | 148,928 | ||||||
Prior to 2006, the Corporation had certain nonqualified stock option plans administered by the Compensation Committee. Employees eligible to receive incentives under these plans were those designated, individually or by groups or categories, by the Compensation Committee. The following grants were issued under these plans:
| Grant Date |
Number of Shares | Option Price | |||
| June 2001 |
112,000 | $ | 20.75 | ||
| June 2002 |
117,868 | $ | 24.11 | ||
| April 2004 |
139,187 | $ | 25.18 | ||
| January 2005 |
16,300 | $ | 25.28 | ||
Initially under these plans, the options were to vest in equal amounts over a four-year period. However, during the third quarter of 2005, the Compensation Committee reviewed the Corporation’s stock option plans and the options outstanding. At the time of the review, all outstanding options that were not vested were out-of-the-money. This situation had existed for much of 2005. In the opinion of the Compensation Committee, the options were not achieving their intended purposes of incentive compensation and employee retention. As a result, the Compensation Committee recommended to the Board of Directors that all outstanding options be vested to avoid recognizing future expense for options that were not achieving their intended results, and the Board of Directors voted to vest all outstanding options, effective August 31, 2005.
In April of 2004, the Corporation exchanged its options for options that had been issued by Enterprise. As a result of this transaction, the Corporation issued 16,731 options at an exercise price of $16.14 per share and 22,308 options at an exercise price of $17.21 per share. All of these options became fully vested at the change of control and expire between 2010 and 2013. At December 31, 2009, 11,154 of the $16.14 options and 14,872 of the $17.21 options were outstanding and exercisable.
ASC Topic 718 requires that compensation cost related to share-based payment transactions, including stock options, be recognized in the financial statements; however, since all options were fully vested as of the effective date of this pronouncement, no expense was recognized in the income statement in 2007, 2008 or 2009.
A summary of the status of the Corporation’s stock option plans for the three years ended December 31, 2009, 2008, and 2007, follows:
| 2009 | 2008 | 2007 | ||||||||||||||||||
| Number of Options |
Weighted Average Exercise Price |
Number of Options |
Weighted Average Exercise Price |
Number of Options |
Weighted Average Exercise Price | |||||||||||||||
| Options outstanding, beginning of year |
327,286 | $ | 23.01 | 327,286 | $ | 23.01 | 339,286 | $ | 23.07 | |||||||||||
| Options granted |
— | — | — | — | — | — | ||||||||||||||
| Options exercised |
— | — | — | — | — | — | ||||||||||||||
| Options cancelled |
(22,000 | ) | 23.54 | — | — | (12,000 | ) | 24.65 | ||||||||||||
| Options outstanding, end of year |
305,286 | 22.97 | 327,286 | 23.01 | 327,286 | 23.01 | ||||||||||||||
| Options exercisable at end of year |
305,286 | 22.97 | 327,286 | 23.01 | 327,286 | 23.01 | ||||||||||||||
| Weighted average fair value of options granted during year |
$ | — | $ | — | $ | — | ||||||||||||||
71
Table of Contents
The following table summarizes information about stock options outstanding at December 31, 2009:
| Exercise Price |
Number Outstanding and Exercisable |
Remaining Contractual Life In Years | ||
| $20.75 | 82,134 | 1.5 | ||
| 24.11 | 86,400 | 2.5 | ||
| 25.18 | 94,426 | 4.3 | ||
| 16.14 | 3,718 | 0.1 | ||
| 17.21 | 7,436 | 1.1 | ||
| 17.21 | 7,436 | 2.1 | ||
| 16.14 | 7,436 | 3.1 | ||
| 25.28 | 16,300 | 5.0 |
NOTE M - EMPLOYEE BENEFITS
The Corporation accounts for its defined benefit plan in accordance with ASC Topic 715. This guidance requires companies to recognize the funded status of a defined benefit plan (measured as the difference between the fair value of plan assets and the projected benefit obligation) on the balance sheet and to recognize in other comprehensive income any gains or losses and prior service costs or benefits not included as components of periodic benefit cost.
The following table sets forth the defined benefit plan’s funded status and amounts recognized in the Corporation’s consolidated financial statements at December 31, 2009 and 2008:
| December 31, | ||||||||
| $ in thousands |
2009 | 2008 | ||||||
| Change in benefit obligation: |
||||||||
| Benefit obligation at beginning of year |
$ | 12,949 | $ | 13,210 | ||||
| Service cost |
714 | 821 | ||||||
| Interest cost |
745 | 675 | ||||||
| Actuarial loss (gain) |
517 | (219 | ) | |||||
| Administrative expenses paid |
(126 | ) | (129 | ) | ||||
| Benefits paid |
(2,231 | ) | (1,409 | ) | ||||
| Curtailments |
63 | — | ||||||
| Benefit obligation at end of year |
12,631 | 12,949 | ||||||
| Change in plan assets: |
||||||||
| Fair value of plan assets at beginning of year |
10,707 | 12,196 | ||||||
| Return on plan assets |
2,599 | (2,651 | ) | |||||
| Employer contributions |
1,100 | 2,700 | ||||||
| Administrative expenses paid |
(125 | ) | (129 | ) | ||||
| Benefits paid |
(2,231 | ) | (1,409 | ) | ||||
| Fair value of plan assets at end of year |
12,050 | 10,707 | ||||||
| Funded status |
$ | (581 | ) | $ | (2,242 | ) | ||
| Weighted average assumptions used to determine benefit obligations at December 31: |
||||||||
| Discount rate |
5.50 | % | 6.25 | % | ||||
| Compensation increase rate |
3.50 | % | 3.50 | % | ||||
| Measurement date |
12/31/2009 | 12/31/2008 | ||||||
| Census date |
1/1/2009 | 1/1/2008 | ||||||
72
Table of Contents
| Years Ended December 31, | ||||||||||||
| 2009 | 2008 | 2007 | ||||||||||
| Weighted average assumptions used to determine net periodic benefit cost for years ended December 31: |
||||||||||||
| Discount rate |
6.25 | % | 6.00 | % | 5.75 | % | ||||||
| Expected return on plan assets |
7.00 | % | 7.50 | % | 7.50 | % | ||||||
| Rate of compensation increase |
3.50 | % | 4.00 | % | 4.00 | % | ||||||
| Components of net periodic benefit cost: |
||||||||||||
| Service cost |
$ | 714 | $ | 821 | $ | 638 | ||||||
| Interest cost |
745 | 675 | 691 | |||||||||
| Expected return on plan assets |
(902 | ) | (770 | ) | (831 | ) | ||||||
| Amortization of prior service costs |
(87 | ) | (93 | ) | (126 | ) | ||||||
| Recognized net actuarial loss |
336 | 275 | 346 | |||||||||
| Cost of curtailments |
60 | — | — | |||||||||
| Cost of settlements |
828 | — | — | |||||||||
| Net periodic benefit cost |
$ | 1,694 | $ | 908 | $ | 718 | ||||||
| Amounts recognized in accumulated other comprehensive income: |
||||||||||||
| Net actuarial loss |
$ | (4,840 | ) | $ | (7,185 | ) | $ | (4,257 | ) | |||
| Prior service cost (credit) |
(19 | ) | 71 | 165 | ||||||||
| (4,859 | ) | (7,114 | ) | (4,092 | ) | |||||||
| Tax effect |
(1,859 | ) | (2,721 | ) | (1,565 | ) | ||||||
| Net |
$ | (3,000 | ) | $ | (4,393 | ) | $ | (2,527 | ) | |||
The amounts in accumulated other comprehensive income that are expected to be recognized as components of net periodic benefit cost in 2010 are as follows:
| Amount | ||||
| (In thousands) | ||||
| Amortization of net actuarial loss |
$ | 353 | ||
| Amortization of prior service cost |
(79 | ) | ||
| Total |
$ | 274 | ||
The accumulated benefit obligation for the defined benefit pension plan was $10.5 million and $10.7 million at December 31, 2009 and 2008, respectively.
Retiree benefit payments, which reflect expected future service, are anticipated to be paid as follows:
| Year |
Amount | ||
| (In thousands) | |||
| 2010 |
$ | 1,133 | |
| 2011 |
2,972 | ||
| 2012 |
907 | ||
| 2013 |
870 | ||
| 2014 |
1,268 | ||
| 2015-2019 |
5,588 | ||
| Total |
$ | 12,738 | |
In determining the expected return on plan assets, the Corporation considers the relative weighting of plan assets, the historical performance of total plan assets, individual asset classes, and economic and other indicators of future performance. In addition, the Corporation may consult with and consider the opinions of financial and other professionals in developing appropriate return benchmarks.
73
Table of Contents
The Corporation’s pension plan fair values and weighted-average asset allocations at December 31, 2009 and 2008, by asset category were as follows:
| 12/31/09 | 12/31/08 | |||||||||||
| ($ in thousands) |
Fair Value of Plan Assets |
Asset Allocations |
Fair Value of Plan Assets |
Asset Allocations |
||||||||
| Asset Category |
||||||||||||
| Equity securities |
$ | 7,354 | 61 | % | $ | 4,218 | 40 | % | ||||
| Debt securities |
4,619 | 38 | % | 2,920 | 27 | % | ||||||
| Cash and cash equivalents |
77 | 1 | % | 3,569 | 33 | % | ||||||
| Total |
$ | 12,050 | 100 | % | $ | 10,707 | 100 | % | ||||
The primary investment objective of the Corporation’s defined benefit pension plan is to maximize total return while accepting and managing a moderate to average degree of risk. The assets are invested based upon a moderate growth asset allocation model, which seeks to provide long-term growth of capital with a moderate level of current income and a somewhat higher level of principal volatility. For 2009, the assets are allocated in a target mix of 39% fixed income, 60% equity and 1% money market. For 2008, the assets were allocated in a target mix of 37% fixed income, 53% equity and 10% money market. The fixed income class is divided between a short-term government bond fund, a core fixed income bond fund, a high-yield bond fund and an international bond fund. The equity class is diversified among large, mid and small cap growth and value stock funds with an emphasis being placed on large cap. There is also an exposure in the international equity market. This diversification among all of the equity sectors is an effort to reduce risk and attempt to generate higher returns. As a result of market conditions and cash contributions by the Corporation, the target percentages may not be achieved at any one point in time. The asset category percentages for 2008 reflect a $2.7 million cash contribution made by the Corporation in late December. This contribution was worked into the portfolio gradually in 2009.
The Employee Benefit Committee of the Corporation reviews annually the investments of the plan made throughout the year and approves and ratifies the investment model used for the upcoming year. The investments are managed by the Trust Division of the Corporation within the guidelines established by the Employee Benefit Committee. It is the intent of management and the Committee to give the investment managers flexibility within the overall parameters designated in the investment model selected by the Employee Benefit Committee for the plan.
Equity securities do not include common stock of the Corporation. The fair values of all plan assets as of December 31, 2009 and 2008, were measured using quoted prices in active markets for identical assets and liabilities (Level 1 inputs, as defined by ASC Topic 820, “Fair Value Measurements and Disclosures”).
The Corporation has until September 15, 2010, to make any necessary cash contributions to the plan for 2009. While there is no minimum required contribution for 2009, the Corporation expects to contribute approximately $450,000 to the plan to maximize funding levels. There is no requirement to make a 2010 plan contribution by December 31, 2010.
No contributions were made to the Corporation’s nonleveraged ESOP in each of the three years ended December 31, 2009. At December 31, 2009, the plan held 289,280 shares of the Corporation’s common stock. Contributions to the 401(k) plan amounted to $525,000 in 2009, $1.1 million in 2008, and $604,000 in 2007. Contributions to the defined contribution plan totaled $515,000 in 2007. There were no contributions made to the defined contribution plan in 2009 or 2008.
The accrued liability for the supplemental retirement plan, accounted for under ASC Topic 715 approximates the projected benefit obligation. The accrued liability for this plan was $1,734,000 and $1,806,000 at December 31, 2009 and 2008, respectively. The amounts recognized in compensation expense were $118,000 for the year ended December 31, 2009, and $154,000 for the years ended December 31, 2008 and 2007.
Projected benefit payments under the supplemental retirement plan are anticipated to be paid as follows:
| Year |
Amount | ||
| (In thousands) | |||
| 2010 |
$ | 191 | |
| 2011 |
191 | ||
| 2012 |
189 | ||
| 2013 |
168 | ||
| 2014 |
96 | ||
| 2015-2019 |
501 | ||
| Total |
$ | 1,336 | |
74
Table of Contents
The accrued liability for the supplemental retirement and deferred compensation plans was $2,570,000 and $2,879,000 at December 31, 2009 and 2008, respectively. The amounts recognized in compensation expense were $390,000, ($368,000), and $29,000 for the years ended December 31, 2009, 2008, and 2007, respectively. Compensation expense is impacted by the changes in market values of plan assets. As market values declined during 2008, the liabilities under the plans declined and the plans recognized income.
NOTE N - RELATED PARTY TRANSACTIONS
In the normal course of business, loans are made to directors and executive officers and to companies in which they have a significant ownership interest. In the opinion of management, these loans are made on substantially the same terms, including interest rates and collateral, as those prevailing at the time for comparable transactions with other parties, are consistent with sound banking practices, and are within applicable regulatory and lending limitations. The activity in loans to current directors, executive officers, and their affiliates during 2009 and 2008 is summarized as follows:
| December 31, | ||||||||
| (In thousands) |
2009 | 2008 | ||||||
| Loans outstanding at beginning of year |
$ | 19,736 | $ | 13,966 | ||||
| New loans |
8,209 | 24,084 | ||||||
| Repayments |
(13,702 | ) | (18,314 | ) | ||||
| Loans outstanding at end of year |
$ | 14,243 | $ | 19,736 | ||||
Also, in the normal course of business, the Corporation and its subsidiaries enter into transactions for services with companies and firms whose principals are directors and shareholders.
NOTE O - REGULATORY MATTERS
Generally, dividends paid by the Corporation are provided from dividends received from Cadence. Under regulations controlling national banks, the payment of any dividends by a bank without prior approval of the OCC is limited to the current year’s net profits (as defined by the OCC) and retained net profits of the two preceding years. At December 31, 2009, Cadence can not make dividend payments to the Corporation without prior approval. The Federal Reserve, as primary regulator for bank holding companies, has also stated that all common stock dividends should be paid out of current earnings. As the Corporation does not generate earnings on a stand-alone basis, it does not have the capability to pay common stock dividends without receiving dividends from Cadence.
Cadence is subject to the capital adequacy requirements of the OCC. The Corporation, as a bank holding company, is subject to the capital adequacy requirements of the Federal Reserve. Failure to meet minimum capital requirements can initiate certain mandatory and possibly additional discretionary actions by regulators that, if undertaken, could have a direct material effect on the Corporation’s Consolidated Financial Statements. Under capital adequacy guidelines and the regulatory framework for prompt corrective action, the Corporation and Cadence must meet specific capital guidelines that involve quantitative measures of assets, liabilities and certain off-balance sheet items as calculated under regulatory accounting practices. Capital amounts and classifications are also subject to qualitative judgment by regulators about components, risk weightings, and other related factors.
The risk-based capital requirements of the Federal Reserve and the OCC define capital and establish minimum capital requirements in relation to assets and off-balance sheet exposure, adjusted for credit risk. The risk-based capital standards currently in effect are designed to make regulatory capital requirements more sensitive to differences in risk profiles among bank holding companies and banks, to account for off-balance sheet exposure and to minimize disincentives for holding liquid assets. Assets and off-balance sheet items are assigned to broad risk categories, each with appropriate relative risk weights. The resulting capital ratios represent capital as a percentage of total risk-weighted assets and off-balance sheet items.
The risk-based capital standards issued by the Federal Reserve require all bank holding companies to have a Tier 1 leverage ratio of at least 4.0% to be “adequately capitalized” and at least 6.0% to be “well-capitalized” and a total risk-based capital ratio (Tier 1 and Tier 2) of at least 8.0% of total risk-adjusted assets to be “adequately capitalized” and at least 10.0% to be “well-capitalized.” Tier 1 capital generally includes common shareholders’ equity and qualifying perpetual preferred stock together with related surpluses and retained earnings, less deductions for goodwill and various other intangibles. Tier 2 capital may consist of a limited amount of intermediate-term preferred stock, a limited amount of term subordinated debt, certain hybrid capital instruments and other debt securities, perpetual preferred stock not qualifying as Tier 1 capital, and a limited amount of the general valuation allowance for loan losses.
The Federal Reserve has also adopted guidelines which supplement the risk-based capital guidelines with a minimum ratio of Tier 1 capital to average total consolidated assets (leverage ratio) of 3.0% for institutions with well diversified risk, including no undue interest rate exposure; excellent asset quality; high liquidity; good earnings; and that are generally considered to be strong banking organizations, rated composite 1 under applicable federal guidelines, and that are not experiencing or
75
Table of Contents
anticipating significant growth. Other banking organizations are required to maintain a leverage ratio of at least 4.0% in order to be categorized as “adequately capitalized” and at least 5.0% to be categorized as “well-capitalized.” These rules further provide that banking organizations experiencing internal growth or making acquisitions will be expected to maintain capital positions substantially above the minimum supervisory levels and comparable to peer group averages, without significant reliance on intangible assets.
The actual capital amounts and ratios are presented in the following table. No amount was deducted from capital for interest-rate risk exposure.
| Cadence Financial Corporation (Consolidated) |
Cadence | |||||||||||||
| ($ In thousands) |
Amount | Ratio | Amount | Ratio | ||||||||||
| December 31, 2009: |
||||||||||||||
| Total risk-based |
$ | 125,730 | 10.9 | % | $ | 117,053 | 10.2 | % | ||||||
| Tier 1 risk-based |
110,980 | 9.6 | % | 102,338 | 8.9 | % | ||||||||
| Tier 1 leverage |
110,980 | 6.3 | % | 102,338 | 6.0 | % | ||||||||
| December 31, 2008: |
||||||||||||||
| Total risk-based |
$ | 164,255 | 11.4 | % | $ | 153,652 | 10.4 | % | ||||||
| Tier 1 risk-based |
146,164 | 10.1 | % | 135,607 | 9.3 | % | ||||||||
| Tier 1 leverage |
146,164 | 7.7 | % | 135,607 | 7.0 | % | ||||||||
| The minimum amounts of capital and ratios as established by banking regulators are as follows: | ||||||||||||||
| December 31, 2009: |
||||||||||||||
| Total risk-based |
$ | 92,103 | 8.0 | % | $ | 91,878 | 8.0 | % | ||||||
| Tier 1 risk-based |
46,052 | 4.0 | % | 45,939 | 4.0 | % | ||||||||
| Tier 1 leverage |
70,136 | 4.0 | % | 68,616 | 4.0 | % | ||||||||
| December 31, 2008: |
||||||||||||||
| Total risk-based |
$ | 115,569 | 8.0 | % | $ | 115,274 | 8.0 | % | ||||||
| Tier 1 risk-based |
57,785 | 4.0 | % | 57,637 | 4.0 | % | ||||||||
| Tier 1 leverage |
76,472 | 4.0 | % | 76,132 | 4.0 | % | ||||||||
Cadence is subject to capital adequacy guidelines of the OCC at the bank level that are substantially similar to the Federal Reserve guidelines. Although current regulatory guidelines state that a financial institution must have a total risk-based capital ratio of 10.0%, a Tier 1 risk-based capital ratio of 6.0%, and a Tier 1 leverage ratio of 5.0% to be considered “well-capitalized” in accordance with the regulations, the primary regulator has the ability to impose higher ratios on financial institutions. These higher standards are imposed if the regulator believes that the risk profile on the institution is higher than they consider appropriate. As part of an agreement entered into with the OCC in April 2009, Cadence was required to achieve by September 30, 2009, and maintain on an ongoing basis, a Tier 1 leverage ratio of 8.0% and a total risk-based capital ratio of 12.0%. As of December 31, 2009, Cadence had a Tier 1 leverage ratio of 6.0% and a total risk-based capital ratio of 10.2%. As a result of not meeting the capital ratio requirements, the OCC has broad authority to take additional adverse actions against Cadence.
As a result of losses experienced by the Corporation in 2009 and Cadence’s requirement for additional capital to meet these higher ratios, there is a need for the Corporation to raise additional capital. The Corporation is currently seeking to raise this capital through all available sources, including public or private equity offerings. However, at this time, there can be no assurance as to the availability or terms upon which this capital might be available.
The Corporation is required to maintain average reserve balances in the form of cash or deposits with the Federal Reserve Bank. The reserve balance varies depending upon the types and amounts of deposits. At December 31, 2009 and 2008, the required reserve balance on deposit with the Federal Reserve Bank was approximately $600,000 and $250,000, respectively.
NOTE P - COMMITMENTS AND CONTINGENT LIABILITIES
The consolidated financial statements do not reflect various commitments and contingent liabilities which arise in the normal course of banking business and which involve elements of credit risk, interest rate risk, and liquidity risk. The commitments and contingent liabilities are commitments to extend credit, home equity lines, overdraft protection lines, and standby letters of credit. Such financial instruments are recorded when they are funded. A summary of commitments and contingent liabilities at December 31, 2009 and 2008 is as follows:
| Contractual Amount December 31, | ||||||
| (In thousands) |
2009 | 2008 | ||||
| Commitments to extend credit |
$ | 162,029 | $ | 257,797 | ||
| Standby letters of credit |
12,086 | 16,027 | ||||
76
Table of Contents
Commitments to extend credit and letters of credit include some exposure to credit loss in the event of nonperformance of the customer. Commitments to extend credit are agreements to lend to a customer as long as there is no violation of any condition established in the contract. Standby letters of credit are conditional commitments issued to guarantee the performance of a customer to a third party. The credit policies and procedures for such commitments are the same as those used for lending activities. Because these instruments have fixed maturity dates and because a number expire without being drawn upon, they generally do not present any significant liquidity risk. No significant losses on commitments were incurred during the three years ended December 31, 2009, nor are any significant losses as a result of these transactions anticipated.
In June 2008, the FHLB of Dallas issued a $35 million standby letter of credit to the Bank to secure public funds.
The Corporation leases various premises and equipment under operating leases. At December 31, 2009, future minimum rental commitments are as follows:
| Year |
Amount | ||
| (In thousands) | |||
| 2010 |
$ | 1,691 | |
| 2011 |
1,582 | ||
| 2012 |
1,515 | ||
| 2013 |
1,425 | ||
| 2014 |
1,357 | ||
| Thereafter |
7,715 | ||
Rental expense for premises and equipment for the years ended December 31, 2009, 2008, and 2007, were $1,491,000, $1,539,000, and $1,776,000, respectively.
The Corporation is a defendant in various pending and threatened legal actions arising in the normal course of business. In the opinion of management, based upon the advice of legal counsel, the ultimate disposition of these matters will not have a material effect on the Corporation’s consolidated financial statements.
NOTE Q - CONCENTRATIONS OF CREDIT
Most of the loans, commitments and letters of credit have been granted to customers in the Corporation’s market areas. Generally, such customers are also depositors. Investments in state and municipal securities also involve governmental entities within the Corporation’s market areas. The concentrations of credit by type of loan are set forth in Note D of these Consolidated Financial Statements. The distribution of commitments to extend credit approximates the distribution of loans outstanding. Letters of credit were granted primarily to commercial borrowers.
NOTE R - SUPPLEMENTAL CASH FLOW INFORMATION
| Years Ended December 31, | |||||||||
| (In thousands) |
2009 | 2008 | 2007 | ||||||
| Cash paid during the year for: |
|||||||||
| Interest |
$ | 35,893 | $ | 49,070 | $ | 67,093 | |||
| Income taxes, net of refunds |
— | 2,554 | 7,064 | ||||||
| Non-cash activities: |
|||||||||
| Transfers of loans to other real estate |
34,357 | 16,251 | 8,979 | ||||||
NOTE S - DISCLOSURE ABOUT FAIR VALUES OF FINANCIAL INSTRUMENTS
The following disclosure of the estimated fair value of financial instruments is made in accordance with ASC Topic 825, “Financial Instruments.” The estimated fair value amounts have been determined using available market information and appropriate valuation methodologies. However, considerable judgment is necessarily required to interpret market data to develop the estimates of fair value. Accordingly, the estimates presented herein are not necessarily indicative of the amounts that could be realized in a current market exchange. The use of different market assumptions and/or estimation methodologies may have a material effect on the estimated fair value amounts.
77
Table of Contents
The following methods and assumptions were used to estimate the fair value of each class of financial instruments for which it is practicable to estimate that value:
Cash and Cash Equivalents – For such short-term instruments, the carrying amount is a reasonable estimate of fair value.
Securities – For securities held as investments, fair value equals market price, if available. If a quoted market price is not available, fair value is estimated using quoted market prices for similar securities; however, as of December 31, 2009, quoted market prices were available for all securities. The fair value of other securities, which consist of FHLB stock and Federal Reserve Bank stock, is estimated to be the carrying value, which is par.
Loans – The fair value of loans is estimated by discounting the future cash flows using the current rates at which similar loans would be made to borrowers with similar credit ratings and for the same remaining maturities.
Deposits – The fair values of demand deposits are, as required by ASC Topic 825, equal to the carrying value of such deposits. Demand deposits include noninterest-bearing demand deposits, savings accounts, NOW accounts, and money market demand accounts. The fair value of variable rate term deposits, those repricing within six months or less, approximates the carrying value of these deposits. Discounted cash flows have been used to value fixed rate term deposits and variable rate term deposits repricing after six months. The discount rate used is based on interest rates currently being offered on comparable deposits as to amount and term.
Federal Funds Purchased and Securities Sold Under Agreements to Repurchase – The fair value of any federal funds purchased, securities sold under agreements to repurchase and other short-term borrowings generally approximates their carrying value. The fair value of structured repurchase agreements is estimated using discounted cash flows, based on current incremental borrowing rates for similar types of arrangements.
Subordinated Debentures – The subordinated debentures bear interest at a variable rate and the carrying value approximates the fair value.
FHLB and Other Borrowings – The fair value of the fixed rate borrowings is estimated using discounted cash flows, based on current incremental borrowing rates for similar types of borrowing arrangements. The carrying amount of any variable rate borrowings approximates their fair values.
Off-Balance Sheet Instruments – Fair values of off-balance sheet financial instruments are based on fees charged to enter into similar agreements. However, commitments to extend credit do not represent a significant value until such commitments are funded or closed. Management has determined that these instruments do not have a distinguishable fair value and no fair value has been assigned.
The estimated fair values of financial instruments, none of which are held for trading purposes, were as follows:
| December 31, 2009 | December 31, 2008 | |||||||||||
| (In thousands) |
Carrying Amount |
Estimated Fair Value |
Carrying Amount |
Estimated Fair Value | ||||||||
| Financial Instruments: |
||||||||||||
| Assets: |
||||||||||||
| Cash and cash equivalents |
$ | 297,035 | $ | 297,035 | $ | 61,233 | $ | 61,233 | ||||
| Securities available-for-sale |
330,079 | 330,079 | 398,702 | 398,702 | ||||||||
| Securities held-to-maturity |
2,671 | 2,741 | 21,358 | 22,115 | ||||||||
| Other securities |
13,313 | 13,313 | 16,369 | 16,369 | ||||||||
| Loans |
1,048,055 | 1,049,952 | 1,307,599 | 1,305,410 | ||||||||
| Liabilities: |
||||||||||||
| Noninterest-bearing deposits |
170,722 | 170,722 | 181,191 | 181,191 | ||||||||
| Interest-bearing deposits |
1,329,088 | 1,315,583 | 1,279,968 | 1,285,294 | ||||||||
| Federal funds purchased and securities sold under agreements to repurchase |
87,432 | 89,582 | 98,527 | 101,427 | ||||||||
| Subordinated debentures |
30,928 | 30,928 | 30,928 | 30,928 | ||||||||
| FHLB and other borrowings |
96,640 | 94,985 | 188,938 | 192,491 | ||||||||
ASC Topic 820, “Fair Value Measurements and Disclosures,” provides guidance for using fair value to measure assets and liabilities and establishes a hierarchy to prioritize the inputs used to measure fair value. The fair value hierarchy gives the highest priority to a valuation based on quoted prices in active markets for identical assets and liabilities (Level 1), moderate priority to a valuation based on quoted prices in active markets for similar assets and liabilities and/or based on assumptions that are observable in the market (Level 2), and the lowest priority to a valuation based on assumptions that are not observable in the market (Level 3).
78
Table of Contents
In accordance with the disclosure requirements of ASC Topic 820, the following table reflects assets measured at fair value on a recurring basis as of December 31, 2009. U. S. Treasury securities are reported at fair value utilizing Level 1 inputs. Other securities classified as available-for-sale are reported at fair value using Level 2 inputs. For these securities, the Corporation obtains fair value measurements from an independent pricing service. The fair value measurements consider observable data that may include dealer quotes, market spreads, cash flows, the U.S. Treasury yield curve, live trading levels, trade execution data, market consensus prepayment speeds, credit information, and bond terms and conditions, among other things.
| (In thousands) |
Total | Level 1 | Level 2 | ||||||
| Available-for-sale securities |
$ | 330,079 | $ | 321 | $ | 329,758 | |||
The following valuation methodologies are used for assets measured at fair value on a non-recurring basis and recognized in the Corporation’s consolidated balance sheets, as well as the general classification of these assets within the valuation hierarchy.
Impaired Loans – A loan is considered impaired when, based on current information, it is probable that the Corporation will not receive all amounts due in accordance with the contractual terms of the loan agreement. Once a loan has been identified as impaired, management measures impairment in accordance with ASC Topic 310, “Receivables.” The measurement of impaired loans is based on the present value of expected future cash flows discounted at the loan’s effective interest rate or the loan’s observable market price, or based on the fair value of the collateral if the loan is collateral-dependent. When management’s measured value of the impaired loan is less than the recorded investment in the loan, the amount of the impairment is recorded as a specific reserve within the allowance for loan losses. Any subsequent measurement adjustments are recorded as adjustments to the allowance for loan losses. Impaired loans are classified within Level 3 of the fair value hierarchy.
Other Real Estate Owned – Other real estate owned (“OREO”) consists of properties acquired through foreclosure and, as held for sale property, is recorded at the lower of the outstanding loan balance or current appraisal less estimated costs to sell. Any write-down to fair value required at the time of foreclosure is charged to the allowance for loan losses. Subsequent gains or losses on other real estate resulting from the sale of the property or additional valuation allowances required due to further declines in market value are reported in other noninterest income or expenses. OREO is classified within Level 3 of the fair value hierarchy.
The following table presents the fair value measurement of assets measured at fair value on a nonrecurring basis. Fair value for these assets was determined based on the methodology discussed above, using assumptions that are not observable in the market (Level 3 inputs).
| (In thousands) |
Fair Value at December 31, 2009 | ||
| Impaired loans |
$ | 67,785 | |
| Other real estate owned |
34,259 | ||
79
Table of Contents
NOTE T - CONDENSED PARENT COMPANY STATEMENTS
Balance sheets as of December 31, 2009 and 2008, and statements of income and cash flows for the years ended December 31, 2009, 2008 and 2007, of Cadence Financial Corporation (parent company only) are presented below:
BALANCE SHEETS
| December 31, | ||||||
| (In thousands) |
2009 | 2008 | ||||
| Assets |
||||||
| Cash and cash equivalents |
$ | 8,385 | $ | 9,638 | ||
| Securities available-for-sale |
928 | 565 | ||||
| Investment in and advances to subsidiaries |
141,057 | 206,661 | ||||
| Other assets |
1,780 | 1,005 | ||||
| $ | 152,150 | $ | 217,869 | |||
| Liabilities and Shareholders’ Equity |
||||||
| Other liabilities |
$ | 1,468 | $ | 1,376 | ||
| Subordinated debentures |
30,928 | 30,928 | ||||
| Shareholders’ equity |
119,754 | 185,565 | ||||
| $ | 152,150 | $ | 217,869 | |||
STATEMENTS OF INCOME
| Years Ended December 31, | ||||||||||||
| (In thousands) |
2009 | 2008 | 2007 | |||||||||
| Dividends from subsidiaries |
$ | — | $ | 6,548 | $ | 11,897 | ||||||
| Other |
37 | 427 | 929 | |||||||||
| Total income |
37 | 6,975 | 12,826 | |||||||||
| Total expense |
2,947 | 2,226 | 3,539 | |||||||||
| Income (loss) before income taxes and equity in undistributed earnings of subsidiaries |
(2,910 | ) | 4,749 | 9,287 | ||||||||
| Income tax benefit |
1,261 | 683 | 998 | |||||||||
| Income (loss) before equity in undistributed earnings of subsidiaries |
(1,649 | ) | 5,432 | 10,285 | ||||||||
| Equity in undistributed earnings (losses) of subsidiaries less than dividends |
(108,285 | ) | (8,788 | ) | (492 | ) | ||||||
| Net income (loss) |
$ | (109,934 | ) | $ | (3,356 | ) | $ | 9,793 | ||||
80
Table of Contents
STATEMENTS OF CASH FLOWS
| Years Ended December 31, | ||||||||||||
| (In thousands) |
2009 | 2008 | 2007 | |||||||||
| Cash Flows From Operating Activities |
||||||||||||
| Net income (loss) |
$ | (109,934 | ) | $ | (3,356 | ) | $ | 9,793 | ||||
| Equity in subsidiaries’ earnings less than dividends |
108,285 | 8,788 | 492 | |||||||||
| Other, net |
49 | 395 | (10 | ) | ||||||||
| Net cash provided by (used in) operating activities |
(1,600 | ) | 5,827 | 10,275 | ||||||||
| Cash Flows From Investing Activities |
||||||||||||
| Payments for investments in and advances to subsidiaries |
(41,000 | ) | — | (180 | ) | |||||||
| Purchase of investments available-for-sale |
(174 | ) | (5,856 | ) | (6,213 | ) | ||||||
| Proceeds from sales and maturities of securities available-for-sale |
31 | 8,730 | 13,128 | |||||||||
| Other, net |
— | 187 | — | |||||||||
| Net cash provided by (used in) investing activities |
(41,143 | ) | 3,061 | 6,735 | ||||||||
| Cash Flows From Financing Activities |
||||||||||||
| Repayment of advances from subsidiaries |
— | — | (6,000 | ) | ||||||||
| Dividends paid on common and preferred stock |
(2,466 | ) | (7,144 | ) | (11,897 | ) | ||||||
| Proceeds from issuance of preferred stock and warrants |
44,000 | — | — | |||||||||
| Other, net |
(44 | ) | 225 | 247 | ||||||||
| Net cash provided by (used in) financing activities |
41,490 | (6,919 | ) | (17,650 | ) | |||||||
| Net increase (decrease) in cash and cash equivalents |
(1,253 | ) | 1,969 | (640 | ) | |||||||
| Cash and cash equivalents at beginning of year |
9,638 | 7,669 | 8,309 | |||||||||
| Cash and cash equivalents at end of year |
$ | 8,385 | $ | 9,638 | $ | 7,669 | ||||||
81
Table of Contents
NOTE U - SUMMARY OF QUARTERLY RESULTS OF OPERATIONS AND PER SHARE AMOUNTS (UNAUDITED)
| Three Months Ended | ||||||||||||||||
| (In thousands, except per share data) |
Mar. 31 | June 30 | Sept. 30 | Dec. 31 | ||||||||||||
| 2009 |
||||||||||||||||
| Total interest income |
$ | 21,673 | $ | 20,403 | $ | 20,170 | $ | 18,234 | ||||||||
| Total interest expense |
9,353 | 9,753 | 8,577 | 7,364 | ||||||||||||
| Net interest income |
12,320 | 10,650 | 11,593 | 10,870 | ||||||||||||
| Provision for loan losses |
32,761 | 22,995 | 20,704 | 2,868 | ||||||||||||
| Net interest income (loss) after provision for loan losses |
(20,441 | ) | (12,345 | ) | (9,111 | ) | 8,002 | |||||||||
| Total noninterest income, excluding securities gains (losses) |
4,438 | 4,050 | 4,257 | 4,785 | ||||||||||||
| Securities gains (losses) |
63 | 76 | 923 | 2,111 | ||||||||||||
| Total noninterest expenses |
13,632 | 15,301 | 17,370 | 14,083 | ||||||||||||
| Impairment loss on goodwill |
66,542 | — | — | — | ||||||||||||
| Income tax expense (benefit) |
(12,088 | ) | (9,490 | ) | (8,475 | ) | (77 | ) | ||||||||
| Net income (loss) from continuing operations |
(84,026 | ) | (14,030 | ) | (12,826 | ) | 892 | |||||||||
| Net income (loss) from discontinued operations |
(135 | ) | 20 | 399 | (228 | ) | ||||||||||
| Net income (loss) |
(84,161 | ) | (14,010 | ) | (12,427 | ) | 664 | |||||||||
| Preferred stock dividend and accretion of discount |
322 | 652 | 652 | 652 | ||||||||||||
| Net income (loss) applicable to common shareholders |
$ | (84,483 | ) | $ | (14,662 | ) | $ | (13,079 | ) | $ | 12 | |||||
| Per share: |
||||||||||||||||
| Net income (loss) from continuing operations, basic and diluted |
$ | (7.05 | ) | $ | (1.18 | ) | $ | (1.08 | ) | $ | 0.07 | |||||
| Net income (loss) from discontinued operations, basic and diluted |
(0.01 | ) | — | 0.03 | (0.02 | ) | ||||||||||
| Net income (loss), basic and diluted |
(7.06 | ) | (1.18 | ) | (1.04 | ) | 0.06 | |||||||||
| Net income (loss) applicable to common shareholders, basic and diluted |
(7.09 | ) | (1.23 | ) | (1.10 | ) | — | |||||||||
| Cash dividends declared to common shareholders |
0.05 | — | — | — | ||||||||||||
| 2008 |
||||||||||||||||
| Total interest income |
$ | 28,577 | $ | 25,706 | $ | 24,866 | $ | 23,574 | ||||||||
| Total interest expense |
14,090 | 11,688 | 11,360 | 10,192 | ||||||||||||
| Net interest income |
14,487 | 14,018 | 13,506 | 13,382 | ||||||||||||
| Provision for loan losses |
3,000 | 3,300 | 11,703 | 10,596 | ||||||||||||
| Net interest income after provision for loan losses |
11,487 | 10,718 | 1,803 | 2,786 | ||||||||||||
| Total noninterest income, excluding securities gains (losses) |
4,420 | 4,127 | 4,735 | 4,295 | ||||||||||||
| Securities gains (losses) |
203 | (48 | ) | 65 | 165 | |||||||||||
| Total noninterest expenses |
12,731 | 12,531 | 16,006 | 12,573 | ||||||||||||
| Income tax expense (benefit) |
809 | 391 | (3,980 | ) | (2,523 | ) | ||||||||||
| Net income (loss) from continuing operations |
2,570 | 1,875 | (5,423 | ) | (2,804 | ) | ||||||||||
| Net income (loss) from discontinued operations |
191 | 3 | 144 | 88 | ||||||||||||
| Net income (loss) |
2,761 | 1,878 | (5,279 | ) | (2,716 | ) | ||||||||||
| Preferred stock dividend and accretion of discount |
— | — | — | — | ||||||||||||
| Net income (loss) applicable to common shareholders |
$ | 2,761 | $ | 1,878 | $ | (5,279 | ) | $ | (2,716 | ) | ||||||
| Per share: |
||||||||||||||||
| Net income (loss) from continuing operations, basic |
$ | 0.22 | $ | 0.16 | $ | (0.46 | ) | $ | (0.24 | ) | ||||||
| Net income (loss) from continuing operations, diluted |
0.22 | 0.16 | (0.45 | ) | (0.23 | ) | ||||||||||
| Net income (loss) from discontinued operations, basic and diluted |
0.02 | — | 0.01 | 0.01 | ||||||||||||
| Net income (loss), basic and diluted |
0.23 | 0.16 | (0.44 | ) | (0.23 | ) | ||||||||||
| Net income (loss) applicable to common shareholders, basic and diluted |
0.23 | 0.16 | (0.44 | ) | (0.23 | ) | ||||||||||
| Cash dividends declared to common shareholders |
0.25 | 0.25 | 0.05 | 0.05 | ||||||||||||
NOTE V - PREFERRED STOCK
On January 9, 2009, the Corporation completed the sale of $44 million of non-voting preferred stock to the U.S. Treasury Department under the Capital Purchase Program. These senior preferred shares pay a cumulative annual dividend at a 5% rate for the first five years and will reset to a rate of 9% after five years if not redeemed by the Corporation prior to that time. In connection with the issuance of the senior preferred shares, the Corporation also issued to the U.S. Treasury a warrant to purchase the Corporation’s common stock up to a maximum of 15% of the senior preferred amount, or $6.6 million.
82
Table of Contents
ITEM 9 - CHANGES IN AND DISAGREEMENTS WITH ACCOUNTANTS ON ACCOUNTING AND FINANCIAL DISCLOSURE
Not applicable.
ITEM 9A - CONTROLS AND PROCEDURES
Disclosure Controls and Procedures
As required by Rules 13a-15 and 15d-15 of the Exchange Act, the Corporation has evaluated, with the participation of management, including the Chief Executive Officer and the Chief Financial Officer, as of the end of the period covered by this report, the effectiveness of the design and operation of its disclosure controls and procedures. Based on such evaluation, the Chief Executive Officer and Chief Financial Officer have concluded that, as of the end of the period covered by this report, such disclosure controls and procedures are effective in ensuring that information required to be disclosed by the Corporation, including its consolidated subsidiaries, is recorded, processed, summarized and reported, including being made known to the certifying officers by others within the Corporation and its consolidated subsidiaries as appropriate to allow timely decisions regarding disclosure, within the time periods specified in the SEC’s rules and forms. From time to time, the Corporation reviews the disclosure controls and procedures, and may from time to time make changes aimed at enhancing their effectiveness and to ensure that the Corporation’s system evolves with its business.
Changes in Internal Controls over Financial Reporting
There was no change in the Corporation’s internal control over financial reporting during the quarter ended December 31, 2009 that has materially affected, or is likely to materially affect, the Corporation’s internal control over financial reporting.
Management’s Report on Internal Control Over Financial Reporting
Management of the Corporation is responsible for establishing and maintaining adequate internal control over financial reporting as defined in Rules 13a-15(f) of the Securities and Exchange Act of 1934. The Corporation’s internal control over financial reporting is designed to provide reasonable assurance regarding the reliability of financial reporting and the preparation of financial statements for external purposes in accordance with generally accepted accounting principles.
Management has in place an internal accounting control system designed to safeguard corporate assets from material loss or misuse. The internal control system includes an organizational structure that provides appropriate delegation of authority and segregation of duties, establishes policies and procedures, and comprehensive internal audit and loan review programs. Management believes that this system provides assurance that assets are adequately safeguarded and that the accounting records, which are the basis for the preparation of the financial statements, are reliable.
Any system of internal control, no matter how well designed, has inherent limitations, including the possibility that a control can be circumvented, or overridden or misstatements due to error or fraud may occur and not be detected. Also, because of changes in conditions, internal control effectiveness may vary over time. Accordingly, an effective system of control will provide only reasonable assurance with respect to the financial statement preparation.
The Board of Directors, primarily through its audit committee, oversees the adequacy of the Corporation’s internal control structure. The audit committee, consisting entirely of independent directors, meets regularly with management, internal auditors and the independent registered public accounting firm, and reviews audit plans and results as well as management’s actions taken in discharging responsibilities for accounting, financial reporting and internal control. Both the independent registered public accounting firm and the internal auditors have direct confidential access to the audit committee at all times to discuss the results of their examinations.
Management conducted an evaluation of the effectiveness of the Corporation’s internal controls over financial reporting as of December 31, 2009. This evaluation was based on criteria for effective internal control over financial reporting described in “Internal Control-Integrated Framework” issued by the Committee of Sponsoring Organizations of the Treadway Commission (COSO). Based upon that evaluation, management concluded that the Corporation maintained effective internal control over financial reporting as of December 31, 2009.
The effectiveness of the Corporation’s internal control over financial reporting as of December 31, 2009, has been audited by the Corporation’s independent registered public accounting firm.
Not applicable.
83
Table of Contents
PART III
ITEM 10 - DIRECTORS, EXECUTIVE OFFICERS, AND CORPORATE GOVERNANCE
Reference is made to the material under the captions, “Election of Directors” and “Audit Committee Report,” in the Corporation’s proxy statement for its 2010 annual meeting, which is incorporated herein by reference, and “Executive Officers,” included in Part I, Item 1, of this report.
The Corporation has a Code of Ethics for its directors, officers and employees. Section IV of the Code of Ethics specifically addresses the special code of ethics adopted for the Chief Executive Officer, the Chief Operating Officer, the Chief Financial Officer and the Chief Accounting Officer. This Code of Ethics is posted on the Corporation’s website at www.cadencebanking.com under the “Investor Relations” tab and under the “Corporate Governance” heading.
ITEM 11 - EXECUTIVE COMPENSATION
Reference is made to the caption, “Executive Compensation,” in the Corporation’s proxy statement for its 2010 annual meeting, which is incorporated herein by reference.
ITEM 12 - SECURITY OWNERSHIP OF CERTAIN BENEFICIAL OWNERS AND MANAGEMENT AND RELATED STOCKHOLDER MATTERS
Reference is made to the caption, “Stock Ownership of Directors, Officers, and Principal Shareholders,” in the Corporation’s proxy statement for its 2010 annual meeting, which is incorporated herein by reference.
The following table gives information about the common stock that may be issued upon the exercise of options under the Corporation’s existing equity compensation plans as of December 31, 2009.
Equity Compensation Plan Information
| Plan Category |
Number of Securities to Be Issued Upon Exercise of Outstanding Options |
Weighted- Average Price of Outstanding Options |
Number of Securities Remaining Available for Future Issuance Under Equity Compensation Plans | ||||
| (a) | (b) | (c) | |||||
| Equity compensation plans approved by security holders |
39,393 | $ | 25.22 | 707,618 | |||
| Equity compensation plans not approved by security holders |
265,893 | $ | 22.64 | — | |||
Note L to the Corporation’s Notes to Consolidated Financial Statements and the information contained under the caption, “Executive Compensation,” in the Corporation’s proxy statement to be mailed to shareholders in connection with the Corporation’s 2010 annual meeting of shareholders should also be read in connection with this item.
ITEM 13 - CERTAIN RELATIONSHIPS AND RELATED TRANSACTIONS AND DIRECTOR INDEPENDENCE
Reference is made to the caption, “Certain Relationships, Related Transactions and Indebtedness,” in the Corporation’s proxy statement for its 2010 annual meeting, which is incorporated herein by reference.
ITEM 14 - PRINCIPAL ACCOUNTING FEES AND SERVICES
Reference is made to the caption, “Independent Public Accountant Fees,” in the Corporation’s proxy statement for its 2010 annual meeting, which is incorporated herein by reference.
84
Table of Contents
PART IV
ITEM 15 - EXHIBITS, FINANCIAL STATEMENT SCHEDULES
(a) Documents filed as part of this report:
| 1. | Financial Statements |
The following consolidated financial statements and report of independent registered public accounting firm of Cadence Financial Corporation and subsidiaries are included in this Form 10-K (Item 8) of the registrant for the year ended December 31, 2009:
Report of Independent Registered Public Accounting Firm
Consolidated Balance Sheets—December 31, 2009 and 2008
Consolidated Statements of Income—Years Ended December 31, 2009, 2008, and 2007
Consolidated Statements of Shareholders’ Equity—Years Ended December 31, 2009, 2008, and 2007
Consolidated Statements of Cash Flows—Years Ended December 31, 2009, 2008, and 2007
Notes to Consolidated Financial Statements
| 2. | Financial Statement Schedules |
Schedules not included have been omitted because they are not applicable or the required information is shown in the financial statements or notes thereto.
| 3. | Exhibits: |
| 3.1 | Restated Articles of Incorporation of Cadence Financial Corporation (incorporated by reference to Exhibit 3.1 to the Corporation’s Annual Report on Form 10-K for the year ended December 31, 2007, filed with the Commission on March 13, 2008). | |||
| 3.2 | Amended and Restated Bylaws of Cadence Financial Corporation (incorporated by reference to Exhibit 3.2 to the Corporation’s Annual Report on Form 10-K for the year ended December 31, 2008, filed with the Commission on March 12, 2009). | |||
| 3.3 | Articles of Amendment to Articles of Incorporation of Cadence Financial Corporation (incorporated by reference to Annex B to the Corporation’s Definitive Proxy Statement on Schedule 14A filed with the Commission on November 18, 2008). | |||
| 3.4 | Certificate of Designations for Fixed Rate Cumulative Perpetual Preferred Stock, Series A (incorporated by reference to Exhibit 3.3 to the Corporation’s Current Report on Form 8-K filed with the Commission on January 14, 2009). | |||
| 4.1 | Indenture Agreement of NBC Capital Corporation dated as of December 30, 2003, for $30,928,000 of Floating Rate Junior Subordinated Deferrable Interest Debentures, due 2033, with U. S. Bank National Association, as Trustee (incorporated by reference to Exhibit 4 to the Corporation’s Annual Report on Form 10-K for the year ended December 31, 2009, filed with the Commission on March 11, 2004). | |||
| ** | 10.1 | Employment Agreement Dated March 14, 2007, by and between Cadence Financial Corporation and Lewis F. Mallory, Jr. (incorporated by reference to Exhibit 10.2 to the Corporation’s Annual Report on Form 10-K for the year ended December 31, 2006, filed with the Commission on March 14, 2007). | ||
| ** | 10.2 | Employment Agreement Dated March 14, 2007, by and between Cadence Financial Corporation and Mark A. Abernathy (incorporated by reference to Exhibit 10.3 to the Corporation’s Annual Report on Form 10-K for the year ended December 31, 2006, filed with the Commission on March 14, 2007). | ||
| ** | 10.3 | Employment Agreement Dated March 14, 2007, by and between Cadence Financial Corporation and Richard T. Haston (incorporated by reference to Exhibit 10.4 to the Corporation’s Annual Report on Form 10-K for the year ended December 31, 2006, filed with the Commission on March 14, 2007). | ||
85
Table of Contents
| ** | 10.4 | NBC Capital Corporation 2005 Deferred Compensation Plan (incorporated by reference to Exhibit 10.1 to the Corporation’s Current Report on Form 8-K filed with the Commission on December 7, 2004). | ||
| ** | 10.5 | NBC Capital Corporation Long-Term Incentive Compensation Plan (incorporated by reference to Exhibit 10.1 to the Corporation’s Quarterly Report on Form 10-Q for the quarter ended June 30, 2007, filed with the Commission on August 8, 2007). | ||
| 10.6 | Agreement by and between Cadence Bank, N.A. and the Office of the Comptroller of the Currency effective April 17, 2009 (incorporated by reference to Exhibit 99.2 to the Corporation’s Current Report on Form 8-K filed with the Commission on April 21, 2009). | |||
| 10.7 | Asset Purchase Agreement, dated as of August 31, 2009, by and among Cadence Bank, N.A., Galloway-Chandler-McKinney Insurance Agency, Inc., Galloway-Chandler-McKinney Insurance Agency of Columbus, LLC, Galloway-Chandler-McKinney Insurance Agency of West Point, LLC, Galloway-Chandler-McKinney Insurance Agency of Monroe County, LLC and Galloway-Chandler-McKinney Insurance Agency of Starkville, LLC (incorporated by reference to Exhibit 10.1 to the Corporation’s Current Report on Form 8-K filed with the Commission on September 3, 2009). | |||
| 14 | Cadence Financial Corporation’s Code of Ethics is posted on the Corporation’s website. | |||
| * | 21.1 | Subsidiaries of the Corporation | ||
| * | 23.1 | Consent of Independent Registered Public Accounting Firm | ||
| * | 31.1 | Certificate pursuant to Rule 13a-14(a) or 15d-14(a) of Securities Exchange Act of 1934 as adopted pursuant to section 302 of the Sarbanes-Oxley Act of 2002 – Chief Executive Officer. | ||
| * | 31.2 | Certificate pursuant to Rule 13a-14(a) or 15d-14(a) of Securities Exchange Act of 1934 as adopted pursuant to section 302 of the Sarbanes-Oxley Act of 2002 – Chief Financial Officer. | ||
| * | 32.1 | Certificate pursuant to 18 U.S.C. Section 1350 as adopted pursuant to Section 906 of the Sarbanes-Oxley Act of 2002 – Chief Executive Officer. | ||
| * | 32.2 | Certificate pursuant to 18 U.S.C. Section 1350 as adopted pursuant to Section 906 of the Sarbanes-Oxley Act of 2002 – Chief Financial Officer. | ||
| * | Filed herewith. |
| ** | Indicates management contracts and compensatory plans and arrangements. |
| (b) | Exhibits |
See exhibit index included in Item 15(a)(3) of this Form 10-K.
| (c) | Financial Statement Schedules |
See Item 15(a)(2) of this Form 10-K.
86
Table of Contents
SIGNATURES
Pursuant to the requirements of Section 13 or 15(d) of the Securities Exchange Act of 1934, the registrant has duly caused this report to be signed on its behalf by the undersigned, thereunto duly authorized.
| CADENCE FINANCIAL CORPORATION | ||
| (Registrant) | ||
| By | /s/ L. F. Mallory, Jr. | |
| L. F. Mallory, Jr. | ||
| Chairman of Board and Chief Executive Officer | ||
| By | /s/ Mark A. Abernathy | |
| Mark A. Abernathy | ||
| President and Chief Operating Officer | ||
| By | /s/ Richard T. Haston | |
| Richard T. Haston | ||
| Executive Vice President and Chief Financial Officer | ||
| By | /s/ J. Aubrey Adair | |
| J. Aubrey Adair | ||
| Vice President and Chief Accounting Officer | ||
Pursuant to the requirements of the Securities Exchange Act of 1934, this report has been signed below by the following persons on behalf of the registrant and in the capacity and on the dates indicated.
| /s/ Robert L. Calvert, III |
/s/ Robert S. Caldwell, Jr. | |||
| Robert L. Calvert, III Director |
Robert S. Caldwell, Jr. Director | |||
| /s/ Harry Stokes Smith |
/s/ Robert A. Cunningham | |||
| Harry Stokes Smith Director |
Robert A. Cunningham Director | |||
| /s/ James C. Galloway, Jr. |
/s/ Clifton S. Hunt | |||
| James C. Galloway, Jr. Director |
Clifton S. Hunt Director | |||
| /s/ Sammy J. Smith |
||||
| Sammy J. Smith Director |
||||
Date: March 29, 2010
87