Attached files
| file | filename |
|---|---|
| EX-21 - ACCESS NATIONAL CORP | v178926_ex21.htm |
| EX-32 - ACCESS NATIONAL CORP | v178926_ex32.htm |
| EX-23 - ACCESS NATIONAL CORP | v178926_ex23.htm |
| EX-10.5 - ACCESS NATIONAL CORP | v178926_ex10-5.htm |
| EX-31.2 - ACCESS NATIONAL CORP | v178926_ex31-2.htm |
| EX-10.6 - ACCESS NATIONAL CORP | v178926_ex10-6.htm |
| EX-31.1 - ACCESS NATIONAL CORP | v178926_ex31-1.htm |
UNITED STATES
SECURITIES
AND EXCHANGE COMMISSION
Washington, D.C. 20549
FORM
10-K
(Mark
One)
x ANNUAL REPORT PURSUANT
TO SECTION 13 OR 15(d) OF THE SECURITIES EXCHANGE ACT OF 1934
For
the fiscal year ended December 31,
2009
or
¨ TRANSITION REPORT
PURSUANT TO SECTION 13 OR 15(d) OF THE SECURITIES EXCHANGE ACT OF 1934
For
the transition period from_____________ to_______________
Commission
File Number 000-49929
Access
National Corporation
(Exact
name of registrant as specified in its charter)
|
Virginia
|
82-0545425
|
|
|
(State or other jurisdiction of
|
(I.R.S. Employer
|
|
|
incorporation or organization)
|
|
Identification Number)
|
1800 Robert Fulton Drive,
Suite 300, Reston, Virginia 20191
(Address of
principal executive offices) (Zip Code)
(703)
871-2100
(Registrant's
telephone number, including area code)
|
Securities
registered pursuant to Section 12(b) of the Act:
|
||
|
Title
of each class
|
Name
of each exchange on which registered
|
|
|
Common Stock $0.835 par
value
|
The
NASDAQ Stock Market
LLC
|
|
Securities
registered pursuant to Section 12(g) of the Act:
|
||
|
(Title
of class) None
|
Indicate by check mark if the
registrant is a well-known seasoned issuer, as defined in Rule 405 of the
Securities Act. Yes ¨ No x
Indicate
by check mark if the registrant is not required to file reports pursuant to
Section 13 or Section 15(d) of the Act. Yes ¨ No
x
Indicate
by check mark whether the registrant (1) has filed all reports required to be
filed by Section 13 or 15(d) of the Securities Act of 1934 during the preceding
12 months (or for such shorter period that the registrant was required to file
such reports), and (2) has been subject to such filing requirements for the past
90 days. Yes x No
¨
Indicate
by check mark whether the registrant has submitted electronically and posted on
its corporate Web site, if any, every Interactive Data File required to be
submitted and posted pursuant to Rule 405 of Regulation S-T (§ 232.405 of this
chapter) during the preceding 12 months (or for such shorter period that the
registrant was required to submit and post such files). Yes ¨ No
¨
Indicate
by checkmark if disclosure of delinquent filers pursuant to Item 405 of
Regulation S-K (§229.405 of this chapter) is not contained herein, and will not
be contained, to the best of registrant’s knowledge, in definitive proxy or
information statements
incorporated by reference in Part III of this Form 10-K or any amendment
to this Form 10-K ¨
Indicate
by checkmark whether the registrant is a large accelerated filer, an accelerated
filer, a non-accelerated filer, or a smaller reporting company. See the
definitions of “large accelerated filer,” “accelerated filer” and
“smaller reporting company” in Rule 12b-2 of the Exchange Act.
|
Large
accelerated filer ¨
|
Accelerated
filer ¨
|
|
|
Non-accelerated
filer ¨
(Do not check if a smaller reporting company)
|
Smaller
reporting company x
|
Indicate
by check mark whether the registrant is a shell company (as defined in Rule
12b-2 of the Act) Yes o No x
The
aggregate market value of the registrant’s common voting and non-voting common
equity held by non-affiliates of the registrant, computed by reference to the
price at which the stock was last sold on the NASDAQ Global Market as of the
last business day of the registrant’s most recently completed second fiscal
quarter, was approximately $46,360,310.
As of
March 26, 2010, there were 10,615,313 shares of Common Stock, par value $.835
per share, of Access National Corporation issued and outstanding.
DOCUMENTS
INCORPORATED BY REFERENCE
Portions
of the Registrant’s Proxy Statement for the Corporation’s Annual Meeting of
Shareholders to be held on May 18, 2010, are incorporated by reference in Part
III of this Form 10-K.
Access
National Corporation
FORM
10-K
INDEX
|
|
Page
|
|||
|
PART I
|
||||
|
Item
1
|
Business
|
2
|
||
|
Item
1A
|
Risk
Factors
|
11
|
||
|
Item
1B
|
Unresolved
Staff Comments
|
16
|
||
|
Item
2
|
Properties
|
16
|
||
|
Item
3
|
Legal
Proceedings
|
16
|
||
|
Item
4
|
(Removed
and Reserved)
|
16
|
||
|
PART II
|
||||
|
Item
5
|
Market
for Registrant’s Common Equity, Related Stockholder Matters and
Issuer Purchases of Equity Securities
|
16
|
||
|
Item
6
|
Selected
Financial Data
|
19
|
||
|
Item
7
|
Management’s
Discussion and Analysis of Financial Condition and Results of
Operations
|
20
|
||
|
Item
7A
|
Quantitative
and Qualitative Disclosures About Market Risk
|
34
|
||
|
Item
8
|
Financial
Statements and Supplementary Data
|
36
|
||
|
Item
9
|
Changes
in and Disagreements With Accountants on Accounting and Financial
Disclosure
|
75
|
||
|
Item
9A
|
Controls
and Procedures
|
75
|
||
|
Item
9B
|
Other
Information
|
75
|
||
|
PART III
|
||||
|
Item
10
|
Directors,
Executive Officers and Corporate Governance
|
75
|
||
|
Item
11
|
Executive
Compensation
|
76
|
||
|
Item
12
|
Security
Ownership of Certain Beneficial Owners and Management and Related
Stockholder Matters
|
76
|
||
|
Item
13
|
Certain
Relationships and Related Transactions, and Director
Independence
|
76
|
||
|
Item
14
|
Principal
Accountant Fees and Services
|
76
|
||
|
PART IV
|
||||
|
Item
15
|
Exhibits,
Financial Statement Schedules
|
77
|
||
|
Signatures
|
79
|
|||
1
PART I
In
addition to historical information, the following report contains
forward-looking statements that are subject to risks and uncertainties that
could cause Access Naational Corporation’s actual results to differ materially
from those anticipated. Readers are cautioned not to place undue
reliance on these forward-looking statements, which reflect management’s
analysis only as of the date of the report. For discussion of factors that may
cause our actual future results to differ materially from those anticipated,
please see “Item 1A – Risk Factors” and “Item 7 – Management’s Discussion and
Analysis of Financial Condition and Results of Operations – Forward-Looking
Statements” herein.
ITEM 1 –
BUSINESS
Access
National Corporation (the “Corporation”) was organized June 15, 2002 under the
laws of Virginia to operate as a bank holding company. The
Corporation has two active wholly owned subsidiaries: Access National
Bank, and Access National Capital Trust II. Effective June 15, 2002, pursuant to
an Agreement and Plan of Reorganization dated April 18, 2002 between the
Corporation and Access National Bank (the “Bank”), the Corporation acquired all
of the outstanding stock of the Bank in a statutory share exchange
transaction. The Bank is the primary operating business of the
Corporation. The Bank provides commercial credit, deposit and
mortgage services to middle market businesses and associated professionals,
primarily in the greater Washington, D.C. Metropolitan Area. The Bank was
organized under federal law as a national banking association to engage in a
general banking business to serve the communities in and around Northern
Virginia. The Bank opened for business on December 1, 1999 at 14006
Lee-Jackson Memorial Highway in Chantilly, Virginia. Deposits with
the Bank are insured to the maximum amount provided by the Federal Deposit
Insurance Corporation. The Bank offers a comprehensive range of financial
services and products and specializes in providing customized financial services
to small and medium sized businesses, professionals, and associated
individuals. The Bank provides its customers with personal customized
service utilizing the latest technology and delivery channels. The
Bank has two active wholly owned subsidiaries: Access National
Mortgage Corporation (the “Mortgage Corporation”) and Access National Real
Estate LLC (“Access Real Estate”). The Corporation does not have any significant
operations and serves primarily as the parent company for the Bank. The
Corporation’s income is primarily derived from dividends received from the
Bank. These dividends are determined by the Bank’s earnings and
capital position. Access National Capital Trust II was formed for the
purpose of issuing redeemable capital securities.
The
headquarters for the Corporation, the Bank, Access Real Estate and the Mortgage
Corporation are located at 1800 Robert Fulton Drive, Reston,
Virginia.
Bank
revenues are derived from interest and fees received in connection with loans,
deposits and investments. Interest paid on deposits and borrowings are the major
expenses followed by administrative and operating expenses. Revenues
from the Mortgage Corporation consist primarily of gains from the sale of loans
and loan origination fees. Major expenses of the Mortgage Corporation
consist of personnel, interest, advertising and other operating
expenses.
The
economy, interest rates, monetary and fiscal policies of the federal government
and regulatory policies have a significant influence on the Corporation, the
Bank, and the Mortgage Corporation, and the banking industry as a
whole.
The Bank
has experienced consistent growth and profitability since inception. Our goal is
to become a leading provider of financial services to small to medium sized
businesses and professionals in Northern Virginia. Our strategy is to
know the needs of our clients and to deliver the corresponding financial
services. We employ highly qualified personnel and emphasize the use
of the latest technology in operations and the services we
provide. Our marketing efforts are directed to prospective clients
that value high quality service and that are, or have the potential to become,
highly profitable.
Assets at
year end totaled $666.9 million and net income amounted to $9.6
million. The Bank operates from five banking centers located in
Chantilly, Tysons Corner, Reston, Leesburg and Manassas, Virginia and online at
www.accessnationalbank.com. Additional offices may be added from time
to time based upon management’s constant analysis of the market and
opportunities.
The
Mortgage Corporation specializes in the origination of conforming and government
insured residential mortgages primarily in the greater Washington, D.C.
Metropolitan Area and the surrounding areas of its branch locations. The
Mortgage Corporation has established offices throughout Virginia, in Annandale,
Fairfax, Reston, Roanoke, Richmond, and McLean. Offices outside the state of
Virginia include Westminster and Crofton in Maryland, Nashville in Tennessee,
Denver in Colorado, Indianapolis in Indiana, Chicago in Illinois, Atlanta in
Georgia, Winchester in Massachusetts and San Antonio in Texas.
Access
Real Estate was formed to acquire and hold title to real estate for the
Corporation. Access Real Estate owns a 45,000 square foot, three story office
building located at 1800 Robert Fulton Drive in Reston, Virginia that serves as
the corporate headquarters for the Corporation, Bank, Mortgage Corporation, and
Access Real Estate. Access Real Estate also owns vacant land in
Fredericksburg that was purchased for future expansion of the Bank and Mortgage
Corporation.
The
Corporation’s common stock commenced trading on the NASDAQ Global Market under
the ticker symbol “ANCX” on July 19, 2004.
2
Our
Strategy – Historical and Prospective
Our view
of the financial services marketplace is that community banks must be effective
in select market niches that are under-served and stay clear of competing with
large national competitors on a head-to-head basis for broad based consumer
business. We started by organizing a de novo national bank in
1999. The focus of the Bank was and is serving the small to medium
sized businesses and their associated professionals in the greater Washington,
D.C. Metropolitan Area. We find that large national competitors are ineffective
at addressing this market as it is difficult to distinguish where a business’s
financial needs stop and the personal financial needs of that business’s
professionals start. We believe that emerging businesses and the finances of
their owners are best served hand-in-hand.
Our core
competency is judgmental discipline of commercial lending based upon personnel
and practices that help our clients strategize and grow their businesses from a
financial perspective. As financial success takes hold in the
business, personal goals and wealth objectives of the business owners become
increasingly important. Our second competency is a derivative of the
first. We have the personnel and know how to provide private banking
services and the skills and strategy that assist our individual clients to
acquire assets, build wealth and manage their resources. Mortgage
banking and the related activities in our model goes hand-in-hand with supplying
effective private banking services. Unlike most banking companies,
the heart of our Mortgage Corporation is ingrained into our commercial bank,
serving the same clients side-by-side in a coordinated and seamless
fashion. We believe that lending is not enough in today’s environment
to attract and retain commercial and professional clients. The credit
services must be backed up by competitive deposit and cash management products
and operational excellence. We have made significant investments in skilled
personnel and the latest technology to ensure we can deliver these
services.
We
generally expect to have fewer branch locations compared to similar size banking
companies. We do not view our branch network as a significant determinant of our
growth. Our marketing strategies focus on benefits other than branch
location convenience.
The
acquisition of the Mortgage Corporation in 1999 provided two key benefits to our
strategy: 1) it solidified our second competency from a personnel and
operational perspective that would have taken years to replicate with organic
growth alone; and 2) it provided fee income from which to launch a new banking
business. Strong profits and cash flow from the Mortgage Corporation
in the early years subsidized the growth and development of the Bank and allowed
for the acceleration of its growth plans and, in time, its
profitability.
The goal
was and is to generate 70-80% of the Corporation’s earnings from the core
business of the Bank, with the rest of our consolidated earnings to be generated
from related fee income activities. We will consider entering other
related fee income businesses that serve our target market as opportunities,
market conditions and our capacity dictate. See Note 20 to the
consolidated financial statements for additional information on segment
performance.
We expect
to grow our Bank by continuing to hire skilled personnel, train our own and
provide a sound infrastructure that facilitates the success
of businesses, their owners and key personnel, not only today but
tomorrow and on into the ensuing decades.
Lending
Activities
The
Bank’s lending activities involve commercial loans, commercial real estate
loans, commercial and residential real estate construction loans, residential
mortgage loans, home equity loans, and consumer loans. These lending
activities provide access to credit to small to medium sized businesses,
professionals and consumers in the greater Washington, D.C. Metropolitan Area.
Loans originated by the Bank are classified as loans held for
investment. The Mortgage Corporation originates residential mortgages
and home equity loans that are only held temporarily pending their sale to third
parties and in some cases the Bank. The Mortgage Corporation also
brokers loans that do not conform to their existing products. Each of
our principal loan types are described below.
At
December 31, 2009 loans held for investment totaled $486.6 million compared
to $485.9 million at year end 2008. During 2009 loan demand
diminished as a result of economic conditions and stricter underwriting
standards.
The
Bank’s lending activities are subject to a variety of lending limits imposed by
federal law. While differing limits apply in certain circumstances based on the
type of loan, in general, the Bank’s lending limit to any one borrower on loans
that are not fully secured by readily marketable or other permissible collateral
is equal to 15% of the Bank’s capital and surplus. The Bank has established
relationships with correspondent banks to participate in loans when loan amounts
exceed the Bank’s legal lending limits or internal lending
policies.
3
We have
an established credit policy that includes procedures for underwriting each type
of loan and lending personnel have been assigned specific authorities based upon
their experience. Loans in excess of an individual loan officer’s
authority are presented to our Loan Committee for approval. The Loan
Committee meets weekly to facilitate a timely approval process for our
clients. Loans are approved based on the borrower’s capacity for
credit, collateral and sources of repayment. Loans are actively monitored to
detect any potential performance issues. We manage our loans within
the context of a risk grading system developed by management based upon
extensive experience in administering loan portfolios in our
market. Payment performance is carefully monitored for all
loans. When loan repayment is dependent upon an operating business or
investment real estate, periodic financial reports, site visits and select asset
verification procedures are used to ensure that we accurately rate the relative
risk of our assets. Based upon criteria that are established by
management and the Board of Directors, the degree of monitoring is escalated or
relaxed for any given borrower based upon our assessment of the future repayment
risk.
Loan Portfolio –
Loans Held for Investment. The following outlines the
composition of loans held for investment.
Commercial Loans:
Commercial Loans represent 14.9% of our loan portfolio held for investment as of
December 31, 2009. These loans are to businesses or individuals
within our target market for business purposes. Typically the loan
proceeds are used to support working capital and the acquisition of fixed assets
of an operating business. These loans are underwritten based upon our
assessment of the obligor(s)’ ability to generate operating cash flow in the
future necessary to repay the loan. To address the risks associated
with the uncertainties of future cash flow, these loans are generally well
secured by assets owned by the business or its principal shareholders and the
principal shareholders are typically required to guarantee the
loan.
Real Estate Construction
Loans: Real Estate Construction Loans, also known as construction and
land development loans, comprise 8.5% of our held for investment loan portfolio,
as of December 31, 2009. These loans generally fall into one of four
circumstances: first, loans to construct owner occupied commercial
buildings; second, loans to individuals that are ultimately used to acquire
property and construct an owner occupied residence; third, loans to builders for
the purpose of acquiring property and constructing homes for sale to consumers;
and fourth, loans to developers for the purpose of acquiring land that is
developed into finished lots for the ultimate construction of residential or
commercial buildings. Loans of these types are generally secured by
the subject property within limits established by the Board of Directors based
upon an assessment of market conditions and up-dated from time
to time. The loans typically carry recourse to principal
borrowers. In addition to the repayment risk associated with loans to
individuals and businesses, loans in this category carry construction completion
risk. To address this additional risk, loans of this type are subject
to additional administrative procedures designed to verify and ensure progress
of the project in accordance with allocated funding, project specifications and
time frames.
Commercial Real Estate
Loans: Also known as Commercial Mortgages, loans in this category
represent 45.3% of our loan portfolio held for investment, as of December 31,
2009. These loans generally fall into one of three situations:
first, loans supporting an owner occupied commercial property; second,
properties used by non-profit organizations such as churches or schools where
repayment is dependent upon the cash flow of the non-profit organizations; and
third, loans supporting a commercial property leased to third parties for
investment. Commercial Real Estate Loans are secured by the subject
property and underwritten to policy standards. Policy standards
approved by the Board of Directors from time to time set forth, among other
considerations, loan to value limits, cash flow coverage ratios, and the general
creditworthiness of the obligors.
Residential Real Estate
Loans: This category includes loans secured by first or second
mortgages on one to four family residential properties,
generally extended to Bank clients, and represents 31.0% of the portfolio, as of
December 31, 2009. Of this amount, the following
sub-categories exist as a percentage of the whole Residential Real Estate Loan
portfolio: Home Equity Lines of Credit 12.4%; First
Trust Mortgage Loans 68.5%; Loans Secured by a Junior Trust 16.9%; Multi-Family
Loans and Loans Secured by Farmland 2.2%.
Home
Equity Loans are extended to borrowers in our target market. Real
estate equity is the largest component of consumer wealth in our
marketplace. Once approved, this consumer finance tool allows the
borrowers to access the equity in their home or investment property and use the
proceeds for virtually any purpose. Home Equity Loans are most
frequently secured by a second lien on residential property. One to Four Family
Residential First Trust Loan, or First Mortgage Loan, proceeds are used to
acquire or refinance the primary financing on owner occupied and residential
investment properties. Junior Trust Loans, or Loans Secured by a Second Trust
Loans, are to consumers wherein the proceeds have been used for a stated
consumer purpose. Examples of consumer purposes are education,
refinancing debt, or purchasing consumer goods. The loans are
generally extended in a single disbursement and repaid over a specified period
of time.
Loans in
the Residential Real Estate portfolio are underwritten to standards within a
traditional consumer framework that is periodically reviewed and updated by our
management and Board of Directors: repayment source and capacity, value of the
underlying property, credit history, savings pattern and stability.
Consumer
Loans: Consumer Loans make up approximately 0.3% of our loan
portfolio. Most loans are well secured with assets other than real
estate, such as marketable securities or automobiles. Very few loans
are unsecured. As a matter of operation, management discourages
unsecured lending. Loans in this category are underwritten to
standards within a traditional consumer framework that is periodically reviewed
and up dated by our management and Board of Directors: repayment source and
capacity, collateral value, credit history, savings pattern and
stability.
4
Loans Held for
Sale (“LHFS”). Loans in this category are originated by the Mortgage
Corporation and comprised of residential mortgage loans extended to consumers
and underwritten in accordance with standards set forth by an institutional
investor to whom we expect to sell the loan. Loan proceeds are used for the
purchase or refinance of the property securing the loan. Loans are
sold with the servicing released to the investor.
The LHFS
loans are closed in our name and carried on our books until the loan is
delivered to and purchased by an investor. In 2009, we originated
$1.5 billion of loans processed in this manner, up from $775.2 million in
2008. At December 31, 2009 loans held for sale totaled $76.2
million compared to $84.3 million at year end 2008. The amount of
loans held for sale outstanding at the end of any given month fluctuates with
the volume of loans closed during the month and the timing of loans purchased by
investors.
Brokered
Loans
Brokered
loans are underwritten and closed by a third party lender. We are
paid a fee for procuring and packaging brokered loans. In 2009,
we originated a total volume of $68.4 million in residential mortgage loans
under this type of delivery method. Brokered loans accounted for 4.4%
of the total loan volume of the Mortgage Corporation. The risks
associated with this activity are limited to losses or claims arising from
fraud.
Deposits
Deposits
are the primary source of funding loan growth. At December 31, 2009
deposits totaled $466.6 million compared to $485.4 million on December 31,
2008.
Market
Area
The
Corporation, the Bank, and the Mortgage Corporation are headquartered in Fairfax
County and serve the Northern Virginia region. Fairfax County is a
diverse and thriving urban county. As of April 2008, the estimated
population of the county is 1,015,302, making it the most populous jurisdiction
in the Commonwealth of Virginia, with about 13% of Virginia's population.
Fairfax was the first county to reach a six-figure median household income, and
has the second-highest median household income of any jurisdiction in the United
States after neighboring Loudoun County. The proximity to Washington,
D.C. and the influence of the federal government and its spending provides
somewhat of a recession shelter.
Competition
The Bank
competes with virtually all banks and financial institutions which offer
services in its market area. Much of this competition comes from
large financial institutions headquartered outside the state of Virginia, each
of which has greater financial and other resources to conduct large advertising
campaigns and offer incentives. To attract business in this
competitive environment, the Bank relies on personal contact by its officers and
directors, local promotional activities, and the ability to provide personalized
custom services to small and medium sized businesses and professionals. In
addition to providing full service banking, the Bank offers and promotes
alternative and modern conveniences such as internet banking, automated
clearinghouse transactions, remote deposit capture, and courier services for
commercial clients. Because
federal regulation of financial institutions changes regularly and is the
subject of constant legislative debate, we cannot foresee how federal regulation
of financial institutions may change in the future. However, it is
possible that current and future governmental regulatory and economic
initiatives could impact the competitive landscape in the Bank’s
markets.
Employees
At
December 31, 2009 the Corporation had 328 employees, 94 of whom were employed by
the Bank and 234 of whom were employed by the Mortgage
Corporation. None of the employees of the Corporation is subject to a
collective bargaining agreement. Management considers employee
relations to be good.
Supervision
and Regulation
Set forth
below is a brief description of the material laws and regulations that affect
the Corporation. The description of these statutes and regulations is only a
summary and does not purport to be complete. This discussion is qualified in its
entirety by reference to the statutes and regulations summarized below. No
assurance can be given that these statutes or regulations will not change in the
future.
General. The Corporation is
subject to the periodic reporting requirements of the Securities and Exchange
Act of 1934, as amended (the “Exchange Act”), which include, but are not limited
to, the filing of annual, quarterly and other reports with the Securities and
Exchange Commission (the “SEC”). As an Exchange Act reporting company, the
Corporation is directly affected by the Sarbanes-Oxley Act of 2002 (the “SOX”),
which aimed at improving corporate governance and reporting procedures and
requires expanded disclosure of the Corporation’s corporate operations and
internal controls.
5
The
Corporation is a bank holding company within the meaning of the Bank Holding
Company Act of 1956, and is registered as such with, and subject to the
supervision of, the Board of Governors of the Federal Reserve System and the
Federal Reserve Bank of Richmond (the “FRB”). Generally, a bank holding company
is required to obtain the approval of the FRB before it may acquire all or
substantially all of the assets of any bank, and before it may acquire ownership
or control of the voting shares of any bank if, after giving effect to the
acquisition, the bank holding company would own or control more than 5% of the
voting shares of such bank. The FRB’s approval is also required for the merger
or consolidation of bank holding companies.
The
Corporation is required to file periodic reports with the FRB and provide any
additional information as the FRB may require. The FRB also has the authority to
examine the Corporation and the Bank, as well as any arrangements between the
Corporation and the Bank, with the cost of any such examinations to be borne by
the Corporation.
Banking
subsidiaries of bank holding companies are also subject to certain restrictions
imposed by federal law in dealings with their holding companies and other
affiliates. Subject to certain restrictions set forth in the Federal Reserve
Act, a bank can loan or extend credit to an affiliate, purchase or invest in the
securities of an affiliate, purchase assets from an affiliate or issue a
guarantee, acceptance or letter of credit on behalf of an affiliate, as long as
the aggregate amount of such transactions of a bank and its subsidiaries with
its affiliates does not exceed 10% of the capital stock and surplus of the bank
on a per affiliate basis or 20% of the capital stock and surplus of the bank on
an aggregate affiliate basis. In addition, such transactions must be on terms
and conditions that are consistent with safe and sound banking practices. In
particular, a bank and its subsidiaries generally may not purchase from an
affiliate a low-quality asset, as defined in the Federal Reserve Act. These
restrictions also prevent a bank holding company and its other affiliates from
borrowing from a banking subsidiary of the bank holding company unless the loans
are secured by marketable collateral of designated amounts. Additionally, the
Corporation and its subsidiary are prohibited from engaging in certain tie-in
arrangements in connection with any extension of credit, sale or lease of
property or furnishing of services.
A bank
holding company is prohibited from engaging in or acquiring direct or indirect
ownership or control of more than 5% of the voting shares of any company engaged
in non-banking activities. A bank holding company may, however, engage in or
acquire an interest in a company that engages in activities which the FRB has
determined by regulation or order are so closely related to banking as to be a
proper incident to banking. In making these determinations, the FRB considers
whether the performance of such activities by a bank holding company would offer
advantages to the public that outweigh possible adverse effects.
As a
national bank, the Bank is subject to regulation, supervision and regular
examination by the Office of the Comptroller of the Currency (the
“Comptroller”). Each depositor’s account with the Bank is insured by the Federal
Deposit Insurance Corporation (the “FDIC”) to the maximum amount permitted by
law. The Bank is also subject to certain regulations promulgated by the FRB and
applicable provisions of Virginia law, insofar as they do not conflict with or
are not preempted by federal banking law.
The
regulations of the FDIC, the Comptroller and FRB govern most aspects of the
Corporation’s business, including deposit reserve requirements, investments,
loans, certain check clearing activities, issuance of securities, payment of
dividends, branching, deposit interest rate ceilings and numerous other
matters.
As a
consequence of the extensive regulation of commercial banking activities in the
United States, the Corporation’s business is particularly susceptible to changes
in state and federal legislation and regulations, which may have the effect of
increasing the cost of doing business, limiting permissible activities or
increasing competition.
Governmental
Policies and Legislation. Banking is a business that
depends primarily on interest rate differentials. In general, the difference
between the interest rates paid by the Bank on its deposits and its other
borrowings and the interest rates received by the Bank on loans extended to its
customers and securities held in its portfolio comprise the major portion of the
Corporation’s earnings. These rates are highly sensitive to many factors that
are beyond the Corporation’s control. Accordingly, the Corporation’s growth and
earnings are subject to the influence of domestic and foreign economic
conditions, including inflation, recession and unemployment.
The
commercial banking business is affected not only by general economic conditions,
but is also influenced by the monetary and fiscal policies of the federal
government and the policies of its regulatory agencies, particularly the FRB.
The FRB implements national monetary policies (with objectives such as curbing
inflation and combating recession) by its open-market operations in U.S.
Government securities, by adjusting the required level of reserves for financial
institutions subject to its reserve requirements and by varying the discount
rates applicable to borrowings by depository institutions. The actions of the
FRB in these areas influence the growth of bank loans, investments and deposits,
and also affect interest rates charged on loans and paid on deposits. The nature
and impact of any future changes in monetary policies cannot be predicted. From
time to time, legislation is enacted which has the effect of increasing the cost
of doing business, limiting or expanding permissible activities or affecting the
competitive balance between banks and other financial institutions. Proposals to
change the laws and regulations governing the operations and taxation of bank
holding companies, banks and other financial institutions are frequently made in
Congress, in the Virginia Legislature and brought before various bank holding
company and bank regulatory agencies. The likelihood of any major changes and
the impact such changes might have are impossible to predict. It is also not
clear at this time what impact the EESA, as amended by the American Recovery and
Reinvestment Act of 2009 (the “ARRA”), enacted February 17, 2009, or other
initiatives of the U.S. Treasury and other bank regulatory agencies that have
been announced, or any additional programs that may be initiated in the future,
will have on the financial markets, the financial services industry, the
Corporation or the Bank.
6
Dividends. There
are both federal and state regulatory restrictions on dividend payments by both
the Bank and the Corporation that may affect the Corporation’s ability to pay
dividends on its common stock. As a bank holding company, the Corporation is a
separate legal entity from the Bank. Virtually all of the
Corporation’s income results from dividends paid to the Corporation by the
Bank. The amount of dividends that may be paid by the Bank depends
upon the Bank’s earnings and capital position and is limited by federal and
state law, regulations and policies. In addition to specific
regulations governing the permissibility of dividends, both the FRB and the
Virginia Bureau of Financial Institutions are generally authorized to prohibit
payment of dividends if they determine that the payment of dividends by the Bank
would be an unsafe and unsound banking practice. The Corporation
meets all regulatory requirements and began paying dividends in February
2006. The Corporation paid dividends totaling $415 thousand in 2009.
See “Item 5 - Market for Registrant’s Common Equity, Related Stockholder
Matters and Issuer Purchases of Equity Securities.”
Capital
Requirements. The FRB, the Comptroller and the FDIC have adopted
risk-based capital adequacy guidelines for bank holding companies and banks.
These capital adequacy regulations are based upon a risk-based capital
determination, whereby a bank holding company’s capital adequacy is determined
in light of the risk, both on- and off-balance sheet, contained in the company’s
assets. Different categories of assets are assigned risk weightings and are
counted at a percentage of their book value.
The
regulations divide capital between Tier 1 capital (core capital) and Tier 2
capital. For a bank holding company, Tier 1 capital consists primarily of common
stock, related surplus, non-cumulative perpetual preferred stock, minority
interests in consolidated subsidiaries and a limited amount of qualifying
cumulative preferred securities. Goodwill and certain other intangibles are
excluded from Tier 1 capital. Tier 2 capital consists of an amount equal to the
allowance for loan and lease losses up to a maximum of 1.25% of risk weighted
assets, limited other types of preferred stock not included in Tier 1 capital,
hybrid capital instruments and term subordinated debt. Investments in and loans
to unconsolidated banking and finance subsidiaries that constitute capital of
those subsidiaries are excluded from capital. The sum of Tier 1 and Tier 2
capital constitutes qualifying total capital. The guidelines generally require
banks to maintain a total qualifying capital to weighted risk assets level of 8%
(the “Risk-based Capital Ratio”). Of the total 8%, at least 4% of the total
qualifying capital to weighted risk assets (the “Tier 1 Risk-based Capital
Ratio”) must be Tier 1 capital.
The FRB,
the Comptroller and the FDIC have adopted leverage requirements that apply in
addition to the risk-based capital requirements. Banks and bank holding
companies are required to maintain a minimum leverage ratio of Tier 1 capital to
average total consolidated assets (the “Leverage Ratio”) of at least 3.0% for
the most highly-rated, financially sound banks and bank holding companies and a
minimum Leverage Ratio of at least 4.0% for all other banks. The FDIC and the
FRB define Tier 1 capital for banks in the same manner for both the Leverage
Ratio and the Risk-based Capital Ratio. However, the FRB defines Tier 1 capital
for bank holding companies in a slightly different manner. An institution may be
required to maintain Tier 1 capital of at least 4% or 5%, or possibly higher,
depending upon the activities, risks, rate of growth, and other factors deemed
material by regulatory authorities. As of December 31, 2009, the
Corporation and Bank both met all applicable capital requirements imposed by
regulation.
Federal Deposit
Insurance Corporation Improvement Act of 1991
(“FDICIA”). There are five capital categories applicable
to insured institutions, each with specific regulatory consequences. If the
appropriate federal banking agency determines, after notice and an opportunity
for hearing, that an insured institution is in an unsafe or unsound condition,
it may reclassify the institution to the next lower capital category (other than
critically undercapitalized) and require the submission of a plan to correct the
unsafe or unsound condition. The Comptroller has issued regulations to implement
these provisions. Under these regulations, the categories are:
a. Well
Capitalized — The institution exceeds the required minimum level for each
relevant capital measure. A well capitalized institution is one (i) having a
Risk-based Capital Ratio of 10% or greater, (ii) having a Tier 1 Risk-based
Capital Ratio of 6% or greater, (iii) having a Leverage Ratio of 5% or
greater and (iv) that is not subject to any order or written directive to
meet and maintain a specific capital level for any capital measure.
b. Adequately
Capitalized — The institution meets the required minimum level for each relevant
capital measure. No capital distribution may be made that would result in the
institution becoming undercapitalized. An adequately capitalized institution is
one (i) having a Risk-based Capital Ratio of 8% or greater,
(ii) having a Tier 1 Risk-based Capital Ratio of 4% or greater and
(iii) having a Leverage Ratio of 4% or greater or a Leverage Ratio of 3% or
greater if the institution is rated composite 1 under the CAMELS (Capital,
Assets, Management, Earnings, Liquidity and Sensitivity to market risk) rating
system.
c. Undercapitalized
— The institution fails to meet the required minimum level for any relevant
capital measure. An undercapitalized institution is one (i) having a
Risk-based Capital Ratio of less than 8% or (ii) having a Tier 1 Risk-based
Capital Ratio of less than 4% or (iii) having a Leverage Ratio of less than
4%, or if the institution is rated a composite 1 under the CAMEL rating system,
a Leverage Ratio of less than 3%.
7
d. Significantly
Undercapitalized — The institution is significantly below the required minimum
level for any relevant capital measure. A significantly undercapitalized
institution is one (i) having a Risk-based Capital Ratio of less than 6% or
(ii) having a Tier 1 Risk-based Capital Ratio of less than 3% or
(iii) having a Leverage Ratio of less than 3%.
e. Critically
Undercapitalized — The institution fails to meet a critical capital level set by
the appropriate federal banking agency. A critically undercapitalized
institution is one having a ratio of tangible equity to total assets that is
equal to or less than 2%.
An
institution which is less than adequately capitalized must adopt an acceptable
capital restoration plan, is subject to increased regulatory oversight, and is
increasingly restricted in the scope of its permissible activities. Each company
having control over an undercapitalized institution must provide a limited
guarantee that the institution will comply with its capital restoration plan.
Except under limited circumstances consistent with an accepted capital
restoration plan, an undercapitalized institution may not grow. An
undercapitalized institution may not acquire another institution, establish
additional branch offices or engage in any new line of business unless
determined by the appropriate federal banking agency to be consistent with an
accepted capital restoration plan, or unless the FDIC determines that the
proposed action will further the purpose of prompt corrective action. The
appropriate Federal banking agency may take any action authorized for a
significantly undercapitalized institution if an undercapitalized institution
fails to submit an acceptable capital restoration plan or fails in any material
respect to implement a plan accepted by the agency. A critically
undercapitalized institution is subject to having a receiver or conservator
appointed to manage its affairs and for loss of its charter to conduct banking
activities.
An
insured depository institution may not pay a management fee to a bank holding
company controlling that institution or any other person having control of the
institution if, after making the payment, the institution, would be
undercapitalized. In addition, an institution cannot make a capital
distribution, such as a dividend or other distribution that is in substance a
distribution of capital to the owners of the institution if following such a
distribution the institution would be undercapitalized. Thus, if payment of such
a management fee or the making of such would cause the Bank to become
undercapitalized, it could not pay a management fee or dividend to the
Corporation.
As of
December 31, 2009, both the Corporation and the Bank were considered “well
capitalized.”
Deposit Insurance
Assessments. The Bank's deposits are
insured up to applicable limits by the Deposit Insurance Fund (the “DIF”) of the
FDIC. The FDIC amended its risk-based assessment system in 2007 to
implement authority granted by the Federal Deposit Insurance Reform Act of 2005
(“FDIRA”). Under the revised system, insured institutions are
assigned to one of four risk categories based on
supervisory evaluations, regulatory capital levels and certain other
factors. An institution's assessment rate depends upon the
category
to which it is assigned. Unlike the other categories, Risk Category
I, which contains the least risky depository institutions, contains further risk
differentiation based on the FDIC's analysis of financial ratios, examination
component ratings and other information. Assessment rates are
determined by the FDIC and vary as between the healthiest institutions (Risk
Category I) and the riskiest (Risk Category IV). For calendar 2008,
assessments ranged from five to 43 basis points of each institution’s deposit
assessment base. Due to losses incurred by the DIF in 2008 from
failed institutions, and anticipated future losses, the FDIC adopted an across
the board seven basis point increase in the assessment range for the first
quarter of 2009. The FDIC made further refinements to its risk-based
assessment that were effective April 1, 2009, and effectively made the range
seven to 771/2 basis
points, with the annualized assessment rate for Risk Category 1 institutions
ranging from seven to 24 basis points. The FDIC may adjust rates uniformly from
one quarter to the next, except that no single adjustment can exceed three basis
points. FDIRA also provided for the possibility that the FDIC may pay
dividends to insured institutions if the DIF reserve ratio equals or exceeds
1.35% of estimated insured deposits.
Gramm-Leach-Bliley
Act of 1999. The Gramm-Leach-Bliley Act of 1999 (the “GLBA”) implemented
major changes to the statutory framework for providing banking and other
financial services in the United States. The GLBA, among other things,
eliminated many of the restrictions on affiliations among banks and securities
firms, insurance firms and other financial service providers. A bank holding
company that qualifies as a financial holding company will be permitted to
engage in activities that are financial in nature or incidental or complimentary
to financial activities. The activities that the GLBA expressly lists as
financial in nature include insurance underwriting, sales and brokerage
activities, providing financial and investment advisory services, underwriting
services and limited merchant banking activities.
To become
eligible for these expanded activities, a bank holding company must qualify as a
financial holding company. To qualify as a financial holding company, each
insured depository institution controlled by the bank holding company must be
well-capitalized, well-managed and have at least a satisfactory rating under the
CRA (discussed below). In addition, the bank holding company must file with the
Federal Reserve a declaration of its intention to become a financial holding
company. While the Corporation satisfies these requirements, the Corporation has
not elected for various reasons to be treated as a financial holding company
under the GLBA.
8
We do not
believe that the GLBA has had a material adverse impact on the Corporation’s or
the Bank’s operations. To the extent that it allows banks, securities firms and
insurance firms to affiliate, the financial services industry may experience
further consolidation. The GLBA may have the result of increasing competition
that we face from larger institutions and other companies offering financial
products and services, many of which may have substantially greater financial
resources.
The GLBA
and certain other regulations issued by federal banking agencies also provide
new protections against the transfer and use by financial institutions of
consumer nonpublic personal information. A financial institution must provide to
its customers, at the beginning of the customer relationship and annually
thereafter, the institution’s policies and procedures regarding the handling of
customers’ nonpublic personal financial information. These privacy provisions
generally prohibit a financial institution from providing a customer’s personal
financial information to unaffiliated third parties unless the institution
discloses to the customer that the information may be so provided and the
customer is given the opportunity to opt out of such disclosure.
Community
Reinvestment Act. The Bank is
subject to the requirements of the Community Reinvestment Act (the “CRA”). The
CRA imposes on financial institutions an affirmative and ongoing obligation to
meet the credit needs of their local communities, including low and
moderate-income neighborhoods, consistent with the safe and sound operation of
those institutions. A financial institution’s efforts in meeting community
credit needs currently are evaluated as part of the examination process pursuant
to three performance tests. These factors also are considered in evaluating
mergers, acquisitions and applications to open a branch or
facility.
Federal Home Loan
Bank (“FHLB”) of Atlanta. The Bank is a member of the
FHLB of Atlanta, which is one of twelve regional FHLBs that provide funding to
their members for making housing loans as well as for affordable housing and
community development lending. Each FHLB serves as a reserve or central bank for
its members within its assigned region. It is funded primarily from proceeds
derived from the sale of consolidated obligations of the FHLB System. It makes
loans to members (i.e., advances) in accordance with policies and procedures
established by the Board of Directors of the FHLB. As a member the Bank is
required to purchase and maintain stock in the FHLB in an amount equal to 4.5%
of aggregate outstanding advances in addition to the membership stock
requirement of 0.2% of the Bank’s total assets.
Mortgage Banking
Regulation. The
Bank’s mortgage banking subsidiary is subject to the rules and regulations of,
and examination by, the Department of Housing and Urban Development (“HUD”), the
Federal Housing Administration, the Department of Veterans Affairs and state
regulatory authorities with respect to originating, processing and selling
mortgage loans. Those rules and regulations, among other things, establish
standards for loan origination, prohibit discrimination, provide for inspections
and appraisals of property, require credit reports on prospective borrowers and,
in some cases, restrict certain loan features and fix maximum interest rates and
fees. In addition to other federal laws, mortgage origination activities are
subject to the Equal Credit Opportunity Act, Truth-in-Lending Act, Home Mortgage
Disclosure Act, Real Estate Settlement Procedures Act, and Home Ownership Equity
Protection Act, and the regulations promulgated there under. These laws prohibit
discrimination, require the disclosure of certain basic information to
mortgagors concerning credit and settlement costs, limit payment for settlement
services to the reasonable value of the services rendered and require the
maintenance and disclosure of information regarding the disposition of mortgage
applications based on race, gender, geographical distribution and income
level.
USA PATRIOT
Act. The USA
PATRIOT Act became effective on October 26, 2001 and provides for the
facilitation of information sharing among governmental entities and financial
institutions for the purpose of combating terrorism and money laundering. Among
other provisions, the USA PATRIOT Act permits financial institutions, upon
providing notice to the U.S. Treasury, to share information with one another in
order to better identify and report to the federal government concerning
activities that may involve money laundering or terrorists’ activities. The USA
PATRIOT Act is considered a significant banking law in terms of information
disclosure regarding certain customer transactions. Certain provisions of the
USA PATRIOT Act impose the obligation to establish anti-money laundering
programs, including the development of a customer identification program, and
the screening of all customers against any government lists of known or
suspected terrorists. Although it does create a reporting obligation and a cost
of compliance, the Bank does not expect the USA PATRIOT Act to materially affect
its products, services or other business activities.
Reporting
Terrorist Activities. The Federal Bureau of
Investigation (“FBI”) has sent, and will send, our banking regulatory agencies
lists of the names of persons suspected of involvement in terrorist activities.
The Bank has been requested, and will be requested, to search its records for
any relationships or transactions with persons on those lists. If the Bank finds
any relationships or transactions, it must file a suspicious activity report and
contact the FBI.
The
Office of Foreign Assets Control (“OFAC”), which is a division of the
U.S.Treasury, is responsible for helping to insure that United States entities
do not engage in transactions with “enemies” of the United States, as defined by
various Executive Orders and Acts of Congress. OFAC has sent, and will send, our
banking regulatory agencies lists of names of persons and organizations
suspected of aiding, harboring or engaging in terrorist acts. If the Bank finds
a name on any transaction, account or wire transfer that is on an OFAC list, it
must freeze such account, file a suspicious activity report and notify the FBI.
The Bank has appointed an OFAC compliance officer to oversee the inspection of
its accounts and the filing of any notifications. The Bank actively checks
high-risk OFAC areas such as new accounts, wire transfers and customer files.
The Bank performs these checks utilizing software, which is updated each time a
modification is made to the lists provided by OFAC and other agencies of
Specially Designated Nationals and Blocked Persons.
9
Consumer Laws and
Regulations. The Bank is also subject to certain consumer laws and
regulations that are designed to protect consumers in transactions with
banks. While the list set forth herein is not exhaustive, these laws
and regulations include the Truth in Lending Act, the Truth in Savings Act, the
Electronic Funds Transfer Act, the Expedited Funds Availability Act, the Equal
Credit Opportunity Act, the Fair Credit Reporting Act and the Fair Housing Act,
among others. These laws and regulations mandate certain disclosure
requirements and regulate the manner in which financial institutions transact
business with customers. The Bank must comply with the applicable
provisions of these consumer protection laws and regulations as part of its
ongoing customer relations.
Emergency
Economic Stabilization
Act of 2008 (“EESA"). On
October 3, 2008, the EESA was enacted, which temporarily increased FDIC
insurance coverage from $100,000 to $250,000, as well as provided up to
$700 billion in funding for the financial services industry. Pursuant to
the EESA, the U.S. Treasury was initially authorized by Congress to use
$350 billion for the Troubled Asset Relief Program (“TARP”). Of this
amount, the U.S. Treasury allocated $250 billion to the Capital
Purchase Program (“CPP”). This program allows a qualifying institution to apply
for up to three percent of its total risk-weighted assets in capital, which will
be in the form of non-cumulative perpetual preferred stock of the institution
with a dividend rate of 5% until the fifth anniversary of the investment and 9%
thereafter. The U.S. Treasury will also receive warrants for common stock of the
institution equal to 15% of the capital invested. On January 15, 2009, the
second $350 billion of TARP funding was released to the U.S. Treasury.
The Corporation applied in November, 2008 for TARP funding of up to three
percent of its risk-weighted assets and we were approved on January 6, 2009 for
up to $16 million. On February 5, 2009 the Corporation declined
participation in these programs due to the cost of participation in the CPP and
the well capitalized position of both the Bank and Corporation.
Temporary
Liquidity Guarantee Program. On
November 21, 2008, the Board of Directors of the FDIC adopted a final rule
relating to the Temporary Liquidity Guarantee Program (“TLG Program”). The
TLG Program was announced by the FDIC on October 14, 2008, preceded by
the determination of systemic risk by the Secretary of the Department of
Treasury (after consultation with the President), as an initiative to counter
the system-wide crisis in the nation’s financial sector. Under the
TLG Program the FDIC will (i) guarantee, through the earlier of
maturity or December 31, 2012, certain newly issued senior unsecured debt
issued by participating institutions on or after October 14, 2008, and
before October 31, 2009 and (ii) provide full FDIC deposit insurance
coverage for non-interest bearing transaction deposit accounts, Negotiable Order
of Withdrawal (“NOW”) accounts paying less than 0.5% interest per annum and
Interest on Lawyers Trust Accounts held at participating FDIC insured
institutions through June 30, 2010, extended by subsequent amendment from
December 31, 2009. Coverage under the TLG Program was
available for the first 30 days without charge. The fee assessment for
coverage of senior unsecured debt ranges from 50 basis points to
125 basis points per annum, depending on the initial maturity of the debt
and its date of issuance. The fee assessment for deposit insurance coverage on
amounts in covered accounts exceeding $250,000 was an annualized 10 basis points
through December 31, 2009 and is an annualizes 15 basis points for coverage in
2010 for institutions in risk category 1. The Bank elected to participate in
both guarantee programs. On February 11, 2009 the Bank issued $30.0
million in new senior unsecured debt at 2.74% maturing February 15, 2012 under
the TLG Program.
Future
Regulations
Regulatory Restructuring
Legislation. In June 2009, the U.S. President’s administration
proposed a wide range of regulatory reforms that, if enacted, may have
significant effects on the financial services industry in the United States.
Significant aspects of the administration’s proposals included, among other
things, proposals: (i) to reassess and increase capital requirements for
banks and bank holding companies and examine the types of instruments that
qualify as regulatory capital; (ii) to create a federal consumer financial
protection agency to be the primary federal consumer protection supervisor with
broad examination, supervision and enforcement authority with respect to
consumer financial products and services; (iii) to further limit the
ability of banks to engage in transactions with affiliates; and (iv) to
subject all “over-the-counter” derivatives markets to comprehensive
regulation.
The U.S.
Congress, state lawmaking bodies and federal and state regulatory agencies
continue to consider a number of wide-ranging and comprehensive proposals for
altering the structure, regulation and competitive relationships of the nation’s
financial institutions, including rules and regulations related to the
administration’s proposals. Separate comprehensive financial reform bills
intended to address the proposals set forth by the administration were
introduced in both houses of Congress in the second half of 2009 and remain
under review by both the U.S. House of Representatives and the U.S. Senate. In
addition, both the U.S. Treasury and the Basel Committee have issued policy
statements regarding proposed significant changes to the regulatory capital
framework applicable to banking organizations as discussed above. The
Corporation cannot predict whether or in what form further legislation or
regulations may be adopted or the extent to which the Corporation may be
affected thereby.
10
Incentive
Compensation. On October 22, 2009, the FRB issued a
comprehensive proposal on incentive compensation policies intended to ensure
that the incentive compensation policies of banking organizations do not
undermine the safety and soundness of such organizations by encouraging
excessive risk-taking. Banking organizations are instructed to review their
incentive compensation policies to ensure that they do not encourage excessive
risk-taking and implement corrective programs as needed. The FRB will review, as
part of the regular, risk-focused examination process, the incentive
compensation arrangements of banking organizations, such as the Bank, that are
not “large, complex banking organizations.” These reviews will be tailored to
each organization based on the scope and complexity of the organization’s
activities and the prevalence of incentive compensation arrangements. The
findings of the supervisory initiatives will be included in reports of
examination. Deficiencies will be incorporated into the organization’s
supervisory ratings, which can affect the organization’s ability to make
acquisitions and take other actions. In addition, on January 12,
2010, the FDIC announced that it would seek public comment on whether banks with
compensation plans that encourage risky behavior should be charged at higher
deposit assessment rates than such banks would otherwise be
charged. The scope and content of the U.S. banking regulators’
policies on executive compensation are continuing to develop and are likely to
continue evolving in the near future. It cannot be determined at this time
whether compliance with such policies will adversely affect the Bank’s ability
to hire, retain and motivate its key employees.
ITEM 1A – RISK
FACTORS
Our
future success will depend on our ability to compete effectively in the highly
competitive financial services industry.
We face
substantial competition in all phases of our operations from a variety of
different competitors. In particular, there is very strong
competition for financial services in Northern Virginia and the greater
Washington, D.C. Metropolitan Area in which we conduct a substantial portion of
our business. We compete with commercial banks, credit unions,
savings and loan associations, mortgage banking firms, consumer finance
companies, securities brokerage firms, insurance companies, money market funds
and other mutual funds, as well as other local and community, super-regional,
national and international financial institutions that operate offices in our
primary market areas and elsewhere. Our future growth and success
will depend on our ability to compete effectively in this highly competitive
financial services environment. Many of our competitors are
well-established, larger financial institutions and many offer products and
services that we do not. Many have substantially greater resources,
name recognition and market presence that benefit them in attracting
business. Some of our competitors are not subject to the same
regulation as is imposed on bank holding companies and federally-insured
national banks, including credit unions which do not pay federal income tax,
and, therefore, have regulatory advantages over us in accessing funding and in
providing various services. While we believe we compete effectively
with these other financial institutions in our primary markets, we may face a
competitive disadvantage as a result of our smaller size, smaller asset base,
lack of geographic diversification and inability to spread our marketing costs
across a broader market. If we have to raise interest rates paid on
deposits or lower interest rates charged on loans to compete effectively, our
net interest margin and income could be negatively affected. Failure
to compete effectively to attract new or to retain existing clients may reduce
or limit our net income and our market share and may adversely affect our
results of operations, financial condition and growth.
Our
profitability depends on interest rates generally, and we may be adversely
affected by changes in government monetary policy.
Our
profitability depends in substantial part on our net interest margin, which is
the difference between the rates we receive on loans and investments and the
rates we pay for deposits and other sources of funds. Our net
interest margin depends on many factors that are partly or completely outside of
our control, including competition, federal economic, monetary and fiscal
policies, and economic conditions generally. Our net interest income
will be adversely affected if market interest rates change so that the interest
we pay on deposits and borrowings increases faster than the interest we earn on
loans and investments.
Changes
in interest rates, particularly by the Board of Governors of the FRB, which
implements national monetary policy in order to mitigate recessionary and
inflationary pressures, also affect the value of our loans. In
setting its policy, the FRB may utilize techniques such as: (i) engaging in
open market transactions in United States government securities;
(ii) setting the discount rate on member bank borrowings; and
(iii) determining reserve requirements. These techniques may
have an adverse effect on our deposit levels, net interest margin, loan demand
or our business and operations. In addition, an increase in interest
rates could adversely affect borrowers’ ability to pay the principal or interest
on existing loans or reduce their desire to borrow more money. This
may lead to an increase in our non-performing assets, a decrease in loan
originations, or a reduction in the value of and income from our loans, any of
which could have a material and negative effect on our results of
operations. We try to minimize our exposure to interest rate risk,
but we are unable to completely eliminate this risk. Fluctuations in
market rates and other market disruptions are neither predictable nor
controllable and may have a material and negative effect on our business,
financial condition and results of operations.
Our
profitability depends significantly on local economic conditions.
As a
lender, we are exposed to the risk that our loan clients may not repay their
loans according to their terms and any collateral securing payment may be
insufficient to fully compensate us for the outstanding balance of the loan plus
the costs we incur disposing of the collateral. Although we have
collateral for most of our loans, that collateral can fluctuate in value and may
not always cover the outstanding balance on the loan. With most of
our loans concentrated in Northern Virginia, a decline in local economic
conditions could adversely affect the values of our real estate
collateral. Consequently, a decline in local economic conditions may
have a greater effect on our earnings and capital than on the earnings and
capital of larger financial institutions whose real estate loan portfolios are
more geographically diverse.
11
In
addition to assessing the financial strength and cash flow characteristics of
each of our borrowers, the Bank often secures loans with real estate
collateral. At December 31, 2009, approximately 84.8% of our Bank’s
loans held for investment have real estate as a primary or secondary component
of collateral. The real estate collateral in each case provides an
alternate source of repayment in the event of default by the borrower and may
deteriorate in value during the time the credit is extended. If we
are required to liquidate the collateral securing a loan to satisfy the debt
during a period of reduced real estate values, our earnings and capital could be
adversely affected.
Our
business strategy includes the continuation of our growth plans, and our
financial condition and results of operations could be negatively affected if we
fail to grow or fail to manage our growth effectively.
We intend
to continue to grow in our existing banking markets (internally and through
additional offices) and to expand into new markets as appropriate opportunities
arise. Our prospects must be considered in light of the risks,
expenses and difficulties frequently encountered by companies that are
experiencing growth. We cannot assure you we will be able to expand
our market presence in our existing markets or successfully enter new markets,
or that any expansion will not adversely affect our results of
operations. Failure to manage our growth effectively could have a
material adverse effect on our business, future prospects, financial condition
or results of operations, and could adversely affect our ability to successfully
implement our business strategy. Also, if our growth occurs more
slowly than anticipated or declines, our operating results could be materially
affected in an adverse way. Our ability to successfully grow will depend on a
variety of factors, including the continued availability of desirable business
opportunities, the competitive responses from other financial institutions in
our market areas and our ability to manage our growth. While we
believe we have the management resources and internal systems in place to
successfully manage our future growth, there can be no assurance growth
opportunities will be available or growth will be successfully
managed.
We
may face risks with respect to future acquisitions.
As a
strategy, we have sought to increase the size of our business by pursuing
business development opportunities, and we have grown rapidly since our
incorporation. As part of that strategy, we have acquired three
mortgage companies and a small equipment leasing company. We may
acquire other financial institutions and mortgage companies, or parts of those
entities, in the future. Acquisitions and mergers involve a number of
risks, including:
|
|
Ÿ
|
the
time and costs associated with identifying and evaluating potential
acquisitions and merger partners;
|
|
|
Ÿ
|
the
estimates and judgments used to evaluate credit, operations, management
and market risks with respect to the target entity may not be
accurate;
|
|
|
Ÿ
|
the
time and costs of evaluating new markets, hiring experienced local
management and opening new offices, and the time lags between these
activities and the generation of sufficient assets and deposits to support
the costs of the expansion;
|
|
|
Ÿ
|
our
ability to finance an acquisition and possible ownership or economic
dilution to our current
shareholders;
|
|
|
Ÿ
|
the
diversion of our management’s attention to the negotiation of a
transaction, and the integration of the operations and personnel of the
combining businesses;
|
|
|
Ÿ
|
entry
into new markets where we lack
experience;
|
|
|
Ÿ
|
the
introduction of new products and services into our
business;
|
|
|
Ÿ
|
the
incurrence and possible impairment of goodwill associated with an
acquisition and possible adverse short-term effects on our results of
operations; and
|
|
|
Ÿ
|
the
potential loss of key employees and
clients.
|
We may
incur substantial costs to expand, and we can give no assurance such expansion
will result in the levels of profits we seek. There can be no
assurance that integration efforts for any future mergers or acquisitions will
be successful. Also, we may issue equity securities, including common
stock and securities convertible into shares of our common stock, in connection
with future acquisitions, which could cause ownership and economic dilution to
our current shareholders. There is no assurance that, following any future
merger or acquisition, our integration efforts will be successful or our
company, after giving effect to the acquisition, will achieve profits comparable
to or better than our historical experience.
12
Our
allowance for loan losses could become inadequate and reduce our earnings and
capital.
We
maintain an allowance for loan losses that we believe is adequate for absorbing
any potential losses in our loan portfolio. Management conducts a
periodic review and consideration of the loan portfolio to determine the amount
of the allowance for loan losses based upon general market conditions, credit
quality of the loan portfolio and performance of our clients relative to their
financial obligations with us. The amount of future losses, however,
is susceptible to changes in borrowers’ circumstances and economic and other
market conditions, including changes in interest rates and collateral values
that are beyond our control and these future losses may exceed our current
estimates. Our allowance for loan losses at December 31, 2009 was
$9.1 million. Although we believe the allowance for loan losses is
adequate to absorb probable losses in our loan portfolio, we cannot predict such
losses or guarantee that our allowance will be adequate in the
future. Excessive loan losses could have a material impact on our
financial performance and reduce our earnings and capital.
Liquidity
needs could adversely affect our results of operations and financial
condition.
We rely
on dividends from the Bank as our primary source of funds. The
primary sources of funds of the Bank are client deposits and loan
repayments. While scheduled loan repayments are a relatively stable
source of funds, they are subject to the ability of borrowers to repay the
loans. The ability of borrowers to repay loans can be adversely
affected by a number of factors, including changes in economic conditions,
adverse trends or events affecting business industry groups, reductions in real
estate values or markets, business closings or lay-offs, inclement weather,
natural disasters and international instability. Additionally,
deposit levels may be affected by a number of factors, including rates paid by
competitors, general interest rate levels, regulatory capital requirements,
returns available to clients on alternative investments and general economic
conditions. Accordingly, we may be required from time to time to rely
on secondary sources of liquidity to meet withdrawal demands or otherwise fund
operations. Such sources include FHLB advances, sales of securities
and loans, and federal funds lines of credit from correspondent banks, as well
as out-of-market time deposits. While we believe that these sources
are currently adequate, there can be no assurance they will be sufficient to
meet future liquidity demands, particularly if we continue to grow and
experience increasing loan demand. We may be required to slow or
discontinue loan growth, capital expenditures or other investments or liquidate
assets should such sources not be adequate.
We
are subject to extensive regulation that could limit or restrict our activities
and adversely affect our earnings.
We
operate in a highly regulated industry, and both we and the Bank are subject to
extensive regulation and supervision by the FRB, the Comptroller, and the
FDIC. Our compliance with these regulations is costly and restricts
certain of our activities, including payment of dividends, mergers and
acquisitions, investments, loans and interest rates charged, interest rates paid
on deposits and locations of offices. We are also subject to
capitalization guidelines established by our regulators, which require us to
maintain adequate capital to support our growth. Many of these
regulations are intended to protect depositors and the FDIC’s Deposit Insurance
Fund rather than our shareholders.
SOX, and
the related rules and regulations promulgated by the SEC and NASDAQ that are
applicable to us, have increased the scope, complexity and cost of corporate
governance, reporting and disclosure practices, including the cost of completing
our audit and maintaining our internal controls. As a result, we may
experience greater compliance costs.
The laws
and regulations that apply to us could change at any time. We cannot
predict whether or what form of proposed statute or regulation will be adopted
or the extent to which such adoption may affect our
business. Regulatory changes may increase our costs, limit the types
of financial services and products we may offer and/or increase the ability of
non-banks to offer competing financial services and products and thus place
other entities that are not subject to similar regulation in stronger, more
favorable competitive positions, which could adversely affect our growth and our
ability to operate profitably. Failure to comply with existing or new
laws, regulations or policies could result in sanctions by regulatory agencies,
civil money penalties and/or reputation damage, which could have an adverse
effect on our business, financial condition and results of
operations.
Our
recent results may not be indicative of our future results.
Various
factors, such as economic conditions, regulatory and legislative considerations
and competition, may impede or prohibit our ability to expand our market
presence. Until the economy, loan demand, credit quality and consumer
confidence improve, it is unlikely that revenues will increase significantly,
and may be reduced.
Our
hedging strategies may not be successful in managing our risks associated with
interest rates.
We use
various derivative financial instruments to provide a level of protection
against interest rate risks, but no hedging strategy can protect
us completely. When rates change, we expect to record a gain or loss
on derivatives that would be offset by an inverse change in the value of loans
held for sale and mortgage-related securities. We cannot assure you, however,
that our hedging strategy and use of derivatives will offset the risks related
to changes in interest rates. See “Item 7 - Management’s Discussion
and Analysis of Financial Condition and Results of Operations — Critical
Accounting Policies” and “Item 7A - Quantitative and Qualitative Disclosures
About Market Risk.”
13
The
profitability of the Mortgage Corporation will be significantly reduced if we
are not able to sell mortgages.
Currently,
we sell all of the mortgage loans originated by the Mortgage Corporation. We
only underwrite mortgages that we reasonably expect will have more than one
potential purchaser. The profitability of our mortgage company
depends in large part upon our ability to originate or purchase a high volume of
loans and to quickly sell them in the secondary market. Thus, we are
dependent upon (i) the existence of an active secondary market and
(ii) our ability to sell loans into that market.
The
Mortgage Corporation’s ability to sell mortgage loans readily is dependent upon
the availability of an active secondary market for single-family mortgage loans,
which in turn depends in part upon the continuation of programs currently
offered by Fannie Mae and Freddie Mac and other institutional and
non-institutional investors. These entities account for a substantial
portion of the secondary market in residential mortgage loans. Some
of the largest participants in the secondary market, including Fannie Mae and
Freddie Mac, are government-sponsored enterprises whose activities are governed
by federal law, and while we do not actively participate in their programs, they
do have substantial market influence. Any future changes in laws that
significantly affect the activity of these government-sponsored enterprises and
other institutional and non-institutional investors or any impairment of our
ability to participate in such programs could, in turn, adversely affect our
operations.
Fannie
Mae and Freddie Mac have recently reported substantial losses and a need for
substantial amounts of additional capital. Such losses are due to these
entities’ business models being tied extensively to the U.S. housing market
which is in a severe contraction. In response to the deteriorating
financial condition of Fannie Mae and Freddie Mac from the U.S. housing market
contraction, Congress and the U.S. Treasury have undertaken a series of actions
to stabilize these entities. The Federal Housing Finance Agency, or
FHFA, was established in July 2008 pursuant to the Regulatory Reform Act in an
effort to enhance regulatory oversight over Fannie Mae and Freddie
Mac. FHFA placed Fannie Mae and Freddie Mac into federal
conservatorship in September 2008. Although the federal government
has committed capital to Fannie Mae and Freddie Mac, there is no explicit
guaranty of the obligations of these entities by the federal government and
there can be no assurance that these government credit facilities and other
capital infusions will be adequate for the needs of Fannie Mae and Freddie Mac.
If the financial support is inadequate, these companies could continue to suffer
losses and could fail to offer programs necessary to an active secondary market.
If this were to occur, the Mortgage Corporation’s ability to sell mortgage loans
readily could be hampered, and the profitability of the Mortgage Corporation
could be significantly reduced.
The
Mortgage Corporation may be subject to claims on mortgage loans previously
sold.
The
Mortgage Corporation makes representations and warranties that loans sold to
investors meet their program’s guidelines and that the information provided by
the borrowers is accurate and complete. In the event of a default on a loan
sold, the investor may make a claim for losses due to document document
deficiencies, program compliance, early payment default, and fraud or borrower
misrepresentations. The Mortgage Corporation maintains a reserve in
other liabilities for potential losses on mortgage loans
sold. Earnings may be impacted if this reserve is insufficient to
cover claims from the investors.
Our
small-to medium-sized business target market may have fewer financial resources
to weather a downturn in the economy.
We target
our commercial development and marketing strategy primarily to serve the banking
and financial services needs of small- and medium-sized
businesses. These businesses generally have fewer financial resources
in terms of capital or borrowing capacity than larger entities. If
general economic conditions negatively impact this economic sector in the
markets in which we operate, our results of operations and financial condition
may be adversely affected.
We
depend on the accuracy and completeness of information about clients and
counterparties.
In
deciding whether to extend credit or enter into other transactions with clients
and counterparties, we may rely on information furnished to us by or on behalf
of clients and counterparties, including financial statements and other
financial information. We also may rely on representations of clients
and counterparties as to the accuracy and completeness of that information and,
with respect to financial statements, on reports of independent
auditors. For example, in deciding whether to extend credit to
clients, we may assume that a customer’s audited financial statements conform
with generally accepted accounting principles (“GAAP”) and present fairly, in
all material respects, the financial condition, results of operations and cash
flows of the customer. Our financial condition and results of
operations could be negatively impacted to the extent we rely on financial
statements or other information that does not comply with GAAP or is materially
misleading.
Negative
public opinion could damage our reputation and adversely impact our
earnings.
Reputation
risk, or the risk to our business, earnings and capital from negative public
opinion, is inherent in our business. Negative public opinion can
result from our actual or alleged conduct in any number of activities, including
lending practices, corporate governance and acquisitions, and from actions taken
by government regulators and community organizations in response to those
activities. Negative public opinion can adversely affect our ability
to keep and attract clients and employees and can expose us to litigation and
regulatory action. Because virtually all of our businesses operate
under the “Access National” brand, actual or alleged conduct by one business can
result in negative public opinion about our other
businesses. Although we take steps to minimize reputation risk in
dealing with our clients and communities, this risk will always be present given
the nature of our business.
14
We
depend on the services of key personnel, and a loss of any of those personnel
could disrupt our operations and result in reduced revenues.
Our
success depends upon the continued service of our senior management team and
upon our ability to attract and retain qualified financial services
personnel. Competition for qualified employees is
intense. In our experience, it can take a significant period of time
to identify and hire personnel with the combination of skills and attributes
required in carrying out our strategy. If we lose the services of our
key personnel, or are unable to attract additional qualified personnel, our
business, financial condition, results of operations and cash flows could be
materially adversely affected.
We
may need to invest in new technology to compete effectively, and that could have
a negative effect on our operating results and the value of our common
stock.
The
market for financial services, including banking services, is increasingly
affected by advances in technology, including developments in
telecommunications, data processing, computers, automation and Internet-based
banking. We depend on third-party vendors for portions of our data
processing services. In addition to our ability to finance the
purchase of those services and integrate them into our operations, our ability
to offer new technology-based services depends on our vendors’ abilities to
provide and support those services. Future advances in technology may
require us to incur substantial expenses that adversely affect our operating
results, and our limited capital resources may make it impractical or impossible
for us to keep pace with competitors possessing greater capital
resources. Our ability to compete successfully in our banking markets
may depend on the extent to which we and our vendors are able to offer new
technology-based services and on our ability to integrate technological advances
into our operations.
Our
ability to pay dividends is subject to regulatory restrictions, and we may be
unable to pay future dividends.
Our
ability to pay dividends is subject to regulatory restrictions and the need to
maintain sufficient consolidated capital. Also, our only source of
funds with which to pay dividends to our shareholders is dividends we receive
from our Bank, and the Bank’s ability to pay dividends to us is limited by its
own obligations to maintain sufficient capital and regulatory
restrictions. If these regulatory requirements are not satisfied, we
will be unable to pay dividends on our common stock. We paid our
first cash dividends on February 24, 2006. We cannot guarantee that dividends
will not be reduced or eliminated in future periods.
Certain
provisions under our articles of incorporation and applicable law, in addition
to the ownership position of certain shareholders, may make it difficult for
others to obtain control of our Corporation even if such a change in control may
be favored by some shareholders.
In
addition to the amount of common stock controlled by our chairman of the board
and other principal shareholders, certain provisions in our articles of
incorporation and applicable Virginia corporate and banking law may have the
effect of discouraging a change of control of our company even if such a
transaction is favored by some of our shareholders and could result in
shareholders receiving a substantial premium over the current market price of
our shares. The primary purpose of these provisions is to encourage
negotiations with our management by persons interested in acquiring control of
our Corporation. These provisions may also tend to perpetuate present
management and make it difficult for shareholders owning less than a majority of
the shares to be able to elect even a single director.
There
can be no assurance that recent government actions will help stabilize the U.S.
financial system.
In
response to the financial crises affecting the banking system and financial
markets and going concern threats to investment banks and other financial
institutions, various branches and agencies of the U.S. government have put in
place laws, regulations, and programs to address capital and liquidity issues in
the banking system. There can be no assurance, however, as to the actual impact
that such laws, regulations, and programs will have on the financial markets.
The failure of such laws, regulations, and programs to help stabilize the
financial markets or a continuation of recent financial market conditions could
materially and adversely affect our business, financial condition, results of
operations, access to credit or the trading price of our common
stock.
The
soundness of other financial institutions could adversely affect
us.
Our
ability to engage in routine funding transactions could be adversely affected by
the actions and commercial soundness of other financial institutions. Financial
services institutions are interrelated as a result of trading, clearing,
counterparty, or other relationships. We have exposure to many different
counterparties, and we routinely execute transactions with counterparties in the
financial services industry, including brokers, dealers, commercial banks,
investment banks, and government sponsored enterprises. Many of these
transactions expose us to credit risk in the event of default of our
counterparty. In addition, our credit risk may be exacerbated when the
collateral held by us cannot be realized or is liquidated at prices not
sufficient to recover the full amount of the loan or other obligation due us.
There is no assurance that any such losses would not materially and adversely
affect our financial condition and results of operations.
15
Current
market developments may adversely affect our industry, business, and results of
operations.
Dramatic
declines in the housing market during the prior year, with falling home prices
and increasing foreclosures and unemployment, have resulted in significant
write-downs of asset values by financial institutions, including
government-sponsored entities and major commercial and investment banks. These
write-downs have caused many financial institutions to seek additional capital,
to merge with larger and stronger institutions and, in some cases, to fail.
Reflecting concern about the stability of the financial markets generally and
the strength of counterparties, many lenders and institutional investors have
reduced, and in some cases, ceased to provide funding to borrowers, including
other financial institutions. The resulting lack of available credit, lack of
confidence in the financial sector, increased volatility in the financial
markets, and reduced business activity could materially and adversely, directly
or indirectly, affect our business, financial condition and results of
operations.
ITEM 1B – UNRESOLVED STAFF
COMMENTS
None.
ITEM 2 -
PROPERTIES
The Bank
and the Mortgage Corporation lease offices that are used in the normal course of
business. The principal executive office of the Corporation, Bank, Access Real
Estate and Mortgage Corporation is owned by Access Real Estate, a subsidiary of
the Bank, and is located at 1800 Robert Fulton Drive, Reston, Virginia. The Bank
leases offices in Chantilly, Tysons Corner, Leesburg, and Manassas, Virginia.
The Mortgage Corporation leases offices in Annandale, Fairfax McLean, Reston,
Richmond, and Roanoke in Virginia. The Mortgage Corporation leases two offices
in Maryland located in Crofton and Westminster in addition to the offices in
Tennessee, Texas, Indiana, Illinois, Georgia Massachusetts and
Colorado. Access Real Estate owns an undeveloped commercial lot in
Fredericksburg that is being held for future expansion of the Bank and Mortgage
Corporation.
All of
the owned and leased properties are in good operating condition and are adequate
for the Corporation’s present and anticipated future needs.
ITEM 3 – LEGAL
PROCEEDINGS
The Bank
is a party to legal proceedings arising in the ordinary course of business.
Management is of the opinion that these legal proceedings will not have a
material adverse effect on the Corporation’s financial condition or results of
operations. From time to time the Bank
may initiate legal actions against borrowers in connection with collecting
defaulted loans. Such actions are not considered material by
management unless otherwise disclosed.
ITEM 4 – (Removed and
Reserved).
PART II
ITEM 5 – MARKET FOR
REGISTRANT’S COMMON EQUITY, RELATED STOCKHOLDER MATTERS AND ISSUER PURCHASES OF
EQUITY SECURITIES
In July 2004, the Corporation’s common
stock became listed on the NASDAQ Global Market of the NASDAQ Stock Market LLC
and is quoted under the symbol of “ANCX”. Set forth below is certain financial
information relating to the Corporation’s common stock price
history. Prices reflect transactions executed on
NASDAQ.
|
2009
|
2008
|
|||||||||||||||||||||||
|
High
|
Low
|
Dividends
|
High
|
Low
|
Dividends
|
|||||||||||||||||||
|
First
Quarter
|
$ | 5.17 | $ | 3.80 | $ | 0.01 | $ | 8.10 | $ | 5.11 | $ | 0.01 | ||||||||||||
|
Second
Quarter
|
6.80 | 4.49 | 0.01 | 8.35 | 6.25 | 0.01 | ||||||||||||||||||
|
Third
Quarter
|
6.92 | 5.10 | 0.01 | 6.85 | 4.99 | 0.01 | ||||||||||||||||||
|
Fourth
Quarter
|
6.85 | 5.86 | 0.01 | 6.13 | 4.42 | 0.01 | ||||||||||||||||||
16
As of
March 26, 2010, the Corporation had 10,615,313 outstanding shares of Common
Stock, par value $.835 per share, held by approximately 437 shareholders of
record and the closing price for the Corporation’s common stock on the NASDAQ
Global Market was $6.00.
The
Corporation paid its seventeenth consecutive quarterly cash dividend on February
25, 2010 to shareholders of record as of February 10, 2010. Payment of dividends
is at the discretion of the Corporation’s Board of Directors, and is also
subject to various federal and state regulatory limitations. Future
dividends are dependent upon the overall performance and capital requirements of
the Corporation. See “Item 1 - Business - Supervision and Regulation
- Dividends" for a discussion of regulatory requirements related to
dividends.
Issuer
Purchases of Equity Securities for the Quarter Ended December 31,
2009
The
following table details the Corporation’s purchases of its common stock during
the fourth quarter pursuant to a Share Repurchase Program announced on March 20,
2007. On April 22, 2008 the number of shares authorized for repurchase under the
Share Repurchase Program was increased from 2,000,000 to 2,500,000 shares. The
Share Repurchase Program does not have an expiration date.
|
Issuer Purchases of Equity Securities
|
||||||||||||||||
|
(c) Total Number of
|
(d) Maximum Number
|
|||||||||||||||
|
Shares Purchased as
|
of Shares that may
|
|||||||||||||||
|
(a) Total Number of
|
(b) Average Price
|
Part of Publicly
|
yet be Purchased
|
|||||||||||||
|
Period
|
Shares Purchased
|
Paid Per Share
|
Announced Plan
|
Under the Plan
|
||||||||||||
|
October
1 - October 31, 2009
|
500 | $ | 5.16 | 500 | 403,910 | |||||||||||
|
November
1 - November 30, 2009
|
8,900 | 6.07 | 8,900 | 395,010 | ||||||||||||
|
December
1 - December 31, 2009
|
- | - | - | - | ||||||||||||
| 9,400 | $ | 6.07 | 9,400 | 395,010 | ||||||||||||
Stock
Performance
The
following graph compares the Corporation’s cumulative total shareholder return
on its common stock for the five year period ended December 31, 2009 with the
cumulative return of a broad equity market index, the Standard & Poor’s 500
Index (“S&P 500 Index”) and a peer group constructed by the Corporation (the
“Peer Group”). This presentation assumes $100 was invested in
shares of the Corporation and each of the indices on December 31, 2004, and that
dividends, if any, were immediately reinvested in additional
shares. The graph plots the value of the initial $100
investment at one-year intervals from December 31, 2004 through December 31,
2009.
The Peer
Group consists of five companies that, in the opinion of management, are similar
to the Corporation in ways relevant to a comparison of stock
performance. Specifically, each company in the Peer Group provides
commercial banking services in the Mid-Atlantic Region, has existed for a
reasonably similar time period as has the Corporation, and is considered by our
management to be in an expansion mode. In calculating the relative
index, the stock values of the Peer Group are re-balanced at the beginning of
each year by the weighted market capitalization.
The
Peer Group consists of:
|
Company, Headquarters
|
Exchange
|
Trading Symbol
|
Established
|
|||
|
Cardinal
Financial Corporation
|
NASDAQ-GS
|
CFNL
|
1997
|
|||
|
Fairfax,
Virginia
|
||||||
|
Eagle
Bancorp, Inc.
|
NASDAQ-CM
|
EGBN
|
1997
|
|||
|
Bethesda,
Maryland
|
||||||
|
TowneBank
|
NASDAQ-GS
|
TOWN
|
1999
|
|||
|
Portsmouth,
Virginia
|
||||||
|
Valley
Financial Corporation
|
NASDAQ-CM
|
VYFC
|
1994
|
|||
|
Roanoke,
Virginia
|
||||||
|
Virginia
National Bank
|
OTC-BB
|
VABK
|
1998
|
|||
|
Charlottesville,
Virginia
|
|
|
|
17
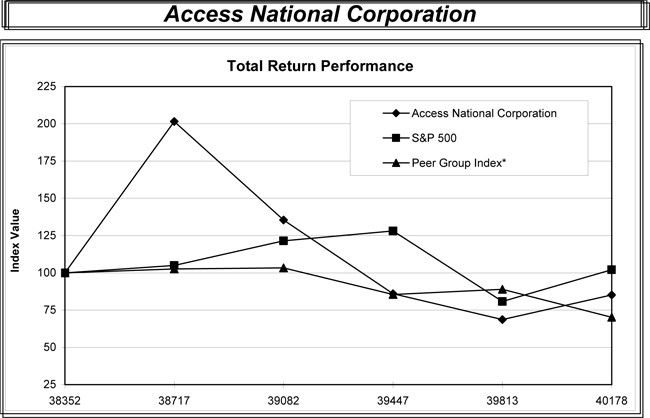
|
Period Ending
|
||||||||||||||||||||||||
|
Index
|
12/31/04
|
12/31/05
|
12/31/06
|
12/31/07
|
12/31/08
|
12/31/09
|
||||||||||||||||||
|
Access
National Corporation
|
100.00 | 201.56 | 135.48 | 86.04 | 68.67 | 85.17 | ||||||||||||||||||
|
S&P
500
|
100.00 | 104.91 | 121.48 | 128.16 | 80.74 | 102.11 | ||||||||||||||||||
|
Peer
Group Index*
|
100.00 | 102.58 | 103.35 | 85.49 | 88.97 | 70.18 | ||||||||||||||||||
*Access
National Corporation's peer group consists of the following: Cardinal Financial
Corporation (CFNL), Eagle Bancorp, Inc. (EGBN), TowneBank (TOWN), Valley
Financial Corporation (VYFC), Virginia National Bank (VABK)
18
ITEM 6 – SELECTED FINANCIAL
DATA
The
following consolidated selected financial data is derived from the Corporation’s
audited financial statements for the five years ended December 31,
2009. This information should be read in conjunction with the
following Management’s Discussion and Analysis of Financial Condition and
Results of Operations and the Consolidated Financial Statements and Notes
thereto.
|
Selected Financial Data
|
||||||||||||||||||||
|
Year Ended December 31,
|
||||||||||||||||||||
|
2009
|
2008
|
2007
|
2006
|
2005
|
||||||||||||||||
|
(In Thousands, Except for Share Data)
|
||||||||||||||||||||
|
Income
Statement Data:
|
||||||||||||||||||||
|
Net
interest income
|
$ | 23,558 | $ | 21,052 | $ | 20,122 | $ | 18,256 | $ | 15,273 | ||||||||||
|
Provision
for loan losses
|
6,064 | 5,423 | 2,588 | 232 | 1,196 | |||||||||||||||
|
Non-interest
income
|
56,966 | 30,813 | 27,707 | 27,633 | 30,956 | |||||||||||||||
|
Non-interest
expense
|
58,971 | 38,998 | 39,949 | 34,212 | 35,830 | |||||||||||||||
|
Income
taxes
|
5,854 | 2,700 | 1,590 | 3,853 | 3,305 | |||||||||||||||
|
Net
income
|
$ | 9,635 | $ | 4,744 | $ | 3,702 | $ | 7,592 | $ | 5,898 | ||||||||||
|
Per
Share Data:
|
||||||||||||||||||||
|
Earnings
per share
|
||||||||||||||||||||
|
Basic
|
$ | 0.93 | $ | 0.46 | $ | 0.32 | $ | 0.81 | $ | 0.75 | ||||||||||
|
Diluted
|
0.92 | 0.46 | 0.31 | 0.72 | 0.63 | |||||||||||||||
|
Cash
dividends paid
|
0.04 | 0.04 | 0.04 | 0.02 | - | |||||||||||||||
|
Book
value at period end
|
6.43 | 5.66 | 5.35 | 5.27 | 3.92 | |||||||||||||||
|
Balance
Sheet Data:
|
||||||||||||||||||||
|
Total
assets
|
$ | 666,879 | $ | 702,324 | $ | 622,376 | $ | 644,782 | $ | 537,050 | ||||||||||
|
Loans
held for sale
|
76,232 | 84,312 | 39,144 | 65,320 | 45,019 | |||||||||||||||
|
Total
loans
|
486,564 | 485,929 | 477,598 | 433,594 | 369,733 | |||||||||||||||
|
Total
securities
|
47,838 | 91,015 | 73,558 | 105,163 | 87,771 | |||||||||||||||
|
Total
deposits
|
466,645 | 485,401 | 473,418 | 438,932 | 419,629 | |||||||||||||||
|
Shareholders'
equity
|
67,778 | 57,945 | 57,961 | 62,295 | 31,185 | |||||||||||||||
|
Average
shares outstanding, basic
|
10,391,348 | 10,298,631 | 11,620,130 | 9,429,074 | 7,867,135 | |||||||||||||||
|
Average
shares outstanding, diluted
|
10,432,857 | 10,423,555 | 11,866,468 | 10,541,873 | 9,423,087 | |||||||||||||||
|
Performance
Ratios:
|
||||||||||||||||||||
|
Return
on average assets
|
1.35 | % | 0.76 | % | 0.57 | % | 1.29 | % | 1.29 | % | ||||||||||
|
Return
on average equity
|
15.04 | % | 8.34 | % | 5.84 | % | 17.15 | % | 20.63 | % | ||||||||||
|
Net
interest margin (1)
|
3.42 | % | 3.48 | % | 3.18 | % | 3.21 | % | 3.49 | % | ||||||||||
|
Efficiency
Ratios:
|
||||||||||||||||||||
|
Access
National Bank
|
60.41 | % | 55.36 | % | 50.87 | % | 48.67 | % | 52.21 | % | ||||||||||
|
Access
National Mortgage Corp.
|
77.40 | % | 86.65 | % | 107.52 | % | 92.42 | % | 89.13 | % | ||||||||||
|
Access
National Corporation
|
73.23 | % | 75.19 | % | 83.52 | % | 75.06 | % | 80.09 | % | ||||||||||
|
Asset
Quality Ratios:
|
||||||||||||||||||||
|
Allowance
to period end loans
|
1.88 | % | 1.54 | % | 1.56 | % | 1.26 | % | 1.41 | % | ||||||||||
|
Allowance
to non-performing loans
|
129.79 | % | 259.55 | % | 449.25 | % | 1514.60 | % | 397.78 | % | ||||||||||
|
Net
charge-offs to average loans
|
1.08 | % | 1.06 | % | 0.12 | % | - | - | ||||||||||||
|
(1)
Net interest income divided by total average earning
assets.
|
||||||||||||||||||||
Table
continued on next page
19
ITEM 6 – SELECTED FINANCIAL
DATA continued
|
Year
Ended December 31,
|
||||||||||||||||||||
|
2009
|
2008
|
2007
|
2006
|
2005
|
||||||||||||||||
|
(In
Thousands, Except for Share Data)
|
||||||||||||||||||||
|
Average
Balance Sheet Data:
|
||||||||||||||||||||
|
Total
assets
|
$ | 714,970 | $ | 624,450 | $ | 649,584 | $ | 589,834 | $ | 457,251 | ||||||||||
|
Securities
|
69,758 | 68,861 | 94,331 | 107,165 | 64,862 | |||||||||||||||
|
Loans
held for sale
|
65,780 | 25,757 | 49,750 | 53,935 | 45,688 | |||||||||||||||
|
Loans
|
490,393 | 484,764 | 472,372 | 400,211 | 318,438 | |||||||||||||||
|
Allowance
for loan losses
|
8,065 | 8,248 | 6,170 | 5,363 | 4,433 | |||||||||||||||
|
Total
deposits
|
519,477 | 450,873 | 444,999 | 423,788 | 337,403 | |||||||||||||||
|
Junior
subordinated debentures
|
6,186 | 6,186 | 9,237 | 10,311 | 10,311 | |||||||||||||||
|
Total
shareholders' equity
|
64,054 | 56,882 | 63,343 | 44,270 | 28,586 | |||||||||||||||
|
Capital
Ratios:
|
||||||||||||||||||||
|
Tier
1 risk-based capital
|
13.47 | % | 11.86 | % | 12.41 | % | 15.01 | % | 10.78 | % | ||||||||||
|
Total
risk-based capital
|
14.73 | % | 13.11 | % | 13.66 | % | 16.18 | % | 12.11 | % | ||||||||||
|
Leverage
capital ratio
|
10.73 | % | 9.71 | % | 10.07 | % | 11.53 | % | 7.60 | % | ||||||||||
ITEM 7 - MANAGEMENT’S
DISCUSSION AND ANALYSIS OF FINANCIAL CONDITION AND RESULTS OF
OPERATIONS
The
following discussion and analysis is intended to provide an overview of the
significant factors affecting the financial condition and the results of
operations of the Corporation and its subsidiaries for the years ended December
31, 2009 and 2008. The consolidated financial statements and accompanying notes
should be read in conjunction with this discussion and analysis.
Forward-Looking
Statements
In
addition to historical information, this Annual Report on Form 10-K may contain
forward-looking statements. For this purpose, any statements
contained herein, including documents incorporated by reference, that are not
statements of historical fact may be deemed to be forward-looking
statements. Examples of forward-looking statements include
discussions as to our expectations, beliefs, plans, goals, objectives and future
financial or other performance or assumptions concerning matters discussed in
this document. Forward-looking statements often use words such as
“believes,” “expects,” “plans,” “may,” “will,” “should,” “projects,”
“contemplates,” “anticipates,” “forecasts,” “intends” or other words of similar
meaning. You can also identify them by the fact that they do not
relate strictly to historical or current facts. Forward-looking statements are
subject to numerous assumptions, risks and uncertainties, and actual results
could differ materially from historical results or those anticipated by such
statements. Factors that could have a material adverse effect on the
operations and future prospects of the Corporation include, but are not limited
to, changes in: continued deterioration in general business and economic
conditions and in the financial markets and the impact of any policies or
programs implemented pursuant to the EESA, branch expansion plans, interest
rates, general economic conditions, monetary and fiscal policies of the U.S.
Government, including policies of the Comptroller, U.S. Treasury and the FRB,
the economy of Northern Virginia, including governmental spending and real
estate markets, the quality or composition of the loan or investment portfolios,
demand for loan products, deposit flows, competition, and accounting principles,
policies and guidelines. These risks and uncertainties should be
considered in evaluating the forward-looking statements contained herein, and
readers are cautioned not to place undue reliance on such
statements. Any forward-looking statement speaks only as of the date
on which it is made, and we undertake no obligation to update any
forward-looking statement to reflect events or circumstances after the date on
which it is made. For additional discussion of risk factors that may
cause our actual future results to differ materially from the results indicated
within forward looking statements, please see “Item 1A – Risk Factors”
herein.
CRITICAL ACCOUNTING
POLICIES
The
Corporation’s consolidated financial statements have been prepared in accordance
with accounting principles generally accepted in the United States. In preparing
the Corporation’s financial statements management makes estimates and judgments
that affect the reported amounts of assets, liabilities, revenues, and
expenses. Our
significant accounting policies are presented in Note 1 to the consolidated
financial statements.
Management believes that the most significant subjective judgments that it makes
include the following:
20
Allowance for Loan
Losses
The
allowance for loan losses is an estimate of the losses that may be sustained in
our loan portfolio. The allowance is based on two basic principals of
accounting: (i) Accounting Standards Codification (“ASC”) No. 450-10
Contingencies, which requires that losses be accrued when they are probable of
occurring and estimatable and (ii) ASC 310-10, Receivables, which requires that
losses be accrued based on the differences between the value of collateral,
present value of future cash flows or values that are observable in the
secondary market and the loan balance.
An
allowance for loan losses is established through a provision for loan losses
based upon industry standards, known risk characteristics, and management’s
evaluation of the risk inherent in the loan portfolio and changes in the nature
and volume of loan activity. Such evaluation considers among other
factors, the estimated market value of the underlying collateral, and current
economic conditions. For further information about our practices with
respect to allowance for loan losses, please see the subsection “Allowance for
Loan Losses” below.
Other Than Temporary
Impairment of Investment Securities
The
Bank’s investment portfolio is classified as available-for-sale. The
estimated fair value of the portfolio fluctuates due to changes in market
interest rates and other factors. Changes in estimated fair value are recorded
in stockholders’ equity as a component of comprehensive income. Securities are
monitored to determine whether a decline in their value is
other-than-temporary. Management evaluates the investment portfolio
on a quarterly basis to determine the collectability of amounts due per the
contractual terms of the investment security. Once a decline in value
is determined to be other than temporary, the value of the security is reduced
and a corresponding charge to earnings is recognized. At December 31,
2009 there were no securities in the securities portfolio with other than
temporary impairment.
Income
Taxes
The
Corporation uses the liability method of accounting for income taxes. This
method results in the recognition of deferred tax assets and liabilities that
are reflected at currently enacted income tax rates applicable to the period in
which the deferred tax assets or liabilities are expected to be realized or
settled. As changes in tax laws or rates are enacted, deferred tax assets and
liabilities are adjusted through the provision for income taxes. The deferred
provision for income taxes is the result of the net change in the deferred tax
asset and deferred tax liability balances during the year. This amount combined
with the current taxes payable or refundable results in the income tax expense
for the current year. Our evaluation of the deductibility or
taxability of items included in the Corporation’s tax returns has not resulted
in the identification of any material, uncertain tax positions.
Fair
Value
Fair
values of financial instruments are estimated using relevant market information
and other assumptions. Fair value estimates involve uncertainties and matters of
significant judgment regarding interest rates, credit risk, prepayments and
other factors, especially in the absence of broad markets for particular
items. Changes in assumptions or in market conditions could
significantly affect the estimates. The fair value estimates of
existing on and off balance sheet financial instruments do not include the value
of anticipated future business or the values of assets and liabilities not
considered financial instruments. For additional information about our financial
assets carried at fair value, refer to Note 18 to the
consolidated financial statements.
FINANCIAL
CONDITION
Summary
The
Corporation completed its tenth year of operation and recorded net income of
$9.6 million. Total assets at December 31, 2009 were $666.9 million compared to
$702.3 million in 2008. The decrease in total assets is primarily due
to a $43.2 million reduction in investment securities and an $8.1 million
decrease in loans held for sale. Interest bearing deposits in other
banks increased $11.6 million and other assets increased $8.6
million.
The
following discussions by major categories explain the changes in financial
condition.
Cash and Due From
Banks
Cash and
due from banks represents cash and non-interest bearing balances at other banks
and cash letters in process of collection at the FRB. At December 31,
2009 cash and due from banks totaled approximately $6.0 million compared to $8.8
million at December 31, 2008. The balance fluctuates depending on the
volume of cash letters in process of collection at the FRB.
21
Interest Bearing Deposits in
Other Banks and Federal Funds Sold
At
December 31, 2009 interest bearing balances in other banks totaled $25.3 million
compared to $13.7 million at December 31, 2008. These balances are
maintained at the FRB and the FHLB of Atlanta and provide liquidity for managing
daily cash inflows and outflows from deposits and loans.
Investment
Securities
The
Corporation’s securities portfolio is comprised of U.S. Treasury securities,
U.S. Government Agency securities, municipal securities, CRA mutual fund,
mortgage backed securities issued by U.S. government sponsored agencies and FRB
and FHLB stock. The investment portfolio is used to provide
liquidity and as a tool for managing interest sensitivity in the balance sheet,
while generating income. At December 31, 2009 the estimated fair
value of the securities portfolio totaled $47.8 million, down from $91.0 million
in 2008. The decrease is due to maturing and called securities that
were not reinvested. All securities were classified as
available for sale. The Financial Accounting Standards Board (“FASB”) requires
that securities classified as available for sale be accounted for at fair market
value. Unrealized gains and losses are recorded directly to a
separate component of stockholders' equity.
The
following tables present the types, amounts and maturity distribution of the
securities portfolio.
|
Investment
Securities Available for Sale
|
||||||||||||
|
December
31,
|
||||||||||||
|
2009
|
2008
|
2007
|
||||||||||
|
(In
Thousands)
|
||||||||||||
|
Investment
Securities Available for Sale:
|
||||||||||||
|
US
Treasury
|
$ | - | $ | 1,006 | $ | 1,013 | ||||||
|
US
Government agency
|
40,154 | 76,354 | 61,720 | |||||||||
|
Mortgage
backed
|
743 | 1,391 | 799 | |||||||||
|
Tax
exempt municipals
|
- | - | 2,891 | |||||||||
|
Taxable
municipals
|
699 | 4,920 | 1,099 | |||||||||
|
CRA
Mutual fund
|
1,499 | 1,448 | 1,479 | |||||||||
|
Restricted
stock
|
4,743 | 5,896 | 4,557 | |||||||||
|
Total
securities
|
$ | 47,838 | $ | 91,015 | $ | 73,558 | ||||||
|
Maturity Schedule of Investment Securities Available for Sale 2009
|
||||||||||||||||||||||||||||||||||||||||
|
After One Year
|
After Five Years
|
After Ten Years
|
||||||||||||||||||||||||||||||||||||||
|
Within
|
But Within
|
But Within
|
and
|
|||||||||||||||||||||||||||||||||||||
|
One Year
|
Five Years
|
Ten Years
|
Over
|
Total
|
||||||||||||||||||||||||||||||||||||
|
Amount
|
Yield
|
Amount
|
Yield
|
Amount
|
Yield
|
Amount
|
Yield
|
Amount
|
Yield
|
|||||||||||||||||||||||||||||||
|
(Dollars
In Thousands)
|
||||||||||||||||||||||||||||||||||||||||
|
Investment Securities
Available for Sale: (1)
|
||||||||||||||||||||||||||||||||||||||||
|
US
Treasury
|
$ | - | - | $ | - | - | $ | - | - | $ | - | - | $ | - | - | |||||||||||||||||||||||||
|
US
Government agency
|
5,145 | 1.00 | % | 15,023 | 1.58 | % | 19,986 | 4.73 | % | - | - | 40,154 | 3.07 | % | ||||||||||||||||||||||||||
|
Mortgage
backed
|
33 | 5.00 | % | - | - | - | - | 710 | 6.02 | % | 743 | 5.98 | % | |||||||||||||||||||||||||||
|
Tax
exempt municipals
|
- | - | - | - | - | - | - | - | - | - | ||||||||||||||||||||||||||||||
|
Taxable
municipals
|
- | - | 699 | 4.30 | % | - | - | - | - | 699 | 4.30 | % | ||||||||||||||||||||||||||||
|
Total
|
$ | 5,178 | 1.03 | % | $ | 15,722 | 1.70 | % | $ | 19,986 | 4.73 | % | $ | 710 | 6.02 | % | $ | 41,596 | 3.14 | % | ||||||||||||||||||||
(1)
Excludes CRA Mutual Fund, FRB Stock and FHLB Stock
Loans
Loans
held for investment totaled $486.6 million at December 31, 2009 compared to
$485.9 million at December 31, 2008. Adverse economic conditions and
stringent loan underwriting standards contributed to the modest increase in
loans. Commercial loans increased $3.1 million in 2009 and
commercial real estate loans increased $1.8 million while residential real
estate loans decreased $2.9 million. The Bank
concentrates on providing banking services to small to medium sized businesses
and professionals in our market area. Commercial real estate loans comprised
45.3% of the loans held for investment portfolio; however we do not have any
exposure to builders or developers. Our loan officers maintain a professional
relationship with our clients and are responsive to their financial
needs. They are directly involved in the community and it is this
involvement and commitment that leads to referrals and continued
growth.
22
Loans
held for sale totaled $76.2 million at December 31, 2009 compared to $84.3
million at December 31, 2008, a decrease of $8.1 million. The
level of loans held for sale fluctuates with the volume of loans originated
during the month and the timing of loans purchased by
investors. Loan origination volume including brokered loans
totaled $1.6 billion in 2009 compared to $853.8 million in 2008, an 83.1%
increase. The increase was due to the low interest rate environment
and refinance activity.
The
following tables present the major classifications and maturity distribution of
loans held for investment at December 31:
|
Composition of Loan Portfolio
|
||||||||||||||||||||||||||||||||||||||||
|
Year Ended December 31,
|
||||||||||||||||||||||||||||||||||||||||
|
2009
|
2008
|
2007
|
2006
|
2005
|
||||||||||||||||||||||||||||||||||||
|
Amount
|
Percentage
of Total
|
Amount
|
Percentage
of Total
|
Amount
|
Percentage
of Total
|
Amount
|
Percentage
of Total
|
Amount
|
Percentage
of Total
|
|||||||||||||||||||||||||||||||
|
(Dollars In Thousands)
|
||||||||||||||||||||||||||||||||||||||||
|
Commercial
|
$ | 72,628 | 14.93 | % | $ | 69,537 | 14.31 | % | $ | 64,860 | 13.58 | % | $ | 51,825 | 11.95 | % | $ | 38,516 | 10.42 | % | ||||||||||||||||||||
|
Commercial
real estate
|
220,301 | 45.28 | 218,539 | 44.97 | 199,894 | 41.85 | 159,996 | 36.90 | 137,423 | 37.17 | ||||||||||||||||||||||||||||||
|
Real
estate construction
|
41,508 | 8.53 | 42,600 | 8.77 | 55,074 | 11.53 | 68,570 | 15.81 | 37,054 | 10.02 | ||||||||||||||||||||||||||||||
|
Residential
real estate
|
150,792 | 30.99 | 153,740 | 31.64 | 156,731 | 32.82 | 152,648 | 35.21 | 156,185 | 42.24 | ||||||||||||||||||||||||||||||
|
Consumer
and other
|
1,335 | 0.27 | 1,513 | 0.31 | 1,039 | 0.22 | 555 | 0.13 | 555 | 0.15 | ||||||||||||||||||||||||||||||
|
Total
loans
|
$ | 486,564 | 100.00 | % | $ | 485,929 | 100.00 | % | $ | 477,598 | 100.00 | % | $ | 433,594 | 100.00 | % | $ | 369,733 | 100.00 | % | ||||||||||||||||||||
|
Loan Maturity Distribution
|
||||||||||||||||||||
|
December 31, 2009
|
||||||||||||||||||||
|
Three Months or
|
Over Three Months
|
Over One Year
|
Over
|
|||||||||||||||||
|
Less
|
Through One Year
|
Through Five Years
|
Five Years
|
Total
|
||||||||||||||||
|
(In Thousands)
|
||||||||||||||||||||
|
Commercial
|
$ | 15,725 | $ | 27,302 | $ | 22,572 | $ | 7,029 | $ | 72,628 | ||||||||||
|
Commercial
real estate
|
26,981 | 36,548 | 141,199 | 15,573 | 220,301 | |||||||||||||||
|
Real
estate construction
|
11,203 | 24,662 | 5,616 | 27 | 41,508 | |||||||||||||||
|
Residential
real estate
|
41,744 | 39,068 | 57,988 | 11,992 | 150,792 | |||||||||||||||
|
Consumer
and other
|
131 | 663 | 540 | - | 1,334 | |||||||||||||||
|
Total
|
$ | 95,784 | $ | 128,243 | $ | 227,915 | $ | 34,621 | $ | 486,563 | ||||||||||
|
Loans
with fixed interest rates
|
$ | 15,471 | $ | 24,799 | $ | 79,545 | $ | 16,277 | $ | 136,092 | ||||||||||
|
Loans
with floating interest rates
|
80,313 | 103,444 | 148,370 | 18,344 | 350,471 | |||||||||||||||
|
Total
|
$ | 95,784 | $ | 128,243 | $ | 227,915 | $ | 34,621 | $ | 486,563 | ||||||||||
Allowance for Loan
Losses
The
allowance for loan loss totaled approximately $9.1 million at December 31, 2009
and $7.5 million in 2008. The allowance for loan losses represents
1.88% of loans held for investment at December 31, 2009 compared to 1.54% in
2008. The provision for loan losses charged to expense was $ 6.1
million in 2009, up from $5.4 million in 2008. The increase in the
provision charged to expense is primarily due to an ongoing detailed analysis of
risk and loss potential within the portfolio. Management believes the
amount of the reserve and the methodology applied to arrive at the amount of the
reserve is justified and appropriate. Outside of our own analysis, our reserve
adequacy and methodology are reviewed on a regular basis by an internal audit
program, and bank regulators and such reviews have not resulted in any material
adjustment to the reserve. The schedule below, Allocation of
the Allowance for Loan Losses, reflects the pro rata allocation by the different
loan types. The methodology as to how the allowance is derived is
discussed below.
The Bank
has developed a comprehensive risk weighting system based on individual loan
characteristics that enables the Bank to allocate the composition of the
allowance for loan losses by types of loans. Adequacy of the
allowance is assessed monthly and increased by provisions charged to expense.
Charge-offs are taken, no less frequently than at the close of each fiscal
quarter. The methodology by which we systematically determine the amount of our
allowance is set forth by the Board of Directors in our Credit Policy, pursuant
to which our Chief Credit Officer is charged with ensuring that each loan is
individually evaluated and the portfolio characteristics are evaluated to arrive
at an appropriate aggregate reserve. The results of the analysis are
documented, reviewed and approved by the Board of Directors no less than
quarterly. The following elements are considered in this
analysis: loss estimates on specific problem credits, individual loan
risk ratings, lending staff changes, loan review and board oversight, loan
policies and procedures, portfolio trends with respect to volume, delinquency,
composition/concentrations of credit, risk rating migration, levels of
classified credit, off-balance sheet credit exposure, any other factors
considered relevant from time to time. All loans are graded or “Risk
Rated” individually for loss potential at the time of origination and as
warranted thereafter, but no less frequently than quarterly. Loss
potential factors are applied based upon a blend of the following
criteria: our own direct experience at this Bank; our collective
management experience in administering similar loan portfolios in the market for
nearly 150 years; and peer data contained in statistical releases issued by both
the Comptroller and the FDIC. Although looking only at peer data and
the Bank’s historically low write-offs would suggest a lower loan loss
allowance, our management’s experience with similar portfolios in the same
market combined with the fact that our portfolio is relatively unseasoned,
justify a conservative approach in contemplating external statistical
resources. Accordingly, management’s collective experience at this
Bank and other banks is the most heavily weighted criterion, and the weighting
is subjective and varies by loan type, amount, collateral, structure, and
repayment terms. Prevailing economic conditions generally and within
each individual borrower’s business sector are considered, as well as any
changes in the borrower’s own financial position and, in the case of commercial
loans, management structure and business operations.
When
deterioration develops in an individual credit, the loan is placed on a “Watch
List” and the loan is monitored more closely. All loans on the watch
list are evaluated for specific loss potential based upon either an evaluation
of the liquidated value of the collateral or cash flow
deficiencies. If management believes that, with respect to a specific
loan, an impaired source of repayment, collateral impairment or a change in a
debtor’s financial condition presents a heightened risk of loss, the loan is
classified as impaired and the book balance of the loan is reduced to collateral
value or present value of cash flows and a specific reserve is established to
further guard against loss upon liquidation.
23
The following
tables present an analysis of the allowance for loan losses for the periods
indicated.
|
Allowance
for Loan Losses
|
||||||||||||||||||||
|
Year
Ended December 31,
|
||||||||||||||||||||
|
2009
|
2008
|
2007
|
2006
|
2005
|
||||||||||||||||
|
(In
Thousands)
|
||||||||||||||||||||
|
Balance,
beginning of year
|
$ | 7,462 | $ | 7,462 | $ | 5,452 | $ | 5,215 | $ | 4,019 | ||||||||||
|
Provision
for loan losses
|
6,064 | 5,423 | 2,588 | 232 | 1,196 | |||||||||||||||
|
Charge-offs:
|
||||||||||||||||||||
|
Commercial
|
1,541 | 184 | - | - | - | |||||||||||||||
|
Commercial
real estate
|
1,648 | 4,038 | - | - | - | |||||||||||||||
|
Real
estate construction
|
1,247 | 241 | - | - | - | |||||||||||||||
|
Residential
real estate
|
851 | 1,055 | 580 | - | - | |||||||||||||||
|
Consumer
and other
|
23 | 42 | - | - | - | |||||||||||||||
|
Total
charge-offs
|
5,310 | 5,560 | 580 | - | - | |||||||||||||||
|
Recoveries:
|
||||||||||||||||||||
|
Commercial
|
374 | - | - | - | - | |||||||||||||||
|
Commercial
real estate
|
294 | - | - | - | - | |||||||||||||||
|
Real
estate construction
|
66 | - | - | - | - | |||||||||||||||
|
Residential
real estate
|
79 | 137 | - | - | - | |||||||||||||||
|
Consumer
and other
|
98 | - | 2 | 5 | - | |||||||||||||||
|
Total
recoveries
|
911 | 137 | 2 | 5 | - | |||||||||||||||
|
Net
charge-offs
|
(4,399 | ) | (5,423 | ) | (578 | ) | 5 | - | ||||||||||||
|
Balance,
end of year
|
$ | 9,127 | $ | 7,462 | $ | 7,462 | $ | 5,452 | $ | 5,215 | ||||||||||
|
Allocation of the Allowance for Loan Losses
|
||||||||||||||||||||||||||||||||||||||||
|
Year Ended December 31,
|
||||||||||||||||||||||||||||||||||||||||
|
2009
|
Percentage
of total
|
2008
|
Percentage
of total
|
2007
|
Percentage
of total
|
2006
|
Percentage
of total
|
2005
|
Percentage
of total
|
|||||||||||||||||||||||||||||||
|
(Dollars In Thousands)
|
||||||||||||||||||||||||||||||||||||||||
|
Commercial
|
$ | 1,589 | 17.41 | % | $ | 1,816 | 24.34 | % | $ | 1,341 | 17.97 | % | $ | 802 | 14.71 | % | $ | 1,546 | 29.64 | % | ||||||||||||||||||||
|
Commercial
real estate
|
4,285 | 46.95 | 2,948 | 39.51 | 3,487 | 46.73 | 2,296 | 42.11 | 1,896 | 36.36 | ||||||||||||||||||||||||||||||
|
Real
estate construction
|
549 | 6.02 | 805 | 10.79 | 929 | 12.45 | 1,055 | 19.35 | 499 | 9.58 | ||||||||||||||||||||||||||||||
|
Residential
real estate
|
2,690 | 29.47 | 1,880 | 25.19 | 1,695 | 22.72 | 1,293 | 23.72 | 1,267 | 24.30 | ||||||||||||||||||||||||||||||
|
Consumer
and other
|
14 | 0.15 | 13 | 0.17 | 10 | 0.13 | 6 | 0.11 | 6 | 0.12 | ||||||||||||||||||||||||||||||
|
Total
|
$ | 9,127 | 100.00 | % | $ | 7,462 | 100.00 | % | $ | 7,462 | 100.00 | % | $ | 5,452 | 100.00 | % | $ | 5,215 | 100.00 | % | ||||||||||||||||||||
24
Non-performing Assets And
Loans Past Due
The
following table presents information with respect to non-performing assets and
90 day delinquencies for the years indicated.
|
Non-performing
Assets and Accruing Loans Past Due 90 Days or More
|
||||||||||||||||||||
|
December
31,
|
||||||||||||||||||||
|
2009
|
2008
|
2007
|
2006
|
2005
|
||||||||||||||||
|
(Dollars
In Thousands)
|
||||||||||||||||||||
|
Non-accrual
loans:
|
||||||||||||||||||||
|
Commercial
|
$ | 208 | $ | 74 | $ | 187 | $ | - | $ | 1,311 | ||||||||||
|
Commercial
real estate
|
3,631 | 22 | - | - | - | |||||||||||||||
|
Real
estate construction
|
1,689 | 2,678 | - | - | - | |||||||||||||||
|
Residential
real estate
|
1,504 | - | 1,474 | 360 | - | |||||||||||||||
|
Consumer
and other
|
- | 101 | - | - | - | |||||||||||||||
|
Total
non-accrual loans
|
7,032 | 2,875 | 1,661 | 360 | 1,311 | |||||||||||||||
|
Restructured
loans
|
- | - | - | - | - | |||||||||||||||
|
Other
real estate owned ("OREO")
|
5,111 | 4,455 | 1,041 | - | - | |||||||||||||||
|
Total
non-performing assets
|
$ | 12,143 | $ | 7,330 | $ | 2,702 | $ | 360 | $ | 1,311 | ||||||||||
|
Ratio
of non-performing assets to:
|
||||||||||||||||||||
|
Total
loans plus OREO
|
2.47 | % | 1.49 | % | 0.56 | % | 0.08 | % | 0.35 | % | ||||||||||
|
Total
assets
|
1.82 | 1.04 | 0.43 | 0.06 | 0.24 | |||||||||||||||
|
Accruing
past due loans:
|
||||||||||||||||||||
|
90
or more days past due
|
$ | - | $ | - | $ | - | $ | 914 | $ | - | ||||||||||
Non-accrual
loans totaled $7.0 million at December 31, 2009 to ten borrowers. The
loans are carried at the current net realizable value after consideration of
$362.3 thousand in specific reserves.
The
accrual of interest is discontinued at the time a loan is 90 days delinquent
unless the credit is well-secured and in process of collection. When a loan is
placed on non-accrual, unpaid interest is reversed against interest
income. Subsequent receipts on non-accrual loans are recorded as a
reduction to the principal balance. Interest income is recorded only after
principal recovery is reasonably assured.
The loss
potential for each loan has been evaluated and in management’s opinion the risk
of loss is adequately reserved against. Management actively works
with the borrowers to maximize the potential for repayment and reports on the
status to the Board of Directors monthly.
At
December 31, 2009, OREO was composed of one single family property located in
suburban Maryland carried at a value of $400 thousand, one industrial property
located in Winchester, Virginia carried at a value of $600 thousand, one office
building located in Prince William County, Virginia carried at a value of $1.9
million, and two contiguous office buildings located in Baltimore, Maryland
carried at a value of $2.2 million. All of the properties are being
actively marketed in an effort to liquidate these assets.
Deposits
Deposits
totaled $466.6 million at December 31, 2009 and were comprised of
non-interest bearing demand deposits in the amount of $69.8 million, savings and
interest-bearing deposits in the amount of $139.0 million and time deposits in
the amount of $257.9 million. Total deposits decreased approximately
$18.8 million from December 31, 2008. Non-interest bearing deposits
decreased $5.2 million from $75.0 million at December 31, 2008 to $69.8 million
at December 31, 2009. This decrease is due to balance fluctuations in
existing commercial accounts. Savings and interest bearing deposit
accounts increased $43.3 million from $95.7 million at December 31, 2008 to
$139.0 million at December 31, 2009. Interest bearing demand deposits
increased $16.1 million and money market and savings increased $27.8 million as
a result of new accounts. Time deposits decreased $56.8 million and
totaled $257.9 million at December 31, 2009 compared to $314.7 million in
2008. The decrease in time deposits occurred as a result of lower
rates being offered to rate sensitive customers.
25
We use
wholesale funding or brokered deposits to supplement deposits and to help
maintain our desired interest rate risk position. Together with FHLB borrowings
we use brokered deposits to fund the short term cash needs associated with the
LHFS activities discussed under “Loans” as well as other funding needs. Brokered
deposits included totaled $171.2 million and $189.1 million at December 31, 2009
and 2008 respectively.
We
participate in the Certificate of Deposit Account Registry Service (“CDARS”).
Through CDARS our depositors are able to obtain FDIC
insurance of up to $50.0 million. The FDIC currently includes CDARS
deposits with brokered deposits even though the deposits originate from our
customers. These deposits are placed at other participating financial
institutions to obtain FDIC insurance and we receive a reciprocal amount in
return from these financial institutions. Brokered deposits include $41.6
million and $61.4 million at December 31, 2009 and 2008 respectively, in
reciprocal CDARS deposits.
The daily
average balances and weighted average rates paid on deposits for each of the
years ended December 31, 2009, 2008 and 2007 are presented below.
|
Average Deposits and Average Rates Paid
|
||||||||||||||||||||||||||||||||||||
|
Year Ended December 31,
|
||||||||||||||||||||||||||||||||||||
|
2009
|
2008
|
2007
|
||||||||||||||||||||||||||||||||||
|
Average
|
Income /
|
Yield /
|
Average
|
Income /
|
Yield /
|
Average
|
Income /
|
Yield /
|
||||||||||||||||||||||||||||
|
Balance
|
Expense
|
Rate
|
Balance
|
Expense
|
Rate
|
Balance
|
Expense
|
Rate
|
||||||||||||||||||||||||||||
|
(Dollars In Thousands)
|
||||||||||||||||||||||||||||||||||||
|
Interest
bearing demand deposits
|
$ | 27,224 | $ | 278 | 1.02 | % | $ | 8,956 | $ | 100 | 1.12 | % | $ | 9,507 | $ | 199 | 2.09 | % | ||||||||||||||||||
|
Money
market deposit accounts
|
92,682 | 1,403 | 1.51 | % | 112,391 | 2,653 | 2.36 | % | 111,344 | 4,888 | 4.39 | % | ||||||||||||||||||||||||
|
Savings
accounts
|
4,470 | 60 | 1.34 | % | 3,137 | 101 | 3.22 | % | 4,989 | 231 | 4.63 | % | ||||||||||||||||||||||||
|
Time
deposits
|
316,823 | 8,827 | 2.79 | % | 263,175 | 11,197 | 4.25 | % | 256,805 | 12,808 | 4.99 | % | ||||||||||||||||||||||||
|
Total
interest bearing deposits
|
441,199 | 10,568 | 2.40 | % | 387,659 | 14,051 | 3.62 | % | 382,645 | 18,126 | 4.74 | % | ||||||||||||||||||||||||
|
Non-interest
bearing demand deposits
|
78,278 | 63,214 | 62,354 | |||||||||||||||||||||||||||||||||
|
Total
deposits
|
$ | 519,477 | $ | 450,873 | $ | 444,999 | ||||||||||||||||||||||||||||||
The table
below presents the maturity distribution of time deposits at December 31,
2009.
|
Certificate of Deposit Maturity Distribution
|
||||||||||||||||
|
December 31, 2009
|
||||||||||||||||
|
Three months
|
Over three
|
Over
|
||||||||||||||
|
or less
|
through twelve months
|
twelve months
|
Total
|
|||||||||||||
|
(In Thousands)
|
||||||||||||||||
|
Less
than $100,000
|
$ | 39,044 | $ | 32,786 | $ | 23,148 | $ | 94,978 | ||||||||
|
Greater
than or equal to $100,000
|
82,430 | 36,687 | 43,780 | 162,897 | ||||||||||||
| $ | 121,474 | $ | 69,473 | $ | 66,928 | $ | 257,875 | |||||||||
Borrowings
Borrowed
funds consist of advances from the FHLB, senior unsecured term note,
subordinated debentures (trust preferred), securities sold under agreement to
repurchase, U.S. Treasury demand notes, federal funds purchased and commercial
paper. At December 31, 2009 borrowed funds totaled $116.8 million, compared to
$150.9 million at December 31, 2008. Short-term borrowings
decreased from $103.6 million at December 31, 2008 to $64.2 million at December
31, 2009. The decrease in short term borrowings was funded by a
reduction in loans held for sale and investment securities.
26
The
following table provides a break down of all borrowed funds.
|
Borrowed
Funds Distribution
|
||||||||||||
|
Year
Ended December 31,
|
||||||||||||
|
2009
|
2008
|
2007
|
||||||||||
|
(Dollars
In Thousands)
|
||||||||||||
|
At
Period End
|
||||||||||||
|
FHLB
advances
|
$ | 20,179 | $ | 44,333 | $ | 15,500 | ||||||
|
Securities
sold under agreements to repurchase
|
26,804 | 21,395 | 14,814 | |||||||||
|
Commercial
paper
|
16,517 | 26,136 | 9,454 | |||||||||
|
U.S.
Treasury demand note
|
750 | 1,718 | 1,907 | |||||||||
|
FHLB
long term borrowings
|
16,333 | 41,107 | 39,524 | |||||||||
|
Senior
unsecured term note
|
29,997 | - | - | |||||||||
|
Subordinated
debentures
|
6,186 | 6,186 | 6,186 | |||||||||
|
Federal
funds purchased
|
- | 9,993 | - | |||||||||
|
Total
at period end
|
$ | 116,766 | $ | 150,868 | $ | 87,385 | ||||||
|
Average
Balances
|
||||||||||||
|
FHLB
advances
|
$ | 23,676 | $ | 13,524 | $ | 60,224 | ||||||
|
Securities
sold under agreements to repurchase
|
23,283 | 16,269 | 11,695 | |||||||||
|
Commercial
paper
|
16,934 | 19,836 | 15,679 | |||||||||
|
U.S.
Treasury demand note
|
706 | 861 | 234 | |||||||||
|
FHLB
long term borrowings
|
24,026 | 54,173 | 41,932 | |||||||||
|
Senior
unsecured term note
|
26,627 | - | - | |||||||||
|
Subordinated
debentures
|
6,186 | 6,186 | 9,237 | |||||||||
|
Federal
funds purchased
|
177 | 164 | 716 | |||||||||
|
Total
average balance
|
$ | 121,615 | $ | 111,013 | $ | 139,717 | ||||||
|
Average
rate paid on all borrowed funds
|
2.80 | % | 3.32 | % | 5.14 | % | ||||||
Shareholders’
Equity
Shareholders’
equity totaled $67.8 million at December 31, 2009, compared to $57.9 million at
December 31, 2008. Changes in shareholders’ equity during 2009 include earnings
of $9.6 million, $1.4 million from proceeds of stock options exercised and
dividend reinvestment, stock based compensation of $0.2 million less shares
repurchased of $0.2 million, cash dividends paid of $0.4 million, and other
comprehensive loss of $0.7 million.
Banking
regulators have defined minimum regulatory capital ratios that the Corporation
and the Bank are required to maintain. These risk based capital
guidelines take into consideration risk factors, as defined by the banking
regulators, associated with various categories of assets, both on and off the
balance sheet. Both the Corporation and Bank are classified as well
capitalized, which is the highest rating.
27
The table
below presents an analysis of risk based capital and outlines the regulatory
components of capital and risk based capital ratios.
|
Risk
Based Capital Analysis
|
||||||||||||
|
Year
Ended December 31,
|
||||||||||||
|
2009
|
2008
|
2007
|
||||||||||
|
(Dollars
In Thousands)
|
||||||||||||
|
Tier
1 Capital:
|
||||||||||||
|
Common
stock
|
$ | 8,799 | $ | 8,551 | $ | 9,052 | ||||||
|
Capital
surplus
|
18,552 | 17,411 | 21,833 | |||||||||
|
Retained
earnings
|
40,376 | 31,123 | 26,832 | |||||||||
|
Subordinated
debt (trust preferred debenture)
|
6,000 | 6,000 | 6,000 | |||||||||
|
Less:
Disallowed servicing assets
|
(123 | ) | - | - | ||||||||
|
Total
Tier 1 Capital
|
73,604 | 63,085 | 63,717 | |||||||||
|
Subordinated
debt not included in Tier 1
|
- | - | - | |||||||||
|
Allowance
for loan losses
|
6,861 | 6,662 | 6,585 | |||||||||
|
Total
Risk Based Capital
|
$ | 80,465 | $ | 69,747 | $ | 70,302 | ||||||
|
Risk
weighted assets
|
$ | 546,288 | $ | 532,195 | $ | 525,676 | ||||||
|
Quarterly
average assets
|
$ | 685,754 | $ | 649,817 | $ | 632,752 | ||||||
|
Capital
Ratios:
|
||||||||||||
|
Tier
1 risk based capital ratio
|
13.47 | % | 11.86 | % | 12.12 | % | ||||||
|
Total
risk based capital ratio
|
14.73 | % | 13.11 | % | 13.37 | % | ||||||
|
Leverage
ratio
|
10.73 | % | 9.71 | % | 10.07 | % | ||||||
RESULTS OF
OPERATIONS
Net
income for 2009 totaled $9.6 million, or $.92 per diluted common share compared
to $4.7 million or $.46 per diluted common share in 2008. Earnings in
2009 were favorably impacted by gains on the sale of mortgage loans that
contributed $49.3 million in pre-tax gains, up from $24.9 million in
2008. During 2009 the economy continued to impact commercial clients
and collateral values resulting in a provision for loan losses of $6.1 million,
up from $5.4 million in 2008. Interest and dividend income totaled $37.5
million, down from $38.8 million in 2008 as increases in the volume of earning
assets did not offset the decrease in yields. Net interest income
improved from $21.1 million in 2008 to $23.6 million in 2009 due to lower rates
on deposits and borrowings.
Net
income in 2008 and totaled $4.7 million, or $.46 per diluted common share
compared to $3.7 million or $.31 per diluted common share in
2007. Earnings in 2008 were directly impacted by a $5.4 million
provision for loan losses, up from $2.6 million in 2007 as a result of
non-performing loans being charged off or otherwise written
down. Interest and dividend income decreased $6.6 million from $45.4
million in 2007 to $38.8 million in 2008. The decrease in interest
income was largely due to lower yields on loans as a result of the prime rate
decreasing from 7.25% at the beginning of the year and ending the year at
3.25%.
Net Interest
Income
Net
interest income is the amount of income generated by earning assets (primarily
loans and investment securities) less the interest expense incurred on interest
bearing liabilities (primarily deposits) used to fund earning assets. Net
interest income and margin are influenced by many factors, primarily the volume
and mix of earning assets, funding sources and interest rate fluctuations.
Net interest income on a taxable equivalent basis totaled $23.6 million in 2009,
up from $21.1 million in 2008. Average earning assets increased $83.2
million from $606.0 million in 2008 to $689.2 million in
2009. Average interest bearing deposits and liabilities increased
$64.1 million in 2009. Net interest margin decreased 6 basis points
from 3.48% in 2008 to 3.42% in 2009. The weighted average yield on
earning assets decreased 95 basis points while the weighted average rate paid on
interest bearing liabilities decreased 108 basis points.
In 2008,
net interest income on a fully taxable equivalent basis increased from $20.2
million in 2007 to $21.1 million in 2008. Net interest income depends
upon the volume of earning assets and interest bearing liabilities and the
associated yields and rates. Fluctuation in interest rates impacts the volume,
mix and yield of average earning assets. The target federal funds rate, the rate
that dictates national prime rate and determines many other short-term loan and
liability rates, was 4.25% at December 31, 2007 and declined during 2008 as
the economy deteriorated and reached an effective rate of 0% at
December 31, 2008. During 2008 we lowered rates on all deposit
accounts and reduced average borrowings by $28.7 million. Interest sensitive
time deposits were replaced with wholesale funds at lower
rates.
28
The table
below, Yield on Average Earning Assets and Rates on Average Interest Bearing
Liabilities, summarizes the major components of net interest income for the past
three years and also provides yields, rates and average balances.
|
Yield
on Average Earning Assets and Rates on Average Interest-Bearing
Liabilities*
|
||||||||||||||||||||||||||||||||||||
|
Year
Ended December 31,
|
||||||||||||||||||||||||||||||||||||
|
2009
|
2008
|
2007
|
||||||||||||||||||||||||||||||||||
|
Average
|
Income
/
|
Yield
/
|
Average
|
Income
/
|
Yield
/
|
Average
|
Income
/
|
Yield
/
|
||||||||||||||||||||||||||||
|
Balance
|
Expense
|
Rate
|
Balance
|
Expense
|
Rate
|
Balance
|
Expense
|
Rate
|
||||||||||||||||||||||||||||
|
(Dollars
In Thousands)
|
||||||||||||||||||||||||||||||||||||
|
Assets:
|
||||||||||||||||||||||||||||||||||||
|
Interest
earning assets:
|
||||||||||||||||||||||||||||||||||||
|
Securities
|
$ | 68,852 | $ | 3,038 | 4.41 | % | $ | 68,522 | $ | 3,440 | 5.02 | % | $ | 94,331 | $ | 4,324 | 4.58 | % | ||||||||||||||||||
|
Loans(3)
|
556,173 | 34,334 | 6.17 | % | 510,521 | 34,875 | 6.83 | % | 522,122 | 40,303 | 7.72 | % | ||||||||||||||||||||||||
|
Interest
bearing deposits and federal funds sold
|
64,128 | 154 | 0.24 | % | 26,911 | 487 | 1.81 | % | 17,474 | 846 | 4.84 | % | ||||||||||||||||||||||||
|
Total
interest earning assets
|
689,153 | 37,526 | 5.45 | % | 605,954 | 38,802 | 6.40 | % | 633,927 | 45,473 | 7.17 | % | ||||||||||||||||||||||||
|
Non-interest
earning assets:
|
||||||||||||||||||||||||||||||||||||
|
Cash
and due from banks
|
6,748 | 5,257 | 6,784 | |||||||||||||||||||||||||||||||||
|
Premises,
land and equipment
|
8,991 | 9,475 | 9,710 | |||||||||||||||||||||||||||||||||
|
Other
assets
|
18,143 | 12,012 | 5,333 | |||||||||||||||||||||||||||||||||
|
Less:
allowance for loan losses
|
(8,065 | ) | (8,248 | ) | (6,170 | ) | ||||||||||||||||||||||||||||||
|
Total
non-interest earning assets
|
25,817 | 18,496 | 15,657 | |||||||||||||||||||||||||||||||||
|
Total
Assets
|
$ | 714,970 | $ | 624,450 | $ | 649,584 | ||||||||||||||||||||||||||||||
|
Liabilities
and Shareholders' Equity:
|
||||||||||||||||||||||||||||||||||||
|
Interest
bearing liabilities:
|
||||||||||||||||||||||||||||||||||||
|
Interest
bearing demand deposits
|
$ | 27,224 | $ | 278 | 1.02 | % | $ | 8,956 | $ | 100 | 1.12 | % | $ | 9,507 | $ | 199 | 2.09 | % | ||||||||||||||||||
|
Money
market deposit accounts
|
92,682 | 1,403 | 1.51 | % | 112,391 | 2,653 | 2.36 | % | 111,344 | 4,888 | 4.39 | % | ||||||||||||||||||||||||
|
Savings
accounts
|
4,470 | 60 | 1.34 | % | 3,137 | 101 | 3.22 | % | 4,989 | 231 | 4.63 | % | ||||||||||||||||||||||||
|
Time
deposits
|
316,823 | 8,827 | 2.79 | % | 263,175 | 11,197 | 4.25 | % | 256,805 | 12,808 | 4.99 | % | ||||||||||||||||||||||||
|
Total
interest bearing deposits
|
441,199 | 10,568 | 2.40 | % | 387,659 | 14,051 | 3.62 | % | 382,645 | 18,126 | 4.74 | % | ||||||||||||||||||||||||
|
FHLB
Advances
|
23,676 | 979 | 4.13 | % | 13,524 | 454 | 3.36 | % | 60,224 | 3,197 | 5.31 | % | ||||||||||||||||||||||||
|
Securities
sold under agreements to repurchase and federal funds
purchased
|
23,460 | 115 | 0.49 | % | 16,433 | 260 | 1.58 | % | 12,410 | 516 | 4.16 | % | ||||||||||||||||||||||||
|
Other
short-term borrowings
|
17,640 | 167 | 0.95 | % | 20,697 | 363 | 1.75 | % | 15,913 | 641 | 4.03 | % | ||||||||||||||||||||||||
|
Long-term
borrowings
|
50,653 | 1,901 | 3.75 | % | 54,173 | 2,195 | 4.05 | % | 41,932 | 2,018 | 4.81 | % | ||||||||||||||||||||||||
|
Subordinated
debentures
|
6,186 | 238 | 3.85 | % | 6,186 | 417 | 6.74 | % | 9,237 | 806 | 8.73 | % | ||||||||||||||||||||||||
|
Total
interest bearing liabilities
|
562,814 | 13,968 | 2.48 | % | 498,672 | 17,740 | 3.56 | % | 522,361 | 25,304 | 4.84 | % | ||||||||||||||||||||||||
|
Non-interest
bearing liabilities:
|
||||||||||||||||||||||||||||||||||||
|
Demand
deposits
|
78,278 | 63,214 | 62,354 | |||||||||||||||||||||||||||||||||
|
Other
liabilities
|
9,824 | 5,682 | 1,526 | |||||||||||||||||||||||||||||||||
|
Total liabilities
|
650,916 | 567,568 | 586,241 | |||||||||||||||||||||||||||||||||
|
Shareholders'
Equity
|
64,054 | 56,882 | 63,343 | |||||||||||||||||||||||||||||||||
|
Total
Liabilities and Shareholders' Equity:
|
$ | 714,970 | $ | 624,450 | $ | 649,584 | ||||||||||||||||||||||||||||||
|
Interest Spread(1)
|
2.97 | % | 2.84 | % | 2.33 | % | ||||||||||||||||||||||||||||||
|
Net Interest Margin(2)
|
$ | 23,558 | 3.42 | % | $ | 21,062 | 3.48 | % | $ | 20,169 | 3.18 | % | ||||||||||||||||||||||||
(1)
Interest spread is the average yield earned on earning assets, less the
average rate incurred on interest bearing liabilities.
(2) Net
interest margin is net interest income, expressed as a percentage of average
earning assets.
(3) Loans
placed on non-accrual status are included in loan balances.
*Note:
Interest income and yields are presented on a fully taxable equivalent basis
using 34% tax rate.
29
The
following table shows fluctuations in net interest income attributable to
changes in the average balances of assets and liabilities and the yields earned
or rates paid for the years ended December 31.
|
Volume and Rate Analysis
|
||||||||||||||||||||||||||||||||||||
|
Years Ended December 31,
|
||||||||||||||||||||||||||||||||||||
|
2009 compared to 2008
|
2008 compared to 2007
|
2007 compared to 2006
|
||||||||||||||||||||||||||||||||||
|
Change Due To:
|
Change Due To:
|
Change Due To:
|
||||||||||||||||||||||||||||||||||
|
Increase /
|
Increase /
|
Increase /
|
||||||||||||||||||||||||||||||||||
|
(Decrease)
|
Volume
|
Rate
|
(Decrease)
|
Volume
|
Rate
|
(Decrease)
|
Volume
|
Rate
|
||||||||||||||||||||||||||||
|
(In Thousands)
|
||||||||||||||||||||||||||||||||||||
|
Interest
Earning Assets:
|
||||||||||||||||||||||||||||||||||||
|
Investments
|
$ | (402 | ) | $ | 16 | $ | (418 | ) | $ | (884 | ) | $ | (1,267 | ) | $ | 383 | $ | (363 | ) | $ | (584 | ) | $ | 221 | ||||||||||||
|
Loans
|
(541 | ) | 2,974 | (3,515 | ) | (5,428 | ) | (879 | ) | (4,549 | ) | 5,404 | 5,226 | 178 | ||||||||||||||||||||||
|
Interest
bearing deposits
|
(319 | ) | 319 | (638 | ) | (356 | ) | 299 | (655 | ) | 431 | 434 | (3 | ) | ||||||||||||||||||||||
|
Federal
funds sold
|
(14 | ) | (7 | ) | (7 | ) | (2 | ) | 18 | (20 | ) | 15 | 16 | (1 | ) | |||||||||||||||||||||
|
Total
Increase (Decrease) in Interest Income
|
(1,276 | ) | 3,302 | (4,578 | ) | (6,670 | ) | (1,829 | ) | (4,841 | ) | 5,487 | 5,092 | 395 | ||||||||||||||||||||||
|
Interest
Bearing Liabilities:
|
||||||||||||||||||||||||||||||||||||
|
Interest
bearing demand deposits
|
177 | 187 | (10 | ) | (99 | ) | (11 | ) | (88 | ) | (25 | ) | (24 | ) | (1 | ) | ||||||||||||||||||||
|
Money
market deposit accounts
|
(1,250 | ) | (410 | ) | (840 | ) | (2,235 | ) | 46 | (2,281 | ) | 29 | (304 | ) | 333 | |||||||||||||||||||||
|
Savings
accounts
|
(42 | ) | 32 | (74 | ) | (130 | ) | (71 | ) | (59 | ) | 143 | 130 | 13 | ||||||||||||||||||||||
|
Time
deposits
|
(2,368 | ) | 1,990 | (4,358 | ) | (1,611 | ) | 311 | (1,922 | ) | 2,203 | 1,240 | 963 | |||||||||||||||||||||||
|
Total
interest bearing deposits
|
(3,483 | ) | 1,799 | (5,282 | ) | (4,075 | ) | 275 | (4,350 | ) | 2,350 | 1,042 | 1,308 | |||||||||||||||||||||||
|
FHLB
Advances
|
525 | 401 | 124 | (2,743 | ) | (1,861 | ) | (882 | ) | 36 | (42 | ) | 78 | |||||||||||||||||||||||
|
Securities
sold under agreements to repurchase
|
(145 | ) | 82 | (227 | ) | (256 | ) | 132 | (388 | ) | 350 | 304 | 46 | |||||||||||||||||||||||
|
Other
short-term borrowings
|
(196 | ) | (48 | ) | (148 | ) | (278 | ) | 155 | (433 | ) | (97 | ) | (54 | ) | (43 | ) | |||||||||||||||||||
|
Long-term
borrowings
|
(294 | ) | (138 | ) | (156 | ) | 177 | 529 | (352 | ) | 1,056 | 851 | 205 | |||||||||||||||||||||||
|
Trust
preferred
|
(179 | ) | - | (179 | ) | (389 | ) | (230 | ) | (159 | ) | (74 | ) | (95 | ) | 21 | ||||||||||||||||||||
|
Total
Increase (Decrease) in Interest Expense
|
(3,772 | ) | 2,096 | (5,868 | ) | (7,564 | ) | (1,000 | ) | (6,564 | ) | 3,621 | 2,006 | 1,615 | ||||||||||||||||||||||
|
Increase
(Decrease) in Net Interest Income
|
$ | 2,496 | $ | 1,206 | $ | 1,290 | $ | 894 | $ | (829 | ) | $ | 1,723 | $ | 1,866 | $ | 3,086 | $ | (1,220 | ) | ||||||||||||||||
Note: Interest
income and yields are presented on a fully taxable equivalent basis using a 34%
tax rate.
Provision for Loan
Losses
The
provision for loan losses charged to operating expense in 2009 was $6.1 million,
compared to $5.4 million in 2008 and $2.6 million in 2007. This amount was
determined by management to restore the allowance for loan losses to a level
believed to be adequate to absorb inherent losses in the loan portfolio based on
an evaluation as of December 31, 2009.
Non-Interest
Income
Non-interest
income consists of revenue generated from service fees on deposit accounts,
gains on sale of loans and other charges and fees. The Mortgage
Corporation provides the most significant contributions towards non-interest
income and is subject to wide fluctuations due to the general interest rate
environment and economic conditions. Total non-interest income was $57.0 million
in 2009 compared to $30.8 million in 2008. Gains on the sale of loans originated
by the Mortgage Corporation totaled $49.3 million in 2009 compared to $24.9
million in 2008. Gains on sale of loans increased in 2009 as a result
of a $709.3 million increase in mortgage loan originations. Other income totaled
$6.3 million in 2009 compared to $3.8 million in 2008. Included in
other income are mortgage loan settlement fees amounting to $5.9 million in
2009, up from $2.9 million in 2008.
Total
non-interest income was $30.8 million in 2008 compared to $27.7 million in 2007.
Gains on the sale of loans originated by the Mortgage Corporation totaled $24.9
million in 2008 compared to $20.2 million in 2007. Gains on sale of
loans increased in 2008 despite a decrease in loan originations. The
increase is largely due to an increase in the profit margin on loans sold by the
Mortgage Corporation. Mortgage broker fees amounted to $1.7 million in 2008 down
from $3.9 million in 2007 due to a decrease in loans originated in this manner.
Other income, comprised primarily of miscellaneous loan fees, totaled $3.8
million in 2008 compared to $3.2 million in 2007.
Non-Interest
Expense
Non-interest
expense totaled $59.0 million in 2009 compared to $39.0 million in
2008. Compensation and employee benefits, the largest component of
non-interest expense, totaled $28.1 million in 2009 compared to $20.8 million in
2008, an increase of $7.3 million. The increase is primarily
attributable to a $6.8 million increase in compensation and benefits at the
Mortgage Corporation and relates to the increased volume of loan originations in
2009. Other operating expense totaled $28.4 million for the year
ended December 31, 2009 compared to $15.7 million in 2008, an increase of $12.7
million. The increase is attributable to the following expense
categories: advertising expense $1.8 million primarily at the Mortgage
Corporation, $0.7 million in investor fees paid in conjunction with selling
mortgage loans, $4.8 million in management fees associated with the operation of
certain offices of the Mortgage Corporation, $3.0 million in the provision for
losses on mortgage loans sold, $0.9 million in FDIC premiums. OREO expenses
increased $1.5 million in 2009 as a result of valuation adjustments and expenses
associated with foreclosed properties.
30
Non-interest
expense totaled $39.0 million in 2008 compared to $39.9 million in
2007. Compensation and employee benefits, the largest component of
non-interest expense, totaled $20.8 million in 2008 compared to $19.6 million in
2007, an increase of $1.2 million. The increase is primarily due to
increased staff and merit salary increases. Other operating expense
totaled $15.7 million for the period ended December 31, 2008 compared to $17.8
million in 2007, a decrease of $2.1 million. The decrease is
primarily attributable to a $3.4 million decrease in broker premiums as a result
of eliminating wholesale operations at the Mortgage Corporation in 2007.
Management fees
increased approximately $820 thousand in 2008 and represent fees paid for
managing certain offices of the Mortgage Corporation. The
provision for losses on loans sold by the Mortgage Corporation increased $345
thousand and represents amounts credited to the allowance for possible losses
associated with loans sold.
Note 17
to the consolidated financial statements provides the composition of other
expense.
Income
Taxes
Income
tax expense totaled approximately $5.9 million in 2009 compared to $2.7 million
in 2008, an increase of $3.2 million. The increase in taxes is due to an
increase of approximately $8.0 million in pre tax earnings. Note 9 to
the consolidated financial statements show the components of federal income
tax.
31
Quarterly
Results
(unaudited)
The
following is a summary of the results of operations for each quarter of 2009 and
2008.
|
First
|
Second
|
Third
|
Fourth
|
Total
|
||||||||||||||||
|
Quarter
|
Quarter
|
Quarter
|
Quarter
|
YTD
|
||||||||||||||||
|
(In
Thousands, Except Per Share Data)
|
||||||||||||||||||||
|
2009
|
||||||||||||||||||||
|
Total
interest income
|
$ | 9,679 | $ | 9,688 | $ | 9,216 | $ | 8,943 | $ | 37,526 | ||||||||||
|
Total
interest expense
|
3,936 | 3,649 | 3,305 | 3,078 | 13,968 | |||||||||||||||
|
Net
interest income
|
5,743 | 6,039 | 5,911 | 5,865 | 23,558 | |||||||||||||||
|
Provision
for loan losses
|
1,369 | 2,060 | 1,387 | 1,248 | 6,064 | |||||||||||||||
|
Net
interest income after provision for loan losses
|
4,374 | 3,979 | 4,524 | 4,617 | 17,494 | |||||||||||||||
|
Total
non-interest income
|
15,160 | 18,052 | 10,923 | 12,831 | 56,966 | |||||||||||||||
|
Total
non-interest expense
|
14,880 | 17,549 | 12,033 | 14,509 | 58,971 | |||||||||||||||
|
Income
tax expense
|
1,990 | 1,712 | 1,260 | 892 | 5,854 | |||||||||||||||
|
Net
income
|
$ | 2,664 | $ | 2,770 | $ | 2,154 | $ | 2,047 | $ | 9,635 | ||||||||||
|
Earnings
Per Share:
|
||||||||||||||||||||
|
Basic
|
$ | 0.26 | $ | 0.27 | $ | 0.21 | $ | 0.19 | $ | 0.93 | ||||||||||
|
Diluted
|
0.26 | 0.27 | 0.21 | 0.19 | 0.92 | |||||||||||||||
|
First
|
Second
|
Third
|
Fourth
|
Total
|
||||||||||||||||
|
Quarter
|
Quarter
|
Quarter
|
Quarter
|
YTD
|
||||||||||||||||
|
(In
Thousands, Except Per Share Data)
|
||||||||||||||||||||
|
2008
|
||||||||||||||||||||
|
Total
interest income
|
$ | 10,019 | $ | 9,511 | $ | 9,727 | $ | 9,535 | $ | 38,792 | ||||||||||
|
Total
interest expense
|
5,237 | 4,262 | 4,172 | 4,069 | 17,740 | |||||||||||||||
|
Net
interest income
|
4,782 | 5,249 | 5,555 | 5,466 | 21,052 | |||||||||||||||
|
Provision
for loan losses
|
408 | 1,399 | 1,855 | 1,761 | 5,423 | |||||||||||||||
|
Net
interest income after provision for loan losses
|
4,374 | 3,850 | 3,700 | 3,705 | 15,629 | |||||||||||||||
|
Total
non-interest income
|
8,442 | 8,022 | 5,640 | 8,709 | 30,813 | |||||||||||||||
|
Total
non-interest expense
|
10,181 | 10,215 | 8,147 | 10,455 | 38,998 | |||||||||||||||
|
Income
tax expense
|
944 | 595 | 424 | 737 | 2,700 | |||||||||||||||
|
Net
income
|
$ | 1,691 | $ | 1,062 | $ | 769 | $ | 1,222 | $ | 4,744 | ||||||||||
Earnings
Per Share:
Liquidity
Management
Liquidity
is the ability of the Corporation to meet current and future cash flow
requirements. The liquidity of a financial institution reflects its
ability to convert assets into cash or cash equivalents without significant loss
and to raise additional funds by increasing liabilities. Liquidity
management involves maintaining the Corporation’s ability to meet the daily cash
flow requirements of both depositors and borrowers.
Asset and
liability management functions not only serve to assure adequate liquidity in
order to meet the needs of the Corporation’s customers, but also to maintain an
appropriate balance between interest sensitive assets and interest sensitive
liabilities so that the Corporation can earn an appropriate return for its
shareholders.
The asset
portion of the balance sheet provides liquidity primarily through loan principal
repayments and maturities of investment securities. Other short-term
investments such as federal funds sold and interest bearing deposits with other
banks are additional sources of liquidity funding. At
December 31, 2009, overnight interest bearing balances totaled $25.3
million and securities available for sale net of restricted stock totaled $41.6
million.
32
The
liability portion of the balance sheet provides liquidity through various
interest bearing and non-interest bearing deposit accounts, federal funds
purchased, securities sold under agreement to repurchase and other short-term
borrowings. At December 31, 2009, the Bank had a line of credit with
the FHLB totaling $193.4 million and $36.5 million in term loans outstanding at
fixed rates ranging from 2.55% to 5.07% leaving approximately $156.9 million
available on the line. In addition to the line of credit at the FHLB,
the Bank and Mortgage Corporation issue repurchase agreements and commercial
paper. As of December 31, 2009, outstanding repurchase
agreements totaled $26.8 million and commercial paper issued amounted to $16.5
million. The interest rate on these instruments is variable and
subject to change daily. The Bank also maintains federal funds lines
of credit with its correspondent banks and, at December 31, 2009, these
lines amounted to $28.5 million. The Corporation also has $6.2
million in subordinated debentures to support the growth of the
organization.
The Bank
relies on deposits and other short and long term resources for liquidity from a
variety of sources that substantially reduces reliance upon any single provider.
The Corporation expects its short and long-term sources of liquidity and capital
to remain adequate to support expected growth.
Contractual
Obligations
The
following table summarizes the Corporation’s significant fixed and determinable
contractual obligations to make future payments as of December 31,
2009.
|
Payments
Due By Period
|
||||||||||||||||
|
December
31, 2009
|
||||||||||||||||
|
Less
Than
|
1
- 3
|
More Than
|
||||||||||||||
|
1
Year
|
Years
|
3
Years
|
Total
|
|||||||||||||
|
(In
Thousands)
|
||||||||||||||||
|
Certificates
of deposit
|
$ | 190,947 | $ | 53,656 | $ | 13,272 | $ | 257,875 | ||||||||
|
FHLB
advances
|
20,179 | - | - | 20,179 | ||||||||||||
|
Securities
sold under agreements to repurchase
|
26,804 | - | - | 26,804 | ||||||||||||
|
FHLB
long-term borrowings
|
- | 7,083 | 9,250 | 16,333 | ||||||||||||
|
Senior
unsecured term note
|
- | 29,997 | - | 29,997 | ||||||||||||
|
Commercial
paper
|
16,517 | - | - | 16,517 | ||||||||||||
|
US
treasury demand notes
|
750 | - | - | 750 | ||||||||||||
|
Subordinated
debentures
|
- | - | 6,186 | 6,186 | ||||||||||||
|
Leases
|
- | 1,200 | 740 | 1,940 | ||||||||||||
|
Total
|
$ | 255,197 | $ | 91,936 | $ | 29,448 | $ | 376,581 | ||||||||
Off Balance Sheet
Items
During
the ordinary course of business, the Bank issues commitments to extend credit
and, at December 31, 2009, these commitments amounted to $15.3
million. These commitments do not necessarily represent cash
requirements, since many commitments are expected to expire without being drawn
on. At December 31, 2009 the Bank had approximately $125.6 million in
unfunded lines and letters of credit.
The
Mortgage Corporation had open forward contracts at December 31, 2009 totaling
$61.5 million and $99.2 million at December 31, 2008. See Notes 10
and 11 to the consolidated financial statements.
33
The
Mortgage Corporation has agreements with a variety of counter parties to whom
mortgage loans are sold on a non-recourse basis. As customary in the industry,
the agreements require the Mortgage Corporation to extend representations and
warranties with respect to program compliance, borrower misrepresentation, fraud
and early payment performance. Under the agreements, the counter parties are
entitled to make loss claims and repurchase requests of the Mortgage Corporation
for loans that contain covered deficiencies. The overall economic conditions,
rising unemployment and weak values in the housing market has created a heighted
risk of loss due to the representations and warranties associated with sold
mortgage loans. Upon recognizing this heightened risk as well as actual claims,
the Mortgage Corporation adopted a reserve methodology whereby provisions are
made to an expense account to fund a reserve maintained as a liability account
on the balance sheet for potential losses. The amount of the provision and
adequacy of the reserve is recommended by Management and approved by the Board
of the Mortgage Corporation no less than quarterly. Management estimates the
reserve based upon the maintenance of a schedule of expected losses on loans
with claims or indemnifications and ensures the reserve equals or exceeds the
estimate of loss. Claims in process are recognized in the period received,
actively monitored and subject to validation prior to payment. Often times,
claims are not factually validated and the claim is rescinded. Once claims are
validated and the actual or potential loss is agreed upon with the counterparty,
the reserve is charged and a cash payment is made to settle the claim. The loan
performance data of sold loans is not made available to the Mortgage Corporation
by the counter parties, thereby making it impossible to estimate the timing and
amount of claims until such time as claims are actually presented. Through
careful monitoring and conservative estimates, the balance of the reserve has
adequately provided for all claims since established. At December 31,
2009 and 2008 the balance in this reserve totaled approximately $3.3 million and
$1.4 million respectively.
The
following table presents the activity in the Allowance for Losses on Mortgage
Loans Sold at December 31, 2009 and 2008.
|
Allowance
For Losses On Mortgage Loans Sold
|
||||||||
|
December
31,
|
||||||||
|
2009
|
2008
|
|||||||
|
Balance
at beginning of year
|
$ | 1,439 | $ | 119 | ||||
|
Provision
charged to operating expense
|
5,050 | 2,095 | ||||||
|
Recoveries
|
16 | 16 | ||||||
|
Charge-offs
|
(3,173 | ) | (791 | ) | ||||
|
Balance
at end of year
|
$ | 3,332 | $ | 1,439 | ||||
Recent Accounting
Pronouncements
Refer to
Note 1 to the consolidated financial statements.
ITEM 7A – QUANTITATIVE AND
QUALITATIVE DISCLOSURES ABOUT MARKET RISK
The
Corporation’s market risk is composed primarily of interest rate
risk. The Funds Management Committee is responsible for reviewing
the interest rate sensitivity position and establishes policies to monitor and
coordinate the Corporation’s sources, uses and pricing of funds.
Interest
Rate Sensitivity Management
The
Corporation uses a simulation model to analyze, manage and formulate operating
strategies that address net interest income sensitivity to movements in interest
rates. The simulation model projects net interest income based on
various interest rate scenarios over a twelve month period. The model
is based on the actual maturity and re-pricing characteristics of rate sensitive
assets and liabilities. The model incorporates certain assumptions
which management believes to be reasonable regarding the impact of changing
interest rates and the prepayment assumption of certain assets and liabilities
as of December 31, 2009. The model assumes changes in interest rates
without any management intervention to change the composition of the balance
sheet. According to the model run for the period ended December 31,
2009 over a twelve month period, an immediate 100 basis points increase in
interest rates would result in an increase in net interest income by
0.37%. An immediate 200 basis points increase in interest rates would
result in an increase in net interest income by 1.23%. A 100
basis points decrease in interest rates would result in a negative variance in
net interest income and is considered unlikely given current interest rate
levels. While management carefully monitors the exposure to changes in interest
rates and takes actions as warranted to decrease any adverse impact, there can
be no assurance about the actual effect of interest rate changes on net interest
income.
The
Corporation’s net interest income and the fair value of its financial
instruments are influenced by changes in the level of interest rates. The
Corporation manages its exposure to fluctuations in interest rates through
policies established by its Funds Management Committee. The Funds Management
Committee meets monthly and has responsibility for formulating and implementing
strategies to improve balance sheet positioning and earnings and reviewing
interest rate sensitivity.
34
The
Mortgage Corporation is party to mortgage rate lock commitments to fund mortgage
loans at interest rates previously agreed (locked) by both the Corporation and
the borrower for specified periods of time. When the borrower locks his or her
interest rate, the Corporation effectively extends a put option to the borrower,
whereby the borrower is not obligated to enter into the loan agreement, but the
Corporation must honor the interest rate for the specified time
period. The Corporation is exposed to interest rate risk during
the accumulation of interest rate lock commitments and loans prior to sale. The
Corporation utilizes either a best efforts sell forward or a mandatory sell
forward commitment to economically hedge the changes in fair value of the loan
due to changes in market interest rates. Failure to effectively
monitor, manage and hedge the interest rate risk associated with the mandatory
commitments subjects the Corporation to potentially significant market
risk.
Throughout
the lock period the changes in the market value of interest rate lock
commitments, best efforts and mandatory sell forward commitments are recorded as
unrealized gains and losses and are included in the consolidated statement of
income under other non-interest income. The Corporation's management has made
complex judgments in the recognition of gains and losses in connection with this
activity. The Corporation utilizes a third party and its proprietary
simulation model to assist in identifying and managing the risk associated with
this activity.
Impact of Inflation and
Changing Prices
A bank’s
asset and liability structure is substantially different from that of a
non-financial company in that virtually all assets and liabilities of a bank are
monetary in nature. The impact of inflation on financial results
depends upon the Bank’s ability to react to changes in interest rates and, by
such reaction, reduce the inflationary impact on
performance. Interest rates do not necessarily move in the same
direction, or at the same magnitude, as the prices of other goods and
services. Management seeks to manage the relationship between
interest-sensitive assets and liabilities in order to protect against wide
interest rate fluctuations, including those resulting from
inflation.
35
ITEM 8 - FINANCIAL
STATEMENTS AND SUPPLEMENTARY DATA
Report
of Independent Registered Public Accounting Firm
Board of
Directors and Shareholders
Access
National Corporation
Reston,
Virginia
We have
audited the accompanying consolidated balance sheets of Access National
Corporation and subsidiaries as of December 31, 2009 and 2008 and the related
consolidated statements of income, shareholders’ equity, and cash flows for each
of the three years in the period ended December 31, 2009. These
financial statements are the responsibility of the Corporation’s
management. Our responsibility is to express an opinion on these
financial statements based on our audits.
We
conducted our audits in accordance with the standards of the Public Company
Accounting Oversight Board (United States). Those standards require
that we plan and perform the audit to obtain reasonable assurance about whether
the financial statements are free of material misstatement. An audit
includes examining, on a test basis, evidence supporting the amounts and
disclosures in the financial statements, assessing the accounting principles
used and significant estimates made by management, as well as evaluating the
overall financial statement presentation. We believe that our audits
provide a reasonable basis for our opinion.
In our
opinion, the consolidated financial statements referred to above present fairly,
in all material respects, the financial position of Access National Corporation
and subsidiaries at December 31, 2009 and 2008, and the results of its
operations and its cash flows for each of the three years in the period ended
December 31, 2009, in
conformity with accounting principles generally accepted in the United States of
America.
We also
have audited, in accordance with the standards of the Public Company Accounting
Oversight Board (United States), Access National Corporation and subsidiaries’
internal control over financial reporting as of December 31, 2009, based on
criteria established in Internal Control – Integrated
Framework issued by the Committee of Sponsoring Organizations of the
Treadway Commission (COSO) and our report dated March 29, 2010 expressed an
unqualified opinion thereon.
/S/ BDO
Seidman, LLP
BDO
Seidman, LLP
Richmond,
Virginia
March 29,
2010
36
Report
of Independent Registered Public Accounting Firm
Board of
Directors and Shareholders
Access
National Corporation
Reston,
Virginia
We have
audited Access National Corporation and subsidiaries’ internal control over
financial reporting as of December 31, 2009, based on criteria established in
Internal Control-Integrated
Framework issued by the Committee of Sponsoring Organizations of the
Treadway Commission (the COSO criteria). Access National
Corporation’s management is responsible for maintaining effective internal
control over financial reporting and for its assessment of the effectiveness of
internal control over financial reporting, included in the accompanying
Management’s Report on Internal Control Over Financial Reporting. Our
responsibility is to express an opinion on the Corporation’s internal control
over financial reporting based on our audit.
We
conducted our audit in accordance with the standards of the Public Company
Accounting Oversight Board (United States). Those standards require
that we plan and perform the audit to obtain reasonable assurance about whether
effective internal control over financial reporting was maintained in all
material respects. Our audit included obtaining an understanding of
internal control over financial reporting, assessing the risk that a material
weakness exists, and testing and evaluating the design and operating
effectiveness of internal control based on the assessed risk. Our
audit also included performing such other procedures as we considered necessary
in the circumstances. We believe that our audit provides a reasonable
basis for our opinion.
A
company’s internal control over financial reporting is a process designed to
provide reasonable assurance regarding the reliability of financial reporting
and the preparation of financial statements for external purposes in accordance
with generally accepted accounting principles. A company’s internal
control over financial reporting includes those policies and procedures that (1)
pertain to the maintenance of records that, in reasonable detail, accurately and
fairly reflect the transactions and dispositions of the assets of the company;
(2) provide reasonable assurance that transactions are recorded as necessary to
permit preparation of financial statements in accordance with generally accepted
accounting principles, and that receipts and expenditures of the company are
being made only in accordance with authorizations of management and directors of
the company; and (3) provide reasonable assurance regarding prevention or timely
detection of unauthorized acquisition, use, or disposition of the company’s
assets that could have a material effect on the financial
statements.
Because
of its inherent limitations, internal control over financial reporting may not
prevent or detect misstatements. Also, projections of any evaluation
of effectiveness to future periods are subject to the risk that controls may
become inadequate because of changes in conditions, or that the degree of
compliance with the policies or procedures may deteriorate.
In our
opinion, Access National Corporation and subsidiaries maintained, in all
material respects, effective internal control over financial reporting as of
December 31, 2009, based on the COSO criteria.
We have
also audited, in accordance with the standards of the Public Company Accounting
Oversight Board (United States), the accompanying consolidated balance sheets of
Access National Corporation and subsidiaries as of December 31, 2009 and 2008,
and the related consolidated statements of income, shareholders’ equity and cash
flows for each of the three years in the period ended December 31, 2009, and our
report dated March 29, 2010 expressed an unqualified opinion
thereon.
/S/ BDO
Seidman, LLP
BDO
Seidman, LLP
Richmond,
Virginia
March 29,
2010
37
ACCESS
NATIONAL CORPORATION
Consolidated
Balance Sheets
(In
Thousands, Except for Share Data)
|
December
31,
|
||||||||
|
2009
|
2008
|
|||||||
|
Assets
|
||||||||
|
Cash
and due from banks
|
$ | 5,965 | $ | 8,785 | ||||
|
Interest
bearing deposits in other banks and federal funds sold
|
25,256 | 13,697 | ||||||
|
Securities
available for sale, at fair value
|
47,838 | 91,015 | ||||||
|
Loans
held for sale, at fair value
|
76,232 | 84,312 | ||||||
|
Loans,
net of allowance for loan losses 2009, $ 9,127; 2008,
$7,462
|
477,437 | 478,467 | ||||||
|
Premises
and equipment, net
|
8,759 | 9,211 | ||||||
|
Accrued
interest receivable and other assets
|
25,392 | 16,837 | ||||||
|
Total
assets
|
$ | 666,879 | $ | 702,324 | ||||
|
Liabilities
and Shareholders' Equity
|
||||||||
|
Liabilities
|
||||||||
|
Deposits
|
||||||||
|
Non-interest
bearing demand deposits
|
$ | 69,782 | $ | 75,000 | ||||
|
Savings
and interest bearing deposits
|
138,988 | 95,730 | ||||||
|
Time
deposits
|
257,875 | 314,671 | ||||||
|
Total
deposits
|
466,645 | 485,401 | ||||||
|
Short
term borrowings
|
64,249 | 103,575 | ||||||
|
Long
term borrowings
|
46,330 | 41,107 | ||||||
|
Subordinated
debentures
|
6,186 | 6,186 | ||||||
|
Other
liabilities and accrued expenses
|
15,691 | 8,110 | ||||||
|
Total
liabilities
|
599,101 | 644,379 | ||||||
|
Shareholders'
Equity
|
||||||||
|
Common
stock, par value, $.835, authorized 60,000,000 shares, issued and
outstanding, 10,537,428 in 2009 and 10,240,747 in 2008
|
8,799 | 8,551 | ||||||
|
Additional
paid in capital
|
18,552 | 17,410 | ||||||
|
Retained
earnings
|
40,377 | 31,157 | ||||||
|
Accumulated
other comprehensive income, net
|
50 | 827 | ||||||
|
Total
shareholders' equity
|
67,778 | 57,945 | ||||||
|
Total
liabilities and shareholders' equity
|
$ | 666,879 | $ | 702,324 | ||||
See
accompanying Notes to Consolidated Financial Statements.
38
ACCESS
NATIONAL CORPORATION
Consolidated
Statements of Income
(In
Thousands, Except for Per Share Data)
|
Year
Ended December 31,
|
||||||||||||
|
2009
|
2008
|
2007
|
||||||||||
|
Interest
and Dividend Income
|
||||||||||||
|
Loans
|
$ | 34,334 | $ | 34,875 | $ | 40,303 | ||||||
|
Interest
bearing deposits and federal funds sold
|
154 | 486 | 846 | |||||||||
|
Securities
|
3,038 | 3,431 | 4,277 | |||||||||
|
Total
interest and dividend income
|
37,526 | 38,792 | 45,426 | |||||||||
|
Interest
Expense
|
||||||||||||
|
Deposits
|
10,568 | 14,051 | 18,125 | |||||||||
|
Short-term
borrowings
|
1,261 | 1,077 | 4,354 | |||||||||
|
Long-term
borrowings
|
1,901 | 2,195 | 2,018 | |||||||||
|
Subordinated
debentures
|
238 | 417 | 807 | |||||||||
|
Total
interest expense
|
13,968 | 17,740 | 25,304 | |||||||||
|
Net
interest income
|
23,558 | 21,052 | 20,122 | |||||||||
|
Provision
for loan losses
|
6,064 | 5,423 | 2,588 | |||||||||
|
Net
interest income after provision for loan losses
|
17,494 | 15,629 | 17,534 | |||||||||
|
Non-Interest
Income
|
||||||||||||
|
Service
fees on deposit accounts
|
536 | 438 | 365 | |||||||||
|
Gain
on sale of loans
|
49,262 | 24,859 | 20,241 | |||||||||
|
Mortgage
broker fee income
|
918 | 1,672 | 3,890 | |||||||||
|
Other
income
|
6,250 | 3,844 | 3,211 | |||||||||
|
Total
non-interest income
|
56,966 | 30,813 | 27,707 | |||||||||
|
Non-Interest
Expense
|
||||||||||||
|
Compensation
and employee benefits
|
28,122 | 20,781 | 19,578 | |||||||||
|
Occupancy
|
1,726 | 1,546 | 1,419 | |||||||||
|
Furniture
and equipment
|
771 | 933 | 1,111 | |||||||||
|
Other
|
28,352 | 15,738 | 17,841 | |||||||||
|
Total
non-interest expense
|
58,971 | 38,998 | 39,949 | |||||||||
|
Income
before income taxes
|
15,489 | 7,444 | 5,292 | |||||||||
|
Income
taxes
|
5,854 | 2,700 | 1,590 | |||||||||
|
Net
Income
|
$ | 9,635 | $ | 4,744 | $ | 3,702 | ||||||
|
Earnings
per common share:
|
||||||||||||
|
Basic
|
$ | 0.93 | $ | 0.46 | $ | 0.32 | ||||||
|
Diluted
|
$ | 0.92 | $ | 0.46 | $ | 0.31 | ||||||
|
Average
outstanding shares:
|
||||||||||||
|
Basic
|
10,391,348 | 10,298,631 | 11,620,130 | |||||||||
|
Diluted
|
10,432,857 | 10,423,555 | 11,866,468 | |||||||||
See
accompanying Notes to Consolidated Financial Statements.
39
ACCESS
NATIONAL CORPORATION
(In
Thousands, Except for Share Data)
|
Accumulated
|
||||||||||||||||||||
|
Other
|
||||||||||||||||||||
|
Additional
|
Compre-
|
|||||||||||||||||||
|
Common
|
Paid
in
|
Retained
|
hensive
|
|||||||||||||||||
|
Stock
|
Capital
|
Earnings
|
Income
(Loss)
|
Total
|
||||||||||||||||
|
Balance,
December 31, 2006
|
$ | 9,867 | $ | 29,316 | $ | 23,641 | $ | (529 | ) | $ | 62,295 | |||||||||
|
Comprehensive
income:
|
||||||||||||||||||||
|
Net
income
|
- | - | 3,702 | - | 3,702 | |||||||||||||||
|
Other
comprehensive income, unrealized holdings gains arising during
the period (net of tax, $391)
|
- | - | - | 759 | 759 | |||||||||||||||
|
Total
comprehensive income
|
4,461 | |||||||||||||||||||
|
Stock
options exercised (178,320 shares)
|
149 | 151 | - | - | 300 | |||||||||||||||
|
Dividend
reinvestment plan (91,105 shares)
|
76 | 729 | - | - | 805 | |||||||||||||||
|
Repurchase
of common stock under share repurchase program (1,245,624
shares)
|
(1,040 | ) | (8,462 | ) | - | - | (9,502 | ) | ||||||||||||
|
Cash
dividend
|
- | - | (497 | ) | - | (497 | ) | |||||||||||||
|
Stock-based
compensation expense recognized in earnings
|
- | 99 | - | - | 99 | |||||||||||||||
|
Balance,
December 31, 2007
|
$ | 9,052 | $ | 21,833 | $ | 26,846 | $ | 230 | $ | 57,961 | ||||||||||
|
Comprehensive
income:
|
||||||||||||||||||||
|
Net
income
|
- | - | 4,744 | - | 4,744 | |||||||||||||||
|
Other
comprehensive income, unrealized holdings gains arising during the period
(net of tax, $307)
|
- | - | - | 597 | 597 | |||||||||||||||
|
Total
comprehensive income
|
5,341 | |||||||||||||||||||
|
Stock
options exercised (137,682 shares)
|
115 | 284 | - | - | 399 | |||||||||||||||
|
Dividend
reinvestment plan (87,171 shares)
|
73 | 398 | - | - | 471 | |||||||||||||||
|
Repurchase
of common stock under share repurchase program (824,836
shares)
|
(689 | ) | (5,241 | ) | - | - | (5,930 | ) | ||||||||||||
|
Cash
dividend
|
- | - | (433 | ) | - | (433 | ) | |||||||||||||
|
Stock-based
compensation expense recognized in earnings
|
- | 136 | - | - | 136 | |||||||||||||||
|
Balance,
December 31, 2008
|
$ | 8,551 | $ | 17,410 | $ | 31,157 | $ | 827 | $ | 57,945 | ||||||||||
|
Comprehensive
income:
|
||||||||||||||||||||
|
Net
income
|
- | - | 9,635 | - | 9,635 | |||||||||||||||
|
Other
comprehensive income, unrealized holdings losses arising during the period
(net of tax, $400)
|
- | - | - | (777 | ) | (777 | ) | |||||||||||||
|
Total
comprehensive income
|
8,858 | |||||||||||||||||||
|
Stock
options exercised (184,452 shares)
|
154 | 470 | - | - | 624 | |||||||||||||||
|
Dividend
reinvestment plan (146,759 shares)
|
123 | 654 | - | - | 777 | |||||||||||||||
|
Repurchase
of common stock under share repurchase program (34,530
shares)
|
(29 | ) | (144 | ) | - | - | (173 | ) | ||||||||||||
|
Cash
dividend
|
- | - | (415 | ) | - | (415 | ) | |||||||||||||
|
Stock-based
compensation expense recognized in earnings
|
- | 162 | - | - | 162 | |||||||||||||||
|
Balance,
December 31, 2009
|
$ | 8,799 | $ | 18,552 | $ | 40,377 | $ | 50 | $ | 67,778 | ||||||||||
See
accompanying Notes to Consolidated Financial Statements.
40
ACCESS
NATIONAL CORPORATION
Consolidated
Statements of Cash Flows
(In
Thousands)
|
Year
Ended December 31,
|
||||||||||||
|
2009
|
2008
|
2007
|
||||||||||
|
Cash
Flows from Operating Activities
|
||||||||||||
|
Net
income
|
$ | 9,635 | $ | 4,744 | $ | 3,702 | ||||||
|
Adjustments
to reconcile net income to net cash provided by operating
activities:
|
||||||||||||
|
Provision
for loan losses
|
6,064 | 5,423 | 2,588 | |||||||||
|
Provision
for losses on mortgage loans sold
|
5,050 | 2,095 | 1,750 | |||||||||
|
Writedown
of other real estate owned
|
1,245 | - | 714 | |||||||||
|
Gain
on sale of securities
|
(984 | ) | (12 | ) | - | |||||||
|
Deferred
tax benefit
|
(1,525 | ) | (906 | ) | (1,106 | ) | ||||||
|
Stock
based compensation
|
162 | 136 | 99 | |||||||||
|
Valuation
allowance on derivatives
|
(75 | ) | (231 | ) | 68 | |||||||
|
Net
amortization on securities
|
72 | 2 | (20 | ) | ||||||||
|
Depreciation
and amortization
|
565 | 747 | 839 | |||||||||
|
Loss
on disposal of assets
|
2 | 5 | 1 | |||||||||
|
Changes
in assets and liabilities:
|
||||||||||||
|
Valuation
of loans held for sale carried at fair value
|
(1,626 | ) | (2,109 | ) | - | |||||||
|
Originations
of loans held for sale
|
(1,515,880 | ) | (775,857 | ) | (886,433 | ) | ||||||
|
Proceed
from sale of loans held for sale
|
1,525,586 | 732,798 | 912,609 | |||||||||
|
Increase
in other assets
|
(8,228 | ) | (8,221 | ) | (1,851 | ) | ||||||
|
Increase
(decrease) in other liabilities
|
2,530 | 2,404 | (3,860 | ) | ||||||||
|
Net
cash provided by (used in) operating activities
|
22,593 | (38,982 | ) | 28,386 | ||||||||
|
Cash
Flows from Investing Activities
|
||||||||||||
|
Proceeds
from maturities and calls of securities available for sale
|
63,556 | 61,357 | 66,612 | |||||||||
|
Proceeds
from sale of securities
|
15,312 | 2,939 | - | |||||||||
|
Purchases
of securities available for sale
|
(35,955 | ) | (80,840 | ) | (33,838 | ) | ||||||
|
Net
increase in loans
|
(5,035 | ) | (13,754 | ) | (44,581 | ) | ||||||
|
Proceeds
from sale of assets
|
23 | 35 | 23 | |||||||||
|
Proceeds
from sales of other real estate owned
|
350 | 2,449 | 1,363 | |||||||||
|
Purchases
of premises and equipment
|
(58 | ) | (199 | ) | (970 | ) | ||||||
|
Net
cash provided by (used in) investing activities
|
38,193 | (28,013 | ) | (11,391 | ) | |||||||
|
Cash
Flows from Financing Activities
|
||||||||||||
|
Net
increase (decrease) in demand, interest bearing demand and savings
deposits
|
37,940 | (31,505 | ) | 2,704 | ||||||||
|
Net
(decrease) increase in time deposits
|
(56,696 | ) | 43,488 | 31,782 | ||||||||
|
(Decrease)
increase in securities sold under agreement to repurchase
|
(4,584 | ) | 16,574 | 273 | ||||||||
|
Net
(decrease) increase in other short-term borrowings
|
(34,742 | ) | 45,326 | (43,548 | ) | |||||||
|
Net
increase in long-term borrowings
|
5,223 | 1,583 | (7,173 | ) | ||||||||
|
Proceeds
from issuance of common stock
|
1,400 | 870 | 1,105 | |||||||||
|
Repurchase
of common stock
|
(173 | ) | (5,930 | ) | (9,502 | ) | ||||||
|
Dividends
paid
|
(415 | ) | (433 | ) | (497 | ) | ||||||
|
Net
cash (used in) provided by financing activities
|
(52,047 | ) | 69,973 | (24,856 | ) | |||||||
|
Increase
(decrease) in cash and cash equivalents
|
8,739 | 2,978 | (7,861 | ) | ||||||||
|
Cash
and Cash Equivalents
|
||||||||||||
|
Beginning
|
22,482 | 19,504 | 27,365 | |||||||||
|
Ending
|
$ | 31,221 | $ | 22,482 | $ | 19,504 | ||||||
|
Supplemental
Disclosures of Cash Flow Information
|
||||||||||||
|
Cash
payments for interest
|
$ | 13,602 | $ | 17,360 | $ | 25,285 | ||||||
|
Cash
payments for income taxes
|
$ | 7,113 | $ | 3,480 | $ | 4,815 | ||||||
|
Supplemental
Disclosures of Noncash Investing Activities
|
||||||||||||
|
Unrealized
(loss) gain on securities available for sale
|
$ | (1,176 | ) | $ | 904 | $ | 1,150 | |||||
|
Loans
transferred to other realestate owned
|
$ | 2,250 | $ | 4,455 | $ | - | ||||||
See
accompanying Notes to Consolidated Financial Statements.
41
ACCESS
NATIONAL CORPORATION
Notes
to Consolidated Financial Statements
Note
1. Summary of Significant Accounting Policies
Nature of Operations - Access
National Corporation (the “Corporation “) is a bank holding company incorporated
under the laws of the Commonwealth of Virginia. The holding company was formed
on June 15, 2002. The Corporation owns all of the stock of its subsidiaries
including Access National Bank (the “Bank”), and Access National Capital Trust
II. The Bank is an independent commercial bank chartered under federal laws as a
national banking association. The Trust subsidiary was formed for the purpose of
issuing redeemable capital securities.
The Bank
has two active wholly-owned subsidiaries: Access National Mortgage Corporation
(the Mortgage Corporation), a mortgage banking company, and Access National Real
Estate LLC, a real estate company.
Basis of Presentation - The
accompanying consolidated financial statements include the accounts of Access
National Corporation and its wholly-owned subsidiaries, Access National Bank,
and Access National Capital Trust II. All significant inter-company
accounts and transactions have been eliminated in consolidation. The accounting
and reporting policies of the Corporation and its subsidiaries conform to
accounting principles generally accepted in the United States of America and to
predominant practices within the banking industry.
Accounting Standards
Codification – In June 2009, the Financial Accounting Standards
Board (“FASB”) issued Statement of Financial Accounting Standard (“SFAS”)
No. 168, The FASB Accounting
Standards Codification and the Hierarchy of Generally Accepted
Accounting Principles, a replacement of FASB Statement No. 162. This
statement modifies the U.S. generally accepted accounting principles (“GAAP”)
hierarchy by establishing only two levels of GAAP: authoritative and
non-authoritative accounting literature. Effective July 2009, the FASB
Accounting Standards Codification (“ASC”), also known collectively as the
“Codification,” is considered the single source of authoritative U.S. GAAP,
except for additional authoritative rules and interpretive releases issued by
the SEC. Non-authoritative guidance and literature would include, among other
things, FASB Concepts Statements, American Institute of Certified Public
Accountants Issue Papers and Technical Practice Aids and accounting textbooks.
The Codification was developed to organize GAAP pronouncements by topic so that
users can more easily access authoritative accounting guidance. It is organized
by topic, subtopic, section, and paragraph, each of which is identified by a
numerical designation. FASB ASC 105-10, Generally Accepted Accounting
Principles, became applicable beginning in the third quarter of 2009. All
accounting references have been updated, and therefore SFAS references have been
replaced with ASC references except for SFAS references that have not been
integrated into the codification.
Use of Estimates - The
preparation of financial statements in conformity with accounting principles
generally accepted in the United States of America requires management to make
estimates and assumptions that affect the reported amounts of assets and
liabilities and disclosure of contingent assets and liabilities at the date of
the financial statements and the reported amounts of revenues and expenses
during the reporting period. Actual results could differ from those estimates.
Material estimates that are particularly susceptible to significant change in
the near term relate to the determination of the allowance for loan losses, the
fair values and impairments of financial instruments, the status of
contingencies and the valuation of deferred tax assets.
Cash Flow Reporting - For
purposes of the statements of cash flows, cash and cash equivalents consists of
cash and due from banks, federal funds sold and interest bearing deposits in
other banks.
Restrictions on Cash and Cash
Equivalents - As a member of the Federal Reserve System (the “FRB”), the
Bank is required to maintain certain average reserve balances. Those balances
include usable vault cash and amounts on deposit with the FRB. At December
31, 2009 and 2008, the amount of daily average required balances were
approximately $350 thousand.
Securities - Debt securities
that management has both the positive intent and ability to hold to maturity are
classified as “held to maturity” and are recorded at amortized cost. Securities
not classified as held to maturity, including equity securities with readily
determinable fair values, are classified as “available for sale” and recorded at
fair value, with unrealized gains and losses excluded from earnings and reported
in other comprehensive income. Restricted stock comprised of FRB and Federal
Home Loan Bank (the “ FHLB”) stock is carried at cost.
Purchase
premiums and discounts are recognized in interest income using the interest
method over the terms of the securities. Declines in the fair value of held to
maturity and available for sale securities below their cost that are deemed to
be other than temporary are reflected in earnings as realized losses. Gains and
losses on the sale of securities are recorded on the trade date and are
determined using the specific identification method. All securities were
classified as available for sale at December 31, 2009 and 2008.
42
Notes
to Consolidated Financial Statements
Other Than Temporary Impairment of Investment
Securities - Available-for-sale securities are evaluated quarterly for
potential other-than-temporary impairment. Management considers the facts of
each security including the nature of the security, the amount and duration of
the loss, credit quality of the issuer, the expectations for that security’s
performance and Corporation’s intent and ability to hold the security until
recovery. Declines in equity securities that are considered to be
other-than-temporary are recorded as a charge to earnings in the Consolidated
Statements of Income. Declines in debt securities that are considered to be
other-than-temporary are separated into (1) the amount of the total
impairment related to credit loss and (2) the amount of the total
impairment related to all other factors. The amount of the total
other-than-temporary impairment related to the credit loss is recognized in
earnings. The amount of the total impairment related to all other factors is
recognized in other comprehensive income.
Loans - The Corporation grants
commercial, real estate, and consumer loans to customers in the community in and
around Northern Virginia. The loan portfolio is well diversified and generally
is collateralized by assets of the customers. The loans are expected to be
repaid from cash flow or proceeds from the sale of selected assets of the
borrowers. The ability of the Corporation’s debtors to honor their contracts is
dependent upon the real estate and general economic conditions in the
Corporation’s market area.
Loans
that management has the intent and ability to hold for the foreseeable future or
until maturity or pay-off generally are reported at their outstanding unpaid
principal balances less the allowance for loan losses, and any deferred fees or
costs on originated loans. Interest income is accrued on the unpaid principal
balance. Loan origination fees, net of certain direct origination costs, are
deferred and recognized as an adjustment of the related loan yield using the
interest method.
The
accrual of interest on mortgage and commercial loans is discontinued at the time
the loan is 90 days delinquent unless the credit is well-secured and in process
of collection. Consumer loans and other loans are typically charged off no later
than 180 days past due. In all cases, loans are placed on non-accrual status or
charged-off at an earlier date if collection of principal or interest is
considered doubtful.
All
interest accrued but not collected for loans that are placed on non-accrual
status or charged-off is reversed against interest income. The interest on these
loans is accounted for on the cash-basis or cost-recovery method, until
qualifying for return to accrual. Loans are returned to accrual status when all
of the principal and interest amounts contractually due are brought current and
future payments are reasonably assured.
Interest Income on Loans
- Interest on loans is accrued and credited to income based on the
principal amount outstanding. The accrual of interest on loans is discontinued
when, in the opinion of management, there is an indication that the borrower may
be unable to meet payments as they become due. Upon such discontinuance, all
unpaid accrued interest is reversed.
Loans Held for Sale - The
Corporation accounts for all one to four unit residential loans originated and
intended for sale in the secondary market in accordance with FASB ASC
825-10. Loans held for sale are recorded at fair value, determined
individually, as of the balance sheet date.
Allowance for Loan Losses -
The allowance for loan losses is established as losses are estimated to have
occurred through a provision for loan losses charged to earnings. Loan losses
are charged against the allowance when management believes the uncollectibility
of a loan balance is confirmed. Subsequent recoveries, if any, are credited to
the allowance.
The
allowance represents an amount that, in management’s judgment, will be adequate
to absorb any losses on existing loans that may become uncollectible.
Management’s judgment in determining the adequacy of the allowance is based on
evaluations of the collectability of loans while taking into consideration such
factors as changes in the nature and volume of the loan portfolio, current
economic conditions which may affect a borrower’s ability to repay, overall
portfolio quality, and review of specific potential losses. This evaluation is
inherently subjective, as it requires estimates that are susceptible to
significant revision as more information becomes available.
The
allowance consists of specific and general components. The specific component
relates to loans that are classified as doubtful, substandard or special
mention. For such loans that are also classified as impaired, an allowance is
established when the discounted cash flows (or collateral value or observable
market price) of the impaired loan is lower than the carrying value of that
loan. The general component covers non-classified loans and is based on
historical loss experience adjusted for qualitative factors.
A loan is
considered impaired when, based on current information and events, it is
probable that the Corporation will be unable to collect the scheduled payments
of principal or interest when due according to the contractual terms of the loan
agreement. Factors considered by management in determining impairment include
payment status, collateral value, and the probability of collecting scheduled
principal and interest payments when due. Loans that experience insignificant
payment delays and payment shortfalls generally are not classified as impaired.
Management determines the significance of payment delays and payment shortfalls
on a case-by-case basis, taking into consideration all of the circumstances
surrounding the loan and the borrower, including the length of the delay, the
reasons for the delay, the borrower’s prior payment record, and the amount of
the shortfall in relation to the principal and interest owed. Impairment is
measured on a loan by loan basis by either the present value of the expected
future cash flows discounted at the loan’s effective interest rate, the loan’s
obtainable market price, or the fair value of the collateral if the loan is
collateral dependent.
43
Notes
to Consolidated Financial Statements
Derivative Financial
Instruments - The Mortgage Corporation enters into commitments to fund
residential mortgage loans with the intention of selling them in the secondary
market. The Mortgage Corporation also enters into forward sales agreements for
certain funded loans and loan commitments. The Mortgage Corporation records
unfunded commitments intended for loans held for sale and forward sales
agreements at fair value with changes in fair value recorded as a component of
other income. Loans originated and intended for sale in the secondary market are
carried at fair value. For pipeline loans which are not pre-sold to an investor,
the Mortgage Corporation manages the interest rate risk on rate lock commitments
by entering into forward sale contracts of mortgage backed securities, whereby
the Mortgage Corporation obtains the right to deliver securities to investors in
the future at a specified price. Such contracts are accounted for as derivatives
and are recorded at fair value in derivative assets or liabilities, with changes
in fair value recorded in other income.
The
Corporation has determined these derivative financial instruments do not meet
the hedging criteria required by FASB ASC 815 and has not designated these
derivative financial instruments as hedges. Accordingly, changes in
fair value are recognized currently in income.
Premises and Equipment -
Premises and equipment are stated at cost less accumulated depreciation.
Premises and equipment are depreciated over their estimated useful lives;
leasehold improvements are amortized over the lives of the respective leases or
the estimated useful life of the leasehold improvement, whichever is less.
Depreciation is computed using the straight-line method over the estimated
useful lives of 39 years for office buildings and 3 to 15 years for furniture,
fixtures, and equipment. Costs of maintenance and repairs are expensed as
incurred; improvements and betterments are capitalized. When items are retired
or otherwise disposed of, the related costs and accumulated depreciation are
removed from the accounts and any resulting gains or losses are included in the
determination of net income.
Real Estate Owned - Real
estate properties acquired through loan foreclosures are recorded initially at
fair value, less expected sales costs. Subsequent valuations are
performed by management, and the carrying amount of a property is adjusted by a
charge to expense to reflect any subsequent declines in estimated fair
value. Fair value estimates are based on recent appraisals and
current market conditions. Gains or losses on sales of real estate
owned are recognized upon disposition. Real estate owned is included
in other assets. At December 31, 2009 real estate owned totaled $5.1
million. At December 31, 2008 real estate owned totaled $4.5
million.
Income Taxes - Income tax
expense is the total of the current year income tax due or refundable, the
change in deferred tax assets and liabilities, and any adjustments related to
unrecognized tax benefits. Deferred income tax assets and liabilities
are determined using the balance sheet method. Under this method, the net
deferred tax asset or liability is determined based on the tax effects of the
temporary differences between the book and tax bases of the various balance
sheet assets and liabilities and gives current recognition to changes in tax
rates and laws. Deferred tax assets are reduced by a valuation allowance when,
in the opinion of management, it is more likely than not that some portion or
all of the deferred tax assets will not be realized. The Corporation has not
identified any material uncertain tax positions.
Stock-Based Compensation Plans
– The Corporation uses the modified prospective method. In accordance
with FASB ASC 718-10, the Corporation measures the cost of employee services
received in exchange for an award of equity instruments based on the fair value
of the award on the grant date. That cost is recognized over the
period during which the employee is required to provide service in exchange for
the award, the requisite service period. No compensation expense is
recognized for equity instruments for which employees do not render the
requisite service. The Corporation determines the fair value of the
employee stock options using the Black-Scholes option pricing
model.
Earnings Per Share - Basic
earnings per share represents income available to common shareholders divided by
the weighted-average number of shares outstanding during the period. Diluted
earnings per share reflect additional common shares that would have been
outstanding if dilutive potential common shares had been issued, as well as any
adjustment to income that would result from the assumed issuance. Common
equivalent shares are excluded from the computation if their effect is
antidilutive.
Fair Value Measurements -
The Corporation records certain of its assets and liabilities at fair value.
Fair value is defined as the exchange price that would be received for an asset
or paid to transfer a liability (an exit price) in the principal or most
advantageous market for the asset or liability in an orderly transaction between
market participants on the measurement date. Fair value measurements are
classified within one of three levels in a valuation hierarchy based upon the
transparency of inputs to the valuation of an asset or liability as of the
measurement date. The three levels are defined as follows:
Level 1 —
Quoted prices (unadjusted) for identical assets or liabilities in active
markets that the entity has the ability to access as of the measurement
date.
Level 2 -
Significant other observable inputs other than Level 1 prices such as quoted
prices for similar assets or liabilities; quoted prices in markets that are not
active; or other inputs that are observable or can be corroborated by observable
market data.
44
Notes
to Consolidated Financial Statements
Level 3 -
Significant unobservable inputs that reflect a company’s own assumptions about
the assumptions that market participants would use in pricing an asset or
liability.
A
financial instrument’s categorization within the valuation hierarchy is based
upon the lowest level of input that is significant to the fair value
measurement.
See
Note 18 - Fair Value Measurements.
Advertising Costs - The
Corporation follows the policy of charging the costs of advertising to expense
as incurred.
Recent
Accounting Pronouncements
FASB ASC 820-10 - In February 2008,
the FASB issued new guidance impacting FASB ASC 820-10, Fair Value Measurements
and Disclosures (FASB Staff Position No. 157-2, Effective Date of FASB
Statement No. 15). The staff position
delays the effective date of FASB ASC 820-10 (SFAS No. 157, Fair
Value Measurements) for non-financial assets and non-financial liabilities,
except for items that are recognized or disclosed at fair value in the financial
statements on a recurring basis. The delay expired January 1, 2009, and the
expiration of the delay did not have an impact on the Corporation’s consolidated
financial statements.
FASB ASC 815-10 -In March 2008, the
FASB issued FASB ASC 815-10, Derivatives and Hedging (Statement No. 161
- Disclosures
about Derivative Instruments and Hedging Activities – an amendment of FASB
Statement No. 133). FASB ASC 815-10 requires enhanced disclosures about how
and why an entity uses derivative instruments, how derivative instruments and
related items are accounted for and how derivative instruments and related
hedged items affect an entity’s financial position, financial performance and
cash flows. The new standard became effective for the Corporation on January 1,
2009. The adoption of this standard did not have a material impact on the
Corporation’s consolidated financial statements and the required disclosures
have been included.
FASB ASC 855 - In May 2009, the
FASB issued FASB ASC 855, Subsequent Events (Statement No. 165 - Subsequent Events).
FASB ASC 855 establishes the period after the balance sheet date during which
management shall evaluate events or transactions that may occur for potential
recognition or disclosure in the financial statements and the circumstances
under which an entity shall recognize events or transactions that occur after
the balance sheet date. The Corporation adopted this standard for the interim
reporting period ending June 30, 2009. The adoption of this standard did
not have a material impact on the Corporation’s consolidated financial
statements.
FASB ASC 860 - In June 2009, the FASB
issued new guidance impacting FASB ASC 860, Transfers and Servicing (Statement
No. 166 - Accounting for
Transfers of Financial Assets - an amendment of FASB Statement No. 140).
The new guidance removes the concept of a qualifying special-purpose entity and
limits the circumstances in which a financial asset, or portion of a financial
asset, should be derecognized when the transferor has not transferred the entire
financial asset to an entity that is not consolidated with the transferor in the
financial statements being presented and/or when the transferor has continuing
involvement with the transferred financial asset. The new standard became
effective for the Corporation on January 1, 2010 and did not have a
material impact on the Corporation’s consolidated financial
statement.
FASB ASC 825-10-50 - In
April 2009, the FASB issued new guidance impacting FASB ASC 825-10-50,
Financial Instruments (FASB Staff Position No. FAS 107-1 and APB 28-1,
Interim Disclosures about Fair Value of Financial Instruments). This guidance
amends existing GAAP to require disclosures about fair values of financial
instruments for interim reporting periods as well as in annual financial
statements. The guidance also amends existing GAAP to require those disclosures
in summarized financial information at interim reporting periods. The
Corporation adopted this standard for the interim reporting period ending
March 31, 2009 and it did not have a material impact on the
Corporation’s consolidated financial statements.
FASB ASC 320-10 - In
April 2009, the FASB issued new guidance impacting FASB ASC 320-10,
Investments-Debt and Equity Securities (FASB Staff Position No. FAS 115-2
and FAS 124-2, Recognition and
Presentation of Other-Than-Temporary Impairments). This guidance amends the
other-than-temporary impairment guidance in U.S. GAAP for debt securities. If an
entity determines that it has an other-than-temporary impairment on a security,
it must recognize the credit loss on the security in the income statement. The
credit loss is defined as the difference between the present value of the cash
flows expected to be collected and the amortized cost basis. FASB ASC 320-10
expands disclosures about other-than-temporary impairment and requires that the
annual disclosures under existing GAAP be made for interim reporting periods.
The Corporation adopted this guidance for the interim reporting period ending
March 31, 2009 and it did not have a material impact on the Corporation’s
consolidated financial statements.
45
Notes
to Consolidated Financial Statements
FASB ASC 820 - In
April 2009, the FASB issued new guidance impacting FASB ASC 820, Fair Value
Measurements and Disclosures (FASB Staff Position No. FAS
157-4, Determining Fair Value When the Volume and Level of Activity for the
Asset or Liability Have Significantly Decreased and Identifying Transactions
That Are Not Orderly). This provides additional guidance on determining fair
value when the volume and level of activity for the asset or liability have
significantly decreased when compared with normal market activity for the asset
or liability. A significant decrease in the volume or level of activity for the
asset or liability is an indication that transactions or quoted prices may not
be determinative of fair value because transactions may not be orderly. In that
circumstance, further analysis of transactions or quoted prices is needed, and
an adjustment to the transactions or quoted prices may be necessary to estimate
fair value. The Corporation adopted this guidance for the interim reporting
period ending March 31, 2009 and it did not have a material impact on the
Corporation’s consolidated financial statements.
SAB 111 - In April 2009, the
Securities and Exchange Commission issued Staff Accounting Bulletin No. 111
(“SAB 111”). SAB 111 amends Topic 5.M. in the Staff Accounting Bulletin series
entitled Other Than Temporary Impairment of Certain Investments in Debt and
Equity Securities. On April 9, 2009, the FASB issued new guidance impacting
FASB ASC 320-10, Investments - Debt and Equity Securities (FASB Staff Position
No. FAS 115-2 and FAS 124-2, Recognition and Presentation of
Other-Than-Temporary Impairments). SAB 111 maintains the previous views related
to equity securities and amends Topic 5.M. to exclude debt securities from its
scope. SAB 111 was effective for the Corporation as of March 31, 2009.
There was no material impact to the Corporation’s consolidated financial
statements.
FASB ASC 323 - In November 2008, the
FASB Emerging Issues Task Force reached a consensus on FASB ASC 323, Investments
- Equity Method and Joint Ventures (Issue No. 08-6, Equity Method
Investment Accounting Considerations). The new guidance clarifies the accounting
for certain transactions and impairment considerations involving equity method
investments. An equity investor shall not separately test an investee’s
underlying assets for impairment but will recognize its share of any impairment
charge recorded by an investee in earnings and consider the effect of the
impairment on its investment. An equity investor shall account for a share
issuance by an investee as if the investor had sold a proportionate share of its
investment, with any gain or loss recognized in earnings. The new guidance
became effective for the Corporation on January 1, 2009 and did not have a
material impact on the Corporation’s consolidated financial
statements.
FASB ASC 820-10 – In
August 2009, the FASB issued an update (ASC No. 2009-05, Measuring
Liabilities at Fair Value) impacting FASB ASC 820-10, Fair Value Measurements
and Disclosures. The update provides clarification about measuring liabilities
at fair value in circumstances where a quoted price in an active market for an
identical liability is not available and the valuation techniques that should be
used. The update also clarifies that when estimating the fair value of a
liability, a reporting entity is not required to include a separate input or
adjustment to other inputs relating to the existence of a restriction that
prevents the transfer of the liability. This update became effective for the
Corporation for the reporting period ending September 30, 2009 and did not
have a material impact on the Corporation’s consolidated financial
statements.
FASB ASC 820-10 - In
January 2010, the FASB issued an update (ASC No. 2010-06, Improving
Disclosures about Fair Value Measurements) impacting FASB ASC 820-10, Fair Value
Measurements and Disclosures. The amendments in this update require new
disclosures about significant transfers in and out of Level 1 and Level 2 fair
value measurements. The amendments also require a reporting entity to provide
information about activity for purchases, sales, issuances and settlements in
Level 3 fair value measurements and clarify disclosures about the level of
disaggregation and disclosures about inputs and valuation techniques. This
update becomes effective for the Corporation for interim and annual reporting
periods beginning after December 15, 2009. The Corporation is currently
evaluating the impact of adopting the new guidance on the consolidated financial
statements.
46
Notes
to Consolidated Financial Statements
Note
2. Securities
Amortized
costs and fair values of the securities available for sale as of December 31,
2009 and 2008 are as follows:
|
December 31, 2009
|
||||||||||||||||
|
Amortized Cost
|
Gross
Unrealized
Gains
|
Gross
Unrealized
(Losses)
|
Estimated
Fair Value
|
|||||||||||||
|
(In
Thousands)
|
||||||||||||||||
|
U.S.
Treasury notes
|
$ | - | $ | - | $ | - | $ | - | ||||||||
|
U.S.
Government agencies
|
40,022 | 144 | (12 | ) | 40,154 | |||||||||||
|
Mortgage
backed securities
|
808 | - | (65 | ) | 743 | |||||||||||
|
Municipals
- taxable
|
690 | 9 | - | 699 | ||||||||||||
|
CRA
Mutual fund
|
1,500 | - | (1 | ) | 1,499 | |||||||||||
|
Restricted
stock:
|
||||||||||||||||
|
Federal
Reserve Bank stock
|
894 | - | - | 894 | ||||||||||||
|
FHLB
stock
|
3,849 | - | - | 3,849 | ||||||||||||
| $ | 47,763 | $ | 153 | $ | (78 | ) | $ | 47,838 | ||||||||
|
December 31, 2008
|
||||||||||||||||
|
Amortized Cost
|
Gross
Unrealized
Gains
|
Gross
Unrealized
(Losses)
|
Estimated
Fair Value
|
|||||||||||||
|
(In
Thousands)
|
||||||||||||||||
|
U.S.
Treasury notes
|
$ | 999 | $ | 7 | $ | - | $ | 1,006 | ||||||||
|
U.S.
Government agencies
|
74,934 | 1,420 | - | 76,354 | ||||||||||||
|
Mortgage
backed securities
|
1,428 | 2 | (39 | ) | 1,391 | |||||||||||
|
Municipals
- taxable
|
5,006 | 3 | (89 | ) | 4,920 | |||||||||||
|
CRA
Mutual fund
|
1,500 | - | (52 | ) | 1,448 | |||||||||||
|
Restricted
stock:
|
||||||||||||||||
|
Federal
Reserve Bank stock
|
894 | - | - | 894 | ||||||||||||
|
FHLB
stock
|
5,002 | - | - | 5,002 | ||||||||||||
| $ | 89,763 | $ | 1,432 | $ | (180 | ) | $ | 91,015 | ||||||||
47
Notes
to Consolidated Financial Statements
Note
2. Securities (continued)
The
amortized cost and estimated fair value of securities available for sale as of
December 31, 2009 by contractual maturities are shown below. Actual
maturities may differ from contractual maturities because the securities may be
called or prepaid without any penalties.
|
December
31, 2009
|
||||||||
|
Estimated
|
||||||||
|
Amortized
|
Fair
|
|||||||
|
Cost
|
Value
|
|||||||
|
(In
Thousands)
|
||||||||
|
US
Treasury and Agencies
|
||||||||
|
Due
in one year or less
|
$ | 5,125 | $ | 5,145 | ||||
|
Due
after one through five years
|
15,000 | 15,023 | ||||||
|
Due
after five through ten years
|
19,896 | 19,986 | ||||||
|
Municipals
– taxable
|
||||||||
|
Due
after one through five years
|
690 | 699 | ||||||
|
Due
after five through ten years
|
- | - | ||||||
|
Mortgage
Backed Securities:
|
||||||||
|
Due
in one year or less
|
33 | 33 | ||||||
|
Due
after one through five years
|
- | - | ||||||
|
Due
after fifteen years
|
776 | 710 | ||||||
|
CRA
Mutual fund
|
1,500 | 1,499 | ||||||
|
Restricted
Stock:
|
||||||||
|
Federal
Reserve Bank stock
|
894 | 894 | ||||||
|
FHLB
stock
|
3,849 | 3,849 | ||||||
| $ | 47,763 | $ | 47,838 | |||||
The
estimated fair value of securities pledged to secure public funds; securities
sold under agreements to repurchase, and for other purposes amounted to
$40,187,000 at December 31, 2009 and $62,779,000 at December 31,
2008.
48
Notes
to Consolidated Financial Statements
Note
2. Securities (continued)
Investment
securities available for sale that have an unrealized loss position at December
31, 2009 and December 31, 2008 are detailed below.
|
Securities in a loss
|
Securities in a loss
|
|||||||||||||||||||||||
|
Position for less than
|
Position for 12 Months
|
|||||||||||||||||||||||
|
12 Months
|
or Longer
|
Total
|
||||||||||||||||||||||
|
December 31, 2009
|
Fair
|
Unrealized
|
Fair
|
Unrealized
|
Fair
|
Unrealized
|
||||||||||||||||||
|
Value
|
Losses
|
Value
|
Losses
|
Value
|
Losses
|
|||||||||||||||||||
|
(In
Thousands)
|
||||||||||||||||||||||||
|
Investment
securities available for sale:
|
||||||||||||||||||||||||
|
U.S.
Treasury securities
|
$ | - | $ | - | $ | - | $ | - | $ | - | $ | - | ||||||||||||
|
Mortgage
backed securities
|
- | - | 710 | (65 | ) | 710 | (65 | ) | ||||||||||||||||
|
U.S.
Government agencies
|
9,988 | (12 | ) | - | - | 9,988 | (12 | ) | ||||||||||||||||
|
Municipals
- taxable
|
- | - | - | - | - | - | ||||||||||||||||||
|
Municipals
- tax exempt
|
- | - | - | - | - | - | ||||||||||||||||||
|
CRA
Mutual fund
|
- | - | 1,499 | (1 | ) | 1,499 | (1 | ) | ||||||||||||||||
|
Total
|
$ | 9,988 | $ | (12 | ) | $ | 2,209 | $ | (66 | ) | $ | 12,197 | $ | (78 | ) | |||||||||
|
Securities in a loss
|
Securities in a loss
|
|||||||||||||||||||||||
|
Position for less than
|
Position for 12 Months
|
|||||||||||||||||||||||
|
12 Months
|
or Longer
|
Total
|
||||||||||||||||||||||
|
December
31, 2008
|
Fair
|
Unrealized
|
Fair
|
Unrealized
|
Fair
|
Unrealized
|
||||||||||||||||||
|
Value
|
Losses
|
Value
|
Losses
|
Value
|
Losses
|
|||||||||||||||||||
|
(In
Thousands)
|
||||||||||||||||||||||||
|
Investment
securities available for sale:
|
||||||||||||||||||||||||
|
U.S.
Treasury securities
|
$ | - | $ | - | $ | - | $ | - | $ | - | $ | - | ||||||||||||
|
Mortgage
backed securities
|
881 | (39 | ) | - | - | 881 | (39 | ) | ||||||||||||||||
|
U.S.
Government agencies
|
- | - | - | - | - | - | ||||||||||||||||||
|
Municipals
- taxable
|
4,012 | (89 | ) | - | - | 4,012 | (89 | ) | ||||||||||||||||
|
Municipals
- tax exempt
|
- | - | - | - | - | - | ||||||||||||||||||
|
CRA
Mutual fund
|
- | - | 1,448 | (52 | ) | 1,448 | (52 | ) | ||||||||||||||||
|
Total
|
$ | 4,893 | $ | (128 | ) | $ | 1,448 | $ | (52 | ) | $ | 6,341 | $ | (180 | ) | |||||||||
Management
does not believe that any individual unrealized loss as of December 31, 2009 and
December 31, 2008 is other than a temporary impairment. These
unrealized losses are primarily attributable to changes in interest
rates. The Corporation has the ability to hold these securities for a
time necessary to recover the amortized cost or until maturity when full
repayment would be received.
49
Notes
to Consolidated Financial Statements
Note
3. Loans
The
composition of net loans is summarized as follows:
|
December
31,
|
||||||||
|
2009
|
2008
|
|||||||
|
|
(In
Thousands)
|
|||||||
|
Loans
secured by real estate:
|
||||||||
|
Real
estate construction
|
$ | 41,508 | $ | 42,600 | ||||
|
Residential
|
150,792 | 153,740 | ||||||
|
Commercial
real estate
|
220,301 | 218,539 | ||||||
|
Commercial
|
72,628 | 69,537 | ||||||
|
Consumer
and other
|
1,335 | 1,513 | ||||||
|
Total
loans
|
486,564 | 485,929 | ||||||
|
Less
allowance for loan losses
|
9,127 | 7,462 | ||||||
|
Net
loans
|
$ | 477,437 | $ | 478,467 | ||||
Note
4. Allowance for Loan Losses
Changes
in the allowance for loan losses were as follows:
|
December
31,
|
||||||||||||
|
2009
|
2008
|
2007
|
||||||||||
|
(In
Thousands)
|
||||||||||||
|
Balance
at beginning of year
|
$ | 7,462 | $ | 7,462 | $ | 5,452 | ||||||
|
Provision
charged to operating expense
|
6,064 | 5,423 | 2,588 | |||||||||
|
Loan
recoveries
|
911 | 137 | 2 | |||||||||
|
Loan
charge-offs
|
(5,310 | ) | (5,560 | ) | (580 | ) | ||||||
|
Balance
at end of year
|
$ | 9,127 | $ | 7,462 | $ | 7,462 | ||||||
Non-accrual
loans amounted to $7,032,000 at December 31, 2009 and $2,875,000 at December 31,
2008 and $1,661,000 at December 31, 2007. If interest had been accrued, such
income would have been approximately $373,000, $54,000 and $91,000
respectively.
50
Notes
to Consolidated Financial Statements
Note
5. Non-performing Assets and Accruing Loans Past Due 90 Days or
More
The
following table summarizes non-performing assets.
|
December 31,
|
||||||||
|
2009
|
2008
|
|||||||
|
(Dollars
In Thousands)
|
||||||||
|
Non-accrual
loans:
|
||||||||
|
Commercial
|
$ | 208 | $ | 74 | ||||
|
Commercial
real estate
|
3,631 | 22 | ||||||
|
Real
estate construction
|
1,689 | 2,678 | ||||||
|
Residential
real estate
|
1,504 | - | ||||||
|
Consumer
and other
|
- | 101 | ||||||
|
Total
non-accrual loans
|
7,032 | 2,875 | ||||||
|
Other
real estate owned ("OREO")
|
5,111 | 4,455 | ||||||
|
Total
non-performing assets
|
$ | 12,143 | $ | 7,330 | ||||
|
Ratio
of non-performing assets to:
|
||||||||
|
Total
loans plus OREO
|
2.47 | % | 1.49 | % | ||||
|
Total
assets
|
1.82 | % | 1.04 | % | ||||
|
Accruing
past due loans:
|
||||||||
|
90
or more days past due
|
$ | - | $ | - | ||||
Note
6. Premises and Equipment
Premises
and equipment, net, are summarized as follows:
|
December
31,
|
||||||||
|
2009
|
2008
|
|||||||
|
(In
Thousands)
|
||||||||
|
Land
|
$ | 2,549 | $ | 2,549 | ||||
|
Premises
|
5,765 | 5,749 | ||||||
|
Leasehold
improvements
|
1,182 | 1,182 | ||||||
|
Furniture
and equipment
|
3,125 | 3,132 | ||||||
| 12,621 | 12,612 | |||||||
|
Less
accumulated depreciation
|
(3,862 | ) | (3,401 | ) | ||||
| $ | 8,759 | $ | 9,211 | |||||
Depreciation
and amortization expense included in operating expenses for the years ended
December 31, 2009, 2008, and 2007 was $565,000, $747,000, and $839,000
respectively.
51
Notes
to Consolidated Financial Statements
Note
7. Deposits
The
composition of deposits is summarized as follows at December 31, 2009 and
2008:
|
2009
|
2008
|
|||||||||||||||
|
Type of Account
|
Amount
|
%
|
Amount
|
%
|
||||||||||||
|
(Dollars
In Thousands)
|
||||||||||||||||
|
Interest
bearing demand deposits
|
$ | 25,918 | 5.55 | % | $ | 9,854 | 2.03 | % | ||||||||
|
Money
market deposit accounts
|
109,085 | 23.38 | % | 81,260 | 16.74 | % | ||||||||||
|
Savings
accounts
|
3,985 | 0.85 | % | 4,616 | 0.95 | % | ||||||||||
|
Time
deposits
|
257,875 | 55.27 | % | 314,671 | 64.83 | % | ||||||||||
|
Total
interest bearing deposits
|
396,863 | 85.05 | % | 410,401 | 84.55 | % | ||||||||||
|
Non-interest
bearing demand deposits
|
69,782 | 14.95 | % | 75,000 | 15.45 | % | ||||||||||
|
Total
deposits
|
$ | 466,645 | 100.00 | % | $ | 485,401 | 100.00 | % | ||||||||
The
aggregate amount of time deposits with a minimum denomination of $100,000 was
$162,897,000 and $77,893,000 at December 31, 2009 and 2008,
respectively.
At
December 31, 2009, the scheduled maturities of time deposits were as
follows:
|
Year
|
Amount
|
|||
|
(In
Thousands)
|
||||
|
2010
|
$ | 190,948 | ||
|
2011
|
36,418 | |||
|
2012
|
17,237 | |||
|
2013
|
6,640 | |||
|
2014
|
3,224 | |||
|
Later
years
|
3,408 | |||
| $ | 257,875 | |||
Brokered
deposits totaled $171,210,000 and $189,145,000 at December 31, 2009 and 2008,
respectively, which includes $41,550,000 and $61,355,000 respectively, in
reciprocal CDARS deposits.
52
Notes
to Consolidated Financial Statements
Note
8. Borrowings
Short-term
borrowings consist of the following at December 31, 2009 and 2008:
|
December 31,
|
||||||||
|
2009
|
2008
|
|||||||
|
(Dollars
In Thousands)
|
||||||||
|
Securities
sold under agreements to repurchase
|
$ | 26,804 | $ | 21,395 | ||||
|
Commercial
paper arrangements
|
16,517 | 26,136 | ||||||
|
FHLB
borrowings
|
20,178 | 44,333 | ||||||
|
Federal
funds purchased
|
- | 9,993 | ||||||
|
US
Treasury demand note
|
750 | 1,718 | ||||||
|
Total
|
$ | 64,249 | $ | 103,575 | ||||
|
Weighted
interest rate
|
1.96 | % | 1.10 | % | ||||
|
Average
for the year ended December 31:
|
||||||||
|
Outstanding
|
$ | 64,776 | $ | 50,749 | ||||
|
Interest
rate
|
1.95 | % | 2.26 | % | ||||
|
Maximum
month-end outstandings
|
$ | 73,201 | $ | 103,575 | ||||
53
Notes
to Consolidated Financial Statements
Note 8. Borrowings
(continued)
Short-term
borrowings consist of securities sold under agreements to repurchase, which are
secured transactions with customers and generally mature the day following the
date sold. Short-term borrowings also include short-term advances from the FHLB,
which are secured by mortgage-related loans and U.S. Government agencies
securities. The carrying value of the loans pledged as collateral for FHLB
advances total $179,239,000 at December 31, 2009 and $191,733,000 at December
31, 2008. In addition, the Mortgage Corporation engaged in unsecured commercial
paper arrangements payable on demand with commercial customers of the
Bank. U.S. Treasury demand notes are included in short-term
borrowings and are secured by securities issued by U.S. Government
agencies.
Long term
borrowings consists of the following at December 31, 2009 and 2008.
|
Long Term Borrowings
|
||||||||
|
December 31,
|
||||||||
|
2009
|
2008
|
|||||||
|
FHLB
long-term borrowings
|
$ | 16,333 | $ | 41,107 | ||||
|
Senior
unsecured term note
|
29,997 | - | ||||||
|
Subordinated
debenture
|
6,186 | 6,186 | ||||||
|
Total
|
$ | 52,516 | 47,293 | |||||
At
December 31, 2009, the Bank’s fixed-rate long-term debt with the FHLB totaled
$16,333,000 and matures through 2015. The interest rate on the fixed-rate notes
payable ranges from 2.55% to 4.97%.
The
contractual maturities of FHLB long-term debt at December 31, 2009 were as
follows:
|
Amount
|
||||
|
(In Thousands)
|
||||
|
Due
in 2011
|
$ | 7,083 | ||
|
Due
in 2013
|
3,250 | |||
|
Due
in 2014
|
2,250 | |||
|
Due
in 2015
|
3,750 | |||
|
Total
Due
|
$ | 16,333 | ||
The Bank
has remaining lines of credit available with the FHLB which totaled $156.9
million at December 31, 2009.
In 2009
the Bank issued $30.0 million in new senior unsecured debt at 2.74% maturing
February 15, 2012 under the Temporary Liquidity Guarantee program.
On
September 29, 2003, Access National Capital Trust II, a wholly-owned subsidiary
of the Corporation which was formed for the purpose of issuing redeemable trust
preferred securities, issued $6.2 million of trust preferred securities. The
securities have a LIBOR-indexed floating rate of interest. The interest rate at
December 31, 2009 was 3.48%. Interest is payable quarterly. The securities have
a mandatory redemption date of September 29, 2034 and are subject to varying
call provisions beginning January 7, 2009. The principal asset of the Trust is
$6.2 million of the Corporation’s junior subordinated debt securities with the
like maturities and like interest rates to the trust preferred
securities.
The trust
preferred securities may be included in Tier 1 capital for regulatory capital
adequacy determination purposes up to 25% of Tier 1 capital after its inclusion.
The portion of the trust preferred securities not considered as Tier 1 capital
may be included in Tier 2 capital.
The
obligations of the Corporation with respect to the issuance of the trust
preferred securities constitute a full and unconditional guarantee by the
Corporation of the Trust’s obligations with respect to the trust preferred
securities. Subject to certain exceptions and limitations, the Corporation may
elect from time to time to defer interest payments on the junior subordinated
debt securities, which would result in a deferral of distribution payments on
the related trust preferred securities.
54
Notes
to Consolidated Financial Statements
Note
9. Income Taxes
Net
deferred tax assets consisted of the following components as of December 31,
2009 and 2008:
|
Year Ended December 31,
|
||||||||
|
2009
|
2008
|
|||||||
|
(In Thousands)
|
||||||||
|
Deferred
tax assets:
|
||||||||
|
Allowance
for loan losses
|
$ | 3,103 | $ | 2,537 | ||||
|
Deferred
fees
|
509 | 415 | ||||||
|
Allowance
for losses on mortgage loans sold
|
1,287 | 556 | ||||||
|
Other
|
622 | 481 | ||||||
| 5,521 | 3,989 | |||||||
|
Deferred
tax liability:
|
||||||||
|
Depreciation
|
91 | 84 | ||||||
|
Securities
available for sale
|
26 | 426 | ||||||
| 117 | 510 | |||||||
|
Net
deferred tax assets included in other assets
|
$ | 5,404 | $ | 3,479 | ||||
The
provision for income taxes charged to operations for the years ended
December 31, 2009, 2008 and 2007 consisted of the following:
|
Year Ended December 31,
|
||||||||||||
|
2009
|
2008
|
2007
|
||||||||||
|
(In
Thousands)
|
||||||||||||
|
Current
tax expense
|
$ | 7,379 | $ | 3,606 | $ | 2,696 | ||||||
|
Deferred
tax (benefit)
|
(1,525 | ) | (906 | ) | (1,106 | ) | ||||||
| $ | 5,854 | $ | 2,700 | $ | 1,590 | |||||||
55
Notes
to Consolidated Financial Statements
The
income tax provision differs from the amount of income tax determined by
applying the U.S. Federal income tax rate to pretax income for the years ended
December 31, 2009, 2008 and 2007 as follows:
|
Year Ended December 31,
|
||||||||||||
|
2009
|
2008
|
2007
|
||||||||||
|
(In
Thousands)
|
||||||||||||
|
Computed
"expected" tax expense at 34%
|
$ | 5,266 | $ | 2,531 | $ | 1,799 | ||||||
|
Increase
(decrease) in income taxes resulting from:
|
||||||||||||
|
State
income taxes
|
532 | 144 | (180 | ) | ||||||||
|
Other
|
56 | 25 | (29 | ) | ||||||||
| $ | 5,854 | $ | 2,700 | $ | 1,590 | |||||||
Note
10. Commitments and Contingent Liabilities
The
Corporation is committed under non-cancelable and month-to-month operating
leases for its office locations. Rent expense associated with these operating
leases for the years ended December 31, 2009, 2008 and 2007 totaled $1,015,000,
$958,000 and $932,000 respectively.
The
following is a schedule of future minimum lease payments required under
operating leases that have initial or remaining lease terms in excess of one
year.
|
Year
|
Amount
|
|||
|
(In
Thousands)
|
||||
|
2010
|
$ | 390 | ||
|
2011
|
399 | |||
|
2012
|
411 | |||
|
2013
|
424 | |||
|
2014
|
316 | |||
| $ | 1,940 | |||
In the
normal course of business, there are outstanding various commitments and
contingent liabilities, which are not reflected in the accompanying financial
statements. The Corporation does not anticipate any material loss as a result of
these transactions. See Note 11 for additional
information.
56
Notes
to Consolidated Financial Statements
Note
10. Commitments and Contingent Liabilities (continued)
As part
of its mortgage banking activities, the Mortgage Corporation enters into
interest rate lock commitments, which are commitments to originate loans whereby
the interest rate on the loan is determined prior to funding and the customers
have locked into that interest rate. The Mortgage Corporation then either locks
the loan and rate in with an investor and commits to deliver the loan if
settlement occurs (“Best Efforts”) or commits to deliver the locked loan in a
binding (“Mandatory”) delivery program with an investor. Certain loans under
rate lock commitments are covered under forward sales contracts of
mortgage-backed securities (“MBS”). Forward sales contracts of MBS are
recorded at fair value with changes in fair value recorded in non-interest
income. Interest rate lock commitments and commitments to deliver
loans to investors are considered derivatives. The market value of
interest rate lock commitments and best efforts contracts are not readily
ascertainable with precision because they are not actively traded in
stand-alone markets. The Mortgage Corporation determines the fair
value of rate lock commitments and delivery contracts by measuring the fair
value of the underlying asset, which is impacted by current interest rates and
taking into consideration the probability that the rate lock commitments will
close or will be funded.
Since the
Mortgage Corporation’s derivative instruments are not designated as hedging
instruments, the fair value of the derivatives are recorded as a freestanding
asset or liability with the change in value being recognized in current earnings
during the period of change.
At
December 31, 2009 and 2008 the Mortgage Corporation had open forward contracts
(Mandatory and MBS) with a notional value of $61,471,000 and $99,179,000,
respectively. The open forward delivery contracts are composed of $22,721,000
and $74,929,000 under mandatory delivery programs and $38,750,000 and
$24,250,000 of forward sales of MBS at December 31, 2009 and 2008, respectively.
The fair value of these open forward contracts was $61,893,000 and $99,240,000
respectively. Certain additional risks arise from these forward
delivery contracts in that the counterparties to the contracts may not be able
to meet the terms of the contracts. The Mortgage Corporation does not
expect any counterparty to fail to meet its obligation. Additional
risks inherent in mandatory delivery programs include the risk that if the
Mortgage Corporation does not close the loans subject to interest rate risk lock
commitments, they will be obligated to deliver MBS to the counterparty under the
forward sales agreement. Should this be required, the Mortgage
Corporation could incur significant costs in acquiring replacement loans or MBS
and such costs could have an adverse effect on mortgage banking operations in
future periods.
Interest
rate lock commitments totaled $41,483,000 and $32,646,000 at December 31, 2009
and 2008, respectively, and included $7,956,000 and $10,029,000 that were made
on a Best Efforts basis at December 31, 2009 and 2008, respectively. Fair values
of these best efforts commitments were $7,999,000 and $10,074,000 at December
31, 2009 and 2008, respectively. The remaining hedged interest rate
lock commitments totaling $33,527,000 and $22,617,000 at December 31 2009 and
2008 had a fair value of $33,201,000 and $22,612,000 respectively.
The
Mortgage Corporation makes representations and warranties that loans sold to
investors meet their program’s guidelines and that the information provided by
the borrowers is accurate and complete. In the event of a default on a loan
sold, the investor may make a claim for losses due to document deficiencies,
program compliance, early payment default, and fraud or borrower
misrepresentations. The
Mortgage Corporation maintains a reserve in other liabilities for potential
losses on mortgage loans sold. At December 31, 2009 and 2008 the
balance in this reserve totaled approximately $3.3 million and $1.4 million
respectively.
Allowance For Losses on Mortgage Loans Sold
|
December 31,
|
||||||||
|
2009
|
2008
|
|||||||
|
Balance
at beginning of year
|
$
|
1,439
|
$
|
119
|
||||
|
Provision
charged to operating expense
|
5,050
|
2,095
|
||||||
|
Recoveries
|
16
|
16
|
||||||
|
Charge-offs
|
(3,173
|
)
|
(791
|
)
|
||||
|
Balance
at end of year
|
3,332
|
1,439
|
||||||
57
Notes
to Consolidated Financial Statements
Note
11. Financial Instruments with Off-Balance-Sheet Risk
The
Corporation is a party to financial instruments with off-balance-sheet risk in
the normal course of business to meet the financing needs of its customers.
These financial instruments consist primarily of commitments to extend credit.
These instruments involve, to varying degrees, elements of credit risk in excess
of the amount recognized in the balance sheet. The contract or notional amounts
of those instruments reflect the extent of involvement the Corporation has in
particular classes of financial instruments.
Commitments
to extend credit are agreements to lend to a customer as long as there is no
violation of any condition established in the contract. Commitments generally
have fixed expiration dates or other termination clauses and may require payment
of a fee by the customer. Since many of the commitments are expected to expire
without being drawn upon, the total commitment amounts do not necessarily
represent future cash requirements. The Corporation evaluates each customer’s
creditworthiness on a case-by-case basis. The amount of collateral, if any,
deemed necessary by the Corporation upon extension of credit is based on
management’s credit evaluation of the counterparty. Collateral normally consists
of real property, liquid assets or business assets. The Corporation had
approximately $15,266,000 and $20,911,000 in outstanding commitments at December
31, 2009 and 2008, respectively.
The
Corporation’s exposure to credit loss in the event of nonperformance by the
other party to the financial instrument for commitments to extend credit is
represented by the contractual notional amount of those instruments. The
Corporation uses the same credit policies in making commitments and conditional
obligations as it does for on-balance-sheet instruments. The Corporation had
approximately $119,590,000 and $93,911,000 in unfunded lines of credit whose
contract amounts represent credit risk at December 31, 2009 and 2008,
respectively.
Standby
letters of credit are conditional commitments issued by the Corporation to
guarantee the performance of a customer to a third party. Those letters of
credit are primarily issued to support public and private borrowing
arrangements. Essentially all letters of credit issued have expiration dates
within one year. The credit risk involved in issuing letters of credit is
essentially the same as that involved in extending loan facilities to customers.
The Corporation generally holds collateral supporting those commitments if
deemed necessary. The Corporation had standby letters of credit outstanding in
the amount of $6,033,000 and $5,704,000 at December 31, 2009 and 2008,
respectively.
In
addition to the above, the Corporation is subject to risks related to the
mortgage origination operations of the Mortgage Corporation. See Note
10 for a discussion of those risks.
58
Notes
to Consolidated Financial Statements
Note
12. Related Party Transactions
The
Corporation has had, and may be expected to have in the future, banking
transactions in the ordinary course of business with directors, principal
officers, their immediate families and affiliated companies in which they are
principal shareholders (commonly referred to as related parties), on the same
terms, including interest rates and collateral, as those prevailing at the time
for comparable transactions with others. These related parties were indebted to
the Corporation for loans totaling $12,373,000 and $13,984,000 at December 31,
2009 and 2008, respectively. During 2009, total principal additions were
$3,124,000 and total principal payments and changes in related parties were
$4,375,000. The aggregate amount of deposits at December 31, 2009 and 2008 from
directors and officers was $21,032,000 and $19,187,000
respectively.
Note
13. Stock Option Plan
The
Corporation’s 1999 Stock Option Plan approved by shareholders at the 2000 Annual
Meeting of Shareholders expired in 2009 and no new grants will be issued under
this plan.
The
Corporation established the Access National Corporation 2009 Stock Option Plan
(“the Plan”) and it was approved by shareholders on May 19, 2009. The
Plan reserves 975,000 shares of the Corporation’s common stock, $0.835 par
value, for issuance under the Plan. The Plan allows for
incentive stock options to be granted with an exercise price equal to the fair
market value at the date of grant. The expiration date on options
granted is three and one half years from the grant date.
Total
compensation cost for share-based payment arrangements recognized in 2009, 2008
and 2007 was $162,000,
$136,000
and $99,000 respectively.
Cash
received from option exercises under share-based payment arrangements for 2009,
2008 and 2007 was $624,000, $399,000 and $300,000 respectively.
59
Notes
to Consolidated Financial Statements
Note
13. Stock Option Plan (continued)
Changes in the
stock options outstanding under the plans are summarized as
follows:
|
2009
|
2008
|
2007
|
||||||||||||||||||||||
|
Weighted
|
Weighted
|
Weighted
|
||||||||||||||||||||||
|
Number of
|
Average
|
Number of
|
Average
|
Number of
|
Average
|
|||||||||||||||||||
|
Options
|
Exercise Price
|
Options
|
Exercise Price
|
Options
|
Exercise Price
|
|||||||||||||||||||
|
Outstanding
at beginning of year
|
589,617 | $ | 5.96 | 713,624 | $ | 6.07 | 815,244 | $ | 4.80 | |||||||||||||||
|
Granted
|
106,750 | 4.08 | 97,375 | 6.29 | 80,900 | 9.47 | ||||||||||||||||||
|
Exercised
|
184,452 | 3.38 | 137,682 | 2.89 | 178,320 | 1.68 | ||||||||||||||||||
|
Lapsed
or canceled
|
72,836 | 6.82 | 83,700 | 12.35 | 4,200 | 11.23 | ||||||||||||||||||
|
Outstanding
at end of year
|
439,079 | $ | 6.44 | 589,617 | $ | 5.96 | 713,624 | $ | 6.07 | |||||||||||||||
|
Options
exercisable at end of year
|
256,404 | $ | 7.43 | 426,892 | $ | 5.28 | 605,454 | $ | 5.61 | |||||||||||||||
Options
outstanding at year end 2009 were as follows:
|
Options Outstanding
|
Options Exercisable
|
|||||||||||||||||||||||||
|
Weighted-
|
Weighted-
|
|||||||||||||||||||||||||
|
Average
|
Weighted
|
Average
|
Weighted
|
|||||||||||||||||||||||
|
Range of
|
Remaining
|
Average
|
Remaining
|
Average
|
||||||||||||||||||||||
|
Exercise
|
Number
|
Contractual
|
Exercise
|
Number
|
Contractual
|
Exercise
|
||||||||||||||||||||
|
Price
|
Outstanding
|
Life (in yrs)
|
Price
|
Exercisable
|
Life (in yrs)
|
Price
|
||||||||||||||||||||
|
$1.00-3.45
|
15,000 | 0.08 | $ | 3.45 | 15,000 | 0.08 | $ | 3.45 | ||||||||||||||||||
|
3.46-6.94
|
281,145 | 1.99 | 5.57 | 100,970 | 1.68 | 6.55 | ||||||||||||||||||||
|
6.95-7.54
|
77,834 | 1.12 | 7.53 | 75,334 | 1.09 | 7.53 | ||||||||||||||||||||
|
$7.55-9.58
|
65,100 | 0.58 | 9.58 | 65,100 | 0.58 | 9.58 | ||||||||||||||||||||
| 439,079 | 1.56 | $ | 6.44 | 256,404 | 1.13 | $ | 7.43 | |||||||||||||||||||
The fair
value of stock options granted was estimated using the Black Scholes option
pricing model with the following weighted average assumptions:
|
2009
|
2008
|
2007
|
||||||||||
|
Expected
life of options granted
|
2.60
Years
|
2.62
Years
|
2.6
Years
|
|||||||||
|
Risk-free
interest rate
|
1.09 | % | 3.04 | % | 4.56 | % | ||||||
|
Expected
volatility of stock
|
47 | % | 35 | % | 33 | % | ||||||
|
Annual
expected dividend yield
|
1 | % | 1 | % | 1 | % | ||||||
|
Fair
Value of Granted Options
|
$ | 185,025 | $ | 174,028 | $ | 188,073 | ||||||
|
Nonvested
Options
|
182,675 | 162,725 | 108,170 | |||||||||
The total
intrinsic value of options exercised during the years ended December 31, 2009,
2008 and 2007 was $425,597, $514,680 and $1,357,329 respectively. The
weighted average grant date fair value of options granted during the years were
$1.73, $1.79, $2.32 for 2009, 2008 and 2007, respectively.
The total
unrecognized compensation cost related to non-vested share based compensation
arrangements granted under the plan as of December 31, 2009 was
$140,386. The cost is expected to be recognized over a weighted
average period of 1.39 years.
60
Notes
to Consolidated Financial Statements
Note
14. Capital Requirements
The
Corporation (on a consolidated basis) and the Bank are subject to various
regulatory capital requirements administered by the federal banking agencies.
Failure to meet minimum capital requirements can initiate certain mandatory -
possibly additional discretionary - actions by regulators that, if undertaken,
could have a direct material effect on the Corporation’s and the Bank’s
financial statements. Under capital adequacy guidelines and the regulatory
framework for prompt corrective action, the Corporation and the Bank must meet
specific capital guidelines that involve quantitative measures of the
Corporation’s and the Bank’s assets, liabilities, and certain off-balance-sheet
items as calculated under regulatory accounting practices. The Corporation’s and
the Bank’s capital amounts and classification are also subject to qualitative
judgments by the regulators about components, risk weightings, and other
factors.
Quantitative
measures established by regulation to ensure capital adequacy require the
Corporation and Bank to maintain minimum amounts and ratios (set forth in the
table below) of total and Tier 1 capital (as defined in the regulations) to
risk-weighted assets (as defined), and of Tier 1 capital (as defined) to average
assets (as defined). Management believes, as of December 31, 2009 and 2008, that
the Corporation and the Bank meet all capital adequacy requirements to which
they are subject.
At
December 31, 2009 the Corporation and Bank exceeded the minimum required ratios
for “well capitalized” as defined by the federal banking regulators. To be
categorized as well capitalized, the Bank must maintain minimum total
risk-based, Tier 1 risk-based, and Tier 1 leverage ratios as set forth in the
table. There are no conditions or events that management believes have changed
the institutions’ category.
61
Notes
to Consolidated Financial Statements
Note
14. Capital Requirements (continued)
The
Corporation’s and Bank’s actual capital amounts and ratios as of December 31,
2009 and 2008 are presented in the table below:
|
Minimum
|
||||||||||||||||||||||||
|
To Be Well
|
||||||||||||||||||||||||
|
Capitalized Under
|
||||||||||||||||||||||||
|
Minimum Capital
|
Prompt Corrective
|
|||||||||||||||||||||||
|
Actual
|
Requirement
|
Action Provisions
|
||||||||||||||||||||||
|
Amount
|
Ratio
|
Amount
|
Ratio
|
Amount
|
Ratio
|
|||||||||||||||||||
|
(Dollars
In Thousands)
|
||||||||||||||||||||||||
|
December
31, 2009
|
||||||||||||||||||||||||
|
Total
Capital
|
||||||||||||||||||||||||
|
(to
Risk Weighted Assets)
|
||||||||||||||||||||||||
|
Corporation
|
$ | 80,465 | 14.73 | % | $ | 43,703 | 8.00 | % | $ | 54,629 | 10.00 | % | ||||||||||||
|
Bank
|
$ | 73,252 | 13.43 | % | $ | 43,644 | 8.00 | % | $ | 54,555 | 10.00 | % | ||||||||||||
|
Tier
1 Capital
|
||||||||||||||||||||||||
|
(to
Risk-Weighted Assets)
|
||||||||||||||||||||||||
|
Corporation
|
$ | 73,604 | 13.47 | % | $ | 21,852 | 4.00 | % | $ | 32,777 | 6.00 | % | ||||||||||||
|
Bank
|
$ | 66,400 | 12.17 | % | $ | 21,822 | 4.00 | % | $ | 32,733 | 6.00 | % | ||||||||||||
|
Tier
1 Capital
|
||||||||||||||||||||||||
|
(to
Average Assets)
|
||||||||||||||||||||||||
|
Corporation
|
$ | 73,604 | 10.73 | % | $ | 27,430 | 4.00 | % | $ | 34,288 | 5.00 | % | ||||||||||||
|
Bank
|
$ | 66,400 | 9.69 | % | $ | 27,398 | 4.00 | % | $ | 34,247 | 5.00 | % | ||||||||||||
|
December
31, 2008
|
||||||||||||||||||||||||
|
Total
Capital
|
||||||||||||||||||||||||
|
(to
Risk Weighted Assets)
|
||||||||||||||||||||||||
|
Corporation
|
$ | 69,747 | 13.11 | % | $ | 42,576 | 8.00 | % | $ | 53,220 | 10.00 | % | ||||||||||||
|
Bank
|
$ | 65,095 | 12.26 | % | $ | 42,489 | 8.00 | % | $ | 53,111 | 10.00 | % | ||||||||||||
|
Tier
1 Capital
|
||||||||||||||||||||||||
|
(to
Risk-Weighted Assets)
|
||||||||||||||||||||||||
|
Corporation
|
$ | 63,085 | 11.86 | % | $ | 21,277 | 4.00 | % | $ | 31,915 | 6.00 | % | ||||||||||||
|
Bank
|
$ | 58,433 | 11.00 | % | $ | 21,245 | 4.00 | % | $ | 31,867 | 6.00 | % | ||||||||||||
|
Tier
1 Capital
|
||||||||||||||||||||||||
|
(to
Average Assets)
|
||||||||||||||||||||||||
|
Corporation
|
$ | 63,085 | 9.71 | % | $ | 25,993 | 4.00 | % | $ | 32,491 | 5.00 | % | ||||||||||||
|
Bank
|
$ | 58,433 | 9.00 | % | $ | 25,961 | 4.00 | % | $ | 32,452 | 5.00 | % | ||||||||||||
62
Note
15. Earnings Per Share
The
following shows the weighted average number of shares used in computing earnings
per share and the effect on weighted average number of shares of diluted
potential common stock. Potential dilutive common stock has no effect on income
available to common shareholders.
|
Year Ended December 31,
|
||||||||||||||||||||||||||||||||||||
|
2009
|
2008
|
2007
|
||||||||||||||||||||||||||||||||||
|
Net
|
Per Share
|
Net
|
Per Share
|
Net
|
Per Share
|
|||||||||||||||||||||||||||||||
|
Income
|
Shares
|
Amount
|
Income
|
Shares
|
Amount
|
Income
|
Shares
|
Amount
|
||||||||||||||||||||||||||||
|
(In
Thousands, Except Per Share Data)
|
||||||||||||||||||||||||||||||||||||
|
Earnings
per share
|
||||||||||||||||||||||||||||||||||||
|
Basic
|
$ | 9,635 | 10,391 | $ | 0.93 | $ | 4,744 | 10,299 | $ | 0.46 | $ | 3,702 | 11,620 | $ | 0.32 | |||||||||||||||||||||
|
Effect
of dilutive securities:
|
||||||||||||||||||||||||||||||||||||
|
Stock
options and warrants
|
- | 42 | - | - | 125 | - | - | 246 | - | |||||||||||||||||||||||||||
|
Diluted
|
||||||||||||||||||||||||||||||||||||
|
Diluted
earnings per share
|
$ | 9,635 | 10,433 | $ | 0.92 | $ | 4,744 | 10,424 | $ | 0.46 | $ | 3,702 | 11,866 | $ | 0.31 | |||||||||||||||||||||
Note
16. Employee Benefits
The
Corporation maintains a Defined Contribution 401(k) Profit Sharing Plan (the
“401(k) Plan”), which authorizes a maximum voluntary salary deferral of up to
IRS limitations. All full-time employees are eligible to participate after 6
months of employment. The Corporation reserves the right to make an annual
discretionary contribution to the account of each eligible employee based in
part on the Corporation’s profitability for a given year, and on each
participant’s yearly earnings. Approximately $371,000, $346,000, and $367,000
were charged to expense under the 401(k) Plan for 2009, 2008, and 2007
respectively.
63
Notes
to Consolidated Financial Statements
Note
17. Other Expenses
The
Corporation had the following other expenses as of December 31, 2009, 2008, and
2007:
|
Year Ended December 31,
|
||||||||||||
|
2009
|
2008
|
2007
|
||||||||||
|
(In
Thousands)
|
||||||||||||
|
Advertising
and promotional expense
|
$ | 5,552 | $ | 3,760 | $ | 3,921 | ||||||
|
Investor
fees
|
1,567 | 889 | 891 | |||||||||
|
Legal
fees
|
63 | 403 | 99 | |||||||||
|
Other
settlement fees
|
163 | 146 | 251 | |||||||||
|
Management
fees
|
7,152 | 2,380 | 1,560 | |||||||||
|
Provision
for losses on mortgage loans sold
|
5,050 | 2,095 | 1,750 | |||||||||
|
Buy
down expense
|
20 | 332 | (119 | ) | ||||||||
|
Business
and franchise tax
|
447 | 406 | 458 | |||||||||
|
Accounting
and auditing service
|
563 | 623 | 570 | |||||||||
|
Consulting
fees
|
346 | 334 | 405 | |||||||||
|
Early
payoff and default penalties
|
61 | 119 | 331 | |||||||||
|
Office
supplies-stationary print
|
204 | 175 | 150 | |||||||||
|
Telephone
|
276 | 282 | 331 | |||||||||
|
Postage
|
147 | 157 | 223 | |||||||||
|
Credit
reports
|
516 | 238 | 299 | |||||||||
|
Other
office expense
|
60 | 95 | 152 | |||||||||
|
Other
operating expenses
|
142 | 139 | 179 | |||||||||
|
Data
processing
|
497 | 472 | 374 | |||||||||
|
Regulatory
examinations
|
166 | 155 | 159 | |||||||||
|
FDIC
insurance
|
1,203 | 350 | 51 | |||||||||
|
OREO
expenses
|
1,497 | 22 | - | |||||||||
|
Other
|
2,660 | 2,166 | 5,806 | |||||||||
| $ | 28,352 | $ | 15,738 | $ | 17,841 | |||||||
Note
18. Fair Value Measurements
Effective
January 1, 2008, the Corporation adopted FASB ASC 820-10 (SFAS 157) and FASB ASC
825-10 (SFAS 159). FASB ASC 820-10 defines fair value as the exchange
price that would be received for an asset or paid to transfer a liability (exit
price) in the principal or most advantageous market for the asset or liability
in an orderly transaction between market participants on the measurement date.
FASB ASC 820-10 also establishes a fair value hierarchy which requires an entity
to maximize the use of observable inputs and minimize the use of unobservable
inputs when measuring fair value. The standard describes three levels of inputs
that may be used to measure fair values:
Level 1 -
Quoted prices (unadjusted) for identical assets or liabilities in active
markets that the entity has the ability to access as of the measurement
date.
Level 2 -
Significant other observable inputs other than Level 1 prices such as quoted
prices for similar assets or liabilities; quoted prices in markets that are not
active; or other inputs that are observable or can be corroborated by observable
market data.
64
Notes
to Consolidated Financial Statements
Note
18. Fair Value Measurements (continued)
Level
3 - Significant unobservable inputs that reflect a company’s own
assumptions about the assumptions that market participants would use in pricing
an asset or liability.
The
Corporation used the following methods to determine the fair value of each type
of financial instrument:
Investment
securities: The fair values for investment securities are determined by
quoted market prices from active markets (Level 1).
Residential
loans held for sale: The fair value of loans held for sale is determined
using quoted prices for a similar asset, adjusted for specific attributes of
that loan (Level 2).
Derivative
financial instruments: Derivative instruments are used to
hedge residential mortgage loans held for sale and the related interest-rate
lock commitments and
include forward commitments to sell mortgage loans and mortgage backed
securities. The fair values of derivative financial instruments are based on
derivative market data inputs as of the valuation date and the underlying value
of mortgage loans for rate lock commitments (Level
3).
Impaired
loans: The fair values of impaired loans are measured for
impairment using the fair value of the collateral for collateral-dependent loans
on a non-recurring basis. Collateral may be in the form of real
estate or business assets including equipment, inventory and accounts
receivable. The use of discounted cash flow models and management’s
best judgment are significant inputs in arriving at the fair value measure of
the underlying collateral (Level 3).
Other real
estate owned: The fair value of other real estate owned, which
is included in other assets on the balance sheet, consists of real estate that
has been foreclosed. Foreclosed real estate is recorded at the lower
of fair value less selling expenses or the book balance prior to
foreclosure. Write downs are provided for subsequent declines in
value and are recorded in other non-interest expense (Level
2).
65
Note
18. Fair Value Measurements (continued)
Assets
and liabilities measured at fair value under FASB ASC 820-10 on a recurring and
non-recurring basis, including financial assets and liabilities for which the
Corporation has elected the fair value option, are summarized
below:
|
Fair Value Measurement
at December 31, 2009 Using
(In Thousands)
|
||||||||||||||||
|
Description
|
Carrying
Value
|
Quoted Prices in
Active Markets
for Identical
Assets (Level 1)
|
Other Observable
Inputs (Level 2)
|
Significant
Unobservable
Inputs (Level 3)
|
||||||||||||
|
Financial
Assets-Recurring
|
||||||||||||||||
|
Available
for sale investment securities (1)
|
$ | 43,095 | $ | 43,095 | $ | - | $ | - | ||||||||
|
Residential
loans held for sale
|
76,232 | - | 76,232 | - | ||||||||||||
|
Derivative
assets
|
492 | - | - | 492 | ||||||||||||
|
Total
Financial Assets-Recurring
|
$ | 119,819 | $ | 43,095 | $ | 76,232 | $ | 492 | ||||||||
|
Financial
Liabilities-Recurring
|
||||||||||||||||
|
Derivative
liabilities
|
$ | 353 | $ | - | $ | - | $ | 353 | ||||||||
|
Total
Financial Liabilities-Recurring
|
$ | 353 | $ | - | $ | - | $ | 353 | ||||||||
|
Financial
Assets-Non-Recurring
|
||||||||||||||||
|
Impaired
loans (2)
|
$ | 7,032 | $ | - | $ | - | $ | 7,032 | ||||||||
|
Other
real estate owned (3)
|
5,111 | - | 5,111 | - | ||||||||||||
|
Total
Financial Assets-Non-Recurring
|
$ | 12,143 | $ | - | $ | 5,111 | $ | 7,032 | ||||||||
|
(1)
|
Excludes
restricted stock.
|
|
|
(2)
|
Represents
the carrying value of loans for which adjustments are based on the
appraised value of the
collateral.
|
|
(3)
|
Represents
appraised value and realtor comparables less estimated selling
expenses.
|
|
Fair Value Measurement
at December 31, 2008 Using
(In Thousands)
|
||||||||||||||||
|
Description
|
Carrying
Value
|
Quoted Prices in
Active Markets
for Identical
Assets (Level 1)
|
Other Observable
Inputs (Level 2)
|
Significant
Unobservable
Inputs (Level 3)
|
||||||||||||
|
Financial
Assets-Recurring
|
||||||||||||||||
|
Available for sale investment
securities (1)
|
$ | 85,119 | $ | 85,119 | $ | - | $ | - | ||||||||
|
Residential
loans held for sale
|
84,312 | - | 84,312 | - | ||||||||||||
|
Derivative
assets
|
363 | 363 | ||||||||||||||
|
Total
Financial Assets-Recurring
|
$ | 119,819 | $ | 85,119 | $ | 84,312 | $ | 363 | ||||||||
|
Financial
Liabilities-Recurring
|
||||||||||||||||
|
Derivative
liabilities
|
$ | 272 | $ | - | $ | - | $ | 272 | ||||||||
|
Total
Financial Liabilities-Recurring
|
$ | 272 | $ | - | $ | - | $ | 272 | ||||||||
|
Financial
Assets-Non-Recurring
|
||||||||||||||||
|
Impaired loans (2)
|
$ | 2,875 | $ | - | $ | - | $ | 2,875 | ||||||||
|
Other real estate owned
(3)
|
4,455 | - | 4,455 | - | ||||||||||||
|
Total
Financial Assets-Non-Recurring
|
$ | 7,330 | $ | - | $ | 4,455 | $ | 2,875 | ||||||||
|
|
(1)
|
Excludes
restricted stock.
|
|
|
(2)
|
Represents
the carrying value of loans for which adjustments are based on the
appraised value of the collateral.
|
|
|
(3)
|
Represents
appraised value and realtor comparables less estimated selling
expenses.
|
The
changes in Level 3 assets and liabilities measured at fair value on a recurring
basis are summarized as follows for the three month period ended December 31,
2009.
66
Notes
to Consolidated Financial Statements
Note
18. Fair Value Measurements (continued)
|
Net Derivatives
|
||||
|
(In Thousands)
|
||||
|
Balance
September 30, 2009
|
$ | (86 | ) | |
|
Realized
and unrealized gains (losses) included in earnings
|
225 | |||
|
Unrealized
gains (losses) included in other comprehensive income
|
- | |||
|
Purchases,
settlements, paydowns, and maturities
|
- | |||
|
Transfer
into Level 3
|
- | |||
|
Balance
December 31, 2009
|
$ | 139 | ||
The
changes in Level 3 assets and liabilities measured at fair value on a recurring
basis are summarized as follows for the twelve month period ended December 31,
2009 and 2008.
|
Net Derivatives
|
||||
|
(In Thousands)
|
||||
|
Balance
January 1, 2009
|
$ | 91 | ||
|
Realized
and unrealized gains included in earnings
|
48 | |||
|
Unrealized
gains (losses) included in other comprehensive income
|
- | |||
|
Purchases,
settlements, paydowns, and maturities
|
- | |||
|
Transfer
into Level 3
|
- | |||
|
Balance
December 31, 2009
|
$ | 139 | ||
|
Net Derivatives
|
||||
|
(In Thousands)
|
||||
|
Balance
January 1, 2008
|
$ | (140 | ) | |
|
Realized
and unrealized gains included in earnings
|
231 | |||
|
Unrealized
gains (losses) included in other comprehensive income
|
- | |||
|
Purchases,
settlements, paydowns, and maturities
|
- | |||
|
Transfer
into Level 3
|
- | |||
|
Balance
December 31, 2008
|
$ | 91 | ||
Financial instruments recorded using FASB
ASC 825-10
Under
FASB ASC 825-10, the Corporation may elect to report most financial instruments
and certain other items at fair value on an instrument-by-instrument basis with
changes in fair value reported in net income. After the initial adoption, the
election is made at the acquisition of an eligible financial asset, financial
liability or firm commitment or when certain specified reconsideration events
occur. The fair value election, with respect to an item, may not be revoked
once an election is made. Additionally, the transaction provisions of FASB ASC
825-10 permit a one-time election for existing positions at the adoption date
with a cumulative-effect adjustment included in beginning retained earnings and
future changes in fair value reported in net income. The Corporation elected the
fair value option on all loans held for sale transactions subsequent to December
31, 2007.
67
Notes
to Consolidated Financial Statements
Note
18. Fair Value Measurements (continued)
The
following tables reflect the difference between the fair value carrying amount
of residential mortgage loans held for sale, measured at fair value under FASB
ASC 825-10, and the aggregate unpaid principal amount the Corporation is
contractually entitled to receive at maturity.
|
December 31, 2009
|
||||||||||||
|
(In Thousands)
|
Aggregate
Fair Value
|
Difference
|
Contractual
Principal
|
|||||||||
|
Residential
mortgage loans held for sale
|
$ | 76,232 | $ | 1,626 | $ | 74,606 | ||||||
|
December 31, 2008
|
||||||||||||
|
(In Thousands)
|
Aggregate
Fair Value
|
Difference
|
Contractual
Principal
|
|||||||||
|
Residential
mortgage loans held for sale
|
$ | 84,312 | $ | 2,109 | $ | 82,203 | ||||||
The fair
values of financial assets and financial liabilities that are not measured and
reported at fair value on a recurring basis or non-recurring basis are presented
below. The methodologies for estimating the
fair value of financial assets and financial liabilities that are measured at
fair value on a recurring or non-recurring basis are discussed above. The
methodologies for other financial assets and financial liabilities are discussed
below:
Cash
and Short-Term Investments
For those
short-term instruments, the carrying amount is a reasonable estimate of fair
value.
Securities
For
securities, fair values are based on quoted market prices or dealer
quotes.
Loans
Held for Sale
Loans
held for sale and are recorded at fair value, determined individually, as of the
balance sheet date.
Loan
Receivables
For
certain homogeneous categories of loans, such as some residential mortgages,
and other consumer loans, fair value is estimated using the quoted
market prices for securities backed by similar loans, adjusted for differences
in loan characteristics. The fair value of other types of loans is estimated by
discounting the future cash flows using the current rates at which similar loans
would be made to borrowers with similar credit ratings and for the same
remaining maturities.
Deposits
and Borrowings
The fair
value of demand deposits, savings accounts, and certain money market deposits is
the amount payable on demand at the reporting date. The fair value of
fixed-maturity certificates of deposit is estimated using the rates currently
offered for deposits of similar remaining maturities. The fair value of all
other deposits and borrowings is determined using the discounted cash flow
method. The discount rate was equal to the rate currently offered on similar
products.
Accrued
Interest
The
carrying amounts of accrued interest approximate fair value.
Off-Balance-Sheet
Financial Instruments
The fair
value of commitments to extend credit is estimated using the fees currently
charged to enter similar agreements, taking into account the remaining terms of
the agreements and the present credit worthiness of the counterparties. For
fixed-rate loan commitments,
68
Notes
to Consolidated Financial Statements
Note
18. Fair Value Measurements (continued)
fair
value also considers the difference between current levels of interest rates and
the committed rates. The fair value of stand-by letters of credit is based on
fees currently charged for similar agreements or on the estimated cost to
terminate them or otherwise settle the obligations with the counterparties at
the reporting date.
At
December 31, 2009 and 2008, the majority of off-balance-sheet items is variable
rate instruments or converts to variable rate instruments if drawn upon.
Therefore, the fair value of these items is largely based on fees, which are
nominal and immaterial.
|
December 31,
|
||||||||||||||||
|
2009
|
2008
|
|||||||||||||||
|
Carrying
Amount
|
Fair
Value
|
Carrying
Amount
|
Fair
Value
|
|||||||||||||
|
(In
Thousands)
|
||||||||||||||||
|
Financial
assets:
|
||||||||||||||||
|
Cash
and short-term investments
|
$ | 31,221 | $ | 31,221 | $ | 22,482 | $ | 22,482 | ||||||||
|
Securities
available for sale
|
43,095 | 43,095 | 85,119 | 85,119 | ||||||||||||
|
Restricted
stock
|
4,743 | 4,743 | 5,896 | 5,896 | ||||||||||||
|
Loans,
net of allowance
|
553,669 | 552,097 | 562,779 | 562,430 | ||||||||||||
|
Derivatives
|
492 | 492 | 363 | 363 | ||||||||||||
|
Total
financial assets
|
$ | 633,220 | $ | 631,648 | $ | 676,639 | $ | 676,290 | ||||||||
|
Financial
liabilities:
|
||||||||||||||||
|
Deposits
|
$ | 466,645 | $ | 466,668 | $ | 485,401 | $ | 486,989 | ||||||||
|
Short-term
borrowings
|
64,249 | 64,258 | 103,575 | 104,083 | ||||||||||||
|
Long-term
borrowings
|
46,330 | 46,351 | 41,107 | 42,458 | ||||||||||||
|
Subordinated
debentures
|
6,186 | 6,248 | 6,186 | 6,321 | ||||||||||||
|
Derivatives
|
353 | 353 | 272 | 272 | ||||||||||||
|
Total
financial liabilities
|
$ | 583,763 | $ | 583,878 | $ | 636,541 | $ | 640,123 | ||||||||
Current
accounting pronouncements require disclosure of the estimated fair value of
financial instruments. Effective January 1, 2008, fair value is
defined in accordance with FASB ASC 820-10 as disclosed above. Given
the current market conditions, a portion of our loan portfolio is not readily
marketable and market prices do not exist. We have not attempted to
market our loans to potential buyers, if any exist, to determine the fair value
of those instruments in accordance with the definition of FASB ASC
820-10. Since negotiated prices in illiquid markets depends upon the
then present motivations of the buyer and seller, it is reasonable to assume
that actual sales prices could vary widely from any estimate of fair value made
without the benefit of negotiations. Additionally, changes in market
interest rates can dramatically impact the value of financial instruments in a
short period of time. Accordingly, the fair value measurements for
loans included in the table above are unlikely to represent the instruments’
liquidation values.
69
Notes
to Consolidated Financial Statements
Note
19. Segment Reporting
The
Corporation has two reportable segments: traditional commercial banking and a
mortgage banking business. Revenues from commercial banking operations consist
primarily of interest earned on loans and investment securities and fees from
deposit services. Mortgage banking operating revenues consist principally of
interest earned on mortgage loans held for sale, gains on sales of loans in the
secondary mortgage market and loan origination fee income.
The
commercial banking segment provides the mortgage banking segment with the
short-term funds needed to originate mortgage loans through a warehouse line of
credit and charges the mortgage banking segment interest based on a premium over
their cost to borrow funds. These transactions are eliminated in the
consolidation process.
70
Notes
to Consolidated Financial Statement
The
following table presents segment information for the years ended December 31,
2009, 2008 and 2007:
|
2009
|
Commercial
|
Mortgage
|
Consolidated
|
|||||||||||||||||
|
Banking
|
Banking
|
Other
|
Eliminations
|
Totals
|
||||||||||||||||
|
(In
Thousands)
|
||||||||||||||||||||
|
Revenues:
|
||||||||||||||||||||
|
Interest
income
|
$ | 35,886 | $ | 3,361 | $ | 44 | $ | (1,765 | ) | $ | 37,526 | |||||||||
|
Gain
on sale of loans
|
659 | 48,603 | - | - | 49,262 | |||||||||||||||
|
Other
|
3,031 | 5,150 | 1,180 | (1,657 | ) | 7,704 | ||||||||||||||
|
Total
operating income
|
39,576 | 57,114 | 1,224 | (3,422 | ) | 94,492 | ||||||||||||||
|
Expenses:
|
||||||||||||||||||||
|
Interest
expense
|
13,565 | 1,488 | 682 | (1,767 | ) | 13,968 | ||||||||||||||
|
Salaries
and employee benefits
|
8,040 | 20,082 | - | - | 28,122 | |||||||||||||||
|
Other
|
13,746 | 22,965 | 1,857 | (1,655 | ) | 36,913 | ||||||||||||||
|
Total
operating expenses
|
35,351 | 44,535 | 2,539 | (3,422 | ) | 79,003 | ||||||||||||||
|
Income
before income taxes
|
$ | 4,225 | $ | 12,579 | $ | (1,315 | ) | $ | - | $ | 15,489 | |||||||||
|
Total
assets
|
$ | 627,766 | $ | 79,557 | $ | 9,138 | $ | (49,582 | ) | $ | 666,879 | |||||||||
|
Capital
expenditures
|
$ | 10 | $ | 32 | $ | 16 | $ | - | $ | 58 | ||||||||||
|
2008
|
Commercial
|
Mortgage
|
Consolidated
|
|||||||||||||||||
|
Banking
|
Banking
|
Other
|
Eliminations
|
Totals
|
||||||||||||||||
|
(In
Thousands)
|
||||||||||||||||||||
|
Revenues:
|
||||||||||||||||||||
|
Interest
income
|
$ | 37,910 | $ | 1,778 | $ | 71 | $ | (967 | ) | $ | 38,792 | |||||||||
|
Gain
on sale of loans
|
- | 24,863 | - | (4 | ) | 24,859 | ||||||||||||||
|
Other
|
1,961 | 4,472 | 1,148 | (1,627 | ) | 5,954 | ||||||||||||||
|
Total
operating income
|
39,871 | 31,113 | 1,219 | (2,598 | ) | 69,605 | ||||||||||||||
|
Expenses:
|
||||||||||||||||||||
|
Interest
expense
|
16,972 | 865 | 873 | (970 | ) | 17,740 | ||||||||||||||
|
Salaries
and employee benefits
|
7,520 | 13,261 | - | - | 20,781 | |||||||||||||||
|
Other
|
10,836 | 12,692 | 1,740 | (1,628 | ) | 23,640 | ||||||||||||||
|
Total
operating expenses
|
35,328 | 26,818 | 2,613 | (2,598 | ) | 62,161 | ||||||||||||||
|
Income
before income taxes
|
$ | 4,543 | $ | 4,295 | $ | (1,394 | ) | $ | - | $ | 7,444 | |||||||||
|
Total
assets
|
$ | 662,885 | $ | 85,909 | $ | 9,476 | $ | (55,946 | ) | $ | 702,324 | |||||||||
|
Capital
expenditures
|
$ | 98 | $ | 72 | $ | 29 | $ | - | $ | 199 | ||||||||||
|
2007
|
Commercial
|
Mortgage
|
Consolidated
|
|||||||||||||||||
|
Banking
|
Banking
|
Other
|
Eliminations
|
Totals
|
||||||||||||||||
|
(In
Thousands)
|
||||||||||||||||||||
|
Revenues:
|
||||||||||||||||||||
|
Interest
income
|
$ | 45,176 | $ | 3,594 | $ | 665 | $ | (4,009 | ) | $ | 45,426 | |||||||||
|
Gain
on sale of loans
|
- | 20,244 | - | (3 | ) | 20,241 | ||||||||||||||
|
Other
|
1,452 | 7,256 | 1,081 | (2,323 | ) | 7,466 | ||||||||||||||
|
Total
operating income
|
46,628 | 31,094 | 1,746 | (6,335 | ) | 73,133 | ||||||||||||||
|
Expenses:
|
||||||||||||||||||||
|
Interest
expense
|
23,881 | 4,166 | 1,270 | (4,013 | ) | 25,304 | ||||||||||||||
|
Salaries
and employee benefits
|
6,822 | 12,756 | - | - | 19,578 | |||||||||||||||
|
Other
|
6,546 | 16,989 | 1,746 | (2,322 | ) | 22,959 | ||||||||||||||
|
Total
operating expenses
|
37,249 | 33,911 | 3,016 | (6,335 | ) | 67,841 | ||||||||||||||
|
Income
before income taxes
|
$ | 9,379 | $ | (2,817 | ) | $ | (1,270 | ) | $ | - | $ | 5,292 | ||||||||
|
Total
assets
|
$ | 599,835 | $ | 46,184 | $ | 9,115 | $ | (32,758 | ) | $ | 622,376 | |||||||||
|
Capital
expenditures
|
$ | 554 | $ | 111 | $ | 305 | $ | - | $ | 970 | ||||||||||
71
Notes to Consolidated Financial
Statements
Note
21. Parent Corporation Only Statements
ACCESS
NATIONAL CORPORATION
(Parent
Corporation Only)
Balance
Sheets
|
December 31,
|
||||||||
|
2009
|
2008
|
|||||||
|
(In
Thousands)
|
||||||||
|
Assets
|
||||||||
|
Cash
|
$ | 189 | $ | 10 | ||||
|
Other
investments
|
6,540 | 4,028 | ||||||
|
Investment
in subsidiaries
|
66,760 | 59,604 | ||||||
|
Other
assets
|
757 | 804 | ||||||
|
Total
assets
|
$ | 74,246 | $ | 64,446 | ||||
|
Liabilities
|
||||||||
|
Subordinated
debentures
|
$ | 6,186 | $ | 6,186 | ||||
|
Other
liabilities
|
282 | 315 | ||||||
|
Total
liabilities
|
6,468 | 6,501 | ||||||
|
Shareholders'
Equity
|
||||||||
|
Common
stock
|
8,799 | 8,551 | ||||||
|
Capital
surplus
|
18,552 | 17,410 | ||||||
|
Retained
earnings
|
40,377 | 31,157 | ||||||
|
Accumulated
other comprehensive income
|
50 | 827 | ||||||
|
Total
shareholders' equity
|
67,778 | 57,945 | ||||||
|
Total
liabilities and shareholders' equity
|
$ | 74,246 | $ | 64,446 | ||||
72
Notes to Consolidated Financial
Statements
ACCESS
NATIONAL CORPORATION
(Parent
Corporation Only)
Statements
of Income
|
Year Ended December 31,
|
||||||||||||
|
2009
|
2008
|
2007
|
||||||||||
|
(In
Thousands)
|
||||||||||||
|
Income
|
||||||||||||
|
Dividends
from subsidiaries
|
$ | 2,467 | $ | 3,203 | $ | 1,260 | ||||||
|
Interest
|
44 | 72 | 665 | |||||||||
|
Other
|
24 | 81 | 46 | |||||||||
| 2,535 | 3,356 | 1,971 | ||||||||||
|
Expenses
|
||||||||||||
|
Interest
expense on subordinated debentures
|
238 | 418 | 807 | |||||||||
|
Other
expenses
|
1,185 | 1,122 | 1,188 | |||||||||
|
Total
expenses
|
1,423 | 1,540 | 1,995 | |||||||||
|
Income
before income taxes and undistributed income of
subsidiaries
|
1,112 | 1,816 | (24 | ) | ||||||||
|
Income
tax (benefit)
|
(466 | ) | (526 | ) | (487 | ) | ||||||
|
Income
before undistributed income of subsidiaries
|
1,578 | 2,342 | 463 | |||||||||
|
Undistributed
income of subsidiaries
|
8,057 | 2,402 | 3,239 | |||||||||
|
Net
income
|
$ | 9,635 | $ | 4,744 | $ | 3,702 | ||||||
73
Notes
to Consolidated Financial Statements
ACCESS
NATIONAL CORPORATION
(Parent
Corporation Only)
Statements
of Cash Flows
|
Year Ended December 31,
|
||||||||||||
|
2009
|
2008
|
2007
|
||||||||||
|
(In
Thousands)
|
||||||||||||
|
Cash
Flows from Operating Activities
|
||||||||||||
|
Net
income
|
$ | 9,635 | $ | 4,744 | $ | 3,702 | ||||||
|
Adjustments
to reconcile net income to net cash provided by (used in) operating
activities:
|
||||||||||||
|
Undistributed
income of subsidiaries
|
(8,057 | ) | (2,402 | ) | (3,239 | ) | ||||||
|
(Increase)
decrease in other assets
|
172 | (79 | ) | 147 | ||||||||
|
Increase
(decrease) in other liabilities
|
(33 | ) | (150 | ) | 205 | |||||||
|
Stock
based compensation
|
162 | 136 | 99 | |||||||||
|
Net
cash provided by operating activities
|
1,879 | 2,249 | 914 | |||||||||
|
Cash
Flows from Investing Activities
|
||||||||||||
|
Increase
in investment in subsidiaries
|
- | (8,212 | ) | - | ||||||||
|
(Increase)
decrease in other investments
|
(2,512 | ) | 11,464 | 12,059 | ||||||||
|
Net
cash (used in) provided by investing activities
|
(2,512 | ) | 3,252 | 12,059 | ||||||||
|
Cash
Flows from Financing Activities
|
||||||||||||
|
Repurchase
of common stock
|
1,400 | (5,930 | ) | (9,502 | ) | |||||||
|
Net
proceeds from issuance of common stock
|
(173 | ) | 870 | 1,105 | ||||||||
|
Repayment of
subordinated debentures
|
- | - | (4,125 | ) | ||||||||
|
Dividends
paid
|
(415 | ) | (433 | ) | (497 | ) | ||||||
|
Net
cash provided by (used in) financing activities
|
812 | (5,493 | ) | (13,019 | ) | |||||||
|
Increase
in cash and cash equivalents
|
179 | 8 | (46 | ) | ||||||||
|
Cash
and Cash Equivalents
|
||||||||||||
|
Beginning
|
10 | 2 | 48 | |||||||||
|
Ending
|
$ | 189 | $ | 10 | $ | 2 | ||||||
74
ITEM 9 - CHANGES IN AND
DISAGREEMENTS WITH ACCOUNTANTS ON ACCOUNTING AND FINANCIAL
DISCLOSURE
None.
ITEM 9A – CONTROLS AND
PROCEDURES
The
Corporation’s management evaluated, with the participation of the Chief
Executive Officer and Chief Financial Officer, the effectiveness of the
Corporation’s disclosure controls and procedures (as defined in Rule 13a-15(e)
under the Exchange Act) as of the end of the period covered by this report.
Based on that evaluation, the Chief Executive Officer and Chief Financial
Officer concluded that the Corporation’s disclosure controls and procedures are
effective as of the end of the period covered by this report to ensure that
information required to be disclosed in the reports that the Corporation files
or submits under the Exchange Act is recorded, processed, summarized and
reported, within the time periods specified in the SEC’s rules and forms, and
that such information is accumulated and communicated to the Corporation’s
management, including the Chief Executive Officer and Chief Financial Officer,
as appropriate, to allow timely decisions regarding required
disclosure.
Because
of the inherent limitations in all control systems, no evaluation of controls
can provide absolute assurance that the Corporation’s disclosure controls and
procedures will detect or uncover every situation involving the failure of
persons within the Corporation to disclose material information required to be
set forth in the Corporation’s periodic and current reports.
The
Corporation’s management is also responsible for establishing and maintaining
adequate internal control over financial reporting (as defined in Rule 13a-15(f)
under the Exchange Act). No changes in our internal control over financial
reporting occurred during the last fiscal quarter that have materially affected,
or are reasonably likely to materially affect, our internal control over
financial reporting.
Report
of Management’s Assessment of Internal Control over Financial
Reporting
The
Corporation’s management is responsible for establishing and maintaining
adequate internal control over financial reporting, as defined in Rule 13a-15(f)
under the Exchange Act.
With the
supervision and participation of its Chief Executive Officer and its Chief
Financial Officer, management evaluated the effectiveness of the Corporation’s
internal control over financial reporting as of December 31, 2009, using the
framework set forth by the Committee of Sponsoring Organizations of the Treadway
Commission and based on this assessment has concluded the Corporation’s internal
control over financial reporting is effective as of that date.
No matter
how well designed, internal control over financial reporting may not prevent or
detect all misstatements. Projection of the evaluation of effectiveness to
future periods is subject to risks, including but not limited to (a) controls
may become inadequate due to changes in conditions; (b) a deterioration in the
degree of compliance with policies or procedures; and (c) the possibility of
control circumvention or override, any of which may lead to misstatements due to
undetected error or fraud. Effective internal control over financial reporting
can provide only a reasonable assurance with respect to financial statement
preparation and reporting.
The
Corporation’s independent registered public accounting firm, BDO
Seidman LLP, has audited the Consolidated Financial Statements included in
this Annual Report and has issued an attestation report on the Corporation’s
internal control over financial reporting which is included in “Item 8 –
Financial Statements and Supplementary Data” herein.
ITEM 9B – OTHER
INFORMATION
None.
PART III
ITEM 10 – DIRECTORS,
EXECUTIVE OFFICERS AND CORPORATE GOVERNANCE
The
information contained under the captions "Election of Directors," “Executive
Officers Who Are Not Directors,” “Corporate Governance and the Board of
Directors,” “Certain Relationships and Related Transactions” and
"Section 16(a) Beneficial Ownership Reporting Compliance" in the 2010 Proxy
Statement that is required to be disclosed in this Item 10 is incorporated
herein by reference.
75
ITEM 11 – EXECUTIVE
COMPENSATION
The
information contained under the captions “Executive Compensation” in the 2010
Proxy Statement that is required to be disclosed in this Item 11 is incorporated
herein by reference.
ITEM 12 – SECURITY OWNERSHIP
OF CERTAIN BENEFICIAL OWNERS AND MANAGEMENT AND RELATED STOCKHOLDER
MATTERS
The
information contained under the captions “Security Ownership of Management”,
“Security Ownership of Certain Beneficial Owners” and “Securities
Authorized for Issuance Under Equity Compensation Plans” in the 2010 Proxy
Statement that is required to be disclosed in this Item 12 is incorporated
herein by reference.
ITEM 13 – CERTAIN
RELATIONSHIPS AND RELATED TRANSACTIONS, AND DIRECTOR
INDEPENDENCE
The
information regarding certain relationships between the Corporation and its
directors and officers is contained under the captions “Certain Relationships
and Related Transactions” and “Corporate Governance and the Board of Directors”
in the 2010 Proxy Statement that is required to be disclosed in this Item 13 is
incorporated herein by reference.
ITEM 14 – PRINCIPAL
ACCOUNTANT FEES AND SERVICES
The
information under the captions “Audit and Non-Audit Fees” and “Audit Committee
Pre-Approval Policies” in the 2010 Proxy Statement that is required to be
disclosed in this Item 14 is incorporated herein by reference.
76
PART IV
ITEM 15 – EXHIBITS,
FINANCIAL STATEMENT SCHEDULES
(a)
Exhibit Index:
|
Exhibit No.
|
Description
|
|
|
3.1
|
Amended
and Restated Articles of Incorporation of Access National Corporation
(incorporated by reference to Exhibit 3.1 to Form 8-K filed July 18,
2006)
|
|
|
3.2
|
Amended
and Restated Bylaws of Access National Corporation (incorporated by
reference to Exhibit 3.2 to Form 8-K Filed October 24,
2007)
|
|
|
4
|
Form
of Common Stock Certificate (incorporated by reference to Exhibit 4.0 to
Form 10-KSB filed March 31, 2003)
|
|
|
Certain
instruments relating to long-term debt as to which the total amount of
securities authorized thereunder does not exceed 10% of Access National
Corporation’s total assets have been omitted in accordance with Item
601(b)(4)(iii) of Regulation S-K. The registrant will furnish a
copy of any such instrument to the Securities and Exchange Commission upon
its request.
|
||
|
10.1+
|
Employment
Letter Agreement between Access National Bank and Michael W. Clarke
(incorporated by reference to Exhibit 10.1 to Form 10-K filed March
31, 2005)
|
|
|
10.2+
|
Employment
Letter Agreement between Access National Bank and Robert C. Shoemaker
(incorporated by reference to Exhibit 10.2 to Form 10-K filed March
31, 2005)
|
|
|
10.3+
|
Employment
Agreement between Access National Bank and Charles Wimer (incorporated by
reference to Exhibit 10.3 to Form 10-KSB filed March 31,
2003)
|
|
|
10.4+
|
Employment
Agreement between Access National Mortgage Corporation and Dean Hackemer
(incorporated by reference to Exhibit 10.4 to Form 10-K filed March
31, 2005)
|
|
|
10.4.1+
|
Amendment
#1 to Employment Agreement between Access National Mortgage Corporation
and Dean Hackemer (incorporated by reference to Exhibit 10.2 to
Form 10-Q filed May 15, 2007)
|
|
|
10.5*+
|
Annual
Compensation of Non-Employee Directors
|
|
|
10.6*+
|
Base
Salaries for Named Executive Officers
|
|
|
10.7+
|
Access
National Bank 1999 Stock Option Plan (incorporated by reference to Exhibit
10.5 to Form 10-KSB filed March 31, 2003)
|
|
|
10.7.1+
|
Form
of Incentive Stock Option Agreement for Employee under 1999 Stock Option
Plan (incorporated by reference to Exhibit 10.5.1 to Form 8-K filed
January 31, 2007)
|
|
|
10.7.2+
|
Form
of Incentive Stock Option for Employee-Director under 1999 Stock Option
Plan (incorporated by reference to Exhibit 10.5.2 to Form 8-K filed
January 31, 2007)
|
|
|
10.7.3+
|
Form
of Non-Qualified Stock Option Agreement for Director under 1999 Stock
Option Plan (incorporated by reference to Exhibit 10.5.3 to Form 8-K filed
January 31, 2007)
|
|
|
10.8
|
Lease
agreement between Access National Bank and William and Blanca Spencer
(incorporated by reference to Exhibit 10.6 to Form 10-KSB filed March
31, 2003)
|
|
|
10.9
|
Lease
agreement between Access National Mortgage Corporation and WJG, LLC
(incorporated by reference to Exhibit 10.7 to Form 10-KSB filed March
31, 2003)
|
77
|
10.10
|
Access
National Corporation 2009 Stock Option Plan, effective May 19, 2009
(incorporated by reference to Appendix A to the definitive proxy statement
filed April 15, 2009)
|
|
|
10.10.1
|
Form
of Stock Option Agreement for Employee under 2009 Stock Option Plan
(incorporated by reference to Exhibit 10.10.1 to Form 8-K filed July
6, 2009)
|
|
|
14
|
Code
of Ethics (incorporated by reference to Exhibit 14 to Form 10-KSB
filed March 30, 2004)
|
|
|
21*
|
Subsidiaries
of Access National Corporation
|
|
|
23*
|
Consent
of BDO Seidman, LLP
|
|
|
24*
|
Power
of Attorney (included on the signature page of this
report)
|
|
|
31.1*
|
CEO
Certification Pursuant to Rule 13a-14(a)
|
|
|
31.2*
|
CFO
Certification Pursuant to Rule 13a-14(a)
|
|
|
32*
|
CEO/CFO
Certification Pursuant to § 906 of the Sarbanes-Oxley Act of 2002 (18
U.S.C. § 1350)
|
* filed
herewith
+
indicates a management contract or compensatory plan or
arrangement
78
SIGNATURES
Pursuant
to the requirements of Section 13 or 15(d) of the Securities Exchange Act of
1934, the registrant has duly caused this report to be signed on its behalf by
the undersigned, thereunto duly authorized.
|
Access
National Corporation
|
|||
|
(Registrant)
|
|||
|
Date: March
29,
2010
|
By:
|
/s/ Michael W. Clarke
|
|
|
Michael
W. Clarke
|
|||
|
President
and Chief Executive Officer
|
|||
|
Date:
March 29,
2010
|
By:
|
/s/ Charles Wimer
|
|
|
Charles
Wimer
|
|||
|
Executive
Vice President and Chief Financial
Officer
|
|||
79
SIGNATURES
POWER OF
ATTORNEY
Each
person whose signature appears below constitutes and appoints Michael W. Clarke
his true and lawful attorney-in-fact and agent with full power of substitution
and re-substitution for him and in his name, place and stead, in any and all
capacities, to sign any or all amendments to this Form 10-K and to file the
same, with all exhibits thereto, and other documents in connection therewith,
with the Securities and Exchange Commission, granting unto said attorney-in-fact
and agents full power and authority to do fully and to all intents and purposes
as he might or could do in person, hereby ratifying and confirming all that said
attorney-in-fact and agent, and his substitutes, may lawfully do or cause to be
done by virtue hereof.
Pursuant
to the requirements of the Securities Exchange Act of 1934, this report has been
signed below by the following persons on behalf of the registrant and in the
capacities and on the dates indicated.
|
Signature
|
Title
|
Date
|
||
|
/s/ Michael W. Clarke
|
||||
|
Michael
W. Clarke
|
Chairman,
President, Chief Executive Officer & Director
(Principal
Executive Officer)
|
March
29, 2010
|
||
|
/s/Martin S. Friedman
|
March
29,2010
|
|||
|
Martin
S. Friedman
|
Director
|
|||
|
/s/ John W.
Edgemond IV
|
||||
|
John
W. Edgemond IV
|
Director
|
March
29, 2010
|
||
|
/s/ James L.
Jadlos
|
||||
|
James
L. Jadlos
|
Director
|
March
29, 2010
|
||
|
/s/ Thomas M. Kody
|
||||
|
Thomas
M. Kody
|
Director
|
March
29, 2010
|
||
|
/s/ Robert C. Shoemaker
|
||||
|
Robert
C. Shoemaker
|
Director
|
March
29, 2010
|
||
|
/s/ Charles Wimer
|
||||
|
Charles
Wimer
|
Executive
Vice President and Chief Financial
Officer
(Principal
Financial Officer and Principal
Accounting
Officer)
|
March
29, 2010
|
80