Attached files
| file | filename |
|---|---|
| 8-K - FORM 8-K - SMITHFIELD FOODS INC | form_8k.htm |
Barclays
Capital 2010
High Yield Bond and
Syndicated Loan Conference
High Yield Bond and
Syndicated Loan Conference
Robert
W. Manly
Executive Vice
President and Chief Financial Officer
Smithfield Foods,
Inc.
March
26, 2010

2
2
2
Forward-Looking
Statements
This
presentation contains “forward-looking” statements within the meaning of the
federal
securities laws. The forward-looking statements include statements concerning the
Company’s outlook for the future, as well as other statements of beliefs, future plans and
strategies or anticipated events, and similar expressions concerning matters that are not
historical facts. The Company’s forward-looking information and statements are subject to
risks and uncertainties that could cause actual results to differ materially from those
expressed in, or implied by, the statements. These risks and uncertainties include the
availability and prices of live hogs, raw materials, fuel and supplies, food safety, livestock
disease, live hog production costs, product pricing, the competitive environment and related
market conditions, hedging risk, operating efficiencies, changes in interest rate and foreign
currency exchange rates, changes in our credit ratings, access to capital, the investment
performance of the Company’s pension plan assets and the availability of legislative funding
relief, the cost of compliance with environmental and health standards, adverse results from
on-going litigation, actions of domestic and foreign governments, labor relations issues,
credit exposure to large customers, the ability to make effective acquisitions and
dispositions and successfully integrate newly acquired businesses into existing operations,
the Company’s ability to effectively restructure portions of its operations and achieve cost
savings from such restructurings and other risks and uncertainties described in the
Company’s Annual Report on Form 10-K for fiscal 2009 and in its subsequent Quarterly
Reports on Form 10-Q. Readers are cautioned not to place undue reliance on forward-looking
statements because actual results may differ materially from those expressed in, or implied
by, the statements. Any forward-looking statement that the Company makes speaks only as
of the date of such statement, and the Company undertakes no obligation to update any
forward-looking statements, whether as a result of new information, future events or
otherwise. Comparisons of results for current and any prior periods are not intended to
express any future trends or indications of future performance, unless expressed as such,
and should only be viewed as historical data.

3
Emerging
As A Global Leader In
Packaged Meats
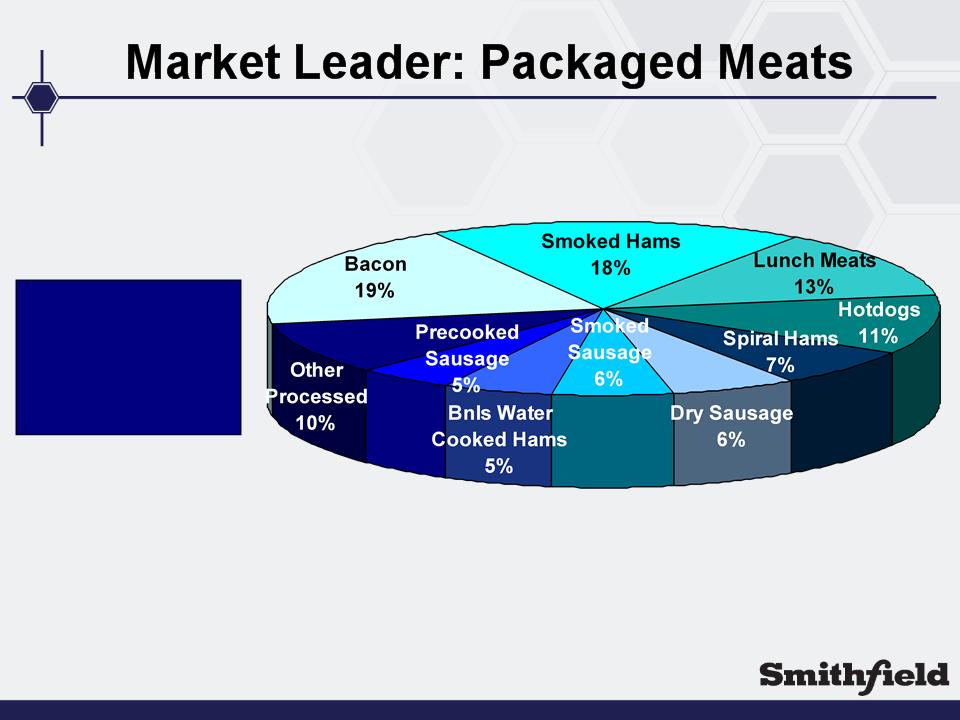
Packaged Meats
4
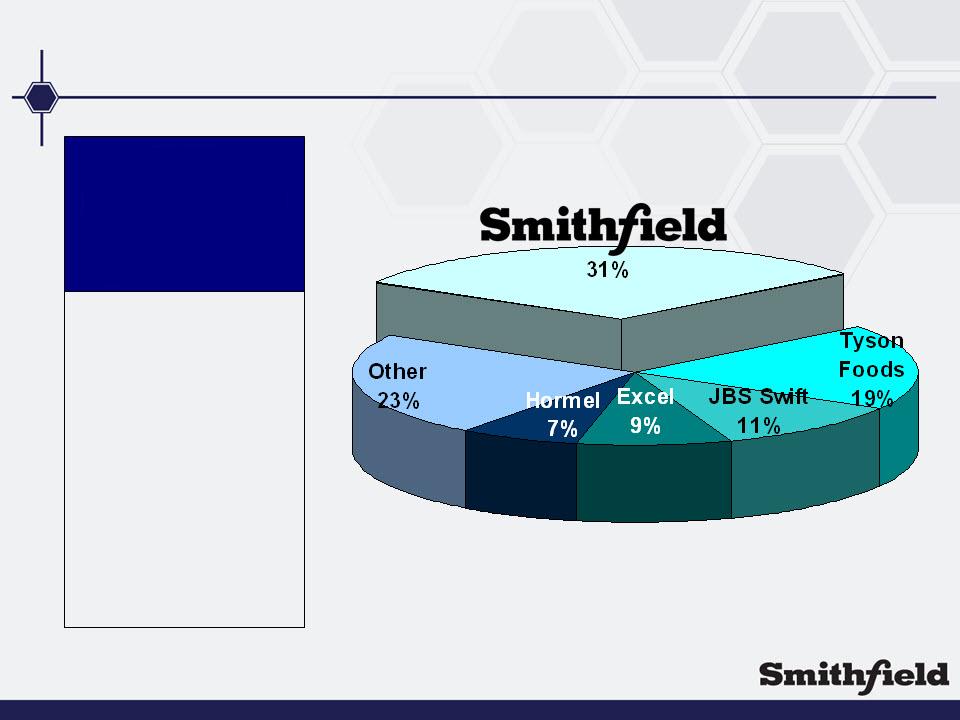
Market
Leader: Pork Processing
Pork
Sales:
$9.3 billion
Operating
Profit:
$538.2 million
$538.2 million
•World’s
largest pork
processor
processor
•Sold
approximately
3.1 billion pounds of
packaged meats in
FY09
3.1 billion pounds of
packaged meats in
FY09
•Processed
33 million
hogs in FY09
hogs in FY09
•Sold
approximately
4.5 billion pounds of
fresh pork in FY09
4.5 billion pounds of
fresh pork in FY09
Note:
TTM FY 10 Q3 sales (before eliminations) and operating profit
Source:
United States Industry Data Successful Farming
(%
of U.S. hogs processed)
5
5
5
Smithfield
sold
approximately 3.1
billion pounds of
packaged meats
in fiscal 2009
approximately 3.1
billion pounds of
packaged meats
in fiscal 2009
(%
of Smithfield U.S. packaged meats volume)
6
6
6
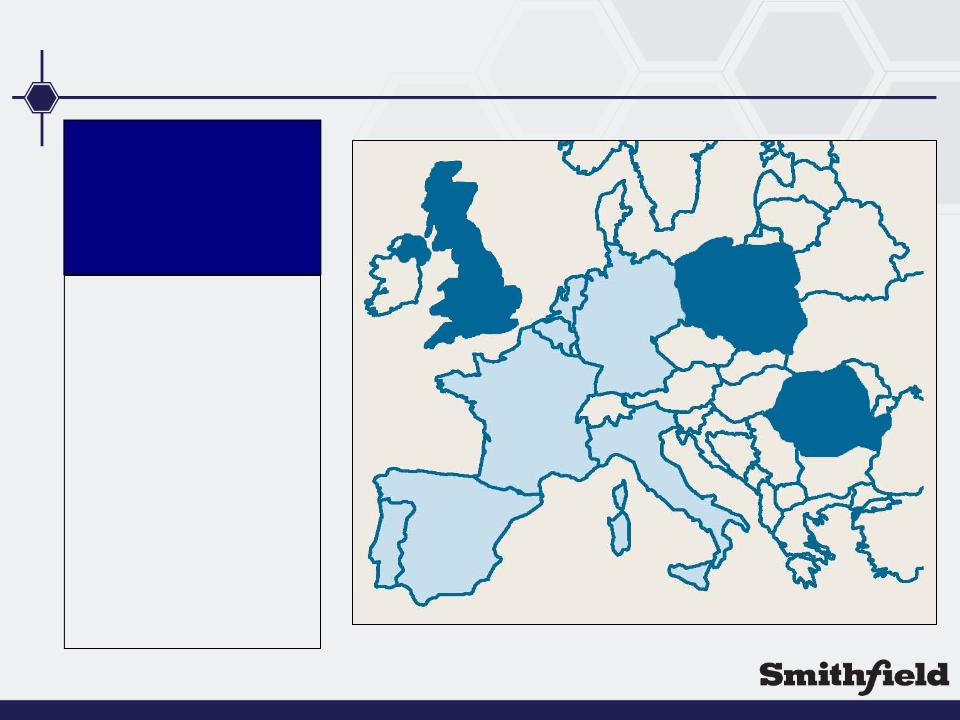
Market
Leadership: International
International
Sales:
$1.2 billion
Operating
Profit:
$39.5 million
$39.5 million
•Subsidiaries
in
Poland, Romania and
the United Kingdom
Poland, Romania and
the United Kingdom
•37%
ownership of
Campofrío Food Group
(public company) with
#1 packaged meats
market share in
France, Spain, The
Netherlands, Belgium
and Portugal
Campofrío Food Group
(public company) with
#1 packaged meats
market share in
France, Spain, The
Netherlands, Belgium
and Portugal
•Joint
ventures in
Mexico and China
Mexico and China
Note:
TTM FY 10 Q3 sales (before eliminations) and operating profit
#1
#1
#1
#1
#1
#1
#1
7
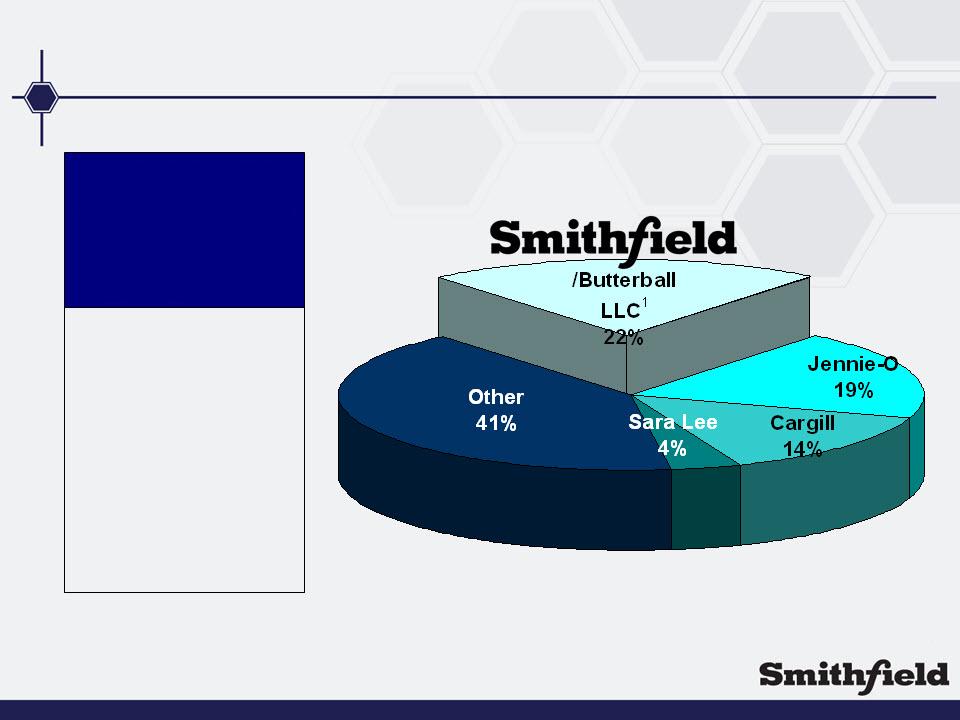
Market
Leader: Turkey Processing
Other
Segment
Sales:
$189 million
Operating
Loss:
$(17.1) million
$(17.1) million
•Butterball
is the
largest turkey
processor in the U.S.
largest turkey
processor in the U.S.
•Segment
comprised
of turkey production
operations, 49%
interest in Butterball
and interest in live
cattle joint venture
operations
of turkey production
operations, 49%
interest in Butterball
and interest in live
cattle joint venture
operations
Note:
TTM FY 10 Q3 sales (before eliminations) and operating profit; includes amounts
related to cattle operations
Source:
United States Industry Data Successful Farming
1 49% owned joint
venture
(%
of U.S. turkeys processed)
8
8
8
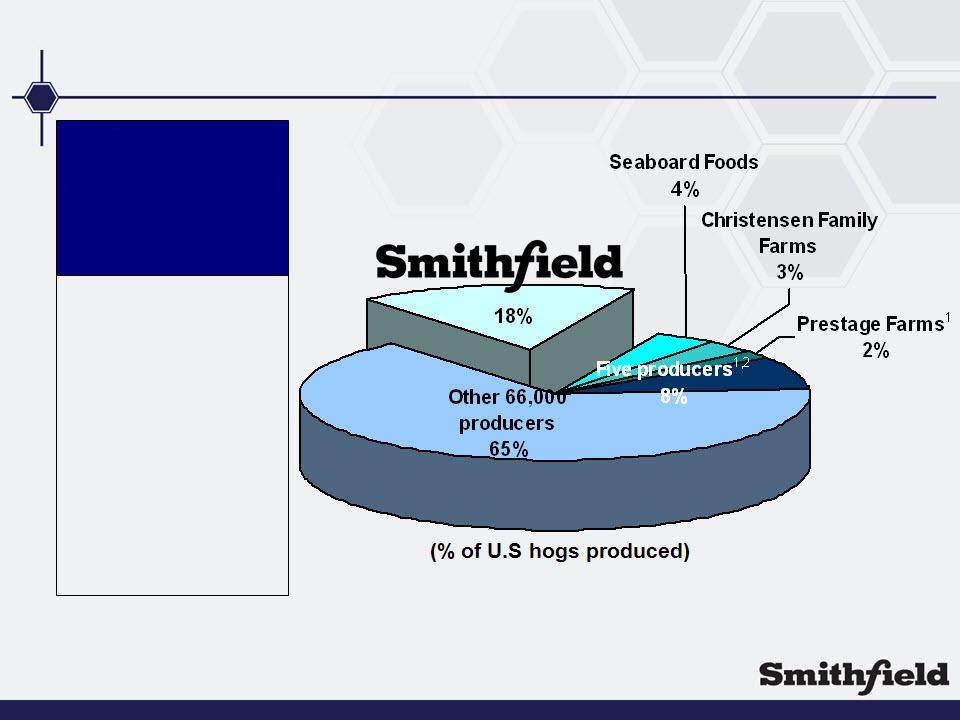
Market
Leader: Hog Production
Hog
Production
Sales:
$2.4 billion
Operating
Loss:
$(555.8) million
$(555.8) million
•World’s
largest hog
producer
producer
•Produced
18.7
million hogs in U.S.
in FY09
million hogs in U.S.
in FY09
•Produced
1.7
million hogs in
Poland and Romania
and 1.7 million hogs
at Mexican joint
ventures in FY09
million hogs in
Poland and Romania
and 1.7 million hogs
at Mexican joint
ventures in FY09
Note:
TTM FY 10 Q3 sales (before eliminations) and operating profit
Source:
United States Industry Data Successful Farming
1 The majority of hogs
from Prestage Farms and Goldsboro Hog Farm are sold to Smithfield Foods under
long-term contract
2 Approximate market
shares of Five Producers: Cargill=2%; Iowa Select Farms=2%; The Pipestone
System=1%; Goldsboro
Hog Farm=1%; The Hanor Company=1%; Total=8%
Hog Farm=1%; The Hanor Company=1%; Total=8%

9
The
New Era of Smithfield

10
10
10
The
New Era of Smithfield
• Restructured Pork
Group primed for higher performance
and stability of earnings
and stability of earnings
• Focus on synergies,
efficiency, ROIC and margins
• Increased financial
management with focus on
deleveraging the balance sheet and maintaining strong
liquidity
deleveraging the balance sheet and maintaining strong
liquidity
• Business focus on
maximizing core assets
• Create better
balance of earnings between hog
production and pork processing
production and pork processing

11
11
Pork
Group Restructuring Update
• Streamlined Pork
Group management structure - DONE
• Consolidated seven
IOC’s into three and closed five
processing plants; sixth to close in third quarter - DONE
processing plants; sixth to close in third quarter - DONE
• Merged three fresh
pork sales organizations into two and
consolidated three overseas export teams into one -
DONE
consolidated three overseas export teams into one -
DONE
• Consolidated
manufacturing platform to improve
margins, lower operating costs and increase plant
utilization - DONE
margins, lower operating costs and increase plant
utilization - DONE
• Improved Pork Group
base profitability - IN
PROCESS
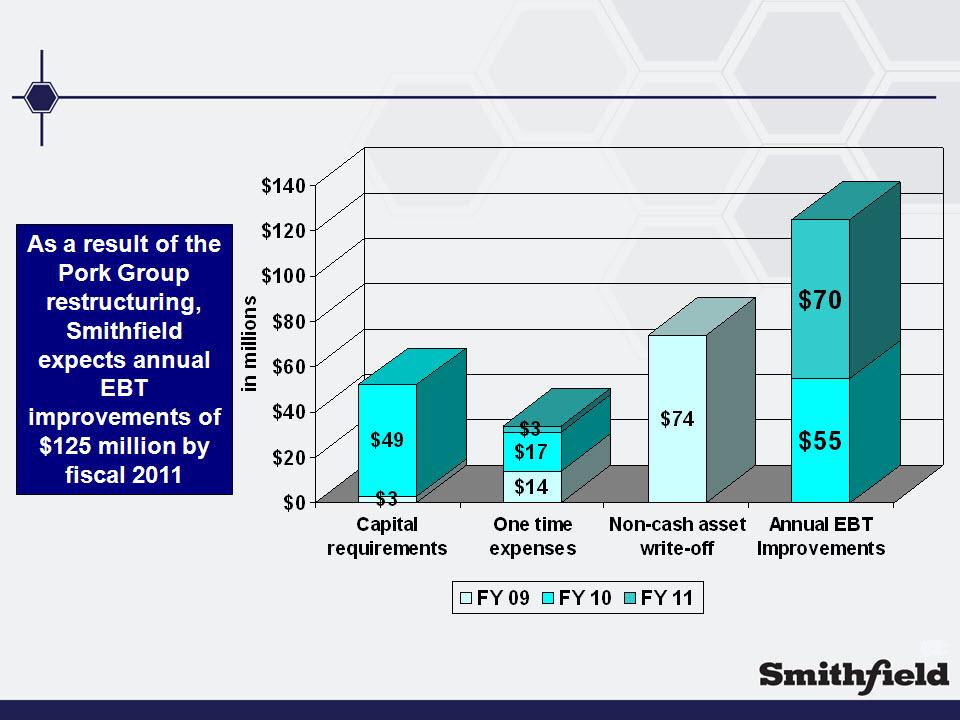
12
12
Pork
Group Restructuring Costs/Benefits
$54
million
$34
million
$74
million
$125
million

13
13
13
Pork
Group Restructuring Costs/Benefits
|
|
Capital
requirements |
One
time
expenses |
Non-cash
asset write-off |
Annual
EBT
Improvements |
|
Total
|
$52
million
|
$34
million
|
$74
million
|
$125
million
|
|
Amount
previously
incurred/achieved |
$44
million
|
$28
million
|
$74
million
|
$111
million
|
|
Amount
remaining
after FY 10 Q3 |
$8
million
|
$6
million
|
-
|
$14
million
|
14
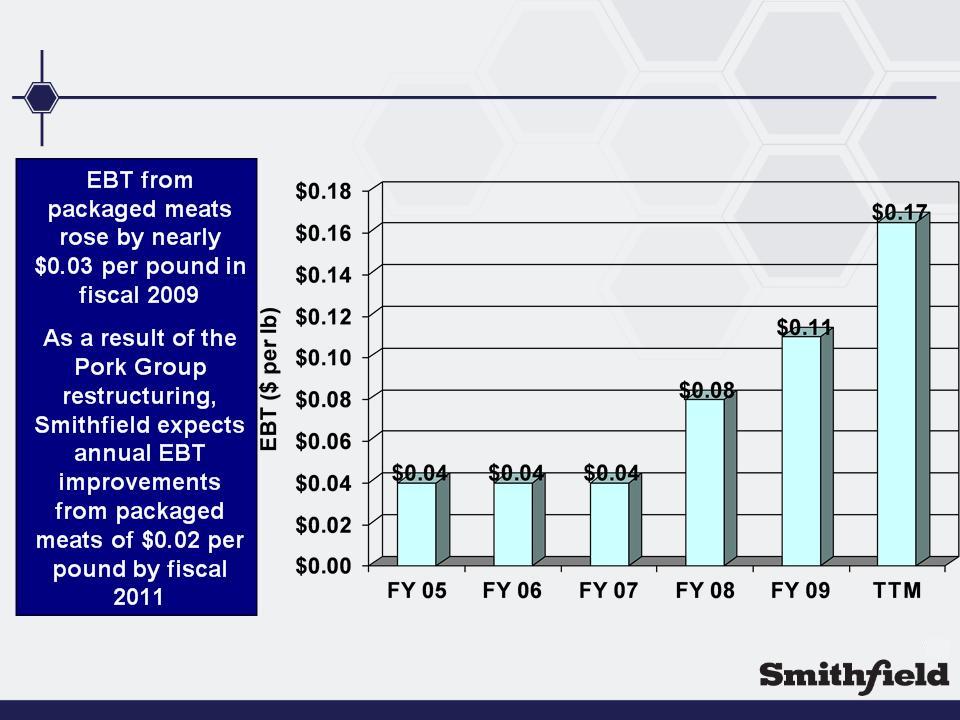
Packaged
Meats Margin Growth
Note:
FY 09 and FY 10 results before restructuring charges
15
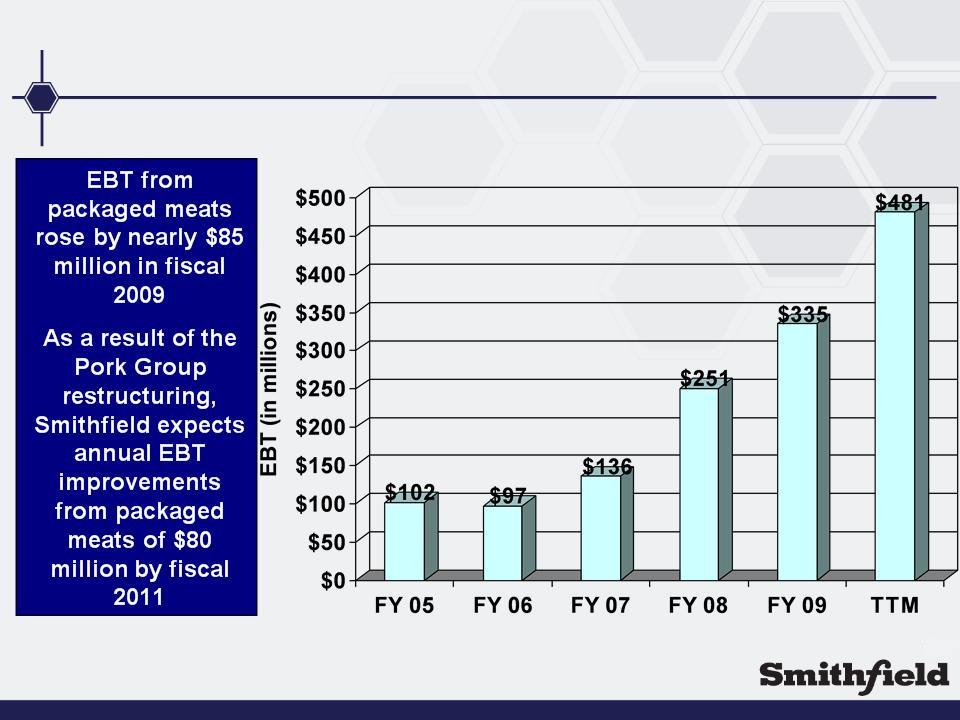
Packaged
Meats EBT Growth
Note:
FY 09 and FY 10 results before restructuring charges
16
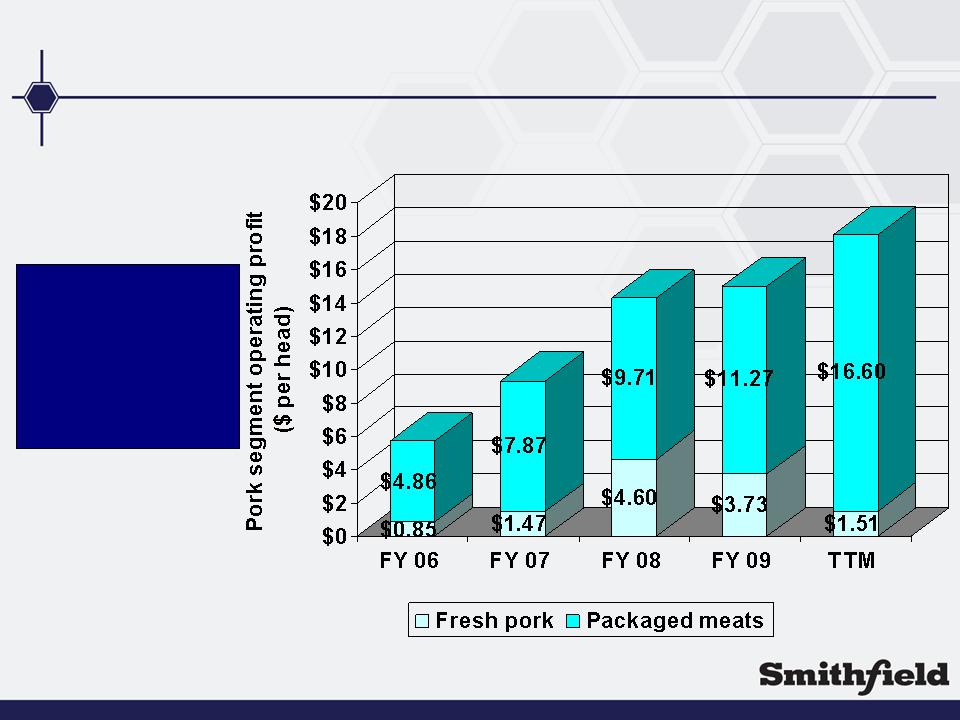
Packaged
Meats Contribution
Packaged
meats
will continue to
drive pork
segment
earnings
contribution
will continue to
drive pork
segment
earnings
contribution
$5.71
$9.34
$14.32
$15.00
Note:
FY 09 and TTM results exclude impairments mostly related to segment
restructuring. All periods
reflect an apportionment of "Pork Other" consistent with the apportionment recognized for FY 10.
reflect an apportionment of "Pork Other" consistent with the apportionment recognized for FY 10.
$18.11

17
Source:
IRI Total US Food 52 WE 12/06/09; FreshLook Market Total US Food 52 WE 11/22/09;
Turkey = Whole Bird
|
|
Category
|
|||
|
|
Size1
|
Growth2
|
||
|
Packaged
Lunchmeat
|
741.1
|
-2.5%
|
11.1%
|
2
|
|
Deli
Meats
|
685.2
|
+2.6%
|
13.3%
|
1
|
|
Turkey
|
631.9
|
+0.8%
|
20.7%
|
1
|
|
Bacon
|
604.1
|
+7.2%
|
18.4%
|
1
|
|
Smoked
Hams
|
544.0
|
+10.6%
|
55.0%
|
1
|
|
Cooked Dinner
Sausage
|
361.8
|
-1.2%
|
17.0%
|
2
|
|
Breakfast
Sausage
|
341.3
|
+0.7%
|
7.7%
|
3
|
|
Smoked
Pork
|
161.8
|
-3.5%
|
49.5%
|
1
|
|
Value Added
Ham Cuts
|
58.8
|
+3.4%
|
27.9%
|
1
|
|
Frozen
Meatballs
|
57.2
|
+2.2%
|
24.2%
|
1
|
|
BBQ
Meats
|
30.4
|
+3.9%
|
21.4%
|
2
|
Smithfield
brands
drive 19.5% of the
5 billion+ pounds
sold across its
key growth
categories
drive 19.5% of the
5 billion+ pounds
sold across its
key growth
categories
Smithfield
brands
are ranked 1st or
2nd in 10 leading
consumer
packaged meats
categories
are ranked 1st or
2nd in 10 leading
consumer
packaged meats
categories
Leading
position in key consumer categories
18
18
18
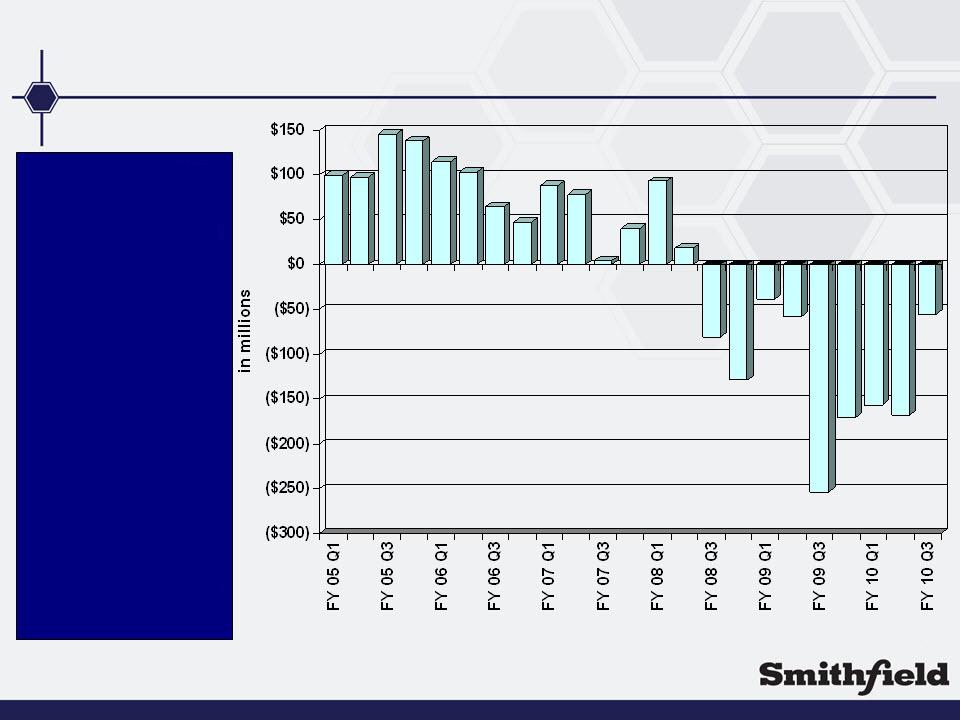
Hog
Production Operating Profit (Loss)
Smithfield
has
proactively
reduced the size
of its sow herd
by 13% in an
effort to return
hog production
to normalized
levels of
profitability
proactively
reduced the size
of its sow herd
by 13% in an
effort to return
hog production
to normalized
levels of
profitability
Hog
production
losses
moderated
significantly in
the third quarter
of fiscal 2010
losses
moderated
significantly in
the third quarter
of fiscal 2010
19
19
19
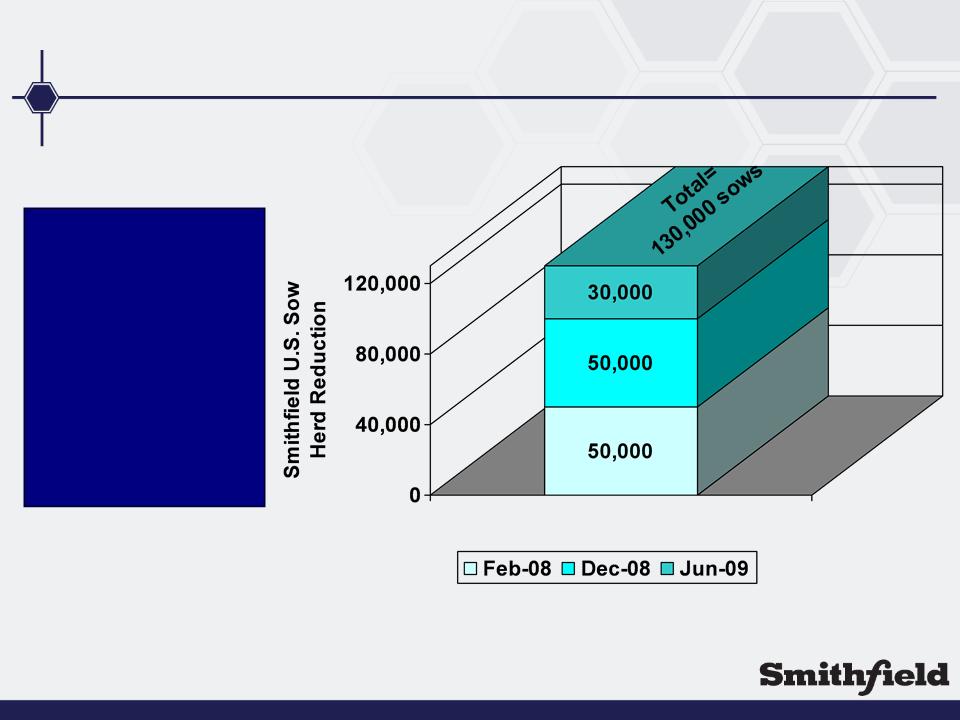
U.S.
Sow Herd Reduction
Smithfield
will
produce
approximately 1.4
million fewer
market hogs in
fiscal 2010 and
approximately 2.2
million fewer
market hogs
annually thereafter
produce
approximately 1.4
million fewer
market hogs in
fiscal 2010 and
approximately 2.2
million fewer
market hogs
annually thereafter

20
Exports
21
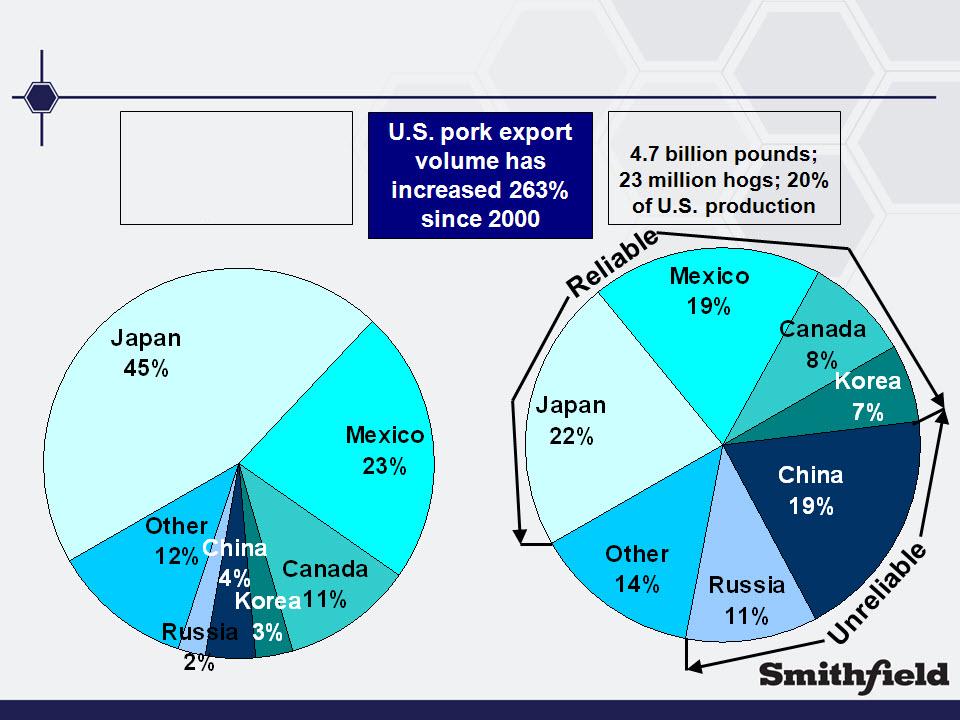
U.S.
Pork Exports 2000 vs. 2008
2008
2000
1.3
billion pounds; 7
million hogs; 7% of
U.S. production
million hogs; 7% of
U.S. production

22
Financial
Management

23
23
23
Restructuring
the Balance Sheet
• Reduced total
debt
• Removed
risk
– Covenant
– Liquidity
– Maturities

24
24
24
Restructured
$2 Billion In Debt
|
|
Size
|
Maturity
|
|
Asset-Based
Revolving
Credit Facility |
$1.0
billion
|
July
2012
|
|
Senior
Secured Notes
|
$625
million
|
July
2014
|
|
Senior
Secured Notes
|
$225
million
|
July
2014
|
|
Term
Loan Maturity
Extension |
$200
million
|
October
2013
|
New
credit facility
contains no
currently
applicable
maintenance
covenants
contains no
currently
applicable
maintenance
covenants
Estimated
quarterly interest
expense is $65-70
million
quarterly interest
expense is $65-70
million
Note:
New credit facility requires that fixed charge coverage ratio must be at least
1.1
to 1.0 if availability is less than $120 million. The Company does not expect that
availability will be below that threshold through fiscal year 2010.
to 1.0 if availability is less than $120 million. The Company does not expect that
availability will be below that threshold through fiscal year 2010.
25
25
25
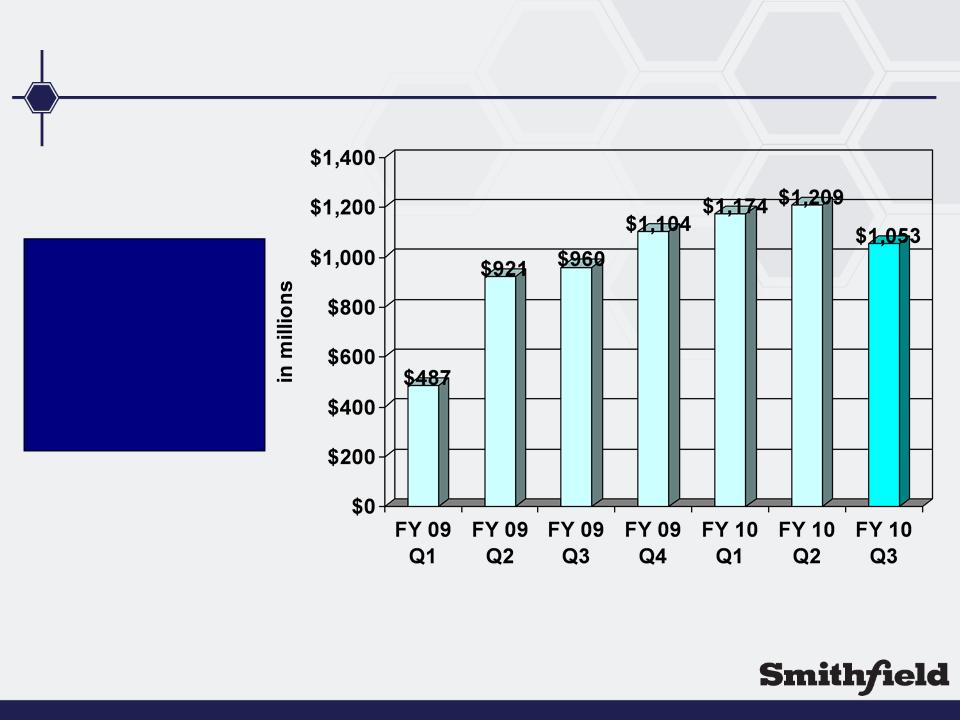
Improving
Liquidity
Smithfield
continues to
improve liquidity
and has reduced
net debt in excess
of $1 billion since
fiscal 2009
continues to
improve liquidity
and has reduced
net debt in excess
of $1 billion since
fiscal 2009
Note:
Amounts reflect unused borrowing capacity under U.S. credit facility at quarter
end plus invested and liquid
cash
cash
26
26
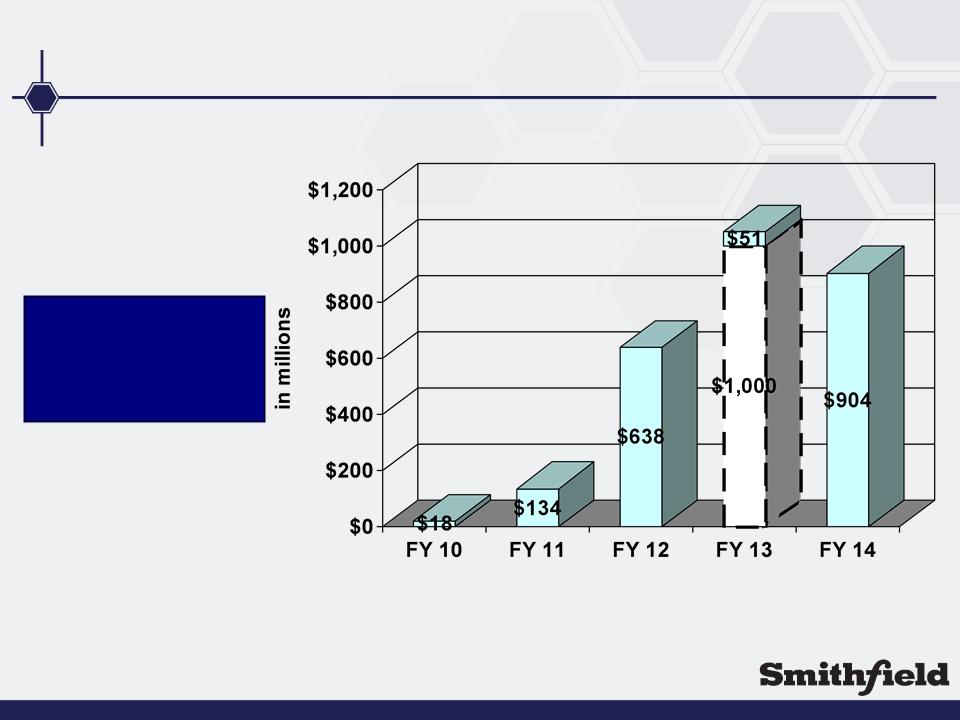
Long-Term
Debt Maturities
Smithfield
has no
significant debt
maturities until
fiscal 2012
significant debt
maturities until
fiscal 2012
27
27
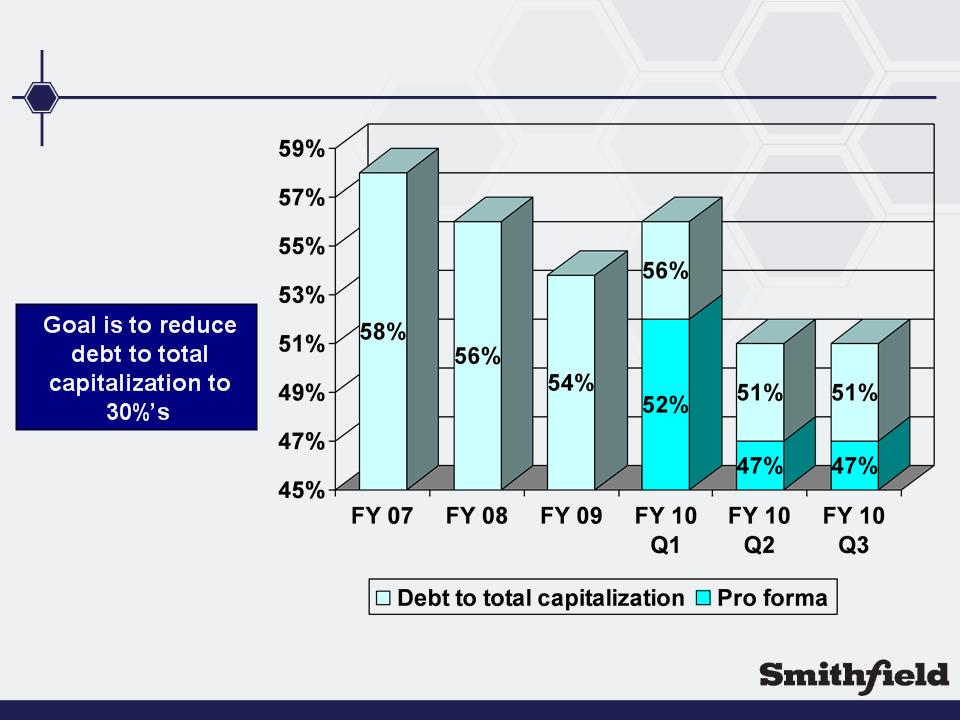
Total
Debt to Total Capitalization
Note:
FY 10 Pro forma debt is net of short-term cash
investments

28
Conclusion

29
29
29
Where
do we go from here?
• De-emphasize
domestic hog production
• Devote additional
resources to marketing
• Concentrate on
packaged meat capabilities
• Continue to search
for international value added
opportunities
opportunities

30
30
30
Conclusion
• Pork Group
profitability is already benefitting from
restructuring plan and will increase in fiscal 2011
restructuring plan and will increase in fiscal 2011
• Packaged meats
business performing at record levels
• Continuing to
maintain very strong liquidity position,
reduce debt and strengthen the balance sheet
reduce debt and strengthen the balance sheet
• Hog production
results are improving as a result of herd
reductions
reductions
• Company continues to
position the overall business for
much stronger earnings
much stronger earnings