Attached files
| file | filename |
|---|---|
| 8-K - FORM 8-K - NACCO INDUSTRIES INC | l39097e8vk.htm |
Exhibit 99
NACCO Industries, Inc. at a Glance
| Principal Businesses | 2009 Financial Results | Market Positions | ||||
 
|
NACCO Materials Handling Group (“NMHG”) | NMHG: | NMHG: | |||
| Headquarters: Cleveland, Ohio NMHG designs, engineers, manufactures, sells, services and leases a comprehensive line of lift trucks and aftermarket parts marketed globally under the Hyster® and Yale® brand names. Lift trucks and component parts are manufactured in the United States, Northern Ireland, The Netherlands, China, Italy, Japan, Mexico, the Philippines, Vietnam and Brazil. |
Revenues: $1.5 billion Operating loss: $31.2 million *Net loss: $43.1 million |
NMHG is a world leader in
the lift truck industry with an
estimated 8 percent market
share worldwide, including
a 21.5 percent market share
in the Americas market. Lift trucks are distributed through a worldwide network of independent Hyster and Yale dealers and a limited number of wholly owned dealers. |
||||
   
|
Hamilton Beach Brands (“HBB”) | HBB: | HBB: | |||
| Headquarters: Richmond, Virginia HBB is a leading designer, marketer and distributor of small electric household appliances, as well as commercial products for restaurants, bars and hotels. HBB has a broad portfolio of some of the most recognized and respected brands in the small electric appliance industry, including Hamilton Beach®, Proctor Silex®, eclectrics®, Traditions®, TrueAir® and Hamilton Beach® Commercial. |
Revenues: $497.0 million Operating profit: $50.4 million *Net income: $26.1 million |
HBB is one of the leading
companies in retail and
commercial small appliances,
with strong share positions
in many of the categories in
which it competes. HBB products are primarily distributed through mass merchants, national department stores, wholesale distributors and other retail sales outlets. |
||||
| Kitchen Collection Headquarters: Chillicothe, Ohio Kitchen Collection is a national specialty retailer of kitchenware and gourmet foods operating under the Kitchen Collection® and Le Gourmet Chef® store names in outlet and traditional malls throughout the United States. |
Kitchen Collection: Revenues: $213.9 million Operating profit: $6.7 million *Net income: $3.9 million |
Kitchen Collection: Kitchen Collection is the nation’s leading specialty retailer of kitchen and related products in factory outlet malls with 296 stores throughout the United States in 2009. |
||||
 
|
North American Coal (“NACoal”) | NACoal: | NACoal: | |||
| Headquarters: Dallas, Texas North American Coal mines and markets coal primarily as fuel for power generation and provides selected value-added mining services for other natural resources companies. North American Coal operates five surface coal mining operations and has three additional coal mines under development. The company also provides dragline mining services operating under the name “North American Mining Company” for independently owned limerock quarries in Florida. |
Revenues: $129.5 million Operating profit: $42.6 million *Net income: $53.2 million |
North American Coal is the nation’s largest miner of lignite coal and among the ten largest coal producers. Coal is delivered from mines in Louisiana, Mississippi, North Dakota and Texas to adjacent or nearby power plants. | ||||
| * For purposes of this annual report, discussions about net income/loss refer to net income/loss attributable to stockholders. | ||
NACCO Industries, Inc. is an operating holding company with subsidiaries in the following
principal industries: lift trucks, small appliances, speciality retail and mining. In 2009, total
revenues were $2.3 billion and net income* was
$31.1 million.
| Competitive Advantages | Financial Objectives | Key Strategies | ||||||
| NMHG: | NMHG: | NMHG: | ||||||
• • • • • • • • |
Leading market share positions in the
Americas and worldwide Highly recognized Hyster® and Yale® brand names Large installed population base of lift trucks; an estimated 804,000 Hyster® and Yale® lift trucks in operation worldwide Highly diverse customer base with more than 600 different end-user applications in more than 600 industries Comprehensive global product line Strong dealer network Industry-leading national account coverage in the Americas Globally integrated operations with significant economies of scale |
Achieve a minimum operating profit margin target of 9 percent at the peak of the market cycle | • • • • • |
Innovation in our products and services - Lowest cost of ownership
- Application-focused
solutions
Quality and efficiency- Improve operational effectiveness while delivering
high-quality products
- Continually reduce manufacturing and supply chain costs
- Manufacturing in market of sale
Sales and service excellence
- Independent dealer networks with dual brand representation
if dealerships meet criteria
- Strong national account direct sales group to support large,
geographically dispersed customers
Global coverage with local tailoring of products, services,
processes and systemsOrganizational excellence - People development |
||||
| HBB: | HBB: | HBB: | ||||||
• • • • • |
Strong heritage brands with leading market
shares Strong relationships with leading retailers Highly professional and experienced management team Successful track record of product line expansion and new product innovation Industry-leading working capital management |
Achieve a minimum operating profit margin target of 10 percent | • • • • • |
Innovation in our products Sales and marketing excellence - Professional and efficient sales and marketing teams,
processes and systems
- Building brand equity of our current brands and
increasing the number of brands
Quality and efficiency- Ensure operational excellence while delivering
high-quality products
- Continually reduce supply chain costs
Partnerships with our customers and suppliers
Organizational excellence- People and processes development |
||||
| Kitchen Collection: | Kitchen Collection: | Kitchen Collection: | ||||||
• • |
Highly analytical merchandising skills and
disciplined operating controls Two well-established, complementary retail store formats —Kitchen Collection® and Le Gourmet Chef® |
Achieve a minimum operating profit margin target of 5 percent | • • • • • |
Unique, high-quality, widest variety of affordable products
in creative store environments Store improvement and expansion - Kitchen Collection® outlet mall expansion
- Le Gourmet Chef® outlet and traditional mall expansion
- Internet channel expansion
Cost control- Continually reduce store and warehousing costs
- Control capital costs
Partnerships with our suppliersOrganizational excellence - People and processes development |
||||
| NACoal: | NACoal: | NACoal: | ||||||
• • • • • • |
Coal mines provide steady income and cash
flow before financing activities and high return
on equity Contracts are structured to minimize exposure to market fluctuations of coal prices 2.2 billion tons of lignite coal reserves, of which approximately 1.2 billion tons are committed to current customers Outstanding operational and technological mining skills Highly efficient heavy equipment utilization Excellent record of environmental responsibility and employee safety |
Earn a minimum return on capital employed of 13 percent and attain positive Economic Value Income from all existing consolidated mining operations and any new projects, while maintaining or increasing the profitability of all existing unconsolidated mining operations | • • • • • |
Mining and reclamation expertise - Innovative and low cost
- Equipment maintenance
- Efficient processes and systems
Safety focusLong-term partnerships with current and future customers Pursue new business opportunities - Domestic and international
- Coal and value-added mining services
Organizational excellence- People development
- Highly disciplined mine management teams |
||||

Selected Financial and Operating Data
NACCO Industries, Inc. and Subsidiaries
| Year Ended December 31 | ||||||||||||||||||||
| 2009 | 2008(1) | 2007 | 2006 | 2005 | ||||||||||||||||
| (In millions, except per share data) | ||||||||||||||||||||
Operating Statement Data : |
||||||||||||||||||||
Revenues |
$ | 2,310.6 | $ | 3,665.1 | $ | 3,590.0 | $ | 3,327.6 | $ | 3,144.2 | ||||||||||
Operating profit (loss) |
$ | 59.1 | $ | (389.5 | ) | $ | 139.2 | $ | 171.1 | $ | 107.9 | |||||||||
Income (loss) from continuing operations |
$ | 8.4 | $ | (439.7 | ) | $ | 89.7 | $ | 90.5 | $ | 56.9 | |||||||||
Discontinued operations, net-of-tax(2) |
22.6 | 2.3 | 0.6 | 2.8 | 1.4 | |||||||||||||||
Extraordinary gain, net-of-tax(3) |
— | — | — | 12.8 | 4.7 | |||||||||||||||
Net income (loss) |
$ | 31.0 | $ | (437.4 | ) | $ | 90.3 | $ | 106.1 | $ | 63.0 | |||||||||
Net (income) loss attributable
to noncontrolling interest |
0.1 | (0.2 | ) | 0.1 | 0.7 | 0.1 | ||||||||||||||
Net income (loss) attributable to stockholders |
$ | 31.1 | $ | (437.6 | ) | $ | 90.4 | $ | 106.8 | $ | 63.1 | |||||||||
Basic Earnings (Loss) per Share: |
||||||||||||||||||||
Income (loss) from continuing operations
attributable to stockholders |
$ | 1.03 | $ | (53.12 | ) | $ | 10.87 | $ | 11.07 | $ | 6.93 | |||||||||
Discontinued operations, net-of-tax(2) |
2.72 | 0.28 | 0.07 | 0.34 | 0.17 | |||||||||||||||
Extraordinary gain, net-of-tax(3) |
— | — | — | 1.56 | 0.57 | |||||||||||||||
Basic earnings (loss) per share |
$ | 3.75 | $ | (52.84 | ) | $ | 10.94 | $ | 12.97 | $ | 7.67 | |||||||||
Diluted Earnings (Loss) per Share: |
||||||||||||||||||||
Income (loss) from continuing operations
attributable to stockholders |
$ | 1.03 | $ | (53.12 | ) | $ | 10.86 | $ | 11.06 | $ | 6.93 | |||||||||
Discontinued operations, net-of-tax(2) |
2.72 | 0.28 | 0.07 | 0.34 | 0.17 | |||||||||||||||
Extraordinary gain, net-of-tax(3) |
— | — | — | 1.56 | 0.57 | |||||||||||||||
Diluted earnings (loss) per share |
$ | 3.75 | $ | (52.84 | ) | $ | 10.93 | $ | 12.96 | $ | 7.67 | |||||||||
Per Share and Share Data: |
||||||||||||||||||||
Cash dividends |
$ | 2.068 | $ | 2.045 | $ | 1.980 | $ | 1.905 | $ | 1.848 | ||||||||||
Market value at December 31 |
$ | 49.80 | $ | 37.41 | $ | 99.69 | $ | 136.60 | $ | 117.15 | ||||||||||
Stockholders’ equity at December 31 |
$ | 47.82 | $ | 43.05 | $ | 107.80 | $ | 96.05 | $ | 85.21 | ||||||||||
Actual shares outstanding at December 31 |
8.294 | 8.286 | 8.269 | 8.238 | 8.226 | |||||||||||||||
Basic weighted average shares outstanding |
8.290 | 8.281 | 8.263 | 8.234 | 8.223 | |||||||||||||||
Diluted weighted average shares outstanding |
8.296 | 8.281 | 8.272 | 8.242 | 8.226 | |||||||||||||||
Balance Sheet Data at December 31: |
||||||||||||||||||||
Total assets |
$ | 1,488.7 | $ | 1,687.9 | $ | 2,427.3 | $ | 2,154.5 | $ | 2,091.6 | ||||||||||
Long-term debt |
$ | 377.6 | $ | 400.3 | $ | 439.3 | $ | 359.9 | $ | 406.2 | ||||||||||
Stockholders’ equity |
$ | 396.6 | $ | 356.7 | $ | 891.4 | $ | 791.3 | $ | 700.9 | ||||||||||
| (1) | During 2008, NACCO’s stock price significantly declined compared with previous periods and the Company’s market value of equity was below its book value of tangible assets and book value of equity. The Company performed an impairment test, which indicated that goodwill and certain other intangibles were impaired at December 31, 2008. Therefore, the Company recorded a non-cash impairment charge of $435.7 million in 2008. | |
| (2) | During 2009, the Company’s North American Coal subsidiary completed the sale of certain assets of the Red River Mining Company. The results of operations of Red River for 2009 and all prior periods have been reclassified to reflect Red River’s operating results as discontinued operations. | |
| (3) | An extraordinary gain was recognized in 2006 and 2005 as a result of a reduction to Bellaire Corporation’s estimated closed mine obligations relating to amounts owed to the United Mine Workers of America Combined Benefit Fund arising as a result of the Coal Industry Retiree Health Benefit Act of 1992. |
1
| Year Ended December 31 | ||||||||||||||||||||
| 2009 | 2008(1) | 2007 | 2006 | 2005 | ||||||||||||||||
| (In millions, except employee data) | ||||||||||||||||||||
Cash Flow Data: |
||||||||||||||||||||
Operating Activities |
||||||||||||||||||||
NACCO Materials Handling Group |
$ | 115.9 | $ | (27.3 | ) | $ | 34.6 | $ | 84.8 | $ | 11.9 | |||||||||
Hamilton Beach Brands |
35.5 | 18.0 | 19.5 | 28.7 | 31.8 | |||||||||||||||
Kitchen Collection |
5.4 | (6.4 | ) | (10.9 | ) | 17.2 | 0.1 | |||||||||||||
North American Coal Corporation |
42.0 | 23.2 | 44.7 | 38.7 | 26.4 | |||||||||||||||
NACCO and Other |
(41.8 | ) | (2.6 | ) | (6.5 | ) | 4.1 | 5.0 | ||||||||||||
Provided by operating activities |
$ | 157.0 | $ | 4.9 | $ | 81.4 | $ | 173.5 | $ | 75.2 | ||||||||||
Investing Activities |
||||||||||||||||||||
NACCO Materials Handling Group |
$ | 5.8 | $ | (37.5 | ) | $ | (33.9 | ) | $ | (30.6 | ) | $ | (30.1 | ) | ||||||
Hamilton Beach Brands |
(2.1 | ) | (5.7 | ) | (3.7 | ) | 7.2 | (3.8 | ) | |||||||||||
Kitchen Collection |
(1.1 | ) | (6.0 | ) | (3.9 | ) | (16.1 | ) | (1.0 | ) | ||||||||||
North American Coal Corporation |
34.5 | (15.9 | ) | (18.2 | ) | 4.2 | (21.4 | ) | ||||||||||||
NACCO and Other |
(14.0 | ) | (6.3 | ) | (0.2 | ) | — | — | ||||||||||||
Provided by (used for) investing activities |
$ | 23.1 | $ | (71.4 | ) | $ | (59.9 | ) | $ | (35.3 | ) | $ | (56.3 | ) | ||||||
Cash Flow before Financing Activities(4) |
||||||||||||||||||||
NACCO Materials Handling Group |
$ | 121.7 | $ | (64.8 | ) | $ | 0.7 | $ | 54.2 | $ | (18.2 | ) | ||||||||
Hamilton Beach Brands |
33.4 | 12.3 | 15.8 | 35.9 | 28.0 | |||||||||||||||
Kitchen Collection |
4.3 | (12.4 | ) | (14.8 | ) | 1.1 | (0.9 | ) | ||||||||||||
North American Coal Corporation |
76.5 | 7.3 | 26.5 | 42.9 | 5.0 | |||||||||||||||
NACCO and Other |
(55.8 | ) | (8.9 | ) | (6.7 | ) | 4.1 | 5.0 | ||||||||||||
Consolidated Cash Flow before Financing Activities |
$ | 180.1 | $ | (66.5 | ) | $ | 21.5 | $ | 138.2 | $ | 18.9 | |||||||||
Provided by (used for) financing activities |
$ | (64.1 | ) | $ | (83.2 | ) | $ | 64.4 | $ | (105.8 | ) | $ | (1.8 | ) | ||||||
Other Data: |
||||||||||||||||||||
Adjusted EBITDA(5) |
$ | 111.5 | $ | 106.6 | $ | 201.7 | $ | 213.8 | $ | 175.5 | ||||||||||
Total employees at December 31(6) |
8,600 | 9,500 | 10,600 | 11,300 | 11,100 | |||||||||||||||
| (4) | Cash Flow before Financing Activities is equal to net cash provided by operating activities less net cash used for investing activities. | |
| (5) | Adjusted EBITDA is provided solely as a supplemental disclosure with respect to liquidity because management believes it provides useful information regarding a company’s ability to service its indebtedness. Adjusted EBITDA does not represent cash flow from operations, as defined by U.S. generally accepted accounting principles. You should not consider Adjusted EBITDA as a substitute for net income or net loss, or as an indicator of our operating performance or whether cash flows will be sufficient to fund our cash needs. NACCO defines Adjusted EBITDA as income before goodwill and other intangible assets impairment charges, income taxes, non-controlling interest (income) expense, discontinued operations and extraordinary gain plus net interest expense and depreciation, depletion and amortization expense. Adjusted EBITDA is not a measurement under U.S. generally accepted accounting principles and is not necessarily comparable with similarly titled measures of other companies. Net cash flows from operating, investing and financing activities as determined using U.S. generally accepted accounting principles are presented above. A reconciliation of cash flow provided by operating activities to Adjusted EBITDA is presented below. | |
| (6) | Includes employees of the unconsolidated mining subsidiaries and excludes employees of Red River. |
| Year Ended December 31 | ||||||||||||||||||||
| 2009 | 2008(1) | 2007 | 2006 | 2005 | ||||||||||||||||
| (In millions) | ||||||||||||||||||||
Reconciliation of Cash Flow Provided by
Operating Activities to Adjusted EBITDA(5) |
||||||||||||||||||||
Cash flow provided by operating activities |
$ | 157.0 | $ | 4.9 | $ | 81.4 | $ | 173.5 | $ | 75.2 | ||||||||||
Change in working capital items |
(114.9 | ) | 96.6 | 77.2 | (21.6 | ) | 46.0 | |||||||||||||
Gain on sale of assets and businesses |
10.0 | 0.1 | 1.3 | 25.6 | 0.6 | |||||||||||||||
Discontinued operations(2) |
8.4 | (4.6 | ) | (2.0 | ) | (4.8 | ) | (2.6 | ) | |||||||||||
Restructuring charges |
(9.3 | ) | (9.1 | ) | (8.6 | ) | (0.8 | ) | (2.7 | ) | ||||||||||
Difference between deferred income
taxes and income tax provision (benefit) |
(4.6 | ) | (1.6 | ) | 19.1 | 19.4 | 21.1 | |||||||||||||
Other non-cash items |
35.9 | (12.7 | ) | 4.6 | (11.8 | ) | (5.4 | ) | ||||||||||||
Interest expense, net |
29.0 | 33.0 | 28.7 | 34.3 | 43.3 | |||||||||||||||
Adjusted EBITDA(5) |
$ | 111.5 | $ | 106.6 | $ | 201.7 | $ | 213.8 | $ | 175.5 | ||||||||||
Calculation of Adjusted EBITDA(5) |
||||||||||||||||||||
Net income (loss) attributable to stockholders |
$ | 31.1 | $ | (437.6 | ) | $ | 90.4 | $ | 106.8 | $ | 63.1 | |||||||||
Goodwill and other intangible
assets impairment charges |
— | 435.7 | — | — | — | |||||||||||||||
Discontinued operations, net of tax(2) |
(22.6 | ) | (2.3 | ) | (0.6 | ) | (2.8 | ) | (1.4 | ) | ||||||||||
Extraordinary gain, net-of-tax(3) |
— | — | — | (12.8 | ) | (4.7 | ) | |||||||||||||
Noncontrolling interest (income) loss |
(0.1 | ) | 0.2 | (0.1 | ) | (0.7 | ) | (0.1 | ) | |||||||||||
Income tax provision |
20.5 | 18.7 | 24.3 | 28.5 | 13.8 | |||||||||||||||
Interest expense |
32.2 | 40.6 | 40.7 | 41.8 | 47.5 | |||||||||||||||
Interest income |
(3.2 | ) | (7.6 | ) | (12.0 | ) | (7.5 | ) | (4.2 | ) | ||||||||||
Depreciation, depletion and amortization expense |
53.6 | 58.9 | 59.0 | 60.5 | 61.5 | |||||||||||||||
Adjusted EBITDA(5) |
$ | 111.5 | $ | 106.6 | $ | 201.7 | $ | 213.8 | $ | 175.5 | ||||||||||
This Annual Report contains references to non-GAAP financial measures. Presentations of, and
quantitative reconciliations to, the most directly comparable financial measures calculated and
presented in accordance with GAAP appear on this page and page 16.
2
To
Our Stockholders
Introduction
The global recession
made 2009 very challenging for
NACCO Industries, Inc. and its
subsidiaries, particularly in
the first half of the year.
NACCO’s lift truck business
faced extraordinarily depressed
markets worldwide. Consumer
goods markets were well below
earlier peak levels. And while
lignite mining markets remained
steady, the limerock mining
markets in Florida were
extremely depressed.
Given these market
conditions, consolidated
revenues for NACCO decreased
substantially in 2009 to $2.3
billion compared with $3.7
billion in 2008. As a result,
NACCO Materials Handling Group
(“NMHG”) had a significant loss
in 2009 as its revenue declined
48 percent because global lift
truck markets remained very
weak for the entire year.
However, at Hamilton Beach
Brands (“HBB”), despite a
decrease in revenues, operating
results were exceptional.
Kitchen Collection also
experienced a promising
turnaround in 2009, reporting
significantly improved results.
North American Coal (“NACoal”)
had an excellent year with
improved results. Overall, we
implemented aggressive actions
in 2009 to combat the recession
and made sound progress on our
key improvement programs.
Economic and market
conditions appeared to
stabilize in the second half of
2009, with some isolated signs
of limited recovery beginning
to emerge. The forklift truck
market appears to have
stabilized at the end of 2009,
but at very depressed levels in
NMHG’s largest markets.
These depressed levels are
expected to continue into 2010.
NACCO continues to operate on
the assumption that the global
lift truck
markets will not improve
significantly in the first half of
2010, and is cautiously optimistic
a moderate recovery in that market
will begin in the second half. The
consumer goods markets appear to be
recovering, although consumers
continue to struggle with high
unemployment rates and lower income
levels. The lignite market is
expected to remain stable, and the
limerock market in South Florida is
expected to continue to be
depressed by the weak housing and
construction markets. Aggressive
cost containment actions, such as
reduced employee salaries and
benefits and spending and travel
restrictions, remain in effect at
NMHG and NACCO headquarters, and
will be phased back in only as
NMHG’s financial results permit. At
the consumer products subsidiaries,
employee-related benefit programs
suspended at the beginning of 2009
were partially phased back in
during the fourth quarter of 2009
and have been fully reinstated in
2010.
NACCO and its subsidiaries
continue to be financially
secure. In 2009, NACoal
refinanced its credit agreement
on favorable terms. Each of the
other subsidiaries currently has
attractive financing in place.
Further, each of NACCO’s
subsidiaries generated
extraordinary cash flow before
financing activities in 2009,
with Consolidated NACCO in total
generating $180.1 million. We
will continue to focus on
maximizing cash flow before
financing activities in 2010,
although levels lower than in
2009 are expected because 2009’s
significant reductions in
working capital are not expected
to reoccur.
NACCO continues to have
flexibility in capitalizing
its subsidiaries, an option
3
we believe to be a key advantage
of our operating holding company
organization structure. In 2009,
additional capital contributions
of $79.7 million and $3.2 million
were made to NMHG and Kitchen
Collection, respectively.
Subsidiary Financial Objectives
Each of NACCO’s
subsidiary companies has
specific long-term financial
objectives (see sidebar for
specific goals). In 2009, NACoal
and HBB achieved their targets.
However, if HBB had not
suspended certain employee
benefits, the company would have
been short of its operating
profit margin target. Looking
forward, HBB is expected to
continue to do very well, but it
will need additional sales
volume to achieve its target.
Kitchen Collection made
substantial progress toward its
financial objectives in 2009.
Kitchen Collection®
stores were at target, but
the Le Gourmet
Chef® stores are not
expected to achieve the target
objective until 2012 to 2013 as
sales volume increases and certain
underperforming stores are closed.
Due to the unprecedented depressed
market conditions in the forklift
truck market and the continuing
uncertainty regarding the timing of
an upturn in that market, it is
difficult to provide a timetable
for achieving NMHG’s target.
However, NMHG’s programs created
substantial operating leverage,
establishing a strong position to
achieve its operating profit margin
target when the market does peak.
Each of NACCO’s subsidiaries is
proceeding with specific programs
designed to achieve its targets. As
market conditions improve, the
Company expects that the
subsidiaries’ operating
fundamentals and the maturation of
the programs that have been put in
place will position each of them to
achieve their long-term financial
goals.
Subsidiary Financial Objectives:
| • | NACoal: Earn a minimum return on capital employed of 13 percent and attain positive Economic Value Income from all existing consolidated mining operations and any new projects while maintaining or increasing the profitability of all existing unconsolidated mining operations | |
| • | NMHG: Achieve a minimum operating profit margin of 9 percent at the peak of the market cycle | |
| • | HBB: Achieve a minimum operating profit margin of 10 percent | |
| • | Kitchen Collection: Achieve a minimum operating profit margin of 5 percent | |
| • | All subsidiaries: Generate substantial cash flow before financing activities |
Discussion of Results
In late 2009, NACoal completed the
sale of certain assets of the Red River
Mining Company for cash proceeds of $41.4
million. Because of this sale, the financial
information in this Annual Report has been
reclassified to reflect the Red River Mining
Company operating results as discontinued
operations. As a result, net income(1)
for 2009 includes earnings from
discontinued operations of $22.6 million,
comprised of the after-tax gain on the sale
of $22.3 million and Red River’s full-year
after-tax earnings of $0.3 million.
Overall, NACCO reported consolidated
income from continuing operations of $8.5
million in 2009, compared with a consolidated
loss from continuing operations of $439.9
million in 2008. Results for 2008 were
negatively affected by a non-cash write-off of
goodwill and certain other intangible assets
at NMHG, HBB and Kitchen Collection totaling
$435.7 million, or $431.6 million net of taxes
of $4.1 million, and the recognition of
non-cash charges totaling $29.8 million
against certain accumulated deferred tax
assets at NMHG. Including these charges, in
2008 NMHG incurred a net loss of $376.0
million, HBB reported a net loss of $73.3
million and Kitchen Collection reported a net
loss of $10.0 million.
Excluding these charges, consolidated
adjusted net income for the year ended
December 31, 2008 was $23.8 million, or
$2.87 per share, which includes earnings from
discontinued operations of $2.3 million.
“Adjusted net income or loss” in this letter
refers to net income or net loss results that
exclude the goodwill and intangible assets
impairment charges as well as the charges against
the accumulated deferred tax assets. (For
reconciliations from 2008 GAAP results to the
adjusted 2008 non-GAAP results, see page 16.) The
remaining discussion of 2008 results in this
letter relates only to adjusted net income or
adjusted net loss unless otherwise noted.
Management believes a discussion of adjusted net
income or adjusted net loss is more reflective of
NACCO’s underlying business operations and
assists investors and the subsidiaries’ lenders
in better understanding the results of operations
of NACCO and its subsidiaries.
During 2009, NACoal reported income from
continuing operations of $30.6 million
compared with income from continuing
operations of $19.8 million in 2008. NMHG had
a net loss of $43.1 million in 2009 compared
with adjusted net income of $1.1 million in
2008. HBB had 2009 net income of $26.1
million compared with 2008 adjusted net
income of $7.4 million. Finally, in 2009
Kitchen Collection reported net income of
$3.9 million compared with an adjusted net
loss of $6.4 million in 2008. Further
discussion of these results is contained in
each subsidiary’s section of this letter.
| (1) | For purposes of this annual report, discussions about income/loss from continuing operations and net income/loss refer to income/loss from continuing operations attributable to stockholders and net income/loss attributable to stockholders. |
4
[PICTURE:
One of the draglines at The Falkirk Mining Company in North
Dakota.]
North American Coal
2009 Results
NACoal has had
strong, stable performance over
the years and 2009 was no
exception. The long-term nature
of NACoal’s coal supply
agreements and the low cost of
power provided by the power
plants it serves resulted in
minimal effect from the
recession on the company’s coal
mining operations. Positive
financial developments in 2009
included the sale of the Red
River Mining Company for cash
proceeds of $41.4 million and
an after-tax gain of $22.3
million, the receipt of lease
bonus payments of $7.1
million pre-tax for
leasing certain oil and gas
mineral rights controlled by
NACoal to a third party
and significantly improved
deliveries and operations at the
Mississippi Lignite Mining Company
compared with 2008. As a result of
the favorable events of 2009,
NACoal generated cash flow before
financing activities of $76.5
million compared with cash flow
before financing activities of $7.3
million in 2008.
Nevertheless, 2009 did have
challenges. Minimal limerock was
mined as a result of
the downturn in the Florida housing
and construction markets and an
unfavorable legal ruling for the
Florida lake belt region that
terminated NACoal’s customers’, as
well as others’, existing mining
permits at most of the limerock
dragline mining operations. The
nature of the company’s limerock
mining services agreements did,
however, limit the financial impact
on NACoal. In addition, inclement
weather in Mississippi in the
fourth quarter reduced efficiency
at that mine and unscheduled
outages throughout the year at the
Sabine Mining Company’s customer’s
power plant resulted in fewer
deliveries at that mine.
NACoal entered into a
number of new coal mining
contracts in 2009. These
projects are in development phases
and will not be fully operational
for several years. NACoal’s new
subsidiary, Camino Real Fuels,
entered into a contract mining
services agreement to mine
approximately 2.7 million tons of
coal annually with initial
deliveries expected to commence in
2012. NACoal’s new subsidiary, the
Demery Resources Company, entered
into a contract mining services
agreement to
5
mine approximately 300,000 to
400,000 tons of coal annually, with
initial deliveries expected to
commence in 2010. Finally, NACoal’s
new subsidiary, Caddo Creek
Resources Company, entered into a
contract mining services agreement
to mine approximately 650,000 tons
of coal annually for a customer that
currently purchases its coal from
The Sabine Mining Company, with
initial deliveries expected to
commence in 2013. In addition to the
new coal mining agreements, NACoal
entered into a new limerock mining
services contract for deliveries of
approximately 1.0 million cubic
yards annually when the quarry is at
full capacity once the Florida
market improves. NACoal commenced
limerock mining at this quarry
during 2009.
[PICTURE:
At the Falkirk Mine in North Dakota, an electric shovel loads overburden into a fleet
of Caterpillar end dump trucks to expose the coal for extraction.]
Market Outlook for 2010
NACoal expects steady
performance at its coal mining
operations in 2010 provided that
customers achieve their planned
power plant operating levels. As
a result, tons delivered at its
coal mines in 2010 are expected
to be comparable to 2009.
Limerock deliveries are
expected to be significantly
higher in 2010 than in 2009. In
early 2010, the U.S. Army Corps
of Engineers began issuing new
mining permits for NACoal’s
limerock customers in the
Florida lake belt region where
an unfavorable legal ruling
terminated the
customers’previous mining
permits. Most of the company’s
limerock operations are expected
to be operating again by the end
of the first quarter of 2010.
However, production will ramp up
slowly and not all mining
permits will be issued at once.
In addition, production levels
are expected to continue at low
rates in 2010 because of the
continued depressed levels of
the South Florida housing and
construction markets. Delivery
levels are not expected to
return to 2008 levels until
those markets recover.
[PICTURE: Sunflowers ready for harvesting bask in the midday sun on reclaimed land at The Coteau
Properties Company’s Freedom Mine in North Dakota. One of Freedom Mine’s draglines works in the
background to remove overburden at the mine site.]
Actions Being Taken to Move Forward in 2010
NACoal prides itself
on its intense focus on safety,
the environment and its
continuous improvement programs.
These well-established programs
form a solid foundation for
operations to be relatively
stable at all of its coal mines
in 2010. Results may improve at
certain mines, providing no
significant unplanned outages
occur at any of its
customers’power plants. High
productivity levels are expected
to continue at all mining
operations, especially at the
Mississippi Lignite Mining
Company, where the company
expects to build up safety stock
inventory during 2010 and
achieve a steady operating level
beginning in 2011.
NACoal’s exemplary
reclamation practices reflect a
long-term commitment to
outstanding land reclamation
efforts. During 2009, the
Mississippi Lignite Mining
Company was one of three mines
awarded the 2009 Office of
Surface Mining Gold Good
Neighbor Award in recognition
of its outstanding commitment
to establishing good working
relations with surrounding
communities.
NACoal is working on three
important new project
opportunities for which it
expects to continue to incur
substantial expenses in 2010.
First, permitting is under way
in the Otter Creek Reserve in
North Dakota in expectation of
opening a new mine. A permit is
anticipated to be issued in
mid-2010. Second, construction
is complete on coal dryers and a
coal load-out facility adjacent
to the Falkirk Mine. This
project is expected to improve
market potential for the
Falkirk Mine by extending the
distances lignite coal can be
economically shipped, beginning
with shipments expected to start
in the second quarter of 2010 to
the Spiritwood Power Plant, now
under construction. Finally,
NACoal is working
6
on a project with Mississippi
Power to provide lignite coal to a
new plant expected to be built in
Mississippi.
Overall, NACoal expects
full-year income from continuing
operations to increase
moderately in 2010 over 2009
after excluding lease bonus
payments of $7.1 million pre-tax
received during 2009. However,
the company anticipates
receiving receive significant
royalties on the leased reserves
over time. Cash flow before
financing activities is expected
to be positive in 2010, but down
significantly from 2009, after
excluding the effect of the Red
River Mining Company sale and
the lease bonus payments, as a
result of changes in working
capital.
NACoal’s contract at the
San Miguel Lignite Mine expires
at the end of 2010. The company
intends to respond to San Miguel
Electric’s “Request for
Proposal” to operate the mine
beyond 2010.
Longer-Term Perspective
NACoal expects to
continue its record of
operational excellence in
safety, environmental
stewardship and production at
each of its mining operations
and, over time, to deliver
profitability that exceeds its
financial objectives.
NACoal’s vision is to
continue to be the leading
low-cost miner of coal used in
power generation, coal
gasification and coal-to-liquids
plants and to provide selected
value-added mining services for
companies in the aggregates
business. However, significant
growth for NACoal in the United
States will depend on the United
States adopting a balanced
energy policy in which coal
continues to play a key role.
The company believes that coal
must remain an integral part of
the energy mix if the United
States is going to continue to
be fully competitive in a global
economy.
NACoal will continue
taking a leadership role in
helping balance energy
needs with environmental
responsibility. The company is
actively associated with several
organizations involved in evaluating
and studying various clean-coal
technologies, some of which are
funded by the federal government.
Also, one of NACoal’s customers,
Basin Electric, is a pioneer in the
carbon capture process, which it
employs at its Dakota Gasification
facility to put CO2 into a pipeline
for export to Canada for enhanced
oil and gas recovery. Further, most
of NACoal’s potential coal-fired
power plant customers, such as
Mississippi Power, include carbon
capture in their new coal project
plans. The company continues to
believe that new power plant
technologies, such as integrated
gasification combined cycle power
generation, and production of
alternative fuels made from coal,
will provide important opportunities
in the future, and it will continue
to monitor the economic feasibility
of coal-to-liquid technologies.
Importantly, the company
is encouraged that more
value-added mining services
projects for coal and other
aggregates may become
available in the international
arena, as evidenced by the
company’s recent agreement for
mining services in India.
NACoal also continues to
pursue non-coal mining
opportunities outside the
United States.
Overall, NACoal sees
sound long-term prospects for
additional mining
opportunities and has several
promising business
opportunities currently
in various stages of
negotiation.
[PICTURE:
Hyster’s new electric-rider lift truck series, the Hyster® J45-70XN pneumatic
tire series, has lifting capacities of 4,500 to 7,000 pounds. These trucks have been designed for
overall productivity at lower costs.
The 5,000 pound lift truck model is shown below.]
NACCO
Materials Handling Group
2009 Results
Like most companies in
the industrial equipment sector,
NMHG faced extremely challenging
market and operating conditions
in 2009 as a result of
extraordinarily depressed global
lift truck markets. The lift
truck market saw an
unprecedented decline
7
in the beginning of 2009 before
reaching a bottom in mid-2009, where
it remained almost through year end.
As a result of these market
conditions, NMHG experienced a 52
percent drop in lift truck unit
shipments and a corresponding 48
percent decline in revenues in 2009
compared with 2008. The company
reported a significant net loss for
the year ended December 31, 2009.
However, as a result of aggressive
programs to reduce inventories and
receivables, NMHG generated
significant cash flow before
financing activities of $121.7
million in 2009.
NMHG acted early and
aggressively to counteract the
market decline. In late 2008,
NMHG implemented cost
containment measures that
included reduced salaries and
other employee-related benefits,
capital expenditure restraints,
and travel restrictions, all of
which remained in place
throughout 2009. In addition, in
late 2008 and throughout 2009,
the company implemented
reductions-in-force and plant
restructurings to properly size
the organization for the reduced
market levels. Over the year,
NMHG restructured its American
and European sales and marketing
work forces to enhance the
effectiveness of these
organizations while at the same
time reducing expenses. In
October
2009, the company announced
the shutdown of its Modena,
Italy, manufacturing plant and
the transfer of production to
its Masate, Italy, manufacturing
plant. These restructurings were
essentially complete by the end
of 2009.
NMHG was fortunate that
some key programs undertaken
well in advance of the downturn
were completed in the first
quarter of 2009. A manufacturing
restructuring program, which
included the transfer of the 2.0
to 3.5 ton internal combustion
engine pneumatic lift truck to
the Berea, Kentucky, plant, the
closure of the plant in Irvine,
Scotland, and a plant
consolidation in Greenville,
North Carolina, all produced
a smaller total plant footprint
with significant efficiencies
and enhanced throughput
capacity.
Unlike prior years,
currency exchange rates and
material costs had a significant
favorable effect on operating
results in 2009 as the dollar
strengthened against the British
pound and Australian dollar for
the greater part of the year and
as commodity costs declined
compared with 2008. These
benefits were compounded by the
favorable effects of price
increases implemented in prior
periods. In addition,
current-year results benefited
from the effect of LIFO
liquidations at lower prior-year
inventory costs compared with
current-year purchases.
During 2009, NMHG sold its
Australian fleet rental business
and the majority of its
Australian retail dealerships,
which has resulted in retail
becoming a very small portion of
overall NMHG results. The
company will continue to look to
divest its remaining retail
dealerships to strong
independent dealers in the
coming year.
NMHG’s market share of
factory bookings declined in
2009
in each area of the world,
largely due to NMHG’s commitment
to reducing dealer inventories
as quickly as possible to
market-appropriate levels and to
the disproportionate decline in
the internal combustion engine
counterbalanced truck market in
which NMHG has a more
significant share.
[PICTURE:
The new European Hyster® pneumatic tire, J3.5XN electric lift truck, with
all-weather cab, shown above, has a lifting capacity of up to 3.5
metric tons.]
[PICTURE:
The new Yale® GP170-190 Veracitor™ VX, with lifting capacities from 17,000 to 19,000
pounds, features a 3.3L high output turbo diesel engine and custom transmission for maximum
performance.]
Market Outlook for 2010
Global market levels
for units and parts volumes
appear to have stabilized in
the second half of 2009.
However, NMHG is not
anticipating a market upturn of
any significance in the first
half of 2010. The Chinese
market, in which NMHG is not a
significant player, is the only
market to have recovered to
pre-recession levels. The
Brazilian market also appears
to be turning up. Latin America
and the critical North American
market, as well as European
8
markets, continue at low but
stable levels. NMHG is cautiously
optimistic a moderate recovery will
begin in the second half of 2010 for
these regions. Recovery is also
anticipated to be stronger in
Eastern Europe, the Middle East and
Asia than in Western Europe, which
is expected to be flat in comparison
with 2009. The North American market
is expected to improve moderately.
Parts volumes showed only a
slight improvement in the second
half of 2009 over the first half
of 2009, and early 2010
indicators show a continued weak
recovery. Generally, the pace of
the upturn is difficult to
forecast. Overall, the company
expects moderate increases in
bookings, unit shipment levels
and parts sales in 2010 compared
with 2009, with gradual
increases each quarter.
[PICTURE:
The Yale®
MPE 060-080
rider-walkie pallet
truck, with capacities
up to 8,000 pounds, is
available in single,
double or triple
pallet configurations.
The MPE is designed to meet the horizontal
transporting dock needs in warehouse environments.]
Actions Being Taken to Move Forward in 2010
Given these market
prospects, NMHG’s team is
overseeing a focused agenda
that balances near-term
challenges of revenue
generation in a severely
depressed market with the
longer-term objective of
ensuring that the company is
properly prepared to achieve its
financial targets as the recovery
strengthens.
In 2009, the company’s
actions were successful in
reducing NMHG’s overall cost
structure to appropriate levels
for prevailing market
conditions. The company plans
to continue to manage its
business very conservatively
until it is confident the
upturn will be enduring. Cost
containment
actions, such as conservative plant
schedules, plant vacation periods,
administrative cost control
measures, reduced salaries and
capital expenditure constraints,
will continue in 2010 and will be
adjusted only as conditions
improve.
Overall, NMHG’s product
development, supply chain,
manufacturing processes and
quality and reliability programs
are
quite mature and are in a
phase of continuous improvement.
The company expects significant
benefits from these areas as the
market returns. These programs,
in conjunction with strengthened
sales and marketing capabilities
and a focus on enhanced
distribution effectiveness, set
the stage for gaining additional
market share in the next cycle.
In 2009, NMHG announced that it
would permit its dealers
9
to represent both the Hyster®
and Yale® brands under
controlled conditions. This new
policy is expected to enhance sales
effectiveness through specialization
around end customer application
needs. Another priority will be to
continue to strengthen NMHG’s
competitive pricing strategy based
on more regularly updated product
costs and value-selling around base
products and bundled features.
The company believes it
currently has a broad grouping
of the right products available
at appropriate cost and price
structures as a result of
programs implemented in earlier
years. The introduction of a
number of additional products
in 2010 will largely complete
this major effort. Also,
despite some recent 2010
commodity cost increases,
material costs are expected to
remain flat over the course of
the year. However, the lift
truck market is currently very
price-competitive, with
significant pricing pressures
in all markets due mainly to
the excess capacity that
results from current low market
levels.
Overall, NMHG expects a net
loss in the first half of 2010,
with a difficult first quarter.
However, the net loss is
expected to be much smaller than
the loss realized in the first
half of 2009. Modest market
improvements from improved parts
and unit volumes anticipated in
the second half of 2010 are
expected to
lead to about break-even
results for the full year, based
on the company’s current
forecast of market conditions.
Cash flow before financing
activities for 2010 is expected
to be positive, but
significantly lower than 2009
because the working capital
reductions achieved in 2009 will
not be repeated in 2010.
Longer-Term Perspective
NMHG’s vision
continues to be to ensure
its place as a leading
globally integrated
designer, manufacturer and
marketer of a complete range
of high-quality, application-tailored
lift trucks, offering the lowest
cost of ownership, outstanding
parts and service support and the
best overall value.
As a result of mature
improvement programs, NMHG is
well-positioned to maintain its
global competitiveness. The
company’s focus on its product
pipeline is also expected to
help enhance the company’s
competitiveness and market
share. A continuous stream of
new product innovations and
product introductions is on
track. The new electric-rider
lift truck program is bringing
a full line of newly designed
products to market. The company
is expected to introduce the
remainder of its new electric
lift truck line in 2010 and
early 2011. The company
introduced the 2 to 3 ton
four-wheel electric trucks in
Europe in early 2010 and
expects to introduce five
additional series over the
remainder of the year. In
addition, NMHG plans to
introduce a 25 to 32 ton big
truck and several warehouse
trucks. Finally, NMHG is
developing a new base-model
internal combustion engine lift
truck aimed at the medium-duty
segment of the market. The
first lift trucks in this
series are expected to be
introduced in mid-2010,
with a complete rollout by
2012.
Overall, NMHG believes its
products, supply chain,
manufacturing, quality, pricing,
distribution and sales and
marketing programs will position
the company well in the global
lift truck market. As the market
turns up, these programs are
expected to move the company’s
financial performance to target
levels and to an enhanced market
share position.
[PICTURE:
The new Yale® ERP-045-070VL electric-rider lift truck, with lifting capacities of up
to 7,000 pounds, shown above, provides a zero-emissions alternative for indoor and outdoor
applications. The innovative component design and the “Drop Battery Box” allows for pneumatic tires
on an electric truck.]
[PICTURE:
The new Hyster® H550-700HD series of big trucks with lifting capacities up to
70,000 pounds, shown below, features a redesigned hydraulic system for optimal reliability and
lower operating costs.]
Hamilton
Beach Brands
2009 Results
| Despite the global recession and its negative effects on retail markets, which unfavorably affected sales volumes in 2009, HBB operated exceptionally well during |
10
2009, generating a
substantial increase in operating
profit and net income compared
with 2008. Sales volume was
constrained by job losses and an
uncertain economy, and, in the
second half of 2009, by lost
placements and promotions at
certain key retailers.
Nonetheless, improved margins from
sales of innovative, higher-priced
products, reduced product and
supply
chain costs and lower advertising
expenses more than offset the impact
of the decline in revenues.
Additionally, as a result of strong
profitability and effective working
capital management, HBB generated
cash flow before financing
activities of $33.4 million in 2009.
[PICTURE:
Hamilton
Beach®
Commercial
Tempest®
high-performance blender.]
[PICTURE:
Clockwise from top: Hamilton Beach Brands’ newest products include: Hamilton
Beach® 6-quart programmable Set & Forget® slow cooker with spoon rest and
clip-tight gasket lid, Hamilton Beach® BrewStation® Summit Ultra 12-cup
coffeemaker, Hamilton Beach® 6-Speed classic hand mixer, Traditions® by
Proctor Silex iron and Hamilton
Beach®
Premiere cookware electric skillet.]
[PICTURE:
True
Air®
Allergen Reducer.]
Market Outlook for 2010
The small kitchen
appliances market appears to be
recovering. Although consumer
confidence and other key
indicators have improved in
early 2010 compared with 2009,
the pace and sustainability of
the upturn in consumer markets
are uncertain. Although the
market is expected to be
stronger in 2010, it is still
not yet back to
the retail sales levels of 2006 and
2007 as consumers continue to
struggle with financial concerns and
high unemployment rates.
Importantly, the company is well
positioned at mass merchants who
tend to serve price-conscious
consumers and who performed better
in 2009 than higher-end retailers.
HBB is not significantly dependent
on the higher-end segments, which
are
expected to continue to experience
weakness in 2010. Accordingly, HBB
anticipates revenues in 2010 to be
comparable to or slightly lower
than 2009.
Actions Being Taken to Move Forward in 2010
HBB entered the
recession operationally strong
and emerged even stronger. The
company is entering 2010 with
expectations for above-average
growth in the international and
commercial markets. However,
U.S. consumer markets will be
more challenging in 2010. While
HBB’s position with mass
merchants was stable
and helped to mitigate the
effects of the global recession
in 2009, in 2010 the company
will continue to invest
11
in innovative products and
value-added services for its key
customers to ensure HBB products
maintain their current strong
market position in those accounts.
In 2010, HBB also plans to
strengthen its focus on the
higher-end U.S. consumer market.
The company expects to launch a
line of Melitta-branded beverage
appliances under its new licensing
agreement in the third quarter of
2010.
HBB will continue to
monitor commodity costs closely
and will adjust product prices
and placements as appropriate.
The company will continue to
have an intense focus on
improving market share while
maintaining or improving
product margins.
Certain employee-related
benefit programs that were
suspended at the beginning of
2009 were partially phased back
in during the fourth quarter
and have been fully restored in
2010. Nevertheless, HBB will
continue to manage its
operating expenses
aggressively.
Overall, full-year 2010
net income and cash flow before
financing activities are
currently expected to be lower
than 2009 on roughly comparable
revenues, as expenses are
expected to be higher in 2010
compared with the unusually low
levels achieved in 2009.
Longer-Term Perspective
Product quality,
customer service and fact-based
professional sales and marketing
remain areas of excellence for
HBB. Important promotional
campaigns designed to support
HBB’s brands and new products
are expected to continue. The
company’s product and placement
track record continues to be
impressive due to innovation
processes centered on
understanding and meeting
end-user needs. New products
introduced in 2009, as well as
further new product
introductions in the pipeline
for 2010 and future years, are
expected to improve revenues.
At the end of 2009, HBB’s
Chief Executive Officer, Dr.
Michael J. Morecroft, retired
and was succeeded by Gregory H.
Trepp, previously the Vice
President of Marketing and a
long-time member of the
executive management team. The
transition was extremely smooth,
with the company continuing to
be led by a strong and
experienced management team.
This team is focused on ensuring
HBB continues to be a leading
designer, marketer and
distributor of small electric
household and commercial
products sold worldwide under
strong brand names and achieving
profitable growth from
innovative solutions that
improve everyday living. The
company will continue to work to
increase revenues and
profitability by gaining
placements, improving
efficiencies, reducing costs,
and pursuing strategic growth
opportunities, including growth
through royalty and branding
agreements, growth throughout
Latin America and growth in
commercial products. The company
is well-positioned to continue
its leadership position in the
small kitchen appliances
industry and to operate close to
its long-term financial
objectives in the years ahead.
[PICTURE:
Proctor Silex® 8-Speed Blender, Hamilton Beach® Ensemble™
2-slice bagel toaster (shown in red) and Hamilton
Beach®
stainless steel kettle.]
Kitchen
Collection
2009 Results
Despite much economic
uncertainty, a weak consumer
market and an environment in
which discretionary spending on
entertaining contracted,
Kitchen Collection achieved a
major
turnaround in 2009,
delivering increased revenues,
income and cash flow before
financing activities compared
with 2008 and significantly
outperforming expectations held
at the beginning of 2009.
Favorable results in both store
formats, as well as benefits
from lower product and freight
costs, the full-year benefit of
an efficiently run distribution
center owned and operated by
Kitchen Collection rather than
by a third party, and
administrative cost control
measures
12
implemented in early 2009 all
contributed to Kitchen
Collection’s turnaround. The
company generated positive cash
flow before financing activities
of $4.3 million in 2009.
The Kitchen
Collection® stores,
which sell more basic kitchen
items, had very strong results
in 2009 as consumers sought
value brands and items for
basic needs. While the average
sales transaction value was
lower, the Kitchen
Collection® stores
experienced more sales transactions
due to an increase in customer
visits. The Kitchen Collection®
stores also benefited from new
and seasonal stores and improved
merchandising and promotional
activities in the second half of
the year that resulted in improved
margins. The Le Gourmet Chef®
stores, which sell higher-end
goods focusing on entertaining
themes, struggled in the early part
of 2009 but ended the year much
stronger
with an increase in transactions
and a higher average sales
transaction value. A new,
revitalized store format and
website for the Le Gourmet
Chef® stores, focused
more on food, tabletop and
on-trend merchandise, was fully
implemented as the fourth
quarter holiday season opened,
helping drive customer visits,
sales volumes and improved
margins.
[PICTURE:
Le Gourmet Chef® stores display goods in theme-oriented sections featuring
Spices, Barbeque, Cookware, Snacks, Tex-Mex, Baking, Breakfast and Seafood.
Featured is the storefront
for the Paramus, New Jersey, store.]
Market Outlook for 2010
Despite uncertain
consumer spending, which
remains constrained by
financial concerns and high
unemployment rates, the
outlet mall market appears to be
improving. Against this backdrop,
Kitchen Collection expects a modest
increase in revenue in 2010 compared
with 2009, despite the planned
closing of a number of
under-performing stores. Favorable
sales and margin trends that
occurred in the reformatted Le
Gourmet Chef® stores in the
second half of 2009 are expected to
continue into 2010.
Actions Being Taken to Move Forward in 2010
In 2009, changes in
upper management at Kitchen
Collection strengthened a
seasoned team with significant
consumer
13
and retail merchandising
experience. This new team
redirected the focus of the
company toward enhancement of the
separate identities of its two
store formats. On January 1, 2010,
Robert LeBrun, previously Senior
Vice President General Merchandise
Manager, became President of The
Kitchen Collection, Inc.
In 2009, the company
invested significantly in
improving the Le Gourmet
Chef® store format and
moving toward profitability by
focusing on an enhanced product
assortment in reformatted
stores.
These steps increasingly
took effect in the second half
of 2009 and are expected to
continue to improve results in
2010. Kitchen Collection will
continue to refine the
merchandise mix in the Le
Gourmet Chef® stores in
2010. The company expects to
continue to test and implement
programs to improve Kitchen
Collection’s sales and profits
as well.
Rent levels at certain
stores will be another area of
concentration in 2010. The
company intends to close stores
when rent levels result in
stores becoming unprofitable in
the long term. Kitchen
Collection intends to capitalize
on the weak commercial real
estate market to negotiate
acceptable leases in
underperforming stores. Also, as
a result of favorable short-term
leasing rates, Kitchen
Collection was able to keep nine
2008 seasonal stores open in
2009 and 2010, and an additional
five seasonal stores, which
opened in late 2009, open in
2010. The company also opened 11
new traditional stores in 2009.
While growth in the number of
Kitchen Collection® and
Le Gourmet Chef® stores
continues to be a long-term
goal, the expected closure of
underperforming stores in 2010
will result in a near-term
reduction in the number of Le
Gourmet Chef® stores.
Certain employee-related
benefit programs that were
suspended or reduced at
the beginning of 2009 were partially
phased back in during the fourth
quarter of 2009, and have been fully
restored in 2010. Kitchen Collection
will, however, continue to manage
its operating expenses carefully.
Overall, Kitchen Collection
anticipates a moderate increase
in full-year net income for 2010
compared with 2009. Cash flow
before financing activities is
expected to be comparable
with 2009.
[PICTURE:
The Le Gourmet Chef® store in Paramus, New Jersey, shown above, features
higher-margin, brand-name kitchenware and gourmet foods.]
[PICTURE: The Kitchen Collection® store in Edinburgh, Indiana, shown below, features
higher-margin, brand-name kitchen gadgets, small electric appliances and a variety of other
kitchen- and housewares-related products.]
Longer-Term Perspective
Kitchen Collection’s
vision is to be the leading
specialty retailer of kitchen,
home entertaining and gourmet
food products in outlet malls
and other retail channels for
consumers seeking a large
selection of unique,
high-quality products at an
exceptional value. The company
has two strong store formats
and plans to leverage this
strength with strong, separate
brand identities for each.
Overall, the company has
moved from recovery into a
growth phase. The Kitchen
Collection® store
format is strong and Le Gourmet
Chef® continues to
improve. Going forward,
management plans to focus on
revenue growth through further
enhancement of its merchandise
mix, store displays and
appearance. The company will
also strive to expand the number
of outlet malls in which Kitchen
Collection® and Le
Gourmet Chef® have
stores and to ensure store
footprint sizes are appropriate
to enhance its ability to
achieve target profit levels.
Kitchen Collection also
continues to work on developing
a profitable traditional mall
strategy for the Le Gourmet
Chef® stores, where
expansion potential is very
high. The Le Gourmet Chef®
website was updated in 2009
and the Kitchen Collection®
website is expected to be
updated in 2010. These websites
are expected to provide ongoing
revenue growth opportunities.
14
Conclusions and NACCO
Outlook
The economic
environment has improved
substantially from where it was
a year ago, but a number of
uncertainties still remain.
NACCO’s companies will manage
cautiously until evidence of a
solid economic recovery becomes
clear. As markets and volumes
turn up, NACCO’s businesses
expect to gain the benefits of
previously established programs.
NACCO’s businesses are
well-positioned to achieve their
minimum financial goals when
markets fully recover.
We believe that appropriate
plans are in place for a
challenging 2010 at NMHG and for
maintaining the three other
subsidiaries at sound levels in
2010. While NMHG is planning for
about break-even performance in
2010, it is poised to begin
achieving its financial goals as
its markets recover. We expect
continued strong performance
from NACoal and HBB, which are
operating well and either
achieving or close to their
targets. Improved results at
Kitchen Collection are expected
to continue.
NACCO plans to continue to
focus on maximizing cash flow
before financing activities in
2010 and later years. Capital
expenditures are expected to be
modest in the years ahead
unless new growth opportunities
develop. NACCO’s cash on hand
provides flexibility with
respect to capitalizing its
subsidiaries, although no
further significant capital
injections are anticipated at
this time.
NACCO continues to have
great confidence in the
management teams at each of the
Company’s subsidiaries. The
many experienced and capable
people who worked so closely
together in a most challenging
2009 were the key to the
Company’s achievement of
strong results at each company,
given the state of each
subsidiary’s markets.
Early in 2009, NACCO’s
stock price reached a remarkable
low. Although the price has
recovered significantly since
then, we hope that further price
increases will come as the
Company’s income improves as a
result of its strong improvement
programs and the return of
stronger market conditions.

In closing, we would
like to give special
acknowledgment to Dr. Michael
Morecroft, who retired in
December 2009 as President and
Chief Executive Officer of HBB.
Throughout Mike’s 22-year career
with the company, he was an
outstanding leader with a
particularly approachable
personal style. This was most
evident during the last eight
years when Mike led HBB. We are
pleased to continue to have the
benefit of Mike’s leadership on
the HBB Board as Vice Chairman.
We all thank Mike for his
commitment to HBB and wish him
the very best in his retirement.
We would also like to take
this opportunity to express
sincere thanks to Dr. Ian Ross,
who is choosing to retire from
NACCO’s Board this May after
serving for 15 years. Ian
brought unique and extremely
valuable perspectives and
insight to the NACCO Board. His
contributions will be missed.
Finally, we would like to
take this opportunity to thank
all of our subsidiaries’
customers, retailers, dealers
and suppliers and all NACCO
stockholders for their continued
support, and to thank all NACCO
and subsidiary employees most
sincerely for their hard work,
sacrifices and commitment in
meeting the challenges of 2009.
We hope for a sustained global
economic recovery and look
forward to a successful 2010.

Alfred M. Rankin, Jr.
Chairman, President and
Chief Executive Officer
NACCO Industries, Inc.

Robert L. Benson
President and Chief Executive Officer
The North American Coal Corporation

Michael P. Brogan
President and Chief Executive Officer
NACCO Materials Handling Group, Inc.

Gregory H. Trepp
President and Chief Executive Officer
Hamilton Beach Brands, Inc.
Chief Executive Officer
The Kitchen Collection, Inc.

Robert A. LeBrun, Jr.
President
The Kitchen Collection, Inc.
15
Supplemental Data
NACCO Industries, Inc. and Subsidiaries
Reconciliation
of 2008 Net Income (Loss) attributable to stockholders “As
Reported” to
2008 Adjusted Net Income (Loss) attributable to stockholders Excluding “Special Items”
(in millions, except per share data)
2008 Adjusted Net Income (Loss) attributable to stockholders Excluding “Special Items”
(in millions, except per share data)
| Year Ended 2008 | ||||||||||||
| Diluted | ||||||||||||
| Pre-tax | After-tax | EPS | ||||||||||
2008 Consolidated Net Loss attributable to stockholders, as reported |
$ | (437.6 | ) | $ | (52.84 | ) | ||||||
Goodwill and other intangible assets impairment charges |
$ | 435.7 | 431.6 | 52.12 | ||||||||
Charges against accumulated deferred tax assets |
29.8 | 3.59 | ||||||||||
Net effect of special items |
$ | 435.7 | $ | 461.4 | ||||||||
2008 Consolidated Adjusted Net Income attributable to stockholders |
$ | 23.8 | $ | 2.87 | ||||||||
| Year Ended 2008 | ||||||||
| Pre-tax | After-tax | |||||||
2008 NMHG Net Loss attributable to stockholders, as reported |
$ | (376.0 | ) | |||||
Goodwill and other intangible assets impairment charge |
$ | 351.1 | 347.3 | |||||
Charge against accumulated deferred tax assets |
29.8 | |||||||
Net effect of special items |
$ | 351.1 | $ | 377.1 | ||||
2008 NMHG Adjusted Net Income attributable to stockholders |
$ | 1.1 | ||||||
| Year Ended 2008 | ||||||||
| Pre-tax | After-tax | |||||||
2008 Hamilton Beach Net Loss attributable to stockholders, as reported |
$ | (73.3 | ) | |||||
Goodwill impairment charge |
$ | 80.7 | 80.7 | |||||
2008 Hamilton Beach Adjusted Net Income attributable to stockholders |
$ | 7.4 | ||||||
| Year Ended 2008 | ||||||||
| Pre-tax | After-tax | |||||||
2008 Kitchen Collection Net Loss attributable to stockholders,
as reported |
$ | (10.0 | ) | |||||
Goodwill and other intangible assets impairment charge |
$ | 3.9 | 3.6 | |||||
2008 Kitchen Collection Adjusted Net Loss attributable to stockholders |
$ | (6.4 | ) | |||||
Adjusted Net Income/Loss attributable to stockholders is a measure of income that differs
from Net Income/Loss attributable to stockholders measured in accordance with U.S. generally
accepted accounting principles (“GAAP”). Adjusted Net Income/Loss attributable to stockholders is
Net Income/Loss attributable to stockholders adjusted for the exclusion of goodwill and intangible
asset impairment charges at NMHG, Hamilton Beach and Kitchen Collection and charges against the
accumulated deferred tax assets of NMHG in 2008. Management believes that both Net Income/Loss
attributable to stockholders and Adjusted Net Income/Loss attributable to stockholders assist the
investor and the subsidiaries’ lenders in understanding the results of operations of NACCO
Industries, Inc. and its subsidiaries. In addition, management evaluates results using Net
Income/Loss attributable to stockholders and Adjusted Net Income/Loss attributable to
stockholders.
16
Officers
and Directors
Officers and Directors of NACCO Industries, Inc.
Officers:
Alfred M. Rankin, Jr.
Chairman, President
and Chief Executive
Officer
Charles A. Bittenbender
Vice President,
General Counsel and
Secretary
J.C. Butler, Jr.
Vice President-Corporate
Development and Treasurer
Lauren E. Miller
Vice President-Consulting Services
Kenneth C. Schilling
Vice President and Controller
Mary D. Maloney
Assistant General
Counsel and
Assistant Secretary
Suzanne S. Taylor
Associate General
Counsel and
Assistant Secretary
Directors:
Owsley Brown II
Retired Chairman,
Brown-Forman Corporation
Dennis W. LaBarre
Partner, Jones Day
Richard de J. Osborne
Retired Chairman and Chief
Executive Officer, ASARCO
Incorporated
Alfred M. Rankin, Jr.
Chairman, President and Chief
Executive Officer, NACCO Industries, Inc.
Ian M. Ross
President Emeritus,
AT&T Bell
Laboratories
Michael E. Shannon
President, MEShannon &
Associates, Inc. Retired
Chairman, Chief Financial
and Administrative Officer,
Ecolab, Inc.
Britton T. Taplin
Self employed (personal investments)
David F. Taplin
Self employed (tree farming)
John F. Turben
Chairman,
Kirtland Capital Partners
Eugene Wong
Professor Emeritus
University of California at Berkeley
Officers of Subsidiaries
Officers of NACCO Materials Handling Group, Inc.
Corporate:
Alfred M. Rankin, Jr.
Chairman
Michael P. Brogan
President and Chief Executive Officer
Colin Wilson
Vice President and Chief
Operating Officer and
President, Americas
Lauren E. Miller
Senior Vice President,
Marketing and
Consulting
Kenneth C. Schilling
Vice President and
Chief Financial Officer
Charles A. Bittenbender
Vice President,
General Counsel and
Secretary
James M. Phillips
Vice President, Human Resources
Rajiv K. Prasad
Vice President,
Global Product
Development
Victoria L. Rickey
Vice President, Asia-Pacific
Michael E. Rosberg
Vice President, Global Supply Chain
Michael K. Smith
Vice President,
Finance and
Information Systems
Gopi Somayajula
Vice President,
Counterbalanced
Engineering
Daniel P. Gerrone
Controller
Jeffrey C. Mattern
Treasurer
Americas:
Donald L. Chance, Jr.
Vice President, President,
NMHG Sales
Raymond C. Ulmer
Vice President, Finance Americas
Vice President, President,
NMHG Sales
Raymond C. Ulmer
Vice President, Finance Americas
Europe, Africa and Middle East:
Ralf A. Mock
Managing Director,
Europe, Africa and
Middle East
Managing Director,
Europe, Africa and
Middle East
Asia-Pacific:
Nobuo Kimura
President, Sumitomo NACCO
Materials Handling Co.,
Ltd.
President, Sumitomo NACCO
Materials Handling Co.,
Ltd.
Officers of Hamilton Beach Brands, Inc.
Alfred M. Rankin, Jr.
Chairman
Dr. Michael J. Morecroft
Vice Chairman
Gregory H. Trepp
President and Chief Executive Officer
Gregory E. Salyers
Senior Vice President, Global Operations
R. Scott Tidey
Senior Vice President, North
America Sales and Marketing
Keith B. Burns
Vice President,
Engineering and
Information Technology
Kathleen L. Diller
Vice President, General
Counsel and Secretary
James H. Taylor
Vice President, Chief
Financial Officer and
Treasurer
Officers of The Kitchen Collection, Inc.
Alfred M. Rankin, Jr.
Chairman
Dr. Michael J. Morecroft
Vice Chairman
Gregory H. Trepp
Chief Executive Officer
Robert A. LeBrun, Jr.
President
Emil S. Wepprich
Vice President-Supply Chain
Karen E. Cavender
Controller
L.J. Kennedy
Secretary and Treasurer
Chairman
Dr. Michael J. Morecroft
Vice Chairman
Gregory H. Trepp
Chief Executive Officer
Robert A. LeBrun, Jr.
President
Emil S. Wepprich
Vice President-Supply Chain
Karen E. Cavender
Controller
L.J. Kennedy
Secretary and Treasurer
Officers of The North American Coal Corporation
Alfred M. Rankin, Jr.
Chairman
Robert L. Benson
President and Chief Executive Officer
J.C. Butler, Jr.
Senior Vice
President-Project
Development and
Administration
Bob D. Carlton
Vice President and
Chief Financial Officer
Douglas L. Darby
Vice President-Southern Operations
Michael J. Gregory
Vice President-Engineering,
Human Resources and
International Operations
Thomas A. Koza
Vice President-Law and
Administration, and Secretary
John D. Neumann
Assistant General
Counsel and Assistant
Secretary
K. Donald Grischow
Treasurer
John R. Pokorny
Controller
17
Corporate
Information
Annual Meeting |
The Annual Meeting of Stockholders of NACCO Industries, Inc. will be held on May 12, 2010, at 9:00 a.m. at the corporate office located at: 5875 Landerbrook Drive, Suite 300, Cleveland, Ohio 44124 |
Form 10-K |
Additional copies of the Company’s Form 10-K filed with the Securities and Exchange Commission are available through NACCO’s website (www.nacco.com) or by request to: |
Investor Relations NACCO Industries, Inc. 5875 Landerbrook Drive, Suite 300 Cleveland, Ohio 44124 (440) 449-9669 |
Stock Transfer Agent and Registrar |
Computershare 7530 Lucerne Drive, Suite 305 Cleveland, Ohio 44130 1-800-622-6757 |
Legal Counsel |
Jones Day North Point 901 Lakeside Avenue Cleveland, Ohio 44114 |
Independent Auditors |
Ernst & Young LLP 1300 Huntington Building 925 Euclid Avenue Cleveland, Ohio 44115 |
Stock Exchange Listing |
The New York Stock Exchange Symbol: NC |
Investor Relations Contact |
Investor questions may be addressed to: Investor Relations NACCO Industries, Inc. 5875 Landerbrook Drive, Suite 300 Cleveland, Ohio 44124 (440) 449-9669 E-mail: ir@naccoind.com |
NACCO Industries Website |
Additional information on NACCO Industries may be found at the corporate website, www.nacco.com. The Company considers this website to be one of the primary sources of information for investors and other interested parties. |
Subsidiary Company Websites |
The websites of several subsidiary companies and their brands can be found at the following locations: |
NACCO Materials Handling Group: |
www.nmhg.com |
Hyster North America: |
www.hysteramericas.com |
Hyster Europe: |
www.hyster.co.uk |
Hyster Asia-Pacific: |
www.hyster.com.au |
Hyster China: |
www.hyster.com.cn |
Yale North America: |
www.yale.com |
Yale Europe: |
www.yale-forklifts.eu |
Yale Asia-Pacific: |
www.yale.com.au |
Hamilton
Beach Brands–U.S.: |
www.hamiltonbeach.com |
www.proctorsilex.com |
www.buytraditions.com |
www.commercial.hamiltonbeach.com |
Hamilton
Beach Brands–Mexico: |
www.hamiltonbeach.com.mx |
Kitchen Collection: |
www.kitchencollection.com |
www.legourmetchef.com |
North American Coal: |
www.nacoal.com |
Environmental Benefits
This Summary Annual Report and Supplemental Package is printed using post-consumer waste recycled paper and vegetable-based inks.
By using this environmental paper, NACCO Industries Inc. saved the following resources:
The FSC Trademark identifies wood fibers coming from forests which have been certified in accordance with the rules of the Forest Stewardship Counsel.
18
The following information related to the Company’s stock performance was not included in or
incorporated by reference into, and shall not be deemed to constitute a part of, the Company’s
Annual Report on Form 10-K filed with the SEC.
Stock Price Performance Presentation
The following graphs compare the Company’s total annual stock price performance on Class A Common
Stock against the total stock price performance of the Russell 2000 Index and, in the case of Graph
1, the Russell 2000 Producer Durables Index for the periods indicated. The graphs present the
year-end value of a $100 investment, at the base point, for each index assuming the reinvestment of
dividends.
In accordance with the regulations promulgated by the SEC, Graph 1 compares the stock price
performance based upon the difference between the stock price at the beginning of each fiscal year
and the stock price at the end of the fiscal year for the five-year period commencing January 1,
2005 (base point December 31, 2004) and ending December 31, 2009.
The Company believes that the measurement set forth in Graph 1, which is based upon the stock price
at a single point in time in each year, does not adequately reflect the Company’s stock price
performance over the period because of the numerous periodic fluctuations throughout the year in
both the price of the Company’s stock and the level of the Russell 2000 Index. The Company,
therefore, has provided Graph 2, which compares the returns for the Company and the Russell 2000
Index based upon the average of the daily closing stock price compared with the corresponding
information from Graph 1, which is based upon the change in the stock price for each fiscal year
for the same period as in Graph 1.
The Company believes that although sustained operating and financial performance will ultimately be
reflected in stock price, the five-year period portrayed in the foregoing graphs is too brief a
period over which to measure the results of significant strategic activities, and that corporate
financial and strategic performance will be reflected in stock price only when measured over the
long term. The Company, therefore, has included Graph 3, which compares the 10-year returns for
the Company and the Russell 2000 Index based on the average stock price for the year computed using
the same method as in Graph 2 for the 10-year period commencing January 1, 2000 (base point
December 31, 1999) and ending December 31, 2009.
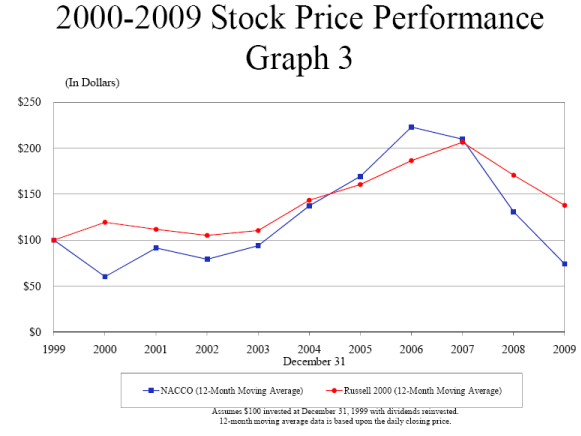

Environmental Benefits
This Summary Annual Report and Supplemental Package is printed using post-consumer waste recycled paper and vegetable-based inks.
By using this
environmental paper, NACCO Industries, Inc. saved the following
resources:
The FSC Trademark identifies wood fibers coming from forests which have been certified in accordance with the rules of the Forest Stewardship Counsel.