Attached files
| file | filename |
|---|---|
| EX-23.1 - American CareSource Holdings, Inc. | e606638_ex23-1.htm |
| EX-31.1 - American CareSource Holdings, Inc. | e606638_ex31-1.htm |
| EX-21.1 - American CareSource Holdings, Inc. | e606638_ex21-1.htm |
| EX-31.2 - American CareSource Holdings, Inc. | e606638_ex31-2.htm |
| EX-32.1 - American CareSource Holdings, Inc. | e606638_ex32-1.htm |
| EX-10.23 - American CareSource Holdings, Inc. | e606638_ex10-23.htm |
| EX-10.22 - American CareSource Holdings, Inc. | e606638_ex10-22.htm |
UNITED
STATES
SECURITIES
AND EXCHANGE COMMISSION
Washington,
D.C. 20549
FORM
10-K
(Mark
One)
|
x
|
ANNUAL
REPORT UNDER SECTION 13 OR 15(d)
OF
THE SECURITIES EXCHANGE ACT OF 1934
For
the Fiscal Year Ended December 31, 2009
|
|
|
o
|
TRANSITION
REPORT PURSUANT TO SECTION 13 OR 15(d)
OF
THE SECURITIES EXCHANGE ACT OF 1934
For
the transition period from ___ to ___
Commission
File Number: 001-33094
AMERICAN
CARESOURCE HOLDINGS, INC.
|
|
|
(Exact
Name of Registrant as Specified in Its Charter)
|
||
|
Delaware
|
20-0428568
|
|
|
(State
or other jurisdiction of incorporation or organization)
|
(I.R.S.
Employer Identification No.)
|
|
5429
Lyndon B. Johnson Freeway, Suite 850, Dallas, Texas
|
75240
|
|
|
(Address
of principal executive offices)
|
(Zip
Code)
|
|
|
(972)
308-6830
|
||
|
(Registrant’s
telephone number, including area code)
|
||
|
Securities
registered pursuant to Section 12(b) of the Exchange
Act:
|
||
|
Title
of Each Class
|
Name
of Each Exchange on Which Registered
|
|
|
Common
Stock, par value $.01 per share
|
The
NASDAQ Capital Market
|
|
|
Securities
registered pursuant to Section 12(g) of the Exchange Act:
None
|
|
|
Indicate
by checkmark if the Registrant is a well-known seasoned issuer, as defined
in Rule 405 of the Securities Act of 1933 (the “Securities
Act”).
|
Yes o No x
|
|
Indicate
by checkmark if the Registrant is not required to file reports pursuant to
Section 13 or 15(d) of the Securities Exchange Act of 1934 (the “Exchange
Act”).
|
Yes o No x
|
|
Indicate
by checkmark whether the Registrant (1) has filed all reports required to
be filed by Section 13 or 15(d) of the Exchange Act during the preceding
12 months (or for such shorter period that the Registrant was required to
file such reports) and (2) has been subject to such filing requirements
for the past 90 days.
|
Yes
x No
o
|
|
Indicate
by check mark whether the registrant has submitted electronically and
posted on its corporate Web site, if any, every Interactive Data File
required to be submitted and posted pursuant to Rule 405 of Regulation S-T
(§232.405 of this chapter) during the preceding 12 months (or for such
shorter period that the registrant was required to submit and post such
files).
|
Yes
o No o
|
|
Indicate
by checkmark if disclosure of delinquent filers pursuant to Item 405 of
Regulation S-K is not contained in this form, and will not be contained,
to the best of Registrant’s knowledge, in definitive proxy or information
statements incorporated by reference in Part III of this Form 10-K or any
amendment to this Form 10-K.
|
x
|
|
Indicate
by checkmark whether the Registrant is a large accelerated filer, an
accelerated filer, a non-accelerated filer, or a smaller reporting
company. See the definitions of “large accelerated filer,”
“accelerated filer” and “smaller reporting company” in Rule 12b-2 of the
Exchange Act. (Check one):
|
|
|
o Large
Accelerated Filer o Accelerated
Filer o Non-Accelerated
Filer x Smaller Reporting
Company
|
|
|
Indicate
by checkmark whether the Registrant is a shell company (as defined in Rule
12b-2 of the Exchange Act).
|
Yes o No x
|
|
The
aggregate market value of the voting and nonvoting Common Stock held by
non-affiliates of the Registrant was $30,230,109, computed by reference to
the price at which the Common Stock was last sold on The NASDAQ Capital
Market on the last business day of the Registrant’s most recently
completed second fiscal quarter (June 30, 2009).
|
|
|
The
number of shares of the Registrant’s Common Stock, par value $.01 per
share, outstanding as of March 22, 2010 was 16,375,604.
|
|
|
DOCUMENTS
INCORPORATED BY REFERENCE
|
|
|
Portions
of the definitive proxy statement for the annual meeting of stockholders
of American CareSource Holdings, Inc. to be held on June 9, 2010 and to be
filed with the Securities and Exchange Commission pursuant to Regulation
14A not later than April 30, 2010, are incorporated by reference into Part
III of this Form 10-K.
|
|
AMERICAN CARESOURCE HOLDINGS, INC.
FORM
10-K
TABLE
OF CONTENTS
|
PART
I
|
|
|
|
Item
1.
|
1
|
|
|
Item
1A.
|
8
|
|
|
Item
2.
|
12
|
|
|
Item
3.
|
12
|
|
|
Item
4.
|
12
|
|
|
|
||
|
PART
II
|
|
|
|
Item
5.
|
13
|
|
|
Item
7.
|
14
|
|
|
Item
8.
|
22
|
|
|
Item
9.
|
22
|
|
|
Item
9A
|
22
|
|
|
Item
9B
|
23
|
|
|
|
||
|
PART
III
|
|
|
|
Item
10.
|
24
|
|
|
Item
11.
|
24
|
|
|
Item
12.
|
24
|
|
|
Item
13.
|
25
|
|
|
Item
14.
|
25
|
|
|
PART
IV
|
|
|
|
Item
15.
|
25
|
|
|
Index
to Financial Statements
|
||
|
F-1
|
||
|
F-2
|
||
|
F-3
|
||
|
F-4
|
||
|
F-5
|
||
|
F-6
|
||
Special
Note Regarding Forward-Looking Statements
This
annual report on Form 10-K contains forward-looking statements within the
meaning of Section 27A of the Securities Act of 1933, as amended, and Section
21E of the Securities Exchange Act of 1934, as amended. These
statements can be identified by forward-looking words such as “may,” “will,”
“expect,” “intend”, “anticipate,” “believe,” “estimate” and “continue” or
similar words and discuss the Company’s plans and objectives for future
operations, including its services, contain projections of the Company’s future
operating results or financial condition, and discuss its expectations with
respect to the growth in health care costs in the United States, the demand for
ancillary benefits management services, and the Company’s competitive
advantages, or contain other “forward-looking” information.
Such
forward-looking statements are based on current information, assumptions and
belief of management, and are not guarantees of future
performance. Substantial risks and uncertainties could cause actual
results to differ materially from those indicated by such forward-looking
statements, including, but not limited to, changes in national health care
policy, regulation, and/or reimbursement, general economic conditions (including
the recent economic downturns and increases in unemployment), lower than
anticipated demand for ancillary services, pricing, market
acceptance/preference, the Company’s ability to integrate with its clients,
consolidation in the industry that may affect the Company’s key clients, changes
in the business decisions by significant clients, increased competition, the
Company’s inability to attract or maintain providers or clients or achieve its
financial results, the Company’s inability to manage growth, implementation and
performance difficulties, and other risk factors detailed from time to time in
the Company’s periodic filings with the Securities and Exchange Commission,
including in this annual report on Form 10-K for the year ended December 31,
2009.
Do not
place undue reliance on these forward-looking statements, which speak only as of
the date this document was prepared. All forward-looking statements
included herein are expressly qualified in their entirety by the cautionary
statements contained or referred to in this section. Except to the
extent required by applicable securities laws and regulations, the Company
undertakes no obligation to update or revise these forward-looking statements to
reflect events or circumstances after the date of this document or to reflect
the occurrence of unanticipated events.
PART I
Item
1. Business.
Overview
American
CareSource Holdings, Inc. (“ACS,” “Company,” the “Registrant,” “we,”
“us,” or “our,”) is an ancillary benefits management company that offers cost
effective access to a comprehensive national network of ancillary healthcare
service providers. The Company’s clients are national, regional and
local health plans, which include preferred provider organizations (“PPOs”),
third party administrators (“TPAs”), insurance companies, large self-funded
organizations and Taft-Hartley union plans (i.e., employee benefit plans that
are self-administered under collective bargaining agreements), that engage the
Company to provide them with a complete outsourced solution designed to manage
each payor’s obligations to its covered persons. The Company offers
payors this solution by:
|
·
|
lowering
the cost of our payors’ ancillary care costs throughout our network of
high quality, cost effective providers that we have under contract at more
favorable terms than they could generally obtain on their
own;
|
|
|
·
|
providing
payors with a comprehensive network of ancillary healthcare services
providers that is tailored to each payor’s specific needs and is available
to each payor’s covered persons for covered services;
|
|
|
·
|
providing
payors with claims management, reporting, and processing and payment
services;
|
|
·
|
performing
network/needs analysis to assess the benefits to payors of adding
additional/different service providers to the payor -specific provider
networks; and
|
|
·
|
credentialing
network service providers for inclusion in the payor -specific provider
networks.
|
Ancillary
healthcare services encompass a broad array of services that supplement or
support the care provided by hospitals and physicians and include the services
listed under “-- Services and
Capabilities--Ancillary care services” below.
Although
the Company has continued to experience revenue growth in 2008 and 2009, its
results have been impacted by the current economic crisis. First, the
unemployment rate has caused fewer people to participate in insurance programs
with our clients. Second, plan participants, seeking to spend less
money, appear to be making less frequent use of some ancillary
services. Third, the possibility exists that payor and, or provider
consolidation within our industry could adversely affect our
business. To the extent that these trends continue, or become worse,
we may earn less revenue and our profitability and growth could be adversely
affected, depending on the extent of the declines. Finally, as with
any business, the deterioration of the financial condition or sale or change of
control of our significant payor clients (with the two most significant
accounting for approximately 85% of our revenue during the year ended December
31, 2009) could have a corresponding adverse effect on us. Additional
risks that we do not consider material, or of which we are not currently aware,
may also have an adverse impact on us.
ACS was
incorporated under the laws of the State of Delaware on November 24, 2003 as a
wholly-owned subsidiary of Patient Infosystems, Inc. (“Patient Infosystems”) in
order to facilitate Patient Infosystems’ acquisition of substantially all of the
assets of American CareSource Corporation. American CareSource
Corporation had been in operation since 1997. The predecessor company
to American CareSource Corporation, Physician’s Referral Network, had been in
operation since 1995. On December 23, 2005, the Company became an
independent company when Patient Infosystems distributed by dividend to its
stockholders substantially all of its shares of the Company. Ancillary Care
Services, Inc. is a wholly owned subsidiary of the Company.
The
Company’s principal executive offices are located at 5429 Lyndon B. Johnson
Freeway, Suite 850, Dallas, TX 75240. Our Common Stock is listed on The NASDAQ
Capital Market under the symbol “ANCI.” Our telephone number is (972)
308-6830. Our Internet address is www.anci-care.com.
Services
and Capabilities
Ancillary
care services
Ancillary
healthcare services include a broad array of services that supplement or support
the care provided by hospitals and physicians, including the non-hospital,
non-physician services associated with surgery centers, free-standing diagnostic
imaging centers, home health and infusion, supply of durable medical equipment,
orthotics and prosthetics, laboratory and other services.
Ancillary
healthcare services include, but are not limited to, the following
categories:
|
·
Acupuncture
|
·
Long-term Acute Care
|
|
·
Cardiac Monitoring
|
·
Massage Therapy
|
|
·
Chiropractor
|
·
Occupational Therapy
|
|
·
Diagnostic Imaging
|
·
Pain Management
|
|
·
Dialysis
|
·
Physical Therapy
|
|
·
Durable Medical Equipment
|
·
Podiatry
|
|
·
Genetic Testing
|
·
Rehab: Outpatient
|
|
·
Hearing Aids
|
·
Rehab: Inpatient
|
|
·
Home Health
|
·
Sleep
|
|
·
Hospice
|
·
Skilled Nursing Facility
|
|
·
Implantable Devices
|
·
Surgery Center
|
|
·
Infusion
|
·
Transportation
|
|
·
Laboratory
|
·
Urgent Care
|
|
·
Lithotripsy
|
·
Vision
|
The
Company’s clients are health plans including PPOs, TPAs, insurance companies,
large self-funded organizations and Taft-Hartley union plans (i.e., employee
benefit plans that are self-administered under collective bargaining
agreements). The Company has agreements with approximately 4,300
ancillary healthcare service providers operating in approximately 33,000 sites
nationwide. The Company is able to offer payors cost savings by
functioning as a single point of contact for managing a comprehensive array of
ancillary healthcare services. The Company’s services include
analyzing the needs of payors and creating a custom network for them,
credentialing providers, processing provider claims submitted to the payors and
forwarded by the payors to ACS, submitting the processed claims to its client
payors for payment and performing client service functions for payors and
contracted providers, including monthly reporting
services. Contracting with the Company provides payors the capability
of marketing comprehensive, efficient and affordable ancillary healthcare
services to their participants.
Provider
Network
The
Company views its ability to manage, organize and maintain its provider network
and to recruit new providers as critical elements in its long term success
because its network is one of the most important reasons healthcare payors
engage the Company. The Company has contractual agreements with its
network of ancillary healthcare service providers for the purpose of meeting its
contractual obligations to its healthcare payors to make available a
comprehensive and customer-specific ancillary healthcare provider
network. The agreements define the scope of services to be provided
to covered persons by each ancillary healthcare provider and the amounts to be
charged for those services and are negotiated independent of the agreements
reached with the Company’s client payors. The terms of each agreement
between the Company and ancillary healthcare service providers make it clear
that the Company is solely obligated to the service provider under the contract
between them and do not contemplate any contractual relationship between the
service providers and the Company’s payor customers or permit the service
providers to pursue claims directly against the Company’s payors. The
network is comprised of approximately 4,300 ancillary healthcare service
providers that are located in 33,000 sites nationwide.
When
providers initially enter the ACS provider network, the Company credentials them
for inclusion into the Credentialed ACS network. The Company also
re-credentials its providers on a periodic basis. From time to time,
the Company reviews its provider relationships to determine whether any changes
to the relationship are appropriate through sanction monitoring and other
methods. The Company believes that credentialing providers represents
a valuable service to both its payors and the providers in the network, who
would, in the absence of such service, be forced to undergo the credentialing
process with respect to each payor with whom they enter into a service
relationship.
Our
Model
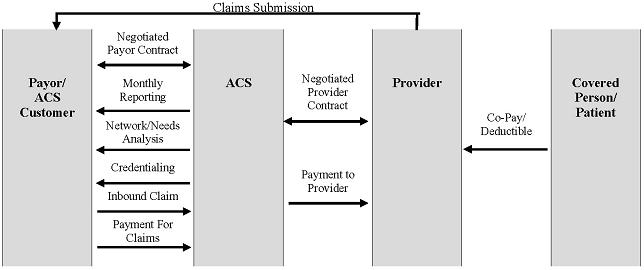
The
Company’s business model, illustrating the relationships among the persons
involved, directly or indirectly, in the Company’s business and its generation
of revenue and expenses is depicted below:

Payors
route healthcare claims to us after service has been performed by participant
providers in our network. We process those claims and charge the
payor according to its contractual rate for the services according to our
contract with the payor. In processing the claim, we are paid
directly by the payor or the insurer for the service. We then pay the
provider of service according to its independently-negotiated contractual
rate. We assume the risk of generating positive margin, the
difference between the payment we receive for the service and the amount we are
obligated to pay the provider of service.
The
Company may also receive a claims submission from a payor either electronically
or via a paper based claim. As part of its relationship with the
payors, the Company may pay an administrative fee to the payors for the
modifications that may be required to the payor’s technology, systems and
processes to create electronic connectivity with the Company, as well as for the
aggregation of claims and the electronic transmission of those claims to
us.
How
We Deliver Services
Ancillary network
analysis. The Company performs an analysis of the available
claims history from each client payor and develops a specific plan to meet each
payor’s needs. This analysis identifies service providers that are
not already in our network. We attempt to enter into agreements with
such service providers to maximize discount levels and capture a significant
volume of previously out-of-network claims.
Ancillary custom
network. ACS customizes its network to meet the needs of
each payor. In particular, when a new payor joins and periodically
for each existing payor, we review the payor’s “out-of-network” claims history
through our network analysis service and develop a strategy to create a network
that efficiently serves the payor’s needs. This may involve adding
additional service providers for a payor or removing service providers if we
determine it is beneficial for them to be excluded from the client’s
network.
Ancillary network
management. The Company manages ancillary service provider
contracts, reimbursement and credentialing for its payors. This not
only provides administrative benefits to our payors, but reduces the burden on
our contracted service providers who typically must supply credentialing
documentation to payors and engage in contract negotiations with separate
payors.
Ancillary systems
integration. The Company has created a proprietary software
system that enables us to manage many different customized accounts and includes
the following modules:
|
·
|
Provider
network management
|
|
·
|
Credentialing
|
|
·
|
Data
transfer management/electronic data
interface
|
|
·
|
Multi-level
reimbursement management
|
|
·
|
Posting,
Explanation of Benefits, check, and e-funds
processes
|
|
·
|
Client
service management
|
|
·
|
Claims
pricing
|
|
·
|
Advanced
data reporting
|
Ancillary
reporting. ACS offers a complete suite of reports to each
payor on a monthly basis. These reports cover contracting efforts and
capture rates, client savings, volumes by service category and complete claims
and utilization reports and other information of value to the
client.
Ancillary healthcare claims
management. The Company can manage ancillary healthcare claims
flow, both electronic and paper based, and integrate with a payor’s process
electronically or through paper claims. The Company has the
capability of performing a number of customized processes that may add
additional value for each payor. As part of the claims management
process, we manage the documentation requirements specific to each
payor. In the event claims are submitted to us by a payor without the
complete required documentation, we will work with the payor and/or service
provider to obtain the required documentation so that the claim will be accepted
by the payor. This service provides a labor cost savings to the
payors and providers.
Ancillary claims collections
management. The Company facilitates an expedited claims
collection process by ensuring receipt of the claim by the payor, providing
information to the payor required for processing the claim, tracking the status
of the claim throughout the process and maintaining a team of customer service
representatives to resolve any issues that might delay the collections
process. The Company believes that the providers in its network are
paid more effectively and efficiently than would otherwise be the
case.
Ancillary data
insights. The Company has developed and continues to develop
an extensive database of ancillary healthcare claims history. The
data provides insights into utilization and pricing across a wide variety of
service categories, geographies, and service providers. The Company
intends to market this data as a value added service to its payors in the design
of custom networks, and the development of ancillary healthcare management
programs.
Business
Strategy
The
Company’s focus is strictly on the ancillary healthcare services market, a
growing market that now accounts for almost 30% of total annual healthcare
spending in the United States and is estimated at $574 billion (as derived from
2006 data published by the Center for Medicare and Medicaid Services, National
Health Statistics Group, U.S. Department of Commerce and Bureau of Economic
Analysis and Census). Ancillary healthcare services are cost
effective alternatives to physician and hospital-based services and ancillary
providers offer services in 28 different categories, including those listed
under “-- Services and
Capabilities--Ancillary care services.” While most efforts are
placed on managing outcomes and reducing healthcare costs associated with
patient care in hospitals and in physician offices, the ancillary healthcare
service market is an often over-looked, but very important emerging segment of
the overall United States healthcare system. As more and more care is
delivered in highly cost effective out-patient and ancillary care settings, the
need for better organization and cost containment will only increase over the
next several years.
We
believe that companies who understand the nuances of the ancillary healthcare
market and develop the expertise to manage this new, de-centralized system of
patient care, are able to capitalize on this market opportunity. For
example, contracting with ancillary healthcare service providers is difficult
without a specific focus on the market. This is due to the disparate
nature of ancillary healthcare services and the fact that these services are
offered by a wide array of providers, ranging from small independent
practitioners, regional specialty practices, national providers and within
hospital systems. Since this market is so diverse, it has not been a
focus of the major health plans and payors. In addition, many health
plans are conflicted because their existing hospital contracts may encourage the
use of the hospital systems’ more expensive in-house ancillary
services. The Company believes that because it has developed a
substantial network of providers, it has established a sustainable advantage in
this market by becoming an aggregator of these services for health plans, and
because it has been retained by substantial payors, it can offer healthcare
providers a substantial number of patients who are entitled to receive services
from payors. In addition, our ancillary only contracting focus allows
us to be independent of any hospital relationships that may encourage retaining
all ancillary services within the more expensive hospital setting.
Because
the Company is solely focused on the nation-wide ancillary healthcare system
designed specifically to help regional and mid-market payors across the country,
expanding and maintaining a nation-wide, high-quality, multiple specialty
ancillary provider network is a critical component of the Company’s
strategy. The Company has invested to develop its ancillary service
provider network both proactively, across geographical and healthcare
specialties, and reactively to address specific client needs. While
we have a national footprint of service providers, our intention is to focus on
specific geographic markets where we can have a significant impact on a service
provider’s patient load. With market strength in specific geographic
areas, the Company has been able to develop favorable rates with ancillary
service providers and create an attractive product offering (healthcare cost
savings) to regionally-based clients.
In order
to enhance its ability to recruit and manage its network of providers, the
Company offers a suite of value added services specifically designed to help
ancillary care service providers lower their cost of doing business by assuming
the responsibility for the most complex and costly interactions with
payors. The services include those listed under “-- Services and
Capabilities--Ancillary care services.” The Company believes
that by becoming an indispensable business partner to the ancillary healthcare
service provider community, it will continue to grow its ancillary healthcare
service provider network and continue to derive favorable contracting terms from
these service providers.
The
Company markets its services to PPOs, TPAs, insurance companies, large
self-funded organizations and Taft-Hartley union plans (i.e., employee benefit
plans that are self-administered under collective bargaining
agreements). The Company believes that there is a large
market opportunity involved in providing a highly competitive ancillary care
solution to the standard service offered by the major national insurers in
select regional markets across the country. The combination of our
regionally specific networks of providers and the resulting contractual cost
savings we are able to generate helps ACS’ payor customers compete more
effectively against the major national insurers in their local
markets.
As of
early 2010, the Company’s contracts span approximately six million covered
lives. As a rapid aggregator of significant patient volume, the Company believes
that it will be able to continue to drive favorable contracting terms from the
selected service providers in the ACS Network by directing patient volume to
their practices and it will have the ability to negotiate exclusive contracts
that will allow the Company to manage the full spectrum of a payor client’s
ancillary healthcare benefit offerings. The volume of collective
lives that we manage allows us to obtain more favorable pricing than our clients
can generally obtain on their own.
Sales
and Marketing
The
Company markets its services to PPOs, TPAs, insurance companies, large
self-funded organizations and Taft-Hartley union plans (i.e., employee benefit
plans that are self-administered under collective bargaining
agreements). The Company utilizes both a new business sales
organization of three senior sales professionals as well as an account
management team of three professionals to contract with new payor organizations
and then maximize the revenue and margin potential of each new
payor. The new business sales team uses a variety of channels to
reach potential customers including professional relationships, direct marketing
efforts, attendance at industry-specific trade shows and conferences, and
through strategic partnerships with market partners, independent brokers, and
consultants. The account management team gets engaged with each new
payor to help manage the implementation process. In addition, an
Account Manager is generally assigned to each new payor organization and is
responsible for all aspects of the Company’s relationship with the entity
including the expanded utilization of the Company’s services over time and the
enhancement of the Company’s relationship with the payor.
In early
2009, the Company invested in a Sales Force Automation/Customer Relationship
Management (“SFA/CRM”) software program to help improve the reach and efficiency
of both the new business sales and the account management teams. The
SFA component is being used to help track, analyze, and optimize the new
business sales team’s direct sales efforts and provides a strategic account
management tool for the account management team. In addition, the CRM
component is utilized for targeted direct marketing campaigns to prospective and
current customers by both teams.
The
Company invests in on-going market research with its customers and maintains an
informal customer advisory group with a number of senior leaders in managed care
organizations. In the first quarter of 2009, the Company
engaged a strategic marketing services company to conduct a “Market Pulse” which
involved in-depth interviews with senior managers/decision-makers in current ACS
customer organizations. The purpose of the “Market Pulse” was to gain
customer feed-back on the Company’s optimal product messaging by market segment,
differentiated “go-to-market” strategies, and new product ideas. The
outcome from these sessions was used to formulate a solid base of sales,
marketing and new product priorities for the next several years.
Customers
The
Company’s healthcare payor clients engage the Company to manage a comprehensive
array of ancillary healthcare services that they and their payors have agreed to
make available to their insureds or beneficiaries or for which they have agreed
to provide insurance coverage. The typical services the healthcare
payor customers require the Company to provide include:
|
·
|
providing
a comprehensive network of ancillary healthcare services providers that is
available to the payor’s covered persons for covered
services;
|
|
·
|
providing
claims management, reporting, and processing and payment
services;
|
|
·
|
performing
network/needs analysis to assess the benefits to payor customers of adding
additional/different service providers to the payor-specific provider
networks; and
|
|
·
|
credentialing
network service providers for inclusion in the payor -specific provider
networks.
|
The terms
of the agreement between the Company and the payors do not contemplate that the
payors will have any relationship with the service providers and, in fact,
prohibit payors from claiming directly against the service
providers. The agreements between the Company and the payors provide
that it is the Company’s obligation to deliver or make available the agreed-upon
services. The Company is responsible irrespective of the existence or
terms of any agreement the Company has with the service
providers. The terms of the Company-payor agreement provide that the
Company is obligated to provide or arrange for the provision of all of the
services under the Company-payor agreement and the Company is responsible for
ensuring that the contractual terms are met and such services are provided
(whether the services are those performed directly by the Company, such as
claims management, processing and payment service, network/needs analysis and
credentialing, or those performed by a service provider contracted by the
Company).
The
Company’s most significant payors include (i) HealthSmart (“HealthSmart”), which
consists of HealthSmart and its affiliates, American Administrative Group
(“AAG”), Interplan Health Group (“IHG”), Emerald Healthcare, and HealthSmart
Accel Network (“Accel”), and (ii) Viant Holdings Inc. (“Viant”), consisting of
Texas True Choice, Inc. and Beech Street Corporation. For the year
ended December 31, 2009, ACS derived 47% of its total revenue from HealthSmart
(including its affiliates) and 38% of its total revenue from Viant (including
its affiliates). For the year ended December 31, 2008, ACS derived
59% of its total revenue from HealthSmart and 39% of its total revenue from
Viant.
On
December 31, 2008, the Company entered into an amendment to its provider service
agreement with HealthSmart. The purpose of this amendment was, among
other things, to facilitate and accelerate the integration into the Company’s
business model of IHG, with which HealthSmart became affiliated in September
2007, adjust the administrative fees outlined in the previous amendment, define
and clarify the exclusivity and levels of cooperation contemplated by the
previous amendments, and extend the partnership between the Company and
HealthSmart and the duration of their provider service agreement to December 31,
2012. Under a strategic contracting plan that the amendment requires
the parties to develop, the Company would be the exclusive outsourced ancillary
contracting and network management provider for HealthSmart’s group health
clients and any third party administrators (TPAs).
In
accordance with the amendment to the HealthSmart agreement, in April 2009 the
Company paid HealthSmart $1.0 million for costs incurred in connection with the
integration of and access to the Company’s network by members of the IHG
network, including, but not limited to, costs associated with salaries,
benefits, and third party contracts over the extended contract term through
2012. The Company will continue to pay a service fee to
HealthSmart designed to reimburse and compensate HealthSmart for the work that
it is required to perform to support the Company’s program. The
Amendment provides for adjustments to such fee upon certain events.
In
November 2009, HealthSmart completed a recapitalization with a private
investment company and HealthSmart’s other lenders. We are uncertain
of how this transaction will impact our contract with HealthSmart and the volume
of claims that is generated from our relationship with HealthSmart.
The
client contract with Viant expires on May 20, 2011 and automatically renews for
successive one-year periods unless either party delivers a written notice of
non-renewal at least 90 days prior to expiration. Such contract may
be terminated for convenience by Viant upon two years notice to us or upon
thirty (30) days’ notice in the event of a breach. In addition, in
March 2010, Viant was acquired by MultiPlan, Inc., a provider of PPO network and
related transaction-based solutions.
Competition
The
Company faces four types of direct competitors.
|
·
|
The
first group of competitors consists of larger, national health plans and
insurers such as Aetna, Blue Cross/Blue Shield plans, Cigna, Humana, and
United HealthCare. These larger carriers offer nation-wide,
standardized products and often compete on a local level based of the
cost-effectiveness of their national
contracts.
|
|
·
|
The
second group of competitors is more regionally-focused and consists of
smaller regional PPOs, payors and community-based provider-owned
networks. These regional competitors are generally managing
their own home-grown network of ancillary care providers and are more
likely to offer customized products and services tailored to the needs of
the local community. These regional groups will often use their
ownership and/or management of the full continuum of care in a local
market to direct patients to the provider groups within their
network.
|
|
·
|
The
third group of competitors focus on managing patients within a single
ancillary specialty (e.g. dialysis, imaging or infusion), and offer
comprehensive payor and provider services within their chosen ancillary
category.
|
|
·
|
The
fourth group of competitors is our own payors. Our payors have
selected us based on our extensive network of service providers and
cost-savings potential. However, they may choose to develop
their own network instead of outsourcing ancillary management services to
us in the future.
|
Research
and Development
The
company invests in its information technology infrastructure to enhance the
capabilities of its databases, data retrieval tools, data exchange capabilities
and claims processing engine. In addition, the Company believes that
its extensive claims database of ancillary healthcare services and costs is a
strategic asset. The Company’s capitalized development costs totaled
approximately $628,000 during 2009.
Government
Regulation
The
healthcare industry is extensively regulated by both the Federal and state
governments. A number of states have extensive licensing and other
regulatory requirements applicable to companies that provide healthcare
services. Additionally, services provided to health benefit plans in
certain cases are subject to the provisions of the Employee Retirement Income
Security Act of 1974, as amended (“ERISA”).
Furthermore,
state laws govern the confidentiality of patient information through statutes
and regulations that safeguard privacy rights. The Company is subject
to the Health Insurance Portability and Accountability Act of 1996 (“HIPAA”),
which provides national standards for electronic health information transactions
and the data elements used in such transactions. ACS and its clients
may be subject to Federal and state laws and regulations that govern financial
and other arrangements among healthcare providers. Furthermore, the
Company and its clients may be subject to federal and state laws and regulations
governing the submission of false healthcare claims to the government and
private payors, mail pharmacy laws and regulations, consumer protection laws and
regulations, legislation imposing benefit plan design restrictions, various
licensure laws, such as managed care and third party administrator licensure
laws, drug pricing legislation, and Medicare and Medicaid reimbursement
regulations. Possible sanctions for violations of these laws and
regulations include minimum civil penalties of between $5,000-$10,000 for each
false claim and treble damages.
Proposed
changes to the U.S. healthcare system, including potential national healthcare
reform, may increase governmental involvement in healthcare and ancillary
healthcare services, and otherwise change the way payors, networks and service
providers conduct their businesses. Healthcare organizations may react to these
proposals and the uncertainty surrounding them by reducing or delaying purchases
of cost control mechanisms and related services such as those provided by the
Company.
The
Company must continually adapt to new and changing regulations in the healthcare
industry. If we fail to comply with these applicable laws, we may be subject to
fines, civil penalties, or criminal prosecution. If an enforcement
action were to occur, our business and financial condition may be adversely
affected.
Employees
As of
March 22, 2010, the Company had 69 full-time employees and one part-time
employee.
Item
1A.
Risk Factors.
The
Company’s stockholders and any potential investor in the Company’s Common Stock
should carefully review and consider each of the following risk factors, as well
as all other information appearing in this Annual Report on Form 10-K, relating
to investment in our Common Stock. The Company’s business faces
numerous risks and uncertainties, the most significant of which are described
below. If any of the following risks actually occur, the business,
financial condition, results of operations or cash flows of the Company could be
materially adversely affected, the market price of the Company’s Common Stock
could decline significantly, and a stockholder could lose all or part of an
investment in the Company’s Common Stock.
Proposed
health care reforms could materially adversely affect our revenues, financial
position and our results of operations.
Both
houses of Congress have recently passed bills relating to health care reform,
which have not yet been reconciled with each other and signed into law. Examples
of health care reform proposals include policy changes that would change the
dynamics of the health care industry, including having the federal or one or
more state governments assume a larger role in the health care system such as
competing with private health insurers, imposing new and potentially significant
taxes on health insurers and health care benefits, guaranteed coverage
requirements, elimination of pre-existing condition exclusions or annual
lifetime maximum limits.
The
enactment of health care reforms at the federal or state level may affect
certain aspects of our business, including contracting with ancillary healthcare
service providers; administrative, technology or other costs; provider
reimbursement methods and payment rates; premium rates; coverage determinations;
mandated benefits; minimum medical expenditures; claim payments and processing;
drug utilization and patient safety efforts; collection, use, disclosure,
maintenance and disposal of individually identifiable health information;
personal health records; consumer-driven health plans and health savings
accounts and insurance market reforms; and government-sponsored
programs.
We cannot
predict if any of these proposals will ultimately become law, or, if enacted,
what their terms or the regulations promulgated pursuant to such laws will be.
Any health care reforms enacted may be phased in over a number of years but, if
enacted, could reduce our revenues, increase our costs, expose us to expanded
liability and require us to revise the ways in which we conduct business or put
us at risk for loss of business. In addition, our results of operations, our
financial position, including our ability to maintain the value of our goodwill,
and cash flows could be materially adversely affected by such
changes.
The
Company has a history of losses and has only achieved profitability in the past
two years.
Although
the Company achieved its second consecutive profitable year in 2009, it incurred
losses in each year between its spinoff in 2003 through 2007 and has an
accumulated deficit of approximately $1.5 million as of December 31,
2009. The Company will need to maintain similar levels of claims
volume and revenue as it had in 2009 in order to continue
profitability. No assurances can be given that the Company will be
able to continue to grow at the current pace or to continue to operate
profitably in the future. The Company’s prospects must be considered
in light of the numerous risks, expenses, delays and difficulties frequently
encountered in an industry characterized by intense competition, as well as the
risks inherent in the development of new programs and the commercialization of
new services, particularly given its operating history through
2007.
The
Company has a limited number of clients, a few of which account for a
substantial portion of its business, and failure to retain such clients could
have a material adverse effect on its business and results of
operations.
Our two
largest clients, HealthSmart Preferred Care, Inc. (“HealthSmart”) and Viant
Holdings, Inc. (“Viant”), accounted for an aggregate of approximately 85% of our
revenue during 2009; of which 47% was derived from
HealthSmart. In 2008, our two largest clients accounted for 98% of
our revenue, of which 59% was generated from HealthSmart. The loss of either one
of these clients or significant declines in the level of use of our services by
one or more of these clients (as would be the case, for example, if our clients
decide to contract directly with ancillary healthcare service providers),
without replacement by new business, would have a material adverse effect on the
Company’s business and results of operations.
The
client contract with Viant expires on May 20, 2011 and automatically renews for
successive one-year periods unless either party delivers a written notice of
non-renewal at least 90 days prior to expiration. Such contract may
be terminated for convenience by Viant upon two years notice to us or upon
thirty (30) days’ notice in the event of a breach. In addition, in
March 2010, Viant was acquired by MultiPlan, Inc., a provider of PPO network and
related transaction-based solutions. The client contract with
HealthSmart, which was set to expire on July 31, 2009, was amended on December
31, 2008. The term was extended four years and will expire on
December 31, 2012. There can be no assurance that any client will
maintain its contract with us after the expiration of the then-current term or
that it will renew its contract on terms favorable to
us. Consequently, the Company’s failure to retain such clients could
have a material adverse effect on our business and results of
operations. Additionally, an adverse change in the financial
condition of any of these clients, particularly HealthSmart or Viant, including
an adverse change as a result of a change in governmental or private
reimbursement programs, could have a material adverse effect on our
business.
The
current financial crisis may reduce our revenue and profitability and harm our
growth prospects.
Although
the Company has continued to experience revenue growth from 2008 to 2009, its
results have been impacted by the current economic crisis. First, the
unemployment rate has caused fewer people to participate in insurance programs
with our customers. Second, plan participants, seeking to spend less
money, appear to be making less frequent use of some ancillary
services. Third, the possibility exists that client and, or provider
consolidation within our industry could adversely affect our
business. To the extent that these trends continue, or become worse,
we may receive less revenue and our profitability and growth could be adversely
affected, depending on the extent of the declines. Finally, as with
any business, the deterioration of the financial condition or sale or change of
control of our significant customers could have a corresponding adverse effect
on us.
Large
competitors in the healthcare industry could choose to compete with us, reducing
our margins. Some of these potential competitors may be our current
clients.
Traditional
health insurance companies, specialty provider networks, and specialty
healthcare services companies are potential competitors of the
Company. These entities include well-established companies that may
have greater financial, marketing and technological resources than we have.
Pricing pressure caused by competition has caused many of these companies to
reduce the prices charged to clients for core services and to pass on to clients
a larger portion of the formulary fees and related revenues received from
service providers. Increased price competition from such companies’
entry into the market could reduce our margins and have a material adverse
effect on our financial condition and results of operations. In fact,
our clients could choose to establish their own network of ancillary care
providers. As a result, we would not only lose the benefit of revenue
from such clients, but we could face additional competition in our
market.
The
Company is dependent upon payments from third party payors who may reduce rates
of reimbursement.
The
Company’s profitability depends on payments provided by third-party
payors. Competition for patients, efforts by traditional third party
payors to contain or reduce healthcare costs and the increasing influence of
managed care payors, such as health maintenance organizations, have resulted in
reduced rates of reimbursement in recent years. If continuing, these
trends could adversely affect the Company’s results of operations unless it can
implement measures to offset the loss of revenues and decreased profitability.
In addition, changes in reimbursement policies of private and governmental
third-party payors, including policies relating to the Medicare and Medicaid
programs, could reduce the amounts reimbursed to the Company’s clients for the
Company’s services provided through the Company, and consequently, the amount
these clients would be willing to pay for the Company’s services.
The
Company is dependent upon its network of qualified providers and its provider
agreements may be terminated at any time.
The
development of a network of qualified providers is an essential component of our
business strategy. The typical form of agreement from ancillary
healthcare providers provides that these agreements may be terminated at any
time by either party with or without cause. If these agreements are
terminated, such ancillary healthcare providers could enter into new agreements
with our competitors which would have an adverse effect on our ability to
continue our business as it is currently conducted.
For
any given claim, the Company is subject to the risk of paying more to the
provider than it receives from the customer.
The
Company’s agreements with its payors, on the one hand, and the service
providers, on the other, are negotiated separately. The Company has
complete discretion in negotiating both the prices it charges its payors and the
financial terms of its agreements with the providers. As a result,
the Company’s profit is primarily a function of the spread between the prices it
has agreed to pay the service providers and the prices the Company’s payors have
agreed to pay the Company. The Company bears the pricing/margin risk
because it is responsible for providing the agreed-upon services to its payors,
whether or not it is able to negotiate fees and other agreement terms with
service providers that result in a positive margin for the
Company. For example, during 2009 and 2008, approximately 8% and 9%
of claims were “loss claims” (that is, where the amount paid by the Company to
the provider exceeded the amount received by the Company from the corresponding
payor for that particular claim) and these loss claims, in the aggregate,
comprised approximately $1.2 million and $998,000, respectively. There can be no
assurances that the loss claim percentage will not be higher in future
periods. If a higher percentage of the Company’s claims resulted in a
loss, its results of operations and financial position would be adversely
affected.
The
Company has significantly increased in size and may not be able to effectively
process the claims submitted by its providers in a timely manner.
Our size
and the volume of claims has increased dramatically in the last few
years. As a result, we have had to increase the size of our
processing capabilities and our staff. If we are unable to
effectively increase our processing speed and integrate new providers, we may be
unable to process properly all claims submitted and this could have a negative
impact on our relationships with clients, which in turn could lead to a loss of
business.
An
interruption of data processing capabilities and telecommunications could
negatively impact the Company’s operating results.
Our
business is dependent upon our ability to store, retrieve, process and manage
data and to maintain and upgrade our data processing capabilities. An
interruption of data processing capabilities for any extended length of time,
loss of stored data, programming errors, other computer problems or
interruptions of telephone service could have a material adverse effect on our
business.
Changes
in state and federal regulations could restrict our ability to conduct our
business.
Numerous
state and federal laws and regulations affect our business and operations. These
laws and regulations include, but are not necessarily limited to:
|
·
|
healthcare
fraud and abuse laws and regulations, which prohibit illegal referral and
other payments;
|
|
·
|
the
Employee Retirement Income Security Act of 1974 and related regulations,
which regulate many healthcare
plans;
|
|
·
|
mail
pharmacy laws and regulations;
|
|
·
|
privacy
and confidentiality laws and
regulations;
|
|
·
|
consumer
protection laws and regulations;
|
|
·
|
legislation
imposing benefit plan design
restrictions;
|
|
·
|
various
licensure laws, such as managed care and third party administrator
licensure laws;
|
|
·
|
drug
pricing legislation;
|
|
·
|
Medicare
and Medicaid reimbursement regulations;
and
|
|
·
|
Health
Insurance Portability and Accountability Act of
1996.
|
We
believe we are operating our business in substantial compliance with all
existing legal requirements material to the operation of our business. There
are, however, significant uncertainties regarding the application of many of
these legal requirements to our business, and there cannot be any assurance that
a regulatory agency charged with enforcement of any of these laws or regulations
will not interpret them differently or, if there is an enforcement action, that
our interpretation would prevail. In addition, there are numerous proposed
healthcare laws and regulations at the federal and state levels, many of which
could materially affect our ability to conduct our business or adversely affect
our results of operations.
If
the Company fails to comply with the requirements of HIPAA, it could face
sanctions and penalties.
HIPAA
provides safeguards to ensure the integrity and confidentiality of health
information. Violation of the standards is punishable by fines and, in the case
of wrongful disclosure of individually identifiable health information, fines or
imprisonment, or both. Although we intend to comply with all applicable laws and
regulations regarding medical information privacy, failure to do so could have
an adverse effect on our business.
Limited
barriers to entry into the ancillary healthcare services market could result in
greater competition.
There are
limited barriers to entering our market, meaning that it is relatively easy for
other companies to replicate our business model and provide the same or similar
services that we currently provide. Major benefit management companies and
healthcare companies not presently offering ancillary healthcare services may
decide to enter the market. These companies may have greater financial,
marketing and other resources than are available to us. Competition
from other companies may have a material adverse effect on our financial
condition and results of operations.
The
Company may be unsuccessful in hiring and retaining skilled
employees.
The
future growth of our business depends on our ability to hire and retain skilled
employees. The Company may be unable to hire and retain the skilled
employees needed to succeed in our business. Qualified employees are
in great demand throughout the healthcare industry. Our failure to attract and
retain sufficient skilled employees may limit the rate at which our business can
grow, which will result in harm to our financial performance. During
the last month, each of the Chief Financial Officer and the Senior Vice
President of Sales and Marketing of the Company has resigned. The
extensive nature of the changes could result in instability to the management of
the Company to the extent new personnel cannot be identified and integrated
adequately.
An
inability to adequately protect our intellectual property could harm the
Company’s competitive position.
We
consider our methodologies, processes and know-how to be proprietary. We seek to
protect our proprietary information through confidentiality agreements with our
employees, as well as our clients and contracted service
providers. The Company’s policy is to have its employees enter into a
confidentiality agreement at the time employment begins, with the
confidentiality agreement containing provisions prohibiting the employee from
disclosing our confidential information to anyone outside of the Company,
requiring the employee to acknowledge, and, if requested, assist in confirming
the Company’s ownership of new ideas, developments, discoveries or inventions
conceived by the employee during his or her employment with the Company, and
requiring the assignment by the employee to the Company of proprietary rights to
such matters that are related to our business. There can be no assurance that
the steps taken by the Company to protect its intellectual property will be
successful. If the Company does not adequately protect its intellectual
property, its competitors may be able to use its technologies and erode or
negate the Company’s competitive advantage in the market.
Fluctuations
in the number and types of claims processed by the Company could make it more
difficult to predict the Company’s revenues from quarter to
quarter.
Monthly
fluctuations in the number of claims we process and the types of claims we
process will impact the quarterly and annual results of the
Company. Our margins vary depending on the type of ancillary
healthcare service provided, the rates associated with those services and the
overall mix of these claims, each of which will impact our
profitability. Consequently, it may be difficult to predict our
revenue from one quarter to another quarter.
Future
sales of the Company’s Common Stock, or the perception that these sales may
occur, could depress the price of the Company’s Common Stock.
Sales of
substantial amounts of our Common Stock, or the perception in the public that
such sales may occur, could cause the market price of the Company’s Common Stock
to decline. This could also impair the Company’s ability to raise
additional capital through the sale of equity securities. As of March
22, 2010, the Company had 16,375,604 shares of its Common Stock
outstanding. The outstanding shares are either freely tradable
without restriction or further registration under the Securities Act, unless the
shares are held by one of our “affiliates” as such term is defined in Rule 144
of the Securities Act, or are “restricted shares” as that term is defined under
the Securities Act and may be sold from time to time pursuant to a registration
statement which was declared effective on February 8, 2007 by the Securities and
Exchange Commission (the “SEC”), or in reliance upon an exemption from
registration available under the Securities Act. At March 22, 2010,
warrants to purchase 955,710 shares of Common Stock of the Company were
outstanding, and options to purchase 2,188,620 shares of Common Stock of the
Company had been granted and were outstanding under the Company’s Amended and
Restated 2005 Stock Option Plan and the 2009 Equity Incentive
Plan. At March 22, 2010, restricted stock units (“RSUs”), which are
convertible into 90,999 shares of common stock were outstanding under our 2009
Equity Incentive Plan. In addition, 1,907,601 shares of the Common
Stock of the Company remain available for future grants of RSUs and options to
purchase shares of the Common Stock of the Company under the Company’s Amended
and Restated 2005 Stock Option Plan and the 2009 Equity Incentive
Plan. If all of the outstanding warrants are exercised, all options
available under the Company’s Amended and Restated 2005 Stock Option Plan are
issued and exercised and all RSUs are converted, there will be approximately
18,374,204 shares of Common Stock of the Company outstanding.
Some
of our existing stockholders can exert control over us and may not make
decisions that further the best interests of all stockholders.
As of
March 22, 2010, our officers, directors and principal stockholders (greater than
5% stockholders) together control beneficially approximately 50.0% of the
outstanding Common Stock of the Company. As a result, these
stockholders, if they act individually or together, may exert a significant
degree of influence over our management and affairs and over matters requiring
stockholder approval, including the election of directors and approval of
significant corporate transactions. Furthermore, the interests of
this concentration of ownership may not always coincide with our interests or
the interests of other stockholders and, accordingly, they could cause us to
enter into transactions or agreements which we would not otherwise
consider. In addition, this concentration of ownership of the
Company’s Common Stock may delay or prevent a merger or acquisition resulting in
a change in control of the Company and might affect the market price of our
Common Stock, even when such a change in control may be in the best interest of
all of our stockholders.
We
are subject to the listing requirements of the Nasdaq Capital Market and there
can be no assurances that we will continue to satisfy these listing
requirements.
Our
common stock is listed on The NASDAQ Capital Market, and we are therefore
subject to continued listing requirements, including requirements with respect
to the market value of publicly-held shares and minimum bid price per share,
among others, and requirements relating to board and audit committee
independence. If we fail to satisfy one or more of the
requirements, we may be delisted from The NASDAQ Capital Market. If
we are delisted from The NASDAQ Capital Market and we are not able to list our
common stock on another exchange, our common stock could be quoted on the OTC
Bulletin Board or on the “pink sheets”. As a result, we could face significant
adverse consequences including, among others, a limited availability of market
quotations for our securities and a decreased ability to issue additional
securities or obtain additional financing in the future.
Item
2.
Properties.
The
Company occupies a total of 16,449 square feet of office space, all of which is
leased. The leased space comprises our principal executive offices,
which is located at 5429 Lyndon B. Johnson Freeway, Suite 850, Dallas, TX 75240,
pursuant to a lease that expires on March 31, 2013. Included in the 16,449
square feet are 7,100 square feet of space added to our original lease by means
of an amendment to the lease executed in February 2009. The Company does not
own or lease any other real property and believes its offices are suitable to
meet its current needs.
Item
3.
Legal Proceedings.
None.
Item
4.
Reserved.
PART II
|
Item
5.
|
Market
for Registrant’s Common Equity, Related Stockholder Matters and Issuer
Purchases ofEquity
Securities.
|
Market
Information
The
Company’s Common Stock has traded on The NASDAQ Capital Market (“NASDAQ”) under
the symbol ANCI since September 29, 2008. Between October 19, 2006 and
September 26, 2008, our stock traded on the American Stock Exchange (“Amex”)
under the symbol XSI and between December 28, 2005 and October 19, 2006, public
trading for our Common Stock occurred on the OTC Bulletin Board.
The
following table sets forth, for the fiscal periods indicated, the range of the
high and low sales prices for our Common Stock on the Amex from January 1, 2008
through September 26, 2008 and the high and low sales prices for our Common
Stock on NASDAQ from September 29, 2008 through December 31, 2009.
|
High
|
Low
|
|
|
2009
|
||
|
Fourth
Quarter Ended December 31(NASDAQ)
|
$4.49
|
$1.95
|
|
Third
Quarter Ended September 30 (NASDAQ)
|
$4.73
|
$3.57
|
|
Second
Quarter Ended June 30 (NASDAQ)
|
$8.74
|
$3.50
|
|
First
Quarter Ended March 31 (NASDAQ)
|
$8.18
|
$6.40
|
|
2008
|
||
|
Fourth
Quarter Ended December 31(NASDAQ)
|
$9.50
|
$4.02
|
|
Third
Quarter Ended September 30 (NASDAQ)*
|
$9.50
|
$4.40
|
|
Second
Quarter Ended June 30 (Amex)
|
$4.75
|
$2.85
|
|
First
Quarter Ended March 31 (Amex)
|
$3.60
|
$2.40
|
*
Represents price on NYSE Amex through September 26, 2008 and on NASDAQ from
September 29, 2008.
The
closing price on NASDAQ for our Common Stock on March 22, 2010 was
$1.88.
Holders
As of
March 22, 2010, in accordance with the records of our transfer agent, there were
146 record holders of ACS Common Stock.
Dividends
We have
not declared cash dividends on our Common Stock. We intend to retain
all earnings to finance future growth and do not anticipate that we will pay
cash dividends for the foreseeable future.
Repurchases
of Securities
There
were no repurchases of the Common Stock of the Company by or on behalf of the
Company or any affiliated purchasers during the fourth quarter of the Company’s
fiscal year ended December 31, 2009.
Item
7.
Management’s Discussion and Analysis of Financial Condition and Results of
Operations.
The focus
of the following discussion is on the underlying business reasons for
significant changes and trends affecting our revenues, net income and financial
condition. The following discussion should be read in conjunction
with our consolidated financial statements, which present our results of
operations for the twelve month periods ended December 31, 2009 and 2008 as well
as our financial position at December 31, 2009 and 2008, contained elsewhere in
this Annual Report on Form 10-K. Some of the information contained in
this discussion and analysis or set forth elsewhere in this Annual Report on
Form 10-K, including information with respect to our plans and strategy for our
business, includes forward-looking statements that involve risks and
uncertainties. You should review the “Special Note Regarding Forward Looking
Statements” and “Risk Factors” sections of this Annual Report for a discussion
of important factors that could cause actual results to differ materially from
the results described in or implied by the forward-looking statements contained
in the following discussion and analysis.
Overview
American
CareSource Holdings, Inc. (the “Company”, “ACS”, “we”, “us”, or “our”) is an
ancillary benefits management company that offers cost effective access to a
comprehensive national network of ancillary healthcare service providers. The
Company’s customers include self-insured employers, indemnity insurers, PPOs,
HMOs, third-party administrators and federal and local governments that engage
the Company to provide them with a complete outsourced solutions designed to
manage each customer’s obligations to its covered persons. The
Company offers its customers this solution by executing the
following:
|
·
|
providing
payor customers with a comprehensive network of ancillary healthcare
services providers that is available to their covered persons for covered
services;
|
|
·
|
providing
payor customers with claims management, reporting, and processing and
payment services;
|
|
·
|
performing
network/needs analysis to assess the benefits to payor customers of adding
additional/different service providers to the payor customer-specific
provider networks; and
|
|
·
|
credentialing
network service providers for inclusion in the payor customer-specific
provider networks.
|
The
Company’s business model, illustrating the relationships among the persons
involved, directly or indirectly, in the Company’s business and its generation
of revenue and expenses is depicted below:
Our
clients route healthcare claims to us after service has been performed by
participant providers in our network. We process those claims and
charge the client/payor according to its contractual rate for the services
according to our contract with the client/payor. In processing the
claim, we are paid directly by the client or the insurer for the
service. We then pay the provider of service according to its
contractual rate. We assume the risk of generating positive margin,
the difference between the payment we receive for the service and the amount we
are obligated to pay the original provider of service or member of its
proprietary network.
The
Company recognizes revenues for ancillary healthcare services when services by
providers have been authorized and performed, the claim has been billed to the
payor and collections from payors are reasonably assured. Cost of
revenues for ancillary healthcare services consist of amounts due to providers
for providing ancillary health care services, client administration fees paid to
our client payors to reimburse them for routing the claims to us for processing,
and the Company’s related direct labor and overhead of processing invoices,
collections and payments. The Company is not liable for costs incurred by
independent contract service providers until payment is received by us from the
payors. The Company recognizes actual or estimated liabilities to independent
contract service providers as the related revenues are recognized.
The
Company markets its products to preferred provider organizations (“PPOs”), third
party administrators (“TPAs”), insurance companies, large self-funded
organizations and Taft-Hartley union plans, such as employee benefit plans that
are self-administered under collective bargaining agreements.
The year
ended December 31, 2009 marks the second full year in which we realized net
income. For the year ended December 31, 2009 our net income was $2.3
million, compared to a net income of $3.6 million for the year ended December
31, 2008. Our 2009 operating results reflect significant investments in
personnel, processes and technological tools, in both our Sales and Marketing
and Provider Development efforts, which positions us for future
growth. The Company is seeking continuing growth in the number of
client payors and service provider relationships we secure by focusing on
providing in-network services for its payors and aggressively pursuing
additional PPOs, TPAs and other direct payors as its primary sales targets. The
Company believes that this strategy should increase the volume of claims the
Company can process in addition to the expansion in the number of lives that are
eligible to receive ancillary health care benefits. No assurances can
be given that the Company can expand its service provider or payor
relationships, nor that any such expansion will result in an improvement in the
results of operations of the Company.
Year
Ended December 31, 2009 Compared to Year Ended December 31, 2008
Net
Revenues
The
following table sets forth a comparison of our revenues for the following years
ended December 31:
|
Change
|
||||||||
|
($
in thousands)
|
2009
|
2008
|
$
|
%
|
||||
|
Net
Revenues
|
$68,311
|
$58,289
|
$10,022
|
17%
|
||||
The
Company’s net revenues are generated from ancillary healthcare service
claims. Revenue is recognized when we bill our client payors for
services performed and collection is reasonably assured. The increase
in revenue for the year ended December 31, 2009 as compared to 2008 was due
primarily to the progression of our client relationships, which allowed the
Company access to a greater number of payors and allowed us to benefit from the
external growth and expansion of our clients. In addition, revenues
were positively impacted by growth in our ancillary service provider
network.
During
2009, revenues from the nine clients added during 2008 (one of which is an
affiliate of one of our two existing significant clients), increased over the
prior year by $4.6 million, which was due to the progression and development of
our client relationships, resulting in an increased number of payors and
increased claims volume. Clients added during 2009 contributed an
incremental $6.0 million of revenue during the current year. The
increases are a direct result of a concentrated effort to diversify our client
base. In 2009, our two significant clients accounted for 85% as
compared to 98% in 2008.
The
increase in revenues during 2009 from clients added in 2008 and 2009, was offset
by a slight decline (less than 1%) in revenues from our legacy clients (those
added in 2007 or earlier) of approximately $523,000. The decrease was
attributable primarily to reductions in revenue from our two largest legacy
clients.
The
following table details revenues generated by clients and the periods in which
those clients were added for the periods presented:
|
Year of
implementation ($ in thousands)
|
2007
and prior
|
2008
|
2009
|
Total
|
||||||||||||
|
2009
|
$
|
57,084
|
$
|
5,262
|
$
|
5,965
|
$
|
68,311
|
||||||||
|
2008
|
57,607
|
682
|
—
|
58,289
|
||||||||||||
The
Company will continue to seek growth in the number of client payor and service
provider relationships by focusing on providing in-network services for its
payors and aggressively pursuing additional regional and middle-market PPOs,
TPAs and other direct payors as its primary sales targets. The Company believes
that this strategy should increase the volume of claims the Company can process
in addition to the expansion in the number of lives that are eligible to receive
ancillary health care benefits. No assurances can be given that the
Company can expand its service provider or payor relationships, nor that any
such expansion will result in an improvement in the results of operations of the
Company.
In
addition, during 2009, the number of billed claims increased by 35% compared to
the prior year. The increase in claim volume was driven by the
expansion of existing client relationships, new clients implemented during 2009
as well as through expansion of our network of service providers.
Revenue
per claim declined for the periods presented due to lower than estimated
collection rates related to our new client relationships, limited benefits
offered by certain recently implemented clients and the change in mix of
provider specialties driving our claim volume during 2009. In
particular, we have experienced accelerated growth in categories such as
laboratory services with lower average revenue per claim while other higher
average revenue per claim categories such as dialysis services have not grown as
rapidly. The decline was offset somewhat by an increase in claims
from the diagnostic imaging services category. Revenues from
diagnostic imaging services increased as a percent of total revenue during 2009
as compared to the prior year as a result of our relationship with a third-party which
manages and maintains a national imaging network. Revenue per claim
can vary significantly depending upon factors including the types of services
consumed by clients members, the quantity of services delivered, client
negotiated pricing, provider negotiated service rates, the rate of collections
based upon the client and members financial responsibility and other
factors. The following table provides information with respect to
claims processed, claims billed and the associated revenue per claim metrics for
the years ended December 31:
|
2009
|
2008
|
||||||
|
Claims
processed (in thousands)
|
437
|
302
|
|||||
|
Claims
billed (in thousands)
|
373
|
276
|
|||||
|
Revenue
per processed claim
|
$
|
156
|
$
|
193
|
|||
|
Revenue
per billed claim
|
183
|
211
|
|||||
Cost
of Revenues and Contribution Margin
The
following table sets forth a comparison of the key components of our cost of
revenues, for the years ended December 31:
|
Change
|
||||||||||||||||||||||||
|
($
in thousands)
|
2009
|
%
of revenue
|
2008
|
%
of revenue
|
$ | % | ||||||||||||||||||
|
Provider
payments
|
$ | 51,235 | 75 | % | $ | 42,603 | 73 | % | $ | 8,632 | 20 | % | ||||||||||||
|
Administrative
fees
|
3,302 | 5 | 3,395 | 6 | (93 | ) | (3 | )% | ||||||||||||||||
|
Claims
administration and provider development
|
4,252 | 6 | 3,255 | 5 | 997 | 31 | % | |||||||||||||||||
|
Total
cost of revenues
|
$ | 58,789 | 86 | % | $ | 49,253 | 84 | % | $ | 9,536 | 19 | % | ||||||||||||
Cost of
revenues is comprised of payments to our providers, administrative fees paid to
our payors for converting claims to electronic data interchange and routing them
to both the Company for processing and to their payors for payment, and the
fixed costs of our claims administration and ancillary service provider
development organizations. Payments to providers is the largest
component of our cost of revenues and it consists of our payments for ancillary
care services in accordance with contracts negotiated separately with providers
for specific ancillary services.
In 2009,
cost of revenues related to payments to providers increased as compared to 2008
as a result of increased claims volume and increased revenues, and the
fluctuation in the mix of types of services provided by the
Company. Payments made to providers as a percent of net revenues were
75.0% during 2009 and 73.1% during 2008. Provider payments as a
percent of revenues increased due primarily to lower margins in our laboratory
services, dialysis services and infusion services specialties, as compared to
the prior year. These category margins were impacted by the execution
of new provider agreements, pricing for associated services on recently
implemented and existing client contracts, the mix of services delivered in each
category, the mix of providers delivering the services and overall pricing
pressures which have resulted in lower client rates.
While
administrative fees were relatively flat in 2009 compared to 2008,
administrative fees as a percent of revenues decreased from 5.8% in the prior
year to 4.8% in 2009. The decrease was due to the shift in revenues
to clients that carry lower contracted administrative fee rates.
The
detail of the costs of claims administration and provider development for the
years presented ended December 31 (amounts in thousands) are as
follows:
|
Claims
Administration
|
Provider
Development
|
Total
|
||||||||||||||||||||||||||||||||||||||||||||||
|
Increase
|
Increase
|
Increase
|
||||||||||||||||||||||||||||||||||||||||||||||
|
2009
|
2008
|
(Decrease)
|
2009
|
2008
|
(Decrease)
|
2009
|
2008
|
(Decrease)
|
||||||||||||||||||||||||||||||||||||||||
|
Total
wages, incentives and benefits
|
$
|
2,301
|
$
|
1,733
|
$
|
568
|
33
|
%
|
$
|
1,384
|
$
|
812
|
$
|
572
|
70
|
%
|
$
|
3,685
|
$
|
2,545
|
$
|
1,140
|
45
|
%
|
||||||||||||||||||||||||
|
Contract
labor and consulting fees
|
564
|
734
|
(170
|
)
|
(23
|
)%
|
85
|
6
|
79
|
nm
|
%
|
649
|
740
|
(91
|
)
|
(12
|
)%
|
|||||||||||||||||||||||||||||||
|
Capitalized
development costs
|
(628
|
)
|
(492
|
)
|
(136
|
)
|
28
|
%
|
—
|
—
|
—
|
—
|
%
|
(628
|
)
|
(492
|
)
|
(136
|
)
|
28
|
%
|
|||||||||||||||||||||||||||
|
Other
|
131
|
113
|
18
|
16
|
%
|
84
|
44
|
40
|
91
|
%
|
215
|
157
|
58
|
37
|
%
|
|||||||||||||||||||||||||||||||||
|
Allocation
of shared overheads
|
(37
|
)
|
53
|
(90
|
)
|
170
|
%
|
368
|
252
|
116
|
46
|
%
|
331
|
305
|
26
|
9
|
%
|
|||||||||||||||||||||||||||||||
|
$
|
2,331
|
$
|
2,141
|
$
|
190
|
9
|
%
|
$
|
1,921
|
$
|
1,114
|
$
|
807
|
72
|
%
|
$
|
4,252
|
$
|
3,255
|
$
|
997
|
31
|
%
|
|||||||||||||||||||||||||
The
increase in costs during 2009 as compared to the prior year is due primarily to
the following:
|
·
|
Investments
in claims administration and provider development. Wages,
incentives and benefits increased due to resource
additions. Headcount as of December 31, 2009 and 2008 were as
follows: Claims Administration -- 33 and 26, respectively; and
Provider Development -- 15 and 8, respectively. The increases
in headcount were made to facilitate growth through the enhancement of our
network of ancillary care providers, and to grow our claims processing and
management capabilities consistent with growth in claims
volume.
|
|
·
|
The
aforementioned cost increases were offset by a decrease in consulting fees
related to an information technology initiative in which a platform was
developed to create data analysis efficiencies. The fees were
primarily incurred during the second and third quarters of
2008.
|
The
following table sets forth a comparison of contribution margin percentage for
the years presented ended December 31:
|
2009
|
2008
|
Percent
Change
|
||||
|
Contribution
margin
|
13.9%
|
15.5%
|
(1.6)%
|
Contribution
margin is calculated by dividing the difference between net revenues and total
costs of revenues by net revenues. Contribution margin in 2009 was
negatively impacted by an increase in provider payments and claims
administration and provider development costs, as a percentage of revenue, of
1.9% and 0.6%, respectively. This decrease in contribution margin was
offset by a decrease in administrative fees, as a percentage of
revenue. The overall decline in contribution margin percentage was
discussed in detail in the preceding comments. Our contribution
margin percentage fluctuates over time due to changes in the prices we charge
our client payors as compared to the financial terms of our provider agreements,
changes in costs of our claims administration and provider development
organizations and changes in the mix of services we provide. There
can be no assurances that we will be able to maintain contribution margin at
current levels, either in absolute or in percentage terms.
Selling,
General and Administrative Expenses
The
following table sets forth a comparison of our selling, general and
administrative (“SG&A”) expenses for the periods ended December
31:
|
Change
|
||||||||
|
($
in thousands)
|
2009
|
2008
|
$
|
%
|
||||
|
Selling,
general and administrative expenses
|
$7,626
|
$5,095
|
$2,531
|
50%
|
||||
|
Percentage
of total net revenues
|
11.2%
|
8.7%
|
||||||
SG&A
expenses consist primarily of salaries and related benefits, travel costs, sales
commissions, sales materials, other marketing related expenses, costs of
corporate operations, finance and accounting, human resources and other general
operating expenses of the Company.
SG&A
expenses for the years presented ending December 31 (amounts in thousands) are
as follows:
|
Finance
& Administration
|
Sales
& Marketing
|
Total
|
||||||||||||||||||||||||||||||||||||||||||||||
|
|
2009
|
2008
|
Increase
(Decrease)
|
2009
|
2008
|
Increase
(Decrease)
|
2009
|
2008
|
Increase
(Decrease)
|
|||||||||||||||||||||||||||||||||||||||
|
Total
wages, commissions, incentives and benefits
|
$
|
1,459
|
$
|
1,343
|
$
|
116
|
9
|
%
|
$
|
1,540
|
$
|
683
|
$
|
857
|
125
|
%
|
$
|
2,999
|
$
|
2,026
|
$
|
973
|
48
|
%
|
||||||||||||||||||||||||
|
Professional
fees (legal, accounting and consulting)
|
943
|
629
|
314
|
50
|
%
|
121
|
—
|
121
|
nm
|
%
|
1,064
|
629
|
435
|
69
|
%
|
|||||||||||||||||||||||||||||||||
|
Stock-based
compensation expense
|
1,220
|
699
|
521
|
75
|
%
|
—
|
—
|
—
|
—
|
%
|
1,220
|
699
|
521
|
75
|
%
|
|||||||||||||||||||||||||||||||||
|
Investor
relations costs
|
255
|
153
|
102
|
67
|
%
|
—
|
—
|
—
|
—
|
%
|
255
|
153
|
102
|
67
|
%
|
|||||||||||||||||||||||||||||||||
|
Recruiting
costs
|
115
|
338
|
(223
|
)
|
(66
|
)%
|
—
|
—
|
—
|
—
|
%
|
115
|
338
|
(223
|
)
|
(66
|
)%
|
|||||||||||||||||||||||||||||||
|
Marketing
costs
|
—
|
—
|
—
|
—
|
%
|
317
|
25
|
292
|
nm
|
%
|
317
|
25
|
292
|
nm
|
%
|
|||||||||||||||||||||||||||||||||
|
Banking
fees
|
177
|
123
|
54
|
44
|
%
|
—
|
—
|
—
|
—
|
%
|
177
|
123
|
54
|
44
|
%
|
|||||||||||||||||||||||||||||||||
|
Other
|
371
|
371
|
—
|
—
|
%
|
122
|
58
|
64
|
110
|
%
|
493
|
429
|
64
|
15
|
%
|
|||||||||||||||||||||||||||||||||
|
Allocation
of shared overheads
|
509
|
556
|
(47
|
)
|
(8)
|
%
|
236
|
117
|
119
|
102
|
%
|
745
|
673
|
72
|
11
|
%
|
||||||||||||||||||||||||||||||||
|
Restructuring
charge
|
—
|
—
|
—
|
—
|
%
|
—
|
—
|
—
|
—
|
%
|
241
|
—
|
241
|
100
|
%
|
|||||||||||||||||||||||||||||||||
|
Total
selling, general and administrative expenses
|
$
|
5,049
|
$
|
4,212
|
$
|
837
|
20
|
%
|
$
|
2,336
|
$
|
883
|
$
|
1,453
|
165
|
%
|
$
|
7,626
|
$
|
5,095
|
$
|
2,531
|
50
|
%
|
||||||||||||||||||||||||
The
increase in SG&A, reflected in the above table is related to the
following:
|
·
|
Increased
headcount in our finance and administration and sales and marketing
groups. Wages, commissions, incentives and benefits during 2009
reflect the addition of four resources. These resources were
added during late 2008 and the first quarter of 2009. Headcount
as of December 31, 2009 and 2008 were as follows: Finance &
Administration – 10 and 7, respectively; and Sales & Marketing – 8 and
7, respectively.
|
|
·
|
Increased
compensation costs related to our stock-based incentive
plans. The increase in these costs are the direct result of an
increase in incentives granted during 2008 and 2009, and the increase in
the fair value of our stock options and restricted stock units (as
calculated under the Black-Scholes-Merton valuation model) which is
directly related to the increase in the value of our common stock during
2008 and the first half of 2009. As a result, stock-based
awards made in late-2008 through mid-2009 had higher associated costs than
those awarded during the prior
year.
|
|
·
|
Increased
professional fees. Our audit and legal-related activities
increased over the prior year and we implemented an enhanced compensation
plan for our Board of Directors in
2009.
|
|
·
|
Marketing
costs included $250,000 of amortization of the amendment of our client
agreement with one of our significant clients. The $1.0 million
payment is being amortized over a four-year period, which is the term of
the amended agreement.
|
|
·
|
The
increases were offset by a decline in recruiting costs of approximately
$223,000. During 2008, we incurred significant costs associated
with increasing our headcount to support strategic
initiatives.
|
In
addition, while we added significant resources during 2009, we made
organizational changes to bring our internal cost structure in line with
expected levels of revenue while reorganizing our functional groups to ensure
that we capitalize on certain market opportunities. We eliminated
approximately six positions, including our Vice President of Client Development
and other administrative personnel.
In
connection with the reorganization, we incurred certain charges during
2009. Those charges were primarily comprised of employee severance
costs and related fringe benefits, totaling approximately
$241,000. The majority of the payments were made by December 31,
2009. For 2009, SG&A, excluding the restructuring charge, as a
percent of revenues was 10.8%.
Depreciation
and Amortization
The
following table sets forth a comparison of depreciation and amortization for the
periods ended December 31:
|
Change
|
||||||||||||||||
|
($
in thousands)
|
2009
|
2008
|
$ | % | ||||||||||||
|
Depreciation
|
$ | 435 | $ | 202 | $ | 233 | 115 | % | ||||||||
|
Amortization
|
128 | 214 | (86 | ) | (40 | )% | ||||||||||
|
Total
Depreciation and amortization
|
$ | 563 | $ | 416 | $ | 147 | 35 | % | ||||||||
Amortization
of intangibles consists of $128,000 in amortization of the capitalized value of
provider contracts that were acquired in the 2003 acquisition of the assets of
our predecessor, American CareSource Corporation by Patient Infosystems (now
CareGuide, Inc.), our former parent corporation. Each of these items
is being amortized using the straight-line method over its expected useful life,
which is five years for software and 15 years for provider
contracts. As of December 31, 2008, the intangible asset from the
2003 acquisition related to software development costs was fully
amortized.
The
increase in depreciation expense is a direct result of an increase in capital
expenditures, which increased 63% in 2009 compared to 2008. A
significant portion of our expenditures in 2009 related to the continued
development of our technology infrastructure.
Other
Income
The
following table sets forth a comparison of the components of other income for
the periods ended December 31:
|
Change
|
||||||||||||||||
|
($
in thousands)
|
2009
|
2008
|
$ | % | ||||||||||||
|
Interest
income
|
$ | 130 | $ | 178 | $ | (48 | ) | (27 | )% | |||||||
|
Unrealized
gain on warrant derivative
|
324 | — | 324 |
nm
|
||||||||||||
|
Total
other income
|
$ | 454 | $ | 178 | $ | 276 | 155 | % | ||||||||
During
2009, we had unrealized gains of approximately $324,000, related to warrants
accounted for under the liability method. We use a two-step process
for evaluating whether our equity-linked financial instruments or embedded
features are indexed to our own stock. Warrants to purchase 109,095
shares of common stock issued by the Company contain a strike price adjustment
feature, which results in the instruments no longer being considered indexed to
the Company’s own stock and required the Company to record these warrants under
the liability accounting method. Accordingly, on January 1, 2009, we
adopted current accounting guidance that changed the current classification
(from equity to liability) and the related accounting for these
warrants. As of that date, we reclassified the warrants, based on a
fair value of $3.43 per warrant, as calculated using the Black–Scholes–Merton
valuation model. During 2009, the liability was adjusted for warrants
exercised and the change in fair value of the warrants. A liability
of approximately $18,000 related to the stock warrants is included as a warrant
derivative liability in our consolidated balance sheet as of December 31,
2009. The unrealized gain on the warrant derivative reflects the
change in fair value of the warrants.
Income
Tax Provision
For the
year ended December 31, 2009, we recorded an income tax benefit of approximately
$533,000 and eliminated any remaining deferred tax asset valuation
allowance. As of December 31, 2009, the Company determined that it is
more likely than not that we will realize the deferred tax
assets. The benefit recognized from the reversal of the valuation
allowance on deferred tax assets was offset by a state tax provision of
approximately $80,000.
Liquidity
and Capital Resources
As of
December 31, 2009, the Company had a working capital surplus of $11.1 million
compared to $7.8 million at December 31, 2008. In addition, our cash
and cash equivalents balance increased to $11.9 million as of December 31, 2009
compared to $10.6 million at December 31, 2008. The increase is
primarily the result of net cash provided by operating activities of $2.6
million. That increase was offset by capital expenditures of
approximately $1.3 million during 2009.
During
2009, operating activities provided net cash of $2.6 million, the primary
components of which were net income of $2.3 million, adjusted for non-cash
charges of share-based compensation expense of $1.5 million, depreciation and
amortization of approximately $563,000, a unrealized gain on our warrant
derivative of approximately $324,000, $250,000 of amortization of the amendment
of our client agreement with one of our significant clients, a deferred income
tax benefit of approximately $643,000 and a $1.1 million decrease in operating
assets and liabilities. Net operating assets and liabilities declined
due primarily to the $1.0 million payment made to one our significant clients in
conjunction with the amendment of our agreement with that
client. Such payment was made in April 2009.
Investing
activities during 2009 were comprised of investments in software development
costs of approximately $628,000 and in property and equipment of approximately
$653,000. The software development costs relate primarily to
enhancements to our internal legacy applications, while the increase in property
and equipment relates primarily to investments in computer equipment and our
facilities to accommodate our growth and increases in
headcount.
Historically,
we have relied on a combination of internally generated cash and external
sources of capital, including indebtedness or issuance of equity securities to
fund our operations. We believe our current cash balance of $11.9
million as of December 31, 2009 and expected future cash flows from operations
will be sufficient to meet our anticipated cash needs for working capital,
capital expenditures and other activities through at least the next twelve
months. If operating cash flows are not sufficient to meet our needs,
we believe that credit or access to capital through issuance of equity would be
available to us. We do not have any lines of credit, credit
facilities or outstanding bank indebtedness as of December 31,
2009.
Inflation
Inflation
did not have a significant impact on the Company’s costs during the years ended
December 31, 2009 and December 31, 2008, respectively. The Company
continues to monitor the impact of inflation in order to minimize its effects
through pricing strategies, productivity improvements and cost
reductions.
Off-Balance
Sheet Arrangements
The
Company does not have any off-balance sheet arrangements at December 31, 2009 or
December 31, 2008 or for the periods then ended.
Critical
Accounting Policies
Critical
accounting policies are those that require application of management’s most
difficult, subjective or complex judgments, often as a result of the need to
make estimates about the effect of matters that are inherently uncertain and may
change in subsequent periods.
The
Company’s significant accounting policies are described in the Notes to the
Consolidated Financial Statements located elsewhere in this Annual Report on
Form 10-K. Not all of these significant accounting policies require management
to make difficult, subjective or complex judgments or estimates. However, the
following accounting policies are deemed to be critical by our
management:
Intangible
Assets.
Intangible
assets consist of provider contracts and internally developed claims payment and
billing software. Each of these items is being amortized using the
straight-line method over its expected useful life of five years for the
software and fifteen years for the provider contracts. Our experience
to date is that we have approximately 2-4% annual turnover or attrition of
provider contracts. The provider contracts are being accounted for on
a pooled basis and the actual cancellation rates of provider contracts that were
acquired will be monitored for potential impairment or amortization adjustment,
if warranted. As of December 31, 2009, there is no impairment of this
intangible asset. The cost of adding additional providers is
considered an ongoing operating expense.
Revenue
recognition.
The
Company recognizes revenue on the services that it provides, which includes (i)
providing payor clients with a comprehensive network of ancillary healthcare
providers, (ii) providing claims management, reporting, processing and payment
services, (iii) providing network/need analysis to assess the benefits to payor
clients of adding what additional/different service providers to the
client-specific provider networks and (iv) providing credentialing of network
services providers for inclusion in the client payor-specific provider
networks. Revenue is recognized when services are delivered, which
occurs after processed claims are billed to the client payors and collections
are reasonably assured. The Company estimates revenues and costs of
revenues using average historical collection rates and average historical
margins earned on claims. Periodically, revenues are adjusted to
reflect actual cash collections so that revenues recognized accurately reflect
cash collected.
The
Company determines whether it is acting as a principal or agent in the
fulfillment of the services rendered. After careful evaluation of the
key gross and net revenue recognition indicators, the Company acknowledges that
while the determination of gross versus net reporting is highly judgmental in
nature, the Company has concluded that its circumstances are most consistent
with those key indicators that support gross revenue reporting.
Following
are the key indicators that support the Company’s conclusion that it acts as a
principal when settling claims for service providers through its contracted
service provider network:
|
|
·
|
The Company is the primary
obligor in the arrangement. The Company has assessed its
role as primary obligor as a strong indicator of gross
reporting. The Company believes that it is the primary obligor
in its transactions because it is responsible for providing the services
desired by its client payors. The Company has distinct,
separately negotiated contractual relationships with its client payors and
with the ancillary health care providers in its networks. The
Company does not negotiate “on behalf of” its client payors and does not
hold itself out as the agent of the client payors when negotiating the
terms of the Company’s ancillary healthcare service provider
agreements. The Company’s agreements contractually prohibit
client payors and service providers to enter into direct contractual
relationships with one another. The client payors have no
control over the terms of the Company’s agreements with the service
providers. In executing transactions, the Company assumes key
performance-related risks. The client payors hold the Company
responsible for fulfillment, as the provider, of all of the services the
client payors are entitled to under their contracts; client payors do not
look to the service providers for fulfillment. In addition, the
Company bears the pricing/margin risk as the principal in the
transactions. Because the contracts with the client payors and
service providers are separately negotiated, the Company has complete
discretion in negotiating both the prices it charges its client payors and
the financial terms of its agreements with the service
providers. Since the Company’s profit is the spread between the
amounts received from the client payors and the amount paid to the service
providers, it bears significant pricing/margin risk. There is
no guaranteed mark-up payable to the Company on the amount the Company has
contracted. Thus, the Company bears the risk that amounts paid
to the service provider will be greater than the amounts received from the
client payors, resulting in a loss or negative
claim.
|
|
|
·
|
The Company has latitude in
establishing pricing. As stated above, the Company has
complete latitude in negotiating the price to be paid to the Company by
each client payor and the price to be paid to each contracted service
provider. This type of pricing latitude indicates that the
Company has the risks and rewards normally attributed to a principal in
the transactions.
|
|
|
·
|
The Company changes the
product or performs part of the services. The Company
provides the benefits associated with the relationships it builds with the
client payors and the services providers. While the parties
could deal with each other directly, the client payors would not have the
benefit of the Company’s experience and expertise in assembling a
comprehensive network of service providers, in claims management,
reporting and processing and payment services, in performing network/needs
analysis to assess the benefits to client payors of adding
additional/different service providers to the client payor-specific
provider networks, and in credentialing network service
providers.
|
|
|
·
|
The Company has
complete discretion in supplier
selection. One of the key factors considered by client
payors who engage the Company is to have the Company undertake the
responsibility for identifying, qualifying, contracting with and managing
the relationships with the ancillary healthcare service
providers. As part of the contractual arrangement between the
Company and its client payors, the payors identify their obligations to
their respective covered persons and then work with the Company to
determine the types of ancillary healthcare services required in order for
the payors to meet their obligations. The Company may select
the providers and contract with them to provide services at its
discretion.
|
|
|
·
|
The Company is involved in the
determination of product or service specifications. The
Company works with its client payors to determine the types of ancillary
healthcare services required in order for the payors to meet their
obligations to their respective covered persons. In some
respects, the Company is customizing the product through its efforts and
ability to assemble a comprehensive network of providers for its customers
that is tailored to each client payor’s specific needs. In
addition, as part of its claims processing and payment services, the
Company works with the client payors, on the one hand, and the providers,
on the other, to set claims review, management and payment
specifications.
|
|
|
·
|
The supplier (and not the
Company) has credit risk. The Company believes it has
some level of credit risk, but that risk is mitigated because the Company
does not remit payment to providers unless and until it has received
payment from the relevant client payors following the Company’s processing
of a claim.
|
|
|
·
|
The amount that the Company
earns is not fixed. The Company does not earn a fixed
amount per transaction nor does it realize a per-person per-month charge
for its services.
|
The
Company has evaluated the other indicators of gross and net revenue recognition,
including whether or not the Company has general inventory risk. The
Company does not have any general inventory risk, as its business is not related
to the manufacture, purchase or delivery of goods and it does not purchase in
advance any of the services to be provided by the ancillary healthcare service
providers. While the absence of this risk would be one indicator in
support of net revenue reporting, as described in detail above, the Company has
carefully evaluated all of the key gross and net revenue recognition indicators
and has concluded that its circumstances are most consistent with those key
indicators that support gross revenue reporting.
Pending
Accounting Pronouncements
In
January 2010, the Financial Accounting Standards Board (“FASB”) issued
Accounting Standards Update No. 2010-06, Improving Disclosures about Fair
Value Measurements. The Update provides amendments to FASB ASC 820-10 that
requires entities to disclose separately the amounts of significant transfers in
and out of Level 1 and Level 2 fair value measurements and describe the reasons
for the transfers. In addition, the Update requires entities to present
separately information about purchases, sales, issuances, and settlements in the
reconciliation for fair value measurements using significant unobservable inputs
(Level 3). The disclosures related to Level 1 and Level 2 fair value
measurements are effective for us in 2010 and the disclosures related to Level 3
fair value measurements are effective for us in 2011. The Update requires new
disclosures only, and will have no impact on our consolidated financial
position, results of operations, or cash flows.
Item
8.
Financial Statement and
Supplementary Data.
The
Company’s financial statement and supplementary data required to be filed
pursuant to this Item 8 are located at the end of this Annual Report on Form
10-K, beginning on page F-1.
Item
9.
Changes in and Disagreements with Accountants on Accounting and Financial
Disclosure.
None.
Item
9A.
Controls and Procedures.
Evaluation
of Disclosure Controls and Procedures
Our
management, with the participation of our Chief Executive Officer and Interim
Chief Financial Officer, has evaluated the effectiveness of our disclosure
controls and procedures as of December 31, 2009. Based upon this
evaluation, our Chief Executive Officer and Interim Chief Financial Officer
concluded that our disclosure controls and procedures (as defined in Rules
13a-15(e) and 15(d)-15(e) under the Exchange Act) are effective to ensure that
information required to the disclosed by us in reports we file or submit under
the Exchange Act is recorded, processed, summarized and reported within the time
periods specified in the SEC’s rules and forms, and is accumulated and
communicated to our management, including our Chief Executive Officer and
Interim Chief Financial Officer, as appropriate to allow timely decisions
regarding required disclosures.
Management’s
Annual Report on Internal Control over Financial Reporting
The
management of the Company is responsible for establishing and maintaining
adequate internal control over financial reporting by the
Company. “Internal
control over financial reporting“ is defined in Rule 13a-15(f) and Rule
15d-15(f) under the Exchange Act, as amended, as a process designed by, or under
the supervision of, the Company’s principal executive and principal financial
officers, or persons performing similar functions, and effected by the Company’s
Board of Directors, management and other personnel to provide reasonable
assurance regarding the reliability of financial reporting and the preparation
of financial statements for external purposes in accordance with generally
accepted accounting principles and includes those policies and procedures
that:
|
·
|
Pertain
to the maintenance of records that in reasonable detail accurately and
fairly reflect the transactions and dispositions of the assets of the
Company;
|
|
·
|
Provide
reasonable assurance that transactions are recorded as necessary to permit
preparation of financial statements in accordance with generally accepted
accounting principles, and that receipts and expenditure of the issuer are
being made only in accordance with authorizations of management and
directors of the Company; and
|
|
·
|
Provide
reasonable assurance regarding prevention or timely detection of
unauthorized acquisition, use or disposition of the Company’s assets that
could have a material effect on the financial
statements.
|
Internal
control over financial reporting has inherent limitations and may not prevent or
detect misstatements. Also, projections of any evaluation of
effectiveness to future periods are subject to the risks that controls may
become inadequate because of changes in conditions, or that the degree of
compliance with the policies or procedures may deteriorate.
Management
assessed the effectiveness of the Company’s internal control over financial
reporting as of December 31, 2009. In making this assessment, management
used the criteria set forth by the Committee of Sponsoring Organizations of the
Treadway Commission (COSO) in Internal Control – Integrated
Framework.
Management reviewed the results of its assessment with the Audit Committee of
the Company’s Board of Directors. Based on this assessment,
management believes that, as of December 31, 2009, the Company has maintained
effective internal control over financial reporting.
This
Annual Report does not include an attestation report of the Company’s registered
public accounting firm regarding internal control over financial
reporting. Management’s report was not subject to attestation by the
Company’s registered public accounting firm pursuant to temporary rules of the
Securities and Exchange Commission that permit the Company to provide only
management’s report in this Annual Report.
Changes
in Internal Control over Financial Reporting
Our
management, with the participation of our Chief Executive Officer and Interim
Chief Financial Officer, has concluded that there were no changes in the
Company’s internal controls over financial reporting (as defined in Rules
13a-15(f) and 15d-15(f) under the Exchange Act) since the last fiscal quarter
that have materially affected the Company’s internal controls over financial
reporting or are reasonably likely to materially affect internal controls over
financial reporting, including any corrective actions with regard to significant
deficiencies and material weaknesses.
Item
9B.
Other Information
On March
24, 2010, Kenneth S. George was named Chairman of the Company's Board of
Directors (the “Board”), replacing David George, who resigned from the Board,
both effective March 24, 2010. Kenneth S. George has served on the Board since
January 2004. In connection with his appointment, Kenneth S. George was granted
options to purchase 100,000 shares of the Company’s common stock, with an
exercise price of $1.83, the closing price of the Company’s common stock on The
NASDAQ Capital Market on March 24, 2010. The options were granted under the
Company's 2009 Equity Incentive Plan and vest in equal annual increments over
five years.
PART III
Item
10. Directors,
Executive Officers and Corporate Governance
The
information required by this Item 10 is incorporated herein by reference to the
applicable information contained in the definitive proxy statement for our
annual meeting of stockholders to be held on or about June 9, 2010, which will
be filed with the SEC pursuant to Regulation 14A not later than 120 days after
the Company’s fiscal year ended December 31, 2009.
Item
11.
Executive Compensation
The
information required by this Item 11 is incorporated herein by reference to the
applicable information contained in the definitive proxy statement for our
annual meeting of stockholders to be held on or about June 9, 2010, which will
be filed with the SEC pursuant to Regulation 14A not later than 120 days after
the Company’s fiscal year ended December 31, 2009.
Item
12.
Security Ownership of Certain Beneficial Owners and Management and Related
Stockholder Matters
The
following table provides information with respect to the equity securities that
are authorized for issuance under our equity compensation plans as of December
31, 2009:
|
Equity
Compensation Plan Information at December 31, 2009
|
|||||||||
|
Plan
Category
|
Number
of securities to be issued upon
exercise
of outstanding options, warrants and rights, (a)
|
Weighted-average
exercise price of outstanding options, warrants and rights
(b)
|
Number
of securities remaining available for future issuance under equity
compensation plans (excluding securities reflected in column
(a)
|
||||||
|
Equity
compensation plans approved by security holders
|
4,456,216
|
$2.55
|
1,590,178
|
||||||
|
Equity
compensation plans not approved by security holders
|
—
|
$—
|
—
|
||||||
|
Total
|
4,456,216
|
$2.55
|
1,590,178
|
||||||
In
addition, warrants to purchase 1,827,269 shares of Common Stock of the Company
were issued and outstanding as of December 31, 2009, as shown in the table
below. These warrants had been granted as compensation to certain
guarantors (including two of our directors) of Company debt that has since been
retired by the Company, as part of compensation to the placement agent in
connection with a March 2006 private placement of the Company’s Common Stock,
and to a client of the Company as partial compensation for services
performed.
|
Shares
of Common Stock issuable under outstanding warrants
|
Weighted-average
exercise price of outstanding warrants
|
|||||||
|
Series A
(1)
|
871,559 | $ | 0.40 | |||||
|
Series B
(2)
|
631,059 | $ | 0.49 | |||||
|
Series C
(3)
|
99,651 | $ | 5.50 | |||||
|
Series
D (4)
|
225,000 | $ | 1.84 | |||||
|
Total
Warrants Outstanding
|
1,827,269 | $ | 0.89 | |||||
|
(1)
|
Series
A warrants were granted on January 20, 2005 to John Pappajohn and Derace
L. Schaffer in conjunction with the personal guarantees associated with
the Company’s $3,000,000 line of credit with Wells Fargo Bank,
NA. As of March 22, 2010, all Series A warrants were
exercised.
|
|
(2)
|
Series
B warrants were granted on August 9, 2005 to John Pappajohn, Derace L.
Schaffer and Matthew P. Kinley in conjunction with increasing the
Company’s line of credit with Wells Fargo Bank, NA from $3,000,000 to
$4,000,000 and the associated increase in the personal
guarantees.
|
|
(3)
|
Service
warrants were granted as part of the compensation to Laidlaw and Company
in connection with the Company’s March 2006 private
placement.
|
|
(4)
|
These
warrants were granted on May 21, 2007 to Corporate Health Plans of
America, Inc., an affiliate of the Company’s client, Texas True Choice,
Inc. (“Texas True Choice”), as partial compensation to Texas True Choice
for services to be performed by it pursuant to an ancillary care services
network access agreement between the Company and Texas True
Choice.
|
The other
information required by this Item 12 is incorporated herein by reference to the
applicable information contained in the definitive proxy statement for our
annual meeting of stockholders to be held on or about June 9, 2010, which will
be filed with the SEC pursuant to Regulation 14A not later than 120 days after
the Company’s fiscal year ended December 31, 2009.
Item
13.
Certain Relationships and Related Transactions, and Director
Independence
The
information required by this Item 13 is incorporated herein by reference to the
applicable information contained in the definitive proxy statement for our
annual meeting of stockholders to be held on or about June 9, 2010, which will
be filed with the SEC pursuant to Regulation 14A not later than 120 days after
the Company’s fiscal year ended December 31, 2009.
Item
14.
Principal Accounting Fees and Services
The
information required by this Item 14 is incorporated herein by reference to the
applicable information contained in the definitive proxy statement for our
annual meeting of stockholders to be held on or about June 9, 2010, which will
be filed with the SEC pursuant to Regulation 14A not later than 120 days after
the Company’s fiscal year ended December 31, 2009.
PART IV
Item
15. Exhibits
and Financial Statement Schedules
|
(a)
|
The following documents are filed as part of this Annual
Report on Form 10-K:
|
|
(1)
|
Financial Statements
|
The
following financial statements are set forth in Item 8 hereof:
|
Document
|
Pages
|
|
Report
of Independent Registered Public Accounting Firm
|
F-1
|
|
Consolidated
Statements of Income for the Years Ended December 31, 2009 and
2008
|
F-2
|
|
Consolidated
Balance Sheets as of December 31, 2009 and 2008
|
F-3
|
|
Consolidated
Statements of Stockholders’ Equity for the Years Ended December 31, 2009
and 2008
|
F-4
|
|
Consolidated
Statements of Cash Flows for the Years Ended December 31, 2009 and
2008
|
F-5
|
|
Notes
to Consolidated Financial Statements
|
F-6
|
|
(2)
|
Financial
Statement Schedules
|
None.
|
(3)
|
Exhibits
|
Reference
is made to the Exhibit Index following this Annual Report on Form
10-K.
Report of Independent Registered Public Accounting Firm
To the
Board of Directors and Stockholders
American
CareSource Holdings, Inc.
We have
audited the accompanying consolidated balance sheets of American CareSource
Holdings, Inc. and subsidiary as of December 31, 2009 and 2008, and the related
consolidated statements of income, stockholders’ equity, and cash flows for each
of the years then ended. These financial statements are the
responsibility of the Company’s management. Our responsibility is to
express an opinion on these financial statements based on our
audits.
We
conducted our audits in accordance with the standards of the Public Company
Accounting Oversight Board (United States). Those standards require
that we plan and perform the audit to obtain reasonable assurance about whether
the financial statements are free of material misstatement. An audit
includes examining, on a test basis, evidence supporting the amounts and
disclosures in the financial statements. An audit also includes
assessing the accounting principles used and significant estimates made by
management, as well as evaluating the overall financial statement
presentation. We believe that our audits provide a reasonable basis
for our opinion.
In our
opinion, the consolidated financial statements referred to above present fairly,
in all material respects, the financial position of American CareSource
Holdings, Inc. and subsidiary as of December 31, 2009 and 2008, and the results
of their operations and their cash flows for the years then ended, in conformity
with U.S. generally accepted accounting principles.
As
described in Note 10 to the consolidated financial statements, effective January
1, 2009, American CareSource Holdings, Inc. and subsidiary adopted the
provisions of Accounting Standards Codification Topic 815-40 and reclassified
certain warrants previously classified as an equity instrument to a liability.
We were
not engaged to examine management’s assessment of the effectiveness of American
CareSource Holdings, Inc. and subsidiary’s internal control over financial
reporting as of December 31, 2009, included in Item 9A(T) of Form 10-K and,
accordingly, we do not express an opinion thereon.
/s/
McGladrey & Pullen, LLP
Des
Moines, Iowa
March 26,
2010
AMERICAN CARESOURCE HOLDINGS, INC.
CONSOLIDATED
STATEMENTS OF INCOME
For the
years ended December 31
(amounts
in thousands, except per share data)
|
2009
|
2008
|
|||||||
|
Net
revenues
|
$ | 68,311 | $ | 58,289 | ||||
|
Cost
of revenues:
|
||||||||
|
Provider
payments
|
51,235 | 42,603 | ||||||
|
Administrative
fees
|
3,302 | 3,395 | ||||||
|
Claims
administration and provider development
|
4,252 | 3,255 | ||||||
|
Total
cost of revenues
|
58,789 | 49,253 | ||||||
|
Contribution
margin
|
9,522 | 9,036 | ||||||
|
Selling,
general and administrative expenses
|
7,626 | 5,095 | ||||||
|
Depreciation
and amortization
|
563 | 416 | ||||||
|
Total
operating expenses
|
8,189 | 5,511 | ||||||
|
Operating
income
|
1,333 | 3,525 | ||||||
|
Other
income:
|
||||||||
|
Interest
income
|
130 | 178 | ||||||
|
Unrealized
gain on warrant derivative
|
324 | — | ||||||
|
Total
other income
|
454 | 178 | ||||||
|
Income
before income taxes
|
1,787 | 3,703 | ||||||
|
Income
tax provision (benefit)
|
(533 | ) | 65 | |||||
|
Net
income
|
$ | 2,320 | $ | 3,638 | ||||
|
Earnings
per common share:
|
||||||||
|
Basic
|
$ | 0.15 | $ | 0.24 | ||||
|
Diluted
|
$ | 0.11 | $ | 0.21 | ||||
|
Basic
weighted average common shares outstanding
|
15,469 | 15,084 | ||||||
|
Diluted
weighted average common shares outstanding
|
17,764 | 17,736 | ||||||
See
accompanying notes.
AMERICAN CARESOURCE HOLDINGS, INC.
CONSOLIDATED
BALANCE SHEETS
December
31
(amounts
in thousands except per share amounts)
|
2009
|
2008
|
|||||||
|
ASSETS
|
||||||||
|
Current
assets:
|
||||||||
|
Cash
and cash equivalents
|
$ | 11,868 | $ | 10,578 | ||||
|
Accounts
receivable, net
|
7,474 | 5,788 | ||||||
|
Prepaid
expenses and other current assets
|
822 | 490 | ||||||
|
Deferred
income taxes
|
576 | 6 | ||||||
|
Total
current assets
|
20,740 | 16,862 | ||||||
|
Property
and equipment, net
|
1,762 | 915 | ||||||
|
Other
assets:
|
||||||||
|
Deferred
income taxes
|
317 | 244 | ||||||
|
Other
assets
|
657 | 883 | ||||||
|
Intangible
assets, net
|
1,153 | 1,281 | ||||||
|
Goodwill
|
4,361 | 4,361 | ||||||
| $ | 28,990 | $ | 24,546 | |||||
|
LIABILITIES
AND SHAREHOLDERS’ EQUITY
|
||||||||
|
Current
liabilities:
|
||||||||
|
Due
to service providers
|
$ | 7,702 | $ | 5,964 | ||||
|
Accounts
payable and accrued liabilities
|
1,980 | 3,115 | ||||||
|
Total
current liabilities
|
9,682 | 9,079 | ||||||
|
Warrant
derivative liability
|
18 | — | ||||||
|
Commitments
and contingencies
|
||||||||
|
Shareholders’
equity:
|
||||||||
|
Preferred
stock, $0.01 par value; 10,000 shares authorized none
issued
|
— | — | ||||||
|
Common
stock, $0.01 par value; 40,000 shares authorized; 15,642 and 15,407 shares
issued and outstanding in 2009 and 2008, respectively
|
156 | 154 | ||||||
|
Additional
paid-in capital
|
20,605 | 19,046 | ||||||
|
Accumulated
deficit
|
(1,471 | ) | (3,733 | ) | ||||
|
Total
shareholders’ equity
|
19,290 | 15,467 | ||||||
| $ | 28,990 | $ | 24,546 | |||||
See
accompanying notes.
AMERICAN CARESOURCE HOLDINGS, INC.
CONSOLIDATED
STATEMENT OF STOCKHOLDERS’ EQUITY
For the
years ended December 31, 2009 and 2008
(amounts in
thousands)
|
Common
Stock
|
||||||||||||||||||||
|
Shares
|
Amount
|
Additional
Paid-in Capital
|
Accumulated
Deficit
|
Total
Stockholders’ Equity
|
||||||||||||||||
|
Balance
at December 31, 2007
|
14,668 | $ | 145 | $ | 17,614 | $ | (7,371 | ) | $ | 10,388 | ||||||||||
|
Net
income
|
— | — | — | 3,638 | 3,638 | |||||||||||||||
|
Stock-based
compensation expense
|
— | — | 699 | — | 699 | |||||||||||||||
|
Issuance
of common stock upon exercise of stock options
|
701 | 7 | 445 | — | 452 | |||||||||||||||
|
Issuance
of common stock upon exercise of stock warrants
|
23 | 1 | 128 | — | 129 | |||||||||||||||
|
Issuance
of common stock upon net warrant exercises
|
15 | 1 | (1 | ) | — | — | ||||||||||||||
|
Issuance
of common stock warrants for payment of client management
fees
|
— | — | 161 | — | 161 | |||||||||||||||
|
Balance
at December 31, 2008
|
15,407 | $ | 154 | $ | 19,046 | $ | (3,733 | ) | $ | 15,467 | ||||||||||
|
Cumulative
effect of change in accounting principle – January 1, 2009
reclassification of embedded feature of equity-linked financial instrument
to warrant derivative liability
|
— | — | (316 | ) | (58 | ) | (374 | ) | ||||||||||||
|
Net
income
|
— | — | — | 2,320 | 2,320 | |||||||||||||||
|
Stock-based
compensation expense
|
— | — | 1,495 | — | 1,495 | |||||||||||||||
|
Issuance
of common stock upon exercise of stock options and restricted stock
units
|
20 | — | (12 | ) | — | (12 | ) | |||||||||||||
|
Issuance
of common stock upon exercise of stock warrants
|
215 | 2 | 81 | — | 83 | |||||||||||||||
|
Issuance
of common stock warrants for payment of client management
fees
|
— | — | 311 | — | 311 | |||||||||||||||
|
Balance
at December 31, 2009
|
15,642 | $ | 156 | $ | 20,605 | $ | (1,471 | ) | $ | 19,290 | ||||||||||
See
accompanying notes.
AMERICAN CARESOURCE HOLDINGS, INC.
CONSOLIDATED
STATEMENTS OF CASH FLOWS
For the
years ended December 31
(amounts in
thousands)
|
2009
|
2008
|
|||||||
|
Cash
flows from operating activities:
|
||||||||
|
Net
income
|
$ | 2,320 | $ | 3,638 | ||||
|
Adjustments
to reconcile net income to net cash provided by
operations:
|
||||||||
|
Stock-based
compensation expense
|
1,495 | 699 | ||||||
|
Depreciation
and amortization
|
563 | 415 | ||||||
|
Unrealized
gain on warrant derivative
|
(324 | ) | — | |||||
|
Amortization
of long-term client agreement
|
250 | — | ||||||
|
Deferred
income tax provision (benefit)
|
(643 | ) | 12 | |||||
|
Changes
in operating assets and liabilities:
|
||||||||
|
Accounts
receivable
|
(1,686 | ) | (2,137 | ) | ||||
|
Prepaid
expenses and other assets
|
(56 | ) | 429 | |||||
|
Accounts
payable and accrued liabilities
|
(1,102 | ) | 689 | |||||
|
Due
to service providers
|
1,738 | 2,620 | ||||||
|
Net
cash provided by operating activities
|
2,555 | 6,365 | ||||||
|
Cash
flows from investing activities:
|
||||||||
|
Investments
in internally developed software
|
(628 | ) | (492 | ) | ||||
|
Investments
in property and equipment
|
(653 | ) | (292 | ) | ||||
|
Redemption
of certificate of deposit
|
— | 145 | ||||||
|
Net
cash used in investing activities
|
(1,281 | ) | (639 | ) | ||||
|
Cash
flows from financing activities:
|
||||||||
|
Proceeds
from exercise of stock warrants
|
13 | 127 | ||||||
|
Proceeds
from exercise of stock options
|
3 | 452 | ||||||
|
Net
cash provided by financing activities
|
16 | 579 | ||||||
|
Net
increase in cash and cash equivalents
|
1,290 | 6,305 | ||||||
|
Cash
and cash equivalents at beginning of period
|
10,578 | 4,273 | ||||||
|
Cash
and cash equivalents at end of period
|
$ | 11,868 | $ | 10,578 | ||||
|
Supplemental
cash flow information:
|
||||||||
|
Cash
paid for taxes
|
$ | 90 | $ | 15 | ||||
|
Supplemental
non-cash financing activity:
|
||||||||
|
Warrants
issued as payment of client management fees
|
$ | 311 | $ | 161 | ||||
|
Warrant
exercise in accrued liabilities
|
38 | — | ||||||
|
Warrant
derivative liability transferred to equity upon exercise
|
32 | — | ||||||
See
accompanying notes.
AMERICAN CARESOURCE HOLDINGS, INC.
NOTES TO
THE CONSOLIDATED FINANCIAL STATEMENTS
December
31, 2009
(Tables
in thousands, except per share amounts)
1.
Summary of Significant Accounting Policies
American
CareSource Holdings, Inc. (“ACS,” “Company,” the “Registrant,” “we,” “us,” or
“our,”) is an ancillary benefits management company that offers cost effective
access to a comprehensive national network of ancillary healthcare service
providers. The Company’s clients, healthcare payors, which include
preferred provider organizations (“PPOs”), third party administrators (“TPAs”),
insurance companies, large self-funded organizations and Taft-Hartley union
plans (i.e., employee benefit plans that are self-administered under collective
bargaining agreements), engage the Company to provide them with a complete
outsourced solution designed to manage each customer’s obligations to its
covered persons. The Company offers its customers this solution
by:
|
|
·
|
providing
payors with a comprehensive network of ancillary healthcare services
providers that is tailored to each payor customer’s specific needs and is
available to each payor customer’s covered persons for covered
services;
|
|
|
·
|
providing
payor customers with claims management, reporting, and processing and
payment services;
|
|
|
·
|
performing
network/needs analysis to assess the benefits to payor customers of adding
additional/different service providers to the payor customer-specific
provider networks; and
|
|
|
·
|
credentialing
network service providers for inclusion in the payor customer-specific
provider networks.
|
During
the third quarter of 2008, the Company’s Board of Directors approved the
decision to move the listing of the Company’s common stock to The NASDAQ Stock
Market (“the NASDAQ”) from the American Stock Exchange. Trading of
the Company’s common stock commenced on the NASDAQ on September 29, 2008 under
the stock symbol “ANCI”.
Basis
of Presentation
The
consolidated financial statements include the accounts of the Company and its
one wholly-owned subsidiary, Ancillary Care Services, Inc. All
material intercompany accounts and transactions are eliminated in
consolidation. Certain prior year amounts have been reclassified
within the consolidated financial statements to conform to the current year
presentation.
Cash
and Cash Equivalents
The
Company considers all highly-liquid investments with original maturities of
three months or less to be cash equivalents. Cash and cash equivalents include
amounts in deposit accounts in excess of federally insured limits of
$250,000. The Company has not experienced any losses in such
accounts.
Revenue
Recognition
The
Company recognizes revenue on the services that it provides, which includes (i)
providing payor clients with a comprehensive network of ancillary healthcare
providers, (ii) providing claims management, reporting, processing and payment
services, (iii) providing network/need analysis to assess the benefits to payor
clients of adding what additional/different service providers to the
client-specific provider networks and (iv) providing credentialing of network
services providers for inclusion in the client payor-specific provider
networks. Revenue is recognized when services are delivered, which
occurs after processed claims are billed to the client payors and collections
are reasonably assured. The Company estimates revenues and costs of
revenues using average historical collection rates and average historical
margins earned on claims. Periodically, revenues are adjusted to
reflect actual cash collections so that revenues recognized accurately reflect
cash collected.
The
Company determines whether it is acting as a principal or agent in the
fulfillment of the services rendered. After careful evaluation of the
key gross and net revenue recognition indicators, the Company acknowledges that
while the determination of gross versus net reporting is highly judgmental in
nature, the Company has concluded that its circumstances are most consistent
with those key indicators that support gross revenue reporting.
Following
are the key indicators that support the Company’s conclusion that it acts as a
principal when settling claims for service providers through its contracted
service provider network:
|
|
·
|
The Company is the primary
obligor in the arrangement. The Company has assessed its
role as primary obligor as a strong indicator of gross
reporting. The Company believes that it is the primary obligor
in its transactions because it is responsible for providing the services
desired by its client payors. The Company has distinct,
separately negotiated contractual relationships with its client payors and
with the ancillary health care providers in its networks. The
Company does not negotiate “on behalf of” its client payors and does not
hold itself out as the agent of the client payors when negotiating the
terms of the Company’s ancillary healthcare service provider
agreements. The Company’s agreements contractually prohibit
client payors and service providers to enter into direct contractual
relationships with one another. The client payors have no
control over the terms of the Company’s agreements with the service
providers. In executing transactions, the Company assumes key
performance-related risks. The client payors hold the Company
responsible for fulfillment, as the provider, of all of the services the
client payors are entitled to under their contracts; client payors do not
look to the service providers for fulfillment. In addition, the
Company bears the pricing/margin risk as the principal in the
transactions. Because the contracts with the client payors and
service providers are separately negotiated, the Company has complete
discretion in negotiating both the prices it charges its client payors and
the financial terms of its agreements with the service
providers. Since the Company’s profit is the spread between the
amounts received from the client payors and the amount paid to the service
providers, it bears significant pricing/margin risk. There is
no guaranteed mark-up payable to the Company on the amount the Company has
contracted. Thus, the Company bears the risk that amounts paid
to the service provider will be greater than the amounts received from the
client payors, resulting in a loss or negative
claim.
|
|
|
·
|
The Company has latitude in
establishing pricing. As stated above, the Company has
complete latitude in negotiating the price to be paid to the Company by
each client payor and the price to be paid to each contracted service
provider. This type of pricing latitude indicates that the
Company has the risks and rewards normally attributed to a principal in
the transactions.
|
|
|
·
|
The Company changes the
product or performs part of the services. The Company
provides the benefits associated with the relationships it builds with the
client payors and the services providers. While the parties
could deal with each other directly, the client payors would not have the
benefit of the Company’s experience and expertise in assembling a
comprehensive network of service providers, in claims management,
reporting and processing and payment services, in performing network/needs
analysis to assess the benefits to client payors of adding
additional/different service providers to the client payor-specific
provider networks, and in credentialing network service
providers.
|
|
|
·
|
The Company has discretion in
supplier selection. The Company has complete discretion
in supplier selection. One of the key factors considered by
client payors who engage the Company is to have the Company undertake the
responsibility for identifying, qualifying, contracting with and managing
the relationships with the ancillary healthcare service
providers. As part of the contractual arrangement between the
Company and its client payors, the payors identify their obligations to
their respective covered persons and then work with the Company to
determine the types of ancillary healthcare services required in order for
the payors to meet their obligations. The Company may select
the providers and contract with them to provide services at its
discretion.
|
|
|
·
|
The Company is involved in the
determination of product or service specifications. The
Company works with its client payors to determine the types of ancillary
healthcare services required in order for the payors to meet their
obligations to their respective covered persons. In some
respects, the Company is customizing the product through its efforts and
ability to assemble a comprehensive network of providers for its customers
that is tailored to each client payor’s specific needs. In
addition, as part of its claims processing and payment services, the
Company works with the client payors, on the one hand, and the providers,
on the other, to set claims review, management and payment
specifications.
|
|
|
·
|
The supplier (and not the
Company) has credit risk. The Company believes it has
some level of credit risk, but that risk is mitigated because the Company
does not remit payment to providers unless and until it has received
payment from the relevant client payors following the Company’s processing
of a claim.
|
|
|
·
|
The amount that the Company
earns is not fixed. The Company does not earn a fixed
amount per transaction nor does it realize a per-person per-month charge
for its services.
|
The
Company has evaluated the other indicators of gross and net revenue recognition,
including whether or not the Company has general inventory risk. The
Company does not have any general inventory risk, as its business is not related
to the manufacture, purchase or delivery of goods and it does not purchase in
advance any of the services to be provided by the ancillary healthcare service
providers. While the absence of this risk would be one indicator in
support of net revenue reporting, as described in detail above, the Company has
carefully evaluated all of the key gross and net revenue recognition indicators
and has concluded that its circumstances are most consistent with those key
indicators that support gross revenue reporting.
If the
Company were to report its revenues net of provider payments rather than on a
gross reporting basis, for the years ended December 31, 2009 and December 31,
2008, its net revenues would have been $17.1 million and $15.7 million,
respectively.
Provider
Payments
Payments
to providers is the largest component of our cost of revenues and it consists of
our payments for ancillary care services in accordance with contracts negotiated
separately with providers for specific ancillary services.
Use
of Estimates
The
preparation of financial statements in conformity with accounting principles
generally accepted in the United States requires management to make estimates
and assumptions that affect the reported amounts of assets and liabilities and
disclosure of contingent assets and liabilities at the date of the financial
statements and the reported amounts of revenues and expenses during the
reporting period. Actual amounts could differ from those
estimates.
Property
and Equipment
Property
and equipment are recorded at original cost and increased by the cost of any
significant improvements subsequent to purchase. The Company expenses
repairs and maintenance as incurred. Depreciation and amortization is
calculated using the straight-line method over the shorter of the asset’s
estimated useful life or the term of the lease in the case of leasehold
improvements. The Company capitalizes costs associated with software
developed for internal use. During 2009 and 2008, we capitalized
approximately $628,000 and $492,000 of internally developed software costs,
respectively. Internally developed software is being amortized over a
useful life of 5-years.
Research
and Development
Research
and development costs are expensed as incurred.
Income
Taxes
Income
taxes are accounted for under the asset and liability
method. Deferred taxes arise because of different treatment between
financial statement accounting and tax accounting, known as “temporary
differences”. The Company records the tax effect of these temporary
differences as “deferred tax assets” (generally items that can be used as a tax
deduction of credit in the future periods) and “deferred tax liabilities”
(generally items that we received a tax deduction for, which have not yet been
recorded in the income statement). The deferred tax assets and
liabilities are measured using enacted tax rules and laws that are expected to
be in effect when the temporary differences are expected to be recovered or
settled. A valuation allowance would be established to reduce
deferred tax assets if it is more likely than not that a deferred tax assets
will not be realized.
Stock
Compensation
The
Company records all stock-based payments to employees in the consolidated
financial statements based on their estimated fair values as of the measurement
date of the respective awards. Additional information about the
Company’s share-based payment plan is presented in Note 8.
Segment
and Related Information
The
Company uses the “management approach” for reporting information about segments
in our annual and interim financial statements. The management
approach is based on the way the chief operating decision-maker organizes
segments within a company for making operating decisions and assessing
performance. Reportable segments are based on products and services,
geography, legal structure, management structure and any other manner in which
management disaggregates a company. Based on the “management
approach” model, the Company determined that our business is comprised of a
single operating segment.
Fair
Value of Financial Instruments
The
Company’s financial instruments consist primarily of cash and cash equivalents,
accounts receivable, accounts payable and accrued expenses. The fair
value of instruments is determined by reference to various market data and other
valuation techniques, as appropriate. Unless otherwise disclosed, the
fair value of short-term financial instruments approximates their recorded
values due to the short-term nature of the instruments.
Pending
Accounting Pronouncements
In
January 2010, the Financial Accounting Standards Board (“FASB”) issued
Accounting Standards Update No. 2010-06, Improving Disclosures about Fair
Value Measurements. The Update provides amendments to FASB ASC 820-10 that
requires entities to disclose separately the amounts of significant transfers in
and out of Level 1 and Level 2 fair value measurements and describe the reasons
for the transfers. In addition, the Update requires entities to present
separately information about purchases, sales, issuances, and settlements in the
reconciliation for fair value measurements using significant unobservable inputs
(Level 3). The disclosures related to Level 1 and Level 2 fair value
measurements are effective for us in 2010 and the disclosures related to Level 3
fair value measurements are effective for us in 2011. The Update requires new
disclosures only, and will have no impact on our consolidated financial
position, results of operations, or cash flows.
Recently
Adopted Accounting Pronouncements
In
June 2009, the Financial Accounting Standards Board (“FASB”) issued SFAS
No. 168, The “FASB Accounting Standards Codification” and the Hierarchy of
Generally Accepted Accounting Principles. This standard replaces SFAS
No. 162, The Hierarchy of Generally Accepted Accounting Principles, and
establishes only two levels of U.S. GAAP, authoritative and non-authoritative.
The FASB Accounting Standards Codification (the “Codification”) will become the
source of authoritative, nongovernmental GAAP, except for rules and
interpretive releases of the SEC, which are sources of authoritative GAAP for
SEC registrants. All other non-grandfathered, non-SEC accounting literature not
included in the Codification will become non-authoritative. As the
Codification was not intended to change or alter existing GAAP, it had no impact
on our consolidated financial statements.
In
May 2009, the FASB issued guidance regarding the reporting of subsequent
events. This guidance is intended to establish general standards of accounting
for and disclosure of events that occur after the balance sheet date but before
financial statements are issued or are available to be issued. Specifically, it
sets forth the period after the balance sheet date during which management of a
reporting entity should evaluate events or transactions that may occur for
potential recognition or disclosure in the financial statements, the
circumstances under which an entity should recognize events or transactions
occurring after the balance sheet date in its financial statements, and the
disclosures that an entity should make about events or transactions that
occurred after the balance sheet date.
2.
Concentration of Credit Risk
The
Company has two client payor relationships that individually comprise a
significant portion of our revenue. The following is a summary of the
approximate amounts of the Company’s revenue and accounts receivable contributed
by each of these customers as of and for the years ended December
31:
|
2009
|
2008
|
||||||||||||||||
|
Accounts
Receivable
|
Revenue
|
%
of Total Revenue
|
Accounts
Receivable
|
Revenue
|
%
of Total Revenue
|
||||||||||||
|
Client
A
|
$
|
2,976
|
$
|
32,454
|
|
47
|
%
|
|
$
|
3,059
|
|
$
|
34,275
|
|
59
|
%
|
|
|
Client
B
|
|
3,478
|
|
|
25,897
|
|
38
|
|
|
2,369
|
|
|
22,688
|
|
39
|
||
|
All
Others
|
|
1,020
|
|
|
9,960
|
|
15
|
|
|
360
|
|
|
1,326
|
|
2
|
||
|
|
$
|
7,474
|
|
$
|
68,311
|
|
100
|
%
|
|
$
|
5,788
|
|
$
|
58,289
|
|
100
|
%
|
Client A
includes five entities and Client B includes two entities, which are aggregated
for this presentation. The Company contracted with these entities
from 2006 through 2009.
3.
Allowance for Doubtful Accounts
The
Company maintains an allowance for doubtful accounts which is provided for at
the time revenue is recognized. Co-payments, deductibles and
co-insurance payments can all impact the collectability of each individual claim
submitted to payors for payment. While the Company is able to process
a claim and estimate the cash it will receive from the payor for that claim, the
presence of co-pays, deductibles and co-insurance payments can affect the
ultimate collectability of the claim. The Company records an
allowance against gross revenue to better estimate
collectability. The allowance is applied specifically for each payor
and is adjusted to reflect the Company’s collection experience on a quarterly
basis.
The
following table summarizes the changes in the allowance for doubtful accounts
for the years ended December 31:
|
2009
|
2008
|
|||||||
|
Beginning
balance
|
$ | 200 | $ | 190 | ||||
|
Provisions
for losses - accounts receivable
|
— | 85 | ||||||
|
Deduction
for accounts charged off
|
(42 | ) | (75 | ) | ||||
|
Ending
balance
|
$ | 158 | $ | 200 | ||||
4.
Property and Equipment
Property
and equipment, net consists of the following:
|
Useful
Lives (years)
|
2009
|
2008
|
||||||||||
|
Computer
equipment
|
3-5
|
|
$
|
428
|
|
$
|
379
|
|
||||
|
Software
– purchased
|
3-5
|
|
|
434
|
|
|
329
|
|
||||
|
Software
– internally developed
|
5
|
1,164
|
536
|
|||||||||
|
Furniture
and fixtures
|
5
|
|
|
356
|
|
|
146
|
|
||||
|
Leasehold
improvements
|
7
|
|
|
205
|
|
|
40
|
|
||||
|
|
|
2,587
|
|
|
1,430
|
|
||||||
|
Accumulated
depreciation and amortization
|
|
|
(825
|
)
|
|
|
(515
|
)
|
||||
|
Property
and equipment, net
|
|
|
$
|
1,762
|
|
$
|
915
|
|
||||
5.
Income Taxes
Income
tax provision (benefit) for the years ended December 31 differed from the U.S.
federal income tax rate of 34% approximately in the amounts indicated as a
result of the following:
|
2009
|
2008
|
|||||||
|
Computed
“expected” tax provision
|
|
$
|
608
|
|
$
|
1,273
|
||
|
Change
in the valuation allowance for deferred tax assets
|
|
|
(1,199
|
)
|
|
|
(1,217
|
)
|
|
Change
in fair value of warrant derivative liability
|
|
|
(113
|
)
|
|
|
—
|
|
|
State
taxes
|
|
|
80
|
|
|
65
|
|
|
|
Other
|
|
|
91
|
|
|
|
(56
|
)
|
|
Total
income tax provision (benefit)
|
|
$
|
(533
|
)
|
|
$
|
65
|
|
Differences
between financial accounting principles and tax laws cause differences between
the bases of certain assets and liabilities for financial reporting purposes and
tax purposes.
The tax
effects of these differences, to the extent they are temporary, are recorded as
deferred tax assets and liabilities and consisted of the following
components:
|
2009
|
2008
|
|||||||
|
Deferred
tax assets:
|
|
|
|
|
|
|
||
|
Operating
loss carryforward
|
|
$
|
196
|
|
$
|
815
|
|
|
|
Accounts
receivable allowance
|
|
|
55
|
|
|
70
|
|
|
|
Warrants
|
|
|
229
|
|
|
176
|
|
|
|
Texas
tax credit carryforward
|
|
|
244
|
|
|
250
|
|
|
|
Stock
option compensation
|
|
|
911
|
|
|
395
|
|
|
|
Accrued
expenses
|
147
|
285
|
||||||
|
Alternative
Minimum Tax credit carryforwards
|
|
|
39
|
|
|
—
|
|
|
|
Total
deferred tax assets
|
|
|
1,821
|
|
|
1,991
|
|
|
|
Deferred
tax liabilities:
|
|
|
|
|
|
|
||
|
Goodwill
|
|
|
(442
|
)
|
|
|
(322
|
)
|
|
Fixed
assets
|
|
|
(456
|
)
|
|
|
(199
|
)
|
|
Prepaid
expense
|
|
|
(30
|
)
|
|
|
(21
|
)
|
|
Total
deferred tax liabilities
|
|
|
(928
|
)
|
|
|
(542
|
)
|
|
|
|
|
|
|
|
|
||
|
Net
deferred tax assets
|
|
|
893
|
|
|
1,449
|
||
|
Valuation
allowance
|
|
|
—
|
|
|
(1,199
|
)
|
|
|
Deferred
tax assets, net of valuation allowance
|
|
$
|
893
|
|
$
|
250
|
||
As of
December 31, 2009, based on the operating results achieved in 2008 and 2009, the
Company has determined that it is more likely than not that it will utilize its
existing deferred tax assets. Thus, the existing valuation allowance
of $1.2 million was eliminated during the year ended December 31,
2009.
As of
December 31, 2009, the net operating loss carryforward was approximately $4.1
million which expires in 2025 through 2027. Included in the net
operating loss carryforward is approximately $3.6 million which relates to the
excess tax benefits for stock options and warrants exercised which will result
in a credit into additional paid-in capital of approximately $1.2 million when
the associated tax deduction results in a reduction in income taxes
payable.
The
income tax expense (benefit) shown on the statement of operations for the years
ended December 31, 2009 and 2008 consisted of the following:
|
2009
|
2008
|
|||||||
|
Current
|
|
$
|
110
|
|
|
$
|
53
|
|
|
Deferred
|
|
|
(643
|
)
|
|
|
12
|
|
|
|
|
$
|
(533
|
)
|
|
$
|
65
|
|
The
Company has identified the United States and Texas as major tax jurisdictions
which remain open to examination for periods subsequent to December 31,
2005.
6.
Goodwill and Intangible Assets
Goodwill
is evaluated for impairment annually as of December or more frequently if
impairment indicators arise. An impairment loss is recognized to the
extent that the carrying amount exceeds the asset’s fair value. As of
December 31, 2009 and 2008, we have determined that no impairment of goodwill
exists.
Intangible
assets consist of provider contracts and internally developed claims payment and
billing software. Each of these items is being amortized using the
straight-line method over its expected useful life of 5 years for the software
and 15 years for the provider contracts. Our experience to date is
that we have approximately 2-4% annual turnover or attrition of provider
contracts. The provider contracts are being accounted for on a pooled
basis and the actual cancellation rates of provider contracts that were acquired
are monitored for potential impairment or amortization adjustment, if
warranted. As of December 31, 2009, there were no indicators of
impairment of these intangible assets. The cost of adding additional
providers is considered an ongoing operating expense.
The
following is a summary of our intangible assets as of December 31 for the years
presented:
|
2009
|
2008
|
|||||||
|
Provider
contracts
|
|
$
|
1,921
|
|
$
|
1,921
|
||
|
Software
|
|
|
428
|
|
|
|
428
|
|
|
|
|
2,349
|
|
|
2,349
|
|||
|
Accumulated
amortization
|
|
|
(1,196
|
)
|
|
|
(1,068
|
)
|
|
Acquisition
intangibles, net
|
|
$
|
1,153
|
|
$
|
1,281
|
||
Amortization
expense was approximately $128,000 and $214,000 for the years ended December 31,
2009 and 2008, respectively. Amortization expense is estimated at
$128,000 per year through 2018.
7.
Commitments and Contingencies
The
Company leases certain equipment and office space under non-cancelable lease
agreements, which expire at various dates through April 2013.
At
December 31, 2009 minimum annual lease payments for operating leases are
approximately as follows:
|
Operating
Leases
|
||
|
2010
|
|
421
|
|
2011
|
|
423
|
|
2012
|
|
412
|
|
2013
|
104
|
|
|
|
|
|
|
Total
minimum lease payments
|
$
|
1,360
|
Rent
expense related to operating leases was approximately $342,000 and $154,000 for
the years ended December 31, 2009 and 2008, respectively.
8.
Stock-Based Compensation
Stock
Options
American
CareSource Holdings, Inc. has an Employee Stock Option Plan (the “Stock Option
Plan”) for the benefit of certain employees, non-employee directors, and key
advisors. On May 16, 2005, the stockholders approved the 2005 Stock
Option Plan which (i) authorized options to purchase 2,249,329 shares and (ii)
established the class of eligible participants to include employees, nominees to
the Board of Directors of American CareSource Holdings and consultants engaged
by American CareSource Holdings, limited to 50,000 the number of shares of
Common Stock underlying the one-time grant of a Non-Qualified Option to which
non-employee directors or non-employee nominees of the Board of Directors may be
entitled. The Company filed a registration statement on Form S-8
registering the issuance of 2,249,329 of the Stock Option Plan shares on April
7, 2006. Stock options granted under the Stock Option Plan may be of two
types: (1) incentive stock options and (2) nonqualified stock
options. The option price of such grants shall be determined by a
Committee of the Board of Directors (the “Committee”), but shall not be less
than the estimated fair value of the common stock at the date the option is
granted. The Committee shall fix the terms of the grants with no
option term lasting longer than ten years. The ability to exercise
such options shall be determined by the Committee when the options are
granted.
On May
24, 2007, the Company amended the Stock Option Plan to increase the maximum
number of shares of Common Stock that may be issued pursuant to the Stock Option
Plan. The American CareSource Holdings, Inc. Amended and Restated
2005 Stock Option Plan (the “Amended and Restated Plan”) increased the shares
available for issue under the Stock Option Plan by 1,000,000 shares to a total
of 3,249,329 shares. The Company filed a registration statement on
Form S-8 registering the issuance of the additional shares on June 14,
2007.
In
November 2008, the Company again amended the Plan to increase the number of
shares under the plan by 500,000 to a total of 3,749,329 shares, which amendment
was approved by the stockholders of the Company on May 19, 2009.
On May
19, 2009, the stockholders of the Company approved the 2009 Equity Incentive
Plan (the “2009 Plan”). The purpose of the 2009 Plan is (a) to allow
selected employees and officers of the Company to acquire and increase equity
ownership in the Company, which will strengthen their commitment to the success
of the Company, and to attract new employees, officers and consultants, (b) to
provide annual cash incentive compensation opportunities that are competitive
with other peer corporations, (c) to optimize the profitability and growth of
the Company through incentives that are consistent with the Company’s goals, (d)
to provide grantees an incentive for individual excellence, (e) to promote
teamwork and (f) to attract and retain highly-qualified persons to serve as
non-employee directors. The Company filed a registration statement on
Form S-8 registering the issuance of the 1,500,000 shares of the 2009 Plan on
May 21, 2009. The 2009 Plan allows for awards of non-qualified options, stock
appreciation rights, restricted shares, performance units/shares, deferred
stock, dividend equivalents and other stock-based awards. The term of
the 2009 Plan is ten years and all non-qualified options will be valued at not
less than 100% of the market value of the Company’s stock on the date of
grant.
Shares of
common stock reserved for future grants under the Stock Option Plan and the 2009
Plan (the “Plans”) were 1,590,178 and 393,292 at December 31, 2009 and 2008,
respectively.
Compensation
expense related to all equity awards, including non-qualified stock options and
restricted stock units, that has been charged against income for the years ended
December 31, 2009 and 2008 was approximately $1.5 million and $699,000,
respectively.
The
awards granted to employees and non-employee directors become exercisable over
periods of one to five years. The fair value of each option award
granted is estimated on the date of grant using the Black-Scholes-Merton
valuation model that uses the assumptions noted in the following
table. Volatility is calculated using an analysis of historical
volatility. The Company believes that the historical volatility of
the Company’s stock is the best method for estimating future
volatility. The expected lives of options are determined based on the
Company’s historical share option exercise experience. The Company
believes the historical experience method is the best estimate of future
exercise patterns currently available. The risk-free interest rates
are determined using the implied yield currently available for zero-coupon U.S.
government issues with a remaining term equal to the expected life of the
options. The expected dividend yields are based on the approved
annual dividend rate in effect and current market price of the underlying common
stock at the time of grant.
|
2009
|
2008
|
|||
|
Weighted
average grant date fair value
|
|
$3.87
|
|
$2.82
|
|
Weighted
average assumptions used
|
|
|
|
|
|
Expected
volatility
|
|
69.8%
|
|
65.8%
|
|
Expected
lives
|
|
6.4
years
|
|
5.3
years
|
|
Risk
free interest rate
|
|
2.6%
|
|
2.7%
|
|
Forfeiture
rate
|
|
24.3%
|
|
24.3%
|
|
Dividend
rate
|
—
|
—
|
A summary
of stock option activity is as follows:
|
Options
|
Weighted-Average
Exercise Price
|
||||
|
Outstanding
at December 31, 2007
|
|
2,001
|
|
$1.41
|
|
|
|
|
|
|
|
|
|
Granted
|
|
1,115
|
|
$4.88
|
|
|
|
|
|
|
||
|
Forfeited
|
|
(60
|
)
|
$2.82
|
|
|
|
|
|
|
|
|
|
Exercised
|
|
(701
|
)
|
$0.65
|
|
|
|
|
|
|
|
|
|
Outstanding
at December 31, 2008
|
|
2,355
|
|
$3.25
|
|
|
|
|
|
|
|
|
|
Granted
|
|
450
|
|
$5.96
|
|
|
|
|
|
|
||
|
Forfeited
|
|
(167
|
)
|
$3.68
|
|
|
Cancelled
|
(130
|
)
|
$7.02
|
||
|
|
|
|
|
|
|
|
Exercised
|
|
(20
|
)
|
$2.47
|
|
|
|
|
||||
|
Outstanding
at December 31, 2009
|
|
2,488
|
$3.52
|
||
|
Exercisable
at December 31, 2009
|
1,415
|
$2.38
|
|||
As of
December 31, 2009, the weighted average remaining contractual life of the
options outstanding was 7.7 years and the weighted average remaining contractual
life of the outstanding exercisable options was 7.0 years.
The
following table summarizes information concerning outstanding and exercisable
options at December 31, 2009:
|
Options
Outstanding
|
Options
Exercisable
|
|||||||||
|
Range
of Exercise Price
|
Number
Outstanding
|
Weighted
Average Outstanding Contractual Life
|
Weighted
Average Exercise Price
|
Number
Exercisable
|
Weighted
Average Exercise Price
|
|||||
|
Under
$1.00
|
|
438
|
|
5.4
|
$0.34
|
|
438
|
|
$0.34
|
|
|
$1.00
- $2.00
|
|
386
|
|
7.3
|
$1.86
|
|
369
|
|
$1.86
|
|
|
$2.01
- $3.00
|
|
311
|
|
8.2
|
$2.57
|
|
148
|
|
$2.60
|
|
|
$3.01
- $4.00
|
|
436
|
|
8.1
|
$3.38
|
|
238
|
|
$3.40
|
|
|
$4.01
- $5.00
|
|
308
|
|
8.7
|
$4.32
|
|
60
|
|
$4.19
|
|
|
$5.01
- $6.00
|
|
50
|
|
6.1
|
$5.60
|
|
50
|
|
$5.60
|
|
|
$6.01
- $7.00
|
|
238
|
|
8.9
|
$6.88
|
|
60
|
|
$6.88
|
|
|
Greater
than $7.01
|
|
321
|
|
9.0
|
$7.36
|
|
52
|
|
$7.53
|
|
The total
intrinsic value of options outstanding at December 31, 2009 and 2008 was
approximately $1.1 million and $9.0 million, respectively. The total
intrinsic value of the options that are exercisable at December 31, 2009 and
2008 was approximately $1.1 million and $5.3 million,
respectively. The total intrinsic value of options exercised during
the year ended December 31, 2009 and 2008 was approximately $82,000 and $2.6
million, respectively.
As of
December 31, 2009, there was approximately $2.3 million of total unrecognized
compensation cost related to non-vested non-qualified stock options granted
under the plan. The cost is expected to be recognized over a weighted
average period of 2.9 years.
Restricted
Stock Units
Under the
2009 Plan, the Company issued restricted stock units (“RSUs”) to certain
employees and the Board of Directors during the twelve months ended December 31,
2009. As RSUs vest, they are convertible into shares of the Company’s
common stock. The RSUs are valued at the market price of the
Company’s stock on the measurement date, which is the date of
grant. Our forfeiture rate on RSUs is 0% as the RSUs have been
awarded primarily to members of our Board of Directors and members of senior
management of the Company.
A summary
of RSU activity is as follows:
|
RSUs
|
Weighted-Average
Fair Value
|
||||
|
|
|
|
|
|
|
|
Outstanding
at December 31, 2008
|
|
—
|
|
$—
|
|
|
|
|
|
|
|
|
|
Granted
|
|
154
|
|
$7.00
|
|
|
|
|
|
|
|
|
|
Forfeited
|
|
(4
|
)
|
$7.02
|
|
|
|
|
|
|
|
|
|
Converted
to common stock
|
|
(10
|
)
|
$7.02
|
|
|
|
|
||||
|
Outstanding
at December 31, 2009
|
|
140
|
$6.99
|
||
|
Vested
and convertible to common stock at December 31, 2009
|
32
|
$7.02
|
Compensation
expense related to RSUs charged to operations during 2009 was approximately
$319,000. Compensation expense is recognized ratably over the vesting
period. As of December 31, 2009, there was approximately $707,000 of
total unrecognized compensation cost related to non-vested RSUs granted under
the plan.
9.
Earnings per Share
Basic
earnings per share is computed by dividing net income by the weighted average
number of shares of common stock outstanding during the year. Diluted earnings
per share reflects the potential dilution that could occur if options, warrants
and restricted stock units to purchase common stock were exercised or converted.
For purposes of this calculation, outstanding stock options, stock warrants and
restricted stock units are considered common stock equivalents using the
treasury stock method, and are the only such equivalents
outstanding. 1.3 million options, 325,000 warrants and 151,000 RSUs
were excluded from the calculation as their impact would be
anti-dilutive.
Basic
earnings and diluted earnings per share data were computed as
follows:
|
2009
|
2008
|
|||||
|
Numerator:
|
|
|
|
|
|
|
|
Net
income for basic earnings per share
|
$
|
2,320
|
$
|
3,638
|
|
|
|
Less:
|
||||||
|
Change
in fair value of warrant derivative liability
|
324
|
—
|
||||
|
Net
income for diluted earnings per share
|
$
|
1,996
|
$
|
3,638
|
||
|
Denominator:
|
|
|
|
|
|
|
|
Weighted-average
basic common shares outstanding
|
|
15,469
|
|
15,084
|
|
|
|
Assumed
conversion of dilutive securities:
|
|
|
|
|
|
|
|
Stock
options
|
|
691
|
|
1,003
|
|
|
|
Warrants
|
1,602
|
1,649
|
||||
|
Restricted
stock units
|
|
2
|
|
—
|
|
|
|
Potentially
dilutive common shares
|
|
2,295
|
|
2,652
|
|
|
|
Denominator
for diluted earnings per share – Adjusted weighted-average
shares
|
|
17,764
|
|
17,736
|
|
|
|
Earnings
per common share:
|
|
|
|
|
|
|
|
Basic
|
$
|
0.15
|
$
|
0.24
|
|
|
|
Diluted
|
$
|
0.11
|
$
|
0.21
|
||
10.
Stock Warrants
In
January 2005, the Company issued Series A warrants to purchase 1,096,491 shares
of common stock to two directors of the Company in exchange for a guarantee of
the Company’s $3.0 million line of credit. In addition, in August
2005, we issued Series B warrants to purchase 641,059 shares of common stock to
two directors and a stockholder of the Company to increase the associated line
of credit. The total number of warrants issued in exchange for the
guarantee of debt was 1,737,550. Under the Black-Scholes Merton value
method, the warrants were valued at approximately $377,000 as of the dates of
the grants using the fair value method. The exercise price of these
warrants ranges from $0.40 - $0.49. These deferred debt issuance
costs were amortized to expense over the life of the guarantee.
The
Company also issued warrants to purchase up to 159,952 shares of common stock
with an exercise price of $5.50, in connection with the Private Placement
financing completed in March of 2006, to Laidlaw as part of their compensation
for the financing. The warrants were valued at approximately $464,000
as of the date of the grant using the Black-Scholes Merton fair value method. In
September 2008, additional accounting guidance was issued relating to
determining whether an instrument (or embedded feature) is indexed to entity’s
own stock. The guidance mandates a two-step process for evaluating
whether an equity-linked financial instrument or embedded feature is indexed to
the entity’s own stock. Warrants to purchase 109,095 shares of common
stock issued by the Company contain a strike price adjustment feature, which
upon adoption, resulted in the instruments no longer being considered indexed to
the Company’s own stock. Accordingly, adoption changed the current
classification (from equity to liability) and the related accounting for these
warrants outstanding as of January 1, 2009. As of that date, we
reclassified the warrants, based on a fair value of $3.43 per warrant, as
calculated using the Black–Scholes–Merton valuation model. During
2009, the liability was adjusted for warrants exercised and the change in fair
value of the warrants. A liability of approximately $18,000 related
to the stock warrants is included as a warrant derivative liability in our
consolidated balance sheet as of December 31, 2009. During 2009, we
recorded an unrealized gain of approximately $324,000 related to the change in
fair value of the warrants.
On July
2, 2007, the Company announced that it had signed an Ancillary Care Services
Network Access Agreement (the “Ancillary Care Services Agreement”) effective as
of May 21, 2007 (the “Effective Date”) with a new customer, Texas True Choice,
Inc. (“Texas True Choice”), a Texas-based preferred provider organization
network, and certain subsidiaries of Texas True Choice. As partial compensation
to Texas True Choice under the Ancillary Care Services Agreement, the Company
issued to Corporate Health Plans of America, Inc., an affiliate of Texas True
Choice, warrants to purchase a total of 225,000 shares of the Company’s common
stock at an exercise price of $1.84, the closing price of the common stock of
the Company as reported on the American Stock Exchange on the Effective Date.
The Company is valuing the warrants when a measurement dates is reached which is
based on the cancellation notice that is required under the
agreement. Utilizing the Black-Scholes Merton valuation method,
112,500 warrants were valued at $0.94 in 2007, 56,250 warrants were valued at
$2.87 at June 2008 and the remaining 56,250 were valued at $5.53 in June
2009.
The
Company recorded the value of warrants as deferred costs as they vest and is
amortizing the deferred costs over the related contract
term. These warrants vested as to 25% of the shares on
the Effective Date, shall vest an additional 25% on each anniversary date of the
Effective Date, and have an expiration date of May 20, 2012. In the event of an
early termination of the Ancillary Care Services Agreement, the warrants
terminate with respect to all unvested shares at the time of such early
termination. As of December 31, 2009, the total unrecognized cost
related to non-vested warrants of approximately $267,000 was included as Prepaid
and Other Current Assets and Other Assets. These warrants expire five
years after issuance. The weighted average remaining life of the
warrants is 0.5 years
A summary
of stock warrant activity is as follows:
|
Outstanding
Warrants
|
Weighted-Average
Exercise Price
|
|||
|
Outstanding
at December 31, 2007
|
2,123
|
|
$0.96
|
|
|
|
|
|
|
|
|
Exercised
|
(57
|
)
|
$5.06
|
|
|
|
|
|
|
|
|
Outstanding
at December 31, 2008
|
2,066
|
|
$0.85
|
|
|
|
|
|
|
|
|
Exercised
|
(239
|
)
|
$0.60
|
|
|
|
|
|
|
|
|
Outstanding
at December 31, 2009
|
1,827
|
|
$0.89
|
|
|
Vested
at December 31, 2009
|
1,771
|
$0.86
|
On
January 22, 2010, warrants to purchase approximately 872,000 shares of the
Company’s common stock were exercised, through a cashless net
exercise. 727,498 shares of common stock were issued as a result of
the exercise. The exercise price of the warrants was $0.40 per
share.
11.
Fair Value of Warrant Derivative Liability
The
warrant derivative liability recorded at fair value on the balance sheet as of
December 31, 2009 is categorized based upon the level of judgment associated
with the inputs used to measure their fair value. Hierarchical
levels, are directly related to the amount of subjectivity associated with the
inputs to fair valuation of these liabilities is as follows:
Level 1 —
Inputs are unadjusted, quoted prices in active markets for identical assets or
liabilities at the measurement date;
Level 2 —
Inputs other than Level 1 inputs that are either directly or indirectly
observable; and
Level 3 —
Unobservable inputs, for which little or no market data exist, therefore
requiring an entity to develop its own assumptions.
The
following table summarizes the financial liabilities measured at fair value on a
recurring basis as of December 31, 2009, segregated by the level of the
valuation inputs within the fair value hierarchy utilized to measure fair value
(amounts in thousands):
|
Total
|
Quoted
prices in active markets for identical assets
(Level 1)
|
Significant
other observable inputs
(Level 2)
|
Significant
unobservable inputs
(Level 3)
|
||||||||||||
|
Warrant
derivative liability
|
$
|
18
|
$
|
—
|
$
|
—
|
$
|
18
|
|||||||
Equity-linked
financial instruments consist of stock warrants issued by the Company that
contain a strike price adjustment feature. We calculated the fair
value of the warrants using the Black–Scholes–Merton valuation
model. During 2009, we recognized an unrealized gain of approximately
$324,000 related to the change in the fair value of the warrant derivative
liability.
The
assumptions used in the Black-Scholes-Merton valuation model were as
follows:
|
January
1,
|
December
31,
|
|||||||
|
2009
|
2009
|
|||||||
|
Exercise
price
|
$
|
5.50
|
$
|
5.50
|
||||
|
Expected
volatility
|
73.4
|
%
|
68.9
|
%
|
||||
|
Expected
life (years)
|
2.13
|
1.17
|
||||||
|
Risk
free interest rate
|
0.8
|
%
|
0.6
|
%
|
||||
|
Forfeiture
rate
|
—
|
—
|
||||||
|
Dividend
rate
|
—
|
—
|
||||||
The
following table reflects the activity for liabilities measured at fair value
using Level 3 inputs for the year ended December 31, 2009:
|
Initial
recognition of warrant derivative as of January 1, 2009
|
$
|
374
|
||
|
Sales
of warrant derivative
|
(32
|
)
|
||
|
Unrealized
gains related to the change in fair value
|
(324
|
)
|
||
|
Balance
as of December 31, 2009
|
$
|
18
|
12.
Significant Client Agreements
On
December 31, 2008, we entered into an amendment (the “Amendment”) to our
Provider Service Agreement with one of our significant clients.
The
purpose of the Amendment is, among other things, to facilitate and accelerate
the integration into the Company’s business model of one of the client’s
affiliates, adjust the administrative fees outlined in the previous amendment,
define and clarify the exclusivity and levels of cooperation contemplated by the
previous amendments, and extend the partnership between the Company and the
client and the duration of their Provider Service Agreement to December 31,
2012. Under a strategic contracting plan that the Amendment requires
the parties to develop, the Company will be the exclusive outsourced ancillary
contracting and network management provider for the client’s group health
clients and any third party administrators (TPAs).
As part
of the Amendment, the Company agreed to pay to the client $1.0 million for costs
incurred in connection with the integration of and access to the Company’s
network by members of the affiliate’s network, including, but not limited to,
costs associated with salaries, benefits, and third party
contracts. The Amendment specifies that payment of such amount
will be made within 90 days of December 31, 2008. The Company will
continue to pay a service fee to the client designed to reimburse and compensate
for the work that it is required to perform to support the Company’s
program. The Company has recognized the $1.0 million fee as a prepaid
expense which will be amortized over the term of the
agreement. During 2009, we recorded amortization related to the
agreement of $250,000. At December 31, 2009, $250,000 was classified
as a current asset on the consolidated balance sheet representing the amount to
be amortized during the subsequent twelve-month period. The remaining
$500,000 balance was classified as a long-term other asset at December 31,
2009.
13.
Employee Benefit Plans
We
provide a defined contribution plan for our employees meeting minimum service
requirements. Employees can contribute up to 100% of their current
compensation to the plan subject to certain statutory limitations. We
contribute up to a maximum of 3.5% of an employee’s compensation and plan
participants are fully-vested in the Company’s contributions
immediately. We made contributions to the plan and charged operations
approximately $121,000 and $39,000 during the years ended December 31, 2009 and
2008.
14.
Subsequent Events
On
January 26, 2010, James T. Robinson resigned from his position of Senior
Vice-President of Sales and Marketing.
On March
3, 2010, Steven J. Armond resigned from his position of Chief Financial
Officer.
On March
15, MultiPlan, Inc. announced that it acquired Viant, Inc.
(“Viant”). Viant, and its affiliates, accounted for 38% of our total
revenue in 2009.
15.
Quarterly Financial Information (unaudited)
The
following table contains selected financial information from unaudited
statements of operations for each quarter of 2009 and 2008.
|
Quarters
Ended
|
|||||||||||||||||||||||
|
2009
|
2008
|
||||||||||||||||||||||
|
Dec.
31
|
Sept.
30
|
June
30
|
Mar.
31
|
Dec.
31
|
Sept.
30
|
June
30
|
Mar.
31
|
||||||||||||||||
|
Net
revenues
|
$
|
16,886
|
|
$
|
18,235
|
|
$
|
17,135
|
|
$
|
16,055
|
|
$
|
17,660
|
|
$
|
16,111
|
|
$
|
13,012
|
|
$
|
11,506
|
|
Contribution
margin
|
|
2,520
|
|
|
2,356
|
|
|
2,346
|
|
|
2,300
|
|
|
2,873
|
|
|
2,556
|
|
|
1,902
|
|
|
1,705
|
|
Contribution
margin %
|
14.9
|
12.9
|
13.7
|
14.3
|
16.2
|
15.9
|
14.6
|
14.8
|
|||||||||||||||
|
Income
before income taxes
|
|
770
|
|
|
168
|
|
|
547
|
|
|
302
|
|
|
1,498
|
|
|
1,028
|
|
|
640
|
|
|
538
|
|
Net
income
|
|
1,360
|
|
|
147
|
|
|
534
|
|
|
279
|
|
|
1,495
|
|
|
1,001
|
|
|
621
|
|
|
521
|
|
Earnings
per diluted share
|
|
0.07
|
|
|
0.01
|
|
|
0.01
|
|
|
0.02
|
|
|
0.08
|
|
|
0.06
|
|
|
0.04
|
|
|
0.03
|
|
Shares
used in computing diluted earnings per share
|
|
17,140
|
|
|
17,573
|
|
|
18,055
|
|
|
18,287
|
|
|
18,208
|
|
|
18,045
|
|
|
17,435
|
|
|
17,225
|
SIGNATURES
Pursuant
to the requirements of Section 13 or 15(d) of the Securities Exchange Act of
1934, the Registrant has duly caused this report to be signed on its behalf by
the undersigned, thereunto duly authorized.
|
AMERICAN
CARESOURCE HOLDINGS, INC.
|
||
|
By:
/s/ David S. Boone
|
March
25, 2010
|
|
|
David
S. Boone
Chief
Executive Officer
Director
(Principal
Executive Officer)
|
Date
|
|
|
Pursuant
to the requirements the Securities Exchange Act of 1934, this report has
been signed below by the following persons on behalf of the Registrant and
in the capacities and on the dates indicated.
|
||
|
By:
/s/ Kenneth S. George
|
March
26, 2010
|
|
|
Kenneth
S. George
Chairman
of the Board of Directors
|
Date
|
|
|
By:
/s/ David S. Boone
|
March
25, 2010
|
|
|
David
S. Boone
Chief
Executive Officer
Director
(Principal
Executive Officer)
|
Date
|
|
|
By:
/s/ Matthew D. Thompson
|
March
25, 2010
|
|
|
Matthew
D. Thompson
Vice
President of Finance and Interim Chief Financial Officer
(Principal Financial Officer
and Principal Accounting Officer)
|
Date
|
|
|
By:
/s/ Sami
S. Abbasi
|
March
25, 2010
|
|
|
Sami
S. Abbasi
Director
|
Date
|
|
|
By:
/s/ Edward
B. Berger
|
March
25, 2010
|
|
|
Edward
B. Berger Director |
Date
|
|
|
By:
/s/ John N. Hatsopoulos
|
March
25, 2010
|
|
|
John
N. Hatsopoulos
Director
|
Date
|
|
|
By:
/s/ Derace L. Schaffer
|
March
26, 2010
|
|
|
Derace
L. Schaffer
Director
|
Date
|
|
|
By:
/s/ John Pappajohn
|
March
26, 2010
|
|
|
John
Pappajohn
Director
|
Date
|
|
|
By:
/s/ John W. Colloton
|
March
25, 2010
|
|
|
John
W. Colloton
Director
|
Date
|
EXHIBIT
INDEX
|
Exhibit
#
|
Description
of Exhibits
|
|
3.1(1)
|
Certificate
of Incorporation of American CareSource Holdings, Inc.
|
|
3.2(1)
|
By-Laws
|
|
3.3(2)
|
Amendment
to the Certificate of Incorporation of American CareSource Holdings, Inc.,
dated May 25, 2005
|
|
3.4(2)
|
Amendment
to the Certificate of Incorporation of American CareSource Holdings, Inc.,
dated June 2, 2005
|
|
3.5(3)
|
Amendment
to the Certificate of Incorporation of American CareSource Holdings, Inc.,
dated November 14, 2005
|
|
3.6(4)
|
Certificate
of Incorporation of Ancillary Care Services – Group Health,
Inc.
|
|
3.7(4)
|
Certificate
of Incorporation of Ancillary Care Services – Medicare,
Inc.
|
|
3.8(4)
|
Certificate
of Incorporation of Ancillary Care Services – Worker’s Compensation,
Inc.
|
|
3.9(4)
|
Certificate
of Incorporation of Ancillary Care Services, Inc.
|
|
4.1(6)
|
Amended
and Restated 2005 Stock Option Plan
|
|
4.2(2)
|
Specimen
Stock Certificate
|
|
10.03(7)*+
|
Employment
Agreement dated September 1, 2006 between American CareSource Holdings,
Inc. and Kurt Fullmer
|
|
10.04(7)*+
|
Employment
Agreement dated February 19, 2007 between American CareSource Holdings,
Inc. and Maria Baker
|
|
10.05(7)*+
|
Employment
Agreement dated February 19, 2007 between American CareSource Holdings,
Inc. and Jennifer Boone
|
|
10.06(9)*+
|
Employment
Agreement dated October 12, 2007 between American CareSource Holdings,
Inc. and Steven J. Armond
|
|
10.07(8)*+
|
Separation
Agreement and General Release dated July 12, 2007 between American
CareSource Holdings, Inc. and Wayne Schellhammer
|
|
10.08*+
|
Employment
Letter dated January 29, 2008 between American CareSource Holdings, Inc.
and Cornelia Outten
|
|
10.09*+
|
Employment
Letter dated March 6, 2008 between American CareSource Holdings, Inc. and
Rost Ginevich
|
|
10.10(4)
|
Form
of Registration Rights Agreement used in March 2006 private
placement
|
|
10.11(4)
|
Form
of Subscription Agreement used in March 2006 private
placement
|
|
10.12(4)
|
Amended
and Restated Stock Purchase Warrant dated March 30, 2006 by and between
American CareSource Holdings, Inc. and John Pappajohn (amends Stock
Purchase Warrant dated January 27, 2005).
|
|
10.13(4)
|
Amended
and Restated Stock Purchase Warrant dated March 29, 2006 by and between
American CareSource Holdings, Inc. and Derace L. Schaffer (amends Stock
Purchase Warrant dated January 27, 2005).
|
|
10.14(4)
|
Amended
and Restated Stock Purchase Warrant dated March 29, 2006 by and between
American CareSource Holdings, Inc. and John Pappajohn (amends Stock
Purchase Warrant dated August 15, 2005).
|
|
10.15(4)
|
Amended
and Restated Stock Purchase Warrant dated March 29, 2006 by and between
American CareSource Holdings, Inc. and Derace L. Schaffer (amends Stock
Purchase Warrant dated August 15, 2005).
|
|
10.16(4)
|
Amended
and Restated Stock Purchase Warrant dated March 30, 2006 by and between
American CareSource Holdings, Inc. and Matthew P. Kinley (amends Stock
Purchase Warrant dated August 15, 2005).
|
|
10.17(5)
|
Lease
dated June 14, 2006, between American CareSource Holdings, Inc. and TR LBJ
Campus Partners, L.P.
|
|
10.18(10)
|
First
Amendment to Office Lease, dated December 1, 2008, between American
CareSource Holdings, Inc. and TR LBJ Campus Partners,
L.P.
|
|
10.19(10),
***
|
Provider
Services Agreement, dated as of August 1, 2002, by and among the Company,
HealthSmart Holdings, Inc. and HealthSmart Preferred Care II, L.P, and
Amendment No. 1, 3 and 4 thereto, dated January 1, 2007, July 31, 2007 and
December 20, 2008, respectively.
|
|
10.20(10),
*+
|
Employment
Letter dated November 10, 2008 between American CareSource Holdings, Inc.
and James T. Robinson.
|
|
10.21(10),***
|
Ancillary
Care Services Network Access Agreement, dated as of July 2, 2007, by and
between the Company and Texas True Choice, Inc. and its
subsidiaries.
|
|
10.22+
|
Letter
Agreement dated December 24, 2009 by and between American CareSource
Holdings, Inc. and James T. Robinson.
|
|
10.23+
|
Letter
Agreement dated November 4, 2009 by and between American CareSource
Holdings, Inc. and Steven J. Armond.
|
|
14.1(4)
|
Code
of Ethics
|
|
20.1(5)
|
Governance
and Nominating Committee Charter
|
|
20.2(5)
|
Audit
Committee Charter
|
|
20.3(5)
|
Compensation
Committee Charter
|
|
21.1
|
Subsidiaries
|
|
23.1
|
Consent
of McGladrey & Pullen LLP
|
|
31.1
|
Certification
of the Chief Executive Officer pursuant to Section 302 of the
Sarbanes-Oxley Act of 2002.
|
|
31.2
|
Certification
of the Chief Financial Officer pursuant to Section 302 of the
Sarbanes-Oxley Act of 2002.
|
|
32.1
|
Certification
pursuant to Section 906 of the Sarbanes-Oxley Act of
2002.
|
*
Designates a management contract or compensatory plan or arrangement required to
be filed as an exhibit to this report pursuant to Item 15(a)(3) of this
report.
** Filed
herewith
***
Certain confidential portions of this exhibit have been omitted and filed
separately with the Securities and Exchange Commission pursuant to a request for
confidential treatment under Rule 24b-2 of the Securities Exchange Act of
1934.
+ Management
contract or compensatory plan or arrangement.
|
(1)
|
Previously
filed with the Securities and Exchange Commission as an exhibit to
Amendment No. 1 to the Form SB-2 filed May 13, 2005 and incorporated
herein byreference.
|
|
(2)
|
Previously
filed with the Securities and Exchange Commission as an exhibit to
Amendment No. 5 to the Form SB-2 filed August 12, 2005 and incorporated
herein by reference.
|
|
(3)
|
Previously
filed with the Securities and Exchange Commission as an exhibit to
Amendment No. 8 to the Form SB-2 filed November 18, 2005 and
incorporated herein by reference.
|
|
(4)
|
Previously
filed with the Securities and Exchange Commission as an exhibit to the
Form 10-KSB filed March 31, 2006 and incorporated herein by
reference.
|
|
(5)
|
Previously
filed with the Securities and Exchange Commission as an exhibit to the
Form 10-QSB filed August 11, 2006 and incorporated herein by
reference.
|
|
(6)
|
Previously
filed with the Securities and Exchange Commission as Exhibit A to
Amendment No. 1 to the Proxy Statement for the 2007 Annual Meeting of
Stockholders filed May 1, 2007 and incorporated herein by
reference.
|
|
(7)
|
Previously
filed with the Securities and Exchange Commission as an exhibit to the
Form 10-QSB filed May 15, 2007 and incorporated herein by
reference.
|
|
(8)
|
Previously
filed with the Securities and Exchange Commission as an exhibit to the
Form 8-K filed July 17, 2007 and incorporated herein by
reference.
|
|
(9)
|
Previously
filed with the Securities and Exchange Commission as an exhibit to the
Form 10-QSB filed November 13, 2007 and incorporated herein by
reference.
|
|
(10)
|
Previously
filed with the Securities and Exchange Commission as an exhibit to the
Form 10-K filed March 31, 2009 and incorporated herein by
reference.
|