Attached files
| file | filename |
|---|---|
| EX-32.1 - EXHIBIT 32.1 - ASTEA INTERNATIONAL INC | ex32-1.htm |
| EX-21.1 - EXHIBIT 21.1 - ASTEA INTERNATIONAL INC | ex21-1.htm |
| EX-31.2 - EXHIBIT 31.2 - ASTEA INTERNATIONAL INC | ex31-2.htm |
| EX-31.1 - EXHIBIT 31.1 - ASTEA INTERNATIONAL INC | ex31-1.htm |
| EX-23.1 - EXHIBIT 23.1 - ASTEA INTERNATIONAL INC | ex23-1.htm |
| EX-32.2 - EXHIBIT 32.2 - ASTEA INTERNATIONAL INC | ex32-2.htm |
`UNITED STATES
SECURITIES AND EXCHANGE COMMISSION
Washington, D.C. 20549
___________________________________________
FORM 10-K
(Mark One)
[X] Annual Report Pursuant to Section 13 or 15(d) of The Securities Exchange Act of 1934.
For The Fiscal Year Ended: December 31, 2009
or
[ ] Transition Report Pursuant to Section 13 or 15(d) of The Securities Exchange Act of 1934.
For the transition period from _______ to ________
Commission File Number: 0-26330
ASTEA INTERNATIONAL INC.
(Exact name of registrant as specified in its charter)
|
Delaware
|
23-2119058
|
|
(State or other jurisdiction of
|
(I.R.S. Employer
|
|
incorporation or organization)
|
Identification No.)
|
|
240 Gibraltar Road, Horsham, Pennsylvania
|
19044
|
|
(Address of principal executive offices)
|
(Zip Code)
|
|
Registrant’s telephone number, including area code: (215) 682-2500
|
Securities registered pursuant to Section 12(b) of the Exchange Act:
|
Title of Each Class
|
|
Name of Each Exchange on Which Registered
|
|
Common Stock, $0.01 Par Value Per Share
|
|
The NASDAQ Stock Market LLC
|
Securities registered pursuant to Section 12(g) of the Exchange Act: NONE
Indicate by checkmark if the registrant is a well-known seasoned issuer, as defined in Rule 405 of the Securities Act.
Yes _ No X
Indicate by checkmark if the registrant is not required to file reports pursuant to Section 13 or Section 15(d) of the Act. Yes _ No X
Indicate by check mark whether the registrant (1) has filed all reports required to be filed by Section 13 or 15(d) of the Securities Exchange Act of 1934 during the preceding 12 months (or for such shorter period that the registrant was required to file such reports), and (2) has been subject to such filing requirements for the past 90 days. Yes X No
Indicate by check mark whether the registrant has submitted electronically and posted on its corporate Web site, if any, every Interactive Data File required to be submitted and posted pursuant to Rule 405 of Regulation S-T during the preceding 12 months (or for such shorter period that the registrant was required to submit and post such files). Yes No
Indicate by check mark if disclosure of delinquent filers pursuant to Item 405 of Regulation S-K is not contained herein, and will not be contained, to the best of registrant’s knowledge, in definitive proxy or information statements incorporated by reference in Part III of this Form 10-K or any amendment to this Form 10-K. [ X ]
Indicate by check mark whether the registrant is a large accelerated filer, an accelerated filer, a non-accelerated filer or a smaller reporting company. See definition of “accelerated filer”, “large accelerated filer” and “smaller reporting company” in Rule 12b-2 of the Exchange Act.
Large Accelerated filer __ Accelerated Filer __ Non-accelerated Filer __ Smaller Reporting Company X
Indicate by checkmark whether the registrant is a shell company (as defined in Rule 12b-2 if the Exchange Act.) Yes__ No X
The aggregate market value of the voting stock held by nonaffiliates of the registrant as of June 30, 2009 (based on the closing price of $2.02 as reported by the Capital Market of The NASDAQ Stock Market LLC as of such date) was $4,550,361. For purposes of determining this amount only, the registrant has defined affiliates of the registrant to include the executive officers and directors of registrant and holders of more than 10% of the registrant’s common stock on June 30, 2008.
As of March 18, 2010, 3,556,049 shares of the registrant’s Common Stock were outstanding.
DOCUMENTS INCORPORATED BY REFERENCE
Portions of the definitive Proxy Statement for the 2010 Annual Meeting of Stockholders are incorporated by
reference into Part III of this Annual Report on Form 10-K.
TABLE OF CONTENTS
|
Page
|
||
|
PART I
|
||
|
Item 1.
|
Business
|
|
|
Item 1A.
|
Risk Factors
|
|
|
Item 1B.
|
Unresolved Staff Comments
|
|
|
Item 2.
|
Properties
|
|
|
Item 3.
|
Legal Proceedings
|
|
|
Item 4.
|
Reserved
|
|
|
PART II
|
||
|
Item 5.
|
Market for Registrant’s Common Equity, Related Stockholder
|
|
|
Matters and Issuer Purchases of Equity Securities
|
||
|
Item 6.
|
Selected Financial Data
|
|
|
Item 7.
|
Management’s Discussion and Analysis of Financial
|
|
|
Condition and Results of Operations
|
||
|
Item 7A.
|
Quantitative and Qualitative Disclosures about Market Risk
|
|
|
Item 8.
|
Financial Statements and Supplementary Data
|
|
|
Item 9.
|
Changes in and Disagreements with Accountants on
|
|
|
Accounting and Financial Disclosure
|
||
|
Item 9A(T).
|
Controls and Procedures
|
|
|
Item 9B.
|
Other Information
|
|
|
PART III
|
||
|
Item 10.
|
Directors, Executive Officers and Corporate Governance
|
|
|
Item 11.
|
Executive Compensation
|
|
|
Item 12.
|
Security Ownership of Certain Beneficial Owners and
|
|
|
Management and Related Stockholder Matters
|
||
|
Item 13.
|
Certain Relationships and Related Transactions, and
|
|
|
Director Independence
|
||
|
Item 14.
|
Principal Accountant Fees and Services
|
|
|
PART IV
|
||
|
Item 15.
|
Exhibits and Financial Statement Schedules
|
|
|
Signature Page
|
||
|
Subsidiaries of Registrant
|
||
|
Consent of Independent Registered Public Accounting Firm
|
||
|
Certificates
|
2
PART I
Forward-Looking Statements
This Annual Report on Form 10-K may contain, in addition to historical information, forward-looking statements. These forward-looking statements are based on the Company’s current assumptions, expectations and projections about future events. Words like “believe,” “anticipate,” “intend,” “estimate,” “expect,” “project,” and similar expressions are used to identify forward-looking statements, although not all forward-looking statements contain these words. These forward-looking statements are necessarily estimates reflecting the best judgment of the Company’s management and involve a number of risks, uncertainties and assumptions that could cause actual results to differ materially from those expressed or implied by the forward-looking statements. Among the factors that could cause actual results to differ from those expressed or implied by a forward-looking statement are those described in the sections entitled “Risk Factors” and “Management’s Discussion and Analysis of Financial Condition and Results of Operations” in this Annual Report on Form 10-K.
Our forward-looking statements are subject to risks and uncertainties. Actual events or results may differ materially from the results anticipated in these forward-looking statements as a result of a variety of factors. While it is impossible to identify all such factors, factors that could cause actual results to differ materially from those estimated by us include:
|
|
·
|
each of the factors discussed on this Item 1A, Risk Factors as well as risk discussed elsewhere in this report;
|
|
|
·
|
our ability to recruit and retain key technical and management personnel;
|
|
|
·
|
changes in existing laws;
|
|
|
·
|
our ability to expand our customer base;
|
|
|
·
|
infringement on the proprietary rights of our property and the rights of others;
|
|
|
·
|
competitive pricing pressures in the Service Management industry and our responses to those pressures;
|
|
|
·
|
our ability to develop new products on a timely basis that keep pace with new technological developments;
|
|
|
·
|
our increased dependence on technology from third parties; and
|
|
|
·
|
our ability to expand our products into international markets.
|
Many of these factors are beyond our ability to predict or control. In addition, as a result of these and other factors, our past financial performance should not be relied on as an indication of future performance. The cautionary statements referred to in this section also should be considered in connection with any subsequent written or oral forward-looking statements, whether as a result of new information, future events or otherwise, except as required by law. In light of these risks and uncertainties, the forward-looking events and circumstances discussed in this report might not occur. Furthermore, we cannot guarantee future results, events, levels of activity, performance, or achievements.
The Company is not under any obligation and does not intend to make publicly available any update or other revision to any forward-looking statements to reflect circumstances existing after the date of this Annual Report on Form 10-K or to reflect the occurrence or future events even if experience or future events make it clear that any expected results expressed or implied by these forward-looking statements will not be realized.
Item 1. Business.
General
Astea International Inc. and subsidiaries (collectively “Astea” or the “Company”) develop, market and support service management software solutions, which are licensed to companies that sell and service equipment, and/or sell and deliver professional services. Companies invest in Astea’s software and services to automate enterprise business processes for purposes of revenue enhancement, cost containment, operational efficiency improvement, and expansion of our customers’ awareness of operational performance through analytical reporting. Customers’ return on investment from implementing Astea’s solutions is achieved through more efficient management of information, people and cash flows, which we believe increases competitive advantages and customer satisfaction as well as top-line revenue and profitability.
Astea solutions are used in industries such as information technology, medical devices and diagnostic systems, industrial controls and instrumentation, retail systems, office automation, imaging systems, facilities management, telecommunications and other industries with equipment sales and service requirements. Astea’s strong focus on enterprise solutions for organizations that sell and deliver services is a unique industry differentiator that draws upon the Company’s extensive industry experience and core expertise.
3
Founded in 1979, Astea is known throughout the industry, largely from its history as a provider of software solutions for field service management and depot repair. Astea has since expanded its product portfolio to also include integrated management applications for sales and marketing, multi-channel customer contact centers, and professional services automation.
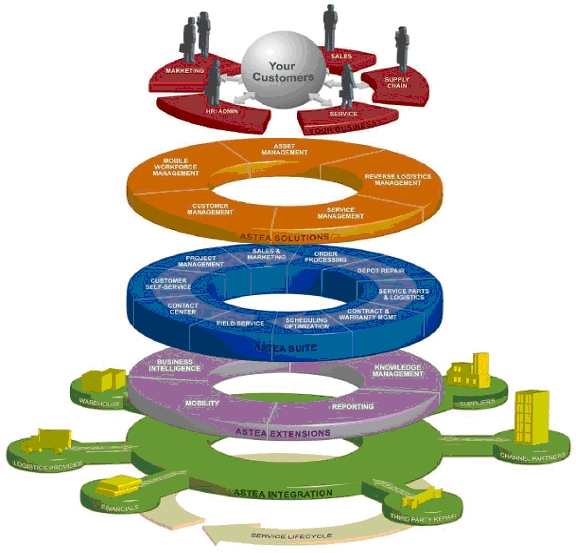
Astea offers all the cornerstones of service lifecycle management, including customer management, service management, asset management, reverse logistics management and mobile workforce management. This comprehensive approach provides unmatched expertise in service lifecycle workflow and integration needs throughout the service continuum. Astea’s solutions empower companies by making more actionable data readily accessible, providing companies agility needed to achieve sustainable value more quickly and compete successfully in a global community.
Astea’s software has been licensed to approximately 630 companies worldwide. Customers range from mid-size organizations to large, multinational corporations with geographically dispersed locations around the globe. The Company markets and supports its products through a worldwide network of direct and indirect sales and services offices with corporate headquarters in the United States and regional headquarters in the United Kingdom, Australia and Japan. In 2009, Astea announced the establishment of Astea International Japan, Inc., a new subsidiary in Tokyo, Japan. With local resources in Tokyo, the Company is providing sales, professional services and customer support to leading service organizations in Japan. The establishment of a formal presence in Japan brings Astea closer to the market and confirms their commitment to the partnerships that they have developed over the past ten years. With over forty customers already in Japan, and this number rapidly growing, our new subsidiary affords Astea the ability to better serve their local customers and strategic partners. Sales partners include distributors (value-added resellers, system integrators and sales agents) and OEM partners. See Note 14 to the Consolidated Financial Statements Geographic Segment Data for revenues, income (loss) from operations and long lived assets related to each of the Company’s geographic operating regions for the past two years.
In addition to its own product development that is conducted at Company facilities in the United States and Israel, Astea participates in contractual relationships with complementary technology companies in order to reduce time-to-market with new product capabilities and continually increase its value proposition to customers. The Company’s product strategies are developed from the collective feedback from customers, industry consultants, technology partners and sales partners, in addition to its internal product management and development teams. Astea also works with its active user community who closely advises and participates in ongoing product development efforts.
Astea provides customers with an array of professional consulting, training and customer support services to implement its products and integrate them with other corporate systems such as back-office financial and ERP applications. Astea also maintains and supports its software over its installed life cycle. The Company’s experience and domain expertise in service and sales management, distribution, logistics, finance, mobile technologies, internet applications and enterprise systems integration are made available to customers during their assessments of where and how their business processes can be improved.
The Company’s sales and marketing efforts are primarily focused on new software licensing and support services for its latest generation of Astea Alliance and FieldCentrix products. Marketing and sales of licenses and services related to the Company’s legacy system DISPATCH-1® products are limited to existing DISPATCH-1 customers.
4
Industry Overview – Service Management
In a very simplistic manner, service management is typically defined as a technician performing repair, installation, or regularly scheduled/preventive maintenance work at a customer site. It involves the management of incoming service requests, dispatching of service technicians, managing parts, managing contracts, prioritizing service based on service level agreement and severity of problem, and the repair, refurbishment and retirement process for a piece of equipment. Field service organizations vary greatly in size, target industries and supported technologies. Although every industry relies on field service to some degree, for some industries field service is critical. Equipment, ranging from computers and peripherals to building systems, office equipment and medical equipment depends on field service. Sometimes, this equipment is the lifeblood of a company, and any downtime or service interruptions can significantly impair operations or even endanger human life and safety.
Managing today's service enterprise means planning and coordinating service on a global scale. It means delighting your customers - and it calls for new technologies and business practices designed specifically to solve the service lifecycle management challenge. The benefits of implementing Service Management solutions are applicable in virtually every service organization, regardless of type, size, or geography served.
5
Current Product Offerings
Astea Alliance
Astea Alliance is a service management offering consisting of software applications and services. The software product consists of a series of applications. The offering has been developed as a global solution from the ground up with multi-lingual and multi-currency capabilities.
Astea Alliance has been designed to address the complete service lifecycle, from lead generation and project quotation to service and billing through asset retirement. It integrates and optimizes critical business processes for Campaigns, Call Center, Depot Repair, Field Service, Logistics, Projects and Sales and Order Processing. Astea extends its application suite with mobile, dynamic scheduling, portals, business intelligence, tools and services solutions. In order to ensure customer satisfaction and quick return on investment, Astea also offers infrastructure tools and services.
Astea Alliance is licensed to companies that sell and/or service capital equipment or mission critical assets and human capital. Companies invest in Astea’s software and services to automate service processes for cost containment, operational efficiency, and management visibility. Customers’ return on investment is achieved through improved management of customer information, people and cash flows, thereby we believe increasing competitive advantage and customer satisfaction, top-line revenues and profitability. Astea solutions are used in industries such as information technology, medical devices and diagnostics systems, industrial controls and instrumentation, retail systems, office automation, imaging systems, facilities management, telecommunications and related industries with equipments sales and service requirements.
6
In 2009, the latest software version, Astea Alliance 9.0 was released. This version delivered extensive enhancements and new features to empower service-centric organizations to achieve a new level of service excellence. Built on the latest Microsoft .NET 3.5 platform, Astea Alliance 9.0 is one of the most open and non-proprietary solutions available on the market today. We believe that organizations benefit from dramatically enhanced professional services automation (PSA), business intelligence (BI), service work order process improvements, logistics, workforce scheduling optimization, scheduling and dispatch console enhancements, as well as many new and significant features added to Astea’s industry leading mobility solution. Accelerated revenue growth, proactive insight to customer interactions, improved customer satisfaction and experiences, and lower total cost of ownership, are just a few of the advantages we believe organizations will be able to realize with this new release. It builds on the prior version, Astea Alliance 8.0, which was designed and built with new system architecture for Web-based deployment using the Microsoft.NET development architecture. Prior to this, products were engineered for Windows client/server technology and marketed as AllianceEnterprise. AllianceEnterprise products included re-engineered and enhanced versions of service modules that were initially introduced as ServiceAlliance® in 1997, and a re-engineered and enhanced version of the Company’s sales force automation product that was initially introduced as SalesAlliance in 1999.
ServiceAlliance and SalesAlliance, the earliest versions of Astea Alliance solutions, were the Company’s initial new technology offerings following a long and highly successful history with its DISPATCH-1 legacy system solutions. Astea Alliance solutions have been licensed to over 255 customers worldwide. Market acceptance of Astea Alliance by global and regional companies has continually increased since 2002 and the Company has aggressively pursued opportunities for larger system implementations with mid-size to large enterprises on a worldwide basis.
The current Astea Alliance offering consists of:
|
|
·
|
Core Applications
|
|
|
·
|
Mobile Applications
|
|
|
·
|
Extended Portals
|
|
|
·
|
Reporting and Business Intelligence
|
|
|
·
|
Tools
|
Astea Alliance Core Applications:
Alliance Contact Center
Alliance Depot Repair
Alliance Field Service
Alliance Logistics
Alliance Marketing Campaigns
Alliance Order Processing
Alliance Professional Services
Alliance Sales
Alliance Dynamic Scheduling Engine
Astea Alliance Mobile Applications:
Alliance Mobile – Laptop & Pocket PC
Alliance 2-way Paging
Astea Alliance Extended Portals:
Customer Self-Service
Remote Technician
7
Astea Alliance Reporting and Business Intelligence:
Alliance Reporting
Alliance Business Intelligence
Astea Alliance Tools:
Alliance Links
Alliance Studio
Alliance Knowledge Base
Astea Alliance Core Applications
Alliance Contact Center
The Alliance Contact Center application supports call centers, information desks, service hotlines, inside sales and telemarketing activities. Integrated multi-channel inbound/outbound capabilities enable customer service representatives to serve prospects and customers in their media of choice, including phone, fax, e-mail or Internet. Integrated customer self-service portals with automated email response, automated call escalation and interface to Computer Telephony Integration (CTI) systems help streamline customer interaction processes. Work scheduling and demand balancing optimize staff utilization. Employee personal portals with access to comprehensive real-time customer data and decision support tools including intelligent knowledge management and scripting for problem resolution and inside sales, drive higher staff productivity. The objectives of Astea’s Alliance Contact Center software are to reduce overhead through improved first-call resolution rates and shorter service-call handling times, as well as more efficient customer service and higher levels of customer satisfaction. A third-party knowledge engine is integrated into this application to extend the diagnostic tools available to contact center agents. This optional module is also available for Depot Repair and Field Service applications.
Alliance Depot Repair
Alliance Depot Repair automates tracking of assets through equipment calibration and repair chains, including merchandise ownership, location, repair status and warranty coverage. Objectives are to gain real-time visibility of all repair chain activities, ensure compliance with warranty and contractual agreements, respond to customer inquiries with up-to-the-minute repair status, collect and analyze repair statistics for product design improvement, and reduce overhead such as inventory carrying costs. Applications support in-house, subcontractor and vendor calibration and repair; customer and vendor exchanges and advance exchanges; equipment on loan; change of ownership; merchandise shipments, cross shipments and pickups; consolidated repair orders; and, storage and refurbishment programs. Integration with other Astea Alliance modules allows repair orders and repair status queries to be initiated from customer contact centers, field service, field sales and warehouses as well as the repair depot.
Alliance Field Service
The Alliance Field Service core application delivers a set of automated capabilities intended to streamline and improve management of field service activities. By automating workflow, field service representatives should be able to efficiently complete and document assignments, manage vehicle assets, capture expenses and generate revenue through add-on sales during a customer contact. Applications alert dispatchers to contractual minimum response times and expedite coordination of field force skills matching, scheduling, dispatch and repair parts logistics. The use of the Dynamic Scheduling Engine should automate much of this process. The Remote Technician portal allows site-based field engineers and other off-site agents secure access to the core system. Mobile tools deliver functionality on notebook and PDA platforms that enable field forces to work electronically for receiving, documenting and reporting assignments, with the expected goal of eliminating manual procedures, service delays and paper reporting. The software supports all field service categories including equipment installations, break/fix, planned maintenance and meter reading. Applications can also be integrated with equipment diagnostic systems for fully automated solutions that initiate and prioritize service requests and dispatch assignments to field employees’ PDAs without human intervention.
8
Alliance Logistics
The Alliance Logistics core application is divided into three functional portals. These are Supply Chain, Inventory Management and Reverse Supply Chain, reflecting the diversity of needs in this area. Seamlessly integrated with sales and service applications, Alliance Logistics enables equipment service organizations to control inventory costs, manage assets and implement proactive service management strategies. Automated calculation of stock profiles based on usage eliminates overstocking and dramatically reduces costs associated with storing, depreciating, and insuring inventory. The application supports parts and tools management for effective field service delivery and Service Level Agreements (SLA) compliance. We believe that improved cost management improves cash flow by streamlining and shortening the cycles from inventory to usage to billing. Lower logistics costs open opportunities to recognize higher margins on products and services. Key areas to apply Alliance Logistics include asset management, field service parts/tools management, demand fulfillment, and sales fulfillment.
Alliance Marketing Campaigns
This core application coordinates the planning, execution and analysis of marketing campaigns. The software supports budgeting and tracking complete multi-channel campaigns that integrate advertising, direct mail, email marketing, telemarketing, etc. Electronic campaigns such as email and telemarketing are further supported with list management, script development and user interfaces for campaign execution. Marketing managers can define campaign offerings such as products and services to be sold, pricing and discount tolerances; assign campaign attributes; attach campaign documentation such as descriptive text, images, slogans and lead conversion literature; and monitor and measure response. The big picture view enables managers to assess synergies each channel delivers to an overall campaign and adjust channel details such as prospect lists, scripts, budgets or offering incentives to elicit best results. Integration with other Astea Alliance modules enables equipment and service organizations to leverage customer information with the goal of identifying potential new revenue sources and marketing to maximize customer loyalty and sales opportunities.
Alliance Order Processing
The Alliance Order Processing module provides straightforward functionality for the management of quotations and order fulfillment. Quotations can be created for the sale of products and the provision of field services. Integration with the approvals process and the Logistics and Field Service modules should ensure efficient management control and sustainable promises for delivery. This application is ideally suited to the sale of “consumable products” in association with the provision of equipment-based services, but can be equally applied to the supply of finished products resulting from up-sell and cross-sell opportunities.
Alliance Professional Services
Alliance Professional Services supports management of knowledge workers, such as those deployed by professional services organizations and internal service departments of large organizations. Functionality focuses on planning, deploying and billing service engagements that can extend for days, weeks, months and years. Applications are expected to improve resource planning and allocation, workflow management, consultant time and expense reporting, subcontractor and vendor invoice processing, customer billing, and visibility of service engagements. Integration with other Astea Alliance modules delivers an end-to-end solution to market, sell, manage and bill professional services. Capabilities to share sales, service, project, and post-project field service data across the enterprise, generally enables professional services organizations to operate with less overhead, improved cash flow, higher profitability, and more competitive bidding.
9
Alliance Sales
Alliance Sales consolidates and streamlines the sales processes of an enterprise, from quote generation through order processing, at all points of customer contact including field sales, inside sales, contact center sales and field service sales. Lead-to-close sales process capabilities include integration with Astea Alliance marketing, customer support and field service applications, leveraging all enterprise knowledge pools with the goal to increase sales opportunities, margins and close rates. Consolidated views of sales and service data also provide a clearer understanding of enterprise operations to drive strategic business decisions. Sales force automation application automates business rules and practices such as enterprise-defined sales methodologies, sales pipeline management, territory management, contact and opportunity management, forecasting, collaborative team selling and literature fulfillment. The same functionality is delivered to mobile resources via the notebook application – with full two-way data synchronization with the central database, via wired and wireless networks. Other applications prompt customer support and service staff to up-sell and cross-sell during contact with customers.
Alliance Dynamic Scheduling Engine (DSE)
Alliance DSE is the new generation of field service scheduling solutions for a new era of service management. It is a real-time scheduling solution designed to optimize and balance the tradeoffs between service cost and level of service. It addresses the specific challenges of field service scheduling, while simultaneously calculating ways to increase efficiency, accuracy and profitability with the goal to help users sustain a competitive advantage in today’s volatile environment. Astea has taken a scheduling engine that was developed to handle mission critical environments such as emergency response, where a response time determined life or death, and embedded it into its core product. We believe that Alliance DSE provides for maximum flexibility that enables companies to proactively drive, manage and monitor their technicians through demand forecasting, workforce profiling, and operational optimization. Powered by the latest Microsoft .NET technology, Astea’s Alliance DSE is designed to enhance productivity, improve business processes and maximize return on investment.
Astea Alliance Mobile Applications
Astea provides a family of mobility applications for use away from the base office. The applications enable customers to match mobile access to field sales and service needs. Untethered wireless applications with synchronized client databases are provided for notebooks and Pocket PC handheld devices. Direct-connect, real-time wireless text messaging, is provided for two-way pagers and capable mobile smart phones. The mobile connectivity integrates field sales and service activity with automated front-office processes and eliminates the time, costs, procedural delays and errors of paper reporting. Expected benefits include reduced field administration costs; electronic data sharing among field and in-house personnel; improved speed, accuracy, content and compliance of field reporting; faster sales order processing and customer service invoicing; and other operational efficiencies.
Astea Alliance Extended Portals
The Alliance Customer Portal is a secure, multi-level entry point that supports unattended e-business transactions for customer self-service and self-sales. Alliance Customer Portal empowers customers as it lessens dependence on sales and service staff to conduct transactions that can be performed over the Internet. It reduces routine voice and fax calls to customer contact centers, freeing lines for customers whose critical needs do require assistance from a service representative. The pre-defined Entry-Level, Standard and Enterprise profiles, in connection with a security utility are designed to ensure tight control on access to sensitive data and a range of features that can be enabled. It also provides another channel to promote and sell more products and services to an existing customer base. The customer portal can delay or eliminate needs for contact center expansion and associated increases in facility, equipment and staffing costs.
10
The Remote Technician Portal provides secure connectivity to the enterprise system from customer sites, technician’s homes or other non-corporate locations. The available functionality covers the needs of a mobile service resource in the areas of work and inventory management.
Astea Alliance Reporting and Business Intelligence (BI)
For proactive service management, Alliance BI provides highly visual, real-time analysis of business performance, focusing on Key Performance Indicators - a tool that facilitates businesses’ understanding of customer behavior. Alliance BI enables the viewing of information for the entire enterprise, increasing revenues and identifying new business opportunities. Alliance BI has been designed to ensure that users of all kinds have immediate access to crucial information whenever it's needed. In the boardroom, at agent level, or even for customers, this tool effortlessly allows the viewing of performance data such as performance against service level agreements, contract profitability, product failure rate, repair turn around times, customer satisfaction and engineer efficiency. Reports allow businesses to see how many orders have met their contractual service ETA and how many failed, which helps organizations better understand customer satisfaction. Workloads show the available working hours at a specific location in contrast to the demand for workforce planning and optimization.
Astea Alliance Tools
Alliance Link
Alliance Link is an enterprise application integration product that interfaces Astea Alliance to other enterprise systems, such as back-office financial and ERP applications, remote equipment monitoring and diagnostic software, and wireless data transmission services. Alliance Link extends Astea Alliance’s return on investment for customers by making all Alliance modules accessible to external software through web services and open, well defined, synchronous and asynchronous application programming interfaces (APIs) that are XML based.
Alliance Studio
Alliance Studio is a toolset for easily adapting system behavior and user interfaces to specific business environments without expensive custom programming. A customer can control how Astea Alliance automates workflows as well as the system’s intuitiveness and “look and feel” to employees, which should thereby maximize the system’s usability, effectiveness and benefits. Compared to many of the large ERP systems, Alliance Studio reduces system implementation time and cost, and subsequently enables customers to update system performance as their business needs change—all of which contribute to the system’s low cost of ownership.
Alliance Knowledge Base
Alliance Knowledge Base provides powerful and scalable enterprise search functionality for corporate content, across a network or on a portal, intranet or Internet site. Delivering single-point access to enterprise-wide data collections; full-text searches can be conducted quickly and easily across disparate data sources, from a single PC to corporate networks, intranets, extranets, websites and portals, improving knowledge retention and sharing across the organization. Alliance Search offers advanced functionality for entering queries and results navigation to help users quickly find the information they need. Alliance Search can provide user-friendly access to a vast range of information, including product manuals, technical support documentation, maintenance histories, repair notes, announcements, and much more. With search functionality, Alliance Search becomes much more than simply an operations tool; it provides organizations the capability to share of all sorts of information, improve problem resolution times, and improve the quality of decision-making across an organization.
11
FieldCentrix Enterprise Suite
The FieldCentrix Enterprise is a service management solution that runs on a wide range of mobile devices (handheld computers, laptops and PCs, and Pocket PC devices), and integrates seamlessly with popular CRM and ERP applications. Add-on features include a Web-based customer self-service portal, workforce optimization capabilities, and equipment-centric functionality. FieldCentrix has licensed applications to companies in a wide range of sectors including HVACR, building and real estate services, manufacturing and process instruments and controls, and medical equipment.
The current FieldCentrix Enterprise offering consists of:
|
|
·
|
FX Service Center
|
|
|
·
|
FX Mobile
|
|
|
·
|
FX e-Service
|
|
|
·
|
FX Fleet Manager
|
|
|
·
|
FX Interchange
|
|
|
·
|
FX Interchange for JD Edwards
|
|
|
·
|
FX Mobility Express
|
FX Service Center
FX Service Center is an Internet-based service management and dispatch solution that gives organizations command over their field service operation in order to more effectively manage call taking, entitlement verification, field personnel scheduling and dispatching, customer service, work orders, timesheets, service agreements, inventory and equipment tracking, pre-invoicing, and reporting. The software is extremely intuitive, giving organizations graphical picture views of the scheduling board, work order lists, field service worker and site locations, and more. Real-time drag-and-drop scheduling and re-scheduling take just a few mouse clicks, and pre-scheduling preventive maintenance calls are simple as well. FX Service Center makes completed work order and timesheet information instantly available for export to an organization’s accounting, ERP, or CRM system. They can integrate FX Service Center with an organization’s accounting, ERP or CRM system for seamless information flow. By adding FX Resource Utilization as part of the Service Center module, organizations have a new tool that is designed to increase the productivity and efficiency of their work force and service operations through load balancing and optimized resource planning. FX Resource Utilization is a strategic workforce modelling tool expected to accurately plan, track, and analyze service resources in real-time. It provides an automated way to size, manage, and report on resource capacity and utilization across the enterprise to provide suggestions to deploy resources, cost-effectively balance workloads and service engineers, and still make sure all service level commitments are met and contracts remain profitable.
FX Mobile
FX Mobile is a workflow software product that uses wireless communications technology with handheld computers, laptops, and PDA’s to automate field service processes and should help field service personnel do their jobs better and faster. With FieldCentrix’s smart mobile client technology, field service workers should be able to complete their work, uninterrupted, regardless of wireless coverage. Along with FX Service Center, FX Mobile eliminates the manual inefficiencies and paperwork that can overwhelm service technicians and an organization’s business. With FX Mobile, service technicians receive work orders electronically on their mobile devices. It then guides them, screen by screen, through the job – prompting them to perform standard tasks, take notes, and even record future recommended repairs or activities. With FX Mobile, field service personnel can now spend their time in the field, better serving customers, generating new business, and increasing organizations bottom line. FX Mobile is an international offering that supports various languages, as well as currencies, measurement systems and time zones.
12
FX e-Service
FX e-Service is an extension of the FieldCentrix solution that provides a dynamic customer self-service portal that links directly from a customer’s web site. When integrated with FX Mobile software, it provides the unique capability to truly deliver real-time information from the point of service to your customers. Working seamlessly with FX Service Center call center and dispatching software, FX e-Service gives an organization’s customers the flexibility of submitting service requests, accessing work order information, and managing their account over the Internet. Customers can receive an email notification each time the status of a work order changes. This allows them to know instantly when the request has been received, scheduled, is in progress and when it is complete – all without ever calling into the office, waiting on hold or taking up valuable CSR resource.
FX Fleet Manager
FX Fleet Manager is FieldCentrix’s Global Positioning System (GPS) offering to help customers manage their mobile resources more effectively. FX Fleet Manager gives companies control and management of their field operations with the expectation that they will make decisions that will increase profitability, reduce service costs, enhance customer responsiveness and satisfaction, and improve productivity and efficiency. With FX Fleet Manager, dispatchers and office personnel will always know where mobile resources are located — in real-time. Are they where they should be? Are they lost? Are they safe? There’s an emergency service request — which resource is the closest with the right parts and skill sets? All this information and more should contribute to more efficiently managed mobile resources.
FX Interchange
FX Interchange software provides data transporting services that allow enterprises to quickly and easily integrate FieldCentrix Enterprise to existing legacy and business systems – that are expected to maximize value from field data. FX Interchange converts data stored in FX Service Center knowledge base to XML (eXtensible Markup Language) or a Microsoft SQL Server database. Once converted, the data is accessible to other systems for basic billing and payroll extraction, and bi-directional integration purposes that should support the needs of an accounting, call center, or service dispatch integrated solution.
FX Interchange for JD Edwards
FieldCentrix field service automation software and JD Edwards® Enterprise and EnterpriseOne applications are integrated to provide medium to large companies with an easy-to-use, cost-effective way to streamline and automate field service operations. The systems are integrated through FX Interchange™ for JD Edwards. This interface dynamically transfers key customer, work order, and accounting related information between the FieldCentrix and JD Edwards applications. This means the key functions that organizations need to run their business efficiently and cost-effectively are now seamless and completed electronically — without paper.
With the FieldCentrix and JD Edwards solution, service workers in the field access and enter all work order information using a mobile device at the job site. When the work is done, the service worker closes the work order and the completed information is sent wirelessly back to the office automatically. The electronic information is instantly accessible for processing by an organization’s billing system so there's no data entry needed. Because you also no longer have to wait for the field service worker to bring in the paperwork before you can close the work order, customers can be billed quicker.
FX Mobility Express
For customers who want to mobilize their workforce without deploying a full field service automation solution, FieldCentrix offers a special mobilized application development toolkit called FX Mobility Express™. The FX Mobility Express toolkit is bundled with FieldCentrix’s popular mobile middleware and allows organizations to quickly and easily build custom mobile applications that fully leverage FieldCentrix’s robust and scalable mobile infrastructure and user- friendly interface. Mobilizing applications with FX Mobility Express should provide organizations with a cost-effective way to create a solution that fits their unique business requirements on a platform built from years of mobile and wireless technology experience and used by thousands of users worldwide.
13
Astea Client Services
Professional Services:
Astea’s typical professional services engagement includes planning, prototyping and implementation of Astea’s products within the client’s organization. Some customers may require customization, but they are relatively insignificant.
During the initial planning phase of the engagement, Astea’s professional services personnel work closely with representatives of the customer to prepare a detailed project plan that includes a timetable, resource requirements, milestones, in-house training programs, onsite business process training and demonstrations of Astea’s product capabilities within the customer’s organization.
The next phase of the Astea professional services engagement is the prototyping phase, in which Astea works closely with representatives of the customer to configure Astea’s software solutions to the customer’s specific business process requirements.
The next integral phase in the professional services engagement is the implementation phase, in which Astea’s professional services personnel work with the client to develop detailed data mapping, conversions, interfaces and other technical and business processes necessary to integrate Astea’s solutions into the customer’s computing environment. Ultimately, education plans are developed and executed to provide the customer with the process and system knowledge necessary to effectively utilize the software and fully implement the solution. Professional services are charged on an hourly or daily basis.
The last phase of the engagement utilizes Astea’s professional services personnel to assist in Go Live planning and the Go Live effort. Astea will assist in the planning for installation, initialization, data preparation, operational procedures, schedules and required resources. The initialization and creation of the production database is planned and prepared for the data history, open orders and all required data for go live processing. During the cutover to the solution, Astea business resources are best utilized to assist new users with functionality/processes while Astea technical resources support customer IT staff.
Following the Go Live, Astea professional services engages the customer in the Assessment Phase. During this effort, the delivered system is assessed to validate benefits, analyze processes to measure key performance indicators, document and understand lessons learned. To perform these assessments, Astea consultants collect and analyze the planned benefits, processes used to capture and report on the key performance indicators, and document the lessons learned from all phases of the implementation. An action plan is developed from the lessons learned and key performance indicators for use in future phases and/or releases.
Technical Services:
Astea’s technical services teams provide services related to installation, data verification, functional design, technical design, system infrastructure setup or changes, customizations, QA activities, testing and go-live support. Initially, software and database installation resources are available to prepare the environment for the prototyping phase.
14
Data verification and feedback services can be provided for initial data verification analysis. These efforts are conducted to determine the present state of information as far as type, conversions, data manipulation, location, frequency, method of interface (initial load, ongoing load, data export or data import) and data integrity. Findings are documented and shared with the project team.
During the implementation phase, Astea’s technical services team is often engaged to assist with the functional and/or technical design as related to customer desired system personalization, minor customization and interfaces, often referred to as ‘gaps’. Gap solutions are assessed and categorized into system, studio, customization or interface. Utilizing the services of the customer project team, Astea professional services and Astea technical services create Business Requirement Documents (BRDs) for all customizations and interfaces. Astea technical services will provide specifications and a quote for the customization. The customer and Astea agree on the outcome of the customization and all expected outputs prior to the actual development customization. Following acceptance of the BRDs, code will be written as per design. QA of the code with test data sets will complete these efforts.
Astea’s technical services team will also provide testing and go-live support, as required.
Customer Support
Astea’s customer support organization provides customers with telephone and online technical support, as well as product enhancements, updates and new software releases. The Company can provide 24X7 “follow-the-sun” support through its global support network. Local representatives support all regions of Astea’s worldwide operations. Astea personnel or a distributor’s personnel, familiar with local business customs and practices, provide support in real-time and usually spoken in native languages. Typically, customer support fees are established as a fixed percentage of license fees and are invoiced to customers on an annual basis. Astea’s customer support representatives are located in the United States, Europe, Israel and Australia. In addition, Astea provides customer support 24X7 with its self-service portal. The maintenance offering provides customers with support and help desk services, as well as software service packs and release upgrades for the modules they have purchased.
Education & Training
Application Training:
Key business owners responsible for the implementation of the core components will receive in-depth training designed to present the features, functionality and terminology of Astea’s solutions. The objective of this training is to provide the audience with a working knowledge of these solutions. This exposure to the system will enable project communication and add insight into specific business processes.
End-user training plans and documents are created during the implementation phase. These plans and documentation are utilized to conduct end-user training sessions prior to go-live.
Technical Training:
Software and database installation/creation training is provided, as required and/or recommended.
System Administration training provides the customer IT staff pre-requisite knowledge to manipulate and manage administrative tasks associated with the Astea solutions. Included within these tasks are: Security, Batch Applications, Escalation, Import, etc.
15
Many customers are interested in performing their own personalization and minor customization to the system. Training sessions are available to enhance customer understanding of available options for personalization and how to perform customizations.
Customers
The Company estimates that it has sold licenses to approximately 630 customers ranging from small, rapidly growing companies to large, multinational corporations with geographically dispersed operations and remote offices. More than 255 companies have purchased (including 2009 sales) Astea Alliance, 45 companies have purchased FieldCentrix products and the remainder purchased DISPATCH-1 software. The broad applicability of the Company’s products is demonstrated by the wide range of companies across many markets and industries that use one or more of Astea’s products, including customers in information technology, medical devices and diagnostic systems, industrial controls and instrumentation, retail systems, office automation, imaging systems, facilities management, telecommunications, and other industries with equipment sales and service requirements. In 2009 and 2008, no customers accounted for more than 10% of total revenues.
Sales and Marketing
The Company markets its products through a worldwide network of direct and indirect sales and services offices with corporate headquarters in the United States and regional headquarters in the United Kingdom (Europe, Middle East and Africa Operations), Japan and Australia (Asia Pacific Operations). Sales partners include distributors (value-added resellers, system integrators and sales agents) and OEM partners. The Company actively seeks to expand its reseller network and establish an international indirect distribution channel targeted at the mid-market tier. See Risk Factors - “Need to Expand Indirect Sales.”
Astea’s direct sales force employs a consultative approach to selling, working closely with prospective clients to understand and define their needs and determine how such needs can be addressed by the Company’s products. These clients typically represent the mid- to high-end of the market. A prospect development organization comprised of telemarketing representatives, who are engaged in outbound telemarketing and inbound inquiry response to a variety of marketing vehicles, develops and qualifies sales leads prior to referral to the direct sales staff. Additional prospects are identified and qualified through the networking of direct sales staff and the Company’s management as part of daily business activities.
The modular structure of Astea’s software and its ongoing product development efforts provide opportunities for incremental sales of product modules and consulting services to existing accounts. See Risk Factors - “Continued Dependence on Large Contracts May Result in Lengthy Sales and Implementation Cycles and Impact Revenue Recognition and Cash Flow.”
Astea’s corporate marketing department is responsible for product marketing, lead generation and marketing communications, including the Company’s corporate website, dialogue with high tech industry analysts, trade conferences, advertising, e-marketing, online and traditional seminars, direct mail, product collateral and public relations. Based on feedback from customers, analysts, business partners and market data, the marketing department provides input and direction for the Company’s ongoing product development efforts and opportunities for professional services. Leads developed from the variety of marketing communications vehicles are routed through the Company’s Astea Alliance sales and marketing automation system. The Company also participates in an annual conference for users of Astea Alliance and FieldCentrix products. Conference participants attend training sessions, workshops and presentations, and interact with other Astea product users, Astea management and staff, and technology partners, providing important input for future product direction.
Astea’s international sales accounted for 31% of the Company’s revenues in 2009 and 26% of the Company’s revenues in 2008. See Risk Factors —“Risks Associated with International Sales.”
16
Product Development
Astea’s product development strategy is to provide products that perform with exceptional depth and breadth of functionality and are easy to implement, use and maintain. Products are designed to be flexible, modular and scalable, so that they can be implemented incrementally in phases and expanded to satisfy the evolving information requirements of Astea’s clients and their customers. Each product is also designed to utilize n-tier, distributed, thin-client and Web environments that can be powered by multiple hardware platforms and operating systems. To accomplish these goals, the Company uses widely accepted commercially available application development tools from Microsoft Corporation for Astea Alliance and FieldCentrix. These software tools provide the Company’s customers with the flexibility to deploy Astea’s products across a variety of hardware platforms, operating systems and relational database management systems. The latest Astea Alliance products are currently being engineered for existing and emerging Microsoft technologies such as Microsoft Message Queuing (MSMQ), Windows Presentation Foundation (WPF); Visual Studio 2008; Microsoft .NET Framework; Internet Information Server (IIS) and Microsoft.NET Enterprise Servers including Windows 2003 and 2008 Servers, SQL Server and BizTalk Server.
In addition to product development that is conducted at Company facilities in the United States and Israel, Astea may participate in contractual relationships with complementary technology companies to reduce time-to-market with new product capabilities in order to continually increase its value proposition to existing and prospective customers.
The Company’s total expense for product development for the years ended December 31, 2009 and 2008 was $2,283,000 and $4,224,000, respectively. These expenses amounted to 11% and 18% of total revenues for 2009 and 2008, respectively. The Company’s capitalized software development costs were $1,761,000 and $2,118,000 in 2009 and 2008, respectively. Capitalized software development costs decreased $357,000 in 2009 compared to 2008 principally due to the release of FieldCentrix version 4.5 in late 2008 and a focus on eliminating all known problems associated with the software in 2009, which did not result in capitalized development costs. Once version 4.5 was released, all costs related to improving the FieldCentrix product were no longer capitalized and instead charged directly to product development expenses. The Company anticipates that it will continue to allocate substantial resources to its development effort for the upgrade of its suite of products. See “Management’s Discussion and Analysis of Financial Condition and Results of Operations” and Risk Factors — “Need for Development of New Products.”
Manufacturing
The Company’s software products are distributed on CD ROMs and electronically via FTP (file transfer protocol). Included with the software products are security keys (a software piracy protection) and documentation available on CD ROM and hard copy. Historically, the Company has purchased media and duplicating and printing services for its product packaging from outside vendors.
Competition
The service management software market is intensely competitive and subject to rapid change. To maintain or increase its position in the industry, the Company will need to continually enhance its current product offerings, introduce new products and features and maintain its professional services capabilities. The Company currently competes on the basis of the depth and breadth of its integrated product features and functions, including the adaptability and scalability of its products to specific customer environments; the ability to deploy complex systems locally, regionally, nationally and internationally; product quality; ease-of-use; reliability and performance; breadth of professional services; integration of Astea’s offerings with other enterprise applications; price; and the availability of Astea’s products on popular operating systems, relational databases, Internet and communications platforms.
17
Competitors vary in size, scope and breadth of the products and services offered. The Company encounters competition generally from a number of sources, including other software companies, third-party professional services organizations that develop custom software, and information systems departments of potential customers developing proprietary, custom software. In the service management marketplace, the Company competes against publicly held companies and numerous smaller, privately held companies. Some of the Company’s competitors include Siebel Systems, Inc. (“Siebel”) and PeopleSoft Inc., (“PeopleSoft”), both acquired by Oracle, SAP AG (“SAP”), Oracle Corporation (“Oracle”), Clarify which was acquired by Amdocs Limited (“Amdocs Clarify”), Viryanet Ltd. (“Viryanet”) and a number of smaller privately held companies. See Risk Factors — “Competition in the Customer Relationship Management Software Market is Intense.”
Licenses and Intellectual Property
Astea considers its software proprietary and licenses its products to its customers under written license agreements. The Company also employs an encryption system that restricts a user’s access to source code to further protect the Company’s intellectual property. Because the Company’s products allow customers to use the software’s built in features to customize their applications without altering the framework source code, the framework source code for the Company’s products is typically neither licensed nor provided to customers. The Company does, however, license source code from time to time and maintains certain third-party source code escrow arrangements. See “Customers” and “Management’s Discussion and Analysis of Financial Condition and Results of Operations.”
The Company seeks to protect its products through a combination of copyright, trademark, trade secret and fair business practice laws. The Company also requires employees, consultants and third parties to sign nondisclosure agreements. Despite these precautions, it may be possible for unauthorized parties to copy certain portions of the Company’s products or reverse engineer or obtain and use information that the Company regards as proprietary. The Company presently has no patents or patent applications pending. See Risk Factors — “Risks of Dependence on Proprietary Technology.”
Because the software development industry is characterized by rapid technological change, Astea believes that factors such as the technological and creative skills of its personnel, new product developments, frequent product enhancements, and reliable product maintenance are more important to establishing and maintaining a technology leadership position than current legal protections.
Employees
As of December 31, 2009, the Company, including its subsidiaries, had a total of 158 full time employees worldwide, 84 in the United States, 13 in the United Kingdom, 4 in the Netherlands, 41 in Israel, 10 in Australia and 6 in Japan. In addition, we have 3 part-time employees, 2 in the United States and 1 in the Netherlands. The Company’s future performance depends, in significant part, upon the continued service of its key technical and management personnel and its continuing ability to attract and retain highly qualified and motivated personnel in all areas of its operations. See Risk Factors — “Dependence on Key Personnel; Competition for Employees.” None of the Company’s employees is represented by a labor union. The Company has not experienced any work stoppages and considers its relations with its employees to be good.
Corporate History
The Company was incorporated in Pennsylvania in 1979 under the name Applied System Technologies, Inc. In 1992, the Company changed its name to Astea International Inc. Until 1986, the Company operated principally as a software-consulting firm, providing professional software consulting services on a fee for service and on a project basis. In 1986, the Company introduced its DISPATCH-1 product. In November 1991, the Company’s sole stockholder acquired the outstanding stock of The DATA Group Corporation (“Data Group”), a provider of field service software and related professional services for the mainframe-computing environment. Data Group was merged into the Company in January 1994. In February 1995, the Company and its sole stockholder acquired the outstanding stock of Astea Service & Distribution Systems BV (“Astea BV”), the Company’s distributor of DISPATCH-1 and related services in Europe. In May 1995, the Company reincorporated in Delaware. In July 1995, the Company completed its initial public offering of Common Stock. In February 1996, the Company merged with Bendata, Inc. In June 1996, the Company acquired Abalon AB. In September 1998 (effective July 1, 1998), the Company sold Bendata, Inc. In December 1998, the Company sold Abalon AB. In December 1997, the Company introduced ServiceAlliance and in October 1999, SalesAlliance. Both products were subsequently re-engineered into components of the AllianceEnterprise suite which was introduced in 2001. Through 2001 and into 2002, the Company rebuilt its product functionality for Web-based applications and in August 2003 introduced Astea Alliance version 6. The Company released a new system architecture based on Microsoft.NET during the third quarter of 2004. On September 21, 2005, the Company acquired substantially all the assets and certain liabilities of FieldCentrix, Inc. In the second quarter of 2009, the Company delivered Astea Alliance version 9.0, its most recent product upgrade.
18
Item 1A. Risk Factors
The following discussion of the Company’s risk factors should be read in conjunction with the financial statements and related notes thereto set forth elsewhere in this report. The following factors, among others, could cause actual results to differ materially from those set forth in forward looking statements contained or incorporated by reference in this report and presented by management from time to time. Such factors, among others, may have a material adverse effect upon the Company’s business, results of operations and financial conditions:
Recent History of Net Losses
The Company has a history of net losses. In 2009, it generated a net loss of $.9 million. The Company generated a net loss of $3.1 million in 2008. As of December 31, 2009, stockholders’ equity is approximately $6.5 million, which is net of an accumulated deficit of approximately $23.9 million. Moreover, the Company expects to continue to incur additional operating expenses for research and development. As a result, the Company will need to generate significant revenues to achieve and maintain profitability. The Company may not be able to achieve the necessary revenue growth or profitability in the future. If the Company does not attain or sustain profitability or raise additional equity or debt in the future, the Company may be unable to continue its operations.
Decreased Revenues from DISPATCH-1 due to rapid change in technology
In both 2009 and 2008, 1.5% of the Company’s total revenues were derived from licensing and providing of professional services in connection with the implementation, deployment and maintenance of DISPATCH-1 installations. See “Management’s Discussion and Analysis of Financial Condition and Results of Operations.” The Company originally introduced Astea Alliance in August 1997 in order to target a market segment in which DISPATCH-1 was not cost-effective or attractive. Subsequent, rapid changes in technology have now positioned the Astea Alliance suite, introduced in 2001 and which includes the Astea Alliance functionality, to supersede DISPATCH-1 as the Company’s flagship product. As a result, there are no license sales planned or anticipated for DISPATCH-1 to new customers. In 2009 and 2008, there were no DISPATCH-1 license sales to existing customers. Total DISPATCH-1 revenues have been declining and insignificant in each of the last two fiscal years. That trend is expected to continue.
19
While the Company has licensed Astea Alliance to over 255 companies worldwide from 1998 through 2009, and more than 45 companies for the FieldCentrix suite supported by the Company since September 2005, revenues from sales of both Astea Alliance and FieldCentrix may not be sufficient to support the expenses of the Company. The Company’s future success will depend mainly on its ability to increase licensed users of both the Astea Alliance suite and FieldCentrix offerings, on developing new products and product enhancements to complement its existing product offerings, on its ability to continue to generate professional services, support and maintenance revenues to Astea Alliance and FieldCentrix customers and on its ability to control its operating expenses. Any failure of the Company’s products to achieve or sustain market acceptance, or of the Company to sustain its current position in the Customer Relationship Management software market, would have a material adverse effect on the Company’s business and results of operations. There can be no assurance that the Company will be able to increase demand for Astea Alliance and FieldCentrix products, maintain an acceptable level of support and maintenance revenues or to lower its expenses, thereby avoiding future losses.
Need for Development of New Products
The Company’s future success will depend upon its ability to enhance its current products and develop and introduce new products on a timely basis that keep pace with technological developments, industry standards and the increasingly sophisticated needs of its customers, including developments within the client/server, thin-client and object-oriented computing environments. Such developments may require, from time to time, substantial capital investments by the Company in product development and testing. The Company intends to continue its commitment to research and development and its efforts to develop new products and product enhancements. There can be no assurance that the Company will not experience difficulties that could delay or prevent the successful development, introduction and marketing of new products and product enhancements; that new products and product enhancements will meet the requirements of the marketplace and achieve market acceptance; or that the Company’s current or future products will conform to industry requirements. Furthermore, reallocation of resources by the Company, such as the diversion of research and development personnel to development of a particular feature for a potential or existing customer, can delay new products and certain product enhancements. Some of our customers adopted our software on an incremental basis. These customers may not expand usage of our software on an enterprise-wide basis or implement new software products introduced by the Company. The failure of the software to perform to customer expectations or otherwise to be deployed on an enterprise-wide basis could have a material adverse effect on the Company’s ability to collect revenues or to increase revenues from new as well as existing customers. If the Company is unable to develop and market new products or enhancements of existing products successfully, the Company’s ability to remain competitive in the industry will be materially adversely effected.
Rapid Technological Change
In the software industry there is a continual emergence of new technologies and continual change in customer requirements. Because of the rapid pace of technological change in the application software industry, the Company’s current market position could be eroded rapidly by product advancements. In order to remain competitive, the Company must introduce new products or product enhancements that meet customers’ requirements in a timely manner. If the Company is unable to do this, it may lose current and prospective customers to competitors.
The Company’s application environment relies primarily on software development tools from Microsoft Corporation. If alternative software development tools were to be designed and generally accepted by the marketplace, we could be at a competitive disadvantage relative to companies employing such alternative developmental tools.
Burdens of Customization
On rare occasions, the Company’s clients may request significant customization of Astea Alliance and FieldCentrix products to address unique characteristics of their businesses or computing environments. In these situations, the Company would apply contract accounting to determine the recognition of license revenues. The Company’s commitment to the customization could place a burden on its client support resources or delay the delivery or installation of products, which, in turn, could materially adversely affect its relationship with significant clients or otherwise adversely affect business and results of operations. In addition, the Company could incur penalties or reductions in revenues for failures to develop or timely deliver new products or product enhancements under development agreements and other arrangements with customers. If customers are not able to customize or deploy the Company’s products successfully, the customer may not complete expected product deployment, which would prevent recognition of revenues and collection of amounts due, and could result in claims against the Company.
20
Product Defects; Failure to Meet Performance Criteria
The Company’s software is intended for use in enterprise-wide applications that may be critical to its customer’s business. As a result, customers and potential customers typically demand strict requirements for installation and deployment. The Company’s software products are complex and may contain undetected errors or failures, particularly when software must be customized for a particular customer, when first introduced or when new versions are released. Although the Company conducts extensive product testing during product development, the Company has at times delayed commercial release of software until problems were corrected and, in some cases, has provided enhancements to correct errors in released software. The Company could, in the future, lose revenues or incur additional and unexpected costs as a result of software errors or defects. Despite testing by the Company and by current and potential customers, errors in the software, customizations or releases might not be detected until after initiating commercial shipments, which could result in additional costs, delays, possible damage to the Company’s reputation and could cause diminished demand for the Company’s products. This could lead to customer dissatisfaction and reduce the opportunity to renew maintenance contracts or sell new licenses.
Continued Dependence on Large Contracts May Result in Lengthy Sales and Implementation Cycles and Impact Revenue Recognition and Cash Flow
The sale and implementation of the Company’s products generally involve a significant commitment of resources by prospective customers. As a result, the Company’s sales process is often subject to delays associated with lengthy approval processes attendant to significant capital expenditures, definition of special customer implementation requirements, and extensive contract negotiations with the customer. Therefore, the sales cycle varies substantially from customer to customer and typically lasts between four and twelve months. During this time the Company may devote significant time and resources to a prospective customer, including costs associated with multiple site visits, product demonstrations and feasibility studies. The Company may experience a number of significant delays over which the Company has no control. Because the costs associated with the sale of the product are fixed in current periods, there may be a lag between the time the Company incurs costs with regard to a particular customer or contract and the time the Company begins to receive or recognize revenues from such customer or contract. Moreover, in the event of any downturn in any existing or potential customer’s business or the economy in general, purchases of the Company’s products may be deferred or canceled.
In addition, the implementation of the Company’s products typically takes several months of integration of the product with the customer’s other existing systems and customer training requires a close working relationship between the customer and members of the Company’s professional service organization. These issues make it difficult to predict the quarter in which expected orders will occur. Delays in implementation of products could cause some or all of the professional services revenues from those projects to be shifted from the expected quarter to a subsequent quarter or quarters.
When the Company has provided consulting services to implement certain larger projects, some customers have delayed payment of a portion of license fees until implementation was complete and in some cases have disputed the consulting fees charged for implementation. There can be no assurance the Company will not experience additional delays or disputes regarding payment in the future, particularly if the Company receives orders for large, complex installations. Additionally, as a result of the application of the revenue recognition rules applicable to the Company’s licenses under generally accepted accounting principles, license revenues may be recognized in periods after those in which the respective licenses were signed. The Company believes that period-to-period comparisons of its results of operations should not be relied upon as any indication of future performance.
21
Fluctuations in Quarterly Operating Results May Be Significant
The Company’s quarterly operating results have in the past and may in the future vary significantly depending on factors such as:
|
|
·
|
revenue from software sales;
|
|
|
·
|
timing of new product releases;
|
|
|
·
|
market acceptance of new and enhanced versions of the Company’s products;
|
|
|
·
|
customer order deferrals in anticipation of enhancements or new products;
|
|
|
·
|
size and timing of significant orders, the recognition of revenue from such orders;
|
|
|
·
|
changes in pricing policies by the Company and its competitors;
|
|
|
·
|
introduction of alternative technologies;
|
|
|
·
|
changes in operating expenses;
|
|
|
·
|
changes in the Company’s strategy;
|
|
|
·
|
personnel changes; and
|
|
|
·
|
effect of potential acquisitions by the Company and its competitors.
|
The Company has limited or no control over many of these factors. Due to all these factors, it is possible that in some future quarter the Company’s operating results will be materially adversely affected.
Fluctuations in Quarterly Operating Results Due to Seasonal Factors
The Company expects to experience fluctuations in the sale of licenses for its products due to seasonal factors. The Company has experienced and anticipates that it may experience relatively lower sales in the first fiscal quarter due to patterns in capital budgeting and purchasing cycles of current and prospective customers. The Company also expects that sales may decline during the summer months of its third quarter, particularly in the European markets. Moreover, the Company generally records most of its total quarterly license revenues in the third month of the quarter, with a concentration of these revenues in the last half of that third month. This concentration of license revenues is influenced by customer tendencies to make significant capital expenditures at the end of a fiscal quarter. The Company expects these revenue patterns to continue for the foreseeable future. Thus, its results of operations may vary seasonally in accordance with licensing activity, and will also depend upon recognition of revenue from such licenses from time to time. The Company believes that period-to-period comparisons of its results of operations are not necessarily meaningful and should not be relied upon as an indication of future performance.
Competition in the Customer Relationship Management (CRM) Software Market is Intense
The Company competes in the CRM software market. This market is highly competitive and the Company expects competition in the market to increase. The Company’s competitors include large public companies such as Oracle, which owns PeopleSoft and Siebel, as well as traditional enterprise resource planning (ERP) software providers such as SAP that are developing CRM capabilities. In addition, a number of smaller privately held companies generally focus only on discrete areas of the CRM software marketplace. Because the barriers to entry in the CRM software market are relatively low, new competitors may emerge with products that are superior to the Company’s products or that achieve greater market acceptance. Moreover, the CRM industry is currently experiencing significant consolidation, as larger public companies seek to enter the CRM market through acquisitions or establish other cooperative relationships among themselves, thereby enhancing their ability to compete in this market with their combined resources. Some of the Company’s existing and potential competitors have greater financial, technical, marketing and distribution resources than the Company. These and other competitors pose business risks to the Company because:
22
|
|
·
|
they compete for the same customers that the Company tries to attract;
|
|
|
·
|
if the Company loses customers to its competitors, it may be difficult or impossible to win them back;
|
|
|
·
|
lower prices and a smaller market share could limit the Company’s revenue generating ability, reduce its gross margins and restrict its ability to become profitable or sustain profitability; and
|
|
|
·
|
competitors may be able to devote greater resources to more quickly respond to emerging technologies and changes in customer requirements or to the development, promotion and sales of their products.
|
There can be no assurance that the Company will be able to compete successfully against current and future competitors or that competitive pressures faced by the Company will not adversely affect its business and results of operations.
Dependence on Proprietary Technology
The Company depends heavily on proprietary technology for its business to succeed. The Company licenses its products to customers under license agreements containing, among other terms, provisions protecting against the unauthorized use, copying and transfer of the licensed program. In addition, the Company relies on a combination of trade secrets, copyright and trademark laws and confidentiality procedures to protect the Company’s proprietary rights in its products and technology. The legal protection is limited, however. Unauthorized parties may copy aspects of the Company’s products and obtain and use information that the Company believes is proprietary. Other parties may breach confidentiality agreements or other contracts they have made with the Company. Policing unauthorized use of the Company’s software is difficult and, while the Company is unable to determine the extent to which piracy of its software products exists, software piracy can be expected to be a persistent problem. There can be no assurance that any of the measures taken by the Company will be adequate to protect its proprietary technology or that its competitors will not independently develop technologies that are substantially equivalent or superior to the Company’s technologies. If the Company fails to successfully enforce its proprietary technology, its competitive position may be harmed.
Other software providers could develop similar technology independently, which may infringe on the Company’s proprietary rights. The Company may not be able to detect infringement and may lose a competitive position in the market before it does so. In addition, competitors may design around the Company’s technology or develop competing technologies. The laws of some foreign countries do not protect the Company’s proprietary rights to the same extent as do the laws of the United States. Litigation may be necessary to enforce the Company’s proprietary rights. Such litigation is time-consuming, has an uncertain outcome and could result in substantial costs and diversion of management’s attention and resources. However, if the Company fails to successfully enforce its proprietary rights, the Company’s competitive position may be harmed.
Possible Infringement of Third Party Intellectual Property Rights
Substantial litigation and threats of litigation regarding intellectual property rights are common in this industry. The Company is not aware that its products and technologies employ technology that infringes any valid, existing proprietary rights of third parties. While there currently are no pending lawsuits against the Company regarding infringement of any existing patents or other intellectual property rights or any notices that it is infringing the intellectual property rights of others, third parties may assert such claims in the future. Any claims, with or without merit, could:
|
|
·
|
be time consuming to defend;
|
|
|
·
|
result in costly litigation or damage awards;
|
|
|
·
|
divert management’s attention and resources;
|
23
|
|
·
|
cause product shipment delays; or
|
|
|
·
|
require the Company to seek to enter into royalty or licensing agreements, which may not be available on terms acceptable to the Company, if at all.
|
A successful claim of intellectual property infringement against the Company or the Company’s failure or inability to license the infringed or similar technology could seriously harm its business because the Company would not be able to sell the impacted product without exposing itself to litigation risk and damages. Furthermore, redevelopment of the product so as to avoid infringement could cause the Company to incur significant additional expense and delay.
Dependence on Technology from Third Parties
The Company integrates various third-party software products as components of its software. The Company’s business would be disrupted if this software, or functional equivalents of this software, were either no longer available to the Company or the Company was no longer able to gain access to this software on commercially reasonable terms. In either case, the Company would be required to either redesign its software to function with alternate third-party software or develop these components itself, which would result in increased costs and could result in delays in software shipments. Furthermore, the Company might be forced to limit the features available in its current or future software offerings.
Need to Expand Indirect Sales
The Company has historically sold its products through its direct sales force and a limited number of distributors (value-added resellers, system integrators and sales agents). The Company’s ability to achieve significant revenue growth in the future will depend in large part on its success in establishing relationships with distributors and OEM partners. The Company is currently investing, and plans to continue to invest, significant resources to expand its domestic and international direct sales force and develop distribution relationships. The Company’s distributors also sell or can potentially sell products offered by the Company’s competitors. There can be no assurance that the Company will be able to retain or attract a sufficient number of its existing or future third party distribution partners or that such partners will recommend, or continue to recommend, the Company’s products. The inability to establish or maintain successful relationships with distributors and OEM partners or to train its direct sales force could cause its sales to decline.
Future Acquisitions
As part of Astea’s growth strategy, it may pursue the acquisition of businesses, technologies or products that are complementary to its business. Acquisitions involve a number of special risks that could harm the Company’s business, including the diversion of management’s attention, the integration of the operations and personnel of the acquired companies, and the potential loss of key employees. In particular, the failure to maintain adequate operating and financial control systems or unexpected difficulties encountered during expansion could harm the Company’s business. Acquisitions may result in potentially dilutive issuances of equity securities, and the incurrence of debt and contingent liabilities, any of which could materially adversely affect the Company’s business and results of operations.
Expansion of International Sales
Astea’s international sales accounted for 31% of the Company’s revenues in 2009 and 26% in 2008. The Company expects that international sales will continue to be a significant component of its business. In the Company’s efforts to expand its international presence, it will face certain risks, which it may not be successful in addressing. These risks include:
|
|
·
|
difficulties in establishing and managing international distribution channels and in translating products into foreign languages;
|
|
|
·
|
difficulties finding staff to manage foreign operations and collect accounts receivable;
|
24
|
|
·
|
difficulties enforcing intellectual property rights;
|
|
|
·
|
liabilities and financial exposure under foreign laws and regulatory requirements;
|
|
|
·
|
fluctuations in the value of foreign currencies and currency exchange rates; and
|
|
|
·
|
potentially adverse tax consequences.
|
Additionally, the current economic difficulties in several Asian countries could have an adverse impact on the Company’s international operations in future periods. Any of these factors, if not successfully addressed, could harm the Company’s operating results.
Research and Development in Israel; Potential Political, Economic or Military Instability
Astea’s principal research and development facilities are located in Israel. Accordingly, political, economic and military conditions in Israel may directly affect its business. Continued political and economic instability or armed conflicts in Israel or in the region could directly harm the Company’s business and operations.
Since the establishment of the State of Israel in 1948, a number of armed conflicts have taken place between Israel and its Arab neighbors, and a state of hostility has existed in varying degrees and intensity. This state of hostility has led to security and economic problems for Israel. The future of peace efforts between Israel and its Arab neighbors, particularly in light of the recent violence and political unrest in the Middle East, remains uncertain and several countries still restrict business with Israel and Israeli companies. These restrictive laws and policies may also materially harm the Company’s operating results and financial condition.
Dependence on Key Personnel who are Required to Perform Military Service
Many of the Company’s employees in Israel are obligated to perform annual military reserve duty in the Israeli army and are subject to being called to active duty at any time, which could adversely affect the Company’s ability to pursue its planned research and development efforts. The Company cannot assess the full impact of these requirements on its workforce or business and the Company cannot predict the effect of any expansion or reduction of these obligations. However, in light of the recent violence and political unrest in Israel, there is an increased risk that a number of the Company’s employees could be called to active military duty without prior notice. The Company’s operations could be disrupted by the absence for a significant period of time of one or more of our key employees or a significant number of other employees due to military service. Any such disruption in the Company’s operations could harm its operations.
Inflation and Currency Fluctuations
The Company generates most of its revenues in U.S. dollars but all of its costs associated with the foreign operations located in Europe, the Pacific Rim, Japan, and Israel are denominated in the respective local currency and translated into U.S. dollars for consolidation and reporting. As a result, the Company is exposed to risks to the extent that the rate of inflation in Europe, the Pacific Rim, Japan, or Israel exceeds the rate of devaluation of their related foreign currency in relation to the U.S. dollar or if the timing of such devaluations lags behind inflation in Europe, the Pacific Rim, Japan, or Israel. In that event, the cost of the Company’s operations in Europe, the Pacific Rim, Japan, and Israel measured in terms of U.S. dollars will increase and the U.S. dollar-measured results of operations will suffer. Historically, Israel has experienced periods of high inflation.
Dependence on Key Personnel; Competition for Employees
The continued growth and success largely depends on the managerial and technical skills of key technical, sales and management personnel. In particular, the Company’s business and operations are substantially dependent of the performance of Zack B. Bergreen, the founder and chief executive officer. If Mr. Bergreen were to leave or become unable to perform services for the Company, the business would likely be harmed.
25
The Company’s success also depends, to a substantial degree, upon its continuing ability to attract, motivate and retain other talented and highly qualified personnel. Competition for key personnel is intense, particularly so in recent years. From time to time the Company has experienced difficulty in recruiting and retaining talented and qualified employees. There can be no assurance that the Company can retain its key technical, sales and managerial employees or that it can attract, assimilate or retain other highly qualified technical, sales and managerial personnel in the future. If the Company fails to attract or retain enough skilled personnel, its product development efforts may be delayed, the quality of its customer service may decline and sales may decline.
Concentration of Ownership
Currently, Zack B. Bergreen, the Company’s chief executive officer, has approximately a 45% beneficial ownership of the outstanding Common Stock of the Company, which includes 826,000 shares of Series A Convertible Preferred Stock. As a result, Mr. Bergreen exercises significant control over the Company through his ability to influence and control the election of directors and all other matters that require action by the Company’s stockholders. Under certain circumstances, Mr. Bergreen could prevent or delay a change of control of the Company which may be favored by a significant portion of the Company’s other stockholders, or cause a change of control not favored by the majority of the Company’s other stockholders. Mr. Bergreen’s ability under certain circumstances to influence, cause or delay a change in control of the Company also may have an adverse effect on the market price of the Company’s Common Stock.
Possible Volatility of Stock Price
The market price of the Common Stock has in the past been, and may continue to be, subject to significant fluctuations in response to, and may be adversely affected by, variations in quarterly operating results, changes in earnings estimates by analysts, developments in the software industry, and adverse earnings or other financial announcements of the Company’s customers as well as other factors. In addition, the stock market can experience extreme price and volume fluctuations from time to time, which may bear no meaningful relationship to the Company’s performance. Broad market fluctuations, as well as economic conditions generally and in the software industry specifically, may result in material adverse effects on the market price of the Company’s Common Stock.
Limitations of the Company Charter Documents
The Company’s Certificate of Incorporation and By-Laws contain provisions that could discourage a proxy contest or make more difficult the acquisition of a substantial block of the Company’s Common Stock, including provisions that allow the Board of Directors to take into account a number of non-economic factors, such as the social, legal and other effects upon employees, suppliers, customers and creditors, when evaluating offers for the Company’s acquisition. Such provisions could limit the price that investors might be willing to pay in the future for the Company’s shares of Common Stock. The Board of Directors is authorized to issue, without stockholder approval, up to 5,000,000 shares of preferred stock with voting, conversion and other rights and preferences that may be superior to the Company’s Common Stock and that could adversely affect the voting power or other rights of our holders of Common Stock. There are currently 826,000 of convertible preferred stock shares outstanding. The issuance of preferred stock or of rights to purchase preferred stock could be used to discourage an unsolicited acquisition proposal.
Item 1B. Unresolved Staff Comments
None
26
Item 2. Properties.
The Company’s headquarters are located in a leased facility of approximately 22,000 square feet in Horsham, Pennsylvania which runs through April 2014. The Company also leases facilities for operational activities in Irvine, California; Culemborg, Netherlands; and Karmiel, Israel, and for sales and customer support activities in Cranfield, England; Tokyo, Japan; and St. Leonards, Australia. The Company believes that suitable additional or alternative office space will be available in the future on commercially reasonable terms as needed.
Item 3. Legal Proceedings.
None
Item 4. Reserved.
27
PART II
Item 5. Market for Registrant’s Common Equity and Related Stockholder Matters and Issuer Purchases of Equity Securities.
The Company’s Common Stock is traded on Capital Market of NASDAQ under the symbol “ATEA.” The following table sets forth the high and low closing sale prices for the Common Stock as reported by the NASDAQ for the past two fiscal years:
|
2009
|
High
|
Low
|
||||||
|
First quarter
|
$ | 2.97 | $ | 1.30 | ||||
|
Second quarter
|
2.99 | 2.01 | ||||||
|
Third quarter
|
3.70 | 2.02 | ||||||
|
Fourth quarter
|
3.50 | 2.75 | ||||||
|
2008
|
High
|
Low
|
||||||
|
First quarter
|
$ | 5.77 | $ | 3.07 | ||||
|
Second quarter
|
5.90 | 3.37 | ||||||
|
Third quarter
|
4.15 | 2.98 | ||||||
|
Fourth quarter
|
3.75 | 1.86 | ||||||
As of March 18, 2010, there were approximately 44 holders of record of the Company’s Common Stock. On March 18, 2010, the last reported sale price of the Common Stock as reported by NASDAQ was $3.50 per share. The Company currently has outstanding 826,000 shares of convertible preferred stock.
Dividend Policy
The Board of Directors from time to time reviews the Company’s forecasted operations and financial condition to determine whether and when payment of a dividend or dividends on common stock is appropriate. No dividends have been declared since June 2000. The Company has no intention at this time to pay dividends on its common stock. Consequently, shareholders will need to sell their shares of our common stock to realize a return on their investment, if any.
In September 2008, the Company issued convertible preferred stock. Dividends accrue daily at an initial rate of 6% and are payable quarterly only when they are declared by the board of directors. The first dividend was paid at the end of 2008. If a dividend is not declared and paid quarterly, then the dividend accrual rate will increase to 8% until it is paid. After 2 years from the date of issuance, September 5, 2010, the annual dividend rate increases from 6% to 10%.
28
Securities Authorized for Issuance Under Equity Compensation Plans
|
Plan Category
|
Number of Securities to be Issued upon Exercise of Outstanding Options, Warrants & Rights
|
Weighted Average Exercise Price of Outstanding Options, Warrants & Rights
|
Number of Securities Remaining Available for Future Issuance Under Equity Compensation Plans (excluding securities reflected in column (a))
|
|
(a)
|
(b)
|
(c)
|
|
|
Equity compensation plans approved by security holders
|
531,000
|
$5.20
|
79,000
|
|
Equity compensation plans not approved by security holders
|
-
|
-
|
-
|
|
Total
|
531,000
|
$5.20
|
79,000
|
29
Stock Performance Graph
The following graph compares the percentage change in cumulative total stockholder return on the Common Stock during the period from December 31, 2004 through December 31, 2009 with cumulative total return on (i) a peer group that includes all organizations in the Company’s Standard Industrial Classification (SIC) Code 7372-Prepackaged Software , (ii) the Nasdaq Market Index, and (iii) the S&P Smallcap 600 Index. The comparison assumes that $100 was invested on December 31, 2004 in the Common Stock and in each of the foregoing indices, and assumes reinvestment of dividends, if any.
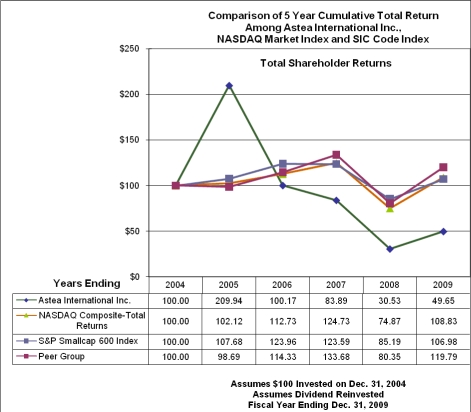
30
Item 6. Selected Financial Data.
|
Years ended December 31,
|
2009
|
2008
|
2007
|
2006
|
2005
|
|||||||||||||||
|
(in thousands, except per share data)
|
||||||||||||||||||||
|
Consolidated Statement of Income Data:
|
||||||||||||||||||||
|
Revenues:
|
||||||||||||||||||||
|
Software license fees
|
$ | 2,665 | $ | 3,273 | $ | 8,089 | $ | 3,431 | $ | 8,057 | ||||||||||
|
Services and maintenance
|
17,438 | 20,578 | 22,281 | 14,751 | 13,908 | |||||||||||||||
|
Total revenues
|
20,103 | 23,851 | 30,370 | 18,182 | 21,965 | |||||||||||||||
|
Cost and Expenses:
|
||||||||||||||||||||
|
Cost of software license fees
|
1,926 | 2,852 | 2,641 | 1,687 | 1,178 | |||||||||||||||
|
Cost of services and maintenance
|
10,496 | 12,099 | 11,908 | 10,262 | 8,261 | |||||||||||||||
|
Product development
|
2,283 | 4,224 | 4,402 | 3,842 | 2,461 | |||||||||||||||
|
Sales and marketing
|
3,445 | 4,735 | 5,319 | 5,923 | 6,192 | |||||||||||||||
|
General and administrative
|
2,815 | 3,103 | 3,405 | 3,757 | 3,003 | |||||||||||||||
|
Total costs and expenses (1)
|
20,965 | 27,013 | 27,675 | 25,471 | 21,095 | |||||||||||||||
|
(Loss) income from operations
before interest and taxes
|
(862 | ) | (3,162 | ) | 2,695 | (7,289 | ) | 870 | ||||||||||||
|
Interest income
|
38 | 68 | 111 | 234 | 165 | |||||||||||||||
|
(Loss) income from
operations before income taxes
|
(824 | ) | (3,094 | ) | 2,806 | (7,055 | ) | 1,035 | ||||||||||||
|
Income tax expense
|
75 | 41 | 41 | 29 | 7 | |||||||||||||||
|
Net (loss) profit
|
(899 | ) | (3,135 | ) | 2,765 | (7,084 | ) | 1,028 | ||||||||||||
|
Preferred dividend
|
290 | 79 | - | - | - | |||||||||||||||
|
Net (loss) income available to common stockholders
|
$ | (1,189 | ) | $ | (3,214 | ) | $ | 2,765 | $ | (7,084 | ) | $ | 1,028 | |||||||
|
Basic and diluted (loss) income per share
|
$ | (.33 | ) | $ | (.90 | ) | $ | .78 | $ | (2.00 | ) | $ | .33 | |||||||
|
Shares used in computing basic (loss) income
per share
|
3,554 | 3,554 | 3,550 | 3,547 | 3,093 | |||||||||||||||
|
Shares used in computing diluted (loss) income
per share
|
3,554 | 3,554 | 3,550 | 3,547 | 3,116 | |||||||||||||||
|
Consolidated Balance Sheet Data at December 31,
|
||||||||||||||||||||
|
Working capital (deficit)
|
$ | 1,111 | $ | 1,294 | $ | 323 | $ | (3,580 | ) | $ | 5,495 | |||||||||
|
Total assets
|
14,270 | 15,166 | 17,560 | 18,059 | 21,612 | |||||||||||||||
|
Long-term debt, less current portion
|
- | - | - | - | - | |||||||||||||||
|
Accumulated deficit
|
(23,903 | ) | (23,004 | ) | (19,869 | ) | (22,634 | ) | (15,550 | ) | ||||||||||
|
Total stockholders’ equity
|
6,486 | 7,172 | 7,108 | 3,815 | 10,459 | |||||||||||||||
|
(1)
|
Results for 2009, 2008, 2007 and 2006 include expense of $187,000, $308,000, $305,000 and $397,000 respectively for stock compensation plans effective at January 1, 2006. Prior year does not contain cost of stock compensation plans.
|
31
Item 7. Management’s Discussion and Analysis of Financial Condition and Results of Operations.
Overview
The Company develops, markets and supports service management software solutions, which are licensed to companies that sell and service equipment, or sell and deliver professional services. The Company’s principal product offerings, Astea Alliance and FieldCentrix Enterprise suites, integrate and automate sales and service business processes and are designed to assist its users to increase competitive advantages, top-line revenue growth and profitability through better management of information, people, assets and cash flows. We believe that Astea Alliance offers substantially broader and far superior capabilities over the Company’s predecessor product, DISPATCH-1, which was designed for only field service and customer support management applications.
The Company’s products and services are primarily used in industries such as information technology, medical devices and diagnostic systems, industrial controls and instrumentation, retail systems, office automation, imaging systems, facilities management and telecommunications. An eclectic group of other industries, all with equipment sales and service requirements, are also represented in Astea’s customer base. The Company maintains offices in the United States, United Kingdom, Australia, Israel, Japan and The Netherlands.
The Company generates revenues from two sources: software license fees for its software products, and services and maintenance revenues from professional services, which includes consulting, implementation, training and maintenance related to those products.
Software license fees accounted for 13% of the Company’s total revenues in 2009, which was fairly evenly split between sales of Astea Alliance and FieldCentrix. Software license fee revenues also include some fees from the sublicensing of third-party software, primarily knowledge management, mapping and analytical software licenses. Typically, customers pay a license fee for the software based on the number of licensed users. Depending on the contract terms and conditions, software license fees are recognized as revenue upon delivery of the product if no significant vendor obligations remain and collection of the resulting receivable is deemed probable. If significant vendor obligations exist at the time of delivery or if the product is subject to uncertain customer acceptance, revenue is deferred until no significant obligations remain or acceptance has occurred.
The remaining component of the Company’s revenues consists principally of fees derived from professional services associated with the implementation and deployment of the Company’s software products and maintenance fees for ongoing customer support, primarily external customer technical support services and product enhancements. Professional services (including training) are charged on an hourly or daily basis and billed on a regular basis pursuant to customer work orders. Training services may also be charged on a per-attendee basis with a minimum daily charge. Out-of-pocket expenses incurred by Company personnel performing professional services are typically reimbursed by the customer. The Company recognizes revenue from professional services as the services are performed. Maintenance fees are typically paid to the Company under written agreements entered into at the time of the initial software license. Maintenance revenue, which is generally invoiced annually, is recognized ratably over the term of the agreement.
Critical Accounting Policies and Estimates
The Company’s significant accounting policies are more fully described in its Summary of Accounting Policies, Note 2, to the Company’s consolidated financial statements. The preparation of financial statements in conformity with accounting principles generally accepted within the United States of America requires management to make estimates and assumptions in certain circumstances that affect amounts reported in the accompanying financial statements and related notes. In preparing these financial statements, management has made its best estimates and judgments of certain amounts included in the financial statements, giving due consideration to materiality. The Company does not believe there is a great likelihood that materially different amounts would be reported related to the accounting policies described below; however, application of these accounting policies involves the exercise of judgments and the use of assumptions as to future uncertainties and, as a result, actual results could differ from these estimates.
32
Revenue Recognition
Astea’s revenue is principally recognized from two sources: (i) licensing arrangements and (ii) services and maintenance.
The Company markets its products primarily through its direct sales force and resellers. License agreements do not provide for a right of return, and historically, product returns have not been significant.
The Company recognizes revenue from license sales when all of the following criteria are met: persuasive evidence of an arrangement exists, delivery has occurred, the license fee is fixed and determinable and the collection of the fee is probable. We utilize written contracts as a means to establish the terms and conditions by which our products support and services are sold to our customers. Delivery is considered to have occurred when title and risk of loss have been transferred to the customer, which generally occurs after a license key has been delivered electronically to the customer. Revenue for arrangements with extended payment terms in excess of one year is recognized when the payments become due, provided all other recognition criteria are satisfied. If collectability is not considered probable, revenue is recognized when the fee is collected. Our typical end user license agreements do not contain acceptance clauses. However, if acceptance criteria are required, revenues are deferred until customer acceptance has occurred.
If these criteria are not met, then revenue is deferred until such criteria are met or until the period(s) over which the last undelivered element is delivered. If there is objective and reliable evidence of fair value for all units of accounting in an arrangement, the arrangement consideration is allocated to the separate units of accounting based on each unit's relative fair value. There may be cases, however, in which there is objective and reliable evidence of fair value of the undelivered item(s) but no such evidence for the delivered item(s). In those cases, the residual method is used to allocate the arrangement consideration. Under the residual method, the amount of consideration allocated to the delivered item(s) equals the total arrangement consideration less the aggregate fair value of the undelivered item(s). We apply the revenue recognition policies discussed below to each separate unit of accounting.
Astea allocates revenue to each element in a multiple-element arrangement based on the elements’ respective fair value, determined by the price charged when the element is sold separately. Specifically, Astea determines the fair value of the maintenance portion of the arrangement based on the price, at the date of sale, if sold separately, which is generally a fixed percentage of the software license selling price. The professional services portion of the arrangement is based on hourly rates which the Company charges for those services when sold separately from software. If evidence of fair value of all undelivered elements exists, but evidence does not exist for one or more delivered elements, then revenue is recognized using the residual method. If an undelivered element for which evidence of fair value does not exist, all revenue in an arrangement is deferred until the undelivered element is delivered or fair value can be determined. Under the residual method, the fair value of the undelivered elements is deferred and the remaining portion of the arrangement fee is recognized as revenue. The proportion of the revenue recognized upon delivery can vary from quarter-to-quarter depending upon the determination of vendor-specific objective evidence (“VSOE”) of fair value of undelivered elements. The residual value, after allocation of the fee to the undelivered elements based on VSOE of fair value, is then allocated to the perpetual software license for the software products being sold.
33
When appropriate, the Company may allocate a portion of its software revenue to post-contract support activities or to other services or products provided to the customer free of charge or at non-standard rates when provided in conjunction with the licensing arrangement. Amounts allocated are based upon standard prices charged for those services or products which, in the Company’s opinion, approximate fair value. Software license fees for resellers or other members of the indirect sales channel are based on a fixed percentage of the Company’s standard prices. The Company recognizes software license revenue for such contracts based upon the terms and conditions provided by the reseller to its customer.
Revenue from post-contract support is recognized ratably over the term of the contract, which is generally twelve months on a straight-line basis. Consulting and training service revenue is generally unbundled and recognized at the time the service is performed. Fees from licenses sold together with consulting services are generally recognized upon shipment, provided that the contract has been executed, delivery of the software has occurred, fees are fixed and determinable and collection is probable.
We believe that our accounting estimates used in applying our revenue recognition are critical because:
|
|
•
|
the determination that it is probable that the customer will pay for the products and services purchased is inherently judgmental;
|
|
|
•
|
the allocation of proceeds to certain elements in multiple-element arrangements is complex;
|
|
|
•
|
the determination of whether a service is essential to the functionality of the software is complex;
|
|
|
•
|
establishing company-specific fair values of elements in multiple-element arrangements requires adjustments from time-to-time to reflect recent prices charged when each element is sold separately; and
|
|
|
•
|
the determination of the stage of completion for certain consulting arrangements is complex.
|
Changes in the aforementioned items could have a material effect on the type and timing of revenue recognized.
If we were to change our pricing approach in the future, this could affect our revenue recognition estimates, in particular, if bundled pricing precludes establishment of VSOE.
We present taxes assessed by a governmental authority including sales, use, value added and excise taxes on a net basis and, therefore, the presentation of these taxes is excluded from our revenues and is included in accrued expenses in the accompanying consolidated balance sheets until such amounts are remitted to the taxing authority.
Cost of Software License Fees
Cost of software license fees includes amortization of the capitalized software development cost and third party license sold to customers.
Cost of Services and Maintenance
Cost of services and maintenance includes compensation and benefits provided to our professional service employees, independent consultants, telecommunication cost, unreimbursed travel expenses, and facility costs.
Product Development
Cost of product development includes our research and development expenses which consist primarily of personnel and related costs, including salaries and employee benefits for software engineers. To date, our product development efforts have been devoted to new products and service offerings and increases in features and functionality of our existing products and services.
Cost of Sales and Marketing
Cost of sales and marketing includes compensation and benefits from our sales force and marketing team, telecommunications cost, marketing and sales costs, professional fees and facility costs.
34
General and Administrative Costs
Cost of general and administrative costs include salaries, benefits and related costs for the Company’s finance, administrative and executive management personnel, accounting costs, bad-debt expense, legal costs, professional fees, corporate facility costs, and other costs associated with being a public company.
Depreciation and Amortization
Depreciation is calculated on a straight-line basis over the estimated useful lives of the assets, which range from three to ten years for computers and related equipment, furniture and fixtures, software and office equipment, and the lesser of the lease term or estimated useful life for leasehold improvements. Intangible assets are being amortized using the straight-line method over the estimated useful lives which range from five to ten years.
Deferred Revenue
Deferred revenue includes amounts billed to or received from customers for which revenue has not been recognized. This generally results from post-contract support, software installation, consulting and training services not yet rendered or license revenue which has been deferred until all revenue recognition requirements have been met or services are performed.
Accounts Receivable and Allowance for Doubtful Accounts
The Company evaluates the adequacy of its allowance for doubtful accounts at the end of each quarter. In performing this evaluation, the Company analyzes the payment history of its customer accounts that are significantly past due, subsequent cash collections on these accounts and comparative accounts receivable aging statistics. Based on this information, along with consideration of the general strength of the economy, the Company develops what it considers to be a reasonable estimate of the uncollectible amounts included in accounts receivable. This estimate involves significant judgment by the management of the Company. Actual uncollectible amounts may differ from the Company’s estimate.
Unbilled receivables are established when revenue is deemed to be recognized based on the Company’s revenue recognition policy, but due to contractual restraints over timing of invoicing, the Company does not have the right to invoice the customer.
We believe that our estimate of our allowance for doubtful accounts is critical because of the significance of our accounts receivable balance relative to total assets. If the general economy deteriorated, or factors affecting the profitability or liquidity of the industry changed significantly, then this could affect the accuracy of our allowance for doubtful accounts.
Capitalized Software and Research and Development Costs
The Company capitalizes software development costs incurred during the period subsequent to the establishment of technological feasibility through the product’s availability for general release. Costs incurred prior to the establishment of technological feasibility are charged to product development expense. Product development expense includes payroll, employee benefits, other headcount-related costs associated with product development and any related costs to third parties under sub-contracting or net of any collaborative arrangements.
Software development costs are amortized on a product-by-product basis over the greater of the ratio of current revenues to total anticipated revenues or on a straight-line basis over the estimated useful lives of the products beginning with the initial release to customers. The Company’s estimated life for its capitalized software products is two years based on current sales trends and the rate of product release. The Company continually evaluates whether events or circumstances have occurred that indicate that the remaining useful life of the capitalized software development costs should be revised or that the remaining balance of such assets may not be recoverable. The Company evaluates the recoverability of capitalized software based on the estimated future revenues of each product.
35
We believe that our estimate of our capitalized software costs and the period for their amortization is critical because of the significance of our balance of capitalized software costs relative to our total assets. Potential impairment is determined by comparing the balance of unamortized capitalized software costs to the sales revenue projected for a capitalized software product. If efforts to sell that software product are terminated, or if the projected sales revenue from that software product drops below a level that is less than the unamortized balance, then an impairment would be recognized.
Goodwill
Part of the purchase price for the FieldCentrix assets, acquired September 21, 2005, included the acquisition of goodwill. Goodwill is tested for impairment on an annual basis as of October 1. It is also tested between annual tests if indicators of potential impairment exists, as for example when the Company’s market capitalization significantly declines for a sustained period, using a fair-value-based approach. The Company uses a two step method for determining goodwill impairment, the market and income approaches. The market approach analyzed the market valuations of similar companies in our peer group based on recent market conditions. The income approach analyzed the Company’s expectation for future results based on current and expected economic conditions. No impairment of goodwill has been identified during any of the periods presented.
The determination of the fair value of the reporting unit and the allocation of that value to individual assets and liabilities within the reporting unit requires the Company to make significant estimates and assumptions. These estimates and assumptions primarily include, but are not limited to: the selection of appropriate peer group companies; control premiums appropriate for acquisitions in the industries in which the Company competes; the discount rate; terminal growth rates; and forecasts of revenue, operating income, depreciation and amortization, and capital expenditures.
Due to the inherent uncertainty involved in making these estimates, actual financial results could differ from those estimates. In addition, changes in assumptions concerning future financial results or other underlying assumptions could have a significant impact on either the fair value of the reporting unit or the amount of the goodwill impairment charge.
Acquired Intangible Assets
Acquired intangible assets (excluding goodwill) are amortized on a straight-line basis over their estimated useful lives and reviewed for impairment on an annual basis, or on an interim basis if an event or circumstance occurs between annual tests indicating that the assets might be impaired. The impairment test will consist of comparing the undiscounted cash flows expected to be generated by the acquired intangible asset to its carrying amount. If the asset is considered to be impaired, an impairment loss will be recognized in an amount by which the carrying amount of the asset exceeds its fair value.
Stock-Based Compensation – Option Plans
The Company records stock based compensation using the modified prospective transition method. Under this method, compensation costs recognized in 2009 include (a) compensation costs for all share-based payments granted to employees and directors prior to, but not yet vested as of January 1, 2006, based on the grant date value estimated and (b) compensation cost for all share-based payments granted subsequent to January 1, 2006, based on the grant date fair value.
36
The fair value of stock option awards was estimated using a Black-Scholes closed-form option valuation model. This model requires the input of assumptions including expected stock price volatility, expected term and estimated forfeitures of each award.
Accounting for Income Taxes
Deferred tax assets and liabilities are determined based on differences between financial reporting and tax bases of assets and liabilities and operating loss and tax credit carryforwards and are measured using the enacted tax rates and laws that will be in effect when the difference and carryforwards are expected to be recovered or settled. A valuation allowance for deferred tax assets is provided when we estimate that it is more likely than not that all or a portion of the deferred tax assets may not be realized through future operations. This assessment is based upon consideration of available positive and negative evidence which includes, among other things, our most recent results of operations and expected future profitability. We consider our actual historical results to have a stronger weight than other more subjective indicators when considering whether to establish or reduce a valuation allowance on deferred tax assets.
As of December 31, 2009, we had approximately $15.1 million of net deferred tax assets, against which we provided a 100% valuation allowance. Our net deferred tax assets were generated primarily by operating losses. Accordingly, it is more likely than not, that we will not realize these assets through future operations.
The Company prescribes a recognition threshold and measurement attribute for the financial statement recognition and measurement of a tax position taken or expected to be taken in a tax return. Estimated interest is recorded as a component of interest expense and penalties are recorded as a component of general and administrative expenses.
In 2008, the Israel Taxing Authority “ITA” notified the Company that it intends to re-examine a 2002 transaction that it had previously approved. The Company is vigorously defending itself in court and based on information to date, does not expect this issue to result in any additional tax to the Company.
Convertible Preferred Stock
On September 24, 2008, the Company sold 826,000 shares of Series-A Convertible Preferred Stock (“preferred stock”) to its Chief Executive Officer at a price of $3.63 per share for a total of $3,000,000. Dividends accrue daily on the preferred stock at an initial rate of 6% and shall be payable only when, as and if declared by the Company’s Board of Directors, quarterly in arrears.
The preferred stock may be converted into common stock at the initial rate of one share of common for each share of preferred stock. After six months, there is no limit on the number of shares that may be converted. Commencing two years after issuance, the Company shall have certain rights to cause conversion of all of the shares of preferred stock then outstanding. Commencing four years after issuance, the Company may redeem, subject to board approval, all of the shares of preferred stock then outstanding at a price equal to the greater of (i) 130% of the purchase price plus all accrued and unpaid dividends and (ii) the fair market value of such number of shares of common stock which the holder of the preferred stock would be entitled to receive had the redeemed preferred stock been converted immediately prior to the redemption.
In accordance with relevant accounting guidance, the Company recorded the preferred stock on the Company’s consolidated balance sheet within Stockholders’ Equity. The preferred stock is recorded on the consolidated balance sheet at the amount of net proceeds received less an imputed dividend cost. The imputed dividend cost of $218,000 was the result of the preferred stock having a dividend rate during the first two years after its issuance (6%) that is lower than the rate that becomes fixed (10%) after the initial two year period. The imputed dividend cost of $218,000 is being amortized over the first two years from the date of issuance and is based upon the present value of the dividend discount using a 10% yield.
37
Recently Adopted Accounting Guidance
In May 2009, we adopted the authoritative guidance issued by the Financial Accounting Standards Board (“FASB”) which established general standards of accounting for and disclosure of events that occur after the balance sheet date but before financial statements are issued or are available to be issued. The adoption of the guidance did not have a material impact on the our financial statements.
In June 2009, the FASB issued, “The FASB Accounting Standards Codification ™ and the Hierarchy of Generally Accepted Accounting Principles”. This establishes the Codification as the source of authoritative GAAP recognized by the FASB to be applied by nongovernmental entities. Rules and interpretive releases of the SEC under federal securities laws are also sources of authoritative GAAP for SEC registrants. All guidance contained in the Codification carries an equal level of authority. This is effective for financial statements issued for the interim and annual periods ending after September 15, 2009.
In September 2009, guidance was issued by the FASB that addresses the effect on the calculation of earnings per share for a period that includes the redemption or induced conversion of preferred stock. The guidance addresses the difference between the (1) fair value of the consideration transferred to the holders of preferred stock and (2) the carrying amount of the preferred stock in the registrant’s balance sheet should be subtracted from net income to arrive at income available to commons stockholders in the calculation of earnings per share. Adoption of this new guidance did not have a material impact on our financial statements.
On January 1, 2009, we adopted authoritative guidance issued by FASB on business combinations. The guidance retains the fundamental requirements that the acquisition method of accounting (previously referred to as the purchase method of accounting) be used for all business combinations, but requires a number of changes, including changes in the way assets and liabilities are recognized and measured as a result of business combinations. It also requires the capitalization of in-process research and development at fair value and requires the expensing of acquisition-related costs as incurred. We adopted this guidance for all business combinations that occur after January 1, 2009. The adoption of this guidance did not have a material impact on our financial statements.
On January 1, 2009, we adopted the authoritative guidance issued by the FASB that changes the accounting and reporting for non-controlling interests. Non-controlling interests are to be reported as a component of equity separate from the parent’s equity, and purchases or sales of equity interests that do not result in a change in control are to be accounted for as equity transactions. In addition, net income attributable to a non-controlling interest is to be included in net income and, upon a loss of control, the interest sold, as well as any interest retained, is to be recorded at fair value with any gain or loss recognized in net income. Adoption of the new guidance did not have a material impact on our financial statements.
On January 1, 2009, we adopted the authoritative guidance on fair value measurement for nonfinancial assets and liabilities, except for items that are recognized or disclosed at fair value in the financial statements on a recurring basis (at least annually). Adoption of the new guidance did not have a material impact on our financial statements.
Recent Accounting Guidance Not Yet Adopted
In January 2010, the FASB issued guidance to amend the disclosure requirements related to recurring and nonrecurring fair value measurements. The guidance requires new disclosure on the transfers of assets and liabilities between Level 1 (quoted prices in active market for identical assets or liabilities) and Level 2 (significant other observable inputs) of fair value measurements hierarchy, including the reasons and the timing of the transfers. Additionally, the guidance requires a roll forward of activities on purchases, sales, issuance, and settlements of the assets and liabilities measured using significant unobservable inputs (Level 3 fair value measurements). The guidance will become effective with the reporting period beginning January 1, 2010, except for the disclosure on the roll forward activities for Level 3 fair value measurements, which will become effective for the reporting period beginning July 1, 2011. We believe adoption of this new guidance will not have a material impact on our financial statements.
38
In October 2009, the FASB issued authoritative guidance on revenue recognition that will become effective for us beginning July 1, 2010, with earlier adoption permitted. Under the new guidance, arrangements that include software elements, tangible products that have software components that are essential to the functionality of the tangible product will no longer be within the scope of the software revenue recognition guidance. Software-enabled products will now be subject to other relevant revenue recognition guidance. Additionally, the FASB issued authoritative guidance on revenue arrangements with multiple deliverables that are outside the scope of the software revenue recognition guidance. Under the new guidance, when vendor specific objective evidence or third party evidence for deliverables in an arrangement cannot be determined, a best estimate of the selling price is required to separate deliverables and allocate arrangement consideration using the relative selling price method. The new guidance includes new disclosure requirements on how the application of the relative selling price method affects the timing and amount of revenue recognition. We believe adoption of this new guidance will not have a material impact on our financial statements.
In June 2009, the FASB issued authoritative guidance on the consolidation of variable interest entities, which is effective for us beginning January 1, 2010. The new guidance requires revised evaluations of whether entities represent variable interest entities, ongoing assessments of control over such entities, and additional disclosures for variable interests. We believe adoption of this new guidance will not have a material impact on our financial statements.
Results of Operations
The following table sets forth for the periods indicated, selected financial data and the percentages of the Company’s total revenues represented by each line item presented for the periods presented:
|
Years ended December 31,
|
2009
|
2008
|
||||
|
Revenues:
|
||||||
|
Software license fees
|
13.3
|
%
|
13.7
|
%
|
||
|
Services and maintenance
|
86.7
|
86.3
|
||||
|
Total revenues
|
100.0
|
%
|
100.0
|
%
|
||
|
Costs and expenses:
|
||||||
|
Cost of software license fees
|
9.6
|
%
|
12.0
|
%
|
||
|
Cost of services and maintenance
|
52.2
|
50.7
|
||||
|
Product development
|
11.4
|
17.7
|
||||
|
Sales and marketing
|
17.1
|
19.9
|
||||
|
General and administrative
|
14.0
|
12.9
|
||||
|
Total costs and expenses
|
104.3
|
113.3
|
||||
|
Net (loss)
|
(4.5)
|
%)
|
(13.1)
|
%)
|
||
39
Comparison of Years Ended December 31, 2009 and 2008
Revenues. Total revenues decreased $3,748,000 or 16%, to $20,103,000 for the year ended December 31, 2009 from $23,851,000 for the year ended December 31, 2008. Software license revenues decreased 19% in 2009, compared to 2008. Services and maintenance fees for 2009 amounted to $17,438,000, a 15% decrease from 2008.
Software license fee revenues decreased $608,000 or 19% to $2,665,000 in 2009 from $3,273,000 in 2008. Astea Alliance license revenues decreased to $1,256,000 in 2009 from $2,300,000 in 2008, a decrease of 45%. The overall decrease is attributable to a significant decline in license sales in most regions of the world in which the Company operates resulting from the economic slowdown affecting the entire world in 2009. However, license sales in Europe increased 226% over 2008 due to renewed marketing efforts and a very low base in 2008. The timing of the sales cycle continues to be long, which further extends the time to convert a sales opportunity into a completed sale. The Company sold $1,409,000 of FieldCentrix licenses in 2009 compared to $973,000 in 2008, an increase of 45%. The Company did not have any license revenue in 2009 or 2008 from its existing DISPATCH-1 customers.
Total services and maintenance revenues decreased $3,140,000 or 15% to $17,438,000 in 2009 from $20,578,000 in 2008. Service and maintenance revenue declined $3,191,000, or 21% on the Astea Alliance products. The primary cause of the decline in service and maintenance revenue resulted from a reduction in implementation projects due to lower license sales. There were a number of ongoing projects as well as upgrades of existing customers from older versions of the Company’s software to its latest versions. FieldCentrix service and maintenance revenue increased $96,000, which is 2% over its 2008 revenues. The slight increase resulted mostly from ongoing projects within its install base of customers. DISPATCH-1 service and maintenance revenues decreased by 12% to $320,000 in 2009 from $364,000 in 2008. Due to the decreasing demand for DISPATCH-1 professional services and the lack of any related product development by the Company, the decrease in service and maintenance revenue is expected to continue beyond 2009.
In 2009 and 2008 no customers represented 10% or more of total revenues.
Costs of Revenues. Costs of software license fee revenues decreased 32% to $1,926,000 in 2009 from $2,852,000 in 2008. The decrease results from decreased amortization of capitalized software development costs related to version 8, which was fully amortized after the first quarter of 2009 compared to a full year’s amortization in 2008. Amortization of capitalized software decreased 34% to $1,736,000 in 2009 from $2,639,000 in 2008. The gross margin percentage on software license sales was 28% in 2009 and 13% in 2008. The slight improvement in the margin results from the overall decrease in cost of sales discussed above, partially offset by a reduction in license revenue.
Costs of services and maintenance revenues decreased 13% to $10,496,000 in 2009 from $12,099,000 in 2008. The decrease in cost of services and maintenance was primarily attributed to decreases in salary expense resulting from worldwide cost containment programs and a decline in share based compensation expense for employees which declined from $44,000 in 2008 to $17,000 in 2009. The service and maintenance gross margin percentage decreased slightly to 40% in 2009 from 41% in 2008. The decreased margin was primarily attributable to pricing pressure on professional services in 2009 resulting from the world-wide economic recession and lower license sales in 2009.
Product Development. Product development expense decreased 46%, or $1,941,000, to $2,283,000 in 2009 from $4,224,000 in 2008. Development costs decreased due to an 11% decrease in headcount in 2009 from the same period in 2008. In addition, the exchange rate of the Israeli shekel, the country where most of the Company’s development is performed, decreased by 10% in value over 2009 compared to 2008. Additionally, $16,000 in share based compensation expense for employees was recorded at December 31, 2009 compared to $42,000 expense for year ending December 31, 2008.
40
Product development as a percentage of total revenue decreased to 11% in 2009 compared to 18% in 2008. This decrease in costs relative to expenses was due to the overall decrease in product development expense in 2009 compared to 2008. Gross development expense before the capitalization of software costs and was $4,044,000 in 2009, a 36% decrease from $6,342,000 in 2008. Capitalized software totaled $1,761,000 in 2009 compared to $2,118,000 in 2008. The decrease in capitalized software of 17% over last year resulted from the headcount reduction and improved foreign exchange rates. In 2009, the Company released version 9.0 of its Astea Alliance product. In 2008, the Company released version 4.5 of its FieldCentrix offering.
Sales and Marketing. Sales and marketing expenses decreased 27%, or $1,290,000, to $3,445,000 in 2009 from $4,735,000 in 2008. The decrease was primarily the result of a 16% reduction in headcount during 2009, lower commissions paid due to lower license sales in 2009 and the Company’s overall aggressive cost containment program. Additionally, $3,000 in share based compensation expense for employees was expensed in 2009 compared to $31,000 expensed in 2008. The Company continues to focus on improving its market presence through intensified marketing efforts to increase awareness of the Company’s products. This occurs through the use of Webinars focused in the vertical industries in which the Company operates, attendance at selected trade shows, and increased efforts in lead generation for its sales force. Sales and marketing expense as a percentage of total revenues decreased to 17% in 2009 from 20% in 2008 principally resulting from the decrease in costs in 2009 compared to 2008.
General and Administrative. General and administrative expenses consist of salaries, benefits and related costs for the Company’s finance, administrative and executive management personnel, legal costs, accounting costs, bad debt expense and various costs associated with the Company’s status as a public company. The Company’s general and administrative expenses were $2,815,000 in 2009 and $3,103,000 in 2008. Expenses in 2009 declined $288,000, a 9% decrease. This decrease is primarily due to a decrease in compensation expense resulting from a pay reduction. In addition, share based compensation expense decreased by $40,000 from 2008 to $151,000 in 2009. As a percentage of total revenues, general and administrative expenses amounted to 14% in 2009 compared to 13% in 2008. The slight increase in expenses relative to revenues primarily results from the decrease in revenues and the fixed nature of many of these expenses.
Interest Income. Net interest income decreased $30,000, to $38,000 in 2009 from $68,000 in 2008. This decrease was primarily attributable to a decline in interest rates in 2009 compared to 2008.
Income Tax Expense. The deferred tax assets and liabilities are recognized using enacted tax rates for the effect of temporary differences between the book and tax basis of recorded assets and liabilities. A valuation allowance is established if it is more likely than not that some portion or all of the deferred tax asset will not be realized. Based on the Company’s current year and historical operating losses, the Company determined maintaining a full valuation allowance was appropriate. The Company recorded a provision of $75,000 in 2009 and $41,000 in 2008 for income taxes. In 2009 and 2008, $36,000 and $41,000, respectively, of expense resulted from a difference between an indefinite-lived asset, goodwill, which is amortized for tax, but not amortized for financial reporting purposes. The additional $39,000 in 2009 relates to foreign taxes.
International Operations. Total revenues from the Company’s international operations decreased slightly by $15,000 or less than 1% to $6,299,000 in 2009 from $6,314,000 in 2008. The decrease in revenue from international operations was attributable to a 19% decrease in revenue in Europe resulting from the worldwide economic recession. However, this was mostly offset by a 20% increase in the Asia Pacific region. Revenue from Asia Pacific increased due to the opening of a new office in Japan in January 2009. Japan had been serviced directly by a local reseller in prior years. Overall, international operations generated a net loss of $550,000 for 2009 compared to net loss of $255,000 in 2008. The principal cause of the additional loss in 2009 was the result of exchange losses of $84,000 in 2009 compared to exchange gains of $202,000 in 2008.
Net (Loss). The Company generated a net loss of $899,000 for the year ended December 31, 2009 compared to net loss of $3,135,000 in 2008. The reduced loss of $2,236,000 is primarily the result of a 22% reduction in operating costs, partially offset by a 16% reduction in revenues. The decrease in revenues is due to the slowdown in purchasing software solutions by companies throughout the world, due to the uncertainty surrounding the word wide economy. As the recession slowed down towards the latter part of 2009, business activity improved slightly as reflected in the number of opportunities the Company pursued at the end of 2009 as well as the number of license deals that were closed in the last quarter of 2009.
41
Liquidity and Capital Resources
Operating Activities
Net cash provided by operating activities was $1,556,000 for the year ended December 31, 2009, an increase of $221,000 over the year ended December 31, 2008 in which $1,335,000 of cash was generated by operations. The increase was primarily attributable to lowering the net loss for the year by $2,236,000 and a net increase in deferred revenues of $2,534,000. The significant increase in deferred revenues occurred due to the recognition of deferred of license, professional services and maintenance revenues in 2009 from transactions that occurred in prior years. Partially offsetting the increases in cash flow were a decrease in noncash expenses of $1,087,000, a decrease in the growth of accounts receivable of $2,771,000 compared to 2008, a decrease in accounts payable of $474,000 and an increase to prepaid expenses of $208,000.
Investing Activities
The Company used $2,191,000 of cash for investing activities in 2009 compared to using $2,691,000 in 2008. The decrease in cash used for investing activities of $500,000 results from a decrease in property and equipment purchases of $170,000, a net increase of short-term investments over short-term investments purchased of $90,000 and a decrease in capitalized software development costs of $357,000 in 2009. The decrease in capitalized software costs resulted from the aggressive cost reduction plan implemented throughout the Company in 2009 as a proactive way to address the impact of the worldwide economic recession on the Company. Partially offsetting the reduced expenditures of cash for investing activities was a reduction in the amount of cash released from restrictions of $117,000.
Financing Activities
The Company generated $3,026,000 less from financing activities in 2009 compared to 2008. In 2008, the Company generated $3,000,000 in proceeds from the issuance of preferred stock and incurred issuance costs of $106,000. In 2009 there were related dividend payments on the preferred stock of $180,000 compared to $48,000 in 2008.
At December 31, 2009, the Company had a working capital ratio of approximately 1.15:1 compared to 1.16:1 at December 31, 2008.
The Company had $3,402,000 in cash and investments available for sale at year ended December 31, 2009, compared to $3,644,000 for year ended December 31, 2008.
The Company has projected revenues for 2010 that will generate enough funds to sustain its continuing operations. In addition, the Company has initiated a number of cost containment programs which are expected to reduce the cost of operating the business. The Company expects its cash from operations to fund all of its financing needs for the upcoming year. However, if actual results trail expectations, the Company has plans in place to reduce operating expenditures appropriately in order to continue to fund all required expenditures. The Board of Directors from time to time reviews the Company’s forecasted operations and financial condition to determine whether and when payment of a dividend or dividends is appropriate. The Company does not plan any significant capital expenditures in 2010 other than to replace its existing capital equipment as it becomes obsolete. The impact of the strengthening dollar relative to the currency in the other regions of the world in which it operates have also contributed to reducing operating costs in other parts of the world. In addition, it does not anticipate that its operations or financial condition will be affected materially by inflation.
42
On May 23, 2006 the Company entered into a secured revolving line of credit (Line) agreement with a bank. That agreement was amended in June of 2008 with an expiration date of June 30, 2009. The line of credit was modified on July 31, 2009 to a guidance line of credit where all draws will be at the bank’s discretion and has a one year term. The guidance line of credit has no fees associated with it. The guidance line of credit interest rate is the prime rate, with a floor of 5%. There were no amounts outstanding as of December 31, 2009 and 2008. As of March 18, 2010, the amount outstanding on the guidance line of credit was zero.
Contractual Obligations and Commercial Commitments
The following tables summarize our contractual and commercial obligations, as of December 31, 2009:
|
Payment Due By Period
|
||||||||||||||||||||
|
Total
|
2010
|
2011-2012 | 2013-2014 |
2015 and after
|
||||||||||||||||
|
Contractual Cash
Obligations:
|
||||||||||||||||||||
|
Long-term Debt
|
$ | - | $ | - | $ | - | $ | - | $ | - | ||||||||||
|
Capital Leases
|
- | - | - | - | - | |||||||||||||||
|
Operating Leases
|
3,621,000 | 1,108,000 | 1,431,000 | 1,082,000 | - | |||||||||||||||
|
Amounts of Commitment Expiration Per Period
|
||||||||||||||||||||
|
Total
|
2010
|
2011-2012 | 2013- 2014 |
2015 and after
|
||||||||||||||||
|
Other Commercial
Commitments:
|
||||||||||||||||||||
|
Letters of Credit
|
$ | - | $ | - | $ | - | $ | - | $ | - | ||||||||||
Dividends may be paid on common stock, when and if, declared by the Board of Directors. However, no dividend has been paid on common stock since January 2000. Dividends on convertible preferred stock are currently payable at 6%, payable on quarterly basis in arrears, as declared by the Board of Directors. If not paid, the rate increases to 8% until paid. In September 2010, the dividend will be increased to 10%.
Off-Balance Sheet Transactions
There are no off balance sheet transactions that would require disclosure in the above contractual obligations and commercial commitments table.
Item 7A. Quantitative and Qualitative Disclosures about Market Risk.
Market risk represents the risk of loss that may impact our financial position due to adverse changes in financial market prices and rates. Our market risk exposure is primarily a result of fluctuations in interest rates. We do not hold financial instruments for trading purposes.
Interest Rate Risk
The Company’s exposure to market risk for changes in interest rates relates primarily to the Company’s investment portfolio. The Company does not have any derivative financial instruments in its portfolio. The Company places its investments in instruments that meet high credit quality standards. The Company is adverse to principal loss and ensures the safety and preservation of its invested funds by limiting default risk, market risk and reinvestment risk. As a result, as of December 31, 2009, the Company’s investments consisted of institutional money market funds and corporate bonds with maturities of less than 30 days. The Company does not expect any material loss with respect to its investment portfolio.
43
Foreign Currency Risk
All costs associated with the Company’s foreign operations in Europe, Asia/Pacific, Japan and Israel are denominated in their respective local currencies and translated into U.S. dollars for financial reporting. As a result, the Company is exposed to risks to the extent that the rate of inflation in any of its foreign operating regions differs from the rate of revaluation of their related currencies in relation to the U.S. dollar or if the timing of such revaluations lags behind inflation in these regions. In such an event, the costs of the Company’s operations in these regions, measured in U.S. dollars, will change and the U.S. dollar measured results of operations will be affected.
The Company does not use foreign currency forward exchange contracts or purchased currency options to hedge local currency cash flows or for trading purposes. All sales arrangements with international customers are denominated in foreign currency. The Company does not expect any material loss with respect to foreign currency risk.
44
Item 8. Financial Statements and Supplementary Data.
Report of Independent Registered Public Accounting Firm
Board of Directors
Astea International Inc.
We have audited the accompanying consolidated balance sheets of Astea International Inc. and Subsidiaries (collectively, the Company) (a Delaware corporation) as of December 31, 2009 and 2008, and the related consolidated statements of operations and stockholders’ equity and cash flows for each of the two years in the period ended December 31, 2009. These financial statements are the responsibility of the Company’s management. Our responsibility is to express an opinion on these financial statements based on our audits.
We conducted our audits in accordance with the standards of the Public Company Accounting Oversight Board (United States). Those standards require that we plan and perform the audit to obtain reasonable assurance about whether the financial statements are free of material misstatement. The Company is not required to have, nor were we engaged to perform an audit of its internal control over financial reporting. Our audit included consideration of internal control over financial reporting as a basis for designing audit procedures that are appropriate in the circumstances, but not for the purpose of expressing an opinion on the effectiveness of the Company’s internal control over financial reporting. Accordingly, we express no such opinion. An audit also includes examining, on a test basis, evidence supporting the amounts and disclosures in the financial statements, assessing the accounting principles used and significant estimates made by management, as well as evaluating the overall financial statement presentation. We believe that our audits provide a reasonable basis for our opinion.
In our opinion, the consolidated financial statements referred to above present fairly, in all material respects, the consolidated financial position of Astea International Inc. and Subsidiaries as of December 31, 2009 and 2008 and the consolidated results of their operations and their cash flows for each of the two years in the period ended December 31, 2009 in conformity with accounting principles generally accepted in the United States of America.
/s/ Grant Thornton LLP
Philadelphia, Pennsylvania
March 25, 2010
45
ASTEA INTERNATIONAL INC. AND SUBSIDIARIES
CONSOLIDATED BALANCE SHEETS
|
December 31,
|
||||||||
|
2009
|
2008
|
|||||||
|
ASSETS
|
||||||||
|
Current assets:
|
||||||||
|
Cash and cash equivalents
|
$ | 2,498,000 | $ | 3,144,000 | ||||
|
Investments available for sale
|
904,000 | 500,000 | ||||||
|
Receivables, net of allowance of $212,000 and $177,000
|
4,900,000 | 5,164,000 | ||||||
|
Prepaid expenses and other
|
439,000 | 362,000 | ||||||
|
Total current assets
|
8,741,000 | 9,170,000 | ||||||
|
Property and equipment, net
|
230,000 | 385,000 | ||||||
|
Intangibles, net
|
878,000 | 1,159,000 | ||||||
|
Capitalized software development costs, net
|
2,743,000 | 2,718,000 | ||||||
|
Goodwill
|
1,538,000 | 1,538,000 | ||||||
|
Restricted cash
|
95,000 | 146,000 | ||||||
|
Other long-term assets
|
45,000 | 50,000 | ||||||
|
Total assets
|
$ | 14,270,000 | $ | 15,166,000 | ||||
|
LIABILITIES AND STOCKHOLDERS’ EQUITY
|
||||||||
|
Current liabilities:
|
||||||||
|
Accounts payable and accrued expenses
|
$ | 2,784,000 | $ | 2,764,000 | ||||
|
Deferred revenues
|
4,846,000 | 5,112,000 | ||||||
|
Total current liabilities
|
7,630,000 | 7,876,000 | ||||||
|
Long-term liabilities
|
||||||||
|
Deferred tax liability
|
154,000 | 118,000 | ||||||
|
Commitments and Contingencies
|
||||||||
|
Stockholders’ equity:
|
||||||||
|
Convertible preferred stock,$.01 par value,
|
||||||||
|
shares authorized 5,000,000; issued and outstanding 826,000
|
8,000 | 8000 | ||||||
|
Common stock $.01 par value,
|
||||||||
|
shares authorized 25,000,000; issued 3,596,000 and
|
||||||||
|
outstanding 3,554,000
|
36,000 | 36,000 | ||||||
|
Additional paid-in-capital
|
31,005,000 | 30,998,000 | ||||||
|
Accumulated deficit, including accumulated comprehensive loss
|
||||||||
|
of $452,000 and $658,000
|
(24,355,000 | ) | (23,662,000 | ) | ||||
|
Treasury stock at cost, 42,000 shares
|
(208,000 | ) | (208,000 | ) | ||||
|
Total stockholders’ equity
|
6,486,000 | 7,172,000 | ||||||
|
Total liabilities and stockholders’ equity
|
$ | 14,270,000 | $ | 15,166,000 | ||||
See accompanying notes to the consolidated financial statements.
46
|
ASTEA INTERNATIONAL INC. AND SUBSIDIARIES
|
||||||||
|
CONSOLIDATED STATEMENTS OF OPERATIONS
|
||||||||
|
Years ended December 31,
|
2009
|
2008
|
||||||
|
Revenues:
|
||||||||
|
Software license fees
|
$ | 2,665,000 | $ | 3,273,000 | ||||
|
Services and maintenance
|
17,438,000 | 20,578,000 | ||||||
|
Total revenues
|
20,103,000 | 23,851,000 | ||||||
|
Costs and expenses:
|
||||||||
|
Cost of software license fees
|
1,926,000 | 2,852,000 | ||||||
|
Cost of services and maintenance
|
10,496,000 | 12,099,000 | ||||||
|
Product development
|
2,283,000 | 4,224,000 | ||||||
|
Sales and marketing
|
3,445,000 | 4,735,000 | ||||||
|
General and administrative
|
2,815,000 | 3,103,000 | ||||||
|
Total costs and expenses
|
20,965,000 | 27,013,000 | ||||||
|
(Loss) from operations
|
(862,000 | ) | (3,162,000 | ) | ||||
|
Interest income
|
38,000 | 68,000 | ||||||
|
(Loss) before income taxes
|
(824,000 | ) | (3,094,000 | ) | ||||
|
Income tax expense
|
75,000 | 41,000 | ||||||
|
Net (loss)
|
(899,000 | ) | (3,135,000 | ) | ||||
|
Preferred dividend
|
290,000 | 79,000 | ||||||
|
Net (loss) available to common stockholders
|
$ | (1,189,000 | ) | $ | (3,214,000 | ) | ||
|
Basic and diluted net (loss) per share
|
$ | (.33 | ) | $ | (.90 | ) | ||
|
Weighted average shares used in computing basic and diluted net (loss) per share
|
3,554,000 | 3,554,000 | ||||||
See accompanying notes to the consolidated financial statements.
47
|
ASTEA INTERNATIONAL INC. AND SUBSIDIARIES
CONSOLIDATED STATEMENTS OF STOCKHOLDERS’ EQUITY
|
|
Year Ended December 31,
|
2009
|
2008
|
||||||
|
Convertible preferred stock
|
|
|||||||
|
Balance, beginning of year
|
$ | 8,000 | $ | - | ||||
|
Issuance of preferred stock
|
- | 8,000 | ||||||
|
Balance, end of year
|
8,000 | 8,000 | ||||||
|
Common stock
|
||||||||
|
Balance, beginning and end of year
|
36,000 | 36,000 | ||||||
|
Additional paid-in-capital
|
||||||||
|
Balance, beginning of year
|
30,998,000 | 27,852,000 | ||||||
|
Issuance of preferred stock
|
- | 2,992,000 | ||||||
|
Legal fees – issuance of preferred stock
|
- | (106,000 | ) | |||||
|
Dividends paid
|
(180,000 | ) | (48,000 | ) | ||||
|
Stock based compensation
|
187,000 | 308,000 | ||||||
|
Balance, end of year
|
31,005,000 | 30,998,000 | ||||||
|
Accumulated deficit
|
||||||||
|
Balance, beginning of year
|
(23,662,000 | ) | (20,572,000 | ) | ||||
|
Net loss
|
(899,000 | ) | (3,135,000 | ) | ||||
|
Other comprehensive loss:
|
||||||||
|
Net unrealized loss on investments available for sale
|
(6,000 | ) | - | |||||
|
Translation adjustments
|
212,000 | 45,000 | ||||||
|
Comprehensive loss
|
(693,000 | ) | (3,090,000 | ) | ||||
|
Balance, end of year
|
(24,355,000 | ) | (23,662,000 | ) | ||||
|
Treasury stock, at cost
|
||||||||
|
Balance, beginning and end of year
|
(208,000 | ) | (208,000 | ) | ||||
|
Total stockholders’ equity
|
$ | 6,486,000 | $ | 7,172,000 | ||||
See accompanying notes to the consolidated financial statements.
48
ASTEA INTERNATIONAL INC. AND SUBSIDIARIES
CONSOLIDATED STATEMENTS OF CASH FLOWS
|
Years ended December 31,
|
2009
|
2008
|
||||||
|
Cash flows from operating activities:
|
||||||||
|
Net (loss)
|
$ | (899,000 | ) | $ | (3,135,000 | ) | ||
|
Adjustments to reconcile net (loss) to net cash
provided by operating activities:
|
||||||||
|
Depreciation and amortization
|
2,242,000 | 3,193,000 | ||||||
|
Increase in provision for doubtful accounts
|
70,000 | 80,000 | ||||||
|
Stock-based compensation
|
187,000 | 308,000 | ||||||
|
Deferred tax expense
|
36,000 | 41,000 | ||||||
|
Changes in operating assets and liabilities:
|
||||||||
|
Receivables
|
447,000 | 3,218,000 | ||||||
|
Prepaid expenses and other
|
(148,000 | ) | 60,000 | |||||
|
Accounts payable and accrued expenses
|
(1,262,000 | ) | (788,000 | ) | ||||
|
Deferred revenues
|
878,000 | (1,656,000 | ) | |||||
|
Other assets
|
5,000 | 14,000 | ||||||
|
Net cash provided by operating activities
|
1,556,000 | 1,335,000 | ||||||
|
Cash flows from investing activities:
|
||||||||
|
Capitalized software development costs
|
(1,761,000 | ) | (2,118,000 | ) | ||||
|
Purchases of property and equipment
|
(71,000 | ) | (241,000 | ) | ||||
|
Purchase of short term investments
|
(2,942,000 | ) | (750,000 | ) | ||||
|
Sale of short term investments
|
2,532,000 | 250,000 | ||||||
|
Change in restricted cash
|
51,000 | 168,000 | ||||||
|
Net cash used in investing activities
|
(2,191,000 | ) | (2,691,000 | ) | ||||
|
Cash flows from financing activities:
|
||||||||
|
Proceeds from line of credit
|
- | 415,000 | ||||||
|
Repayment on line of credit
|
- | (415,000 | ) | |||||
|
Issuance costs of preferred stock
|
- | (106,000 | ) | |||||
|
Dividend paid on preferred stock
|
(180,000 | ) | (48,000 | ) | ||||
|
Proceeds from issuance of preferred stock
|
- | 3,000,000 | ||||||
|
Net cash (used in) provided by financing activities
|
(180,000 | ) | 2,846,000 | |||||
|
Effect of exchange rate changes on cash and cash
Equivalents
|
169,000 | 39,000 | ||||||
|
Net (decrease) increase in cash and cash equivalents
|
(646,000 | ) | 1,529,000 | |||||
|
Cash and cash equivalents balance, beginning of year
|
3,144,000 | 1,615,000 | ||||||
|
Cash and cash equivalents balance, end of year
|
$ | 2,498,000 | $ | 3,144,000 | ||||
|
Cash paid for interest expense
|
$ | - | $ | - | ||||
|
See accompanying notes to the consolidated financial statements.
|
49
ASTEA INTERNATIONAL INC. AND SUBSIDIARIES
NOTES TO THE CONSOLIDATED FINANCIAL STATEMENTS
1. Company Background
Astea International Inc. and Subsidiaries (collectively the “Company” or “Astea”) are a global provider of service management software that addresses the unique needs of companies who manage capital equipment, mission critical assets and human capital. Clients include Fortune 500 to mid-size companies, which Astea services through Company facilities in the United States, United Kingdom, Australia, Japan, The Netherlands and Israel. The Company’s principal products are Astea Alliance, FX Service Center and FX Mobile. Astea Alliance supports the complete service lifecycle, from lead generation and project quotation to service and billing through asset retirement. FX Service Center is a service management and dispatch solution system that gives organizations command over their field service operations. FX Mobile offerings include mobile field service automation (FSA) systems, which include the wireless devices and support of mobile field technicians using portable, hand-held computing devices. Since its inception in 1979, Astea has licensed applications to companies in a wide range of sectors including information technology, telecommunications, instruments and controls, business systems, and medical devices.
2. Summary of Significant Accounting Policies
Principles of Consolidation
The consolidated financial statements include the accounts of Astea International Inc. and its wholly owned subsidiaries and branches. All significant intercompany accounts and transactions have been eliminated upon consolidation.
Use of Estimates
The preparation of financial statements in conformity with accounting principles generally accepted in the United States of America requires management to make estimates and assumptions that affect the reported amounts of assets and liabilities and disclosure of contingent assets and liabilities at the date of the financial statements and the reported amounts of revenues and expenses during the reporting period. Actual results could differ from those estimates. Significant assets and liabilities that are subject to estimates include allowances for doubtful accounts, goodwill and other acquired intangible assets, deferred tax assets and certain accrued and contingent liabilities.
Revenue Recognition
Astea’s revenue is principally recognized from two sources: (i) licensing arrangements and (ii) services and maintenance.
The Company markets its products primarily through its direct sales force and resellers. License agreements do not provide for a right of return, and historically, product returns have not been significant.
Astea recognizes revenue from license sales when all of the following criteria are met: persuasive evidence of an arrangement exists, delivery has occurred, the license fee is fixed and determinable and the collection of the fee is probable. We utilize written contracts as a means to establish the terms and conditions by which our products support and services are sold to our customers. Delivery is considered to have occurred when title and risk of loss have been transferred to the customer, which generally occurs after a license key has been delivered electronically to the customer. Revenue for arrangements with extended payment terms is recognized when the payments become due, provided all other revenue recognition criteria are satisfied. If collectability is not considered probable, revenue is recognized when the fee is collected. Our typical end user license agreements do not contain acceptance clauses. However, if acceptance criteria is required, revenues are deferred until customer acceptance has occurred.
50
Astea allocates revenue to each element in a multiple-element arrangement based on the elements’ respective fair value, determined by the price charged when the element is sold separately. Specifically, Astea determines the fair value of the maintenance portion of the arrangement based on the price, at the date of sale, if sold separately, which is generally a fixed percentage of the software license selling price. The professional services portion of the arrangement is based on hourly rates which the Company charges for those services when sold separately from software. If evidence of fair value of all undelivered elements exists, but evidence does not exist for one or more delivered elements, then revenue is recognized using the residual method. If an undelivered element for which evidence of fair value does not exist, all revenue in an arrangement is deferred until the undelivered element is delivered or fair value can be determined. Under the residual method, the fair value of the undelivered elements is deferred and the remaining portion of the arrangement fee is recognized as revenue. The residual value, after allocation of the fee to the undelivered elements based on VSOE of fair value, is then allocated to the perpetual software license for the software products being sold. The Company’s policy is to recognize expenses as incurred when revenues are deferred in connection with transactions where VSOE cannot be established for an undelivered element. Accordingly, all costs associated with the contracts are recorded in the period incurred, which may differ from the period in which revenue is recognized.
When appropriate, the Company may allocate a portion of its software revenue to post-contract support activities or to other services or products provided to the customer free of charge or at non-standard rates when provided in conjunction with the licensing arrangement. Amounts allocated are based upon standard prices charged for those services or products which, in the Company’s opinion, approximate fair value. Software license fees for resellers or other members of the indirect sales channel are based on a fixed percentage of the Company’s standard prices. The Company recognizes software license revenue for such contracts based upon the terms and conditions provided by the reseller to its customer.
Revenue from post-contract support is recognized ratably over the term of the contract, which is generally twelve months on a straight-line basis. Consulting and training service revenue is generally unbundled and recognized at the time the service is performed.
Deferred revenue represents payments or accounts receivable from the Company’s customers for amounts billed in advance.
If we were to change our pricing approach in the future, this could affect our revenue recognition estimates, in particular, if bundled pricing precludes establishment of VSOE.
We present taxes assessed by a governmental authority including sales, use, value added and excise taxes on a net basis and therefore the presentation of these taxes is excluded from our revenues and is included in accrued expenses in the accompanying consolidated balance sheets until such amounts are remitted to the taxing authority.
Reimbursable Expenses
The Company charges customers for out-of-pocket expenses incurred by its employees during the performance of professional services in the normal course of business. Billings for out-of-pocket expenses that are reimbursed by the customer are included in revenues with the corresponding expense included in cost of services and maintenance. During fiscal years 2009 and 2008, the Company billed $367,000 and $543,000, respectively, of reimbursable expenses to customers.
51
Cash and Cash Equivalents
The Company considers all highly liquid investments purchased with an original maturity of three months or less to be cash equivalents.
Investments Available for Sale
Investments that the Company designated as available-for-sale are reported at fair value, with unrealized gains and losses, net of tax, recorded in accumulated other comprehensive income (loss). The Company bases the cost of the investment sold on the specific identification method. The available-for-sale investment consists of corporate fixed income bonds and mutual funds. If an available-for-sale investment is other than temporarily impaired, the loss is charged to either earnings or shareholders’ equity depending on our intent and ability to retain the security until we recover the full cost basis and the extent of the loss attributable to the creditworthiness of the issuer.
The Company defines the fair value as the price that would be received to sell an asset or paid to transfer a liability in an orderly transaction between market participants at the measurement date.
The Company accounts for certain assets and liabilities at fair value. The hierarchy below lists three levels of fair value based on the extent to which inputs in measuring fair value are observable in the market. We categorize each of our fair value measurements in one of these three levels based on the lowest level input that is significant to the fair value measurement in its entirety. These levels are:
|
|
1.
|
Level 1 - Valuations based on quoted prices in active markets for identical assets that the Company has the ability to access.
|
|
|
2.
|
Level 2 - Valuations based on inputs on other than quoted prices included within Level 1, for which all significant inputs are observable, either directly or indirectly.
|
|
|
3.
|
Level 3 - Valuations based on inputs that are unobservable and significant to the overall fair value measurement.
|
On December 31, 2009 the fair value for the Company’s investments was determined based upon quoted prices in active markets for identical assets (Level 1).
Allowance for Doubtful Accounts
The Company records an allowance for doubtful accounts based on specifically identified amounts that management believes to be uncollectible. The Company also records an additional allowance based on certain percentages of aged receivables, which are determined based on historical experience and management’s assessment of the general financial conditions affecting the Company’s customer base. Once management determines that an account will not be collected, the account is written off against the allowance for doubtful accounts. If actual collections experience changes, revisions to the allowances may be required. Activity in the allowance for doubtful accounts is as follows:
|
Year Ended December 31
|
Balance at
beginning of year
|
Expensed
|
Write offs
|
Balance at end of year
|
||||||||||||
|
2009
|
$ | 177,000 | $ | 70,000 | $ | 35,000 | $ | 212,000 | ||||||||
|
2008
|
$ | 206,000 | $ | 80,000 | $ | 109,000 | $ | 177,000 | ||||||||
Bad debt expense decreased in 2009 by 12% from 2008 due to improved collections on outstanding receivables.
52
The Company reviews accounts receivable on a monthly basis to determine if any receivables will potentially be uncollectible. Based on all information available, the Company believes its allowance for doubtful accounts as of December 31, 2009 is adequate. However, actual write-offs might exceed the recorded allowance.
Property and Equipment
Property and equipment are recorded at cost. Depreciation and amortization are provided using the straight-line method over the estimated useful lives of the related assets or the lease term, whichever is shorter. When property and equipment are sold or otherwise disposed of, the fixed asset account and related accumulated depreciation account are relieved and any gain or loss is included in operations. Expenditures for repairs and maintenance are charged to expense as incurred and significant renewals and betterments are capitalized.
Impairment of Long Lived Assets
The Company evaluates its long-lived assets, including certain identifiable intangible assets, excluding goodwill, for impairment whenever events or changes in circumstances indicate that the carrying amount of such assets may not be recoverable. Recoverability of assets to be held and used is measured by a comparison of the carrying amount of any asset to future undiscounted net cash flows expected to be generated by the asset. If such assets are considered to be impaired, the impairment is measured by the amount by which the carrying amount of the asset exceeds the fair value of the assets. As of December 31, 2009, the Company has determined that no impairment has occurred.
Capitalized Software Development Costs
The Company capitalizes software development costs incurred during the period from the establishment of technological feasibility through the product’s availability for general release. Costs incurred prior to the establishment of technology feasibility are charged to product development expense. Product development expense includes payroll, employee benefits, other headcount-related costs associated with product development and any related costs to third parties under sub-contracting or net of any collaborative arrangements.
Software development costs are amortized on a product-by product basis over the greater of the ratio of current revenues to total anticipated revenues (current and future revenues) or on a straight-line basis over the estimated useful lives of the products beginning with the initial release to customers. The Company’s estimated life for its capitalized software products is two years based on current sales trends and the rate of product release. The Company continually evaluates whether events or circumstances had occurred that indicate that the remaining useful life of the capitalized software development costs should be revised or that the remaining balance of such assets may not be recoverable. The Company evaluates the recoverability of capitalized software based on the estimated future revenues of each product. As of December 31, 2009, management believes that no revisions to the remaining useful lives or write-downs of capitalized software development costs are required.
Research and Development Costs
The Company reports research and development costs as Product Development expense in its statement of operations. These costs include the costs incurred prior to the establishment of technological feasibility for new product development. In addition, research and development costs also include costs related to improving the quality of the Company’s released software products and any costs incurred by third party companies that may be engaged from time to time, to assist the Company in its product development efforts.
53
Goodwill
Goodwill represents the excess of the cost of businesses acquired over the fair value of the net assets acquired at the date of acquisition. Goodwill is not amortized but rather tested for impairment at least annually. The Company performs its annual impairment test as of the first day of the fiscal fourth quarter. The impairment test must be performed more frequently if there are triggering events, as for example when our market capitalization significantly declines for a sustained period, which could cause us to do interim impairment testing that might result in an impairment to goodwill.
The Company uses a two step method for determining goodwill impairment. In the first step, the Company determines the fair value of the reporting unit and compares that fair value to the carrying value of the reporting unit including goodwill. The fair value of the reporting unit is determined using various valuation techniques, including a comparable companies market multiple approach and a discounted cash flow analysis (an income approach). If the carrying value of a reporting unit exceeds its fair value, the Company performs the second step of the goodwill impairment test to measure the impairment loss, if any.
The Company compares the implied fair value of goodwill with the carrying amount of goodwill. The Company determined the implied fair value of goodwill in the same manner as if the Company had acquired those business units. Specifically, the Company must allocate the fair value of the reporting unit to all of the assets of that unit, including any unrecognized intangible assets, in a hypothetical calculation that would yield the implied fair value of goodwill.
Our annual impairment test, which was completed during the fourth quarter of 2009, indicated that the fair value of our one reporting unit exceeded the carrying value and, therefore, the goodwill amount was not impaired for our one reporting unit.
The determination of the fair value of the reporting units and the allocation of that value to individual assets and liabilities within those reporting units requires the Company to make significant estimates and assumptions. These estimates and assumptions primarily include, but are not limited to: the selection of appropriate peer group companies; control premiums appropriate for acquisitions in the industries in which the Company competes; the discount rate; terminal growth rates; and forecasts of revenue, operating income, depreciation and amortization, and capital expenditures.
Due to the inherent uncertainty involved in making these estimates, actual financial results could differ from those estimates. Changes in assumptions concerning future financial results or other underlying assumptions could have a significant impact on either the fair value of the reporting unit or the amount of the goodwill impairment charge.
On September 21, 2005, the Company acquired the assets and certain liabilities of FieldCentrix, Inc. through its wholly-owned subsidiary, FC Acquisition Corp. Included in the allocation of the purchase price was goodwill valued at $1,100,000.
The purchase agreement provided for an earn-out provision through June 30, 2007 that paid the sellers a percentage of certain license revenues and certain professional services. Due to the contingent nature of such payments, the value of the future payments was not included in the purchase price. However, as such sales transactions occurred, the related earn-out amounts were added to the purchase price, specifically goodwill. The total addition to goodwill from the date the assets of FieldCentrix, Inc. were acquired through the end of the earn-out period June 30, 2007 was $285,000. At December 31, 2009 goodwill was $1,538,000.
Major Customers
In 2009 and 2008, no customers represented more than 10% of total revenues. At December 31, 2009, there were three significant customers: one customer accounted for 19% of accounts receivable, another accounted for 17%, and a third customer accounted for 12%. One customer represented 13% of total accounts receivable and two customers each represented 10% of total accounts receivable at December 31, 2008.
54
Concentration of Credit Risk
Financial instruments, which potentially subject the Company to credit risk, consist of cash equivalents and accounts receivable. The Company’s policy is to limit the amount of credit exposure to any one financial institution. The Company places investments with financial institutions evaluated as being creditworthy, or investing in short-term money markets which are exposed to minimal interest rate and credit risk. Cash balances are maintained with several banks. Certain operating accounts may exceed the FDIC limits.
Concentration of credit risk, with respect to accounts receivable, is limited due to the Company’s credit evaluation process. The Company sells its products to customers involved in a variety of industries including information technology, medical devices and diagnostic systems, industrial controls and instrumentation and retail systems. While the Company does not require collateral from its customers, it does perform continuing credit evaluations of its customer’s financial condition.
Fair Value of Financial Instruments
Cash and cash equivalents, trade accounts receivable, other assets, trade accounts payable, and accrued expenses: The carrying amounts at face value approximate fair value because of the short maturity of these instruments.
Investments: Debt securities classified as available for sale are measured using quoted market prices multiplied by the quantity held where quoted market prices were available.
The fair value of goodwill is determined by estimating the expected present value of future cash flows without reference to observable market transactions.
Income Taxes
Deferred tax assets and liabilities are determined based on differences between financial reporting and tax bases of assets and liabilities and operating loss and tax credit carryforwards and are measured using the enacted tax rates and laws that will be in effect when the difference and carryforwards are expected to be recovered or settled. A valuation allowance for deferred tax assets is provided when we estimate that it is more likely than not that all or a portion of the deferred tax assets may not be realized through future operations. This assessment is based upon consideration of available positive and negative evidence which included, among other things, our most recent results of operations and expected future profitability. We consider our actual historical results to have a stronger weight than other more subjective indicators when considering whether to establish or reduce a valuation allowance on deferred tax assets.
The Company prescribes a recognition threshold and measurement attribute for the financial statement recognition and measurement of a tax position taken or expected to be taken in a tax return. Estimated interest is recorded as a component of interest expense and penalties are recorded as a component of general and administrative expenses. Such amounts were not material for 2009 and 2008 and did not have a material impact on our financial position.
Advertising
Advertising costs are expensed when incurred. Advertising costs for the years ended December 31, 2009 and 2008 were $91,000 and $117,000 respectively and are included in sales and marketing costs.
Currency Translation
The accounts of the international subsidiaries and branch operations translate the assets and liabilities of international operations by using the exchange rate in effect at the balance sheet date. The results of operations are translated at average exchange rates during the period. The effects of exchange rate fluctuations in translating assets and liabilities of international operations into U.S. dollars are accumulated and reflected as a currency translation adjustment as other comprehensive loss in the accompanying consolidated statements of stockholders’ equity. Transaction gains and losses are included in net (loss). General and administrative expenses include exchange gains (losses) of ($84,000) and $202,000 for the years ended December 31, 2009 and 2008, respectively.
55
Net Loss Per Share
Earnings per share is computed on the basis of the weighted average number of shares and common stock equivalents outstanding during the period. In the calculation of diluted earnings per share, shares outstanding are adjusted to assume conversion of the Company’s non-interest bearing convertible stock and exercise of options as if they were dilutive. In the calculation of basic earnings (loss) per share, weighted average numbers of shares outstanding are used as the denominator.
For the year ended December 31, 2009, the Company had a net loss. In 2009 there were zero net additional dilutive shares assumed to be converted at an average exercise price of $5.20. In addition, 100% of the outstanding convertible preferred stock, 826,000 shares, was eligible to be converted into common stock. For purposes of this calculation, if converted, it would have been assumed that they were converted into common stock and the related dividends were not paid. However, all options outstanding at December 31, 2009 to purchase shares of common stock and shares of common stock issued on the assumed conversion of the eligible preferred stock were excluded from the diluted loss per common share calculation as the inclusion of these options would have been antidilutive.
|
Year Ended December 31,
|
2009
|
2008
|
||||||
|
Net (loss)
|
$ | (899 | ) | $ | (3,135 | ) | ||
|
Preferred Dividend
|
290 | 79 | ||||||
|
Net (Loss) available to common shareholders
|
(1,189 | ) | (3,214 | ) | ||||
|
Basic weighted average number of common shares
outstanding
|
3,554 | 3,554 | ||||||
|
Basic (loss) earnings per common share
|
$ | (.33 | ) | $ | (.90 | ) | ||
|
Effect of dilutive stock options
|
- | - | ||||||
|
Diluted weighted average number of common shares
outstanding
|
3,554 | 3,554 | ||||||
|
Diluted (loss) per common share
|
$ | (.33 | ) | $ | (.90 | ) | ||
Comprehensive (Loss)
Comprehensive (loss) consists of net income (loss), unrealized losses on investments available for sale and foreign currency translation adjustments. The effects are presented in the accompanying Consolidated Statements of Stockholders’ Equity.
56
Stock Compensation
The Company records stock based compensation using the modified prospective transition method. Under this method, compensation costs recognized in 2009 include (a) compensation costs for all share-based payments granted to employees and directors prior to, but not yet vested as of January 1, 2006, based on the grant date value estimated and (b) compensation cost for all share-based payments granted subsequent to January 1, 2006, based on the grant date fair value estimated in.
The Company estimates the fair value of stock options granted using the Black-Scholes-Merton (Black-Scholes) option-pricing formula and amortizes the estimated option value using an accelerated amortization method where each option grant is split into tranches based on vesting periods. The Company’s expected term represents the period that the Company’s share-based awards are expected to be outstanding and was determined based on historical experience regarding similar awards, giving consideration to the contractual terms of the share-based awards and employee termination data. Executive level employees who hold a majority of options outstanding, and non-executive level employees each have similar historical option exercise and termination behavior and thus were grouped for valuation purposes. The Company’s expected volatility is based on the historical volatility of its traded common stock and places exclusive reliance on historical volatilities to estimate our stock volatility over the expected term of its awards. The Company has historically not paid dividends and has no foreseeable plans to issue dividends. The risk-free interest rate is based on the yield from the U.S. Treasury zero-coupon bonds with an equivalent term. Results for prior periods have not been restated.
Under the Company’s stock option plans, options awards generally vest over a four year period of continuous service and have a 10 year contractual term. The fair value of each option is amortized on a straight-line basis over the option’s vesting period. The fair value of each option is estimated on the date of the grant using the Black-Scholes option pricing formula using the following assumptions as of December 31, 2009.
|
For the year ended
|
For the year ended
|
|||||||
|
December 31, 2009
|
December 31, 2008
|
|||||||
|
Wtd. Avg.
|
Wtd. Avg.
|
|||||||
|
Risk-free interest rate
|
2.23 | % | 2.23 | % | ||||
|
Expected life (in years)
|
4.83 | 4.28 | ||||||
|
Volatility
|
107 | % | 88 | % | ||||
|
Expected dividends
|
- | - | ||||||
|
Annual forfeiture rate
|
17.00 | % | 19.23 | % | ||||
The weighted-average fair value of options granted during the years ended December 31, 2009 and 2008 was estimated as $2.58 and $2.49, respectively.
Convertible Preferred Stock
On September 24, 2008 the Company issued 826,000 shares of Series-A Convertible Preferred Stock (“preferred stock”) to its Chief Executive Officer at a price of $3.63 per share for a total of $3,000,000. Dividends accrue daily on the preferred stock at an initial rate of 6% and shall be payable only when, as and if declared by the Company’s Board of Directors, quarterly in arrears.
The preferred stock may be converted into common stock at the initial rate of one share of common for each share of preferred stock. After six months there is no limit on the number of shares that may be converted. Commencing two years after issuance, the Company shall have certain rights to cause conversion of all of the shares of preferred stock then outstanding. Commencing four years after issuance, the Company may redeem, subject to board approval, all of the shares of preferred stock then outstanding at a price equal to the greater of (i) 130% of the purchase price plus all accrued and unpaid dividends and (ii) the fair market value of such number of shares of common stock which the holder of the preferred stock would be entitled to receive had the redeemed preferred stock been converted immediately prior to the redemption.
57
The Company recorded the preferred stock on the Company’s consolidated balance sheet within Stockholders’ Equity. The preferred stock is recorded on the consolidated balance sheet at the amount of net proceeds received less an imputed dividend cost. The imputed dividend cost of $218,000 was the result of the preferred stock having a dividend rate during the first two years after its issuance (6%) that is lower than the rate that becomes fixed (10%) after the initial two year period. The imputed dividend cost of $218,000 is being amortized over the first two years from the date of issuance and is based upon the present value of the dividend discount using a 10% yield.
Reclassification
Certain reclassifications were made to prior period financial statements to conform to the current presentation.
Recently Adopted Accounting Guidance
In May 2009, we adopted the authoritative guidance issued by the Financial Accounting Standards Board (“FASB”) which established general standards of accounting for and disclosure of events that occur after the balance sheet date but before financial statements are issued or are available to be issued. The adoption of the guidance did not have a material impact on the our financial statements.
In June 2009, the FASB issued, “The FASB Accounting Standards Codification ™ and the Hierarchy of Generally Accepted Accounting Principles”. This establishes the Codification as the source of authoritative GAAP recognized by the FASB to be applied by nongovernmental entities. Rules and interpretive releases of the SEC under federal securities laws are also sources of authoritative GAAP for SEC registrants. All guidance contained in the Codification carries an equal level of authority. This is effective for financial statements issued for the interim and annual periods ending after September 15, 2009.
In September 2009, guidance was issued by the FASB that addresses the effect on the calculation of earnings per share for a period that includes the redemption or induced conversion of preferred stock. The guidance addresses the difference between the (1) fair value of the consideration transferred to the holders of preferred stock and (2) the carrying amount of the preferred stock in the registrant’s balance sheet should be subtracted from net income to arrive at income available to commons stockholders in the calculation of earnings per share. Adoption of this new guidance did not have a material impact on our financial statements.
On January 1, 2009, we adopted authoritative guidance issued by FASB on business combinations. The guidance retains the fundamental requirements that the acquisition method of accounting (previously referred to as the purchase method of accounting) be used for all business combinations, but requires a number of changes, including changes in the way assets and liabilities are recognized and measured as a result of business combinations. It also requires the capitalization of in-process research and development at fair value and requires the expensing of acquisition-related costs as incurred. We adopted this guidance for all business combinations that occur after January 1, 2009. The adoption of this guidance did not have a material impact on our financial statements.
On January 1, 2009, we adopted the authoritative guidance issued by the FASB that changes the accounting and reporting for non-controlling interests. Non-controlling interests are to be reported as a component of equity separate from the parent’s equity, and purchases or sales of equity interests that do not result in a change in control are to be accounted for as equity transactions. In addition, net income attributable to a non-controlling interest is to be included in net income and, upon a loss of control, the interest sold, as well as any interest retained, is to be recorded at fair value with any gain or loss recognized in net income. Adoption of the new guidance did not have a material impact on our financial statements.
58
On January 1, 2009, we adopted the authoritative guidance on fair value measurement for nonfinancial assets and liabilities, except for items that are recognized or disclosed at fair value in the financial statements on a recurring basis (at least annually). Adoption of the new guidance did not have a material impact on our financial statements.
Recent Accounting Guidance Not Yet Adopted
In January 2010, the FASB issued guidance to amend the disclosure requirements related to recurring and nonrecurring fair value measurements. The guidance requires new disclosure on the transfers of assets and liabilities between Level 1 (quoted prices in active market for identical assets or liabilities) and Level 2 (significant other observable inputs) of fair value measurements hierarchy, including the reasons and the timing of the transfers. Additionally, the guidance requires a roll forward of activities on purchases, sales, issuance, and settlements of the assets and liabilities measured using significant unobservable inputs (Level 3 fair value measurements). The guidance will become effective with the reporting period beginning January 1, 2010, except for the disclosure on the roll forward activities for Level 3 fair value measurements, which will become effective for the reporting period beginning July 1, 2011. We believe adoption of this new guidance will not have a material impact on our financial statements.
In October 2009, the FASB issued authoritative guidance on revenue recognition that will become effective for us beginning July 1, 2010, with earlier adoption permitted. Under the new guidance, arrangements that include software elements, tangible products that have software components that are essential to the functionality of the tangible product will no longer be within the scope of the software revenue recognition guidance. Software-enabled products will now be subject to other relevant revenue recognition guidance. Additionally, the FASB issued authoritative guidance on revenue arrangements with multiple deliverables that are outside the scope of the software revenue recognition guidance. Under the new guidance, when vendor specific objective evidence or third party evidence for deliverables in an arrangement cannot be determined, a best estimate of the selling price is required to separate deliverables and allocate arrangement consideration using the relative selling price method. The new guidance includes new disclosure requirements on how the application of the relative selling price method affects the timing and amount of revenue recognition. We believe adoption of this new guidance will not have a material impact on our financial statements.
In June 2009, the FASB issued authoritative guidance on the consolidation of variable interest entities, which is effective for us beginning January 1, 2010. The new guidance requires revised evaluations of whether entities represent variable interest entities, ongoing assessments of control over such entities, and additional disclosures for variable interests. We believe adoption of this new guidance will not have a material impact on our financial statements.
3. Receivables
Billed receivables represent billings for the Company’s products and services to end users and value added resellers. Unbilled receivables represent contractual amounts due within one year under software licenses that have been delivered or statements of work for professional services, for work performed but not yet invoiced. Billed receivables are shown net of reserves for estimated uncollectible amounts. Receivables net of allowance consist of the following:
|
December 31,
|
||||||||
|
2009
|
2008
|
|||||||
|
Billed receivables, net
|
$ | 4,158,000 | $ | 4,534,000 | ||||
|
Unbilled receivables
|
742,000 | 630,000 | ||||||
| $ | 4,900,000 | $ | 5,164,000 | |||||
59
4. Investments Available-for-Sale
The carrying amount, gross unrealized holding gains, gross unrealized holding losses, and fair value of available-for-sale debt securities by major security type and class of security at December 31, 2009 and 2008 were as follows:
|
Gross
|
Gross
|
|||||||||||||||
|
unrealized
|
unrealized
|
|||||||||||||||
|
Aggregate
|
holding
|
holding
|
Aggregate
|
|||||||||||||
|
cost basis
|
gains
|
(losses)
|
fair value
|
|||||||||||||
|
At December 31, 2009
|
||||||||||||||||
|
Available for sale:
|
||||||||||||||||
|
Corporate Fixed Income
|
$ | 402,000 | $ | — | $ | (4,000 | ) | $ | 398,000 | |||||||
|
Mutual Funds
|
508,000 | — | (2,000 | ) | 506,000 | |||||||||||
| $ | 910,000 | $ | — | $ | (6,000 | ) | $ | 904,000 | ||||||||
|
At December 31, 2008
|
||||||||||||||||
|
Available for sale:
|
||||||||||||||||
|
Municipal Bonds
|
$ | 500,000 | $ | — | $ | — | $ | 500,000 | ||||||||
| $ | 500,000 | $ | — | $ | — | $ | 500,000 | |||||||||
The investments in corporate fixed income bonds with unrealized losses included in the table above are comprised primarily of corporate bonds that mature in 2010. The unrealized losses on corporate fixed income bonds were caused by interest rate increases and currency fluctuations. The contractual terms of the fixed income bonds do not permit the issuer to settle the securities at a price less than the amortized cost of the investment. Because the Company believes that it is not more likely than not that it will be required to sell the bonds before recovery of their amortized cost basis, the securities are not considered to be other-than-temporarily impaired.
The investments in mutual funds with unrealized losses included in the table are based on investments that seek a high level of current income. The fund normally invests at least 80% of net assets, plus the amount of any borrowings for investment purposes, in floating or adjustable rate senior loans of any maturity or credit quality, including those rated below investment grade or determined by the fund's advisor to be of comparable quality. The unrealized loss on the mutual funds is due to credit quality of the senior loans in the portfolio. Based the Company's ability and intent to hold those investments for a reasonable period of time sufficient for a forecasted recovery of fair value, the Company does not consider those investments to be other-than-temporarily impaired at December 31, 2009.
60
5. Property and Equipment
Property and equipment consist of:
|
December 31,
|
|||||||||
|
Useful Life
|
2009
|
2008
|
|||||||
|
Computers and related equipment
|
3 | $ | 4,117,000 | $ | 4,070,000 | ||||
|
Furniture and fixtures
|
10 | 555,000 | 555,000 | ||||||
|
Leasehold improvements
|
10 | 144,000 | 129,000 | ||||||
|
Software
|
1-3 | 994,000 | 987,000 | ||||||
|
Office equipment
|
3-7 | 786,000 | 784,000 | ||||||
| 6,596,000 | 6,525,000 | ||||||||
|
Less: Accumulated depreciation
|
|||||||||
|
and amortization
|
(6,366,000 | ) | (6,140,000 | ) | |||||
| $ | 230,000 | $ | 385,000 | ||||||
Depreciation and amortization expense for the years ended December 31, 2009 and 2008 was $226,000 and $274,000, respectively.
6. Capitalized Software Development Costs
|
Remaining
Weighted |
December 31,
|
||||||||
|
Average Life
|
2009
|
2008
|
|||||||
|
Capitalized software
development costs
|
1.27 | $ | 11,952,000 | $ | 10,191,000 | ||||
|
Less: Accumulated
amortization
|
(9,209,000 | ) | (7,473,000 | ) | |||||
| $ | 2,743,000 | $ | 2,718,000 | ||||||
The Company capitalized software development costs of $1,761,000 and $2,118,000 for the years ended December 31, 2009 and 2008, respectively. Amortization of capitalized software development costs for the years ended December 31, 2009 and 2008 were $1,736,000 and $2,638,000, respectively, and is reflected in cost of software license fees in the financial statements. The Company amortizes software developments costs using the lesser of the straight-line basis over the estimated useful lives of the product (two years) or the revenue forecast method.
7. Intangible Assets
Intellectual property and customer lists (“intangible assets”) acquired as part of the FieldCentrix acquisition are amortized on a straight-line basis over their estimated annual lives or over the period of their expected benefit, generally ranging from 5 to 10 years. Amortization expense related to these intangible assets was $280,000 for each of the years ended December 31, 2009 and 2008.
61
|
Accumulated Amortization
|
Net Carrying Value
|
||||||||||||||||||||
|
Description
|
Weighted
Avg. Life
|
Gross Cost
|
2009
|
2008
|
2009
|
2008
|
|||||||||||||||
|
Software
|
5 years
|
$ | 720,000 | $ | 618,000 | $ | 474,000 | $ | 102,000 | $ | 246,000 | ||||||||||
|
Customer Relationship List
|
10 years
|
1,360,000 | 584,000 | 447,000 | 776,000 | 913,000 | |||||||||||||||
| $ | 2,080,000 | $ | 1,202,000 | $ | 921,000 | $ | 878,000 | $ | 1,159,000 | ||||||||||||
Estimated amortization expense for each of the next five years is as follows:
|
Amortization Expense
|
|
|
2010
|
$ 238,000
|
|
2011
|
136,000
|
|
2012
|
136,000
|
|
2013
|
136,000
|
|
2014
|
136,000
|
8. Accounts Payable and Accrued Expenses
Accounts payable and accrued expenses consist of:
|
December 31,
|
2009
|
2008
|
||||||
|
Accounts payable
|
$ | 680,000 | $ | 426,000 | ||||
|
Accrued compensation and related benefits
|
1,256,000 | 1,655,000 | ||||||
|
Accrued professional services
|
142,000 | 59,000 | ||||||
|
Sales and payroll taxes
|
395,000 | 388,000 | ||||||
|
Other accrued liabilities
|
311,000 | 236,000 | ||||||
| $ | 2,784,000 | $ | 2,764,000 | |||||
9. Income Taxes
The Company has identified its federal tax return and its state returns in Pennsylvania and California as “major” tax jurisdictions. Based on the Company’s evaluation, it has been concluded that there are no significant uncertain tax positions requiring recognition in the Company’s financial statements. The Company’s evaluation was performed for tax years ended 2004 through 2009, the only periods subject to examination. The Company believes that its income tax positions and deductions will be sustained on audit and does not anticipate any adjustments that will result in a material change to its financial position. Accordingly, the Company did not record a cumulative effect adjustment.
In 2008, the Israel Taxing Authority “ITA” notified the Company that it intends to re-examine a 2002 transaction that it had previously approved. The Company is vigorously defending itself in court and based on information to date, does not expect this issue to result in any additional tax to the company. It is the opinion of the Company based on current information that this matter will not have a material impact on its financial condition or results of operations.
The Company’s policy for recording interest and penalties associated with audits is to record such items as a component of income before income taxes. Penalties are recorded in general and administrative expenses and interest paid or received is recorded in interest expense or interest income, respectively, in the statement of operations. For the years ended December 31, 2009 and 2008, there were no interest or penalties related to the settlement of audits.
62
Deferred tax assets and liabilities represent the future tax consequences of the differences between the financial statement carrying amounts for assets and liabilities versus the tax bases of assets and liabilities. Under this method, deferred tax assets are recognized for deductible temporary differences, operating loss and tax credit carryforwards. Deferred liabilities are recognized for taxable temporary differences. Deferred tax assets are reduced by a valuation allowance when, in the opinion of management, it is more likely than not that some portion or all of the deferred tax assets will not be realized. The impact of tax rate changes on deferred tax assets and liabilities is recognized in the year that the change is enacted.
The provision for income taxes is as follows:
|
Years ended December 31,
|
2009
|
2008
|
||||||
|
Current:
|
||||||||
|
Federal
|
$ | - | $ | - | ||||
|
State
|
- | - | ||||||
|
Foreign
|
39,000 | - | ||||||
| - | - | |||||||
|
Deferred:
|
||||||||
|
Federal
|
$ | 33,000 | $ | 33,000 | ||||
|
State
|
3,000 | 8,000 | ||||||
| $ | 75,000 | $ | 41,000 | |||||
Pre-tax (loss) for domestic locations for the year ended December 31, 2009 and 2008 was ($359,000) and ($2,839,000) respectively. Foreign locations had pre-tax (loss) income of ($465,000) and ($255,000) in 2009 and 2008, respectively.
63
The approximate income tax effect of each type of temporary difference is as follows:
|
December 31,
|
2009
|
2008
|
||||||
|
Deferred income tax assets:
|
||||||||
|
Timing of revenue recognition
|
$ | - | $ | 10,000 | ||||
|
Accruals and reserves not
currently deductible for tax
|
147,000 | 154,000 | ||||||
|
Benefit of net operating loss carryforward
|
13,411,000 | 13,830,000 | ||||||
|
Benefit of foreign net operating loss
carryforward
|
2,165,000 | 2,152,000 | ||||||
|
Depreciation
|
272,000 | 176,000 | ||||||
|
Alternative minimum tax
|
361,000 | 361,000 | ||||||
|
Non-qualified stock options
|
210,000 | 137,000 | ||||||
|
Other
|
31,000 | 29,000 | ||||||
| 16,597,000 | 16,849,000 | |||||||
|
Deferred income tax liabilities:
|
||||||||
|
Capitalized software development costs
|
(1,303,000 | ) | (1,204,000 | ) | ||||
|
Amortization of deductible goodwill
|
(154,000 | ) | (117,000 | ) | ||||
| (1,457,000 | ) | (1,321,000 | ) | |||||
|
Net deferred tax asset before allowance
|
15,140,000 | 15,528,000 | ||||||
|
Valuation allowance
|
(15,294,000 | ) | (15,646,000 | ) | ||||
|
Net deferred income tax liability
|
$ | (154,000 | ) | $ | (118,000 | ) | ||
Realization of deferred tax assets is primarily dependent on future taxable income, the amount and timing of which is uncertain. The valuation allowance is adjusted on a periodic basis to reflect management’s estimate of the realizable value of the net deferred tax assets. Therefore, a valuation allowance has been recorded for the entire net deferred tax asset with the exception of $154,000 related to the deferred tax liability associated with indefinite-lived intangible assets. Because indefinite-lived intangible assets and goodwill are not amortized for book purposes, the related deferred tax liabilities will not reverse until some indeterminate future period when the asset becomes impaired, are disposed of, or in the case of indefinite-lived intangible assets, begin to reverse if they are reclassified as an amortizing intangible asset. The expected timing of future reversals of deferred tax liabilities are to be taken into account when evaluating the realizability of deferred tax assets. Therefore, the Company believes the reversal of deferred tax liabilities related to indefinite-lived intangible assets and goodwill should not be considered a source of future taxable income when assessing the realization of the Company’s deferred tax assets and as a result a deferred expense has been recorded.
The Company has a tax holiday in Israel, which expires in 2014. Taxable income for the Israeli subsidiary was $46,000 and $222,000 for the years ended December 31, 2009 and 2008, respectfully. The Israeli subsidiary has net carryforward losses for Israeli tax purposes of approximately $0.5 million.
As of December 31, 2009, the Company had a net operating loss carryforward for United States federal income tax purposes of approximately $32,027,000. Included in the aggregate net operating loss carryforward is $8,900,000 of tax deductions related to equity transactions, the benefit of which will be credited to stockholders’ equity, if and when realized after the other tax deductions in the carryforwards have been realized. The net operating loss carryforwards expire in 2016 through 2029.
64
The Company does not provide for federal income taxes or tax benefits on the undistributed earnings or losses of its international subsidiaries because earnings are reinvested and, in the opinion of management, will continue to be reinvested indefinitely. At December 31, 2009, the Company had not provided federal income taxes on cumulative earnings of individual international subsidiaries of $2,446,000. Should these earnings be distributed in the form of dividends or otherwise, the Company would be subject to both U.S. income taxes and withholding taxes in various international jurisdictions. Determination of the related amount of unrecognized deferred U.S. income tax liability is not practicable because of the complexities associated with its hypothetical calculation. As noted above, the Company has significant net operating loss carryforwards for U.S. federal income taxes purposes, which are available to offset the potential tax liability if the earnings were to be distributed.
The extent to which the loss carryforward can be used to offset future taxable income and tax liabilities, respectively, may be limited, depending on the extent of ownership changes within any three-year period.
The effective tax rate differed from the statutory U.S. federal income tax rate as follows:
|
Year ended December 31,
|
||||||||
|
2009
|
2008
|
|||||||
|
U.S. Federal Statutory rate
|
34.0 | % | 34.0 | % | ||||
|
State Tax
|
11.0 | % | 6.9 | % | ||||
|
Permanent differences
|
(7.0 | %) | (4.6 | %) | ||||
|
Foreign benefit
|
(0.9 | %) | 6.7 | % | ||||
|
Other
|
3.8 | % | - | |||||
|
Valuation allowance
|
(50.7 | %) | (45.3 | %) | ||||
|
|
(9.80 | %) | (2.3 | %) | ||||
10. Line of Credit
On May 23, 2006 the Company entered into a secured revolving line of credit (Line) agreement with a bank. That agreement was amended in June of 2008 with an expiration date of June 30, 2009. The line of credit was modified on July 31, 2009 to a guidance line of credit where all draws will be at the bank’s discretion and has a one year term. The guidance line of credit has no fees associated with it. The guidance line of credit interest rate is the prime rate, with a floor of 5%. There were no amounts outstanding as of December 31, 2009 and 2008.
11. Commitments and Contingencies
The Company leases facilities and equipment under non cancelable operating leases which include escalation clauses. Rent expense for facility leases for the years ended December 31, 2009 and 2008 was $1,127,000 and $950,000, respectively. Equipment and vehicle lease expense for the years ended December 31, 2009 and 2008 was $238,000 and $194,000, respectively.
Future minimum lease payments under the Company’s leases as of December 31, 2009 are as follows:
|
Operating Leases
|
||||
|
2010
|
$ | 1,108,000 | ||
|
2011
|
893,000 | |||
|
2012
|
538,000 | |||
|
2013
|
537,000 | |||
|
2014
|
545,000 | |||
|
Thereafter
|
- | |||
|
Total minimum lease payments
|
$ | 3,621,000 | ||
65
From time to time, the Company may be involved in certain legal actions and customer disputes arising in the ordinary course of business. In the Company’s opinion, the outcome of such actions will not have a material adverse effect on the Company’s financial position or results of operations.
12. Profit Sharing Plan/Savings Plan
The Company maintains a discretionary profit sharing plan, including a voluntary Section 401(k) feature, covering all qualified and eligible employees. Company contributions to the profit sharing plan are determined at the discretion of the Board of Directors. The Company may match 25% of eligible employees’ contributions to the 401(k) plan up to a maximum of 1.5% of each employee’s compensation. It was determined by the Board of Directors that there would be no match in 2009. The Company contributed approximately $93,000 for the year ended December 31, 2008.
13. Equity Plans
Share-Based Awards
The Company records stock based compensation using the modified prospective transition method. Under this method, compensation costs in 2009 include (a) compensation costs for all share-based payments granted to employees and directors prior to, but not yet vested as of January 1, 2006, based on the grant date value estimated and (b) compensation cost for all share-based payments granted subsequent to January 1, 2006, based on the grant date fair value estimated in.
The Company estimates the fair value of stock options granted using the Black-Scholes-Merton (Black-Scholes) option-pricing formula and amortizes the estimated option value using an accelerated amortization method where each option grant is split into tranches based on vesting periods. The Company’s expected term represents the period that the Company’s share-based awards are expected to be outstanding and was determined based on historical experience regarding similar awards, giving consideration to the contractual terms of the share-based awards and employee termination data. Executive level employees who hold a majority of options outstanding, and non-executive level employees each have similar historical option exercise and termination behavior and thus were grouped for valuation purposes. The Company’s expected volatility is based on the historical volatility of its traded common stock and places exclusive reliance on historical volatilities to estimate our stock volatility over the expected term of its awards. The Company has historically not paid dividends and has no foreseeable plans to issue dividends. The risk-free interest rate is based on the yield from the U.S. Treasury zero-coupon bonds with an equivalent term. Results for prior periods have not been restated.
As of December 31, 2009, the total unrecognized compensation cost related to non-vested options amounted to $431,000, which is expected to be recognized over the options’ remaining vesting periods of 2.54 years. No income tax benefit was realized by the Company in the year ended December 31, 2009 as the Company maintains a full valuation allowance on its net deferred tax asset.
Stock Option Plans
The Company has Stock Option Plans (the “Plans”) under which incentive and non-qualified stock options may be granted to its employees, officers, directors and others. Generally, incentive stock options are granted at fair value, become exercisable over a four-year period, and are subject to the employee’s continued employment. Non-qualified options are granted at exercise prices determined by the Board of Directors and vest over varying periods. A summary of the status of the Company’s stock options as of December 31, 2009 and 2008 and changes during the years then ended are as follows:
66
|
OPTIONS OUTSTANDING
|
OPTIONS EXERCISABLE
|
|||||||||||||||
|
Shares
|
Wtd. Avg. Exercise
Price Per Share
|
Shares
|
Wtd. Avg. Exercise
Price Per Share
|
|||||||||||||
|
Balance, December 31, 2007
|
484,000 | $ | 5.91 | 177,000 | $ | 6.43 | ||||||||||
|
Authorized
|
- | - | - | |||||||||||||
|
Granted
|
64,000 | 3.83 | - | - | ||||||||||||
|
Cancelled
|
(60,000 | ) | 5.89 | - | - | |||||||||||
|
Exercised
|
- | - | - | - | ||||||||||||
|
Expired
|
(19,000 | ) | 7.38 | - | - | |||||||||||
|
Balance, December 31, 2008
|
469,000 | $ | 6.10 | 243,000 | $ | 6.10 | ||||||||||
|
Authorized
|
- | - | ||||||||||||||
|
Granted
|
104,000 | 3.39 | - | - | ||||||||||||
|
Cancelled
|
(41,000 | ) | 4.74 | - | - | |||||||||||
|
Exercised
|
- | - | - | - | ||||||||||||
|
Expired
|
(1,000 | ) | 10.00 | - | - | |||||||||||
|
Balance, December 31, 2009
|
531,000 | $ | 5.20 | 307,000 | $ | 6.04 | ||||||||||
During the second quarter of 2006, the shareholders of the Company approved the 2006 Stock Option Plan in order to fulfill the Company’s needs of attracting new managerial and technical talent and retaining existing talent. The 2006 Plan authorizes the issuance of a maximum of 350,000 additional shares of Common Stock of the Company. When added to the existing plans, there are 79,000 shares available for granting future options as of December 31, 2009. It is the Company’s policy to issue shares from authorized but unissued common stock when shares are exercised.
The following table summarizes outstanding options that are vested and expected to vest under the Company’s stock option plans as of December 31, 2009:
|
Number of Shares
|
Wtd. Avg.
Exercise
Price Per Share
|
Weighted Average Remaining Contractual
Term (in years)
|
Aggregate Intrinsic
Value
|
|
|
Outstanding Options
|
531,000
|
$5.20
|
6.78
|
-
|
|
Ending Vested and Expected to Vest
|
371,000
|
$5.28
|
7.56
|
-
|
|
|
||||
|
Options Exercisable
|
307,000
|
$6.04
|
5.31
|
-
|
|
|
The intrinsic value of options exercised for the years ending December 31, 2009 and 2008 was $0. The total fair value of shares vested for the years ended December 31, 2009 and 2008 was $341,000 and $377,000, respectively.
A summary of the status of the Company’s nonvested share options as of December 31, 2009 is presented below:
|
Non Vested Shares
|
Shares
|
Wtd. Avg.
Grant Date
Fair Value
|
||||||
|
Nonvested at December 31, 2008
|
226,000 | $ | 3.51 | |||||
|
Granted
|
104,000 | $ | 2.58 | |||||
|
Vested
|
(82,000 | ) | $ | 4.16 | ||||
|
Forfeited or expired
|
(24,000 | ) | $ | 3.08 | ||||
|
Nonvested at December 31, 2009
|
224,000 | $ | 2.88 | |||||
67
The Company classified share-based compensation expense within the cost of services and maintenance, development, sales and marketing, and general and administrative expenses. The following table shows total share based compensation expense included in the Consolidated Statement of Operations:
|
Year Ended
December 31, 2009
|
Year Ended
December 31, 2008
|
|||||||
|
Cost of Services and Maintenance
|
$ | 17,000 | $ | 44,000 | ||||
|
Development
|
16,000 | 42,000 | ||||||
|
Sales & Marketing
|
3,000 | 31,000 | ||||||
|
General & Administrative
|
151,000 | 191,000 | ||||||
|
Pre-tax share based compensation
|
187,000 | 308,000 | ||||||
|
Income tax benefit
|
- | - | ||||||
|
Share-based compensation expense, net
|
$ | 187,000 | $ | 308,000 | ||||
68
14. Geographic Segment Data
The Company and its subsidiaries are engaged in the design, development, marketing and support of its service management software solutions. Substantially all revenues result from the license of the Company’s software products and related professional services and customer support services. The Company’s chief executive officer reviews financial information presented on a consolidated basis, accompanied by disaggregated information about revenues by geographic region for purposes of making operating decisions and assessing financial performance. Accordingly, the Company considers itself to have three reporting segments as follows:
|
Year ended December 31,
|
2009
|
2008
|
||||||
|
Revenues:
|
|
|||||||
|
Software license fees
|
|
|||||||
|
United States
|
|
|||||||
|
Domestic
|
$ | 2,064,000 | $ | 2, 509,000 | ||||
|
Export
|
- | - | ||||||
|
Total United States software license fees
|
2,064,000 | 2, 509,000 | ||||||
|
United Kingdom
|
584,000 | 179,000 | ||||||
|
Asia/Pacific
|
17,000 | 585,000 | ||||||
|
Total foreign software license fees
|
601,000 | 764,000 | ||||||
|
Total software license fees
|
2,665,000 | 3, 273,000 | ||||||
|
Services and maintenance
|
||||||||
|
United States
|
||||||||
|
Domestic
|
10,815,000 | 14,744,000 | ||||||
|
Export
|
925,000 | 284,000 | ||||||
|
Total United States service and maintenance revenue
|
11,740,000 | 15,028,000 | ||||||
|
Europe
|
2,120,000 | 3,147,000 | ||||||
|
Asia/Pacific
|
3,578,000 | 2,403,000 | ||||||
|
Total foreign service and maintenance revenue
|
5,698,000 | 5,550,000 | ||||||
|
Total service and maintenance revenue
|
17,438,000 | 20,578,000 | ||||||
|
Total revenue
|
$ | 20,103,000 | $ | 23,851,000 | ||||
|
Net (loss) income
|
||||||||
|
United States
|
$ | (349,000 | ) | $ | (2,880,000 | ) | ||
|
Europe
|
(605,000 | ) | (1,217,000 | ) | ||||
|
Asia/Pacific
|
55,000 | 962,000 | ||||||
|
Net (loss) income
|
$ | (899,000 | ) | $ | (3,135,000 | ) | ||
|
Long lived assets
|
||||||||
|
United States
|
$ | 5,491,000 | $ | 5, 807,000 | ||||
|
Europe
|
25,000 | 25,000 | ||||||
|
Asia/Pacific
|
13,000 | 18,000 | ||||||
|
Total long-lived assets
|
$ | 5,529,000 | $ | 5, 850,000 | ||||
|
Total assets
|
||||||||
|
United States
|
$ | 11,290,000 | $ | 12,902,000 | ||||
|
Europe
|
1,414,000 | 1,341,000 | ||||||
|
Asia/Pacific
|
1,566,000 | 923,000 | ||||||
|
Total assets
|
$ | 14,270,000 | $ | 15,166,000 | ||||
69
15. Selected Consolidated Quarterly Financial Data (Unaudited)
|
2009 Quarter Ended
|
Dec 31,
|
Sep 30,
|
Jun 30,
|
Mar 31,
|
||||||||||||
|
Revenues
|
$ | 5,597,000 | $ | 4,791,000 | $ | 4,931,000 | $ | 4,784,000 | ||||||||
|
Gross profit
|
2,614,000 | 1,541,000 | 1,927,000 | 1,599,000 | ||||||||||||
|
Net income (loss)
|
440,000 | (353,000 | ) | (258,000 | ) | (728,000 | ) | |||||||||
|
Basic net income (loss) per share
|
$ | .10 | $ | (.12 | ) | $ | (.09 | ) | $ | (.23 | ) | |||||
|
Diluted net income (loss) per share
|
$ | .10 | $ | (.12 | ) | $ | (.09 | ) | $ | (.23 | ) | |||||
|
Shares used in computing basic net income (loss) per share (in thousands)
|
3,554 | 3,554 | 3,554 | 3,554 | ||||||||||||
|
Shares used in computing
diluted net income (loss) per
share (in thousands)
|
4,381 | 3,554 | 3,554 | 3,554 | ||||||||||||
|
2008 Quarter Ended
|
Dec 31,
|
Sep 30,
|
Jun 30,
|
Mar 31,
|
||||||||||||
|
Revenues
|
$ | 5,912,000 | $ | 5,442,000 | $ | 5,471,000 | $ | 7,026,000 | ||||||||
|
Gross profit
|
2, 810,000 | 1,636,000 | 1,497,000 | 2,956,000 | ||||||||||||
|
Net income (loss)
|
401,000 | (976,000 | ) | (2,135,000 | ) | (425,000 | ) | |||||||||
|
Basic net income (loss) per share
|
$ | .09 | $ | (.27 | ) | $ | (.60 | ) | $ | (.12 | ) | |||||
|
Diluted net income (loss) per
share
|
$ | .09 | $ | (.27 | ) | $ | (.60 | ) | $ | (.12 | ) | |||||
|
Shares used in computing basic net income (loss) per share (in thousands)
|
3,554 | 3,554 | 3,554 | 3,554 | ||||||||||||
|
Shares used in computing
diluted net income (loss) per
share (in thousands)
|
4,381 | 3,554 | 3,554 | 3,554 | ||||||||||||
16. Subsequent Events
In February 2010, Astea International Japan, Inc., as wholly owned subsidiary moved into a new office under a noncancelable operating lease for 3 years. Minimum lease payments under this new office lease are $310,515.
Item 9. Changes in and Disagreements with Accountants on Accounting and Financial Disclosure.
None
Item 9A(T). Controls and Procedures.
|
|
(a)
|
Evaluation of Disclosure Controls and Procedures
|
As of the end of the period covered by this report, the Company conducted an evaluation, under the supervision and with the participation of management, including our principal executive officer and our principal financial officer, of the effectiveness of the Company’s disclosure controls and procedures (as defined in Rules 13a-15(e) and 15d-15(e) of the Securities Exchange Act of 1934 (the “Exchange Act”). Based on this evaluation, our principal executive officer and principal financial officer concluded that, as of December 31, 2009 the design and operation of our disclosure controls and procedures were effective.
70
|
|
(b)
|
Management’s Report on Internal Control Over Financial Reporting as of December 31, 2009
|
Management is responsible for establishing and maintaining adequate internal control over financial reporting. Internal control over financial reporting is defined in Rule 13a-15(f) and Rule 15d-15(f) under the Exchange Act as a process designed by, or under the supervision of, the issuer’s principal executive and principal financial officers, or persons performing similar functions, and effected by the issuer’s board of directors, management and other personnel, to provide reasonable assurance regarding the reliability of financial reporting and the preparation of financial statements for external purposes in accordance with GAAP and includes those policies and procedures that:
|
|
·
|
pertain to the maintenance of records that, in reasonable detail, accurately and fairly reflect the transactions and dispositions of the assets of the issuer;
|
|
|
·
|
provide reasonable assurance that transactions are recorded as necessary to permit the preparation of financial statements in accordance with U.S. GAAP, and that receipts and expenditures of the issuer are being made only in accordance with authorizations of management and directors of the issuer; and
|
|
|
·
|
provide reasonable assurance regarding the prevention or timely detection of unauthorized acquisition, use or disposition of the issuer’s assets that could have a material effect on the financial statements.
|
Because of its inherent limitations, internal controls over financial reporting may not prevent or detect misstatements. Also, projections of any evaluation of effectiveness to future periods are subject to the risk that controls may become inadequate because of changes in conditions or that the degree of compliance with existing policies or procedures may deteriorate.
In accordance with the internal control reporting requirements of the SEC, management completed an assessment of the adequacy of our internal control over financial reporting as of December 31, 2009. In making this assessment, management used the criteria set forth in Internal Control – Integrated Framework by the Committee of Sponsoring Organizations of the Treadway Commission (COSO). As a result of this assessment and based on the COSO framework, management has concluded that, as of December 31, 2009, our internal control over financial reporting was effective.
This annual report does not include an attestation report of the Company’s registered public accounting firm regarding internal control over financial reporting. Management’s report was not subject to attestation by the Company’s registered public accounting firm pursuant to temporary rules of the Securities and Exchange Commission that permit the Company to provide only management’s report in this annual report.
|
|
(c)
|
Changes in Internal Controls Over Financial Reporting
|
As a result of initiatives that management undertook in 2009 to remediate the known material weakness in our internal controls over financial reporting as of December 31, 2008, we made the following change to our internal controls over financial reporting throughout and during the year ended December 31, 2009. We expanded our internal contract documentation procedures and review process related to software revenue recognition.
71
Item 9B. Other Information.
None
PART III
Item 10. Directors, Executive Officers and Corporate Governance.
Certain information required by Part III is omitted from this Report in that the Company will file a definitive proxy statement within 120 days after the end of the Company’s fiscal year pursuant to Regulation 14A (the “Proxy Statement”) for its 2010 Annual Meeting of Stockholders proposed to be held on June 24, 2010, and the information therein is incorporated herein reference.
The information in the Proxy Statement set forth under the captions “Election of Directors,” “Executive Officers,” “Section 16(a) Beneficial Ownership Reporting Compliance,” “The Board of Directors and Its Committees—Code of Conduct and Ethics,” “The Board of Directors and Its Committees—Nominating and Corporate Governance Committee” and “The Board of Directors and Its Committees—Audit Committee” is incorporated herein by reference.
Item 11. Executive Compensation.
Executive Severance Agreements
The information in the Proxy Statement set forth under the captions “Compensation Discussion and Analysis” and “Compensation and Other Information Concerning Directors and Officers” of the Proxy Statement, is incorporated herein by reference.
Item 12. Security Ownership of Certain Beneficial Owners and Management.
The information set forth under the caption “Security Ownership of Certain Beneficial Owners and Management” of the Proxy Statement is incorporated herein by reference.
See “Securities Authorized for Issuance Under Equity Compensation Plans” under Part II, Item 5.
Item 13. Certain Relationships and Related Transactions.
The information required by this Item is incorporated by reference from the Proxy Statement under the captions “Certain Relationships and Related Transactions” and “The Board of Directors and its Committees.”
Item 14. Principal Accountant Fees and Services.
The information required by this Item is incorporated by reference from the Proxy Statement under the heading “Principal Accountant Fees and Services.”
72
PART IV
Item 15. Exhibits and Financial Statement Schedules.
|
|
(a)(1)(A)
|
Consolidated Financial Statements.
|
|
|
i)
|
Consolidated Balance Sheets at December 31, 2009 and 2008
|
|
|
ii)
|
Consolidated Statements of Operations for the years ended December 31, 2009 and 2008
|
|
|
iii)
|
Consolidated Statements of Stockholders’ Equity for the years ended December 31, 2009 and 2008
|
|
|
iv)
|
Consolidated Statements of Cash Flows for the years ended December 31, 2009 and 2008
|
|
|
v)
|
Notes to the Consolidated Financial Statements
|
|
|
(a)(1)(B)
|
Report of Independent Registered Public Accounting Firm.
|
|
|
(a)(2)
|
Schedules.
|
|
|
a)
|
Schedule II - Valuation and Qualifying Accounts
|
Schedule listed above has been omitted because the information required to be set forth therein is not applicable or is shown in the accompanying Financial Statements or notes thereto.
|
|
(a)(3)
|
List of Exhibits.
|
The following exhibits are filed as part of and incorporated by reference into this Annual Report on Form 10-K:
Exhibit No. Description
|
|
3.1
|
Certificate of Incorporation of the Company (Incorporated herein by reference to Exhibit 3.1 to the Company’s Registration Statement on Form S-1, as amended (File No. 33-92778)).
|
|
|
3.2
|
By-Laws of the Company (Incorporated herein by reference to Exhibit 3.2 to the Company’s Registration Statement on Form S-1, as amended (File No. 33-92778)).
|
|
|
3.3
|
Certificate of Designation of Series A Convertible Preferred Stock (Incorporated herein by reference to Exhibit 3.1 to the Company’s Current Report on Form 8-K filed September 26, 2008).
|
|
|
4.1
|
Specimen certificate representing the Common Stock (Incorporated herein by Reference to Exhibit 4.1 to the Company’s Registration Statement on Form S-1, as amended (File No. 33-92778)).
|
|
|
10.9
|
Amended and Restated 1995 Non-Employee Director Stock Option Plan (Incorporated herein by reference to Exhibit 10.9 to the Company’s Annual Report on Form 10-K for the year ended December 31, 1997).
|
|
|
10.10
|
Form of Non-Qualified Stock Option Agreement under the 1995 Non-Employee Director Stock Option Plan (Incorporated herein by reference to Exhibit 4.5 to the Company’s Registration Statement on Form S-8, filed on September 19, 1995 (File No. 33-97064)).
|
73
|
|
10.11
|
1997 Stock Option Plan (Incorporated herein by reference to Exhibit 10.10 to the Company’s Annual Report on Form 10-K for the fiscal year ended December 31, 1996).
|
|
|
10.12
|
Form of Non-Qualified Stock Option Agreement under the 1997 Stock Option Plan. (Incorporated herein by reference to Exhibit 10.11 to the Company’s Annual Report on Form 10-K for the fiscal year ended December 31, 1996).
|
|
|
10.13
|
Form of Incentive Stock Option Agreement under the 1997 Stock Option Plan (Incorporated herein by reference to Exhibit 10.12 to the Company’s Annual Report on Form 10-K for the fiscal year ended December 31, 1996).
|
|
|
10.14
|
1998 Stock Option Plan (Incorporated herein by reference to Exhibit 10.14 to the Company’s Annual Report on Form 10-K for the year ended December 31, 1997).
|
|
|
10.15
|
Form of Non-Qualified Stock Option Agreement under the 1998 Stock Option Plan. (Incorporated herein by reference to Exhibit 10.15 to the Company’s Annual Report on Form 10-K for the year ended December 31, 1997).
|
|
|
10.16
|
Form of Incentive Stock Option Agreement under the 1998 Stock Option Plan. (Incorporated herein by reference to Exhibit 10.16 to the Company’s Annual Report on Form 10-K for the year ended December 31, 1997).
|
|
|
10.28
|
2001 Stock Option Plan (Incorporated herein by reference to Exhibit B to the Company’s Proxy Statement on Schedule 14A filed July 5, 2001).
|
|
|
10.30
|
Form of Severance Agreement, dated April 14, 2008, between Astea International Inc. and certain of its officers.
|
Schedule of Differences
Each Severance Agreement executed with the executive officers listed below is substantially the same as the form of each other:
|
Officers
|
Title
|
|
Zack Bergreen
|
Chief Executive Officer
|
|
Fredric Etskovitz
|
Chief Financial Officer and Treasurer
|
|
John Tobin
|
President
|
|
|
10. 31
|
Preferred Stock Purchase Agreement by and between Astea International Inc. and Zack Bergreen, dated September 24, 2008 (Incorporated herein by reference to Exhibit 10.1 to the Company’s Current Report on Form 8-K filed September 26, 2008).
|
|
|
24.1*
|
Powers of Attorney (See the Signature Page).
|
|
|
31.2*
|
Exhibits.
* Filed herewith.
74
Pursuant to the requirements of Section 13 or 15(d) of the Securities Exchange Act of 1934, the registrant has duly caused this report to be signed on its behalf by the undersigned, thereunto duly authorized this 25th day of March 2010.
|
ASTEA INTERNATIONAL INC.
|
||
|
By:
|
/s/Zack Bergreen
|
|
|
Zack Bergreen
|
||
|
Chief Executive Officer
|
||
POWER OF ATTORNEY
KNOW ALL MEN BY THESE PRESENTS, that each person whose signature appears below constitutes and appoints Zack Bergreen and Rick Etskovitz, jointly and severally, his attorney-in-fact, each with the power of substitution, for him in any and all capacities, to sign any amendments to this Report on Form 10-K and to file same, with exhibits thereto and other documents in connection therewith, with the Securities and Exchange Commission, hereby ratifying and confirming all that each of said attorney-in-fact, or his substitute or substitutes, may do or cause to be done by virtue hereof.
Pursuant to the requirements of the Securities Exchange Act of 1934, this report has been signed below by the following persons on behalf of the Registrant and in the capacities and on the dates indicated.
|
Signature
|
Title
|
Date
|
|
|
/s/Zack Bergreen
|
Chief Executive Officer
|
March 25, 2010
|
|
|
Zack Bergreen
|
(Principal Executive Officer)
|
||
|
/s/Rick Etskovitz
|
Chief Financial Officer
|
March 25, 2010
|
|
|
Rick Etskovitz
|
(Principal Financial and Accounting Officer)
|
||
|
/s/Thomas J. Reilly, Jr.
|
Director
|
March 25, 2010
|
|
|
Thomas J. Reilly, Jr.
|
|
||
|
/s/Zack Bergreen
|
Director
|
March 25, 2010
|
|
|
Zack Bergreen
|
|||
|
/s/Adrian Peters
|
Director
|
March 25, 2010
|
|
|
Adrian Peters
|
|
||
|
/s/Eric Siegel
|
Director
|
March 25, 2010
|
|
|
Eric Siegel
|
75
EXHIBIT INDEX
|
No.
|
Description
|
|
|
21.1
|
||
|
23.1
|
||
|
24.1
|
Powers of Attorney (See the Signature Page).
|
|
|
31.1
|
||
|
31.2
|
||
|
32.1
|
||
|
32.2
|
||
76