Attached files
| file | filename |
|---|---|
| 8-K - USA TRUCK INC | form8k-03242010.htm |

USA
TRUCK
USA
TRUCK

Forward-Looking
Statement
This
information and the statements made at this conference presentation may
contain
forward-looking statements within the meaning of Section 27A of the Securities Act of
1933, as amended and Section 21E of the Securities Exchange Act of 1934, as amended.
These statements generally may be identified by their use of terms or phrases such as
“expects,” “estimates,” “anticipates,” “projects,” “believes,” “plans,” “intends,”
“may,” “will,” “should,” “could,” “potential,” “continue,” “future,” and terms or
phrases of similar substance. Forward-looking statements are based upon the current
beliefs and expectations of our management and are inherently subject to risks and
uncertainties, some of which cannot be predicted or quantified, which could cause
future events and actual results to differ materially from those set forth in,
contemplated by, or underlying the forward-looking statements. Accordingly, actual
results may differ from those set forth in the forward-looking statements. Readers
should review and consider the factors that may affect future results and other
disclosures by the Company in its reports, Annual Report on Form 10-K, and other
filings with the Securities and Exchange Commission. We disclaim any obligation to
update or revise any forward-looking statements to reflect actual results or changes in
the factors affecting the forward-looking information. In light of these risks and
uncertainties, the forward-looking events and circumstances discussed in this
conference presentation might not occur.
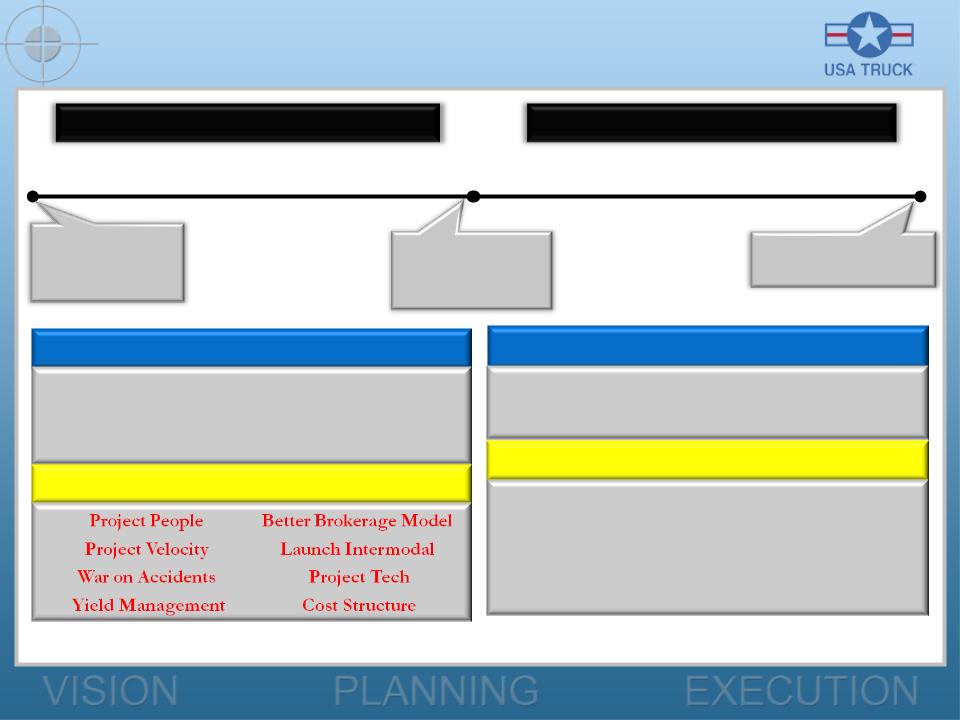
The
VEVA*
Plan
(Unveiled
August 2008)
* We call our strategic
plan Vision for Economic Value-Added, or VEVA
1.0
x Book Value
2
% ROC
98%
OR
3.0
x Book Value
10%
ROC
89%
OR
4.0
x Book Value
<
89% OR
PHASE
I - Earn Cost of Capital
PHASE
II - Earnings Growth
RESULTS
WE WILL NEED
Position
for L-T Growth
Improved
Earnings Consistency
Earn
Our Cost of Capital
RESULTS
WE WILL NEED
Sustained
Earnings Growth > 10%
Positive
Economic Value Added
HOW
WE’LL DO IT
HOW
WE’LL DO IT
Intermodal
Growth
Brokerage
Growth
Niche
Dedicated Launch
General
Freight Acquisitions
Share
Repurchases/Dividends
Project
People
2007
Peer Average (Our Original Goal)
3.9:1
2007
USA Truck
3.2:1
4.0:1
2009
USA Truck
Driver
to Non-Driver Ratio
Non-Drivers
-176
or -22%

2007
2007
2009
2009
Improvement
Improvement
Project
Velocity
Length of
Haul
784
599
-
24%
Velocity (Fleet
Turns Per Week)
2.4
3.0
+
25%
2007
2007
2009
2009
Improvement
Improvement
War
on Accidents
DOT
Accidents Per Million Miles
1.1
0.8
-
27%
Total Accidents
Per Million Miles
9.6
8.5
-
11%
Insurance
& Claims (% Revenue)
8.0%
6.4%
-
160 bps
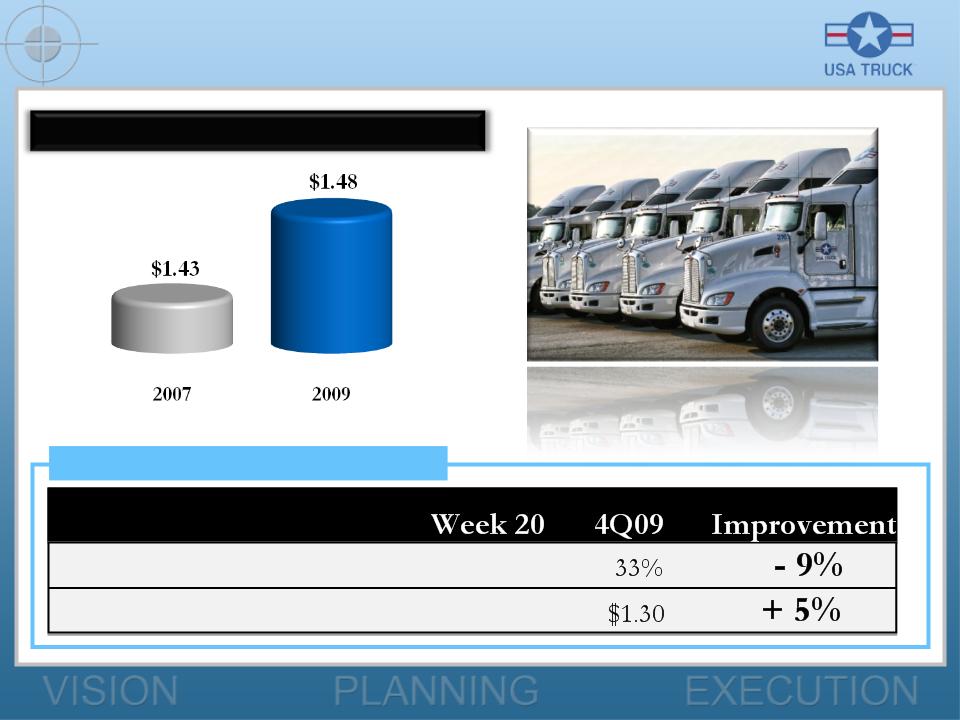
Yield
Management
% of
Outbound Loads
Trucking Revenue
Per Loaded Mile
Backhaul
Management Example
42%
$1.24
Trucking
Revenue Per Loaded Mile

2007
2007
2009
2009
Improvement
Improvement
Improve
Brokerage Model
Brokerage
Employees
10
30
+
200%
Gross Profit Per
Week (thousands)
$34.6
$48.7
+
41%
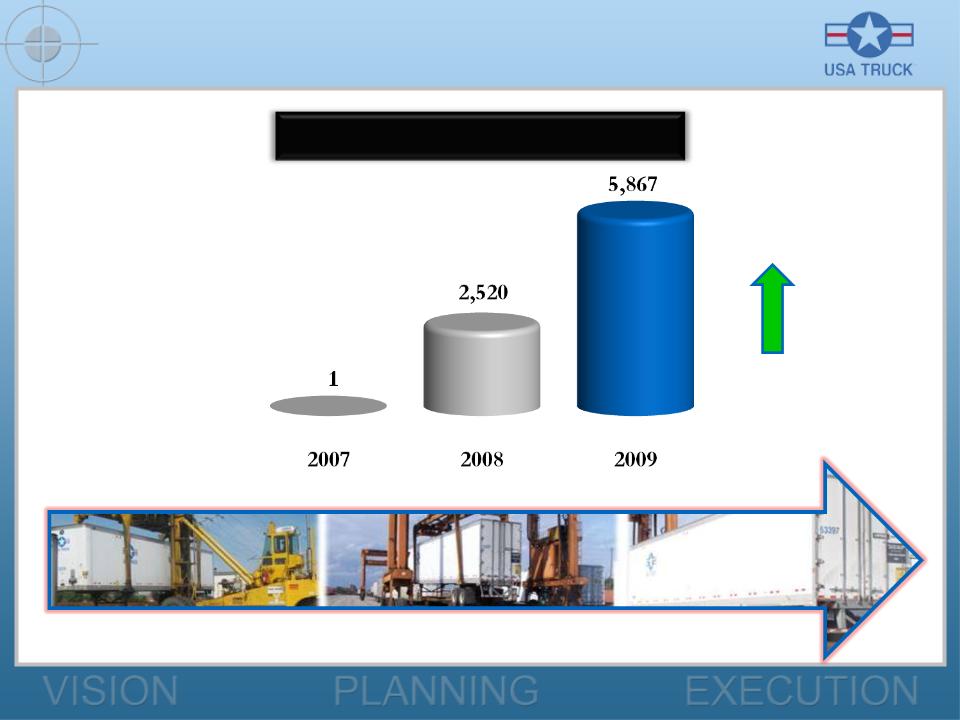
Launch
Intermodal Model
Load
Count
+133%
Project
Tech
Business
Intelligence
Corporate
Website
Customer
Relationship Management
Lane
Analysis
Operational
Decision Support
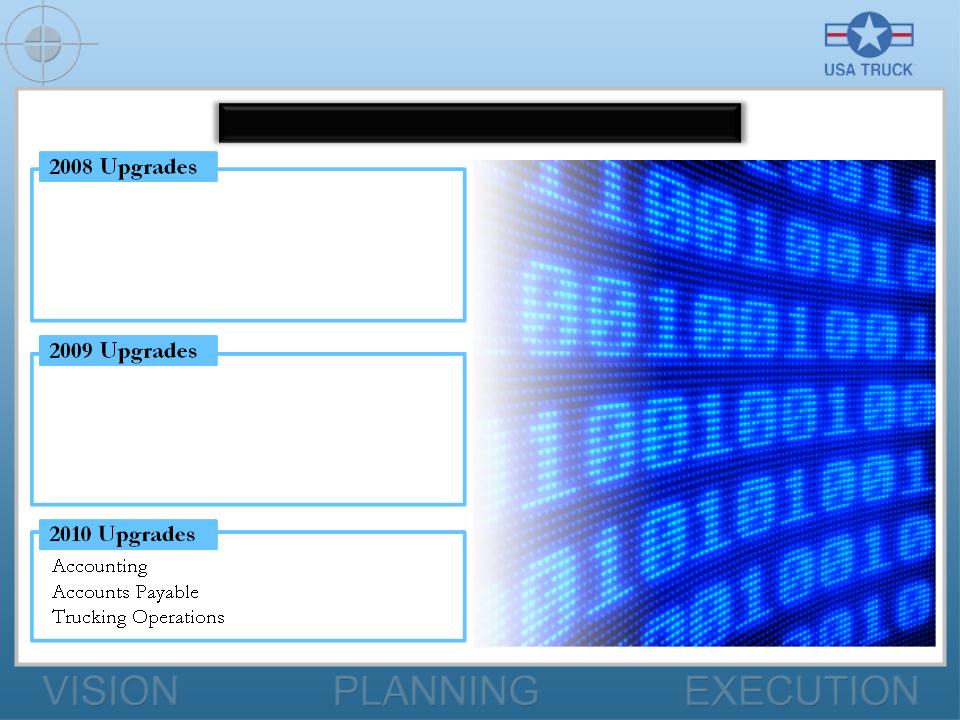
Modernizing
Our Technology Infrastructure
Accounts
Receivable
Brokerage
Operations
Intermodal
Operations
Pricing
Other
Strategic Initiatives
2007
2007
2009
2009
Improvement
Improvement
Fixed Costs Per
Month (millions)
$10.2
$9.4
-
9%
Owner-Operator
Tractors
153
+
303%
Company-Owned
Tractors
2,461
2,185
-
11%

The
VEVA*
Plan
(Unveiled
August 2008)
* We call our strategic
plan Vision for Economic Value-Added, or VEVA
1.0
x Book Value
2
% ROC
98%
OR
3.0
x Book Value
10%
ROC
89%
OR
4.0
x Book Value
<
89% OR
RESULTS
WE WILL NEED
Position
for L-T Growth
Improved
Earnings Consistency
Earn
Our Cost of Capital
RESULTS
WE WILL NEED
Sustained
Earnings Growth > 10%
Positive
Economic Value Added
HOW
WE’LL DO IT
HOW
WE’LL DO IT
Intermodal
Growth
Brokerage
Growth
Niche
Dedicated Launch
General
Freight Acquisitions
Share
Repurchases/Dividends
PHASE
I - Earn Cost of Capital
PHASE
II - Earnings Growth
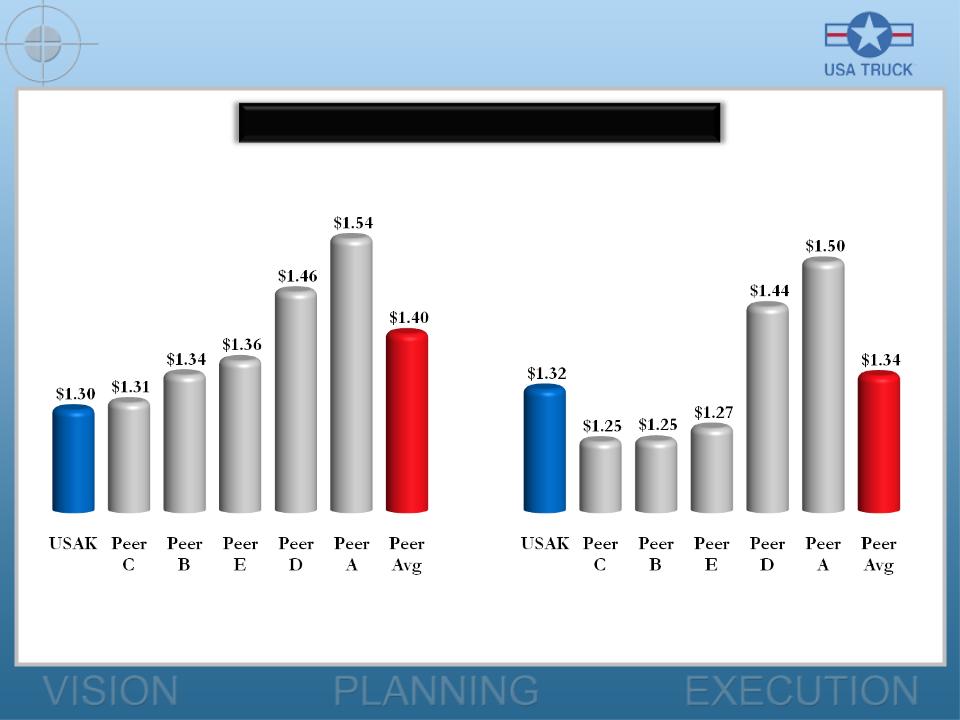
Ineffective
Pricing
Base
Revenue per Total Mile*
*
Asset-based operations only
Source: SEC Documents and USA Truck, Inc.
Source: SEC Documents and USA Truck, Inc.
Year
Ended December 31, 2008
Quarter
Ended December 31, 2009
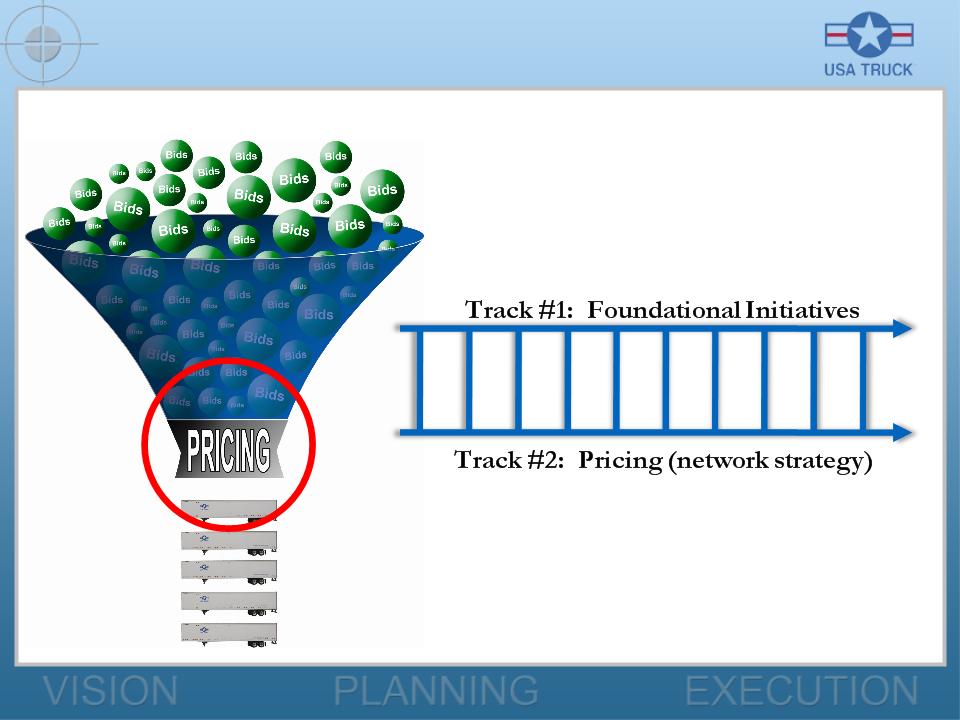
What
Are We Doing About It?
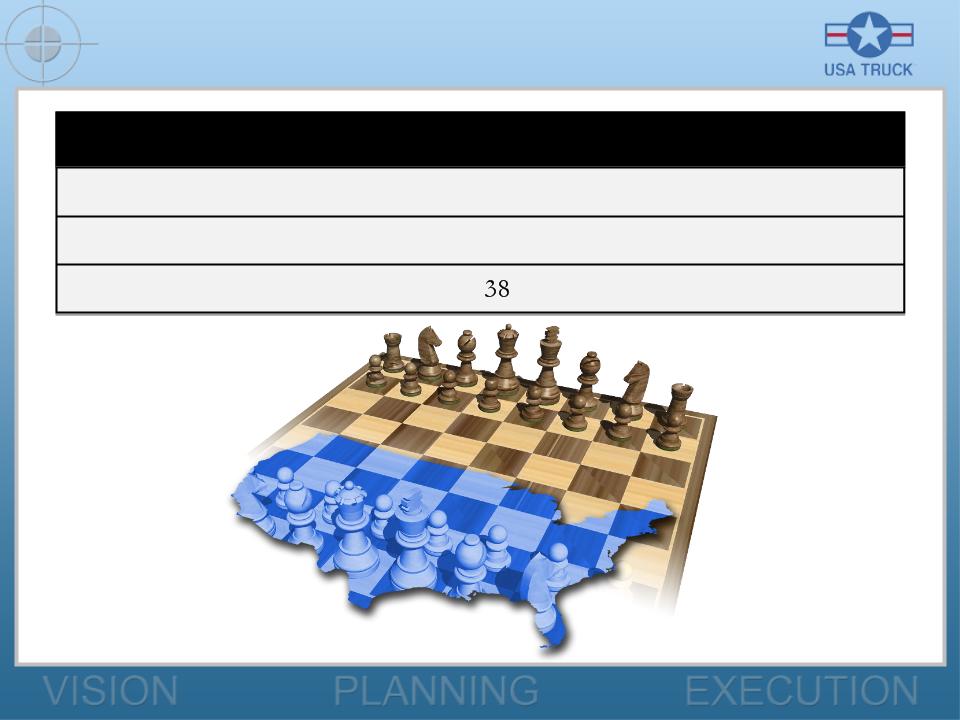
Implementing
the Spider Web
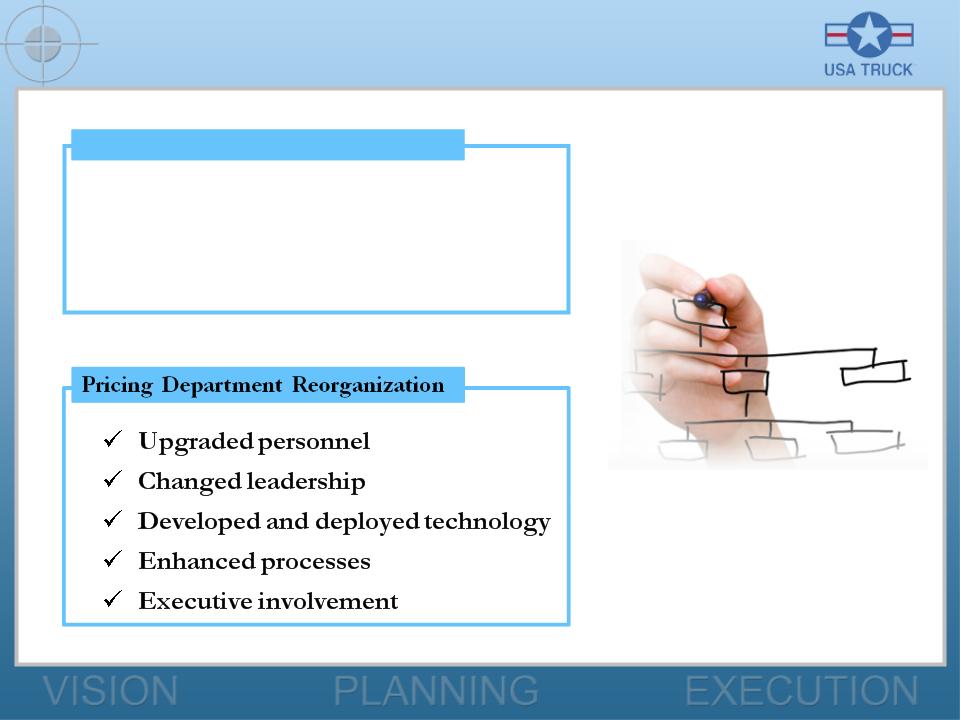
ü 20%
+ expansion
ü Doubled
field representation
ü Upgraded
1/3 of personnel
Sales
Department Reorganization
2009
2009
Spider
Web
Network
Network
Spider
Web
Network
Network
Potential
Potential
Improvement
Improvement
Implementing
the Spider Web
+
1¢ Net RPM ≈ 75 bps
≈
$0.14
EPS annually
Quarterly
Base Revenue > $85 mm ≈
65%
O.R.
Operating
Model Leverage
Length of
Haul
599
450
- 500
-
25%
Trucking Revenue
per Loaded Mile
$1.48
$1.65 -
$1.70
+
15%
Average Weekly
Load Volume
6,871
10,000-11,000
+
60%
Lanes
4,600
1,400
-
70%
Compliance with
Spider Web
38%
≈100%
+
62%
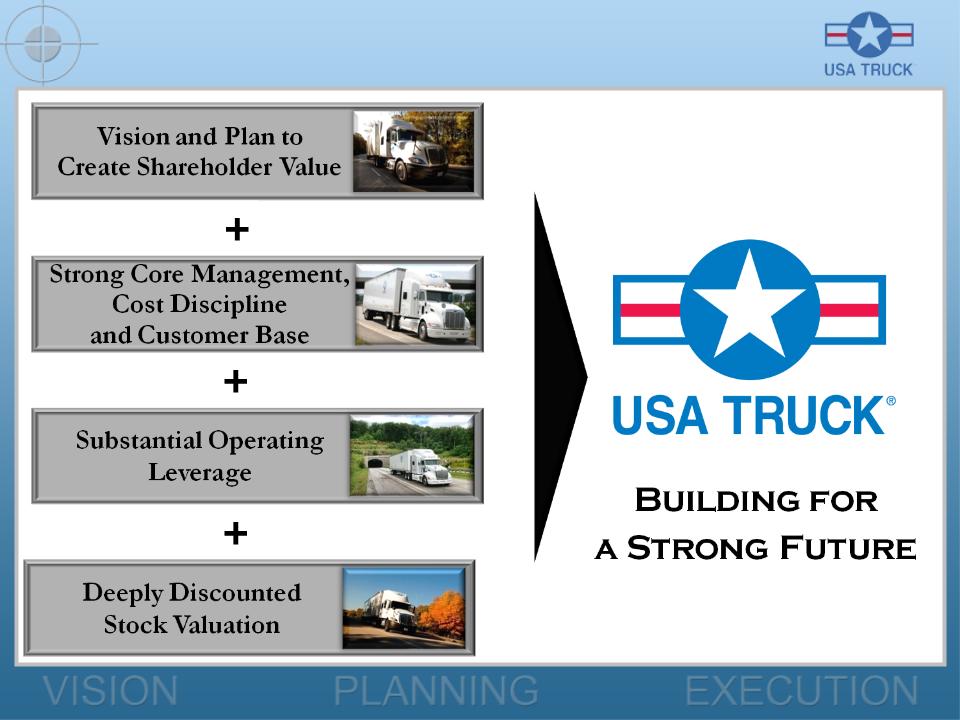
Why
Invest In USA Truck?
USA
TRUCK
USA
TRUCK