Attached files
| file | filename |
|---|---|
| 8-K - DYCOM INDUSTRIES, INC 8K 3-24-2010 - DYCOM INDUSTRIES INC | form8k.htm |

®
BB&T CAPITAL MARKETS
CONFERENCE
March 24, 2010
CONFERENCE
March 24, 2010

1
Forward-Looking Statements and Non-GAAP
Information
Information
Forward-Looking Statements and Non-GAAP
Information
Information
This presentation contains forward-looking statements within the meaning of the Private
Securities Litigation Reform Act of 1995. The words “believe,” “expect,” “anticipate,”
“estimate,” “intend,” “forecast,” “may,” “should”, “could”, “project,” “outlook” and similar
expressions identify forward-looking statements. These forward-looking statements are
based on management’s current expectations, estimates and projections and speak only as
of the date of this presentation. Forward-looking statements are subject to known and
unknown risks and uncertainties that may cause actual results in the future to differ
materially from the results projected or implied in any forward-looking statements contained
in this presentation. The factors that could affect future results and could cause these results
to differ materially from those expressed in the forward-looking statements include, but are
not limited to, those described under Item 1A, “Risk Factors” of the Company’s Annual
Report on Form 10-K for the year ended July 25, 2009, and other risks outlined in the
Company’s periodic filings with the Securities and Exchange Commission (“SEC”). Except
as required by law, the Company may not update forward-looking statements even though
its situation may change in the future.
This presentation includes certain “Non-GAAP” financial measures as defined by SEC rules.
As required by the SEC we have provided a reconciliation of those measures to the most
directly comparable GAAP measures on the Regulation G slide included at the end of this
presentation.
As required by the SEC we have provided a reconciliation of those measures to the most
directly comparable GAAP measures on the Regulation G slide included at the end of this
presentation.

2
Dycom Industries Introduction
n Leading provider of specialty contracting services principally to telephone
and cable companies
and cable companies
n Telecommunications industry dynamics driving growth potential
n Major participant in a large, but fragmented industry, which offers
acquisition opportunities
acquisition opportunities
n Significant portion of revenues from multi-year Master Service
Agreements
Agreements
n Experienced management team operating through a decentralized,
customer-focused organizational structure
customer-focused organizational structure
n Strong cash flows and liquidity
3
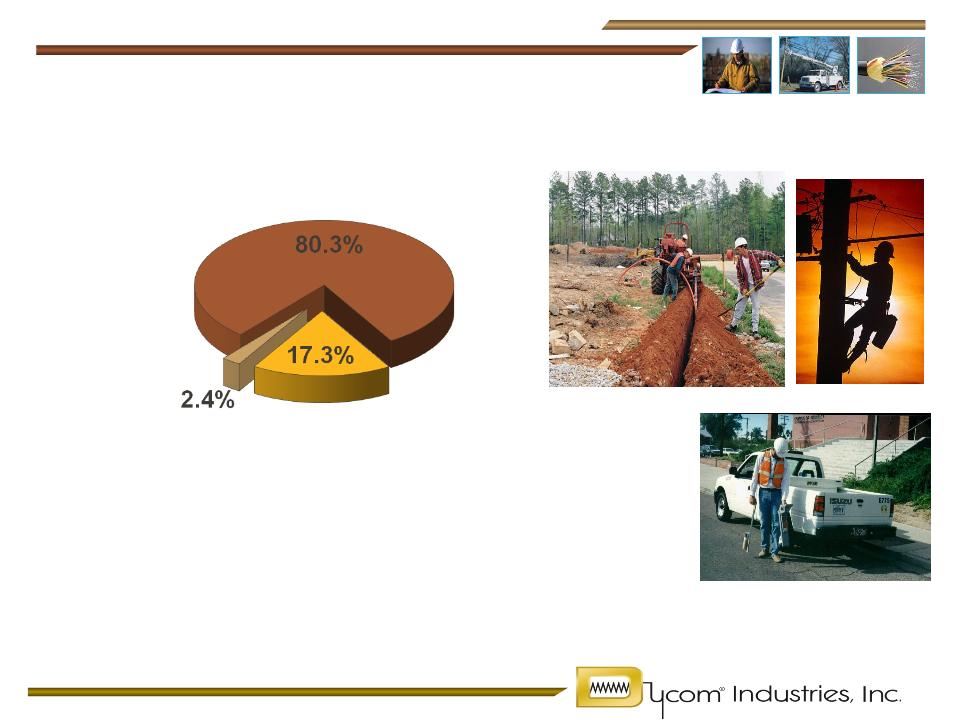
Revenue Mix
Quarter Ended January 23, 2010- $216.3 million
Telecommunications
Underground Facility
Locating
Electric Utilities and
Other Construction
and Maintenance
4
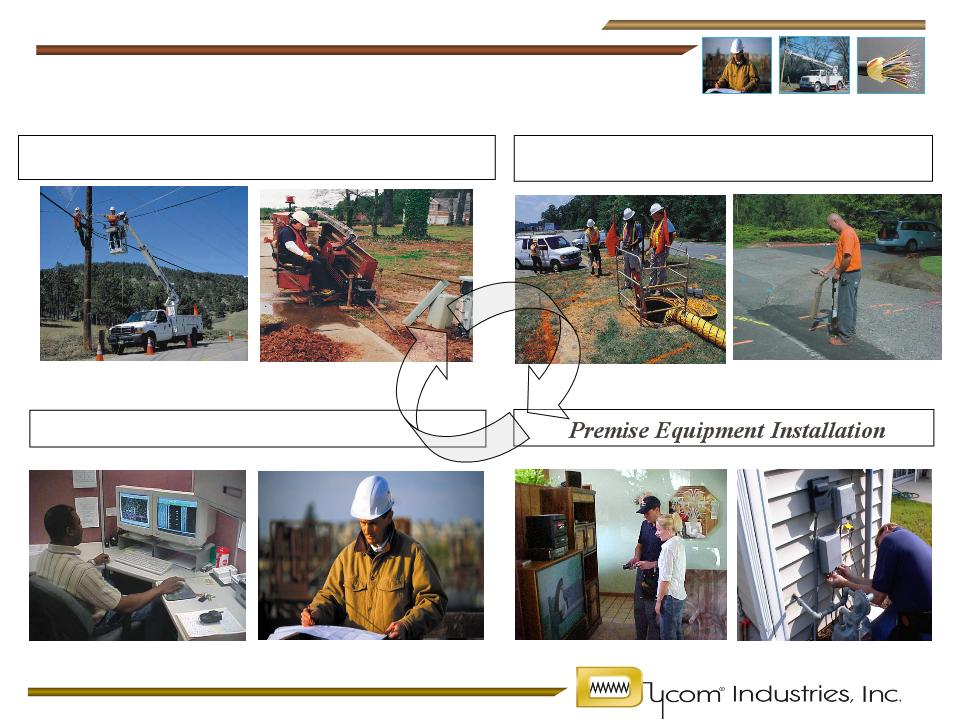
Providing End-To-End Services
Engineering
Underground Facility Locating
Outside Plant & Equipment Installation

5
n Headquartered in Palm Beach Gardens, Florida
n Second quarter fiscal 2010 revenues of $216.3 million
n Strong financial profile
} Cash and equivalents $135.9 million at January 23, 2010
} Shareholders’ equity $391.0 million at January 23, 2010
} Operating cash flow of $126.6 million for fiscal year 2009
} Committed Bank Facility of $210 million through September 2011;
$153.4 million available as of January 23, 2010
$153.4 million available as of January 23, 2010
n Nationwide footprint
} Operates in 48 states and to a limited extent in Canada
} 30 operating subsidiaries and hundreds of field offices
n Over 8,300 employees
n Listed on the NYSE under the ticker: DY
Dycom Industries
At a Glance
At a Glance
Dycom is a leading telecommunications infrastructure provider in the United States
6
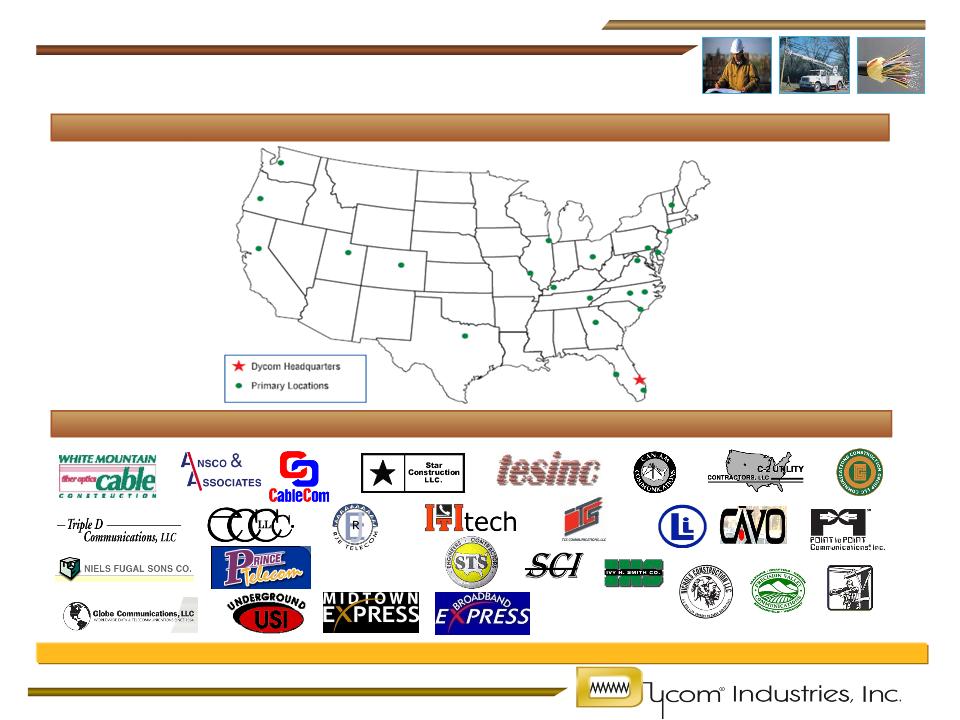
Strong subsidiaries, broad national footprint
Subsidiaries
Cable Connectors
UtiliQuest
Dycom’s Nationwide Presence
LAMBERTS
Dycom Operating Overview

7
Industry Developments…
n Telephone/cable industry convergence - a reality
} Competition for customers drives growth
n Network bandwidth expansion - an imperative
} Telephone companies expanding network capacity
} Cable responding to match capabilities and facilitate new
products such as VOIP, HDTV, and wideband
products such as VOIP, HDTV, and wideband
n Product bundles - key to telephone/cable success
} Decrease churn
} Provide revenue growth opportunities to offset market
share erosion
share erosion
} Differentiate service from satellite video providers

8
…And Opportunities
n Increased capital spending
} Telephone company deployments of Fiber (FTTx)
} Cable company bandwidth expansion
} Customer premise equipment deployments
} Fiber to the cell site
n Renewed focus on network reliability and availability as
subscribers demand better service levels
subscribers demand better service levels
n Continued outsourcing as time to market and
installation quality crucial for new product launches
installation quality crucial for new product launches

9
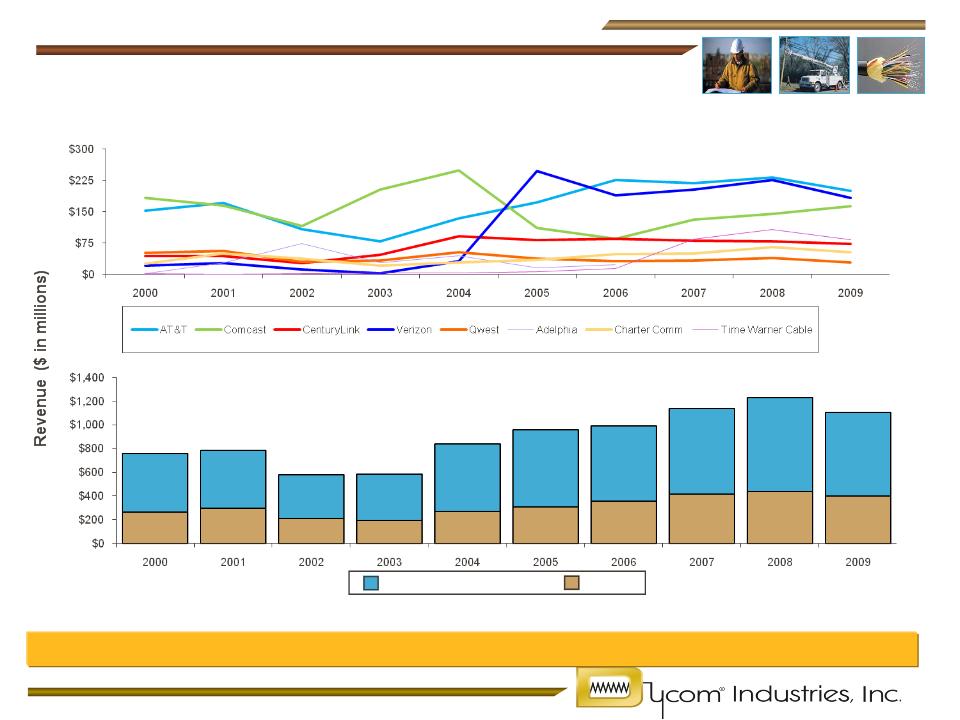
Telecom Capital Spending
Capex Commentary
n Continued capital spending in wireline reflects burgeoning demand for voice, data and
video transmission
video transmission
n RBOCs will continue to constitute the vast majority of U.S. fixed line investment
n Significant portion of RBOCs’ capital budgets are expected to be from fiber deployments,
including fiber to the cell site initiatives
including fiber to the cell site initiatives
n Carriers are shifting capital spending to address growth needs and increased
competition from cable companies
competition from cable companies
“We are taking our U-verse build, which is our IPTV build, the broadband capability
that we have been deploying, and we are going to get to 30 million homes by the
end of next year. We are actually moving that build out to cover more of our small
business locations. We have a fairly aggressive plan to get the U-verse build in
front of a lot of small businesses, integrate the high-bandwidth product with a
mobile product, and we think it is going to be pretty powerful.”
Randall Stephenson- AT&T - Chairman, Chief Executive Officer and President
March 2010
March 2010

10
Cable Capital Spending
Capex Commentary
n Continued capital expenditures on bandwidth reclamation, VOIP and HDTV product
offerings, and cellular backhaul
offerings, and cellular backhaul
n Ongoing plant and network enhancements are critical as cable operators continue to
offer services that require greater reliability
offer services that require greater reliability
n Network capacity and reliability increasingly crucial as cable companies compete with
traditional telecom firms
traditional telecom firms
“[…] we have been aggressively rolling out All-Digital and Wideband. These are
initiatives that are central to our strategy, and so we are investing about $1 billion in
these two projects between 2009 and 2010, and we’ve made rapid progress
deploying these technologies and new products that follow the rollout”
initiatives that are central to our strategy, and so we are investing about $1 billion in
these two projects between 2009 and 2010, and we’ve made rapid progress
deploying these technologies and new products that follow the rollout”
Brian Roberts, Comcast - Chairman and Chief Executive Officer February 2010

11
n “Dig Safe” laws in all 50 states require owners of underground
utilities to identify and mark their facilities prior to excavation
utilities to identify and mark their facilities prior to excavation
} Regulate telephone, cable, power, gas, water & sewer utilities
} Seek to minimize network outages, protect job-site workers, and
safeguard the general public
safeguard the general public
} Locates often required as a condition for permit issuance
n Generally outsourced by telecom companies and cable operators
} Work generated by excavators via “800 number” call centers
} High volume of transactions must be completed within 48-72
hours
hours
n Regulatory backdrop promotes steady workflow
} Driven by regional macro-economic factors
Underground Facility Locating Services

12
Dycom’s Competitive Advantages
n Established customer relationships and reputation
n Broad geographic coverage
n Scale to satisfy customer time and service requirements
n Responsive, local decentralized business units
n Access to capital
n Senior management operating expertise

13
Dycom employs a deliberate and methodical growth strategy
Growth Strategy As Opportunities Expand
n Build and maintain long-term customer relationships at the local level
} Position business to capture both recurring maintenance and new capital
spending
spending
n Empower subsidiary management
} Build relationships with customer contracting decision makers
} Utilize detailed knowledge of local pricing dynamics
} Leverage subcontractors and local trade relationships
n Deliberately select attractive customers with profitable business
} Focus on higher quality, long-term telecommunications industry leaders
n Selectively screen potential acquisitions
} Healthy players that bring long-term, established customer relationships
} Complement existing Dycom customer footprint
} Position Company for significant customer capital or maintenance spending
14
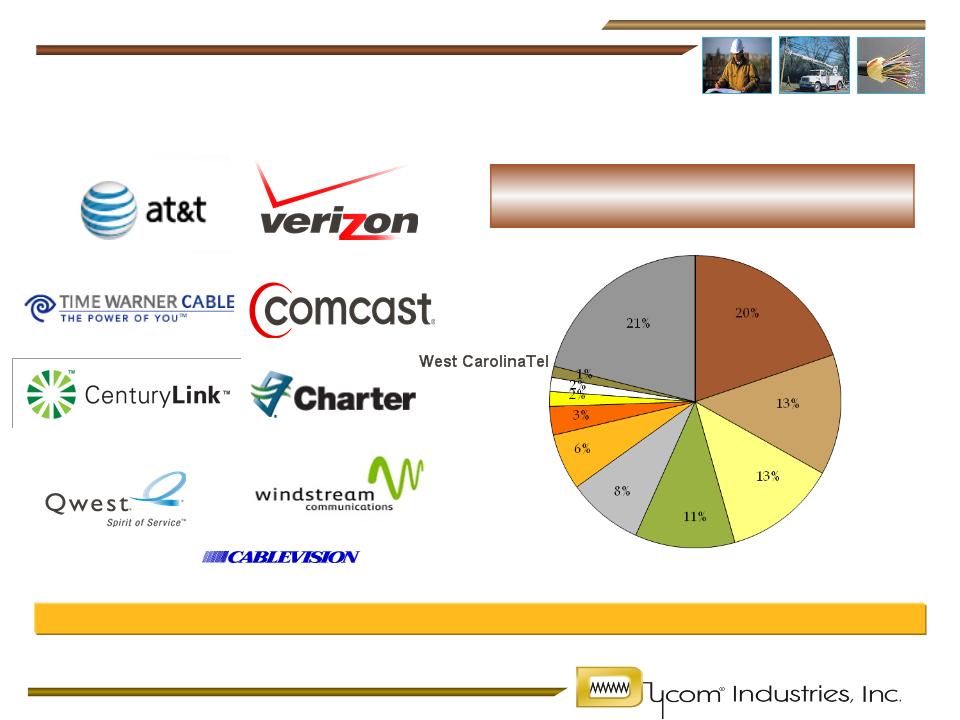
Blue-chip, predominantly investment grade clients comprise the vast majority of revenue
Other
Comcast
Charter
Cablevision
Windstream
AT&T
CenturyLink
Well Established Customers
Fiscal Quarter Ended January 23, 2010
Customer Revenue Breakdown
Qwest
Verizon
Time Warner Cable
15
Customer Rotation
Key long-term relationships help Dycom manage the cyclical nature of telecom and cable capex spending
$958
$842
$588
$579
$784
$760
Top 5 Customers
Other
65%
35%
62%
38%
63%
68%
32%
68%
32%
64%
36%
$995
37%
63%
$1,138
33%
67%
For comparison purposes, when customers have been combined through acquisition or merger, their revenues have been combined for all periods.
37%
64%
36%
$1,230
$1,107
64%
36%
16
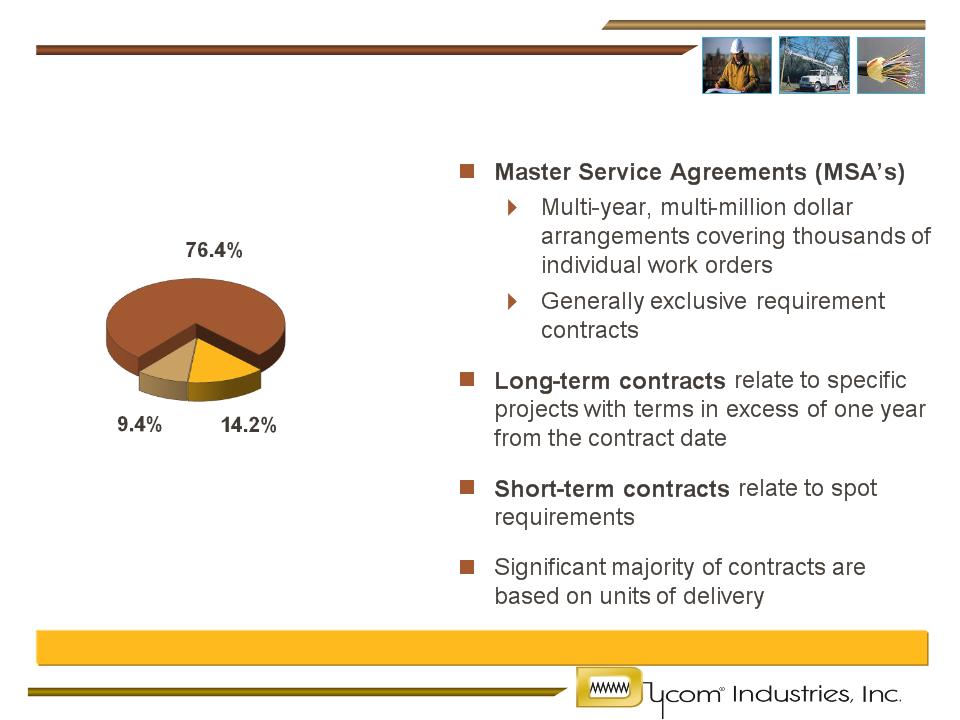
Revenue - Q2 Fiscal 2010
Dycom’s revenue stream is primarily generated by long-term contractual agreements
Master Service Agreements
Long-term
contracts
Short-term
contracts
17
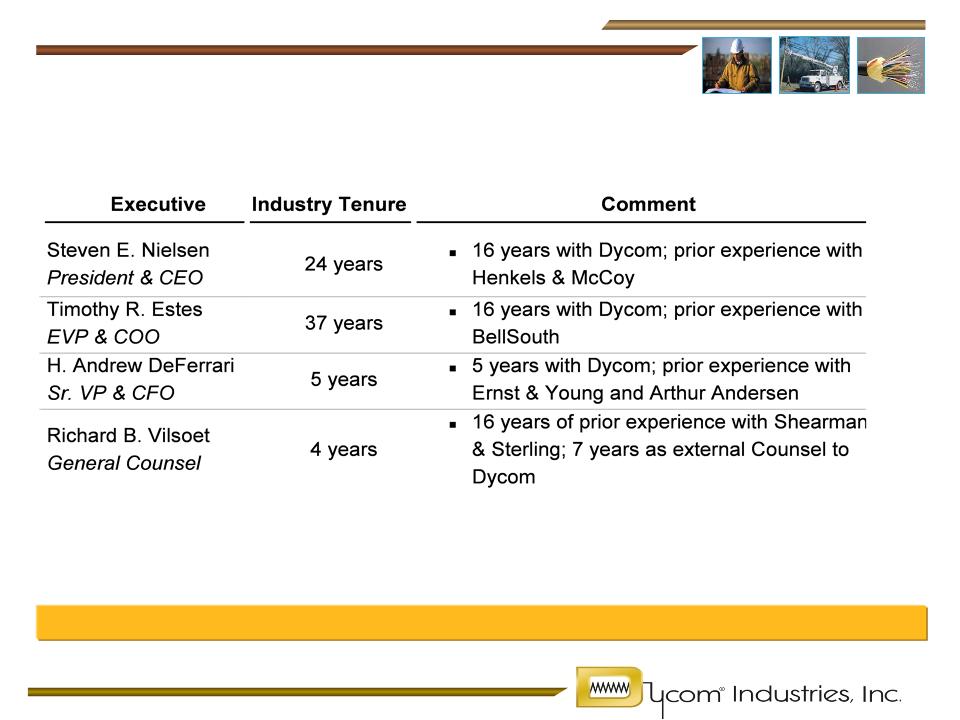
Senior Management
Operating Overview
Seasoned management team with several decades of combined industry experience

®
Financial Update

19
n Centralize activities which yield synergistic benefits
} Treasury
} Tax
} Risk management
} Capital asset procurement
} Information technology resources
n Decentralize financial operations to provide solid
support and flexibility at operating unit level
support and flexibility at operating unit level
n Maintain financial resources to support internal growth
and acquisition opportunities
and acquisition opportunities
Financial Overview
20
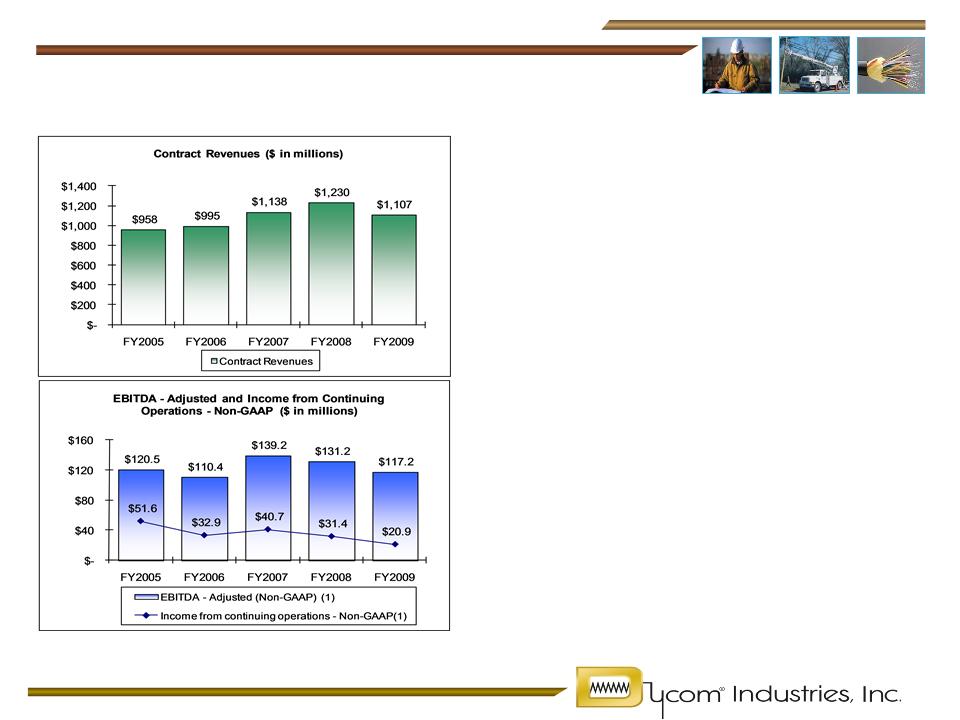
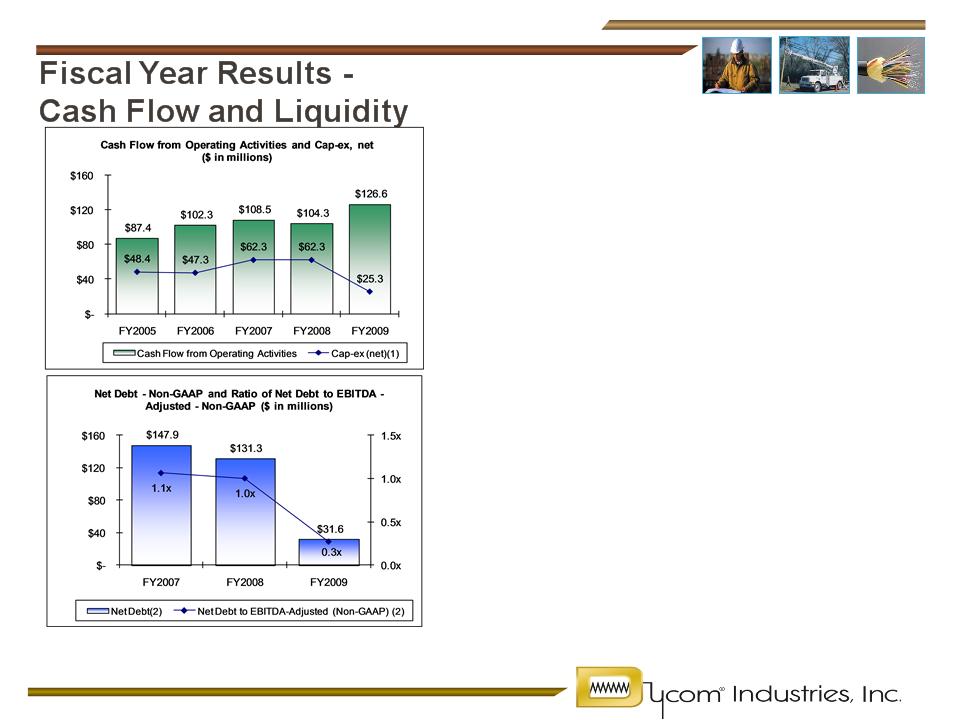
Fiscal Year Results -
Revenue and Earnings
Revenue and Earnings
(1) The amounts for EBITDA - Adjusted and Income from continuing operations -Non-GAAP are Non-GAAP financial measures adjusted to exclude certain items. See
“Regulation G Disclosure” slide for a reconciliation of Non-GAAP financial measures to GAAP financial measures.
“Regulation G Disclosure” slide for a reconciliation of Non-GAAP financial measures to GAAP financial measures.
n Annual revenue exceeding $1.1
billion for the three most recent
fiscal years
billion for the three most recent
fiscal years
n Revenue and results impacted by
customer reductions in capital
spending plans in response to
challenging economic conditions
customer reductions in capital
spending plans in response to
challenging economic conditions
21
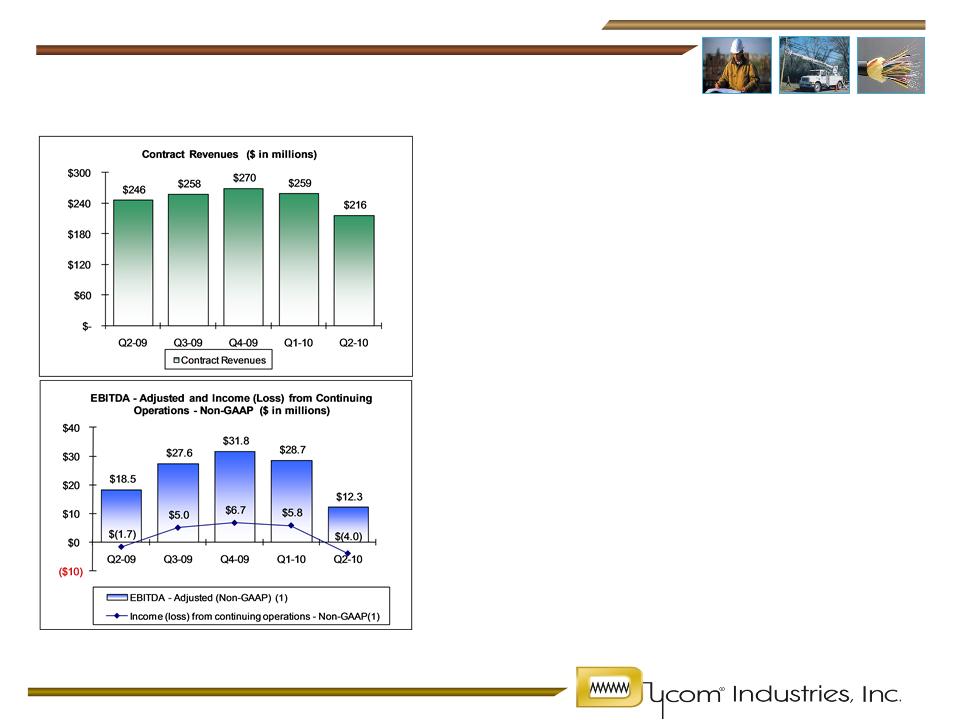
Quarterly Results -
Revenue and Earnings
Revenue and Earnings
n Seasonal revenue pattern driven by
weather and available work days.
weather and available work days.
n Q2-10 year over year revenue
decline of 11.9% reflects customer
reductions in capital spending.
decline of 11.9% reflects customer
reductions in capital spending.
n EBITDA - Adjusted and Income from
Continuing Operations declined due
to reduced level of operations.
Continuing Operations declined due
to reduced level of operations.
(1) The amounts for EBITDA - Adjusted and Income (Loss) from continuing operations -Non-GAAP are Non-GAAP financial measures adjusted to exclude certain
items. See “Regulation G Disclosure” slide for a reconciliation of Non-GAAP financial measures to GAAP financial measures.
items. See “Regulation G Disclosure” slide for a reconciliation of Non-GAAP financial measures to GAAP financial measures.
22
(1) Capital expenditures net of proceeds from the sale of assets
(2) The amounts for EBITDA - Adjusted and Net Debt used in the calculations herein are Non-GAAP financial measures adjusted to exclude certain items. See
“Regulation G Disclosure” slide for a reconciliation of Non-GAAP financial measures to GAAP financial measures.
“Regulation G Disclosure” slide for a reconciliation of Non-GAAP financial measures to GAAP financial measures.
n Cash flow from operations over $100
million for the four most recent years
million for the four most recent years
n Ample cash flows to support capital
expenditures and fund operations
expenditures and fund operations
n Long term financing in place as of
January 23, 2010
January 23, 2010
} $135.35 million Senior Subordinated
Notes - October 2015 maturity
Notes - October 2015 maturity
} $210 million Credit Facility:
} September 2011 maturity
} No borrowings outstanding
n Net cash position as of January 23, 2010
23
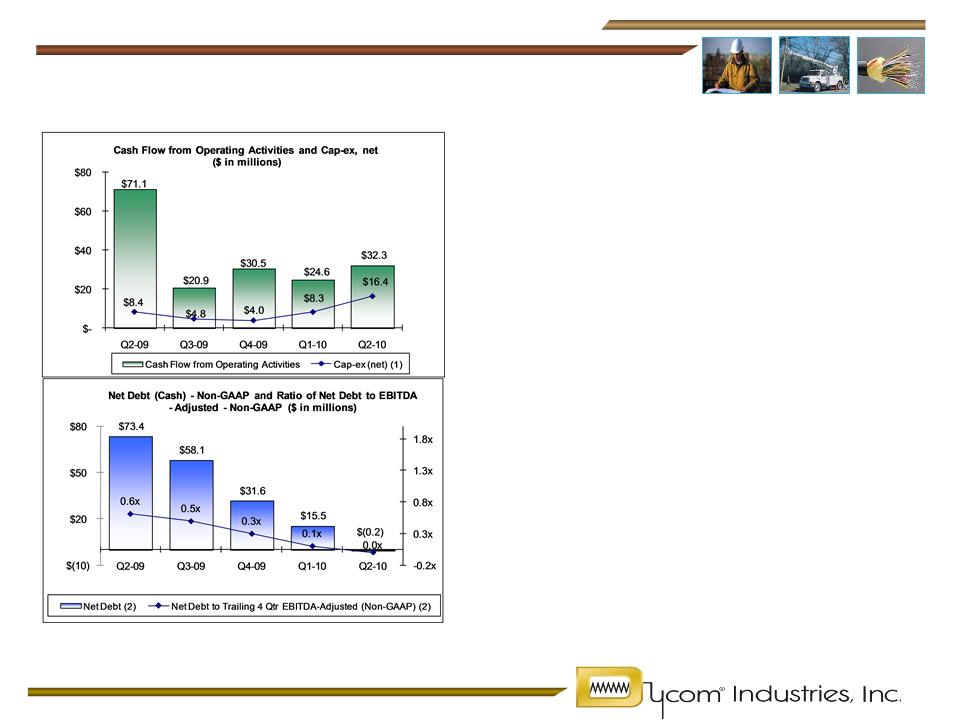
Quarterly Results -
Cash Flow and Liquidity
Cash Flow and Liquidity
(1) Capital expenditures net of proceeds from the sale of assets
(2) The amounts for EBITDA - Adjusted and Net Debt used in the calculations herein are Non-GAAP financial measures adjusted to exclude certain items. See
“Regulation G Disclosure” slide for a reconciliation of Non-GAAP financial measures to GAAP financial measures.
“Regulation G Disclosure” slide for a reconciliation of Non-GAAP financial measures to GAAP financial measures.
n Significant cash flow from operations
reflects efficient conversion of earnings
and working capital to cash
reflects efficient conversion of earnings
and working capital to cash
n Net debt has declined as a result of
significant cash flows from operations
significant cash flows from operations
n Ample liquidity as of January 2010
} $135.9 million cash and equivalents
} $153.4 million availability under
Revolving Credit Facility
Revolving Credit Facility
24
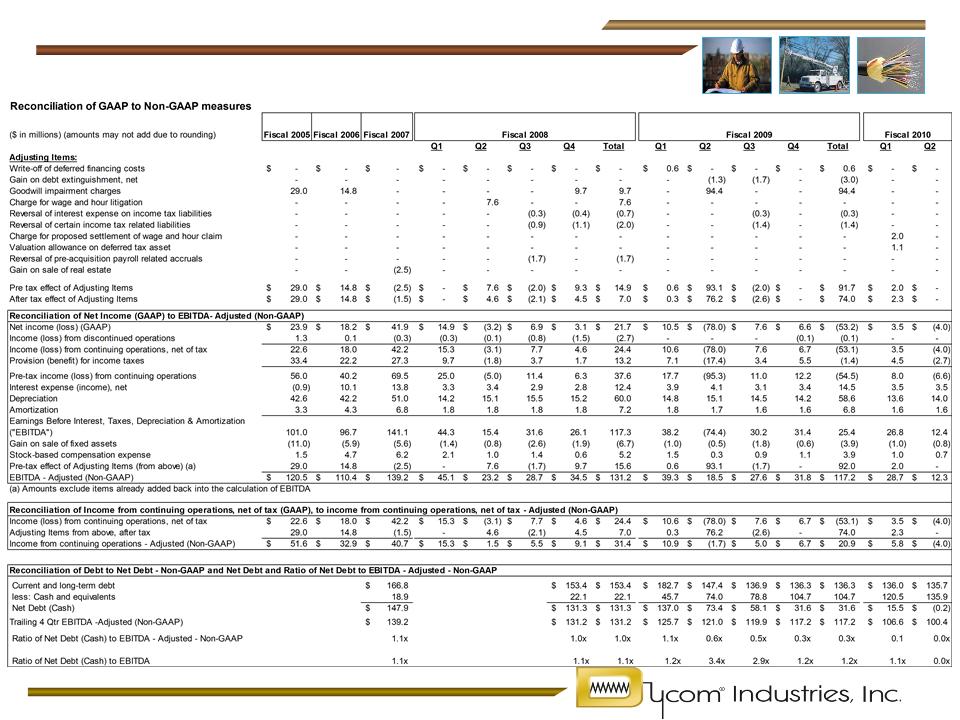
Regulation G Disclosure
®
BB&T CAPITAL MARKETS
CONFERENCE
March 24, 2010
CONFERENCE
March 24, 2010