Attached files
| file | filename |
|---|---|
| 8-K - CURRENT REPORT ON FORM 8-K - US ECOLOGY, INC. | usecology_8k-032410.htm |
Exhibit 99.1
Investor
Presentation March 2010
Safe
Harbor
During
the course of this presentation the Company will be making forward-looking
statements (as such term is defined in the Private Securities Litigation Reform
Act of 1995) that are base d on our current expectations, beliefs and
assumptions about the industry and markets in which American Ecology Corporation
and its subsidiaries operate. Because such statements include risks and
uncertainties, actual Corporation and its subsidiaries operate. Because such
statements include risks and uncertainties, actual results may differ materially
from what is expressed herein and no assurance can be given that the Company
will meet its 2010 earnings estimates, successfully execute its growth strategy,
or declare or pay future dividends. For information on other factors that could
cause actual results to differ materially from expectations, please refer to US
Ecology, Inc.’s (formally known as American Ecology Corporation) December 31,
2009 Annual Report on Form 10K and other reports filed with the Securities and
Exchange Commission. Many of the factors that will determine the Company’s
future results are beyond the ability of management to control or predict.
Participants should not place undue reliance on forward-looking statements,
which reflect management’s views only as of the date hereof. The Company
undertakes no obligation to revise or update any forward-looking statements, or
to make any other forward-looking statements, whether as a result of new
information, future events or otherwise.
Important
assumptions and other important factors that could cause actual results to
differ materially from those set forth in the forward-looking information
include a loss of a major customer compliance with and those set forth in the
forward-looking information include a loss of a major customer, compliance with
and changes to applicable laws and regulations, market conditions and production
rates for the thermal recycling service at our Texas facility, our ability to
replace business from completed Honeywell Jersey City project, access to cost
effective transportation services, access to insurance and other financial
assurances, loss of key personnel, lawsuits, adverse economic conditions
including a tightened credit market, the timing or level of government funding
or competitive conditions, incidents that could limit or suspend specific
operations, our ability to perform under required contracts our willingness or
ability to pay dividends and our ability to integrate any potential
acquisitions.
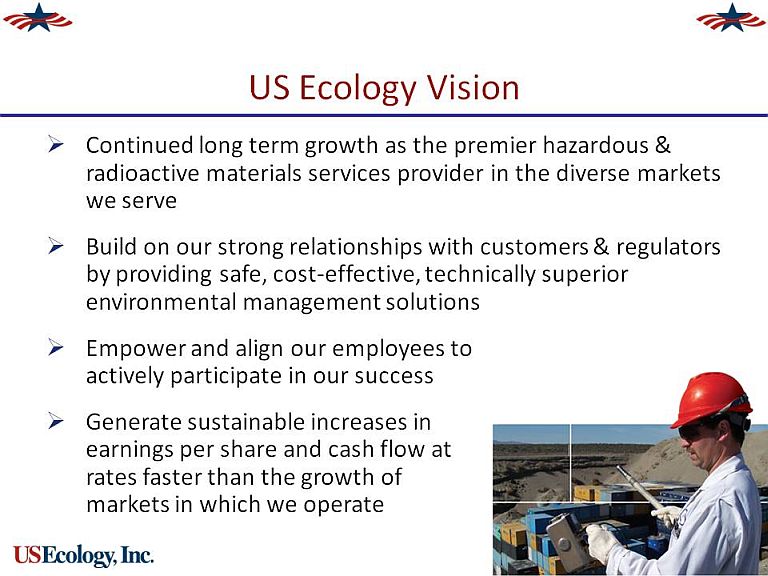
US
Ecology Vision
Continued
long term growth as the premier hazardous & radioactive materials services
provider in the diverse markets we serve Build on our strong relationships with
customers & regulators by providing safe, cost effective, technically
superior environmental management solutions Empower and align our employees to
actively participate in our success Generate sustainable increases in earnings
per share and cash flow at rates faster than the growth of markets in which we
operate
Investment
Highlights
Unique
set of radioactive & hazardous services and assets Seasoned, committed
Executive management team Strong cash flow business – Investment in
infrastructure fueling organic growth Significant operating leverage once fixed
costs are covered Strong balance sheet with no debt Return on invested capital:
14.3% ttm
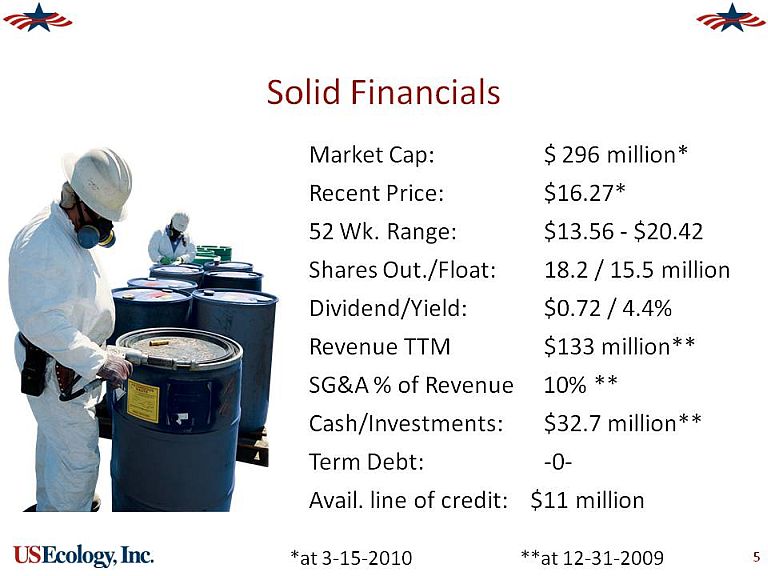
Solid
Financials
Market
Cap: $ 296 million* Recent Price: $16.27* 52 Wk. Range: $13.56 $20.42 Shares
Out./Float: 18.2/15.5 million Dividend/Yield :$0.72/4.4% Revenue TTM $13
3million** SG&A % of Revenue 10%** Cash/Investments: $32.7 million ** Term
Debt: 0 Avail. line of credit: $11 million *at 3-15-2010 ** at
12-31-2009
U.S.
Disposal Market Overview
Historically
3.5M tons/year Down in 2009 due to economy – Base Business: Recurring waste
streams from industrial base Lower manufacturing output in 2009 produced lower
waste volumes–Must take market share to grow Event Business: Discrete cleanups
Private/discretionary clean‐ups continue
to be deferred & delayed –Uncertain when normal conditions will
return Government clean‐ups moving
forward but slower than anticipated
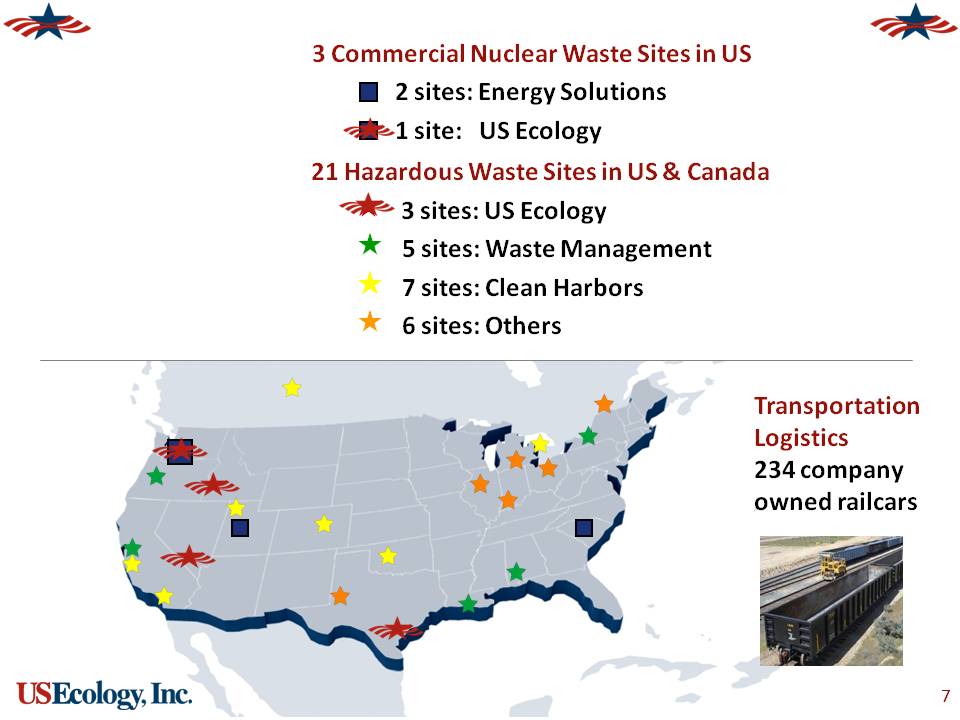
3
Commercial Nuclear Waste Sites in US 2 sites: Energy Solutions 1 site: American
Ecology 21 Hazardous Waste Sites in US & Canada 3 sites: American Ecology 5
sites: Waste Management 7 sites: Clean Harbors 6 sites: Others Transportation
Logistics 234 company owned railcars
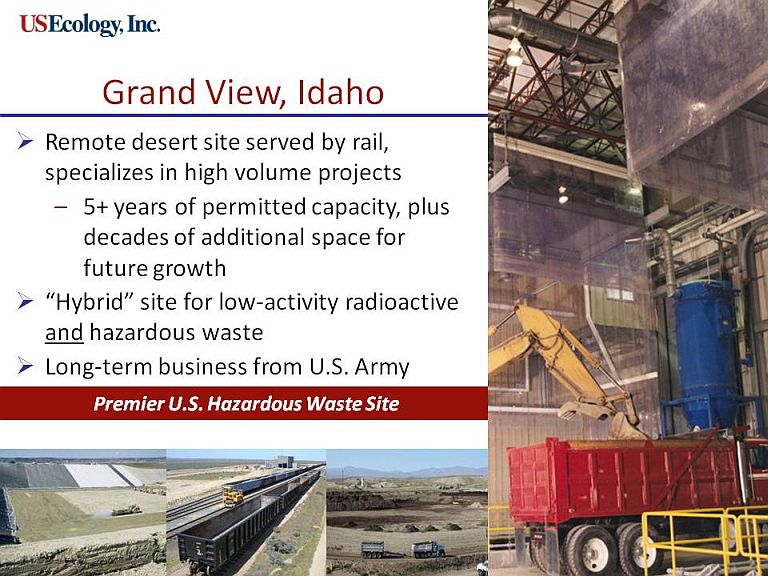
GrandView,
Idaho
Remote
desert site served by rail, specializes in high volume projects–5+ years of
permitted capacity, plus decades of additional space for future growth “Hybrid”
site for low activity radio active and hazardous waste and hazardous waste
Long-term business from U.S. Army Corps of Engineers through~2021 Premier U.S.
Hazardous Waste Site
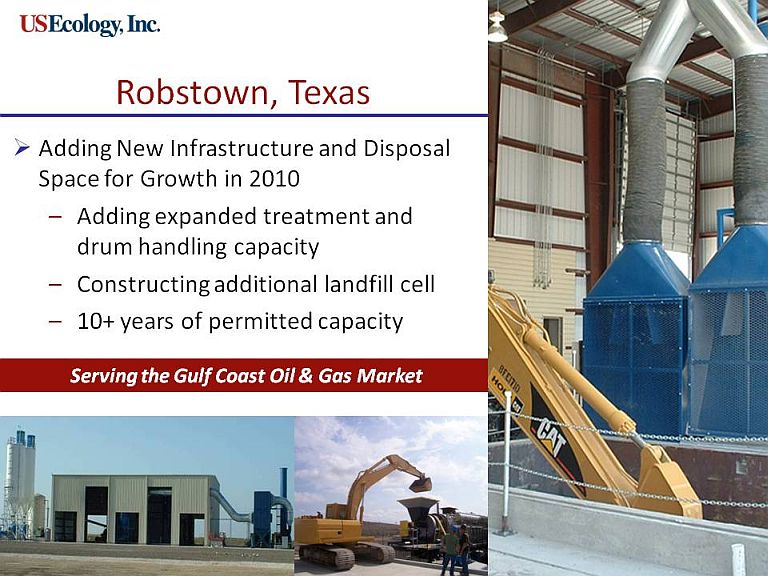
Robstown,
Texas
Adding
New Infrastructure and Disposal Space for Growth in 2010–Adding expanded
treatment and drum handling capacity – Constructing additional land
fill cell 10+ years of permitted capacity Serving the Gulf Coast Oil & Gas
Market
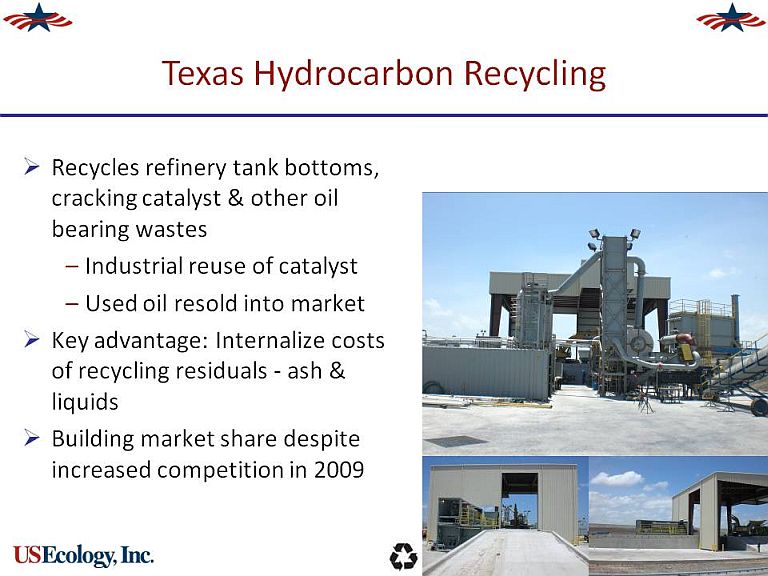
Texas
Hydrocarbon Recycling Recycles refinery tank bottoms, cracking catalyst &
other oilbearing wastes –Industrial reuse of catalyst– Used oil resold into
market Key advantage: Internalize costs of recycling residuals ash & liquids
Building market share despite increased competition in 2009
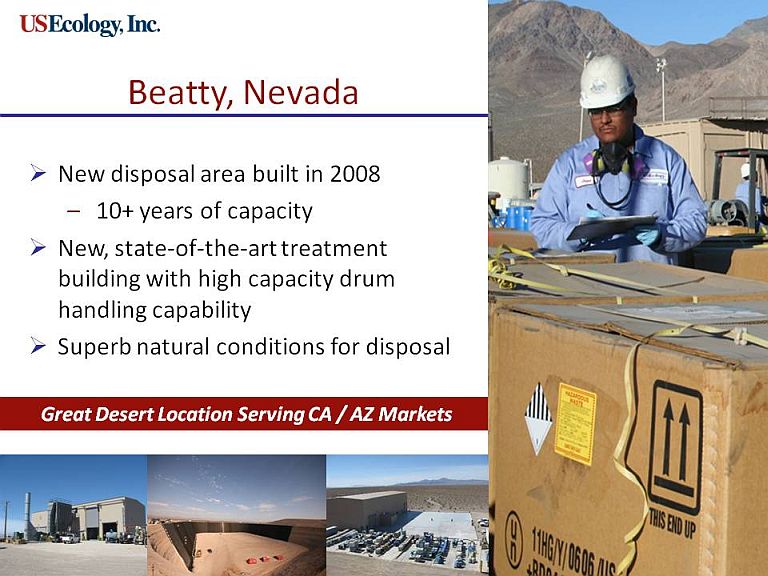
Beatty,
Nevada
New
disposal area built in 2008 –10+ years of capacity New, state of the art
treatment building with high capacity drum handling capability Superb natural
conditions for disposal Great Desert Location Serving CA/AZ Markets
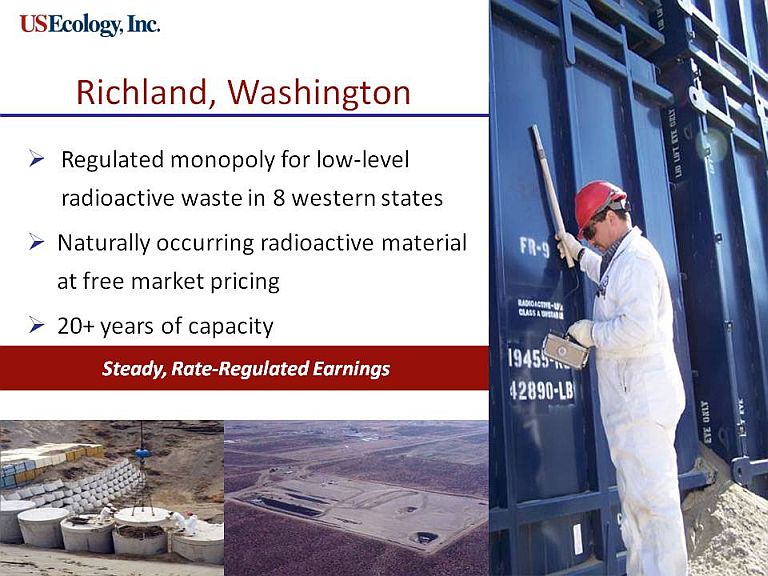
Richland,
Washington Regulated monopoly for low level radio-active waste in 8 western
states Naturally occurring radio-active material at free market pricing 20+
years of capacity Steady, Rate Regulated Earnings
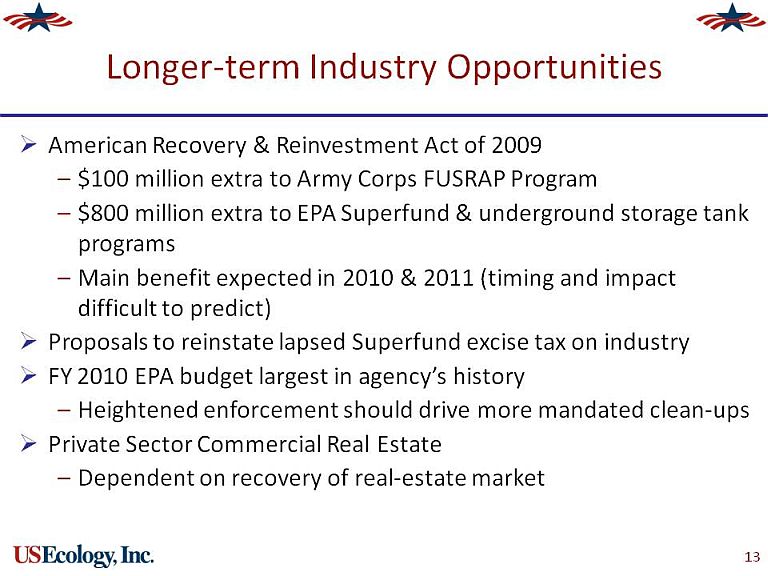
Longer-term
Industry Opportunities
American
Recovery & Reinvestment Act of 2009 – $100 million extra to Army Corps
FUSRAP Program –$800 million extra to EPA Superfund & underground storage
tank programs – Main benefit expected in 2010 & 2011 (timing and impact
difficult to predict) Proposals to reinstate lapsed Superfund excise tax on
industry FY 2010 EPA budget largest in agency’s history – Heightened enforcement
should drive more mandated cleanups Private Sector Commercial Real Estate –
Dependent on recovery of real estate market
Growth
Strategy Overview
Drive
volume through pricing, bundled services and packaging of unique
permit/treatment capabilities Expand waste handling infrastructure and treatment
options Modify facility permits to support entry into new markets Develop new
services to attract new customers Aggressively manage cost structure Maximize
operating leverage inherent to business Execute on our disciplined acquisition
strategy
Disciplined
Acquisition Strategy
Key
targets are RCRA Hazardous and Radioactive Treatment, Storage and Disposal
Facilities (TSDFs) Attractive Deals: – Consistent with our vision and mission –
Leverage our core competencies – Increase geographic reach and footprint –
Provide existing services to new customers Provide new services to existing
customers – Help solve customer waste problem or issue Be accretive in the short
term
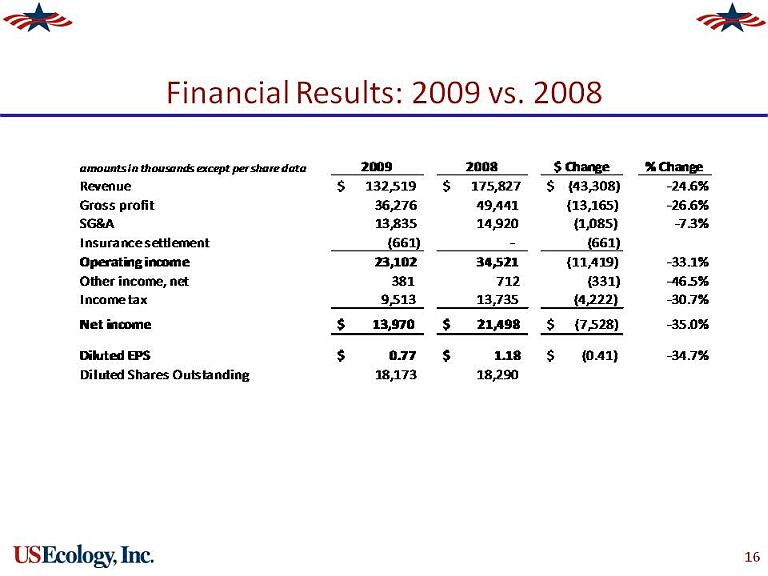
Financial
Results: 2009 vs.2008
amounts
in thousands except per share data Revenue Gross profit SG&A Insurance
settlement Operating income Other income, net Income tax Net income Diluted EPS
Diluted Shares Outstanding 2009 2008 $ Change % Change $132,519 36,276 13 835
(661) 23,102 381 9,513 $13,970 $0.77 18,173 $175,827 49,441 14,920 - 34,521
712,13,735 $21,498 $1.18 18,290 $(43,308) (13,165) (1,085) (661) (11,419) (331(
(4,222) $(7,528) $(0.41) -24.6% -26.6% -7.3% -33.1% -46.5% -30.7% -35.0%
-34.7%
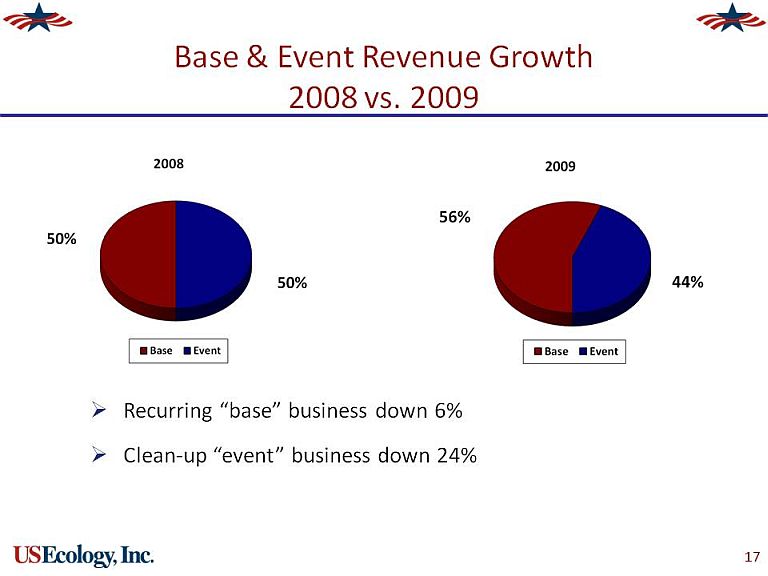
Base &
Event Revenue Growth 2008 vs. 2009 Recurring base business down 6% Cleanup
“event” business down 24% 2008 50% 2009 56% 44%
2009
Overview Total Revenue: $133 million 2009, down from $176 million 2008 Treatment
& disposal revenue down 15% – $9 million contribution from Texas thermal
recycling – Transportation revenue down 36% Recurring “Base” business down 6%
(56% of revenue) –Expanded customer base positions us well for recovery “Event”
business down 24% (44% of revenue) Completion of large event jobs, fewer
replacement opportunities Treatment & disposal margin of 45% reflects
reduced leverage SG&A: 10% of revenue Operating Income: $23 million Net
Income: $0.77 per diluted share; $0.52 eps when excluding Honeywell and
insurance proceeds
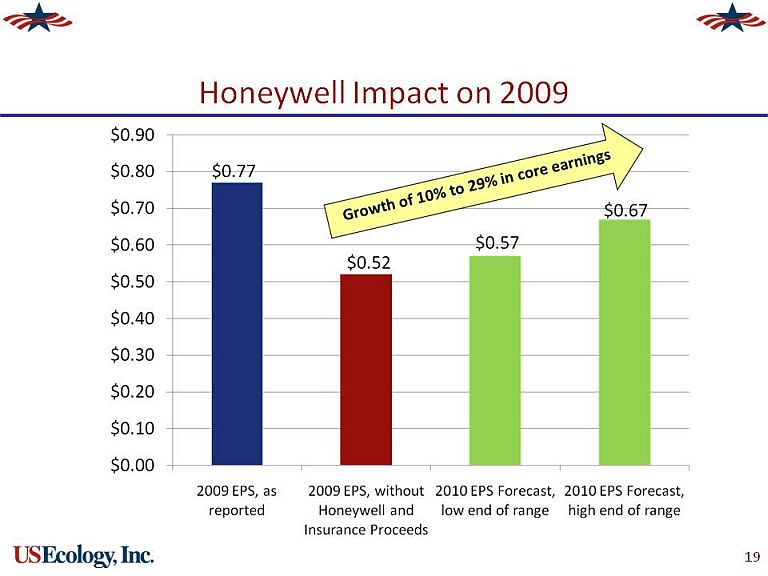
Honeywell
Impact on 2009 $0.77 $0.52 $0.57 $0.67 $0.90 0 $80 0.$70 0. $60 0. $50 $0.40
$0.30 $0.20 $0.10 $0.00 2009 EPS as reported, 2009 EPS, without
Honeywell and Insurance Proceeds 2010 EPS Forecast, low end of range, 2010 EPS
Forecast, high end of range
2010
Business Outlook Estimated 2010 earnings from $0.57 to $0.67 per diluted share
Represents growth of 10% to 29% over 2009 when excluding Honeywell contributions
($0.23) and favorable impacts from an insurance settlement ($0.02) Factors
driving guidance:‒Expect challenging economy delaying private “Event” clean up
opportunities through first half of 2010, recovering slowly in second half ‒
Competition for thermal recycling waste streams continues, keeping pressure on
price and volumes‒ “Base” business expected to grow slowly throughout 2010 ‒ US
Army Corps expected to return to pre 2009 levels on additional stimulus
funding