Attached files
Table of Contents
UNITED STATES
SECURITIES AND EXCHANGE COMMISSION
WASHINGTON, DC 20549
FORM 10-K
| x | ANNUAL REPORT PURSUANT TO SECTION 13 OR 15(d) OF THE SECURITIES EXCHANGE ACT OF 1934 |
For the fiscal year ended December 31, 2009
OR
| ¨ | TRANSITION REPORT PURSUANT TO SECTION 13 OR 15(d) OF THE SECURITIES EXCHANGE ACT OF 1934 |
COMMISSION FILE NUMBER: 001-15941
UTEK CORPORATION
| Delaware | 59-3603677 | |
| (State or other jurisdiction of incorporation or organization) |
(I.R.S. Employer Identification No.) |
2109 Palm Avenue
Tampa, FL 33605
(Address of principal executive offices)
(813) 754-4330
(Registrant’s telephone number)
SECURITIES REGISTERED PURSUANT TO SECTION 12(b) OF THE ACT:
| TITLE OF EACH CLASS |
NAME OF EACH EXCHANGE ON WHICH REGISTERED | |
| COMMON STOCK, $.01 PAR VALUE | NYSE Amex |
SECURITIES REGISTERED PURSUANT TO SECTION 12(g) OF THE ACT: NONE
Indicate by check mark if the registrant is a well-known seasoned issuer, as defined in Rule 405 of the Securities Act. Yes ¨ No x
Indicate by check mark if the registrant is not required to file reports pursuant to Section 13 or Section 15(d) of the Exchange Act. Yes ¨ No x
Indicate by check mark whether the registrant (1) has filed all reports required to be filed by Section 13 or 15(d) of the Securities Exchange Act of 1934 during the preceding 12 months (or for such shorter periods as the Registrant was required to file such reports), and (2) has been subject to such filing requirements for the past 90 days. Yes x No ¨
Indicate by check mark whether the registrant has submitted electronically and posted on its corporate Web site, if any, every Interactive Data File required to be submitted and posted pursuant to Rule 405 of Regulation S-T (§232.405 of this chapter) during the preceding 12 months (or for such shorter period that the registrant was required to submit and post such files). Yes ¨ No ¨
Indicate by check mark if disclosure of delinquent filers pursuant to Item 405 of Regulation S-K is not contained herein, and will not be contained, to the best of registrant’s knowledge, in definitive proxy or information statements incorporated by reference in Part III of this Form 10-K or any amendment to this Form 10-K x
Indicate by check mark whether the registrant is a large accelerated filer, an accelerated filer, a non-accelerated filer, or a smaller reporting company. See the definitions of “large accelerated filer,” “accelerated filer” and “smaller reporting company” in Rule 12b-2 of the Exchange Act.
Large accelerated filer ¨ Accelerated filer ¨ Non-accelerated filer x Smaller reporting company ¨
(Do not check if a smaller reporting company)
Indicate by check mark whether the registrant is a shell company (as defined in Rule 12b-2 of the Act). Yes ¨ No x
The aggregate market value of the registrant’s Common Stock held by non-affiliates at June 30, 2009 was $35,748,372.
As of March 18, 2010, there were 11,797,140 shares of the registrant’s common stock outstanding.
DOCUMENTS INCORPORATED BY REFERENCE
Portions of the registrant’s definitive proxy statement for the 2010 Annual Meeting of Shareholders are incorporated by reference into Part III of this report.
Table of Contents
UTEK CORPORATION
Annual Report on Form 10-K for the Fiscal Year Ended December 31, 2009
| Page | ||||
| 1 | ||||
| ITEM 1. |
1 | |||
| ITEM 1A. |
7 | |||
| ITEM 1B. |
15 | |||
| ITEM 2. |
15 | |||
| ITEM 3. |
15 | |||
| ITEM 4. |
15 | |||
| 16 | ||||
| ITEM 5. |
16 | |||
| ITEM 6. |
18 | |||
| ITEM 7. |
Management’s Discussion and Analysis of Financial Condition and Results of Operations |
19 | ||
| ITEM 7A. |
40 | |||
| ITEM 8. |
41 | |||
| ITEM 9. |
Changes in and Disagreements with Accountants on Accounting and Financial Disclosure |
88 | ||
| ITEM 9A. |
88 | |||
| ITEM 9B. |
88 | |||
| 89 | ||||
| ITEM 10. |
89 | |||
| ITEM 11. |
89 | |||
| ITEM 12. |
Security Ownership of Certain Beneficial Owners and Management and Related Stockholder Matters |
89 | ||
| ITEM 13. |
Certain Relationships and Related Transactions, and Director Independence |
90 | ||
| ITEM 14. |
90 | |||
| 91 | ||||
| ITEM 15. |
91 | |||
| 94 | ||||
Table of Contents
| Item 1. | Business |
Unless the context requires otherwise, reference in this Form 10-K to “UTEK,” the “Company,” “we,” “us” and words of similar import refer to UTEK Corporation and its wholly owned subsidiaries, UTEK-Europe, Ltd. (Europe), UTEKip, Ltd. (Israel) and UTEK Real Estate Holdings, Inc. UTEKip, Ltd. was dissolved in 2008 and all operations of that subsidiary are currently being serviced by UTEK. In addition, the legal entities for Innovaro, Ltd., Pharmalicensing, Ltd. and Carmi, Inc. (Strategos) still exist, but their operations have been assumed by UTEK and UTEK-Europe, Ltd.
We commenced operations in 1997 and were originally incorporated under the laws of the State of Florida, and subsequently under the laws of the State of Delaware in July 1999.
Until September 30, 2009, we were a non-diversified, closed-end management investment company that had elected to be treated as a business development company (“BDC”) under the Investment Company Act of 1940 (“1940 Act”).
Withdrawal of our Election to be Treated as a Business Development Company under the Investment Company Act of 1940
On October 1, 2009, we filed a notification on Form N-54C with the Securities and Exchange Commission (“SEC”) withdrawing our election to be regulated as a BDC under the 1940 Act. As such, we are reporting as an operating company as of October 1, 2009.
We determined, based on our current business focus and the fact that the equity interests we hold have constituted a declining amount of our assets over the last couple of years, that we no longer met the requirements to be regulated as a BDC under the 1940 Act. Accordingly, and after careful consideration of the requirements applicable to BDCs under the 1940 Act, the cost of compliance with the provisions of the 1940 Act and a thorough assessment of our current business model, our Board of Directors determined that we should withdrawal our election to be regulated as a BDC under the 1940 Act.
The withdrawal of our election to be regulated as a BDC caps the transition of our business to a global IP licensing and innovation services company. We believe that this change will reduce our administrative and regulatory compliance costs, including the significant legal, valuation and other compliance-related expenses associated with the business development company regulatory regime, as well as increase our ability to raise financing and provide us with greater flexibility in operating our business.
As an operating company, we are required to consolidate UTEK Real Estate Holdings, Inc. and its subsidiaries: Ybor City Group, Inc., 22nd Street of Ybor City, Inc., ABM of Tampa Bay, Inc. and Cortez 114, LLC (collectively “UTEK Real Estate”). This represents a change because, pursuant to accounting standards applicable to BDCs, UTEK’s investments in these companies were categorized as portfolio company investments and were not consolidated into UTEK. The assets, liabilities and results of operations of UTEK Real Estate have been included in our consolidated financial statements from October 1, 2009. The consolidation of UTEK Real Estate had a significant effect on our balance sheet as of December 31, 2009 as it added approximately $500,000 in investments, $8.0 million in land and buildings and $4.2 million in related long-term debt. The consolidation did not have a material effect on our results of operations for the three months ended December 31, 2009.
As a result of our de-election from BDC status, we make reference to both Investment Company Accounting and Operating Company Accounting throughout this document. Investment Company Accounting, as we refer to it, is defined as accounting in accordance with U.S. generally accepted accounting principles (“US GAAP”) for investment companies under the 1940 Act. Operating Company Accounting, as we refer to it, is defined as accounting in accordance with US GAAP other than for Investment Companies under the 1940 Act.
1
Table of Contents
Business Overview
We help clients become stronger innovators, develop compelling strategies to drive and catalyze growth, rapidly source externally developed technologies, create added value from their intellectual property and gain foresight into marketplace and technology developments that affect their business. These services are primarily provided throughout the United States and the United Kingdom.
Innovation Consulting Services
Strategic Innovation Consulting
Our clients require strategies to help them embrace greater innovation capabilities. We apply innovation insights and build those strategies with supporting infrastructure, processes & mechanisms, creating a culture primed for repeatable innovation success. We help organizations create and realize new, breakthrough growth strategies, create and execute non-incremental new growth platforms and opportunities, and develop the capability for ongoing creation and execution of those growth platforms and concepts.
We provide strategic innovation consulting services to enable clients to become more efficient by finding new avenues to growth, fighting commoditization, improving return on investment, transforming the organization, and removing barriers to innovation. Business value is delivered to our clients through working with a team of seasoned and experienced professionals capable of unlocking an organization’s capacity by offering the following services:
| • | Identify and develop new segments and markets; |
| • | Create and act on game-changing strategies; |
| • | Build an enterprise-wide capability for innovation; |
| • | Accelerate and improve new product development processes; and |
| • | Assess a company’s innovation capability. |
Foresight and Trend Research
Foresight is the ability of an organization to understand the ways in which the future might emerge and to apply that understanding in organizationally useful ways. Strategic foresight may also be used to detect adverse conditions, guide policy and help shape strategy. We provide services to clients that build the capacity for foresight, including monitoring trends, researching topics of interest, forecasting alternative scenarios, developing technology roadmaps, creating growth platforms and embedding futures thinking within the organization.
We also offer innovative futures programs that provide clients with up-to-the-minute knowledge, expert insight, high-level learning experiences, and opportunities to network with experts and peers. Our futures programs are as follows:
Futures Consortium is a membership service that provides members access to research briefs, member meetings and networking events, and onsite workshops.
Futures Observatory is a membership service that provides members a steady stream of “observations” that illustrate the latest developments in key global trends. The observations are brief, timely discussions of real-life events or circumstances in key markets, which exemplify how trends are playing out in the market.
Futures Interactive is a customizable, web-based knowledge management tool that gathers and organizes information from across a company in one, intuitive platform.
2
Table of Contents
Clients
Approximately 70%, 55% and 0% of our revenue in 2009, 2008 and 2007, respectively, was from innovation consulting services. We have a global client base including both private and public sector organizations, representing multiple industries including fast moving consumer goods, consumer packaged goods, retail, medical, telecommunications, chemicals, media, financial services, energy, utilities and government agencies. We had one significant consulting client for the year ended December 31, 2009 and two significant consulting clients for the year ended December 31, 2008, which accounted for 10% and 27% of the total revenue, respectively.
Competition
The strategic innovation consulting business is highly competitive. We currently have significant competitors for many of our service offerings, including but not limited to McKinsey & Company, The Boston Consulting Group and Monitor Group, Inc. for strategic innovation consulting and Forrester Research, Inc. and Gartner, Inc. for foresight and trend research.
Sale of Technology Rights
Our services enable companies to acquire externally developed technologies from universities, university incubators, federal labs, medical centers, and corporate research laboratories worldwide to augment their internal research and development efforts. A sale of technology rights refers to the process by which these technologies are licensed to companies for potential commercial development and use. Our goal is to provide our clients an opportunity to acquire and commercialize innovative technologies primarily developed external to their business.
Historically, to effectuate a technology transfer, we would typically create a newly formed company to acquire a new technology from a university, medical center, corporation or federal research laboratory and then sell this newly formed company to our client for securities or cash. In the ordinary course of business, we would then sell the securities we received in exchange for cash or other assets. A benefit of effectuating technology transfers through this process is that such transactions did not result in a current taxable event for income tax purposes. A disadvantage resulted from the fact that our business focused on small- and mid-cap companies, which are typically more volatile and left us open to the risk of declining stock prices.
Overall equity market conditions generally forced micro-capitalization stock prices down, making it more difficult for some of our clients to issue a reasonable amount of stock with sufficient value in exchange for these technologies during 2008. In addition, we began to pursue technology transfers on a more selective basis to mitigate the risk of declining stock prices with respect to the stock consideration we have historically received in connection with our technology transfers.
Following our study of the potential market and resulting opportunity for UTEK, we shifted our focus from technology transfers with small- and micro-cap companies to developing relationships with large capitalization clients in 2009. Our shift toward these larger capitalization clients, which are expected to be more stable and more amenable to cash based technology transfer services, requires us to develop a modified sales approach. This strategy helps us mitigate the risk of declining stock prices with respect to the stock consideration previously received in connection with technology transfers with small- to mid-cap companies whose stock is typically more volatile.
Our client make up is now more heavily weighted towards larger capitalization companies, which has caused a significant slowdown in the process to complete a technology transfer given the more measured decision making process with respect to executing a technology transfer by these companies. This has resulted in a decrease in the number of executed technology transfers during 2009.
3
Table of Contents
Clients
Approximately 0%, 23% and 81% of our revenue in 2009, 2008 and 2007, respectively, was from the sale of technology rights. We have a global client base including private and public sector organizations of varying sizes, representing a wide range of industries.
Competition
We have capable competitors in the licensing business including, IP Group plc, British Technology Group plc, Intellectual Ventures, Yet2.com, Competitive Technologies, Inc. and many other firms. In addition, university technology commercialization offices also provide location specific competition with regard to the intellectual property which they have developed and have available for license.
Subscription and Other Services
Subscription and other services include income from both our subscription services segment and our other services segment.
Online Licensing Platform
Our online licensing services division provides the following subscription-based website services:
| • | Pharmalicensing is a biopharmaceutical innovation resource designed for life science professionals driving partnering, licensing and business development worldwide. Pharmalicensing affords clients the ability to in-license and out-license intellectual property and also provides partnering services, business development reports, industry news and a jobs source for candidates and employers. To further grow traffic, we are continuing to develop partnerships with sites such as Patents.com. |
| • | Medical Device Licensing is an online global resource for open innovation, partnering, licensing and business development within the medical device industry. Medical Device Licensing benefits from the Pharmalicensing traffic and partnerships as well as establishing some of its own with member associations around the globe to further its reach and exposure. |
| • | Knowledge Express is a searchable database of information for licensing professionals, which provides clients with comprehensive coverage of licensing agreements, corporate profiles, clinical trials, deals, drug pipelines, drug sales, licensable technologies, patents and royalty rates. |
| • | Pharma Transfer provides a source of research and peer reviewed business development opportunities for the international pharmaceutical market encompassing all areas of pipeline development including early-stage discovery, pre-clinical and clinical trials and registered products that are all available for co-development or licensing. |
| • | TekScout, a development stage platform, enables companies to outsource unfinished R&D projects to scientists from around the world. TekScout provides a platform for companies to supplement internal R&D and resources to accelerate product development. |
Global Technology Licensing
Our global technology licensing service enables clients to enhance their new product pipeline through the acquisition of proprietary technologies primarily from universities, medical centers, federal research laboratories, select corporations, and university incubator programs. A global network of technology providers, coupled with an in-house staff of scientists and researchers, offers companies low-cost, low-risk access to review and acquire new technologies from research centers around the world. After gaining an understanding of our clients’ technology and business needs, we find and assess technologies for our clients. With the added benefit of licensing professionals, we negotiate agreements on behalf of our clients and offer a variety of flexible terms and transaction models.
4
Table of Contents
A component of our global technology licensing division is our patent analytic service designed to help our clients create marketplace value from their intellectual property (“IP”). We help clients identify the strengths and weaknesses of their own IP as well as that of companies in the same or adjacent industries. Additionally, by identifying gaps and opportunities in the IP landscape, we assist clients with developing IP acquisition, disposition, and management strategies.
Clients
Approximately 30%, 20% and 16% of our revenue in 2009, 2008 and 2007, respectively, was from online subscription and other services. Clients for our subscription services segment include universities, research centers and primarily large companies across a diversified group of industries. Clients for our other services segment include both private and public sector organizations, representing multiple industry sectors including retail, government, telecommunications, chemicals, media, financial services, energy and utilities.
Competition
Competitors for online licensing services are significant and include: Reed Elsevier, PharmaVentures, Nerac, Inc., Thomson S.A., BioPharm Insight, EvaluatePharma and many others. Competitors for global technology licensing that are significant and well developed include: IP Group plc, British Technology Group plc, Competitive Technologies, Inc. and Yet2.com. Competitors for patent analytic services include: The Patent Board, Ocean Tomo, LLC, PatentCafé, 1790 Analytics and many other private firms. In addition, university technology commercialization offices also provide location specific competition with regard to the intellectual properties, which they have developed and are available for license.
We believe the primary factors affecting competition in our market include firm and consultant reputations, client relationships and experiences, a legacy of successes, referrals and referral sources, the ability to attract and retain top talent, the ability to manage client engagements effectively, responsiveness, and the ability to listen and provide high quality services. There is competition on price, especially during this last economic downturn. However, given the critical nature of many of the issues that our services address, we are not typically competing on price alone. Many of our competitors have greater mindshare in the market, more high profile personnel and greater financial and marketing resources than we do. We believe that our experience, our heritage, our reputation (collectively and as previously independent businesses), our focus on innovation, and our comprehensive approach to our clients’ innovation challenges enable us to compete favorably and effectively in this marketplace.
Business Development and Marketing
Our business development and marketing efforts are aimed to develop relationships and build strong awareness and brand reputation with the key economic buyers and influences, specifically; innovation leaders, business and business unit leaders, research and consumer insights professionals, R&D leaders, product marketers, brand managers, licensing professionals, industry analysts, academic institutions, legal firms, and others. We believe strong relationships and a client-driven approach to service are critical to building and maintaining our business and brand reputation. We emphasize high quality client service to all of our employees.
We generate new business opportunities through relationships with individuals, through direct sales, cross selling, trade show and conference participation and sponsorship, direct marketing outreach, and our extensive network of contacts. We have thought leadership programs in action to generate awareness and build brand associations of expertise. These activities include a quarterly Innovation Index which ranks businesses in a different industry each quarter in terms of their level of innovation; an Innovation Update, which is a topical monthly opinion piece; bi-annual Innovation Leaders rankings; and book sponsorships, most recently including The Future of Innovation.
5
Table of Contents
Financial Information about Financial Segments and Geographic Areas
Information concerning sales and segment income attributable to each of our product segments and geographic areas is set forth in Note 11 of our Notes to Consolidated Financial Statements under Item 8. “Financial Statements and Supplementary Data” and is incorporated herein by reference.
Recent Developments
Beginning in 2008, we have acquired and integrated certain companies in an effort to enhance our ability to provide end-to-end innovation services. During 2010, we will bring those companies together under a single go-to-market brand strategy, expecting to leverage both market and cost efficiencies while creating a more comprehensive brand with the large-capitalization companies we increasingly serve.
| • | In January 2008, we acquired Pharmalicensing Limited (“Pharmalicensing”), a leading biopharmaceutical innovation website designed for professionals involved with partnering, licensing and business development worldwide. Actively supporting in- and out-licensing activities, Pharmalicensing provides partnering services, business development reports and industry news. With the acquisition of Pharmalicensing, we significantly expanded our online marketplace presence. We are able to use it as a platform to launch other targeted marketplaces, such as our 2009 launch of the Medical Device Licensing marketplace, and we will continue to launch market specific verticals in the future. It is also a substantial online traffic generator and awareness builder for our entire business. |
| • | In April 2008, we acquired Carmi, Inc., a 100% owned subsidiary of Strategos, LLC that we refer to as “Strategos.” Founded in 1995 by a small group of experienced consultants and industry veterans, including management strategist Gary Hamel, the firm focuses on helping clients achieve and sustain industry leadership, develop innovative growth strategies, identify and bring to market new growth opportunities and build a culture of innovation into their organization. Strategos helps companies bring innovation to their core business and organization. The acquisition of Strategos lends credibility to our move into Global 1000 list of clients and prospects, providing us with a thought leadership platform, considerable consulting and management strength and better positions us with the innovation leadership of the Global 1000. |
| • | In July 2008, we acquired Innovaro Limited (“Innovaro”). Founded in 2000, Innovaro was headquartered in London (UK) and has a global client base including both private and public sector organizations. Innovaro provides consulting and insight support to many organizations, across industry sectors ranging from fast moving consumer goods, retail, government and telecommunications to chemicals, media, financial services, energy and utilities. The acquisition of Innovaro, like Strategos, lends credibility to our move into Global 1000 list of clients and prospects, extending us geographically into western Europe, providing us with a thought leadership platform, considerable consulting and management strength and better positions us with the innovation leadership of the Global 1000. |
| • | In October 2008, we acquired Social Technologies Group, Inc. (“Social Technologies”). Founded in 1999, Social Technologies is headquartered in Washington, D.C. The firm has helped clients across a wide range of industries guide policy, shape business strategy, explore new markets, and develop new products and services. The firm helps organizations protect against unexpected risks, spot opportunities before competitors do, and ultimately better prepare for the future from a far more informed, empowered perspective. The acquisition of Social Technologies enhances our service offerings to the research and insights professionals in the Global 1000 and beyond, a critical role in an organization’s innovation development. |
Our business strategy has evolved significantly since our inception. Starting as a company in 1997, we focused solely on working with the technology transfer offices at universities. We now also serve mid- and large-cap organizations who are increasingly seeking the technologies our university partners have developed. We have aligned our management structure to maximize the benefit gained from the talented executives within
6
Table of Contents
our team. We have hired experienced professionals from a variety of leading organizations. We have added executives and functions to progress us in our mission, including a VP of Marketing. We have gone from being a sole office in Tampa, FL, our current headquarters, to also having offices in Chicago, IL, Washington, D.C. and York, England.
As of March 16, 2010, we began doing business as Innovaro and changed our ticker symbol to NYSE Amex: INV. Our proxy statement for the 2010 Annual Meeting of Shareholders will include a proposal to amend our articles of incorporation to change the corporate name to Innovaro, Inc. Beginning in March 2010, the Company will reorganize into three primary business groups, all working under the Innovaro brand: Strategic Services—driven by Strategos, an advanced innovation consultancy; Technology Marketplaces—online platforms, partnering services, global licensing and technology transfer services; Insights & Research—futures and trends, research, information services and more. In connection therewith, our business segments will change beginning with our quarterly reporting period ending March 31, 2010 and this change will require certain reclassifications to prior period financial information.
Scientific Advisory Council
Our Scientific Advisory Council is comprised of more than 40 experts in a broad range of scientific, medical and engineering disciplines. Our Scientific Advisory Council assists our management in the evaluation of new technologies for our clients.
Employees
As of March 16, 2010, we had 61 employees. We believe our relations with our employees are good.
Corporate Offices and Available Information
Our executive offices are located at 2109 Palm Avenue, Tampa, Florida 33605 and our telephone number is (813) 754-4330. We also have offices in Illinois, Washington D.C. and the United Kingdom.
Our Internet address is www.innovaro.com. We make available free of charge through our website our annual report on Form 10-K, quarterly reports on Form 10-Q, current reports on Form 8-K and amendments to those reports as soon as reasonably practicable after we electronically file such material with, or furnish it to, the SEC. Information contained on our website is not incorporated by reference into this annual report on Form 10-K, and you should not consider information contained on our website to be part of this annual report on Form 10-K.
| Item 1A. | Risk Factors |
Investing in our common stock involves a high degree of risk. As a result, there can be no assurance that we will achieve our business objectives. You should consider carefully the risks described below. In addition to the risk factors described below, other factors that could cause actual results to differ materially include:
| • | Changes in the economy; |
| • | Changes in the market for technology transfer and innovation services; |
| • | Risks associated with possible disruption in our operations due to terrorism; |
| • | Future regulatory actions and conditions in our operating areas; and |
| • | Other risks and uncertainties as may be detailed from time to time in our public announcements and SEC filings. |
7
Table of Contents
Our business, financial condition and results of operations may be materially impacted by economic conditions and related fluctuations in customer demand for innovation consulting, technology licensing, patent analysis and other consulting services.
The market for our consulting services tends to fluctuate with economic cycles. During economic cycles in which many companies are experiencing financial difficulties or uncertainty, clients and potential clients may cancel or delay spending on technology, intellectual property and other business initiatives. In particular, current uncertainty in global economic conditions may cause companies to cancel or delay consulting initiatives for which they have engaged us. Further, if the rate of project cancellations or delays significantly increases, our business, financial condition and results of operations could be materially and adversely impacted.
It is important to our future success that we expand the breadth and depth of our service offerings to stay abreast of the competition and to enhance our potential for growth of revenues and profits.
We are primarily a service business. It is important to our future success to expand the breadth and depth of our service offerings to stay abreast of the competition and to enhance our potential for growth of revenues and profits. Expansion of our service categories and service offerings in this manner will require significant additional expenditures and could strain our management, financial and operational resources. For example, we are currently seeking to build up our intellectual property analysis service business. We cannot be certain that we will be able to do so in a cost-effective or timely manner or that we will be able to offer certain services in demand by our clients, or to do so in a quality manner. Furthermore, any new service offering that is not favorably received by our clients could damage our reputation. The lack of market acceptance of new services or our inability to generate satisfactory revenues from expanded service offerings to offset their costs could harm our business. If we do not successfully expand our operations, our revenues may fall below expectations. If we do not successfully expand our operations on an ongoing basis to accommodate increases in demand, we will not be able to fulfill our clients’ needs in a timely manner, which would harm our business.
Our growth strategy is partially dependent on completing additional acquisitions of innovation services companies.
As part of our strategy for growth, we have made and may continue to make acquisitions of complementary innovation services companies. However, we may not be able to identify suitable acquisition candidates, complete acquisitions, or integrate acquisitions successfully. In this regard, acquisitions involve numerous risks, including difficulties in the integration of the operations, technologies, services and products of the acquired companies and the diversion of management’s attention from other business concerns. Although our management will endeavor to evaluate the risks inherent in any particular transaction, there can be no assurance that we will properly ascertain all such risks. In addition, prior acquisitions have resulted, and future acquisitions could result, in the incurrence of substantial additional indebtedness and other expenses. Future acquisitions may also result in potentially dilutive issuances of equity securities. There can be no assurance that difficulties encountered with acquisitions will not have a material adverse effect on our business, financial condition and results of operations.
Our quarterly and annual results fluctuate significantly.
Our quarterly and annual operating results fluctuate significantly due to a number of factors. These factors include fluctuations in the amount of consulting services we provide, the degree to which we encounter competition in our markets, and general economic conditions. As a result of these factors, quarterly and annual results are not necessarily indicative of our performance in future quarters and years.
The agreements we have with universities, medical research centers, corporate research laboratories and federal research laboratories do not guarantee that such entities will grant licenses to us or other companies.
We do not invent new technologies or products. We depend on relationships with universities, corporations, government agencies, research institutions, inventors, and others to provide technology-based opportunities that
8
Table of Contents
we can develop into profitable royalty-bearing licenses. Failure to maintain these relationships or to develop new relationships could adversely affect our operating results and financial condition. If we are unable to forge new relationships or to maintain current relationships, we may be unable to identify new technology-based opportunities and enter into royalty-bearing licenses. We also are dependent on our clients’ abilities to develop new technologies, introduce new products, and adapt to changes in technology and economic needs.
We cannot be certain that current or new relationships will provide the volume or quality of available new technologies necessary to sustain our business. In some cases, universities and other sources of new technologies may compete against us as they seek to develop and commercialize these technologies themselves, or through entities that they develop, finance and/or control. In other cases, universities receive financing for basic research from companies in exchange for the exclusive right to commercialize any resulting inventions. These and other strategies may reduce the number of technology sources, potential clients, to whom we can market our services. If we are unable to secure new sources of technology, it could have a material adverse effect on our operating results and financial condition.
We are focusing our business on providing innovation services to our clients which is a new and uncertain trend in our industry.
We are focused on providing innovation services to our clients. While these services utilize our well established technology transfer capabilities, they also incorporate additional products and services which in their entirety are as yet unproven in their ability to generate consistent significant revenue. As a result, if our innovation services are not well received by our clients or if industry changes its focus off of innovation, this may result in reduced revenue and profitability for us.
The consulting services business is highly competitive, and we may not be able to compete effectively.
The innovation consulting services business in which we operate includes a large number of participants and is intensely competitive. We face competition from other business operations and financial consulting firms, general management consulting firms, the consulting practices of major accounting firms, technical and economic advisory firms, regional and specialty consulting firms and the internal professional resources of organizations. In addition, because there are relatively low barriers to entry, we expect to continue to face additional competition from new entrants into the business operations and financial consulting industries. Many of our competitors have a greater national and international presence, as well as have significantly greater personnel, financial, technical and marketing resources. In addition, these competitors may generate greater revenues and have greater name recognition than we do. Our ability to compete also depends in part on the ability of our competitors to hire, retain and motivate skilled professionals, the price at which others offer comparable services and our competitors’ responsiveness to their clients. If we are unable to compete successfully with our existing competitors or with any new competitors, it could negatively affect our operating results.
Our inability to hire and retain talented people in an industry where there is great competition for talent could have a serious negative effect on our services and results of operations.
Our innovation consulting services business involves the delivery of professional services and is highly labor-intensive. Our success depends largely on our general ability to attract, develop, motivate and retain highly skilled professionals. The loss of a significant number of our professionals or the inability to attract, hire, develop, train and retain additional skilled personnel could have a serious negative effect on us, including our ability to manage, staff and successfully complete our existing engagements and obtain new engagements. Qualified professionals are constantly in demand, and we face significant competition for both senior and junior professionals with the requisite credentials and experience. Our principal competition for talent comes from other research and consulting firms, as well as from organizations seeking to staff their internal professional positions. Many of these competitors may be able to offer significantly greater compensation and benefits or more attractive lifestyle choices, career paths or geographic locations than we do. Therefore, we may not be successful
9
Table of Contents
in attracting and retaining the skilled consultants we require to conduct and expand our operations successfully. Increasing competition for these revenue-generating professionals may also significantly increase our labor costs, which could negatively affect our operating results.
The profitability of our fixed-fee engagements with clients may not meet our expectations if we underestimate the cost of these engagements.
When making proposals for fixed-fee engagements, we estimate the costs and timing for completing the engagements. These estimates reflect our best judgment regarding the efficiencies of our methodologies and consultants as we plan to deploy them on engagements. Any increased or unexpected costs or unanticipated delays in connection with the performance of fixed-fee engagements, including delays caused by factors outside our control, could make these contracts less profitable or unprofitable, which could negatively affect our operating results.
A significant portion of our revenue is derived from a limited number of clients, which may cause our operating results to be unpredictable.
As an innovation services firm, we have derived, and expect to continue to derive, a significant portion of our revenue from a limited number of clients. Our clients typically retain us on an engagement-by-engagement basis, rather than under fixed-term contracts; the volume of work performed for any particular client is likely to vary from year to year and a major client in one fiscal period may not require or decide not to use our services in any subsequent fiscal period. Moreover, a large portion of our new engagements comes from existing clients. Accordingly, the failure to obtain new large engagements or multiple engagements from existing or new clients could have a material adverse effect on the amount of revenues we generate. In addition, if we fail to collect a large trade receivable or group of receivables, we could be subject to significant financial exposure.
Our ability to maintain and attract new business depends upon our reputation, the professional reputation of our revenue-generating employees and the quality of our services.
As an innovation services firm, our ability to secure new engagements depends heavily upon our corporate brand and reputation and the individual reputations of our professionals. Any factor that diminishes our reputation or that of our employees, including not meeting client expectations, misconduct by our employees, or dissemination of inappropriate information from outside sources, could make it substantially more difficult for us to attract new engagements and clients. Similarly, because we obtain many of our new engagements from former or current clients or from referrals by those clients or by law firms that we have worked with in the past, any client that questions the quality of our work or that of our consultants could impair our ability to secure additional new engagements and clients.
We depend on non-recurring consulting engagements and our failure to secure new engagements could lead to a decrease in our revenues.
Innovation consulting segment revenues constituted approximately 70% of our total revenues for 2009. These consulting engagements typically are project-based and non-recurring. Our ability to replace consulting engagements is subject to numerous factors, including the following:
| • | Delivering consistent, high-quality consulting services to our clients; |
| • | Tailoring our consulting services to the changing needs of our clients; and |
| • | Our ability to match skills and competencies of our consulting staff to the skills required for the fulfillment of existing or potential innovation consulting engagements. |
Any material decline in our ability to replace consulting arrangements could have an adverse impact on our revenues and our financial condition.
10
Table of Contents
The absence of long-term contracts with our clients reduces the predictability of our revenue.
Our clients are generally able to reduce or cancel their use of our professional services without penalty and, in some circumstances, with little notice. As a result, we believe that the number of clients or the number and size of our existing projects are not reliable indicators or measures of future revenue. We will need to continuously acquire new clients and/or new projects to meet our expenses. When a client defers, modifies or cancels a project, there is no assurance that we will be able to rapidly redeploy our professionals to other projects in order to minimize the underutilization of employees and the resulting adverse impact on operating results. We may not be able to replace cancelled or reduced contracts with new business while at the same time our expenses are generally longer term in nature with the result that our revenue and profits may decline.
Our revenue growth depends on our ability to understand the technology requirements of our customers in the context of their markets. If we fail to understand their technology needs or markets, we limit our ability to meet those needs and to generate revenue.
We believe that by focusing on the technology needs of our customers, we are better positioned to generate revenues by providing technology solutions to them. The market demands of our customers drive our revenues. The better we understand their markets and requirements, the better we are able to identify and obtain effective technology solutions for our customers. We rely on our professional staff and contract business development consultants to understand our customers’ technical, commercial, and market requirements and constraints, and to identify and obtain effective technology solutions for them.
Additional hiring and business acquisitions could disrupt our operations, increase our costs or otherwise harm our business.
Our business strategy is dependent in part upon our ability to grow by hiring individuals or groups of individuals and by acquiring complementary businesses. However, we may be unable to identify, hire, acquire or successfully integrate new employees and acquired businesses without substantial expense, delay or other operational or financial obstacles. Competition for future hiring and acquisition opportunities in our markets could increase the compensation we offer to potential employees or the prices we pay for businesses we wish to acquire. In addition, we may be unable to achieve the financial, operational and other benefits we anticipate from any hiring or acquisition, including those we have completed so far. Hiring additional employees or acquiring businesses could also involve a number of additional risks, including:
| • | The diversion of management’s time, attention and resources from managing the Company; |
| • | The failure to retain key acquired personnel; |
| • | The adverse short-term effects on reported operating results from the amortization or write-off of acquired goodwill and other intangible assets; |
| • | The potential impairment of existing relationships with our clients, such as client satisfaction or performance problems, whether as a result of integration or management difficulties or otherwise; |
| • | The creation of conflicts of interest that require us to decline or resign from engagements that we otherwise could have accepted; |
| • | The potential need to raise significant amounts of capital to finance a transaction or the potential issuance of equity securities that could be dilutive to our existing stockholders; |
| • | Increased costs to improve, coordinate or integrate managerial, operational, financial and administrative systems; |
| • | The usage of contingent earnouts based on the future performance of our business acquisitions may deter the acquired company from fully integrating into our existing business; and |
| • | A decision not to fully integrate an acquired business may lead to the perception of inequalities if different groups of employees are eligible for different benefits and incentives or are subject to different policies and programs. |
11
Table of Contents
If we fail to successfully address these risks, our ability to compete may be impaired.
The failure to integrate or negotiate successfully any future acquisitions could harm our business and operating results.
If we acquire businesses in the future and are unable to integrate successfully these businesses, it could harm our business and operating results. In order to remain competitive or to expand our business, we may find it necessary or desirable to acquire other businesses, products or technologies. We may be unable to identify appropriate acquisition candidates. If we identify an appropriate acquisition candidate, we may not be able to negotiate the terms of the acquisition successfully, finance the acquisition or integrate the acquired businesses, products or technologies into our existing business and operations. Further, completing a potential acquisition and integrating an acquired business may strain our resources and require significant management time. In addition, we may revalue or write-down the value of goodwill and other intangible assets in connection with future acquisitions, which would negatively affect our operating results.
Changes in the laws or regulations that govern us could have a material impact on our operations.
Any change in the laws or regulations that govern our business could have a material impact on us or on our operations. Laws and regulations may be changed from time to time, and the interpretations of the relevant laws and regulations also are subject to change.
We are subject to certain risks associated with our foreign operations.
We have operations in the United Kingdom and may seek to expand our operations in other countries.
Certain risks are inherent in foreign operations, including:
| • | difficulties in enforcing agreements and collecting receivables through certain foreign legal systems; |
| • | foreign clients may have longer payment cycles than clients in the US; |
| • | tax rates in certain foreign countries may exceed those in the US and foreign earnings may be subject to withholding requirements, exchange controls or other restrictions; |
| • | general economic and political conditions in countries where we operate may have an adverse effect on our operations; |
| • | exposure to risks associated with changes in foreign exchange rates; |
| • | difficulties associated with managing a large organization spread throughout various countries; |
| • | difficulties in enforcing intellectual property rights; and |
| • | required compliance with a variety of foreign laws and regulations. |
Investing in foreign companies, including innovation services firms, may expose us to additional risks not typically associated with investing in US companies. These risks include changes in foreign exchange rates, exchange control regulations, political and social instability, expropriation, imposition of foreign taxes, less liquid markets and less available information than is generally the case in the US, higher transaction costs, less government supervision of exchanges, brokers and issuers, less developed bankruptcy laws, difficulty in enforcing contractual obligations, lack of uniform accounting and auditing standards and greater price volatility.
As we continue to expand our business globally, our success will depend, in part, on our ability to anticipate and effectively manage these and other risks. We cannot assure you that these and other factors will not have a material adverse effect on our international operations or our business as a whole.
12
Table of Contents
We may issue shares of our common stock and warrants at a discount to the market price for such shares, which may put downward pressure on the market price for shares of our common stock.
If we issue shares of our common stock at a discount to the market price for such shares, it may put downward pressure on the market price for shares of our common stock. Such downward pressure could in turn encourage short sales or similar trading with respect to shares of our common stock, which could in itself, place further downward pressure on the market price for shares of our common stock.
We may issue shares of our common stock and warrants in conjunction with the acquisition of other businesses, which may put downward pressure on the market price for shares of our common stock and create additional dilution of the current shares outstanding.
Consistent with our current strategy, we may seek to acquire other businesses through the issuances of common stock and or cash. If common stock is used in these transactions, it would create additional dilution of the current shares outstanding. Further, such issuances may result in downward pressure on our share price as a result of these additional shares being issued. Also, there is the potential that the market may not respond favorably to potential new acquisitions, which could also negatively affect our share price.
We may need additional capital in the future and it may not be available on acceptable terms.
We have historically relied on equity financing and, to a lesser extent, cash flow from operations including the sale of our investments and debt financing to fund our operations, capital expenditures and expansion. However, we may require additional capital in the future to fund our operations or respond to competitive pressures or strategic opportunities. We cannot assure that additional financing will be available on terms favorable to us, or at all. In addition, the terms of available financing may place limits on our financial and operating flexibility. If we are unable to obtain sufficient capital in the future, we may:
| • | be forced to reduce our operations; |
| • | not be able to expand or acquire complementary businesses; and |
| • | not be able to develop new services or otherwise respond to changing business conditions or competitive pressures. |
Our common stock price may be volatile.
The trading price of our common stock has fluctuated significantly and may continue to fluctuate substantially, depending on many factors, many of which are beyond our control and may not be directly related to operating performance. These factors include the following:
| • | price and volume fluctuations in the overall stock market from time to time; |
| • | significant volatility in the market price and trading volume of securities of innovation services firms and technology transfer companies; |
| • | changes in regulatory policies, accounting or tax guidelines with respect to innovation services firms and technology transfer companies; |
| • | actual or anticipated changes in our sales or earnings or fluctuations in our operating results; |
| • | actual or anticipated changes in the value of our investments; |
| • | changes in financial reporting requirements; |
| • | general economic conditions and trends; |
| • | loss of a major funding source; |
| • | departures of key personnel; |
13
Table of Contents
| • | changes to the market or shareholder’s acceptance of our unique technology transfer business; or |
| • | the consummation of mergers or acquisitions of related businesses. |
As a publicly held company, we have significantly higher administrative costs.
The Sarbanes-Oxley Act of 2002, as well as new rules implemented by the SEC and new listing requirements adopted by the American Stock Exchange in response to the Sarbanes-Oxley Act of 2002, has required changes in corporate governance practices, internal control policies and audit control practices of public companies. These new rules, regulations, and requirements have increase our legal, audit, financial, compliance and administrative costs, and have made certain other activities more time consuming and costly. The additional costs are expected to continue. These rules and regulations may make it more difficult and more expensive for us to obtain directors and officers liability insurance in the future, and could make it more difficult for us to attract and retain qualified members for our Board of Directors, particularly to serve on our audit committee.
We may experience outages and disruptions in connection with our online licensing services if we fail to maintain an adequate operations infrastructure.
We have spent and expect to continue to spend substantial amounts to maintain equipment and to upgrade our technology and network infrastructure relating to our online licensing services. However, any inefficiencies or operational failures could diminish the quality of our services, and client experience, resulting in damage to our reputation and loss of current and potential users, and subscribers, harming our operating results and financial condition.
The agreements relating to our indebtedness may restrict our current and future operations.
Our debt agreements contain, and any future agreements may include, a number of restrictive covenants that impose significant operating and financial restrictions on, among other things, our ability to:
| • | incur additional debt, including guarantees; |
| • | incur liens; |
| • | sell or otherwise dispose of assets; |
| • | make investments, loans or advances; |
| • | make some acquisitions; |
| • | engage in mergers or consolidations; |
| • | make capital expenditures; and |
| • | pay dividends. |
Any future debt could contain financial and other covenants more restrictive than those that are currently applicable.
Our failure to comply with the agreements relating to our outstanding indebtedness, including as a result of events beyond our control, could result in an event of default that could materially and adversely affect our operating results and our financial condition.
If there were an event of default under any of the agreements relating to our outstanding indebtedness the holders of the defaulted debt could cause all amounts outstanding with respect to that debt to be due and payable immediately. We cannot assure you that our assets or cash flow would be sufficient to fully repay borrowings under our outstanding debt instrument, either upon maturity or if accelerated upon an event of default. Further, if we were unable to repay, refinance or restructure our indebtedness under our secured debt, the holders of such
14
Table of Contents
debt could proceed against the collateral securing that indebtedness. In addition, any event of default or declaration or acceleration under one debt instrument could also result in an event of default under one or more of our other debt instruments.
We may not be able to generate sufficient cash flow to meet our debt service obligations.
Our ability to generate sufficient cash flow from operations to make scheduled payments on our debt obligations will depend on our future financial performance, which will be affected by a range of economic, competitive and business factors, many of which are outside our control. If we do not generate sufficient cash flow from operations to satisfy our debt obligations, we may have to undertake alternative financing plans, such as refinancing or restructuring our debt, selling assets, reducing or delaying capital investments or seeking to raise additional capital. We cannot assure you that any refinancing would be possible, that any assets could be sold, or, if sold, of the timing of the sales and the amount of proceeds realized from those sales, or that additional financing could be obtained on acceptable terms, if at all, or would be permitted under the terms of our various debt agreements then in effect. Our inability to generate sufficient cash flow to satisfy our debt obligations, or to refinance our obligations on commercially reasonable terms, would have an adverse effect on our business, financial condition and results of operations, as well as on our ability to satisfy our debt obligations.
| Item 1B. | Unresolved Staff Comments |
None.
| Item 2. | Properties |
Our principal office is located in Tampa, Florida. This office space is owned by our subsidiary, UTEK Real Estate and is encumbered. This property is utilized by all of our product segments and is adequate for our current domestic office needs. If our office requirements increase beyond our current expectations, we believe that additional office space may be available for use at this location.
We also lease office space in Illinois, Washington D.C. and the United Kingdom. The Illinois and Washington D.C. properties are utilized by our innovation consulting services segment and the United Kingdom property is utilized by our subscription services segment and our other services segment. These properties are adequate for our current needs.
| Item 3. | Legal Proceedings |
We may be a party from time to time in certain lawsuits in the normal course of our business. While the outcome of these legal proceedings cannot at this time be predicted with certainty, we do not expect that these proceedings will have a material effect upon our financial condition or results of operations.
| Item 4. | Reserved |
15
Table of Contents
| Item 5. | Market for Registrant’s Common Equity, Related Stockholder Matters and Issuer Purchases of Equity Securities |
Our shares of common stock trade on the NYSE Amex under the symbol “UTK” though March 15, 2010. As of March 16, 2010, we began doing business as Innovaro and changed our ticker symbol to NYSE Amex: “INV”. Computershare Trust Company, Inc., 350 Indiana Street, Suite 800, Golden, CO 80401; 303-262-0600, serves as transfer agent for our common stock.
We had approximately 3,000 stockholders of record at March 15, 2010.
Price Range of Common Stock and Dividends
The following table reflects the high and low closing prices for our common stock as reported on the NYSE Amex and the cash dividends declared per common share for the periods indicated:
| High | Low | Dividends | ||||||
| Fiscal year 2009 |
||||||||
| First quarter |
$ | 8.90 | $ | 6.00 | — | |||
| Second quarter |
$ | 6.65 | $ | 3.79 | — | |||
| Third quarter |
$ | 5.15 | $ | 3.75 | — | |||
| Fourth quarter |
$ | 4.55 | $ | 3.60 | — | |||
| Fiscal year 2008 |
||||||||
| First quarter |
$ | 13.05 | $ | 9.95 | — | |||
| Second quarter |
$ | 11.10 | $ | 9.98 | — | |||
| Third quarter |
$ | 11.05 | $ | 9.50 | — | |||
| Fourth quarter |
$ | 10.29 | $ | 8.65 | — | |||
Our Board of Directors has sole discretion in determining whether to declare and pay cash dividends in the future. The declaration of cash dividends will depend on our profitability, financial condition, cash requirements, future prospects and other factors deemed relevant by our Board of Directors. Our ability to pay cash dividends in the future could be limited or prohibited by regulatory requirements and the terms of financing agreements that we may enter into or by the terms of any preferred stock that we may authorize and issue.
Securities Authorized for Issuance under Equity Compensation Plans
The information required by this item appears under “Item 12. Security Ownership of Certain Beneficial Owners and Management and Related Stockholder Matters” included elsewhere in this Annual Report on Form 10-K.
16
Table of Contents
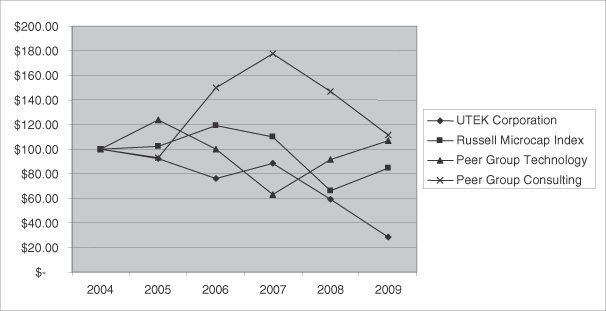
Performance Graph
The following graph shows a comparison of the five-year cumulative total return, assuming the reinvestment of dividends, on our common stock with that of the Russell Microcap Index, our sale of technology rights peer group (“Peer Group Technology”) including British Technology Group plc, Competitive Technologies, Inc., IP Group plc, and Sagentia Group AG, and our innovation consulting services peer group (“Peer Group Consulting”) including Forrester Research, Inc., Gartner, Inc., Huron Consulting Group, Inc. and Diamond Management and Technology Consultants Inc. The graph assumes $100 was invested on December 31, 2004 in our common stock, the Russell Microcap Index companies, and the companies in both of the peer groups. Note that historical stock price performance is not necessarily indicative of future stock price performance.
COMPARISON OF 5 YEAR CUMULATIVE TOTAL RETURN
AMONG UTEK, RUSSELL MICROCAP INDEX AND UTEK’S PEER GROUPS
17
Table of Contents
| Item 6. | Selected Financial Data |
The following table presents our selected consolidated financial and other data and has been derived from our audited financial statements for the three months ended December 31, 2009, nine months ended September 30, 2009, and the years ended December 31, 2008, 2007, 2006 and 2005. The information below should be read in conjunction with “Item 7. Management’s Discussion and Analysis of Financial Condition and Results of Operations” and our consolidated financial statements and the notes thereto, each of which is included in another section of this annual report on Form 10-K.
| Operating Company Accounting |
Investment Company Accounting | ||||||||||||||||||||
| Three Months Ended Dec 31, 2009(1) |
Nine Months Ended Sept 30, 2009(1) |
Year Ended December 31, | |||||||||||||||||||
| 2008 | 2007 | 2006 | 2005 | ||||||||||||||||||
| Consolidated Statement of Operations Data: |
|||||||||||||||||||||
| Revenue / Income from operations |
$ | 3,012,839 | $ | 7,764,664 | $ | 20,178,119 | $ | 20,300,949 | $ | 56,952,937 | $ | 22,743,823 | |||||||||
| Net (loss) income from operations |
(624,006 | ) | (9,340,651 | ) | (10,034,812 | ) | 3,776,742 | 19,944,207 | 5,887,830 | ||||||||||||
| Net (loss) income from operations per diluted common share |
$ | (0.05 | ) | $ | (0.83 | ) | $ | (1.01 | ) | $ | 0.42 | $ | 2.27 | $ | 0.80 | ||||||
| Weighted average shares: |
|||||||||||||||||||||
| Diluted |
11,605,373 | 11,257,663 | 9,947,221 | 8,989,234 | 8,786,605 | 7,325,312 | |||||||||||||||
| Cash dividends declared per common share |
— | — | — | — | $ | 0.04 | — | ||||||||||||||
| Dec 31, 2009(2) |
Dec 31, 2008 |
Dec 31, 2007 |
Dec 31, 2006 |
Dec 31, 2005 | |||||||||||
| Balance Sheet Data: |
|||||||||||||||
| Total assets |
$ | 40,331,181 | $ | 45,886,209 | $ | 45,221,077 | $ | 53,040,810 | $ | 49,005,960 | |||||
| Long-term debt |
6,329,252 | 839,765 | — | — | — | ||||||||||
| Net asset value per share |
n/a | $ | 3.42 | $ | 4.85 | $ | 5.71 | $ | 5.58 | ||||||
| (1) | Financial data for the year ended December 31, 2009 has been segregated into two sections to conform to the financial statement presentation in our consolidated financial statements, which is included in another section of this annual report on Form 10-K. Financial data for the nine months ended September 30, 2009 reflect our operations as an investment company and financial data for the three months ended December 31, 2009 reflect our operations as an operating company. See Note 1 to the consolidated financial statements, which are included in another section of this annual report on Form 10-K, for further discussion of UTEK’s change in status from an investment company to operating company. |
| (2) | Balance sheet data as of December 31, 2009 includes approximately $8.9 million in total assets and $4.2 million in long-term debt of our newly consolidated subsidiary, UTEK Real Estate Holdings, Inc. See Note 1 to the consolidated financial statements, which are included in another section of this annual report on Form 10-K, for further discussion of the circumstances relating to the consolidation of UTEK Real Estate Holdings, Inc. with those of UTEK. |
18
Table of Contents
Item 7. Management’s Discussion and Analysis of Financial Condition and Results of Operations
Special Note Regarding Forward-Looking Statements
The following discussion should be read in conjunction with our consolidated financial statements and the notes thereto included elsewhere in this annual report on Form 10-K. This annual report on Form 10-K contains forward-looking statements regarding the plans and objectives of management for future operations. These forward-looking statements may involve known and unknown risks, uncertainties and other factors which may cause our actual results, performance or achievements to be materially different from future results, performance or achievements expressed or implied by any forward-looking statements. Forward-looking statements, which involve assumptions and describe our future plans, strategies and expectations, are generally identifiable by use of the words “may,” “will,” “should,” “expect,” “anticipate,” “estimate,” “believe,” “intend” or “project” or the negative of these words or other variations on these words or comparable terminology. These forward-looking statements are based on assumptions that may be incorrect, and we cannot assure you that the projections included in these forward-looking statements will come to pass. Our actual results could differ materially from those expressed or implied by the forward-looking statements as a result of various factors.
Overview
For comparability purposes, the revenues and expenses for the nine months ended September 30, 2009 under Investment Company Accounting and for the three months ended December 31, 2009 under Operating Company Accounting are presented combined for the year ended December 31, 2009 throughout management’s discussion and analysis. Management believes this presentation to be more meaningful to the reader as there has been no significant change in our revenue streams as a result of our change in status.
In addition, we refer to “income from operations,” which is revenue under investment company presentation, simply as “revenue” throughout this and certain other sections of this annual report on Form 10-K in order to eliminate confusion.
Financial Condition
Our total assets were $40.3 million at December 31, 2009, compared to $45.9 million at December 31, 2008. At the end of fiscal year 2009, we had $6.3 million in long-term debt outstanding, $2.1 million in cash and cash equivalents and $492,000 of investments in certificates of deposit.
Revenue totaled approximately $10.8 million for fiscal year 2009 compared to $20.2 million for fiscal year 2008. Net loss from operations totaled approximately $10.0 million for both fiscal years ended 2009 and 2008. Net realized losses on investments, net of any related deferred tax effect, totaled approximately $49.6 million in 2009 as compared to $4.2 million in 2008. In this regard, we received gross proceeds of $3.1 million in 2009 and $2.3 million in 2008 in connection with the sale of the securities we received in connection with our global technology licensing agreements and technology transfers. Proceeds received in connection with the sale of our investments for the year ended December 31, 2009 included $1.1 million in cash, $218,000 in common stock, $201,000 in an additional investment in UTEK Real Estate Holdings, Inc., and $1.5 million in a note receivable. Net change in unrealized appreciation (depreciation) of investments, net of any related deferred tax benefit, was $44.3 million in 2009 as compared to $(12.2) million in 2008. The unrealized appreciation of $44.3 million in 2009 is related to the reversal of previously recorded unrealized depreciation upon the sale of certain investments for a realized loss of 49.6 million.
Current Market Conditions
Since mid-2007, global credit and other financial markets have suffered substantial stress, volatility, illiquidity and disruption. These forces reached unprecedented levels in late 2008, resulting in the bankruptcy or acquisition of, or government assistance to, several major domestic and international financial institutions. These
19
Table of Contents
events have significantly diminished overall confidence in the financial markets and caused increasing global economic uncertainty. This reduced confidence and uncertainty could further exacerbate the overall market disruptions and risks to businesses in need of capital, including us. Moreover, the deterioration in the equity markets has had a significant impact on the cash proceeds that we have been able to obtain upon the sale of our investments. In addition, the deterioration in consumer confidence and a general reduction in spending by consumers and business have had an adverse effect on our innovation consulting services operations as businesses have delayed spending on these types of services. Although the market and economic conditions have recently improved, we can provide no assurance that we will not be negatively impacted by these market and economic conditions.
Investment Portfolio Activity
Until September 30, 2009, the Company was a non-diversified, closed-end management investment company that had elected to be treated as a business development company (“BDC”) under the Investment Company Act of 1940 (“1940 Act”). On October 1, 2009, because we no longer met the requirements, the Company filed a notification on Form N-54C with the SEC withdrawing its election to be regulated as a BDC under the 1940 Act. As such, the Company began reporting as an operating company as of October 1, 2009.
In connection with our plan to de-elect BDC status, we liquidated a significant portion of our investment portfolio during 2009. We sold some or all of our shares in a significant number of our portfolio companies for $3.1 million in cash and other assets, which resulted in realized losses of $49.6 million and unrealized appreciation of $44.3 million, which is primarily related to the reversal of previously recorded unrealized depreciation upon the sale of these investments.
Conversion from Investment Company Presentation to Operating Company Presentation
The withdrawal of the Company’s election to be regulated as a BDC under the 1940 Act resulted in a significant change in the Company’s method of accounting. Investment company financial statement presentation and accounting utilizes the value method of accounting used by investment companies, which requires investment companies to value their investments at market value as opposed to historical cost, and recognize income related to unrealized gains and losses in the current period. As an operating company, the required financial statement presentation and accounting for investments held is either fair value or historical cost methods of accounting, depending on the classification of the investment and the Company’s intent with respect to the period of time it intends to hold the investment.
In addition, the financial accounts of majority-owned entities were not consolidated with those of the Company under Investment Company Accounting; rather, investments in those entities were reflected in the Company’s balance sheet at fair value. As an operating company, the Company is required to consolidate the accounts of majority-owned entities in which we have a controlling financial interest with those of the Company. In this regard, the accounts of UTEK Real Estate Holdings, Inc., which was previously reflected as an investment in the Company’s balance sheet at fair value, have been consolidated with the accounts of the Company from October 1, 2009. The consolidation of UTEK Real Estate Holdings, Inc. had a significant effect on the Company’s balance sheet as of December 31, 2009, as it added approximately $500,000 in investments, $8.0 million in land and buildings and $4.2 million in related long-term debt. The consolidation did not have a material effect on the Company’s results of operations for the three months ended December 31, 2009.
For a detailed discussion of the impact of the withdrawal of the Company’s election to be regulated as a BDC under the 1940 Act on its method of accounting and a discussion of how the Company accounts for investments as an operating company, see Notes 1 and 2 to the consolidated financial statements contained elsewhere in this annual report on Form 10-K.
20
Table of Contents
Results of Operations
Summary of Results for Years Ended December 31, 2009, 2008 and 2007
Revenue / Income from Operations
| (in thousands, except percentages) |
2009 | 2008 | 2007 | Percent Change 2009 versus 2008 |
Percent Change 2008 versus 2007 |
||||||||||
| Innovation consulting services |
$ | 7,491 | $ | 11,135 | $ | — | (33 | )% | 100 | % | |||||
| Sale of technology rights |
— | 4,685 | 16,373 | (100 | )% | (71 | )% | ||||||||
| Subscription and other services |
3,227 | 3,959 | 3,343 | (18 | )% | 18 | % | ||||||||
| Investment income, net |
60 | 399 | 585 | (85 | )% | (32 | )% | ||||||||
| Revenue |
$ | 10,778 | $ | 20,178 | $ | 20,301 | (47 | )% | (1 | )% | |||||
Innovation Consulting Services
Innovation consulting services revenue includes income from strategic innovation consulting and foresight and trend research. Innovation consulting services revenue decreased $3.6 million for the year ended December 31, 2009 compared to the year ended December 31, 2008. Throughout 2009, we had the innovation consulting income of three divisions, which were acquired intermittently during 2008. We recognized revenue for all three divisions for the entire year of 2009 versus having recognized revenue for these divisions for only a portion of 2008. However, the revenue of all of our acquired innovation consulting companies suffered significantly throughout 2009 due to the adverse economic conditions. During economic cycles in which companies are experiencing financial difficulties or uncertainty, companies generally cancel or delay spending on consulting type services.
As a result of our acquisition of Strategos, Innovaro and Social Technologies in 2008, our innovation consulting revenue increased to $11.1 million for the year ended December 31, 2008, versus $-0- for the year ended December 31, 2007.
Sale of Technology Rights
Sale of technology rights income strictly relates to the revenue generated from completed technology transfers. Sale of technology rights revenue decreased during 2009 as a result of our not having completed any technology transfers during the year ended December 31, 2009 compared to having completed seven technology transfers during the year ended December 31, 2008. To mitigate the risk of declining stock prices with respect to the stock consideration we have historically received in connection with our technology transfers, we currently intend to complete all technology transfers for cash as opposed to stock. In addition, our client focus is now more heavily weighted towards larger capitalization companies, which has caused a significant slowdown in the process to complete a technology transfer given the more measured decision making process with respect to executing a technology transfer by these companies.
Sale of technology rights revenue decreased during 2008 as a result of our having completed seven technology transfers during the year ended December 31, 2008 compared to having completed sixteen technology transfers during the year ended December 31, 2007. The technology transfers had an average value of $669,000 and $1.0 million for the years ended December 31, 2008 and 2007, respectively. With the exception of $125,000 in 2008 and $200,000 in 2007, all income from the sale of technology rights for the years ended December 31, 2008 and 2007 was received in the form of equity securities. Overall equity market conditions generally forced micro-capitalization stock prices down during 2008, making it more difficult for some of our clients to issue a reasonable amount of stock with sufficient value in exchange for these technologies. In addition, we were pursuing technology transfers on a more selective basis to mitigate the risk of declining stock prices with respect to the stock consideration we received in connection with our technology transfers. These circumstances resulted in a decrease in the number of executed technology transfers during 2008.
21
Table of Contents
As a result of the change from completing technology transfers in exchange for cash as opposed to stock consideration, and the change in focus toward a large capitalization client, we expect our revenues from the sale of technology rights in the near-term will continue to be significantly lower than our historical revenues from such transactions.
Subscription and Other Services
Our subscription and other services revenue was $3.2 million for the year ended December 31, 2009 versus $4.0 million and $3.3 million for the years ended December 31, 2008 and 2007, respectively. Our subscription and other services revenue includes online licensing services income from our website subscriptions, global technology licensing income (including patent analytic fees), and income from various other services.
Our online licensing services division had website subscription income of approximately $1.9 million for the year ended December 31, 2009 as compared to $2.1 million for the year ended December 31, 2008. We have been able to keep this income source relatively stable from 2008 to 2009 due to a new product sold through Pharmalicensing called Partnering Search. Through this program, we use our partnering experts to search for partners on behalf of the customers as well as to provide a fully qualified list of target companies, instruct customers on how to contact target companies, make introductions and coordinate initial contact/conference calls.
Our online licensing services division had website subscription income of approximately $2.1 million for the year ended December 31, 2008 as compared to $1.3 million for the year ended December 31, 2007. The increase was attributable to the acquisition of Pharmalicensing in January 2008, which accounted for $760,000 in subscription revenues for the year ended December 31, 2008.
Our global technology licensing income was approximately $800,000 for the year ended December 31, 2009 as compared to $1.3 million for the year ended December 31, 2008. The decrease in 2009 resulted primarily from a decrease in the number of global technology licensing agreements signed and the number of patent analytics projects, which was driven by poor economic conditions. We have recently increased the price of our services and are concentrating on providing improved services to a few select clients.
Our global technology licensing income was approximately $1.3 million for the year ended December 31, 2008 as compared to $1.9 million for the year ended December 31, 2007. The decrease in 2008 resulted primarily from a decrease in the number of global technology licensing agreements signed and the number of patent analytics projects, which was by driven poor economic conditions. The number of new agreements added in 2008 was thirty-two as compared to eighty new agreements in 2007. During 2008, we did implement a price increase, but due to the lowered number of alliances, the income was still lower than in 2007.
Our other services generated $490,000 in income during 2009 compared to $533,000 in 2008 and $148,000 in 2007. The change from year to year is primarily related to Strategos software and licensing income, which became a new revenue stream during 2008.
Investment Income, net
Investment income decreased in 2009 and 2008 due to lower cash and cash equivalent balances and reduced market interest rates in the lower interest rate environment. Beginning on October 1, 2009, we changed from Investment Company Accounting to Operating Company Accounting, which resulted in investment income for the fourth quarter of 2009 being recorded as other income and expense in the statement of operations. This did not have a significant impact on the change in investment income from 2008 to 2009.
22
Table of Contents
Expenses
Direct Costs of Innovation Consulting Services
| (in thousands, except percentages) |
2009 | 2008 | 2007 | Percent Change 2009 versus 2008 |
Percent Change 2008 versus 2007 |
|||||||||||||
| Direct costs of innovation consulting services |
$ | 6,305 | $ | 10,124 | $ | — | (38 | )% | 100 | % | ||||||||
| As a percent of innovation consulting services |
84 | % | 91 | % | — | % | (7 | )ppt | 91 | ppt* | ||||||||
| * | The abbreviation “ppt” throughout this section denotes percentage points. |
Direct costs of innovation consulting services are comprised of salaries and related taxes, bonuses, certain outside services and other direct project costs related to innovation consulting services revenue. This expense line item was created in 2008 as a result of the acquisitions of Strategos, Innovaro and Social Technologies and the addition of our innovation consulting services segment.
The most significant portion of direct costs of innovation consulting services is comprised of consulting personnel compensation including bonuses. Direct costs decreased by $3.8 million from the year ended December 31, 2008 to the year ended December 31, 2009. This change is related to a decrease in bonuses of $5.3 million, partially offset by an increase in Strategos and Social Technologies division salaries of $690,000 and $782,000, respectively. Bonuses comprised $565,000 of direct costs of innovation consulting services for the year ended December 31, 2009 as compared to $5.9 million of for the year ended December 31, 2008. The decrease in bonuses paid is directly related to the significant decrease in revenue.
We have a Strategos Bonus Plan for qualifying Strategos division employees. The award pool is determined from eligible earnings and aggregate revenues and is limited to the extent required to permit Strategos to maintain sufficient operating cash. Awards are to be paid out by December 15th of each year and are accrued on a quarterly basis. Approximately 85% to 90% of Strategos net income will be paid out in connection with this bonus plan.
We have an Innovaro Bonus Plan for qualifying Innovaro division employees. The award pool is determined from eligible earnings and aggregate revenues and is limited to the extent required to permit Innovaro to maintain sufficient operating cash. Awards are to be paid out by June 30th of each year and are accrued on a quarterly basis. Approximately 75% to 85% of Innovaro net income will be paid out in connection with this bonus plan.
We have a Social Technologies Bonus Plan for qualifying Social Technologies division employees. The award pool is determined from eligible earnings and aggregate revenues and is limited to the extent required to permit Social Technologies to maintain sufficient operating cash.
Direct Costs of Subscription and Other Services
The Company does not report direct costs associated with its subscription and other services revenue as these costs have not been quantified. Direct costs of subscription and other services are primarily related to salaries and related expenses of employees who have multiple roles within the organization.
Acquisition of Technology Rights
| (in thousands, except percentages) |
2009 | 2008 | 2007 | Percent Change 2009 versus 2008 |
Percent Change 2008 versus 2007 |
|||||||||||||
| Acquisition of technology rights |
$ | — | $ | 1,780 | $ | 3,816 | (100 | )% | (53 | )% | ||||||||
| As a percent of sale of technology rights |
0 | % | 38 | % | 23 | % | (38 | )ppt | 15 | ppt | ||||||||
23
Table of Contents
Acquisition of technology rights costs consist of the direct costs associated with our technology transfers, which include cash to further accelerate commercialization efforts, license fees to acquire new technologies, consulting fees with the inventor of the technologies, and sponsored research fees with the university or research facility transferring the technologies. The overall decrease in acquisition of technology rights from the year ended December 31, 2008 to the year ended December 31, 2009 was due to the Company not having completed any technology transfers during 2009 compared to having completed seven technology transfers during 2008. To mitigate the risk of declining stock prices with respect to the stock consideration we have historically received in connection with our technology transfers, we currently intend to complete all technology transfers for cash as opposed to stock. In addition, our client focus is now more heavily weighted towards larger capitalization companies, which has caused a significant slowdown in the process to complete a technology transfer given the more measured decision making process with respect to executing a technology transfer by these companies.
The overall decrease in acquisition of technology rights from the year ended December 31, 2007 to the year ended December 31, 2008 was due to our having completed nine less technology transfers in 2008 than in 2007. The average cost per technology transfer remained fairly consistent from 2007 to 2008, but the percentage of sale of technology rights revenue increased to 38% in 2008 as a result of the lower average revenue per technology transfer. This is a result of the decrease in the average value of technology transfers from $1.0 million in 2007 to $669,000 in 2008.
Acquisition of technology rights costs are directly related to sale of technology rights revenue. In the future, we plan to focus on completing technology transfers in exchange for cash remuneration.
The following table provides certain information relating to the costs of the acquisition of technology rights we incurred in connection with our technology transfers during the year ended December 31, 2008:
| Date |
Client Acquiring Newly Formed Company |
Newly Formed Company |
Dollar Amount of Expenses | ||||
| January 28 |
Rim Semiconductor Company | Broadband Distance Systems, Inc. | $ | 440,000 | |||
| March 24 |
Rim Semiconductor Company | Multi-Carrier Communications, Inc. | 383,500 | ||||
| March 31 |
Platina Energy Group, Inc. | Enhanced Oil Recovery, Inc. | 360,500 | ||||
| June 10 |
World Energy Group, Inc. | Advanced Alternative Energy, Inc. | 236,000 | ||||
| June 26 |
CSMG Technologies, Inc. | Carbon Capture Technologies, Inc. | 60,000 | ||||
| September 26 |
World Energy Solutions, Inc. | H-Hybrid Technologies, Inc. | 300,000 | ||||
| $ | 1,780,000 | ||||||
24
Table of Contents
The following table provides certain information relating to costs of the acquisition of technology rights we incurred in connection with our technology transfers during the year ended December 31, 2007:
| Date |
Client Acquiring Newly Formed Company |
Newly Formed Company |
Dollar Amount of Expenses | ||||
| January 4 |
Manakoa Services Corporation | Infinite Identification Technologies, Inc. | $ | 400,000 | |||
| January 11 |
Cyberlux Corporation | Hybrid Lighting Technologies, Inc. | 192,455 | ||||
| January 30 |
CytoDyn, Inc. | Advanced Genetic Technologies, Inc. | 167,500 | ||||
| January 31 |
Material Technologies, Inc. | Stress Analysis Technologies, Inc. | 130,000 | ||||
| February 12 |
Liberty Diversified Holdings, Inc. | Sero Tonin Solutions, Inc. | 70,052 | ||||
| March 12 |
Metamorphix Global, Inc. | Flex Crete Technologies, Inc. | 52,884 | ||||
| March 12 |
Klegg Electronics, Inc. | Tempo Control Technologies, Inc. | 135,388 | ||||
| March 28 |
Avalon Oil & Gas, Inc. | Leak Location Technologies, Inc. | 155,000 | ||||
| April 30 |
Material Technologies, Inc. | Damage Assessment Technologies, Inc. | 300,000 | ||||
| May 30 |
Klegg Electronics, Inc. | Klegg Network Storage Technologies, Inc. | 450,000 | ||||
| June 28 |
Material Technologies, Inc. | Non-Destructive Assessment Technologies, Inc. | 280,000 | ||||
| July 12 |
Pathway One Plc | WebMed Technologies, Inc. | 305,215 | ||||
| July 20 |
MachineTalker, Inc. | Wideband Detection Technologies, Inc. | 40,000 | ||||
| Sept 28 |
World Energy Solutions, Inc. | Hydrogen Safe Technologies, Inc. | 492,350 | ||||
| November 12 |
NeoStem, Inc. | Stem Cell Technologies, Inc. | 300,000 | ||||
| December 28 |
MachineTalker, Inc. | Micro Wireless Technologies, Inc. | 345,000 | ||||
| $ | 3,815,844 | ||||||
Salaries and Wages
| (in thousands, except percentages) |
2009 | 2008 | 2007 | Percent Change 2009 versus 2008 |
Percent Change 2008 versus 2007 |
|||||||||||||
| Salaries and wages |
$ | 5,295 | $ | 6,154 | $ | 3,519 | (14 | )% | 75 | % | ||||||||
| As a percent of revenue |
49 | % | 30 | % | 17 | % | 19 | ppt | 13 | ppt | ||||||||
Salaries and wages include non-sales employee and officer salaries and related benefits including bonuses and stock-based compensation. Salaries and wages decreased by $859,000 for the year ended December 31, 2009 compared to the year ended December 31, 2008. During the year ended December 30, 2009, we had a $2.55 million charge to salaries and wages related to the modification of the acquisition and employment agreements with the manager of our Social Technologies division versus having had a $1.65 million charge for our CEO’s severance liability in the corresponding period of 2008. The offsetting decrease in salaries and wages of approximately $1.75 million in 2009 relates to the reduction in employees of $1,270,000, the retirement of our CEO of $284,000 and a decrease in stock compensation expense of $203,000 resulting primarily from significant option forfeitures.
Salaries and wages increased $2.6 million during the year ended December 31, 2008 compared to the year ended December 31, 2007 as a result of the accrual of our former CEO’s severance liability of $1.65 million, the addition of Pharmalicensing employees to the payroll of $425,000, additional salaries related to new management for the TekScout website of $125,000, increased officer salaries of $293,000 and an increase in stock-based compensation expense of $167,000 resulting from additional option grants.
We expect salaries and wages to increase for the year ending December 31, 2010 as a result of new hires.
25
Table of Contents
Professional Fees
| (in thousands, except percentages) |
2009 | 2008 | 2007 | Percent Change 2009 versus 2008 |
Percent Change 2008 versus 2007 |
|||||||||||||
| Professional fees |
$ | 814 | $ | 1,257 | $ | 1,359 | (35 | )% | (7 | )% | ||||||||
| As a percent of revenue |
8 | % | 6 | % | 7 | % | 2 | ppt | (1 | )ppt | ||||||||
Professional fees include accounting fees, legal fees and valuation expenses for our investments. Professional fees decreased by $443,000 for the year ended December 31, 2009 compared to the year ended December 31, 2008. We incurred legal fees related to specific projects in 2008 that were not incurred in 2009, which resulted in a decrease in legal fees of $198,000. Our valuation expenses decreased $124,000 due to a reduced number of investment holdings in 2009. Our accounting fees decreased $120,000 related to having four acquisition audits in 2008 that we did not have in 2009.
The decrease in professional fees of $102,000 for the year ended December 31, 2008 compared to the year ended December 31, 2007 relates to a significant decrease in legal fees, partially offset by an increase in the accounting fees. We incurred legal fees related to our registration statement filing and responses to SEC comment letters in 2007, which were not incurred in 2008. This resulted in a decrease in legal fees of $316,000 in 2008. Our accounting fees increased $206,000 during 2008 related to acquisition audits performed due to filing requirements.
We expect to have a decrease in professional fees for the year ending December 31, 2010 from an anticipated reduction in the number of investments requiring quarterly valuations and a reduction in legal fees related to the change from a BDC to an operating company.
Sales and Marketing
| in thousands, except percentages) |
2009 | 2008 | 2007 | Percent Change 2009 versus 2008 |
Percent Change 2008 versus 2007 |
|||||||||||||
| Sales and marketing |
$ | 1,707 | $ | 2,322 | $ | 2,036 | (26 | )% | 14 | % | ||||||||
| As a percent of revenue |
16 | % | 12 | % | 10 | % | 4 | ppt | 2 | ppt | ||||||||
Sales and marketing expenses include advertising, marketing, salaries and commissions paid to sales personnel, commissions paid to outside service providers, travel and other selling expenses. Sales and marketing expenses decreased by $615,000 for the year ended December 31, 2009 compared to the year ended December 31, 2008. Sales salaries decreased $81,000 as a result of downsizing the number of employees in all areas of the company, including sales staff. Commissions decreased $376,000 as a result of reduced sales and reduced sales staff. Sales related travel and entertainment costs decreased $42,000 and marketing costs decreased $109,000 in connection with management’s effort to curb costs.
Sales and marketing expenses increased by $286,000 for the year ended December 31, 2008 compared to the year ended December 31, 2007. Commissions decreased $103,000 primarily as a result of reduced technology transfer sales. Sales related travel and entertainment costs increased $194,000 as a result of increased travel to clients in an attempt to boost sales and the addition of sales travel costs of our acquired companies. Marketing costs increased $81,000 due to the addition of marketing costs of our acquired companies and $19,000 for marketing our new TekScout website. Sales salaries increased $62,000 related to new employees from our acquired companies.
We expect sales and marketing expenses to increase for the year ending December 31, 2010 as a result of a push in our marketing efforts.
26
Table of Contents
General and Administrative
| (in thousands, except percentages) |
2009 | 2008 | 2007 | Percent Change 2009 versus 2008 |
Percent Change 2008 versus 2007 |
|||||||||||||
| General and administrative |
$ | 2,756 | $ | 3,781 | $ | 2,626 | (27 | )% | 44 | % | ||||||||
| As a percent of revenue |
26 | % | 19 | % | 13 | % | 7 | ppt | 6 | ppt | ||||||||
General and administrative expenses decreased by $1.0 million for the year ended December 31, 2009 compared to the year ended December 31, 2008. We experienced a $297,000 reduction in investor relations, investment banking and public relations fees by eliminating our outside providers, a $156,000 reduction in payroll taxes and insurance and other payroll related expenses due to a decrease in payroll, and a $198,000 reduction in outside consulting costs related to four acquisitions during 2008, in addition to other reductions resulting from an overall plan to reduce all aspects of overhead.
General and administrative expenses increased by $1.1 million for the year ended December 31, 2008 compared to the year ended December 31, 2007 as a direct result of the four acquisitions made in 2008. We had significant increases in insurance of $255,000, rent of $179,000, outside services of $180,000 and investment banking of $61,000, all of which were directly related to the acquisitions. The remainder of the increase primarily relates to employee costs as a result of these acquisitions. The increase was partially offset by a decrease in bad debt expense of $128,000 and a decrease in public relations costs of $54,000 because we stopped using an outside firm for this service.
We expect general and administrative expenses for the year ending December 31, 2010 to remain flat to 2009.
Amortization and Depreciation
| (in thousands, except percentages) |
2009 | 2008 | 2007 | Percent Change 2009 versus 2008 |
Percent Change 2008 versus 2007 |
|||||||||||||
| Amortization and depreciation |
$ | 1,616 | $ | 1,096 | $ | 212 | 47 | % | 416 | % | ||||||||
| As a percent of revenue |
15 | % | 5 | % | 1 | % | 10 | ppt | 4 | ppt | ||||||||
The increase in amortization and depreciation expense for the years ended December 31, 2009 and 2008 was a direct result of four business acquisitions we made in 2008. We acquired $12.4 million in intangible assets and $350,000 in fixed assets during 2008 in connection with these acquisitions, which significantly increased our annual amortization and depreciation expense.
We expect amortization and depreciation for the year ending December 31, 2010 to increase in relation to that of 2009 as a result of the addition $4.0 million in depreciable assets from the consolidation of UTEK Real Estate, partially offset by a decrease of $700,000 in definite-lived intangible asset as a result of impairment.
Impairment Loss
| (in thousands, except percentages) |
2009 | 2008 | 2007 | Percent Change 2009 versus 2008 |
Percent Change 2008 versus 2007 |
|||||||||||||
| Impairment loss |
$ | 2,368 | $ | — | $ | 210 | 100 | % | — | % | ||||||||
| As a percent of revenue |
22 | % | — | % | 1 | % | 22 | ppt | (1 | )ppt | ||||||||
27
Table of Contents
Our long-lived assets are tested for impairment on at least an annual basis. Impairment testing is required more often than annually if an event or circumstance indicates that an impairment, or decline in value, may have occurred. No impairments were incurred in 2008, but we incurred impairments during both 2009 and 2007 as discussed below.
In 2009, our Social Technologies division had significant declines in revenues related to their futures and foresight projects. The state of the economy during 2009 contributed to potential Social Technologies’ clients focusing on short-term survival rather than long-term foresight planning. As a result, management terminated the majority of the division’s employees in favor of an independent, network-based approach in an effort to reduce overhead. Management concluded that this division suffered a significant adverse change in the business, which includes a projection of continuing operating and cash flow losses. We determined that there was impairment of the division’s purchased intangible assets of $1.0 million and impairment of the division’s goodwill of $1.3 million during 2009.
In connection with our annual impairment analysis in 2007, we determined there was impairment of the goodwill related to the Pharma Transfer, Ltd. and Knowledge Express acquisitions. As a result, we recorded a partial impairment of the related goodwill during 2007. These write-downs resulted in an impairment charge of approximately $159,000 ($99,000 after tax) for the United Kingdom segment and $51,000 ($32,000 after tax) for the United States segment during 2007.
Other (income) expense
Other (income) expense is a new line item in our statement of operations beginning on October 1, 2009 in connection with our conversion to Operating Company Accounting. The net expense of $69,731 for the three months ended December 31, 2009 is primarily comprised of $110,000 loss on derivative liability relating to revaluing certain of our outstanding warrants to purchase UTEK common stock. This loss is partially offset by rental income of $40,000 and capital gains from the sale of marketable securities of $20,000.
Interest Expense
Interest expense, net is a new line item in our statement of operations beginning on October 1, 2009 in connection with our conversion to Operating Company Accounting. The net expense of $85,467 for the three months ended December 31, 2009 is primarily comprised of interest expense on long-term debt, primarily related to mortgages held by UTEK Real Estate, partially offset by interest income on our note receivable.
Net Realized Gains or Losses on Investments (from investment company activity)
| (in thousands, except percentages) |
2009 | 2008 | 2007 | Percent Change 2009 versus 2008 |
Percent Change 2008 versus 2007 |
|||||||||||||
| Realized gains/ (losses) |
$ | (49,591 | ) | $ | (4,232 | ) | $ | (1,447 | ) | 1072 | % | 192 | % | |||||
In connection with our plan to de-elect BDC status, we liquidated a significant portion of our investment portfolio during 2009. We sold some or all of our shares in a significant number of our portfolio companies for $3.1 million in cash and other assets, which resulted in realized losses of $49.6 million and unrealized appreciation of $44.3 million, which is primarily related to the reversal of previously recorded unrealized depreciation upon the sale of these investments.
28
Table of Contents
Net realized losses on investments amounted to $49,591,193 for the nine months ended September 30, 2009 and were related to sales as follows:
| Portfolio Company |
Number of Shares |
Realized Gain (Loss) |
||||
| Advanced Medical Isotope Corporation—preferred shares |
95,000 | $ | (1,387,427 | ) | ||
| Advanced Refractive Technologies, Inc.—common and preferred shares |
various | (3,369,544 | ) | |||
| American Soil Technologies, Inc. |
6,498,845 | (1,010,585 | ) | |||
| Avalon Oil and Gas, Inc. |
3,373,107 | (1,595,566 | ) | |||
| Cyberlux Corporation—common and preferred shares |
various | (2,133,210 | ) | |||
| CytoDyn, Inc. |
2,768,000 | (2,622,757 | ) | |||
| Eclips Energy Technologies, Inc. |
9,790,530 | (1,906,981 | ) | |||
| Island Gas Resources Plc |
2,500 | (4,478,732 | ) | |||
| Stealth MediaLabs, Inc. |
4,221,165 | (1,192,848 | ) | |||
| Klegg Electronics, Inc. |
15,009,402 | (4,543,913 | ) | |||
| Rim Semiconductor Company |
210,000,000 | (1,251,861 | ) | |||
| MATECH Corporation |
17,823 | (2,872,617 | ) | |||
| NutriPure Beverages, Inc.—common shares |
69,237 | (1,137,017 | ) | |||
| Tesla Vision Corporation—common and preferred shares |
various | (3,074,753 | ) | |||
| The Renewable Corporation |
2,971 | (2,413,005 | ) | |||
| Trio Industries Group, Inc. |
7,787,565 | (8,611,409 | ) | |||
| UBA Technology, Inc.—common and preferred shares |
various | (2,285,649 | ) | |||
| All other investments sold |
(3,703,319 | ) | ||||
| Total |
$ | (49,591,193 | ) | |||
Net realized losses on investments, net of income tax effect, amounted to $4,232,138 for the year ended December 31, 2008 and were related to sales as follows:
| Company Name |
Number of Shares |
Realized Gain (Loss) |
||||
| Advanced Medical Isotope Corporation |
600,000 | $ | 203,950 | |||
| Avalon Oil and Gas, Inc. |
247,200 | (235,050 | ) | |||
| Broadcast International, Inc. |
478,562 | 479,441 | ||||
| EcoSystem Corporation |
922,446 | (1,513,603 | ) | |||
| eLinear, Inc. |
261,234 | (118,963 | ) | |||
| The Renewable Corporation |
2,491 | (1,805,369 | ) | |||
| MATECH Corporation |
2,728,243 | (323,273 | ) | |||
| Pathway One PLC |
3,000,000 | (265,790 | ) | |||
| All other investments sold |
20,434,345 | (653,481 | ) | |||
| Total |
($ | 4,232,138 | ) | |||
29
Table of Contents
Net realized losses on investments, net of income tax effect, amounted to $1,447,380 for the year ended December 31, 2007 and were related to sales as follows:
| Portfolio Company |
Number of Shares |
Realized Gain (Loss) |
||||
| Shumate Industries, Inc. |
171,432 | $ | 127,234 | |||
| Health Sciences Group, Inc. |
3,023,703 | (974,894 | ) | |||
| Swiss Medica, Inc. |
1,735,000 | (181,851 | ) | |||
| Xethanol Corporation |
136,838 | (378,936 | ) | |||
| Broadcast International, Inc. |
505,798 | 222,543 | ||||
| Power3 Medical Products, Inc. |
221,033 | (106,931 | ) | |||
| All other investments sold |
3,557,785 | (154,545 | ) | |||
| Total |
($ | 1,447,380 | ) | |||
Net realized gains and losses can vary substantially due to a variety of factors and may not be indicative of future performance. As a result of the uncertainty surrounding the future values of our investments, we are unable to make any projections or estimates regarding realized gains or losses expected in 2010.
Net Changes in Unrealized Appreciation or Depreciation on Investments (from investment company activity)
As a BDC, we were required to determine the value of each investment in our portfolio on a quarterly basis and changes in value result in unrealized appreciation or depreciation being recognized. Value, as defined in Section 2(a)(41) of the 1940 Act, is (i) the market price for those securities for which a market quotation is readily available and (ii) for all other securities and assets, fair value is as determined in good faith by the Board of Directors. Because there is typically no readily available market value for the investments in our portfolio, we valued substantially all of our investments at fair value as determined in good faith by the Board of Directors. In making its determination, our Board of Directors considered valuation appraisals provided by independent valuation service providers. Because of the inherent uncertainty of determining the fair value of investments that do not have a readily available market value, the fair value of our investments determined in good faith by the Board of Directors may differ significantly from the values that would have been used had a ready market existed for the investments, and the differences could be material.
| (in thousands, except percentages) |
Nine Months Ended Sept 30, 2009 |
Year Ended Dec 31, 2008 |
Year Ended Dec 31, 2007 |
Percent Change 2009 versus 2008 |
Percent Change 2008 versus 2007 |
||||||||||||
| Unrealized appreciation/ (depreciation) |
$ | 44,292 | $ | (12,218 | ) | $ | (10,806 | ) | (463 | )% | 13 | % | |||||
Overall negative equity market conditions and a weakened U.S. economy have resulted in significant decreases in market prices for a significant portion of our portfolio companies. This resulted in significant unrealized depreciation on many of our investments during 2008 and 2007. A significant amount of the accumulation of these losses has been realized during 2009 in connection with the sale or exchange of the majority of these investments.
In addition, we recorded a valuation allowance against our deferred tax asset during 2008. A portion of the valuation allowance ($5.7 million) was charged as an expense against the change in unrealized depreciation of investments for the year ended December 31, 2008. The valuation allowance was recorded as a result of management’s determination that it was more likely than not that our net operating loss carryforwards would not be utilized in the future.
In connection with our plan to de-elect BDC status, we liquidated a significant portion of our investment portfolio during 2009. We sold some or all of our shares in a significant number of our portfolio companies for $3.1 million in cash and other assets, which resulted in realized losses of $49.6 million and unrealized appreciation of $44.3 million, which is primarily related to the reversal of previously recorded unrealized depreciation upon the sale of these investments.
30
Table of Contents
Net change in unrealized appreciation (depreciation) on investments amounted to $44,292,068 for the nine months ended September 30, 2009 and was related to our investments as follows:
| Portfolio Company |
Net Unrealized Appreciation (Depreciation) | ||
| Effect of recognition of realized gains (losses) |
$ | 42,937,888 | |
| Eclips Energy Technologies, Inc. |
685,848 | ||
| Websky, Inc. |
294,262 | ||
| All other investments |
374,070 | ||
| Total |
$ | 44,292,068 | |
Net change in unrealized appreciation (depreciation) on investments, net of income tax effect, amounted to $(12,217,977) for the year ended December 31, 2008 and was related to our investments as follows:
| Portfolio Company |
Net Unrealized Appreciation (Depreciation) |
|||
| Effect of recognition of realized gains (losses) |
$ | 2,580,081 | ||
| Advanced Refractive Technologies, Inc. |
(648,249 | ) | ||
| Cyberlux Corporation |
(710,231 | ) | ||
| Emission & Power Supply, Inc. |
(813,678 | ) | ||
| Tesla Vision Corporation |
(510,498 | ) | ||
| MachineTalker, Inc. |
(333,430 | ) | ||
| MATECH Corporation |
(2,439,129 | ) | ||
| MiMedx Group, Inc. |
705,529 | |||
| Platina Energy Group, Inc. |
(454,478 | ) | ||
| RIM Semiconductor Company |
(1,117,982 | ) | ||
| World Energy Solutions, Inc. |
(1,229,624 | ) | ||
| All other investments |
(1,556,095 | ) | ||
| Deferred tax valuation allowance |
(5,690,193 | ) | ||
| $ | (12,217,977 | ) | ||
Net unrealized appreciation (depreciation) on investments, net of income tax effect, amounted to $(10,806,048) for the year ended December 31, 2007 and was related to our investments as follows:
| Portfolio Company |
Net Unrealized Appreciation (Depreciation) |
|||
| Effect of recognition of realized gains (losses) |
$ | 1,852,136 | ||
| Advanced Refractive Technologies, Inc. |
(1,261,124 | ) | ||
| American Soil Technologies, Inc. |
(720,328 | ) | ||
| CytoDyn, Inc. |
(825,467 | ) | ||
| Industrial Biotechnology Corporation |
(1,243,595 | ) | ||
| Emission & Power Supply, Inc. |
(766,590 | ) | ||
| Klegg Electronics, Inc. |
(3,489,976 | ) | ||
| Manakoa Services Corporation |
(1,055,455 | ) | ||
| vidShadow, Inc. |
(703,548 | ) | ||
| World Energy Solutions, Inc. |
(1,436,653 | ) | ||
| All other investments |
(1,155,448 | ) | ||
| $ | (10,806,048 | ) | ||
31
Table of Contents
While these unrealized losses were significant, reduction in values and failures among small cap companies is not unexpected and may occur in the future. Changes in unrealized appreciation or depreciation can vary substantially due to a variety of factors and may not be indicative of future performance.
Other Matters
Income Tax
Deferred taxes are provided on the asset and liability method whereby deferred tax assets are recognized for deductible temporary differences and operating loss and tax credit carry forwards and deferred tax liabilities are recognized for taxable temporary differences. Temporary differences are the differences between the reported amounts of assets and liabilities and their tax bases. Future tax benefits for net operating loss carryforwards are recognized to the extent that realization of these benefits is considered more likely than not. Deferred tax assets are reduced by a valuation allowance when, in the opinion of management, it is more likely than not that some portion or all of the deferred tax assets will not be realized.
For federal and state income tax purposes, we are taxed at regular corporate rates on ordinary income and recognize gains on distributions of appreciated property. As an investment company, we were not entitled to the special tax treatment available to BDCs that elect to be treated as regulated investment companies under the Internal Revenue Code because, among other reasons, we did not distribute at least 90% of “investment company taxable income” as required by the Internal Revenue Code for such treatment.
We do not have any income tax benefit related to the net loss from operations in 2009, nor do we have a deferred tax asset related to our net operating loss carryforward, because of a 100% valuation allowance. We do have an income tax benefit from the reversal of a deferred tax liability related to the impairment of an indefinite-lived intangible asset and from foreign tax for the year ended December 31, 2009.
Liquidity and Capital Resources
Cash Flows
Cash used in operating activities of $3.7 million in 2009 increased $1.4 million from $2.3 million in 2008. This total cash used in operations of $3.7 million is primarily attributable to:
| • | $9.96 million net operating loss; |
| • | $944,000 related to severance compensation paid to our former CEO in cash; and |
| • | $1.55 million decrease in deferred revenue related to recognition of certain jobs coupled with a lower overall revenue level. |
Partially offset by:
| • | $682,000 in cash proceeds received from the sale of investments from investment company activity; |
| • | $1.6 million in non-cash depreciation and amortization related to the intangible assets and fixed assets acquired in 2008; |
| • | $2.4 million in non-cash goodwill and intangible asset impairment related to the Social Technologies division that was purchased in 2008; |
| • | $2.5 million in non-cash severance compensation paid for in escrowed shares of our common stock; |
| • | $577,000 in non-cash stock compensation expense related to the options issued; and |
| • | $1.2 million decrease in accounts receivable related to reduced revenue levels as a result of the economic downturn coupled with increased collection efforts. |
32
Table of Contents
Cash provided by investing activities of $169,000 in 2009 decreased $620,000 from $789,000 in 2008. This total cash provided by investing of $169,000 is primarily attributable to:
| • | $453,000 in cash proceeds received from the sale of investments from operating company activity, |
Partially offset by:
| • | $292,000 in cash paid out in connection with Strategos’ 2008 tax liability resulting from the acquisition. |
Cash provided by financing activities of $1.7 million in 2009 increased $1.55 million from $178,000 in 2008. This total cash provided by financing of $1.7 million is primarily attributable to:
| • | $1.75 million in cash received from debt financing. |
Borrowings
As of October 1, 2009, the financial results of UTEK Real Estate have been consolidated with those of UTEK. UTEK Real Estate has a $3 million bank note payable due in monthly installments of $20,436 including principal and interest at 6.50% through April 1, 2013 with a balloon payment due on May 1, 2013. In addition, UTEK Real Estate has a $1.5 million note payable due in monthly installments of interest at 5.25% with principal due in full on October 1, 2015. These loans were entered into in connection with the purchases of land and building that serves as our company headquarters and certain other undeveloped land located in Hillsborough County, Florida. These loans are collateralized by the property related to the purchases.
On October 22, 2009, we entered into a Promissory Note (the “Note”) with Gators Lender, LLC (the “Lender”), pursuant to which we borrowed $1,750,000 from the Lender. Interest is payable at an annual rate of 8% on a quarterly basis, in arrears, beginning April 15, 2010. The entire principal amount outstanding and all accrued interest is payable in full no later than October 22, 2012. UTEK Real Estate is a co-borrower under the Note and the loan is guaranteed by all subsidiaries. In addition, the guaranty was secured pursuant to a security agreement encumbering vacant real property located in Hernando County, Florida (the “Collateral”), which is owned by Cortez 114, LLC (“Cortez”), a subsidiary of UTEK Real Estate.
On February 26, 2010, we entered into a Substitution of Collateral Agreement and a Membership Interest Pledge Agreement and Release of Mortgage (the “Modification Agreements”), pursuant to which the Lender’s security interest in the Collateral was released and replaced by a security interest in 68% of the outstanding membership interests of Cortez. The Note was amended and restated to provide that UTEK and UTEK Real Estate must pay down $500,000 of the indebtedness to the Lender within 60 days.
As additional consideration for this loan, we also entered into a Warrant Agreement with the Lender to allow the Lender to purchase up to 437,500 shares of UTEK’s common stock at an exercise price of $4.48 until October 22, 2014. The exercise price is subject to certain conditions and adjustments that make the exercise price variable.
Liquidity
Our primary cash requirements include working capital, principal and interest payments on indebtedness, and funding bonuses and severance obligations. Our primary sources of funds are cash received from customers in connection with operations, proceeds from the sale of our investments, debt financing and availability under our $450,000 revolving line of credit. At December 31, 2009, we had cash and cash equivalents of $2.1 million and investments in certificates of deposit (“CDs”) of $492,000. The CDs are pledged to financial institutions as collateral to support the issuance of our line of credit. The Company had $200,000 of unused availability under its revolving line of credit at December 31, 2009.
33
Table of Contents
Subsequent to December 31, 2009, we satisfied our remaining severance obligation to our former CEO through the conveyance of a 32% ownership interest in Cortez. Cortez owns vacant real property located in Hernando County, Florida that previously served as Collateral to the Note discussed in “Borrowings” above. The Modification Agreement was entered into in connection with our satisfaction of this severance obligation. In connection with this severance payment, we paid approximately $320,000 to satisfy the related payroll taxes.
We currently intend to fund our capital expenditures and liquidity needs with existing cash and cash equivalent balances, our investments in certificates of deposit, as well as with cash generated by operations, the potential sales of our investments and unused availability under our revolving line of credit. As a result of our progress in significantly reducing our overhead expenses, we believe that these sources will be sufficient to fund our scheduled debt service, bonus and severance obligations, and provide required resources for working capital for the next twelve months.
We may seek to raise additional funds through public or private debt or equity financing for long-term liquidity. Financing terms from our recent debt financing discussed under “Borrowings” represent what possible additional financing could look like in the near term.
Off-Balance Sheet Arrangements
We have no off-balance sheet arrangements that have or are materially likely to have a current or future material effect on our financial condition, revenues or expenses, results of operations, liquidity, capital expenditures or capital resources.
Contractual Obligations
The following table reflects a summary of our significant contractual obligations and other commercial commitments as of December 31, 2009 and the effect such obligations are expected to have on our liquidity and cash flow in future periods:
Contractual Obligations
| Payments due by Period | |||||||||||||||
| Total | Less than 1 year |
1-3 years | 3-5 years | More than 5 years | |||||||||||
| Lines of credit |
$ | 250,000 | $ | 250,000 | $ | — | $ | — | $ | — | |||||
| Long-term debt |
6,554,000 | 875,000 | 1,681,000 | 2,748,000 | 1,250,000 | ||||||||||
| Estimated interest payments(1) |
1,627,000 | 470,000 | 819,000 | 250,000 | 88,000 | ||||||||||
| Capital lease obligations |
45,000 | 35,000 | 10,000 | — | — | ||||||||||
| Operating lease obligations |
300,000 | 136,000 | 139,000 | 25,000 | — | ||||||||||
| Total |
$ | 8,776,000 | $ | 1,766,000 | $ | 2,649,000 | $ | 3,023,000 | $ | 1,338,000 | |||||
| (1) | Estimated interest payments for long-term debt were calculated based on applicable rates and payment dates. Management expects to settle such interest payments with cash flows from operating activities or short-term borrowings. |
34
Table of Contents
Critical Accounting Estimates
The preparation of financial statements in conformity with US GAAP requires management to make assessments, estimates and assumptions that affect the amounts reported in the financial statements. Critical accounting estimates are those that require management’s most difficult, complex, or subjective judgments and have the most potential to impact our financial position and operating results. We consider the following accounting policies and related estimates to be critical with regard to our status as an investment company and as an operating company:
Revenue Recognition—Applicable under Both Investment Company Accounting and Operating Company Accounting
Innovation Consulting Services
Related to the Company’s Strategos division, revenues on fixed fee contracts are recognized on a pro rata basis based upon costs incurred to date compared to total estimated contract costs. Prior to the commencement of a client engagement, the Company and the client agree on fees for services based upon the scope of the project, staffing requirements and the level of client involvement. Total revenues are comprised of professional fees for services rendered to clients plus reimbursement of out-of-pocket expenses and exclude applicable taxes.
Service revenue recognition inherently involves a degree of estimation. Examples of important estimates in this area include determining the level of effort required to execute the project, calculating costs incurred and assessing our progress toward project completion on an ongoing basis. These estimates can materially affect our revenues and earnings and require us to make judgments about matters that are uncertain. We utilize a number of management processes to monitor project performance and revenue recognition including periodic reviews of the progress of each project against the budget and staff and resource usage. From time to time, as part of our normal management process, circumstances are identified that require us to revise our estimates of the timing of revenues to be realized on a project. To the extent that a revised estimate affects revenue previously recognized, we record the full effect of the revision in the period when the underlying facts become known.
Related to the Company’s Social Technologies division, the Company has certain other consulting revenue for which vendor specific objective evidence is not available to allocate among the respective deliverables. Accordingly, the Company recognizes consulting services revenue at the point when all the deliverables associated with the consulting contract have been provided to the customer. Before the Company recognizes revenue, we require evidence of an agreement with the customer, delivery of the product or services, a fixed fee arrangement, collectability must be reasonably assured and receipt is probable. Collectability is determined on a customer-by-customer basis.
Time-and-expense billing arrangements generally require the client to pay based on the number of hours worked by our consulting professionals at agreed-upon rates. Time-and-expense revenues are billed and recognized as incurred.
Sale of Technology Rights
A sale of technology rights refers to the process by which externally developed technologies are licensed to client companies for potential development and use. Historically, we primarily received illiquid securities in our client companies in connection with the sale of technology rights. The securities received were generally subject to restrictions on resale and generally were thinly traded or had no established market. Revenue for the sale of technology rights was based on the fair value of the securities received on the date of completion of the sale contract. The valuation of these securities at fair value is further discussed in the following section “Valuation Methodology for Portfolio Investments—Applicable under Investment Company Accounting.”
35
Table of Contents
Subscription and Other Services
Revenue from the sale of subscriptions to the Company’s websites generally is received in the form of cash and initially is deferred and subsequently recognized ratably over the term of the subscription, which is typically one year.
Valuation Methodology for Portfolio Investments—Applicable under Investment Company Accounting
Historically, we primarily received illiquid securities in connection with both our global technology licensing agreements and technology transfers. The securities received were generally subject to restrictions on resale and generally are thinly traded or have no established market.
We determine fair value to be the amount for which an investment could be exchanged in an orderly disposition over a reasonable period of time between willing parties other than in a forced or liquidation sale. Our valuation process is intended to provide a consistent basis for determining the fair value of our portfolio investments. We record unrealized depreciation on investments when we believe that an investment has become impaired, including where realization of an equity security is doubtful. We record unrealized appreciation if we believe that the underlying portfolio company has appreciated in value and, therefore, our equity security has also appreciated in value. Upon the sale of our investments, the values that are ultimately realized may be different from the presently determined fair values of such securities. This difference could be material.
We adopted the standards in ASC Topic 820 Fair Value Measurements and Disclosures on a prospective basis in the first quarter of 2008. These standards require us to assume that the portfolio investment is to be sold in the principal market to market participants, or in the absence of a principal market, the most advantageous market, which may be a hypothetical market. Market participants are defined as buyers and sellers in the principal or most advantageous market that are independent, knowledgeable, and willing and able to transact. In accordance with the standards, we have considered our principal market, or the market in which we exit our portfolio investments with the greatest volume and level of activity.
All portfolio investments recorded at fair value are categorized based upon the level of judgment associated with the inputs used to measure their fair value. Hierarchical levels related to the amount of subjectivity associated with the inputs to fair valuation of these assets, are as follows:
| • | Level 1—Unadjusted quoted prices in active markets for identical assets or liabilities. |
| • | Level 2—Quoted prices in active markets for similar assets or liabilities, or quoted prices for identical or similar assets or liabilities in markets that are not active, or inputs other than quoted prices that are observable for the asset or liability. |
| • | Level 3—Unobservable inputs for the asset of liability. |
Investment in our portfolio companies are classified within Level 2 of the fair value hierarchy as of December 31, 2008. Our equity interests in portfolio companies for which there is no liquid public market are valued using quoted market prices for identical or similar instruments in markets that are not active. The determined values are generally discounted to account for the illiquid nature of the investment and minority ownership positions. The value of our equity interests in portfolio companies for which market quotations are readily available is based on quoted market prices for similar instruments in an active market. These securities are generally thinly traded and/or carry discounts from the public market value for certain restrictions on resale.
The fair value of our investments at December 31, 2008 was determined by our Board of Directors. At December 31, 2008, we received valuation assistance from an independent valuation firm on our entire portfolio of investments. As an investment company, our Board of Directors is ultimately responsible for valuing our investments in good faith.
36
Table of Contents
Net Realized Gains or Losses and Net Change in Unrealized Appreciation or Depreciation for Portfolio Investments—Applicable under Investment Company Accounting
Realized gains or losses are measured by the difference between the net proceeds from the repayment or sale and the original cost basis of the investment without regard to unrealized appreciation or depreciation previously recognized. The original cost basis of the securities received in connection with our global technology licensing agreements and technology transfers is equal to the amount of revenue recognized upon the receipt of such securities. Net change in unrealized appreciation or depreciation of investments through September 30, 2009 reflects the change in portfolio investment values during the reporting period, including the reversal of previously recorded unrealized appreciation or depreciation when gains or losses are realized.
Valuation Methodology for Available-for-Sale Securities—Applicable under Operating Company Accounting
All investments recorded at fair value are categorized based upon the level of judgment associated with the inputs used to measure their fair value. Hierarchical levels related to the amount of subjectivity associated with the inputs to fair valuation of these assets, are as follows:
| • | Level 1—Unadjusted quoted prices in active markets for identical assets or liabilities. |
| • | Level 2—Quoted prices in active markets for similar assets or liabilities, or quoted prices for identical or similar assets or liabilities in markets that are not active, or inputs other than quoted prices that are observable for the asset or liability. |
| • | Level 3—Unobservable inputs for the asset of liability. |
The Company’s investments are classified within Level 2 of the fair value hierarchy. Our equity interests in companies for which there is no liquid public market are valued using quoted market prices for identical or similar instruments in markets that are not active. The determined values are generally discounted to account for the illiquid nature of the investment and minority ownership positions. The value of our equity interests in public companies for which market quotations are readily available is based on quoted market prices for similar instruments in an active market. These securities are generally thinly traded and/or carry discounts from the public market value for certain restrictions on resale. The Company utilizes the assistance of a third-party valuation firm in determining these values.
Stock-Based Compensation—Applicable under Both Investment Company Accounting and Operating Company Accounting
We account for stock option grants in accordance with US GAAP. Stock-based compensation cost recognized during the years ended December 31, 2009, 2008 and 2007 includes compensation cost for all share-based payments granted prior to, but not yet vested as of January 1, 2006 and compensation cost for all share-based payments granted subsequent to January 1, 2006, based on their relative grant date fair values estimated in accordance with US GAAP. The Company recognizes compensation expense on a straight-line basis over the requisite service period.
Determination of the fair values of stock option grants at the grant date requires judgment, including estimating the expected term of the relevant grants and the expected volatility of the Company’s stock. Additionally, management must estimate the amount of stock option grants that are expected to be forfeited. The expected term of options granted represents the period of time that the options are expected to be outstanding and is based on historical experience of similar grants, giving consideration to the contractual terms of the grants, vesting schedules and expectations of future employee behavior. The expected volatility is based upon our historical market price at consistent points in a period equal to the expected life of the options. Expected forfeitures are based on historical experience and expectations of future employee behavior.
37
Table of Contents
Purchase Price Allocation Process for Business Combinations—Applicable under Both Investment Company Accounting and Operating Company Accounting
We determine and allocate the purchase price of an acquired company to the tangible and intangible assets acquired and liabilities assumed as of the business combination date in accordance with US GAAP for business combinations. The purchase price allocation process requires us to use significant estimates and assumptions, including fair value estimates, as of the business combination date.
While we use our best estimates and assumptions as a part of the purchase price allocation process to accurately value assets acquired and liabilities assumed at the business combination date, our estimates and assumptions are inherently uncertain and subject to refinement. As a result, during the purchase price allocation period, which is generally one year from the business combination date, we record adjustments to the assets acquired and liabilities assumed based on additional information received, with the corresponding offset to goodwill. In addition, there are contingencies based on earnings (commonly referred to as earnouts) included in some of our purchase agreements entered into during 2008. The earnout is recorded as it is earned over the contingency period, which is generally one to three years from the business combination date. With the exception of unresolved income tax matters or the earnout of contingent consideration, subsequent to the purchase price allocation period any adjustment to assets acquired or liabilities assumed is included in our operating results in the period in which the adjustment is determined.
In January 2009, the Company adopted new US GAAP for business combinations, which requires a number of changes, including changes in the way assets and liabilities are recognized as a result of business combinations. This new US GAAP requires that more assets and liabilities assumed be measured at fair value as of the acquisition date and that liabilities related to contingent consideration be re-measured at fair value in each subsequent reporting period. It also requires the capitalization of in-process research and development at fair value and requires the expensing of acquisition-related costs as incurred. The impact of the adoption of this new US GAAP for business combinations will depend on the nature of acquisitions completed after the date of adoption.
Carrying Values of Goodwill and Intangible Assets—Applicable under Both Investment Company Accounting and Operating Company Accounting
Goodwill represents the excess of the aggregate consideration paid for an acquisition over the fair value of the net tangible and intangible assets acquired. Intangible assets represent the cost of trade marks, trade names, websites, customer lists, non-compete agreements, and proprietary processes and software obtained in connection with certain of these acquisitions. Intangible assets with finite lives are amortized on a straight-line basis over their estimated useful lives, which range from 5 to 12 years. In accordance with US GAAP, goodwill and intangible assets determined to have indefinite lives are not subject to amortization but are tested for impairment annually, or more frequently if events or changes in circumstances indicate a potential impairment may have occurred. Circumstances that may indicate impairment include qualitative factors such as an adverse change in the business climate, loss of key personnel, and unanticipated competition. Additionally, management considers quantitative factors such as current estimates of the future profitability of the Company’s reporting units, the current stock price, and the Company’s market capitalization compared to its book value. In conducting its impairment test, the Company compares the fair value of each of its reporting units to the related book value. If the fair value of a reporting unit exceeds its net book value, long-lived assets are considered not to be impaired. If the net book value of a reporting unit exceeds it fair value, an impairment loss is measured and recognized. The Company conducts its impairment test using balances as of December 31.
The Company accounts for long-lived assets, including intangibles that are amortized, in accordance with US GAAP, which requires that all long-lived assets be reviewed for impairment whenever events or circumstances indicate that the carrying amount of an asset may not be recoverable. If indicators of impairment are present, reviews are performed to determine whether the carrying value of an asset to be held and used is
38
Table of Contents
impaired. Such reviews involve a comparison of the carrying amount of an asset to future net undiscounted cash flows expected to be generated by the asset over its remaining useful life. If the comparison indicates that there is impairment, the impaired asset is written down to its fair value. The impairment to be recognized as a non-cash charge to earnings is measured by the amount by which the carrying amount of the asset exceeds the fair value of the asset. Assets to be disposed are reported at the lower of the carrying amount or fair value, less cost to dispose.
As a result of significant declines in revenues related to its futures and foresight projects, management determined that there was possible goodwill and intangible asset impairment for our Social Technologies reporting unit. Therefore, interim impairment testing was performed as of June 30, 2009. The state of the economy early in 2009 contributed to potential Social Technologies’ clients focusing on short-term survival rather than long-term foresight planning. As a result, management terminated the majority of this division’s employees in favor of an independent, network-based approach in an effort to reduce overhead. Management concluded that this division suffered a significant adverse change in the business, which included a projection of continuing operating and cash flow losses. The Company determined that there was impairment of this division’s purchased intangible assets of $1.0 million and impairment of the division’s goodwill of $1.3 million. This impairment loss is included in the Company’s consolidated statement of operations for the nine months ended September 30, 2009. Based on our annual impairment analysis completed with the assistance of our independent valuation firm, we determined that no additional impairment exists at December 31, 2009.
Derivative Liability—Applicable under Operating Company Accounting
US GAAP requires bifurcation of embedded derivative instruments and measure of their fair value for accounting purposes. In addition, freestanding derivative instruments such as certain warrants are also derivative liabilities. We estimate the fair value of these instruments using the Black-Scholes option pricing model, which takes into account a variety of factors that require judgment, including estimating the expected term of the warrants and the expected volatility of the Company’s stock price. The expected term of the warrants represents the period of time that they are expected to be outstanding and is based on the contractual term of the warrants and expectations of the warrants holders’ behavior. The expected volatility is based upon our historical market price at consistent points in a period equal to the expected life of the warrants. Derivative liabilities are recorded at fair value at inception and then are adjusted to reflect fair value at the end of each quarter, with any increase or decrease in the fair value being recorded in results of operations as a component of other (income) expense.
At December 31, 2009, we had a derivative instrument related to our issuance of a Note and Warrant Purchase Agreement as further discussed in Note 7 to the consolidated financial statements contained elsewhere in this annual report on Form 10-K. The warrants have features that make their exercise price variable. We used the Black-Scholes model to determine the fair value of these warrants at inception, which resulted in a derivative liability of approximately $555,000. We used the Black-Scholes model to determine the fair value of the warrants again as of December 31, 2009, which resulted in a derivative liability of approximately $665,000. The increase in the fair value of the derivative liability from inception is primarily related to the increase in the market price of our stock during the period.
Recently Issued Accounting Pronouncements
In October 2009, the Financial Accounting Standards Board (“FASB”) issued an update to existing guidance on revenue recognition for arrangements with multiple deliverables. This update will allow companies to allocate consideration received for qualified separate deliverables using estimated selling price for both delivered and undelivered items when vendor-specific objective evidence or third-party evidence is unavailable. Additional disclosures discussing the nature of multiple element arrangements, the types of deliverables under the arrangements, the general timing of their delivery, and significant factors and estimates used to determine estimated selling prices are required. We will adopt this update for new revenue arrangements entered into or materially modified beginning January 1, 2011. The adoption of this update is not expected to have a material impact on our consolidated financial statements.
39
Table of Contents
| Item 7A. | Quantitative and Qualitative Disclosures about Market Risk |
Market risk is the risk of loss arising from adverse changes in market rates and prices. We are primarily exposed to market risks from changes in foreign exchange rates, changes in the market value of our investments and changes in our stock price.
Approximately 17% of our revenues and expenses are generated internationally in the United Kingdom and are typically denominated in the local currency. Accordingly, our U.K. subsidiary uses the local currency as their functional currency. Our international business is subject to risks typical of any international business, including, but not limited to, differing economic conditions, changes in political climate, differing tax structures, other regulations and restrictions and foreign exchange rate volatility. Our future results could be materially adversely impacted by changes in these or other factors.
The financial statements of our U.K. business are denominated in the local currency. As a result, we are also exposed to foreign exchange rate fluctuations as the financial results of foreign subsidiaries are translated into U.S. dollars in consolidation. As exchange rates fluctuate, these results, when translated, may vary from expectations and adversely impact overall expected results and profitability. We have not historically used hedging instruments to protect ourselves against foreign exchange risk because the effect on the Company has been immaterial to our operating results.
We performed a sensitivity analysis as of December 31, 2009 assuming a hypothetical 10% adverse change in foreign currency exchange rates. Holding all other variables constant, the analysis indicated that such a market movement would affect our income from operations by approximately $216,000. However, actual gains and losses in the future could differ materially from this analysis based on the timing and amount of both foreign currency exchange rate movements and our actual exposure.
Equity price risk arises from exposure to securities that represent an ownership interest in our investments. The value of our marketable equity securities are based on quoted market prices. Market prices of common equity securities, in general, are subject to fluctuations, which could cause the amount to be realized upon the sale of the instruments to differ significantly from the current reported value. The fluctuations may result from perceived changes in the underlying economic characteristics of our investments, the relative price of alternative investments, general market conditions and supply and demand imbalances for a particular security.
The Company invests its cash in highly liquid investments with original maturities of three months or less as well as in other short-term debt instruments. We have not used derivative financial instruments in fiscal year 2009 to alter the interest rate characteristics of our investment holdings. We have concluded that we do not have material market risk exposure with regard to these investments.
In connection with the Note and Warrant Purchase Agreement we entered into on October 22, 2009 as further discussed in Note 7 to the consolidated financial statements contained elsewhere in this annual report on Form 10-K, we issued warrants to allow the Lender to purchase up to 437,500 shares of our common stock at any time until October 22, 2014. These warrants are considered an embedded derivative instrument. US GAAP requires bifurcation of embedded derivative instruments and measure of their fair value for accounting purposes. We estimate the fair value of this derivative instrument using the Black-Scholes option pricing model, which takes into account a variety of factors, including historical stock price volatility, risk-free interest rates, remaining term and the closing price of our common stock. Changes in the assumptions used to estimate the fair value of these derivative instruments could result in a material change in the fair value of the instruments.
We performed an analysis as of December 31, 2009 assuming a hypothetical $1, $2 and $3 change in our stock price. Holding all other variables constant, the analysis indicated that such market movements would affect our income from operations by approximately $324,000, $677,000 and $1,050,000, respectively. However, actual gains and losses in the future could differ materially from this analysis.
40
Table of Contents
| Item 8. | Financial Statements and Supplementary Data |
UTEK CORPORATION
INDEX TO CONSOLIDATED FINANCIAL STATEMENTS AND SCHEDULES
41
Table of Contents
REPORT OF INDEPENDENT REGISTERED PUBLIC ACCOUNTING FIRM
Board of Directors
UTEK Corporation and Subsidiaries
Tampa, Florida
We have audited the accompanying consolidated balance sheet of UTEK Corporation and subsidiaries (the “Company”) as of December 31, 2009 and the related consolidated statements of operations and comprehensive income (loss), and cash flows for the three months ended December 31, 2009 and the nine months ended September 30, 2009, and the statement of changes in net assets for the nine months ended September 30, 2009. We have audited the accompanying consolidated statement of stockholders’ equity and comprehensive income (loss) for the year ended December 31, 2009. We have also audited the accompanying consolidated statement of assets and liabilities of the Company including the schedule of investments as of December 31, 2008 and the related consolidated statements of operations, cash flows and changes in net assets for the two years ended December 31, 2008 and 2007. These consolidated financial statements are the responsibility of the Company’s management. Our responsibility is to express an opinion on these consolidated financial statements based on our audits.
We conducted our audits in accordance with the standards of the Public Company Accounting Oversight Board (United States). Those standards require that we plan and perform the audit to obtain reasonable assurance about whether the consolidated financial statements are free of material misstatement. An audit includes examining, on a test basis, evidence supporting the amounts and disclosures in the consolidated financial statements. An audit also includes assessing the accounting principles used and significant estimates made by management, as well as evaluating the overall consolidated financial statement presentation. We believe that our audits provide a reasonable basis for our opinion.
In our opinion, the consolidated financial statements and schedule of investments referred to above present fairly, in all material respects, the financial position of the Company as of December 31, 2009 and 2008 and the results of its operations and cash flows for the three month period ended December 31, 2009, the nine month period ended September 30, 2009, and the two years ended December 31, 2008 and 2007 in conformity with accounting principles generally accepted in the United States of America.
We have also audited, in accordance with the standards of the Public Company Accounting Oversight Board (United States), the Company’s internal control over financial reporting as of December 31, 2009, based on criteria established in Internal Control—Integrated Framework issued by the Committee of Sponsoring Organizations of the Treadway Commission and our report dated March 22, 2010 expressed an unqualified opinion thereon.
Effective October 1, 2009, the Company filed a notification with the Securities and Exchange Commission withdrawing its election to be regulated as a business development company pursuant to the Investment Company Act of 1940, as more fully discussed in Note 1 to the consolidated financial statements.
| /s/ PENDER NEWKIRK & COMPANY |
| Pender Newkirk & Company LLP |
| Certified Public Accountants |
Tampa, Florida
March 22, 2010
42
Table of Contents
REPORT OF MANAGEMENT ON INTERNAL CONTROL OVER FINANCIAL REPORTING
UTEK Corporation
Management of the Company is responsible for establishing and maintaining adequate internal control over financial reporting as such term is defined in Rule 13a-15(f) under the Securities Exchange Act of 1934 (“Exchange Act”). The Company’s internal control over financial reporting is designed to provide reasonable assurance regarding the reliability of financial reporting and the preparation of the consolidated financial statements. Because of its inherent limitations, internal control over financial reporting may not prevent or detect misstatements and even when determined to be effective, can only provide reasonable assurance with respect to financial statement preparation and presentation.
Management assessed the effectiveness of the Company’s internal control over financial reporting as of December 31, 2009. In making this assessment, management used the criteria set forth by the Committee of Sponsoring Organizations of the Treadway Commission (COSO), in Internal Control—Integrated Framework. Based on our assessment, management believes that the Company maintained effective internal control over financial reporting as of December 31, 2009.
Our internal control over financial reporting as of December 31, 2009 has been audited by Pender Newkirk & Company LLP, an independent registered public accounting firm, as stated in their report which is included herein.
43
Table of Contents
REPORT OF INDEPENDENT REGISTERED PUBLIC ACCOUNTING FIRM ON INTERNAL CONTROL OVER FINANCIAL REPORTING
Board of Directors
UTEK Corporation and Subsidiaries
Tampa, Florida
We have audited the internal control over financial reporting of UTEK Corporation and Subsidiaries (the “Company”) as of December 31, 2009, based on criteria established in Internal Control—Integrated Framework issued by the Committee of Sponsoring Organizations of the Treadway Commission (the COSO criteria). The Company’s management is responsible for maintaining effective internal control over financial reporting and for its assessment of the effectiveness of internal control over financial reporting. Our responsibility is to express an opinion on the Company’s internal control over financial reporting based on our audit.
We conducted our audit in accordance with the standards of the Public Company Accounting Oversight Board (United States). Those standards require that we plan and perform the audit to obtain reasonable assurance about whether effective internal control over financial reporting was maintained in all material respects. Our audit included obtaining an understanding of internal control over financial reporting, assessing the risk that a material weakness exists, testing and evaluating the design and operating effectiveness of internal control based on the assessed risk, and performing such other procedures as we considered necessary in the circumstances. We believe that our audit provides a reasonable basis for our opinion.
A company’s internal control over financial reporting is a process designed to provide reasonable assurance regarding the reliability of financial reporting and the preparation of financial statements for external purposes in accordance with generally accepted accounting principles. A company’s internal control over financial reporting includes those policies and procedures that (1) pertain to the maintenance of records that, in reasonable detail, accurately and fairly reflect the transactions and dispositions of the assets of the company; (2) provide reasonable assurance that transactions are recorded as necessary to permit preparation of financial statements in accordance with generally accepted accounting principles, and that receipts and expenditures of the company are being made only in accordance with authorizations of management and directors of the company; and (3) provide reasonable assurance regarding prevention or timely detection of unauthorized acquisition, use, or disposition of the company’s assets that could have a material effect on the financial statements.
Because of its inherent limitations, internal control over financial reporting may not prevent or detect misstatements. Also, projections of any evaluation of effectiveness to future periods are subject to the risk that controls may become inadequate because of changes in conditions, or that the degree of compliance with the policies or procedures may deteriorate.
In our opinion the Company maintained effective internal control over financial reporting as of December 31, 2009, in all material respects, based on the COSO criteria.
We also have audited, in accordance with the standards of the Public Company Accounting Oversight Board (United States), the consolidated balance sheet of the Company as of December 31, 2009 and the related statements of operations and comprehensive income (loss), and cash flows for the three months ended December 31, 2009 and the nine months ended September 30, 2009, and the statement of changes in net assets for the nine months ended September 30, 2009. We have audited the statement of stockholders’ equity and comprehensive income (loss) for the year ended December 31, 2009. In addition, we have audited the consolidated statement of assets and liabilities including the schedule of investments as of December 31, 2008 and the related statements of operations, cash flows and changes in net assets for each of the two years ended December 31, 2008 and 2007 and our report dated March 22, 2010 expressed an unqualified opinion thereon.
| /s/ PENDER NEWKIRK & COMPANY |
| Pender Newkirk & Company LLP |
| Certified Public Accountants |
Tampa, Florida
March 22, 2010
44
Table of Contents
Consolidated Balance Sheet (2009)/ Consolidated Statement of Assets and Liabilities (2008)
| December 31, 2009 |
December 31, 2008 |
|||||||
| ASSETS |
||||||||
| Current assets: |
||||||||
| Cash and cash equivalents |
$ | 2,118,970 | $ | 3,922,297 | ||||
| Accounts receivable, net |
1,481,548 | 2,290,363 | ||||||
| Investments: |
||||||||
| Non-affiliate investments (cost: 2008 - $36,994,463) |
— | 5,603,440 | ||||||
| Affiliate investments (cost: 2008 - $38,559,629) |
— | 3,477,200 | ||||||
| Control investments (cost: 2008 - $10,637,748) |
— | 2,987,500 | ||||||
| Certificates of deposit (cost: 2008 - $291,581) |
492,246 | 291,581 | ||||||
| Available-for-sale securities |
729,800 | — | ||||||
| Investments under cost method |
588,085 | — | ||||||
| Total investments |
1,810,131 | 12,359,721 | ||||||
| Prepaid expenses and other assets |
569,829 | 750,502 | ||||||
| Total current assets |
5,980,478 | |||||||
| Note receivable and accrued interest |
1,596,000 | — | ||||||
| Fixed assets, net |
8,388,263 | 653,208 | ||||||
| Goodwill |
15,874,139 | 15,246,143 | ||||||
| Intangible assets, net |
8,492,301 | 10,663,975 | ||||||
| Total assets |
$ | 40,331,181 | 45,886,209 | |||||
| LIABILITIES |
||||||||
| Current liabilities: |
||||||||
| Accounts payable |
$ | 454,509 | 575,988 | |||||
| Accrued expenses |
462,802 | 995,652 | ||||||
| Accrued severance liability |
876,400 | 1,651,814 | ||||||
| Deferred revenue |
1,634,096 | 2,849,270 | ||||||
| Current maturities of long-term debt |
975,360 | — | ||||||
| Derivative liability |
664,972 | — | ||||||
| Total current liabilities |
5,068,139 | |||||||
| Long-term debt, less current maturities |
5,353,892 | 839,765 | ||||||
| Deferred tax liability |
1,303,031 | 1,773,441 | ||||||
| Total liabilities |
11,725,062 | 8,685,930 | ||||||
| Net assets |
$ | 37,200,279 | ||||||
| STOCKHOLDERS’ EQUITY/ COMPOSITION OF NET ASSETS: |
||||||||
| Preferred stock, $.01 par value, 1,000,000 shares authorized; none issued and outstanding |
— | — | ||||||
| Common stock, $.01 par value, 29,000,000 shares authorized; 12,286,768 and 12,134,959 shares issued; 11,797,140 and 10,879,900 shares outstanding at December 31, 2009 and 2008, respectively |
117,971 | $ | 108,800 | |||||
| Additional paid-in capital |
81,010,460 | 75,067,857 | ||||||
| Accumulated income (loss) under Investment Company Accounting: |
||||||||
| Accumulated net operating income |
23,463,295 | |||||||
| Net realized loss on investments, net of income taxes |
(7,744,736 | ) | ||||||
| Net unrealized depreciation of investments, net of deferred income taxes |
(51,921,150 | ) | ||||||
| Foreign currency translation adjustment |
(1,773,787 | ) | ||||||
| Total accumulated loss under Investment Company Accounting |
(52,073,915 | ) | ||||||
| Accumulated income (deficit) under Operating Company Accounting: |
||||||||
| Accumulated deficit |
(624,006 | ) | — | |||||
| Accumulated other comprehensive income (loss) |
175,609 | — | ||||||
| Total stockholders’ equity/ Net assets |
28,606,119 | $ | 37,200,279 | |||||
| Total liabilities and stockholders’ equity |
$ | 40,331,181 | ||||||
| Net asset value per share |
$ | 3.42 | ||||||
See accompanying notes
45
Table of Contents
Consolidated Statements of Operations and Comprehensive Income (Loss)
| Operating Company Accounting |
Investment Company Accounting | |||||||||||||||
| Three Months Ended Dec 31, 2009 |
Nine Months Ended Sept 30, 2009 |
Year Ended Dec 31, 2008 |
Year Ended Dec 31, 2007 |
|||||||||||||
| Revenue / Income from operations: |
||||||||||||||||
| Innovation consulting services |
$ | 2,190,703 | $ | 5,300,331 | $ | 11,134,855 | $ | — | ||||||||
| Sale of technology rights |
— | — | 4,684,680 | 16,372,550 | ||||||||||||
| Subscription and other services |
822,136 | 2,404,729 | 3,959,243 | 3,343,134 | ||||||||||||
| Investment income, net |
— | 59,604 | 399,341 | 585,265 | ||||||||||||
| 3,012,839 | 7,764,664 | 20,178,119 | 20,300,949 | |||||||||||||
| Expenses: |
||||||||||||||||
| Direct costs of innovation consulting services |
1,337,491 | 4,967,243 | 10,124,462 | — | ||||||||||||
| Acquisition of technology rights |
— | — | 1,780,000 | 3,815,844 | ||||||||||||
| Salaries and wages |
526,950 | 4,768,390 | 6,153,771 | 3,518,769 | ||||||||||||
| Professional fees |
164,570 | 649,723 | 1,257,307 | 1,358,668 | ||||||||||||
| Sales and marketing |
639,993 | 1,067,116 | 2,322,406 | 2,035,860 | ||||||||||||
| General and administrative |
470,030 | 2,286,193 | 3,781,008 | 2,625,559 | ||||||||||||
| Depreciation and amortization |
409,087 | 1,206,777 | 1,096,490 | 212,350 | ||||||||||||
| Impairment loss |
— | 2,368,458 | — | 210,140 | ||||||||||||
| 3,548,121 | 17,313,900 | 26,515,444 | 13,777,190 | |||||||||||||
| Other (income) and expense: |
||||||||||||||||
| Other (income) expense |
69,731 | |||||||||||||||
| Interest expense, net |
85,467 | |||||||||||||||
| 155,198 | ||||||||||||||||
| (Loss) income before income taxes |
(690,480 | ) | (9,549,236 | ) | (6,337,325 | ) | 6,523,759 | |||||||||
| Provision for income taxes |
(66,474 | ) | (208,585 | ) | 3,697,487 | 2,747,017 | ||||||||||
| Net (loss) income from operations |
(624,006 | ) | (9,340,651 | ) | (10,034,812 | ) | 3,776,742 | |||||||||
| Net realized and unrealized gains (losses) from investment company activity: |
||||||||||||||||
| Net realized losses on investments, net of income tax benefit |
(49,591,193 | ) | (4,232,138 | ) | (1,447,380 | ) | ||||||||||
| Net change in unrealized appreciation (depreciation) of investments, net of deferred tax expense (benefit) |
44,292,068 | (12,217,977 | ) | (10,806,048 | ) | |||||||||||
| Net loss/ Net decrease in net assets from operations |
$ | (624,006 | ) | $ | (14,639,776 | ) | $ | (26,484,927 | ) | $ | (8,476,686 | ) | ||||
| Other comprehensive gain (loss): |
||||||||||||||||
| Unrealized gain (loss) from available-for-sale securities |
(70,946 | ) | ||||||||||||||
| Cumulative translation adjustment |
246,555 | |||||||||||||||
| Comprehensive income (loss) |
$ | (448,397 | ) | |||||||||||||
| Net loss/ Net decrease in net assets from operations per share: |
||||||||||||||||
| Basic and diluted |
$ | (0.05 | ) | $ | (1.30 | ) | $ | (2.66 | ) | $ | (0.94 | ) | ||||
| Weighted average shares: Basic and diluted |
11,605,373 | 11,257,663 | 9,947,221 | 8,989,234 | ||||||||||||
| Dividend declared or paid per share: |
— | — | — | — | ||||||||||||
See accompanying notes
46
Table of Contents
Consolidated Statement of Stockholders’ Equity (Deficit) and Comprehensive Income (Loss)
| Investment Company Accounting | Operating Company Accounting | |||||||||||||||||||||||||||||||||||||||||||||
| Common Stock | Accumulated Net Operating Income |
Net Realized Loss on Investments |
Net Unrealized Depreciation of investments |
Foreign Currency Translation Adjustment |
Total Accumulated Loss under Investment Company Accounting |
Comprehensive Income (Loss) |
Accumulated Deficit |
Accumulated Other Comprehensive Income (Loss) |
||||||||||||||||||||||||||||||||||||||
| Shares Issued | Shares Outstanding |
Par Value | Paid-In Capital | Totals | ||||||||||||||||||||||||||||||||||||||||||
| Balances at January 1, 2007 |
8,936,009 | 8,936,009 | $ | 89,361 | $ | 51,993,822 | $ | 29,721,366 | $ | (2,065,218 | ) | $ | (28,897,125 | ) | $ | 138,956 | $ | 50,981,162 | ||||||||||||||||||||||||||||
| Employee stock options exercised |
75,267 | 75,267 | 753 | 541,928 | — | — | — | — | 542,681 | |||||||||||||||||||||||||||||||||||||
| Stock-based compensation expense |
— | — | — | 612,893 | — | — | — | — | 612,893 | |||||||||||||||||||||||||||||||||||||
| Cumulative translation adjustment |
14,498 | 14,498 | ||||||||||||||||||||||||||||||||||||||||||||
| Change in net assets |
— | — | — | — | 3,776,742 | (1,447,380 | ) | (10,806,048 | ) | (8,476,686 | ) | |||||||||||||||||||||||||||||||||||
| Balances at December 31, 2007 |
9,011,276 | 9,011,276 | $ | 90,114 | $ | 53,148,643 | $ | 33,498,108 | $ | (3,512,598 | ) | $ | (39,703,173 | ) | $ | 153,454 | $ | 43,674,548 | ||||||||||||||||||||||||||||
| Employee stock options exercised |
31,015 | 31,015 | 310 | 189,484 | — | — | — | — | 189,794 | |||||||||||||||||||||||||||||||||||||
| Stock-based compensation expense |
— | — | — | 779,865 | — | — | — | — | 779,865 | |||||||||||||||||||||||||||||||||||||
| Acquisition of Pharmalicensing, Ltd. |
153,967 | 153,967 | 1,540 | 2,148,460 | — | — | — | — | 2,150,000 | |||||||||||||||||||||||||||||||||||||
| Acquisition of Strategos |
1,248,960 | 502,970 | 5,030 | 6,035,640 | — | — | — | — | 6,040,670 | |||||||||||||||||||||||||||||||||||||
| Acquisition of Innovaro Ltd. |
691,714 | 345,857 | 3,458 | 3,660,855 | — | — | — | — | 3,664,313 | |||||||||||||||||||||||||||||||||||||
| Acquisition of Social Technologies Group, Inc. |
998,027 | 499,014 | 4,990 | 5,083,448 | — | — | — | — | 5,088,438 | |||||||||||||||||||||||||||||||||||||
| Earnout accruals for all companies |
— | 335,801 | 3,358 | 4,021,462 | — | — | — | — | 4,024,820 | |||||||||||||||||||||||||||||||||||||
| Cumulative translation adjustment |
(1,927,241 | ) | (1,927,241 | ) | ||||||||||||||||||||||||||||||||||||||||||
| Change in net assets |
— | — | — | — | (10,034,812 | ) | (4,232,138 | ) | (12,217,977 | ) | (26,484,927 | ) | ||||||||||||||||||||||||||||||||||
| Balances at December 31, 2008 |
12,134,959 | 10,879,900 | $ | 108,800 | $ | 75,067,857 | $ | 23,463,295 | $ | (7,744,736 | ) | $ | (51,921,150 | ) | $ | (1,773,787 | ) | $ | 37,200,279 | |||||||||||||||||||||||||||
| Stock-based compensation expense |
— | — | — | 438,217 | — | — | — | — | 438,217 | |||||||||||||||||||||||||||||||||||||
| Common stock issued to acquire interest in a subsidiary of UTEK Real Estate Holdings, Inc. |
176,470 | 176,470 | 1,765 | 1,498,235 | — | — | — | — | 1,500,000 | |||||||||||||||||||||||||||||||||||||
| Severance compensation paid out in escrowed shares |
— | 485,607 | 4,856 | 2,539,725 | — | — | — | — | 2,544,581 | |||||||||||||||||||||||||||||||||||||
| Earnout accruals and escrow adjustments |
(24,352 | ) | 85,950 | 858 | 505,193 | — | — | — | — | 506,051 | ||||||||||||||||||||||||||||||||||||
| Cumulative translation adjustment |
542,239 | 542,239 | ||||||||||||||||||||||||||||||||||||||||||||
| Change in net assets |
— | — | — | — | (9,340,651 | ) | (49,591,193 | ) | 44,292,068 | (14,639,776 | ) | |||||||||||||||||||||||||||||||||||
| Balances at September 30, 2009 |
12,287,077 | 11,627,927 | $ | 116,279 | $ | 80,049,227 | $ | 14,122,644 | $ | (57,335,929 | ) | $ | (7,629,082 | ) | $ | (1,231,548 | ) | $ | 28,091,591 | |||||||||||||||||||||||||||
| Adoption of Operating Company Accounting on Oct 1, 2009 |
— | — | — | — | (14,122,644 | ) | 57,335,929 | 7,629,082 | 1,231,548 | $ | (52,073,915 | ) | — | |||||||||||||||||||||||||||||||||
| Stock-based compensation expense |
— | — | — | 138,960 | $ | — | 138,960 | |||||||||||||||||||||||||||||||||||||||
| Earnout accruals and escrow adjustments |
(309 | ) | 169,213 | 1,692 | 822,273 | — | 823,965 | |||||||||||||||||||||||||||||||||||||||
| Unrealized gain (loss) from available-for-sale securities |
— | — | — | — | $ | (70,946 | ) | — | — | |||||||||||||||||||||||||||||||||||||
| Cumulative translation adjustment |
— | — | — | — | 246,555 | — | — | |||||||||||||||||||||||||||||||||||||||
| Other comprehensive gain (loss) |
— | — | — | — | 175,609 | — | $ | 175,609 | 175,609 | |||||||||||||||||||||||||||||||||||||
| Comprehensive income (loss) |
— | — | — | — | $ | 175,609 | — | — | — | |||||||||||||||||||||||||||||||||||||
| Net income (loss) |
— | — | — | — | (624,006 | ) | — | (624,006 | ) | |||||||||||||||||||||||||||||||||||||
| Balances at December 31, 2009 |
12,286,768 | 11,797,140 | $ | 117,971 | $ | 81,010,460 | $ | (52,073,915 | ) | $ | (624,006 | ) | $ | 175,609 | $ | 28,606,119 | ||||||||||||||||||||||||||||||
See accompanying notes
47
Table of Contents
Consolidated Statements of Cash Flows
| Operating Company Accounting |
Investment Company Accounting | |||||||||||||||
| Three Months Ended Dec 31, 2009 |
Nine Months Ended Sept 30, 2009 |
Year Ended Dec 31, 2008 |
Year Ended Dec 31, 2007 |
|||||||||||||
| Operating Activities: |
||||||||||||||||
| Net loss/ Net decrease in net assets from operations |
$ | (624,006 | ) | $ | (14,639,776 | ) | $ | (26,484,927 | ) | $ | (8,476,686 | ) | ||||
| Adjustments to reconcile net loss/ net decrease in net assets from operations to net cash flows from operating activities: |
||||||||||||||||
| Change in net unrealized appreciation (depreciation) of investments from investment company activity |
— | (44,292,068 | ) | 10,466,219 | 17,325,713 | |||||||||||
| Loss on sale of investments from investment company activity |
— | 49,591,193 | 6,785,540 | 2,320,637 | ||||||||||||
| Proceeds from sale of equity investments from investment company activity |
— | 681,727 | 2,265,430 | 1,923,528 | ||||||||||||
| Net proceeds from sale (purchases) of short-term investments from investment company activity |
— | (198,420 | ) | 1,206,766 | 3,086,305 | |||||||||||
| Net repayment from (investment in) UTEK Real Estate |
— | — | 1,965,261 | (783,789 | ) | |||||||||||
| Depreciation and amortization |
409,087 | 1,206,777 | 1,096,490 | 212,350 | ||||||||||||
| Amortization of debt discount from investor warrants |
35,478 | — | — | — | ||||||||||||
| Goodwill and intangible asset impairment |
— | 2,368,458 | — | 210,140 | ||||||||||||
| Loss on sale of available-for-sale securities |
(19,733 | ) | — | — | — | |||||||||||
| Loss on disposal of fixed assets |
4,131 | 67,062 | 13,448 | 22,403 | ||||||||||||
| Loss on derivative liability |
110,000 | — | — | — | ||||||||||||
| Bad debt expense |
8,398 | 35,151 | 78,150 | 364,586 | ||||||||||||
| Stock-based compensation |
138,960 | 438,217 | 779,865 | 612,893 | ||||||||||||
| Severance compensation paid out in escrowed shares |
— | 2,544,580 | — | — | ||||||||||||
| Deferred income taxes |
(66,474 | ) | (208,585 | ) | 2,870,820 | (4,645,904 | ) | |||||||||
| Investment securities received in connection with the sale of technology rights |
— | — | (4,559,680 | ) | (16,172,550 | ) | ||||||||||
| Consulting and other services rendered in exchange for investment securities |
— | — | (45,269 | ) | (1,021,117 | ) | ||||||||||
| Changes in operating assets and liabilities: |
||||||||||||||||
| Accounts receivable |
183,028 | 985,238 | 1,749,091 | 124,231 | ||||||||||||
| Prepaid expenses and other assets |
(53,095 | ) | 324,374 | (126,445 | ) | (3,241 | ) | |||||||||
| Deferred revenue |
(734,928 | ) | (836,752 | ) | (577,448 | ) | (222,059 | ) | ||||||||
| Accounts payable and accrued expenses |
(533,050 | ) | (642,577 | ) | 183,762 | 363,920 | ||||||||||
| Net cash flows from operating activities |
(1,142,204 | ) | (2,575,401 | ) | (2,332,927 | ) | (4,758,640 | ) | ||||||||
| Investing Activities: |
||||||||||||||||
| Capital expenditures |
(7,643 | ) | (7,006 | ) | (23,772 | ) | (50,042 | ) | ||||||||
| Cash received (paid) in connection with consolidation/ acquisitions |
23,170 | (292,468 | ) | 813,211 | — | |||||||||||
| Proceeds from sale of available-for-sale securities |
452,708 | — | — | — | ||||||||||||
| Net cash flows from investing activities |
468,235 | (299,474 | ) | 789,439 | (50,042 | ) | ||||||||||
| Financing Activities: |
||||||||||||||||
| Net increase in line of credit |
— | 250,000 | — | — | ||||||||||||
| Proceeds from exercise of stock options |
— | — | 189,794 | 542,681 | ||||||||||||
| Proceeds from debt financing |
1,750,000 | — | — | — | ||||||||||||
| Distributions to stockholders |
— | — | — | (179,032 | ) | |||||||||||
| Payments on notes payable and other debt |
(80,720 | ) | (198,791 | ) | (12,248 | ) | — | |||||||||
| Net cash flows from financing activities |
1,669,280 | 51,209 | 177,546 | 363,649 | ||||||||||||
| Effect of foreign exchange rates |
4,500 | 20,528 | 33,663 | 14,498 | ||||||||||||
| Increase (decrease) in cash and cash equivalents |
999,811 | (2,803,138 | ) | (1,332,279 | ) | (4,430,535 | ) | |||||||||
| Cash and cash equivalents at beginning of period |
1,119,159 | 3,922,297 | 5,254,576 | 9,685,111 | ||||||||||||
| Cash and cash equivalents at end of period |
$ | 2,118,970 | $ | 1,119,159 | $ | 3,922,297 | $ | 5,254,576 | ||||||||
See accompanying notes
48
Table of Contents
UTEK Corporation
Consolidated Statements of Cash Flows (continued)
| Three Months Ended Dec 31, 2009 |
Nine Months Ended Sept 30, 2009 |
Year Ended Dec 31, 2008 |
Year Ended Dec 31, 2007 | |||||||||
| Supplemental Disclosures of Non-Cash Investing and Financing Activities |
||||||||||||
| The Company issued 153,967 shares of common stock to purchase Pharmalicensing Limited. In conjunction with the acquisition, liabilities were assumed as follows: |
||||||||||||
| Fair value of assets acquired |
$ | 2,534,197 | ||||||||||
| Less: Fair value of common stock issued |
2,150,000 | |||||||||||
| Liabilities assumed |
$ | 384,197 | ||||||||||
| The Company issued 502,970 shares of common stock to purchase Carmi, Inc., a 100% owned subsidiary of Strategos, LLC. In conjunction with the acquisition, liabilities were assumed as follows: |
||||||||||||
| Fair value of assets acquired |
$ | 9,339,383 | ||||||||||
| Less: Fair value of common stock issued |
6,040,669 | |||||||||||
| Less: contingent liability incurred |
1,952,340 | |||||||||||
| Liabilities assumed |
$ | 1,346,374 | ||||||||||
| The Company issued 345,857 shares of common stock to purchase Innovaro Limited. In conjunction with the acquisition, liabilities were assumed as follows: |
||||||||||||
| Fair value of assets acquired |
$ | 4,945,313 | ||||||||||
| Less: Fair value of common stock issued |
3,664,313 | |||||||||||
| Less: Foreign currency translation adjustment |
52,875 | |||||||||||
| Liabilities assumed |
$ | 1,228,125 | ||||||||||
| The Company issued 499,014 shares of common stock to purchase Social Technologies Group, Inc. In conjunction with the acquisition, liabilities were assumed as follows: |
||||||||||||
| Fair value of assets acquired |
$ | 8,782,600 | ||||||||||
| Less: Fair value of common stock issued |
5,088,438 | |||||||||||
| Liabilities assumed |
$ | 3,694,162 | ||||||||||
| The Company issued 58,338, 85,950 and 335,801 shares of common stock in connection with certain acquisition earnout contingencies |
$ | 823,965 | $ | 506,051 | $ | 4,024,820 | ||||||
| Investment securities received for unearned global technology licensing services (net) |
$ | 87,500 | $ | 280,463 | ||||||||
| The Company received a note in connection with the sale of certain investments |
$ | 1,500,000 | ||||||||||
| The Company received 100,000 shares in Technology Capital Services, LLC in connection with the sale of certain investments |
$ | 69,568 | ||||||||||
49
Table of Contents
UTEK Corporation
Consolidated Statements of Cash Flows (continued)
| Three Months Ended Dec 31, 2009 |
Nine Months Ended Sept 30, 2009 |
Year Ended Dec 31, 2008 |
Year Ended Dec 31, 2007 | ||||||||||
| The Company received 375,000 shares in Oxygen Biotherapeutics, Inc. in connection with the redemption of 750,000 warrants |
$ | 148,750 | |||||||||||
| The Company issued stock in connection with an investment in UTEK Real Estate Holdings, Inc. as follows: |
|||||||||||||
| 176,470 shares of UTEK common stock |
$ | 1,500,000 | |||||||||||
| 240,964 shares of NeoStem, Inc. common stock |
200,000 | ||||||||||||
| $ | 1,700,000 | ||||||||||||
| The consolidation of UTEK Real Estate Holdings, Inc. as of October 1, 2009 resulted in the addition of the following assets and liabilities to the balance sheet: |
|||||||||||||
| Accounts receivable |
$ | 87,921 | |||||||||||
| Cost method investments |
494,517 | ||||||||||||
| Other tangible assets |
441,696 | ||||||||||||
| Fixed assets |
8,002,162 | ||||||||||||
| Accounts payable and accrued expenses |
(104,757 | ) | |||||||||||
| Debt |
(4,184,709 | ) | |||||||||||
| Derivative liability recorded upon issuance of investor warrants |
$ | 554,972 | |||||||||||
| Cash paid for taxes |
$ | — | $ | — | $ | — | $ | — | |||||
| Cash paid for interest |
$ | 84,914 | $ | 50,206 | $ | — | $ | — | |||||
50
Table of Contents
Consolidated Statements of Changes in Net Assets
| Nine Months Ended Sept 30, 2009(1) |
Year Ended Dec 31, 2008 |
Year Ended Dec 31, 2007 |
||||||||||
| Changes in net assets from operations: |
||||||||||||
| Net (loss) income from operations |
$ | (9,340,651 | ) | $ | (10,034,812 | ) | $ | 3,776,742 | ||||
| Net realized loss on sale of investments, net of related income taxes |
(49,591,193 | ) | (4,232,138 | ) | (1,447,380 | ) | ||||||
| Change in net unrealized appreciation (depreciation) of investments, net of related deferred taxes |
44,292,068 | (12,217,977 | ) | (10,806,048 | ) | |||||||
| Net decrease in net assets from operations |
(14,639,776 | ) | (26,484,927 | ) | (8,476,686 | ) | ||||||
| Distributions to Stockholders (Paid or Declared): |
||||||||||||
| From net income from operations(2) |
— | — | — | |||||||||
| Capital stock transactions: |
||||||||||||
| Proceeds from the exercise of stock options |
— | 189,794 | 542,681 | |||||||||
| Issuance of stock options for compensation |
438,217 | 779,865 | 612,893 | |||||||||
| Severance compensation paid for in escrowed shares |
2,544,580 | — | — | |||||||||
| Common stock issued in acquisition of Pharmalicensing Ltd. |
— | 2,150,000 | — | |||||||||
| Common stock issued in acquisition of Strategos |
— | 6,040,669 | — | |||||||||
| Common stock issued in acquisition of Innovaro, Ltd. |
— | 3,664,313 | — | |||||||||
| Common stock issued in acquisition of Social Technologies Group, Inc. |
— | 5,088,438 | — | |||||||||
| Escrow shares earnout |
506,051 | 4,024,820 | — | |||||||||
| Investment in UTEK Real Estate Holdings, Inc |
1,500,000 | — | — | |||||||||
| Net increase in net assets from stock transactions |
4,988,848 | 21,937,899 | 1,155,574 | |||||||||
| Foreign currency translation adjustment |
542,240 | (1,927,241 | ) | 14,498 | ||||||||
| Net decrease in net assets |
(9,108,688 | ) | (6,474,269 | ) | (7,306,614 | ) | ||||||
| Net assets at beginning of period |
37,200,279 | 43,674,548 | 50,981,162 | |||||||||
| Net assets at end of period |
$ | 28,091,591 | $ | 37,200,279 | $ | 43,674,548 | ||||||
| (1) | Information is presented for the nine months ended September 30 of the current year because the Company ceased operating as an investment company on October 1, 2009. As an operating company, measurement of certain items included in this table is not applicable or appropriate. Therefore, certain items included in this table agree to financial statements included in the Company’s September 30, 2009 quarterly report on Form 10-Q as opposed to financial statements included in this annual report on Form 10-K. See Note 1 for further discussion of the Company’s change from an investment company to an operating company. |
| (2) | Distributions to shareholders as noted in the Consolidated Statement of Cash Flows for the year ended December 31, 2007 was accrued at December 31, 2006; therefore, it is not reflected as a distribution to shareholders for purposes of this schedule. |
See accompanying notes
51
Table of Contents
Consolidated Schedule of Investments December 31, 2008
| Shares |
Dates of Acquisition |
Non-Affiliate Investments(1) |
Original Cost Basis |
Value | Percentage of Net Assets |
||||||||
| 560,003 | 1/07 | MiMedx Group, Inc. (MiMedx, Inc.) Connective tissue technology |
$ | — | $ | 1,971,200 | 5.3 | % | |||||
| Advanced Medical Isotope Corporation(8) Medical isotope processes |
|||||||||||||
| 95,000 | 9/06 | Series A Convertible Preferred Stock |
1,803,417 | 1,750,400 | 4.7 | ||||||||
| 148,000 | 11/06-1/07 | Cyberlux Corporation LED lighting solutions Series C Convertible Preferred Stock |
2,181,640 | 1,133,400 | 3.0 | ||||||||
| 25,931,484 | 1/07 | Common Stock |
502,558 | 33,100 | 0.1 | ||||||||
| 100,000 | 4/06 | Advanced Refractive Technologies, Inc. Ophthalmic technologies Series D Convertible Preferred Stock |
1,996,176 | 140,000 | 0.4 | ||||||||
| 97,000 | 3/06 | Series C Convertible Preferred Stock |
2,066,063 | 135,800 | 0.4 | ||||||||
| 97,000 | 12/05 | Series B Convertible Preferred Stock |
1,032,675 | 70,600 | 0.2 | ||||||||
| 4,000,000 | 5/06 | Common Stock |
76,368 | 140 | <0.1 | ||||||||
| (6) | 4/07 | Oxygen Biotherapeutics, Inc.(Synthetic Blood Intn’l, Inc) Biotechnology products |
120,000 | 151,000 | 0.4 | ||||||||
| 321,020 | 6/08 | CSMG Technologies, Inc. Environmental and medical technologies |
300,300 | 81,900 | 0.2 | ||||||||
| 92,000 | 3/08 | Platina Energy Group Inc. Oil and gas exploration and production Series F Convertible Preferred Stock |
794,880 | 66,200 | 0.2 | ||||||||
| 40,000 | 7/06 | Bacterin International, Inc. (privately held) Bioactive coatings for medical devices |
120,000 | 40,000 | 0.1 | ||||||||
| 60,000 | 12/05 | Metamorphix Global, Inc. (privately held) Design and manufacture of countertops |
120,000 | 18,000 | 0.1 | ||||||||
| 109,091 | 7/06 | Turbine Truck Engines, Inc. Heavy-duty highway truck engines |
72,000 | 7,800 | <0.1 | ||||||||
| 6,706 | 5/06-6/06 | Codima, Inc.(KKS Venture Management/ Rheologics) Study of blood viscosity |
86,100 | 2,200 | <0.1 | ||||||||
| Island Gas Resources Plc. (KP Renewables Plc)(5) Renewable energy |
|||||||||||||
| 5/06 | Convertible Debenture, due 5/10/07 |
4,433,403 | — | 0.0 | |||||||||
| 9/05 | Convertible Debenture, due 9/30/06 |
1,884,920 | — | 0.0 | |||||||||
| 2,500 | 3/05 | Common Stock |
94,500 | 700 | <0.1 | ||||||||
| 1,250,010 | 5/06 | In Veritas Medical Diagnostics, Inc. Medical devices designs and testing |
74,400 | 600 | <0.1 | ||||||||
| 940,000 | 10/06 | Laserlock Technologies, Inc. Security solutions for the gaming industry |
18,900 | 400 | <0.1 | ||||||||
| 2,971 | 12/05-8/06 | The Renewable Corp. (Industrial Biotechnology Corp.) Provider of renewable resources |
3,455,105 | — | 0.0 | ||||||||
| 387,097 | 6/06 | Tradequest International, Inc. Provider of voice over internet protocol |
76,092 | — | 0.0 | ||||||||
| 1,886 | 9/05-6/08 | Applied Wellness Corporation (New Life Scientific, Inc.) Pharmaceutical biotechnologies |
81,816 | — | 0.0 | ||||||||
| 232,211 | 5/05 | EFuel EFN Corp. (Preservation Sciences, Inc.) Internet sites host |
— | — | 0.0 | ||||||||
52
Table of Contents
| Shares |
Dates of Acquisition |
Original Cost Basis |
Value | Percentage of Net Assets |
|||||||||
| 2,430,740 | 2/06-6/06 | UBA Technology, Inc. Software development Common Stock |
1,652,900 | — | 0.0 | ||||||||
| 95,000 | 4/06 | Series A Convertible Preferred Stock |
1,619,849 | — | 0.0 | ||||||||
| 7,787,565 | 6/05-6/06 | Trio Industries Group, Inc. Protective powder coating |
12,330,401 | — | 0.0 | ||||||||
| Total Investments in Non-Affiliates | $ | 36,994,463 | $ | 5,603,440 | 15.1 | % | |||||||
| Affiliate Investments(2) |
|||||||||||||
| 100,000 | 6/08 | World Energy Solutions, Inc.(7) Energy saving technologies Series B Convertible Preferred Stock |
$ | 875,000 | $ | 750,000 | 2.0 | % | |||||
| 100,000 | 9/08 | Series C Convertible Preferred Stock |
750,000 | 700,000 | 1.9 | ||||||||
| 18,042,749 | 9/05-6/08 | Common Stock |
4,715,949 | 322,100 | 0.9 | ||||||||
| 17,823 | 12/06-6/07 | MATECH Corporation (Material Technologies, Inc.) Metal fatigue detection Common Stock |
4,170,070 | 58,400 | 0.2 | ||||||||
| 47,500 | 1/07 | Series E Convertible Preferred Stock |
694,640 | 463,100 | 1.2 | ||||||||
| 2,040,000 | 4/06-7/06 | CytoDyn, Inc. Novel therapeutic agents Common Stock |
3,640,772 | 171,400 | 0.5 | ||||||||
| 100,000 | 1/07 | Series A Convertible Preferred Stock |
845,000 | 260,000 | 0.7 | ||||||||
| 15,150,717 | 4/05-6/08 | Emission & Power Solutions, Inc. (Fuel FX International, Inc.) (privately held) Reductional environmental emissions |
4,080,142 | 287,900 | 0.8 | ||||||||
| 412,000 | 9/07 | NeoStem, Inc. Stem cell banking services |
761,440 | 164,600 | 0.4 | ||||||||
| 49,500,000 | 7/07 | MachineTalker, Inc. Intelligent wireless security networks |
993,000 | 133,700 | 0.4 | ||||||||
| 3,373,107 | 7/06-9/07 | Avalon Oil and Gas, Inc. Oil and gas producers |
2,448,681 | 67,500 | 0.2 | ||||||||
| 1,426,754 | 9/07 | USTelematics, Inc.(9) Broadband telecommunication for moving vehicles |
— | 59,900 | 0.1 | ||||||||
| 6,498,845 | 6/07 | American Soil Technologies, Inc. Fertilizer innovation |
1,528,289 | 27,300 | 0.1 | ||||||||
| 153,417,714 | 12/06-4/07 | Cargo Connection Logistics Holdings, Inc. World trade logistics |
959,972 | 10,700 | <0.1 | ||||||||
| 5,724,500 | 5/06-8/06 | NetFabric Holdings, Inc. Information technology services |
489,132 | 600 | <0.1 | ||||||||
| 4,426,136 | 7/06 | DME Interactive Holdings, Inc. Multi-media entertainment |
752,443 | — | 0.0 | ||||||||
| 3,000,000 | 7/07 | Pathway One Plc(5) Sales and development licenses |
426,150 | — | 0.0 | ||||||||
| 95,000 | 1/07 | Tesla Vision Corporation (Manakoa Services Corp.)(8) Compliance analysis and monitoring Series B Convertible Preferred Stock |
2,280,000 | — | 0.0 | ||||||||
| 1,559,903 | 8/04-4/07 | Common Stock |
2,122,641 | — | 0.0 | ||||||||
| 33,730,000 | 4/05-1/06 | WebSky, Inc. Broadband wireless |
897,750 | — | 0.0 | ||||||||
| 4,221,165 | 4/01-12/02 | Stealth MediaLabs, Inc.(9) Software products |
1,708,000 | — | 0.0 | ||||||||
53
Table of Contents
| Shares |
Dates of Acquisition |
Original Cost Basis |
Value | Percentage of Net Assets |
|||||||||
| 5,346 | 7/06-9/06 | NutriPure Beverages, Inc. (Liberty Diversified Holdings, Inc.) Printing and packaging Common Stock |
1,245,258 | — | 0.0 | ||||||||
| 63,981 | 2/07 | Series D Convertible Preferred Stock |
382,800 | — | 0.0 | ||||||||
| 210,000,000 | 1/08 | RIM Semiconductor Company(7) Data transmission technology |
1,792,500 | — | 0.0 | ||||||||
| Total Investments in Affiliates | $ | 38,559,629 | $ | 3,477,200 | 9.3 | % | |||||||
| Control Investments(3) |
|||||||||||||
| 1,000 | 11/99-11/06 | UTEK Real Estate Holdings, Inc. (privately held) Real estate development |
$ | 4,131,574 | $ | 2,980,000 | 8.0 | % | |||||
| 15,009,402 | 3/06-5/07 | Klegg Electronics, Inc. Manufacturer/distributor for retail electronic products |
6,506,174 | 7,500 | <0.1 | ||||||||
| Total Investments in Control Investments |
$ | 10,637,748 | $ | 2,987,500 | 8.0 | % | |||||||
| Certificates of Deposit(4) |
|||||||||||||
| 95,000 | 8/08 | Sun Amern BK Boca Raton FL CD, maturity 1/29/09, interest rate @ 2.60% |
$ | 95,035 | $ | 95,035 | 0.3 | % | |||||
| 100,000 | 10/08 | Doral BK Catano P R CD, maturity 6/29/09, interest rate @ 3.55% |
100,000 | 100,000 | 0.3 | ||||||||
| 95,000 | 8/08 | SunTrust Bank CD, maturity 9/12/09, interest rate @ 4.21% |
96,546 | 96,546 | 0.3 | ||||||||
| Total Investments in Certificates of Deposit |
$ | 291,581 | $ | 291,581 | 0.8 | % | |||||||
| TOTAL INVESTMENTS | $ | 86,483,421 | $ | 12,359,721 | 33.2 | % | |||||||
| Cash and other assets, less liabilities | 24,840,558 | 66.8 | % | ||||||||||
| Net assets at December 31, 2008 | $ | 37,200,279 | 100 | % | |||||||||
Notes to Schedule of Investments:
| • | Except where otherwise noted, all of the Company’s investments listed above are in common stock of companies that are publicly quoted on the OTC Bulletin Board or listed on the NYSE Amex or other similar markets. |
| • | The above investments, with the exception of the U.S. Treasuries and certificates of deposits, are non-income producing. Equity investments that have not paid dividends within the last twelve months are considered non-income producing. |
| • | The value of all securities for which there is no readily available market value is determined in good faith by the Board of Directors. In making its determination, the Board of Directors has considered |
54
Table of Contents
| valuation appraisals provided by an independent valuation service provider. (See Note 4 to the Notes to the Consolidated Financial Statements.) |
| • | As of December 31, 2008, all of the securities that the Company owns are subject to legal restrictions on resale. As a result, the Company’s ability to sell or otherwise transfer the securities it holds in its portfolio is limited. |
| (1) | Non-affiliate investments are generally defined under the Investment Company Act of 1940 as companies in which the Company owns less than 5% of the voting securities. |
| (2) | Affiliate investments are generally defined under the Investment Company Act of 1940 as companies in which the Company owns at least 5% but not more than 25% of the voting securities. |
| (3) | Control investments are generally defined under the Investment Company Act of 1940 as companies in which the Company owns more than 25% of the voting securities or where the Company holds one or more seats on the company’s Board of Directors. We own 100% of UTEK Real Estate Holdings, Inc. (“UREHI”), which holds four investments: Rosbon LLC, ABM of Tampa Bay, Inc., 22nd Street of Ybor City, Inc. and Ybor City Group, Inc. UREHI holds 150 of the total membership interests outstanding of Rosbon LLC and all of the outstanding shares of capital stock of ABM of Tampa Bay, Inc., 22nd Street of Ybor City, Inc. and Ybor City Group, Inc. |
| (4) | The Company invests excess cash in a number of certificates of deposit. These short-term investments normally have three-month to one-year maturities and do not qualify as cash or cash equivalents. |
| (5) | Non-U.S. company or the company’s principal place of business is outside the U.S. |
| (6) | Investment consists of warrants to purchase 1,500,000 shares of Oxygen Biotherapeutics, Inc., formerly Synthetic Blood International, Inc., common stock. |
| (7) | During the period ended December 31, 2008, the Company reclassified this investment from Control investments to Affiliate investments based on the criteria in notes (2) and (3). |
| (8) | Advanced Medical Isotope Corporation and Tesla Vision Corporation are related through common management. |
| (9) | Stealth MediaLabs, Inc. and USTelematics, Inc. are related through common management. |
See accompanying notes
55
Table of Contents
NOTES TO CONSOLIDATED FINANCIAL STATEMENTS
1. Withdrawal of the Company’s Election to be Treated as a Business Development Company under the Investment Company Act of 1940
Until September 30, 2009, the Company was a non-diversified, closed-end management investment company that had elected to be treated as a business development company (“BDC”) under the Investment Company Act of 1940 (“1940 Act”). On October 1, 2009, the Company filed a notification on Form N-54C with the Securities and Exchange Commission (“SEC”) withdrawing its election to be regulated as a BDC under the 1940 Act. As such, the Company began reporting as an operating company as of October 1, 2009.
Based on the Company’s current business focus and the fact that the equity interests it holds have constituted a declining amount of its assets over the last couple of years, the Company determined that it no longer met the requirements to be regulated as a BDC under the 1940 Act. In this regard, the Company’s current business focus is to provide consulting and technology transfer services to companies in exchange for cash as opposed to equity interests. Thus, because of the Company’s current business focus of providing consulting and technology transfer services to companies in exchange for cash as opposed to equity interests, as well as the fact that the Company no longer holds the requisite level of “investment securities” (as this term is defined in the 1940 Act) to permit it to be an “investment company” under the 1940 Act and, as a result, be regulated as a BDC, the Company is operating, and intends to continue to operate, as an operating company rather than an investment company.
Accordingly, and after careful consideration of the requirements applicable to BDCs under the 1940 Act, the cost of compliance with the provisions of the 1940 Act and a thorough assessment of the Company’s current business model, the Company’s Board of Directors determined that the Company should withdraw its election to be regulated as a BDC under the 1940 Act.
Under its current business model, the Company intends at all times to conduct its activities in such a way that it will not be deemed an “investment company” subject to regulation under the 1940 Act. Thus, the Company will not hold itself out as being engaged primarily in the business of investing, reinvesting or trading in securities. In addition, the Company intends to conduct its business in a manner so that it will at no time own or propose to acquire investment securities having a value exceeding 40% of the Company’s total assets at any one time.
As a result of our de-election from BDC status, we make reference to both Investment Company Accounting and Operating Company Accounting throughout these consolidated financial statements. Investment Company Accounting, as we refer to it, is defined as accounting in accordance with U.S. generally accepted accounting principles (“US GAAP”) for investment companies under the 1940 Act. Operating Company Accounting, as we refer to it, is defined as accounting in accordance with US GAAP other than for investment companies under the 1940 Act.
As an operating company, the Company is required to consolidate UTEK Real Estate Holdings, Inc. and its subsidiaries: Ybor City Group, Inc., 22nd Street of Ybor City, Inc., ABM of Tampa Bay, Inc., and Cortez 114, LLC (collectively “UTEK Real Estate”). Under Investment Company Accounting, the fair value of UTEK Real Estate was included in the Company’s portfolio investments and the operating results of these companies were not consolidated with those of the Company. The assets, liabilities and results of operations of UTEK Real Estate have been included in the Company’s consolidated financial statements from October 1, 2009. As of October 1, 2009, none of the Company’s other investments are greater than 20% of the outstanding equity interests of any individual company, and accordingly, consolidation is not required for these investments.
The change in reporting did not have a material affect on the Company’s net loss from operations, net loss or related per share amounts for the three months ended December 31, 2009.
56
Table of Contents
Conversion from Investment Company Presentation to Operating Company Presentation
ASC Topic 250, Accounting Changes and Error Corrections
UTEK was required to make the accounting change at the time that it no longer met the requirements of the 1940 Act and filed its Form N-54C with the SEC withdrawing its election to be treated as a BDC under the 1940 Act. The Company has applied the change as of October 1, 2009, which is the first date that it was no longer appropriate for the Company to use Investment Company Accounting.
The Company’s change in financial statement presentation from fair value Investment Company Accounting to Operating Company Accounting has been accounted for as the initial adoption of or modification of an accounting principle resulting from a change in events or transactions as contemplated by Financial Accounting Standards Board (“FASB”) Accounting Standards Codification (“ASC”) 250-10-45-1. The Company’s change to Operating Company Accounting is clearly different in substance from that previously occurring under Investment Company Accounting. This is not considered to be a change in accounting principle. In accordance with this view, the Company applied the adoption of accounting as an operating company prospectively beginning October 1, 2009.
ASC Topic 946, Investment Companies
As there was limited authoritative guidance on accounting for the transition from a BDC to an operating company, the Company reviewed the guidance in ASC Topic 946 Financial Services—Investment Companies. The Company relied on the guidance in Topic 946, a significant portion of which has been delayed indefinitely. The guidance that has been delayed is not US GAAP and is considered nonauthoritative.
The initial determination of whether UTEK was an investment company within the scope of Topic 946 was made upon formation of the Company. Reconsideration of the provisions of Topic 946 by the Company’s Board of Directors during 2009 resulted in the determination that continuation as a BDC was inappropriate. ASC 946-10-15-5 (delayed) dictates companies that no longer meet the conditions of an investment company should discontinue application of Topic 946 and report the change in status prospectively by accounting for its investments in conformity with applicable US GAAP other than Investment Company Accounting, beginning as of the date of the change using fair value in conformity with Investment Company Accounting at the date of the change as the carrying amount of investments at the date of the change. In accordance with this guidance, the Company reported a change in status and began reporting as an operating company as of October 1, 2009. In addition, the fair value of the Company’s investments as of September 30, 2009 became their cost basis under Operating Company Accounting beginning on October 1, 2009.
Presentation of Financial Statements
The Company made the following adjustments in order to present two years of financial statements together for which the years include two different methods of accounting. Changes made to the accompanying consolidated balance sheet / consolidated statement of assets and liabilities include the following:
| • | The balance sheet was reformatted as of December 31, 2009 to a classified balance sheet presentation in accordance with Operating Company Accounting. |
| • | The investment in UTEK Real Estate Holdings, Inc., which was included as a portfolio investment under Investment Company Accounting, was eliminated and this company’s balance sheet is consolidated with UTEK as of the date of change of October 1, 2009 pursuant to Operating Company Accounting. |
| • | Investments are now presented as certificates of deposit and either available-for-sale securities or investments under cost method in accordance with ASC Topic 320 Investments—Debt and Equity Securities and ASC Topic 325 Investments—Other. |
57
Table of Contents
| • | The stockholders’ equity presentation has separate classification for earnings accounts under Investment Company Accounting and Operating Company Accounting. Accumulated income (loss) under Investment Company Accounting includes earnings through September 30, 2009. Accumulated income (deficit) under Operating Company Accounting includes earnings incurred subsequent to the date of change of October 1, 2009. |
Changes made to the accompanying consolidated statements of operations include the following:
| • | Operations for the year ended December 31, 2009 were segregated into two columns in the consolidated statements of operations to properly report results of operations in accordance with the accounting in effect during the respective periods. The nine months ended September 30, 2009 are presented in investment company format and the three months ended December 31, 2009 are presented in operating company format. |
| • | The statement of operations was reformatted for the three months ended December 31, 2009 to conform to an operating company presentation. Certain balances are not applicable to an investment company and are not included prior to the date of change of October 1, 2009. These include other (income) expense and interest expense, net. In addition, this statement includes the statement of comprehensive income (loss) for the three months ended December 31, 2009. |
| • | UTEK Real Estate’s results of operations are consolidated with those of UTEK as of the date of change of October 1, 2009. Intercompany transactions, including intercompany borrowings and rent, are eliminated in consolidation for the three months ended December 31, 2009. Through September 31, 2009, UTEK Real Estate is included as one of the Company’s portfolio companies and the fair value of this company is included in the Company’s portfolio investments. |
| • | Certain balances reported under Investment Company Accounting are not applicable to an operating company and are not included subsequent to the date of change of October 1, 2009. These include investment income, net realized gains (losses) on investments and net change in unrealized appreciation (depreciation) of investments. Under Operating Company Accounting, income and losses from these sources are classified as follows: |
| • | Investment income is included in other (income) expense or interest expense, net, depending on its source. |
| • | Realized gains (losses) on investments are included in other (income) expense. |
| • | Unrealized appreciation (depreciation) on available-for-sale securities are reported in operating company equity as a component of accumulated other comprehensive income (loss) in the consolidated balance sheet. |
Other changes include the following:
| • | The Consolidated Statements of Changes in Net Assets and the Schedule of Investments in and Advances to Affiliates, as well as Selected Per Share Data and Ratios under Investment Company Accounting included in Note 16, are included only through September 30, 2009 as they are requirements under Investment Company Accounting. Therefore, certain balances as shown will agree to the Company’s quarterly report on Form 10-Q for the nine months ended September 30, 2009 as opposed to the current financial statements included in this annual report on Form 10-K. |
| • | The Consolidated Schedule of Investments is presented only for the year ended December 31, 2008. |
| • | The consolidated statement of stockholders’ equity (deficit) is included for the years ended December 31, 2009, 2008 and 2007. In addition, this statement includes the statement of comprehensive income (loss) for the three months ended December 31, 2009. |
| • | Cash flows for the year ended December 31, 2009 were segregated into two columns in the consolidated statements of cash flows to properly report cash flows in accordance with the accounting in effect during the respective periods. The nine months ended September 30, 2009 are presented in investment company format and the three months ended December 31, 2009 are presented in operating company format. |
58
Table of Contents
Consolidation of UTEK Real Estate
UTEK Real Estate has been consolidated into the Company’s balance sheet as of December 31, 2009. The following reflects the components of UTEK Real Estate’s carrying value as of October 1, 2009:
| Cash |
$ | 23,170 | ||
| Accounts receivable |
87,921 | |||
| Cost method investments |
494,517 | |||
| Other tangible assets |
441,696 | |||
| Fixed assets |
8,002,162 | |||
| Accounts payable and accrued expenses |
(104,757 | ) | ||
| Debt |
(4,184,709 | ) | ||
| Total carrying value |
$ | 4,760,000 | ||
2. Nature of Business and Significant Accounting Policies
Organization
We commenced operations in 1997 and were originally incorporated under the laws of the State of Florida, and subsequently under the laws of the State of Delaware in July 1999.
The Company
The Company provides services that help clients become stronger innovators, develop compelling strategies to drive and catalyze growth, rapidly source externally developed technologies, create value from their intellectual property and gain foresight into marketplace and technology developments that affect their business. These services are primarily provided throughout the United States (“U.S.”) and the United Kingdom (“UK”).
Innovation Consulting Services
The Company provides strategic innovation consulting services to clients to help them become more efficient by finding new avenues for growth, fighting commoditization, improving return on investment, transforming the organization, and removing barriers to innovation. Business value is delivered to our clients through working with a team of seasoned and experienced professionals capable of unlocking an organization’s capacity for strategy and innovation.
In addition, the Company provides services to clients that build the capacity for foresight, including monitoring trends, researching topics of interest, forecasting alternative scenarios, developing technology roadmaps, creating growth platforms and embedding futures thinking within the organization. The Company also offers innovative futures programs that provide clients with up-to-the-minute knowledge, expert insight, high-level learning experiences, and opportunities to network with experts and peers.
Sale of Technology Rights
UTEK’s services enable companies to acquire externally developed technologies from universities, university incubators, federal labs, medical centers, and corporate research laboratories worldwide to augment their internal research and development (“R&D”) efforts. A sale of technology rights refers to the process by which these technologies are licensed to companies for potential commercial development and use. UTEK’s goal is to provide its clients an opportunity to acquire and commercialize innovative technologies primarily developed external to their business.
59
Table of Contents
Subscription and Other Services
Online Licensing Platform
The Company’s online licensing services division provides the following subscription-based website services:
| • | Pharmalicensing is a biopharmaceutical innovation resource designed for life science professionals driving partnering, licensing and business development worldwide. Pharmalicensing affords clients the ability to in-license and out-license intellectual property and also provides partnering services, business development reports, industry news and a jobs source for candidates and employers. We are tracking at over 200,000 visitors per month and developing partnerships with sites such as Patents.com to drive further traffic. |
| • | Medical Device Licensing is an online global resource for open innovation, partnering, licensing and business development within the medical device industry. Medical Device Licensing benefits from the Pharmalicensing traffic and partnerships as well as establishing some of its own with member associations around the globe to further its reach and exposure. |
| • | Knowledge Express is a searchable database of information for licensing professionals, which provides our clients with comprehensive coverage of licensing agreements, corporate profiles, clinical trials, deals, drug pipelines, drug sales, licensable technologies, patents and royalty rates. |
| • | Pharma Transfer provides a source of research and business development opportunities for the international pharmaceutical market encompassing all areas of pipeline development including, early-stage discovery, pre-clinical and clinical trials and registered products that are all available for co-development or licensing. |
| • | TekScout enables companies to outsource unfinished R&D projects to scientists from around the world. TekScout provides a platform for companies to supplement internal R&D and resources to accelerate product development. |
Global Technology Licensing
The Company’s global technology licensing service enables clients to enhance their new product pipeline through the acquisition of proprietary technologies primarily from universities, medical centers, federal research laboratories, select corporations, and university incubator programs.
Another component of the Company’s global technology licensing division is our patent analytic service designed to help our clients create marketplace value from their intellectual property (“IP”). The Company helps clients identify the strengths and weaknesses of their own IP as well as that of companies in the same or adjacent industries. Additionally, by identifying gaps and opportunities in the IP landscape, the Company assists clients with developing IP acquisition, disposition, and management strategies.
Principles of Consolidation
The consolidated financial statements include the accounts of UTEK and its wholly owned subsidiaries: UTEK Europe, Ltd. (Europe), UTEKip, Ltd. (Israel) and UTEK Real Estate Holdings, Inc. UTEKip, Ltd. was dissolved in 2008 and all operations of that subsidiary are currently being serviced by UTEK. In addition, the legal entities for Innovaro, Ltd., Pharmalicensing, Ltd. and Carmi, Inc. (Strategos) still exist, but their operations have been assumed by UTEK and UTEK Europe, Ltd. All intercompany transactions and balances are eliminated in consolidation.
As an investment company, portfolio investments are held for the purpose of deriving investment income and future capital gains. The operating results of the Company’s portfolio companies, including UTEK Real Estate Holdings, Inc., are not consolidated in the Company’s financial statements through September 30, 2009.
60
Table of Contents
Effective October 1, 2009, the Company is reporting as an operating company. As such, the Company is required to consolidate UTEK Real Estate Holdings, Inc. and its subsidiaries: Ybor City Group, Inc., 22nd Street of Ybor City, Inc., ABM of Tampa Bay, Inc., and Cortez 114, LLC (collectively “UTEK Real Estate”). The assets, liabilities and results of operations of UTEK Real Estate have been included in the Company’s consolidated financial statements from October 1, 2009. As of October 1, 2009, none of the Company’s other investments are greater than 20% of the outstanding equity interests of any individual company, and accordingly, equity investment accounting is not warranted for these investments.
Reclassifications
Certain reclassifications have been made to the 2008 and 2007 balances to conform to the 2009 financial statement presentation.
Business Combinations
The Company determines and allocates the purchase price of an acquired company to the tangible and intangible assets acquired and liabilities assumed as of the business combination date in accordance with US GAAP for business combinations. The purchase price allocation process requires the Company to use significant estimates and assumptions, including fair value estimates, as of the business combination date.
While the Company uses its best estimates and assumptions as a part of the purchase price allocation process to accurately value assets acquired and liabilities assumed at the business combination date, its estimates and assumptions are inherently uncertain and subject to refinement. As a result, during the purchase price allocation period, which is generally one year from the business combination date, the Company records adjustments to the assets acquired and liabilities assumed based on additional information received, with the corresponding offset to goodwill. In addition, there are contingencies based on earnings (commonly referred to as earnouts) included in some of the Company’s purchase agreements entered into during 2008. The earnout is recorded as it is earned over the contingency period, which is generally one to three years from the business combination date. With the exception of unresolved income tax matters or the earnout of contingent consideration, subsequent to the purchase price allocation period any adjustment to assets acquired or liabilities assumed is included in the Company’s operating results in the period in which the adjustment is determined.
In January 2009, the Company adopted new US GAAP for business combinations, which requires a number of changes, including changes in the way assets and liabilities are recognized as a result of business combinations. This new US GAAP requires that more assets and liabilities assumed be measured at fair value as of the acquisition date and that liabilities related to contingent consideration be re-measured at fair value in each subsequent reporting period. It also requires the capitalization of in-process research and development at fair value and requires the expensing of acquisition-related costs as incurred. The impact of the adoption of this new US GAAP for business combinations will depend on the nature of acquisitions completed after the date of adoption.
Investments
Under Investment Company Accounting
Through September 30, 2009, the Company operated as a non-diversified, closed-end management investment company that had elected to be treated as a BDC under the 1940 Act and accounted for investments in accordance with Investment Company Accounting.
Pursuant to the requirements of the 1940 Act, UTEK’s Board of Directors was responsible for determining, in good faith, the fair value of the Company’s securities and assets for which market quotations are not readily available. In making its determination, the Board of Directors considered valuation appraisals provided by an independent valuation firm.
61
Table of Contents
Our equity interests in portfolio companies for which there is no liquid public market are valued using quoted market prices for identical or similar instruments in active markets. The determined values are generally discounted to account for the illiquid nature of the investment and minority ownership positions. The value of our equity interests in portfolio companies for which market quotations are readily available is based on the public market price on the balance sheet date. These securities are generally thinly traded and/or carry discounts from the public market value for certain restrictions on resale.
The Board of Directors based its determination upon, among other things, applicable quantitative and qualitative factors. These factors included, but were not limited to, type of securities, nature of business, marketability, market price of unrestricted securities of the same issue (if any), comparative valuation of securities of publicly traded companies in the same or similar industries, current financial conditions and operating results, sales and earnings growth, operating revenues, competitive conditions and current and prospective conditions in the overall stock market.
Without a readily available market value, the value of the portfolio of equity securities may differ significantly from the values that would be placed on the portfolio if there existed a ready market for such equity securities, and the differences could be material. Approximately 60% and 28% of the Company’s investments owned at September 30, 2009 and December 31, 2008, respectively, were stated at fair value as determined by the Board of Directors, in the absence of readily available fair values. The Company used the first-in, first-out (FIFO) method of accounting for sales of its investments.
Under Operating Company Accounting
The Company began reporting as an operating company on October 1, 2009. In connection therewith, the Company modified the accounting treatment for it investments to conform to US GAAP for operating companies. See Note 1 for further discussion of the Company’s withdrawal of its election to be treated as an investment company under the 1940 Act and the effects on the Company’s financial statements.
Certificates of Deposit
Certificates of deposit are short term investments that are carried at their fair values. These certificates of deposit collateralize the Company’s line of credit as of December 31, 2009.
Available-for-Sale Securities
As of October 1, 2009, the Company classifies all investments in freely tradable equity securities as available-for-sale in accordance with US GAAP and our intentions regarding these instruments. Investments in equity securities of public companies continue to be accounted for using the fair value method as long as there is a market in the stock that provides readily determinable fair values for these securities. These investments are adjusted to fair value at the end of each quarter, as determined using the assistance of an independent valuation firm. Unrealized gains and losses are reported in operating company equity as a component of accumulated other comprehensive income (loss) in the consolidated balance sheet. Realized gains and losses from the sale of available-for-sale securities are determined on the FIFO method of accounting and are included as a component of other (income) expense in the consolidated statement of operations.
Should management determine that an available-for-sale security has an other-than-temporary decline in fair value, the Company would recognize the investment loss in the consolidated statement of operations. Available-for-sale securities were evaluated for other-than-temporary impairment at December 31, 2009. See Note 4 for further discussion.
62
Table of Contents
Investments under Cost Method
As of October 1, 2009, the Company classifies all investments in non-marketable equity securities in which we do not have a controlling financial interest, constituting 20% interest in the company, or significant influence as investments under cost method in accordance with US GAAP. Pursuant to US GAAP, the fair value of the Company’s non-marketable equity securities at September 30, 2009 became the new cost basis of the investments under cost method on October 1, 2009.
Individual securities classified as investments under cost method will remain at cost basis unless there is impairment. The Company must determine whether a decline in fair value below the cost basis is other than temporary. If the decline in fair value is judged to be other than temporary, the cost basis of the individual security will be written down to fair value as a new cost basis and the amount of the impairment will be included in earnings as a realized loss. The new cost basis cannot be adjusted upwards for subsequent recoveries in fair value. Investments under cost method were considered for impairment at December 31, 2009. As of December 31, 2009, the Company determined that the fair value of approximately $418,000 of the Company’s investments under cost method exceeded the carrying amount of these investments. It was not practicable to estimate the fair value of the remaining $170,000 of the Company’s investments under cost method and such an estimate was not made because there were no events or circumstances that could have had a significant adverse effect on the fair value of such investments during 2009.
Realized gains and losses from the sale of investments under cost method are determined on the FIFO method of accounting and are included as a component of other (income) expense in the consolidated statement of operations.
Cash and Cash Equivalents
The Company considers all highly liquid, fixed income investments with maturities of three months or less at the time of acquisition to be cash equivalents.
Accounts Receivable
The Company provides an allowance for losses on trade receivables based on a review of the current status of existing receivables and management’s evaluation of periodic aging of accounts. The Company charges off accounts receivable against the allowance for losses when an account is deemed to be uncollectible. It is not the Company’s policy to accrue interest on past due receivables. The provision for doubtful accounts and notes was approximately $83,000 and $124,000 as of December 31, 2009 and 2008, respectively.
Note Receivable
The Company holds a $1,500,000 note receivable from a privately held company. The note was received in exchange for the sale of certain of the Company’s investments in January 2009. The note bears interest at 7% per annum and does not require the payment of such interest or the principal amount of the note until maturity of the note on December 31, 2012. The Company recorded $96,000 of accrued interest income on the note for the year ended December 31, 2009. The note is collateralized by a security interest in certain property located in Pasco County, Florida.
Fixed Assets
Fixed assets are stated at cost, less accumulated depreciation. Depreciation is recorded using the straight-line method over the estimated useful lives of the respective assets of between 3 and 39.5 years. Leasehold improvements are amortized over the shorter of the estimated useful life of the assets or lease term. The carrying amount of all long-lived assets is evaluated periodically to determine if adjustment to the depreciation and amortization period or the unamortized balance is warranted. The Company believes that no impairment of fixed assets exists at December 31, 2009 and 2008.
63
Table of Contents
Maintenance and repairs are charged to operations when incurred. Betterments and renewals are capitalized. When fixed assets are sold or otherwise disposed of, the asset account and related accumulated depreciation account are relieved, and any gain or loss is included as a component of other (income) expense in the consolidated statement of operations.
Goodwill and Intangible Assets
Goodwill represents the excess of the purchase price over the fair value of the assets acquired in connection with the Company’s acquisitions. Intangible assets represent the cost of trade marks, trade names, websites, customer lists, non-compete agreements, and proprietary processes and software obtained in connection with certain of the Company’s acquisitions. In accordance with US GAAP, goodwill and intangible assets determined to have indefinite lives are not subject to amortization. Goodwill and indefinite-lived intangible assets are reviewed for impairment by applying a fair value based test on an annual basis or more frequently if circumstances indicate a potential impairment. Intangible assets with finite lives are amortized over their estimated useful lives.
Impairment of Long-lived Assets
Long-lived assets are tested for impairment on at least an annual basis. Impairment testing is required more often than annually if an event or circumstance indicates that an impairment, or decline in value, may have occurred. In conducting its impairment test, the Company compares the fair value of each of its reporting units to the related book value. If the fair value of a reporting unit exceeds its net book value, long-lived assets are considered not to be impaired. If the net book value of a reporting unit exceeds it fair value, an impairment loss is measured and recognized. The Company conducts its annual impairment test using balances as of December 31.
Derivative Liability
US GAAP requires bifurcation of embedded derivative instruments and measure of their fair value for accounting purposes. In addition, freestanding derivative instruments such as certain warrants are also derivative liabilities. We estimate the fair value of these instruments using the Black-Scholes option pricing model. Derivative liabilities are recorded at fair value at inception and then are adjusted to reflect fair value at the end of each quarter, with any increase or decrease in the fair value being recorded in results of operations as a component of other (income) expense.
At December 31, 2009, we had a derivative instrument related to our issuance of a Note and Warrant Purchase Agreement as further discussed in Note 7. The warrants have features that make their exercise price variable. We used the Black-Scholes model to determine the fair value of these warrants at inception, which resulted in a derivative liability of approximately $555,000. We used the Black-Scholes model to determine the fair value of the warrants again as of December 31, 2009, which resulted in a derivative liability of approximately $665,000. The increase in the fair value of the derivative liability from inception is primarily related to the increase in the market price of our stock during the period.
Foreign Currency Translation
The functional currency of the Company’s UK operations is that country’s local currency. The Company translates the assets and liabilities of its UK subsidiary into U.S. Dollars at the exchange rates in effect at the end of each reporting period. Revenues and expenses of the Company’s UK operations are translated into U.S. Dollars using weighted average exchange rates during the period. Through September 30, 2009, the effects of foreign currency translation adjustments are reported as a component of investment company equity in the consolidated statement of assets and liabilities. Beginning October 1, 2009, the translation adjustments are included in operating company equity as a component of accumulated other comprehensive income (loss) in the consolidated balance sheet. Foreign currency transaction gains and losses are included in other (income) expense in the consolidated statement of operations as of October 1, 2009 and are immaterial for all periods presented.
64
Table of Contents
Revenue Recognition
Innovation Consulting Services
Related to the Company’s Strategos division, revenues on fixed fee contracts are recognized on a pro rata basis based upon costs incurred to date compared to total estimated contract costs. Prior to the commencement of a client engagement, the Company and the client agree on fees for services based upon the scope of the project, staffing requirements and the level of client involvement. Total revenues are comprised of professional fees for services rendered to clients plus reimbursement of out-of-pocket expenses and exclude applicable taxes. The Company bills clients for services and expenses incurred in accordance with the terms of the client engagement agreement.
Related to the Company’s Social Technologies division, the Company has certain other consulting revenue that is derived from the sale of services in technology foresight, forecasting, scenario playing, vision, creativity and leadership, as well as the sale of services to provide for the design, development and implementation of custom software applications. Vendor specific objective evidence is not available to allocate among the respective deliverables in contracts with multiple deliverables. Accordingly, the Company recognizes consulting services revenue at the point when all the deliverables associated with the consulting contract have been provided to the customer.
Before the Company recognizes revenue, the following criteria must be met:
| 1. | Evidence of a financial arrangement or agreement must exist between the Company and its customer. Purchase orders, signed contracts, or electronic confirmations are three examples of items accepted by the Company to meet this criterion. |
| 2. | Delivery of the products or services must have occurred. The Company treats either physical or electronic delivery as having met this requirement. |
| 3. | The price of the products or services is fixed and measurable. |
| 4. | Collectability of the sale is reasonably assured and receipt is probable. Collectability of a sale is determined on a customer-by-customer basis. |
Innovation consulting membership services consist of Futures Consortium and Futures Interactive management products that allow clients access to information, research, databases and workshops that provide information on trends in different technologies and industries. Revenues are recognized on a contractual basis, generally on an annual basis. These fees are generally collected in advance of the membership period and the revenue is recognized ratably over the respective months, as services are provided.
Differences between the timing of billings and the recognition of revenue are recognized as either unbilled services (included as a component of prepaid expenses and other assets) or deferred revenue in the consolidated balance sheets. Client prepayments and retainers are classified as deferred revenue and recognized over future periods as earned.
Time-and-expense billing arrangements generally require the client to pay based on the number of hours worked by our consulting professionals at agreed-upon rates. Time-and-expense revenues are billed and recognized as incurred.
Sale of Technology Rights
The Company recognizes revenue from the sale of technology rights upon the exchange of the securities of its newly formed companies for cash or securities in the portfolio company that acquires such newly formed company and the technology held by such newly formed company. The Company records revenue based on the fair value of the consideration received. Historically, the consideration received for the rights has been unregistered shares of common or preferred stock of the portfolio company.
65
Table of Contents
Subscription and Other Services
Revenue from the sale of subscriptions to the Company’s websites generally is received in the form of cash and initially is deferred and subsequently recognized ratably over the term of the subscription, which is typically one year.
Global technology licensing services are performed pursuant to service agreements in which UTEK provides consulting services by identifying and evaluating technology licensing opportunities in exchange for cash, or in previous years, unregistered shares of the portfolio company. These agreements are typically cancelable with thirty days notice.
Revenue from global technology licensing agreements in which unregistered shares of common stock are received before they are earned are deferred and recognized over the term of each agreement. For global technology licensing agreements in which the stock is received ratably over the agreement, revenue is recognized as earned. The common stock received as payment is recorded as income based on the fair value of the consideration received. At December 31, 2009 and 2008, the Company did not have any global technology licensing agreements for which payment was to be received in stock.
Direct Costs Related to Revenue
Direct costs of innovation consulting services are comprised of salaries and related taxes, bonuses, certain outside services and other direct project costs related to innovation consulting services revenue. Acquisition of technology rights costs consist of the direct costs associated with technology transfers, which include cash to further accelerate commercialization efforts, license fees to acquire new technologies, consulting fees with the inventor of the technologies, and sponsored research fees with the university or research facility transferring the technologies. The Company does not report direct costs associated with its subscription and other services revenue as these costs have not been quantified.
Stock-Based Compensation
At December 31, 2009, the Company had two stock-based equity compensation plans, which are described more fully in Note 9.
The Company accounts for stock option grants in accordance with US GAAP. Stock-based compensation cost recognized during the years ended December 31, 2009, 2008 and 2007 includes compensation cost for all share-based payments granted prior to, but not yet vested as of January 1, 2006 and compensation cost for all share-based payments granted subsequent to January 1, 2006, based on their respective grant date fair values estimated in accordance with US GAAP. The Company recognizes compensation expense on a straight-line basis over the requisite service period. The Company uses the Black-Scholes option pricing model to estimate fair value of stock option grants at the grant date.
Determination of the fair values of stock option grants at the grant date requires judgment, including estimating the expected term of the relevant grants and the expected volatility of the Company’s stock. Additionally, management must estimate the amount of stock option grants that are expected to be forfeited. The expected term of options granted represents the period of time that the options are expected to be outstanding and is based on historical experience of similar grants, giving consideration to the contractual terms of the grants, vesting schedules and expectations of future employee behavior. The expected volatility is based upon our historical market price at consistent points in a period equal to the expected life of the options. Expected forfeitures are based on historical experience and expectations of future employee behavior.
66
Table of Contents
Income Taxes
Deferred taxes are provided on the asset and liability method whereby deferred tax assets are recognized for deductible temporary differences and operating loss and tax credit carry forwards and deferred tax liabilities are recognized for taxable temporary differences. Temporary differences are the differences between the reported amounts of assets and liabilities and their tax bases. Future tax benefits for net operating loss carryforwards are recognized to the extent that realization of these benefits is considered more likely than not. Deferred tax assets are reduced by a valuation allowance when, in the opinion of management, it is more likely than not that some portion or all of the deferred tax assets will not be realized.
For federal and state income tax purposes, the Company is taxed at regular corporate rates on ordinary income and recognizes gains on distributions of appreciated property. As an investment company, the Company was not entitled to the special tax treatment available to BDCs that elect to be treated as regulated investment companies under the Internal Revenue Code because, among other reasons, the Company did not distribute at least 90% of “investment company taxable income” as required by the Internal Revenue Code for such treatment.
Certain guidance located within ASC Topic 740, Income Taxes, clarifies the accounting for uncertainty in income taxes recognized in an enterprise’s financial statements. Topic 740 provides guidance on the financial statement recognition and measurement of a tax position taken or expected to be taken in a tax return. Topic 740 also provides guidance on derecognition, classification, interest and penalties, accounting in interim periods, disclosures, and transition. The Company had no uncertain tax positions for the years ended December 31, 2009, 2008 and 2007.
The Company does not have any income tax benefit related to its net loss from operations in 2009, nor does it have a deferred tax asset related to its net operating loss carryforward, because of a 100% valuation allowance. The Company does have an income tax benefit from the reversal of a deferred tax liability related to the impairment of an indefinite-lived intangible asset and from foreign tax for the year ended December 31, 2009.
Net Realized Gains or Losses and Net Change in Unrealized Appreciation or Depreciation from Investment Company Activity
Realized gains or losses are measured by the difference between the net proceeds from the repayment or sale and the original cost basis of the investment without regard to unrealized appreciation or depreciation previously recognized. The original cost basis of the securities received in connection with global technology licensing agreements and technology transfers is equal to the amount of revenue recognized upon the receipt of such securities. Net change in unrealized appreciation or depreciation of investments through September 30, 2009 reflects the change in portfolio investment values during the reporting period, including the reversal of previously recorded unrealized appreciation or depreciation when gains or losses are realized.
Earnings per Share (EPS)
Basic earnings per share is computed on the basis of the weighted-average number of shares of common stock outstanding during the period. Diluted earnings per share is computed on the basis of the weighted-average number of shares of common stock outstanding plus the effect of dilutive potential common shares outstanding during the period using the treasury stock method. The Company’s dilutive potential common shares consist of outstanding stock options and warrants.
67
Table of Contents
Components of basic and diluted per share data are as follows:
| Three Months Ended Dec 31, 2009 |
Nine Months Ended Sept 30, 2009 |
Year Ended Dec 31, 2008 |
Year Ended Dec 31, 2007 | |||||
| Weighted average outstanding shares of common stock |
11,605,373 | 11,257,663 | 9,947,221 | 8,989,234 | ||||
| Dilutive effect of stock options and warrants |
— | — | — | — | ||||
| Common stock and common stock equivalents |
11,605,373 | 11,257,663 | 9,947,221 | 8,989,234 | ||||
| Shares excluded from calculation of diluted EPS(1) |
1,739,150 | 1,014,400 | 988,400 | 652,025 | ||||
| (1) | These shares attributable to outstanding common stock options and warrants were excluded from the calculation of diluted EPS because their inclusion would have been anti-dilutive, primarily as a result of the net loss/ net decrease in net assets from operations during the period. |
Dividends to Shareholders
Dividends to shareholders are recorded on the date of declaration.
Financial Instruments and Concentrations of Credit Risk
The Company’s financial instruments consist of investments, certificates of deposit, cash and cash equivalents, accounts receivable, accounts payable, accrued expenses, long-term debt and the derivative liability. The fair value of trade accounts receivable and payable and certain accrued expenses approximate their carrying amounts in the financial statements due to the short maturity of such instruments. The fair value of certificates of deposit is recorded based upon their market value. The fair value of all other investments is determined as further discussed in Note 4. The fair value of the derivative liability is determined as further described in Note 7. The estimated fair value of the Company’s long-term debt at December 31, 2009 is not materially different from the carrying value of $6.3 million.
Financial instruments with significant credit risk include investments, certificates of deposit and cash and cash equivalents. The Company invests its cash and cash equivalents and certificates of deposit with high credit quality financial institutions. Certain cash and cash equivalents were in excess of FDIC insurance limits at December 31, 2009. The Company has not experienced any losses on such accounts.
The Company had one major customer during the year ended December 31, 2009, two major customers during the year ended December 31, 2008 and three major customers during the year ended December 31, 2007. Major customers, those generating greater than 10% of total income from operations, accounted for approximately 10%, 27% and 43% of the Company’s revenue during the years ended December 31, 2009, 2008 and 2007, respectively. In addition, one customer accounted for approximately 17% of accounts receivable at December 31, 2009.
Use of Estimates
The preparation of the Company’s consolidated financial statements in conformity with US GAAP requires management to make estimates and assumptions that could affect the reported amounts of assets and liabilities and disclosure of contingent assets and liabilities at the date of the financial statements and the reported amounts of revenue and expenses during the reporting period. The most significant estimates relate to revenue recognition, the fair value of certain investments, stock-based compensation, the carrying values of goodwill, intangible assets and the derivative liability, and the purchase price allocation process for business combinations. Actual results could differ from those estimates.
68
Table of Contents
Recently Issued Accounting Pronouncements
In October 2008, the FASB amended ASC Topic 820, Fair Value Measurements and Disclosures. Topic 820 provides an illustrative example of how to determine the fair value of a financial asset in an inactive market. Topic 820 does not change the fair value measurement principles set forth in the original literature. Since adopting Topic 820 in January 2008, UTEK’s practices for determining the fair value of its investment portfolio have been, and continue to be, consistent with the guidance provided in the example in Topic 820 and Topic 825, Financial Instruments. Therefore, UTEK’s adoption of Topics 820 and 825 did not affect its practices for determining the fair value of its investments and did not have a material effect on its consolidated financial statements.
In April 2009, the FASB amended ASC Topic 805, Business Combinations. Topic 805 establishes a model to account for certain pre-acquisition contingencies. Under Topic 805, an acquirer is required to recognize at fair value an asset acquired or a liability assumed in a business combination that arises from a contingency if the acquisition-date fair value of that asset or liability can be determined during the measurement period. If the acquisition-date fair value cannot be determined, then the acquirer should follow the recognition criteria in ASC Topic 450, Contingencies, and ASC Topic 450-20, Loss Contingencies. Topic 805 was effective for the Company beginning January 1, 2009, and will apply prospectively to business combinations completed subsequent to that date. The impact of the adoption of Topic 805 will depend on the nature of acquisitions completed after the date of adoption.
In June 2009, the FASB issued ASC Topic 105, Generally Accepted Accounting Principles. The FASB Accounting Standards Codification (the “Codification”) became the source of authoritative US GAAP recognized by the FASB to be applied by nongovernmental entities. All of the Codification’s content carries the same level of authority, and the US GAAP hierarchy will be modified to include only two levels: authoritative and nonauthoritative. Topic 105 was effective for the Company as of July 1, 2009 and did not have a material effect on its consolidated financial statements.
In June 2009, the FASB issued a new accounting standard which provides amendments to previous guidance on the consolidation of variable interest entities. This standard clarifies the characteristics that identify a variable interest entity (“VIE”) and changes how a reporting entity identifies a primary beneficiary that would consolidate the VIE from a quantitative risk and rewards calculation to a qualitative approach based on which variable interest holder has controlling financial interest and the ability to direct the most significant activities that impact the VIE’s economic performance. This standard requires the primary beneficiary assessment to be performed on a continuous basis. It also requires additional disclosures about an entity’s involvement with a VIE, restrictions on the VIE’s assets and liabilities that are included in the reporting entity’s consolidated balance sheet, significant risk exposures due to the entity’s involvement with the VIE, and how its involvement with a VIE impacts the reporting entity’s consolidated financial statements. The standard was effective for the Company as of January 1, 2010 and did not have a material effect on its consolidated financial statements.
In August 2009, the FASB issued ASU 2009-05 (previously exposed for comments as proposed FSP FAS 157-f) to provide guidance on measuring the fair value of liabilities under ASC Topic 820 Fair Value Measurements and Disclosures. ASU 2009-05 clarifies that the quoted price for the identical liability, when traded as an asset in an active market, is also a Level 1 measurement for that liability when no adjustment to the quoted price is required. In the absence of a Level 1 measurement, an entity must use certain valuation techniques to estimate fair value. ASU 2009-05 was effective for the Company on October 1, 2009 and did not have a material effect on its consolidated financial statements.
In October 2009, the FASB issued an update to existing guidance on revenue recognition for arrangements with multiple deliverables. This update will allow companies to allocate consideration received for qualified separate deliverables using estimated selling price for both delivered and undelivered items when vendor-specific objective evidence or third-party evidence is unavailable. Additional disclosures discussing the nature of multiple
69
Table of Contents
element arrangements, the types of deliverables under the arrangements, the general timing of their delivery, and significant factors and estimates used to determine estimated selling prices are required. This update is effective for the Company beginning January 1, 2011 and is not expected to have a material impact on the Company’s consolidated financial statements.
3. Acquisitions
Strategos
On April 17, 2008, UTEK purchased all of the shares of Carmi, Inc., a 100% owned subsidiary of Strategos, LLC, wherein Carmi, Inc. became a subsidiary of UTEK. Carmi, Inc. is being dissolved and all operations are included as a unit of UTEK, which is doing business as and is referred to as “Strategos” throughout these financial statements. The financial results of Strategos have been included in the Company’s consolidated financial statements from April 17, 2008.
The total purchase price for Strategos was $11.4 million, which consisted of 1,094,084 shares of UTEK unregistered common stock. Strategos stockholders were entitled to 502,970 shares of UTEK unregistered common stock valued at approximately $6,041,000 as of the acquisition date. In addition, Strategos stockholders received an additional 329,670 and 261,444 shares of UTEK unregistered common stock in 2008 and 2009, respectively, pursuant to having met specific revenue targets for those years. In allocating the purchase price based on estimated fair values, the Company recorded approximately $5.8 million of goodwill, $6.4 million of identifiable intangible assets and $(787,000) of net tangible assets.
Social Technologies
On October 10, 2008, UTEK purchased 100% of Social Technologies Group, Inc. (“Social Technologies”). The financial results of Social Technologies have been included in the Company’s consolidated financial statements from October 10, 2008.
The total purchase price for Social Technologies was $5.2 million, which consisted of 512,420 shares of UTEK unregistered common stock. Social Technologies stockholders were entitled to 499,014 shares of UTEK unregistered common stock valued at approximately $5,088,000 as of the acquisition date. In addition, Social Technologies stockholders received an additional 13,406 shares of UTEK unregistered common stock in 2009 pursuant to having met specific revenue targets for that year. In allocating the purchase price based on estimated fair values, we recorded approximately $5.7 million of goodwill, $2.2 million of identifiable intangible assets and $(2.7 million) of net tangible assets.
Pharmalicensing
On December 20, 2007, the Company entered into a stock purchase agreement with Partnering Intelligence Limited and Bridgehead International Limited to acquire Pharmalicensing Limited (“Pharmalicensing”). The transaction closed and became effective on January 3, 2008, at which time the Company issued 153,967 shares of unregistered UTEK common stock, valued at $2.15 million, to Partnering Intelligence in consideration for all of the shares of Pharmalicensing owned by Partnering Intelligence. In allocating the purchase price based on estimated fair values, we recorded approximately $1.5 million of goodwill, $858,000 of identifiable intangible assets and $(235,000) of net tangible assets. The financial results of Pharmalicensing have been included in the Company’s consolidated financial statements from January 3, 2008.
70
Table of Contents
Innovaro
On July 3, 2008, the Company entered into a stock purchase agreement to acquire 100% of Innovaro Limited (“Innovaro”), a company incorporated in the United Kingdom and Wales. The financial results of Innovaro have been included in the Company’s consolidated financial statements from July 3, 2008.
The total purchase price for Innovaro was $3.8 million, which consisted of 356,962 shares of UTEK unregistered common stock. Innovaro stockholders were entitled to 345,857 shares of UTEK unregistered common stock valued at approximately $3,664,000 as of the acquisition date. In addition, Innovaro stockholders received an additional 6,131 and 4,974 shares of UTEK unregistered common stock in 2008 and 2009, respectively, pursuant to having met specific revenue targets for those years. In allocating the purchase price based on estimated fair values, we recorded approximately $1.7 million of goodwill, $3.0 million of identifiable intangible assets and $(915,000) of net tangible assets.
Unaudited Pro Forma Financial Information
The unaudited financial information in the table below summarizes the combined results of operations of Strategos, Social Technologies, Innovaro and Pharmalicensing acquired during fiscal 2008, on a pro forma basis, as though the companies had been combined as of the beginning of fiscal 2007. The pro forma financial information is presented for informational purposes only and is not indicative of the results of operations that would have been achieved if the acquisitions had taken place at the beginning of each of the periods presented. The pro forma financial information for all periods presented also includes the business combination accounting effects on the historical companies’ operating results including the amortization expenses from acquired intangible assets, stock-based compensation charges for stock awards to acquired employees, and related tax effects as though the companies had been combined as of the beginning of fiscal 2007.
The unaudited pro forma financial information for the year ended December 31, 2008 combines the historical results of UTEK for the year ended December 31, 2008 and the historical results of Strategos, Social Technologies, Innovaro and Pharmalicensing for the year ended December 31, 2008, and the pro forma adjustments discussed above. The unaudited pro forma financial information for the year ended December 31, 2007 combines the historical results of UTEK for the year ended December 31, 2007 and the historical results of Strategos, Social Technologies, Innovaro and Pharmalicensing for the year ended December 31, 2007, and the pro forma adjustments discussed above.
| Year Ended Dec 31, | ||||||||
| 2008 | 2007 | |||||||
| Income from operations |
$ | 26,501,545 | $ | 38,689,163 | ||||
| Net decrease in net assets from operations |
$ | (26,156,397 | ) | $ | (9,975,743 | ) | ||
| Basic and diluted net decrease in net assets from operations per share |
$ | (2.40 | ) | $ | (0.92 | ) | ||
4. Investments
Under Investment Company Accounting
Through September 30, 2009, the Company was operating as an investment company under the 1940 Act and accounted for investments in accordance with Investment Company Accounting.
Investments at December 31, 2008 were valued at fair value as determined by the Board of Directors, with the assistance of appraisals provided by an independent valuation service provider, in the absence of readily available market values. The values assigned to these securities were based upon available information and may not reflect amounts that ultimately have been or may be realized. Accordingly, the fair values included in the accompanying schedule of investments as of December 31, 2008 may differ from the values that would have been used had a ready market existed for these securities and such differences could be material.
71
Table of Contents
In connection with the Company’s plan to de-elect BDC status, the Company liquidated a significant portion of its investment portfolio during 2009. The Company sold some or all of its shares in a significant number of its investments for $3.1 million in cash and other assets, which included $1.1 million in cash, $218,000 in common stock, $201,000 in an additional investment in UTEK Real Estate Holdings, Inc., and a $1.5 million note receivable. In connection therewith, the Company recognized realized losses of $49.6 million and unrealized appreciation of $44.3 million, which is primarily related to the reversal of previously recorded unrealized depreciation upon the sale of these investments, for the nine months ended September 30, 2009.
Under Operating Company Accounting
The Company began reporting as an operating company on October 1, 2009. In connection therewith, the Company modified the accounting treatment for it investments to conform to US GAAP for operating companies. See Note 1 for further discussion of the Company’s withdrawal of its election to be treated as an investment company under the 1940 Act and the effects on the Company’s financial statements.
Available-for-Sale Securities
As of October 1, 2009, the Company classifies its investments in freely tradable equity securities as available-for-sale in accordance with US GAAP and its intentions regarding these instruments. A summary of the estimated fair value of available-for-sale securities is as follows as of December 31, 2009.
| Cost | Unrealized(1) | ||||||||||||
| Gains | Losses | Fair Value | |||||||||||
| Equity securities |
$ | 800,746 | $ | 282,684 | $ | (353,630 | ) | $ | 729,800 | ||||
| Available-for-Sale Securities |
$ | 800,746 | $ | 282,684 | $ | (353,630 | ) | $ | 729,800 | ||||
| (1) | The total of the unrealized gains and losses of $(70,946) is included in operating company equity as a component of accumulated other comprehensive income (loss) in the consolidated balance sheet. |
As of December 31, 2009, five of our nine total available-for-sale securities were in an unrealized loss position, all of which were for a period of less than twelve months. These securities are in micro-cap companies in various industries and the impairment is significant as it relates to three of the five investments. In all cases, the impairment is deemed to have been caused by general market fluctuations. Based on third-party valuations, the Company believes these impairments are not other-than-temporary. Accordingly, no impairment loss has been recognized on these securities.
Proceeds from the sale of available-for-sale securities for the three months ended December 31, 2009 were approximately $453,000. Gross realized gains (losses) were approximately $20,000 for the three months ended December 31, 2009.
Fair Value Hierarchy
The Company values substantially all of its investments at fair value as determined in good faith by the Board of Directors in accordance with the Company’s valuation policy, the provisions of the 1940 Act and US GAAP through September 30, 2009. Subsequent to October 1, 2009, the Company values its investments in certificates of deposits and available-for-sale securities and its derivative liability at fair value in accordance with US GAAP. US GAAP establishes a fair value hierarchy that encourages and is based on the use of observable inputs, but allows for unobservable inputs when observable inputs do not exist. When there are multiple inputs for determining the fair value of an investment, the Company classifies the investment in the fair value hierarchy based on the lowest level input that is significant to the fair value measurement. Inputs are classified into one of three categories:
72
Table of Contents
| • | Level 1—Unadjusted quoted prices in active markets for identical assets or liabilities. |
| • | Level 2—Quoted prices in active markets for similar assets or liabilities, or quoted prices for identical or similar assets or liabilities in markets that are not active, or inputs other than quoted prices that are observable for the asset or liability. |
| • | Level 3—Unobservable inputs for the asset of liability. |
Assets measured at fair value on a recurring basis by level within the fair value hierarchy at December 31, 2009 and 2008, were as follows:
| Fair Value Measurements at Reporting Date Using | ||||||||||||||
| Description |
Fair Value | Quoted Prices in Active Markets for Identical Assets (Level 1) |
Significant Other Observable Inputs (Level 2) |
Significant Unobservable Inputs (Level 3) | ||||||||||
| Certificates of deposit at |
$ | 492,246 | $ | — | $ | 492,246 | $ | — | ||||||
| Available-for-sale securities at 12/31/09 |
$ | 729,800 | $ | — | $ | 729,800 | $ | — | ||||||
| Derivative liability at |
$ | (664,972 | ) | $ | — | $ | (664,972 | ) | $ | — | ||||
| Total investments at |
$ | 12,359,721 | $ | — | $ | 12,359,721 | $ | — | ||||||
The Company’s investments are classified within Level 2 of the fair value hierarchy. Our equity interests in companies for which there is no liquid public market are valued using quoted market prices for identical or similar instruments in markets that are not active. The determined values are generally discounted to account for the illiquid nature of the investment and minority ownership positions. The value of our equity interests in public companies for which market quotations are readily available is based on quoted market prices for similar instruments in an active market. These securities are generally thinly traded and/or carry discounts from the public market value for certain restrictions on resale. The Company utilizes the assistance of an independent valuation firm in determining these values.
The Company’s derivative liability is classified within Level 2 of the fair value hierarchy. The Company utilizes the Black-Scholes Option Pricing Model to value the derivative liability utilizing observable inputs such as the Company’s common stock price, the exercise price of the warrants, and expected volatility, which is based on historical volatility.
5. Fixed Assets
Fixed assets consist of the following:
| December 31, | ||||||||
| 2009 | 2008 | |||||||
| Computer Equipment |
$ | 316,250 | $ | 708,334 | ||||
| Furniture and Fixtures |
651,948 | 394,314 | ||||||
| Leasehold Improvements |
9,085 | 25,883 | ||||||
| Building |
2,169,128 | — | ||||||
| Building Improvements |
1,824,546 | — | ||||||
| Land |
4,388,625 | — | ||||||
| 9,359,582 | 1,128,531 | |||||||
| Less: Accumulated Depreciation |
(971,319 | ) | (475,323 | ) | ||||
| $ | 8,388,263 | $ | 653,208 | |||||
73
Table of Contents
Depreciation expense was approximately $215,000, $164,000 and $145,000 for the years ended December 31, 2009, 2008, and 2007, respectively.
6. Goodwill and Intangible Assets
In accordance with US GAAP, goodwill is not subject to amortization. Goodwill and indefinite-lived assets are reviewed for impairment by applying a fair value based test on an annual basis or more frequently if circumstances indicate impairment may have occurred. The Company assesses goodwill for impairment by comparing the carrying value of its reporting units to their respective fair values and reviewing the Company’s market value of invested capital. Management engages an independent valuation firm to assist in its impairment assessment reviews. The Company determines the fair value of its reporting units primarily by comparing the reporting unit to similar business ownership interests that have been sold. The Company also uses comparative price-to-book multiples and other factors to corroborate the reasonableness of the conclusion.
As a result of significant declines in revenues related to its futures and foresight projects, management determined that there was possible goodwill and intangible asset impairment for our Social Technologies division (innovation consulting segment). Therefore, interim impairment testing was performed as of June 30, 2009. The state of the economy early in 2009 contributed to potential Social Technologies’ clients focusing on short-term survival rather than long-term foresight planning. As a result, management terminated the majority of this division’s employees in favor of an independent, network-based approach in an effort to reduce overhead. Management concluded that this division suffered a significant adverse change in the business, which included a projection of continuing operating and cash flow losses. The Company determined that there was impairment of this division’s purchased intangible assets of $1.0 million and impairment of the division’s goodwill of $1.3 million. This impairment loss is included in the Company’s consolidated statement of operations for the nine months ended September 30, 2009. Based on the annual impairment analysis completed with the assistance of an independent valuation firm, the Company determined that no additional impairment exists at December 31, 2009.
In connection with our annual impairment analysis in 2007, we determined there was impairment of the goodwill related to the Pharma Transfer, Ltd. and Knowledge Express acquisitions. As a result, we recorded a partial impairment of the related goodwill during 2007. These write-downs resulted in an impairment charge of approximately $159,000 ($99,000 after tax) for the United Kingdom segment and $51,000 ($32,000 after tax) for the United States segment during 2007. This impairment loss is included in the Company’s consolidated statement of operations for the year ended December 31, 2007.
74
Table of Contents
The following table presents goodwill and intangible assets as of December 31, 2009 and 2008.
| 2009 | 2008 | |||||||||||||||||||
| Weighted Average Life |
Gross Carrying Amount |
Accumulated Amortization |
Net Carrying Amount |
Gross Carrying Amount |
Accumulated Amortization |
Net Carrying Amount | ||||||||||||||
| Amortizable intangible assets: |
||||||||||||||||||||
| Trade names/trademarks/ websites |
5.0 years | $ | 674,293 | $ | 438,574 | $ | 235,719 | $ | 636,642 | $ | 321,037 | $ | 315,605 | |||||||
| Proprietary software/ processes/ know-how |
6.1 years | 3,172,396 | 807,598 | 2,364,798 | 3,737,093 | 336,583 | 3,400,510 | |||||||||||||
| Non-compete agreements |
3.4 years | 709,862 | 324,701 | 385,161 | 697,404 | 111,585 | 585,819 | |||||||||||||
| Customer list |
8.1 years | 3,749,493 | 833,054 | 2,916,439 | 3,851,759 | 370,621 | 3,481,138 | |||||||||||||
| Total amortizable intangible assets, net |
5,902,117 | 7,783,072 | ||||||||||||||||||
| Infinite-lived intangible assets: |
||||||||||||||||||||
| Trade names |
2,590,184 | 2,880,903 | ||||||||||||||||||
| Total intangible assets, net |
$ | 8,492,301 | $ | 10,663,975 | ||||||||||||||||
| Goodwill |
$ | 15,874,139 | $ | 15,246,143 | ||||||||||||||||
The changes to the net carrying value of goodwill by product segment for the years ended December 31, 2009 and 2008 are as follows:
| Innovation Consulting |
Subscription Services |
Other Services |
Total | |||||||||||||
| Balance as of December 31, 2007 |
$ | — | $ | 1,809,000 | $ | 1,012,064 | $ | 2,821,064 | ||||||||
| Increases due to acquisitions and earnouts |
11,646,767 | 1,766,991 | — | 13,413,758 | ||||||||||||
| Impairment |
— | — | — | — | ||||||||||||
| Translation adjustment |
(374,803 | ) | (457,867 | ) | (156,009 | ) | (988,679 | ) | ||||||||
| Balance as of December 31, 2008 |
11,271,964 | 3,118,124 | 856,055 | 15,246,143 | ||||||||||||
| Increases due to acquisitions and earnouts |
1,622,484 | — | — | 1,622,484 | ||||||||||||
| Impairment |
(1,325,767 | ) | — | — | (1,325,767 | ) | ||||||||||
| Translation adjustment |
140,765 | 143,476 | 47,038 | 331,279 | ||||||||||||
| Balance as of December 31, 2009 |
$ | 11,709,446 | $ | 3,261,600 | $ | 903,093 | $ | 15,874,139 | ||||||||
75
Table of Contents
The changes to the net carrying value of intangible assets by product segment for the years ended December 31, 2009 and 2008 are as follows:
| Innovation Consulting |
Subscription Services |
Other Services |
Total | |||||||||||||
| Balance as of December 31, 2007 |
$ | — | $ | 117,146 | $ | 6,667 | $ | 123,813 | ||||||||
| Increases due to acquisitions and earnouts |
11,583,488 | 858,386 | — | 12,441,874 | ||||||||||||
| Amortization |
(749,534 | ) | (173,284 | ) | (6,667 | ) | (929,485 | ) | ||||||||
| Impairment |
— | — | — | — | ||||||||||||
| Translation adjustment |
(772,726 | ) | (199,501 | ) | — | (972,227 | ) | |||||||||
| Balance as of December 31, 2008 |
10,061,228 | 602,747 | — | 10,663,975 | ||||||||||||
| Increases due to acquisitions and earnouts |
— | — | — | — | ||||||||||||
| Amortization |
(1,247,724 | ) | (155,643 | ) | — | (1,403,367 | ) | |||||||||
| Impairment |
(1,042,692 | ) | — | — | (1,042,692 | ) | ||||||||||
| Translation adjustment |
218,231 | 56,154 | — | 274,385 | ||||||||||||
| Balance as of December 31, 2009 |
$ | 7,989,043 | $ | 503,258 | $ | — | $ | 8,492,301 | ||||||||
Finite-lived intangible assets are being amortized over the estimated useful lives of the respective assets, which range between three and twelve years. Total amortization expense related to intangible assets was approximately $1,401,000, $929,500 and $66,000 for the years ended December 31, 2009, 2008 and 2007, respectively.
The estimated aggregate future amortization expense related to the Company’s intangible assets with finite lives is as follows:
| For the years |
|||
| 2010 |
$ | 1,315,440 | |
| 2011 |
1,228,790 | ||
| 2012 |
1,103,754 | ||
| 2013 |
1,006,368 | ||
| 2014 |
695,051 | ||
| Thereafter |
552,714 | ||
| Total |
$ | 5,902,117 | |
76
Table of Contents
7. Long-term Debt
The Company had the following long-term debt at December 31, 2009:
| $3,000,000 note payable, bank, due in monthly installments of $20,436 including principal and interest at 6.50% through April 1, 2013 with a balloon payment due on May 1, 2013; collateralized by the Company’s corporate office building and related land |
$ | 2,921,541 | |
| $1,750,000 note payable, due in quarterly installments of interest in arrears at 8.00% with principal due in full on October 22, 2013; less applicable debt discount (discussed below); collateralized by a security interest in 68% of one of the Company’s subsidiaries, which owns undeveloped land in Hernando County, Florida |
1,230,506 | ||
| $1,500,000 note payable, due in monthly installments of interest at 5.25% with principal due in full on October 1, 2015; collateralized by undeveloped land in Hillsborough County, Florida |
1,250,000 | ||
| $600,000 note payable, bank, due in monthly installments of $14,420 including principal and interest at 7.09% through November 2011 |
456,613 | ||
| $450,000 bank revolving line of credit, due in monthly installments of interest at 5.25%; collateralized by certificates of deposit |
250,000 | ||
| Capital leases on computer equipment, due in monthly installments of up to $6,053 expiring through July 2010, imputed interest rates of between 7.0% and 13.0% |
45,015 | ||
| Insurance financing, due in monthly installments of $9,711 including principal and interest at 5.83% through September 2009 |
85,324 | ||
| $75,000 bank credit card financing, due in monthly installments of interest at 11.99% |
16,729 | ||
| $50,000 bank credit card financing, due in monthly installments of interest at 7.74% |
48,524 | ||
| $25,000 bank credit card financing, due in monthly installments of interest at 7.0% |
25,000 | ||
| Total long-term debt |
6,329,252 | ||
| Less current maturities |
975,360 | ||
| Non current portion |
$ | 5,353,892 | |
Payments required for the next five years on the long-term debt balance as of December 31, 2009 are as follows:
| For the years ending December 31, |
||||
| 2010 |
$ | 978,318 | ||
| 2011 |
38,955 | |||
| 2012 |
1,817,500 | |||
| 2013 |
2,247,779 | |||
| 2014 |
— | |||
| Thereafter |
1,250,000 | |||
| 6,332,552 | ||||
| Less imputed interest on capital lease obligations |
(3,300 | ) | ||
| $ | 6,329,252 | |||
Amortization expense related to capitalized leases was approximately $27,000 and $4,000 for the years ended December 31, 2009 and 2008, respectively. Accumulated depreciation related to computer equipment under capital lease obligations was approximately $32,000 and $7,000 at December 31, 2009 and 2008, respectively. This depreciation expense relates to approximately $140,000 of equipment purchased under capital lease agreements, of which $125,000 is still under capital lease at December 31, 2009.
77
Table of Contents
Note and Warrant Purchase Agreement
On October 22, 2009, the Company entered into a Note and Warrant Purchase Agreement (the “Purchase Agreement”) with Gators Lender, LLC (the “Lender”), pursuant to which the Company borrowed $1,750,000 from the Lender. In connection with this transaction, the Company issued a Promissory Note (the “Note”) to the Lender in the principal amount of $1,750,000. UTEK Real Estate is a co-borrower under the Note.
Pursuant to an Absolute Guaranty of Payment and Performance, this loan is guaranteed by all of the Company’s subsidiaries, including newly formed subsidiaries. In addition, this guaranty was secured pursuant to a Mortgage and Security Agreement encumbering vacant real property located in Hernando County, Florida (the “Collateral”), which is owned by Cortez 114, LLC (“Cortez”), a subsidiary of UTEK Real Estate.
Pursuant to a February 26, 2010, Substitution of Collateral Agreement and a Membership Interest Pledge Agreement and Release of Mortgage, the Lender’s security interest in the Collateral was released and replaced by a security interest in 68 Units, constituting 68% of the outstanding membership interests of Cortez. The Note was amended and restated to provide that UTEK and UTEK Real Estate must pay down $500,000 of the indebtedness to the Lender within 60 days.
Interest is payable on the outstanding principal amount of the Note at an annual rate of 8.00%. Interest is payable on a quarterly basis, in arrears, beginning April 15, 2010. The entire principal amount outstanding and all accrued interest is payable in full no later than October 22, 2012. The entire principal amount outstanding may be repaid earlier at the discretion of the Company, subject to certain prepayment penalties. The Note also includes customary event of default provisions, including the failure to make timely payments, material misrepresentations, change of control of the Company, defaults on other obligations in excess of $100,000, the grant of a senior security interest on the property securing this loan, the liquidation of the Company, bankruptcy and certain judicial judgments.
As additional consideration for this loan, the Company also entered into a Warrant Agreement with the Lender to allow the Lender to purchase up to 437,500 shares of the Company’s common stock at any time until October 22, 2014 at an exercise price of $4.48 per share. The exercise price is subject to certain conditions and adjustments that make the exercise price variable prior to the issuance of the Company’s common stock pursuant to the Warrant Agreement.
The Company determined that the embedded feature (ratchet down of exercise price) in the warrants is not indexed to the Company’s own stock due to the variability in the exercise price of the warrants and, therefore, is an embedded derivative financial liability, which requires bifurcation and to be separately accounted for pursuant to US GAAP. The Company uses the Black-Scholes option pricing model to estimate the fair value of the derivative instrument, for which we employed certain assumptions as follows: The expected dividend yield is based on the current historical yield of 0%. The expected volatility is based on historical volatility for a period equal to the expected life of the warrants of 39%. The risk-free interest rate is based on the US Treasury yield curve in effect of 2.39% at Oct 22, 2009 and 2.69% at Dec 31, 2009. The expected term of the warrants is based on the contractual term of the warrants and expectations of the warrants holders’ behavior of 5 years from inception. This model also uses the current market price of the Company’s common stock and the exercise price of the warrants in the fair value calculation.
The Company determined the value of the derivative instrument to be $554,972 upon issuance of the warrants and recorded a debt discount and offsetting derivative liability. The debt discount is being amortized over the life of the debt, which is three years. The Company recorded interest expense of $35,478 related to the amortization of debt discount for the three months ended December 31, 2009. The derivative liability is required to be revalued to fair value at the end of each quarter and the value is adjusted accordingly. The Company recorded a loss on derivative liability of $110,000 for the three months ended December 31, 2009 in connection with adjusting the derivative liability to fair value.
78
Table of Contents
The following shows the components comprising the carrying value of this note at December 31, 2009:
| Original issue price of note |
$ | 1,750,000 | ||
| Original issue discount |
(554,972 | ) | ||
| Amortization of discount |
35,478 | |||
| Carrying value of note |
$ | 1,230,506 | ||
8. Income Taxes
Deferred income tax assets and liabilities are determined based upon differences between financial reporting and tax basis of assets and liabilities and are measured using the enacted tax rates and laws that will be in effect when the differences are expected to reverse.
The components of the income tax provision on operations, excluding income tax expense (benefit) on realized gains (losses) and unrealized appreciation (depreciation) of investments are as follows:
| Year Ended December 31, | ||||||||||
| 2009 | 2008 | 2007 | ||||||||
| Current: |
||||||||||
| Federal |
$ | — | $ | — | $ | — | ||||
| State |
— | — | — | |||||||
| Foreign |
— | — | — | |||||||
| $ | — | $ | — | $ | — | |||||
| Deferred: |
||||||||||
| Federal |
$ | (85,270 | ) | $ | 3,226,295 | $ | 2,482,024 | |||
| State |
(9,104 | ) | 344,454 | 264,993 | ||||||
| Foreign |
(180,685 | ) | 126,738 | — | ||||||
| (275,059 | ) | 3,697,487 | 2,747,017 | |||||||
| Provision for income taxes |
$ | (275,059 | ) | $ | 3,697,487 | $ | 2,747,017 | |||
A reconciliation of the differences between the effective income tax rate and the statutory federal tax rate follows:
| Year Ended December 31, | |||||||||||
| 2009 | 2008 | 2007 | |||||||||
| Tax at US statutory rate |
$ | (3,396,646 | ) | $ | (1,933,074 | ) | $ | 2,218,078 | |||
| State taxes, net of federal benefit |
(357,147 | ) | (206,384 | ) | 236,812 | ||||||
| Foreign rate differential |
38,929 | 140,720 | — | ||||||||
| Stock options |
202,999 | 252,456 | 149,560 | ||||||||
| Amortization of intangible assets |
510,508 | 6,739 | 142,567 | ||||||||
| (3,001,357 | ) | (1,739,543 | ) | 2,747,017 | |||||||
| Change in valuation allowance |
2,726,298 | 5,437,030 | — | ||||||||
| Provision for income taxes |
$ | (275,059 | ) | $ | 3,697,487 | $ | 2,747,017 | ||||
Related to the Company’s status as an investment company during the nine months ended September 30, 2009, the Company has changes in unrealized losses and realized losses on investments totaling $64,658,725 and $(69,399,078), respectively. Additionally, related to the Company’s status as an operating company from October 1, 2009 through December 31, 2009, the Company has unrealized losses on available-for-sale securities
79
Table of Contents
and foreign currency translation adjustments of $70,946 and $(697,682), respectively. These amounts are included as a component of stockholders’ equity in the respective periods. Accordingly, these amounts as tax-effected are included in the Company’s valuation allowance, but would not be reflected in the change in the valuation allowance in the accompanying reconciliation of the effective rate to the statutory rate for 2009.
Significant components of the Company’s deferred tax assets and liabilities as of December 31, 2009 are as follows:
| 2009 | ||||
| Current |
||||
| Accrued expenses |
$ | 19,246 | ||
| Revenue recognition |
48,996 | |||
| Subtotal current deferred tax asset |
68,242 | |||
| Non-current |
||||
| Net operating loss carryforward |
11,575,000 | |||
| Capital loss carryforward |
3,350,600 | |||
| Intangible assets |
(3,029,471 | ) | ||
| Investments |
2,330,697 | |||
| Other |
231,257 | |||
| Subtotal non-current deferred tax asset |
14,458,083 | |||
| Total deferred tax asset |
14,526,325 | |||
| Less: valuation allowance |
(15,829,356 | ) | ||
| Net deferred tax liability |
$ | (1,303,031 | ) | |
Significant components of the Company’s deferred tax assets and liabilities as of December 31, 2008 are as follows:
| 2008 | ||||
| Net operating loss carryforward |
$ | 7,138,377 | ||
| Intangible assets |
(4,009,708 | ) | ||
| Other |
567,817 | |||
| Investments |
5,680,682 | |||
| Subtotal |
9,377,168 | |||
| Less: valuation allowance |
(11,150,609 | ) | ||
| Net deferred tax liability |
$ | (1,773,441 | ) | |
US GAAP requires a valuation allowance to reduce the deferred tax assets reported if, based on the weight of the evidence, it is more likely than not that some portion or all of the deferred tax assets will not be realized. During 2008, management determined that it was more likely than not that net operating loss carryforwards in UTEK would not be utilized in the future. Accordingly, a valuation allowance of $15.8 million and $11.2 million and was recorded for 2009 and 2008, respectively.
At December 31, 2009, the Company had available U.S. net operating loss carryforwards of approximately $30,011,000, which expire as follows: 2021-$753,000; 2022-$371,000; 2023-$1,645,000; 2024-$69,000; 2025-$3,835,000; 2027-$5,076,000; 2028-$5,423,000; and 2029-$12,839,000.
9. Stock-Based Compensation
The Company has two stock-based equity compensation plans at December 31, 2009. The Company adopted a stock option plan in September 1999 (the “1999 Plan”) and a non-qualified stock option plan in February 2000 (the “2000 Plan”). Under the terms of the 1999 Plan, as amended, the Company is authorized to
80
Table of Contents
issue options to purchase up to 2,211,274 shares of the Company’s common stock. The options are intended to be incentive stock options within the meaning of Section 422 of the Internal Revenue Code (the “Code”), however, options may be issued under the 1999 Plan, as amended, that do not qualify for incentive treatment under the Code. Under the terms of the 2000 Plan, the Company is authorized to issue options to purchase up to 315,000 shares of the Company’s common stock. Under the 2000 Plan, as amended, the Company may only issue options that do not qualify for incentive treatment under Section 422 of the Code. Options, under both plans, are granted at the fair market value of the stock on the date of grant, except in the case of a more than 10% shareholder for which grants are exercisable at 110% of fair market value of the stock on the date of grant. Options generally become fully vested three to four years from the date of grant and expire five to seven years from the date of grant. At December 31, 2009, the Company had 1,194,837 shares available for future stock option grants under existing plans.
Stock-based compensation cost recognized during the years ended December 31, 2009, 2008 and 2007 includes compensation cost for all share-based payments granted prior to, but not yet vested as of January 1, 2006 and compensation cost for all share-based payments granted subsequent to January 1, 2006, based on their respective grant date fair values estimated in accordance with US GAAP. The Company recognizes compensation expense on a straight-line basis over the requisite service period. The Company estimates forfeitures, both at the grant date as well as throughout the requisite service period, based on the Company’s historical experience and future expectations.
In accordance with US GAAP, the Company is required to estimate at the grant date the number of share options for which the requisite service is expected to be rendered. The Company estimated that 80% of the requisite service of its stock options issued from 2006 through 2008 would be rendered. Management revised its estimate of the forfeiture rate of these options in the second quarter of 2009. The revision to the forfeiture rate was accounted for as a change in estimate and its cumulative effect of $65,000, a reduction in stock-based compensation, was recognized in the second quarter of 2009. In connection with this revision, stock-based compensation for prospective periods will also be reduced by $794,000 over the next 2.75 years.
The Company uses the Black-Scholes option pricing model to estimate the fair value of stock-based awards on the date of grant. The assumptions employed in the calculation of the fair value of share-based compensation expense were calculated as follows for all years presented:
| • | Expected dividend yield — based on the Company’s historical dividend yield. |
| • | Expected volatility — based on the Company’s historical market price at consistent points in a period equal to the expected life of the options. |
| • | Risk-free interest rate — based on the US Treasury yield curve in effect at the time of grant. |
| • | Expected life of options — 2008 and 2009: based on the Company’s historical life of options exercised, giving consideration to the contractual terms of the grants, vesting schedules and expectations of future employee behavior; 2007: calculated using the simplified method as prescribed by US GAAP, where the expected life is equal to the sum of the vesting period and the contractual term divided by two. |
The following table summarizes the assumptions used to estimate the fair value of stock options granted during the years ended December 31, 2009, 2008 and 2007.
| 2009 | 2008 | 2007 | ||||
| Expected dividend yield |
0% | 0% | 0-0.25% | |||
| Expected volatility |
37-44% | 34-38% | 37-40% | |||
| Risk-free interest rate |
1.28-1.84% | 1.18-3.00% | 3.40-4.91% | |||
| Expected life of options |
4.0 years | 4.0 years | 3.75-3.88 years | |||
| Weighted average grant date fair value |
$1.48 | $3.08 | $ 4.73 |
81
Table of Contents
Net cash proceeds from the exercise of stock options were approximately $0, $190,000 and $543,000 for the years ended December 31, 2009, 2008 and 2007, respectively. Total compensation cost related to stock options was approximately $577,000, $780,000 and $613,000 for the years ended December 31, 2009, 2008 and 2007, respectively. The tax benefits from the exercise of common stock options and from the recognition of compensation costs were not significant during 2009, 2008 or 2007. At December 31, 2009, there was approximately $1,473,000 of unrecognized compensation cost related to stock options which is expected to be recognized over a weighted average period of 2.6 years.
The following table represents stock option activity as of and for the three years ended December 31, 2009:
| Number of Shares |
Weighted Average Exercise Price |
Weighted Average Remaining Contractual Life |
Aggregate Intrinsic Value | ||||||||
| Options Outstanding—December 31, 2006 |
582,050 | $ | 13.18 | ||||||||
| Granted |
291,500 | 13.80 | |||||||||
| Exercised |
(75,267 | ) | 13.44 | $ | 485,000 | ||||||
| Forfeited/cancelled/expired |
(146,258 | ) | 7.03 | ||||||||
| Options Outstanding—December 31, 2007 |
652,025 | $ | 14.08 | ||||||||
| Granted |
572,500 | 9.82 | |||||||||
| Exercised |
(31,015 | ) | 6.12 | $ | 129,000 | ||||||
| Forfeited/cancelled/expired |
(205,110 | ) | 13.10 | ||||||||
| Options Outstanding—December 31, 2008 |
988,400 | $ | 12.09 | ||||||||
| Granted |
776,500 | 4.46 | |||||||||
| Exercised |
— | ||||||||||
| Forfeited/cancelled/expired |
(463,250 | ) | 11.19 | ||||||||
| Options Outstanding—December 31, 2009 |
1,301,650 | $ | 7.86 | 5.44 years | $ | 86,350 | |||||
| Options Exercisable—December 31, 2009 |
267,650 | $ | 13.77 | 2.72 years | $ | — | |||||
The total grant date fair value of options vested during the years ended December 31, 2009, 2008 and 2007 was approximately $544,000, $547,000 and $434,000, respectively.
The following table summarizes information about outstanding and exercisable stock options at December 31, 2009:
| Outstanding Options | Exercisable Options | |||||||||||
| Range of Exercise Prices |
Outstanding at 12/31/09 |
Weighted Average Exercise Price |
Remaining Contractual Life in Years |
Exercisable at 12/31/09 |
Weighted Average Exercise Price | |||||||
| $3.97 - $5.05 |
756,500 | $ | 4.46 | 6.73 | 6,250 | $ | 4.59 | |||||
| $9.05 - $9.30 |
83,500 | 9.27 | 5.92 | 21,250 | 9.27 | |||||||
| $10.22 - $10.50 |
184,250 | 10.44 | 5.40 | 47,000 | 10.45 | |||||||
| $13.00 - $13.95 |
147,900 | 13.47 | 2.04 | 81,400 | 13.48 | |||||||
| $14.02 - $15.90 |
88,500 | 15.59 | 1.49 | 73,500 | 15.56 | |||||||
| $18.40 - $22.04 |
41,000 | 19.23 | 1.53 | 38,250 | 19.06 | |||||||
| 1,301,650 | $ | 7.86 | 5.44 | 267,650 | $ | 13.77 | ||||||
10. Employee Benefit Plan
The Company previously offered the UTEK Corporation Simple IRA Plan (the “IRA Plan”) to employees of the Company and its subsidiaries. The IRA Plan allows employees who satisfy the service requirements of the
82
Table of Contents
IRA Plan to contribute pre-tax wages to the IRA Plan, subject to legal limits, $10,500 in 2008 with “catch up” deferrals of an additional $2,000 for participants age 50 and older. The Company matched 100% of the first 3% of wages contributed by employees. The Company’s matching contributions vest immediately and were approximately $171,000 and $74,000 for the years ended December 31, 2008 and 2007, respectively.
On February 1, 2009, the Company adopted the UTEK Corporation 401k Plan (the “401k Plan”). The 401k Plan replaced the IRA Plan for employees of the Company and its subsidiaries. The 401k Plan allows employees who satisfy the service requirements of the 401k Plan, which include being 21 years of age and having three months of service, to contribute pre-tax wages to the 401k Plan, subject to legal limits. The Company matches 100% of the first 3%, and 50% of the second 2%, of compensation contributed by employees. The Company’s contributions vest immediately and were approximately $170,000 during the year ended December 31, 2009.
11. Segment Reporting
The Company’s principal area of activity is providing technology transfer services and supporting innovation consulting services. The Company has three reportable geographical operating segments: United Kingdom, Israel and the United States. The United Kingdom segment includes the Company’s wholly owned subsidiary UTEK-Europe, Ltd., the Israel segment includes the Company’s wholly owned subsidiary UTEKip, Ltd., and the United States (“U.S.”) segment includes UTEK Corporation. UTEKip was closed down in the second quarter of 2008 and all operations of that segment are currently being serviced by the US segment.
A summary of revenue and other financial information by reportable geographical operating segment is shown below:
| United Kingdom | United States | Consolidated | |||||||
| Long-lived assets December 31, 2009 |
$ | 5,887,520 | $ | 26,867,183 | $ | 32,754,703 | |||
| Total assets December 31, 2009 |
6,411,846 | 33,919,335 | 40,331,181 | ||||||
| Long-lived assets December 31, 2008 |
5,659,892 | 20,903,434 | 26,563,326 | ||||||
| Total assets December 31, 2008 |
6,304,527 | 39,581,682 | 45,886,209 | ||||||
| For the year ended December 31, 2009 | ||||||||||||||||
| United Kingdom | United States | Consolidated | ||||||||||||||
| Revenue / Income from operations |
$ | 1,875,221 | $ | 8,902,282 | $ | 10,777,503 | ||||||||||
| Income (loss) before income taxes |
(648,825 | ) | (9,590,891 | )(2) | (10,239,716 | ) | ||||||||||
| Depreciation and amortization |
434,286 | 1,181,578 | 1,615,864 | |||||||||||||
| For the year ended December 31, 2008 | ||||||||||||||||
| United Kingdom | Israel | United States | Consolidated | |||||||||||||
| Revenue / Income from operations |
$ | 1,694,503 | $ | 8,638 | $ | 18,474,978 | $ | 20,178,119 | ||||||||
| Income (loss) before income taxes |
(434,786 | ) | 634,433 | (1) | (6,536,972 | )(1) | (6,337,325 | ) | ||||||||
| Depreciation and amortization |
296,300 | 2,750 | 797,440 | 1,096,490 | ||||||||||||
| For the year ended December 31, 2007 | ||||||||||||||||
| United Kingdom | Israel | United States | Consolidated | |||||||||||||
| Revenue / Income from operations |
$ | 274,221 | $ | 123,511 | $ | 19,903,217 | $ | 20,300,949 | ||||||||
| Income (loss) before income taxes |
(116,568 | ) | (164,481 | ) | 6,804,808 | (1) | 6,523,759 | |||||||||
| Depreciation and amortization |
1,658 | 7,021 | 203,671 | 212,350 | ||||||||||||
| (1) | The Company dissolved UTEKip, which resulted in a gain for the Israel segment and an offsetting loss for the US segment of approximately $753,000 in 2008. The Company dissolved UTEKip with the transfer of operations to the US segment. |
| (2) | The Company recognized a $2.4 million impairment loss for the U.S. segment during 2009. |
83
Table of Contents
During 2008, the Company changed the way it classifies and records its revenues and certain expenses to provide additional information for management. As a result of the Company’s new products and services from the acquisitions of Pharmalicensing, Strategos, Social Technologies and Innovaro, the Company now has product segments for which certain information can be reported. These reportable product segments include: technology transfer business; innovation consulting comprised of the consulting portion of Strategos, Social Technologies and Innovaro businesses; subscription services comprised of the Company’s online licensing services business; and all other services comprised of global technology licensing and other services. The administrative and other column represents miscellaneous and other income items and general and administrative type expenses that are not allocated amongst the different businesses. Management does not analyze assets for decision making purposes as it relates to the segments below. Accordingly, information is not available for long-lived assets or total assets.
A summary of revenue and other financial information by reportable product segment is shown below:
| For the Year Ended December 31, 2009 | ||||||||||||||||||||||
| Sale of Technology Rights |
Innovation Consulting |
Subscription Services |
All Other Services |
Administrative and Other |
Total | |||||||||||||||||
| Revenue / Income from operations |
$ | — | $ | 7,491,034 | $ | 2,091,586 | $ | 1,135,279 | $ | 59,604 | $ | 10,777,503 | ||||||||||
| Income (loss) before income taxes |
— | (4,977,744 | ) | 305,745 | 53,942 | (5,621,659 | ) | (10,239,716 | ) | |||||||||||||
| For the Year Ended December 31, 2008 | ||||||||||||||||||||||
| Sale of Technology Rights |
Innovation Consulting |
Subscription Services |
All Other Services |
Administrative and Other |
Total | |||||||||||||||||
| Revenue / Income from operations |
$ | 4,684,680 | $ | 11,134,855 | $ | 2,102,015 | $ | 1,857,228 | $ | 399,341 | $ | 20,178,119 | ||||||||||
| Income (loss) before income taxes |
1,869,666 | (102,657 | ) | (165,262 | ) | 157,114 | (8,096,186 | ) | (6,337,325 | ) | ||||||||||||
12. Commitments and Contingencies
Employment Agreements and Severance Liability
Clifford M. Gross, Ph.D. retired from his position as the Company’s chief executive officer on March 1, 2009, following the conclusion of the term of his employment agreement. We entered into a separation agreement with Dr. Gross on April 8, 2009 that modified the payment terms, but not the monetary obligation amount that Dr. Gross was entitled to receive pursuant to the employment agreement. In connection therewith, the Company issued to Dr. Gross a $550,000 promissory note that does not bear any interest and is due and payable on March 1, 2010. Pursuant to the terms of the promissory note, the Company had the option to elect to transfer certain equity interests in one of its subsidiaries, Cortez 114, LLC (“Cortez”), which owns real estate located in Hernando County, Florida, to Dr. Gross in lieu of making the $550,000 cash payment upon maturity of the promissory note.
Subsequent to December 31, 2009, we satisfied our remaining severance obligation to Dr. Gross through the conveyance of a 32% ownership interest in Cortez. In connection with this severance payment, we paid approximately $320,000 to satisfy the related payroll taxes.
The Company has various other employment agreements with its executive officers and certain other employees, some of which were entered into in connection with the acquisitions made by the Company during 2008. Obligations under these employment agreements total $2,546,000 and $1,568,000 for the years ending December 31, 2010 and 2011, respectively. In addition, certain agreements provide for discretionary bonuses and severance packages. There are also 25,000 stock options issuable in 2010 under these agreements.
84
Table of Contents
Bonus Plans
The Company has a Strategos Bonus Plan for qualifying Strategos division employees. The award pool is determined from eligible earnings and aggregate revenues and is limited to the extent required to permit Strategos to maintain sufficient operating cash. Awards are to be paid out by December 15th of each year and are accrued on a quarterly basis. Approximately 85% to 90% of Strategos net income will be paid out in connection with this bonus plan. The Company recognized bonus expense of approximately $330,000 and $5.9 million in connection with the Strategos Bonus Plan during the years ended December 31, 2009 and 2008, respectively.
The Company has an Innovaro Bonus Plan for qualifying Innovaro division employees. The award pool is determined from eligible earnings and aggregate revenues and is limited to the extent required to permit Innovaro to maintain sufficient operating cash. Awards are to be paid out by June 30th of each year and are accrued on a quarterly basis. Approximately 75% to 85% of Innovaro net income will be paid out in connection with this bonus plan. There was no bonus in connection with the Innovaro Bonus Plan during the years ended December 31, 2009 and 2008.
The Company has a Social Technologies Bonus Plan for qualifying Social Technologies division employees. The award pool is determined from eligible earnings and aggregate revenues and is limited to the extent required to permit Social Technologies to maintain sufficient operating cash. The Company recognized bonus expense of $225,000 and $0 in connection with the Social Technologies Bonus Plan for the years ended December 31, 2009 and 2008, respectively.
Operating Leases
The Company leases its office facilities and certain equipment for various terms under long-term, non-cancelable operating lease agreements. The leases expire at various dates through 2013 and provide for various renewal options. In the normal course of business, it is expected that these leases will be renewed or replaced by leases on other properties. The leases provide for increases in future minimum annual rental payments. Lease expense charged to operations was approximately $442,000, $526,000 and $317,000 for the years ended December 31, 2009, 2008 and 2007, respectively.
The Company leases the office space for its corporate headquarters from Ybor City Group, Inc., a subsidiary of UTEK Real Estate. In connection with the consolidation of UTEK Real Estate as of October 1, 2009, the rent expense associated with this lease is eliminated as an intercompany transaction.
The following is a schedule by year of future minimum rental payments required under the operating lease agreements:
| 2010 |
$ | 136,446 | |
| 2011 |
108,076 | ||
| 2012 |
31,234 | ||
| 2013 |
25,278 | ||
| $ | 301,034 | ||
13. Related Party Transactions
During the years ended December 31, 2007 and 2006, the Company loaned funds for operations and real estate improvements to certain subsidiaries of UTEK Real Estate. The entire balance of approximately $2 million was repaid to the Company during 2008.
The Company leases space for its corporate headquarters from Ybor City Group, Inc., a subsidiary of UTEK Real Estate. The Company paid rent of approximately $269,000, $344,000 and $258,000 to Ybor City Group, Inc. during the nine months ended September 30, 2009 and the years ended December 31, 2008 and 2007, respectively.
85
Table of Contents
In connection with the consolidation of UTEK Real Estate as of October 1, 2009, UTEK Real Estate and Ybor City Group, Inc. are no longer related party entities and disclosure of intercompany transactions in not applicable.
14. Subsequent Events
As of March 16, 2010, we began doing business as Innovaro and changed our ticker symbol to NYSE Amex: “INV”. Our proxy statement for the 2010 Annual Meeting of Shareholders will include a proposal to amend our articles of incorporation to change the corporate name to Innovaro, Inc. Beginning in March 2010, the Company will reorganize into three primary business groups, all working under the Innovaro brand: Strategic Services – driven by Strategos, an advanced innovation consultancy; Technology Marketplaces – online platforms, partnering services, global licensing and technology transfer services; Insights & Research – futures and trends, research, information services and more. In connection therewith, our business segments will change beginning with our quarterly reporting period ending March 31, 2010 and this change will require certain reclassifications to prior period financial information.
15. Selected Quarterly Financial Data (Unaudited)
| March 31 | June 30 | September 30 | December 31 | |||||||||||||
| Fiscal year 2009 |
||||||||||||||||
| Revenue / Income from operations |
$ | 2,778,015 | (1) | $ | 2,645,468 | $ | 2,341,181 | $ | 3,012,839 | |||||||
| Net loss from operations |
(2,074,820 | ) | (6,234,932 | )(2) | (1,030,899 | ) | (624,006 | ) | ||||||||
| Net loss/ Net decrease in net assets from operations |
(4,997,735 | ) | (7,223,234 | )(2) | (2,418,807 | ) | (624,006 | ) | ||||||||
| Net loss per share/ net decrease in net assets from operations per share: |
||||||||||||||||
| Basic and diluted |
$ | (0.45 | ) | $ | (0.64 | ) | $ | (0.21 | ) | $ | (0.05 | ) | ||||
| Fiscal year 2008 |
||||||||||||||||
| Revenue / Income from operations |
$ | 3,665,566 | $ | 4,929,618 | $ | 7,058,406 | $ | 4,524,529 | ||||||||
| Net loss from operations |
(1,653,913 | )(3) | (540,890 | ) | (5,874,393 | ) | (1,965,616 | ) | ||||||||
| Net decrease in net assets from operations |
(6,330,791 | )(3) | (3,388,513 | ) | (12,691,345 | ) | (4,074,278 | ) | ||||||||
| Net decrease in net assets from operations per share: |
||||||||||||||||
| Basic and diluted |
$ | (0.69 | ) | $ | (0.35 | ) | $ | (1.25 | ) | $ | (0.38 | ) | ||||
| Fiscal year 2007 |
||||||||||||||||
| Revenue / Income from operations |
$ | 7,947,771 | $ | 6,388,449 | $ | 3,694,914 | $ | 2,269,815 | ||||||||
| Net income (loss) from operations |
2,233,391 | 1,935,831 | 188,192 | (580,672 | ) | |||||||||||
| Net decrease in net assets from operations |
(406,569 | ) | (3,584,734 | ) | (134,017 | ) | (4,351,366 | ) | ||||||||
| Net decrease in net assets from operations per share: |
||||||||||||||||
| Basic and diluted |
$ | (0.05 | ) | $ | (0.40 | ) | $ | (0.01 | ) | $ | (0.48 | ) | ||||
| (1) | Income from operations for the three months ended March 31, 2009 as shown here varies from the amount previously reported on the Company’s March 31, 2009 quarterly report on Form 10-Q of $2,763,721 by $14,294 because of the subsequent reclassification of gains and losses from the disposal of fixed assets out of investment income. |
| (2) | Net loss from operations and net decrease in net assets from operations for the three months ended June 30, 2009 includes an impairment loss of $2.4 million and severance compensation of $2.5 million. |
| (3) | Net loss from operations and net decrease in net assets from operations for the three months ended March 31, 2008 includes severance compensation of $1.3 million. |
86
Table of Contents
16. Selected Per Share Data and Ratios under Investment Company Accounting
| Nine Months Ended Sept 30, 2009(1) |
Year Ended December 31 | |||||||||||||||||||
| 2008 | 2007 | 2006 | 2005 | |||||||||||||||||
| Per share information:(2) |
||||||||||||||||||||
| Net asset value, beginning of period |
$ | 3.42 | $ | 4.85 | $ | 5.71 | $ | 5.58 | $ | 3.85 | ||||||||||
| Net income (loss) from operations(2) |
(0.83 | ) | (1.01 | ) | 0.42 | 2.27 | 0.80 | |||||||||||||
| Net change in realized and unrealized appreciation/depreciation on investments (after taxes)(3) |
(0.66 | ) | (2.44 | ) | (1.41 | ) | (3.45 | ) | (1.70 | ) | ||||||||||
| Total from investment operations |
(1.48 | ) | (3.45 | ) | (0.99 | ) | (1.18 | ) | (0.90 | ) | ||||||||||
| Foreign currency translation adjustment(2) |
0.05 | (0.19 | ) | — | 0.02 | (0.02 | ) | |||||||||||||
| Distributions to shareholders(2) |
— | — | — | (0.04 | ) | — | ||||||||||||||
| Net increase from stock transactions(2) |
0.44 | 2.21 | 0.13 | 1.33 | 2.65 | |||||||||||||||
| Net asset value, end of period |
$ | 2.42 | $ | 3.42 | $ | 4.85 | $ | 5.71 | $ | 5.58 | ||||||||||
| Per share market value, end of period |
$ | 4.68 | $ | 8.85 | $ | 13.20 | $ | 11.34 | $ | 13.79 | ||||||||||
| Investment return, based on market price at end of period(4) |
(47 | )% | (33 | )% | 16 | % | (18 | )% | (8 | )% | ||||||||||
| Ratios/supplemental data: |
||||||||||||||||||||
| Net assets, end of period |
$ | 28,091,591 | $ | 37,200,279 | $ | 43,674,548 | $ | 50,981,162 | $ | 44,441,118 | ||||||||||
| Ratio of expenses to average net assets |
53 | % | 66 | % | 29 | % | 52 | % | 39 | % | ||||||||||
| Ratio of net income (loss) from operations to average net assets |
(29 | )% | (25 | )% | 8 | % | 42 | % | 17 | % | ||||||||||
| Diluted weighted average number of shares outstanding during the period |
11,257,663 | 9,947,221 | 8,989,234 | 8,786,605 | 7,325,312 | |||||||||||||||
| (1) | Information is presented for the nine months ended September 30 of the current year because the Company ceased operating as an investment company on October 1, 2009. As an operating company, measurement of certain items included in this table is not applicable or appropriate. Therefore, certain items included in this table agree to financial statements included in the Company’s September 30, 2009 quarterly report on Form 10-Q as opposed to financial statements included in this annual report on Form 10-K. See Note 1 for further discussion of the Company’s change in status from an investment company to operating company. |
| (2) | Calculated based on diluted weighted average number of shares outstanding during the year. |
| (3) | Calculated as a balancing amount necessary to reconcile the change in net asset value per share with the other per share information presented. This amount may not agree with the aggregate gains and losses for the period because the difference in the net asset value at the beginning and end of year does not inherently equal the per share changes of the line items disclosed. |
| (4) | Calculated as the change in market price during the period divided by the market price at the end of the period. |
87
Table of Contents
| Item 9. | Changes in and Disagreements with Accountants on Accounting and Financial Disclosure |
Not applicable.
| Item 9A. | Controls and Procedures |
Evaluation of Disclosure Controls and Procedures
Our Chief Executive Officer and Chief Financial Officer have evaluated the effectiveness of the design and operation of our disclosure controls and procedures (as defined in Rule 13a-15(e) of the Securities Exchange Act of 1934) as of the end of the period covered by this report. Based upon that evaluation, the Chief Executive Officer and Chief Financial Officer concluded that our disclosure controls and procedures were effective to ensure that information required to be disclosed by us in reports we file or submit under the Securities Exchange Act of 1934 is recorded, processed, summarized and reported within the time periods specified in the Securities and Exchange Commission rules and forms and such that information required to be disclosed in our reports filed or submitted under the Securities Exchange Act of 1934 is accumulated and communicated to our management, including our principal executive officer and principal financial officer, as appropriate to allow timely decisions regarding required disclosure.
Management’s Annual Report on Internal Control over Financial Reporting
Our management is responsible for establishing and maintaining adequate internal control over financial reporting, as such term is defined in Rule 13a-15(f) under the Securities Act of 1934. Under the supervision and with the participation of our management, including our Chief Executive Officer and Chief Financial Officer, we conducted an evaluation of the effectiveness of our internal control over financial reporting based upon the framework in Internal Control—Integrated Framework issued by the Committee of Sponsoring Organizations of the Treadway Commission. Based on that evaluation, our management concluded that our internal control over financial reporting is effective as of December 31, 2009.
Attestation Report of the Registered Public Accounting Firm
Our independent registered public accounting firm, Pender Newkirk & Company LLP, has issued an attestation report on the effectiveness of the Company’s internal control over financial reporting, which is set forth under the heading “Report of Independent Registered Public Accounting Firm.”
Changes in Internal Control over Financial Reporting
There was no significant change in our internal control over financial reporting (as defined in Rule 13a-15(f) of the Securities Exchange Act of 1934) that occurred during our most recently completed fiscal quarter that has materially affected, or is reasonably likely to materially affect, our internal control over financial reporting.
| Item 9B. | Other Information |
Not applicable.
88
Table of Contents
| Item 10. | Directors, Executive Officers and Corporate Governance |
Information about our directors may be found under the caption “NOMINEES” in the Company’s Proxy Statement for the 2010 Annual Meeting of Stockholders (the “Proxy Statement”) to be filed pursuant to Regulation 14A under the Securities Exchange Act of 1934 within 120 days from the fiscal year end. Information about our executive officers may be found under the caption “EXECUTIVE OFFICERS” in the Proxy Statement. Information about the audit committee may be found under the captions “MEETINGS OF THE BOARD OF DIRECTORS AND COMMITTEES” and “MEMBERSHIP ON BOARD COMMITTEES” in the Proxy Statement. Information about beneficial ownership may be found under the caption “SECTION 16(a) BENEFICIAL OWNERSHIP REPORTING COMPLIANCE” in the Proxy Statement. All of the aforementioned information is incorporated herein by reference.
Code of Business Conduct and Ethics for Directors and Employees
We have adopted a Code of Business Conduct and Ethics for all of our directors and employees, including our Chief Executive Officer and Chief Financial Officer. We have posted a copy of our Code of Business Conduct and Ethics on our Internet website at www.innovaro.com. Any waivers of the Code of Business Conduct and Ethics must be approved, in advance, by our full Board of Directors. Any amendments to, or waivers from the Code of Business Conduct and Ethics that apply to our executive officers and directors will be posted on our Internet website located at www.innovaro.com.
| Item 11. | Executive Compensation |
The information set forth under the captions “DIRECTOR COMPENSATION,” “EXECUTIVE COMPENSATION,” “COMPENSATION COMMITTEE INTERLOCKS AND INSIDER PARTICIPATION” and “COMPENSATION COMMITTEE REPORT” in the Proxy Statement is incorporated herein by reference.
| Item 12. | Security Ownership of Certain Beneficial Owners and Management and Related Stockholder Matters |
The information set forth under the captions “SECURITY OWNERSHIP” in the Proxy Statement is incorporated herein by reference.
Securities Authorized For Issuance under Equity Compensation Plans
The following table summarizes information about the Company’s equity incentive plans as of December 31, 2009:
| Plan category |
Number of securities to be issued upon exercise of outstanding options, warrants and rights |
Weighted-average exercise price of outstanding options, warrants and rights |
Number of securities remaining available for future issuance under equity compensation plans (excluding securities reflected in column(a) | ||||
| (a) | (b) | (c) | |||||
| Equity compensation plans approved by security holders |
1,739,150 | $ | 7.01 | 1,194,837 | |||
| Equity compensation plans not approved by security holders |
— | — | — | ||||
| Total |
1,739,150 | $ | 7.01 | 1,194,837 | |||
89
Table of Contents
| Item 13. | Certain Relationships and Related Transactions, and Director Independence |
The information set forth under the captions “CERTAIN RELATIONSHIPS AND TRANSACTIONS” and “DIRECTOR INDEPENDENCE” in the Proxy Statement is incorporated herein by reference.
| Item 14. | Principal Accountant Fees and Services |
The information set forth under the captions “FEES BILLED TO THE COMPANY BY REGISTERED INDEPENDENT PUBLIC ACCOUNTING FIRM” and “POLICY ON PRE-APPROVAL OF SERVICES PROVIDED BY REGISTERED INDEPENDENT PUBLIC ACCOUNTING FIRM” in the Proxy Statement is incorporated herein by reference.
90
Table of Contents
| Item 15. | Exhibits and Financial Statement Schedules |
(a) Documents filed as part of this report:
1. The following Financial Statements of UTEK Corporation are contained in Item 8 of this Form 10-K:
| • | Consolidated Balance Sheet as of December 31, 2009 and Consolidated Statement of Assets and Liabilities as of December 31, 2008 |
| • | Consolidated Statements of Operations and Comprehensive Income (Loss) for the three months ended December 31, 2009, the nine months ended September 30, 2009, and the years ended December 31, 2008 and 2007 |
| • | Consolidated Statements of Stockholders’ Equity (Deficit) and Comprehensive Income (Loss) for the years ended December 31, 2009, 2008 and 2007 |
| • | Consolidated Statements of Cash Flows for the three months ended December 31, 2009, the nine months ended September 30, 2009, and the years ended December 31, 2008 and 2007 |
| • | Consolidated Statements of Changes in Net Assets for the nine months ended September 30, 2009 and the years ended December 31, 2008 and 2007 |
| • | Consolidated Schedule of Investments for the year ended December 31, 2008 |
| • | Notes to Consolidated Financial Statements |
| • | Selected Per Share Data and Ratios for the nine months ended September 30, 2009 and the years ended December 31, 2008, 2007, 2006 and 2005 |
| • | Report of Independent Registered Public Accounting Firm |
| • | Report of Management on Internal Control over Financial Reporting |
| • | Report of Independent Registered Public Accounting Firm on Internal Control over Financial Reporting |
2. The following financial statement schedules are filed herewith:
Schedule 12-14 of Investments in and Advances to Affiliates
In addition, there may be additional schedules not provided because (i) such schedules are not required or (ii) the information required has been presented in the aforementioned financial statements.
3. The following exhibits are filed with this report or are incorporated herein by reference to a prior filing, in accordance with Rule 12b-32 under the Securities Exchange Act of 1934:
| 3.1 | Certificate of Incorporation, dated July 6, 1999, as filed and recorded with the Secretary of State of the State of Delaware on July 13, 1999. (Incorporated by reference to Exhibit 3.1 filed with the Company’s registration statement on Form N-2 (File No. 333-93913) filed on December 30, 1999.) | |
| 3.2 | Certificate of Amendment to Certificate of Incorporation, dated October 14, 1999, as filed and recorded with the Secretary of State of the State of Delaware on October 15, 1999. (Incorporated by reference to Exhibit 3.2 filed with the Company’s registration statement on Form N-2 (File No. 333-93913) filed on December 30, 1999.) | |
| 3.3 | By-Laws of UTEK Corporation. (Incorporated by reference to Exhibit 3.3 filed with the Company’s registration statement on Form N-2 (File No. 333-93913) filed on December 30, 1999.) | |
91
Table of Contents
| 3.4 | Certificate of Amendment to Certificate of Incorporation dated July 23, 2001, as filed and recorded with the Secretary of State of the State of Delaware on July 24, 2001. (Incorporated by reference to Exhibit 3.4 to the Company’s Form 10-K filed on April 1, 2002.) | |
| 3.5 | Certificate of Amendment to Certificate of Incorporation dated June 12, 2007, as filed and recorded with the Secretary of State of the State of Delaware on July 12, 2007. (Incorporated by reference to Exhibit 3.1 to the Company’s Form 10-Q filed on August 6, 2007.) | |
| 3.6 | Certificate of Amendment to By-Laws dated February 26, 2008. (Incorporated by reference to Exhibit 3.6 to the Company’s Form 10-K filed on March 10, 2009.) | |
| 10.1 | UTEK Corporation Amended and Restated Employee Stock Option Plan. (Incorporated by reference to Exhibit A filed with the Company’s Proxy Statement filed on April 30, 2009.) | |
| 10.2 | UTEK Corporation Amended and Restated Non-Qualified Stock Option Plan. (Incorporated by reference to Exhibit C to the Company’s Proxy Statement filed on April 29, 2004.) | |
| 10.3 | Form of Incentive Stock Option Agreement. (Incorporated by reference to Exhibit 10.1 to the Company’s Form 10-Q filed on August 9, 2005.) | |
| 10.4 | Employment Agreement between UTEK Corporation and Doug Schaedler dated November 20, 2010. (Incorporated by reference to Exhibit No. 10.1 to the Company’s Form 8-K filed on November 23, 2010.) | |
| 10.5 | Employment Agreement between UTEK Corporation and Sam Reiber dated February 5, 2010. (Incorporated by reference to Exhibit 10.2 to the Company’s Form 8-K filed on February 8, 2010.) | |
| 10.6 | Separation Agreement dated April 8, 2009. (Incorporated by reference to Exhibit 10.1 to the Company’s Form 8-K filed on April 13, 2009.) | |
| 10.7 | Note and Warrant Purchase Agreement between UTEK Corporation and Gators Lender, LLC dated October 22, 2009. (Incorporated by reference to Exhibit 10.1 to the Company’s Form 8-K filed on October 28, 2009.) | |
| 10.8 | $1,750,000 Promissory Note between UTEK Corporation, UTEK Real Estate Holdings, Inc. and Gators Lender, LLC dated October 22, 2009. (Incorporated by Reference to Exhibit 10.2 to the Company’s Form 8-K filed on October 28, 2009.) | |
| 10.9 | Warrant Agreement between UTEK Corporation and Gators Lender, LLC dated October 22, 2009. (Incorporated by reference to Exhibits 10.3 to the Company’s Form 8-K filed on October 28, 2009.) | |
| 10.10 | Absolute Guaranty of Payment and Performance by Cortez 114, LLC, Ybor City Group, Inc., 22nd Street of Ybor City, Inc., ABM of Tampa Bay, Inc. and UTEK Europe, Ltd. in favor of Gators Lender, LLC dated October 22, 2009. (Incorporated by reference to Exhibit 10.4 to the Company’s Form 8-K filed on October 28, 2009.) | |
| 10.11 | Mortgage and Security Agreement by Cortez, LLC for the benefit of Gators Lender, LLC dated October 22, 2009. (Incorporated by reference to Exhibit 10.5 to the Company’s Form 8-K filed on October 28, 2009.) | |
| 10.12 | Environmental Indemnity Agreement by UTEK Corporation, UTEK Real Estate Holdings, Inc. and Cortez 114, LLC in favor of Gators Lender, LLC dated October 22, 2009. (Incorporated by reference to Exhibit 10.6 to the Company’s Form 8-K filed on October 28, 2009.) | |
| 10.13 | Substitution of Collateral Agreement among UTEK Corporation, UTEK Real Estate Holdings, Inc., Cortez 114, LLC and Gators Lender, LLC dated February 26, 2010. (Incorporated by reference to Exhibit 10.1 to the Company’s Form 8-K filed on March 5, 2010.) | |
| 10.14 | Membership Interest Pledge Agreement among UTEK Real Estate Holdings, Inc., Cortez 114, LLC and Gators Lender, LLC dated February 26, 2010. (Incorporated by reference to Exhibit 10.2 to the Company’s Form 8-K filed on March 5, 2010.) | |
| 10.15 | Amended and Restated Promissory Note made by UTEK Real Estate Holdings, Inc. in favor of Gators Lender, LLC dated February 26, 2010. (Incorporated by reference to Exhibit 10.3 to the Company’s Form 8-K filed on March 5, 2010.) | |
92
Table of Contents
| 10.16 | Release of Mortgage by Gators Lender, LLC for the benefit of Cortez 114, LLC dated February 26, 2010. (Incorporated by reference to Exhibit 10.4 to the Company’s Form 8-K filed on March 5, 2010.) | |
| 10.17* | $3,000,000 Promissory Note between Ybor City Group, Inc. and The Bank of Tampa dated May 1, 2008. | |
| 10.18* | $1,500,000 Mortgage and $1,500,000 Mortgage Note between Ybor City Group, Inc. and Jacob M. Buchman, Trustee dated September 30, 2005. | |
| 10.19* | Note and Mortgage Modification Agreement between Ybor City Group, Inc., 22nd Street of Ybor City, Inc., and ABM of Tampa Bay, Inc. and Jacob M. Buchman, Trustee dated February 16, 2007. | |
| 10.20* | Employment Agreement between UTEK Corporation and Peter Skarzynski dated April 17, 2008. | |
| 10.21* | UTEK - Strategos Bonus Plan dated April 10, 2008. | |
| 11.1 | Computation of per share earnings is included in Item 8 of this Form 10-K. | |
| 21.1* | List of subsidiaries of UTEK Corporation. | |
| 31.1* | Certification of the Chief Executive Officer pursuant to Section 302 of the Sarbanes-Oxley Act of 2002, 18 USC. Section 1350. | |
| 31.2* | Certification of the Chief Financial Officer pursuant to Section 302 of the Sarbanes-Oxley Act of 2002, 18 USC. Section 1350. | |
| 32.1* | Certification of the Chief Executive Officer pursuant to Section 906 of the Sarbanes-Oxley Act of 2002, 18 USC. Section 1350. | |
| 32.2* | Certification of the Chief Financial Officer pursuant to Section 906 of the Sarbanes-Oxley Act of 2002, 18 USC. Section 1350. | |
| * | Filed Herewith. |
93
Table of Contents
Pursuant to the requirements of Section 13 or 15(d) Securities Exchange Act of 1934, the Registrant has duly caused this Report to be signed on its behalf by the undersigned, thereunto duly authorized on March 22, 2010.
| UTEK CORPORATION | ||
| By: | /s/ DOUGLAS SCHAEDLER | |
| Douglas Schaedler | ||
| Chief Executive Officer | ||
Pursuant to the requirements of the Securities Exchange Act of 1934, this Report has been signed below by the following persons on behalf of the Registrant in the capacities and on the dates indicated.
| Signature |
Title (Capacity) |
Date | ||
| /s/ DOUGLAS SCHAEDLER Douglas Schaedler |
Chief Executive Officer (Principal Executive Officer) |
March 22, 2010 | ||
| /s/ CAROLE R. WRIGHT Carole R. Wright |
Chief Financial Officer (Principal Financial and Accounting Officer) |
March 22, 2010 | ||
| /s/ KEITH A. WITTER Keith A. Witter |
Chairman | March 22, 2010 | ||
| /s/ HOLLY CALLEN-HAMILTON Holly Callen-Hamilton |
Director | March 22, 2010 | ||
| /s/ KWABENA GYIMAH-BREMPONG Kwabena Gyimah-Brempong |
Director | March 22, 2010 | ||
| /s/ JOHN MICEK John Micek |
Director | March 22, 2010 | ||
| /s/ MARK BERSET Mark Berset |
Director | March 22, 2010 | ||
| /s/ HENRY CHESBROUGH Henry Chesbrough |
Director | March 22, 2010 | ||
| /s/ CHARLES POPE Charles Pope |
Director | March 22, 2010 | ||
| /s/ MARK RADCLIFFE Mark Radcliffe |
Director | March 22, 2010 | ||
94
Table of Contents
Schedule 12-14
UTEK CORPORATION
Schedule of Investments in and Advances to Affiliates
| Portfolio Company and Investment |
Period Ended September 31, 2009 Amount of Interest or Dividends(1) |
December 31, 2008 Value |
Gross Additions(2) |
Gross Reductions(3) |
September 30, 2009 Value | |||||||||||
| Affiliate Investments |
||||||||||||||||
| Emission & Power Solutions, Inc. (privately held) |
||||||||||||||||
| Common stock |
$ | — | $ | 287,900 | $ | — | $ | (287,900 | ) | — | ||||||
| Preferred Series B stock |
— | — | — | — | ||||||||||||
| GS Energy Corporation |
||||||||||||||||
| Common stock |
— | — | — | — | — | |||||||||||
| Tesla Vision Corp. (Manakoa Services Corp.) |
||||||||||||||||
| Common stock |
— | — | — | — | — | |||||||||||
| Preferred Series B stock |
— | — | — | — | — | |||||||||||
| MATECH Corporation (Material Technologies, Inc.) |
||||||||||||||||
| Common stock |
— | 58,400 | 463,100 | (521,500 | ) | — | ||||||||||
| Preferred Series E stock |
— | 463,100 | — | (463,100 | ) | — | ||||||||||
| MachineTalker, Inc. |
||||||||||||||||
| Common stock |
— | 133,700 | 15,200 | (148,900 | ) | — | ||||||||||
| NeoStem, Inc. |
||||||||||||||||
| Common stock |
— | 164,600 | — | (164,600 | ) | — | ||||||||||
| Cytodyn, Inc. |
||||||||||||||||
| Common stock |
— | 171,400 | 434,721 | (171,400 | ) | 434,721 | ||||||||||
| Preferred Series A stock |
— | 260,000 | 65,000 | (325,000 | ) | — | ||||||||||
| Cargo Connection Logistics Holdings, Inc. |
||||||||||||||||
| Common stock |
— | 10,700 | — | (10,700 | ) | — | ||||||||||
| Eclips Energy Technologies, Inc. (World Energy Solutions, Inc.) |
||||||||||||||||
| Preferred Series A stock |
— | 1,450,000 | — | (1,450,000 | ) | — | ||||||||||
| Common Stock |
— | 322,100 | 1,450,000 | (1,772,100 | ) | — | ||||||||||
| Avalon Oil and Gas, Inc. |
||||||||||||||||
| Common stock |
— | 67,500 | — | (67,500 | ) | — | ||||||||||
| USTelematics, Inc. |
||||||||||||||||
| Common stock |
— | 59,900 | — | (59,900 | ) | — | ||||||||||
| American Soil Technologies, Inc. |
||||||||||||||||
| Common stock |
— | 27,300 | — | (27,300 | ) | — | ||||||||||
| NetFabric Holdings, Inc. |
||||||||||||||||
| Common stock |
— | 600 | — | (600 | ) | — | ||||||||||
| Technology Capital Services, LLC |
||||||||||||||||
| Common Stock |
— | — | 69,568 | — | 69,568 | |||||||||||
| WebSky, Inc. |
||||||||||||||||
| Common Stock |
— | — | — | — | — | |||||||||||
| Total Investments in Affiliate Investments |
$ | — | $ | 3,477,200 | $ | 2,497,589 | $ | (5,470,500 | ) | $ | 504,289 | |||||
| Control Investments |
||||||||||||||||
| UTEK Real Estate Holdings, Inc., (privately held) |
||||||||||||||||
| Common Stock |
$ | — | $ | 2,980,000 | $ | 1,780,000 | $ | — | $ | 4,760,000 | ||||||
| Klegg Electronics, Inc |
||||||||||||||||
| Common stock |
— | 7,500 | 19,600 | (27,100 | ) | — | ||||||||||
| Total Investment in Control Investment |
$ | — | $ | 2,987,500 | $ | 1,799,600 | $ | (27,100 | ) | $ | 4,760,000 | |||||
SCH-1
Table of Contents
This schedule should be read in conjunction with the Company’s consolidated financial statements including the schedule of investments.
| (1) | All of the listed securities are generally non-income producing. In addition, all of the listed securities are “restricted securities” within the meaning of Rule 144 of the Securities Act of 1933. In some cases, preferred stock may also be non-income producing. The principal amount for debt and the number of shares of common stock and preferred stock is shown in the Schedule of Investments as of September 30, 2009 included in the Company’s September 30, 2009 quarterly report on Form 10-Q. |
| (2) | Gross additions include increases in the cost basis of investments resulting from new portfolio investments and the movement of an existing portfolio company into this category from a different category. Gross additions also include net increases in unrealized appreciation or net decreases in unrealized depreciation. |
| (3) | Gross reductions include decreases in the cost basis of investments resulting from the sale of portfolio investments and the movement of an existing portfolio company out of this category into a different category. Gross reductions also include net increases in unrealized depreciation or net decreases in unrealized appreciation. |
SCH-2