Attached files
| file | filename |
|---|---|
| 8-K - LINCOLN NATIONAL CORPORATION FORM 8-K - LINCOLN NATIONAL CORP | lincoln8k.htm |
Exhibit 99.1

©2010 Lincoln National Corporation
March 22, 2010
Fred Crawford
Chief Financial Officer
Lincoln Financial Group
J.P. Morgan
2010 Insurance Conference
2010 Insurance Conference

2
This presentation and certain oral statements made on LNC’s behalf may contain information that includes
or is a “forward-looking statement” within the meaning of the Private Securities Litigation Reform Act of
1995 (“PSLRA”). A forward-looking statement is a statement that does not strictly relate to a historical fact.
A forward look statement includes any statement that may predict, forecast, indicate or imply future results,
performance or achievements, and may contain words like: “believe”, “anticipate”, “expect”, “estimate”,
“project”, “will”, “shall” and other words or phrases with similar meaning. LNC claims the protection afforded
by the safe harbor for forward-looking statements provided by the PSLRA.
Forward-looking statements involve risks and uncertainties that may cause actual results to differ
materially from the results contained in the forward-looking statements, legislative and regulatory changes
and proceedings, changes in interest rates, sudden or prolonged declines in the equity markets, continued
economic decline and credit-related illiquidity, deviation in actual experience regarding future persistency,
mortality, morbidity, interest rates or equity market returns from Lincoln’s assumptions used in pricing its
products, in establishing related insurance reserves, and in the amortization of intangibles that may result
in an increase in reserves and a decrease in net income; and changes in general economic or business
conditions. These risks and uncertainties, as well others, are described in LNC’s 2008 Form 10-K, 2009
Forms 8-K, and other documents filed with the Securities and Exchange Commission. Moreover, LNC
operates in a rapidly changing and competitive environment. New risk factors emerge from time to time
and it is not possible for management to predict all such risk factors.
Further, it is not possible to assess the impact of all risk factors on LNC’s business or the extent to which
any factor, or combination of factors, may cause actual results to differ materially from those contained in
any forward-looking statements. Given these risks and uncertainties, investors should not place undo
reliance on forward-looking statements as a prediction of actual results. In addition, LNC disclaims any
obligation to update any forward-looking statements to reflect events or circumstances that occur after the
date of this presentation.
Safe Harbor
3
• Defined Contribution
– Invest in technology and service
platforms
platforms
• Group Protection
– Expand voluntary sales efforts
and develop products for new
distribution channels
and develop products for new
distribution channels
• Individual Annuities
– Continue to develop fixed and
indexed solutions
indexed solutions
– Maintain category leadership in
variable annuities
variable annuities
• Individual Life Insurance
– Maintain category leadership
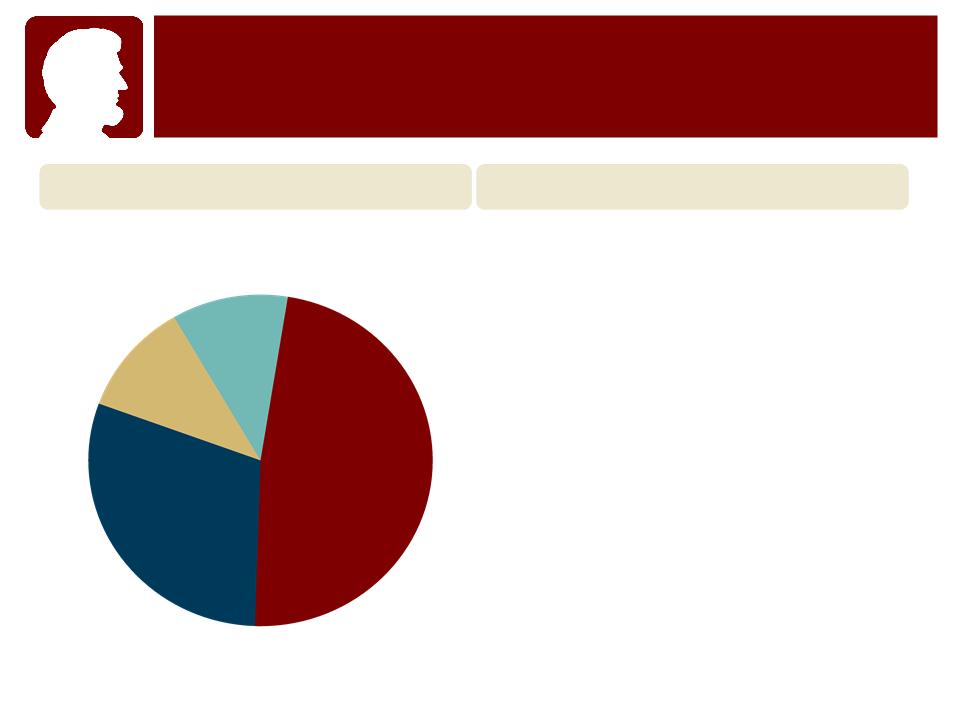
Earnings1
2010 Focus
Life
Insurance
Insurance
48%
Individual
Annuities
30%
Defined
Contribution
11%
Group
Protection
11%
1 Based on LFG after-tax FY 2009 income from operations, excluding Other Operations.
Clearly Focused on Four Core Insurance
and Retirement Businesses
and Retirement Businesses
4
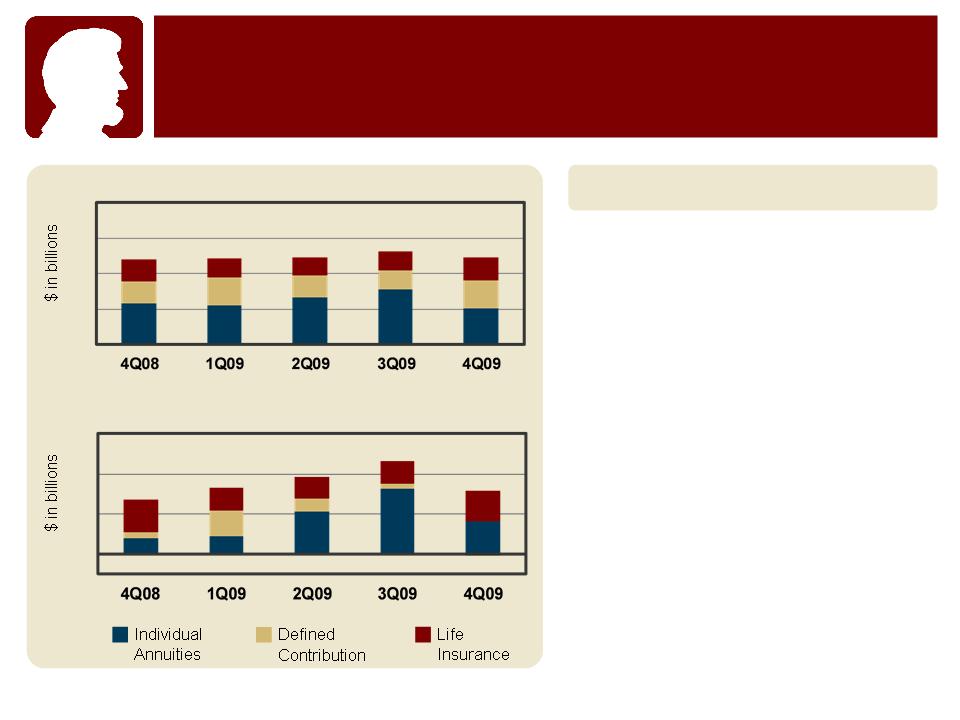
4.8
4.8
4.8
1.4
1.6
1.8
Consolidated Retirement & Insurance Deposits
Consolidated Retirement & Insurance Net Flows
5.3
4.9
2.3
1.5
$3
$2
$1
-$.5
$8
$6
$4
$2
$0
Solid Business Model
• Market share gains in major
lines of business
lines of business
• Updated flagship products
• 22% increase in wholesaler
productivity in 2009
productivity in 2009
• 26 new or expanded distribution
relationships during 2009
relationships during 2009
• 300 net new planners at Lincoln
Financial Network with over
7,700 nationwide
Financial Network with over
7,700 nationwide
• Added to employee base with
key hires
key hires
Market Leading Franchise Intact
Solid Deposits, Positive Net Flows
Solid Deposits, Positive Net Flows
5
• Insurance Solutions:
– Stable growth rates
– Capital solution impact in 2010
– Strong group fundamentals
• Retirement Solutions:
– Account values benefit from net
flows and markets
flows and markets
– DAC and death benefit claims
expenses remain elevated
expenses remain elevated
– DC margins pressured
• Strong alternative investment
income in 4Q
income in 4Q
• Investing in model will impact
expenses in 2010
expenses in 2010
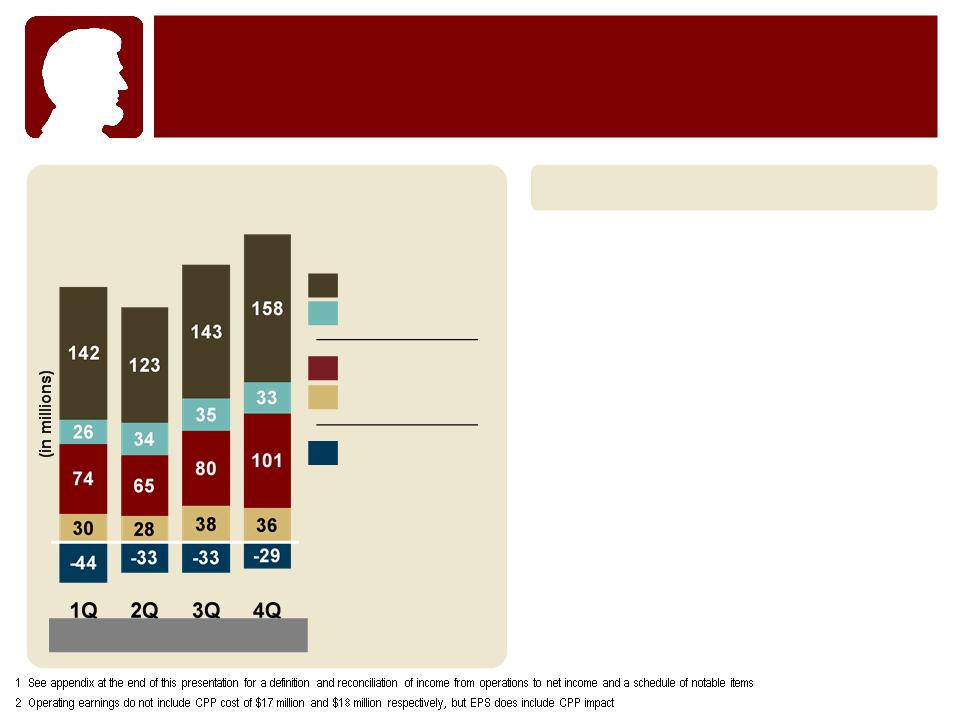
$228
$2632
Life Insurance
Group Protection
Annuities
Defined Contribution
Other Operations
Avg. diluted shares
257.8 262.4 310.0 311.6
2009 Income From Operations Adjusted for
Notable Items1
Notable Items1
Earnings Drivers Improving
$217
$2992
Fourth Quarter Results
Sequential Growth in Account Values and Earnings
Sequential Growth in Account Values and Earnings

6
Life 37%
Dental 9%
Disability 44%
Group Net Earned Premium $1.6b
Medical 10%
UL 41%
VUL 14%
UL SG 24%
MG 8%
Whole Life 10%
Term 3%
Life Segment 10%
• Stable returns with building
in-force and account vales
in-force and account vales
• Reinsurance and XXX transactions
impact on 2010 segment earnings
impact on 2010 segment earnings
• Alternative investment income
expected to recover
expected to recover
• Valuation conversion and
methodology review
methodology review
Group Segment 16%
• Overall fundamentals driving strong
returns
returns
• Favorable loss ratios below 70%
• Sales growth expected to drive
premium growth
premium growth
1 Reflects 2009 reported un-leveraged returns excluding goodwill.
Note: Life Insurance GAAP reserves as of December 31, 2009. Group Protection net earned premium represents FY 2009.
Return on Capital1
Life GAAP Reserves $43b
Insurance and Protection Businesses
Outlook: Stable and Building Returns
Outlook: Stable and Building Returns

7
Retirement AUM = $110 billion
DC Mutual
Funds 9%
DC Fixed
Annuities 11%
DC Variable
Annuities1 12%
Annuities1 12%
Individual Fixed
Annuities 14%
Individual
Variable
Variable
Annuities 50%
Fixed Portion of
Individual Variable
Annuities 4%
Individual Variable
Annuities 4%
Individual Annuities 15%
• Average account values recovering
• Positive flows expected to continue as
productivity improves
productivity improves
• Death benefit reserve and DAC
amortization elevated
amortization elevated
Defined Contribution 13%
• Average account values recovering
• Margins under pressure as higher
yielding investments mature
yielding investments mature
• Flows expected to be positive but
more variable
more variable
• Plans to invest in the platform
1 Excludes fixed portion of VA
2 Reflects 2009 reported un-leveraged returns excluding goodwill.
Return on Capital1
Retirement Returns
Diverse Portfolio Driving Balanced Returns
Diverse Portfolio Driving Balanced Returns

8
Individual VA Living Benefits
56%
Account Value
Step Up <1%
36%
Individual VA AUM1 = $59 billion
Hi-Water
Mark
8%
Return of
Premium
Individual VA Death Benefits
LB NAR3 $6.5b $2.6b
DB NAR3 $14.8b $6.0b
Hedge Target $3.7b $0.7b
Hedge Assets $4.3b $1.0b
GAAP Reserves $3.2b $0.8b
Statutory Reserves2 $1.1b $0.9b
12/31/08 12/31/09
16%
44%
40%
No
Guarantee
Guaranteed
Income
Benefit
Income
Benefit
Guaranteed
Withdrawal
Benefit
Withdrawal
Benefit
Reserve Metrics
1 Includes fixed portion of VA
2 Statutory reserves in 2009 include the adoption of VACARVM
3 Net amount at risk is calculated as the guaranteed amount minus account value, floored at zero
Individual Variable Annuities
Proven Risk Management and Full Economic Hedge
Proven Risk Management and Full Economic Hedge

9
Note: All data shown for available-for-sale securities. All realized loss data presented on a pre-DAC and tax basis; excludes losses on derivatives;
includes losses on sold securities. 2009 reflects the adoption of FASB Staff Position No. FAS 115-2 and 124-2.
* Excludes the impairment on Bank of America common stock securities of $131 million, pre-tax, held at the holding company.
246
236
174
212
Portfolio Allocation
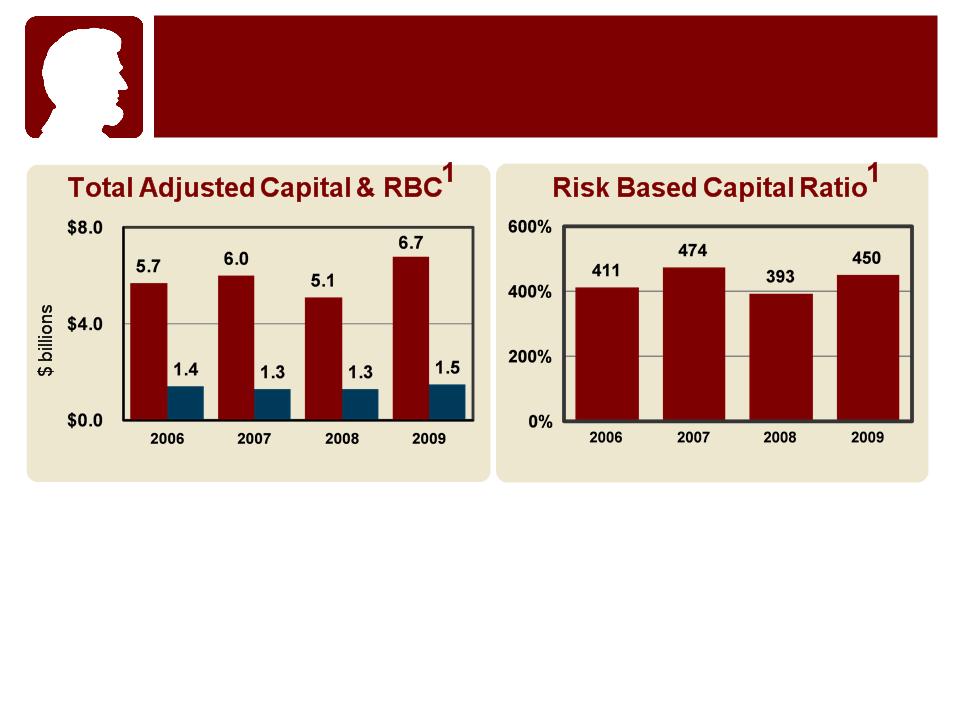
• Year-end activities - closed on long-term life capital solution, adopted VACARVM
and new NAIC RMBS treatment
and new NAIC RMBS treatment
• RBC at 450% - positioned to absorb economic weakness, support new business
growth rates, and allows patience in seeking life capital solutions
growth rates, and allows patience in seeking life capital solutions
1 Represents statutory results of Lincoln National Life Insurance Company, Lincoln Life & Annuity of New York, and First-Penn Pacific Life Insurance Company; The reporting of RBC measures is
not intended for the purpose of ranking any insurance company or for use in connection with any marketing, advertising or promotional activities.
not intended for the purpose of ranking any insurance company or for use in connection with any marketing, advertising or promotional activities.
10
Insurance Company Capitalization
Capital Positioned to Withstand Stressed Markets
Capital Positioned to Withstand Stressed Markets

11
Capital & Liquidity Strategy:
• Target $300-500 million
of liquid investments at the
holding company
of liquid investments at the
holding company
• Targeting long-term leverage
ratio in the 20%-25% range
ratio in the 20%-25% range
• Life capital solutions - blended
approach to funding with shorter-
term bank facility, long-term
funded solutions, and excess
capital
approach to funding with shorter-
term bank facility, long-term
funded solutions, and excess
capital
*As of December 31, 2009 and net of $250 million of debt maturing in March 2010
Financial Flexibility
Excess Holding Company Liquidity and Ready Capital
Excess Holding Company Liquidity and Ready Capital
• $1b of liquid investments
with $100mm of commercial
paper issued*
with $100mm of commercial
paper issued*
• Closed Delaware sale on
January 4th for $410mm
in proceeds
January 4th for $410mm
in proceeds
• $250 million injected into
captive reinsurance
subsidiary at YE 2009
captive reinsurance
subsidiary at YE 2009
• November debt offering
pre-funded $250mm
maturity in 2010
pre-funded $250mm
maturity in 2010

12
“We expect to repay CPP funds in the second half of 2010 or
first half of 2011 or as market conditions dictate and without
diluting operating earnings per share. “
first half of 2011 or as market conditions dictate and without
diluting operating earnings per share. “
Considerations:
– Regulatory and rating agency dialog around stress testing capital
influences final funding mix
influences final funding mix
The CPP Exit Question
“…as market conditions dictate”:
– Pace of economic recovery and impact on capital conditions
– The health of the markets and overall cost of capital

Questions

Appendix

15
Definition of Income (Loss) from Operations: Income (loss) from operations as used in this document is a non-GAAP financial measure
and is not a substitute for net income (loss) calculated using GAAP measures. Income (loss) from operations is the primary financial
measure we use to evaluate and assess our results. Our management and Board of Directors believe that this performance measure
explains the results of our ongoing businesses in a manner that allows for a better understanding of the underlying trends in our
current business because the excluded items are unpredictable and not necessarily indicative of current operating fundamentals or
future performance of the business segments, and, in most instances, decisions regarding these items do not necessarily relate to the
operations of the individual segments. We exclude the after-tax effects of the following items from GAAP net income (loss) to arrive at
income (loss) from operations: realized gains and losses associated with the following ("excluded realized gain (loss)"): sale or
disposal of securities; impairments of securities; change in the fair value of embedded derivatives within certain reinsurance
arrangements and the change in the fair value of our trading securities; change in the fair value of the derivatives we own to hedge our
guaranteed death benefit ("GDB") riders within our variable annuities, which is referred to as "GDB derivatives results"; change in the
fair value of the embedded derivatives of our guaranteed living benefit (“GLB”) riders within our variable annuities accounted for under
the Derivatives and Hedging and the Fair Value Measurements and Disclosures Topics of the FASB ASC (“embedded derivative
reserves”), net of the change in the fair value of the derivatives we own to hedge the changes in the embedded derivative reserves, the
net of which is referred to as “GLB net derivative results”; and changes in the fair value of the embedded derivative liabilities related to
index call options we may purchase in the future to hedge contract holder index allocations applicable to future reset periods for our
indexed annuity products accounted for under the Derivatives and Hedging and the Fair Value Measurements and Disclosures Topics
of the FASB ASC (“indexed annuity forward-starting option”); change in reserves accounted for under the Financial Services -
Insurance - Claim Costs and Liabilities for Future Policy Benefits Subtopic of the FASB ASC resulting from benefit ratio unlocking on
our GDB and GLB riders ("benefit ratio unlocking"); income (loss) from the initial adoption of new accounting standards; income (loss)
from reserve changes (net of related amortization) on business sold through reinsurance; gain (loss) on early extinguishment of debt;
losses from the impairment of intangible assets; and income (loss) from discontinued operations.
The company uses its prevailing corporate federal income tax rate of 35% while taking into account any permanent differences for
events recognized differently in its financial statements and federal income tax returns when reconciling non-GAAP measures to the
most comparable GAAP measure.
events recognized differently in its financial statements and federal income tax returns when reconciling non-GAAP measures to the
most comparable GAAP measure.
Definition of Income (Loss) From
Operations and ROE
Operations and ROE
16
|
($ in millions, except per share data)
|
1Q09
|
3Q09
|
4Q09
|
|
|
Net Income (Loss) available to common stockholders
|
$(579.0)
|
$137.0
|
$84.1
|
|
|
Less:
|
|
|
|
|
|
Preferred stock dividends and accretion of discount
|
|
|
(16.3)
|
(18.2)
|
|
Minority adjustment
|
(0.1)
|
|
|
|
|
Net Income (Loss)
|
(578.9)
|
153.3
|
102.3
|
|
|
Less:
|
|
|
|
|
|
Excluded realized gain (loss)
|
(136.4)
|
(296.8)
|
(248.3)
|
(98.3)
|
|
Benefit ratio unlocking
|
(52.0)
|
80.9
|
52.3
|
7.6
|
|
Income from reserve changes (net of related amortization)
on business sold through reinsurance |
0.4
|
0.4
|
0.4
|
0.5
|
|
Gain on early extinguishment of debt
|
41.8
|
|
|
|
|
Impairment of intangibles
|
(603.5)
|
0.6
|
1.4
|
(108.8)
|
|
Income(loss) from discontinued operations
|
7.7
|
(153.8)
|
72.0
|
4.1
|
|
Income from Operations
|
$163.1
|
$275.5
|
$297.2
|
|
|
Earnings per share (diluted)
|
|
|
|
|
|
Net Income (Loss)
|
$(2.27)
|
$(0.62)
|
$0.44
|
$0.27
|
|
Income from Operations
|
$0.64
|
$0.80
|
$0.84
|
$0.90
|
Net Income to Income from
Operations Reconciliation
Operations Reconciliation
17
* Reflects actual income or (loss) on alternative investment portfolio
|
($ in millions)
|
Retirement Solutions
|
Insurance Solutions
|
|||
|
Annuities
|
Life
Insurance |
||||
|
Reported
|
74
|
30
|
142
|
26
|
(108)
|
|
DAC Unlocking
|
|
|
|
|
|
|
Tax-related
items |
|
|
|
|
|
|
Expenses
|
|
|
|
|
|
|
Other (net)
|
|
|
|
|
(64)
|
|
Total
|
74
|
142
|
(44)
|
||
|
Alternative
Investments* |
|
|
(2)
|
|
|
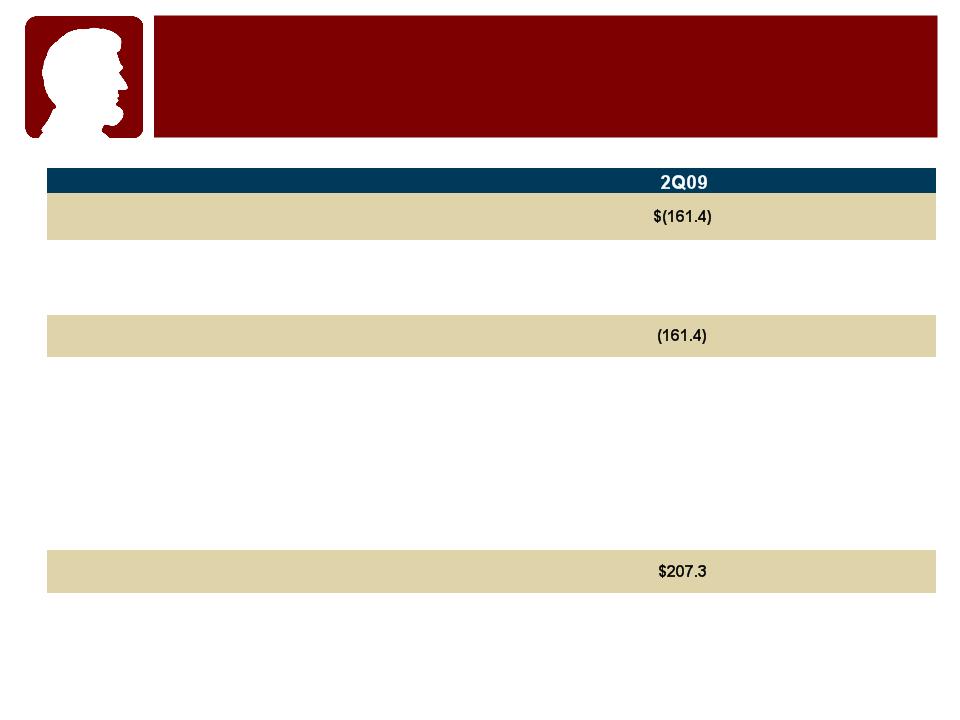
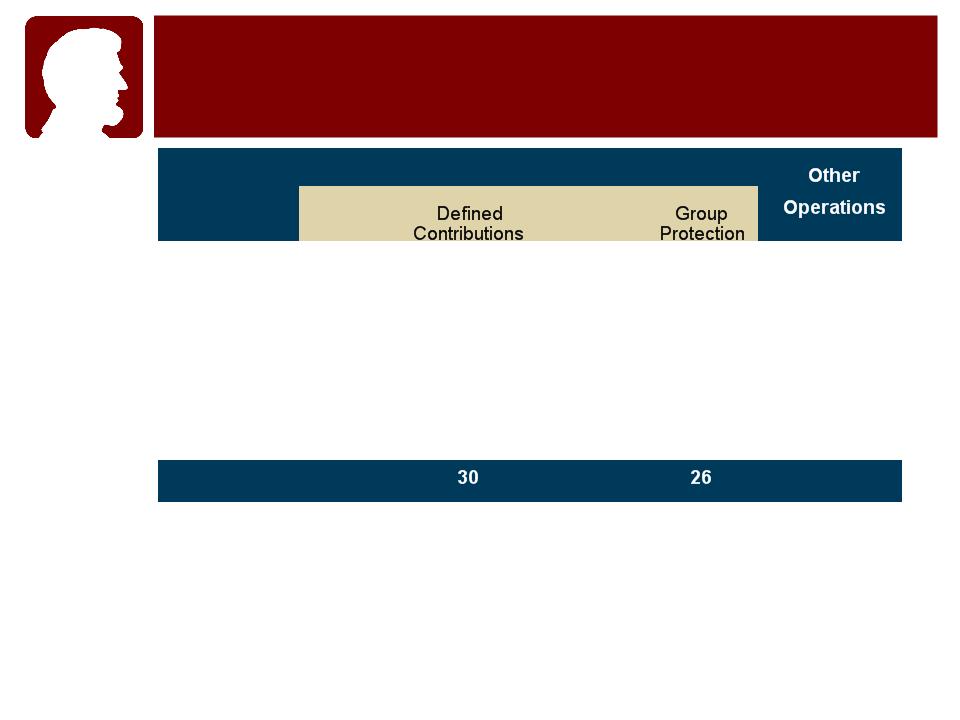
1Q 2009 Income From Operations
Schedule of Notable Items
Schedule of Notable Items
18
* Reflects actual income or (loss) on alternative investment portfolio
|
($ in millions)
|
Retirement Solutions
|
Insurance Solutions
|
|||
|
Annuities
|
Life
Insurance |
||||
|
Reported
|
65
|
28
|
133
|
34
|
(52)
|
|
DAC Unlocking
|
|
|
|
|
|
|
Tax-related
items |
|
|
|
|
|
|
Expenses
|
|
|
2
|
|
(19)
|
|
Mortality
|
|
|
5
|
|
|
|
Other (net)
|
|
|
3
|
|
|
|
Total
|
65
|
28
|
123
|
(33)
|
|
|
Alternative
Investments* |
(5)
|
(3)
|
(20)
|
(2)
|
|
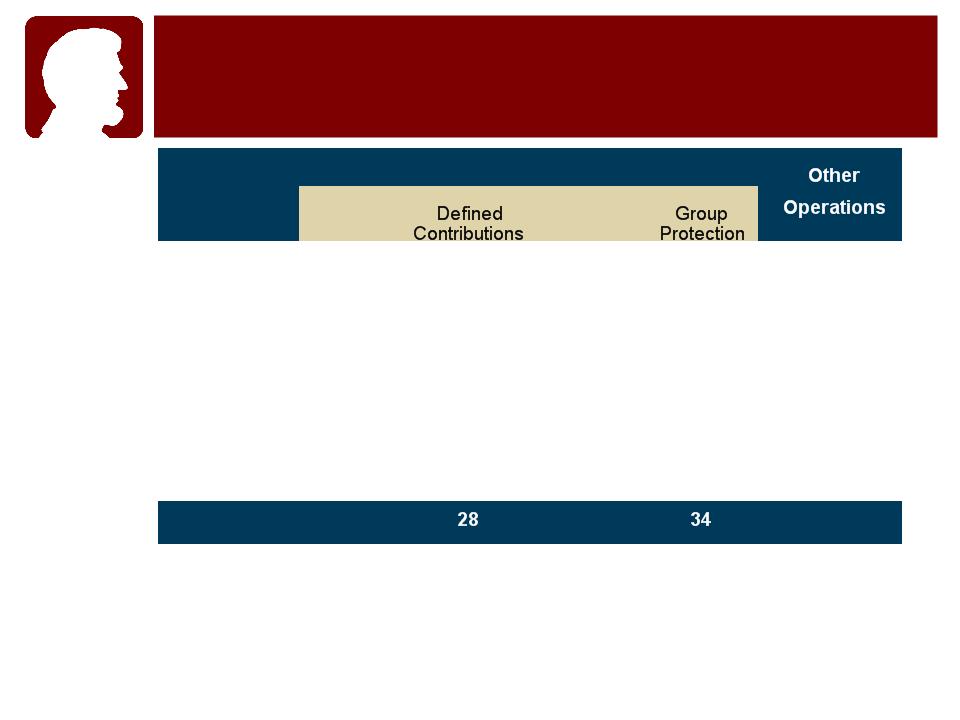
2Q 2009 Income From Operations
Schedule of Notable Items
Schedule of Notable Items
19
* Reflects actual income or (loss) on alternative investment portfolio
|
($ in millions)
|
Retirement Solutions
|
Insurance Solutions
|
|||
|
Annuities
|
Life
Insurance |
||||
|
Reported
|
95
|
43
|
137
|
35
|
(33)
|
|
DAC Unlocking
|
11
|
5
|
(12)
|
|
|
|
Tax-related
items |
3
|
|
6
|
|
|
|
Other
|
1
|
|
|
|
|
|
Total
|
80
|
143
|
(33)
|
||
|
Alternative
Investments* |
2
|
1
|
(5)
|
|
1
|
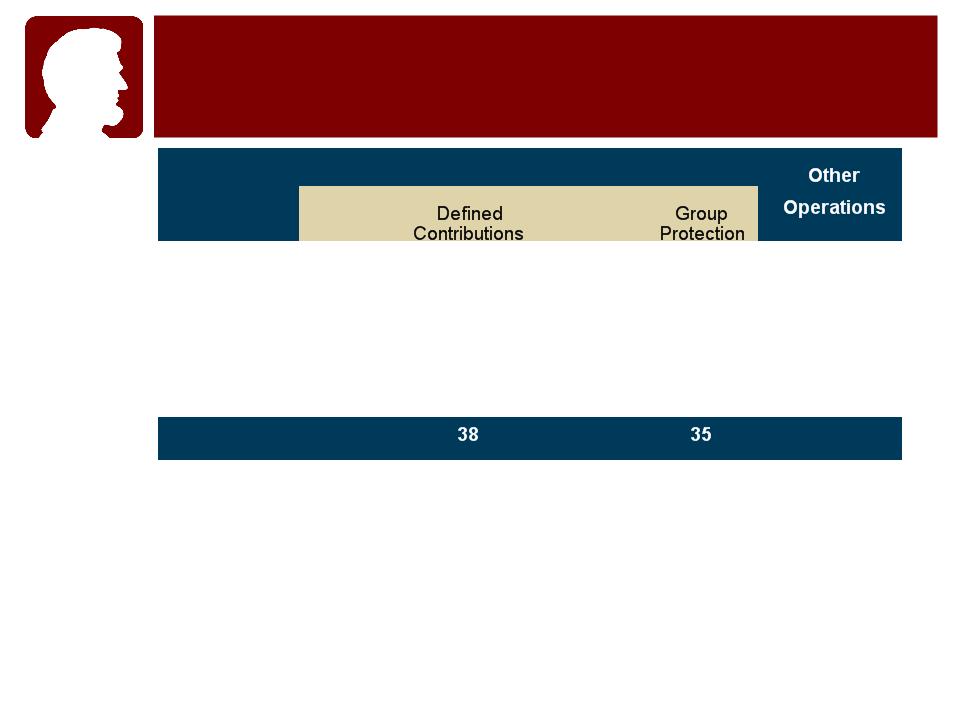
3Q 2009 Income From Operations
Schedule of Notable Items
Schedule of Notable Items

20
* Reflects actual income or (loss) on alternative investment portfolio
|
($ in millions)
|
Retirement Solutions
|
Insurance Solutions
|
|||
|
Annuities
|
Life
Insurance |
||||
|
Reported
|
120
|
33
|
158
|
30
|
(44)
|
|
DAC Unlocking
|
12
|
|
|
|
|
|
Tax-related
items |
7
|
(2)
|
|
|
13
|
|
Expenses
|
|
(1)
|
|
(3)
|
4
|
|
Disability
Business Review |
|
|
|
|
(33)
|
|
Other
|
|
|
|
|
1
|
|
Total
|
101
|
158
|
(29)
|
||
|
Alternative
Investments* |
6
|
4
|
7
|
3
|
2
|
4Q 2009 Income From Operations
Schedule of Notable Items
Schedule of Notable Items