Attached files
| file | filename |
|---|---|
| 8-K - FORM 8-K - International Coal Group, Inc. | frm8-k.htm |
Howard Weil Energy Conference
March 22, 2010
March 22, 2010
Ben Hatfield
President & Chief Executive Officer

Forward-Looking
Statements
Statements
n Statements in this presentation that are not historical facts are forward-looking statements within the “safe harbor” provision of the Private
Securities Litigation Reform Act of 1995 and may involve a number of risks and uncertainties. We have used the words “anticipate,” “believe,”
“could,” “estimate,” “expect,” “intend,” “may,” “plan,” “predict,” “project” and similar terms and phrases, including references to assumptions, to
identify forward-looking statements. These forward-looking statements are made based on expectations and beliefs concerning future events
affecting us and are subject to various risks, uncertainties and factors relating to our operations and business environment, all of which are difficult
to predict and many of which are beyond our control, that could cause our actual results to differ materially from those matters expressed in or
implied by these forward-looking statements. The following factors are among those that may cause actual results to differ materially from our
forward-looking statements: our ability to successfully refinance our outstanding indebtedness and reduce our leverage through the transactions
described in this presentation; market demand for coal, electricity and steel; availability of qualified workers; future economic or capital market
conditions; weather conditions or catastrophic weather-related damage; our production capabilities; consummation of financing, acquisition or
disposition transactions and the effect thereof on our business; a significant number of conversions of our 9.00% Convertible Senior Notes due
2012 prior to maturity; our plans and objectives for future operations and expansion or consolidation; our relationships with, and other conditions
affecting, our customers; availability and costs of key supplies or commodities, such as diesel fuel, steel, explosives and tires; availability and costs
of capital equipment; prices of fuels which compete with or impact coal usage, such as oil and natural gas; timing of reductions or increases in
customer coal inventories; long-term coal supply arrangements; reductions and/or deferrals of purchases by major customers; risks in or related to
coal mining operations, including risks related to third-party suppliers and carriers operating at our mines or complexes; unexpected maintenance
and equipment failure; environmental, safety and other laws and regulations, including those directly affecting our coal mining and production, and
those affecting our customers’ coal usage; ability to obtain and maintain all necessary governmental permits and authorizations; competition
among coal and other energy producers in the United States and internationally; railroad, barge, trucking and other transportation availability,
performance and costs; employee benefits costs and labor relations issues; replacement of our reserves; our assumptions concerning
economically recoverable coal reserve estimates; availability and costs of credit, surety bonds and letters of credit; title defects or loss of leasehold
interests in our properties which could result in unanticipated costs or inability to mine these properties; future legislation and changes in
regulations or governmental policies or changes in interpretations or enforcement thereof, including with respect to safety enhancements and
environmental initiatives relating to global warming or climate change; impairment of the value of our long-lived and deferred tax assets; our
liquidity, including our ability to adhere to financial covenants related to our borrowing arrangements; adequacy and sufficiency of our internal
controls; and legal and administrative proceedings, settlements, investigations and claims and the availability of related insurance coverage.
n You should keep in mind that any forward-looking statement made by us in this presentation or elsewhere speaks only as of the date on which the
statements were made. See also the “Risk Factors” in our 2009 Annual Report on Form 10-K and subsequent filings with the Securities and
Exchange Commission, all of which are currently available on our website at www.intlcoal.com. New risks and uncertainties arise from time to time,
and it is impossible for us to predict these events or how they may affect us or our anticipated results. We have no duty to, and do not intend to,
update or revise the forward-looking statements in this presentation, except as may be required by law. In light of these risks and uncertainties, you
should keep in mind that any forward-looking statement made in this presentation might not occur. All data presented herein is as of December 31,
2009 unless otherwise noted.
2

ICG Highlights
n Product and basin diversification
n Excellent reserve position, majority of which is owned
n Attractive cost position
n Underground-focused growth strategy
3
n Metallurgical sales expected to more than double in 2010 to 2.4 million tons
n Highly contracted 2010 with upside for 2011
n Sufficient open tonnage to take advantage of improving coal markets
n Nearly 3 million annual tons of idle production capacity available
n World-class 3.5 million tpy Tygart longwall development
n Additional opportunities to further increase metallurgical tons
n Demonstrated ability to grow profits and cash flow
n Consistent recent financial performance and favorable outlook
n Industry-leading legacy liability position
n Restructured balance sheet with reduced leverage levels and extended
maturity profile
maturity profile
Attractive Asset Portfolio
Positioned to Capitalize on
Favorable Industry Trends
Favorable Industry Trends
Significant Organic Growth Profile
Enhanced Financial Position
ICG Highlights
n Product and basin diversification
n Excellent reserve position, majority of which is owned
n Attractive cost position
n Underground-focused growth strategy
4
n Metallurgical sales expected to more than double in 2010 to 2.4 million tons
n Highly contracted 2010 with upside for 2011
n Sufficient open tonnage to take advantage of improving coal markets
n Nearly 3 million annual tons of idle production capacity available
n World-class 3.5 million tpy Tygart longwall development
n Additional opportunities to further increase metallurgical tons
n Demonstrated ability to grow profits and cash flow
n Consistent recent financial performance and favorable outlook
n Industry-leading legacy liability position
n Reduced leverage levels and extended maturity profile
Attractive Asset Portfolio
Positioned to Capitalize on
Favorable Industry Trends
Favorable Industry Trends
Significant Organic Growth Profile
Enhanced Financial Position
5
ICG Illinois
Illinois
Kentucky
Beckley
West
Virginia
Virginia
Virginia
MD
East Kentucky
Flint Ridge
Hazard
Knott County
Raven
Eastern
Buckhannon
Sentinel
Tygart Valley #1
Vindex
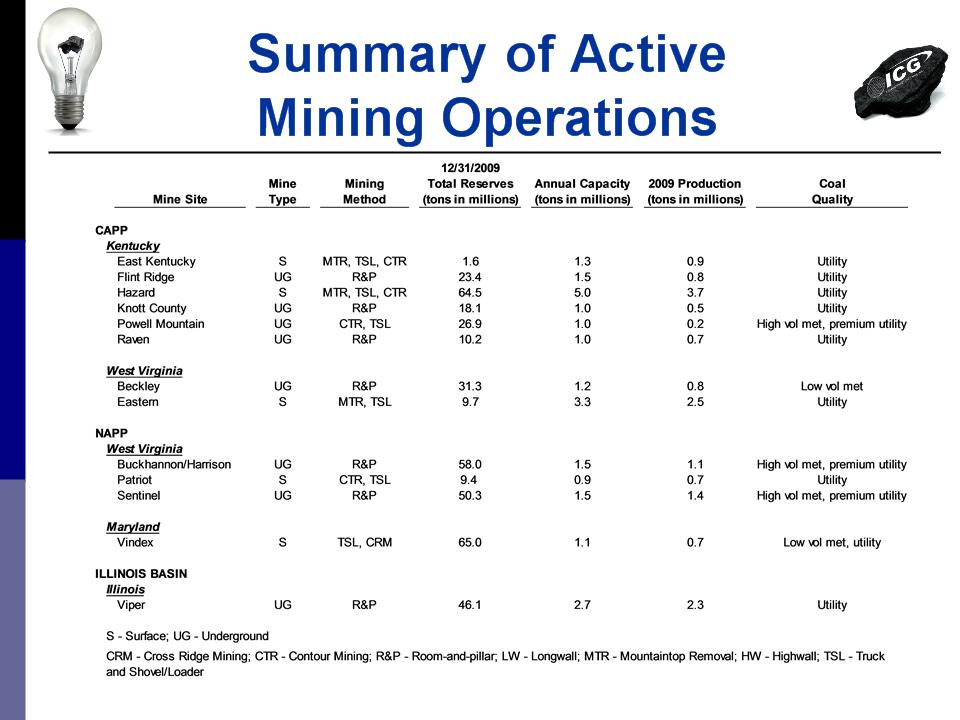
Current Operations
Future Operations
ICG Corporate
Powell Mountain
Note:
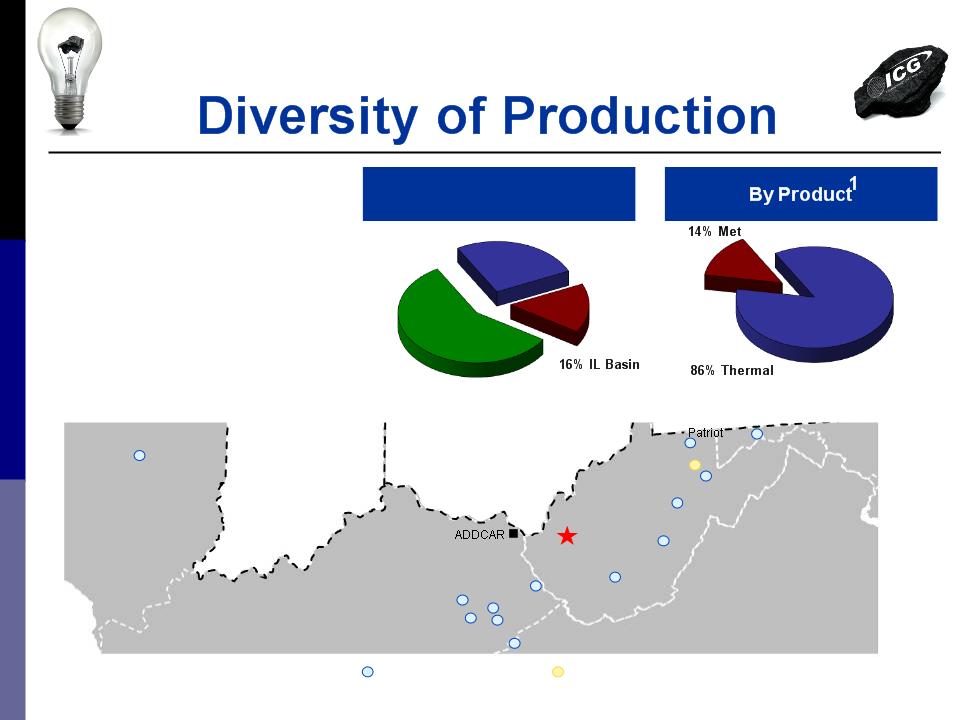
1 Management estimate for 2010 as of February 26, 2010
26% NAPP
By Basin1
58% CAPP
n 13 active mining complexes - 8 in
Central Appalachia, 4 in Northern
Appalachia and 1 in Illinois Basin
Central Appalachia, 4 in Northern
Appalachia and 1 in Illinois Basin
n Less reliant on any single mine for
a significant portion of total
production
a significant portion of total
production
n Additional benefits of
diversification in labor markets and
transportation
diversification in labor markets and
transportation
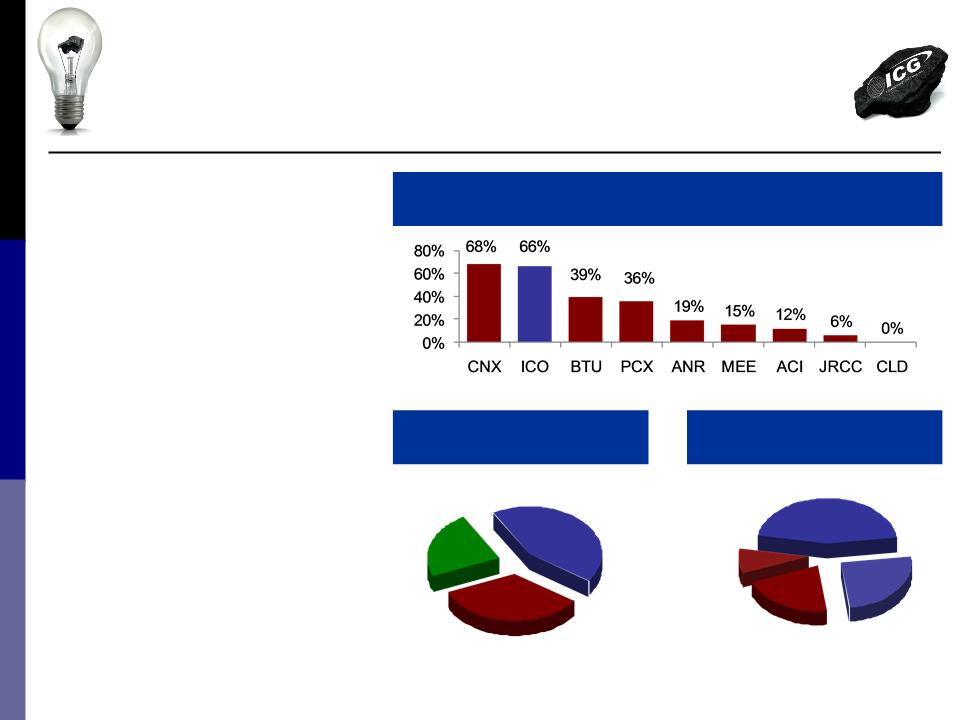
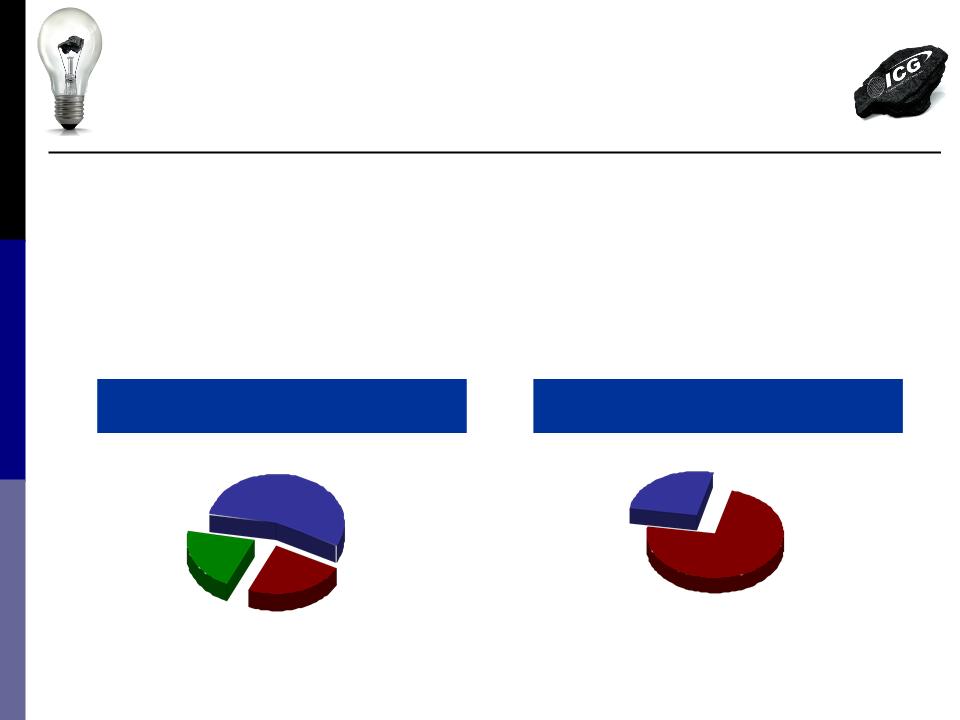
Excellent Reserve Position
n ICG owns a larger portion of
its reserves than nearly all
other public producers
its reserves than nearly all
other public producers
– Reduces royalty costs
n ICG controls 1.1 billion tons
of high-quality reserves that
are primarily high-BTU
metallurgical and low-sulfur
thermal coal
of high-quality reserves that
are primarily high-BTU
metallurgical and low-sulfur
thermal coal
– 325 million tons
metallurgical, 71% of
which are owned
metallurgical, 71% of
which are owned
% Ownership of Total Reserves
Geographic Distribution
of Reserves
of Reserves
21% Met
(Owned)
(Owned)
231 million tons
45% Thermal (Owned)
490 million tons
Reserves by Type
34% IL Basin
371 million tons
23% CAPP
256 million tons
43% NAPP
463 million tons
25% Thermal
(Leased)
(Leased)
275 million tons
9% Met
(Leased)
(Leased)
94 million tons
Source: Company filings as of 12/31/09 (Cloud Peak as of 9/30/09)
6
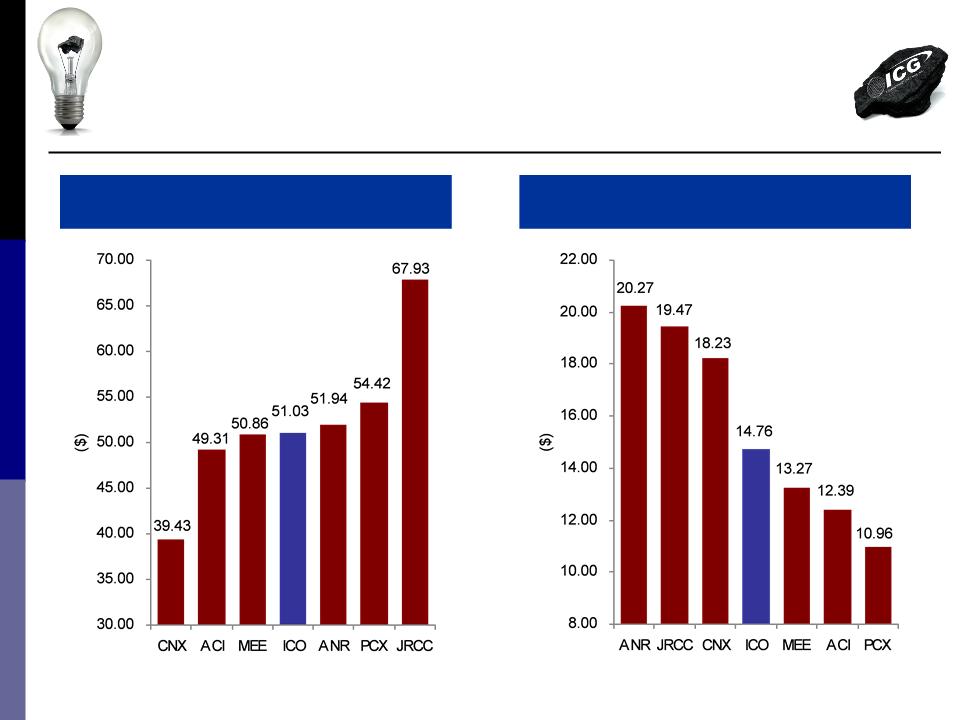
Attractive Competitive Position
7
Appalachian Cash Cost / ton 1,2
Appalachian Cash Margin / ton 1
Notes:
1 Data represents 4Q09 reported cash costs and margins
2 Cash costs exclude DD&A expenses
Shift Towards Underground
Mitigates Regulatory Concerns
Mitigates Regulatory Concerns
n Nearly all ICG growth is projected to be new or
expanding underground mining operations
(rather than surface mines)
expanding underground mining operations
(rather than surface mines)
– Incremental deep mine growth totaling 1.7
million tpy by 2011 is planned at Illinois,
Vindex, Beckley, Eastern & Kentucky
operations
million tpy by 2011 is planned at Illinois,
Vindex, Beckley, Eastern & Kentucky
operations
– Major development is 3.5 million tpy Tygart
#1 complex in NAPP
#1 complex in NAPP
• Production ramp-up projected for 2012-15
n Underground mining operations generally have
fewer regulatory hurdles than surface mines
fewer regulatory hurdles than surface mines
n Reduced risk of regulatory permitting obstacles
Production by Mining Method
Surface
Underground
10% Surface
104 million tons
90% Underground
986 million tons
Reserves by Method
Note:
1 Management estimate as of February 26, 2010
1
1
ICG Highlights
n Product and basin diversification
n Excellent reserve position, majority of which is owned
n Attractive cost position
n Underground-focused growth strategy
9
n Metallurgical sales expected to more than double in 2010 to 2.4 million tons
n Highly contracted 2010 with upside for 2011
n Sufficient open tonnage to take advantage of improving coal markets
n Nearly 3 million annual tons of idle production capacity available
n World-class 3.5 million tpy Tygart longwall development
n Additional opportunities to further increase metallurgical tons
n Demonstrated ability to grow profits and cash flow
n Consistent recent financial performance and favorable outlook
n Industry-leading legacy liability position
n Reduced leverage levels and extended maturity profile
Attractive Asset Portfolio
Positioned to Capitalize on
Favorable Industry Trends
Favorable Industry Trends
Significant Organic Growth Profile
Enhanced Financial Position
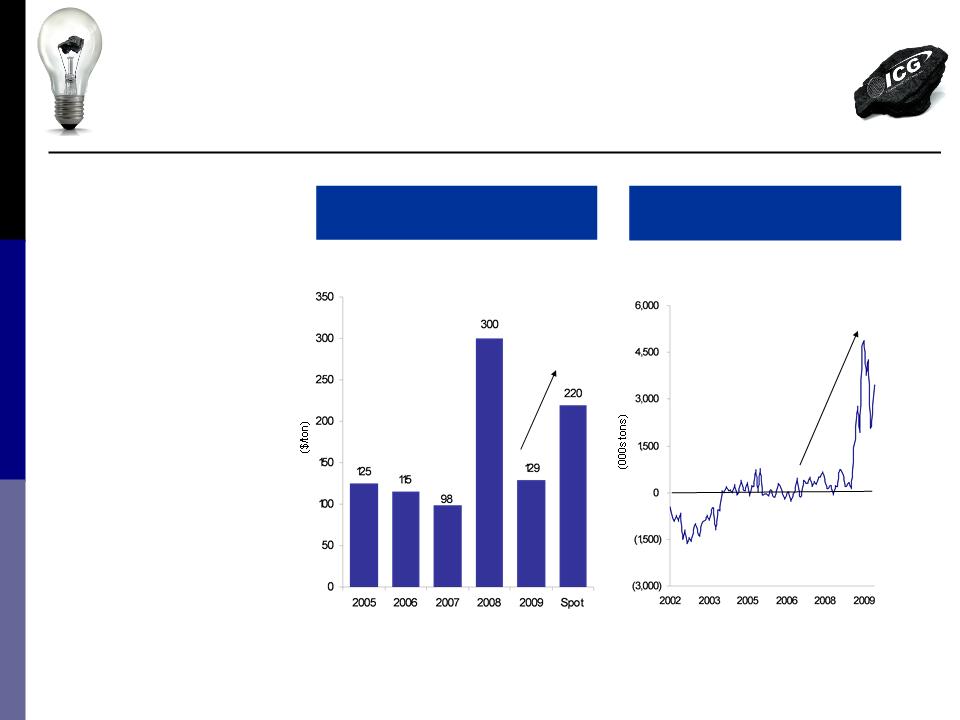
Seaborne Hard
Coking Coal Prices
Coking Coal Prices
Metallurgical Coal
Market Rebounding
10
China Net Importer of Coal
2005 - Current Spot
Chinese Coal Net Imports / (Exports)
Net Exports
Net Imports
n Metallurgical spot
prices have already
rebounded
substantially from
2009 levels
prices have already
rebounded
substantially from
2009 levels
n China met imports
continue to drive
market demand
continue to drive
market demand
n Industry analysts
expect that 2010
benchmark hard
coking coal prices will
settle in the $200 to
$240 range (fob
vessel, mt basis)
expect that 2010
benchmark hard
coking coal prices will
settle in the $200 to
$240 range (fob
vessel, mt basis)
Source: Industry Data
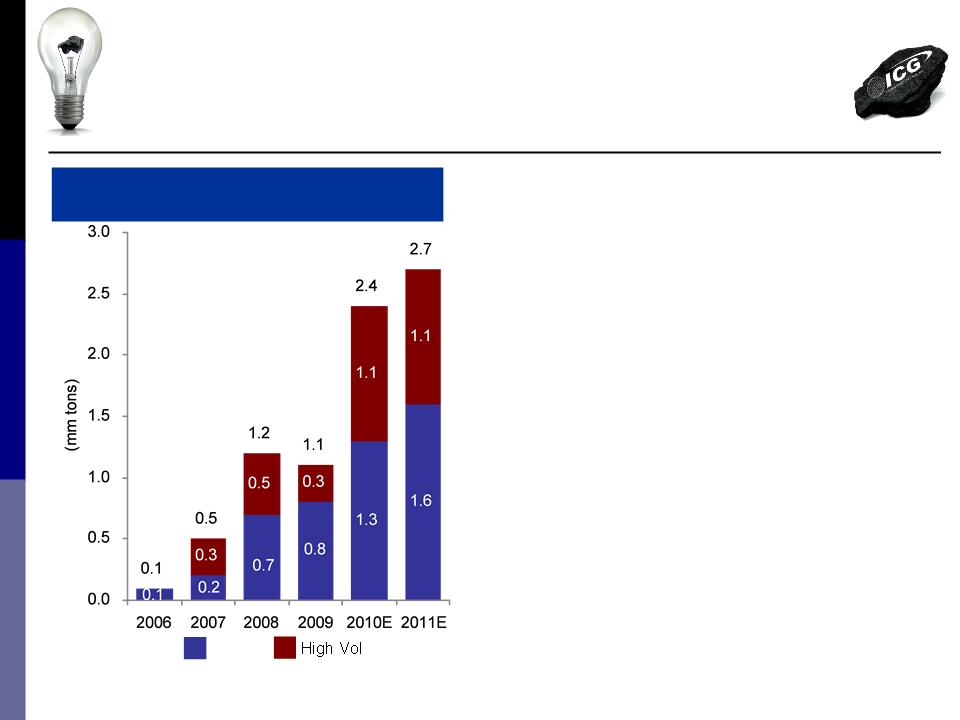
Metallurgical Portfolio
Expanding Rapidly
Expanding Rapidly
Metallurgical Sales Growth
Note:
1 Management estimate as of February 26, 2010
11
Key drivers of met growth:
n Projected production increase at met mines
during 2009-2011 of nearly 700K tons/year
during 2009-2011 of nearly 700K tons/year
– Added third section at Beckley (LV)
– Higher productivity at Sentinel (HV)
– New low volatile met Bismark mine in
development at Vindex; startup projected
for Q3 2010 and expected to reach full
production capacity in 2011
development at Vindex; startup projected
for Q3 2010 and expected to reach full
production capacity in 2011
n Portion of Sentinel sold as met projected to
increase from 14% in 2009 to 60% in 2010
increase from 14% in 2009 to 60% in 2010
– Completion of legacy utility contracts
– Increased demand for Sentinel quality
n Increase in met blend sales expected from
Powell Mtn (HV/PCI) and existing Vindex
mines (LV)
Powell Mtn (HV/PCI) and existing Vindex
mines (LV)
Low Vol
1
1
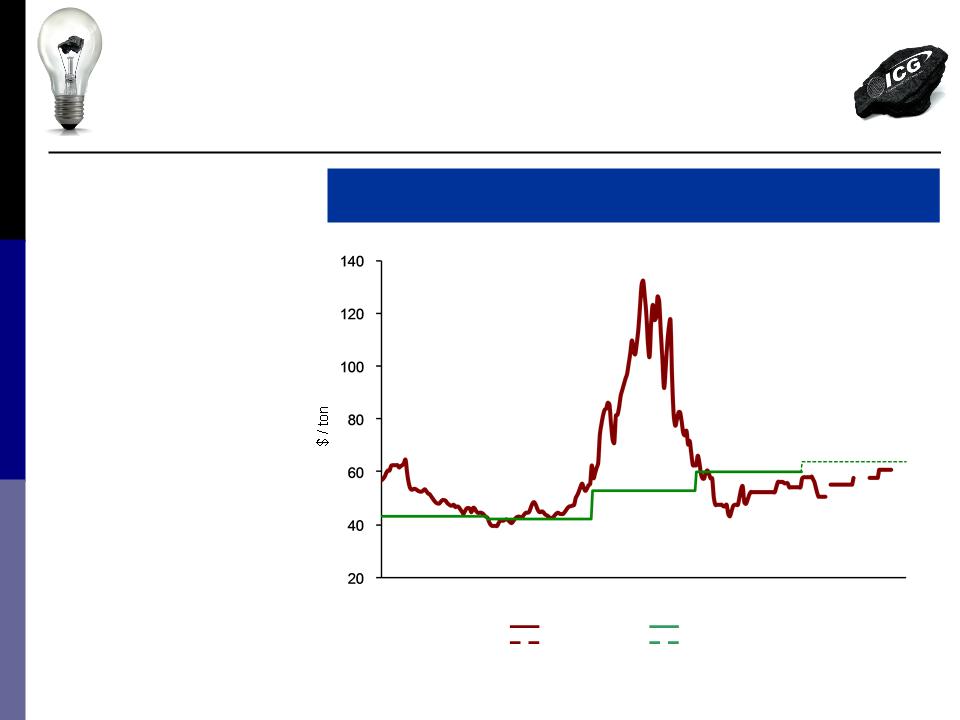
Thermal Coal Market
Showing Signs of Strength
Showing Signs of Strength
Thermal Coal Environment
CAPP Price
Futures
2006
2007
2008
2009
Source: Bloomberg, Company filings
n Expect 2010 to be a
rebalancing year for
coal supply/demand
rebalancing year for
coal supply/demand
n Cold weather
globally has led to
favorable burn,
accelerating thermal
coal inventory
drawdown
globally has led to
favorable burn,
accelerating thermal
coal inventory
drawdown
n Presents upside for
ICG to capitalize on
a rising price
environment
ICG to capitalize on
a rising price
environment
2010
12
ICG Realized Price
2010 Guidance
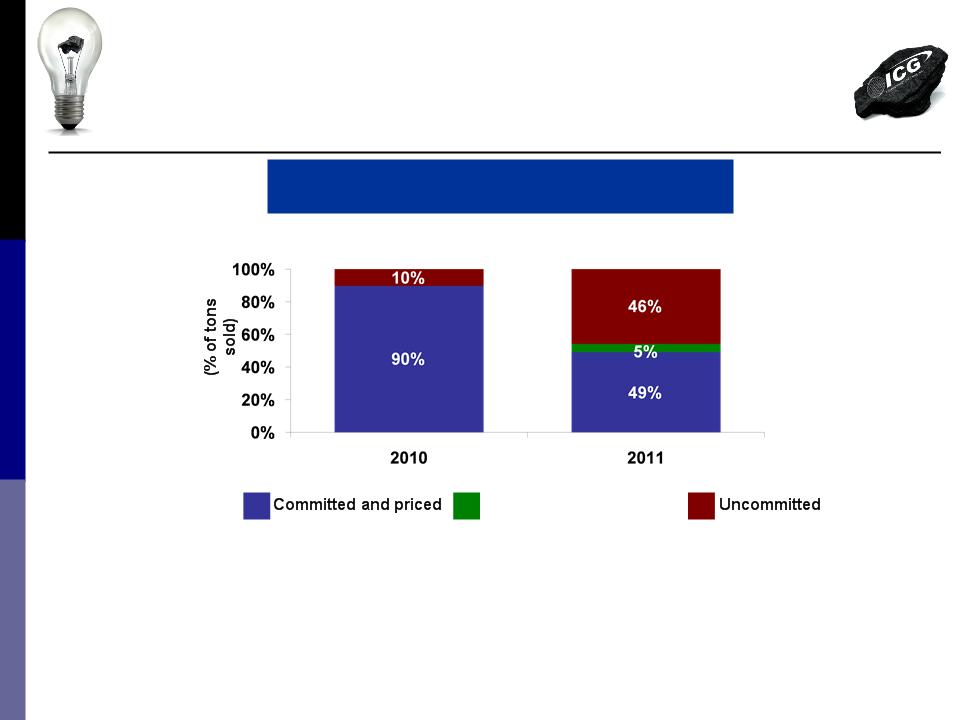
Committed and not priced
Projected Sales 16.7 - 17.3 16.5 - 18.0
(tons in millions)
(tons in millions)
Average Selling Price $63.00-$64.50 $65.00-$70.00
Metallurgical Uncommitted 1.0 2.6
(tons in millions)
(tons in millions)
Committed Tonnage1
Favorable Sales Position
13
Note:
1 Management estimate as of February 26, 2010
ICG Highlights
n Product and basin diversification
n Excellent reserve position, majority of which is owned
n Attractive cost position
n Underground-focused growth strategy
14
n Metallurgical sales expected to more than double in 2010 to 2.4 million tons
n Highly contracted 2010 with upside for 2011
n Sufficient open tonnage to take advantage of improving coal markets
n Nearly 3 million annual tons of idle production capacity available
n World-class 3.5 million tpy Tygart longwall development
n Additional opportunities to further increase metallurgical tons
n Demonstrated ability to grow profits and cash flow
n Consistent recent financial performance and favorable outlook
n Industry-leading legacy liability position
n Reduced leverage levels and extended maturity profile
Attractive Asset Portfolio
Positioned to Capitalize on
Favorable Industry Trends
Favorable Industry Trends
Significant Organic Growth Profile
Enhanced Financial Position
Significant Idle Production
Capacity Available
n Nearly 3 million tons annual production capacity can be promptly activated to take advantage of
strengthening market
strengthening market
– 2.15 million tpy held in "hot-idle" status requiring only moderate equipment investment for
re-start
re-start
– Another 0.75 million tpy production capacity permitted and available for development; 6-12
month start-up timeframe
month start-up timeframe
15
Quality of Idle Production
Status of Idle Production
21% LV Met
0.60 million tons
55% CAPP Thermal
1.60 million tons
24% NAPP Thermal
0.70 million tons
26% Undeveloped
0.75 million tons
74% Hot Idle
2.15 million tons
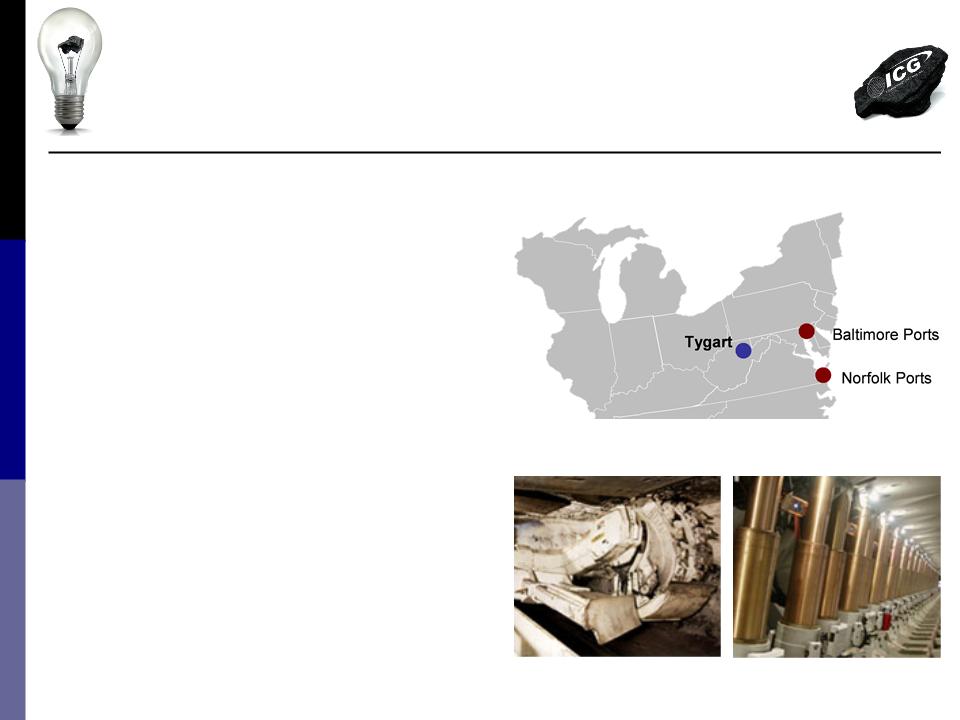
Tygart Represents World
Class Production Opportunity
n Tygart #1 will be the first of 3 or more mining
complexes planned for ICG’s 186 million ton
Hillman property in Northern West Virginia
complexes planned for ICG’s 186 million ton
Hillman property in Northern West Virginia
– High Btu, low- to medium-sulfur thermal and
high volatile met quality coal
high volatile met quality coal
– Anticipating low costs due to longwall mining,
owned property and favorable geology
owned property and favorable geology
– Management estimates Tygart will generate
a margin of plus $40/ton at full output1
a margin of plus $40/ton at full output1
n Expected to produce up to 3.5 million tpy at full
output (50% met/50% thermal)
output (50% met/50% thermal)
– Startup in late 2012; full output mid-2014
– Targets a 40-50 million ton reserve area
n Project capital of approximately $300 million is
expected to be financed through operating cash
flow
expected to be financed through operating cash
flow
n Favorable geographic position relative to
Atlantic terminals and NE customer base
Atlantic terminals and NE customer base
16
Note:
1 Based on the current coal pricing environment and production cost estimates
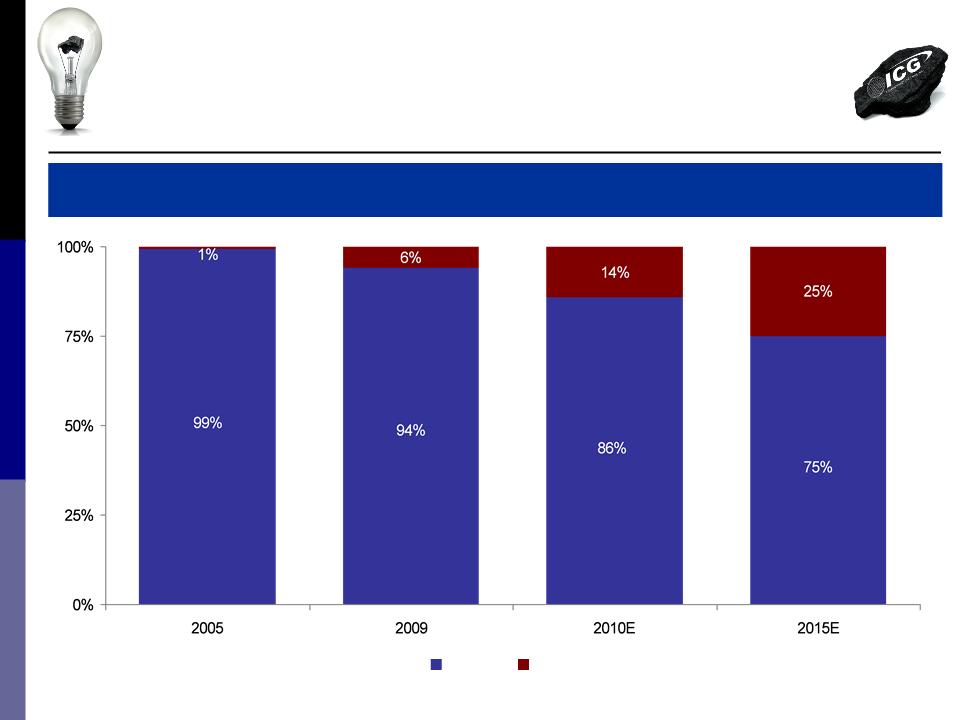
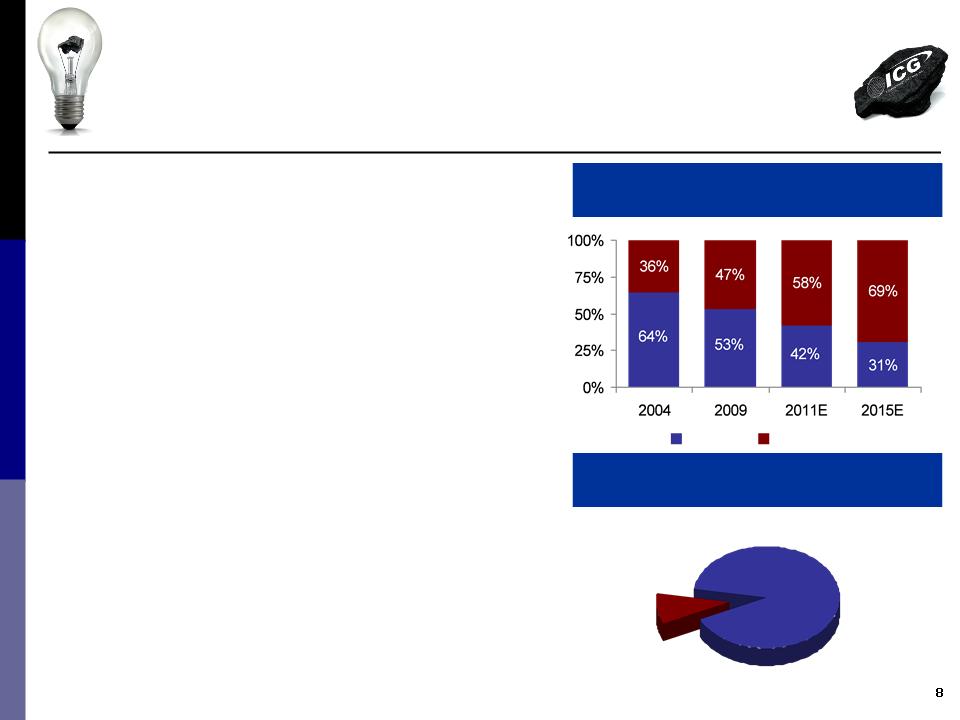
Growing
Metallurgical Production
Metallurgical Production
17
Metallurgical as Percent of Total Tons Sold
Thermal
Met
Note:
1 Management estimate as of February 26, 2010
1
1
ICG Highlights
n Product and basin diversification
n Excellent reserve position, majority of which is owned
n Attractive cost position
n Underground-focused growth strategy
18
n Metallurgical sales expected to more than double in 2010 to 2.4 million tons
n Highly contracted 2010 with upside for 2011
n Sufficient open tonnage to take advantage of improving coal markets
n Nearly 3 million annual tons of idle production capacity available
n World-class 3.5 million tpy Tygart longwall development
n Additional opportunities to further increase metallurgical tons
n Demonstrated ability to grow profits and cash flow
n Consistent recent financial performance and favorable outlook
n Industry-leading legacy liability position
n Restructured balance sheet with reduced leverage levels and extended
maturity profile
maturity profile
Attractive Asset Portfolio
Positioned to Capitalize on
Favorable Industry Trends
Favorable Industry Trends
Significant Organic Growth Profile
Enhanced Financial Position
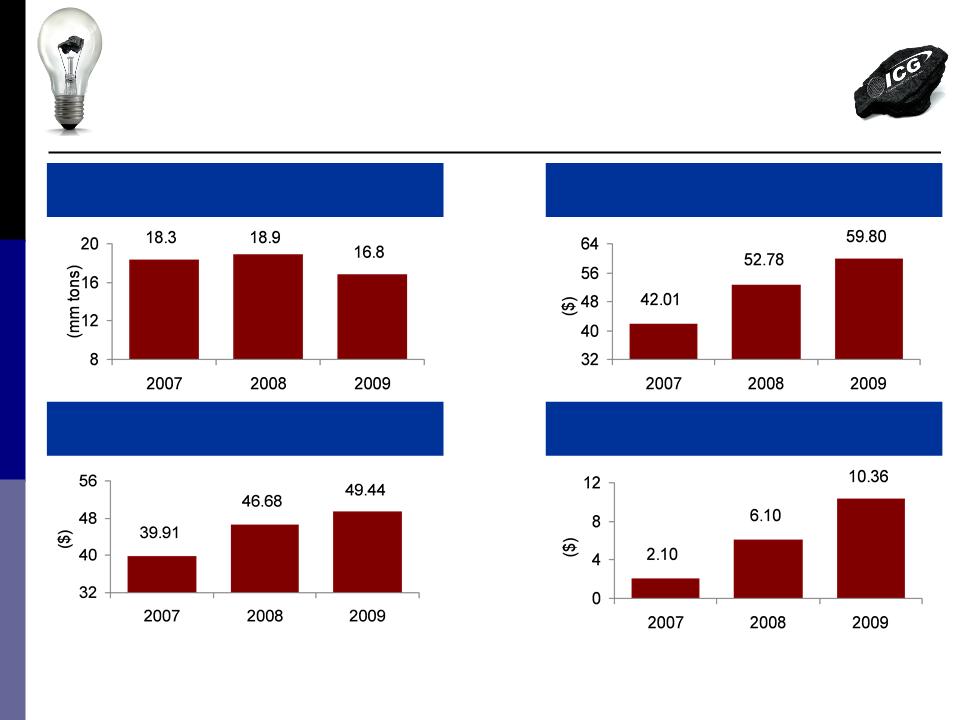
Focused Execution Has
Driven Strong Margin Growth…
Driven Strong Margin Growth…
19
Tons Sold
Coal Sales Revenue Per Ton
Cost of Coal Sales Revenue Per Ton
Margin Per Ton
Source: Company filings
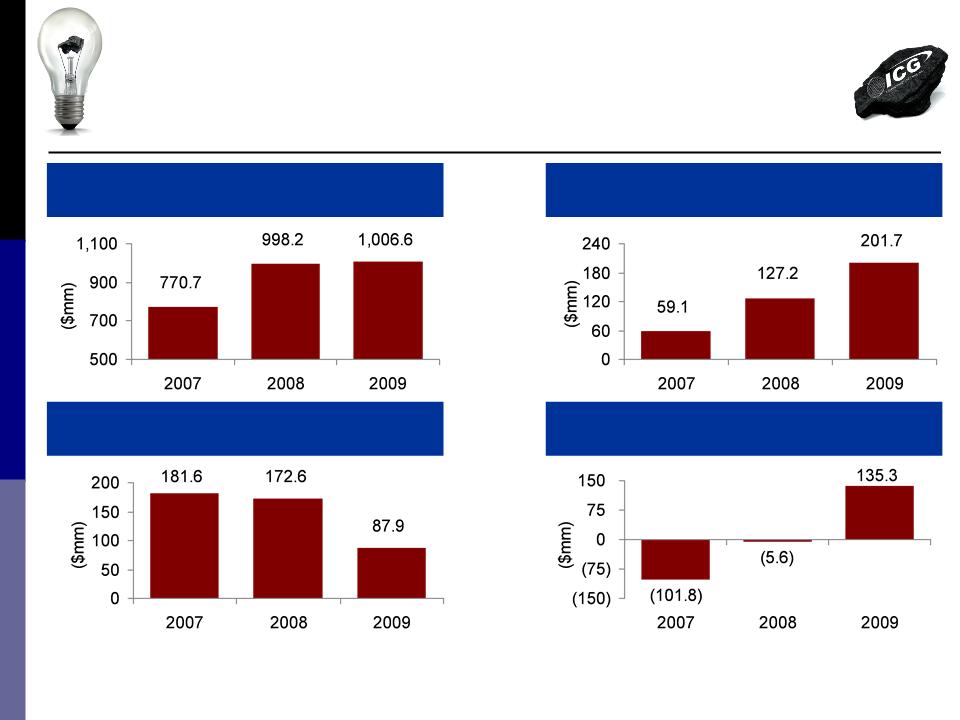
…Resulting in Record
EBITDA Generation
EBITDA Generation
20
Coal Sales Revenue
Adjusted EBITDA1
GAAP Capital Expenditures
Adjusted EBITDA - Cash CapEx
Source: Company filings
Note:
1 EBITDA is a non-GAAP measure and reconciliations provided at end of presentation
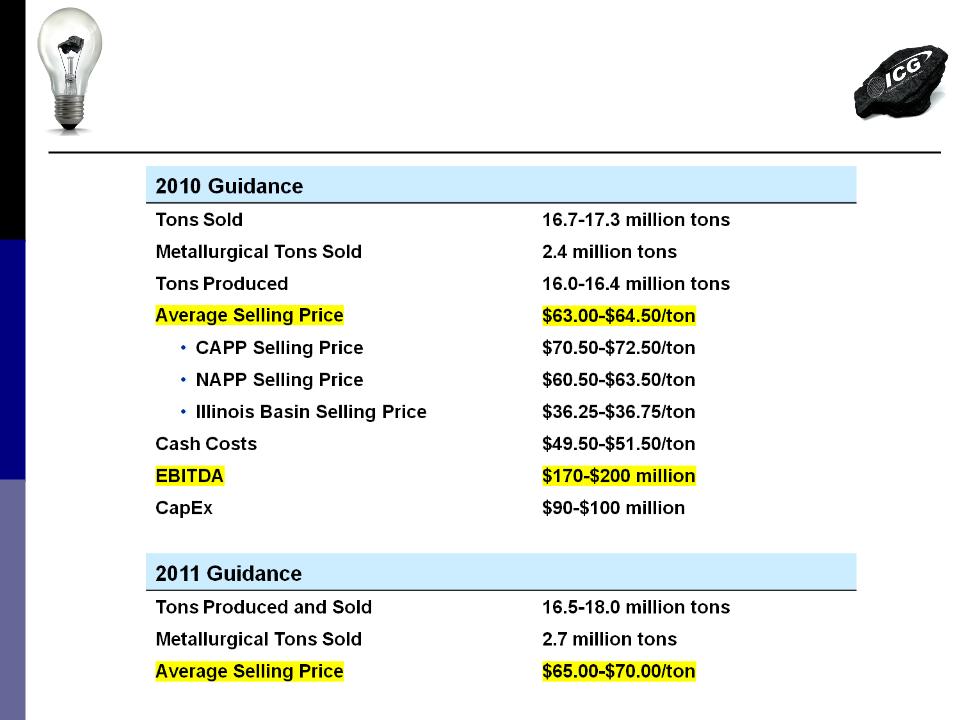
Updated Guidance Summary
(Management Estimate as of February 26, 2010 )
(Management Estimate as of February 26, 2010 )
21
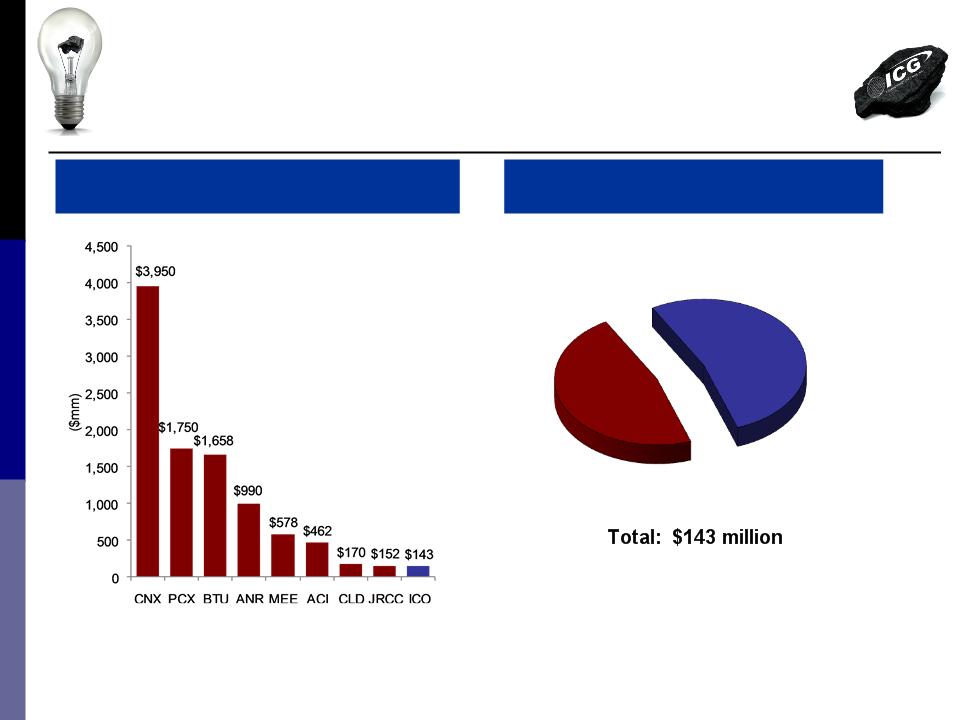
ICG Legacy Liabilities
Total Legacy Liabilities1
Note:
1 Company Annual Reports as of December 31, 2009 (Cloud Peak as of 9/30/09); legacy liabilities include accrued workers’ compensation liabilities,
liabilities under the Coal Industry Retiree Health Benefit Act of 1992, post-retirement employee obligations, “black lung” liabilities and reclamation
liabilities
liabilities under the Coal Industry Retiree Health Benefit Act of 1992, post-retirement employee obligations, “black lung” liabilities and reclamation
liabilities
Lowest Legacy Liabilities
Among Peer Group
22
Employee Benefits
47%
Reclamation
53%

Capital Restructuring
n New ABL credit facility
– Increased borrowing capacity to $125 million
– Eliminated ongoing financial maintenance convents
– Capacity may be increased to $200 million
n Common Stock offering
– Raised $109 million through the sale of 24.4 million shares
n Convertible Senior Notes
– Sold $115 million of 7-year 4.00% convertible senior notes
with a 30% conversion premium
with a 30% conversion premium
n Senior Secured Second-Priority Notes
– Sold $200 million of 8-year 9.125% senior secured second-
priority notes priced to yield 9.25%
priority notes priced to yield 9.25%
23
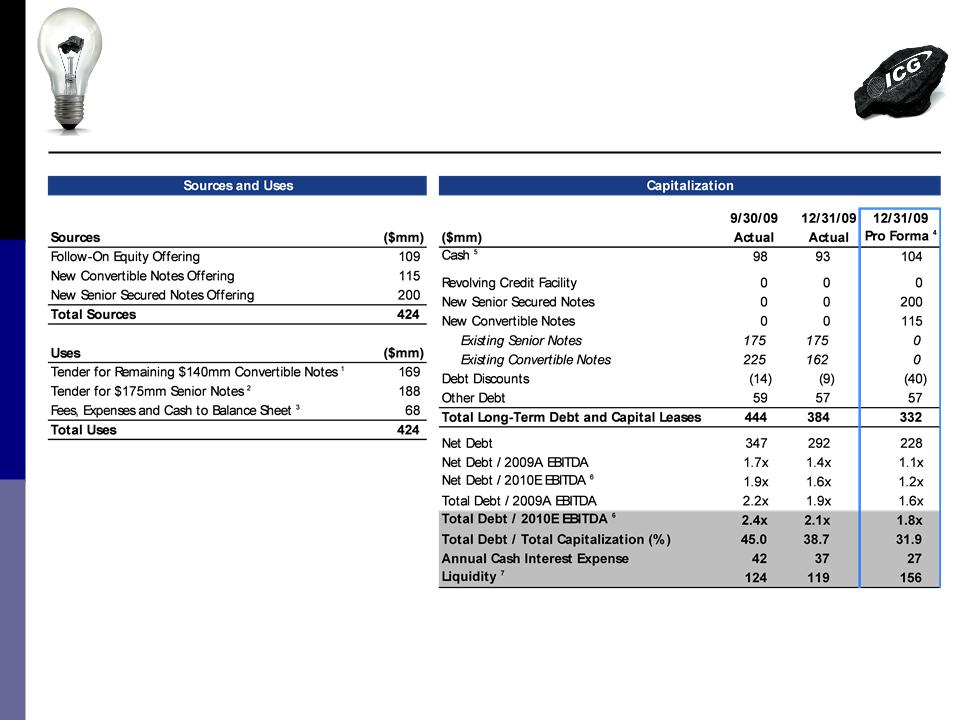
Notes:
1 Assumes existing convertible tendered at price of 121.00
2 Assumes existing senior notes tendered at price of 107.25
3 Includes original issue discount on new senior secured notes of $1.4 million
4 Adjusted to give effect to new offerings, new ABL and $22mm of private exchanges for the existing convertible notes completed in January 2010
5 Pro forma cash includes accrued interest payments
6 2010E EBITDA based on midpoint of ICG guidance ($185 million)
7 Cash plus revolver availability
24
New Capital Structure
n New ABL increases revolver size from
$100 million to $125 million
$100 million to $125 million
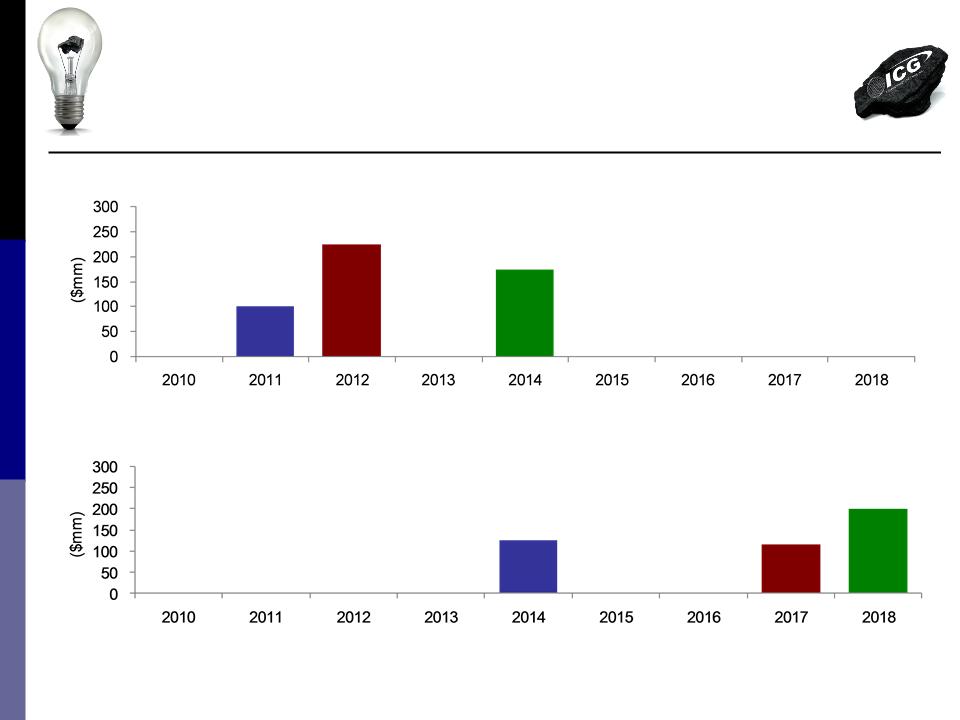
Substantially Extends
Maturity Profile
9/30/09 Maturity Profile
Pro Forma 12/31/09 Maturity Profile
Revolver
$100mm
$100mm
Convertible
$225mm
$225mm
Bond
$175mm
$175mm
Revolver
$125mm
$125mm
Bond
$200mm
$200mm
Convertible
$115mm
$115mm
25

ICG Highlights
n Product and basin diversification
n Excellent reserve position, majority of which is owned
n Attractive cost position
n Underground-focused growth strategy
26
n Metallurgical sales expected to more than double in 2010 to 2.4 million tons
n Highly contracted 2010 with upside for 2011
n Sufficient open tonnage to take advantage of improving coal markets
n Nearly 3 million annual tons of idle production capacity available
n World-class 3.5 million tpy Tygart longwall development
n Additional opportunities to further increase metallurgical tons
n Demonstrated ability to grow profits and cash flow
n Consistent recent financial performance and favorable outlook
n Industry-leading legacy liability position
n Restructured balance sheet with reduced leverage levels and extended
maturity profile
maturity profile
Attractive Asset Portfolio
Positioned to Capitalize on
Favorable Industry Trends
Favorable Industry Trends
Significant Organic Growth Profile
Enhanced Financial Position

Thank You!
27

Appendices
28
29

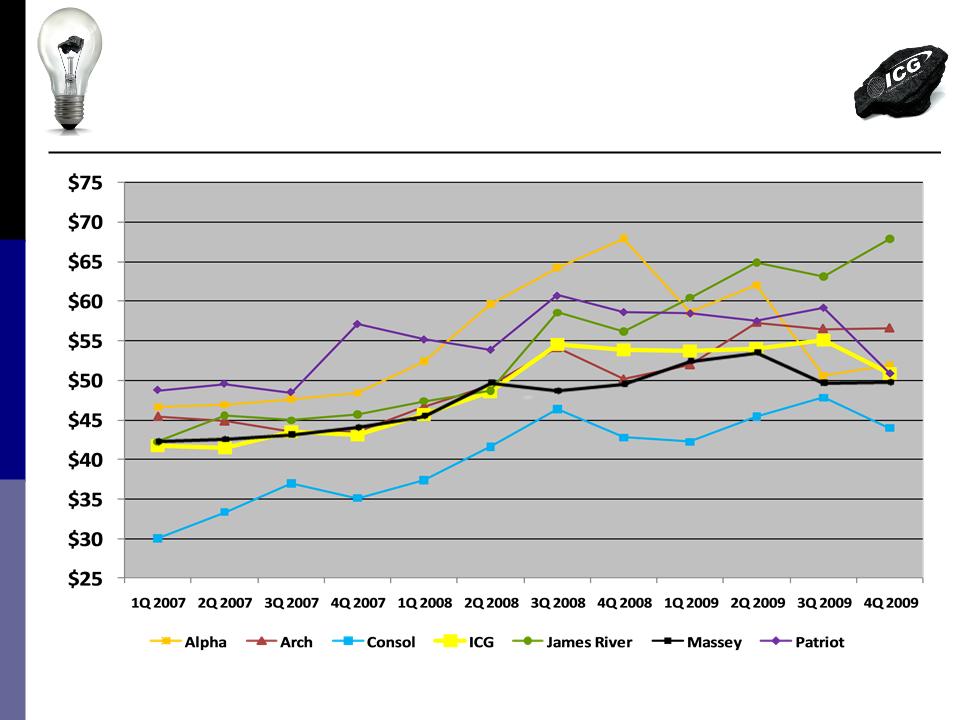
Peer Group
Cost and Margin Comparisons
30
Peer Group Cost Per Ton
Appalachian Production (2007-2009)
Appalachian Production (2007-2009)
31
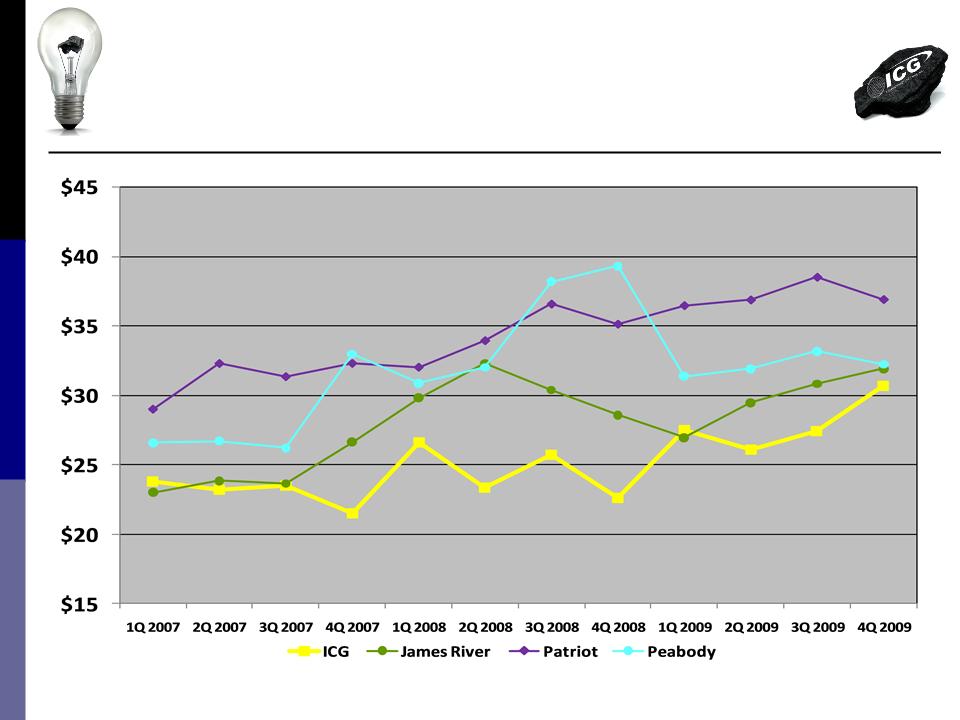
Peer Group Cost Per Ton
Illinois Basin Production (2007-2009)
Illinois Basin Production (2007-2009)
32
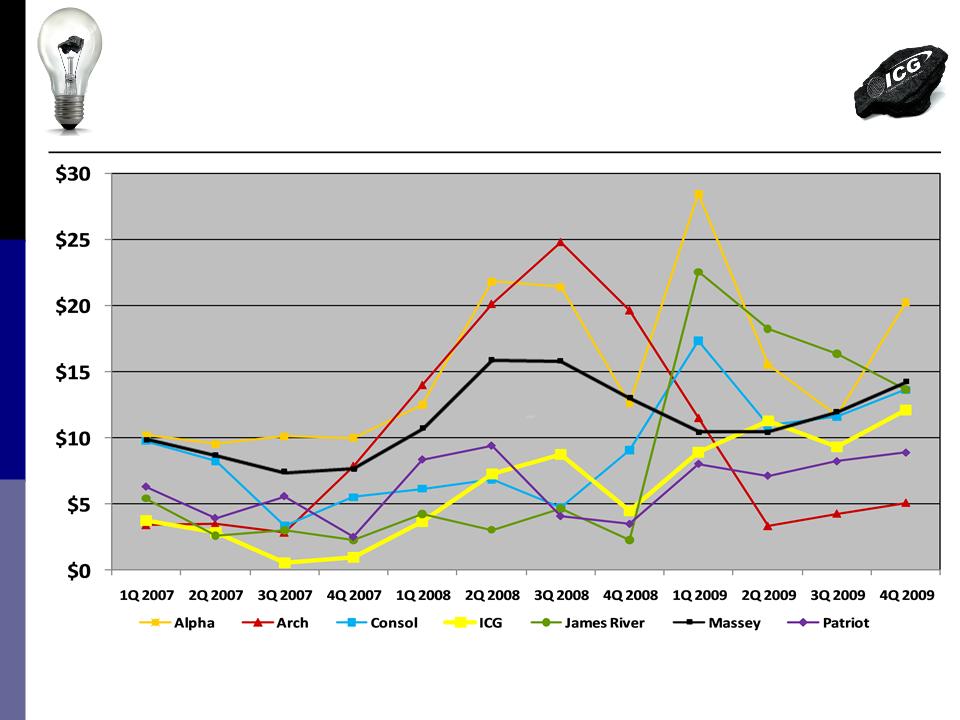
Peer Group Margin Comparison
Margin Per Ton in Dollars (2007-2009)
Margin Per Ton in Dollars (2007-2009)
Note: Margin comparison reflects Eastern US production only.
33

Non-GAAP Measures
n Adjusted EBITDA is a non-GAAP financial measure used by management to gauge operating
performance. We define Adjusted EBITDA as net income or loss attributable to International Coal
Group, Inc. before deducting interest, income taxes, depreciation, depletion, amortization, loss on
extinguishment of debt, impairment charges and noncontrolling interest. Adjusted EBITDA is not, and
should not be used as, a substitute for operating income, net income and cash flow as determined in
accordance with GAAP. We present Adjusted EBITDA because we consider it an important
supplemental measure of our performance and believe it is frequently used by securities analysts,
investors and other interested parties in the evaluation of companies in our industry, substantially all of
which present EBITDA or Adjusted EBITDA when reporting their results. We also use Adjusted
EBITDA as our executive compensation plan bases incentive compensation payments on our Adjusted
EBITDA performance measured against budgets. Our ABL Loan facility uses Adjusted EBITDA (with
additional adjustments) to measure our compliance with covenants, such as fixed charge coverage.
EBITDA or Adjusted EBITDA is also widely used by us and others in our industry to evaluate and price
potential acquisition candidates. Adjusted EBITDA has limitations as an analytical tool, and you should
not consider it in isolation or as a substitute for analysis of our results as reported under GAAP. Some
of these limitations are that Adjusted EBITDA does not reflect all of our cash expenditures or any of
our future requirements, for capital expenditures or contractual commitments; changes in, or cash
requirements for, our working capital needs; or interest expense, or the cash requirements necessary
to service interest or principal payments, on our debts. Although depreciation, depletion and
amortization are non-cash charges, the assets being depreciated, depleted and amortized will often
have to be replaced in the future. Adjusted EBITDA does not reflect any cash requirements for such
replacements. Other companies in our industry may calculate EBITDA or Adjusted EBITDA differently
than we do, limiting its usefulness as a comparative measure.
34