Attached files
| file | filename |
|---|---|
| 8-K - FORM 8-K - GEORESOURCES INC | d8k.htm |
 GeoResources, Inc Corporate Profile March 2010 Exhibit 99.1 |
 2 Forward-Looking Statements Information herein contains forward-looking statements that involve significant risks and uncertainties, including our need to replace production and acquire or develop additional oil and gas reserves, intense competition in the oil and gas industry, our dependence on our management, volatile oil and gas prices, costs associated with hedging activities and uncertainties of our oil and gas estimates of proved reserves and reserve potential, which may be substantial. In addition, all statements or estimates made by the Company, other than statements of historical fact, related to matters that may or will occur in the future are forward-looking statements. Readers are encouraged to read our December 31, 2009 Annual Report on Form 10-K and any and all our other documents filed with the SEC regarding information about GeoResources for meaningful cautionary language in respect of the forward-looking statements herein. Interested persons are able to obtain free copies of filings containing information about GeoResources, without charge, at the SEC’s Internet site (http://www.sec.gov). There is no duty to update the statements herein. |
 3 Additional Disclosures |
 4 Key Investment Highlights Value Creation Experienced Management and Technical Staff with Large Ownership Stake Board and management own or control approximately 43% of the Company Successful track record of creating value and liquidity for shareholders Attractive Value Proposition Trading at a significant discount to NAV Strong Asset Base Strategically located and geographically diverse Balanced oil vs. gas High level of operating control Significant Identified Growth Opportunities on Existing Properties Low risk development drilling Higher impact exploration upside Strong Financial Position Moderate leverage with significant cash flow |
 5
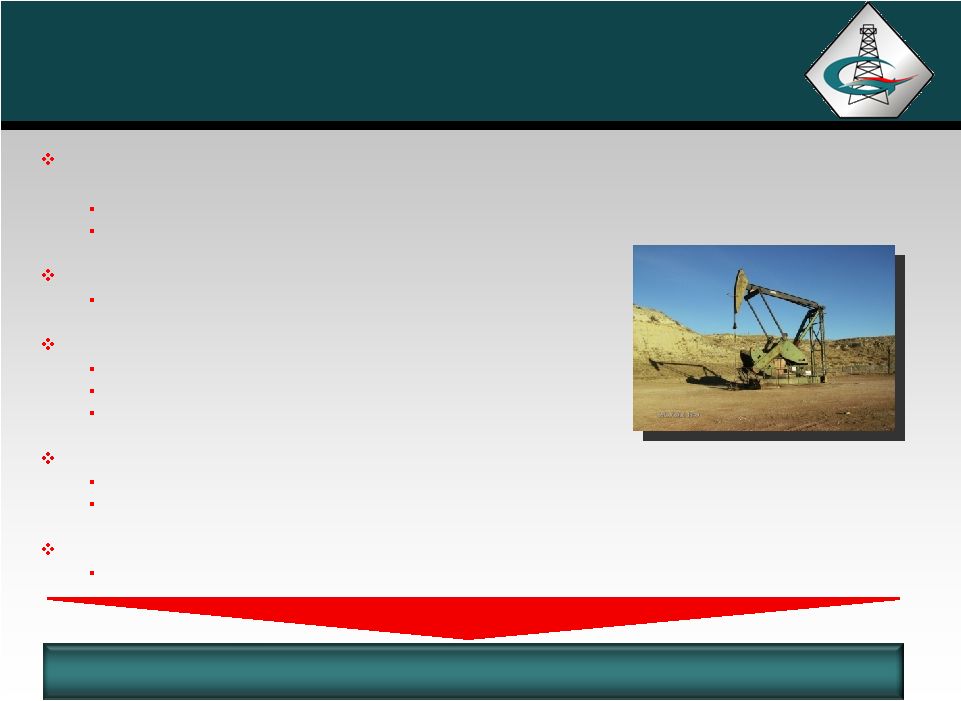
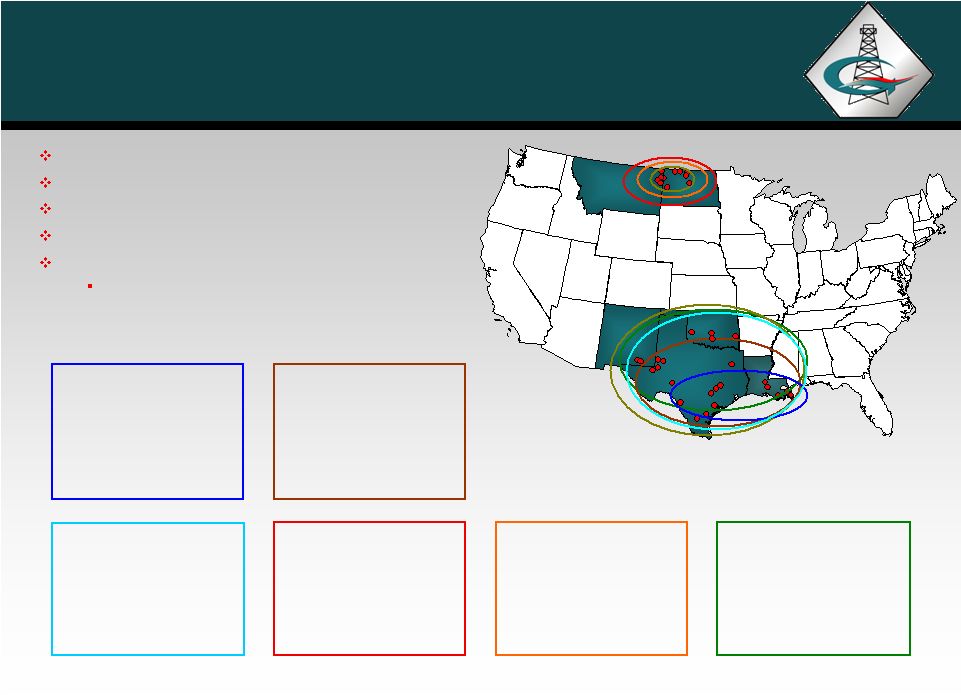
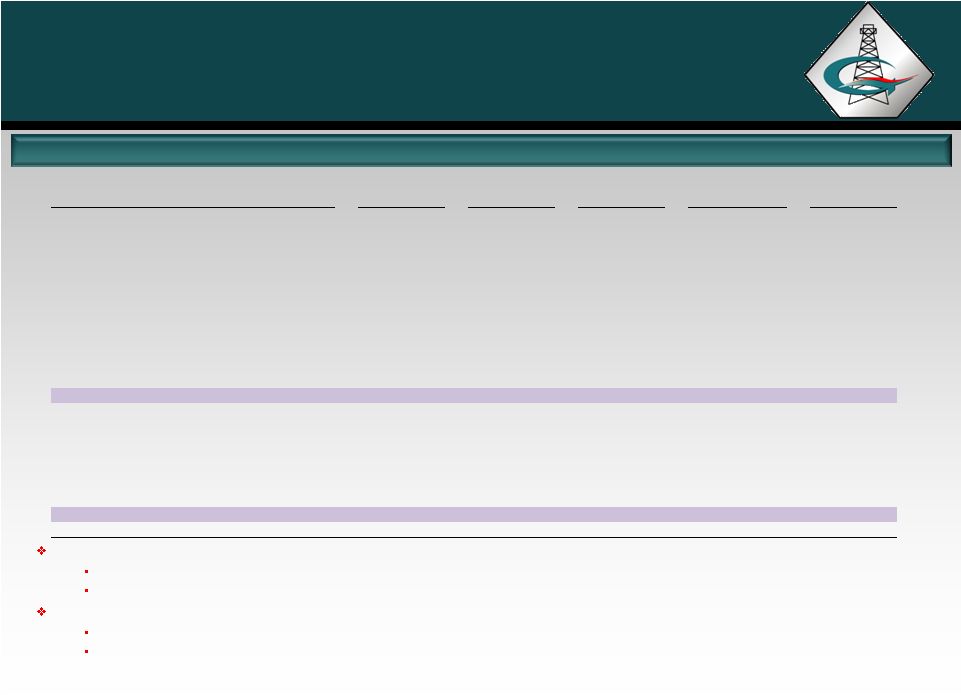
Company Overview Company Highlights (1) Represents the Company’s 4Q 2009 production rate. (2) Acreage information estimated as of 12/31/09. Maps herein exclude minor value
properties. . 5 Direct Direct + Ownership Partnership Proved Reserves (MMBOE) 23.7 25.4 Oil 53% 50% Proved Producing 60% 61% Proved Developed 72% 73% PV 10% (millions) $422 $444 Production (BOEpd) (1) 5,464 5,925 Operated 80% 80% Gross Acreage (2) 477,374 477,374 Net Acreage (2) 216,495 222,893 |
 6 Value-Driven Growth Strategy Asset Rationalization Selectively divest assets to upgrade portfolio Focus on maximizing IRR for investors Cost Control Operate as efficiently as possible by focusing on minimizing development, production, and G&A expenses Pursue promoted partner positions to reduce costs and generate operating fees
Pursue exploration prospects on both new and existing fields Solicit partners on a promoted basis to reduce risk Exploration Acquire operated properties with existing production, development opportunities, and exploration potential Acquisitions Development and Exploitation Drill PUDs and probable reserves to enhance property value Focus on areas with development and exploitation upside Implement re-engineering and development programs to extend field life, increase proved reserves, lower unit operating costs, and enhance economics
|
 7 Management History 2004- 2007 Southern Bay Energy, LLC Gulf Coast, Permian Basin REVERSE MERGED INTO GEORESOURCES 2000-2007 Chandler Energy, LLC Williston Basin, Rockies ACQUIRED BY GEORESOURCES 1988-2000 Chandler Company Rockies, Williston Basin MERGED INTO SHENANDOAH THEN SOLD TO QUESTAR 1992-1996 Hampton Resources Corp, Gulf Coast SOLD TO BELLWETHER EXPLORATION Preferred investors – 30% IRR Initial investors – 7x return 1997-2001 Texoil Inc. Gulf Coast, Permian Basin SOLD TO OCEAN ENERGY Preferred investors – 2.5x return Follow-on investors – 3x return Initial investors – 10x return 2001-2004 AROC Inc. Gulf Coast, Permian Basin, Mid-Con. DISTRESSED ENTITY LIQUIDATED FOR BENEFIT OF INITIAL SHAREHOLDERS Preferred investors – 17% IRR Initial investors – 4x return Track record of profitability and liquidity Long-term repeat investors Extensive industry and financial relationships Significant operational and financial experience Cohesive management and technical staff Team has been together for up to 20 years through multiple entities |
 8 Net Asset Value Net Asset Value (1) Nymex strip pricing. (2) Excludes derivative financial instruments. ($ in millions) PV-10 (1) % of Total Proved Reserves: Proved Developed Producing 262.7 $ 62.3% Proved Developed Non-Producing 69.0 16.4% Proved Undeveloped 90.0 21.3% Total Proved PV-10 Value 421.7 $ 100.0% Plus: Working Capital (2) 16.0 $ Unproved Property, at cost 10.3 Partnership Value 22.1 Less: Total Debt (69.0) Total Net Asset Value 401.1 $ Shares Outstanding (thousands) 19,705 Net Asset Value Per Share 20.36 $ December 31, 2009 |
 9 Proved Reserves Proved Reserves by Category Proved Reserves by Area Partnership Proved % of Interests Total Proved % of Total Area MMBOE Proved MMBOE MMBOE Reserves Gulf Coast/ETX/STX 9.2 38.8% 1.6 10.8 42.5% Williston 6.0 25.3% 0.0 6.0 23.6% Louisiana 3.7 15.6% 0.0 3.7 14.6% Permian 2.3 9.7% 0.0 2.3 9.1% Mid-Continent 1.5 6.3% 0.1 1.6 6.3% Other 1.0 4.2% 0.0 1.0 3.9% Total 23.7 100.0% 1.7 25.4 100.0% ($ in millions) Oil Gas Total % of Corporate Interests MMBO BCF MMBOE Total PV-10 PDP 7.8 37.7 14.1 59.5% $262.7 PDNP 2.1 5.4 3.0 12.7% 69.0 PUD 2.6 23.7 6.6 27.8% 90.0 Total Proved Corporate Interests 12.5 66.8 23.7 100.0% 421.7 Partnership Interests 0.1 10.0 1.7 22.1 Total Proved Corporate and Partnerships 12.6 76.8 25.4 $443.8 |
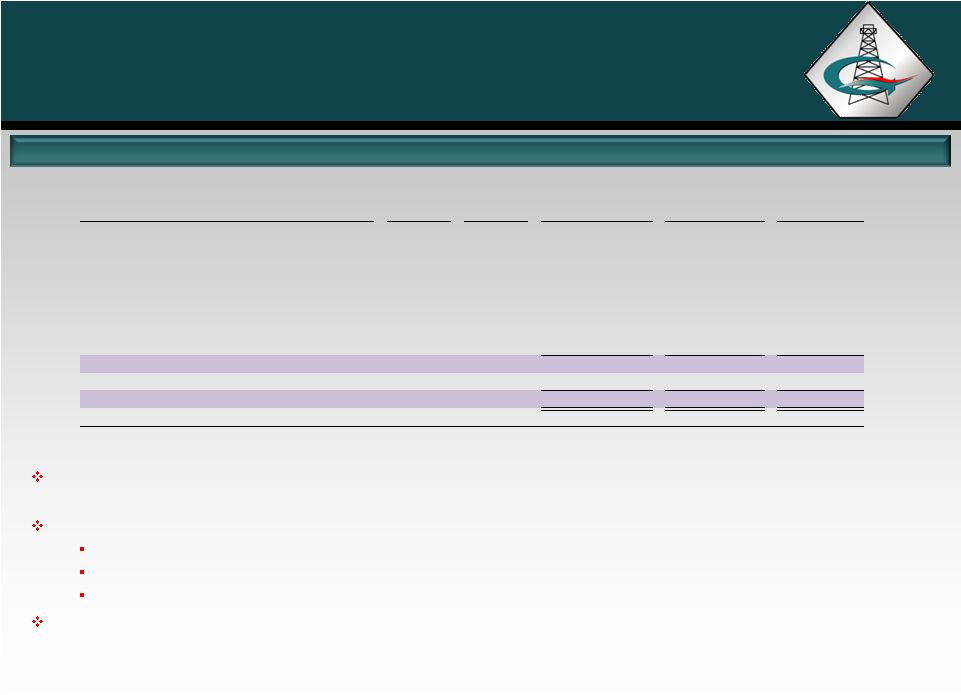
 10 Selected Balance Sheet Data Financial Summary (1) The above table does not include the balance sheet effects of hedge accounting for
derivative financial instruments which is required for financial statements
presented in accordance with generally accepted accounting principles. See the Company’s SEC filings for further information. (2) Adjusted to reflect 11/24/09 equity offering. ($ & shares in millions) Dec. 31, 2009 Dec. 31, 2008 Dec. 31, 2007 Cash 12.7 $ 14.0 $ 24.4 $ Other Working Capital - Net (1) 3.3 $ (8.7) $ (10.5) $ Total Working Capital - Net (1) 16.0 $ 5.3 $ 13.9 $ Oil & Gas Assets (Successful Efforts) 246.8 $ 181.6 $ 181.4 $ Equity in Partnerships 3.5 $ 3.3 $ 1.8 $ Long-Term Debt 69.0 $ 40.0 $ 96.0 $ Common Stock and Additional Paid in Capital 147.2 $ 112.7 $ 79.8 $ Retained Earnings 27.5 $ 21.0 $ 7.5 $ Common Stock Outstanding (2) 19.7 |
 11 Financial Summary Historical Operating Data ($ in millions except per share data) 4th Qtr 2009 2009 2008 2007 Key Data: Average realized oil price ($/Bbl) 65.57 $ 61.09 $ 82.42 $ 67.20 $ Avg. realized natural gas price ($/Mcf) 4.02 $ 3.97 $ 8.12 $ 6.19 $ Oil production (MBbl) 250 851 743 392 Natural gas production (MMcf) 1,514 4,944 2,962 1,648 Total revenue 23.6 $ 80.4 $ 94.6 $ 40.1 $ Net income before tax 2.3 $ 14.8 $ 21.3 $ 8.0 $ Net income after tax 2.4 $ 9.8 $ 13.5 $ 3.1 $ Net income per share (basic) 0.14 $ 0.59 $ 0.87 $ 0.25 $ Adjusted EBITDAX 14.1 $ 48.2 $ 54.2 $ 18.4 $ |
 12 Financial Summary Historical Production Data Historical Operating Netback Data (1) Represents severance tax expense and re-engineering and workover expense. 4 Qtr 2009 2009 2008 2007 Oil Production (MBbls) 250 851 743 292 Gas Production (MMCF) 1,514 4,944 2,962 1,648 Total Production (Mboe) 503 1,675 1,237 667 Avg. Daily Production (Boe/d) 5,464 4,589 3,388 1,826 4 Qtr 2009 2009 2008 2007 ($ per BOE) Revenue $46.97 $48.01 $76.50 $60.17 Less: LOE $11.06 $11.20 $18.53 $16.23 G&A 5.02 5.07 5.80 9.77 Other Field Level Opex (1) 3.60 3.84 8.92 7.46 Total Field Level Operating Costs $19.68 $20.11 $33.25 $33.46 Field Level Operating Netback $27.29 $27.90 $43.25 $26.71 th th |
 13 2009 Finding & Development Costs Capital Expenditures ($M) Reserve Adds (MBOE) (1) Finding & Development Costs Category 2009 Capital Acquisitions 66,594 Drilling 23,623 Exploration 1,406 Total Capital 91,623 Reserve Category Reserve Adds Acquisitions 4,874 Drilling 2,510 Revisions 430 Total direct additions 7,814 Increase partnership share 1,257 Total additions 9,071 Category $/BOE Acquisitions $13.66 Drilling $9.41 Total including revisions $11.73 Total including partnership $10.10 (1) Reserves based on SEC guidelines. |
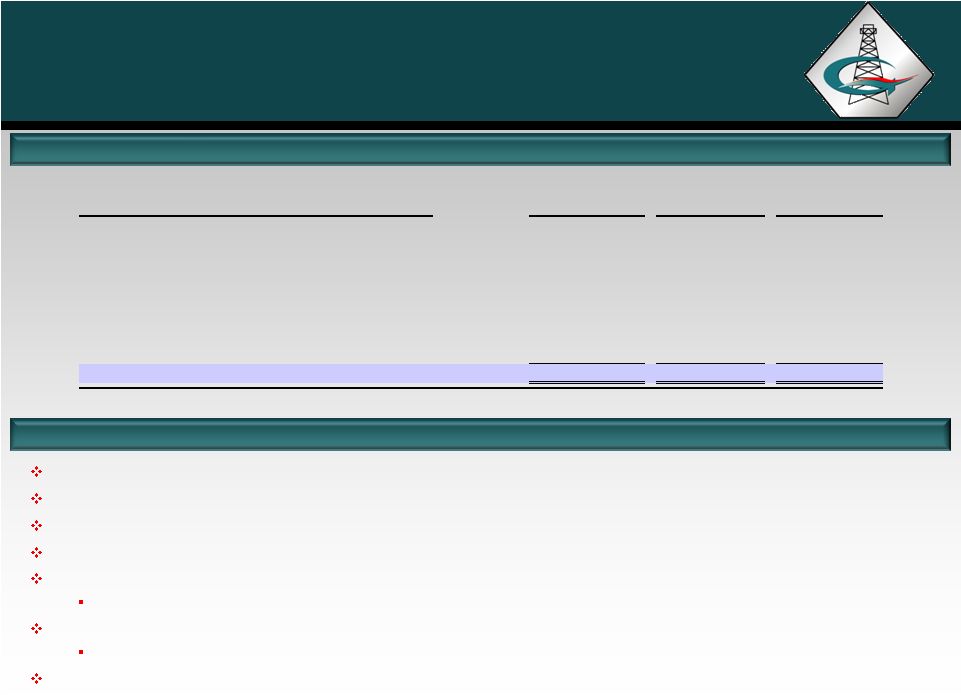
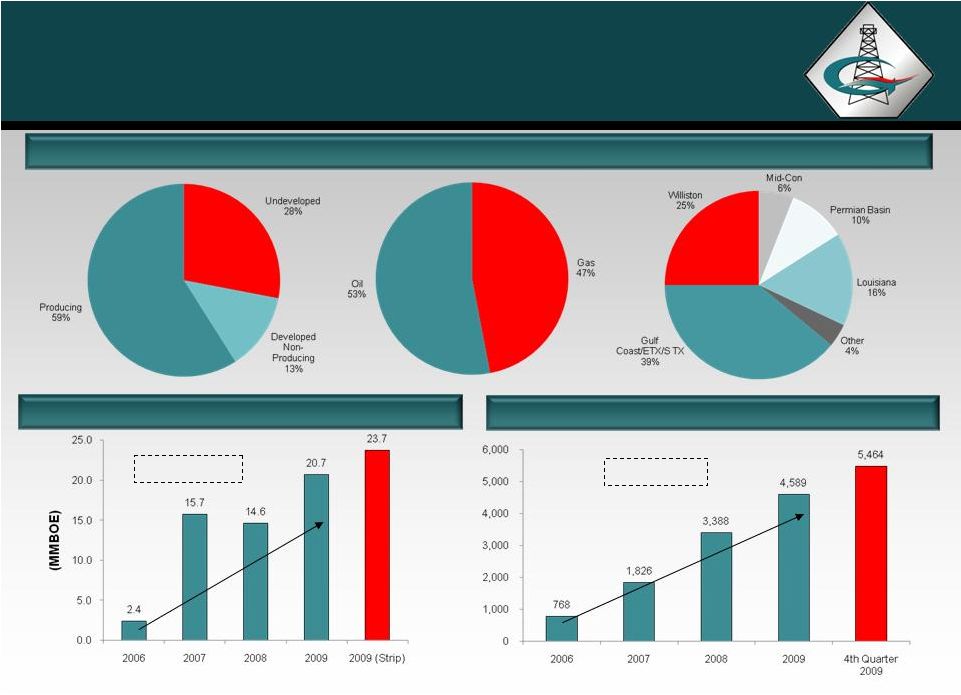 14 Proved Reserves (MMBOE) (2) Average Daily Production (BOEpd) Reserves and Production – Direct Interests (1) Current Proved Reserves – 23.7 MMBOE (2) CAGR: 81% CAGR: 105% (4) (3) (1) Excludes partnership interests. (2) 2006 – 2009 proved reserves based on SEC
guidelines. (3) 2009 strip reserves based on 12/31/09 NYMEX strip
prices. (4) 2008 Reserves reflect divestitures. |
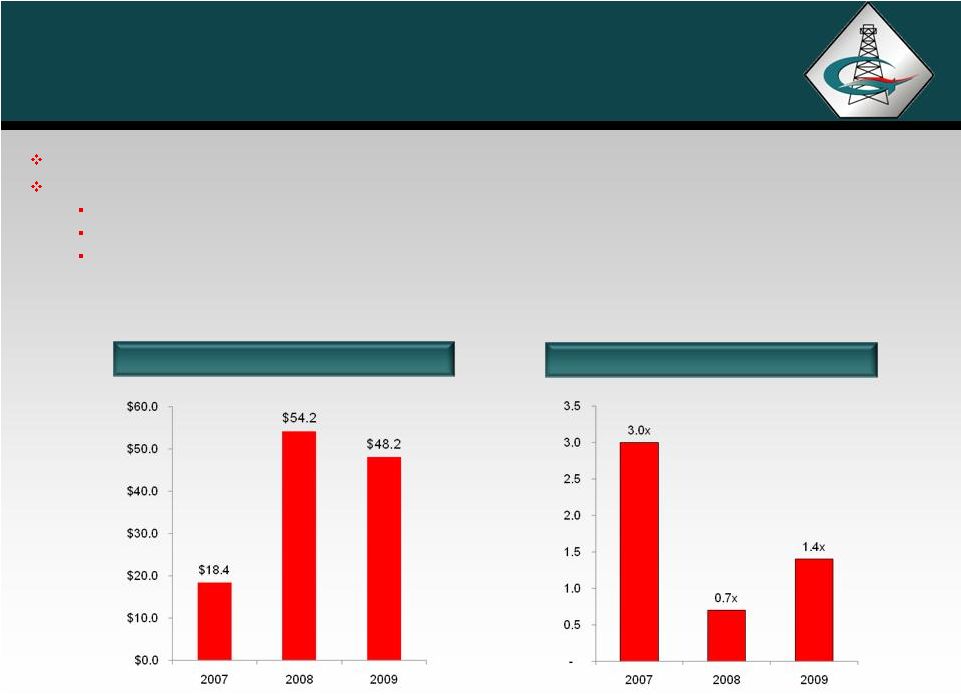 15 Adjusted EBITDAX Total Leverage Ability to control destiny without reliance on capital markets Conservative use of leverage to maintain strong balance sheet $ 145 Million borrowing base Total debt of $69.0 million at December 31, 2009 to Adjusted EBITDAX is 1.4x Credit facility led by Wells Fargo and is priced at LIBOR plus 2.25 – 3.00% Strong Financial Position ($ in millions) |
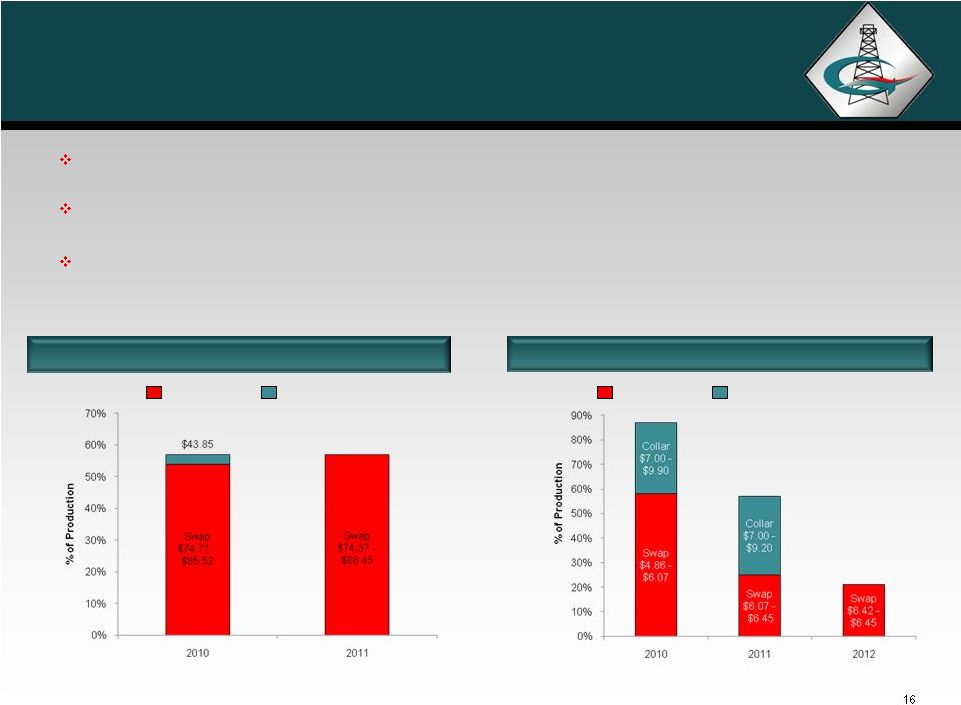 16 Hedging Strategy Oil Hedges GEOI uses commodity price risk management in order to execute its business plan throughout commodity price cycles 2010 – 2012 natural gas hedges include hedge volumes intended to cover GEOI’s share of partnership production Hedged volumes shown below are about 50% of combined production volumes Swaps Fixed Contract Swaps Collar Natural Gas Hedges |
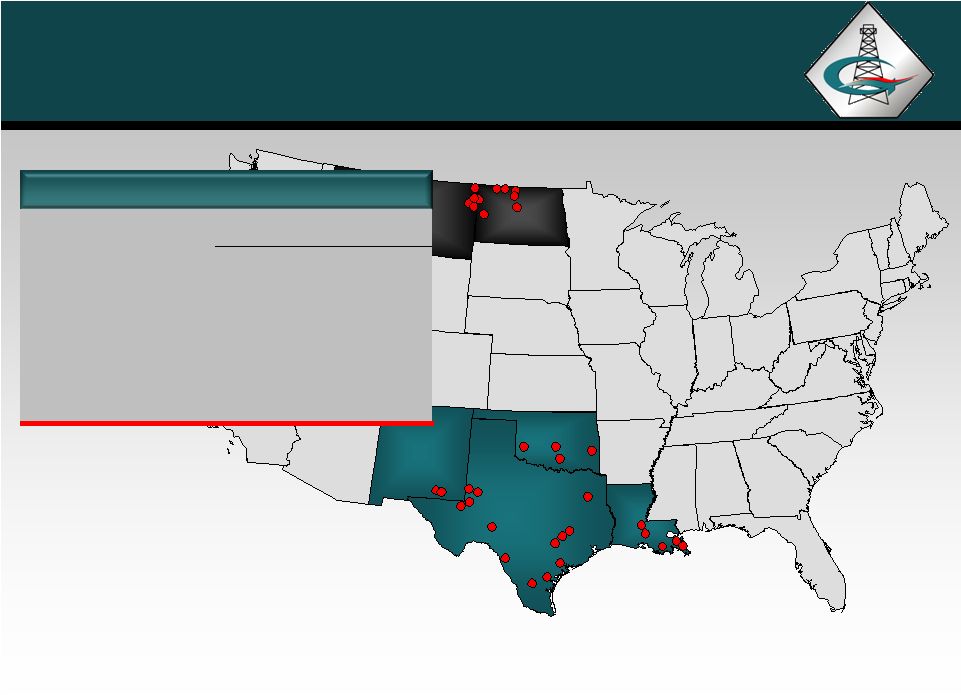
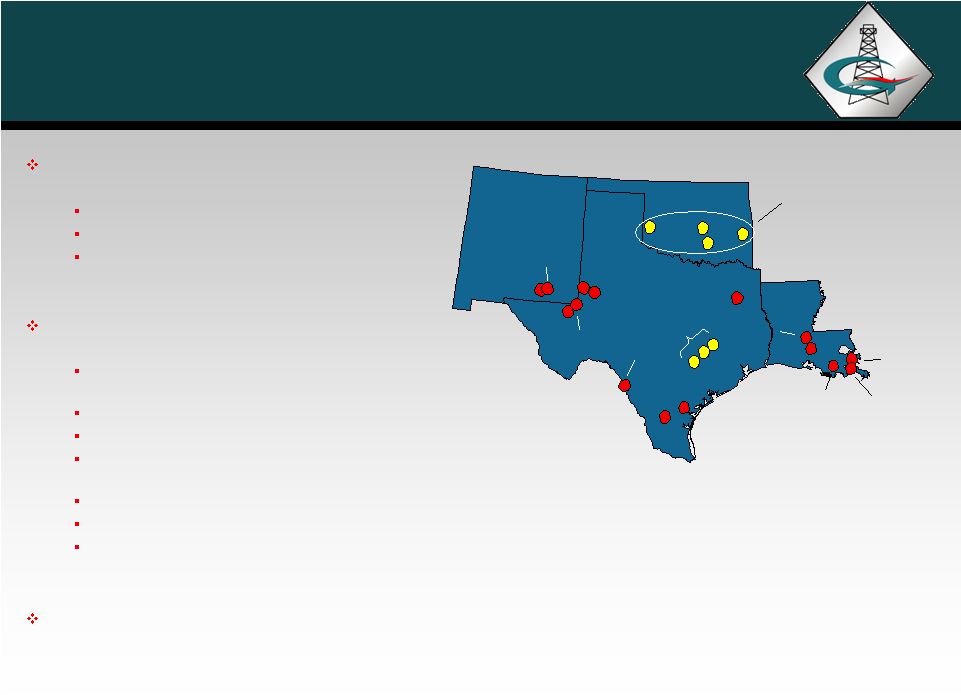 17 Southern Region TX NM LA Loco Hills Maljamar Harris M.A.K. Warwink Wheeler Chittim Ranch Giddings* *SBE
Partners LP properties Odem Driscoll Oak Hill Golden Meadow Quarantine Bay Eloi Bay St. Martinville Frisco OK OKLA Energy Partners LP properties Accounts for approximately 73% of reserves and 78% of total production High-impact exploration potential Development and recompletion potential Approximately 38% of the region’s proved reserves are oil Continuous successful Austin Chalk drilling program Significant working interests plus partnership interests Fourteen wells drilled with 100% success rate 66 producing wells 6-8 wells per year expected to be drilled in 2010 and in 2011 Recent additional acreage acquisitions May deploy additional rig Yegua, Eagle Ford Shale and Georgetown potential Two 3D seismic projects in South Louisiana |
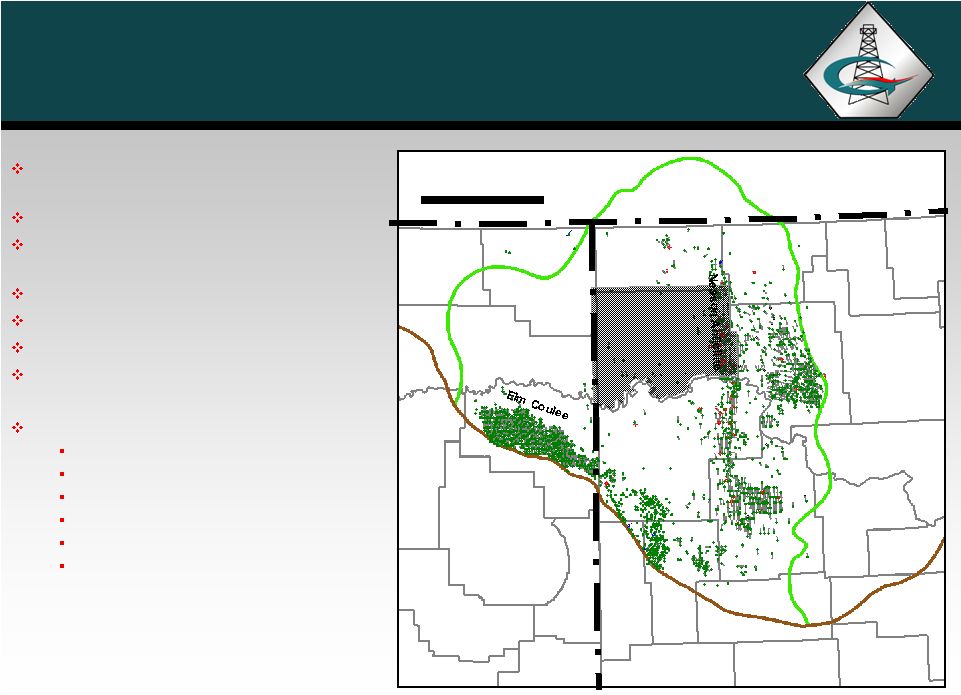
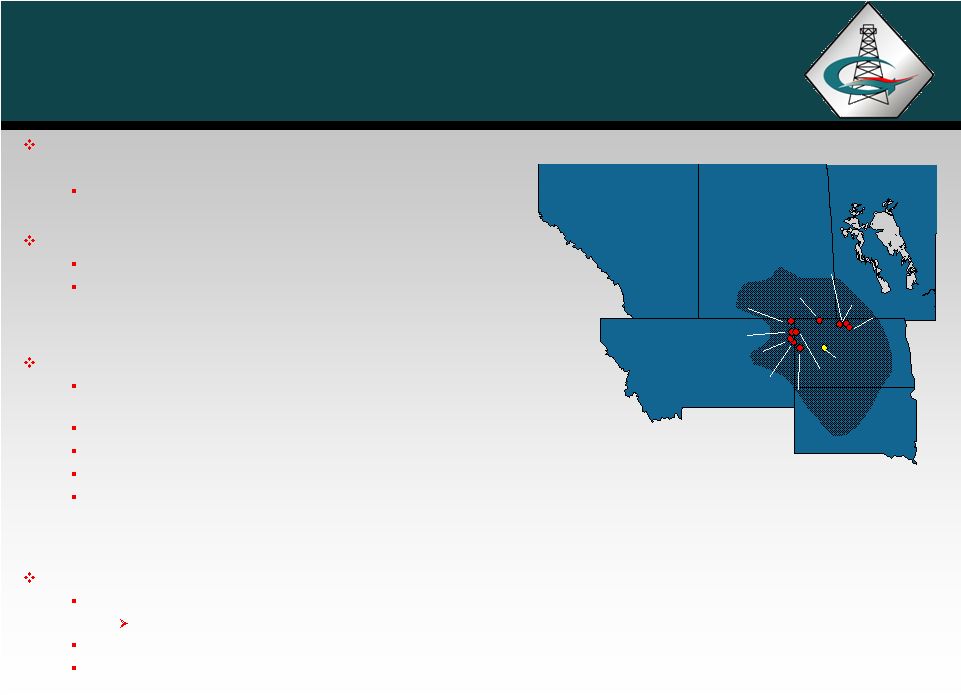   18 Northern Region ALBERTA MANITOBA SASKATCHEWAN MT SD ND Newporte Sherman/Wayne Landa Starbuck Comertown Fairview/Mondak Sioux Pass Four Mile Creek Patent Gate Flat Top Note: Highlighted area represents the Williston Basin Bakken JV Accounts for approximately 27% of reserves and 22% of total production Approximately 93% of the region’s proved reserves are oil Bakken Operated Joint Venture: Acquired 61,000 gross (42,000 net) acres in Williams Co., ND Retains 45% working interest in Area of Mutual Interest and brought in 2 industry partners Bakken Non-Operated Joint Venture: 10-18% working interest in approximately 106,000 gross acres (approximately 13,900 net acres) Current five rig program, with plan to maintain four rigs in 2010 42 joint venture operated gross wells drilled Acquired and/or participated in over 140 non-operated wells Joint venture expects to drill approximately 90 wells in the next 24 months Williston Basin Other: Starbuck & SW Starbuck waterflood installation completed in early 2008 &
in early 2009 Initial response realized Additional upside in horizontal and vertical infill locations within the unit
boundaries Horizontal proved undeveloped and non-proved drilling
opportunities within producing fields |
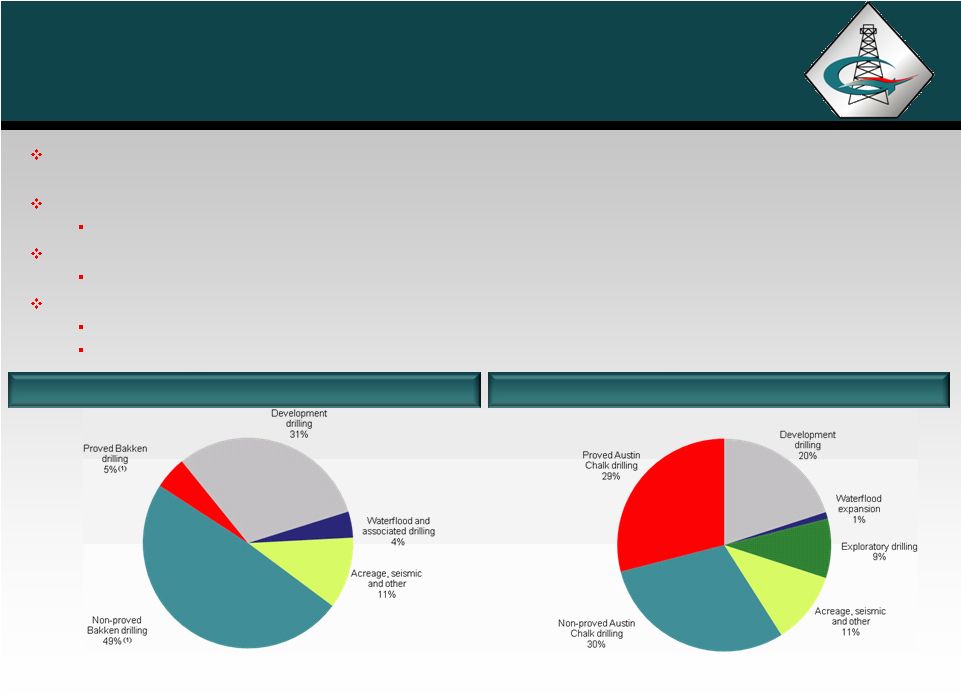 19 Current project inventory totals $160 million and is diversified across GeoResources’ core areas with exposure to 15.3 MMBOE Estimated 24 month capital budget of ~$90 to 100 million This budget can be accelerated and expanded as deemed appropriate by management Current budget allocation favors lower-risk, high cash flow projects Exploratory success could expand drilling inventory Actual expenditures will reflect recent acquisitions, commodity prices, and risk Flexibility between gas and oil projects Flexibility between development and exploration Southern Region Capital Expenditures Northern Region Capital Expenditures $73 million total $87 million total Near-Term Exploration & Development Projects (1) Excludes potential in-fill drilling. |
 20 24 Month Budget – Project Reserve Potential $90 to 100 million of identified capital projects budgeted over next 24 months: 10.3 MMBOE reserve addition $9.19/boe estimated F&D cost Consistent with management prior track record Acreage and seismic expenditures will likely result in additional projects and drilling
inventory Re-engineering should result in lower per-unit lifting
costs and may result in incremental reserves by extending field lives and lowering economic limits Current Budget (1) Capital assumes 1,280 acre units at $6 million per well with added technical data (cores, logs, pilot holes). Reserves estimated at 500 MBOE per well. All non-proved. (2) Initial exploration well below field pay to 16,350+/-. Represents base exploratory reserve case to test six objectives. Investment represents drilling costs only; a discovery well will result in completion costs estimated at $1.0 million. Reserve potential for GEOI is 3.0 MMBOE and would set up additional drilling. . Net Reserve Gross Net Potential Net Investment F&D Cost per Field Wells Wells MBOE (in $ millions) BOE Austin Chalk Proved 6 2.7 1,236 $14.5 $11.70 Non-Proved 4 1.5 1,701 12.5 7.38 Bakken Proved 22 1.8 263 $3.4 $13.03 Non-Proved 100 8.0 2,560 28.0 10.94 St. Martinville Non-Proved 6 5.8 1,365 $5.5 $4.05 Starbuck and SW Starbuck Waterflood Proved 215 $2.4 $11.24 Non-Proved 996 0.8 0.79 Total Proved/Non-Proved Projects in Budget 8,336 $67.2 $8.06 Bakken Operated Non-proved (1) 3 1.4 553 $8.1 $14.65 Quarantine Bay North Exploration (2) 1 0.3 1,443 $2.1 $1.46 Reengineering and Other $3.5 Acreage and Seismic $14.0 Total 24 Month Budget 10,332 $94.9 $9.19 |
 21 Additional Development Potential Budget Acceleration The capital budget can be accelerated to take advantage of additional development
drilling opportunities within our current project portfolio Development Potential: 5.0 MMBOE reserve potential ~$65 million capital cost $13.00/boe estimated F&D cost Several PUD locations have exploratory objectives Field Gross Wells Net Wells Net Reserve Potential MBOE Net Investment (in $ millions) F&D Cost per BOE Other Southern Development Proved 2,079 $17.6 $8.46 Other Northern Development Proved 1,265 $22.5 $17.75 Austin Chalk Proved 5 2.3 889 $11.3 $12.71 Non-proved 7 2.7 773 12.5 16.23 Waterflood Expansion $1.2 Total Budget Acceleration 5,005 $65.1 $13.00 Total 24 Month Budget (previous slide) 10,332 $94.9 $9.19 Total 15,337 $160.0 $10.43 |
 22 Additional Upside Shallow Yegua potential in Giddings Field (above the Austin Chalk) Eagle Ford and Georgetown potential in Giddings Field (below the Austin Chalk) Eagle Ford and Pearsall shale potential in Maverick County, TX Three Forks/Sanish potential in the Williston basin Additional Starbuck upside 0.8 MMBOE from increased waterflood recovery and federal acreage development Quarantine Bay upside Seismic-based regional analogies below 18,000’ Other projects, consistent with management track record of expanding inventory with growth Work in Progress Additional Reserve Potential on Current Projects (1) Additional reserve exposure on the prospects noted above and prior slides of 7.1
MMBOE. Net Reserve F&D Potential Investment Cost per Field MBOE (in $ millions) BOE Bakken Infill Non-proved 1,440 $21.0 $14.58 St. Martinville Shallow 910 $3.8 $4.18 Discorbis (10,000') 1,517 7.0 4.60 Quarantine Bay (1) SW - Exploratory 186 $3.1 $16.70 SE - Exploratory 743 3.1 4.18 Total 4,795 $38.0 $7.93 |
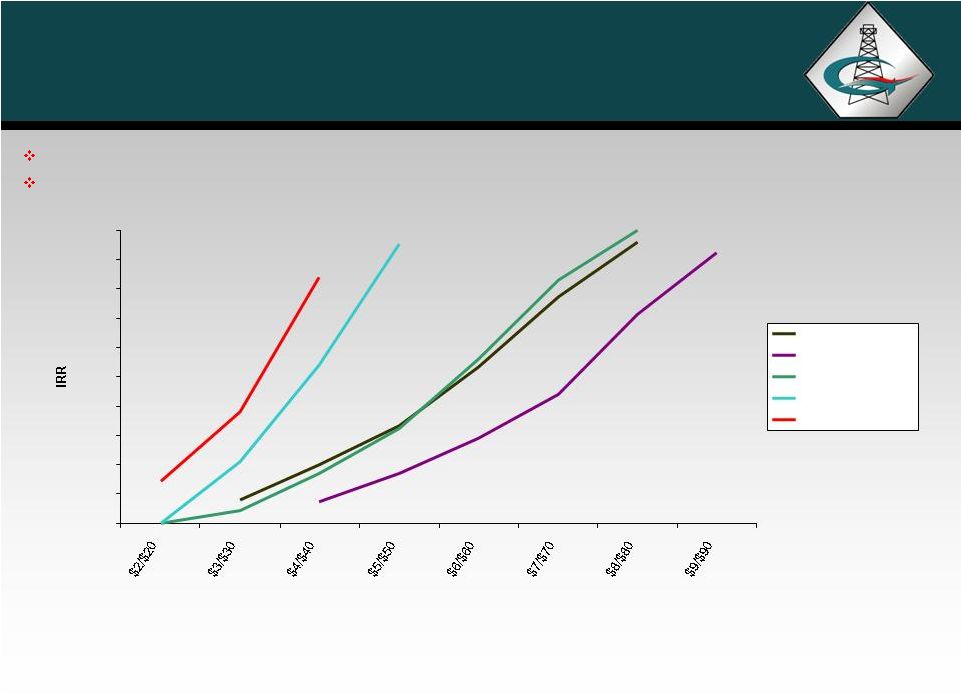 23 Type Well Economics Diverse set of drilling opportunities provides for growth and flexibility in changing
commodity price cycles Most drilling opportunities remain highly economic in
the current price environment (1) Well cost of $6.8 million and reserves of 6.5 BCF. (2) Well cost of $4.4 million and reserves of 1.15 BCF and 150 MBO. (3) Well cost of $3.5 million and reserves of 400 MBO. (4) Well cost of $3.5 million and reserves of 600 MBO. (5) Well cost of $1.3 million and reserves of 250 MBO. 0% 20% 40% 60% 80% 100% 120% 140% 160% 180% 200% Assumed Gas/Oil Price Chalk Gas(1) Chalk O&G(2) Bakken 400(3) Bakken 600(4) St Martinville Oil(5) |
 24 Key Investment Highlights Value Creation Experienced Management and Technical Staff with Large Ownership Stake Board and management own or control approximately 43% of the Company Successful track record of creating value and liquidity for shareholders Attractive Value Proposition Trading at a significant discount to NAV Strong Asset Base Strategically located and geographically diverse Balanced oil vs. gas High level of operating control Significant Identified Growth Opportunities on Existing Properties Low risk development drilling Higher impact exploration upside Strong Financial Position Moderate leverage with significant cash flow |
 APPENDICES |
 26 Demonstrated History of Successful A&D 2007/2008: High-graded portfolio and expanded drilling inventory April 2007: Reverse merger and Chandler acquisition October 2007: $104.0 million acquisition – primarily in Louisiana and Texas January 2008: $6.6 million sale – Michigan February 2008: $7.9 million acquisition – Williston Basin February 2008: $1.8 million sale – Louisiana May 2008: $11.8 million sale – seven fields, Louisiana and Texas May 2008: Participation in the $61.7 million formation of OKLA Energy Partners LP September 2008: $3.6 million acquisition – Oklahoma 2009: Expanded in core areas, high-graded portfolio and increased drilling inventory January 2009: $1.6 million sale – Louisiana May 2009: $10.4 million acquisition – Williston Basin May 2009: $48.4 million acquisition – Giddings Field, Texas August 2009:
$1.6 million acquisition – Giddings Field, Texas Summary of Acquisitions/Divestitures |
   27 Bakken Shale Operated Williams County, ND Joint Venture Acreage Joint Venture controls 61,000 Gross (42,000 net ) Acres GEOI operated Partner with Resolute Energy and Private Independent GEOI retains 45% Working Interest 18,900 net acres Continued leasing Plan to drill at least 3 wells in 2010 Operator Activity Increasing in the County American Brigham Exploration Continental Resources EOG Whiting XTO CANADA ND MT 50 miles Williams County Parshall Sanish 27 |
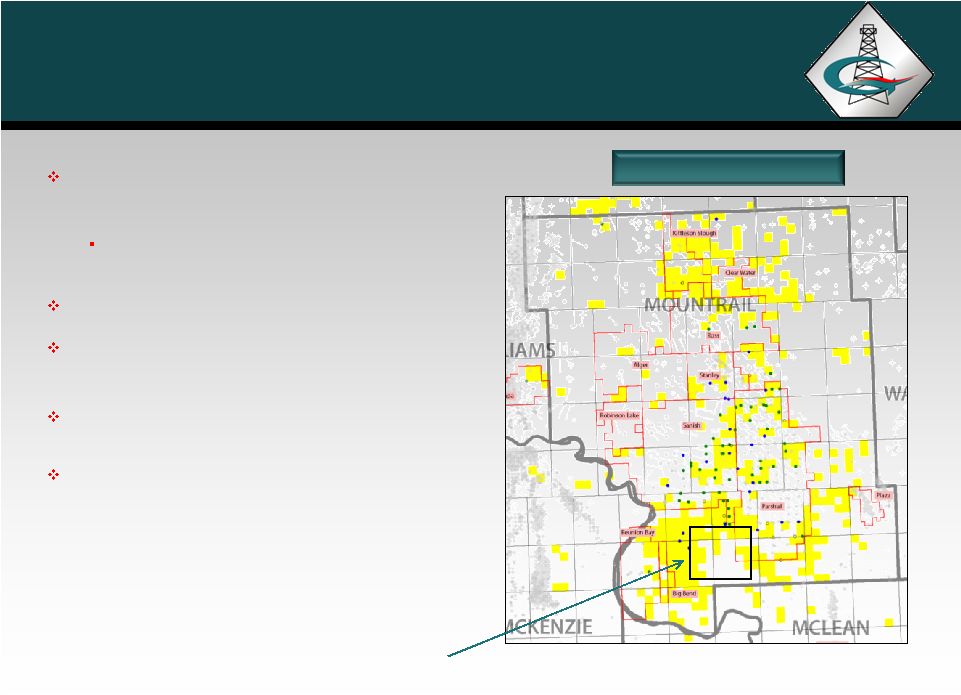 28 Bakken Shale Non-operated Bakken Shale Note: Yellow-highlighted areas represent the Company’s acreage
position. Working interests ranging from 10% to 18% in 106,000 gross acres (approximately 13,900 net acres) 69,000 gross acres in Mountrail County , ND (approximately 8,000 net acres) Five rigs running Joint Venture has drilled 42 wells to date and plans to drill 90 wells in the next 24 months Developing on 640 acre units as well as 1,280 acre and larger units Additional upside in Three Forks and Bakken increased density wells Detailed map on next slide |
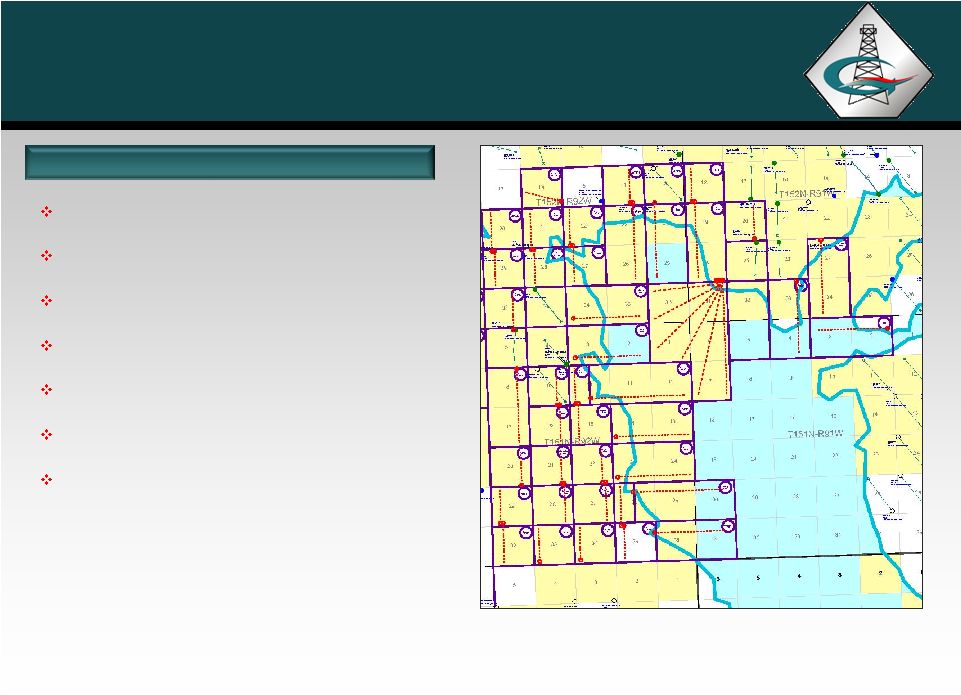 29 Bakken Shale Non-operated Note: Yellow-highlighted areas represent the Company’s acreage position.
640 and 1,280 acre units being drilled Some larger units under the lake Multiple wells from single drilling pad Minimize facilities and roads Maximize infrastructure Developing reserves with difficult access Minimize disturbance and the number of locations Van Hook Area |
 30 Giddings Field Austin Chalk Play, Texas Working interests range from 37% - 53% in 68,000 gross acres (approximately 29,000 net acres) 22 additional gross drilling locations (9.2 net wells) 14 wells drilled – 100% success Additional upside includes: Yegua, Eagle Ford shale and Georgetown potential Multiple wells with rate increase potential from slick water fracture stimulations |
 31 Giddings Field Acreage Position Giddings Field GEOI produces oil & gas from Austin Chalk Horizontal wells Other Potential Reservoirs Yegua Wilcox Eagle Ford Shale Buda Georgetown Edwards |
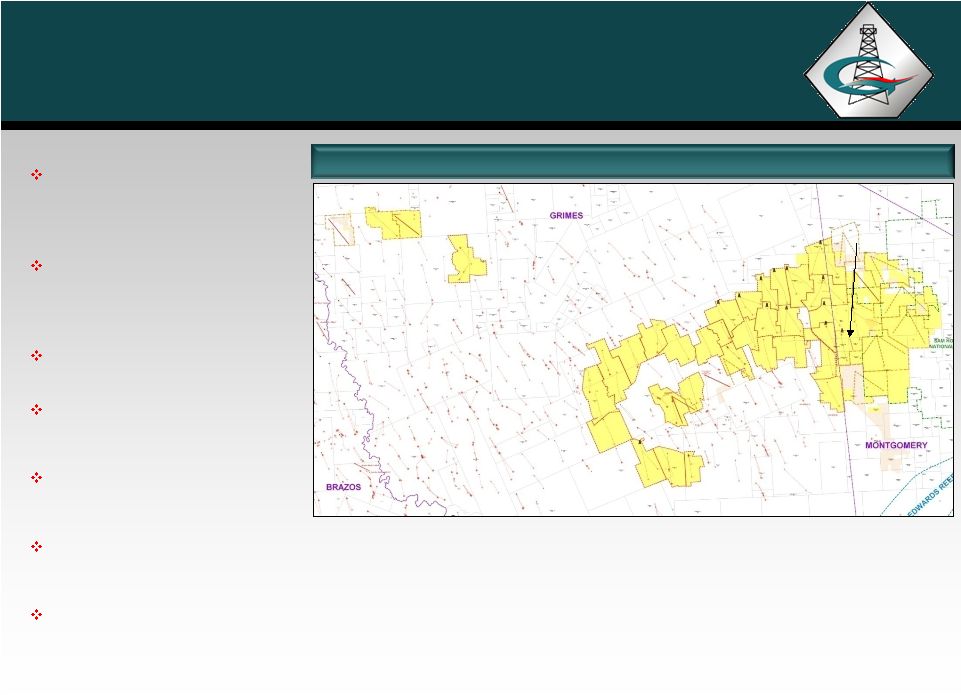 32 Grimes and Montgomery Counties, TX Austin Chalk Development Proved Undeveloped and Probable Horizontal Locations Last well: Longstreet 1H produced 1.0 BCFG in 67 days Single and multiple laterals Eastern Grimes / Western Montgomery dry gas Western Grimes gas with large volume of liquids Single rig continuous program Tight gas – severance tax exemption Longstreet 1H |
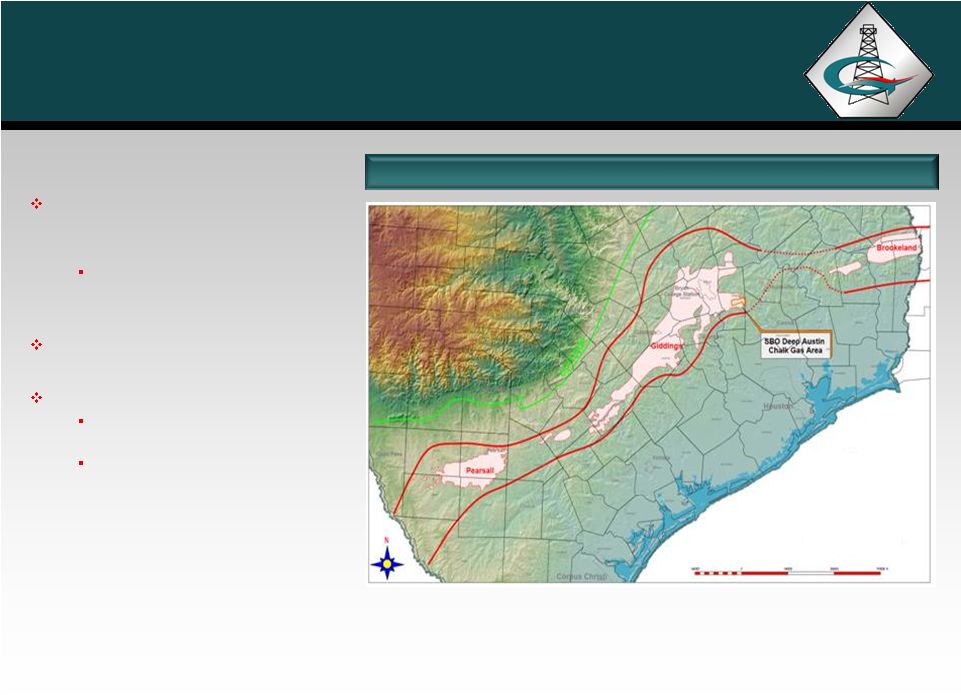
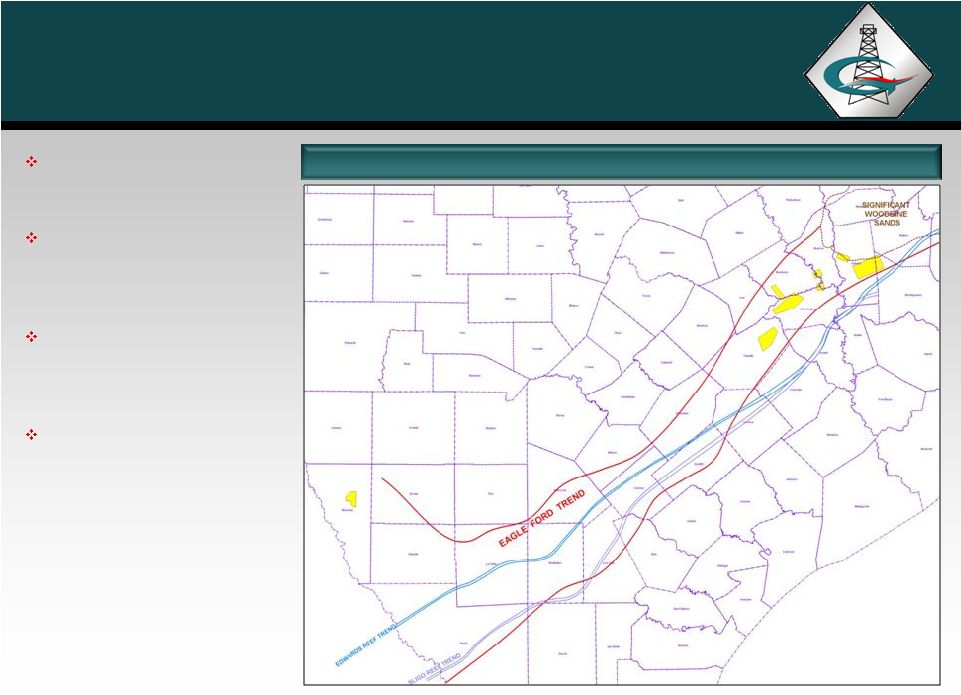 33 Eagle Ford Trend South & Central Gulf Coast Texas Significant acreage position in trend Eagle Ford shale present over much larger area than apparent trend Trend depicted where Eagle Ford is +-7,000’ to +-14,000’ Early in development |
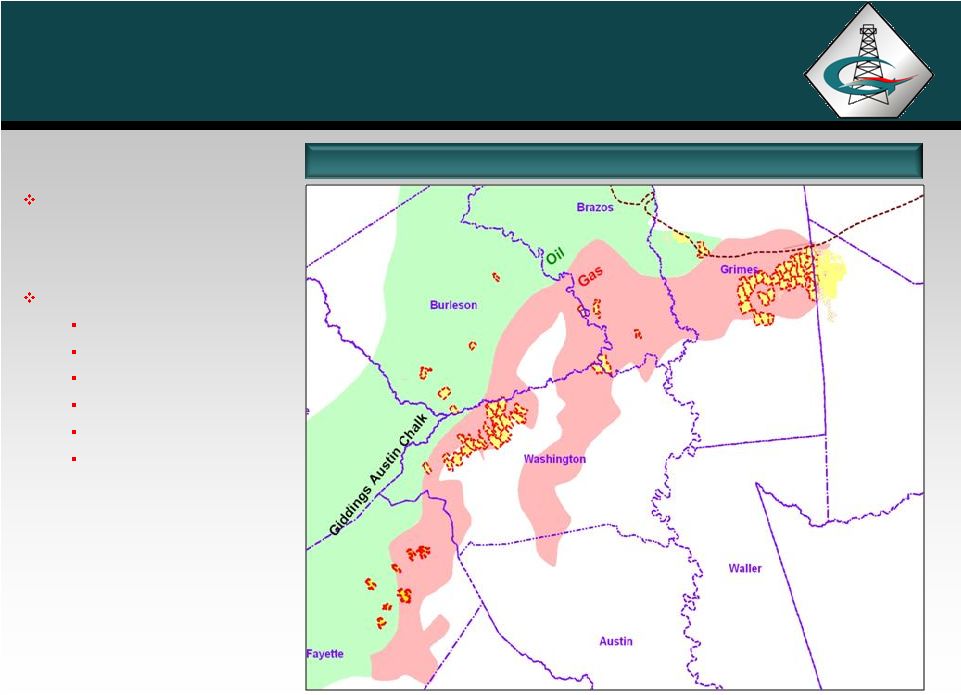
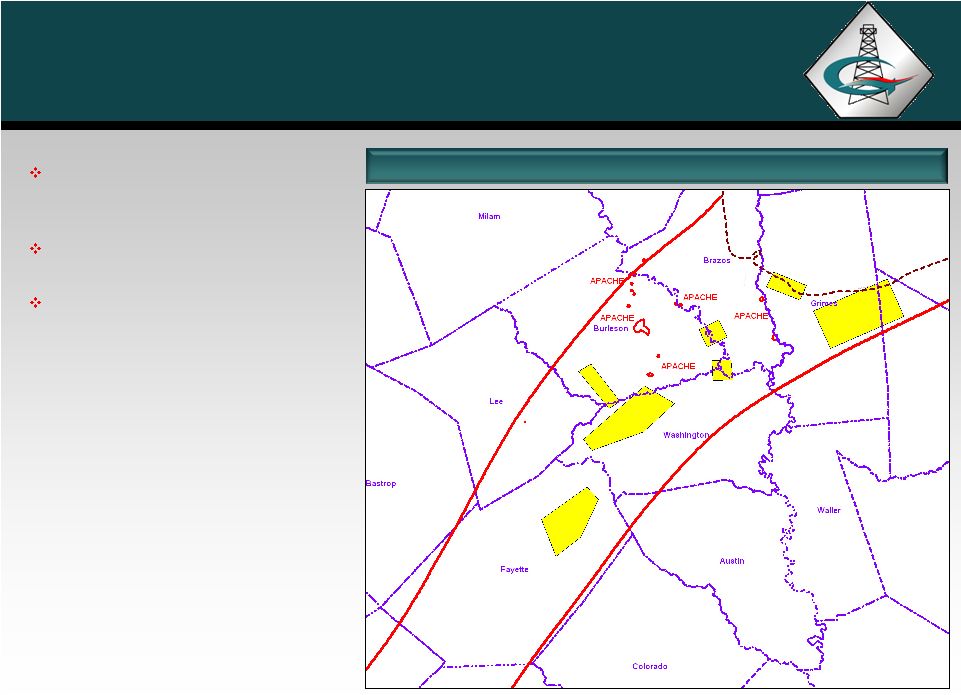 34 Recent Activity Map Apache & Clayton Williams active in our area Majority of Apache wells vertical Our Brazos, Burleson, Fayette and Washington County holdings currently appear most prospective for Eagle Ford Central Texas Eagle Ford |
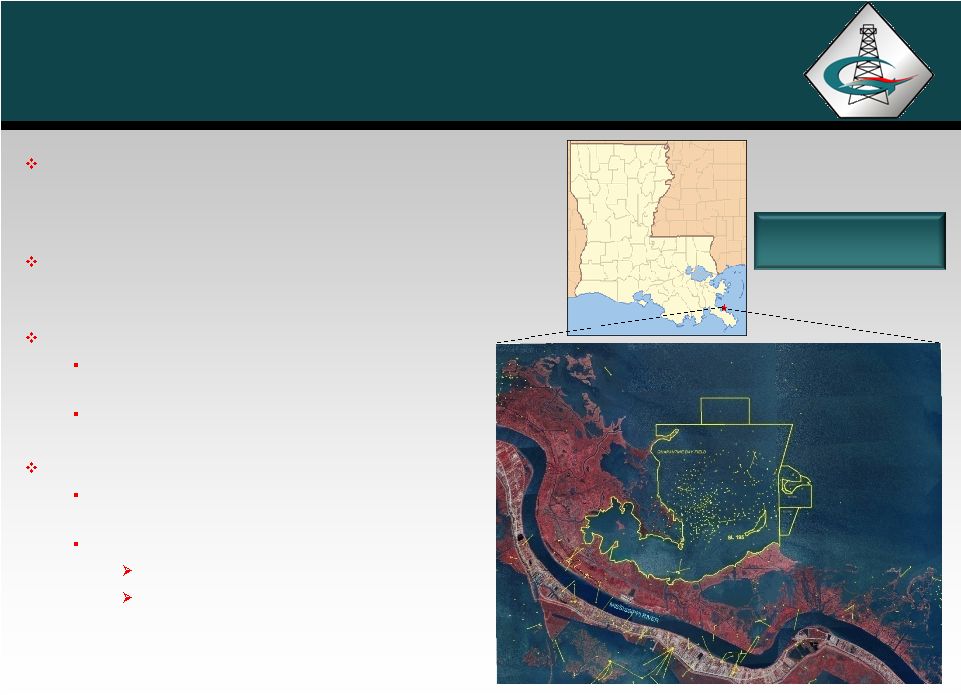 Quarantine Bay GeoResources has a 7% working interest above 10,500 feet and a 33% working interest below 10,500 feet, in approximately 14,000 acres Cumulative production = 180 MMBO and 285 BCF Shallow zone potential (<10,500 ft): Numerous behind pipe opportunities due to multiple stacked sand reservoirs Rate acceleration wells Significant hi-potential exploration deep potential: Schlumberger reprocessed and interpreted the 3-D seismic data Initial prospect Multiple objectives to 16,000 ft Deeper objectives 35 LOUISIANA Quarantine Bay Field |
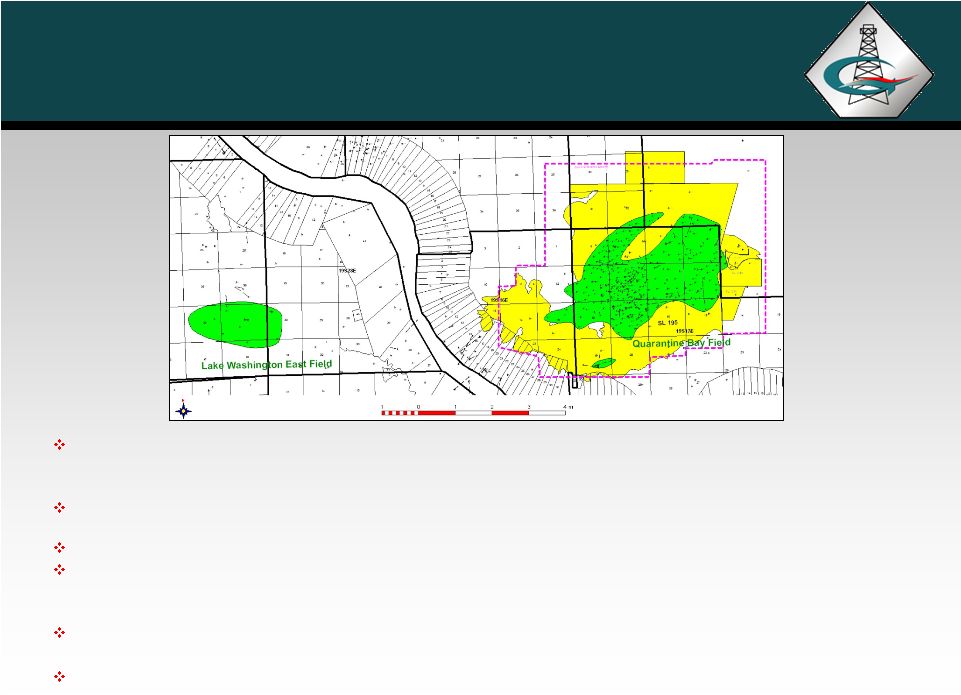 36 Quarantine Bay Nearby Lake Washington East which is an analogy for deep production has produced 9 MMBO & 14 BCF from the Big Hum +-15,000’ Significant Big Hum sand encountered at Quarantine Bay and is productive in one well on the southeast flank New “state of the art” pre-stack depth and simultaneous inversion 3-D processing to evaluate the pressured deep strata (14,000’-18,000’) and ultra-deep strata (>18,000’) Multiple prospective areas have been identified on our leases Current focus is on a opportunities identified above 16,000’ with a estimated cost of $6.5MM to test |
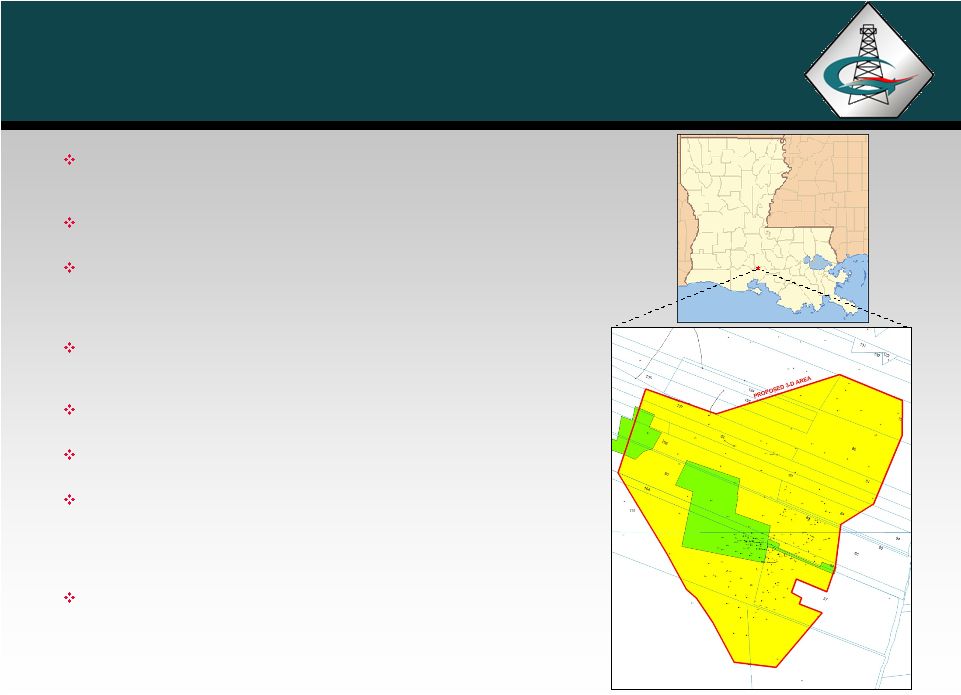 37 St. Martinville St. Martinville 5.3 square mile “high resolution” 3-D survey to be completed in Q4; processed and interpreted in Q1 2010 Intermediate depth salt dome Average working interest 97% and average NRI 91%. Royalty burden ranges from Zero on owned minerals to 22% on lease acreage Complex faulted structural closures provide hydrocarbon traps 534 net acres of owned minerals (green) 2,585 net acres of HBP or leased (yellow) Main objectives Miocene age, low risk, shallow, highly productive multi-sand, oil, from 3,000’ – 5,000’. Over 50 individual sands productive in field with cumulative shallow production est. 15.2 MMBO and 16.6 BCFG Exploratory objectives in Discorbis and Bol perca (gas and condensate) LOUISIANA |
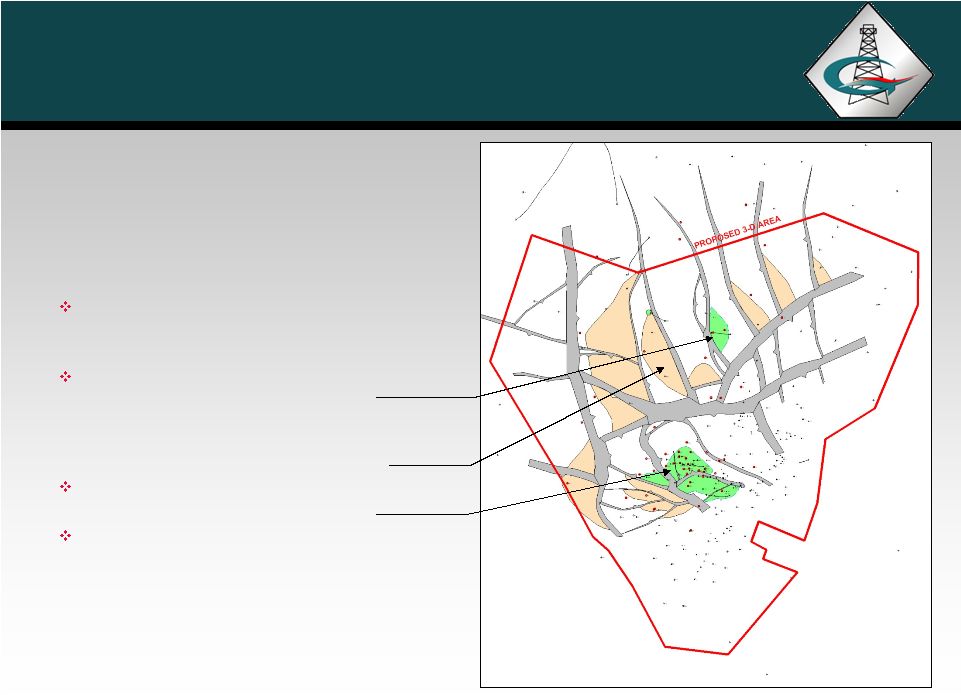 38 St. Martinville Shallow Leads Example St. Martinville Shallow Leads Example Miocene 11D sand lead map (+/-4,000’) Most recent well Std. Kansas 7. Current cumulative 58 MBO (one sand), all sands have reserves of approximately 250 MBO Subsurface leads at this sand level Main field production at this sand |
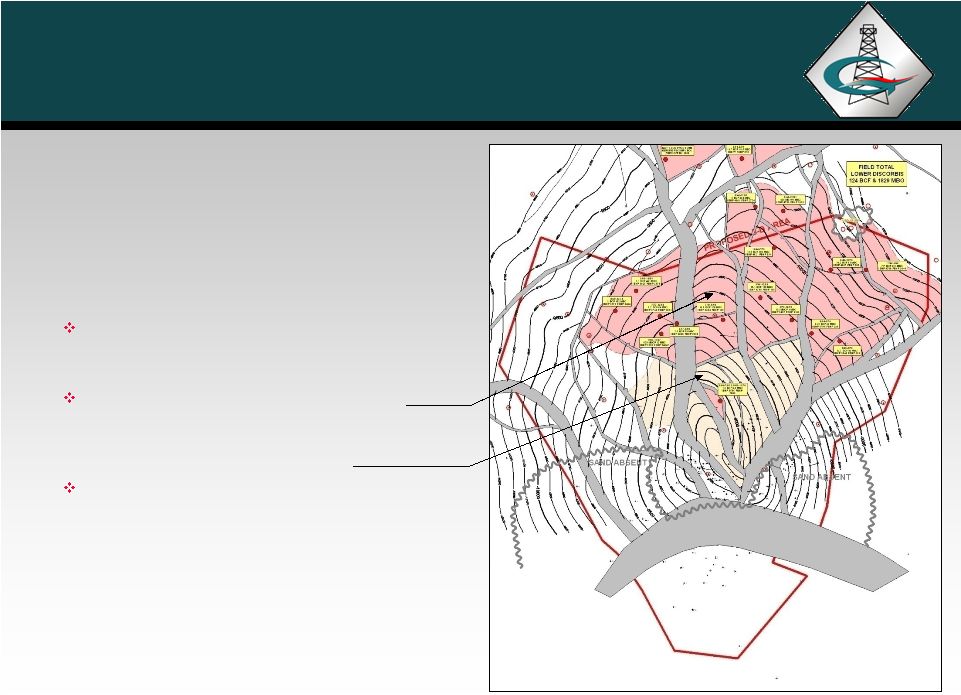 39 St. Martinville Discorbis Miocene lower Discorbis sand lead map Previously productive areas Cumulative 124 BCF and 1.8 MMBO Subsurface leads at this level |
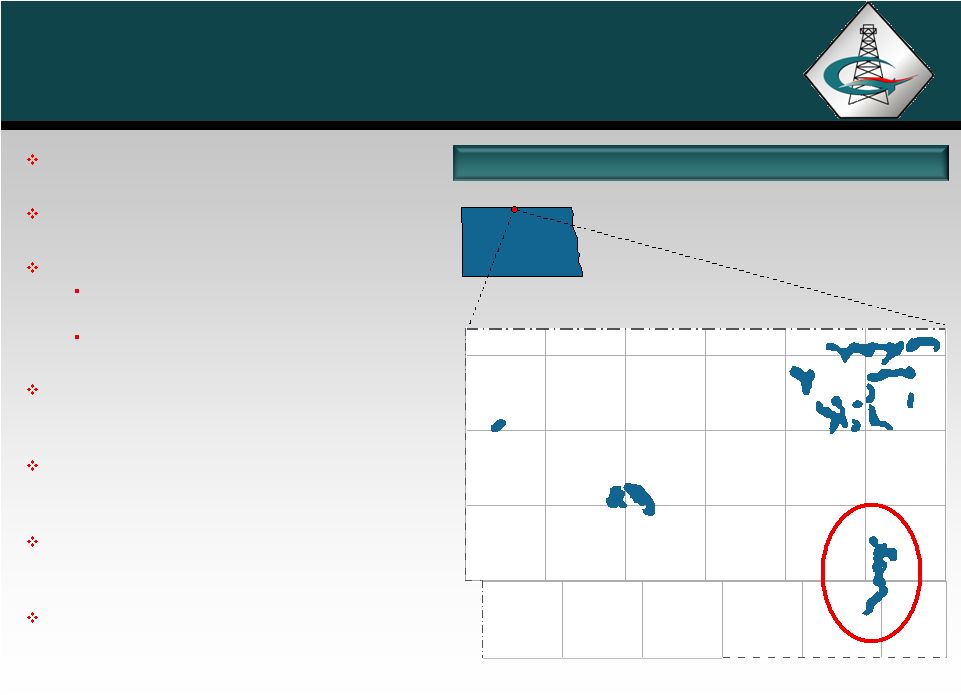 40 Starbuck and SW Starbuck Waterflood Units ND HAAS North Dakota LANDA NE LEONARD ZION LANDA ROTH N ROTH SHERMAN WAYNE STARBUCK CANADA Bottineau County T163N T162N T161N R79W R81W R80W R82W R83W HAAS North Dakota LANDA NE LEONARD ZION LANDA ROTH N ROTH SHERMAN WAYNE STARBUCK CANADA Bottineau County T163N T162N T161N R79W R81W R80W R82W R83W Starbuck 6,618 acres, 96% WI SW Starbuck 560 acres, 98% WI Starbuck phase one completed 2008 Phase two and SW Starbuck expansion completed 2009 Recent initial response Primary production totals 1.4 MMBO for the Starbuck Midale and Berentson Zones Primary production for SW Starbuck totals 162 MBO Approximately $6.0 million on waterflood implementation The Company estimates additional reserves of 1.6 – 2.5 MMBO for both projects Starbuck Unit |
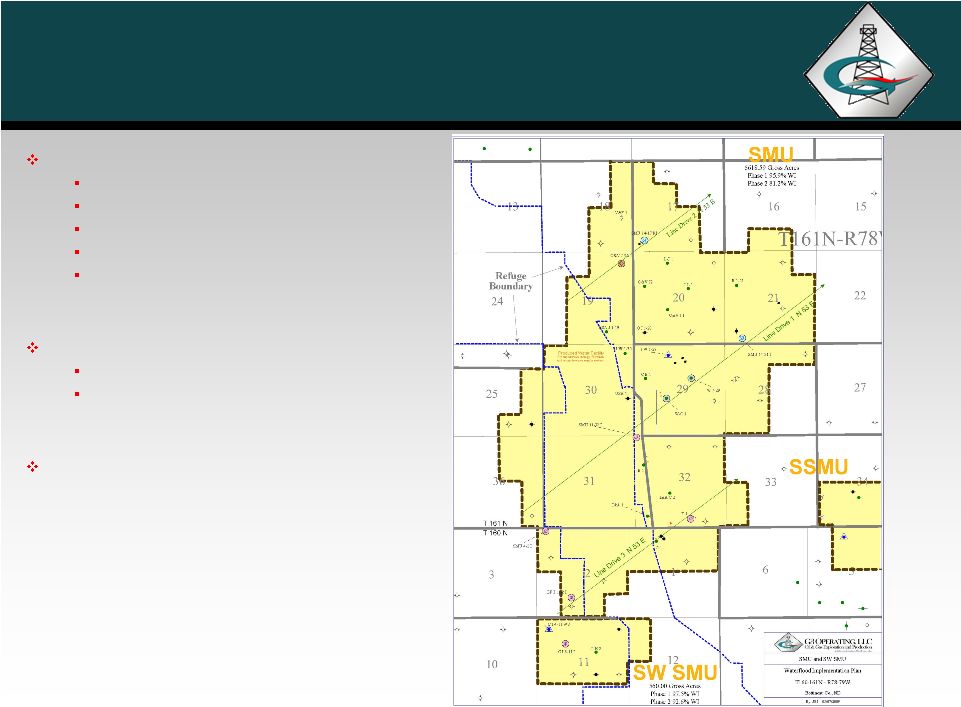 41 Starbuck and SW Starbuck Waterflood Units Starbuck Unit Designed as line-drive waterflood 14 producers 6 injectors One dedicated water supply well One dedicated injection facility and one shared facility with SSMU SW Starbuck Unit Single producer/injector pair Shared water supply well and injection facility with larger Starbuck Unit Additional vertical and horizontal wells planned for both units as pressure response and increased oil rate is achieved |