Attached files
| file | filename |
|---|---|
| 8-K - FORM 8-K - BRIGHTPOINT INC | c57086e8vk.htm |
| EX-99.2 - EX-99.2 - BRIGHTPOINT INC | c57086exv99w2.htm |
Exhibit
99.1

| Brightpoint The Global Leader Providing Unique Supply Chain Solutions to the Wireless Industry NASDAQ-GS Ticker: CELL |

| 1 Forward-Looking Statements This presentation may contain information that includes or is based upon "forward- looking statements" as that term is defined in the Private Securities Litigation Reform Act of 1995. These statements are based on our management's current expectations and involve risks and uncertainties, which may cause results to differ materially from those set forth in the statements. The forward-looking statements may include statements regarding the demand for wireless handsets, our ability to grow faster than the market, our ability to achieve efficiencies and our financial performance. No forward-looking statement can be guaranteed and actual results may differ materially from those projected. Brightpoint, Inc. ("Brightpoint") undertakes no obligation to publicly update any forward-looking statement, whether as a result of new information, future events, or otherwise. Forward- looking statements in this presentation should be evaluated together with the many uncertainties that affect Brightpoint's business, including those mentioned in the Risk Factors in Item 1A of Brightpoint's Form 10-K for the year ended December 31, 2009, and in any Risk Factors or cautionary statements contained in our periodic reports on Form 10-Q or current reports on Form 8-K, which we hereby incorporate by reference. |
| 2 Brightpoint, Inc. Founded in 1989 and initial public offering in 1994 In 2009, Brightpoint handled 84 million devices (actual product value over $10 billion) World's #1 provider of unique and innovative supply chain solutions to the wireless industry Global platform - operations in 26 countries serving the Americas, EMEA, and APAC Customer base exceeds 100,000 points of sale Financially sound - strong balance sheet - ample liquidity |
| 3 Investment Considerations Leading provider of unique and innovative supply chain solutions to the wireless technology industry 80% of the wireless devices handled - non-Brightpoint owned Wireless industry provides significant growth opportunities fueled by replacement cycle Long-term growth prospects and track record of outpacing the industry Positioned to benefit from smartphone adoption Global scale drives operating leverage Breadth and value of services expanding through continued focus on innovation Strong balance sheet enables growth and expansion |
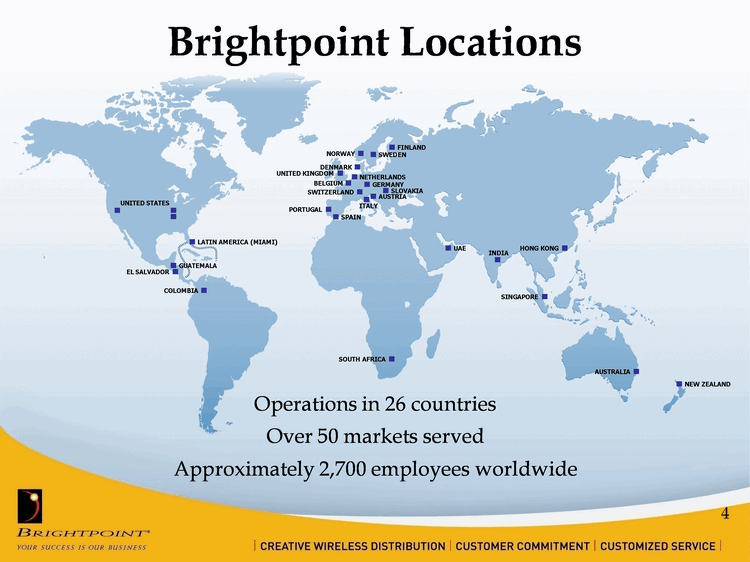
| 4 |
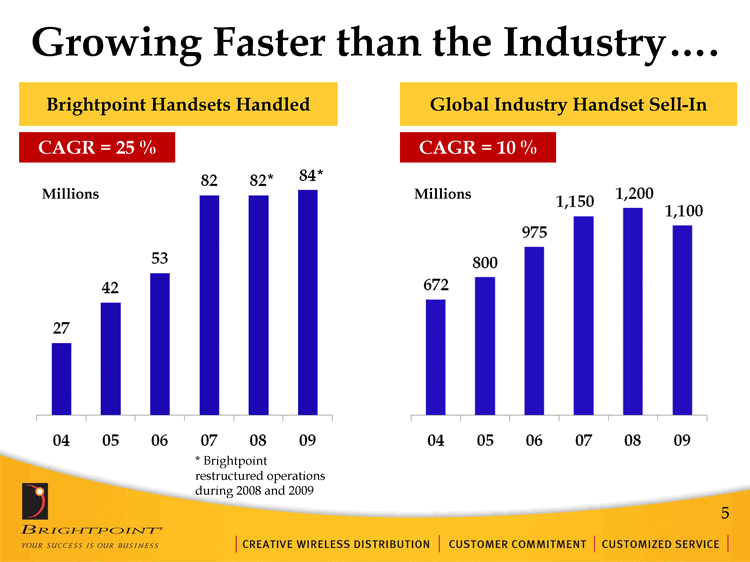
| 5 Growing Faster than the Industry.... Millions CAGR = 25 % Brightpoint Handsets Handled Global Industry Handset Sell-In CAGR = 10 % Millions * Brightpoint restructured operations during 2008 and 2009 * * |
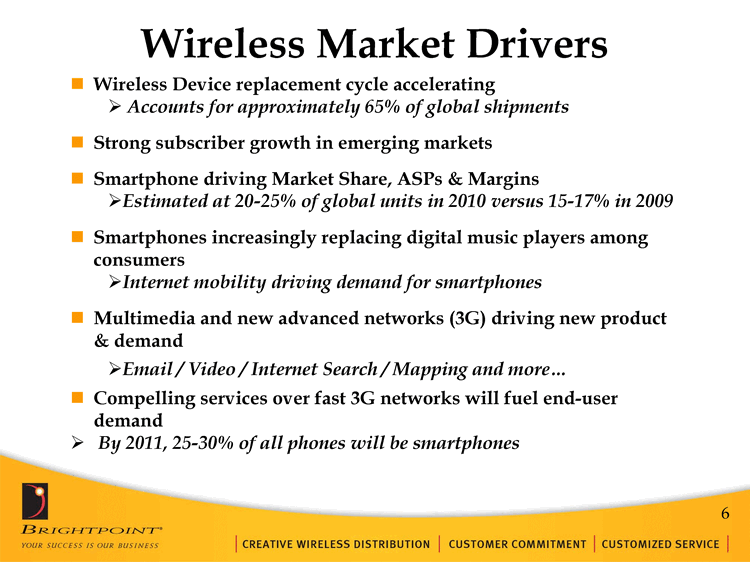
| 6 Wireless Device replacement cycle accelerating Accounts for approximately 65% of global shipments Strong subscriber growth in emerging markets Smartphone driving Market Share, ASPs & Margins Estimated at 20-25% of global units in 2010 versus 15-17% in 2009 Smartphones increasingly replacing digital music players among consumers Internet mobility driving demand for smartphones Multimedia and new advanced networks (3G) driving new product & demand Email / Video / Internet Search / Mapping and more... Compelling services over fast 3G networks will fuel end-user demand By 2011, 25-30% of all phones will be smartphones Wireless Market Drivers |

| 7 Our Business... "...is the last mile in the wireless supply chain." |
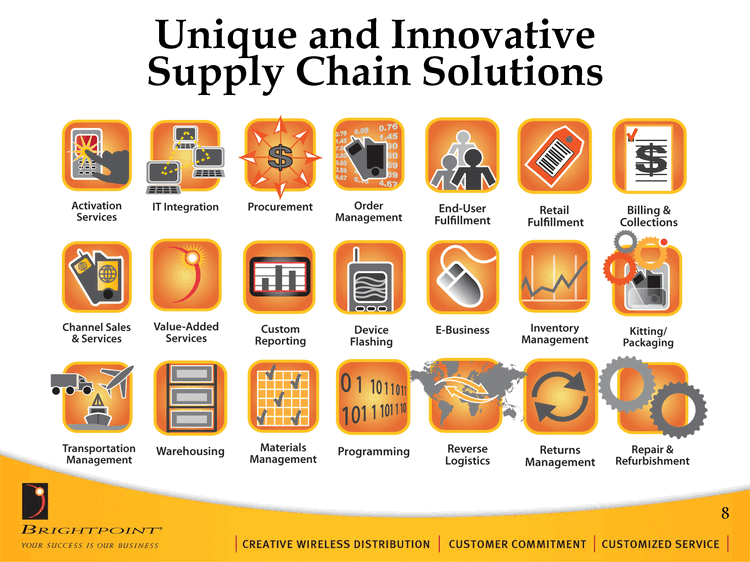
| 8 Unique and Innovative Supply Chain Solutions |
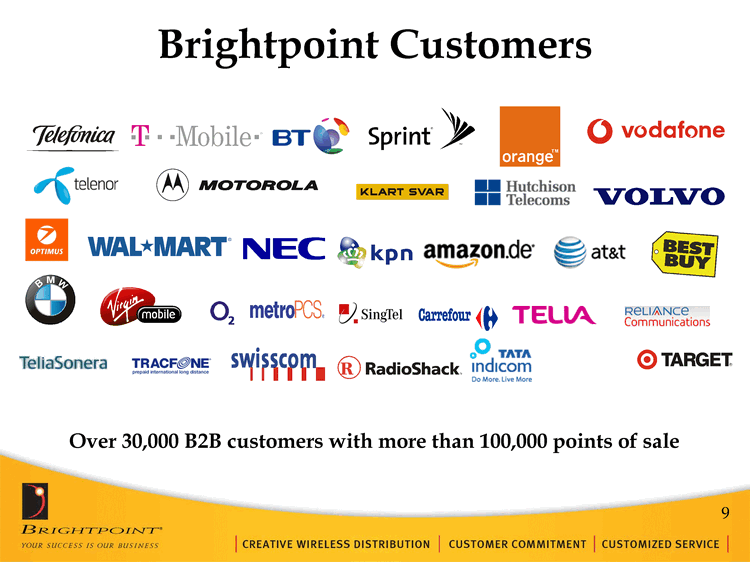
| 9 Brightpoint Customers Over 30,000 B2B customers with more than 100,000 points of sale |
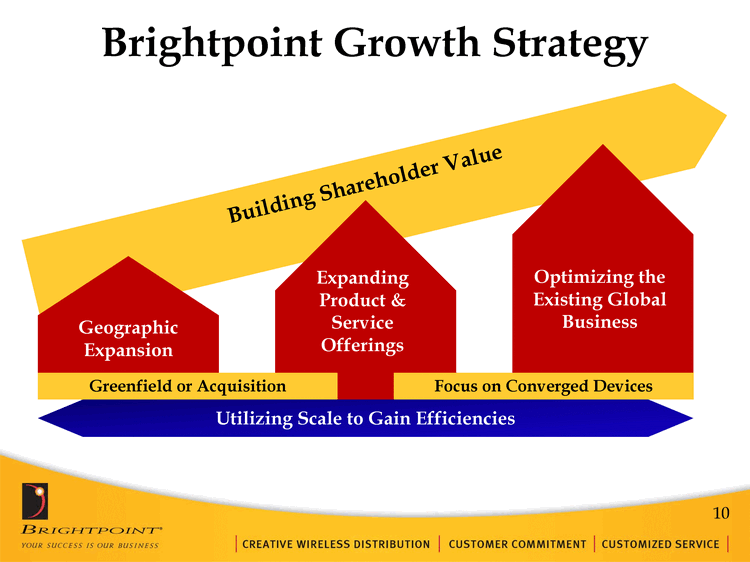
| Building Shareholder Value 10 Brightpoint Growth Strategy Geographic Expansion Expanding Product & Service Offerings Optimizing the Existing Global Business Utilizing Scale to Gain Efficiencies Greenfield or Acquisition Focus on Converged Devices |
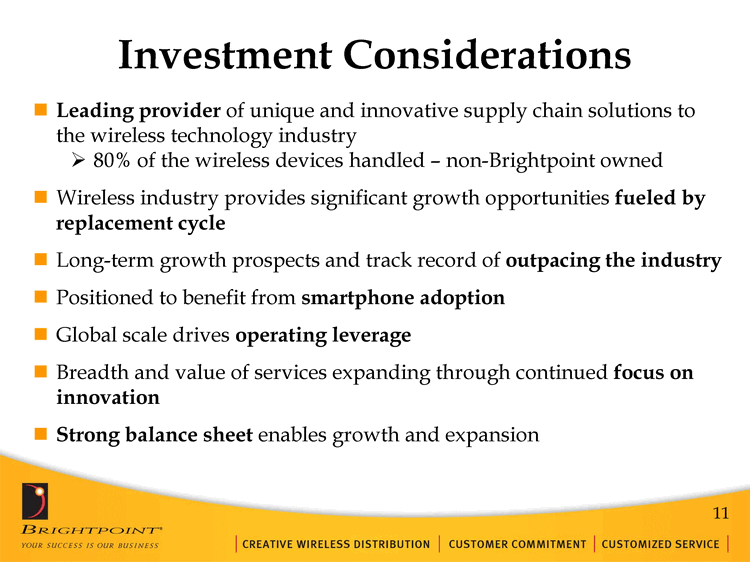
| 11 Investment Considerations Leading provider of unique and innovative supply chain solutions to the wireless technology industry 80% of the wireless devices handled - non-Brightpoint owned Wireless industry provides significant growth opportunities fueled by replacement cycle Long-term growth prospects and track record of outpacing the industry Positioned to benefit from smartphone adoption Global scale drives operating leverage Breadth and value of services expanding through continued focus on innovation Strong balance sheet enables growth and expansion |

| Q4 2009 Financial Appendix |
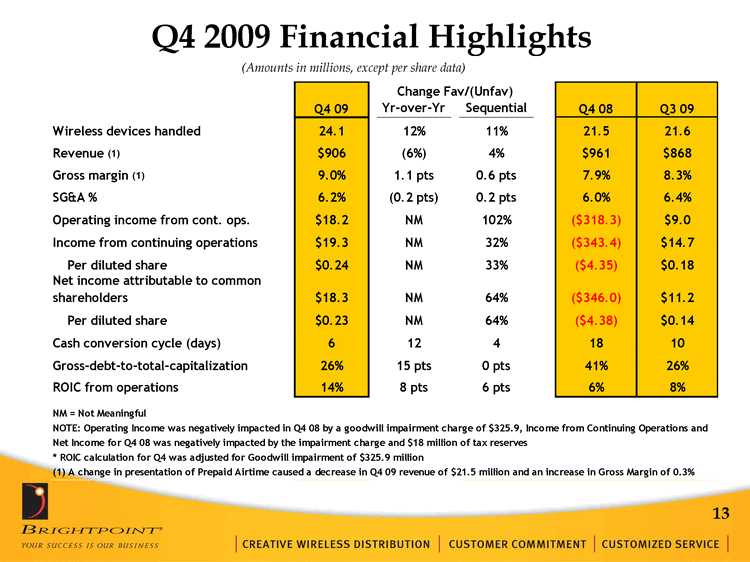
| Q4 2009 Financial Highlights (Amounts in millions, except per share data) 13 |
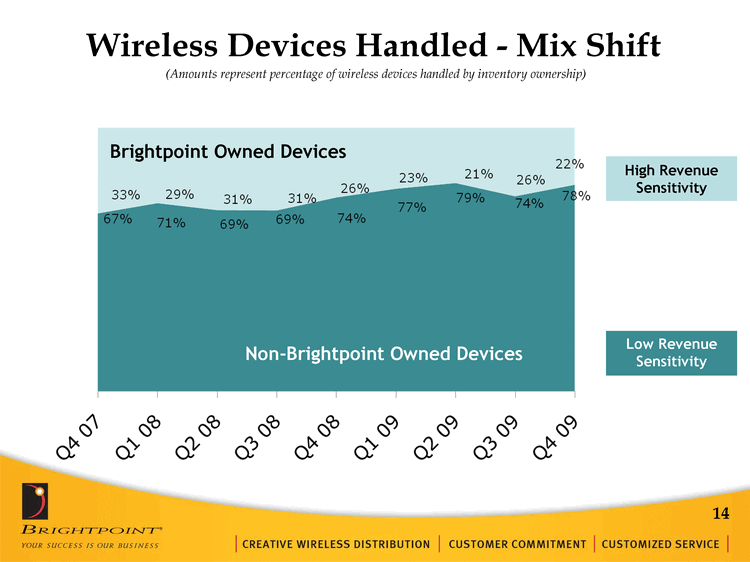
| Wireless Devices Handled - Mix Shift Non-Brightpoint Owned Devices Brightpoint Owned Devices High Revenue Sensitivity Low Revenue Sensitivity (Amounts represent percentage of wireless devices handled by inventory ownership) 14 |
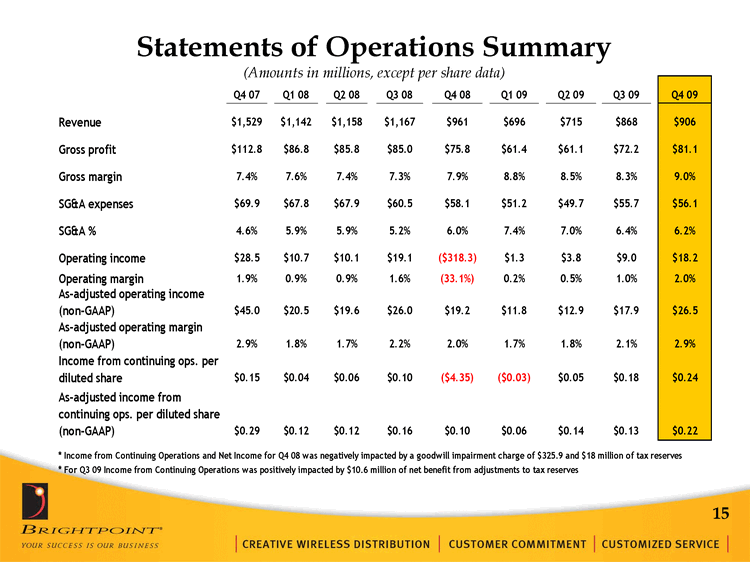
| Statements of Operations Summary (Amounts in millions, except per share data) 15 |
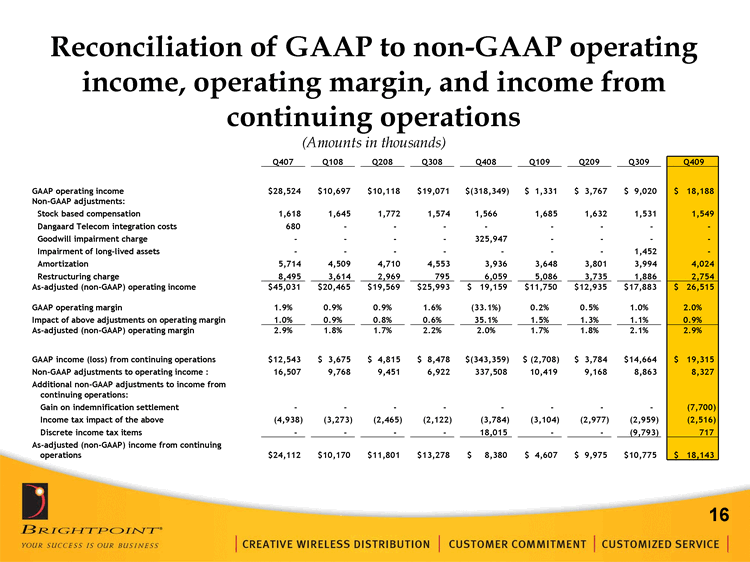
| 16 Reconciliation of GAAP to non-GAAP operating income, operating margin, and income from continuing operations (Amounts in thousands) Q407 Q108 Q208 Q308 Q408 Q109 Q209 Q309 Q409 GAAP operating income $28,524 $10,697 $10,118 $19,071 $(318,349) $ 1,331 $ 3,767 $ 9,020 $ 18,188 Non-GAAP adjustments: Stock based compensation 1,618 1,645 1,772 1,574 1,566 1,685 1,632 1,531 1,549 Dangaard Telecom integration costs 680 - - - - - - - - Goodwill impairment charge - - - - 325,947 - - - - Impairment of long-lived assets - - - - - - - 1,452 - Amortization 5,714 4,509 4,710 4,553 3,936 3,648 3,801 3,994 4,024 Restructuring charge 8,495 3,614 2,969 795 6,059 5,086 3,735 1,886 2,754 As-adjusted (non-GAAP) operating income $45,031 $20,465 $19,569 $25,993 $ 19,159 $11,750 $12,935 $17,883 $ 26,515 GAAP operating margin 1.9% 0.9% 0.9% 1.6% (33.1%) 0.2% 0.5% 1.0% 2.0% Impact of above adjustments on operating margin 1.0% 0.9% 0.8% 0.6% 35.1% 1.5% 1.3% 1.1% 0.9% As-adjusted (non-GAAP) operating margin 2.9% 1.8% 1.7% 2.2% 2.0% 1.7% 1.8% 2.1% 2.9% GAAP income (loss) from continuing operations $12,543 $ 3,675 $ 4,815 $ 8,478 $(343,359) $ (2,708) $ 3,784 $14,664 $ 19,315 Non-GAAP adjustments to operating income : 16,507 9,768 9,451 6,922 337,508 10,419 9,168 8,863 8,327 Additional non-GAAP adjustments to income from continuing operations: Gain on indemnification settlement - - - - - - - - (7,700) Income tax impact of the above (4,938) (3,273) (2,465) (2,122) (3,784) (3,104) (2,977) (2,959) (2,516) Discrete income tax items - - - - 18,015 - - (9,793) 717 As-adjusted (non-GAAP) income from continuing operations $24,112 $10,170 $11,801 $13,278 $ 8,380 $ 4,607 $ 9,975 $10,775 $ 18,143 |
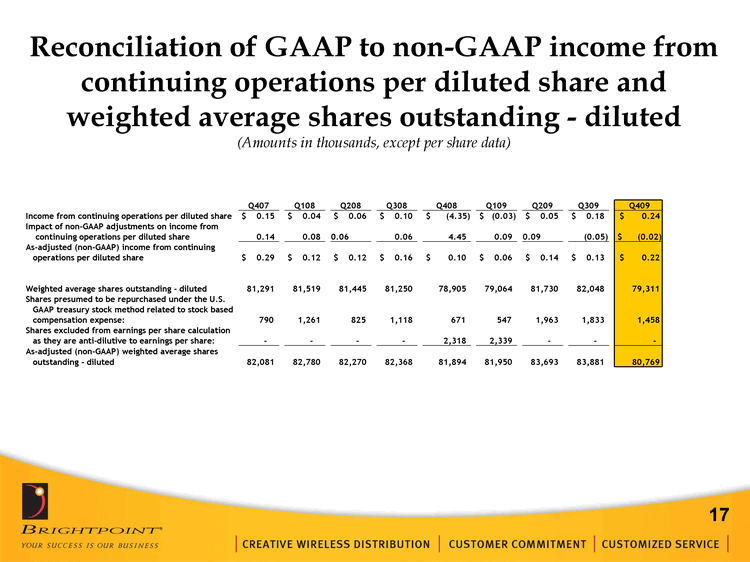
| 17 Q407 Q108 Q208 Q308 Q408 Q109 Q209 Q309 Q409 Income from continuing operations per diluted share $ 0.15 $ 0.04 $ 0.06 $ 0.10 $ (4.35) $ (0.03) $ 0.05 $ 0.18 $ 0.24 Impact of non-GAAP adjustments on income from continuing operations per diluted share 0.14 0.08 0.06 0.06 4.45 0.09 0.09 (0.05) $ (0.02) As-adjusted (non-GAAP) income from continuing operations per diluted share $ 0.29 $ 0.12 $ 0.12 $ 0.16 $ 0.10 $ 0.06 $ 0.14 $ 0.13 $ 0.22 Weighted average shares outstanding - diluted 81,291 81,519 81,445 81,250 78,905 79,064 81,730 82,048 79,311 Shares presumed to be repurchased under the U.S. GAAP treasury stock method related to stock based compensation expense: 790 1,261 825 1,118 671 547 1,963 1,833 1,458 Shares excluded from earnings per share calculation as they are anti-dilutive to earnings per share: - - - - 2,318 2,339 - - - As-adjusted (non-GAAP) weighted average shares outstanding - diluted 82,081 82,780 82,270 82,368 81,894 81,950 83,693 83,881 80,769 Reconciliation of GAAP to non-GAAP income from continuing operations per diluted share and weighted average shares outstanding - diluted (Amounts in thousands, except per share data) |
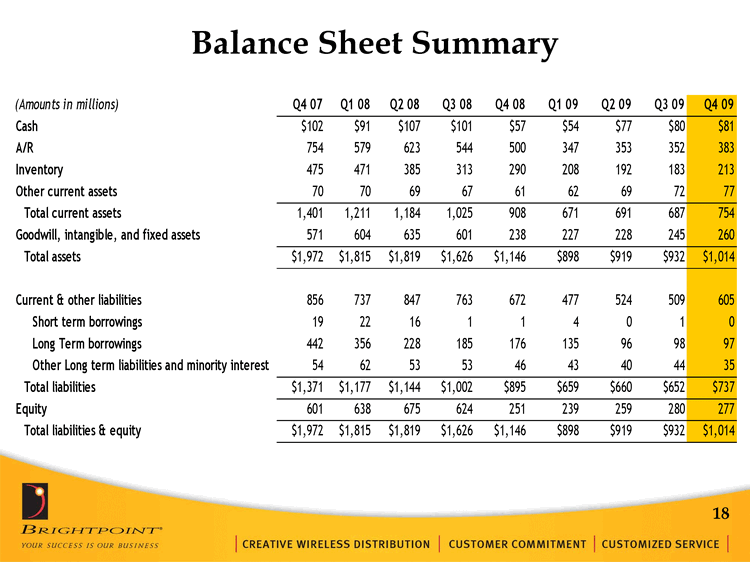
| Balance Sheet Summary 18 |
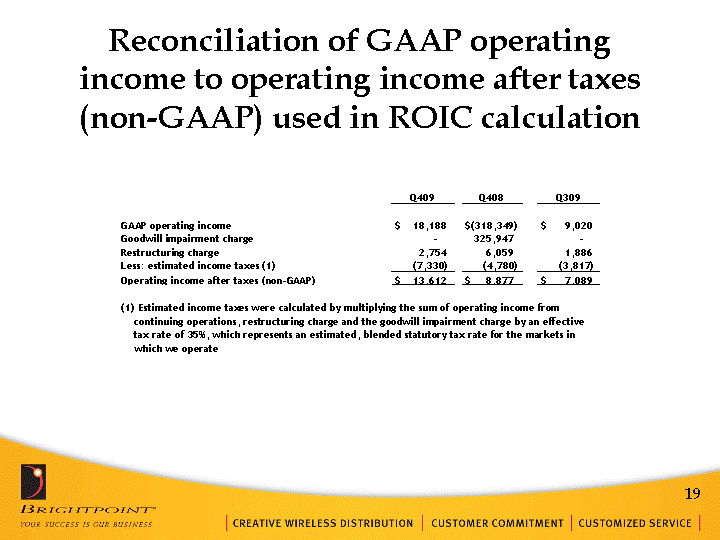
| 19 Reconciliation of GAAP operating income to operating income after taxes (non-GAAP) used in ROIC calculation Q409 Q408 Q309 GAAP operating income $ 18,188 $(318,349) $ 9,020 Goodwill impairment charge - 325,947 - Restructuring charge 2,754 6,059 1,886 Less: estimated income taxes (1) (7,330) (4,780) (3,817) Operating income after taxes (non-GAAP) $ 13,612 $ 8,877 $ 7,089 (1) Estimated income taxes were calculated by multiplying the sum of operating income from (1) Estimated income taxes were calculated by multiplying the sum of operating income from (1) Estimated income taxes were calculated by multiplying the sum of operating income from (1) Estimated income taxes were calculated by multiplying the sum of operating income from (1) Estimated income taxes were calculated by multiplying the sum of operating income from (1) Estimated income taxes were calculated by multiplying the sum of operating income from (1) Estimated income taxes were calculated by multiplying the sum of operating income from continuing operations, restructuring charge and the goodwill impairment charge by an effective continuing operations, restructuring charge and the goodwill impairment charge by an effective continuing operations, restructuring charge and the goodwill impairment charge by an effective continuing operations, restructuring charge and the goodwill impairment charge by an effective continuing operations, restructuring charge and the goodwill impairment charge by an effective continuing operations, restructuring charge and the goodwill impairment charge by an effective continuing operations, restructuring charge and the goodwill impairment charge by an effective tax rate of 35%, which represents an estimated, blended statutory tax rate for the markets in tax rate of 35%, which represents an estimated, blended statutory tax rate for the markets in tax rate of 35%, which represents an estimated, blended statutory tax rate for the markets in tax rate of 35%, which represents an estimated, blended statutory tax rate for the markets in tax rate of 35%, which represents an estimated, blended statutory tax rate for the markets in tax rate of 35%, which represents an estimated, blended statutory tax rate for the markets in tax rate of 35%, which represents an estimated, blended statutory tax rate for the markets in which we operate |

| Brightpoint The Global Leader Providing Unique Supply Chain Solutions to the Wireless Industry NASDAQ-GS Ticker: CELL |
