Attached files
Table of Contents
UNITED STATES
SECURITIES AND EXCHANGE COMMISSION
Washington, D.C. 20549
FORM 10-K
(Mark One)
| x | Annual Report Pursuant to Section 13 or 15(d) of the Securities Exchange Act of 1934 For the Fiscal Year Ended: January 30, 2010 |
or
| ¨ | Transition Report Pursuant to Section 13 or 15(d) of the Securities Exchange Act of 1934 For the transition period from to |
Commission File Number: 1-13113
SAKS INCORPORATED
(Exact Name of Registrant as Specified in Its Charter)
| Tennessee | 62-0331040 | |
| (State of Incorporation) | (I.R.S. Employer Identification Number) | |
| 12 East 49th Street New York, New York |
10017 | |
| (Address of Principal Executive Offices) | (Zip Code) | |
Registrant’s telephone number, including area code: (212) 940-5305
Securities Registered Pursuant to Section 12 (b) of the Act:
| Title of each class |
Name of Each Exchange on which registered | |
| Common Shares, par value $0.10 | New York Stock Exchange |
Securities Registered Pursuant to Section 12 (g) of the Act: None
Indicate by check mark if the registrant is a well-known seasoned issuer, as defined in Rule 405 of the Securities Act. Yes x No ¨
Indicate by check mark if the registrant is not required to file reports pursuant to Section 13 or Section 15(d) of the Exchange Act. Yes ¨ No x
Indicate by check mark if the registrant (1) has filed all reports required to be filed by Section 13 or 15(d) of the Securities Exchange Act of 1934 during the preceding 12 months (or for such shorter period that the registrant was required to file such reports) and (2) has been subject to such filing requirements for the past 90 days. Yes x No ¨
Indicate by check mark whether the registrant has submitted electronically and posted on its corporate Web site, if any, every Interactive Data File required to be submitted and posted pursuant to Rule-405 of Regulation S-T during the preceding 12 months (or for such shorter period that the registrant was required to submit and post such files). Yes ¨ No ¨
Indicate by check mark if disclosure of delinquent filers pursuant to Item 405 of Regulation S-K is not contained herein, and will not be contained, to the best of the registrant’s knowledge, in definitive proxy or information statements incorporated by reference in Part III of this Form 10-K or any amendment to this Form 10-K. ¨
Indicate by check mark whether the registrant is a large accelerated filer, an accelerated filer, a non-accelerated filer, or a smaller reporting company. See the definitions of “large accelerated filer,” “accelerated filer” and “smaller reporting company” in Rule 12b-2 of the Exchange Act.
Large accelerated filer x Accelerated filer ¨ Non-accelerated filer ¨ Smaller reporting company ¨
Indicate by check mark whether the registrant is a shell company (as defined in Rule 12b-2 of the Exchange Act). Yes ¨ No x
The aggregate market value of the voting stock held by non-affiliates of the registrant as of July 31, 2009 (the last business day of the registrant’s most recently completed second fiscal quarter) was approximately $739,950,295.
As of March 12, 2010, the number of shares of the registrant’s Common Stock outstanding was 160,615,141.
DOCUMENTS INCORPORATED BY REFERENCE
Applicable portions of the Saks Incorporated Proxy Statement for the 2010 Annual Meeting of Shareholders to be held on June 8, 2010 are incorporated by reference into Part III of this Form 10-K.
Table of Contents
| PART I |
||||
| Item 1. |
2 | |||
| Item 1A. |
7 | |||
| Item 1B. |
12 | |||
| 13 | ||||
| Item 2. |
15 | |||
| Item 3. |
17 | |||
| PART II |
||||
| Item 5. |
18 | |||
| Item 6. |
21 | |||
| Item 7. |
Management’s Discussion and Analysis of Financial Condition and Results of Operations |
22 | ||
| Item 7A. |
42 | |||
| Item 8. |
43 | |||
| Item 9. |
Changes in and Disagreements with Accountants on Accounting and Financial Disclosure |
43 | ||
| Item 9A. |
43 | |||
| Item 9B. |
44 | |||
| PART III |
||||
| Item 10. |
45 | |||
| Item 11. |
45 | |||
| Item 12. |
Security Ownership of Certain Beneficial Owners and Management and Related Stockholder Matters |
45 | ||
| Item 13. |
Certain Relationships and Related Transactions, and Director Independence |
45 | ||
| Item 14. |
45 | |||
| PART IV |
||||
| Item 15. |
46 | |||
| 47 | ||||
| 48 | ||||
| F-1 | ||||
| F-2 | ||||
| F-3 | ||||
| F-4 | ||||
| F-5 | ||||
| F-6 | ||||
| F-7 | ||||
| Financial Statement Schedule |
||||
| F-47 | ||||
1
Table of Contents
PART I
General
The operations of Saks Incorporated, a Tennessee corporation first incorporated in 1919, and its subsidiaries (together the “Company”) consist of Saks Fifth Avenue (“SFA”), Saks Fifth Avenue OFF 5TH (“OFF 5TH”), and SFA’s e-commerce operations.
The Company is primarily a fashion retail organization offering a wide assortment of distinctive luxury fashion apparel, shoes, accessories, jewelry, cosmetics, and gifts. SFA stores are principally free-standing stores in exclusive shopping destinations or anchor stores in upscale regional malls. Customers may also purchase SFA products online at www.saks.com or by catalog. OFF 5TH is intended to be the premier luxury off-price retailer in the United States. OFF 5TH stores are primarily located in upscale mixed-use and off-price centers and offer luxury apparel, shoes, and accessories, targeting the value-conscious customer. As of January 30, 2010, the Company operated 53 SFA stores with a total of approximately 5.9 million square feet and 55 OFF 5TH stores with a total of approximately 1.6 million square feet.
Merchandising, sales promotion, and store operating support functions reside in New York, New York. The back office sales support functions for the Company, such as accounting, credit card administration, store planning, and information technology, are located principally in the Company’s operations center in Jackson, Mississippi or in the SFA corporate offices in New York City.
The Company’s fiscal year ends on the Saturday closest to January 31. Fiscal years 2009, 2008, and 2007 each contained 52 weeks and ended on January 30, 2010, January 31, 2009, and February 2, 2008, respectively.
Merchandising
The Company’s stores and e-commerce operations carry luxury merchandise from both core vendors and new and emerging designers. The Company has key relationships with the leading American and European fashion houses, including Giorgio Armani, Chanel, Gucci, Prada, Louis Vuitton, St. John, Zegna, Theory, Cartier, David Yurman, Hugo Boss, Elie Tahari, Tory Burch, Ralph Lauren, Akris and Burberry, among many others.
The Company has developed a knowledge of each of its trade areas and customer bases for its operations. This knowledge is gained through use of on-line merchandise information, store visits by senior management and merchandising personnel, and frequent communication between merchandising staff and store management. The Company strives to tailor each store’s merchandise assortment to the characteristics of its trade areas and customer bases and to the lifestyle needs of its local customers.
Certain departments in the Company’s SFA stores are leased to independent companies in order to provide high quality service and merchandise where specialization and expertise are critical. The leased departments are designed to complement the Company’s owned merchandising departments. The principal leased departments in the SFA stores are furs and certain designer handbags. The terms of the lease agreements typically are between one and seven years and may require the lessee to pay for a portion of the fixtures and provide its own employees. Management regularly evaluates the performance of the leased departments and requires compliance with established customer service guidelines.
2
Table of Contents
For the year ended January 30, 2010, SFA’s percentages of owned sales (exclusive of sales generated by leased departments) by major merchandise category were as follows:
| Women’s Apparel |
35.2 | % | |
| Accessories |
19.6 | % | |
| Cosmetics |
16.3 | % | |
| Men’s Apparel |
14.0 | % | |
| Women’s Shoes |
10.3 | % | |
| Other |
4.6 | % | |
| Total |
100.0 | % | |
Inventory Purchasing and Distribution
Consistent with practices in the retail industry, the Company purchases merchandise assortments and volumes to coincide with the seasonality of the business and expected customer demand. Retailers typically purchase and receive larger amounts of merchandise in the fall as they prepare for the holiday shopping season (primarily November and December).
The Company purchases merchandise from many vendors. Management monitors profitability and sales history with vendors and believes it has alternative sources available for each category of merchandise it purchases. Management believes it maintains good relationships with its vendors.
The Company has two distribution facilities serving its stores. Refer to “Item 2. Properties” for additional information about these facilities.
The Company’s distribution facilities operate on a modern warehouse management system that leverages electronic data interchange (“EDI”) technology in conjunction with high-speed automated conveyor systems in order to receive and distribute merchandise as economically as possible to the Company’s stores. Many of the Company’s vendors also utilize EDI technology which permits merchandise to be ‘cross docked’ from the receiving department to the shipping department, with very little handling. The distribution centers also use efficient radio frequency hand-held devices to scan barcodes on merchandise that is too large or fragile for the conveyor system. The warehouse management system is interfaced to the Company’s mainframe to execute ‘booking’ of the merchandise to the stores and to pass the appropriate records to accounting for invoice payment and reconciliation.
Return Policy
The Company offers its customers a fair and liberal return policy, consistent with other luxury retailers, at SFA stores, OFF 5TH stores, and online at www.saks.com. Approximately 23% of merchandise sold is later returned, and a large percentage of merchandise returns occur within a matter of days of the selling transaction. The Company uses historical return patterns to estimate expected returns.
Information Technology
Company management believes that technological investments are necessary to support its business operations and strategies, and, as a result, the Company is continually upgrading its information systems to improve efficiency and productivity. Between 2006 and 2009, the Company completed significant upgrades to its merchandising planning and allocation systems and installed new point-of-sale equipment and software with enhanced clienteling capabilities in each of its SFA stores.
3
Table of Contents
The Company’s information systems provide information deemed necessary for management operating decisions, cost management programs, and customer service enhancements. Individual data processing systems include point-of-sale and sales reporting, purchase order management, receiving, merchandise planning and control, payroll, human resources, general ledger, and accounts payable systems. Bar code ticketing is used, and scanning is utilized at point-of-sale terminals. Information is made available on Company systems to merchandising staff and store management on a timely basis.
The use of EDI technology allows the Company to speed the flow of information and merchandise in an attempt to capitalize on emerging sales trends, maximize inventory turnover, and minimize out-of-stock conditions. EDI technology includes an advance shipping notice system (“ASN”). The ASN system identifies discrepancies between merchandise that is ready to be shipped from a supplier’s warehouse and that which was ordered from the supplier. This early identification provides the Company with a window of time to resolve any discrepancies in order to speed merchandise through the distribution facilities and into its stores.
Marketing
The Company’s marketing principally emphasizes the latest fashion trends in luxury merchandise and primarily utilizes direct mail (catalogs) and email advertising, supplemented with national and local marketing efforts. To promote its image as one of the primary sources of luxury goods in its trade areas, the Company sponsors numerous fashion shows and in-store special events highlighting the designers represented in the Company’s stores. The Company also participates in “cause-related” marketing. This includes special in-store events and related advertising designed to drive store traffic, while raising funds for charitable organizations and causes such as women’s cancer research. The Company’s in-house marketing and sales promotion staff works with outside agencies to produce the Company’s marketing materials and campaigns.
The Company utilizes data captured through the use of proprietary credit cards offered by HSBC Bank Nevada, N.A. (“HSBC”) to develop advertising and promotional events targeted at specific customers who have purchasing patterns for certain brands, departments, and store locations.
Proprietary Credit Cards
HSBC offers proprietary credit card accounts to the Company’s customers. In April 2003, the Company entered into a program agreement with HSBC for a term of ten years expiring in 2013 pursuant to which HSBC owns and issues proprietary credit cards to the Company’s customers. Pursuant to a servicing agreement with HSBC with a ten-year term expiring in 2013, the Company continues to provide key customer service functions, including new account openings, transaction authorizations, billing adjustments and customer inquiries, and receives compensation from HSBC for the provision of these services.
Under the terms of the original program agreement, HSBC assumed substantially all risks while sharing with the Company certain revenue generated by interest and fees on the portfolio. Saks and HSBC have entered into several amendments to the program agreement since 2003. In October 2009, the Company and HSBC entered into a fifth amendment to the program agreement in response to macroeconomic conditions and portfolio performance, which provides for certain changes to the allocation of risk and revenue sharing between the parties. The fifth amendment, which became effective February 1, 2010, provides for HSBC to share with the Company certain credit losses of the card portfolio and also provides increased revenue sharing to the Company.
In September of 2006, the Company entered into agreements with HSBC and MasterCard International Incorporated to issue co-branded MasterCard cards to new and existing proprietary credit card customers. Under this program, qualifying customers are issued an SFA and MasterCard co-branded credit card that functions as a
4
Table of Contents
traditional proprietary credit card when used at any SFA or OFF 5TH store and at www.saks.com or as a MasterCard card when used at any unaffiliated location that accepts MasterCard cards. HSBC establishes and owns the co-brand accounts, retains the benefits associated with the ownership of the accounts, receives the finance charge and other income from the accounts, and incurs the bad debts associated with the accounts.
Historically, proprietary credit card holders have shopped more frequently with the Company and purchased more merchandise than customers who pay with cash or third-party credit cards. The Company also makes frequent use of the names and addresses of the proprietary credit card holders in its direct marketing efforts.
The Company seeks to expand the number and use of the proprietary credit cards by, among other things, providing monetary incentives to sales associates to open new credit accounts, which generally can be opened while a customer is visiting one of the Company’s stores. Customers who open accounts are entitled to a discount on the first day’s purchases. Customers using the proprietary credit card are eligible for the SaksFirst loyalty program that rewards customers for spending on their proprietary charge cards. Additionally, co-brand card customers earn SaksFirst points for purchases made at unaffiliated locations. Increased spending on the proprietary cards is intended to result in an increased rate of reward. Rewards come in the form of electronic gift cards that are redeemable on future purchases. In addition, members of the loyalty program are eligible for other rewards and benefits including special shopping events and travel discounts.
As of January 30, 2010, there were approximately 702,000 proprietary credit accounts that were active within the prior twelve months, accounting for 41.9% of the Company’s 2009 sales.
Trademarks and Service Marks
The Company owns many trademarks and service marks including, but not limited to, “Saks Fifth Avenue,” “Saks & Company,” “SFA,” “S5A,” “The 5TH Avenue Club,” “SAKSFIRST,” “Clothes (Real),” “Saks Fifth Avenue Men’s Collection,” and “OFF 5TH.” Management believes its trademarks and service marks are important and that the loss of certain of its trademarks or trade names, particularly the store nameplates, could have a material adverse effect on the Company. Many of the Company’s trademarks and service marks are registered in the United States Patent and Trademark Office. The terms of these registrations are generally ten years, and they are renewable for additional ten-year periods indefinitely so long as the marks are in use at the time of renewal. The Company is not aware of any claims of infringement or other challenges to its right to use its marks that would have a material adverse effect on the Company’s consolidated financial position, results of operations, or liquidity.
Reliance on Fifth Avenue Store
The Company’s Flagship SFA store located on Fifth Avenue in New York City accounted for approximately 19% of total Company sales in 2009 and plays a significant role in creating awareness for the Saks Fifth Avenue brand name.
Customer Service
The Company believes that good customer service contributes to increased store visits and purchases by its customers.
The Company’s goal is to deliver an inviting, customer-focused shopping experience to each customer. At SFA and OFF 5TH, the Company seeks to enable its customers to discover both accessible and high-end fashion in a warm, welcoming environment, guided by knowledgeable sales associates. Compensation for sales
5
Table of Contents
associates is generally a commission-based program. Sales associates undergo extensive service, selling, and product-knowledge training and are encouraged to maintain frequent, personal contact with their customers. Sales associates are encouraged to utilize detailed customer data available through the Company’s point-of-sale equipment and software for their clienteling efforts, send personalized thank-you notes, and routinely communicate with customers to advise them of new merchandise offerings and special promotions. Typical SFA stores also provide comfortable seating areas, and most SFA stores offer a complimentary personal shopping service called “The Fifth Avenue Club.”
Seasonality
The Company’s business, like that of many retailers, is subject to seasonal influences, with a significant portion of its sales and net income realized during the second half of the fiscal year, which includes the holiday selling season. Approximately 30% of the Company’s sales are generated during the fourth quarter, and normally a large portion of its operating income is generated during the fall season.
Competition
The retail business is highly competitive. The Company’s stores primarily compete with several national and regional department stores, specialty apparel stores, designer boutiques, outlet stores, and mail-order and e-commerce retailers. Management believes that its knowledge of its trade areas and customer base, combined with the Company’s high level of customer service, broad selection of quality fashion merchandise at appropriate prices, innovative marketing, and strategic store locations, positions the Company for a competitive advantage.
Associates
As of January 30, 2010, the Company employed approximately 12,400 associates, of which approximately 22% were employed on a part-time basis. The Company hires additional temporary associates and increases the hours of part-time associates during seasonal peak selling periods. Approximately 1.0% of the Company’s associates are covered by collective bargaining agreements. The Company considers its relations with its associates to be good.
Inflation and Deflation
Inflation and deflation affect the costs incurred by the Company in its purchase of merchandise and in certain components of its selling, general and administrative expenses (“SG&A”). The Company attempts to offset the effects of inflation, which has occurred in recent years in SG&A.
Discontinued Operations
As of January 31, 2009, the Company discontinued the operations of its Club Libby Lu (“CLL”) business, the operations of which are presented as discontinued operations in the Consolidated Statements of Income and the Consolidated Statements of Cash Flows for the current and prior year periods. CLL consisted of 98 leased, mall-based specialty stores, targeting girls aged 4-12 years old. CLL generated revenues of approximately $52.2 million for 2008 and was not profitable. The Company incurred nominal charges in 2009 and charges of $44.5 million in 2008 associated with closing the stores.
6
Table of Contents
Website Access to Information
The Company provides access, free of charge to the Company’s annual report on Form 10-K, quarterly reports on Form 10-Q, current reports on Form 8-K and all amendments to those reports as soon as reasonably practicable after the reports are electronically filed with or furnished to the Securities and Exchange Commission (“SEC”) through the Company’s website, www.saksincorporated.com.
Certifications
The Company filed the certification of its Chief Executive Officer with the New York Stock Exchange (“NYSE”) in fiscal 2009 as required pursuant to Section 303A.12(a) of the NYSE Listed Company Manual, and the Company has filed the Sarbanes-Oxley Act Section 302 and Section 906 certifications of its principal executive officer and principal financial officer with the SEC, which are attached hereto as Exhibits 31.1, 31.2, 32.1, and 32.2.
The following are certain risk factors that affect the Company’s business, financial condition, results of operations, and cash flows, some of which are beyond the Company’s control. These risk factors should be considered in connection with evaluating the forward-looking statements contained in this Annual Report on Form 10-K. The risks and uncertainties described below are not the only ones facing the Company. If any of the events described below were to actually occur, the Company’s business, financial condition, results of operations or cash flows could be adversely affected and results could differ materially from expected and historical results.
A decline in the demand for luxury goods due to difficult macroeconomic conditions has had and could continue to have an adverse impact on the Company’s results of operations.
The Company is focused on the luxury retail sector. SFA stores, OFF 5TH stores and www.saks.com offer a wide assortment of luxury fashion apparel, shoes, accessories, jewelry, cosmetics, and gift items. All of the goods that the Company sells are discretionary items. Changes in consumer confidence and fluctuations in financial markets can influence cyclical trends, particularly in the luxury sector. Consequently, starting in the fall of 2008, the downturn in the economy resulted and may continue to result in fewer customers shopping in the Company’s stores. In response, and in order to reduce inventory levels, the Company was required to take additional markdowns and to increase promotional events during Fall of 2008 and Spring of 2009. The increased markdowns and promotional activity negatively impacted the Company’s profitability. Any future unexpected significant decrease in demand could have a similar effect on profit. As a result of a decrease in consumer spending, the Company has been forced to reduce costs. Despite these measures and continued efforts to align inventory levels with expected sales in fiscal year 2010, there is no assurance that the Company will be successful in restoring profitability. In addition, in the event that we are unsuccessful in restoring profitability, we may not be able to realize our net deferred tax assets, which would require us to record a valuation allowance that could have a material impact on our results of operations in the period in which it is recorded.
Poor economic conditions have affected and may continue to affect consumer spending which has harmed and may continue to harm the Company’s business.
The retail industry is continuously subject to domestic and international economic trends. The success of the Company’s business depends to a significant extent upon the level of consumer spending. A number of factors affect the level of consumer spending on merchandise that the Company offers, including, among other things:
| • | general economic, industry, and weather conditions; |
7
Table of Contents
| • | the performance of the financial equity, and credit markets; |
| • | current and expected unemployment levels; |
| • | crude oil prices that affect gasoline and heating oil prices; |
| • | the level of consumer debt; |
| • | the level of consumer savings |
| • | interest rates; |
| • | tax rates and policies; |
| • | consumer confidence in future economic conditions; and |
| • | war, terrorism, and other hostilities. |
Reduced consumer confidence and spending has resulted in reduced demand for discretionary items and has forced the Company to take significant markdowns in the past. If consumer demand for the Company’s merchandise remains weak, the Company may be forced to take additional markdowns in future periods.
Additionally, several of the Company’s stores are in tourist markets, including the flagship SFA New York store. A continuation of the downturn in economic conditions or other events such as terrorist activity could further impact travel and thus negatively affect the results of operations for stores located within these tourist markets. Increases in transportation and fuel costs, the financial condition of the airline industry and its impact on air travel, and sustained recessionary periods in the U.S. and internationally could also unfavorably impact results of the stores located within these tourist markets.
The Company’s business and results of operations are also subject to uncertainties arising out of world events. These uncertainties may include a global economic slowdown, changes in consumer spending or travel, an increase in gasoline and commodity prices, epidemics, and the economic consequences of natural disasters, military action or terrorist activity (including threats of terrorist activity). Any future events arising as a result of terrorist activity, natural disasters or other world events may have a material impact on the Company’s business, its ability to source products, results of operations, and financial condition in the future.
The Company’s flagship SFA New York store is especially susceptible to volatility in the financial markets and employment and compensation trends in the financial sector.
The Company is restricted in its ability to incur additional debt which may affect its ability to adequately finance its operations.
Our revolving credit facility, our senior notes, and our 2.0% convertible notes contain restrictions on liens and sale/leaseback transactions, and our revolving credit facility also contains a restriction on additional indebtedness, in each case, subject to certain limited exceptions. These restrictions under the revolving credit agreement and the outstanding notes may affect the Company’s ability to obtain additional debt financing or financing on favorable terms if its cash flow from operations and funds available under its revolving credit facility are insufficient to satisfy its working capital requirements.
We are unable to predict the impact of potential disruptions in the credit markets and the resulting costs or constraints in obtaining financing on our business and financial results.
The Company’s principal sources of cash come from the Company’s operating activities and borrowings under its revolving credit facility. Disruptions in the credit markets have had a significant adverse impact on a
8
Table of Contents
number of financial institutions and have affected the cost of capital available to the Company. The Company cannot predict with any certainty the impact of any further disruption in the credit environment or any resulting material impact on its liquidity, future financing costs or financial results.
The Company is dependent on its relationships with certain designers, vendors, and other sources of merchandise.
The Company’s relationships with established and emerging designers are a key factor in its position as a retailer of luxury merchandise, and a substantial portion of its revenues are attributable to its sales of designer merchandise. Many of the Company’s key vendors limit the number of retail outlets they use to sell their merchandise, and competition among luxury retailers to obtain and sell these goods is intense. The Company’s relationships with its designers have been a significant contributor to its past success. Although the Company has supply arrangements with some of its merchandising sources, there can be no assurance that such sources will continue to meet the Company’s quality, style, and volume requirements. Moreover, nearly all of the top designer brands sold by the Company are also sold by competing retailers, and many of these top designer brands also have their own dedicated retail stores. If one or more of these top designers were to cease providing the Company with adequate supplies of merchandise or, conversely, were to increase sales of merchandise through its own stores or to the stores of other competitors, the Company’s business could be adversely affected. In addition, any decline in the popularity or quality of any of these designer brands could adversely affect the Company’s business.
The Company’s business and results of operations may be adversely affected by weather conditions and natural disasters.
The Company’s business is adversely affected by unseasonable weather conditions. Periods of unseasonably warm weather in the fall or winter or unseasonably cold or wet weather in the spring or summer affect consumer apparel purchases and could have a material adverse effect on the Company’s results of operations and financial condition. Additionally, severe weather conditions such as winter snowstorms or natural disasters such as hurricanes, tornadoes, earthquakes, and floods may adversely affect the Company’s results of operations and financial condition.
The Company’s business is intensely competitive and increased or new competition could have a material adverse effect on the Company.
The retail industry is intensely competitive. As a retailer offering a broad selection of luxury fashion apparel, shoes, accessories, jewelry, cosmetics, and gift items, the Company currently competes with a diverse group of retailers, including e-commerce retailers, which sell, among other products, products similar to those of the Company. The Company also competes in particular markets with a substantial number of retailers that specialize in one or more types of products that the Company sells. A number of different competitive factors could have a material adverse effect on the Company’s business, results of operations and financial condition including:
| • | increased operational efficiencies of competitors; |
| • | competitive pricing strategies, including deep discount pricing by a broad range of retailers during periods of poor consumer confidence or economic instability; |
| • | expansion of product offerings by existing competitors; |
| • | entry by new competitors into markets in which the Company currently operates; and |
9
Table of Contents
| • | adoption by existing competitors of innovative retail sales methods. |
The Company may not be able to continue to compete successfully with its existing or new competitors, and prolonged periods of deep discount pricing by its competitors may have a material adverse effect on the Company’s business.
The Company faces risks associated with consumer preferences, demand, and fashion trends.
Changes in consumer preferences, demand and interest could have a material adverse effect on the Company’s business. In addition, fashion trends could materially impact sales. Success in the retail business depends, in part, on the Company’s ability to anticipate consumer preferences and demand. Early order commitments often are made far in advance of consumer acceptance. If the Company fails to anticipate accurately and respond to consumer preferences and demand, it could experience lower sales, excess inventories, and lower profit margins, any of which could have a material adverse effect on the Company’s results of operations and financial condition.
The Company faces a number of risks in opening new stores.
As part of its growth strategy, the Company could potentially increase the total number of stores, which may include opening new stores in both new and existing markets. The Company may not be able to operate any new stores profitably. The success of any future store openings will depend upon numerous factors, many of which are beyond the Company’s control, including the following:
| • | the ability of management to adequately analyze and identify suitable markets and individual store sites within those markets; |
| • | the ability to attract appropriate vendors; |
| • | the competition for suitable store sites; |
| • | the ability to negotiate favorable lease terms with landlords; |
| • | the availability of employees to staff new stores and the Company’s ability to hire, train, motivate, and retain store personnel; and |
| • | the ability to attract customers and generate sales sufficient to operate new stores profitably. |
In future years, the Company may enter into additional markets. These markets may have different competitive conditions, consumer trends, and discretionary spending patterns than its existing markets, which may cause new stores in these markets to be less successful than stores in existing markets.
The loss of, or disruption in, the Company’s centralized distribution centers would have a material adverse effect on the Company’s business and operations.
The Company depends on the orderly operation of the receiving and distribution process, which relies on adherence to shipping schedules and effective management of distribution centers. Although the Company believes that its receiving and distribution process is efficient, and the Company has appropriate contingency plans, unforeseen disruptions in operations due to fire, severe weather conditions, natural disasters, or other catastrophic events, labor disagreements, or other shipping problems may result in delays in the delivery of merchandise to the Company’s stores.
10
Table of Contents
Additionally, freight cost is impacted by changes in fuel prices. Fuel prices affect freight cost both on inbound freight from vendors to the distribution centers and outbound freight from the distribution centers to the Company’s stores.
Although the Company maintains business interruption and property insurance, management cannot be assured that the Company’s insurance coverage will be sufficient, or that insurance proceeds will be timely paid to the Company, if any of the distribution centers are shut down for any reason.
Loss of the Company’s trademarks and service marks or damage to the Company’s brand could have a material adverse effect on the Company’s results of operations.
The Company owns many trademarks and service marks including, but not limited to, “Saks Fifth Avenue,” “Saks & Company,” “SFA,” “S5A,” “The 5TH Avenue Club,” “SAKSFIRST,” “Clothes (Real),” “Saks Fifth Avenue Men’s Collection,” and “OFF 5TH.” Management believes its trademarks and service marks are important and that the loss of certain of its trademarks or trade names, particularly the store nameplates, could have a material adverse effect on the Company. Many of the Company’s trademarks and service marks are registered with the United States Patent and Trademark Office. In addition, the Company has a well-recognized brand that it believes represents unsurpassed customer service and quality merchandise. Any significant damage to the Company’s brand or reputation may negatively impact same-store sales, lower employee morale and productivity, and diminish customer trust, resulting in a reduction in shareholder value.
Fluctuations in foreign currency could have an adverse impact on the Company’s business.
The Company purchases a substantial portion of its inventory from foreign suppliers whose functional currency is not the U.S. dollar. Although fluctuations in the Euro-U.S. dollar exchange rate have the largest impact on the Company’s business, the Company procures goods from many countries and, consequently, is affected by fluctuations in the U.S. dollar relative to the currencies of the countries from which the Company purchases goods. Accordingly, changes in the value of the dollar relative to foreign currencies may increase the Company’s cost of goods sold. If the Company is unable to pass such cost increases on to its customers or the higher cost of the products results in decreased consumption, gross margins and ultimately earnings would decrease.
If the Company does not successfully upgrade, maintain and secure our information systems to support the needs of the organization, it could have an adverse impact on the Company’s business.
The Company relies heavily on information systems to manage operations, including a full range of retail, financial, sourcing and merchandising systems, and regularly make investments to upgrade, enhance or replace these systems. The reliability and capacity of information systems is critical. Despite our preventative efforts, the Company’s systems are vulnerable from time to time to damage or interruption from, among other things, security breaches, computer viruses, power outages and other technical malfunctions. Any disruptions affecting the Company’s information systems, or any delays or difficulties in transitioning to new systems or in integrating them with current systems, could have a material adverse impact on our business. In addition, the Company’s ability to continue to operate its business without significant interruption in the event of a disaster or other disruption depends in part on the ability of the Company’s information systems to operate in accordance with our disaster recovery and business continuity plans.
A privacy breach could adversely affect the Company’s business.
The protection of customer, employee, and company data is critical to the Company. The regulatory environment and industry standards surrounding information security and privacy continue to evolve in response
11
Table of Contents
to increased threats to information security. In addition, customers have a high expectation that the Company will adequately protect their personal information. A significant breach of customer, employee, or company data could damage the Company’s reputation and result in lost sales, fines, or litigation resulting in a decrease in the Company’s earnings.
Ownership and leasing of significant amounts of real estate exposes the Company to possible liabilities and losses.
A significant percentage of our SFA stores and one of our OFF 5TH stores are owned. The remainder of our SFA and OFF 5TH stores are leased. Accordingly, the Company is subject to all of the risks associated with owning and leasing real estate. In particular, the value of the assets could decrease, and their costs to operate could increase, because of changes in the investment climate for real estate, demographic trends, and supply or demand for the use of the store, which may result from competition from similar stores in the area, as well as liability for environmental conditions.
Store leases generally require the Company to pay a fixed minimum rent and a variable amount based on a percentage of annual sales at that location. The Company generally cannot terminate these leases. If a store is not profitable, and the Company decides to close it, the Company may be committed to perform certain obligations under the applicable lease including, among other things, paying rent for the balance of the applicable lease term. In addition, as each of the leases expires, the Company may be unable to negotiate renewals, either on commercially acceptable terms or at all, which could cause the Company to close stores in desirable locations.
If an existing owned store is not profitable, and the Company decides to close it, the Company may be required to record an impairment charge and/or exit costs associated with the disposal of the store.
In addition, the Company may not be able to close an unprofitable owned or leased store due to an existing operating covenant which may cause the Company to operate the location at a loss which could result in an impairment charge.
Item 1B. Unresolved Staff Comments.
None.
12
Table of Contents
Executive Officers and Directors of the Registrant.
The name, age, and position held with the Company for each of the executive officers of the Company are set forth below.
| Name |
Age | Position | ||
| Stephen I. Sadove |
58 | Chairman of the Board of Directors; Chief Executive Officer; Director | ||
| Ronald L. Frasch |
60 | President and Chief Merchandising Officer | ||
| Michael A. Brizel |
53 | Executive Vice President and General Counsel | ||
| Jennifer S. de Winter |
49 | Executive Vice President of Stores | ||
| Marc J. Metrick |
36 | Group Senior Vice President of Merchandise Planning and Chief Strategy Officer | ||
| Christine A. Morena |
54 | Executive Vice President of Human Resources | ||
| Michael Rodgers |
45 | Executive Vice President of Service Operations and Chief Information Officer | ||
| Robert T. Wallstrom |
44 | President, OFF 5TH and Group Senior Vice President | ||
| Kevin G. Wills |
44 | Executive Vice President of Finance and Chief Financial Officer | ||
Stephen I. Sadove was named Chief Executive Officer of the Company in January 2006 and assumed the additional role of Chairman of the Board of Directors in May 2007. Mr. Sadove joined the Company in January 2002 as Vice Chairman and assumed the additional responsibility of Chief Operating Officer in March 2004. Prior to joining the Company, Mr. Sadove served as Senior Vice President of Bristol-Myers Squibb and President of Bristol-Myers Squibb Worldwide Beauty Care from 1996 until January 2002. From 1991 until 1996, Mr. Sadove held various other executive positions with Bristol-Myers Squibb. From 1975 until 1991, Mr. Sadove held various positions of increasing responsibility with General Foods USA.
Ronald L. Frasch was named President and Chief Merchandising Officer of the Company in February 2007. Mr. Frasch joined SFA in January 2004, served in a non-executive capacity through November 2004, and held the post of Vice Chairman and Chief Merchant of SFA from November 2004 until January 2007. Prior to joining the Company, he served as Chairman and Chief Executive Officer of Neiman Marcus Group’s Bergdorf Goodman from April 2000 until January 2004. Prior to that, he held merchandising and executive posts with other companies including GFT USA, Escada USA, Neiman Marcus, and SFA.
Michael A. Brizel joined the Company in April 2007 and was named to the post of Executive Vice President and General Counsel in May 2007. Mr. Brizel served in a variety of positions of increasing responsibility with The Reader’s Digest Association, Inc. between 1989 and April 2007, including Senior Vice President and General Counsel, a position he assumed in 2002. Prior to Reader’s Digest, Mr. Brizel was a member of the legal department of General Foods Corporation from 1983 to 1989 and an associate with the New York law firm of Summit, Rovins and Feldesman (and its predecessors) from 1980 to 1983.
Jennifer S. de Winter was named Executive Vice President of Stores in June 2008. She joined Saks Fifth Avenue in 1995 and held various merchandising positions of increasing responsibility, including her most recent post of Group Senior Vice President and General Merchandise Manager of Fashion and Fine Jewelry, Watches, Women’s Shoes, Handbags, and Soft Accessories. Ms. de Winter began her retail career in 1983 at Macy’s, where she held various merchandising positions through 1995 including Vice President, Divisional Merchandise Manager.
13
Table of Contents
Marc J. Metrick was named Group Senior Vice President and Chief Strategy Officer of the Company in February 2007. Mr. Metrick joined the Company in June 1995 as an executive trainee. Beginning in June 1997, Mr. Metrick served in various planning roles, including Vice President – Merchandise Planning and Senior Vice President — Strategic Planning.
Christine A. Morena joined the Company in January 2007 as Executive Vice President of Human Resources. Ms. Morena spent her career from 1976 through 2006 with AT&T Inc., where she held various positions of increasing responsibility, including Senior Vice President of Human Resources for AT&T Corporation, a subsidiary of AT&T Inc.
Michael Rodgers was named Executive Vice President of Service Operations and Chief Information Officer for the Company in February 2008. Mr. Rodgers served as Executive Vice President of Information Technology, Operations and Credit for the Company from May 2007 through January 2008. Mr. Rodgers joined McRae’s, Inc. (acquired by the Company in 1994) in 1993 as Director of Credit. He was promoted to Vice President of Credit for the Company in 1996 and to Senior Vice President of Credit in 1997, a position he held until 2002. Mr. Rodgers served as Executive Vice President of Operations from 2002 until April 2007. Prior to joining the Company, he held credit management positions with Boscov’s and Woodward & Lothrop.
Robert T. Wallstrom was named President, OFF 5TH and Group Senior Vice President of the Company in February 2007. Mr. Wallstrom joined the Company in June 1995 and has held various leadership positions since that time, including Senior Vice President and General Manager of the SFA flagship store in New York City. Prior to joining the Company, he was a store manager for Macy’s/Bullocks.
Kevin G. Wills was named Executive Vice President and Chief Financial Officer of the Company in May 2007. Mr. Wills served as Executive Vice President of Finance and Chief Accounting Officer from May 2005 until May 2007. He joined the Company in September 1997 and has served in the following capacities: Vice President of Financial Reporting from September 1997 to August 1998; Senior Vice President of Strategic Planning from September 1998 to August 1999; Senior Vice President of Planning and Administration of Saks Department Store Group from September 1999 to January 2003; and Executive Vice President of Operations for Parisian from February 2003 to May 2005. Prior to joining the Company, Mr. Wills was Vice President and Controller for the Tennessee Valley Authority and before that, he was an audit manager with Coopers and Lybrand (now PricewaterhouseCoopers LLP).
14
Table of Contents
The name, current position held and place of employment for each of the directors of the Company are set forth below.
| Name |
Current Position and Place of Employment | |
| Robert B. Carter |
Executive Vice President, FedEx Information Systems and Chief Information Officer, FedEx Corporation | |
| Ronald de Waal |
Chairman, WE International, B.V. | |
| Michael S. Gross |
Chairman, Chief Executive Officer and Managing Member, Solar Capital LLC | |
| Donald E. Hess |
Chief Executive Officer, Southwood Partners | |
| Marguerite W. Kondracke |
President and Chief Executive Officer, America’s Promise – The Alliance for Youth | |
| Jerry W. Levin |
Chairman, JW Levin Partners LLC and Chairman and Chief Executive Officer, Wilton Brands Inc. | |
| Nora P. McAniff |
Treasurer and Member of the Executive Committee, Social Venture Partners of Santa Barbara and formerly, Chief Operating Officer, Time, Inc. | |
| C. Warren Neel |
Executive Director, Center for Corporate Governance at the University of Tennessee, Knoxville and Interim President, Lincoln Memorial University | |
| Christopher J. Stadler |
Managing Partner, CVC Capital Partners | |
| Stephen I. Sadove |
Chairman of the Board and Chief Executive Officer, Saks Incorporated | |
The Company currently operates two principal distribution facilities as follows:
| Company Stores Served |
Location of Facility | Square Feet | Owned/Leased | |||
| SFA, OFF 5TH and Saks Direct |
Aberdeen, Maryland | 514,000 | Leased | |||
| SFA and OFF 5TH |
Ontario, California | 120,000 | Leased |
The Company’s principal administrative offices are as follows:
| Office |
Location of Facility | Square Feet | Owned/Leased | |||
| Corporate Operations Center |
Jackson, Mississippi | 272,000 | Owned | |||
| Corporate Office Headquarters and SFA Offices |
New York, New York | 298,000 | Leased |
The majority of the SFA stores and one OFF 5TH store are owned or owned buildings on leased land. All other SFA and OFF 5TH stores are leased. Store leases generally require the Company to pay a fixed minimum rent and a variable amount based on a percentage of annual sales at that location. Generally, the Company is responsible under its store leases for a portion of mall promotion and common area maintenance expenses and for certain utility, property tax, and insurance expenses. Generally, store leases have initial terms ranging from 20 to 30 years and include renewal options ranging from 5 to 20 years. OFF 5TH leases typically have shorter terms.
15
Table of Contents
The following tables set forth information about the Company’s stores as of January 30, 2010:
| Owned Locations* | Leased Locations | Total | ||||||||||
| Number Of Units |
Gross Square Feet (in mil.) |
Number Of Units |
Gross Square Feet (in mil.) |
Number Of Units |
Gross Square Feet (in mil.) | |||||||
| SFA |
29 | 3.9 | 24 | 2.0 | 53 | 5.9 | ||||||
| OFF 5TH |
1 | 0.1 | 54 | 1.5 | 55 | 1.6 | ||||||
| Total |
30 | 4.0 | 78 | 3.5 | 108 | 7.5 | ||||||
| * | Owned locations include owned stores and owned buildings on leased land. |
| Number of Stores |
Owned Stores |
Leased Stores |
Owned Building on Leased Land | |||||
| Alabama |
1 | 1 | — | — | ||||
| Arizona |
3 | — | 3 | — | ||||
| California |
16 | 1 | 14 | 1 | ||||
| Colorado |
3 | — | 2 | 1 | ||||
| Connecticut |
3 | — | 2 | 1 | ||||
| Florida |
17 | — | 14 | 3 | ||||
| Georgia |
3 | — | 2 | 1 | ||||
| Hawaii |
1 | — | 1 | — | ||||
| Illinois |
4 | — | 3 | 1 | ||||
| Indiana |
1 | — | 1 | — | ||||
| Louisiana |
1 | — | 1 | — | ||||
| Massachusetts |
2 | — | 2 | — | ||||
| Maryland |
2 | — | 1 | 1 | ||||
| Michigan |
2 | 1 | 1 | — | ||||
| Minnesota |
1 | — | — | 1 | ||||
| Missouri |
1 | — | — | 1 | ||||
| North Carolina |
3 | 1 | 2 | — | ||||
| New Jersey |
4 | — | 3 | 1 | ||||
| New York |
8 | 1 | 6 | 1 | ||||
| Nevada |
3 | — | 2 | 1 | ||||
| Ohio |
5 | 1 | 2 | 2 | ||||
| Oklahoma |
1 | — | — | 1 | ||||
| Oregon |
1 | — | — | 1 | ||||
| Pennsylvania |
3 | — | 3 | — | ||||
| South Carolina |
2 | — | 2 | — | ||||
| Tennessee |
1 | — | 1 | — | ||||
| Texas |
12 | 1 | 8 | 3 | ||||
| Virginia |
4 | 2 | 2 | — | ||||
| Total |
108 | 9 | 78 | 21 | ||||
16
Table of Contents
Store count activity for the year ended January 30, 2010 was as follows:
| SFA | OFF 5TH |
Total | ||||
| Store count as of January 31, 2009 |
53 | 51 | 104 | |||
| New stores opened |
0 | 4 | 4 | |||
| Stores closed |
0 | 0 | 0 | |||
| Store count as of January 30, 2010 |
53 | 55 | 108 | |||
Additionally, two OFF 5TH stores were replaced during the year ended January 30, 2010.
The Company is involved in legal proceedings arising from its normal business activities and has accruals for losses where appropriate. Management believes that none of these legal proceedings will have a material adverse effect on the Company’s consolidated financial position, results of operations, or liquidity.
17
Table of Contents
PART II
| Item 5. | Market for Registrant’s Common Equity, Related Stockholder Matters and Issuer Purchases of Equity Securities. |
Market Information
The Company’s common stock trades on the New York Stock Exchange (“NYSE”) under the symbol SKS. The prices in the table below represent the high and low sales prices for the stock as reported by the NYSE.
| Year Ended January 30, 2010 |
Year Ended January 31, 2009 | |||||||||||
| High | Low | High | Low | |||||||||
| First Quarter |
$ | 5.40 | $ | 1.50 | $ | 18.36 | $ | 11.04 | ||||
| Second Quarter |
$ | 5.54 | $ | 3.25 | $ | 14.58 | $ | 9.15 | ||||
| Third Quarter |
$ | 7.45 | $ | 5.11 | $ | 12.25 | $ | 4.81 | ||||
| Fourth Quarter |
$ | 7.72 | $ | 5.37 | $ | 6.16 | $ | 2.25 | ||||
Holders
As of March 12, 2010, there were approximately 2,325 shareholders of record of the Company’s common stock.
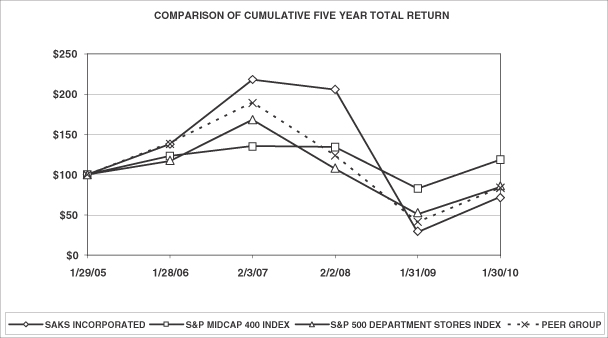
Performance Graph
The following graph and table compare cumulative total shareholder return among the Company, the S&P Midcap 400 Index, the S&P 500 Department Stores Index, and a Retail Peer Group Index (weighted by market capitalization and consisting of Dillard’s, Inc.; Macy’s, Inc.; Nordstrom, Inc.; and J.C. Penney Company, Inc.) assuming an initial investment of $100 and reinvestment of dividends.
18
Table of Contents
| Description |
Starting Basis 1/29/05 |
1/28/06 | 2/3/07 | 2/2/08 | 1/31/09 | 1/30/10 | ||||||||||||
| Saks Incorporated |
$ | 100.00 | $ | 137.75 | $ | 217.71 | $ | 205.39 | $ | 28.22 | $ | 72.12 | ||||||
| S&P Midcap 400 |
$ | 100.00 | $ | 123.18 | $ | 135.57 | $ | 134.06 | $ | 82.57 | $ | 118.37 | ||||||
| S&P 500 Department Stores |
$ | 100.00 | $ | 116.76 | $ | 167.93 | $ | 107.22 | $ | 50.65 | $ | 84.67 | ||||||
| Retail Peer Group |
$ | 100.00 | $ | 139.52 | $ | 189.41 | $ | 123.72 | $ | 41.20 | $ | 83.52 | ||||||
This “Performance Graph” section shall not be deemed to be “soliciting material” or to be “filed” with the SEC or subject to Regulation 14A or 14C or to the liabilities of Section 18 of the Securities Exchange Act of 1934, as amended (the “Exchange Act”).
Dividends
During the fiscal years ended January 30, 2010 and January 31, 2009, the Company did not declare any dividends. Future dividends, if any, will be determined by the Company’s Board of Directors in light of circumstances then existing, including earnings, financial requirements, and general business conditions. The Company does not anticipate declaring dividends in the foreseeable future.
Purchases of Equity Securities by the Issuer and Affiliated Purchasers
The Company has a share repurchase program that authorizes it to purchase shares of the Company’s common stock. The Company did not repurchase any shares of common stock during 2009. The Company has remaining availability of approximately 32.7 million shares under its 70 million authorized share repurchase program.
Securities Authorized for Issuance under Equity Compensation Plans
The following table provides equity compensation plan information for all plans approved and not approved by the Company’s shareholders, as of January 30, 2010:
| Plan Category (1) |
Number of securities to be issued upon exercise of outstanding options, warrants and rights (#) (a) |
Weighted-average exercise price of outstanding options, warrants and rights ($) (b) |
Number of securities remaining available for future issuance under equity compensation plans (excluding securities in column (a)) (2) (c) | ||||
| Equity compensation plans approved by security holders |
2,016,731 | $ | 11.37 | 6,027,589 | |||
| Equity compensation plans not approved by security holders (3) |
257,235 | $ | 6.43 | — | |||
| Total |
2,273,966 | $ | 10.81 | 6,027,589 | |||
| (1) | In connection with the acquisition of its former Parisian business, the Company assumed then-outstanding stock options previously granted to employees and directors of the acquired corporation. No additional grants or awards may be made under the plan pursuant to which these stock options were granted. As of January 30, 2010, the total number of shares of Common Stock to be issued upon exercise of these stock options was 34,707 and the weighted-average exercise price of these stock options was $6.54. These stock options are not included in the table. |
| (2) | This amount represents shares of Common Stock available for issuance under the 2009 Incentive Plan. Awards available for grant under the 2009 Incentive Plan include options, stock appreciation rights, restricted stock, performance units, and any combination of the foregoing awards. |
19
Table of Contents
| (3) | On April 9, 1997, the Board approved the Company’s 1997 Stock-Based Incentive Plan (the “1997 Plan”) to assist in attracting, retaining, and motivating employees and directors. The Board amended the 1997 Plan several times. The exercise price for all outstanding options awarded under the 1997 Plan equals the fair market value of the Common Stock on the date of grant. Most options vest in five installments over four years and expire after seven or ten years. Unvested options generally are forfeited if the executive’s employment is terminated. In the event of a change in control or a potential change in control, the Board of Directors may accelerate awards under the 1997 Plan or provide that such awards be cashed out in connection with the transaction. As of January 30, 2010, under the 1997 Plan, there were (i) options outstanding to purchase 257,235 shares, (ii) 14,000 shares of restricted stock outstanding and unvested, and (iii) no shares remaining available for issuance. |
20
Table of Contents
Item 6. Selected Financial Data.
The selected financial data set forth below should be read in conjunction with Management’s Discussion and Analysis of Financial Condition and Results of Operations, the Company’s Consolidated Financial Statements and notes thereto and the other information contained elsewhere in this Form 10-K.
| Year Ended | ||||||||||||||||||||
| (IN THOUSANDS, EXCEPT PER SHARE AMOUNTS) |
January 30, 2010 |
January 31, 2009 (Revised)** |
February 2, 2008 (Revised)** |
February 3, 2007* (Revised)** |
January 28, 2006 (Revised)** |
|||||||||||||||
| CONSOLIDATED INCOME STATEMENT DATA: |
||||||||||||||||||||
| Net sales |
$ | 2,631,532 | $ | 3,043,438 | $ | 3,237,275 | $ | 2,900,383 | $ | 2,741,295 | ||||||||||
| Cost of sales (excluding depreciation and amortization) |
1,668,097 | 2,062,494 | 1,972,251 | 1,780,127 | 1,731,142 | |||||||||||||||
| Gross margin |
963,435 | 980,944 | 1,265,024 | 1,120,256 | 1,010,153 | |||||||||||||||
| Selling, general and administrative expenses |
674,306 | 784,510 | 840,823 | 811,248 | 822,188 | |||||||||||||||
| Other operating expenses |
314,266 | 320,683 | 317,046 | 312,486 | 317,760 | |||||||||||||||
| Impairments and dispositions |
29,348 | 11,139 | 4,279 | 11,775 | (8,349 | ) | ||||||||||||||
| Operating income (loss) |
(54,485 | ) | (135,388 | ) | 102,876 | (15,253 | ) | (121,446 | ) | |||||||||||
| Interest expense |
(49,480 | ) | (45,739 | ) | (48,303 | ) | (55,693 | ) | (82,539 | ) | ||||||||||
| Gain (loss) on extinguishment of debt |
783 | — | (5,634 | ) | 7 | (29,375 | ) | |||||||||||||
| Other income, net |
1,019 | 5,600 | 24,912 | 28,407 | 7,705 | |||||||||||||||
| Income (loss) from continuing operations before income taxes |
(102,163 | ) | (175,527 | ) | 73,851 | (42,532 | ) | (225,655 | ) | |||||||||||
| Provision (benefit) for income taxes |
(44,501 | ) | (48,902 | ) | 26,755 | (34,947 | ) | (92,062 | ) | |||||||||||
| Income (loss) from continuing operations |
(57,662 | ) | (126,625 | ) | 47,096 | (7,585 | ) | (133,593 | ) | |||||||||||
| Discontinued operations: |
||||||||||||||||||||
| Income (loss) from discontinued operations before income taxes |
(395 | ) | (52,727 | ) | (4,860 | ) | 188,227 | 314,943 | ||||||||||||
| Provision (benefit) for income taxes |
(138 | ) | (20,548 | ) | (1,646 | ) | 130,536 | 163,241 | ||||||||||||
| Income (loss) from discontinued operations |
(257 | ) | (32,179 | ) | (3,214 | ) | 57,691 | 151,702 | ||||||||||||
| Net Income (loss) |
$ | (57,919 | ) | $ | (158,804 | ) | $ | 43,882 | $ | 50,106 | $ | 18,109 | ||||||||
| Basic earnings per common share: |
||||||||||||||||||||
| Income (loss) from continuing operations |
$ | (.40 | ) | $ | (.93 | ) | $ | .33 | $ | (.06 | ) | $ | (.97 | ) | ||||||
| Income (loss) from discontinued operations |
$ | — | $ | (.23 | ) | $ | (.02 | ) | $ | .43 | $ | 1.10 | ||||||||
| Net income (loss) |
$ | (.40 | ) | $ | (1.15 | ) | $ | .31 | $ | .37 | $ | .13 | ||||||||
| Diluted earnings per common share: |
||||||||||||||||||||
| Income (loss) from continuing operations |
$ | (.40 | ) | $ | (.92 | ) | $ | .31 | $ | (.06 | ) | $ | (.97 | ) | ||||||
| Income (loss) from discontinued operations |
$ | — | $ | (.23 | ) | $ | (.02 | ) | $ | .43 | $ | 1.10 | ||||||||
| Net income (loss) |
$ | (.40 | ) | $ | (1.15 | ) | $ | .29 | $ | .37 | $ | .13 | ||||||||
| Weighted average common shares: |
||||||||||||||||||||
| Basic |
143,194 | 138,384 | 140,402 | 135,880 | 138,348 | |||||||||||||||
| Diluted |
143,194 | 138,384 | 153,530 | 135,880 | 138,348 | |||||||||||||||
| CONSOLIDATED BALANCE SHEET DATA: |
||||||||||||||||||||
| Working capital |
$ | 546,169 | $ | 503,952 | $ | 345,097 | $ | 388,061 | $ | 799,601 | ||||||||||
| Total assets |
$ | 2,135,701 | $ | 2,147,677 | $ | 2,350,744 | $ | 2,521,211 | $ | 3,825,247 | ||||||||||
| Long-term debt, less current portion |
$ | 493,330 | $ | 593,103 | $ | 204,238 | $ | 394,498 | $ | 661,202 | ||||||||||
| Shareholders' equity |
$ | 1,071,610 | $ | 990,586 | $ | 1,204,434 | $ | 1,128,559 | $ | 2,035,439 | ||||||||||
| Cash dividends (per share) |
$ | — | $ | — | $ | — | $ | 8.00 | $ | — | ||||||||||
| * | The year ended February 3, 2007 includes an extra week, creating a 53-week fiscal year that occurs every six years in the accounting cycle. |
| ** | Prior year amounts have been revised to reflect the retrospective application of adopting a new accounting pronouncement relating to convertible debt. Amounts have also been revised to reflect all shipping and handling revenue in Net Sales. See Note 2 to the consolidated financial statements for further discussion. |
21
Table of Contents
Item 7. Management’s Discussion and Analysis of Financial Condition and Results of Operations.
Management’s Discussion and Analysis (“MD&A”) is intended to provide an analytical view of the business from management’s perspective of operating the business and is considered to have these major components:
| • | Overview |
| • | Results of Operations |
| • | Liquidity and Capital Resources |
| • | Critical Accounting Policies |
MD&A should be read in conjunction with the consolidated financial statements and related notes thereto contained elsewhere in this Form 10-K.
OVERVIEW
GENERAL
The operations of Saks Incorporated, a Tennessee corporation first incorporated in 1919, and its subsidiaries (together the “Company”) consist of Saks Fifth Avenue (“SFA”), Saks Fifth Avenue OFF 5TH (“OFF 5TH”), and SFA’s e-commerce operations. Previously, the Company also operated Club Libby Lu (“CLL”), the operations of which were discontinued in January 2009. The operations of CLL are presented as discontinued operations in the Consolidated Statements of Income and the Consolidated Statements of Cash Flows for the current and prior year periods and are discussed below in “Discontinued Operations.”
The Company is primarily a fashion retail organization offering a wide assortment of distinctive luxury fashion apparel, shoes, accessories, jewelry, cosmetics, and gifts. SFA stores are principally free-standing stores in exclusive shopping destinations or anchor stores in upscale regional malls. Customers may also purchase SFA products by catalog or online at www.saks.com. OFF 5TH is intended to be the premier luxury off-price retailer in the United States. OFF 5TH stores are primarily located in upscale mixed-use and off-price centers and offer luxury apparel, shoes, and accessories, targeting the value-conscious customer. As of January 30, 2010, the Company operated 53 SFA stores with a total of approximately 5.9 million square feet and 55 OFF 5TH stores with a total of approximately 1.6 million square feet.
The Company is primarily focused on the luxury retail sector. All of the goods that the Company sells are discretionary items. Consequently, a downturn in the economy or difficult economic conditions may result in fewer customers shopping in the Company’s stores or online. In response, the Company may have to increase the duration and/or frequency of promotional events and offer larger discounts in order to attract customers, which would reduce gross margin and adversely affect results of operations.
The Company continues to make targeted investments in key areas to improve customer service and enhance merchandise assortment and allocation effectiveness. In addition, strategic investments are being made to remodel existing selling space with a heightened focus on return on investment. The Company believes that its long-term strategic plans can deliver additional operating margin expansion in future years.
The Company seeks to create value for its shareholders by improving returns on its invested capital. The Company attempts to generate improved operating margins by generating sales increases while improving merchandising margins and controlling expenses. The Company uses operating cash flows to reinvest in the business and to repurchase debt or equity. The Company actively manages its real estate portfolio by routinely evaluating opportunities to improve or close underproductive stores and open new stores.
22
Table of Contents
DISCONTINUED OPERATIONS
As of January 31, 2009, the Company discontinued the operations of its CLL business, which consisted of 98 leased, mall-based specialty stores, targeting girls aged 4-12 years old. Charges incurred during 2008 associated with the closing of these stores totaled approximately $44.5 million and included inventory liquidation costs of approximately $7.0 million, asset impairment charges of $17.0 million, lease termination costs of $14.0 million, severance and personnel related costs of $5.1 million, and other closing costs of $1.4 million. These amounts are included in discontinued operations in the Consolidated Statement of Income and the Consolidated Statement of Cash Flows for fiscal year 2008. The remaining amount payable related to the disposition of the CLL business as of January 30, 2010 is $0.7 million and is expected to be paid during the year ending January 29, 2011.
SAKS FIFTH AVENUE NEW ORLEANS STORE
In late August 2005, the SFA store in New Orleans suffered substantial water, fire, and other damage related to Hurricane Katrina. The Company reopened the store in the fourth fiscal quarter of 2006 after necessary repairs and renovations were made to the property.
The SFA New Orleans store was covered by both property damage and business interruption insurance. The property damage coverage paid to repair and/or replace the physical property damage and inventory loss, and the business interruption coverage reimbursed the Company for lost profits as well as continuing expenses related to loss mitigation, recovery, and reconstruction for the full duration of the reconstruction period plus three months. The Company recorded in 2005 both (i) a $14.7 million gain on the excess of the replacement insurance value over the recorded net book value of the lost and damaged assets and (ii) $2.6 million of expenses related to the insurance deductible. In 2006, the Company recorded an adjustment (credit) of $1.6 million related to the insurance deductible. In 2007, the Company recorded a pre-tax gain of $13.5 million associated with the proceeds from the business interruption claims.
FINANCIAL PERFORMANCE SUMMARY
On a consolidated basis, total net sales and comparable store sales for the year ended January 30, 2010 decreased 13.5% and 14.7%, respectively. The Company recorded a loss from continuing operations of $57.7 million, or $0.40 per share compared to a loss from continuing operations of $126.6 million, or $0.92 per share, for the years ended January 30, 2010 and January 31, 2009, respectively. After recognition of the Company’s after-tax loss from discontinued operations of $0.3 million, net loss totaled $57.9 million, or $0.40 per share for the year ended January 30, 2010. After recognition of the Company’s after-tax loss from discontinued operations of $32.2 million, or $0.23 per share, net loss totaled $158.8 million, or $1.15 per share for the year ended January 31, 2009.
The year ended January 30, 2010 included net after tax charges totaling $10.4 million or $0.07 per share, primarily related to $17.3 million or $0.12 per share of asset impairment charges incurred in the normal course of business and a $3.1 million or $0.02 per share non-cash pension charge related to excess lump sum distributions during 2009 primarily resulting from the Company’s 2009 reductions-in-force. The year ended January 30, 2010 also included a net gain of $10.0 million or $0.07 per share, related to federal and state tax adjustments.
The year ended January 31, 2009 included net after-tax charges totaling $26.2 million or $0.19 per share, primarily related to $7.0 million or $0.05 per share of asset impairment charges incurred in the normal course of business and approximately $6.7 million or $0.05 per share of severance costs related to the Company’s 2008 downsizing initiative and the Ft. Lauderdale store closing. The year ended January 31, 2009 also included a write-off and adjustment of $14.6 million or $0.11 per share of certain deferred tax assets primarily associated with federal net operating loss (“NOL”) tax credits that expired at the end of fiscal 2008. These expenses were partially offset by a net gain of $2.1 million or $0.02 per share related to the sale of three unutilized properties.
23
Table of Contents
The year ended February 2, 2008 included net after-tax charges totaling $16.0 million, or $0.10 per share, primarily related to $18.1 million, or $0.12 per share, for retention, severance, and transition costs related to the Company’s downsizing and consolidation following the disposition of its Saks Department Store Group (“SDSG”) businesses. Additionally, legal and investigation costs totaled $3.7 million, or $.02 per share, associated with the previously disclosed investigation by the SEC (which has been concluded) and the investigation by the Office of the United States Attorney for the Southern District of New York as well as the settlement of two related vendor lawsuits. The year ended February 2, 2008 also included a loss on extinguishment of debt totaling $3.4 million or $.02 per share, related to the repurchase of $106.3 million of senior notes, $2.7 million, or $.02 per share, related to asset impairments and dispositions, and $0.8 million expense related to a state tax adjustment. These expenses were partially offset by an insurance adjustment (credit) of $8.1 million, or $0.05 per share, related to the New Orleans Store, as well as a gain of $1.6 million, or $.01 per share, related to an OFF 5TH store closing and the sale of an unused support facility. Lastly, there was a $3.0 million, or $.02 per share, state income tax valuation adjustment (credit).
During the preparation of our condensed consolidated financial statements for the quarterly period ended October 31, 2009, the Company identified a classification error in our Consolidated Statements of Income for the year ended January 31, 2009 and prior periods and the quarterly periods therein. The Company improperly included certain shipping and handling revenue in selling, general and administrative expenses (“SG&A”). The Company corrected this error in the Consolidated Statements of Income by adjusting Net Sales and SG&A to reflect all shipping and handling revenue in Net Sales for all prior periods presented.
Effective February 1, 2009, the Company retrospectively adopted Financial Accounting Standards Board (“FASB”) Accounting Standards Codification (“ASC”) 470 related to accounting for convertible debt instruments that may be settled in cash upon conversion (including partial cash settlement) (“ASC 470”), which requires an allocation of convertible debt proceeds between the liability component and the embedded conversion option (i.e., the equity component). The liability component of the debt instrument is accreted to par value using the effective interest method over the remaining life of the debt. The accretion is reported as a component of interest expense. The equity component is not subsequently revalued as long as it continues to qualify for equity treatment.
The Company believes that an understanding of its reported financial condition and results of operations is not complete without considering the effect of all other components of MD&A included herein.
24
Table of Contents
RESULTS OF OPERATIONS
The following table sets forth, for the periods indicated, selected items from the Company’s Consolidated Statements of Income, expressed as percentages of net sales (numbers may not total due to rounding):
| Year Ended | |||||||||
| January 30, 2010 |
January 31, 2009 (Revised) |
February 2, 2008 (Revised) |
|||||||
| Net sales |
100 | % | 100 | % | 100 | % | |||
| Cost of sales (excluding depreciation and amortization) |
63.4 | 67.8 | 60.9 | ||||||
| Gross margin |
36.6 | 32.2 | 39.1 | ||||||
| Selling, general and administrative expenses |
25.6 | 25.8 | 26.0 | ||||||
| Other operating expenses |
12.0 | 10.5 | 9.8 | ||||||
| Impairments and dispositions |
1.1 | 0.4 | 0.1 | ||||||
| Operating income (loss) |
(2.1 | ) | (4.4 | ) | 3.2 | ||||
| Interest expense |
(1.9 | ) | (1.5 | ) | (1.5 | ) | |||
| Gain (loss) on extinguishment of debt |
0.0 | 0.0 | (0.2 | ) | |||||
| Other income, net |
0.0 | 0.2 | 0.8 | ||||||
| Income (loss) from continuing operations before income taxes |
(3.9 | ) | (5.8 | ) | 2.3 | ||||
| Provision (benefit) for income taxes |
(1.7 | ) | (1.6 | ) | 0.8 | ||||
| Income (loss) from continuing operations |
(2.2 | ) | (4.2 | ) | 1.5 | ||||
| Discontinued operations: |
|||||||||
| Loss from discontinued operations |
(0.0 | ) | (1.7 | ) | (0.2 | ) | |||
| Benefit for income taxes |
(0.0 | ) | (0.7 | ) | (0.1 | ) | |||
| Loss from discontinued operations |
(0.0 | ) | (1.1 | ) | (0.1 | ) | |||
| Net income (loss) |
(2.2 | )% | (5.2 | )% | 1.4 | % | |||
FISCAL YEAR ENDED JANUARY 30, 2010 (“2009”) COMPARED TO FISCAL YEAR ENDED JANUARY 31, 2009 (“2008”)
DISCUSSION OF OPERATING LOSS — CONTINUING OPERATIONS
The following table shows the changes in operating loss from 2008 to 2009:
| (In Millions) |
Total Company |
|||
| 2008 Operating Loss—Continuing Operations |
$ | (135.4 | ) | |
| Store sales and margin |
(17.5 | ) | ||
| Operating expenses |
116.6 | |||
| Impairments and dispositions |
(18.2 | ) | ||
| Change |
80.9 | |||
| 2009 Operating Loss—Continuing Operations |
$ | (54.5 | ) | |
For the year ended January 30, 2010, the Company’s operating loss totaled $54.5 million, a 240 basis point improvement as a percentage of net sales from the operating loss of $135.4 million in the same period last year. The current operating loss was driven by a 14.7% decrease in comparable store sales partially offset by a gross margin rate increase of 440 basis points for the year ended January 30, 2010. The increase in the gross margin
25
Table of Contents
rate was principally due to fewer markdowns in the fourth quarter of 2009 compared to the aggressive markdowns taken in the fourth quarter of 2008 when the Company initiated promotional activities in an effort to stimulate consumer demand and reduce inventory levels. In addition, the Company achieved SG&A expense leverage of 20 basis points in 2009 despite a year-over-year sales decrease of $411.9 million.
NET SALES
For the year ended January 30, 2010, total sales decreased 13.5% to $2,631.5 million from $3,043.4 million for the year ended January 31, 2009. Consolidated comparable store sales decreased $440.6 million, or 14.7% from $2,987.3 million for the year ended January 31, 2009 to $2,546.7 million for the year ended January 30, 2010.
Comparable store sales are calculated on a rolling 13-month basis. Thus, to be included in the comparison, a store must be open for 13 months. The additional month is used to transition the first month impact of a new store opening. Correspondingly, closed stores are removed from the comparable store sales comparison when they begin liquidating merchandise. Expanded, remodeled, converted, and re-branded stores are included in the comparable store sales comparison, except for the periods in which they are closed for remodeling and renovation.
GROSS MARGIN
For the year ended January 30, 2010, gross margin was $963.4 million, or 36.6% of net sales, compared to $980.9 million, or 32.2% of net sales, for the year ended January 31, 2009. The increase in gross margin dollars and gross margin rate was primarily the result of controlled inventory levels and a more disciplined promotional and clearance cadence during the current year. In 2008, gross margin was negatively impacted by aggressive markdowns as the Company reacted to the rapidly deteriorating economic conditions and worked to clear excess inventory.
SELLING, GENERAL AND ADMINISTRATIVE EXPENSES
For the year ended January 30, 2010, SG&A was $674.3 million, or 25.6% of net sales, compared to $784.5 million, or 25.8% of net sales, for the year ended January 31, 2009. The decrease of $110.2 million in expenses was primarily driven by lower variable expenses associated with the year-over-year sales decrease of $411.9 million, as well as other cost savings initiatives implemented by the Company. As a percentage of sales, SG&A decreased by 20 basis points over the prior year.
Amounts received from vendors in conjunction with compensation programs and cooperative advertising were consistent with the related gross compensation and cooperative advertising expenditures and therefore had no significant impact on SG&A expense, in dollars or as a percentage of net sales.
OTHER OPERATING EXPENSES
For the year ended January 30, 2010, other operating expenses were $314.3 million, or 12% of net sales, compared to $320.7 million, or 10.5% of net sales, for the year ended January 31, 2009. The decrease of $6.4 million was principally driven by a decrease in taxes other than income taxes of $7.3 million due to a decrease in payroll taxes primarily related to the Company’s reduction in force in January 2009 and a decrease in store pre-opening costs of $0.3 million. These decreases were partially offset by higher depreciation and amortization expense of $0.5 million and higher property and equipment rentals of $0.7 million.
26
Table of Contents
IMPAIRMENTS AND DISPOSITIONS
For the year ended January 30, 2010, the Company recognized net charges from impairments and dispositions of $29.3 million compared to net charges of $11.1 million for the year ended January 31, 2009. The current and prior year charges were primarily due to asset impairments in the normal course of business.
INTEREST EXPENSE
Interest expense increased to $49.5 million in 2009 from $45.7 million in 2008 and, as a percentage of net sales, was 1.9% in 2009 and 1.5% in 2008. The increase of $3.8 million was primarily due to the issuance of $120.0 million of convertible notes in May 2009 and the amortization of financing costs associated with these notes and the amended revolving credit facility offset in part by the extinguishment of $23.0 million of senior notes in July 2009 and the retirement of $84.1 million in principal amount of senior notes which matured in November 2008. Noncash interest expense associated with the adoption ASC 470 related to accounting for convertible debt instruments that may be settled in cash upon conversion (including partial cash settlement) was $9.8 million and $6.8 million for the years ended January 30, 2010 and January 31, 2009, respectively.
GAIN ON EXTINGUISHMENT OF DEBT
During the year ended January 30, 2010, the Company extinguished approximately $23.0 million of senior notes. The repurchase of these notes resulted in a gain on extinguishment of debt of $0.8 million. There were no such gains recorded during the year ended January 31, 2009.
OTHER INCOME, NET
Other income decreased to $1.0 million in 2009 from $5.6 million in 2008. Other income in 2009 is primarily attributable to interest income. Other income in 2008 included a $3.4 million gain on the sale of three unutilized properties.
INCOME TAXES
For 2009 and 2008, the effective income tax rate for continuing operations differs from the federal statutory tax rate due to state income taxes and other items such as the change in the valuation allowance against state NOL carryforwards, the effect of concluding tax examinations and other tax reserve adjustments, the write-off of an expired federal NOL, and the change in the overall state tax rate. Including the effect of these items, the Company’s effective income tax rate for continuing operations was 43.6% and 27.9% in 2009 and 2008, respectively.
2008 COMPARED TO FISCAL YEAR ENDED FEBRUARY 2, 2008 (“2007”)
DISCUSSION OF OPERATING INCOME (LOSS) – CONTINUING OPERATIONS
The following table shows the changes in operating income (loss) from 2007 to 2008:
| (In Millions) |
Total |
|||
| 2007 Operating Income—Continuing Operations |
$ | 102.9 | ||
| Store sales and margin |
(284.1 | ) | ||
| Operating expenses |
52.7 | |||
| Impairments and dispositions |
(6.9 | ) | ||
| Change |
(238.3 | ) | ||
| 2008 Operating Loss—Continuing Operations |
$ | (135.4 | ) | |
27
Table of Contents
For the year ended January 31, 2009, the Company’s operating loss totaled $135.4 million, a 760 basis point decrease as a percentage of net sales from operating income of $102.9 million in the same period last year. Operating loss was driven by a 6.1% decrease in comparable store sales and a gross margin rate decline of 690 basis points for the year ended January 31, 2009. The decline in gross margin dollars and the gross margin rate was principally due to aggressive markdowns taken in the fourth quarter of 2008 as the Company initiated promotional activities in an effort to stimulate consumer demand and reduce inventory levels.
NET SALES
For the year ended January 31, 2009, total sales decreased 6.0% to $3,043.4 million from $3,237.3 million for the year ended February 2, 2008. Consolidated comparable store sales decreased $197.3 million, or 6.1%, from $3,211.7 million for the year ended February 2, 2008 to $3,014.4 million for the year ended January 31, 2009.
GROSS MARGIN
For the year ended January 31, 2009, gross margin was $980.9 million, or 32.2% of net sales, compared to $1,265.0 million, or 39.1% of net sales, for the year ended February 2, 2008. The decline in gross margin dollars and gross margin rate was primarily driven by aggressive markdowns as the Company reacted to the rapidly deteriorating economic conditions and worked to clear excess inventory.
SELLING, GENERAL AND ADMINISTRATIVE EXPENSES
For the year ended January 31, 2009, SG&A was $784.5 million, or 25.8% of net sales, compared to $840.8 million, or 26.0% of net sales, for the year ended February 2, 2008. The decrease of $56.3 million in expenses was primarily driven by lower variable expenses associated with the year-over-year sales decrease of $193.8 million, general expense reduction and a decrease in severance, retention, and transition costs of $19.6 million from the prior year. As a percentage of sales, SG&A decreased by 20 basis points over the prior year.
Amounts received from vendors in conjunction with compensation programs and cooperative advertising were consistent with the related gross compensation and cooperative advertising expenditures and therefore had no significant impact on SG&A expense, in dollars or as a percentage of net sales.
OTHER OPERATING EXPENSES
For the year ended January 31, 2009, other operating expenses were $320.7 million, or 10.6% of net sales, compared to $317.0 million, or 9.8% of net sales, for the year ended February 2, 2008. The increase of $3.7 million was principally driven by higher depreciation and amortization expense and property and equipment rentals of $3.0 million and $1.0 million, respectively and an increase in store pre-opening costs of $1.6 million. These increases were partially offset by a decrease in taxes other than income taxes of $1.9 million.
IMPAIRMENTS AND DISPOSITIONS
For the year ended January 31, 2009, the Company recognized net charges from impairments and dispositions of $11.1 million compared to charges of $4.3 million for the year ended February 2, 2008. The current and prior year net charges were primarily due to asset impairments in the normal course of business.
INTEREST EXPENSE
Interest expense decreased to $45.7 million in 2008 from $48.3 million in 2007 and, as a percentage of net sales, was 1.5% in 2008 and 2007. The decrease of $2.6 million was primarily due to lower interest rates due in
28
Table of Contents
part to utilizing the revolving credit facility to retire approximately $84.1 million in principal amount of senior notes which matured in November 2008. Noncash interest expense associated with the adoption of ASC 470 related to accounting for convertible debt instruments that may be settled in cash upon conversion (including partial cash settlement) was $6.8 million and $6.4 million for the years ended January 31, 2009 and February 2, 2008, respectively.
LOSS ON EXTINGUISHMENT OF DEBT
During the year ended February 2, 2008, the Company repurchased a total of approximately $106.3 million of senior notes. The repurchase of these notes resulted in a loss on extinguishment of debt of $5.6 million. There were no such losses recorded during the year ended January 31, 2009.
OTHER INCOME, NET
Other income decreased to $5.6 million in 2008 from $24.9 million in 2007. Other income in 2008 included a $3.4 million gain on the sale of three unutilized properties. Other income in 2007 included approximately $13.5 million of business interruption insurance settlement proceeds received for the SFA New Orleans store, which was destroyed in the aftermath of Hurricane Katrina, $6.2 million of interest income and $2.7 million related to an OFF 5TH store closing and the sale of an unused support facility.
INCOME TAXES
For 2008 and 2007, the effective income tax rate for continuing operations differs from the federal statutory tax rate due to state income taxes and other items such as executive compensation, tax-exempt interest, change in state tax law, the change in the valuation allowance against state NOL carryforwards, the effect of concluding tax examinations and other tax reserve adjustments, and the write-off of an expired federal NOL. Including the effect of these items, the Company’s effective income tax rate for continuing operations was 27.9% and 36.2% in 2008 and 2007, respectively.
LIQUIDITY AND CAPITAL RESOURCES
CASH FLOW
The primary needs for cash are to fund operations, acquire or construct new stores, renovate and expand existing stores, provide working capital for new and existing stores, invest in technology and distribution centers and service debt. The Company anticipates that cash on hand, cash generated from operating activities and borrowings under its revolving credit facility will be sufficient to sustain its current level of operations.
Cash provided by operating activities from continuing operations was $205.9 million in 2009, $17.2 million in 2008 and $67.4 million in 2007. The accompanying Consolidated Statements of Cash Flows identify major differences between net income (loss) and net cash provided by operating activities for each of those years. Cash provided by operating activities principally represents income before depreciation and non-cash charges and after changes in working capital. Working capital is significantly impacted by changes in inventory and accounts payable. Inventory levels typically increase or decrease to support expected sales levels, and accounts payable fluctuations are generally determined by the timing of merchandise purchases and payments. The $188.7 million increase in cash flows from continuing operations in 2009 from 2008 was primarily driven by the loss from continuing operations of $57.7 million in 2009 compared to a loss from continuing operations of $126.6 million in 2008 and a reduction in working capital needs as a result of reduced inventory purchases in line with the 14.7% decrease in comparable store sales. The $50.2 million decrease in cash flows from continuing operations in 2008 from 2007 was primarily driven by a loss from continuing operations of $126.6 million in 2008
29
Table of Contents
compared to income from continuing operations of $47.1 million in 2007 and a year-over-year decrease in accounts payable and accrued liabilities of approximately $114.6 million. This was partially offset by an inflow of cash resulting from a decrease in inventory of approximately $118.5 million.
Cash used in investing activities from continuing operations was $73.9 million in 2009, $123.0 million in 2008 and $124.4 million in 2007. Cash used in investing activities principally consists of construction of new stores and renovation and expansion of existing stores and investments in support areas (e.g., technology and distribution centers). The $49.1 million decrease in cash used in 2009 is primarily related to a decrease in capital expenditures of approximately $52.7 million, partially offset by a decrease in proceeds from the sale of property and equipment of approximately $3.7 million. The $1.4 million decrease in cash used in 2008 is primarily related to a decrease in capital expenditures of approximately $9.4 million, partially offset by a decrease in proceeds from the sale of property and equipment of approximately $8.0 million.
Cash provided by financing activities from continuing operations was $18.8 million and 2009 and $35.5 million in 2008. Cash used in financing activities from continuing operations was $119.6 million in 2007. The 2009 cash provided by financing activities relates to $120.0 million of proceeds from the issuance of the 7.5% convertible notes and $95.1 million of proceeds, net of issuance costs, from the issuance of 14.9 million shares of the Company’s common stock. These inflows were partially offset by the repayment of borrowings under the revolving credit facility of $156.7 million, the early extinguishment of $23.0 million of 7.5% senior notes due in December 2010, the payment of $13.1 million of deferred financing costs related to the 7.5% convertible notes and the amended revolving credit facility agreement, and the payment on capital lease obligations of $4.7 million. The 2008 cash provided by financing activities relates to proceeds of $156.7 million from the revolving credit facility and $4.1 million in proceeds from the issuance of common stock associated with stock option exercises partially offset by the repayments of long-term debt and capital lease obligations of approximately $89.2 million and $34.9 million of common stock repurchases. The 2007 use relates to the repurchase of approximately $106.3 million in principal amount of senior notes and $27.5 million of common stock repurchases partially offset by $34.3 million in proceeds from the issuance of common stock associated with stock option exercises.
During the year ended February 2, 2008, the Company repurchased approximately 1.7 million shares of its common stock at an average price of $15.95 and a total cost of approximately $27.5 million.
During the year ended January 31, 2009, the Company repurchased approximately 2.9 million shares of its common stock at an average price of $11.83 per share and a total cost of approximately $34.9 million.
During the year ended January 30, 2010, there were no repurchases of common stock. At January 30, 2010, there were 32.7 million shares remaining available for repurchase under the Company’s existing shares repurchase program.
CASH BALANCES AND LIQUIDITY
During 2009, the Company substantially strengthened its capital structure and enhanced future flexibility through a series of actions including a $120.0 million convertible debt offering, a $100.0 million common stock offering, the repurchase of $23.0 million of senior notes, and the extension of the maturity of its $500.0 million revolving credit agreement to 2013. The Company ended the fiscal year with no borrowings on its revolving credit facility, approximately $147.3 million of cash on hand, and approximately $22.9 million of current debt maturities. Based on these actions, the Company expects to have sufficient liquidity to fund operations in 2010.
The Company’s primary sources of short-term liquidity are cash on hand and availability under its revolving credit facility. In November 2009, the Company entered into an amended and restated revolving credit
30
Table of Contents
agreement. The maximum borrowing capacity of the amended facility remains at $500.0 million and the maturity date of the amended revolving credit agreement is November 2013. At January 30, 2010 and January 31, 2009, the Company maintained cash and cash equivalent balances of $147.3 million and $10.3 million, respectively. Exclusive of approximately $11.0 million and $10.0 million of store operating cash at January 30, 2010 and January 31, 2009, respectively, cash was invested principally in money market funds, demand deposits, and time deposits.
At January 30, 2010, the Company had no direct borrowings under its revolving credit facility, and had $28.5 million in unfunded letters of credit, which reduces the amount of borrowings under the facility. Borrowings are limited to a prescribed percentage of eligible inventories and receivables. There are no debt ratings-based provisions in the revolving credit facility. The facility includes a fixed-charge coverage ratio requirement of 1 to 1 that the Company is subject to only if availability under the facility becomes less than $87.5 million. The Company had availability under the facility of $289.0 million at January 30, 2010. The availability is based primarily on current levels of inventory, as well as the deduction for outstanding letters of credit at year end and excluding the last $87.5 million of availability due to the fixed charge ratio falling below the required 1 to 1 coverage. The amount of cash on hand and borrowings under the facility are influenced by a number of factors, including sales, inventory levels, vendor terms, the level of capital expenditures, cash requirements related to financing instruments, and the Company’s tax payment obligations, among others.
CAPITAL STRUCTURE
The Company continuously evaluates its debt-to-capitalization ratio in light of economic trends, business trends, levels of interest rates, and terms, conditions and availability of capital in the capital markets. At January 30, 2010, the Company’s capital and financing structure comprised a revolving credit agreement, senior unsecured notes, convertible senior unsecured notes, and capital and operating leases. At January 30, 2010, total funded debt (including the equity component of the convertible notes) was $575.7 million, representing a decrease of $64.4 million from the balance of $640.1 million at January 31, 2009. This decrease in debt was primarily the result of a decrease of $156.7 million in outstanding borrowings from the revolving credit facility, the extinguishment of $23.0 million of the 7.5% senior notes and principal payments of $4.7 million on capital lease obligations in 2009. These decreases were partially offset by the issuance of $120.0 million of 7.5% convertible notes during the second quarter of 2009. Additionally, the debt-to-capitalization ratio decreased to 36.1% in 2009, from 40.3% in 2008, primarily as a result of the decrease in debt in 2009 partially offset by the equity issuance in the second quarter of fiscal 2009.
Senior Revolving Credit Facility
At January 30, 2010, the Company maintained a senior revolving credit facility maturing in 2013, which is secured by inventory and certain third party credit card accounts receivable. Borrowings are limited to a prescribed percentage of eligible inventories and receivables. There are no debt ratings-based provisions in the revolving credit facility. The facility includes a fixed-charge coverage ratio requirement of 1 to 1 that the Company is subject to only if availability under the facility becomes less than $87.5 million. At January 30, 2010, the Company’s fixed charge coverage was below the 1 to 1 requirement; however, the Company is not subject to the fixed charge coverage ratio as its availability under the facility exceeds $87.5 million. The facility contains default provisions that are typical for this type of financing, including a provision that would trigger a default of the facility if a default were to occur in another debt instrument resulting in the acceleration of principal of more than $20 million in that other instrument. Borrowings under the facility bear interest at a per annum rate of either LIBOR plus a percentage ranging from 3.5% to 4.0%, or at the higher of the prime rate and federal funds rate plus a percentage ranging from 2.5% to 3.0%. Letters of credit are charged a per annum fee equal to the then applicable LIBOR borrowing spread (for standby letters of credit) or the applicable LIBOR spread minus 0.50% (for documentary or commercial letters of credit). The Company also pays an unused line fee ranging from 0.5% to 1.0% per annum on the average daily unused revolver.
31
Table of Contents
At January 30, 2010, the Company had no borrowings under the revolving credit facility. The senior revolving credit facility has a maximum capacity of $500 million.
Senior Notes
At January 30, 2010, the Company had $169.2 million of senior notes outstanding, excluding the convertible notes, comprising four separate series having maturities ranging from 2010 to 2019 and interest rates ranging from 7.00% to 9.88%. The terms of each senior note call for all principal to be repaid at maturity. The senior notes have substantially identical terms except for the maturity dates and interest rates payable to investors. Each senior note contains limitations on the amount of secured indebtedness the Company may incur.
On April 12, 2007, the Company announced the results of its modified “Dutch Auction” tender offer to purchase a portion of its 8.25% senior notes due November 15, 2008 for an aggregate purchase price not to exceed $100 million (the “offer cap”). The offer expired on April 11, 2007. The aggregate principal amount of notes validly tendered at or above the clearing spread exceeded the offer cap and the Company accepted $95.9 million aggregate principal amount of the notes, resulting in an aggregate purchase price of $100 million (plus an additional $3.2 million in aggregate accrued interest on such notes). The Company accepted for purchase first, all notes tendered at spreads above the clearing spread, and thereafter, the notes validly tendered at the clearing spread on a prorated basis according to the principal amount of such notes. During the three months ended May 5, 2007, the Company recorded a loss on extinguishment of approximately $5.2 million related to the repurchase of the notes.
During June and July 2007, the Company extinguished an additional $10.4 million in principal amount primarily relating to its 8.25% senior notes. The repurchase of these notes resulted in a loss on extinguishment of approximately $0.4 million. The remainder of the 8.25% notes were retired upon maturity on November 15, 2008.
During June and July 2009, the Company extinguished $23.0 million of its 7.5% senior notes that mature in December 2010. The repurchase of these notes resulted in a gain on extinguishment of debt of approximately $0.8 million.
7.5% Convertible Notes
At January 30, 2010, the Company had $120 million of convertible notes outstanding that bear cash interest semiannually at an annual rate of 7.5% and mature in 2013. The provisions of the convertible notes allow the holder to convert the notes at any time to shares of the Company’s common stock at a conversion rate of 180.5869 shares per one thousand dollars in principal amount of notes. The Company can settle a conversion with shares, cash; or a combination thereof at its discretion. During 2009, the Company received net proceeds from the convertible notes of approximately $115.3 million after deducting initial purchasers’ discounts and offering expenses. The Company used the net proceeds to pay down amounts outstanding under its revolving credit facility and for general corporate purposes.
On February 1, 2009, the Company adopted the provisions of ASC 470 related to accounting for convertible debt instruments that may be settled in cash upon conversion (including partial cash settlement), which specifies that issuers of such instruments should separately account for the liability and equity components in a manner that reflects the entity’s nonconvertible debt borrowing rate when interest cost is recognized in subsequent periods.
Upon issuance of the convertible notes, the Company estimated the fair value of the liability component of the 7.5% convertible notes, assuming a 13% non-convertible borrowing rate, to be $98.0 million. The difference
32
Table of Contents
between the fair value and the principal amount of the 7.5% convertible notes was $22.0 million. This amount was recorded as a debt discount and as an increase to additional paid-in capital as of the issuance date. The current unamortized discount of $19.4 million is being accreted to interest expense over the remaining 3.8 year period to the maturity date of the notes in December 2013 resulting in an increase in non-cash interest expense in future periods.
The convertible notes were classified within “long-term debt” on the Consolidated Balance Sheet as of January 30, 2010 because the Company can settle the principal amount of the notes with shares and/or cash.
2.0% Convertible Senior Notes
At January 30, 2010, the Company had $230 million of convertible senior notes outstanding that bear interest at a rate of 2.0% per annum and mature in 2024. The provisions of the convertible notes allow the holder to convert the notes to shares of the Company’s common stock at a conversion rate of 83.5609 shares per one thousand dollars in principal amount of notes (subject to an anti-dilution adjustment). The holder may put the debt back to the Company in 2014 or 2019 and the Company can call the debt on or after March 11, 2011. The Company can settle a conversion of the notes with shares, cash, or a combination thereof at its discretion. The holders may convert the notes at the following times, among others: if the Company’s share price is greater than 120% of the applicable conversion price for a certain trading period; if the credit ratings of the notes are below a certain threshold; or upon the occurrence of certain consolidations, mergers or share exchange transactions involving the Company. At January 30, 2010, the conversion criteria with respect to the credit rating requirements were met.
The Company used approximately $25 million of the proceeds from the issuances to enter into a convertible note hedge and written call options on its common stock to reduce the exposure to dilution from the conversion of the notes.
Upon adoption of the provisions of ASC 470 related to accounting for convertible debt instruments that may be settled in cash upon conversion (including partial cash settlement), the Company estimated the fair value of the liability component, as of the date of issuance, of its 2.0% convertible senior notes assuming a 6.25% non-convertible borrowing rate to be $158.1 million. The difference between the fair value and the principal amount of the notes was $71.9 million. This amount was retrospectively recorded as a debt discount and as an increase to additional paid-in capital as of the issuance date. The discount is being accreted to interest expense over the ten-year period from the issuance date to the first put date of the notes in 2014 resulting in an increase in non-cash interest expense in prior periods. The current unamortized discount of $35.1 million will be recognized over the remaining 4.1 year period.
The convertible notes were classified within “long-term debt” on the Consolidated Balance Sheet as of January 30, 2010 and January 31, 2009 because the Company can settle the principal amount of the notes with shares and/or cash.
The Company believes it will have sufficient cash on hand, availability under its revolving credit facility and access to various capital markets to repay both the senior notes and convertible notes at maturity.
Capital Leases
At January 30, 2010, the Company had $56.4 million in capital leases covering various properties and pieces of equipment. The terms of the capital leases provide the lessor with a security interest in the asset being leased and require the Company to make periodic lease payments, aggregating between $4 million and $6 million per year.
33
Table of Contents
CONTRACTUAL OBLIGATIONS
The contractual cash obligations at January 30, 2010 associated with the Company’s capital structure, as well as other contractual obligations are illustrated in the following table:
| Payments Due by Period | |||||||||||||||
| (Dollars in Millions) |
Within 1 year | Years 2-3 | Years 4-5 | After Year 5 | Total | ||||||||||
| Long-Term Debt, including interest |
$ | 52 | $ | 179 | $ | 140 | $ | 274 | $ | 645 | |||||
| Capital Lease Obligations, including interest |
11 | 22 | 21 | 45 | 99 | ||||||||||
| Operating Leases |
68 | 117 | 87 | 176 | 448 | ||||||||||
| Purchase Obligations |
391 | 20 | 18 | — | 429 | ||||||||||
| Other Long-Term Liabilities |
4 | 4 | 3 | 6 | 17 | ||||||||||
| Total Contractual Cash Obligations |
$ | 526 | $ | 342 | $ | 269 | $ | 501 | $ | 1,638 | |||||
The Company’s purchase obligations principally consist of purchase orders for merchandise, store construction contract commitments, maintenance contracts, and services agreements and amounts due under employment agreements. Amounts committed under open purchase orders for merchandise inventory represent approximately $368.4 million of the purchase obligations within one year, a substantial portion of which are cancelable without penalty prior to a date that precedes the vendor’s scheduled shipment date.
Other long-term liabilities consist of the Company’s liabilities related to its supplemental executive retirement plan (“SERP”) and long-term cash bonus plan. Additionally, the Company is obligated to fund a cash balance pension plan. The Company’s current policy is to maintain at least the minimum funding requirements specified by the Employee Retirement Income Security Act of 1974. The Company expects funding requirements for its pension plan of approximately $1.4 million in 2010, which is included within other long-term liabilities in the foregoing table.
Other long-term liabilities excluded from the above table include deferred compensation obligations of $12.3 million as the timing of payments for this obligation is subject to employee elections and other employment factors. Other long-term liabilities also excluded from the above table include non-cash obligations for deferred rent and deferred property incentives. Other unrecorded obligations that have been excluded from the contractual obligations table include contingent rent payments, property taxes, insurance payments, amounts that might come due under change-in-control provisions of employment agreements, and common area maintenance costs.
Due to the uncertainty with respect to the timing of future cash flows associated with the Company’s unrecognized tax benefits at January 30, 2010, the Company is unable to make reasonably reliable estimates of the period of cash settlement with the respective taxing authority. Therefore, $40.4 million of unrecognized tax benefits have been excluded from the contractual obligations table above.
The Company has not entered into any off-balance sheet arrangements which would be reasonably likely to have a current or future material effect, such as obligations under certain guarantees or contracts; retained or contingent interests in assets transferred to an unconsolidated entity or similar arrangements; obligations under certain derivative arrangements; and obligations under material variable interests.
From time to time the Company has issued guarantees to landlords under leases of stores operated by its subsidiaries. Certain of these stores were sold in connection with the sale of the Saks Department Store Group to Belk, Inc. in 2005 and the sale of the Northern Department Store Group to The Bon-Ton Stores, Inc. in 2006. If
34
Table of Contents
the purchasers fail to perform certain obligations under the leases guaranteed by the Company, the Company could have obligations to landlords under such guarantees. Based on the information currently available, management does not believe that its potential obligations under these lease guarantees would be material.
CREDIT CARDS
Prior to April 15, 2003, the Company’s proprietary credit cards were issued by National Bank of the Great Lakes (“NBGL”), a wholly owned subsidiary of the Company. On April 15, 2003, the Company sold its proprietary credit card portfolio, consisting of the proprietary credit card accounts owned by NBGL and the Company’s ownership interest in the assets of a trust, to HSBC, a third party financial institution.
As part of the transaction, for a term of ten years expiring in 2013 and pursuant to a program agreement, HSBC established and owns proprietary credit card accounts for customers of the Company’s operating subsidiaries, retains the benefits and risks associated with the ownership of the accounts, receives the finance charge income and incurs the bad debts associated with those accounts. During the ten-year term, pursuant to a servicing agreement, the Company continues to provide key customer service functions, including new account openings, transaction authorizations, billing adjustments and customer inquiries, and receives compensation from HSBC for these services.
At the end of the ten-year term expiring in 2013, the agreement can be renewed for two two-year terms. At the end of the agreement, the Company has the right to repurchase, at fair value, all of the accounts and outstanding accounts receivable, negotiate a new agreement with HSBC or begin issuing private label credit cards itself or through others. The agreement allows the Company to terminate the agreement early following the occurrence of certain events, the most significant of which would be HSBC’s failure to pay owed amounts, bankruptcy, a change in control or a material adverse change in HSBC’s ability to perform under the agreement. The agreement also allows for HSBC to terminate the agreement if the Company fails to pay owed amounts or enters bankruptcy. Should either the Company or HSBC choose to terminate the agreement early, the Company has the right, but not the requirement, to repurchase the credit card accounts and associated accounts receivable from HSBC at their fair value. The Company is contingently liable to pay monies to HSBC in the event of an early termination or a significant disposition of stores. The contingent payment is based upon a declining portion of an amount established at the beginning of the ten-year agreement and on a prorated portion of significant store closings. The maximum contingent payment had the agreement been terminated early at January 31, 2010 would have been approximately $16.3 million. Management believes the risk of incurring a contingent payment is remote.
The Company and HSBC have entered into several amendments to the program agreement since 2003. In October 2009, the Company and HSBC entered into a fifth amendment to the program agreement in response to macroeconomic conditions and portfolio performance, which provides for certain changes to the allocation of risk and revenue sharing between the parties. The fifth amendment, which became effective February 1, 2010, provides for HSBC to share with the Company certain credit losses of the card portfolio and also provides increased revenue sharing to the Company. A net reduction in proprietary credit card income of approximately $10.0 million to $12.0 million is estimated for 2010 primarily due to this amendment.
In September 2006, the Company entered into agreements with HSBC and MasterCard International Incorporated to issue a co-branded MasterCard card to new and existing proprietary credit card customers. Under this program, qualifying customers are issued a SFA and MasterCard-branded credit card that functions as a traditional proprietary credit card when used at any SFA or OFF 5TH store and at Saks Direct or as a MasterCard card when used at any unaffiliated location that accepts MasterCard cards. HSBC establishes and owns the co-brand accounts, retains the benefits and sales associated with the ownership of the accounts, receives the finance charge and other income from the accounts, and incurs the bad-debts associated with the accounts.
35
Table of Contents
CAPITAL NEEDS
The Company estimates capital expenditures for 2010 will be approximately $55 million, net of any proceeds including tenant allowances, primarily for store renovations, enhancements to management information systems, maintenance capital and replacement capital expenditures.
The Company anticipates that working capital requirements related to existing stores, store renovations and capital expenditures will be funded through cash on hand, cash provided by operations and the revolving credit facility. Maximum availability under the revolving credit facility is $500 million, and there is no debt rating trigger. During periods in which availability under the facility exceeds $87.5 million, the Company is not subject to financial covenants. If availability under the facility were to decrease to less than $87.5 million, the Company would be subject to a minimum fixed charge coverage ratio of 1 to 1. During 2009, weighted average letters of credit issued under this credit facility were $25.7 million and letters of credit reduce the amount available to borrow. The Company expects that its cash flows from operating activities combined with borrowings under its revolving credit facility will be sufficient to sustain its current level of operations.
CRITICAL ACCOUNTING POLICIES AND ESTIMATES
The Company’s critical accounting policies and estimates are discussed in the notes to the consolidated financial statements. Certain judgments and estimates utilized in implementing these accounting policies are likewise discussed in each of the notes to the consolidated financial statements. The following discussion sets forth the judgments and uncertainties affecting the application of these policies and estimates and the likelihood that materially different amounts would be reported under varying conditions and assumptions.
REVENUE RECOGNITION
Sales and the related gross margin are recorded at the time customers provide a satisfactory form of payment and take ownership of the merchandise. Revenue associated with gift cards is recognized upon redemption of the card. There are minimal accounting judgments and uncertainties affecting the application of this policy. The Company estimates the amount of goods that will be returned for a refund based on historical trends and reduces sales and gross margin by that amount. However, given that approximately 23% of merchandise sold is later returned and that the vast majority of merchandise returns occur within a short time after the selling transaction, the risk of the Company realizing a materially different amount for sales and gross margin than reported in the consolidated financial statements is minimal.
COST OF SALES AND INVENTORY VALUATION
Merchandise inventories are stated at the lower of cost or market using the retail method. On February 3, 2008, the Company elected to change its method of costing its inventories to the retail “first-in, first-out” (FIFO) method, whereas in all prior periods inventory was costed using the retail “last-in, first-out” (LIFO) method. The new method of accounting had no impact on the fiscal years ending January 30, 2010, January 31, 2009, and February 2, 2008 as the LIFO value exceeded the FIFO market value and inventory had been adjusted to reflect FIFO market value in all periods. Under the retail method, the valuation of inventories at cost and the resulting gross margins are determined by applying a calculated cost-to-retail ratio to the retail value of inventories. The cost of the inventory reflected on the consolidated balance sheet is decreased with a charge to cost of sales contemporaneous with the lowering of the retail value of the inventory on the sales floor through the use of markdowns. Hence, earnings are negatively impacted as the merchandise is being devalued with markdowns prior to the sale of the merchandise. The areas requiring significant management judgment include (1) setting the original retail value for the merchandise held for sale, (2) recognizing merchandise for which the customer’s perception of value has declined and appropriately marking the retail value of the merchandise down to the
36
Table of Contents
perceived value, and (3) estimating the shrinkage that has occurred through theft during the period between physical inventory counts. These judgments and estimates, coupled with the averaging processes within the retail method, can, under certain circumstances, produce varying financial results. Factors that can lead to different financial results include setting original retail prices for merchandise held for sale too high, failure to identify a decline in perceived value of inventories and process the appropriate retail value markdowns and overly optimistic or overly conservative shrinkage estimates. The Company believes it has the appropriate merchandise valuation and pricing controls in place to minimize the risk that its inventory values would be materially under or overvalued.
The Company regularly records a provision for estimated shrinkage, thereby reducing the carrying value of merchandise inventory. A complete physical inventory of all the Company’s stores and distribution facilities is performed annually, with the recorded amount of merchandise inventory being adjusted to coincide with this physical count. The differences between the estimated amount of shrinkage and the actual amount realized have been insignificant.
The Company receives vendor provided support in different forms. When the vendor provides support for inventory markdowns, the Company records the support as a reduction to cost of sales. Such support is recorded in the period that the corresponding markdowns are taken. When the Company receives inventory-related support that is not designated for markdowns, the Company includes this support as a reduction in cost purchases.
SELF-INSURANCE RESERVES
The Company self-insures a substantial portion of the exposure for costs related primarily to employee medical, workers’ compensation and general liability. Expenses are recorded based on estimates for reported and incurred but not reported claims considering a number of factors, including historical claims experience, severity factors, litigation costs, inflation and other assumptions. Although the Company does not expect the amount it will ultimately pay to differ significantly from its estimates, self-insurance reserves could be affected if future claims experience differs significantly from the historical trends and assumptions.
DEPRECIATION AND RECOVERABILITY OF CAPITAL ASSETS
Over forty percent of the Company’s assets at January 30, 2010 are represented by investments in property and equipment. Determining appropriate depreciable lives and reasonable assumptions for use in evaluating the carrying value of capital assets requires judgments and estimates.
| • | The Company principally utilizes the straight-line depreciation method and a variety of depreciable lives. Land is not depreciated. Buildings and improvements are depreciated over 20 to 40 years. Store fixtures are depreciated over 10 years. Equipment utilized in stores (e.g., escalators) and in support areas (e.g., distribution centers, technology) and fixtures in support areas are depreciated over 3 to 15 years. Leasehold improvements are amortized over the shorter of their estimated useful lives or their related lease terms, generally ranging from 10 to 20 years. Internally generated computer software is amortized over 3 to 10 years. Generally, no estimated salvage value at the end of the useful life of the assets is considered. |
| • | When constructing stores, the Company receives allowances from landlords. If the landlord is determined to be the primary beneficiary of the property, then the portion of those allowances attributable to the property owned by the landlord is considered to be a deferred rent liability, whereas the corresponding capital expenditures related to that store are considered to be prepaid rent. Allowances in excess of the amounts attributable to the property owned by the landlord are considered improvement allowances and are recorded as deferred rent liabilities that are amortized over the life of |
37
Table of Contents
| the lease. Capital expenditures are also reduced when the Company receives cash and allowances from merchandise vendors to fund the construction of vendor shops. |
| • | To the extent the Company remodels or otherwise replaces or disposes of property and equipment prior to the end of their assigned depreciable lives, the Company could realize a loss or gain on the disposition. To the extent assets continue to be used beyond their assigned depreciable lives, no depreciation expense is being realized. The Company reassesses the depreciable lives in an effort to reduce the risk of significant losses or gains at disposition and utilization of assets with no depreciation charges. The reassessment of depreciable lives involves utilizing historical remodel and disposition activity and forward-looking capital expenditure plans. |
| • | Recoverability of the carrying value of store assets is assessed upon the occurrence of certain events (e.g., opening a new store near an existing store or announcing plans for a store closing) and, absent certain triggering events, annually during the fourth quarter. The recoverability assessment requires judgment and estimates for future store generated cash flows. The underlying estimates for cash flows include estimates for future sales, gross margin rates, inflation and store expenses. During the year ended January 30, 2010, January 31, 2009, and February 2, 2008, the Company incurred impairment charges of $29.3 million, $11.1 million, and $4.3 million, respectively, related to asset impairments and other costs in the normal course of business. |
LEASES
The Company leases stores, distribution centers, and administrative facilities under operating leases. Store lease agreements generally include rent holidays, rent escalation clauses and contingent rent provisions for a percentage of sales in excess of specified levels. Most of the Company’s lease agreements include renewal periods at the Company’s option. The Company recognizes rent holiday periods and scheduled rent increases on a straight-line basis over the lease term beginning with the date the Company takes possession of the leased space. Rent expense incurred prior to the opening of a store is charged to Store Pre-Opening Costs. The Company records tenant improvement allowances and rent holidays as deferred rent liabilities on the Consolidated Balance Sheets and amortizes the deferred rent over the terms of the lease to rent expense in the Consolidated Statements of Income. The Company records rent liabilities on the Consolidated Balance Sheets for contingent percentage of sales lease provisions when the Company determines that it is probable that the specified levels will be reached during the fiscal year.
INCOME AND OTHER TAXES
The majority of the Company’s net deferred tax assets of $257.3 million at January 30, 2010 consist of federal and state NOL carryforwards that will expire between 2010 and 2029. The majority of the NOL carryforward is a result of the net operating losses incurred during the fiscal years ended January 30, 2010 and January 31, 2009 due principally to difficult market and macroeconomic conditions. We have concluded, based on the weight of all available positive and negative evidence that all but $42.8 million of these tax benefits relating to certain state losses are more likely than not to be realized in the future. Therefore, a valuation allowance for the $42.8 million has been established. We evaluate the realizability of our deferred tax assets on a quarterly basis. In 2009, this evaluation resulted in an additional reserve against state deferred tax assets of $3.0 million, impacting our results of operations. A similar analysis was performed in 2008, which resulted in an additional reserve against state deferred tax assets of $6.1 million. While the Company has incurred a cumulative loss over the three year period ended January 30, 2010, after evaluating all available evidence including our past operating results, the macroeconomic factors contributing to the recent fiscal loss, the length of the carryforward periods available and our forecast of future taxable income, including the availability of prudent and feasible tax planning strategies, we concluded that it is more likely than not the deferred tax asset, net of the $42.8 million
38
Table of Contents
valuation allowance related to state NOLs, will be realized. We will continue to assess the need for additional valuation allowance in the future. If future results are less than projected or tax planning alternatives are no longer viable, then additional valuation allowance may be required to reduce the deferred tax assets which could have a material impact on our results of operations in the period in which it is recorded.
The Company is routinely under audit by federal, state and local authorities in the areas of income taxes and the remittance of sales and use taxes. Taxing authorities may question the timing and amount of deductions, the allocation of income among various tax jurisdictions and compliance with federal, state and local tax laws. In evaluating the exposure associated with various tax filing positions, the Company often accrues for exposures related to uncertain tax positions.
Additional reserves of $1.1 million, $0.5 million and $1.8 million were established for issues raised in current state tax examinations and previously filed federal tax returns related to prior periods during 2009, 2008 and 2007, respectively. At January 30, 2010, the Company believes it has appropriately accrued for future exposures related to uncertain tax positions. To the extent the Company were to prevail in matters for which accruals have been established or be required to pay amounts in excess of reserves, the Company’s effective tax rate in a given financial statement period may be materially impacted.
The Company adopted the provisions of new accounting guidance related to uncertain income tax positions effective as of the beginning of fiscal year 2007. As a result of the implementation of this accounting guidance, the Company recorded a $33.7 million decrease in the liability for unrecognized tax benefits which was accounted for as an increase to the beginning shareholder’s equity. The Company had approximately $40.4 million and $46.0 million of gross unrecognized tax benefits at January 30, 2010 and January 31, 2009, respectively. As of January 30, 2010, $35.0 million represents the amount of unrecognized tax benefits that, if recognized, would impact the effective income tax rate in any future periods. The Company continually evaluates its tax filing positions and to the extent the Company prevails on audits or statutes of limitation expire, the unrecognized tax benefits could be realized. The Company believes that it is reasonably possible that up to $25.5 million in unrecognized tax benefits relating to prior acquisitions could be recognized within 12 months of the January 30, 2010 balance sheet date.
As a result of the analysis of uncertain tax positions upon the adoption of the relevant accounting guidance in 2007 the net deferred tax asset related to state NOL carryforwards increased. Therefore, the Company performed a valuation allowance analysis to determine the realizability of this asset. This analysis resulted in an additional valuation allowance of $19.3 million with the offset recorded to shareholders’ equity in accordance with the relevant accounting guidance for entities in reorganization under the bankruptcy code. The Company was subject to the provisions of this accounting guidance for these net operating losses since these losses were acquired through the acquisition of a company that had previously filed bankruptcy.
The Company files a consolidated U.S. Federal income tax return as well as state tax returns in multiple state jurisdictions. The Company has completed examinations by the Internal Revenue Service or the statute of limitations has expired for taxable years through January 28, 2006 with no significant adjustments. With respect to the state and local jurisdictions, the Company has completed examinations in many jurisdictions through the same period and beyond and currently has examinations in progress for several jurisdictions.
PENSION PLANS
The Company sponsors a defined benefit cash balance pension plan and SERP for certain employees of the Company. The Company amended the pension plan during 2006, freezing benefit accruals for all participants except those who have attained age 55 and completed 10 years of credited service as of January 1, 2007, who are
39
Table of Contents
considered to be non-highly compensated employees. In January 2009, the Company suspended future benefit accruals for all remaining participants in the plan effective on March 13, 2009. This curtailment resulted in a gain of approximately $0.6 million for the year ended January 31, 2009.
Pension expense is based on actuarial models used to estimate the total benefits ultimately payable to participants and is allocated to the respective service periods. The actuarial assumptions used to calculate pension costs are reviewed annually. The Company’s funding policy provides that contributions to the pension trusts shall be at least equal to the minimum funding requirement of the Employee Retirement Income Security Act of 1974. The Company may provide additional contributions from time to time, generally not to exceed the maximum tax-deductible limitation. The pension plans are valued annually as of the Company’s fiscal year-end balance sheet date. The projected unit credit method is utilized in recognizing the pension liabilities.
In September 2006, the FASB issued a new accounting pronouncement which requires employers to (i) recognize the funded status of their defined benefit pension and other postretirement plans on the consolidated balance sheet, (ii) recognize as a component of other comprehensive income, net of tax, the gains or losses and prior service costs or credits that arise during the period but are not recognized as components of net periodic benefit cost and (iii) measure defined benefit plan assets and obligations as of the date of the employer’s statement of financial position. The Company adopted the recognition and disclosure requirements of the new pronouncement prospectively on February 3, 2007. Effective January 31, 2009, in accordance with the new pronouncement, the Company changed its measurement date from November 1 to the date of its fiscal year end. The Company elected to adopt the change in measurement date using the alternative transition method. In accordance with the alternative transition method, the actuarial valuation provided a 15-month projection of net periodic benefit cost to January 31, 2009 that resulted in a $0.3 million decrease to 2008 ending retained earnings.
Pension assumptions are based upon management’s best estimates as of the annual measurement date.
| • | The assumed discount rate utilized is based upon pension discount curves and bond portfolio curves over a duration similar to the plan’s liabilities as of the measurement date. The discount rate is utilized principally in calculating the Company’s pension obligation, which is represented by the Accumulated Benefit Obligation (“ABO”) and the Projected Benefit Obligation (“PBO”) and in calculating net pension expense. At January 30, 2010, the discount rate used to calculate the ABO and PBO was 5.1%. To the extent the discount rate increases or decreases, the Company’s PBO is decreased or increased, respectively. The estimated effect of a 0.25% change in the discount rate is approximately $2.3 million on the PBO and approximately $0.1 million on annual pension expense. To the extent the PBO increases, the after-tax effect of such increase serves to reduce Other Comprehensive Income and Shareholders’ Equity. |
| • | The assumed expected long-term rate of return on assets is the weighted average rate of earnings expected on the funds invested or to be invested to provide for the benefits included in the PBO. It is the Company’s policy to invest approximately 65% of the pension fund assets in equities, 30% in fixed income securities and 5% in real estate. The Company’s estimate of the expected long-term rate of return considers the historical returns on plan assets, as well as the future expectations of returns on classes of assets within the target asset allocation of the plan asset portfolio. This rate is utilized principally in calculating the expected return on plan assets component of the annual pension expense. To the extent the actual rate of return on assets realized is greater than the assumed rate, that year’s annual pension expense is not affected. Rather, this gain reduces future pension expense over a period of approximately 10 years. To the extent the actual rate of return on assets is less than the assumed rate, that year’s annual pension expense is likewise not affected. Rather, this loss increases pension expense over approximately 10 years. The Company’s expected long-term rate of return on assets was 8.0% in 2009 and 2008. |
40
Table of Contents
| • | The assumed average rate of compensation increase is the average annual compensation increase expected over the remaining employment periods for the participating employees. Due to the curtailment of the pension plan, the average rate of compensation increase will no longer be utilized in determining the PBO and pension expense. |
NEW ACCOUNTING PRONOUNCEMENTS
In May 2009, the FASB issued guidance regarding subsequent events, which was subsequently updated in February 2010. This guidance established general standards of accounting for and disclosure of events that occur after the balance sheet date but before financial statements are issued or are available to be issued. In particular, this guidance sets forth the period after the balance sheet date during which management of a reporting entity should evaluate events or transactions that may occur for potential recognition or disclosure in the financial statements, the circumstances under which an entity should recognize events or transactions occurring after the balance sheet date in its financial statements, and the disclosures that an entity should make about events or transactions that occurred after the balance sheet date. This guidance was effective for financial statements issued for fiscal years and interim periods ending after June 15, 2009, and was therefore adopted by the Company for the second quarter 2009 reporting. The adoption did not have a significant impact on the subsequent events that the Company reports, either through recognition or disclosure, in the consolidated financial statements. In February 2010, the FASB amended its guidance on subsequent events to remove the requirement to disclose the date through which an entity has evaluated subsequent events, alleviating conflicts with current SEC guidance. This amendment was effective immediately and therefore the Company did not include the disclosure in this Form 10-K.
In June 2009, the FASB issued the Accounting Standards Codification (the “Codification”). The Codification is the single source of authoritative, U.S. GAAP recognized by the FASB to be applied by nongovernmental entities. The Codification is effective for financial statements issued for interim and annual periods ending after September 15, 2009. The implementation of the Codification did not have an impact on the Company’s consolidated financial statements.
On May 3, 2009, the Company adopted the provisions of a new accounting standard related to disclosures about the fair value of financial instruments, which requires publicly-traded companies to provide disclosures on the fair value of financial instruments in interim financial statements.
On February 1, 2009, the Company retrospectively adopted the provisions of ASC 470 related to accounting for convertible debt instruments that may be settled in cash upon conversion (including partial cash settlement). See Note 6 for further discussion of the adoption of this new accounting standard.
On February 1, 2009, the Company adopted the provisions of the fair value measurement standard related to nonfinancial assets and nonfinancial liabilities that are recognized or disclosed at fair value in the financial statements on a nonrecurring basis. The adoption of the accounting standard did not have a material impact on the Company’s consolidated financial statement for the year ended January 30, 2010.
On February 1, 2009, the Company adopted the provisions of a new accounting standard related to accounting for instruments granted in share-based payment transactions as participating securities. This update provides that unvested share-based payment awards that contain nonforfeitable rights to dividends or dividend equivalents, whether paid or unpaid, are participating securities and shall be included in the computation of both basic and diluted earnings per share. The adoption of this standard did not have a material impact on the Company’s consolidated financial statements for the year ended January 30, 2010.
41
Table of Contents
On February 1, 2009, the Company adopted the provisions of a new accounting standard related to accounting by lessees for nonrefundable maintenance deposits, which clarifies how a lessee shall account for a maintenance deposit under an arrangement accounted for as a lease. The adoption of the new accounting standard did not have a material impact on the Company’s consolidated financial statements for the year ended January 30, 2010.
In December 2008, the FASB issued additional guidance on employers’ disclosures about the plan assets of defined benefit pension or other postretirement plans. The new disclosure requirements include a description of how investment allocation decisions are made, major categories of plan assets, valuation techniques used to measure the fair value of plan assets, the impact of measurement using significant unobservable inputs and concentrations of risk within plan assets. The new disclosure requirements are effective for fiscal years ending after December 15, 2009. See Note 8 for the additional disclosures required in accordance with the adoption of this new accounting standard.
RELATED PARTY TRANSACTIONS
See Item 13, Certain Relationships and Related Transactions, in this Form 10-K.
FORWARD-LOOKING INFORMATION
The information contained in this Form 10-K that addresses future results or expectations is considered “forward-looking” information within the definition of the Federal securities laws. Forward-looking information in this document can be identified through the use of words such as “may,” “will,” “intend,” “plan,” “project,” “expect,” “anticipate,” “should,” “would,” “believe,” “estimate,” “contemplate,” “possible,” and “point.” The forward-looking information is premised on many factors, some of which are outlined below. Actual consolidated results might differ materially from projected forward-looking information.
The forward-looking information and statements are or may be based on a series of projections and estimates and involve risks and uncertainties. These risks and uncertainties include such factors as: the level of consumer spending for luxury apparel and other merchandise carried by the Company and its ability to respond quickly to consumer trends; macroeconomic conditions and their effect on consumer spending; the Company’s ability to secure adequate financing; adequate and stable sources of merchandise; the competitive pricing environment within the retail sector; the effectiveness of planned advertising, marketing, and promotional campaigns; favorable customer response to relationship marketing efforts of proprietary credit card loyalty programs; appropriate inventory management; effective expense control; successful operation of the Company’s proprietary credit card strategic alliance with HSBC Bank Nevada, N.A.; geo-political risks; the performance of the financial markets; changes in interest rates; and fluctuations in foreign currency. For additional information regarding these and other risk factors, please refer to Item 1A of Part I in this Form 10-K.
The Company undertakes no obligation to correct or update any forward-looking statements, whether as a result of new information, future events, or otherwise.
Item 7A. Quantitative and Qualitative Disclosures About Market Risk.
The Company’s exposure to market risk primarily arises from changes in interest rates and the U.S. equity and bond markets. The effects of changes in interest rates on earnings generally have been small relative to other factors that also affect earnings, such as sales and operating margins. The Company seeks to manage exposure to adverse interest rate changes through its normal operating and financing activities, and if appropriate, through the use of derivative financial instruments. Such derivative instruments can be used as part of an overall risk
42
Table of Contents
management program in order to manage the costs and risks associated with various financial exposures. The Company does not enter into derivative instruments for trading purposes. The Company is exposed to interest rate risk primarily through its borrowings under its revolving credit facility.
Based on the Company’s market risk sensitive instruments outstanding at January 30, 2010, the Company has determined that there was no material market risk exposure to the Company’s consolidated financial position, results of operations, or cash flows as of such date.
Item 8. Financial Statements and Supplementary Data.
Information called for by this item is set forth in the Company’s Consolidated Financial Statements and supplementary data contained in this report beginning on page F-1.
Item 9. Changes in and Disagreements with Accountants on Accounting and Financial Disclosure.
None.
Item 9A. Controls and Procedures.
DISCLOSURE CONTROLS AND PROCEDURES
Under the supervision and with the participation of the Company’s management, including the Chief Executive Officer and Chief Financial Officer, the Company conducted an evaluation of the effectiveness of its disclosure controls and procedures (as such term is defined in Rules 13a-15(e) and 15d-15(e) under the Exchange Act) as of the end of the period covered by this report. Based on this evaluation, the Company’s Chief Executive Officer and Chief Financial Officer concluded that the Company’s disclosure controls and procedures were effective as of such date. The Company’s disclosure controls and procedures are designed to ensure that information required to be disclosed by the Company in the reports it files or submits under the Exchange Act is recorded, processed, summarized and reported within the time periods specified in the SEC’s rules and forms and that such information is accumulated and communicated to management, including the Chief Executive Officer and Chief Financial Officer, to allow timely decisions regarding required disclosure.
MANAGEMENT’S REPORT ON INTERNAL CONTROL OVER FINANCIAL REPORTING
Management of the Company is responsible for establishing and maintaining adequate internal control over financial reporting, as such term is defined in Exchange Act Rules 13a-15(f) and 15d-15(e). The Company’s internal control over financial reporting is designed to provide reasonable assurance regarding the reliability of financial reporting and the preparation of financial statements for external purposes in accordance with generally accepted accounting principles. A control system, no matter how well designed and operated, can provide only reasonable, not absolute, assurance that the control system’s objectives will be met. The design of a control system must reflect the fact that there are resource constraints, and the benefits of controls must be considered relative to their costs. Further, because of the inherent limitations in all control systems, no evaluation of controls can provide absolute assurance that misstatements due to error or fraud will not occur or that all control issues and instances of fraud, if any, within the Company have been detected. The design of any system of controls is based in part on certain assumptions about the likelihood of future events, and there can be no assurance that any design will succeed in achieving its stated goals under all potential future conditions.
Under the supervision and with the participation of the Company’s management, including the Chief Executive Officer and Chief Financial Officer, management of the Company conducted an evaluation of the effectiveness of the Company’s internal control over financial reporting as of the end of the period covered by
43
Table of Contents
this report based on the framework set forth in the Internal Control-Integrated Framework issued by the Committee of Sponsoring Organizations of the Treadway Commission. Based on this evaluation, management concluded that, as of January 30, 2010, the Company’s internal control over financial reporting was effective based on those criteria.
PricewaterhouseCoopers LLP, the independent registered public accounting firm that audited the financial statements included in this report, has issued an attestation report on the Company’s internal control over financial reporting which appears in Item 15.
CHANGES IN INTERNAL CONTROL OVER FINANCIAL REPORTING
There were no changes in the Company’s internal control over financial reporting that occurred during the quarter ended January 30, 2010 that have materially affected, or are reasonably likely to materially affect, the Company’s internal control over financial reporting.
Not applicable.
44
Table of Contents
PART III
Item 10. Directors, Executive Officers and Corporate Governance.
The information required by this Item with respect to the Company’s directors is incorporated by reference to the section entitled “Election of Directors” in the Company’s Proxy Statement to be filed in connection with the Company’s 2010 Annual Meeting of Shareholders (the “Proxy Statement”). The information required by this Item with respect to the Company’s Code of Business Conduct and Ethics and Audit Committee (including the Company’s “audit committee financial expert”) is incorporated by reference to the section of the Proxy Statement entitled “Corporate Governance.”
The information required by this Item with respect to the Company’s executive officers is set forth under “Executive Officers and Directors of the Registrant.”
The information required by this Item with respect to Section 16(a) of the Securities and Exchange Act is incorporated by reference to the section of the Proxy Statement entitled “Section 16(a) Beneficial Ownership Reporting Compliance.”
Item 11. Executive Compensation.
The information required by this Item with respect to director and executive officer compensation is incorporated by reference to the section of the Proxy Statement entitled “Executive Compensation.
Item 12. Security Ownership of Certain Beneficial Owners and Management and Related Stockholder Matters.
The information required by this Item with respect to security ownership of certain beneficial owners and management is incorporated by reference to the section of the Proxy Statement entitled “Stock Ownership of Certain Beneficial Owners and Management.”
The remaining information called for by this item relating to “Securities Authorized for Issuance under Equity Compensation Plans” is provided in Part II, Item 5. “Market for Registrant’s Common Equity, Related Stockholder Matters and Issuer Purchases of Equity Securities” of this Form 10-K Report.
Item 13. Certain Relationships and Related Transactions, and Director Independence.
The information required by this Item with respect to certain relationships and related transactions, and director independence is incorporated by reference to the sections of the Proxy Statement entitled “Certain Relationships and Related Transactions” and “Corporate Governance.”
Item 14. Principal Accounting Fees and Services.
The information required by this Item with respect to principal accountants fees and services is incorporated by reference to the section of the Proxy Statement entitled “Fees Paid to Auditors.”
45
Table of Contents
PART IV
Item 15. Exhibits and Financial Statement Schedules.
| (a) | The following documents are filed as part of this report: |
| (1)-(2) | Financial Statements and Schedules – The list of consolidated financial statements and schedules set forth in the Index to Consolidated Financial Statements on page F-1 herein is incorporated herein by reference. All other financial statement schedules are omitted since they are not required or are not applicable, or the required information is included in the consolidated financials statements or notes thereto. |
| (2) | Exhibits — The exhibits listed in the accompanying Index to Exhibits immediately following the signature page to this Report. |
46
Table of Contents
Pursuant to the requirements of Section 13 or 15(d) of the Securities Exchange Act of 1934, the registrant has duly caused this report to be signed on its behalf by the undersigned thereunto duly authorized on March 18, 2010.
| SAKS INCORPORATED | ||
| By: | /S/ KEVIN G. WILLS | |
| Kevin G. Wills | ||
| Executive Vice President and | ||
| Chief Financial Officer | ||
Pursuant to the requirements of the Securities and Exchange Act of 1934, this report has been signed below by the following persons on behalf of the registrant and in the capacities indicated on March 18, 2010.
| /S/ STEPHEN I. SADOVE |
| Stephen I. Sadove |
| Chief Executive Officer |
| Chairman of the Board |
| Principal Executive Officer |
| /S/ KEVIN G. WILLS |
| Kevin G. Wills |
| Executive Vice President and |
| Chief Financial Officer |
| Principal Financial and Accounting Officer |
| /S/ DONALD E. HESS |
| Donald E. Hess |
| Lead Director |
| /S/ ROBERT B. CARTER |
| Robert B. Carter |
| Director |
| /S/ MICHAEL S. GROSS |
| Michael S. Gross |
| Director |
| /S/ MARGUERITE W. KONDRACKE |
| Marguerite W. Kondracke |
| Director |
| /S/ JERRY W. LEVIN |
| Jerry W. Levin |
| Director |
| /S/ NORA P. MCANIFF |
| Nora P. McAniff |
| Director |
| /S/ C. WARREN NEEL |
| C. Warren Neel |
| Director |
| /S/ CHRISTOPHER J. STADLER |
| Christopher J. Stadler |
| Director |
| /S/ RONALD DE WAAL |
| Ronald de Waal |
| Director |
47
Table of Contents
| Exhibit No. |
Description | |
| 3.1 | Composite of Charter of Saks Incorporated (the “Company”) (incorporated by reference to Exhibit 3(i) to the Company’s Current Report on Form 8-K filed on July 30, 2009) | |
| 3.2 | Amended and Restated Bylaws of the Company (as amended through December 9, 2009) (incorporated by reference to Exhibit 3.1 to the Company’s Current Report on Form 8-K filed on December 14, 2009) | |
| 4.1 | Indenture, dated as of December 2, 1998, among the Company, the Subsidiary Guarantors, and The First National Bank of Chicago, as Trustee, related to the 7 1/2% Notes due 2010 (the “2010 Notes”) (incorporated by reference to Exhibit 4.4 to the Company’s Current Report on Form 8-K filed on December 4, 1998) | |
| 4.2 | First Supplemental Indenture, dated as of February 17, 1999, among the Company, the Subsidiary Guarantors and The First National Bank of Chicago, as Trustee, related to the 2010 Notes (incorporated by reference to Exhibit 4.2.1 to the Company’s Annual Report on Form 10-K for the fiscal year ended January 31, 2009 (the “2009 10-K”)) | |
| 4.3 | Second Supplemental Indenture, dated as of May 18, 2000, among the Company, the Subsidiary Guarantors and Bank One Trust Company, National Association, successor-in-interest to The First National Bank of Chicago, as Trustee, related to the 2010 Notes (incorporated by reference to Exhibit 4.2.2 to the 2009 10-K) | |
| 4.4 | Third Supplemental Indenture, dated as of April 18, 2001, among the Company, the Subsidiary Guarantors and Bank One Trust Company, National Association, successor-in-interest to The First National Bank of Chicago, as Trustee, related to the 2010 Notes (incorporated by reference to Exhibit 4.2.3 to the 2009 10-K) | |
| 4.5 | Fourth Supplemental Indenture, dated as of November 19, 2001, among the Company, the Subsidiary Guarantors and Bank One Trust Company, National Association, successor-in-interest to The First National Bank of Chicago, as Trustee, related to the 2010 Notes (incorporated by reference to Exhibit 4.2.4 to 2009 10-K) | |
| 4.6 | Fifth Supplemental Indenture, dated as of February 12, 2002, among the Company, the Subsidiary Guarantors and Bank One Trust Company, National Association, successor-in-interest to The First National Bank of Chicago, as Trustee, related to the 2010 Notes (incorporated by reference to Exhibit 4.2.5 to the 2009 10-K) | |
| 4.7 | Sixth Supplemental Indenture, dated as of June 23, 2004, among the Company, the Subsidiary Guarantors and J.P. Morgan Trust Company, National Association, successor-in-interest to The First National Bank of Chicago, as Trustee, related to the 2010 Notes (incorporated by reference to Exhibit 4.2.6 to 2009 10-K) | |
| 4.8 | Seventh Supplemental Indenture, dated as of July 19, 2005, among the Company, the Subsidiary Guarantors named therein, and J.P. Morgan Chase Bank, N.A. as Trustee, related to the 2010 Notes (incorporated by reference to Exhibit 4.1 to the Company’s Current Report on Form 8-K filed on July 21, 2005) | |
| 4.9 | Eighth Supplemental Indenture, dated as of January 31, 2010, among the Company, the Subsidiary Guarantors named therein, and The Bank of New York Mellon (successor in interest to J.P. Morgan Trust Company, National Association), as Trustee, related to the 2010 Notes * | |
48
Table of Contents
| Exhibit No. |
Description | |
| 4.10 | Indenture, dated as of February 17, 1999, among the Company, the Subsidiary Guarantors, and The First National Bank of Chicago, as trustee, related to the 7 3/8% Notes due 2019 (the “2019 Notes”) (incorporated by reference to the Exhibit 4.1 to the Company’s Current Report on Form 8-K filed on February 19, 1999) | |
| 4.11 | Second Supplemental Indenture, dated as of May 18, 2000, among the Company, the Subsidiary Guarantors and Bank One Trust Company, National Association, successor-in-interest to The First National Bank of Chicago, as Trustee, related to the 2019 Notes (incorporated by reference to Exhibit 4.3.1 to the 2009 10-K) | |
| 4.12 | Third Supplemental Indenture, dated as of April 18, 2001, among the Company, the Subsidiary Guarantors and Bank One Trust Company, National Association, successor-in-interest to The First National Bank of Chicago, as Trustee, related 2019 Notes (incorporated by reference to Exhibit 4.3.2 to the 2009 10-K) | |
| 4.13 | Fourth Supplemental Indenture, dated as of November 19, 2001, among the Company, the Subsidiary Guarantors and Bank One Trust Company, National Association, successor-in-interest to The First National Bank of Chicago, as Trustee, related to the 2019 Notes (incorporated by reference to Exhibit 4.3.3 to the 2009 10-K) | |
| 4.14 | Fifth Supplemental Indenture, dated as of February 12, 2002, among the Company, the Subsidiary Guarantors and Bank One Trust Company, National Association, successor-in-interest to The First National Bank of Chicago, as Trustee, related to the 2019 Notes (incorporated by reference to Exhibit 4.3.4 to the 2009 10-K) | |
| 4.15 | Sixth Supplemental Indenture, dated as of June 23, 2004, among the Company, the Subsidiary Guarantors and J.P. Morgan Trust Company, National Association, successor-in-interest to The First National Bank of Chicago, as Trustee, related to the 2019 Notes (incorporated by reference to Exhibit 4.3.5 to the 2009 10-K) | |
| 4.16 | Seventh Supplemental Indenture, dated as of July 19, 2005, among the Company, the Subsidiary Guarantors named therein, and J.P. Morgan Trust Company, National Association, as Trustee, related to the 2019 Notes (incorporated by reference to Exhibit 4.3 to the Company’s Current Report on Form 8-K filed on July 21, 2005) | |
| 4.17 | Eighth Supplemental Indenture, dated as of January 31, 2010, among the Company, the Subsidiary Guarantors named therein, and The Bank of New York Mellon (successor in interest to J.P. Morgan Trust Company, National Association), as Trustee, related to the 2019 Notes * | |
| 4.18 | Indenture, dated as of October 4, 2001, among the Company, the Subsidiary Guarantors, and Bank One Trust Company, National Association, as trustee, related to the 9 7/8% Notes due 2011 (the “2011 Notes”) (incorporated by reference to Exhibit 4.1 to the Company’s Current Report on Form 8-K filed on October 11, 2001) | |
| 4.19 | First Supplemental Indenture, dated as of November 19, 2001, among the Company, the Subsidiary Guarantors and Bank One Trust Company, National Association, as Trustee, related to the 2011 Notes (incorporated by reference to Exhibit 4.4.1 to the 2009 10-K) | |
| 4.20 | Second Supplemental Indenture, dated as of February 12, 2002, among the Company, the Subsidiary Guarantors and Bank One Trust Company, National Association, as Trustee, related to the 2011 Notes (incorporated by reference to Exhibit 4.4.2 to the 2009 10-K) | |
49
Table of Contents
| Exhibit No. |
Description | |
| 4.21 | Third Supplemental Indenture, dated as of June 23, 2004, among the Company, the Subsidiary Guarantors and J.P. Morgan Trust Company, National Association, successor-in-interest to Bank One Trust Company, National Association, as Trustee, related to the 2011 Notes (incorporated by reference to Exhibit 4.4.3 to the 2009 10-K) | |
| 4.22 | Fourth Supplemental Indenture, dated as of July 1, 2005, among the Company, the Subsidiary Guarantors named therein, and JPMorgan Chase Bank, N.A., as trustee, related to the 2011 Notes (incorporated by reference to Exhibit 4.2 to the Company’s Current Report on Form 8-K filed on July 6, 2005) | |
| 4.23 | Fifth Supplemental Indenture, dated as of January 31, 2010, among the Company, the Subsidiary Guarantors named therein, and The Bank of New York Mellon (successor in interest to J.P. Morgan Trust Company, National Association), as Trustee, related to the 2011 Notes * | |
| 4.24 | Indenture, dated as of December 8, 2003, among the Company, the Subsidiary Guarantors named therein, and the Bank of New York, as Trustee, related to the 7% Notes due 2013 (the “2013 Notes”) (incorporated by reference to Exhibit 4.1 to the Company’s Current Report on Form 8-K filed on December 11, 2003) | |
| 4.25 | First Supplemental Indenture, dated as of May 20, 2004, among the Company, the Subsidiary Guarantors and the Bank of New York, as Trustee, related to the 2013 Notes (incorporated by reference to Exhibit 4.8.1 to the 2009 10-K) | |
| 4.26 | Second Supplemental Indenture, dated as of July 19, 2005, among the Company, the Subsidiary Guarantors named therein, and The Bank of New York Trust Company, N.A., as trustee, related to the 2013 Notes (incorporated by reference to Exhibit 4.2 to the Company’s Current Report on Form 8-K filed on July 21, 2005) | |
| 4.27 | Third Supplemental Indenture, dated as of January 31, 2010, among the Company, the Subsidiary Guarantors named therein, and The Bank of New York Mellon (successor in interest to The Bank of New York Trust Company, N.A.), as Trustee, related to the 2013 Notes * | |
| 4.28 | Indenture, dated as of March 23, 2004, between the Company, the Subsidiary Guarantors named therein, and The Bank of New York Trust Company, N.A., as trustee, related to the 2.00% Convertible Senior Notes due 2024 (the “2024 Notes”) (incorporated by reference to Exhibit 4.1 to the Form 8-K of Saks Incorporated filed on March 26, 2004) | |
| 4.29 | Supplemental Indenture, dated as of July 1, 2005, among the Company, the Subsidiary Guarantors named therein, and The Bank of New York Trust Company, N.A., as trustee, related to the 2024 Notes (incorporated by reference to Exhibit 4.1 to the Company’s Current Report on Form 8-K filed on July 6, 2005) | |
| 4.30 | Second Supplemental Indenture, dated as of January 31, 2010, among the Company, the Subsidiary Guarantors named therein, and The Bank of New York Mellon (successor in interest to The Bank of New York Trust Company, N.A.), as Trustee, related to the 2024 Notes * | |
| 4.31 | Indenture, dated as of May 27, 2009, between the Company, the subsidiary guarantors named therein and The Bank of New York Mellon, as Trustee, related to the 7.50% Convertible Notes due 2013 (the “2013 Convertible Notes”) (incorporated by reference to Exhibit 4.1 to the Company’s Current Report on Form 8-K filed on May 27, 2009) | |
| 4.32 | Supplemental Indenture, dated as of January 31, 2010, among the Company, the Subsidiary Guarantors named therein, and The Bank of New York Mellon, as Trustee, related to the 2013 Convertible Notes * | |
50
Table of Contents
| Exhibit No. |
Description | |
| 10.1 | Supplemental Transaction Agreement, dated as of April 14, 2003, among the Company, National Bank of the Great Lakes, Saks Credit Corporation, Household Finance Corporation, and Household Bank (SB), N.A. (incorporated by reference to Exhibit 2.2 to the Company’s Current Report on Form 8-K filed on April 29, 2003) | |
| 10.2 | Servicing Agreement, dated as of April 15, 2003, between Saks Fifth Avenue, Inc. (successor by merger to Jackson Office Properties, Inc., which was the successor to McRae’s, Inc.) and Household Corporation (incorporated by reference to Exhibit 2.3 to the Company’s Current Report on Form 8-K filed on April 29, 2003) | |
| 10.3 | First Amendment to Servicing Agreement, dated May 27, 2005, between Household Corporation and Saks Fifth Avenue, Inc. (successor by merger to Jackson Office Properties, Inc., which was the successor to McRae’s, Inc.) (incorporated by reference to Exhibit 10.6.1 to the Company’s Annual Report on Form 10-K for the fiscal year ended February 2, 2008 (the “2008 10-K”)) | |
| 10.4 | Amendment to Servicing Agreement, dated April 4, 2007, between Household Corporation and Saks Fifth Avenue, Inc. (successor by merger to Jackson Office Properties, Inc., which was the successor to McRae’s, Inc.) and Program Agreement between the Company, Saks Fifth Avenue, Inc. (successor by merger to Jackson Office Properties, Inc., which was the successor to McRae’s, Inc.), and HSBC Bank Nevada, National Association (incorporated by reference from the Exhibit 10.7.4 to the 2008 10-K) | |
| 10.5 | Program Agreement, dated as of April 15, 2003, among the Company, Saks Fifth Avenue, Inc. (successor by merger to Jackson Office Properties, Inc., which was the successor to McRae’s, Inc.) and Household Bank (SB), N.A. (incorporated by reference from the Exhibit 2.4 to the Company’s Current Report on Form 8-K filed on April 29, 2003) | |
| 10.6 | Second Amendment to Program Agreement, dated as of June 15, 2004, between Household Bank (SB), N.A., the Company and Saks Fifth Avenue, Inc. (successor by merger to Jackson Office Properties, Inc., which was the successor to McRae’s, Inc.) (incorporated by reference to Exhibit 10.7.1 to the 2008 10-K) | |
| 10.7 | Third Amendment to Program Agreement, dated as of August 24, 2005, between the Company, Saks Fifth Avenue, Inc. (successor by merger to Jackson Office Properties, Inc., which was the successor to McRae’s, Inc.), and HSBC Bank Nevada, National Association (incorporated by reference to Exhibit 10.7.2 to the 2008 10-K) | |
| 10.8 | Fourth Amendment to Program Agreement, dated as of November 28, 2007, between the Company, Saks Fifth Avenue, Inc. (successor by merger to Jackson Office Properties, Inc., which was the successor to McRae’s, Inc.), and HSBC Bank Nevada, National Association (incorporated by reference to Exhibit 10.7.3 to the 2008 10-K) | |
| 10.9 | Fifth Amendment to the Program Agreement, dated as of October 19, 2009, among the Company, Saks Fifth Avenue, Inc. (successor by merger to Jackson Office Properties, Inc.), and HSBC Bank Nevada, N.A. (incorporated by reference to Exhibit 99.1 to the Company’s Current Report on Form 8-K filed on October 21, 2009) | |
| 10.10 | Second Amended and Restated Credit Agreement, dated as of November 23, 2009, among the Company, the other Borrowers named therein, the various financial institutions now or hereafter parties thereto, as Lenders, Wells Fargo Retail Finance, LLC, as Agent, Wells Fargo Retail Finance, LLC and General Electric Capital Corporation, as Co-Collateral Agents, Regions Bank, as Syndication Agent, and UBS Securities LLC and General Electric Capital Corporation, as Co-Documentation Agents (incorporated by reference to Exhibit 99.1 to the Company’s Current Report on Form 8-K filed on November 24, 2009) | |
51
Table of Contents
| Exhibit No. |
Description | |
| MANAGEMENT CONTRACTS, COMPENSATORY PLANS OR ARRANGEMENTS, ETC. | ||
| 10.11 | Saks Incorporated Amended and Restated 1994 Long-Term Incentive Plan (incorporated by reference to Exhibit 10.53 to the Company’s Annual Report on Form 10-K for the fiscal year ended January 30, 1999) | |
| 10.12 | Saks Incorporated Amended and Restated 1997 Stock-Based Incentive Plan (incorporated by reference to Exhibit 10 to the Company’s Annual Report on Form 10-K for the fiscal year ended February 3, 2001) | |
| 10.13 | Saks Incorporated 2004 Long-Term Incentive Plan (the “2004 LTIP”) (incorporated by reference to Exhibit 4.4 to the Company’s Registration Statement on Form S-8 (File No. 333-116563) filed on June 17, 2004) | |
| 10.14 | Amendment No. 1 to the 2004 LTIP (incorporated by reference to Exhibit 10.3 to the Company’s Current Report on Form 8-K filed on July 31, 2007) | |
| 10.15 | Saks Incorporated 2009 Long-Term Incentive Plan (the “2009 LTIP”) (incorporated by reference to Exhibit 4.4 to the Company’s Registration Statement on Form S-8 (File No. 333-159952) filed on June 12, 2009) | |
| 10.16 | Form of Stock Option Agreement under the 2009 LTIP (incorporated by reference to Exhibit 10.1 to the Company’s Quarterly Report on Form 10-Q for the quarterly period ended October 31, 2009 (the “2009 Third Quarter 10-Q”)) | |
| 10.17 | Form of Stock Option Grant Document under the 2009 LTIP (incorporated by reference to Exhibit 10.2 to the 2009 Third Quarter 10-Q) | |
| 10.18 | Form of Restricted Stock Agreement under the 2009 LTIP (incorporated by reference to Exhibit 10.3 to the 2009 Third Quarter 10-Q) | |
| 10.19 | Form of Supplement to Restricted Stock Agreement under the 2009 LTIP (incorporated by reference to Exhibit 10.4 to the 2009 Third Quarter 10-Q) | |
| 10.20 | Form of Performance Award Agreement under the 2009 LTIP (incorporated by reference to Exhibit 10.5 to the 2009 Third Quarter 10-Q) | |
| 10.21 | Form of Supplement to Performance Award Agreement under the 2009 LTIP (incorporated by reference to Exhibit 10.6 to the 2009 Third Quarter 10-Q) | |
| 10.22 | 2007 Saks Incorporated Senior Executive Incentive Bonus Plan (incorporated by reference to Exhibit 10.1 to the Company’s Current Report on Form 8-K filed on June 7, 2007) | |
| 10.23 | Saks Incorporated Amended and Restated Employee Stock Purchase Plan, effective September 16, 2008 (incorporated by reference to Exhibit 10.1 to the Company’s Quarterly Report on Form 10-Q for the quarterly period ended November 1, 2008) | |
| 10.24 | Saks Incorporated Amended and Restated Deferred Compensation Plan, effective January 1, 2009 (incorporated by reference to Exhibit 10.16 to the 2009 10-K) | |
| 10.25 | Saks Incorporated Severance Plan, effective as of November 1, 2007 (incorporated by reference to Exhibit 10.2 to the Company’s Quarterly Report on Form 10-Q for the quarterly period ended November 3, 2007) | |
| 10.26 | Form of Indemnification Agreement between the Company, and each of the counterparties thereto (incorporated by reference to Exhibit 10.37 to the Company’s Annual Report on Form 10-K for the fiscal year ended January 28, 2006) | |
52
Table of Contents
| Exhibit No. |
Description | |
| 10.27 | Employment Agreement, dated as of July 31, 2007, between the Company and Stephen I. Sadove, Chief Executive Officer (incorporated by reference to Exhibit 10.1 to the Company’s Current Report on Form 8-K filed on July 31, 2007) | |
| 10.28 | Amendment to Employment Agreement, dated as of December 16, 2008, between the Company and Stephen I. Sadove, Chief Executive Officer (incorporated by reference to Exhibit 10.35.1 to the 2009 10-K) | |
| 10.29 | Amendment to Employment Agreement, dated April 9, 2009, between the Company and Stephen I. Sadove, Chairman and Chief Executive Officer, (incorporated by reference to Exhibit 10.2 to the Company’s Quarterly Report on Form 10-Q for quarterly period ended May 2, 2009 (the “2009 First Quarter 10-Q”)) | |
| 10.30 | Employment Agreement, dated as of April 17, 2007, between the Company and Kevin G. Wills, Executive Vice President and Chief Financial Officer (incorporated by reference to Exhibit 99.4 to the Company’s Current Report on Form 8-K filed on April 19, 2007) | |
| 10.31 | Amendment to Employment Agreement, dated as of December 18, 2008, between the Company and Kevin G. Wills, Executive Vice President and Chief Financial Officer (incorporated by reference to Exhibit 10.32.1 to the 2009 10-K) | |
| 10.32 | Amendment to Employment Agreement, dated April 9, 2009, between the Company and Kevin G. Wills, Executive Vice President and Chief Financial Officer (incorporated by reference to Exhibit 10.4 to the 2009 First Quarter 10-Q) | |
| 10.33 | Employment Agreement, dated as of July 31, 2007, between the Company and Ronald L. Frasch, President and Chief Merchandising Officer (incorporated by reference to the Exhibit 10.2 to the Company’s Current Report on Form 8-K filed on July 31, 2007) | |
| 10.34 | Amendment to Employment Agreement, dated as of December 18, 2008, between the Company and Ronald L. Frasch, President and Chief Merchandising Officer (incorporated by reference to Exhibit 10.36.1 to the 2009 10-K) | |
| 10.35 | Amendment to Employment Agreement, dated April 9, 2009, between the Company and Ronald L. Frasch, President and Chief Merchandising Officer (incorporated by reference to Exhibit 10.3 to the 2009 First Quarter 10-Q) | |
| 10.36 | Employment Agreement, dated as of October 9, 2007, between the Company and Michael Rodgers, Executive Vice President, IT Operations (incorporated by reference to Exhibit 10.41 to the 2009 10-K) | |
| 10.37 | Amendment to Employment Agreement, dated as of December 17, 2008, between the Company and Michael Rodgers (incorporated by reference to Exhibit 10.41.1 to the 2009 10-K) | |
| 10.38 | Form of Employment Agreement for Executive Officers (incorporated by reference to Exhibit 10.1 to the Company’s Quarterly Report on Form 10-Q filed on December 6, 2007) | |
| 21.1 | Subsidiaries of the registrant * | |
| 23.1 | Consents of Independent Registered Public Accounting Firm * | |
| 31.1 | Certification of the principal executive officer pursuant to Section 302 of the Sarbanes-Oxley Act of 2002 * | |
| 31.2 | Certification of the principal accounting officer pursuant to Section 302 of the Sarbanes-Oxley Act of 2002 * | |
53
Table of Contents
| Exhibit No. |
Description | |
| 32.1 | Certification of principal executive officer pursuant to Section 906 of the Sarbanes-Oxley Act of 2002 * | |
| 32.2 | Certification of the principal accounting officer pursuant to Section 906 of the Sarbanes-Oxley Act of 2002 * | |
| 99.1 | Saks Incorporated Employee Stock Purchase Plan Financial Statements for the years ended December 31, 2009 and December 31, 2008 * | |
| * | Filed herewith |
54
Table of Contents
SAKS INCORPORATED & SUBSIDIARIES
INDEX TO CONSOLIDATED FINANCIAL STATEMENTS
| Page | ||
| Consolidated Financial Statements |
||
| F-2 | ||
F-3 | ||
| Consolidated Balance Sheets at January 30, 2010 and January 31, 2009 |
F-4 | |
F-5 | ||
F-6 | ||
| F-7 | ||
| Financial Statement Schedule |
||
| F-47 | ||
All other schedules for which provision is made in the applicable accounting regulation of the Securities and Exchange Commission are not required under the related instructions or are inapplicable and therefore have been omitted.
F-1
Table of Contents
Report of Independent Registered Public Accounting Firm
To the Board of Directors and Shareholders of Saks Incorporated:
In our opinion, the consolidated financial statements listed in the accompanying index present fairly, in all material respects, the financial position of Saks Incorporated and its subsidiaries at January 30, 2010 and January 31, 2009, and the results of their operations and their cash flows for each of the three years in the period ended January 30, 2010 in conformity with accounting principles generally accepted in the United States of America. In addition, in our opinion, the financial statement schedule listed in the accompanying index presents fairly, in all material respects, the information set forth therein when read in conjunction with the related consolidated financial statements. Also in our opinion, the Company maintained, in all material respects, effective internal control over financial reporting as of January 30, 2010 based on criteria established in Internal Control—Integrated Framework issued by the Committee of Sponsoring Organizations of the Treadway Commission (COSO). The Company’s management is responsible for these financial statements and financial statement schedule, for maintaining effective internal control over financial reporting and for its assessment of the effectiveness of internal control over financial reporting, included in Management’s Report on Internal Control over Financial Reporting appearing under Item 9A. Our responsibility is to express opinions on these financial statements, on the financial statement schedule, and on the Company’s internal control over financial reporting based on our integrated audits. We conducted our audits in accordance with the standards of the Public Company Accounting Oversight Board (United States). Those standards require that we plan and perform the audits to obtain reasonable assurance about whether the financial statements are free of material misstatement and whether effective internal control over financial reporting was maintained in all material respects. Our audits of the financial statements included examining, on a test basis, evidence supporting the amounts and disclosures in the financial statements, assessing the accounting principles used and significant estimates made by management, and evaluating the overall financial statement presentation. Our audit of internal control over financial reporting included obtaining an understanding of internal control over financial reporting, assessing the risk that a material weakness exists, and testing and evaluating the design and operating effectiveness of internal control based on the assessed risk. Our audits also included performing such other procedures as we considered necessary in the circumstances. We believe that our audits provide a reasonable basis for our opinions.
As discussed in Note 6 to the consolidated financial statements, effective February 1, 2009, the Company changed the manner in which it accounts for convertible debt instruments that may be settled in cash upon conversion. As discussed in Note 5 to the consolidated financial statements, effective February 4, 2007, the Company changed the manner in which it accounts for uncertain tax positions.
A company’s internal control over financial reporting is a process designed to provide reasonable assurance regarding the reliability of financial reporting and the preparation of financial statements for external purposes in accordance with generally accepted accounting principles. A company’s internal control over financial reporting includes those policies and procedures that (i) pertain to the maintenance of records that, in reasonable detail, accurately and fairly reflect the transactions and dispositions of the assets of the company; (ii) provide reasonable assurance that transactions are recorded as necessary to permit preparation of financial statements in accordance with generally accepted accounting principles, and that receipts and expenditures of the company are being made only in accordance with authorizations of management and directors of the company; and (iii) provide reasonable assurance regarding prevention or timely detection of unauthorized acquisition, use, or disposition of the company’s assets that could have a material effect on the financial statements.
Because of its inherent limitations, internal control over financial reporting may not prevent or detect misstatements. Also, projections of any evaluation of effectiveness to future periods are subject to the risk that controls may become inadequate because of changes in conditions, or that the degree of compliance with the policies or procedures may deteriorate.

Birmingham, Alabama
March 18, 2010
F-2
Table of Contents
SAKS INCORPORATED & SUBSIDIARIES
CONSOLIDATED STATEMENTS OF INCOME
| (In Thousands, except per share amounts) |
Year Ended | |||||||||||
| January 30, 2010 |
January 31, 2009 (Revised) |
February 2, 2008 (Revised) |
||||||||||
| NET SALES |
$ | 2,631,532 | $ | 3,043,438 | $ | 3,237,275 | ||||||
| Cost of sales (excluding depreciation and amortization) |
1,668,097 | 2,062,494 | 1,972,251 | |||||||||
| Gross margin |
963,435 | 980,944 | 1,265,024 | |||||||||
| Selling, general and administrative expenses |
674,306 | 784,510 | 840,823 | |||||||||
| Other operating expenses |
||||||||||||
| Property and equipment rentals |
101,756 | 101,063 | 100,106 | |||||||||
| Depreciation and amortization |
135,162 | 134,694 | 131,737 | |||||||||
| Taxes other than income taxes |
75,271 | 82,598 | 84,496 | |||||||||
| Store pre-opening costs |
2,077 | 2,328 | 707 | |||||||||
| Impairments and dispositions |
29,348 | 11,139 | 4,279 | |||||||||
| OPERATING INCOME (LOSS) |
(54,485 | ) | (135,388 | ) | 102,876 | |||||||
| Interest expense |
(49,480 | ) | (45,739 | ) | (48,303 | ) | ||||||
| Gain (loss) on extinguishment of debt |
783 | — | (5,634 | ) | ||||||||
| Other income, net |
1,019 | 5,600 | 24,912 | |||||||||
| INCOME (LOSS) FROM CONTINUING OPERATIONS BEFORE INCOME TAXES |
(102,163 | ) | (175,527 | ) | 73,851 | |||||||
| Provision (benefit) for income taxes |
(44,501 | ) | (48,902 | ) | 26,755 | |||||||
| INCOME (LOSS) FROM CONTINUING OPERATIONS |
(57,662 | ) | (126,625 | ) | 47,096 | |||||||
| DISCONTINUED OPERATIONS: |
||||||||||||
| Loss from discontinued operations |
(395 | ) | (52,727 | ) | (4,860 | ) | ||||||
| Benefit for income taxes |
(138 | ) | (20,548 | ) | (1,646 | ) | ||||||
| LOSS FROM DISCONTINUED OPERATIONS |
(257 | ) | (32,179 | ) | (3,214 | ) | ||||||
| NET INCOME (LOSS) |
$ | (57,919 | ) | $ | (158,804 | ) | $ | 43,882 | ||||
| Per share amounts — Basic |
||||||||||||
| Income (loss) from continuing operations |
$ | (0.40 | ) | $ | (0.92 | ) | $ | 0.33 | ||||
| Loss from discontinued operations |
$ | — | $ | (0.23 | ) | $ | (0.02 | ) | ||||
| Net income (loss) |
$ | (0.40 | ) | $ | (1.15 | ) | $ | 0.31 | ||||
| Per share amounts — Diluted |
||||||||||||
| Income (loss) from continuing operations |
$ | (0.40 | ) | $ | (0.92 | ) | $ | 0.31 | ||||
| Loss from discontinued operations |
$ | — | $ | (0.23 | ) | $ | (0.02 | ) | ||||
| Net income (loss) |
$ | (0.40 | ) | $ | (1.15 | ) | $ | 0.29 | ||||
| Weighted average common shares: |
||||||||||||
| Basic |
143,194 | 138,384 | 140,402 | |||||||||
| Diluted |
143,194 | 138,384 | 153,530 | |||||||||
The accompanying notes are an integral part of these consolidated financial statements.
F-3
Table of Contents
SAKS INCORPORATED & SUBSIDIARIES
CONSOLIDATED BALANCE SHEETS
| (In Thousands, except per share amounts) |
January 30, 2010 |
January 31, 2009 (Revised) |
||||||
| ASSETS |
||||||||
| CURRENT ASSETS |
||||||||
| Cash and cash equivalents |
$ | 147,301 | $ | 10,273 | ||||
| Merchandise inventories |
649,196 | 728,841 | ||||||
| Other current assets |
93,479 | 105,350 | ||||||
| Deferred income taxes, net |
35,974 | 29,916 | ||||||
| TOTAL CURRENT ASSETS |
925,950 | 874,380 | ||||||
| PROPERTY AND EQUIPMENT, NET OF DEPRECIATION |
956,082 | 1,058,393 | ||||||
| DEFERRED INCOME TAXES, NET |
221,354 | 194,956 | ||||||
| OTHER ASSETS |
32,315 | 19,948 | ||||||
| TOTAL ASSETS |
$ | 2,135,701 | $ | 2,147,677 | ||||
| LIABILITIES AND SHAREHOLDERS’ EQUITY |
||||||||
| CURRENT LIABILITIES |
||||||||
| Accounts payable |
$ | 101,739 | $ | 90,208 | ||||
| Accrued expenses |
200,020 | 233,504 | ||||||
| Accrued compensation and related items |
50,165 | 42,043 | ||||||
| Current portion of long-term debt |
27,857 | 4,673 | ||||||
| TOTAL CURRENT LIABILITIES |
379,781 | 370,428 | ||||||
| LONG-TERM DEBT |
493,330 | 593,103 | ||||||
| OTHER LONG-TERM LIABILITIES |
190,980 | 193,560 | ||||||
| COMMITMENTS AND CONTINGENCIES |
— | — | ||||||
| SHAREHOLDERS’ EQUITY |
||||||||
| Preferred stock — $1.00 par value; Authorized — 10,000 shares; Issued and outstanding — none |
— | — | ||||||
| Common stock — $0.10 par value; Authorized — 500,000 shares; Issued and outstanding — 159,786 shares and 142,170 shares |
15,979 | 14,218 | ||||||
| Additional paid-in capital |
1,277,773 | 1,148,227 | ||||||
| Accumulated other comprehensive loss |
(48,800 | ) | (56,436 | ) | ||||
| Accumulated deficit |
(173,342 | ) | (115,423 | ) | ||||
| TOTAL SHAREHOLDERS’ EQUITY |
1,071,610 | 990,586 | ||||||
| TOTAL LIABILITIES AND SHAREHOLDERS’ EQUITY |
$ | 2,135,701 | $ | 2,147,677 | ||||
The accompanying notes are an integral part of these consolidated financial statements.
F-4
Table of Contents
SAKS INCORPORATED & SUBSIDIARIES
CONSOLIDATED STATEMENTS OF CHANGES IN SHAREHOLDERS’ EQUITY
| (In Thousands) |
Common Stock Shares |
Common Stock Amount |
Additional Paid-In Capital |
Retained Earnings (Accumulated Deficit) |
Accumulated Other Comprehensive Loss |
Total Shareholders’ Equity |
|||||||||||||||||
| Balance at February 3, 2007, as reported |
140,440 | $ | 14,048 | $ | 1,097,817 | $ | 12,620 | $ | (28,346 | ) | $ | 1,096,139 | |||||||||||
| Adoption of ASC 470 (Note 2) |
— | — | 43,028 | (10,608 | ) | — | 32,420 | ||||||||||||||||
| Balance at February 3, 2007, revised |
140,440 | $ | 14,048 | $ | 1,140,845 | $ | 2,012 | $ | (28,346 | ) | $ | 1,128,559 | |||||||||||
| Net income |
43,882 | 43,882 | |||||||||||||||||||||
| Change in minimum pension liability, net of tax |
13,344 | 13,344 | |||||||||||||||||||||
| Comprehensive income |
57,226 | ||||||||||||||||||||||
| Adoption of accounting for uncertain tax positions |
36,528 | (2,858 | ) | 33,670 | |||||||||||||||||||
| Issuance of common stock |
2,930 | 293 | 34,014 | 34,307 | |||||||||||||||||||
| Income tax provision adjustment related to employee stock plans |
(454 | ) | (454 | ) | |||||||||||||||||||
| Increase in tax valuation allowance |
(19,258 | ) | (19,258 | ) | |||||||||||||||||||
| Net activity under stock compensation plans |
136 | 11 | (9,887 | ) | (9,876 | ) | |||||||||||||||||
| Stock-based compensation |
7,724 | 7,724 | |||||||||||||||||||||
| Repurchase of common stock |
(1,722 | ) | (172 | ) | (27,292 | ) | (27,464 | ) | |||||||||||||||
| Balance at February 2, 2008 |
141,784 | $ | 14,180 | $ | 1,162,220 | $ | 43,036 | $ | (15,002 | ) | $ | 1,204,434 | |||||||||||
| Net loss |
(158,804 | ) | (158,804 | ) | |||||||||||||||||||
| Change in minimum pension liability, net of tax |
(41,434 | ) | (41,434 | ) | |||||||||||||||||||
| Comprehensive loss |
(200,238 | ) | |||||||||||||||||||||
| Pension measurement date change |
345 | 345 | |||||||||||||||||||||
| Issuance of common stock |
636 | 64 | 4,025 | 4,089 | |||||||||||||||||||
| Income tax provision adjustment related to employee stock plans |
1,352 | 1,352 | |||||||||||||||||||||
| Net activity under stock compensation plans |
2,699 | 269 | (1,130 | ) | (861 | ) | |||||||||||||||||
| Stock-based compensation |
16,354 | 16,354 | |||||||||||||||||||||
| Repurchase of common stock |
(2,949 | ) | (295 | ) | (34,594 | ) | (34,889 | ) | |||||||||||||||
| Balance at January 31, 2009 |
142,170 | $ | 14,218 | $ | 1,148,227 | $ | (115,423 | ) | $ | (56,436 | ) | $ | 990,586 | ||||||||||
| Net loss |
(57,919 | ) | (57,919 | ) | |||||||||||||||||||
| Change in minimum pension liability, net of tax |
7,636 | 7,636 | |||||||||||||||||||||
| Comprehensive loss |
(50,283 | ) | |||||||||||||||||||||
| Issuance of common stock, net |
15,097 | 1,509 | 94,689 | 96,198 | |||||||||||||||||||
| Income tax provision adjustment related to employee stock plans |
(2,491 | ) | (2,491 | ) | |||||||||||||||||||
| Issuance of 7.5% Convertible Notes |
21,147 | 21,147 | |||||||||||||||||||||
| Net activity under stock compensation plans |
2,519 | 252 | (645 | ) | (393 | ) | |||||||||||||||||
| Stock-based compensation |
16,846 | 16,846 | |||||||||||||||||||||
| Balance at January 30, 2010 |
159,786 | $ | 15,979 | $ | 1,277,773 | $ | (173,342 | ) | $ | (48,800 | ) | $ | 1,071,610 | ||||||||||
The accompanying notes are an integral part of these consolidated financial statements.
F-5
Table of Contents
SAKS INCORPORATED & SUBSIDIARIES
CONSOLIDATED STATEMENTS OF CASH FLOWS
| Year Ended | ||||||||||||
| (In Thousands) |
January 30, 2010 |
January 31, 2009 (Revised) |
February 2, 2008 (Revised) |
|||||||||
| OPERATING ACTIVITIES |
||||||||||||
| Net income (loss) |
$ | (57,919 | ) | $ | (158,804 | ) | $ | 43,882 | ||||
| Loss from discontinued operations |
(257 | ) | (32,179 | ) | (3,214 | ) | ||||||
| Income (loss) from continuing operations |
(57,662 | ) | (126,625 | ) | 47,096 | |||||||
| Adjustments to reconcile net income (loss) to net cash provided by (used in) operating activities: |
||||||||||||
| Loss (gain) on extinguishment of debt |
(783 | ) | — | 5,634 | ||||||||
| Depreciation and amortization |
135,162 | 134,694 | 131,737 | |||||||||
| Equity compensation |
16,846 | 16,354 | 7,724 | |||||||||
| Amortization of discount on convertible notes |
9,819 | 6,811 | 6,404 | |||||||||
| Deferred income taxes |
(40,585 | ) | (49,780 | ) | 23,788 | |||||||
| Impairments and dispositions |
29,348 | 11,139 | 4,279 | |||||||||
| Gain on lease termination |
— | — | (1,669 | ) | ||||||||
| Gain on sale of property |
(628 | ) | (3,400 | ) | (1,069 | ) | ||||||
| Changes in operating assets and liabilities: |
||||||||||||
| Merchandise inventories |
79,645 | 118,539 | (71,032 | ) | ||||||||
| Other current assets |
11,409 | 20,990 | 12,495 | |||||||||
| Accounts payable and accrued liabilities |
13,577 | (114,577 | ) | (119,846 | ) | |||||||
| Other operating assets and liabilities |
9,727 | 3,025 | 21,858 | |||||||||
| Net Cash Provided By Operating Activities — Continuing Operations |
205,875 | 17,170 | 67,399 | |||||||||
| Net Cash Provided By (Used In) Operating Activities — Discontinued Operations |
(13,670 | ) | (18,667 | ) | 4,080 | |||||||
| NET CASH PROVIDED BY (USED IN) OPERATING ACTIVITIES |
192,205 | (1,497 | ) | 71,479 | ||||||||
| INVESTING ACTIVITIES |
||||||||||||
| Purchases of property and equipment |
(74,577 | ) | (127,305 | ) | (136,726 | ) | ||||||
| Proceeds from sale of property and equipment |
643 | 4,338 | 12,352 | |||||||||
| Net Cash Used In Investing Activities — Continuing Operations |
(73,934 | ) | (122,967 | ) | (124,374 | ) | ||||||
| Net Cash Used In Investing Activities — Discontinued Operations |
— | (1,875 | ) | (4,259 | ) | |||||||
| NET CASH USED IN INVESTING ACTIVITIES |
(73,934 | ) | (124,842 | ) | (128,633 | ) | ||||||
| FINANCING ACTIVITIES |
||||||||||||
| Proceeds from issuance of convertible senior notes |
120,000 | — | — | |||||||||
| Payments of deferred financing costs |
(13,105 | ) | — | — | ||||||||
| Proceeds from (payments on) revolving credit facility |
(156,675 | ) | 156,675 | — | ||||||||
| Payments on long-term debt and capital lease obligations |
(26,881 | ) | (89,242 | ) | (118,980 | ) | ||||||
| Cash dividends paid |
(781 | ) | (1,183 | ) | (7,430 | ) | ||||||
| Purchases of common stock |
— | (34,889 | ) | (27,464 | ) | |||||||
| Net proceeds from issuance of common stock |
96,199 | 4,089 | 34,307 | |||||||||
| Net Cash Provided By (Used In) Financing Activities — Continuing Operations |
18,757 | 35,450 | (119,567 | ) | ||||||||
| Net Cash Used In Financing Activities — Discontinued Operations |
— | — | — | |||||||||
| NET CASH PROVIDED BY (USED IN) FINANCING ACTIVITIES |
18,757 | 35,450 | (119,567 | ) | ||||||||
| INCREASE (DECREASE) IN CASH AND CASH EQUIVALENTS |
137,028 | (90,889 | ) | (176,721 | ) | |||||||
| CASH AND CASH EQUIVALENTS AT BEGINNING OF YEAR |
10,273 | 101,162 | 277,883 | |||||||||
| CASH AND CASH EQUIVALENTS AT END OF YEAR |
$ | 147,301 | $ | 10,273 | $ | 101,162 | ||||||
Non-cash investing and financing activities are further described in the accompanying notes.
The accompanying notes are an integral part of these consolidated financial statements.
F-6
Table of Contents
SAKS INCORPORATED & SUBSIDIARIES
NOTES TO CONSOLIDATED FINANCIAL STATEMENTS
(In thousands, except per share amounts)
NOTE 1 — GENERAL
ORGANIZATION
The Company’s operations consist of Saks Fifth Avenue (“SFA”), Saks Fifth Avenue OFF 5TH (“OFF 5TH”), and SFA’s e-commerce operations. Previously, the Company also operated Club Libby Lu (“CLL”) (the operations of which were discontinued in January 2009).
DISCONTINUED OPERATIONS
As of January 31, 2009, the Company discontinued the operations of its CLL business, which consisted of 98 leased, mall-based specialty stores, targeting girls aged 4-12 years old. Charges incurred during 2008 associated with the closing of these stores totaled $44,521 and included inventory liquidation costs of approximately $6,965, asset impairments charges of $16,993, lease termination costs of $14,045, severance and personnel related costs of $5,074 and other closing costs of $1,444. These amounts and the results of operations of CLL are included in discontinued operations in the Consolidated Statements of Income and the Consolidated Statements of Cash Flows for fiscal years 2009, 2008, and 2007.
Net sales of the aforementioned business included within discontinued operations in the accompanying Consolidated Statements of Income are $0, $52,231, and $58,564 for 2009, 2008, and 2007, respectively.
NOTE 2 — SUMMARY OF SIGNIFICANT ACCOUNTING POLICIES
The preparation of financial statements in conformity with generally accepted accounting principles (“GAAP”) requires management to make estimates and assumptions that affect the reported amounts of assets and liabilities and disclosure of contingent assets and liabilities at the date of the financial statements and the reported amounts of revenues and expenses during the reporting period. Actual results could differ from these estimates.
The accompanying consolidated financial statements include the accounts of the Company and its subsidiaries. All intercompany accounts and transactions have been eliminated in consolidation.
The Company’s fiscal year ends on the Saturday closest to January 31. Fiscal years 2009, 2008, and 2007 ended on January 30, 2010, January 31, 2009, and February 2, 2008, respectively.
During the preparation of our condensed consolidated financial statements for the quarterly period ended October 31, 2009, the Company identified a classification error in our Consolidated Statements of Income for the year ended January 31, 2009 and prior periods and the quarterly periods therein. The Company improperly included certain shipping and handling revenue in Selling, General and Administrative expenses (“SG&A”). The Company corrected this error in our Consolidated Statements of Income by adjusting Net Sales and SG&A to reflect all shipping and handling revenue in Net Sales. The adjustment to increase Net Sales and SG&A for the year ended January 31, 2009 and February 2, 2008 was $13,695 and $13,199, respectively. This adjustment had no effect on Operating Income (loss), Income (loss) from Continuing Operations, or Net Income (loss) for the periods adjusted. The Company does not believe these adjustments are material to the Consolidated Statements of Income for the year ended January 31, 2009, February 2, 2008, or to any prior period’s Consolidated Statements of Income or the financial statements taken as a whole.
F-7
Table of Contents
SAKS INCORPORATED & SUBSIDIARIES
NOTES TO CONSOLIDATED FINANCIAL STATEMENTS—(Continued)
(In thousands, except per share amounts)
Certain reclassifications were made to prior period amounts to conform to the current year presentation.
ADOPTION OF NEW ACCOUNTING PRONOUNCEMENTS
Effective February 1, 2009, the Company retrospectively adopted Financial Accounting Standards Board (“FASB”) Accounting Standards Codification (“ASC”) 470 related to accounting for convertible debt instruments that may be settled in cash upon conversion (including partial cash settlement) (“ASC 470”). In March 2004, the Company issued $230,000 of 2.00% convertible senior notes that mature in 2024 (the “2.0% Convertible Senior Notes”). The 2.0% Convertible Senior Notes are within the scope of ASC 470, which requires an allocation of convertible debt proceeds between the liability component and the embedded conversion option (i.e., the equity component). The liability component of the debt instrument is accreted to par value using the effective interest method over the remaining life of the debt (the first put date in 2014). The accretion is reported as a component of interest expense. The equity component is not subsequently revalued as long as it continues to qualify for equity treatment.
Upon adoption of ASC 470, the Company estimated the fair value, as of the date of issuance, of the 2.0% Convertible Senior Notes assuming a 6.25% non-convertible borrowing rate to be $158,148. The difference between the fair value and the principal amount of the 2.0% Convertible Senior Notes was $71,852. This amount was retrospectively recorded as a debt discount and as an increase to additional paid-in capital as of the issuance date. The discount is being accreted to interest expense over the ten-year period to the first put date of the notes in 2014 resulting in an increase in non-cash interest expense in prior and future periods.
The following tables set forth the effect of the retrospective application of ASC 470 on certain previously reported items.
Condensed Consolidated Statements of Income:
| Year Ended | ||||||||||||||||
| January 31, 2009 | February 2, 2008 | |||||||||||||||
| As Reported (1) |
As Revised |
As Reported (1) |
As Revised |
|||||||||||||
| Interest expense |
$ | (39,306 | ) | $ | (45,739 | ) | $ | (42,314 | ) | $ | (48,303 | ) | ||||
| Income (loss) from continuing operations before income taxes |
$ | (169,094 | ) | $ | (175,527 | ) | $ | 79,840 | $ | 73,851 | ||||||
| Provision (benefit) for income taxes for continuing operations |
$ | (46,332 | ) | $ | (48,902 | ) | $ | 29,153 | $ | 26,755 | ||||||
| Income (loss) from continuing operations |
$ | (122,762 | ) | $ | (126,625 | ) | $ | 50,687 | $ | 47,096 | ||||||
| Net income (loss) |
$ | (154,941 | ) | $ | (158,804 | ) | $ | 47,473 | $ | 43,882 | ||||||
| Per share amounts — Basic |
||||||||||||||||
| Income (loss) from continuing operations |
$ | (0.89 | ) | $ | (0.92 | ) | $ | 0.36 | $ | 0.33 | ||||||
| Net income (loss) |
$ | (1.12 | ) | $ | (1.15 | ) | $ | 0.34 | $ | 0.31 | ||||||
| Per share amounts — Diluted |
||||||||||||||||
| Income (loss) from continuing operations |
$ | (0.89 | ) | $ | (0.92 | ) | $ | 0.33 | $ | 0.31 | ||||||
| Net income (loss) |
$ | (1.12 | ) | $ | (1.15 | ) | $ | 0.31 | $ | 0.29 | ||||||
| (1) | As revised for discontinued operations. |
F-8
Table of Contents
SAKS INCORPORATED & SUBSIDIARIES
NOTES TO CONSOLIDATED FINANCIAL STATEMENTS—(Continued)
(In thousands, except per share amounts)
Condensed Consolidated Balance Sheet:
| January 31, 2009 | ||||||||
| As Reported | As Revised | |||||||
| Property and equipment, net |
$ | 1,057,417 | $ | 1,058,393 | ||||
| Other assets |
$ | 21,378 | $ | 19,948 | ||||
| Deferred income taxes, net |
$ | 211,833 | $ | 194,956 | ||||
| Long-term debt |
$ | 635,400 | $ | 593,103 | ||||
| Additional paid-in capital |
$ | 1,105,199 | $ | 1,148,227 | ||||
| Retained earnings (accumulated deficit) |
$ | (97,361 | ) | $ | (115,423 | ) | ||
On February 1, 2009, the Company retrospectively adopted a new accounting standard which addresses whether instruments granted in share-based payment awards are participating securities prior to vesting, and therefore, need to be included in the earnings allocation when computing earnings per share under the two-class method. In accordance with the new accounting standard, the unvested share-based payment awards that contain non-forfeitable rights to dividends or dividend equivalents (whether paid or unpaid) are participating securities and have be included in the computation of earnings per share pursuant to the two-class method. The retrospective adoption of the new accounting standard did not have a material impact on the Company’s consolidated financial statements for the years ended January 31, 2009 and February 2, 2008.
In May 2009, the FASB issued guidance regarding subsequent events, which was subsequently updated in February 2010. This guidance established general standards of accounting for and disclosure of events that occur after the balance sheet date but before financial statements are issued or are available to be issued. In particular, this guidance sets forth the period after the balance sheet date during which management of a reporting entity should evaluate events or transactions that may occur for potential recognition or disclosure in the financial statements, the circumstances under which an entity should recognize events or transactions occurring after the balance sheet date in its financial statements, and the disclosures that an entity should make about events or transactions that occurred after the balance sheet date. This guidance was effective for financial statements issued for fiscal years and interim periods ending after June 15, 2009, and was therefore adopted by the Company for the second quarter 2009 reporting. The adoption did not have a significant impact on the subsequent events that the Company reports, either through recognition or disclosure, in the consolidated financial statements. In February 2010, the FASB amended its guidance on subsequent events to remove the requirement to disclose the date through which an entity has evaluated subsequent events, alleviating conflicts with current Securities and Exchange Commission (“SEC”) guidance. This amendment was effective immediately and therefore the Company did not include the disclosure in this Form 10-K.
In June 2009, the FASB issued the Accounting Standards Codification (the “Codification”). The Codification is the single source of authoritative, U.S. GAAP recognized by the FASB to be applied by nongovernmental entities. The Codification is effective for financial statements issued for interim and annual periods ending after September 15, 2009. The implementation of the Codification did not have an impact on the Company’s consolidated financial statements.
On May 3, 2009, the Company adopted the provisions of a new accounting standard related to disclosures about the fair value of financial instruments, which requires publicly-traded companies to provide disclosures on the fair value of financial instruments in interim financial statements.
F-9
Table of Contents
SAKS INCORPORATED & SUBSIDIARIES
NOTES TO CONSOLIDATED FINANCIAL STATEMENTS—(Continued)
(In thousands, except per share amounts)
On February 1, 2009, the Company adopted the provisions of the fair value measurement standard related to nonfinancial assets and nonfinancial liabilities that are recognized or disclosed at fair value in the financial statements on a nonrecurring basis. The adoption of the new accounting standard did not have a material impact on the Company’s consolidated financial statement for the year ended January 30, 2010.
On February 1, 2009, the Company adopted the provisions of a new accounting standard related to accounting for instruments granted in share-based payment transactions as participating securities. This update provides that unvested share-based payment awards that contain nonforfeitable rights to dividends or dividend equivalents, whether paid or unpaid, are participating securities and shall be included in the computation of both basic and diluted earnings per share. The adoption of this standard did not have a material impact on the Company’s consolidated financial statements for the year ended January 30, 2010.
On February 1, 2009, the Company adopted the provisions of a new accounting standard related to accounting by lessees for nonrefundable maintenance deposits, which clarifies how a lessee shall account for a maintenance deposit under an arrangement accounted for as a lease. The adoption of the new accounting standard did not have a material impact on the Company’s consolidated financial statements for the year ended January 30, 2010.
In December 2008, the FASB issued additional guidance on employers’ disclosures about the plan assets of defined benefit pension or other postretirement plans. The new disclosure requirements include a description of how investment allocation decisions are made, major categories of plan assets, valuation techniques used to measure the fair value of plan assets, the impact of measurement using significant unobservable inputs and concentrations of risk within plan assets. The new disclosure requirements are effective for fiscal years ending after December 15, 2009. See Note 8 for the additional disclosures required in accordance with the adoption of this new accounting standard.
NET SALES
Net sales include sales of merchandise (net of returns and exclusive of sales taxes), commissions from leased departments, shipping and handling revenues related to merchandise sold and breakage income from unredeemed gift cards. Net sales are recognized at the time customers provide a satisfactory form of payment and take ownership of the merchandise or direct its shipment. Revenue associated with gift cards is recognized upon redemption of the card.
The Company estimates the amount of goods that will be returned for a refund and reduces sales and gross margin by that amount.
Commissions from leased departments included in net sales were $27,180, $28,083, and $30,189 in 2009, 2008, and 2007, respectively. Leased department sales were $200,535, $210,284, and $217,636 in 2009, 2008, and 2007, respectively, and were excluded from net sales.
CASH AND CASH EQUIVALENTS
Cash and cash equivalents primarily consist of cash on hand in the stores, deposits with banks, and investments with banks and financial institutions that have original maturities of three months or less. Cash
F-10
Table of Contents
SAKS INCORPORATED & SUBSIDIARIES
NOTES TO CONSOLIDATED FINANCIAL STATEMENTS—(Continued)
(In thousands, except per share amounts)
equivalents are stated at cost, which approximates fair value. Cash equivalents totaled $136,347 and $236 at January 30, 2010 and January 31, 2009, respectively, primarily consisting of money market funds, demand deposits, and time deposits. Income earned on cash equivalents was $358, $1,958, and $6,190 for the fiscal years ended January 30, 2010, January 31, 2009, and February 2, 2008, respectively, and was reflected in Other Income in the accompanying Consolidated Statements of Income. At January 30, 2010, the Company had a $20,000 compensating balance related to the Company’s purchasing card program to ensure future credit availability under that program.
MERCHANDISE INVENTORIES AND COST OF SALES
Merchandise inventories are stated at the lower of cost or market and include freight, buying and distribution costs. The Company takes markdowns related to slow moving inventory, ensuring the appropriate inventory valuation. On February 3, 2008, the Company elected to change its method of costing its inventories to the retail “first-in, first-out” (FIFO) method, whereas in all prior periods inventory was costed using the retail “last-in, first-out” (LIFO) method. The new method of accounting had no impact on the fiscal years ending January 30, 2010 and January 31, 2009 as the LIFO value exceeded the FIFO market value and inventory had been adjusted to reflect FIFO market value in all periods.
The Company regularly records a provision for estimated shrinkage, thereby reducing the carrying value of merchandise inventory. A complete physical inventory of all the Company’s stores and distribution facilities is performed annually, with the recorded amount of merchandise inventory being adjusted to coincide with this physical count. The differences between the estimated amount of shrinkage and the actual amount realized have been insignificant.
The Company receives vendor provided support in different forms. When the vendor provides support for inventory markdowns, the Company records the support as a reduction to cost of sales. Such support is recorded in the period that the corresponding markdowns are taken. When the Company receives inventory-related support that is not designated for markdowns, the Company includes this support as a reduction in the cost of purchases.
Consignment merchandise on hand of $142,928 and $138,762 at January 30, 2010 and January 31, 2009, respectively, is not reflected in the consolidated balance sheets.
SELLING, GENERAL AND ADMINISTRATIVE EXPENSES
SG&A expenses are comprised principally of the costs related to employee compensation and benefits in the selling and administrative support areas, exclusive of payroll taxes; advertising; store and headquarters occupancy, operating and maintenance costs exclusive of rent, depreciation, and property taxes; proprietary credit card promotion, issuance and servicing costs; insurance programs; telecommunications; and other operating expenses not specifically categorized elsewhere in the Consolidated Statements of Income. Advertising and sales promotion costs are generally expensed in the period in which the advertising event takes place. The Company receives allowances and expense reimbursements from merchandise vendors and from the owner of the proprietary credit card portfolio which are netted against the related expense:
| • | Allowances received from merchandise vendors in conjunction with incentive compensation programs for employees who sell the vendors’ merchandise and netted against the related compensation expense were $41,846, $54,653, and $57,348 in 2009, 2008, and 2007, respectively. |
F-11
Table of Contents
SAKS INCORPORATED & SUBSIDIARIES
NOTES TO CONSOLIDATED FINANCIAL STATEMENTS—(Continued)
(In thousands, except per share amounts)
| • | Allowances received from merchandise vendors in conjunction with jointly produced and distributed print and television media and netted against the gross expenditures for such advertising were $33,287, $45,813, and $48,896 in 2009, 2008, and 2007, respectively. Net advertising expenses were $36,025, $39,358, and $42,058 in 2009, 2008, and 2007, respectively. |
| • | Expense reimbursements received from the owner of the Company’s proprietary credit card portfolio are discussed at Note 3 to these financial statements. |
STORE PRE-OPENING COSTS
Store pre-opening costs primarily consist of rent expense incurred during the construction of new stores and payroll and related media costs incurred in connection with new store openings and are expensed when incurred. Rent expense is generally incurred for six to twelve months prior to a store’s opening date.
PROPERTY AND EQUIPMENT
Property and equipment are stated at historical cost less accumulated depreciation. For financial reporting purposes, depreciation is computed principally using the straight-line method over the estimated useful lives of the assets. Buildings and improvements are depreciated over 20 to 40 years while fixtures and equipment are primarily depreciated over 3 to 15 years. Leasehold improvements are amortized over the shorter of their estimated useful lives or their related lease terms, generally ranging from 10 to 20 years. Terms of leases used in the determination of estimated useful lives may include renewal periods at the Company’s option if exercise of the option is determined to be reasonably assured at the inception of the lease. Costs incurred for the development of internal computer software are capitalized and amortized using the straight-line method over 3 to 10 years. Costs incurred in the discovery and post-implementation stages of internally created computer software are generally expensed as incurred.
When constructing stores, the Company receives allowances from landlords. If the landlord is determined to be the primary beneficiary of the property, then the portion of those allowances attributable to the property owned by the landlord is considered to be a deferred rent liability, whereas the corresponding capital expenditures related to that store are considered to be prepaid rent. Allowances in excess of the amounts attributable to the property owned by the landlord are considered leasehold improvement allowances and are recorded as deferred rent liabilities that are amortized over the life of the lease. Capital expenditures are reduced when the Company receives cash and allowances from merchandise vendors to fund the construction of vendor shops.
On a yearly basis and as changes in circumstances arise, the Company evaluates the recoverability of its property and equipment based upon the utilization of the assets and expected future cash flows, in accordance with the authoritative accounting literature. Write-downs associated with the evaluation are reflected in Impairments and Dispositions in the accompanying Consolidated Statements of Income.
FAIR VALUE MEASUREMENTS
The FASB’s accounting guidance defines fair value as the price that would be received to sell an asset or paid to transfer a liability in an orderly transaction between market participants at the measurement date (exit price). The FASB guidance discusses valuation techniques, such as the market approach (comparable market
F-12
Table of Contents
SAKS INCORPORATED & SUBSIDIARIES
NOTES TO CONSOLIDATED FINANCIAL STATEMENTS—(Continued)
(In thousands, except per share amounts)
prices), the income approach (present value of future income or cash flow), and the cost approach (cost to replace the service capacity of an asset or replacement cost). The standard utilizes a fair value hierarchy that prioritizes the inputs to valuation techniques used to measure fair value into three broad levels. The FASB’s guidance classifies the inputs used to measure fair value into the following hierarchy:
Level 1: Quoted market prices in active markets for identical assets or liabilities
Level 2: Observable market-based inputs or unobservable inputs that are corroborated by market data
Level 3: Unobservable inputs reflecting the reporting entity’s own assumptions
The Company may also be required, from time to time, to measure certain other financial assets and liabilities at fair value on a non-recurring basis in accordance with GAAP.
As of January 30, 2010, the Company had no material financial assets or liabilities measured on a recurring basis that required adjustments or write-downs.
IMPAIRMENTS & DISPOSITIONS
The Company continuously evaluates its real estate portfolio and closes individual underproductive stores in the normal course of business as leases expire or as other circumstances indicate. The Company reviews the carrying amounts of individual stores at each fiscal year end or whenever events or changes in circumstances indicate that the carrying amount may not be recoverable. When evaluating individual stores for impairment, the Company’s asset group is at an individual store level, which is the lowest level for which cash flows are identifiable.
A potential impairment has occurred if projected future undiscounted cash flows expected to result from the use and eventual disposition of the store assets are less than the carrying value of the assets. These cash flows are calculated at the individual store level. When determining the cash flows associated with an individual store, management must make assumptions about key store variables, including sales, gross margin and expenses such as store payroll and occupancy costs.
An impairment loss is recognized when the carrying amount of the operating store is not recoverable and exceeds its fair value. The Company uses an income-based approach to determine the fair value of its individual stores that involves making assumptions regarding both a store’s future cash flows, as described above, and the discount rate to determine the present value of those future cash flows. The Company discounts its cash flows at a rate equal to the average of its weighted average cost of capital and the weighted average cost of capital of its competitors as an estimate of the rate that market participants would use in pricing the assets. The Company has not made any material changes in the methodology used to estimate the future cash flows of its stores during the past three fiscal years.
Additionally, the Company disposes of certain assets during the year in the normal course of business.
The fair value of the assets impaired at January 30, 2010 was $20,725 and was classified as Level 3 within the fair value hierarchy. During the year ended January 30, 2010, January 31, 2009, and February 2, 2008, the Company incurred impairment and disposition charges of $29,348, $11,139, and $4,279, respectively.
F-13
Table of Contents
SAKS INCORPORATED & SUBSIDIARIES
NOTES TO CONSOLIDATED FINANCIAL STATEMENTS—(Continued)
(In thousands, except per share amounts)
OPERATING LEASES
The Company leases stores, distribution centers, and administrative facilities under operating leases. Store lease agreements generally include rent holidays, rent escalation clauses and contingent rent provisions for percentage of sales in excess of specified levels. Most of the Company’s lease agreements include renewal periods at the Company’s option. The Company recognizes rent holiday periods and scheduled rent increases on a straight-line basis over the lease term beginning with the date the Company takes possession of the leased space and includes such rent expense in Store Pre-Opening Costs. The Company records tenant improvement allowances and rent holidays as deferred rent liabilities on the consolidated balance sheets and amortizes the deferred rent on a straight–line basis over the life of the lease to rent expense in the Consolidated Statements of Income. The Company records rent liabilities on the consolidated balance sheets for contingent percentage of sales lease provisions when the Company determines that it is probable that the specified levels will be reached during the fiscal year.
SELF-INSURANCE RESERVES
The Company self-insures a substantial portion of its exposure for costs related primarily to employee medical, workers’ compensation and general liability. Expenses are recorded based on estimates for reported and incurred but not reported claims considering a number of factors, including historical claims experience, severity factors, litigation costs, inflation and other assumptions. Although the Company does not expect the amount it will ultimately pay to differ significantly from its estimates, self-insurance reserves could be affected if future claims experience differs significantly from the historical trends and assumptions.
STOCK-BASED COMPENSATION PLANS
The Company maintains an equity incentive plan for the granting of options, stock appreciation rights, performance shares, restricted stock, and other forms of equity awards to employees and directors. Options granted generally vest over a four-year period after grant and have an exercise term of seven to ten years from the grant date. Restricted stock and performance shares generally vest in three years after the grant date, although the plan permits accelerated vesting in certain circumstances at the discretion of the Human Resources and Compensation Committee of the Board of Directors (“HRCC”).
Compensation costs for restricted stock and performance shares that cliff vest is expensed on a straight line basis over the requisite service period. Restricted stock and performance shares with graded vesting features are treated as multiple awards based upon the vesting date. The Company records compensation costs for these awards on a straight line basis over the requisite service period for each separately vesting portion of the award. Compensation costs for stock option awards with graded vesting are expensed on a straight line basis over the requisite service period.
F-14
Table of Contents
SAKS INCORPORATED & SUBSIDIARIES
NOTES TO CONSOLIDATED FINANCIAL STATEMENTS—(Continued)
(In thousands, except per share amounts)
EARNINGS PER SHARE
Basic earnings per share (“EPS”) have been computed based on the weighted average number of common shares outstanding.
| 2009 | 2008 (Revised) |
2007 (Revised) |
|||||||||||||||||||||||||||
| Net Loss | Shares | Per Share Amount |
Net Loss | Shares | Per Share Amount |
Net Income |
Shares | Per Share Amount |
|||||||||||||||||||||
| Basic EPS |
$ | (57,919 | ) | 143,194 | $ | (0.40 | ) | $ | (158,804 | ) | 138,384 | $ | (1.15 | ) | $ | 43,882 | 140,402 | $ | 0.31 | ||||||||||
| Effect of dilutive potential common shares |
— | — | — | — | — | — | — | 13,128 | (.02 | ) | |||||||||||||||||||
| Diluted EPS |
$ | (57,919 | ) | 143,194 | $ | (0.40 | ) | $ | (158,804 | ) | 138,384 | $ | (1.15 | ) | $ | 43,882 | 153,530 | $ | 0.29 | ||||||||||
For the years ended January 30, 2010 and January 31, 2009, the Company generated net losses from continuing operations, and therefore the inclusion of potential common shares would have had an anti-dilutive effect on the Company’s calculation of the diluted loss per share. Accordingly, the Company’s diluted loss per share equals basic loss per share for both of these periods.
The following table presents additional potentially dilutive common shares excluded from diluted earnings (loss) per share because the effect of including these potential shares would have been anti-dilutive:
| 2009 | 2008 | 2007 | ||||
| Stock Options and Employee Stock Purchase Plan Shares |
101 | 346 | — | |||
| Unvested Restricted Stock Awards and Performance Shares |
3,944 | 1,889 | — | |||
| Total |
4,045 | 2,235 | — | |||
| Securities excluded from the diluted earnings (loss) per share calculation because the exercise prices was greater than the average market price |
||||||
| Stock Options (1) |
1,659 | 1,811 | 688 | |||
| Securities excluded from the diluted earnings (loss) per share calculation because the performance criteria were not met: |
||||||
| Performance Shares |
75 | 845 | — |
| (1) | These options represent the number outstanding at the end of the respective year. At the point that the exercise price is less than the average market price, these options have the potential to be dilutive and application of the treasury method would reduce this amount. |
There were also 40,889 potentially dilutive shares under the 7.5% and 2.0% Convertible Notes that were not included in the computation of diluted EPS for the year ended January 30, 2010 because inclusion of the potential common shares would have been anti-dilutive as the Company generated a net loss for the period. For the year ended January 31, 2009 there were 19,219 potentially dilutive shares under the 2.0% Convertible Notes that were not included in the computation of diluted EPS because inclusion of the potential common shares would have been anti-dilutive as the Company generated a net loss for the period. Included in the computation of diluted EPS for the year ended February 2, 2008 are 11,190 potentially dilutive shares associated with shares the Company would issue to settle the difference between fair value and the par value of the convertible notes upon conversion
F-15
Table of Contents
SAKS INCORPORATED & SUBSIDIARIES
NOTES TO CONSOLIDATED FINANCIAL STATEMENTS—(Continued)
(In thousands, except per share amounts)
and the shares to be issued upon the exercise of a call option the Company sold at the time of issuance of the convertible debentures. For the year ended February 2, 2008 there were also 19,219 potentially dilutive shares under the 2.0% Convertible Notes that were not included in the computation of diluted EPS due to the assumption of net share settlement as discussed below.
In 2007, if the holders of the convertible notes exercised their conversion rights, the Company intended to pay cash equal to 100 percent of the principal amount of the convertible notes. In the event that the cash conversion price exceeded 100 percent of the principal amount of the 2% convertible notes, the Company’s intention was to issue common stock for the difference between the par value and fair value at the time of conversion. The Company had $101,162 of cash available as well as availability under the senior revolving credit facility as of February 2, 2008. The cash on hand as well as the availability of borrowings under the senior credit facility provided an adequate source of liquidity to pay 100% of the principal amount of the notes if the holders had elected to exercise their conversion rights.
PENSION PLANS
Pension expense is based on actuarial models used to estimate the total benefits ultimately payable to participants and is allocated to the respective service periods. The Company’s funding policy provides that contributions to the pension trusts shall be at least equal to the minimum funding requirement of the Employee Retirement Income Security Act of 1974. The Company may provide additional contributions from time to time, generally not to exceed the maximum tax-deductible limitation. The Company’s pension plans are valued annually as of the fiscal year-end balance sheet date.
GIFT CARDS
The Company sells gift cards with no expiration dates. At the time gift cards are sold, no revenue is recognized; rather a liability is established for the value of the card. The liability is relieved and revenue is recognized when the gift cards are redeemed by the customer for merchandise. The liability for unredeemed gift cards aggregated $30,422 and $33,315 at January 30, 2010, and January 31, 2009, respectively.
Outstanding gift cards may be subject to state escheatment laws. The Company periodically evaluates unredeemed gift cards and if a determination is made that it is remote that the gift card will be redeemed and if it is determined that the gift card is not subject to escheatment, then the Company will reverse the unredeemed liability. The total reversal reflected in net sales for the years ended January 30, 2010, January 31, 2009, and February 2, 2008 was $5,751, $5,397 and $11,701, respectively.
INCOME TAXES
The Company uses the asset and liability method of accounting for income taxes. Under this method, deferred tax assets and liabilities are determined based on differences between the financial reporting and tax bases of assets and liabilities and are measured using the enacted tax rates and laws that will be in effect when the differences are expected to reverse.
SEGMENT REPORTING
SFA, OFF 5TH and SFA’s e-commerce operations have been aggregated into one reportable segment based on the aggregation criteria outlined in the authoritative accounting guidance.
F-16
Table of Contents
SAKS INCORPORATED & SUBSIDIARIES
NOTES TO CONSOLIDATED FINANCIAL STATEMENTS—(Continued)
(In thousands, except per share amounts)
NOTE 3 — PROPRIETARY CREDIT CARDS
On April 15, 2003, the Company sold its proprietary credit card portfolio, consisting of the proprietary credit card accounts owned by the National Bank of the Great Lakes and the Company’s ownership interest in the assets of the trust, to HSBC Bank Nevada, N.A. (“HSBC”), a third party financial institution.
HSBC, an affiliate of HSBC Holdings PLC, offers proprietary credit card accounts to the Company’s customers. Pursuant to a program agreement with a term of ten years expiring in 2013, HSBC establishes and owns proprietary credit card accounts for the Company’s customers, retains the benefits and risks associated with the ownership of the accounts, receives the finance charge income and incurs the bad debts associated with those accounts. During the ten-year term, pursuant to a servicing agreement, the Company continues to provide key customer service functions, including new account openings, transaction authorizations, billing adjustments and customer inquiries, and receives compensation from HSBC for these services.
At the end of the ten-year term expiring in 2013, the agreement can be renewed for two two-year terms. At the end of the agreement, the Company has the right to repurchase, at fair value, all of the accounts and outstanding accounts receivable, negotiate a new agreement with HSBC or begin issuing private label credit cards itself or through others. The agreement allows the Company to terminate the agreement early following the occurrence of certain events, the most significant of which would be HSBC’s failure to pay owed amounts, bankruptcy, a change in control or a material adverse change in HSBC’s ability to perform under the agreement. The agreement also allows for HSBC to terminate the agreement if the Company fails to pay owed amounts or enters bankruptcy. Should either the Company or HSBC choose to terminate the agreement early, the Company has the right, but not the requirement, to repurchase the credit card accounts and associated accounts receivable from HSBC at their fair value. The Company is contingently liable to pay monies to HSBC in the event of an early termination or a significant disposition of stores. The contingent payment is based upon a declining portion of an amount established at the beginning of the ten-year agreement and on a prorated portion of significant store closings. The maximum contingent payment had the agreement been terminated early at January 31, 2010 would have been approximately $16,340. Management believes the risk of incurring a contingent payment is remote.
The Company and HSBC have entered into several amendments to the program agreement since 2003. In October 2009, the Company and HSBC entered into a fifth amendment to the program agreement in response to macroeconomic conditions and portfolio performance, which provides for certain changes to the allocation of risk and revenue sharing between the parties. The fifth amendment, which became effective February 1, 2010, provides for HSBC to share with the Company certain credit losses of the card portfolio and also provides increased revenue sharing to the Company.
In September 2006, the Company entered into agreements with HSBC and MasterCard International Incorporated to issue a co-branded MasterCard card to new and existing proprietary credit card customers. Under this program, qualifying customers are issued a SFA and MasterCard branded credit card that functions as a traditional proprietary credit card when used at any SFA or OFF 5TH store and at Saks Direct or as a MasterCard card when used at any unaffiliated location that accepts MasterCard cards. HSBC establishes and owns the co-brand accounts, retains the benefits and sales associated with the ownership of the accounts, receives the finance charge and other income from the accounts, and incurs the bad-debts associated with the accounts.
With the exception of depreciation expense, all components of the credit card operations are included in SG&A in the Consolidated Statements of Income. The credit contribution comprises program compensation and
F-17
Table of Contents
SAKS INCORPORATED & SUBSIDIARIES
NOTES TO CONSOLIDATED FINANCIAL STATEMENTS—(Continued)
(In thousands, except per share amounts)
servicing compensation. For 2009, 2008, and 2007, the components of the credit contribution included in SG&A were $29,425, $29,899, and $28,754, respectively.
NOTE 4 — PROPERTY AND EQUIPMENT
A summary of property and equipment is as follows:
| January 30, 2010 |
January 31, 2009 (Revised) |
|||||||
| Land and land improvements |
$ | 174,551 | $ | 177,069 | ||||
| Buildings |
585,860 | 594,578 | ||||||
| Leasehold improvements |
321,092 | 341,319 | ||||||
| Fixtures and equipment |
734,847 | 811,642 | ||||||
| Construction in progress |
10,921 | 24,968 | ||||||
| 1,827,271 | 1,949,576 | |||||||
| Accumulated depreciation |
(871,189 | ) | (891,183 | ) | ||||
| $ | 956,082 | $ | 1,058,393 | |||||
Amounts above include gross assets recorded under capital leases for buildings and equipment of $126,511 and $4,436, respectively as of January 30, 2010 and January 31, 2009. Accumulated depreciation of assets recorded under capital leases was $106,335 and $102,871 as of January 30, 2010 and January 31, 2009, respectively.
Depreciation expense was $135,135, $134,669, and $131,710 in 2009, 2008, and 2007, respectively.
NOTE 5 — INCOME TAXES
The components of income tax expense (benefit) from continuing operations were as follows:
| 2009 | 2008 (Revised) |
2007 (Revised) |
||||||||||
| Current: |
||||||||||||
| Federal |
$ | (4,261 | ) | $ | 1,717 | $ | 826 | |||||
| State |
345 | (839 | ) | 2,141 | ||||||||
| (3,916 | ) | 878 | 2,967 | |||||||||
| Deferred: |
||||||||||||
| Federal |
(34,266 | ) | (51,177 | ) | 25,593 | |||||||
| State |
(6,319 | ) | 1,397 | (1,805 | ) | |||||||
| (40,585 | ) | (49,780 | ) | 23,788 | ||||||||
| Total expense (benefit) from continuing operations |
$ | (44,501 | ) | $ | (48,902 | ) | $ | 26,755 | ||||
F-18
Table of Contents
SAKS INCORPORATED & SUBSIDIARIES
NOTES TO CONSOLIDATED FINANCIAL STATEMENTS—(Continued)
(In thousands, except per share amounts)
Income tax (benefit) expense from continuing operations varies from the amounts computed by applying the statutory federal income tax rate to income before taxes. The reasons for these differences were as follows:
| 2009 | 2008 (Revised) |
2007 (Revised) |
||||||||||
| Expected federal income taxes at 35% |
$ | (35,757 | ) | $ | (61,434 | ) | $ | 25,848 | ||||
| State income taxes, net of federal benefit |
(4,267 | ) | (6,777 | ) | 3,095 | |||||||
| State NOL valuation allowance adjustment |
3,045 | 6,110 | (2,957 | ) | ||||||||
| Effect of settling tax exams and other tax reserve adjustments |
(5,226 | ) | 624 | 690 | ||||||||
| Executive compensation |
— | 318 | 367 | |||||||||
| Tax-exempt interest |
— | — | (662 | ) | ||||||||
| Change in state tax law |
— | (414 | ) | — | ||||||||
| State tax rate adjustment |
(2,703 | ) | — | — | ||||||||
| Write-off of expired Federal NOL |
— | 10,980 | — | |||||||||
| Other items, net |
407 | 1,691 | 374 | |||||||||
| Provision (benefit) for income taxes from continuing operations |
$ | (44,501 | ) | $ | (48,902 | ) | $ | 26,755 | ||||
Components of the net deferred tax asset or liability recognized in the consolidated balance sheets were as follows:
| January 30, 2010 |
January 31, 2009 (Revised) |
|||||||
| Current: |
||||||||
| Deferred tax assets: |
||||||||
| Accrued expenses |
$ | 34,478 | $ | 28,099 | ||||
| NOL carryforwards |
— | 1,029 | ||||||
| Valuation allowance |
— | (2,322 | ) | |||||
| Inventory |
1,496 | 3,110 | ||||||
| Net current deferred tax asset |
$ | 35,974 | $ | 29,916 | ||||
| Non-current: |
||||||||
| Deferred tax assets: |
||||||||
| Capital leases |
$ | 22,000 | $ | 23,968 | ||||
| Rent Adjustments |
20,384 | 18,433 | ||||||
| Pension |
14,638 | 15,993 | ||||||
| Other long-term liabilities |
33,853 | 29,036 | ||||||
| AMT Credit |
23,103 | 24,269 | ||||||
| NOL carryforwards |
138,122 | 134,557 | ||||||
| Valuation allowance |
(42,810 | ) | (39,868 | ) | ||||
| Deferred tax liabilities: |
||||||||
| Property and equipment |
12,053 | (11,446 | ) | |||||
| Other assets |
11 | 14 | ||||||
| Net non-current deferred tax asset |
$ | 221,354 | $ | 194,956 | ||||
| Total Net Deferred Tax Asset |
$ | 257,328 | $ | 224,872 | ||||
F-19
Table of Contents
SAKS INCORPORATED & SUBSIDIARIES
NOTES TO CONSOLIDATED FINANCIAL STATEMENTS—(Continued)
(In thousands, except per share amounts)
The federal and state net operating loss (“NOL”) carryforwards will expire between 2010 and 2029. The majority of the NOL carryforward is a result of the net operating losses incurred during the fiscal years ended January 30, 2010 and January 31, 2009 due principally to difficult market and macroeconomic conditions. We have concluded, based on the weight of all available positive and negative evidence that all but $42,810 of these tax benefits relating to certain state losses are more likely than not to be realized in the future. Therefore, a valuation allowance for the $42,810 has been established.
We evaluate the realizability of our deferred tax assets on a quarterly basis. This evaluation resulted in an additional reserve of $3,045 and $6,110 against state deferred tax assets in 2009 and 2008, respectively, impacting our results of operations. A similar analysis was performed in 2007, which resulted in a decrease in the reserve of $2,957. While the Company has incurred a cumulative loss over the three year period ended January 30, 2010, after evaluating all available evidence including our past operating results, the macroeconomic factors contributing to the most recent fiscal loss, the length of the carryforward periods available and our forecast of future taxable income, including the availability of prudent and feasible tax planning strategies, we concluded that it is more likely than not the deferred tax asset, net of the $42,810 valuation allowance related to state NOLs, will be realized. We will continue to assess the need for additional valuation allowance in the future. If future results are less than projected or tax planning strategies are no longer viable, then additional valuation allowance may be required to reduce the deferred tax assets which could have a material impact on our results of operations in the period in which it is recorded.
Included in the NOL carryforward deferred tax asset at January 30, 2010 is $82,174 related to U.S. federal NOL carryforwards of $234,784. The total federal NOL carryforwards are $261,296 which includes $26,512 of excess tax deductions associated with our stock option plans which have yet to reduce taxes payable. Upon the utilization of these carryforwards, the associated tax benefits of $9,279 will be recorded to Additional Paid-in-Capital.
The Company received income tax refunds of $4,727, $10,214, and, $17,492 during 2009, 2008, and 2007, respectively.
The company adopted the provisions of new accounting guidance related to uncertain income tax positions as of February 4, 2007. As a result of the implementation of this accounting guidance, the Company recorded a $33,671 decrease in the liability for unrecognized tax benefits which was accounted for as an increase to the beginning shareholder’s equity. As a result of the analysis of uncertain tax positions, the net deferred tax asset related to state NOL carryforwards increased by $19,258. Therefore, the Company performed a valuation allowance analysis to determine the realizability of this asset. This analysis resulted in an additional valuation allowance of $19,258 with the offset recorded to shareholders’ equity in accordance with the relevant accounting guidance for entities in reorganization under the bankruptcy code. The Company was subject to the provisions of this accounting guidance for these net operating losses since these losses were acquired through the acquisition of a company that had previously filed bankruptcy.
F-20
Table of Contents
SAKS INCORPORATED & SUBSIDIARIES
NOTES TO CONSOLIDATED FINANCIAL STATEMENTS—(Continued)
(In thousands, except per share amounts)
A reconciliation of the beginning and ending amount of gross unrecognized tax benefits follows:
| January 30, 2010 |
January 31, 2009 |
February 2, 2008 |
||||||||||
| Unrecognized tax benefits at beginning of year |
$ | 46,031 | $ | 47,648 | $ | 46,278 | ||||||
| Gross amount of increases for tax positions of prior years |
1,111 | 505 | 1,793 | |||||||||
| Gross amount of decreases for tax positions of prior years |
— | (761 | ) | — | ||||||||
| Gross amount of decreases due to statute expirations |
(6,656 | ) | (1,256 | ) | (423 | ) | ||||||
| Gross amount of decreases due to tax settlements |
(128 | ) | (105 | ) | — | |||||||
| Balance at end of year |
$ | 40,358 | $ | 46,031 | $ | 47,648 | ||||||
The Company analyzed its positions related to the reserve for tax exposures and determined that the amount was adequate. The Company will continue to analyze its positions related to the reserve for tax exposures on an ongoing basis. At January 30, 2010, $34,969 represents the amount of unrecognized tax benefits that, if recognized, would impact the effective income tax rate in future periods. The Company continually evaluates its tax filing positions and to the extent the Company prevails on audits or statutes of limitation expire, the unrecognized tax benefits could be realized. The Company believes that it is reasonably possible that up to $25,532 in unrecognized tax benefits relating to prior acquisitions could be recognized within 12 months of the January 30, 2010 balance sheet date.
The Company recognizes interest and penalties accrued related to unrecognized tax benefits in income tax expense. During the years ended January 30, 2010, January 31, 2009 and February 2, 2008, the Company recognized $(63), $1,688 and $377, respectively in interest and penalties, net of related tax effects. The Company had accrued $5,005, $5,115 and $3,230 for the payment of interest and penalties as of January 30, 2010, January 31, 2009 and February 2, 2008, respectively.
The Company files a consolidated U.S. federal income tax return as well as state tax returns in multiple state jurisdictions. The Company has completed examinations by the Internal Revenue Service or the statute of limitations has expired for taxable years through January 28, 2006. With respect to the state and local jurisdictions, the Company has completed examinations in many jurisdictions through the same period and beyond and currently has examinations in progress for several jurisdictions.
F-21
Table of Contents
SAKS INCORPORATED & SUBSIDIARIES
NOTES TO CONSOLIDATED FINANCIAL STATEMENTS—(Continued)
(In thousands, except per share amounts)
NOTE 6 — DEBT
A summary of long-term debt and capital lease obligations is as follows:
| January 30, 2010 | January 31, 2009 | ||||||||||||||
| Carrying Amount |
Fair Value |
Carrying Amount (Revised) |
Fair Value | ||||||||||||
| Notes 7.50%, maturing fiscal year 2010 |
$ | 22,859 | $ | 22,973 | $ | 45,872 | $ | 36,698 | |||||||
| Notes 9.875%, maturing fiscal year 2011 |
141,557 | 148,547 | 141,557 | 99,090 | |||||||||||
| Notes 7.00%, maturing fiscal year 2013 |
2,922 | 2,674 | 2,922 | 1,753 | |||||||||||
| Notes 7.375%, maturing fiscal year 2019 |
1,911 | 1,567 | 1,911 | 993 | |||||||||||
| Convertible Notes 7.50%, maturing fiscal year 2013, net (1) |
100,570 | 175,896 | — | — | |||||||||||
| Convertible Notes 2.00%, maturing fiscal year 2024, net (2) |
194,946 | 192,913 | 187,703 | 89,125 | |||||||||||
| Revolving credit facility |
— | — | 156,675 | 156,675 | |||||||||||
| Terminated interest rate swap agreements, net (3) |
12 | N/A | 53 | N/A | |||||||||||
| Capital lease obligations (4) |
56,410 | N/A | 61,083 | N/A | |||||||||||
| Total debt |
521,187 | 544,570 | 597,776 | 384,334 | |||||||||||
| Less current portion: |
|||||||||||||||
| Notes 7.50%, maturing fiscal year 2010 |
(22,859 | ) | (22,973 | ) | — | — | |||||||||
| Capital lease obligations (4) |
(4,998 | ) | N/A | (4,673 | ) | N/A | |||||||||
| Current portion of long-term debt |
(27,857 | ) | (22,973 | ) | (4,673 | ) | — | ||||||||
| Long-term debt |
$ | 493,330 | $ | 521,597 | $ | 593,103 | $ | 384,334 | |||||||
| (1) | Amount represents the $120,000 convertible notes, net of the unamortized discount of $19,430 as of January 30, 2010. |
| (2) | Amount represents the $230,000 convertible notes, net of the unamortized discount of $35,054 and $42,297, as of January 30, 2010 and January 31, 2009, respectively. |
| (3) | The fair value of the terminated interest rate swaps is considered immaterial. |
| (4) | Disclosure regarding fair value of capital leases is not required. |
The fair values of the long-term debt were estimated based on quotes obtained from financial institutions for those or similar instruments or on the basis of quoted market prices. For variable rate notes that reprice frequently, such as the Company’s revolving credit agreement, fair value approximates carrying value.
REVOLVING CREDIT AGREEMENT
The Company has a $500,000 revolving credit facility, subject to a borrowing base equal to a specified percentage of eligible inventory and certain credit card receivables. The facility matures in November 2013. The obligations under the facility are guaranteed by certain of the Company’s existing and future domestic subsidiaries, and the obligations are secured by the Company’s and the guarantors’ merchandise inventories and certain third party accounts receivable. Borrowings under the facility bear interest at a per annum rate of either LIBOR plus a percentage ranging from 3.5% to 4.0%, or at the higher of the prime rate and federal funds rate plus a percentage ranging from 2.5% to 3.0%. Letters of credit are charged a per annum fee equal to the then applicable LIBOR borrowing spread (for standby letters of credit) or the applicable LIBOR spread minus 0.50%
F-22
Table of Contents
SAKS INCORPORATED & SUBSIDIARIES
NOTES TO CONSOLIDATED FINANCIAL STATEMENTS—(Continued)
(In thousands, except per share amounts)
(for documentary or commercial letters of credit). The Company also pays an unused line fee ranging from 0.5% to 1.0% per annum on the average daily unused revolver.
During periods in which availability under the agreement is $87,500 or more, the Company is not subject to financial covenants. If and when availability under the agreement decreases to less than $87,500, the Company will be subject to a minimum fixed charge coverage ratio of 1 to 1. There is no debt rating trigger.
The revolving credit agreement permits additional debt in specific categories including the following (each category being subject to limitations as described in the revolving credit agreement): debt arising from permitted sale/leaseback transactions; debt to finance purchases of machinery, equipment, real estate and other fixed assets; debt in connection with permitted acquisitions; and unsecured debt. The agreement also permits other debt (including permitted sale/leaseback transactions) in an aggregate amount not to exceed $400,000 at any time, including secured debt, so long as it is a permitted lien as defined by the revolving credit agreement. The revolving credit agreement also places certain restrictions on, among other things, asset sales, the ability to make acquisitions and investments, and to pay dividends.
The Company routinely issues stand-by and documentary letters of credit principally related to the funding of insurance reserves. Outstanding letters of credit reduce availability under the revolving line of credit. During 2009, weighted average letters of credit issued under the credit agreement were $25,734. The highest amount of letters of credit outstanding under the agreement during 2009 was $52,455. At January 30, 2010, the Company had no direct outstanding borrowings and had letters of credit outstanding of $28,525. The credit agreement contains default provisions that are typical for this type of financing, including a provision that would trigger a default under the credit agreement if a default were to occur in another debt instrument resulting in the acceleration of principal of more than $20,000 under that other instrument.
SENIOR NOTES
At January 30, 2010, the Company had $169,249 of unsecured senior notes outstanding, excluding the convertible notes, comprised four separate series having maturities ranging from 2010 to 2019 and interest rates ranging from 7.00% to 9.88%. The senior notes are guaranteed by all of the subsidiaries that guarantee the Company’s credit facility and have substantially identical terms except for the maturity dates and interest rates payable to investors. The notes permit certain sale/leaseback transactions but place certain restrictions around the use of proceeds generated from a sale/leaseback transaction. The terms of each senior note require all principal to be repaid at maturity. There are no financial covenants associated with these notes, and there are no debt-rating triggers.
On April 12, 2007, the Company announced the results of its modified “Dutch Auction” tender offer to purchase a portion of its 8.25% senior notes due November 15, 2008 for an aggregate purchase price not to exceed $100 million (the “offer cap”). The offer expired on April 11, 2007. The aggregate principal amount of notes validly tendered at or above the clearing spread exceeded the offer cap and the Company accepted $95,872 aggregate principal amount of the notes, resulting in an aggregate purchase price of approximately $100,000 (plus an additional $3,230 in aggregate accrued interest on such notes). The Company accepted for purchase first, all notes tendered at spreads above the clearing spread, and thereafter, the notes validly tendered at the clearing spread on a prorated basis according to the principal amount of such notes. During the three months ended May 5, 2007, the Company recorded a loss on extinguishment of debt of approximately $5,222 related to the repurchase of the notes.
F-23
Table of Contents
SAKS INCORPORATED & SUBSIDIARIES
NOTES TO CONSOLIDATED FINANCIAL STATEMENTS—(Continued)
(In thousands, except per share amounts)
During June and July 2007, the Company extinguished an additional $10,420 in principal amount primarily relating to its 8.25% senior notes. The repurchase of these notes resulted in a loss on extinguishment of debt of approximately $412.
During June and July 2009, the Company extinguished $23,013 of its 7.5% senior notes that mature in December 2010. The repurchase of these notes resulted in a gain on extinguishment of debt of $783.
CONVERTIBLE NOTES
7.5% Convertible Notes
The Company issued $120,000 of 7.5% convertible notes in May 2009 (the “7.5% Convertible Notes”). The 7.5% Convertible Notes mature in December 2013 and are convertible, at the option of the holders at any time, into shares of the Company’s common stock at a conversion rate of $5.54 per share of common stock (21,670 shares of common stock to be issued upon conversion). The Company can settle a conversion of the notes with shares, cash, or a combination thereof at its discretion. Authoritative accounting literature requires the allocation of convertible debt proceeds between the liability component and the embedded conversion option (i.e., the equity component). The liability component of the debt instrument is accreted to par value using the effective interest method over the remaining life of the debt. The accretion is reported as a component of interest expense. The equity component is not subsequently revalued as long as it continues to qualify for equity treatment.
Upon issuance, the Company estimated the fair value of the liability component of the 7.5% Convertible Notes, assuming a 13% non-convertible borrowing rate, to be $97,994. The difference between the fair value and the principal amount of the 7.5% Convertible Notes was $22,006. This amount was recorded as a debt discount and as an increase to additional paid-in capital as of the issuance date. The discount is being accreted to interest expense over the 4.5 year period to the maturity date of the notes in December 2013 resulting in an increase in non-cash interest expense in future periods.
The following tables provide additional information about the Company’s 7.5% Convertible Notes.
| January 30, 2010 | |||
| Carrying amount of the equity component (additional paid-in capital) |
$ | 22,006 | |
| Principal amount of the 7.5% Convertible Notes |
$ | 120,000 | |
| Unamortized discount of the liability component |
$ | 19,430 | |
| Net carrying amount of liability component |
$ | 100,570 | |
| 2009 | ||||
| Effective interest rate on liability component |
12.9 | % | ||
| Cash interest expense recognized |
$ | 6,100 | ||
| Non-cash interest expense recognized |
$ | 2,576 | ||
The remaining period over which the unamortized discount will be recognized is 3.8 years. As of January 30, 2010, the if-converted value of the notes exceeded its principal amount by $19,558.
F-24
Table of Contents
SAKS INCORPORATED & SUBSIDIARIES
NOTES TO CONSOLIDATED FINANCIAL STATEMENTS—(Continued)
(In thousands, except per share amounts)
The 7.5% Convertible Notes were classified within “long-term debt” on the consolidated balance sheet as of January 30, 2010 because the Company can settle the principal amount of the notes with shares, cash, or a combination thereof at its discretion.
2.0% Convertible Senior Notes
The Company had $230,000 of 2.0% convertible senior notes outstanding at January 30, 2010. The notes bear interest at a rate of 2.0% per annum. The 2.0% Convertible Notes mature in 2024 and in certain circumstances, the provisions of the 2.0% Convertible Notes allow the holder to convert the notes to shares of the Company’s common stock at a conversion rate of $11.97 per share of common stock (19,219 shares of common stock to be issued upon conversion) subject to an anti-dilution adjustment. The Company can settle a conversion of the notes with shares, cash, or a combination thereof at its discretion. The holders may convert the notes at the following times, among others: if the Company’s share price is greater than 120% of the applicable conversion price for a certain trading period; if the credit ratings of the notes are below a certain threshold; or upon the occurrence of certain consolidations, mergers or share exchange transactions involving the Company. At January 30, 2010, the conversion criteria with respect to the credit rating requirements were met.
In connection with the issuance of the 2.0% Convertible Notes, the Company entered into a convertible note hedge and written call options on its common stock to reduce the Company’s exposure to dilution from the conversion of the 2.0% Convertible Notes. The terms and conditions of the note hedge include: strike price of $11.97; contract is indexed to 19,219 shares of the Company’s common stock; maturity dates of the hedge instruments range from March 24, 2011 to April 20, 2011. The terms of the written call options include: strike price of $13.81; contract is indexed to 19,219 shares of the Company’s common stock; maturity date of the written call option instruments is August 2, 2011. These transactions were accounted for as a net reduction of stockholders’ equity of approximately $25,000 in 2004. The estimated fair value of the convertible note hedge and written call option was $521 and $0 at January 30, 2010 and January 31, 2009, respectively.
The following tables provide additional information about the Company’s 2.0% Convertible Notes.
| January 30, 2010 |
January 31, 2009 | |||||
| Carrying amount of the equity component (additional paid-in capital) |
$ | 71,852 | $ | 71,852 | ||
| Principal amount of the 2.0% Convertible Notes |
$ | 230,000 | $ | 230,000 | ||
| Unamortized discount of the liability component |
$ | 35,054 | $ | 42,297 | ||
| Net carrying amount of liability component |
$ | 194,946 | $ | 187,703 | ||
| 2009 | 2008 | 2007 | ||||||||||
| Effective interest rate on liability component |
6.2 | % | 6.2 | % | 6.2 | % | ||||||
| Cash interest expense recognized |
$ | 4,600 | $ | 4,600 | $ | 4,600 | ||||||
| Non-cash interest expense recognized |
$ | 7,243 | $ | 6,811 | $ | 6,404 | ||||||
The remaining period over which the unamortized discount will be recognized is 4.1 years. As of January 30, 2010, the if-converted value of the notes did not exceed its principal amount.
The 2.0% Convertible Notes were classified within “long-term debt” on the consolidated balance sheet as of January 30, 2010 and January 31, 2009 because the Company can settle the principal amount of the notes with shares, cash or a combination thereof at its discretion.
F-25
Table of Contents
SAKS INCORPORATED & SUBSIDIARIES
NOTES TO CONSOLIDATED FINANCIAL STATEMENTS—(Continued)
(In thousands, except per share amounts)
MATURITIES
At January 30, 2010, maturities of long-term debt and capital lease obligations for the next five years and thereafter are as follows:
| Year |
Maturities | |||
| 2010 |
$ | 27,857 | ||
| 2011 |
146,837 | |||
| 2012 |
5,308 | |||
| 2013 |
128,746 | |||
| 2014 |
6,162 | |||
| Thereafter |
260,761 | |||
| Subtotal |
575,671 | |||
| Unamortized discount at January 30, 2010 |
(54,484 | ) | ||
| Total |
$ | 521,187 | ||
The Company made interest payments of $36,388, $31,741, and $34,982, of which $758, $1,308, and $1,830 was capitalized into property and equipment during 2009, 2008, and 2007, respectively.
NOTE 7 — COMMITMENTS AND CONTINGENCIES
OPERATING LEASES AND OTHER PURCHASE COMMITMENTS
The Company leases certain property and equipment under various non-cancelable capital and operating leases. The leases provide for monthly fixed amount rentals or contingent rentals based upon sales in excess of stated amounts and normally require the Company to pay real estate taxes, insurance, common area maintenance costs and other occupancy costs. Generally, the leases have primary terms ranging from 20 to 30 years and include renewal options ranging from 5 to 20 years.
At January 30, 2010, future minimum rental commitments under capital leases and non-cancelable operating leases consisted of the following:
| Operating Leases |
Capital Leases |
||||||
| 2010 |
$ | 67,530 | $ | 11,454 | |||
| 2011 |
64,004 | 11,235 | |||||
| 2012 |
53,331 | 10,771 | |||||
| 2013 |
46,890 | 10,746 | |||||
| 2014 |
39,856 | 10,479 | |||||
| Thereafter |
176,096 | 44,428 | |||||
| $ | 447,707 | 99,113 | |||||
| Amounts representing interest |
(42,703 | ) | |||||
| Capital lease obligations |
$ | 56,410 | |||||
F-26
Table of Contents
SAKS INCORPORATED & SUBSIDIARIES
NOTES TO CONSOLIDATED FINANCIAL STATEMENTS—(Continued)
(In thousands, except per share amounts)
Total rental expense for operating leases was $101,756, $101,063, and $100,106 during 2009, 2008, and 2007, respectively, including contingent rent of $13,301, $17,381, and $19,612, respectively, and common area maintenance costs of 12,299, $12,702, and $10,297, respectively.
As of January 30, 2010, the Company had two potential commitments tied to the value of its common stock. First, the Company may be required to deliver shares and/or cash to holders of the convertible notes described in Note 6 prior to the stated maturity date of said notes based on the value of the Company’s common stock. Second, in connection with the issuance of the convertible notes, the Company bought and sold call options to limit the potential dilution from conversion of the notes. The Company may be required to deliver shares and/or cash to the holders of the call options based on the value of the Company’s common stock.
In the normal course of business, the Company purchases merchandise under purchase commitments; enters into contractual commitments with real estate developers and construction companies for new store construction and store remodeling; and maintains contracts for various information technology, telecommunications, maintenance and other services. Commitments for purchasing merchandise generally do not extend beyond six months and may be cancelable several weeks prior to the vendor shipping the merchandise. Contractual commitments for the construction and remodeling of stores are typically lump sum or cost plus construction contracts. Contracts to purchase various services are generally less than one to two year commitments and are cancelable within several weeks notice.
From time to time the Company has issued guarantees to landlords under leases of stores operated by its subsidiaries. Certain of these stores were sold in connection with the Saks Department Store Group (“SDSG”), and the Northern Department Store Group transactions which occurred in July 2005 and March 2006 respectively. If the purchasers fail to perform certain obligations under the leases guaranteed by the Company, the Company could have obligations to landlords under such guarantees. Based on the information currently available, management does not believe that its potential obligations under these lease guarantees would be material.
LEGAL CONTINGENCIES
The Company is involved in legal proceedings arising from its normal business activities and has accruals for losses where appropriate. Management believes that none of these legal proceedings will have a material adverse effect on the Company’s consolidated financial position, results of operations, or liquidity.
INCOME TAXES
The Company is routinely under audit by federal, state or local authorities in the areas of income taxes and the remittance of sales and use taxes. These audits include questioning the timing and amount of deductions and the allocation of income among various tax jurisdictions. Based on annual evaluations of tax filing positions, the Company believes it has adequately accrued for its income tax exposures. To the extent the Company were to prevail in matters for which accruals have been established or be required to pay amounts in excess of the current reserves, the Company’s effective tax rate in a given financial statement period may be materially impacted. At January 30, 2010 certain state examinations were ongoing.
F-27
Table of Contents
SAKS INCORPORATED & SUBSIDIARIES
NOTES TO CONSOLIDATED FINANCIAL STATEMENTS—(Continued)
(In thousands, except per share amounts)
NOTE 8 — EMPLOYEE BENEFIT PLANS
DEFERRED COMPENSATION PLAN
The Company sponsors a non-qualified deferred compensation plan wherein eligible employees can defer a portion of their compensation or unvested restricted stock and allocate the deferrals to a choice of investments options. The liability for compensation deferred under this plan was $12,266 and $10,267 for the years ended January 30, 2010 and January 31, 2009, respectively. The Company manages the risk of changes in the fair value of the liability for deferred compensation by electing to match its liability under the plan with investment vehicles that offset a substantial portion of its exposure. The cash value of the investment vehicles was $11,962 and $9,701 for the years ended January 30, 2010 and January 30, 2009, respectively, and is included in Other Assets in the accompanying consolidated balance sheets.
EMPLOYEE SAVINGS PLANS
The Company sponsors various qualified savings plans that cover substantially all full-time employees. Company contributions charged to expense under these plans for 2009, 2008, and 2007 were $0, $7,805, and $8,403, respectively. The Company’s contributions to the plan were suspended for the 2009 and 2010 calendar years. At January 30, 2010, total assets invested by participants related to the employee savings plans was $394,715, of which approximately 1% was invested in the Company’s stock at the discretion of the participating employees.
DEFINED BENEFIT PLANS
The Company sponsors a defined benefit cash balance pension plan and supplemental executive retirement plan (“SERP”) for certain employees of the Company. The Company amended the pension plan during 2006, freezing benefit accruals for all participants except those who have attained age 55 and completed 10 years of credited service as of January 1, 2007, who are considered to be non-highly compensated employees. In January 2009, the Company suspended future benefit accruals for all remaining participants in the plan effective on March 13, 2009. This curtailment resulted in a gain of approximately $616 for the year ended January 31, 2009.
The Company generally funds pension costs currently, subject to regulatory funding requirements. The Company expects funding requirements of approximately $1,400 in 2010.
In September 2006, the FASB issued a new accounting pronouncement which requires employers to (i) recognize the funded status of their defined benefit pension and other postretirement plans on the consolidated balance sheet, (ii) recognize as a component of other comprehensive income, net of tax, the gains or losses and prior service costs or credits that arise during the period but are not recognized as components of net periodic benefit cost and (iii) measure defined benefit plan assets and obligations as of the date of the employer’s statement of financial position. The Company adopted the recognition and disclosure requirements of the new pronouncement prospectively on February 3, 2007. Effective January 31, 2009, in accordance with the new pronouncement, the Company changed its measurement date from November 1 to the date of its fiscal year end. The Company elected to adopt the change in measurement date using the alternative transition method. In accordance with the alternative transition method, the actuarial valuation provided a 15-month projection of net periodic benefit cost to January 31, 2009 that resulted in a $344 decrease to 2008 ending retained earnings.
F-28
Table of Contents
SAKS INCORPORATED & SUBSIDIARIES
NOTES TO CONSOLIDATED FINANCIAL STATEMENTS—(Continued)
(In thousands, except per share amounts)
The components of net periodic pension expense (benefit) and other amounts recognized in other comprehensive income related to the Company’s pension plan and SERP for the years ended January 30, 2010, January 31, 2009, and February 2, 2008 were as follows:
| 2009 | 2008 | 2007 | ||||||||||
| Net periodic pension expense: |
||||||||||||
| Service cost |
$ | 70 | $ | 846 | $ | 1,323 | ||||||
| Interest cost |
8,442 | 10,613 | 8,199 | |||||||||
| Expected return on plan assets |
(6,330 | ) | (15,184 | ) | (11,058 | ) | ||||||
| Recognized actuarial loss |
2,707 | 1,005 | 3,338 | |||||||||
| Settlement loss recognized (1) |
5,121 | — | — | |||||||||
| Amortization of prior service costs |
— | (87 | ) | (70 | ) | |||||||
| Total pension expense (benefit) |
$ | 10,010 | $ | (2,807 | ) | $ | 1,732 | |||||
| Other changes recognized in other comprehensive income: |
||||||||||||
| Prior service credit recognized due to curtailment |
$ | — | $ | 616 | $ | — | ||||||
| Net loss (gain) |
(4,690 | ) | 68,200 | (18,606 | ) | |||||||
| Amortization of prior service credit |
— | 88 | 70 | |||||||||
| Amortization of loss |
(7,828 | ) | (1,005 | ) | (3,338 | ) | ||||||
| Total recognized in other comprehensive loss |
$ | (12,518 | ) | $ | 67,899 | $ | (21,874 | ) | ||||
| Total recognized in net periodic benefit cost and other comprehensive loss |
$ | (2,508 | ) | $ | 65,092 | $ | (20,142 | ) | ||||
| (1) | In accordance with authoritative accounting guidance, the Company recorded a non-cash settlement charge of $5,121 as the Company’s lump sum distributions exceeded its interest and service cost in 2009. |
F-29
Table of Contents
SAKS INCORPORATED & SUBSIDIARIES
NOTES TO CONSOLIDATED FINANCIAL STATEMENTS—(Continued)
(In thousands, except per share amounts)
The change in benefit obligation, change in plan assets, funded status, and amounts recognized in the consolidated balance sheets at January 30, 2010 and January 31, 2009, respectively, for the Company’s pension plan and SERP are as follows:
| 2009 | 2008 | |||||||
| Change in benefit obligation: |
||||||||
| Benefit obligation at beginning of period |
$ | 148,671 | $ | 156,109 | ||||
| Service cost |
70 | 846 | ||||||
| Interest cost |
8,442 | 10,613 | ||||||
| Actuarial loss |
11,623 | (3,818 | ) | |||||
| Benefits paid |
(15,236 | ) | (15,079 | ) | ||||
| Benefit obligation at end of period |
$ | 153,570 | $ | 148,671 | ||||
| Change in plan assets: |
||||||||
| Fair value of plan assets at beginning of period |
$ | 95,273 | $ | 165,878 | ||||
| Actual return on plan assets |
22,643 | (55,071 | ) | |||||
| Employer contributions to the SERP |
1,075 | 1,309 | ||||||
| Benefits paid |
(15,236 | ) | (15,079 | ) | ||||
| Administrative expenses |
— | (1,764 | ) | |||||
| Fair value of plan assets at end of period |
$ | 103,755 | $ | 95,273 | ||||
| Pension plans’ funding status: |
||||||||
| Accumulated benefit obligation |
$ | (153,570 | ) | $ | (148,658 | ) | ||
| Effect of projected salary increases |
— | (13 | ) | |||||
| Projected benefit obligation |
(153,570 | ) | (148,671 | ) | ||||
| Fair value of plan assets |
103,755 | 95,273 | ||||||
| Funded status |
(49,815 | ) | (53,398 | ) | ||||
| Accrued pension cost classified in other liabilities at balance sheet date |
$ | (49,815 | ) | $ | (53,398 | ) | ||
| Amounts recognized in the consolidated balance sheet: |
||||||||
| Current liabilities |
$ | (1,168 | ) | $ | (1,179 | ) | ||
| Noncurrent liabilities |
(48,647 | ) | (52,219 | ) | ||||
| Net amount recognized at balance sheet date |
$ | (49,815 | ) | $ | (53,398 | ) | ||
Significant assumptions were as follows:
| 2009 | 2008 | |||||
| Weighted-average assumptions used in measuring the Company’s benefit obligation: |
||||||
| Pension Plan: |
||||||
| Discount rate |
5.1 | % | 6.5 | % | ||
| Measurement date |
1/30/2010 | 1/31/2009 | ||||
| SERP |
||||||
| Discount rate |
5.5 | % | 6.6 | % | ||
| Measurement date |
1/30/2010 | 1/31/2009 |
F-30
Table of Contents
SAKS INCORPORATED & SUBSIDIARIES
NOTES TO CONSOLIDATED FINANCIAL STATEMENTS—(Continued)
(In thousands, except per share amounts)
| 2009 | 2008 | |||||
| Weighted-average assumptions used in measuring the net periodic pension benefit cost: |
||||||
| Pension Plan: |
||||||
| Discount rate |
6.5 | % | 6.5 | % | ||
| Expected return on assets |
8.0 | % | 8.0 | % | ||
| Rate of compensation increase |
4.0 | % | 4.0 | % | ||
| SERP |
||||||
| Discount rate |
6.6 | % | 6.5 | % | ||
Pension assumptions are based upon management’s best estimates as of the annual measurement date. The assumed discount rate utilized is based upon pension discount curves and bond portfolio curves over a duration similar to the plan’s liabilities as of the measurement date. The discount rate is utilized principally in calculating the Company’s pension obligation, which is represented by the Accumulated Benefit Obligation (“ABO”) and the Projected Benefit Obligation (“PBO”) and in calculating net pension expense.
The assumed expected long-term rate of return on assets is the weighted average rate of earnings expected on the funds invested or to be invested to provide for the benefits included in the PBO. The Company’s estimate of the expected long-term rate of return considers the historical returns on plan assets, as well as the future expectations of returns on classes of assets within the target asset allocation of the plan asset portfolio. This rate is utilized principally in calculating the expected return on plan assets component of the Company’s annual pension expense.
The assumed average rate of compensation increase is the average annual compensation increase expected over the remaining employment periods for the participating employees. This rate is utilized principally in calculating the PBO and annual pension expense.
In 2010, the estimated Accumulated Other Comprehensive Income (“AOCI”) amortization of prior service credit and amortization of net loss is $0 and $2,427, respectively, for the pension plan. No refunds are expected from the benefit plan during 2010.
Amounts not yet reflected in net periodic benefit costs and included in AOCI as of January 30, 2010 and January 31, 2009 are $80,001 and $92,519, respectively.
Plan weighted-average asset investment allocations at January 30, 2010 and January 31, 2009, by asset category were as follows:
| January 30, | January 31, | |||||
| 2010 | 2009 | |||||
| Equity securities |
63.8 | % | 55.7 | % | ||
| Fixed income securities |
31.5 | % | 36.1 | % | ||
| Real estate securities |
4.7 | % | 8.2 | % | ||
| Total |
100.0 | % | 100.0 | % | ||
The Company’s pension plan investment strategy is to maintain a diversified portfolio of asset classes with the primary goal to ensure that funds are available to meet the plan’s benefit obligations when they become due
F-31
Table of Contents
SAKS INCORPORATED & SUBSIDIARIES
NOTES TO CONSOLIDATED FINANCIAL STATEMENTS—(Continued)
(In thousands, except per share amounts)
while maintaining an appropriate level of risk control. The plan’s target allocation is determined by the Company’s Retirement Committee, taking into consideration the amounts and timing of projected liabilities, the Company’s funding policies and expected returns on various asset categories, as well as the risk characteristics of and correlations among the various asset classes. Long term rate of return assumptions are developed using historical data on various asset classes. For the years ended January 31, 2009 and January 30, 2010, the plan’s target asset allocation was approximately 65% equity, 30% fixed income and 5% real estate. Equity securities include investments in both large-cap and small-cap companies. Fixed income securities include government bonds, corporate bonds of companies in diversified industries and mortgage-backed securities.
The assets of the pension plan are invested in commingled trust funds that are valued at the unit value, which approximates fair value, as reported by the trustee of the commingled trust fund on each valuation date.
The following table sets forth the fair value of the pension plan’s financial assets by level within the fair value hierarchy as of January 30, 2010:
| Total Plan Assets as of January 30, 2010 |
Quoted Prices In Active Markets for Identical Assets/ Liabilities (Level 1) |
Significant Other Observable Inputs (Level 2) |
Significant Unobservable Inputs (Level 3) | |||||||||
| Equity securities |
$ | 66,172 | $ | — | $ | 66,172 | $ | — | ||||
| Fixed income securities |
32,705 | — | 32,705 | — | ||||||||
| Real estate securities |
4,878 | — | — | 4,878 | ||||||||
| Total |
$ | 103,755 | $ | — | $ | 98,877 | $ | 4,878 | ||||
The following table summarizes changes in the fair value of Level 3 assets for the year ended January 30, 2010:
| Real estate securities |
||||
| Balance at January 31, 2009 |
$ | 7,843 | ||
| Actual return on plan assets: |
||||
| Relating to assets still held at year-end |
(2,757 | ) | ||
| Relating to assets sold during the year |
81 | |||
| Purchases, sales and settlements |
(289 | ) | ||
| Balance at January 30, 2010 |
$ | 4,878 | ||
F-32
Table of Contents
SAKS INCORPORATED & SUBSIDIARIES
NOTES TO CONSOLIDATED FINANCIAL STATEMENTS—(Continued)
(In thousands, except per share amounts)
At January 30, 2010, the following pension plan and SERP benefit payments are expected to be paid:
| Year |
Benefit Payments | ||
| 2010 |
$ | 18,768 | |
| 2011 |
16,377 | ||
| 2012 |
15,605 | ||
| 2013 |
15,354 | ||
| 2014 |
15,152 | ||
| 2015 - 2019 |
49,490 | ||
| $ | 130,746 | ||
NOTE 9 — SHAREHOLDERS’ EQUITY
The Company has a share repurchase program that authorizes it to purchase shares of the Company’s common stock. There were no shares repurchased during 2009. During 2008 and 2007, the Company repurchased 2,949 and 1,722 shares for an aggregate amount of $34,899 and $27,464, respectively. There were 32,709 shares available for repurchase under the share repurchase program at January 30, 2010.
On July 30, 2009, the Company filed a universal shelf registration statement with the SEC permitting the Company to issue securities, in one or more offerings, with a maximum aggregate offering price of $400,000. The shelf registration statement covers a variety of securities including common stock, preferred stock, warrants, and debt securities.
Under the universal shelf registration, the Company completed the public offering of approximately 14,925 shares of its common stock on October 6, 2009, at an offering price of $6.70 per share for $95,095 in proceeds, net of issuance costs.
NOTE 10 — EMPLOYEE STOCK PLANS
The Company maintains an equity incentive plan for the granting of options, stock appreciation rights, performance shares, restricted stock and other forms of equity awards to employees and directors. At January 30, 2010 and January 31, 2009, the Company had available for grant 6,028 and 16,061 shares of common stock, respectively. Options granted generally vest over a four-year period after grant and have an exercise term of seven to ten years from the grant date. Restricted stock and performance shares generally vest three years after the grant date, although the plan permits accelerated vesting in certain circumstances at the discretion of the HRCC of the Board of Directors.
Total pre-tax stock-based compensation expense for the years ended January 30, 2010, January 31, 2009, and February 2, 2008 was $16,846, $16,354, and, $7,724, respectively. The related tax benefit for the years ended January 30, 2010, January 31, 2009, and February 2, 2008 was $6,570, $6,542, and $3,090, respectively.
F-33
Table of Contents
SAKS INCORPORATED & SUBSIDIARIES
NOTES TO CONSOLIDATED FINANCIAL STATEMENTS—(Continued)
(In thousands, except per share amounts)
STOCK OPTIONS
The Company expenses the fair value of all stock-based option grants over the requisite service period on a prospective basis utilizing the Black-Scholes option pricing model. The Black-Scholes model estimates the expected value employees will receive from the options based on a number of assumptions, such as interest rates, employee exercises, the Company’s stock price and dividend yield. The weighted-average Black-Scholes fair value assumptions are as follows:
| 2009 | 2008 | 2007 | |||||||
| Expected life |
4.75 years | 5 years | 5 years | ||||||
| Risk free interest rate |
2.1 | % | 2.5 | % | 4.6 | % | |||
| Expected volatility |
57 | % | 36 | % | 35 | % | |||
| Expected dividend yield |
0 | % | 0 | % | 0 | % |
The expected life is a significant assumption as it determines the period for which the risk free interest rate, volatility and dividend yield must be applied. The expected life is the period over which employee groups are expected to hold options. The expected life is calculated using the simplified method in accordance with the appropriate accounting guidance. The risk free interest rate is based on the expected U.S. Treasury rate over the expected life. Volatility reflects movements in the Company’s stock price over the most recent historical period equivalent to the expected life. The dividend yield is zero as the Company does not anticipate declaring dividends in the foreseeable future.
The Company recognizes compensation expense for stock option awards with graded vesting on a straight line basis over the requisite service period. Total compensation expense for stock option awards, net of related tax effects, for the years ended January 30, 2010, January 31, 2009, and February 2, 2008 was $1,340, $1,374, and $772, respectively. The Company has not granted stock options with performance or market conditions.
A summary of the stock options for the year ended January 30, 2010 is presented below:
| 2009 | |||||||||
| Shares | Weighted Average Exercise Price |
Aggregate Intrinsic Value | |||||||
| Outstanding at beginning of year |
2,487 | $ | 13.26 | ||||||
| Granted |
650 | 2.36 | |||||||
| Exercised |
(171 | ) | 6.44 | ||||||
| Forfeited |
(658 | ) | 13.08 | ||||||
| Outstanding at end of year |
2,308 | $ | 10.75 | $ | 2,717 | ||||
| Options exercisable at year end |
766 | $ | 12.86 | $ | 65 | ||||
The weighted average fair value of options granted during the years ended 2009, 2008, and 2007 was $1.15, $4.65, and $7.61. The fair value of stock options vested during the years ended 2009, 2008, and 2007 was $2,265, $1,459, and $0, respectively. The total intrinsic value of stock options exercised during the years ended 2009, 2008, and 2007 was $115, $1,951, and $25,915, respectively.
F-34
Table of Contents
SAKS INCORPORATED & SUBSIDIARIES
NOTES TO CONSOLIDATED FINANCIAL STATEMENTS—(Continued)
(In thousands, except per share amounts)
The following table summarizes information about stock options outstanding at January 30, 2010:
| Options Outstanding | Options Exercisable | |||||||||||||
| Range of Exercise Prices |
Number Outstanding at January 30, 2010 |
Weighted Average Remaining Contractual Life (Years) |
Weighted Average Exercise Price |
Number Exercisable at January 30, 2010 |
Weighted Average Remaining Contractual Life (Years) |
Weighted Average Exercise Price | ||||||||
| $2.36 to $6.64 |
906 | 4.7 | $ | 3.46 | 256 | 1.1 | $ | 6.25 | ||||||
| $6.65 to 8.07 |
36 | 1.9 | $ | 7.82 | 36 | 1.9 | $ | 7.82 | ||||||
| $8.08 to $13.04 |
838 | 5.1 | $ | 13.04 | 210 | 5.1 | $ | 13.04 | ||||||
| $13.05 to $20.31 |
528 | 4.1 | $ | 19.80 | 264 | 4.1 | $ | 19.80 | ||||||
| 2,308 | 4.7 | $ | 10.75 | 766 | 3.3 | $ | 12.86 | |||||||
RESTRICTED STOCK AND PERFORMANCE SHARES
The Company granted restricted stock awards of 2,351, 2,184, and 406 shares to certain employees in 2009, 2008, and 2007, respectively. The fair value of the restricted stock is based on the market value of the Company’s common stock on the date of grant. The fair value of these shares on the dates of grants was $7,029, $27,934, and $8,843 for 2009, 2008, and 2007, respectively. During 2009, 2008, and 2007, compensation costs, net of related tax effects, of $6,694, $6,511, and $2,162, respectively, was recognized in connection with the Company’s restricted stock grants.
Compensation costs for the restricted stock awards that cliff vest is expensed on a straight line basis over the requisite service period. Restricted stock with graded vesting features are treated as multiple awards based upon the vesting date. The Company records compensation costs for these awards on a straight line basis over the requisite service period for each separately vesting portion of the award.
A summary of restricted stock awards for the year ended January 30, 2010 is presented below:
| Shares | Weighted Average Grant Price | |||||
| Nonvested at January 31, 2009 |
2,719 | $ | 14.43 | |||
| Granted |
2,351 | 2.99 | ||||
| Vested |
(200 | ) | 19.01 | |||
| Canceled |
(78 | ) | 10.77 | |||
| Nonvested at January 30, 2010 |
4,792 | $ | 8.68 | |||
The Company granted performance shares under its long-term incentive plan. The fair value of the performance shares is based on the market value of the Company’s common stock on the date of grant. The actual number of performance shares earned is based on the level of performance achieved relative to established operating (non-market condition) goals for the one-year performance period beginning February 1, 2009 and range from 0% to 100% of the target number of performance shares granted. In addition, once earned, performance shares are not payable unless the grantee remains employed by the Company for an additional two
F-35
Table of Contents
SAKS INCORPORATED & SUBSIDIARIES
NOTES TO CONSOLIDATED FINANCIAL STATEMENTS—(Continued)
(In thousands, except per share amounts)
years. Compensation costs for the performance shares that cliff vest is expensed on a straight line basis over the requisite service period. Performance shares with graded vesting features are treated as multiple awards based upon the vesting date. The Company records compensation costs for these awards on a straight line basis over the requisite service period for each separately vesting portion of the award.
The Company granted performance shares of 1,112, 816, and 570 to certain employees in 2009, 2008, and 2007, respectively. The fair value of these shares on the dates of grants was $2,624, $10,632, and $11,282 for 2009, 2008, and 2007, respectively. During 2009, 2008, and 2007, compensation costs recognized for performance shares earned in current and prior years, net of related tax effects, was $2,242, $1,735, and $1,605, respectively.
A summary of performance share awards for the year ended January 30, 2010 is presented below:
| Shares | Weighted Average Grant Price | |||||
| Nonvested at January 31, 2009 |
1,323 | $ | 15.87 | |||
| Granted |
1,112 | 2.36 | ||||
| Vested |
(7 | ) | 19.86 | |||
| Canceled |
(779 | ) | 13.12 | |||
| Nonvested at January 30, 2010 |
1,649 | $ | 7.66 | |||
At January 30, 2010 and January 31, 2009, the Company had unearned compensation amounts related to non-vested restricted stock and performance shares of $13,959 and $29,986, respectively, which will be recognized over a weighted average period of approximately 2.1 years.
STOCK PURCHASE PLAN
The Company’s employee stock purchase plan provides for an aggregate of 1,450 shares of the Company’s common stock to be purchased by eligible employees through payroll deductions at a 15% discount to market value. Under the plan, 0, 250, and 37 shares of the Company’s common stock were purchased by employees in 2009, 2008, and 2007, respectively. During 2009, 2008, and 2007, compensation costs, net of related tax effects, of $0, $189, and $60, respectively, was recognized in connection with the shares issued. At January 30, 2010, the plan had 148 shares available for future offerings.
On December 3, 2008, the HRCC of the Board of Directors suspended the employee stock purchase plan for the 2009 calendar year. On December 8, 2009, the HRCC of the Board of Directors suspended the employee stock purchase plan indefinitely.
NOTE 11 — STORE DISPOSITIONS, INTEGRATION AND OTHER CHARGES
During the fourth quarter of 2008, the Company discontinued the operations of its CLL specialty store business which consisted of 98 leased, mall-based stores. Along with the previous disposition of the SDSG businesses, CLL was no longer determined to be a strategic fit for the Company. CLL generated revenues of
F-36
Table of Contents
SAKS INCORPORATED & SUBSIDIARIES
NOTES TO CONSOLIDATED FINANCIAL STATEMENTS—(Continued)
(In thousands, except per share amounts)
approximately $52,231 million for 2008 and was not profitable. The Company incurred charges of $44,521 in 2008 associated with the CLL store closings which are included in discontinued operations in the Consolidated Statements of Income.
The following table summarizes 2009 activity related to the discontinuation of the CLL business:
| Severance and Personnel Related Costs |
Lease Termination Costs |
Other Closing Costs |
Total | |||||||||||||
| Balance at January 31, 2009 |
$ | 3,651 | $ | 9,780 | $ | 172 | $ | 13,603 | ||||||||
| Adjustments to the reserve |
— | 156 | — | 156 | ||||||||||||
| Cash Payments |
(3,651 | ) | (9,234 | ) | (172 | ) | (13,057 | ) | ||||||||
| Balance at January 30, 2010 |
$ | — | $ | 702 | $ | — | $ | 702 | ||||||||
NOTE 12 — QUARTERLY FINANCIAL INFORMATION (UNAUDITED)
Summarized quarterly financial information for 2009 and 2008 is as follows:
| First Quarter (Revised) |
Second Quarter (Revised) |
Third Quarter |
Fourth Quarter |
|||||||||||||
| Fiscal year ended January 30, 2010: |
||||||||||||||||
| Total sales |
$ | 624,265 | $ | 564,519 | $ | 631,434 | $ | 811,314 | ||||||||
| Gross margin |
241,407 | 170,999 | 254,635 | 296,394 | ||||||||||||
| Operating income (loss) |
2,191 | (67,688 | ) | 15,609 | (4,597 | ) | ||||||||||
| Income (loss) from continuing operations |
(4,881 | ) | (54,489 | ) | 6,333 | (4,625 | ) | |||||||||
| Net income (loss) |
(5,117 | ) | (54,512 | ) | 6,318 | (4,608 | ) | |||||||||
| Basic earnings (loss) per common share |
$ | (0.04 | ) | $ | (0.39 | ) | $ | 0.04 | $ | (0.03 | ) | |||||
| Diluted earnings (loss) per common share |
$ | (0.04 | ) | $ | (0.39 | ) | $ | 0.04 | $ | (0.03 | ) | |||||
| First Quarter (Revised) |
Second Quarter (Revised) |
Third Quarter (Revised) |
Fourth Quarter (Revised) |
|||||||||||||
| Fiscal year ended January 31, 2009: |
||||||||||||||||
| Total sales |
$ | 853,470 | $ | 660,089 | $ | 690,297 | $ | 839,582 | ||||||||
| Gross margin |
326,272 | 230,528 | 246,329 | 177,815 | ||||||||||||
| Operating income (loss) |
42,614 | (41,566 | ) | (14,369 | ) | (122,067 | ) | |||||||||
| Income (loss) from continuing operations |
18,971 | (30,906 | ) | (30,793 | ) | (83,897 | ) | |||||||||
| Net income (loss) |
17,336 | (32,667 | ) | (43,729 | ) | (99,744 | ) | |||||||||
| Basic earnings (loss) per common share |
$ | 0.12 | $ | (0.24 | ) | $ | (0.32 | ) | $ | (0.72 | ) | |||||
| Diluted earnings (loss) per common share |
$ | 0.12 | $ | (0.24 | ) | $ | (0.32 | ) | $ | (0.72 | ) | |||||
During the preparation of our condensed consolidated financial statements for the quarterly period ended October 31, 2009, the Company identified a classification error in its Consolidated Statements of Income for the year ended January 31, 2009 and prior periods and the quarterly periods therein. The Company improperly included certain shipping and handling revenue in SG&A. The Company corrected this error in our Consolidated
F-37
Table of Contents
SAKS INCORPORATED & SUBSIDIARIES
NOTES TO CONSOLIDATED FINANCIAL STATEMENTS—(Continued)
(In thousands, except per share amounts)
Statements of Income by adjusting Net Sales and SG&A to reflect all shipping and handling revenue in Net Sales. The adjustment for the quarterly periods ended August 1, 2009, May 2, 2009, January 31, 2009, November 1, 2008, August 2, 2008, and May 3, 2008 was $2,823, $2,999, $4,077, $3,068, $3,121, and $3,429, respectively. Operating Income (Loss) was unaffected by these reclassification adjustments.
Effective February 1, 2009, the Company retrospectively adopted ASC 470 related to accounting for convertible debt instruments that may be settled in cash upon conversion (including partial cash settlement). In March 2004, the Company issued $230,000 of 2.00% convertible senior notes that mature in 2024 (the “2.0% Convertible Senior Notes”). The 2.0% Convertible Senior Notes are within the scope of ASC 470, which requires an allocation of convertible debt proceeds between the liability component and the embedded conversion option (i.e., the equity component). The adoption of this pronouncement decreased income (loss) from continuing operations and net income (loss) by $990, $974, $958, and $941 for the quarterly periods ended January 31, 2009, November 1, 2008, August 2, 2008, and May 3, 2008, respectively. Basic and diluted earnings (loss) per share decreased by $.01 for the quarterly periods ended November 1, 2008, August 2, 2008, and May 3, 2008, respectively. There was no impact on basic and diluted loss per share for the quarterly period ended January 31, 2009.
NOTE 13 — CONDENSED CONSOLIDATING FINANCIAL INFORMATION
The following tables present condensed consolidating financial information for 2009, 2008, and 2007 for: (1) Saks Incorporated and (2) on a combined basis, the guarantors of Saks Incorporated’s senior notes (which are all of the wholly owned subsidiaries of Saks Incorporated).
The condensed consolidating financial statements presented as of and for the years ended January 30, 2010, January 31, 2009, and February 2, 2008 reflect the legal entity compositions at the respective dates. Certain prior period amounts have been revised to reflect the adjustment to Net Sales and SG&A to reflect all shipping and handling revenue in Net Sales (see Note 2).
Separate financial statements of the guarantor subsidiaries are not presented because the guarantors are jointly, severally, fully and unconditionally liable under the guarantees. Borrowings and the related interest expense under the Company’s revolving credit agreement are allocated to Saks Incorporated and the guarantor subsidiaries under an intercompany revolving credit arrangement. There are also management and royalty fee arrangements among Saks Incorporated and its subsidiaries. At January 30, 2010, Saks Incorporated was the sole obligor for the majority of the Company’s long-term debt and employed a small group of corporate employees.
F-38
Table of Contents
SAKS INCORPORATED & SUBSIDIARIES
CONDENSED CONSOLIDATING STATEMENTS OF INCOME
FOR THE YEAR ENDED JANUARY 30, 2010
| (In Thousands) |
SAKS INCORPORATED |
GUARANTOR SUBSIDIARIES |
ELIMINATIONS | CONSOLIDATED | |||||||||||
| NET SALES |
$ | 2,631,532 | $ | 2,631,532 | |||||||||||
| Cost of sales (excluding depreciation and amortization) |
1,668,097 | 1,668,097 | |||||||||||||
| GROSS MARGIN |
963,435 | 963,435 | |||||||||||||
| Selling, general and administrative expenses |
$ | 357 | 673,949 | 674,306 | |||||||||||
| Other operating expenses |
1 | 312,188 | 312,189 | ||||||||||||
| Store pre-opening costs |
2,077 | 2,077 | |||||||||||||
| Impairments and dispositions |
29,348 | 29,348 | |||||||||||||
| OPERATING LOSS |
(358 | ) | (54,127 | ) | — | (54,485 | ) | ||||||||
| OTHER INCOME (EXPENSE) |
|||||||||||||||
| Equity in earnings of subsidiaries—continuing operations |
(32,562 | ) | $ | 32,562 | |||||||||||
| Interest expense |
(42,591 | ) | (6,889 | ) | (49,480 | ) | |||||||||
| Gain on extinguishment of debt |
783 | 783 | |||||||||||||
| Other income, net |
1,019 | 1,019 | |||||||||||||
| LOSS FROM CONTINUING OPERATIONS BEFORE BENEFIT FOR INCOME TAXES |
(73,709 | ) | (61,016 | ) | 32,562 | (102,163 | ) | ||||||||
| Benefit for income taxes |
(16,047 | ) | (28,454 | ) | (44,501 | ) | |||||||||
| LOSS FROM CONTINUING OPERATIONS |
(57,662 | ) | (32,562 | ) | 32,562 | (57,662 | ) | ||||||||
| DISCONTINUED OPERATIONS: |
|||||||||||||||
| Equity in earnings of subsidiaries—discontinued operations (net of tax) |
(257 | ) | 257 | ||||||||||||
| Loss from discontinued operations before |
|||||||||||||||
| Benefit for income taxes |
(395 | ) | (395 | ) | |||||||||||
| Benefit for income taxes |
(138 | ) | (138 | ) | |||||||||||
| LOSS FROM DISCONTINUED OPERATIONS |
(257 | ) | (257 | ) | 257 | (257 | ) | ||||||||
| NET LOSS |
$ | (57,919 | ) | $ | (32,819 | ) | $ | 32,819 | $ | (57,919 | ) | ||||
F-39
Table of Contents
SAKS INCORPORATED & SUBSIDIARIES
CONDENSED CONSOLIDATING BALANCE SHEETS
AS OF JANUARY 30, 2010
| (In Thousands) |
SAKS INCORPORATED |
GUARANTOR SUBSIDIARIES |
ELIMINATIONS | CONSOLIDATED | |||||||||
| ASSETS |
|||||||||||||
| CURRENT ASSETS |
|||||||||||||
| Cash and cash equivalents |
$ | 136,347 | $ | 10,954 | $ | 147,301 | |||||||
| Merchandise inventories |
649,196 | 649,196 | |||||||||||
| Other current assets |
93,479 | 93,479 | |||||||||||
| Deferred income taxes, net |
35,974 | 35,974 | |||||||||||
| TOTAL CURRENT ASSETS |
136,347 | 789,603 | — | 925,950 | |||||||||
| PROPERTY AND EQUIPMENT, NET |
956,082 | 956,082 | |||||||||||
| DEFERRED INCOME TAXES, NET |
71,274 | 150,080 | 221,354 | ||||||||||
| OTHER ASSETS |
13,887 | 18,428 | 32,315 | ||||||||||
| INVESTMENT IN AND ADVANCES TO SUBSIDIARIES |
1,324,256 | $ | (1,324,256 | ) | |||||||||
| $ | 1,545,764 | $ | 1,914,193 | $ | (1,324,256 | ) | $ | 2,135,701 | |||||
| LIABILITIES AND SHAREHOLDERS’ EQUITY |
|||||||||||||
| CURRENT LIABILITIES |
|||||||||||||
| Accounts payable |
$ | 101,739 | $ | 101,739 | |||||||||
| Accrued expenses and other current liabilities |
$ | 9,377 | 240,808 | 250,185 | |||||||||
| Current portion of long-term debt |
22,859 | 4,998 | 27,857 | ||||||||||
| TOTAL CURRENT LIABILITIES |
32,236 | 347,545 | — | 379,781 | |||||||||
| LONG-TERM DEBT |
441,918 | 51,412 | 493,330 | ||||||||||
| OTHER LONG-TERM LIABILITIES |
190,980 | 190,980 | |||||||||||
| INVESTMENT BY AND ADVANCES FROM PARENT |
1,324,256 | $ | (1,324,256 | ) | |||||||||
| SHAREHOLDERS’ EQUITY |
1,071,610 | 1,071,610 | |||||||||||
| TOTAL LIABILITIES AND SHAREHOLDERS’ EQUITY |
$ | 1,545,764 | $ | 1,914,193 | $ | (1,324,256 | ) | $ | 2,135,701 | ||||
F-40
Table of Contents
SAKS INCORPORATED & SUBSIDIARIES
CONDENSED CONSOLIDATING STATEMENTS OF CASH FLOWS
FOR THE YEAR ENDED JANUARY 30, 2010
| (In Thousands) |
SAKS INCORPORATED |
GUARANTOR SUBSIDIARIES |
ELIMINATIONS | CONSOLIDATED | ||||||||||||
| OPERATING ACTIVITIES |
||||||||||||||||
| Net loss |
$ | (57,919 | ) | $ | (32,819 | ) | $ | 32,819 | $ | (57,919 | ) | |||||
| Loss from discontinued operations |
(257 | ) | (257 | ) | 257 | (257 | ) | |||||||||
| Loss from continuing operations |
(57,662 | ) | (32,562 | ) | 32,562 | (57,662 | ) | |||||||||
| Adjustments to reconcile net loss to net Cash provided by (used in) operating activities: |
||||||||||||||||
| Equity in earnings of subsidiaries |
32,562 | — | (32,562 | ) | — | |||||||||||
| Depreciation and amortization |
135,162 | 135,162 | ||||||||||||||
| Equity compensation |
16,846 | 16,846 | ||||||||||||||
| Amortization of discount on convertible senior notes |
9,819 | 9,819 | ||||||||||||||
| Gain on debt extinguishment |
(783 | ) | (783 | ) | ||||||||||||
| Deferred income taxes |
1,886 | (42,471 | ) | (40,585 | ) | |||||||||||
| Impairments and dispositions |
29,348 | 29,348 | ||||||||||||||
| Gain on sale of property |
(628 | ) | (628 | ) | ||||||||||||
| Changes in operating assets and liabilities, net |
(9,142 | ) | 123,500 | 114,358 | ||||||||||||
| NET CASH PROVIDED BY (USED IN) OPERATING ACTIVITIES — CONTINUING OPERATIONS |
(6,474 | ) | 212,349 | — | 205,875 | |||||||||||
| NET CASH USED IN OPERATING ACTIVITIES — DISCONTINUED OPERATIONS |
(13,670 | ) | (13,670 | ) | ||||||||||||
| NET CASH PROVIDED BY (USED IN) OPERATING ACTIVITIES |
(6,474 | ) | 198,679 | — | 192,205 | |||||||||||
| INVESTING ACTIVITIES |
||||||||||||||||
| Purchases of property and equipment |
— | (74,577 | ) | — | (74,577 | ) | ||||||||||
| Proceeds from sale of property and equipment |
643 | 643 | ||||||||||||||
| NET CASH USED IN INVESTING ACTIVITIES — CONTINUING OPERATIONS |
— | (73,934 | ) | — | (73,934 | ) | ||||||||||
| NET CASH USED IN INVESTING ACTIVITIES — DISCONTINUED OPERATIONS |
— | — | ||||||||||||||
| NET CASH USED IN INVESTING ACTIVITIES |
— | (73,934 | ) | — | (73,934 | ) | ||||||||||
| FINANCING ACTIVITIES |
||||||||||||||||
| Intercompany borrowings |
119,155 | (119,155 | ) | — | — | |||||||||||
| Proceeds from issuance of convertible senior notes |
120,000 | 120,000 | ||||||||||||||
| Payments of deferred financing costs |
(13,105 | ) | (13,105 | ) | ||||||||||||
| Payments on revolving credit facility |
(156,675 | ) | (156,675 | ) | ||||||||||||
| Cash dividends paid |
(781 | ) | (781 | ) | ||||||||||||
| Payments on long-term debt and capital lease obligations |
(22,208 | ) | (4,673 | ) | (26,881 | ) | ||||||||||
| Net proceeds from issuance of common stock |
96,199 | 96,199 | ||||||||||||||
| NET CASH PROVIDED BY (USED IN) FINANCING ACTIVITIES — CONTINUING OPERATIONS |
142,585 | (123,828 | ) | — | 18,757 | |||||||||||
| NET CASH PROVIDED BY FINANCING ACTIVITIES — DISCONTINUED OPERATIONS |
— | — | — | — | ||||||||||||
| NET CASH PROVIDED BY (USED IN) FINANCING ACTIVITIES |
142,585 | (123,828 | ) | — | 18,757 | |||||||||||
| INCREASE IN CASH AND CASH EQUIVALENTS |
136,111 | 917 | — | 137,028 | ||||||||||||
| CASH AND CASH EQUIVALENTS AT BEGINNING OF YEAR |
236 | 10,037 | — | 10,273 | ||||||||||||
| CASH AND CASH EQUIVALENTS AT END OF YEAR |
$ | 136,347 | $ | 10,954 | $ | — | $ | 147,301 | ||||||||
F-41
Table of Contents
SAKS INCORPORATED & SUBSIDIARIES
CONDENSED CONSOLIDATING STATEMENTS OF INCOME
FOR THE YEAR ENDED JANUARY 31, 2009
| (In Thousands) |
SAKS INCORPORATED (Revised) |
GUARANTOR SUBSIDIARIES (Revised) |
ELIMINATIONS (Revised) |
CONSOLIDATED (Revised) |
|||||||||||
| NET SALES |
$ | 3,043,438 | $ | 3,043,438 | |||||||||||
| Cost of sales (excluding depreciation and amortization) |
2,062,494 | 2,062,494 | |||||||||||||
| GROSS MARGIN |
980,944 | 980,944 | |||||||||||||
| Selling, general and administrative expenses |
$ | 13 | 784,497 | 784,510 | |||||||||||
| Other operating expenses |
947 | 317,408 | 318,355 | ||||||||||||
| Store pre-opening costs |
2,328 | 2,328 | |||||||||||||
| Impairments and dispositions |
11,139 | 11,139 | |||||||||||||
| OPERATING LOSS |
(960 | ) | (134,428 | ) | — | (135,388 | ) | ||||||||
| OTHER INCOME (EXPENSE) |
|||||||||||||||
| Equity in earnings of subsidiaries —continuing operations |
(101,186 | ) | $ | 101,186 | |||||||||||
| Interest expense |
(36,685 | ) | (9,054 | ) | (45,739 | ) | |||||||||
| Other income, net |
5,600 | 5,600 | |||||||||||||
| LOSS FROM CONTINUING OPERATIONS BEFORE BENEFIT FOR INCOME TAXES |
(133,231 | ) | (143,482 | ) | 101,186 | (175,527 | ) | ||||||||
| Benefit for income taxes |
(6,606 | ) | (42,296 | ) | (48,902 | ) | |||||||||
| LOSS FROM CONTINUING OPERATIONS |
(126,625 | ) | (101,186 | ) | 101,186 | (126,625 | ) | ||||||||
| DISCONTINUED OPERATIONS: |
|||||||||||||||
| Equity in earnings of subsidiaries —discontinued operations (net of tax) |
(32,179 | ) | 32,179 | ||||||||||||
| Loss from discontinued operations before Benefit for income taxes |
(52,727 | ) | (52,727 | ) | |||||||||||
| Benefit for income taxes |
(20,548 | ) | (20,548 | ) | |||||||||||
| LOSS FROM DISCONTINUED OPERATIONS |
(32,179 | ) | (32,179 | ) | 32,179 | (32,179 | ) | ||||||||
| NET LOSS |
$ | (158,804 | ) | $ | (133,365 | ) | $ | 133,365 | $ | (158,804 | ) | ||||
F-42
Table of Contents
SAKS INCORPORATED & SUBSIDIARIES
CONDENSED CONSOLIDATING BALANCE SHEETS
AS OF JANUARY 31, 2009
| (In Thousands) |
SAKS INCORPORATED (Revised) |
GUARANTOR SUBSIDIARIES (Revised) |
ELIMINATIONS (Revised) |
CONSOLIDATED (Revised) | |||||||||
| ASSETS |
|||||||||||||
| CURRENT ASSETS |
|||||||||||||
| Cash and cash equivalents |
$ | 236 | $ | 10,037 | $ | 10,273 | |||||||
| Merchandise inventories |
728,841 | 728,841 | |||||||||||
| Other current assets |
105,350 | 105,350 | |||||||||||
| Deferred income taxes, net |
29,916 | 29,916 | |||||||||||
| TOTAL CURRENT ASSETS |
236 | 874,144 | — | 874,380 | |||||||||
| PROPERTY AND EQUIPMENT, NET |
1,058,393 | 1,058,393 | |||||||||||
| DEFERRED INCOME TAXES, NET |
55,227 | 139,729 | 194,956 | ||||||||||
| OTHER ASSETS |
3,614 | 16,334 | 19,948 | ||||||||||
| INVESTMENT IN AND ADVANCES TO SUBSIDIARIES |
1,476,437 | $ | (1,476,437 | ) | |||||||||
| $ | 1,535,514 | $ | 2,088,600 | $ | (1,476,437 | ) | $ | 2,147,677 | |||||
| LIABILITIES AND SHAREHOLDERS’ EQUITY |
|||||||||||||
| CURRENT LIABILITIES |
|||||||||||||
| Accounts payable |
$ | 90,208 | $ | 90,208 | |||||||||
| Accrued expenses and other current liabilities |
$ | 8,235 | 267,312 | 275,547 | |||||||||
| Current portion of long-term debt |
4,673 | 4,673 | |||||||||||
| TOTAL CURRENT LIABILITIES |
8,235 | 362,193 | — | 370,428 | |||||||||
| LONG-TERM DEBT |
536,693 | 56,410 | 593,103 | ||||||||||
| OTHER LONG-TERM LIABILITIES |
193,560 | 193,560 | |||||||||||
| INVESTMENT BY AND ADVANCES FROM PARENT |
1,476,437 | $ | (1,476,437 | ) | |||||||||
| SHAREHOLDERS’ EQUITY |
990,586 | 990,586 | |||||||||||
| TOTAL LIABILITIES AND SHAREHOLDERS’ EQUITY |
$ | 1,535,514 | $ | 2,088,600 | $ | (1,476,437 | ) | $ | 2,147,677 | ||||
F-43
Table of Contents
SAKS INCORPORATED & SUBSIDIARIES
CONDENSED CONSOLIDATING STATEMENTS OF CASH FLOWS
FOR THE YEAR ENDED JANUARY 31, 2009
| (In Thousands) |
SAKS INCORPORATED (Revised) |
GUARANTOR SUBSIDIARIES (Revised) |
ELIMINATIONS (Revised) |
CONSOLIDATED (Revised) |
||||||||||||
| OPERATING ACTIVITIES |
||||||||||||||||
| Net loss |
$ | (158,804 | ) | $ | (133,365 | ) | $ | 133,365 | $ | (158,804 | ) | |||||
| Loss from discontinued operations |
(32,179 | ) | (32,179 | ) | 32,179 | (32,179 | ) | |||||||||
| Loss from continuing operations |
(126,625 | ) | (101,186 | ) | 101,186 | (126,625 | ) | |||||||||
| Adjustments to reconcile net income to net Cash (used in) provided by operating activities: |
||||||||||||||||
| Equity in earnings of subsidiaries |
101,186 | (101,186 | ) | |||||||||||||
| Depreciation and amortization |
134,694 | 134,694 | ||||||||||||||
| Equity compensation |
16,354 | 16,354 | ||||||||||||||
| Amortization of discount on convertible senior notes |
6,811 | 6,811 | ||||||||||||||
| Gain on sale of building |
(3,400 | ) | (3,400 | ) | ||||||||||||
| Deferred income taxes |
1,841 | (51,621 | ) | (49,780 | ) | |||||||||||
| Impairments and dispositions |
11,139 | 11,139 | ||||||||||||||
| Changes in operating assets and liabilities, net |
(109,248 | ) | 137,225 | 27,977 | ||||||||||||
| NET CASH PROVIDED BY (USED IN) OPERATING ACTIVITIES — CONTINUING OPERATIONS |
(109,681 | ) | 126,851 | — | 17,170 | |||||||||||
| NET CASH USED IN OPERATING ACTIVITIES — DISCONTINUED OPERATIONS |
(18,667 | ) | (18,667 | ) | ||||||||||||
| NET CASH PROVIDED BY (USED IN) OPERATING ACTIVITIES |
(109,681 | ) | 108,184 | — | (1,497 | ) | ||||||||||
| INVESTING ACTIVITIES |
||||||||||||||||
| Purchases of property and equipment |
(127,305 | ) | (127,305 | ) | ||||||||||||
| Proceeds from sale of property and equipment |
4,338 | 4,338 | ||||||||||||||
| NET CASH USED IN INVESTING ACTIVITIES — CONTINUING OPERATIONS |
— | (122,967 | ) | — | (122,967 | ) | ||||||||||
| NET CASH USED IN INVESTING ACTIVITIES — DISCONTINUED OPERATIONS |
(1,875 | ) | (1,875 | ) | ||||||||||||
| NET CASH USED IN INVESTING ACTIVITIES |
— | (124,842 | ) | — | (124,842 | ) | ||||||||||
| FINANCING ACTIVITIES |
||||||||||||||||
| Intercompany borrowings |
(15,698 | ) | 15,698 | |||||||||||||
| Payments on long-term debt and capital lease obligations |
(84,569 | ) | (4,673 | ) | (89,242 | ) | ||||||||||
| Proceeds from revolving credit facility |
156,675 | 156,675 | ||||||||||||||
| Cash dividends paid |
(1,183 | ) | (1,183 | ) | ||||||||||||
| Purchase of common stock |
(34,889 | ) | (34,889 | ) | ||||||||||||
| Proceeds from issuance of common stock |
4,089 | 4,089 | ||||||||||||||
| NET CASH PROVIDED BY FINANCING ACTIVITIES — CONTINUING OPERATIONS |
24,425 | 11,025 | — | 35,450 | ||||||||||||
| NET CASH PROVIDED BY FINANCING ACTIVITIES — DISCONTINUED OPERATIONS |
— | — | — | — | ||||||||||||
| NET CASH PROVIDED BY FINANCING ACTIVITIES |
24,425 | 11,025 | — | 35,450 | ||||||||||||
| DECREASE IN CASH AND CASH EQUIVALENTS |
(85,256 | ) | (5,633 | ) | — | (90,889 | ) | |||||||||
| CASH AND CASH EQUIVALENTS AT BEGINNING OF YEAR |
85,492 | 15,670 | — | 101,162 | ||||||||||||
| CASH AND CASH EQUIVALENTS AT END OF YEAR |
$ | 236 | $ | 10,037 | $ | — | $ | 10,273 | ||||||||
F-44
Table of Contents
SAKS INCORPORATED & SUBSIDIARIES
CONDENSED CONSOLIDATING STATEMENTS OF INCOME
FOR THE YEAR ENDED FEBRUARY 2, 2008
| (In Thousands) |
SAKS INCORPORATED (Revised) |
GUARANTOR SUBSIDIARIES (Revised) |
ELIMINATIONS (Revised) |
CONSOLIDATED (Revised) |
||||||||||||
| NET SALES |
$ | 3,237,275 | $ | 3,237,275 | ||||||||||||
| Cost of sales (excluding depreciation and amortization) |
1,972,251 | 1,972,251 | ||||||||||||||
| GROSS MARGIN |
1,265,024 | 1,265,024 | ||||||||||||||
| Selling, general and administrative expenses |
$ | 3,910 | 836,913 | 840,823 | ||||||||||||
| Other operating expenses |
86 | 316,253 | 316,339 | |||||||||||||
| Store pre-opening costs |
707 | 707 | ||||||||||||||
| Impairments and dispositions |
4,279 | 4,279 | ||||||||||||||
| OPERATING INCOME (LOSS) |
(3,996 | ) | 106,872 | — | 102,876 | |||||||||||
| OTHER INCOME (EXPENSE) |
||||||||||||||||
| Equity in earnings of subsidiaries—continuing operations |
61,474 | $ | (61,474 | ) | ||||||||||||
| Interest expense |
(38,951 | ) | (9,352 | ) | (48,303 | ) | ||||||||||
| Loss on extinguishment of debt |
(5,634 | ) | (5,634 | ) | ||||||||||||
| Other income, net |
24,908 | 4 | 24,912 | |||||||||||||
| INCOME FROM CONTINUING OPERATIONS BEFORE PROVISION (BENEFIT) FOR INCOME TAXES |
37,801 | 97,524 | (61,474 | ) | 73,851 | |||||||||||
| Provision (benefit) for income taxes |
(9,295 | ) | 36,050 | 26,755 | ||||||||||||
| INCOME FROM CONTINUING OPERATIONS |
47,096 | 61,474 | (61,474 | ) | 47,096 | |||||||||||
| DISCONTINUED OPERATIONS: |
||||||||||||||||
| Equity in earnings of subsidiaries—discontinued operations (net of tax) |
(3,214 | ) | 3,214 | — | ||||||||||||
| Loss from discontinued operations |
(4,860 | ) | (4,860 | ) | ||||||||||||
| Benefit for income taxes |
(1,646 | ) | (1,646 | ) | ||||||||||||
| LOSS FROM DISCONTINUED OPERATIONS |
(3,214 | ) | (3,214 | ) | 3,214 | (3,214 | ) | |||||||||
| NET INCOME |
$ | 43,882 | $ | 58,260 | $ | (58,260 | ) | $ | 43,882 | |||||||
F-45
Table of Contents
SAKS INCORPORATED & SUBSIDIARIES
CONDENSED CONSOLIDATING STATEMENTS OF CASH FLOWS
FOR THE YEAR ENDED FEBRUARY 2, 2008
| (In Thousands) |
SAKS INCORPORATED (Revised) |
GUARANTOR SUBSIDIARIES (Revised) |
ELIMINATIONS (Revised) |
CONSOLIDATED (Revised) |
||||||||||||
| OPERATING ACTIVITIES |
||||||||||||||||
| Net income |
$ | 43,882 | $ | 58,260 | $ | (58,260 | ) | $ | 43,882 | |||||||
| Loss from discontinued operations |
(3,214 | ) | (3,214 | ) | 3,214 | (3,214 | ) | |||||||||
| Income from continuing operations |
47,096 | 61,474 | (61,474 | ) | 47,096 | |||||||||||
| Adjustments to reconcile net income to net cash (used in) provided by operating activities: |
||||||||||||||||
| Equity in earnings of subsidiaries |
(61,474 | ) | — | 61,474 | — | |||||||||||
| Depreciation and amortization |
131,737 | 131,737 | ||||||||||||||
| Equity Compensation |
7,724 | 7,724 | ||||||||||||||
| Amortization of discount on convertible senior notes |
6,404 | 6,404 | ||||||||||||||
| Gain on lease termination |
(1,669 | ) | (1,669 | ) | ||||||||||||
| Gain on sale of building |
(1,069 | ) | (1,069 | ) | ||||||||||||
| Deferred income taxes |
1,568 | 22,220 | 23,788 | |||||||||||||
| Loss on extinguishment of debt |
5,634 | 5,634 | ||||||||||||||
| Impairments and dispositions |
4,279 | 4,279 | ||||||||||||||
| liabilities, net |
50,201 | (206,726 | ) | (156,525 | ) | |||||||||||
| NET CASH PROVIDED BY OPERATING ACTIVITIES — CONTINUING OPERATIONS |
57,153 | 10,246 | — | 67,399 | ||||||||||||
| NET CASH PROVIDED BY OPERATING ACTIVITIES — DISCONTINUED OPERATIONS |
4,080 | 4,080 | ||||||||||||||
| NET CASH PROVIDED BY OPERATING ACTIVITIES |
57,153 | 14,326 | — | 71,479 | ||||||||||||
| INVESTING ACTIVITIES |
||||||||||||||||
| Purchases of property and equipment |
(136,726 | ) | (136,726 | ) | ||||||||||||
| Proceeds from sale of assets |
12,352 | 12,352 | ||||||||||||||
| NET CASH USED IN INVESTING ACTIVITIES— CONTINUING OPERATIONS |
— | (124,374 | ) | — | (124,374 | ) | ||||||||||
| NET CASH USED IN INVESTING ACTIVITIES — DISCONTINUED OPERATIONS |
(4,259 | ) | (4,259 | ) | ||||||||||||
| NET CASH USED IN INVESTING ACTIVITIES |
— | (128,633 | ) | — | (128,633 | ) | ||||||||||
| FINANCING ACTIVITIES |
||||||||||||||||
| Intercompany borrowings |
(125,750 | ) | 125,750 | |||||||||||||
| Payments on long-term debt and capital lease obligations |
(110,832 | ) | (8,148 | ) | (118,980 | ) | ||||||||||
| Payment of dividend |
(7,430 | ) | (7,430 | ) | ||||||||||||
| Purchase of common stock |
(27,464 | ) | (27,464 | ) | ||||||||||||
| Proceeds from issuance of stock |
34,307 | 34,307 | ||||||||||||||
| NET CASH PROVIDED BY (USED IN) FINANCING ACTIVITIES — CONTINUING OPERATIONS |
(237,169 | ) | 117,602 | — | (119,567 | ) | ||||||||||
| NET CASH USED IN FINANCING ACTIVITIES — DISCONTINUED OPERATIONS |
— | — | ||||||||||||||
| NET CASH PROVIDED BY (USED IN) FINANCING ACTIVITIES |
(237,169 | ) | 117,602 | — | (119,567 | ) | ||||||||||
| INCREASE (DECREASE) IN CASH AND CASH EQUIVALENTS |
(180,016 | ) | 3,295 | — | (176,721 | ) | ||||||||||
| CASH AND CASH EQUIVALENTS AT BEGINNING OF YEAR |
265,508 | 12,375 | 277,883 | |||||||||||||
| CASH AND CASH EQUIVALENTS AT END OF YEAR |
$ | 85,492 | $ | 15,670 | $ | — | $ | 101,162 | ||||||||
F-46
Table of Contents
SAKS INCORPORATED & SUBSIDIARIES
SCHEDULE II — VALUATION AND QUALIFYING ACCOUNTS
| Year Ended | ||||||||||||
| (Dollars In Thousands) |
January 30, 2010 |
January 31, 2009 |
February 2, 2008 |
|||||||||
| Allowance for sales returns, net: |
||||||||||||
| Balance at Beginning of Year |
$ | 4,238 | $ | 7,255 | $ | 6,848 | ||||||
| Charged to Costs and Expenses |
765,534 | 946,230 | 961,593 | |||||||||
| Deductions (A) |
(765,867 | ) | (949,247 | ) | (961,186 | ) | ||||||
| Balance at End of Year |
$ | 3,905 | $ | 4,238 | $ | 7,255 | ||||||
| (A) | Deductions consist of actual returns net of related costs and commissions |
| Year Ended | ||||||||||||
| (Dollars In Thousands) |
January 30, 2010 |
January 31, 2009 |
February 2, 2008 |
|||||||||
| Valuation Allowance in Deferred Tax Assets |
||||||||||||
| Balance at Beginning of Year |
$ | 42,190 | $ | 63,837 | $ | 47,592 | ||||||
| Charged (Credited) to Income |
3,045 | 6,110 | (2,957 | ) | ||||||||
| Charged (Credited) to Shareholders' Equity |
— | — | 19,258 | |||||||||
| Increase (Decrease) to Reserve |
(2,425 | ) | (27,757 | ) | (56 | ) | ||||||
| Balance at End of Year |
$ | 42,810 | $ | 42,190 | $ | 63,837 | ||||||
F-47