Attached files
| file | filename |
|---|---|
| 8-K - FORM 8-K - Great Lakes Dredge & Dock CORP | d8k.htm |
 March 2010 Investor Meetings Exhibit 99.1 |
 2 Safe Harbor This presentation includes “forward-looking” statements within the meaning of Section 27A of the Securities Act of 1933, Section 21E of the Securities Exchange Act of 1934, the Private Securities Litigation
Reform Act of 1995 or in releases made by the SEC, all as may be amended
from time to time. Such statements include declarations regarding the intent, belief, or current expectation of the Company and its management. The Company
cautions that any such forward-looking statements are not guarantees of future performance, and involve a number of risks, assumptions and uncertainties that could cause actual results of the Company and its subsidiaries, or industry results, to
differ materially from those expressed or implied by any forward-looking
statements contained herein, including, but not limited to, as a result of the factors, risks and uncertainties described in other securities filings of the Company
made with the SEC, such as the Company’s most recent Report on Form
10-K. You should not place undue reliance upon these forward-looking statements. Forward-looking statements provided herein are made only as of the
date hereof or as a specified date herein and the Company does not have or
undertake any obligation to update or revise them, unless required by law. |
 Key Investment Highlights Douglas Mackie President & CEO |
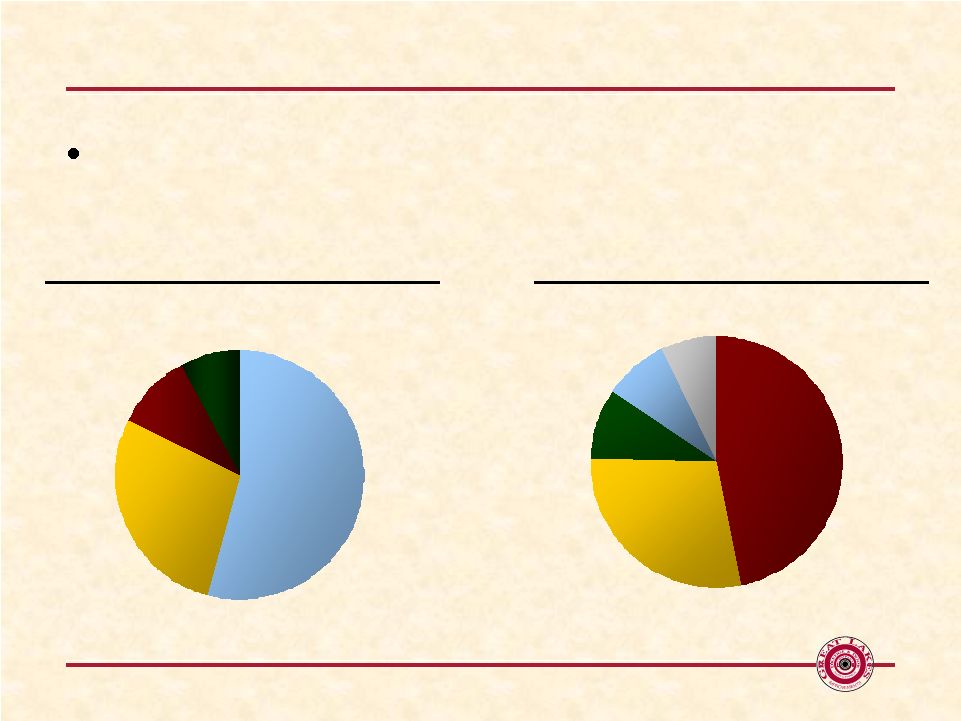 4 Great Lakes Dredge & Dock Largest provider of dredging, land reclamation and beach nourishment services in the
U.S. 2009 REVENUE BY WORK TYPE $622 million 2009 DOMESTIC BID MARKET SHARE Bid Market: $1,137 million Norfolk 7% Other 9% Great Lakes 47% Weeks 29% Manson 8% Demolition 8% Beach 10% Capital 54% Maintenance 28% |
 5 Great Lakes Dredge & Dock Leader in Federally protected domestic market Largest and most diverse U.S. dredging fleet Only U.S. dredge operator with significant foreign presence Technical expertise/capability to address increasingly stringent environmental regulations and job complexity Fleet capacity to compete for multiple projects across domestic market sectors and internationally |
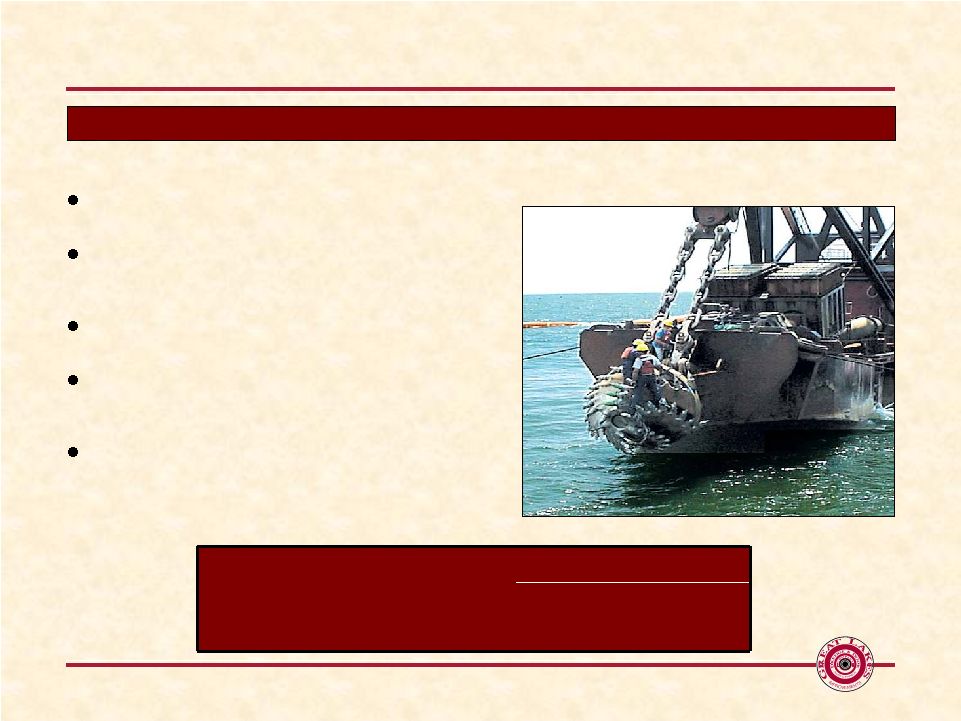
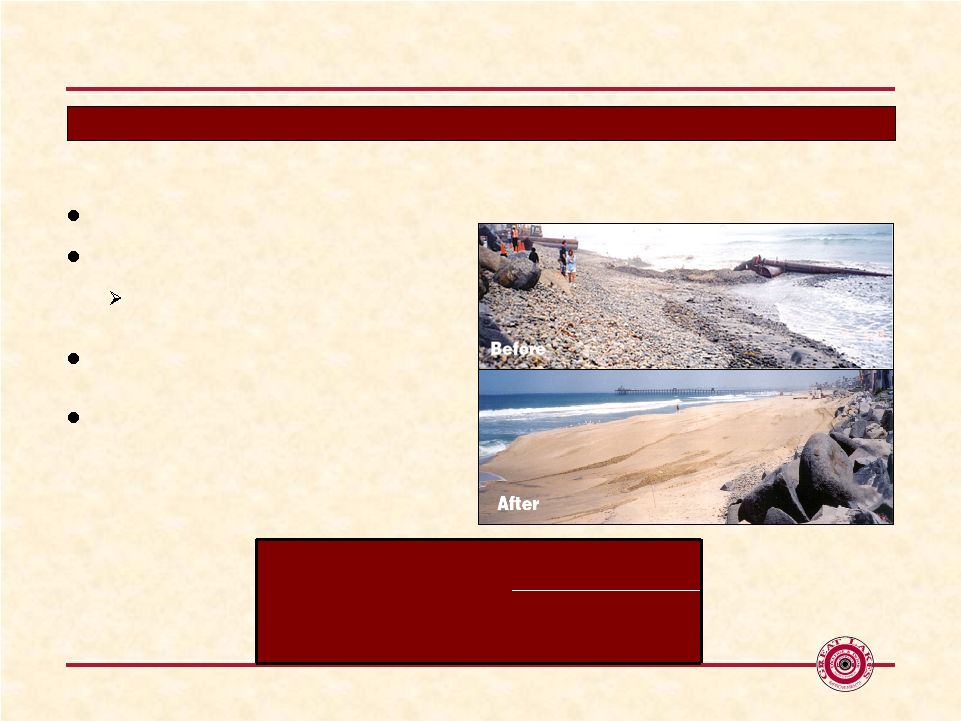
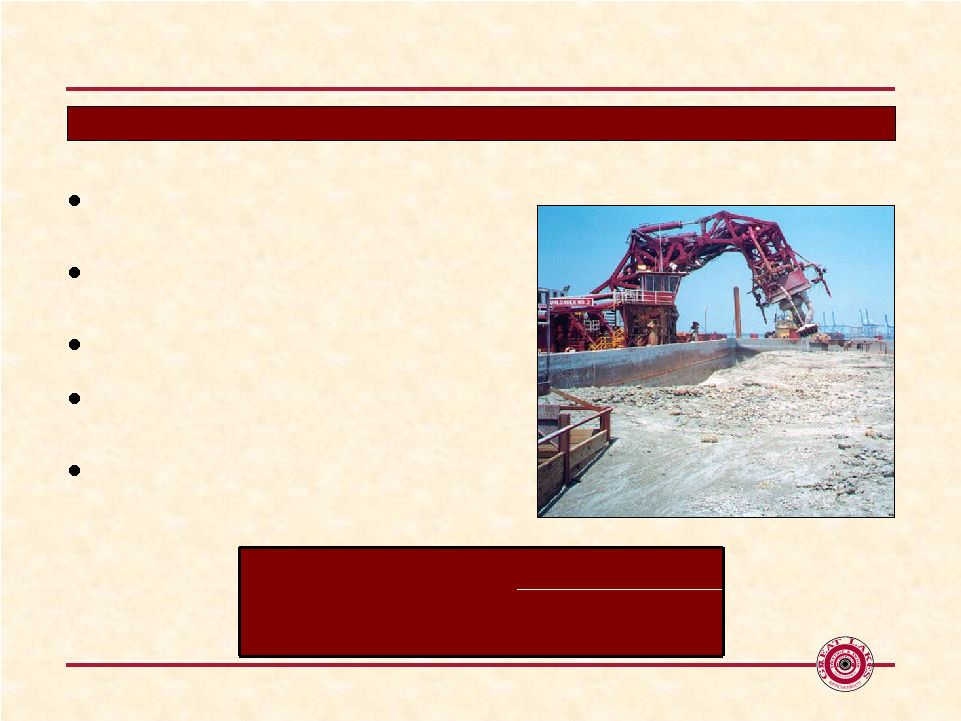
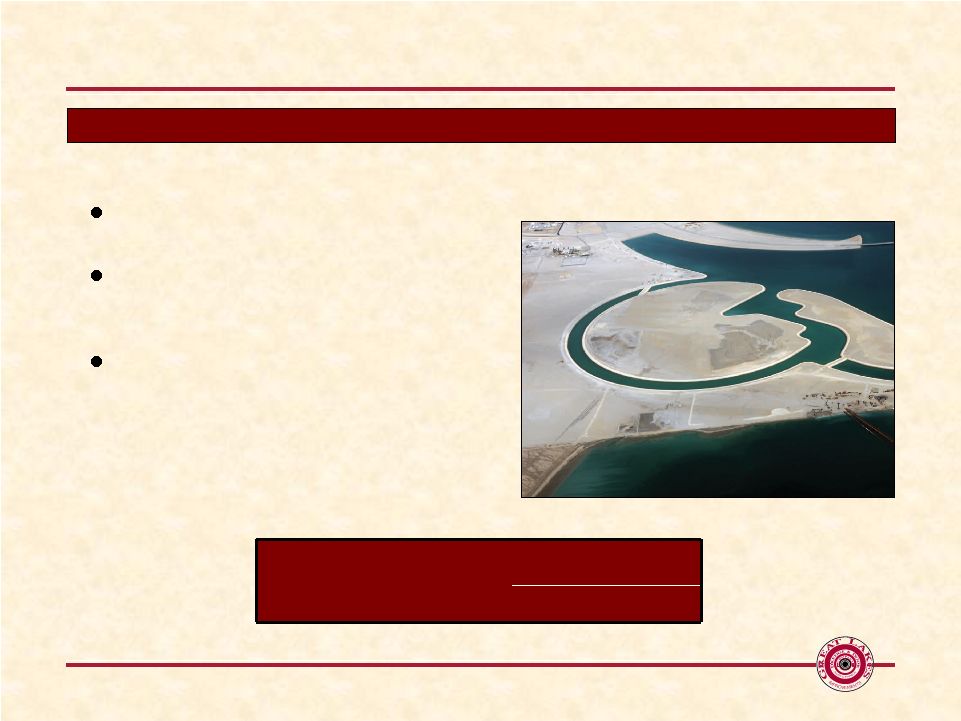
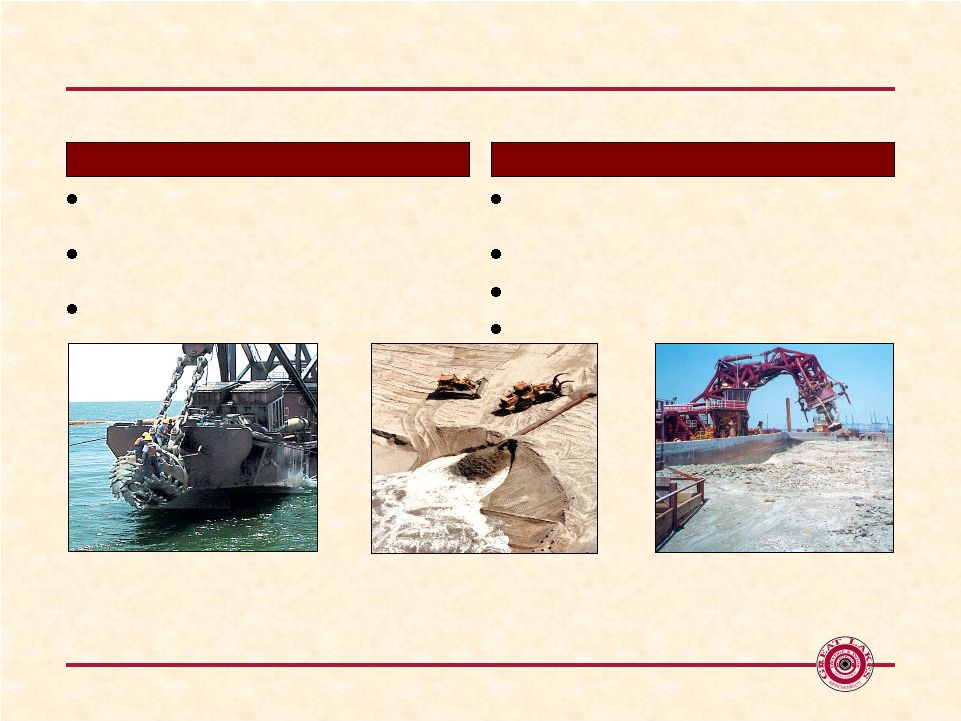 6 Dredging Overview Capital – deepening ports, land reclamation, and excavation of underwater trenches Beach Nourishment – creating and rebuilding beaches Maintenance – maintaining depth of shipping channels Types of Dredging Army Corps of Engineers is largest user of dredging services Foreign governments State and local governments Private entities (e.g., oil companies, utilities) Customers Capital Beach Nourishment Maintenance |
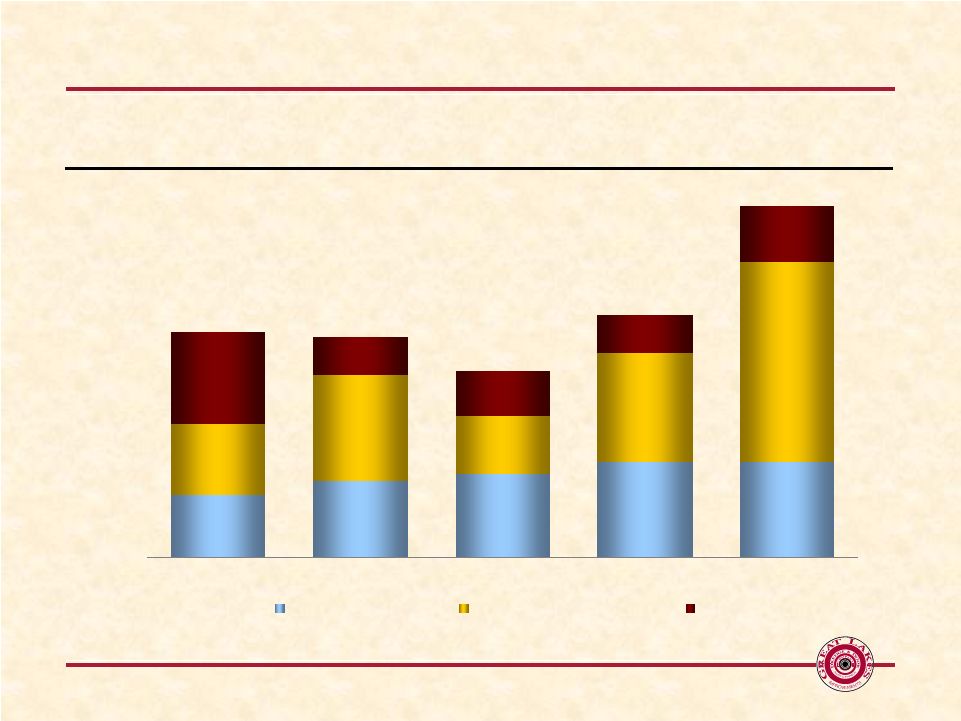
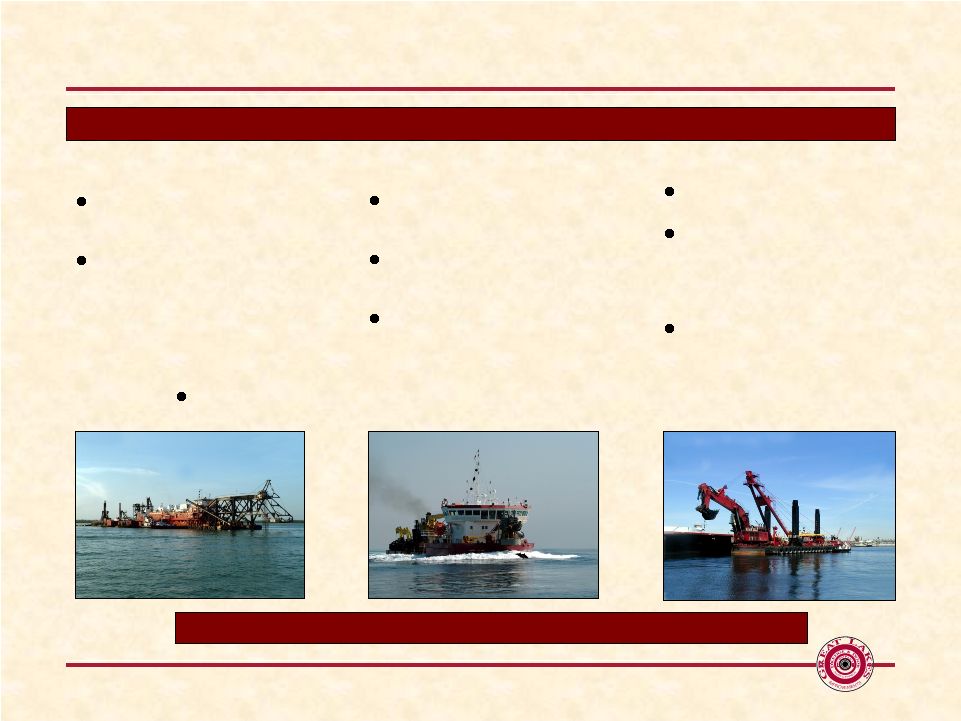 7 Large and Flexible Fleet in U.S. and Middle East Markets Hopper Hydraulic Cutterhead Mechanical 11 Vessels (7 U.S., 4 Middle East) Has the only two large electric cutterhead dredges available in the U.S. for environmentally sensitive regions requiring lower emissions 10 Vessels (4 U.S., 6 Middle East) Highly mobile, able to operate in rough waters Little interference with other ship traffic 5 Vessels (all U.S.) Operates one of two environmentally friendly electric clamshell dredges in the U.S. Maneuverability in tight areas such as docks and terminals 25 material transportation barges and over 160 other specialized support vessels Estimated fleet replacement cost in excess of $1.5 billion in current market Types of Dredges |
 8 Favorable Competitive Dynamics U.S. domestic dredging market is protected from international competition Foreign Dredge Act (1906) and Merchant Marine Act (1920) effectively prohibit foreign
dredges/foreign-owned dredging companies from operating in U.S.
No new material entrants to industry in recent years New dredges are expensive/require long construction lead times Strict job bonding/regulatory certification requirements Dredging projects growing increasingly complex; heightens need for specialized
equipment Recognized leader in dredging safety |
 Industry and Company Overview |
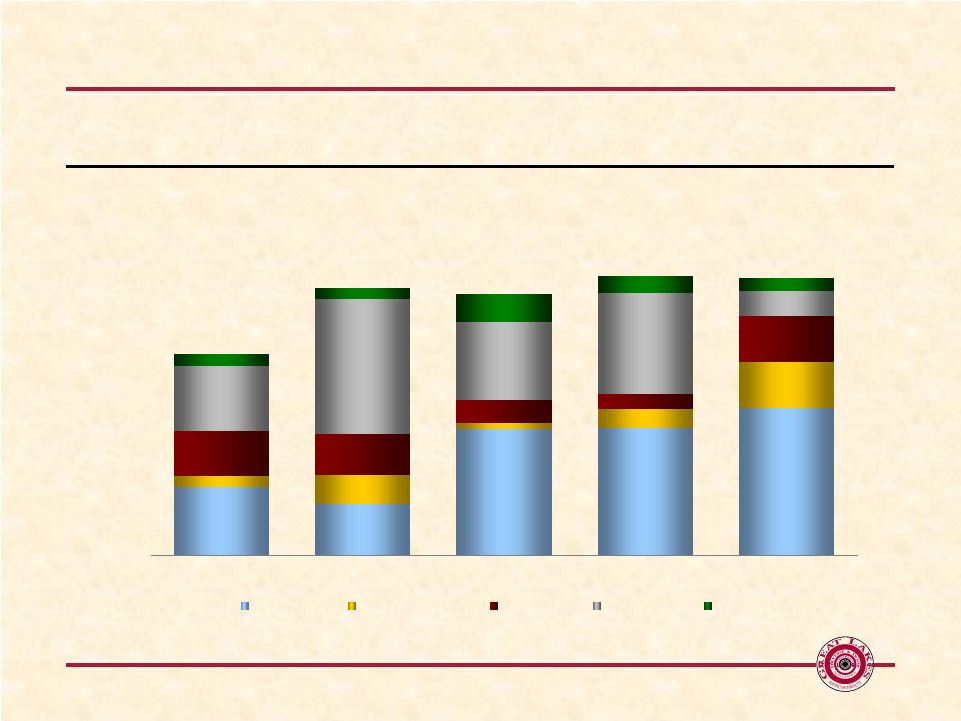
 10 Growing Bid Market BID MARKET BY WORKTYPE ($ in millions) $727 $714 $603 $783 $1,137 0 100 200 300 400 500 600 700 800 900 1000 1100 $1200 2005 2006 2007 2008 2009 Capital Maintenance Beach |
 11 Attractive Catalysts in the Dredging Market Maintenance Dredging The Corps goal is to reach 95% U.S. port operating capacity by 2013 The 2009 domestic bid market, increased significantly to $1.1 billion from $783 million
in 2008, primarily as a result of needed maintenance projects Coastal Restoration Several coastal restoration projects bid in 2009; more expected in 2010 and
beyond Plan in place for coastal work in Mississippi and other coastal
states Panama Canal Expansion Heightens the need to maintain and deepen U.S. East and Gulf Coast ports Jacksonville & Delaware projects, among others, moving forward Los Angeles Port Developments Renewed activity to maintain competitiveness |
 12 Funding for catalysts Federal Budget Early release of President’s 2011 budget enhances likelihood of passage Operating under an approved budget versus a continuing resolution enhances Corps
efficiency Harbor Maintenance Trust Fund (HMTF) HMTF legislation introduced in Congress in March 2010, expected to be passed by summer
2010 Anticipated to provide $250 - $400 million of additional annual dredging work 2009 Stimulus Stimulus bolstered the 2009 bid market Majority of stimulus work has been awarded; significant amount to be completed by
industry in 2010 Mississippi Coastal Improvements Program (MCIP) Signed in June 2009 by President Obama as part of the “Supplemental Appropriations
Act of 2009” Includes $400 million for barrier island/ecosystem
restoration of storm-damaged shorelines Corps in the planning stages and
has indicated it will start bidding projects in the 2010 fourth quarter |
 13 Domestic Dredging Industry Demand Drivers U.S. ports 5’ – 10’ shallower vs. foreign ports Domestic port development required to support larger, deeper draft ships Water Resources Development Act (“WRDA”) Long-term funding for wetland and coastal marshes Other port development Capital (In millions) Three Year Average 2009 Bid Market Size $296 $310 GLDD Revenue $162 $203 |
 14 Domestic Dredging Industry Demand Drivers Storm activity/natural erosion Growing population in coastal communities 22 of the 25 most densely populated U.S. counties are coastal Importance of beach assets to local tourism industry Beaches along East and Gulf Coasts in critical need of nourishment Beach Nourishment (In millions) Three Year Average 2009 Bid Market Size $151 $183 GLDD Revenue $72 $62 |
 15 Domestic Dredging Industry Demand Drivers Corps goal is to reach 95% of U.S. port operating capacity Incremental funding expected from Harbor Maintenance Trust Fund Naturally sedimentation and volatile weather New capital projects increase need for ongoing maintenance 57% of 2009 domestic bid market was maintenance work Maintenance (In millions) Three Year Average 2009 Bid Market Size $395 $645 GLDD Revenue $117 $175 |
 16 International projects tend to be larger/ longer duration vs. domestic projects Middle East has been a strong market historically, and is expected to provide good opportunities in the future Moving forward with upgrade of the dredge Ohio to meet future demand anticipated in Middle East Great Lakes is Well Positioned to Compete Globally International (In millions) Three Year Average 2009 GLDD Revenue $149 $134 |
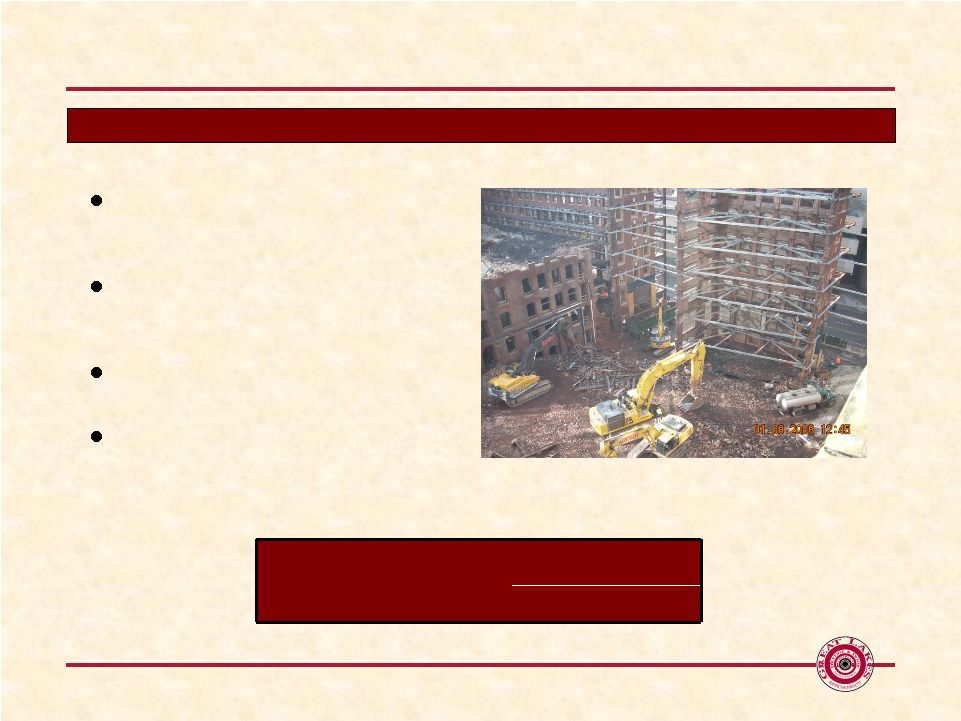 17 Major U.S. provider of commercial and industrial demolition services; primarily in New England Purchased Yankee in 2009; able to offer removal of asbestos and hazardous materials Successfully gaining foothold in New York market over last year In early 2010, segment was awarded over $30 million of new projects in both Boston and New York areas Demolition Segment NASDI and Yankee Environmental Services (In millions) Three Year Average 2009 Demoltion Revenue $75 $48 |
 Financial Highlights Deborah Wensel Senior VP & CFO |
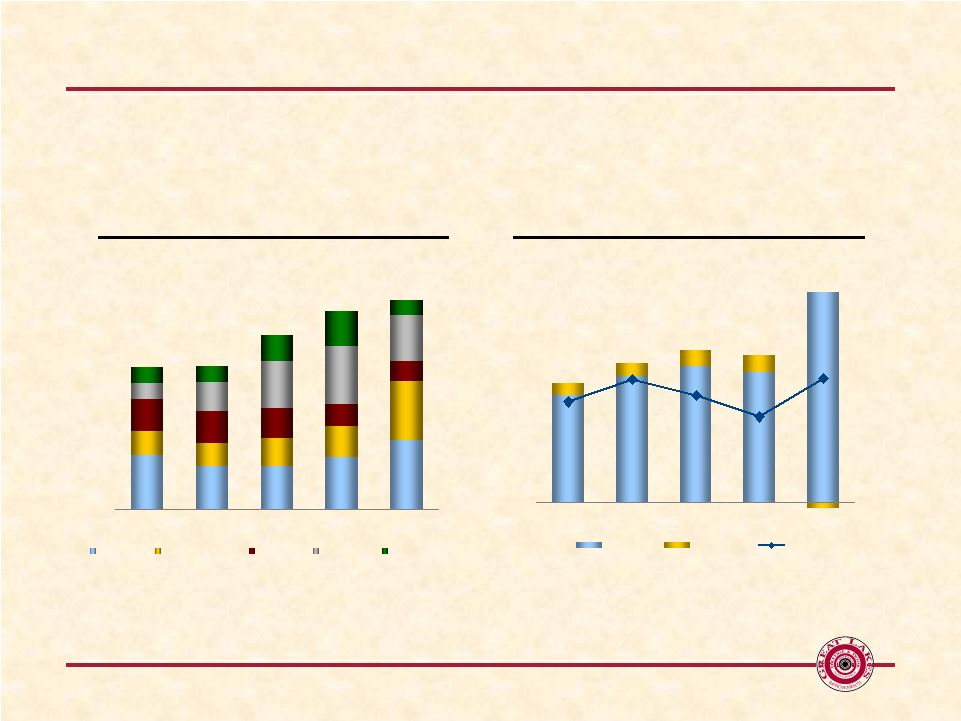 19 Financial Performance ANNUAL EBITDA (a) ANNUAL REVENUE (a) EBITDA represents net income (loss), adjusted for net interest expense, income taxes,
depreciation and amortization expense. 2005 EBITDA also excludes non- cash write down of goodwill and intangibles of $5.7 million. Please see
reconciliation of Net Income to EBITDA at the end of this presentation. ($ in
millions) $423.4 $426.0 $515.8 $586.9 $622.2 0 100 200 300 400 500 600 $700 2005 2006 2007 2008 2009 Capital Maintenance Beach Foreign Demolition $45.1 $77.6 $55.9 $57.5 $52.6 10.7% 12.3% 11.1% 9.5% 12.4% (15) 5 25 45 65 $85 2005 2006 2007 2008 2009 0.0% 4.0% 8.0% 12.0% 16.0% 20.0% Dredging Demolition % Margin |
 20 Primary Factors that Determine Operating Profitability Bid success and dredge employment Revenue is generated when bids are won and projects commence Maximize revenue by employing dredges full-time A dredge does not earn revenue when idle Project mix and dredge mix Projects include capital, beach, maintenance and foreign which inherently have a range
of durations and margins Each dredge has different production capabilities resulting in a range of revenue generating capacity Seek to maximize mix within given bid market (i.e. type of work, type of vessel, duration) Project execution Goal to execute projects at the estimated margin Numerous factors impact actual margin, both favorably and unfavorably, including:
Weather Project conditions Equipment downtime |
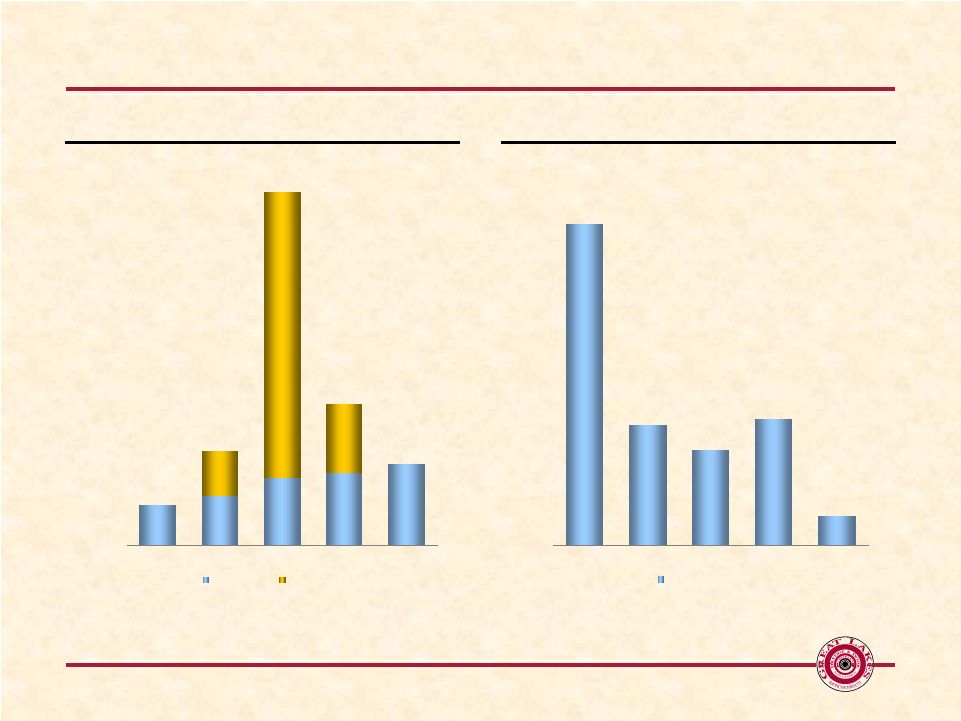 21 2.4x 3.7x 3.3x 3.6x 6.4x 2.0 3.0 4.0 5.0 6.0 7.0x 2005 2006 2007 2008 2009 Net Debt / EBITDA $12.7 $29.8 $111.0 (a) $44.5 $25.7 0.0 20.0 40.0 60.0 80.0 100.0 $120.0 2005 2006 2007 2008 2009 Maintenance Growth & Other Improved Financial Flexibility ($ in millions) (a) Growth and other capital expenditures during the year of 2007 includes the purchase of
four vessels. LEVERAGE CAPEX $15.5 $21.3 $22.9 |
 22 Backlog BY SEGMENT ($ in millions) $382 $385 (a) $360 $369 $278 0.0 100.0 200.0 300.0 400.0 $500.0 2005 2006 2007 2008 2009 Capital Maintenance Beach Foreign Demolition (a) Foreign backlog at December 31, 2008 has been adjusted for the portion of the Diyar contract that became an option pending award in the first quarter of 2009 |
 23 Investment Highlights Attractive near and long-term catalysts in U.S dredging market Harbor Maintenance Trust Fund secures funding for long-term maintenance
demand Other sources of dredging demand include coastal restoration, port
deepening and port development Solid backlog of contracted revenue, strong financial performance and improved financial
flexibility Current backlog of $382.2 million EBITDA growth from $45.1 million in 2005 to $77.6 million in 2009 Decreased Net Debt / EBITDA from 6.4x in 2005 vs. 2.4x in 2009 International Presence Only U.S. dredger with significant foreign presence Flexible fleet enables repositioning of vessels as necessary Opportunistic acquirer of dredging assets Proven executive management team with, an average of nearly 30 years of industry
experience |
 Appendix |
 25 Reconciliation of Net Income to EBITDA ($ in millions) 2005 2006 2007 2008 2009 Net Income Attributable to Great Lakes Dredge & Dock Corp ($6.9) $2.2 $7.1 $5.0 $17.5 Non-Cash Goodwill and Intangibles Write Down $5.7 $0.0 $0.0 $0.0 $0.0 Interest Expense 23.1 24.3 17.5 17.0 16.1 Income Tax Expense (1.4) 1.0 6.4 3.8 11.0 Depreciation and Amortization 24.6 25.1 26.5 30.1 33.0 EBITDA $45.1 $52.6 $57.5 $55.9 $77.6 FYE Ending December 31, |