Attached files
| file | filename |
|---|---|
| 8-K - FORM 8-K - BRINKS CO | form_8-k.htm |

The Brink’s Company
March 2010
The Brink’s Company
Management Presentation
Management Presentation
EXHIBIT 99.1

The Brink's Company
2
Forward-looking Statements
This presentation, including questions and answers, may contain both historical
and forward-looking information within the meaning of the Private Securities
Litigation Reform Act of 1995. Actual results could differ materially from
projected results. Additional information regarding factors that could affect
financial performance is readily available in our press release dated February 2,
2010 and in our filings with the Securities and Exchange Commission, including
our most recent forms 10-K and 10-Q. Information included in this presentation
is representative as of the date of the presentation only and The Brink’s
Company assumes no obligation to update any forward-looking statements
made.

The Brink's Company
3
Agenda
Joseph W. Dziedzic
Vice President &
Chief Financial
Officer
Officer
Edward A. Cunningham
Director of Investor Relations &
Corporate Communications
n Introduction
n Brink’s Business Overview
n Financial Highlights
n Summary
4
The Brink’s Company
¢ Industry leader
¢ Premier brand
¢ Operational excellence
¢ Global footprint
¢ Growth strategy
¢ Proven financial performance
Investment Rationale
The Brink's Company
4
5
Brink’s Company Overview
World’s premier security company
¢ Founded in 1859, Brink’s is
the oldest and largest secure
logistics company
the oldest and largest secure
logistics company
¢ Approximately 59,000 employees,
805 branches and 10,500 vehicles
worldwide
805 branches and 10,500 vehicles
worldwide
¢ Diversified operations with adjusted
revenue of $2.9 billion in 2009 (1)
revenue of $2.9 billion in 2009 (1)
5
The Brink's Company
(1) Adjusted financial information is reconciled to amounts reported under U.S. GAAP on pages 25, 26 &
27.
27.

6
Premier Brand
¢ Globally recognized brand
¢ Value built on:
– Trust and integrity
– Quality of our people
– Safety and security
– Operational excellence
– History and heritage
– Global network
¢ 150th Anniversary in 2009
6
The Brink's Company
Proven Operational Excellence
¢ Demonstrated global expertise
– Security
– Risk management
– Logistics
– Pricing discipline
– Human resource management
– IT capabilities
7
The Brink's Company
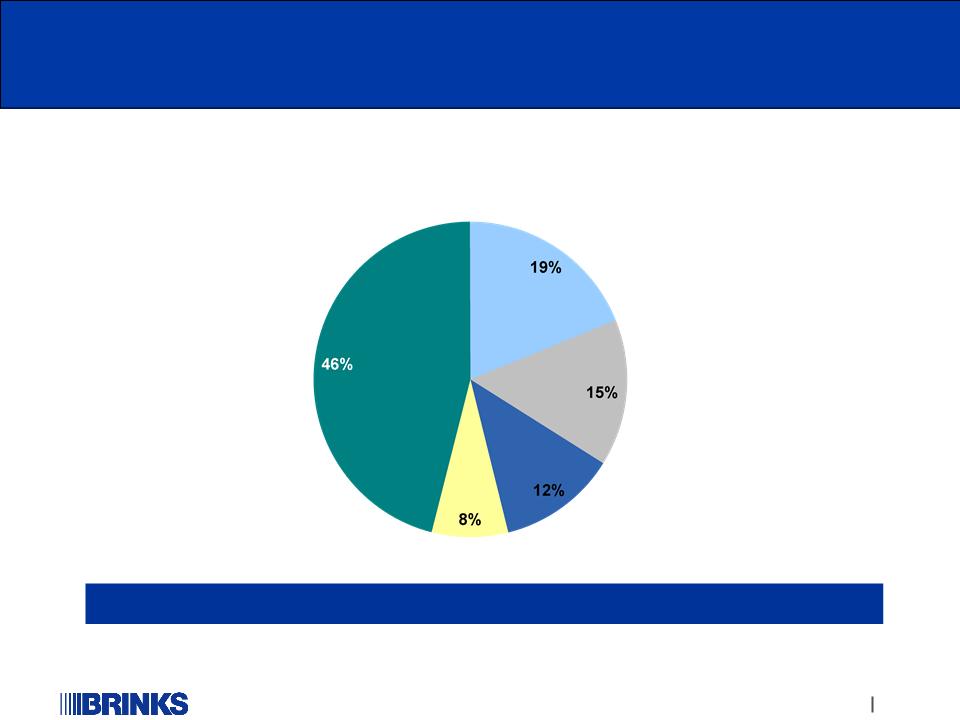
Global Leader in Secure Logistics
Brink’s
Loomis
G4S
Others
Prosegur
Global Market Share
Total $14 Billion
Source: Internal Company Estimates based on most recently available data
8
The Brink's Company
Leading Share in Fragmented Market
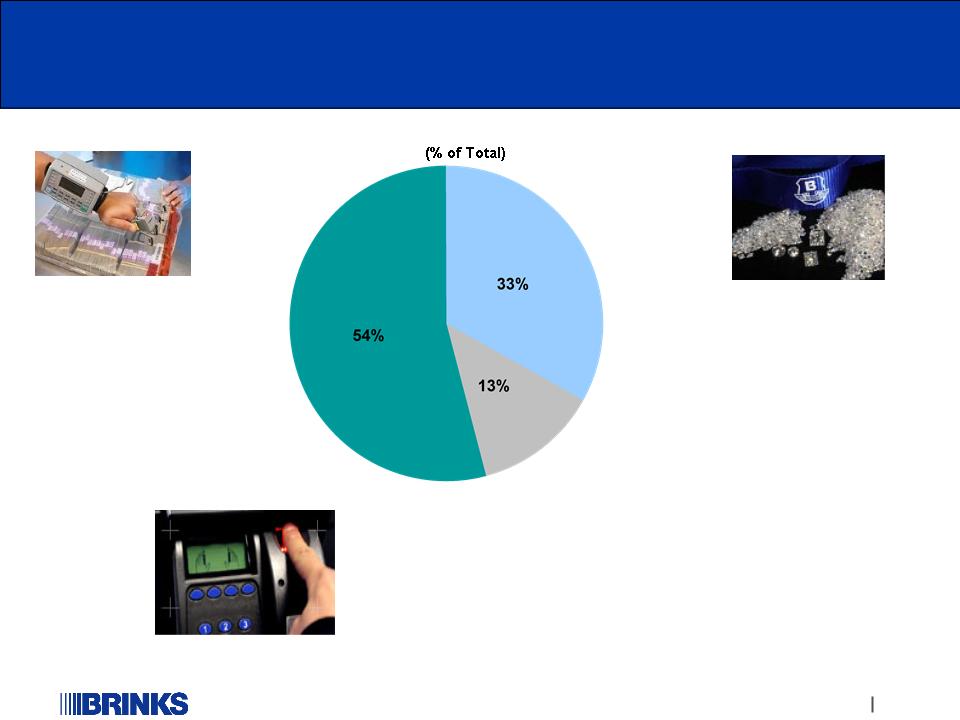
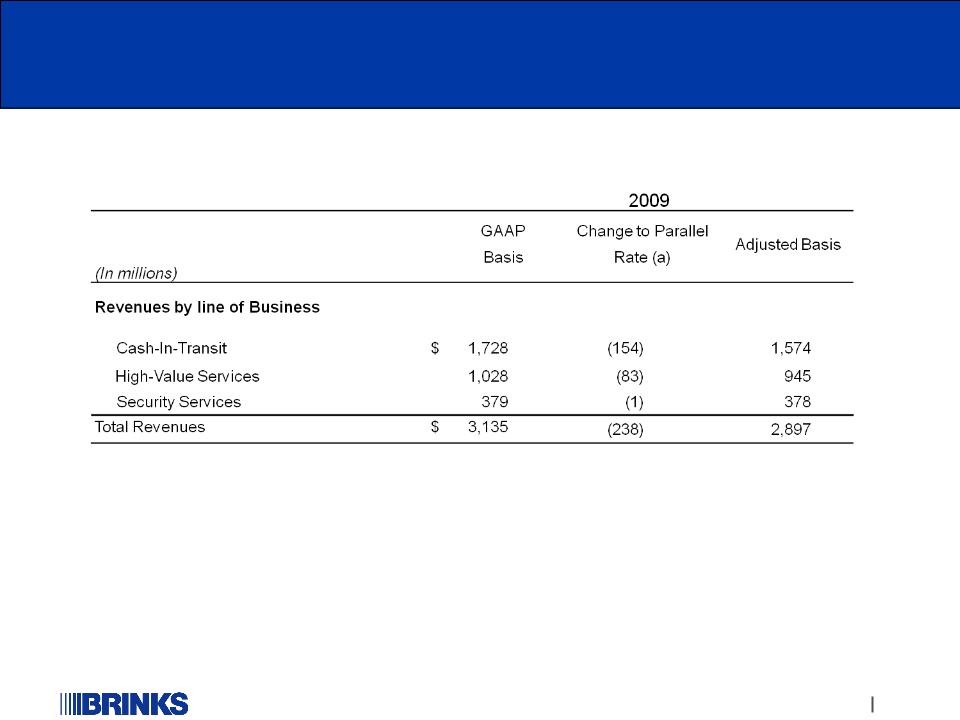
2009 Adjusted Revenue = $2.9B (1)
Business Lines
The Brink's Company
9
¢ Armored car transport
¢ Point-to-point pick-up and delivery of
cash, coins, checks and other
valuables
cash, coins, checks and other
valuables
¢ ATM services
¢ Infrastructure for
High-Value Services
High-Value Services
Cash-in-Transit
$1.6 Billion (1)
High-Value Services
¢ Global Services
– Secure long-distance transport of
valuables
valuables
¢ Cash Logistics Services
– Money processing
– Virtual vaulting
– CompuSafe® Service
¢ New Services
– Payment Services
$0.9 Billion (1)
Security Services
$0.4 Billion (1)
¢ High-value niche guarding services in
select E.U. countries
select E.U. countries
¢ Airports, embassies
High-Value
Services
Services
CIT
Security
Services
Services
(1) Adjusted financial information is reconciled to amounts reported under U.S. GAAP on page 28.
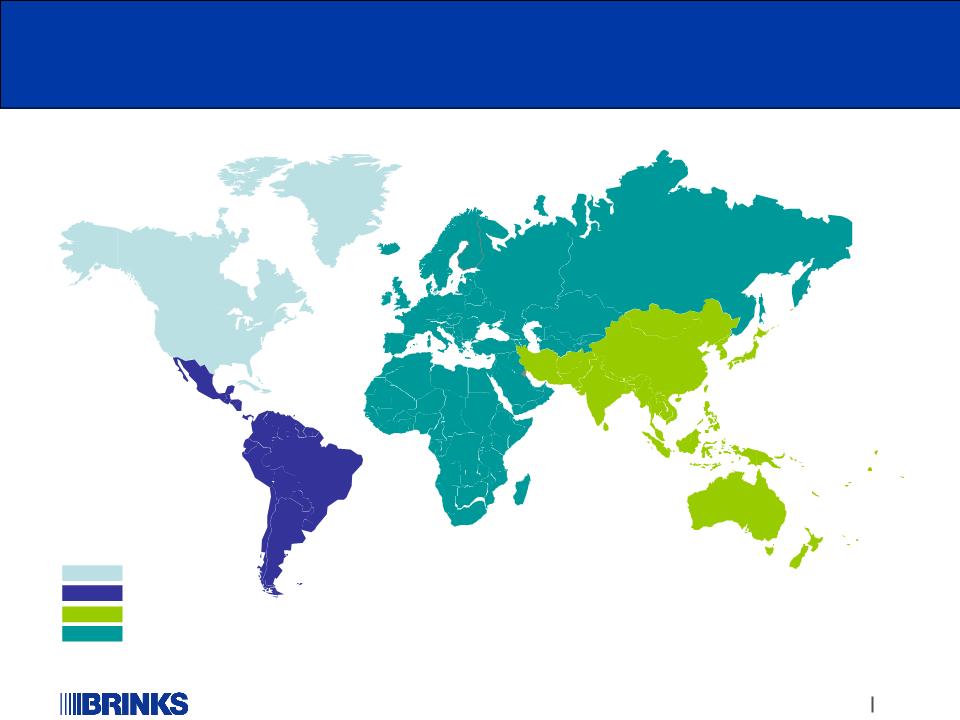
Global Footprint
North America
Asia Pacific
Latin America
Europe, Middle East, Africa
Approximately 805 branches serving more than 50 countries plus 66
additional countries served by Global Services
additional countries served by Global Services
Canada
52 Branches
United States
181 Branches
EMEA
258 Branches
22 Countries
22 Countries
Asia Pacific
97 Branches
9 Countries
9 Countries
Latin America
217 Branches
9 Countries
10
The Brink's Company
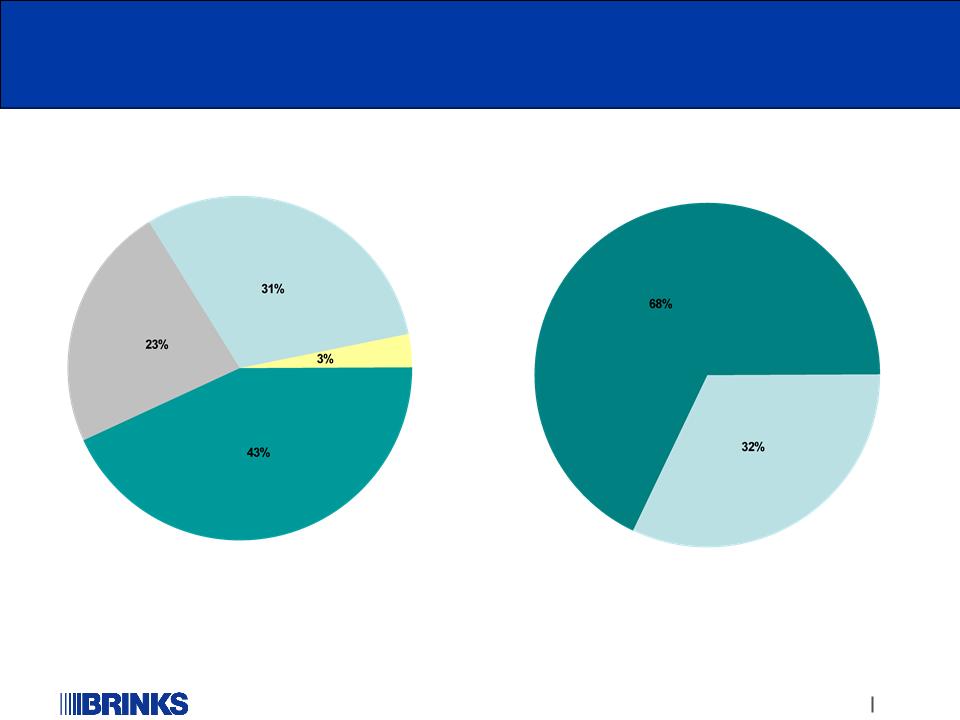
Global Footprint
2009 Brink’s Adjusted Revenue and Segment Operating Profit
2009 Brink’s Adjusted Revenue and Segment Operating Profit
Revenue (1)
Segment Operating Profit (1)
Total: $2.9 billion
International
Total: $175 million
11
The Brink's Company
North America
EMEA
Latin America
North America
Asia Pacific
(1) Adjusted financial information is reconciled to amounts reported under U.S. GAAP on pages 25, 26 & 27.

How We Manage The Company
¢ Invest to protect employees and customer assets… regardless of
economy
economy
¢ Global strategy… local execution… adapted to each market
¢ Disciplined investment and execution… learn… accelerate
¢ Capital allocation
– Maximize mature markets
– Invest in emerging markets
The Brink's Company
12

Financial Strength & Flexibility
¢ $53 million net debt
¢ Over $330 million available borrowing capacity
The Brink's Company
13
|
(millions)
|
|
|
Cash
|
$143
|
|
Debt
|
(196)
|
|
Net cash/(debt)(1)
|
($ 53)
|
December 31, 2009
¢ Investment grade credit rating
¢ Pension/Legacy liabilities… Cash Outflows
(1) See Non-GAAP reconciliation on page 19 of the Fourth-Quarter earnings release dated February 2, 2010.
|
(millions)
|
2010
|
2011
|
2012
|
2013
|
2014
|
|
– Required pension contributions
|
$0
|
0
|
28
|
38
|
$31
|
|
– UMWA (funded by VEBA)
|
No cash outflow expected until 2026
|
||||
|
|
|
|
|
|
|

Growth Strategy
¢ Existing markets
– Invest in higher-margin “solutions” and services
– Cash Logistics, CompuSafe® Service, Global Services
– Expand in emerging, higher-growth markets… BRIC, Latin America,
Asia-Pacific, Africa
Asia-Pacific, Africa
– Maximize profits in mature markets
¢ Adjacencies
– Commercial Security, Payment Processing
¢ Acquisitions in high-growth markets and adjacencies
– Maintain disciplined approach
– Market knowledge important
14
The Brink's Company
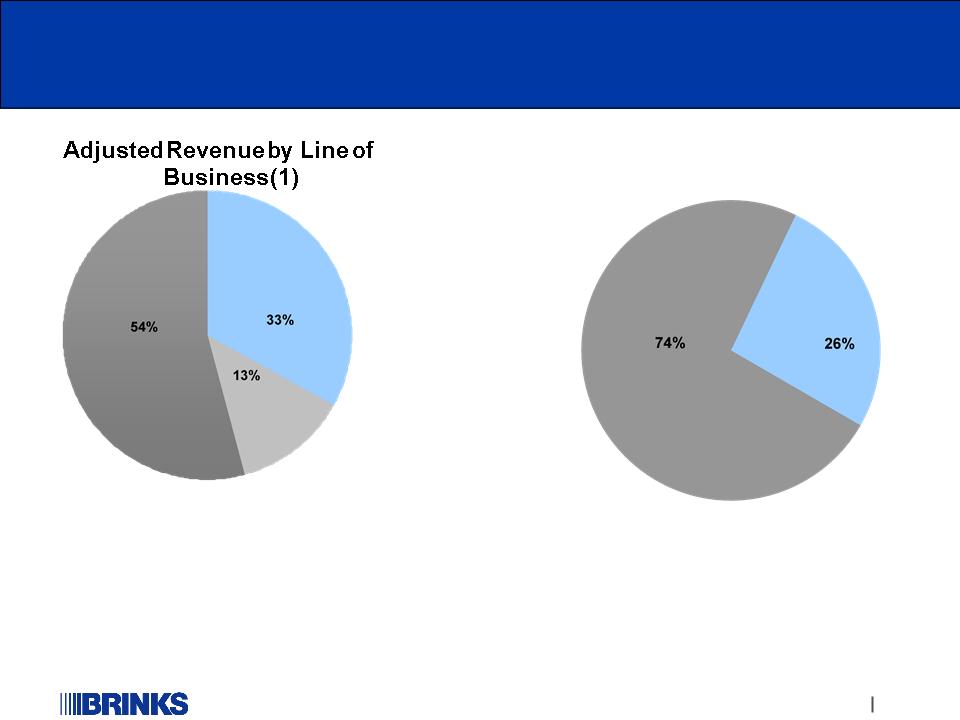
15
The Brink's Company
High-Value
Services
Services
Security
Services
Services
CIT
Developed
Emerging
(1) Adjusted financial information is reconciled to amounts reported under U.S. GAAP on page 28.
Growth Strategy
Adjusted Revenue by Market(2)
Invest in High-Value Services and Emerging Markets… Shift the mix
(2) Adjusted financial information is reconciled to amounts reported under U.S. GAAP on pages 25, 26 & 27.
16
Leader in Business Segments
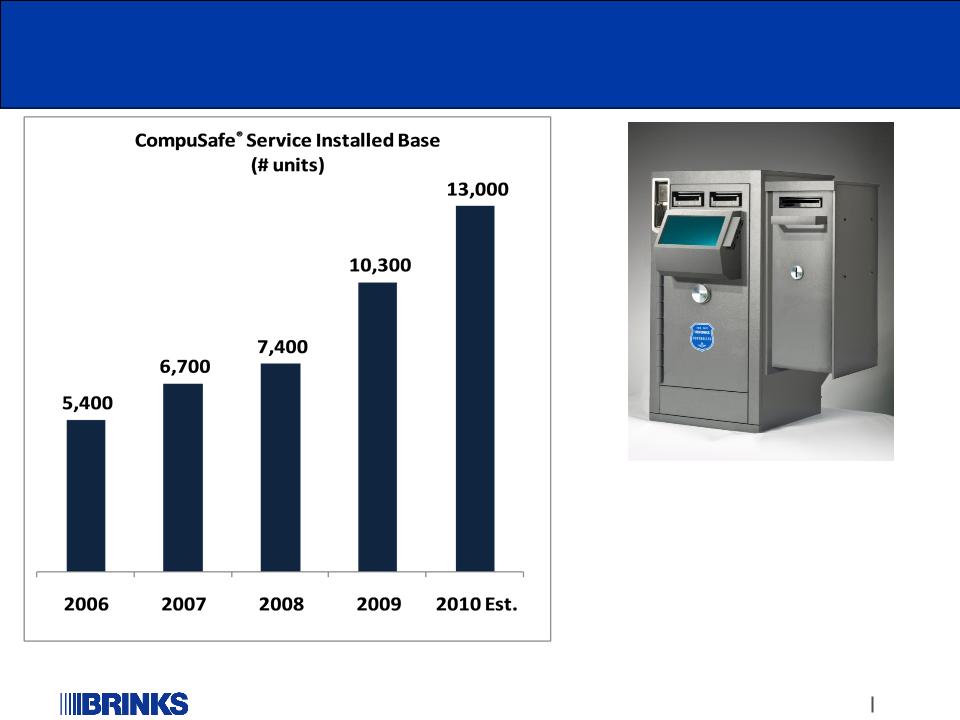
CompuSafe® Service
CompuSafe® Service
Leader in Business Segments
CompuSafe® Service
CompuSafe® Service
¢ CompuSafe® Service
gaining traction
gaining traction
¢ ~30% growth in 2010
The Brink's Company

Recent Actions
¢ Venezuela cash repatriation… executing our strategy (December 2009)
¢ U.S. pension contribution of $150 million (August 2009)
¢ 2009 acquisitions in emerging markets… Brazil, Russia, India, China
¢ Resource allocation and management upgrades… focus on EMEA
17
The Brink's Company

Adjusted Revenue (1)
($MM)
Financial Performance
Adjusted Revenue Growth
Adjusted Revenue Growth
18
The Brink's Company
(1) Adjusted financial information is reconciled to amounts reported under U.S. GAAP on pages 25, 26 &
27.
27.
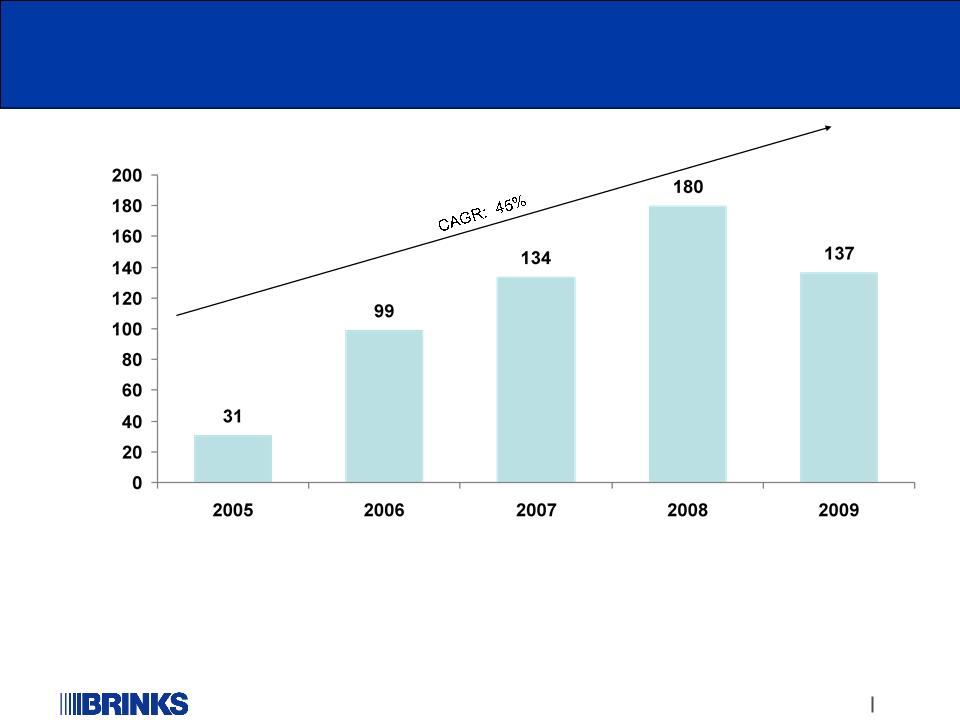
Total Adjusted Operating Profit (1)
($MM
)
)
Financial Performance
Adjusted Profit Growth
Adjusted Profit Growth
|
Segment
|
113
|
172
|
196
|
223
|
175
|
|
Non-Segment
|
(82)
|
(73)
|
(62)
|
(43)
|
(38)
|
|
Total
|
31
|
99
|
134
|
180
|
137
|
19
The Brink's Company
(1) Adjusted financial information is reconciled to amounts reported under U.S. GAAP on pages 25, 26 & 27.
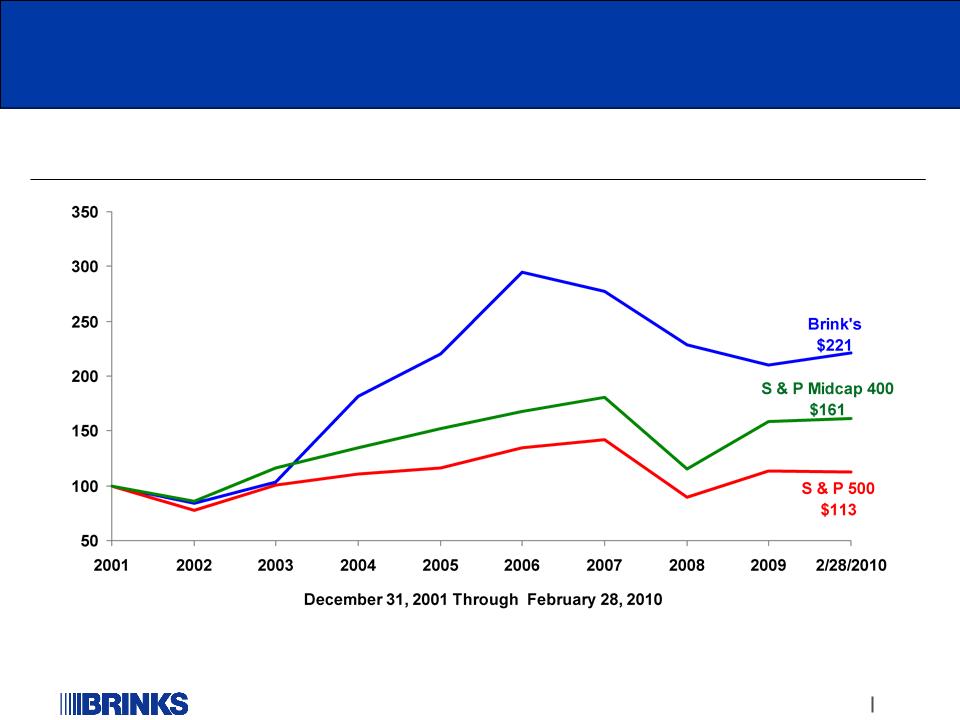
Financial Performance
Execution Creates Value
Execution Creates Value
($)
(1) $100 invested on December 31, 2001 in stock or index. Includes reinvestment of dividends.
Cumulative Stock Total Return (1)
20
The Brink's Company

Financial Performance
¢ Global economic weakness
– Significant volume pressures
– Steep decline in Diamond & Jewelry
market
market
– Customers in financial distress
¢ Key actions taken
– Venezuela… executing our strategy
– Pension funding addressed
– EMEA Restructuring/severance
¢ Growth focus
– BRIC acquisitions
– Disciplined investment & execution
2009 Highlights
2010 Outlook
¢ Global economy stabilizing
– Low/mid single-digit % annual organic
revenue growth (from adjusted $2.9B in 2009)
revenue growth (from adjusted $2.9B in 2009)
– Margins between 7.0% and 7.5%
– Difficult comps in first-half 2010
– Second-half seasonally stronger
¢ 2010 Focus areas
– Latin America continued growth
– North America productivity and margin growth
– EMEA turnaround efforts
¢ Growth focus
– Disciplined M&A
– Solutions… higher-margin services
21
The Brink's Company

22
Summary
Investment Rationale
¢ Industry leader
¢ Premier brand
¢ Operational excellence
¢ Global footprint
¢ Strategy for growth
¢ Proven financial performance
22
The Brink's Company
23
The Brink's Company

Appendix
24
The Brink's Company

Adjusted Results - Reconciled to Amounts Reported under GAAP
25
The Brink's Company
Purpose of Adjusted Information
Adjusted results described in this filing are financial measures that are not required by, or presented in accordance with, U.S. generally accepted accounting principles
(“GAAP”). These adjusted results
(“GAAP”). These adjusted results
a) reflect the impact of reporting results from Venezuela at the less favorable parallel market exchange rate,
b) exclude transaction losses on repatriated cash from Venezuela, and
c) exclude an acquisition gain in India.
The purpose of the adjusted information is to provide users of financial information of The Brink’s Company an understanding of the effects of each of the items
described above. The adjusted information provides information to assist comparability and estimates of future performance. Brink’s believes these measures are
helpful in assessing operations and estimating future results, provide transparency to investors, and enable period-to-period comparability of financial performance.
Adjusted results should not be considered as an alternative to revenue, income or earnings per share amounts determined in accordance with GAAP and should be
read in conjunction with their GAAP counterparts.
Explanation of Reconciling Items
The adjustments:
(a) Change from official rate to parallel rate translation in Venezuela
i.Reduce segment operating income - International to reflect operating results had they been translated using the parallel rate in effect at the time. Results from
Venezuela in 2005, 2006, 2007, 2008 and most of 2009 were translated at the official rate.
Venezuela in 2005, 2006, 2007, 2008 and most of 2009 were translated at the official rate.
ii. Increase segment operating income - International by $5 million in 2009. The adjustment reverses certain currency exchange losses related to increases in cash
held in U.S. dollars by the Venezuelan subsidiaries.
held in U.S. dollars by the Venezuelan subsidiaries.
(b) Venezuela currency loss. Decrease non-segment expense by $23 million for the loss that was recognized in 2009 related to the repatriation of cash
from Venezuela.
from Venezuela.
(c) Acquisition gain. Decrease other operating income - non-segment by $14 million for the gain recorded in 2009 related to an acquisition of a
controlling interest in an Indian subsidiary.
controlling interest in an Indian subsidiary.
|
|
Years Ended December 31,
|
|||||
|
(In millions)
|
|
2009
|
2008
|
2007
|
2006
|
2005
|
|
Revenues
|
$
|
(238)
|
(173)
|
(119)
|
(39)
|
(26)
|
|
Operating profit
|
|
(43)
|
(49)
|
(27)
|
(12)
|
(7)
|

Adjusted Results - Reconciled to Amounts Reported under GAAP
(Cont.)
(Cont.)
26
The Brink's Company
See page 25 for explanation of footnotes
Reconciliation
Amounts may not add due to rounding

Adjusted Results - Reconciled to Amounts Reported under GAAP
(Cont.)
(Cont.)
27
The Brink's Company
|
(In millions)
|
|
2009
|
|
2008
|
|
2007
|
|
2006
|
|
2005
|
|
Non-Segment
|
|
|
|
|
|
|
|
|
|
|
|
Reported GAAP Basis
|
$
|
(47)
|
|
(43)
|
|
(62)
|
|
(73)
|
|
(82)
|
|
Adjustments:
|
|
|
|
|
|
|
|
|
|
|
|
Change to Parallel Rate (a)
|
|
-
|
|
-
|
|
-
|
|
-
|
|
-
|
|
Venezuela Currency Loss (b)
|
|
23
|
|
-
|
|
-
|
|
-
|
|
-
|
|
India Acquisition Gain (c)
|
|
(14)
|
|
-
|
|
-
|
|
-
|
|
-
|
|
Adjusted Basis
|
$
|
(38)
|
|
(43)
|
|
(62)
|
|
(73)
|
|
(82)
|
|
|
|
|
|
|
|
|
|
|
|
|
|
|
|
|
|
|
|
|
|
|
|
|
|
Total Operating Profit
|
|
|
|
|
|
|
|
|
|
|
|
Reported GAAP Basis
|
$
|
167
|
|
229
|
|
161
|
|
111
|
|
38
|
|
Adjustments:
|
|
|
|
|
|
|
|
|
|
|
|
Change to Parallel Rate (a)
|
|
(39)
|
|
(49)
|
|
(27)
|
|
(12)
|
|
(7)
|
|
Venezuela Currency Loss (b)
|
|
23
|
|
-
|
|
-
|
|
-
|
|
-
|
|
India Acquisition Gain (c)
|
|
(14)
|
|
-
|
|
-
|
|
-
|
|
-
|
|
Adjusted Basis
|
$
|
137
|
|
180
|
|
134
|
|
99
|
|
31
|
See page 25 for explanation of footnotes
Reconciliation
Amounts may not add due to rounding
28
The Brink's Company
Adjusted Results - Reconciled to Amounts Reported under GAAP
(Cont.)
(Cont.)
See page 25 for explanation of footnotes