Attached files
| file | filename |
|---|---|
| EX-32.1 - EXHIBIT 32.1 - Echo Global Logistics, Inc. | a2197184zex-32_1.htm |
| EX-31.2 - EXHIBIT 31.2 - Echo Global Logistics, Inc. | a2197184zex-31_2.htm |
| EX-31.1 - EXHIBIT 31.1. - Echo Global Logistics, Inc. | a2197184zex-31_1.htm |
Use these links to rapidly review the document
TABLE OF CONTENTS
Item 8. Financial Statements and Supplementary Data
UNITED STATES
SECURITIES AND EXCHANGE COMMISSION
WASHINGTON, DC 20549
FORM 10-K
| (Mark one) | ||
| ý | Annual report pursuant to section 13 or 15(d) of the Securities Exchange Act of 1934 for the fiscal year ended December 31, 2009 or | |
o |
Transition report pursuant to section 13 or 15(d) of the Securities Exchange Act of 1934 for the transition period from to |
|
Commission file number 001-34470 |
||
ECHO GLOBAL LOGISTICS, INC.
(Exact Name of Registrant as Specified in Its Charter)
| Delaware | 20-5001120 | |
| (State or Other Jurisdiction of Incorporation or Organization) |
(I.R.S. Employer Identification No.) | |
600 West Chicago Avenue, Suite 725 Chicago, Illinois |
60654 |
|
| (Address of Principal Executive Offices) | (Zip Code) |
Registrant's Telephone Number, Including Area Code: (800) 354-7993
Securities registered pursuant to Section 12(b) of the Act:
| Title of each class | Name of each exchange on which registered | |
|---|---|---|
| Common Stock, Par Value $0.0001 per share | The NASDAQ Global Market |
Securities registered pursuant to Section 12(g) of the Act: None
Indicate by check mark if the registrant is a well-known seasoned issuer, as defined in Rule 405 of the Securities Act. Yes o No ý
Indicate by check mark if the registrant is not required to file reports pursuant to Section 13 or 15(d) of the Act. Yes o No ý
Indicate by check mark whether the registrant (1) has filed all reports required to be filed by Section 13 or 15(d) of the Securities Exchange Act of 1934 during the preceding 12 months (or for such shorter period that the registrant was required to file such reports), and (2) has been subject to such filing requirements for the past 90 days. Yes ý No o
Indicate by check mark whether the registrant has submitted electronically and posted on its corporate Website, if any, every Interactive Data File required to be submitted and posted pursuant to Rule 405 of Regulation S-T (§ 232.405 of this chapter) during the preceding 12 months (or for such shorter period that the registrant was required to submit and post such files). Yes o No o
Indicate by check mark if disclosure of delinquent filers pursuant to Item 405 of Regulation S-K is not contained herein, and will not be contained, to the best of registrant's knowledge, in definitive proxy or information statements incorporated by reference in Part III of this Form 10-K or any amendment to this Form 10-K. ý
Indicate by check mark whether the registrant is a large accelerated filer, an accelerated filer, a non-accelerated filer, or a smaller reporting company. See the definitions of "large accelerated filer", "accelerated filer" and "smaller reporting company" in Rule 12b-2 of the Exchange Act.
| Large accelerated filer o | Accelerated filer o | Non-accelerated filer ý (Do not check if a smaller reporting company) |
Smaller reporting company o |
Indicate by check mark whether the registrant is a shell company (as defined in Rule 12b-2 of the Exchange Act). Yes o No ý
At June 30, 2009, there was no public market for the registrant's common stock.
The number of shares of the registrant's common stock outstanding as of the close of business on March 16, 2010 was 21,768,659.
Documents incorporated by reference:
Portions of the Registrant's Proxy Statement for its Annual Meeting of Stockholders are incorporated by reference into Part III, provided, that if such proxy statement is not filed with the Commission within 120 days after the end of the fiscal year covered by this Form 10-K, an amendment to this Form 10-K shall be filed no later than the end of such 120-day period.
2
Unless otherwise indicated or the context otherwise requires, references in this Annual Report on Form 10-K to "Echo Global Logistics, Inc.," "Echo," the "Company," "we," "us" or "our" are to Echo Global Logistics, Inc., a Delaware corporation and subsidiaries.
Certain statements in this Annual Report on Form 10-K are "forward-looking statements" within the meaning of Section 27A of the Securities Act of 1933, as amended (the Securities Act"), and Section 21E if the Securities Exchange Act of 1934, as amended (the Exchange Act"). These statements involve a number of risks, uncertainties, and other factors that could cause our actual results, performance or achievements to be materially different from any future results, performance or achievements expressed or implied by these forward-looking statements. Factors which could materially affect such forward-looking statements can be found in the section entitled "Risk Factors" in Part I, Item IA and Part I, Item 7 entitled "Management's Discussion and Analysis of Financial Condition and Results of Operations" in this Annual Report on Form 10-K. Investors are urged to consider these factors carefully in evaluating the forward-looking statements and are cautioned not to place undue reliance on such forward-looking statements. The forward-looking statements made herein are only made as of the date hereof and we undertake no obligation to publicly update such forward-looking statements to reflect subsequent events or circumstances.
Our Company
We are a leading provider of technology enabled transportation and supply chain management services, delivered on a proprietary technology platform serving the transportation and logistics needs of our clients. Our web-based technology platform compiles and analyzes data from our network of over 24,000 transportation providers to serve our clients' shipping and freight management needs. Our technology platform, composed of web-based software applications and a proprietary database, enables us to identify excess transportation capacity, obtain competitive rates, and execute thousands of shipments every day while providing high levels of service and reliability. We focus primarily on arranging transportation across the major modes, including truckload (TL), less than truck load (LTL) and small parcel, and we also offer inter-modal (which involves moving a shipment by rail and truck), domestic air, expedited and international transportation services. Our core logistics services include rate negotiation, shipment execution and tracking, carrier management, routing compliance, freight bill audit and payment and performance management and reporting, including executive dashboard tools.
We believe our ability to identify and utilize excess capacity solves a long-standing transportation industry problem of failing to match demand with available supply and benefits both our clients and the carriers in our network. Through our proprietary technology platform and the real-time market information stored in our database, we are able to identify and utilize transportation providers with unused capacity on routes that our clients can employ. Our carrier network consists of over 24,000 transportation providers that have been selected based on their ability to effectively serve our clients in terms of price, capabilities, geographic coverage and quality of service. We believe the carriers in our network also benefit from the opportunity to serve the transportation needs of our clients with minimal sales, marketing or customer service expense.
Our proprietary web-based technology platform, Evolved Transportation Manager (ETM), allows us to analyze our clients' transportation requirements and provide recommendations that can result in cost savings for our enterprise clients of approximately 5% to 15%. Our clients communicate their transportation needs to us electronically through our EchoTrak web portal, other computer protocols, or by phone. Using pricing, service and available capacity data derived from our carrier network, historical transaction information and external market sources, ETM analyzes the capabilities and pricing options of our carrier network and recommends cost-effective shipping alternatives. The prices we quote to our clients for their shipping needs include the market cost of fuel, which we pass through
3
to our clients. After the carrier is selected, either by the client or us, we use our ETM technology platform to manage all aspects of the shipping process.
Our clients gain access to our carrier network through our proprietary web-based technology platform, which enables them to capitalize on our logistics knowledge, pricing intelligence and purchasing leverage. In some instances, our clients have eliminated their internal logistics departments altogether, allowing them to reduce overhead costs, redeploy internal resources and focus on their core businesses. Using our web-based software applications also provides our clients with the ability to track individual shipments, transfer shipment-level data to their financial management systems and create customized dashboards and reports detailing carrier activity on an enterprise-wide basis. These features provide our clients with greater visibility, business analytics and control of their freight expenditures.
We procure transportation and provide logistics services for more than 15,600 clients across a wide range of industries, such as manufacturing, construction, consumer products and retail. Our clients fall into two categories, enterprise and transactional. We typically enter into multi-year contracts with our enterprise clients, which are often on an exclusive basis for a specific transportation mode or point of origin. As part of our value proposition, we also provide core logistics services to these clients, including the management of both freight expenditures and logistical issues surrounding freight to be transported. We provide transportation and logistics services to our transactional clients on a shipment-by-shipment.
Initial Public Offering
In October 2009, we completed an initial public offering of shares of our common stock. We offered and sold 5,700,000 shares of common stock at a price to the public of $14.00 per share. All 5,700,000 shares were sold by us. The net proceeds to us from the initial public offering (IPO) were $68.6 million, which, in part, we used for dividend payments to certain shareholders, and to repay outstanding indebtedness under our line of credit and loan agreement with certain existing shareholders.
Our Founders
Eric P. Lefkofsky, Richard A. Heise, Jr. and Bradley A. Keywell (the "Founders") founded Echo in January 2005 ("Inception"). In December 2006, Douglas R. Waggoner was hired as our Chief Executive Officer. Mr. Waggoner has worked in the transportation industry for 29 years, most recently as the President and Chief Executive Officer of USF Bestway. In February 2007, Samuel K. Skinner became the Chairman of our Board of Directors. Mr. Skinner has extensive experience in the transportation industry, having served as Secretary of Transportation and White House Chief of Staff under President George H.W. Bush and as the Chairman, Chief Executive Officer and President of USF Corporation.
In recent years, the Founders have also been involved in the formation of other companies that, like Echo, are based on business models that employ innovative technology, logistics expertise and management experience to capitalize on inefficiencies in traditional supply chains and create compelling value propositions for both customers and suppliers. For example, Messrs. Lefkofsky and Heise were founders of InnerWorkings, Inc. (NASDAQ: INWK).
Prior to the hiring of Mr. Waggoner, Messrs. Keywell and Lefkofsky shared responsibility in overseeing day-to-day executive management of Echo's operations. Messrs. Keywell and Lefkofsky continue to have input that extends beyond their respective roles as members of our Board. In view of the significant role each of them played in our formation and development, members of our management continue to consult with each of Messrs. Keywell and Lefkofsky on a regular basis concerning a broad range of operating and strategic issues.
4
Our Market Opportunity
Overview of the Transportation and Logistics Market
Transportation involves the physical movement of goods, and logistics relates to the management and flow of those goods from origin to destination. The worldwide transportation and logistics market is an integral part of the global economy. According to the Council of Supply Chain Management Professionals, total transportation and logistics spend for the United States in 2008 was approximately $1.3 trillion. According to Armstrong & Associates, an independent research firm, gross revenue for third-party logistics in the United States in 2008 was approximately $127.0 billion.
We believe that a significant portion of available transportation capacity in the United States remains unused as a result of the inefficiencies in the transportation and logistics market relating to the absence of an established and automated marketplace. Without this marketplace, demand is not always matched with available supply due to constant fluctuations in transportation capacity and imperfect information, resulting in underutilized assets. Unused transportation capacity occurs, for example, when a transportation provider delivers its primary load, or headhaul, to a destination and does not have an adequate backhaul shipment back to its point of origin. Additionally, logistics decisions such as carrier selection are made with limited analysis and access to real-time capacity data. As a result, carrier selection is regularly driven by the effectiveness of a carrier's sales organization and decisions are made with limited price information.
Third-Party Logistics Services
As companies seek to become more competitive, they tend to focus on their core business processes and outsource their non-core business processes to third-party providers. Third-party logistics providers for the transportation industry offer services such as transportation, distribution, supply chain management, customs brokerage, warehousing and freight management. Third-party logistics providers may also provide a range of ancillary services such as packaging and labeling, freight tracking and integration with client-specific planning systems to facilitate supply chain management.
According to Armstrong & Associates, from 1996 to 2008, the United States third-party logistics market grew at a 12.5% compounded annual rate, from $30.8 billion to $127.0 billion in gross revenue. In addition, according to Armstrong & Associates, less than 10% of logistics expenditures for the United States were outsourced in 2008. We believe that the market penetration of third-party logistics in the United States will continue to expand and the third-party logistics market in the United States will continue to grow over the next several years. We also believe that many companies will look to outsource their entire shipping department to third-party logistics providers rather than contracting with providers on a shipment-by-shipment basis.
The market for third-party logistics providers is highly fragmented. According to the Transportation Intermediaries Association, a professional organization representing transportation intermediaries, no single third-party logistics provider controls more than 5% of the United States market. Although a variety of business models exist within the transportation and logistics market, transportation providers are generally divided into two primary categories: asset-based transportation providers and non-asset-based service providers. Most asset-based providers have significant capital equipment and infrastructure and typically focus on maximizing their individual asset utilization to limit the amount of unused transportation capacity and increase their return on investment. Non-asset-based providers do not own the transportation equipment that is used to transport their clients' shipments, but instead serve as intermediaries that procure access to physical transportation capacity for shippers and contract warehousing providers. According to Armstrong & Associates, measured by 2008 gross revenue, asset-based providers accounted for 23% of domestic U.S. transportation management services while non-asset-based providers accounted for the other 77%.
5
Many large third-party logistics providers are asset-based providers. Non-asset-based providers typically operate as small freight brokers with limited resources, limited carrier networks and modest or outdated information technology systems. We believe very few non-asset-based providers have more than 100 personnel and the small providers, comprising the vast majority, lack the scale to support the increasing requirements for national and global coverage across multiple modes of transportation, the ability to offer complete outsourcing and the ability to provide their clients with technology-driven logistics services.
Transportation and Logistics Services Trends
We believe that the following trends will continue to drive growth in the third-party logistics market:
Recognition of Outsourcing Efficiencies. Companies increasingly recognize that repetitive and non-core functions such as transportation and logistics management can be outsourced to specialists, resulting in cost savings, improved service and increased return on investment. By outsourcing transportation and logistics to third-party providers, companies can also achieve greater operational flexibility by redeploying resources to core activities. According to Armstrong & Associates, the United States outsourced logistics market has grown from $30.8 billion in 1996 to $127.0 billion in gross revenue in 2008, which we believe evidences the recognition of the benefits of outsourcing logistics.
Increasing Complexity of Global Supply Chains. As global supply chains become more complex, we believe customers will increasingly rely on single providers that can provide the full range of logistics services across multiple transportation modes. Additionally, as manufacturing processes continue to shift towards lower cost centers, raw materials and finished products are traveling greater distances to reach their destination for consumption. At the same time, companies are seeking ways to reduce costs and compete with global competitors. These challenges have forced companies to look for ways to benefit from low cost labor regions and optimize their business processes. We believe that globalization results in an increased demand for logistics service providers that have national and global carrier relationships across multiple modes of transportation.
Demand for Technology Enabled Transportation Management and Logistics Services. Logistics services have historically been focused on realizing immediate cost savings on a shipment-by-shipment basis using a labor-intensive, non-scalable process. Information technology is becoming an important catalyst for logistics services, and clients will benefit from providers that are technologically sophisticated and able to analyze data to optimize the marketplace. Technology enabled third-party logistics providers can also identify transportation routes and excess capacity and are able to aggregate purchasing power more efficiently than traditional third-party logistics providers.
Opportunity for Providers of Technology Enabled Transportation and Logistics Services
In the current state of the transportation and logistics market, we believe a third-party logistics provider with superior technology-driven services can differentiate itself by offering additional cost-savings through its ability to:
- •
- analyze real-time carrier pricing across multiple transportation modes through proprietary data repositories;
- •
- aggregate clients' shipping spend for better pricing;
- •
- build more sophisticated pricing algorithms;
- •
- analyze historical transportation spend data;
- •
- offer access to real-time tracking, monitoring and reporting on shipments;
6
- •
- integrate with clients' existing technology applications;
- •
- provide improved reporting and auditing capabilities; and
- •
- evaluate carrier performance.
Our Competitive Advantage
We believe a number of important competitive strengths will continue to drive our success in the future, including:
Innovative business model with compelling value proposition for clients. We believe our technology-driven, transportation and logistics services improve on traditional transportation outsourcing models because we aggregate fragmented supply and demand information across all major modes of transportation from our network of clients and carriers. By using our proprietary technology platform and market information (including current pricing, service and available capacity data as well as historical transaction information) stored in our database, we are able to recommend a carrier for each shipment regardless of mode, at any given moment, typically at a highly competitive price. Our clients benefit from our buying power aggregated through our more than 15,600 clients. We believe this buying power enables us to provide an efficient network of capacity at preferential rates. As a result, we are typically able to reduce many of our enterprise clients' total annual transportation and logistics costs by between approximately 5% to 15%, while providing high-quality service.
Scalable, proprietary technology platform. Our proprietary ETM technology platform is a web-based software application that provides competitive pricing, supply chain visibility and shipment execution across all major modes of transportation. Our proprietary technology platform can support a significant increase in the number of clients we serve and shipments we execute without a significant additional capital investment. ETM allows us to compile freight and logistics data from our diversified network of over 24,000 carriers to serve our clients' shipping needs and optimize their freight management. Our ETM database expands and becomes more difficult to replicate as we increase the number of shipments and the amount of pricing, service and available capacity data increases. We use our ETM technology platform to analyze the capabilities of our carrier network and recommend cost-effective carriers in the appropriate transportation mode. We also use our ETM technology platform to track individual shipments and provide customized reports throughout the lifecycle of each shipment, allowing us to manage the entire shipping process from pick-up to delivery as part of our value proposition. ETM provides client-specific information by giving them self-service access to carrier pricing information derived from data stored within ETM. The collective components of our ETM technology platform allow us to craft integrated transportation and supply chain management services for each client. We believe that the ability to provide these integrated transportation and supply chain management solutions furthers our competitive advantage.
End-to-end technology enabled services embedded in clients' business processes. Our proprietary technology platform provides a central, scalable and configurable portal interface that enables our clients to manage their transportation and logistics costs. Our web-based software provides our clients with access to transportation market analytics and business information capabilities. By using our suite of web-based applications, our clients can obtain real-time information on individual shipments and available capacity, transfer shipment-level data to their financial management systems and create customized dashboards and reports detailing carrier activity on an enterprise-wide basis. In addition, we offer our enterprise clients superior client care through dedicated teams of account executives and on-site support. We believe our proprietary technology and logistics expertise provide us with the ability to effectively serve the increasingly complex global supply chain needs of our client base and have enabled some of our clients to eliminate their internal logistics departments.
7
High levels of user satisfaction. Our web-based software applications enable our clients to manage the complexities in their transportation and supply chain functions. Our supply chain management services allow our clients to capitalize on our logistics expertise, pricing information and purchasing leverage in a user-friendly interface. We typically have received ratings indicating high levels of satisfaction from a wide range of our clients based on data collected from our periodic client surveys.
Multi-faceted sales strategy leveraging deep logistics expertise. We have built a multi-faceted sales strategy that effectively utilizes our enterprise sales representatives, transactional sales representatives and agent network. Our enterprise sales representatives typically have significant sales expertise and are focused on building relationships with our clients' senior management teams to execute multi-year enterprise contracts, typically with terms of one to three years. Our transactional sales representatives, with support from our account executives, are focused on building new transactional client relationships and migrating transactional accounts to enterprise accounts. From Inception through December 31, 2009, 35 of our enterprise accounts were converted from transactional accounts, and of the 24 contracts entered into with new enterprise clients in 2009, nine were converted from transactional accounts. Our network of agents enables us to benefit from seasoned industry professionals with access to regional shipping markets.
Our agents are typically experienced industry sales professionals focused on building relationships with department level transportation managers with both existing and prospective clients, such as shipping, traffic or logistics managers. From Inception through December 31, 2009, 60 of our enterprise accounts and 3,182 of our transactional accounts were sourced through our network of agents. Our multi-faceted sales strategy enables us to engage clients on a shipment-by-shipment basis (transactional) or a fully or partially outsourced basis (enterprise), which we believe significantly enhances our ability to attract new clients and increase our revenue from existing clients. Our ability to work with clients on a transactional basis also allows for a gradual and transparent transition to a fully-outsourced enterprise engagement, which we believe enhances our ability to sign new enterprise contracts.
Proven track record of success with large enterprise clients. We believe that our record of success in serving large enterprises is a key competitive advantage. As of December 31, 2009, we had contracts with 116 enterprise clients, and the total number of enterprise clients increased by 30 and 24 in 2008 and 2009, respectively. The size, diversity and reputation of these clients, combined with our track record of successful renewals, demonstrates our ability to handle complex client and industry-specific transportation needs.
Access to our carrier network. Our carrier network consists of over 24,000 carriers that have been selected based on their ability to effectively serve our clients on the basis of price, capabilities, geographic coverage and quality of service. We regularly monitor our carriers' pricing, shipment track record, capacity and financial stability using a system in which carriers are graded based on their performance against other carriers, giving our clients an enhanced level of quality control. By using our visibility into carrier capacity, we are also able to negotiate favorable rates, manage our clients' transportation spend and identify cost-effective shipping alternatives.
Experienced management team. We have a highly experienced management team with extensive industry knowledge. Our Chief Executive Officer, Douglas R. Waggoner, is the former President and CEO of USF Bestway, a regional carrier based in Scottsdale, Arizona, and Daylight Transport, a LTL carrier based in Long Beach, California. Our non-executive Chairman, Samuel K. Skinner, is the former Chairman, President and Chief Executive Officer of USF Corporation and the former Secretary of Transportation of the United States of America.
8
Our Strategy
Our objective is to become the premier provider of transportation and logistics services to corporate clients in the United States. Our business model and technological advantage have been the main drivers of our historical results and have positioned us for continued growth. The key elements of our strategy include:
Expand our client base. We intend to develop new long-term client relationships by using our industry experience and expanding our sales and marketing activities. As of December 31, 2009, we had contracts with 116 enterprise clients, and the total number of enterprise clients increased by 30 and 24 in 2008 and 2009, respectively. We seek to attract new enterprise clients by targeting companies with substantial transportation needs and demonstrating our ability to reduce their transportation costs by using our ETM technology platform. In addition, we plan to continue to hire additional sales representatives to build our transactional business across all major modes. We believe our business model provides us with a competitive advantage in recruiting sales representatives as it enables our representatives to leverage our proprietary technology and carrier network to market a broader range of services to their clients at competitive prices.
Further penetrate our established client base. We believe our established client base presents a substantial opportunity for growth. As we demonstrate our ability to execute shipments with high levels of service and favorable pricing, we are able to strengthen our relationships with our clients, penetrate incremental modes and geographic areas and generate more shipments. As we become more fully integrated into the businesses of our transactional clients and are able to identify additional opportunities for efficiencies, we seek to further penetrate our client base by selling our enterprise services to those clients. Of our 116 enterprise clients as of December 31, 2009, 35 began as our transactional clients.
Further invest in our proprietary technology platform. We intend to continue to improve and develop Internet and software-based information technologies that are compatible with our ETM platform. In order to continue to meet our clients' transportation requirements, we intend to invest in specific technology applications and personnel in order to improve and expand our offering. As of December 31, 2009, we had approximately 6,000 individual users of ETM and as the number of users expands, we will continue to invest in both IT development and infrastructure.
Selectively pursue strategic acquisitions. We have grown, in part, through acquisitions. We intend to selectively pursue strategic acquisitions that complement our business relationships and logistics expertise and expand our business into new geographic markets. Our objective is to increase our presence and capabilities in major commercial freight markets in the United States. We may also evaluate opportunities to access attractive markets outside the United States from time to time, or selectively consider strategic relationships that add new long-term client relationships, enhance our services or complement our business strategy.
Our Proprietary Technology Platform
Our proprietary ETM technology platform allows us to analyze our clients' transportation requirements and provide customized shipping recommendations that can result in cost savings of approximately 5% to 15% for our enterprise clients. We collect and store pricing and market capacity data in our ETM database from each interaction with carriers, and our database expands as a result of these interactions. We have also developed data acquisition tools that retrieve information from both private and public transportation databases, including subscription-based sources and public transportation rate boards, and incorporate that information into the ETM database. Using pricing, service and available capacity data derived from our carrier network, historical transaction information and external market sources, we are able to analyze the capabilities of our carrier network to
9
recommend cost-effective shipping alternatives. We believe that the carriers with the most available capacity typically offer the most competitive rates.
Our clients communicate their transportation needs to us electronically through our EchoTrak web portal, other computer protocols, or by phone. ETM generates pricing and carrier information for our clients by accessing pre-negotiated rates with preferred carriers or using present or historical pricing and capacity information contained in our database. If a client enters its own shipment, ETM automatically alerts the appropriate account executive. ETM's pricing algorithms are checked for accuracy before the rates are made available to our account executives. If an error occurs and an inaccurate rate is conveyed to a client, we will honor the quoted rate and correct the defective algorithm to ensure that all quoted rates going forward are accurately calculated. To date, any losses incurred as a result of an inaccurate quote have been negligible. After the carrier is selected, either by us or the client, our account executives use our ETM technology platform to manage all aspects of the shipping process.
We have developed specialized software applications to provide our transportation and logistics services across all major modes of transportation. The software applications shown below reflect the key elements of our ETM technology platform:
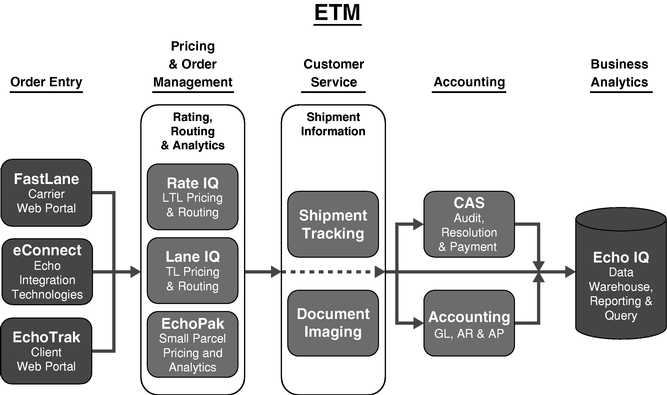
The key elements of our ETM technology platform include:
FastLane is an Internet-based web portal that allows our carriers to view the status of all unpaid invoices, unbilled shipments, shipments in transit and other information used to quickly resolve any billing discrepancies.
eConnect is a set of tools that allows our clients and carriers to interact directly with ETM electronically through any of several computer protocols, including EDI, XML and FTP. The eConnect tools serve as an electronic bridge between the other elements of our ETM technology platform and our clients' enterprise resource planning (ERP), billing, accounts receivable, accounts payable, order management, back office and e-commerce systems. Through eConnect, our clients are able to request shipping services and receive financial and tracking data using their existing systems.
10
EchoTrak is an Internet-based web portal that connects and integrates our clients with ETM. By entering a username and password, our clients are able to display historical and active shipments in the ETM system using configurable data entry screens sorted by carrier, price, delivery date, destination and other relevant specifications. EchoTrak also generates automatic alerts to ensure that shipments are moving in accordance with the client specifications and timeline.
RateIQ is a pricing engine that manages LTL tariffs and generates rate quotes and transit times for LTL shipments. RateIQ also provides integrated tools to manage dispatch, communications, data collection and management functions relating to LTL shipments.
LaneIQ is a pricing engine that generates rate quotes for TL shipments. LaneIQ also provides integrated tools to manage dispatch, communications, headhaul and backhaul data collection and management functions relating to TL shipments.
EchoPak is a small parcel pricing and audit engine. For each small parcel shipped, EchoPak audits carrier compliance with on-time delivery requirements and pricing tariffs. In addition, EchoPak tracks information for each parcel and is able to aggregate and analyze that data for clients. For instance, clients are able to view shipments by date, business unit, product line and location, and clients can access information regarding service levels and pricing.
Shipment Tracking stores shipment information en-route and after final delivery. The shipment data is typically acquired through our carrier EDI integration, allowing our clients to track the location and status of all shipments on one screen, regardless of mode or carrier. Final delivery information is permanently archived, allowing us to provide our clients with carrier performance reporting by comparing actual delivery times with the published transit time standards.
Document Imaging allows us to store digital images of all shipping documents, including bills of lading and delivery receipts. We index the images with the shipment data so users are able to view documents associated with an executed transaction. We use Document Imaging internally to store carrier qualification documents, including W-9, U.S. Department of Transportation authority and proof of insurance.
CAS (Cost Allocation System) automatically audits carrier invoices against our rating engine and accounts payable accrual system. If the amounts match, the invoice is automatically released for payment. If the amounts do not match, the invoice is sent to various administrative personnel for manual processing and resolution. CAS also integrates to our general ledger, accounts receivable and accounts payable systems.
Accounting includes our general ledger, accounts receivable and accounts payable functions. Accounting is integrated with CAS and EchoIQ, which gives us the ability to access both financial and operational data in our data warehouse and reporting systems.
EchoIQ stores internally and externally generated data to support our reporting and analytic functions and integrates all of our core applications with ETM.
ETM fully supports our logistics services, which we provide to our clients as part of our value proposition. Our ETM technology platform is able to track individual shipments and provide customized data and reports throughout the lifecycle of the shipment, allowing us to manage the entire shipping process for our clients. Our customized reports also provide our clients with greater visibility and control over their transportation expenditures, and our ability to benchmark the performance of their internal operations helps identify opportunities for additional cost savings.
In 2007, 2008 and 2009 we spent approximately $3.0 million, $2.5 million and $3.4 million, respectively, on the development of ETM and related technologies.
Our IT infrastructure provides a high level of security for our proprietary software and database. The storage system for our proprietary data is designed to ensure that power and hardware failures do
11
not result in the loss of critical data. The proprietary data is protected from unauthorized access through a combination of physical and logical security measures, including firewalls, encryption, antivirus software, anti-spy software, passwords and physical security, with access limited to authorized IT personnel. In addition to our security infrastructure, our system is backed up daily to prevent the loss of our proprietary data due to catastrophic failures or natural disasters.
Our Services
We are a non-asset-based provider of technology enabled transportation and logistics services, meaning we do not own the transportation equipment used to transport our clients' freight or warehouse our clients' inventory. We believe this allows us to be flexible and seek shipping alternatives that are tailored to the specific needs of our clients, rather than the deployment of particular assets. Through our carrier network, we provide transportation services using a variety of modes of transportation.
Transportation Services
Truckload (TL). We provide TL services across all TL segments, including dry vans, temperature-controlled units and flatbeds. Using our LaneIQ technology, we provide advanced dispatch, communication and data collection tools that enable our dedicated TL team to quickly disseminate critical pricing and capacity information to our clients on a real-time basis.
Less than Truckload (LTL). We provide LTL services involving the shipment of single or multiple pallets of freight. Using our RateIQ technology, we obtain real-time pricing and transit time information for every LTL shipment from our database of LTL carriers.
Small Parcel. We provide small parcel services for packages of all sizes. Using our EchoPak technology, we are often able to deliver cost saving opportunities to our clients that spend over $500,000 annually to ship with major small parcel carriers.
Inter-Modal. Inter-modal transportation is the shipping of freight by multiple modes, typically using a container that is transferred between ships, railcars or trucks. We offer inter-modal transportation services for our clients that utilize both trucks and rail. Using our ETM technology, our dedicated inter-modal team can select, on a timely basis, the most advantageous combination of trucks and rail to meet our clients' individual shipping demands and pricing expectations.
Domestic Air and Expedited Services. We provide domestic air and expedited shipment services for our clients when traditional LTL services do not meet delivery requirements. We use ETM track and trace tools to ensure that up to date information is available to our clients via EchoTrak.
International. We provide air and ocean transportation services for our clients, offering a comprehensive international delivery option to our clients. Using ETM, our dedicated teams can consolidate shipments, coordinate routing, local pick-up and delivery methods and prearrange customs clearance to minimize the time and economic burdens associated with international transportation.
Logistics Services
In addition to arranging for transportation, we provide logistics services, either on-site (in the case of some enterprise clients) or off-site, to manage the flow of those goods from origin to destination. Our core logistics services include:
- •
- rate negotiation;
- •
- procurement of transportation, both contractually and in the spot market;
- •
- shipment execution and tracking;
12
- •
- carrier management, reporting and compliance;
- •
- executive dashboard presentations and detailed shipment reports;
- •
- freight bill audit and payment;
- •
- claims processing and service refund management;
- •
- design and management of inbound client freight programs;
- •
- individually configured web portals and self-service data warehouses;
- •
- ERP integration with transactional shipment data;
- •
- and integration of shipping applications into client e-commerce sites.
We believe that direct access to our web-based applications, process expertise and analytical capabilities is a critical component of our offering, and we provide our logistics services to our clients as part of our value proposition.
Our Clients
We provide transportation and logistics services to corporate clients across a wide range of industries, such as manufacturing, construction, consumer products and retail. In the 2009, we served over 15,600 clients using approximately 6,500 different carriers and, from Inception through December 31, 2009, we served over 22,900 clients using approximately 12,700 different carriers. Our clients fall into two categories: enterprise and transactional.
Enterprise Clients
We typically enter into multi-year contracts with our enterprise clients, generally with terms of one to three years, to provide some, or substantially all, of their transportation requirements. Each new enterprise client is assigned one or more dedicated account executives, who are able to work on-site or off-site, as required by the client. To foster a strategic relationship with these clients, we typically agree to a negotiated level of cost savings compared to the client's historical shipping expenditures over a fixed period of time. Cost savings are estimated periodically during the term of our engagement and if the negotiated amount is not achieved, our clients may have the right to terminate our engagement.
Our enterprise contracts are often on an exclusive basis for a certain transportation mode or point of origin and may apply to a single mode, such as LTL, several modes or all transportation modes used by the client. These contractual exclusivity provisions help ensure, but do not guarantee, that we receive a significant portion of the amount that our enterprise clients spend on transportation in the applicable mode or modes or from the applicable point of origin. In our experience, compliance with such provisions varies from client to client and over time. Reasons compliance may vary include the widely-dispersed nature of transportation decision-making in some clients' organizations and the learning process involved in implementing our services. We work with and expect our enterprise clients to maintain and improve compliance with any applicable exclusivity provisions.
We also provide small parcel consulting services to a limited number of our enterprise clients, which is included in our fee for service revenue. Under these arrangements, we review the client's small parcel shipping contracts and shipment data analyzing their volumes, distribution, rates and savings opportunities, prepare negotiation strategies and directly or indirectly participate in negotiations with carriers to improve the client's rates, charges, services and commitments.
Our annual revenue from individual enterprise clients typically ranges from $100,000 to $10.0 million. Our revenue from all enterprise clients increased in the last two years, from $53.2 million
13
in 2007 to $87.4 million in 2008 and to $109.1 million in 2009. Our revenue from enterprise clients as a percentage of total revenue was 56% in 2007, 43% in 2008 and 42% in 2009.
Transactional Clients
We provide transportation and logistics services to our transactional clients on a shipment-by-shipment basis, which are typically priced to our carriers on a spot, or transactional, basis. Our annual revenue from individual transactional clients typically ranges from $1,000 to $50,000. Of our 50 largest transactional clients in 2008, 45 placed orders with us during 2009, which we believe demonstrates our ability to meet a variety of transportation requirements on a recurring basis.
Our Carrier Network
Our carrier network provides our clients with substantial breadth and depth of offerings within each mode. In 2009, we used approximately 6,200 TL carriers, 100 LTL carriers, 16 small parcel carriers, 57 inter-modal carriers, 12 domestic air carriers and 80 international carriers. Our ability to attract new carriers to our network and maintain good relationships with our current carriers is critical to the success of our business. We rely on our carriers to provide the physical transportation services for our clients, valuable pricing information for our proprietary database and tracking information throughout the shipping process from origin to destination. We believe we provide value to our carriers by enabling them to fill excess capacity on traditionally empty routes, repositioning their equipment and therefore offsetting their substantial overhead costs to generate incremental revenue. In addition, we introduce many of our clients to new carriers and broaden each carrier's market presence by expanding its sales channels to a larger client base.
We select carriers based on their ability to effectively serve our clients with respect to price, technology capabilities, geographic coverage and quality of service. In the small parcel mode, we use nationally recognized carriers, such as FedEx and UPS. In other transportation modes, we maintain the quality of our carrier network by obtaining documentation to ensure each carrier is properly licensed and insured, and has an adequate safety rating. In addition, we continuously collect information on the carriers in our network regarding capacity, pricing trends, reliability, quality control standards and overall customer service. We believe this quality control program helps to ensure that our clients receive high-quality service regardless of the carrier that is selected for an individual shipment. In 2009, we used approximately 6,500 of the over 24,000 carriers in our network to provide shipping services to our clients.
The carriers in our network are of all sizes, including large national trucking companies, mid-sized fleets, small fleets and owner-operators of single trucks. We are not dependent on any one carrier, and our largest carriers by TL, LTL and small parcel accounted for less than 0.9%, 7.9% and 6.2%, respectively, of our total transportation costs across all modes in 2009. For international shipments, we currently rely on one forwarder to provide substantially all of our transportation. We consider our relationship with this carrier to be strong. In 2008 and 2009, international shipments accounted for 4% and 3% of our revenue, respectively.
Sales and Marketing
We market and sell our transportation and logistics services through our sales personnel located in four cities across the United States. As of December 31, 2009, our sales team consisted of 11 enterprise sales representatives, 353 transactional sales representatives and 172 agents. Our enterprise sales representatives typically have significant sales expertise and are focused on building relationships with clients' senior management teams to execute enterprise contracts. Our transactional sales representatives, located largely at our outbound call center in Chicago, are focused on building new transactional client relationships and migrating transactional accounts to enterprise accounts. Our
14
agents, located in regional shipping markets throughout the United States, are typically experienced industry sales professionals focused on building relationships with our clients' transportation managers. We support our sales team with account executives. These individuals are generally responsible for customer service, developing relationships with client personnel and managing the shipping process from origin to destination.
Our marketing efforts typically involve up to a six month selling cycle to secure a new enterprise client. Our efforts may begin in response to a perceived opportunity, a referral by an existing client, a request for proposal, a relationship between a member of our sales team and a potential client, new client prospects gained through acquisitions, an introduction by someone affiliated with our company, or otherwise. Our senior management team, sales representatives and agents are responsible for the sales process. An important aspect of this sales process is our analysis of a prospective client's historic transportation expenditures to demonstrate the potential savings that could be achieved by using our transportation and logistics services. We also try to foster relationships between our senior management team and our clients' senior management, and many of our enterprise clients were secured by marketing our services to "C-level" management contacts. These relationships ensure that both parties are focused on seamless process integration and using our services to provide tangible cost savings.
As we become more knowledgeable about a client's business and processes, our ability to identify opportunities to create value for the client typically increases, and we focus on trying to expand the services we provide to our existing enterprise and transactional clients. As a relationship with a client grows, the time requirement to win an engagement for additional services typically declines and we are able to recognize revenue from our sales efforts more quickly. Historically, many of our clients have been more willing to turn over more of their transportation and logistics requirements to us as we demonstrate our capabilities.
Each new enterprise client is assigned one or more dedicated account executives, who are able to work on-site or off-site, as required by the client. Our dedicated account executives integrate the client's existing business processes with our proprietary technology platform to satisfy the client's transportation requirements, and assist our sales representatives and agents in targeting potential deficiencies in the client's operations that could lead to expanded service offerings. Because the account executives we hire generally have significant sales experience, they can also begin marketing our services after limited training on our model and systems. Our agreements with our account executives require them to market and sell our transportation and logistics services on an exclusive basis and contain non-compete and non-solicitation provisions that apply during and for a specified period after the term of their service.
Our transactional sales representatives, who focus on sales of our transportation and logistics services on a shipment-by-shipment basis, concentrate on building relationships with our transactional clients that could benefit from the competitive pricing and enhanced service associated with our services. Our ability to work with clients on a transactional basis provides us with an opportunity to demonstrate the cost savings associated with our technology-driven services before the client considers moving to a fully-outsourced enterprise engagement. Since our Inception in January 2005, 35 transactional clients have migrated to an enterprise engagement.
Our sales team is critical to the success of our business and our ability to grow will depend on our ability to continue to attract, train and retain talented individuals. Candidates are recruited through search firms, Internet postings, advertisements in industry publications, industry event attendance, referrals and word-of-mouth networking. To attract these candidates, we will continue to offer attractive commission structures and highlight the advantages that our ETM technology platform provides in winning and maintaining new clients. We believe our business model provides us with a competitive advantage in recruiting sales representatives because it enables them to use our enhanced analytics technology and carrier network to market a broader range of services at competitive prices. Our
15
services can be offered at no upfront cost and our clients are generally able to immediately realize tangible cost savings.
We had 24 sales representatives and agents as of December 31, 2005, 57 as of December 31, 2006, 191 as of December 31, 2007, 383 as of December 31, 2008 and 536 as of December 31, 2009. We intend to continue to hire sales representatives and agents with established client relationships that we believe can be developed into new revenue opportunities. We also expect to augment our sales force through selective acquisitions of transportation and logistics service providers with experienced sales representatives and agents in strategic geographical locations.
Competition
The commercial freight transportation services and third-party logistics industries in which we operate are highly competitive and fragmented. We have a number of competitors offering services similar to ours, which include:
- •
- internal shipping departments at companies that have substantial transportation requirements, many of which represent
potential sales opportunities;
- •
- non-asset-based logistics companies, such as C.H. Robinson Worldwide, Freightquote.com, Ozburn-Hessey
Logistics, Total Quality Logistics and Transplace, with whom we compete most often;
- •
- asset-based logistics companies, such as Schneider, FedEx, JB Hunt and ABF;
- •
- carriers that offer logistics services, such as YRC, Conway and UPS, some of whom we frequently purchase transportation
services from on behalf of our clients;
- •
- freight forwarders that dispatch shipments via asset-based carriers, typically arranging for shipments to or from
international destinations, such as Expeditors International; and
- •
- smaller, niche service providers that provide services in a specific geographic market, industry segment or service area.
We believe the principal elements of competition in transportation and logistics services are price, customer service and reliability. Some of our competitors, such as C.H. Robinson Worldwide, have larger client bases and significantly more resources than we do. In addition, some of our competitors may have more expertise in a single transportation mode that allows them to prepare and process documentation and perform related activities pertaining to that mode of transportation more efficiently than Echo. We compete against these entities by establishing ourselves as a leading technology enabled service provider with industry expertise in all major modes of transportation, which enables us to respond rapidly to the evolving needs of our clients related to outsourcing transportation.
Our clients may choose not to outsource their transportation business to us in the future by performing formerly outsourced services for themselves, either in-house or through offshore partnerships or other arrangements. We believe our key advantage over in-house business processes is that ETM gives us the ability to obtain favorable pricing and terms relative to in-house service departments. In addition, we believe we give companies the opportunity to focus on their core products and services while we focus on service, delivery and operational excellence.
We also face competition from some of the larger services companies, such as IBM or Accenture, because they offer transportation procurement and logistics services to their clients. Their well-established client relationships, industry knowledge, brand recognition, financial and marketing capabilities, technical resources and pricing flexibility may provide them with a competitive advantage over us. These companies may include service companies based in offshore locations, divisions of large IT service companies and global services companies located in the United States or offshore.
16
Intellectual Property
We rely primarily on a combination of copyright, trademark and trade secret laws, as well as license agreements and other contractual provisions, to protect our intellectual property rights and other proprietary rights. To date, we have not registered any patents nor trademarks. Some of our intellectual property rights relate to proprietary business process enhancements. It is our practice to enter into confidentiality and invention assignment agreements with all of our employees and independent contractors that:
- •
- include a confidentiality undertaking by the employee or independent contractor;
- •
- ensure that all new intellectual property developed in the course of our relationship with employees or independent
contractors is assigned to us;
- •
- and require the employee or independent contractor to cooperate with us to protect our intellectual property during and after his or her relationship with us.
Government Regulation
Subject to applicable federal and state regulation, we may arrange for the transport of most types of freight to and from any point in the United States. Certain of our U.S. domestic ground transportation operations may be subject to regulation by the Federal Motor Carrier Safety Administration (the FMCSA), which is an agency of the U.S. Department of Transportation, and by various state agencies. The FMCSA has broad regulatory powers in areas such as safety and insurance relating to interstate motor carrier and broker operations. The ground transportation industry is also subject to possible regulatory and legislative changes (such as the possibility of more stringent environmental, safety or security regulations or limits on vehicle weight and size) that could affect the economics of the industry by requiring changes in operating practices or the cost of providing transportation services.
Our international operations are impacted by a wide variety of U.S. government regulations. These include regulations of the U.S. Department of State, U.S. Department of Commerce and the U.S. Department of Treasury. Regulations cover matters such as what commodities may be shipped to what destination and to what end-user, unfair international trade practices and limitations on entities with whom we may conduct business.
Our air freight business in the United States is subject to regulation as an indirect air carrier by the Transportation Security Administration (the TSA) and the Department of Transportation. We are in the process of having our indirect air carrier security program approved by the TSA as required by the applicable regulations. We are also in the process of having our directors and officers complete the Security Threat Assessments required by TSA regulations. The airfreight industry is subject to regulatory and legislative changes that could affect the economics of the industry by requiring changes in operating practices or influencing the demand for, and the costs of providing, services to clients.
Our ocean transportation business in the United States is subject to regulation by the Federal Maritime Commission (the FMC). The FMC licenses persons acting as ocean transportation intermediaries, including ocean freight forwarders and non-vessel operating common carrier operators. Ocean freight forwarders are subject to surety bond requirements and required to retain a "qualified individual" as an officer of the company. Non-vessel operating common carriers are subject to FMC tariff publication requirements, and must submit for review and public notice certain shipping agreements reached with clients. Ocean freight forwarders are also subject to regulatory oversight, particularly those terms proscribing rebating practices. The FMC provides a forum for persons to challenge actions or practices of ocean transportation intermediaries through private actions.
17
Our import and export business in the United States is subject to U.S. Customs regulations imposed by U.S. Customs and Border Protection (the CBP). These regulations include significant notice and registration requirements. While not technically a regulatory requirement, participation in CBP's "Customs-Trade Partnership against Terrorism" (C-TPAT) program will be commercially necessary as we expand our international transportation business. Under C-TPAT, a transportation entity must maintain an effective transportation security program and cooperate with CPB initiatives and guidance. Participation in C-TPAT permits more efficient and expedited processing of shipments through U.S. Customs. We are currently providing customs broker services through contracts with licensed customs brokers.
We are subject to a broad range of foreign and domestic environmental and workplace health and safety requirements, including those governing discharges to air and water and the handling, disposal and release of hazardous substances and wastes. In the course of our operations, we may be asked to store, transport or arrange for the storage or transportation of substances that could result in liability under applicable laws if released into the environment. If a release of hazardous substances occurs while being transported by our subcontracted carrier, we may be required to participate in, or may have liability for response costs and the remediation of such a release. In such case, we also may be subject to claims for personal injury, property damage and damage to natural resources. Our exposure to and potential liability for these claims may be managed through agreements with our clients and suppliers.
The transportation industry is one of the largest sources of man made greenhouse gas emissions that contribute to global warming. National and transnational laws and initiatives to reduce and mitigate the effects of such emissions, such as the Kyoto Protocols and current laws and legislative initiatives in the European Union and the U.S. could significantly impact transportation modes and the economics of the transportation industry. Future environmental laws in this area could adversely affect our carriers' costs and practices and our business.
Although our current operations have not been significantly affected by compliance with, or liability arising under, these environmental, health and safety laws, we cannot predict what impact future environmental, health and safety regulations might have on our business.
Transportation-related regulations are greatly affected by U.S. national security legislation and related regulatory initiatives, and remain in a state of flux. We believe that we are in substantial compliance with applicable material regulations and that the costs of regulatory compliance have not had a material adverse impact on our operations to date. However, our failure to comply with the applicable regulations or to maintain required permits or licenses could result in substantial fines or revocation of our operating permits or licenses. We cannot predict the degree or cost of future regulations on our business. If we fail to comply with applicable governmental regulations, we could be subject to substantial fines or revocation of our permits and licenses.
Risk Management and Insurance
If a shipment is damaged during the delivery process, our client files a claim for the damaged shipment with us. In the cases where we have agreed (either contractually or otherwise) to pay for claims for damage to freight while in transit, we pursue reimbursement from the carrier for the claims. If we are unable to recover all or any portion of the claim amount from our carrier, we may bear the financial loss. We mitigate this risk by using our quality program to carefully select carriers with adequate insurance, quality control procedures and safety ratings. We also take steps to ensure that the coverage we provide to our clients for damaged shipments is substantially similar to the coverage that our carriers provide to us. In addition, we carry our own insurance to protect against client claims for damaged shipments.
We extend credit to certain clients as part of our business model. These clients are subject to an approval process prior to any extension of credit or increase in their current credit limit. Our finance
18
department reviews each credit request and considers, among other things, payment history, current billing status, recommendations by various rating agencies and capitalization. Clients that pass our credit request procedures may receive a line of credit or an increase in their existing credit amount. We believe this review and approval process helps mitigate the risk of client defaults on extensions of credit and the related bad debt expense.
We require all motor carriers we work with to carry at least $1.0 million in auto and general liability insurance and $100,000 in cargo insurance. We also maintain a broad cargo liability insurance policy to protect us against catastrophic losses that may not be recovered from the responsible carrier, and carry various liability insurance policies, including auto and general liability. Our collective insurance policies have a cap of $20.0 million.
Properties
Our principal executive offices are located in Chicago, Illinois. We also maintain sales offices in Los Angeles, California, Vancouver, Washington, Park City, Utah, Troy, Michigan, Little Rock, Arkansas, Buffalo, Minnesota and Matteson, Illinois. We believe that our facilities are generally suitable to meet our needs for the foreseeable future; however, we will continue to seek additional space as needed to satisfy our growth.
Employees
As of December 31, 2009, we had 663 employees, consisting of 11 enterprise sales representatives, 353 transactional sales representatives, 181 account executives, 46 technology personnel and 72 administrative personnel. We also had 172 independent contractors working as sales agents, and a 53-person workforce based at our build, operate, transfer (BOT) facilities in Pune and Kolkata, India. We consider our employee relations to be good.
Legal Proceedings
We are not a party to any material pending legal proceedings.
19
Set forth below are certain risk factors that could harm our business, results of operations and financial condition. You should carefully read the following risk factors, together with the financial statements, related notes and other information contained in this Annual Report on Form 10-K. This Annual Report on Form 10-K contains forward-looking statements that contain risks and uncertainties. Please refer to the discussion of "Forward-Looking Statements" on page one of this Annual Report on Form 10-K in connection with your consideration of the risk factors and other important factors that may affect future results described below.
Investing in our common stock involves a high degree of risk. You should carefully consider the following risks and other information contained in this Annual Report on Form 10-K before you decide to buy our common stock. Our business, financial condition and operating results may suffer if any of the following risks are realized. If any of these risks or uncertainties occur, the trading price of our common stock could decline and you might lose all or part of your investment.
Risks Related to Our Business
If our carriers do not meet our needs or expectations, or those of our clients, our business could suffer.
The success of our business depends to a large extent on our relationships with clients and our reputation for providing high-quality technology enabled transportation and logistics services. We do not own or control the transportation assets that deliver our clients' freight, and we do not employ the people directly involved in delivering the freight. We rely on independent third-parties to provide TL, LTL, small parcel, inter-modal, domestic air, expedited and international services and to report certain information to us, including information relating to delivery status and freight claims. This reliance could cause delays in providing our clients with important service data and in the financial reporting of certain events, including recognizing revenue and recording claims. If we are unable to secure sufficient transportation services to meet our commitments to our clients, our operating results could be adversely affected, and our clients could switch to our competitors temporarily or permanently. Many of these risks are beyond our control and difficult to anticipate, including:
- •
- changes in rates charged by transportation providers;
- •
- supply shortages in the transportation industry, particularly among truckload carriers;
- •
- interruptions in service or stoppages in transportation as a result of labor disputes; and
- •
- changes in regulations impacting transportation.
If any of the third-parties we rely on do not meet our needs or expectations, or those of our clients, our professional reputation may be damaged and our business could be harmed. For international shipments, we currently rely on one carrier to provide substantially all of our transportation. If this carrier fails to meet our needs or expectations, our ability to offer international shipping services could be delayed or disrupted, and our costs may increase. In 2008 and 2009, international shipments accounted for 4% and 3% of our revenue, respectively.
Competition could substantially impair our business and our operating results.
Competition in the transportation services industry is intense. We compete against other non-asset-based logistics companies as well as asset-based logistics companies; freight forwarders that dispatch shipments via asset-based carriers; carriers offering logistics services; internal shipping departments at companies that have substantial transportation requirements; large business process outsourcing (BPO) service providers; and smaller, niche service providers that provide services in a specific geographic market, industry segment or service area. We also compete against carriers' internal sales forces and shippers' transportation departments. At times, we buy transportation services from our competitors.
20
Historically, competition has created a downward pressure on freight rates, and continuation of this rate pressure may adversely affect the Company's revenue and income from operations.
In addition, a software platform and database similar to ETM could be created over time by a competitor with sufficient financial resources and comparable experience in the transportation services industry. If our competitors are able to offer comparable services, we could lose clients, and our market share and profit margin could decline. Our competitors may also establish cooperative relationships to increase their ability to address client needs. Increased competition may lead to revenue reductions, reduced profit margins or a loss of market share, any one of which could harm our business.
A significant portion of our revenue is derived from a relatively limited number of large clients and any loss of, or decrease in sales to, these clients could harm our results of operations.
A significant portion of our revenue is derived from a relatively limited number of large clients. Revenue from our five largest clients, collectively, accounted for 19% of our revenue in 2009, and revenue from our 10 largest clients, collectively, accounted for 27% of our revenue in 2009. We are likely to continue to experience ongoing customer concentration, particularly if we are successful in attracting large enterprise clients. It is possible that revenue from these clients, either individually or as a group, may not reach or exceed historical levels in any future period. The loss or significant reduction of business from one or more of our major clients would adversely affect our results of operations.
If we are unable to expand the number of our sales representatives and agents, or if a significant number of our sales representatives and agents leaves us, our ability to increase our revenue could be negatively impacted.
Our ability to expand our business will depend, in part, on our ability to attract additional sales representatives and agents with established client relationships. Competition for qualified sales representatives and agents can be intense, and we may be unable to hire such persons. Any difficulties we experience in expanding the number of our sales representatives and agents could have a negative impact on our ability to expand our client base, increase our revenue and continue our growth.
In addition, we must retain our current sales representatives and agents and properly incentivize them to obtain new clients and maintain existing client relationships. If a significant number of our sales representatives and agents leave us, our revenue could be negatively impacted. We have entered into agreements with our sales representatives and agents that contain non-compete provisions to mitigate this risk, but we may need to litigate to enforce our rights under these agreements, which could be time-consuming, expensive and ineffective. A significant increase in the turnover rate among our current sales representatives and agents could also increase our recruiting costs and decrease our operating efficiency, which could lead to a decline in the demand for our services.
If our services do not achieve widespread commercial acceptance, our business will suffer.
Many companies coordinate the procurement and management of their logistics needs with their own employees using a combination of telephone, facsimile, e-mail and the Internet. Growth in the demand for our services depends on the adoption of our technology enabled transportation and logistics services. We may not be able to persuade prospective clients to change their traditional transportation management processes. Our business could suffer if our services are not accepted by the marketplace.
We may not be able to develop or implement new systems, procedures and controls that are required to support the anticipated growth in our operations.
Our revenue increased to $259.6 million in 2009 from $7.3 million in 2005, representing an annual revenue growth rate of 353% from 2005 to 2006, 188% from 2006 to 2007, 112% from 2007 to 2008
21
and 28% from 2008 to 2009. Between January 1, 2005 and December 31, 2009, the number of our employees, agents and independent contractors increased from 44 to 663. Continued growth could place a significant strain on our ability to:
- •
- recruit, motivate and retain qualified sales representatives and agents, carrier representatives and management personnel;
- •
- develop and improve our internal administrative infrastructure and execution standards; and
- •
- expand and maintain the operation of our technology infrastructure in a manner that preserves a quality customer experience.
To manage our growth, we must implement and maintain proper operational and financial controls and systems. Further, we will need to manage our relationships with various clients and carriers. We cannot give any assurance that we will be able to develop and implement, on a timely basis, the systems, procedures and controls required to support the growth in our operations or effectively manage our relationships with various clients and carriers. If we are unable to manage our growth, our business, operating results and financial condition could be adversely affected.
If we are unable to maintain ETM, our proprietary software, demand for our services and our revenue could decrease.
We rely heavily on ETM, our proprietary software, to track and store externally and internally generated market data, analyze the capabilities of our carrier network and recommend cost-effective carriers in the appropriate transportation mode. To keep pace with changing technologies and client demands, we must correctly interpret and address market trends and enhance the features and functionality of our proprietary technology platform in response to these trends, which may lead to significant ongoing research and development costs. We may be unable to accurately determine the needs of our clients and the trends in the transportation services industry or to design and implement the appropriate features and functionality of our technology platform in a timely and cost-effective manner, which could result in decreased demand for our services and a corresponding decrease in our revenue. Despite testing, we may be unable to detect defects in existing or new versions of our proprietary software, or errors may arise in our software. Any failure to identify and address such defects or errors could result in loss of revenue or market share, liability to clients or others, diversion of resources, injury to our reputation, and increased service and maintenance costs. Correction of such errors could prove to be impossible or very costly, and responding to resulting claims or liability could similarly involve substantial cost.
We have not registered any patents nor trademarks to date, and our inability to protect our intellectual property rights may impair our competitive position.
Our failure to adequately protect our intellectual property and other proprietary rights could harm our competitive position. We rely on a combination of copyright, trademark, and trade secret laws, as well as license agreements and other contractual provisions to protect our intellectual property and other proprietary rights. In addition, we attempt to protect our intellectual property and proprietary information by requiring all of our employees and independent contractors to enter into confidentiality and invention assignment agreements. To date we have not pursued patent protection for our technology. We also have not registered trademarks to protect our brands. We cannot be certain that the steps we have taken to protect our intellectual property rights will be adequate or will prevent third-parties from infringing or misappropriating our rights; imitating or duplicating our technology, services or methodologies, including ETM; or using trademarks similar to ours. Should we need to resort to litigation to enforce our intellectual property rights or to determine the validity and scope of the rights of others, such litigation could be time-consuming and costly, and the result of any litigation is subject to uncertainty. In addition, ETM incorporates open source software components that are
22
licensed to us under various public domain licenses. Although we believe that we have complied with our obligations under the various applicable licenses for the open source software that we use, there is little or no legal precedent governing the interpretation of many of the terms of these licenses, and the potential impact of such terms on our business is, therefore, difficult to predict.
We may be sued by third-parties for alleged infringement of their intellectual or proprietary rights.
Our use of ETM or other technologies could be challenged by claims that such use infringes, misappropriates or otherwise violates the intellectual property rights of third-parties. Any intellectual property claims, with or without merit, could be time-consuming and costly to resolve, could divert management's attention from our business and could require us to pay substantial monetary damages. Any settlement or adverse judgment resulting from such a claim could require us to enter into a licensing agreement to continue using the technology that is the subject of the claim, or could otherwise restrict or prohibit our use of such technology. There can be no assurance that we would be able to obtain a license on commercially reasonable terms, if at all, from the party asserting an infringement claim, or that we would be able to develop or license a suitable alternative technology to permit us to continue offering the affected services to our clients. Our insurance coverage for claims of infringement, misappropriation, or other violation of the intellectual property rights of third-parties may not continue to be available on reasonable terms or in sufficient amounts to cover one or more large claims against us, and our insurers may disclaim coverage as to any future claims. An uninsured or underinsured claim could result in unanticipated costs thereby reducing operating results.
We have a long selling cycle to secure a new enterprise contract and a long implementation cycle, which require significant investments of resources.
We typically face a long selling cycle to secure a new enterprise contract, which requires significant investment of resources and time by both our clients and us. Before committing to use our services, potential clients require us to spend time and resources educating them on the value of our services and assessing the feasibility of integrating our systems and processes with theirs. Our clients then evaluate our services before deciding whether to use them. Therefore, our enterprise selling cycle, which can take up to six months, is subject to many risks and delays over which we have little control, including our clients' decisions to choose alternatives to our services (such as other providers or in-house resources) and the timing of our clients' budget cycles and approval processes.
Implementing our enterprise services, which can take from one to six months, involves a significant commitment of resources over an extended period of time from both our clients and us. Depending on the scope and complexity of the processes being implemented, these time periods may be significantly longer. Our clients and future clients may not be willing or able to invest the time and resources necessary to implement our services, and we may fail to close sales with potential clients to which we have devoted significant time and resources, which could have a material adverse effect on our business, results of operations, financial condition and cash flows, as we do not recognize significant revenue until after we have completed the implementation phase.
Our clients may terminate their relationships with us on short notice with limited or no penalties, and our clients are not obligated to spend a minimum amount with us.
Our transactional clients, which accounted for approximately 57% and 58% of our revenue in 2008 and 2009, respectively, use our services on a shipment-by-shipment basis rather than under long-term contracts. These clients have no obligation to continue using our services and may stop using them at any time without penalty or with only limited penalties. Our contracts with enterprise clients typically have terms of one to three years and are subject to termination provisions negotiated on a contract-by-contract basis. These termination provisions typically provide the client with the ability to terminate upon 30 or 60 days' advance written notice in the event of a material breach. Included as a material
23
breach is the Company's failure to provide the negotiated level of cost savings. In some cases, the enterprise contracts may be terminated by providing written notice within 60 days of execution or may be terminated upon 60 to 90 days' advanced written notice for any reason. Enterprise contracts accounting for 10.0% and 14.4% of our revenue in 2009 are scheduled to expire (subject to possible renewal) in 2010 and 2011, respectively.
The volume and type of services we provide each client may vary from year to year and could be reduced if the client were to change its outsourcing or shipping strategy. Our enterprise clients generally are not obligated to spend any particular amount with us, although our enterprise contracts are typically exclusive with respect to point of origin or one or more modes of transportation, meaning that the client is obligated to use us if it ships from the point of origin or uses those modes. These contractual exclusivity provisions help ensure, but do not guarantee, that we receive a significant portion of the amount that our enterprise clients spend on transportation in the applicable mode or modes or from the applicable point of origin. In our experience, compliance with such provisions varies from client to client and over time. Failure to comply with these exclusivity provisions may adversely affect our revenue.
If a significant number of our transactional or enterprise clients elect to terminate or not to renew their engagements with us, or if the volume of their shipping orders decreases, our business, operating results and financial condition could suffer. If we are unable to renew our enterprise contracts at favorable rates, our revenue may decline.
If we are unable to deliver agreed upon cost savings to our enterprise clients, we could lose those clients and our results could suffer.
Our contracts with enterprise clients typically commit us to deliver a negotiated level of cost savings compared to our clients' historical shipping expenditures over a fixed period of time. We then estimate cost savings periodically during the term of our engagement and if the negotiated amount is not achieved, the client has the right to terminate the contract. Any number of factors, including a downturn in the economy, increases in costs, or decreases in the availability of transportation capacity, could impair our ability to provide the agreed cost savings. Even if our enterprise clients do not terminate their contracts with us as a result, our results of operations will suffer, and it may become more difficult to attract new enterprise clients.
The current economic conditions of the global and domestic economy, or a substantial or prolonged downturn in our clients' business cycle, may have a material adverse affect on our business, results of operations and financial condition.
Our business, results of operations and financial condition are materially affected by the conditions in the global and domestic economy. The stress experienced by the global capital markets that began in the second half of 2007, substantially increased during the second half of 2008 and continued during 2009. Concerns over unemployment, the availability and cost of credit, the U.S. mortgage market and a declining real estate market in the United States have contributed to increased volatility and diminished expectations for the economy and the financial markets going forward. These factors, combined with volatile oil prices and low business and consumer confidence, have precipitated a recession.
These events and the continuing market upheavals may have an adverse affect on us, our carriers and our clients. Carriers may charge higher prices to cover higher operating expenses such as higher fuel prices, costs associated with regulatory compliance and other factors beyond our control. Our gross profits and income from operations may decrease if we are unable to pass through to our clients the full amount of these higher transportation costs. In addition, our business, results of operations and financial condition may be negatively impacted by decreases in the volume of freight shipped by our clients due to decreases in their business volume or price increases by our carriers. If we are not able
24
to timely and appropriately adapt to changes resulting from the difficult economic environment, our business, results of operations and financial condition may be materially and adversely affected.
High fuel prices may increase carrier prices and volatility in fuel prices may make it more difficult to pass through this cost to our clients, which may impair our operating results.
Fuel prices recently reached historically high levels in the past couple years and continue to be volatile and difficult to predict. In the event fuel prices rise, carriers can be expected to charge higher prices to cover higher operating expenses, and our gross profits and income from operations may decrease if we are unable to continue to pass through to our clients the full amount of these higher costs. Higher fuel costs could also cause material shifts in the percentage of our revenue by transportation mode, as our clients may elect to utilize alternative transportation modes, such as inter-modal. In addition, increased volatility in fuel prices may affect our gross profits and income from operations if we are not able to pass through to our clients any higher costs associated with such volatility. Any material shifts to transportation modes with respect to which we realize lower gross profit margins could impair our operating results.
A decrease in levels of excess capacity in the U.S. transportation services industry could have an adverse impact on our business.
We believe that, historically, the U.S. transportation services industry has experienced significant levels of excess capacity. Our business seeks to capitalize on imbalances between supply and demand in the transportation services industry by obtaining favorable pricing terms from carriers in our network through a competitive bid process. Reduced excess capacity in the transportation services industry generally, and in our carrier network specifically, could have an adverse impact on our ability to execute our business strategy and on our business results and growth prospects.
A decrease in the number of carriers participating in our network could adversely affect our business.
We use our proprietary technology platform to compile freight and logistics data from our network of over 24,000 carriers. In 2009, we used approximately 6,200 TL carriers, 100 LTL carriers, 16 small parcel carriers, 57 inter-modal carriers, 12 domestic air carriers and 80 international carriers. We expect to continue to rely on these carriers to fulfill our shipping orders in the future. However, these carriers are not contractually required to continue to accept orders from us. If shipping capacity at a significant number of these carriers becomes unavailable, we will be required to use fewer carriers, which could significantly limit our ability to serve our clients on competitive terms. The transportation industry has also experienced consolidation among carriers in recent years and further consolidations could result in a decrease in the number of carriers, which may impact our ability to serve our clients on competitive terms. In addition, we rely on price bids provided by our carriers to populate our database. If the number of our carriers decreases significantly, we may not be able to obtain sufficient pricing information for ETM, which could affect our ability to obtain favorable pricing for our clients.
Our obligation to pay our carriers is not contingent upon receipt of payment from our clients, and we extend credit to certain clients as part of our business model.
In most cases, we take full risk of credit loss for the transportation services we procure from carriers. Our obligation to pay our carriers is not contingent upon receipt of payment from our clients. In 2008 and 2009, our revenue was $202.8 million and $259.6 million, respectively, and our top 10 clients accounted for 35% and 27% of our revenue, respectively. If any of our key clients fail to pay for our services, our profitability would be negatively impacted.
We extend credit to certain clients in the ordinary course of business as part of our business model. By extending credit, we increase our exposure to uncollected receivables. The current economic
25
conditions of the global and domestic economy have resulted in an increasing trend of business failures, downsizing and delinquencies, which may cause an increase in our credit risk. If we fail to monitor and manage effectively any increased credit risk, our immediate and long-term liquidity may be adversely affected. In addition, if one of our key clients defaults in paying us, our profitability would be negatively impacted.
A prolonged outage of our ETM database could result in reduced revenue and the loss of clients.
The success of our business depends upon our ability to deliver time-sensitive, up-to-date data and information. We rely on our Internet access, computer equipment, software applications, database storage facilities and other office equipment, which are mainly located in our Chicago headquarters. Our operations and those of our carriers and clients are vulnerable to interruption by fire, earthquake, power loss, telecommunications failure, terrorist attacks, wars, computer viruses, hacker attacks, equipment failure, physical break-ins and other events beyond our control, including disasters affecting Chicago. We attempt to mitigate these risks through various means, including system backup and security measures, but our precautions will not protect against all potential problems. We maintain fully redundant off-site backup facilities for our internet access, computer equipment, software applications, database storage and network equipment, but these facilities could be subject to the same interruptions that could affect our headquarters. If we suffer a database or network facility outage, our business could experience disruption, and we could suffer reduced revenue and the loss of clients.
Our ETM technology platform relies heavily on our telecommunication service providers, our electronic delivery systems and the Internet, which exposes us to a number of risks over which we have no control, including risks with respect to increased prices, termination, failures and disruptions of essential services.
Our ability to deliver our services depends upon the capacity, reliability and security of services provided to us by our telecommunication service providers, our electronic delivery systems and the Internet. We have no control over the operation, quality or maintenance of these services or whether the vendors will improve their services or continue to provide services that are essential to our business. In addition, our telecommunication service providers may increase their prices at which they provide services, which would increase our costs. If our telecommunication service providers were to cease to provide essential services or to significantly increase their prices, we could be required to find alternative vendors for these services. With a limited number of vendors, we could experience significant delays in obtaining new or replacement services, which could significantly harm our reputation and could cause us to lose clients and revenue. Moreover, our ability to deliver information using the Internet may be impaired because of infrastructure failures, service outages at third-party Internet providers or increased government regulation. If disruptions, failures or slowdowns of our electronic delivery systems or the Internet occur, our ability to effectively provide technology enabled transportation and supply chain management services and to serve our clients may be impaired.
We are subject to claims arising from our transportation operations.
We use the services of thousands of transportation companies and their drivers in connection with our transportation operations. From time to time, these drivers are involved in accidents or goods carried by these drivers are lost or damaged and the carriers may not have adequate insurance coverage. Although these drivers are not our employees and all of these drivers are employees or independent contractors working for carriers or are owner-operators, from time to time, claims may be asserted against us for their actions, or for our actions in retaining them. Claims against us may exceed the amount of our insurance coverage, or may not be covered by insurance at all. If a shipment is lost or damaged during the delivery process, a client may file a claim for the damaged shipment with us and we will bear the risk of recovering the claim amount from the carrier. If we are unable to recover all or any portion of the claim amount from the carrier, and to the extent each claim exceeds the
26
amount which may be recovered from the Company's own insurance, we may bear the financial loss. A material increase in the frequency or severity of accidents, claims for lost or damaged goods, liability claims or workers' compensation claims, or unfavorable resolutions of claims, could materially adversely affect our operating results. Significant increases in insurance costs or the inability to purchase insurance as a result of these claims could also reduce our profitability.
Our industry is subject to seasonal sales fluctuations. If our business experiences seasonality, it could have an adverse effect on our operating results and financial condition.
Our industry is subject to some degree of seasonal sales fluctuations as shipments generally are lower during and after the winter holiday season because many of our retail clients ship goods and stock inventories prior to the winter holiday season. If we were to experience lower-than-expected revenue during any such period, whether from a general decline in economic conditions or other factors beyond our control, our expenses may not be offset, which would have a disproportionately adverse impact on our operating results and financial condition for that period.
Our limited operating history makes it difficult to evaluate our business, prospects and future financial performance.
We formed our business in January 2005 and have a limited operating history, which makes evaluating our current business and prospects difficult. The revenue and income potential of our business is uncertain, which makes it difficult to accurately predict our future financial performance. We incurred net losses of $0.5 million in 2005 and $0.2 million in 2006, and we may incur net losses in the future. We may also face periods where our financial performance falls below investor expectations. As a result, the price of our common stock may decline.
Because many of the members of our management team have been employed with us for a short period of time, we cannot be certain that they will be able to manage our business successfully.
We are dependent on our management team for our business to be successful. Because of our limited operating history, many of our key management personnel have been employed by us for less than three years. Therefore, we cannot be certain that we will be able to allocate responsibilities appropriately and that the new members of our management team will succeed in their roles. Our inability to integrate recent additions to our current management team with our business model would make it difficult for us to manage our business successfully and to pursue our growth strategy.
We may not be able to identify suitable acquisition candidates, effectively integrate newly acquired businesses or achieve expected profitability from acquisitions.
Part of our growth strategy is to increase our revenue and the market regions that we serve through the acquisition of complementary businesses. There can be no assurance that suitable candidates for acquisitions can be identified or, if suitable candidates are identified, that acquisitions can be completed on acceptable terms, if at all. Even if suitable candidates are identified, any future acquisitions may entail a number of risks that could adversely affect our business and the market price of our common stock, including the integration of the acquired operations, diversion of management's attention, risks of entering new market regions in which we have limited experience, adverse short-term effects on our reported operating results, the potential loss of key employees of acquired businesses and risks associated with unanticipated liabilities.
We may use our common stock to pay for acquisitions. If the owners of potential acquisition candidates are not willing to receive our common stock in exchange for their businesses, our acquisition prospects could be limited. Future acquisitions could also result in accounting charges, potentially dilutive issuances of equity securities and increased debt and contingent liabilities, including liabilities related to unknown or undisclosed circumstances, any of which could have a material adverse effect on our business and the market price of our common stock.
27
We may face difficulties as we expand our operations into countries in which we have limited operating experience.
We provide transportation services within and between continents on an increasing basis. In 2008 and 2009, international transportation accounted for 4% and 3% of revenue, respectively. We intend to continue expanding our global footprint, specifically in international-air and ocean modes, in order to maintain an appropriate cost structure and meet our clients' delivery needs. This may involve expanding into countries other than those in which we currently operate. Our business outside of the United States is subject to various risks, including:
- •
- changes in economic and political conditions in the United States and abroad;
- •
- changes in compliance with international and domestic laws and regulations;
- •
- wars, civil unrest, acts of terrorism and other conflicts;
- •
- natural disasters;
- •
- changes in tariffs, trade restrictions, trade agreements and taxations;
- •
- difficulties in managing or overseeing foreign operations;
- •
- limitations on the repatriation of funds because of foreign exchange controls;
- •
- less developed and less predictable legal systems than those in the United States; and
- •
- intellectual property laws of countries which do not protect our intellectual property rights to the same extent as the laws of the United States.
The occurrence or consequences of any of these factors may restrict our ability to operate in the affected region and/or decrease the profitability of our operations in that region.
As we expand our business in foreign countries, we will become exposed to increased risk of loss from foreign currency fluctuations and exchange controls as well as longer accounts receivable payment cycles. We have limited control over these risks, and if we do not correctly anticipate changes in international economic and political conditions, we may not alter our business practices in time to avoid adverse effects.
If we are unable to manage the risks and challenges associated with our operations in India, the growth of our business could be impacted.
In 2005, we expanded our business operations to include facilities in Kolkata and Pune, India. These facilities, which provide customer support and administrative services, accounted for approximately 8% of our workforce as of December 31, 2009. We are subject to a number of risks and challenges that specifically relate to our operations in India, including the following:
- •
- wages in India are increasing at a faster rate than in the North America, which may result in increased costs for our
Indian workforce;
- •
- the exchange rate between the Indian rupee and the U.S. dollar has changed substantially in recent years and may fluctuate
substantially in the future. An appreciation of the Indian rupee against the U.S. dollar or a fluctuation in interest rates in India may have an adverse effect on our cost of revenue, gross profit
margin and net income, which may in turn have a negative impact on our business, operating results and financial condition; and
- •
- we do not currently employ our Indian workforce directly but rather contract with an independent third-party to provide and train workers through our build, operate, transfer (BOT) arrangements. Although additional hiring may be necessary, we are able to provide all of the services performed by our Indian workforce through our domestic operations. In addition, we
28
believe that we could replace our BOT arrangement over time with other arrangements in India or in another low cost foreign labor market. However, a significant failure by our independent contractor to provide and train Indian workers under our existing BOT arrangement could result in increased costs and disruptions or delays in the provision of our services and could distract our management from operating and growing our business.
Our operations are subject to various environmental laws and regulations, the violation of which could result in substantial fines or penalties.
From time to time, we arrange for the movement of hazardous materials at the request of our clients. As a result, we are subject to various environmental laws and regulations relating to the handling, transport and disposal of hazardous materials. If our clients or carriers are involved in a spill or other accident involving hazardous materials, or if we are found to be in violation of applicable laws or regulations, we could be subject to substantial fines or penalties, response or remediation costs, and civil and criminal liability, any of which could have an adverse effect on our business and results of operations. In addition, current and future national laws and multilateral agreements relating to carbon emissions and the effects of global warming can be expected to have a significant impact on the transportation sector generally and the operations and profitability of some of our carriers in particular, which could adversely affect our business and results of operations.
Our business depends on compliance with many government regulations.
International and domestic transportation of goods is subject to a number of governmental regulations, including licensing and financial security requirements, import and export regulations, security requirements, packaging regulations and notification requirements. These regulations and requirements are subject to change based on new legislation and regulatory initiatives, which could affect the economics of the transportation industry by requiring changes in operating practices or influencing the demand for, and the cost of providing, transportation services.
We are licensed by the U.S. Department of Transportation as a broker authorized to arrange for the transportation of general commodities by motor vehicle. We must comply with certain insurance and surety bond requirements to act in this capacity. Prior to the completion of this offering, we expect to obtain an ocean transportation intermediary license from the Federal Maritime Commission to act as an ocean freight forwarder and as a non-vessel operating common carrier. The application for our ocean transportation intermediary license has been submitted, and we expect to be issued the license upon the completion of certain compliance requirements.
We are currently providing customs broker services through contacts with licensed customs brokers. We are in the process of obtaining a license as a customs broker, and as a licensed customs broker we will be required to comply with applicable customs and customs broker regulations. We intend to register as an indirect air carrier with the Transportation Security Administration, and as a registered indirect air carrier we will be required to comply with air security regulations imposed by the Transportation Security Administration.
We may experience an increase in operating costs, such as security costs, as a result of governmental regulations that have been and will be adopted in response to terrorist activities and potential terrorist activities. No assurances can be given that we will be able to pass these increased costs on to our clients in the form of rate increases or surcharges.
If the key members of our management team do not remain with us in the future, our business, operating results and financial condition could be adversely affected.
Our future success may depend to a significant extent on the continued services of Douglas R. Waggoner, our Chief Executive Officer; David B. Menzel, our Chief Financial Officer; and Samuel K.
29
Skinner, our non-executive Chairman. The loss of the services of any of these or other individuals could adversely affect our business, operating results and financial condition and could divert other senior management time in searching for their replacements.
Our management team has limited experience managing a public company, and regulatory compliance may divert its attention from the day-to-day management of our business.
The individuals who now constitute our management team have limited experience managing a publicly-traded company and limited experience complying with the increasingly complex laws pertaining to public companies. Our management team may not successfully or efficiently manage our transition into a public company that will be subject to significant regulatory oversight and reporting obligations under federal securities laws. In particular, these new obligations will require substantial attention from our senior management and divert their attention away from the day-to-day management of our business, which could materially and adversely impact our business operations.
We will incur increased costs as a result of being a public company.
We will face increased legal, accounting, administrative and other costs and expenses as a public company that we do not incur as a private company. The Sarbanes-Oxley Act of 2002, including the requirements of Section 404, as well as new rules and regulations subsequently implemented by the Securities and Exchange Commission (the SEC), the Public Company Accounting Oversight Board and The Nasdaq Global Market, imposes additional reporting and other obligations on public companies. We expect that compliance with these public company requirements will increase our costs and make some activities more time-consuming. A number of those requirements will require us to carry out activities we have not done previously. For example, we will create new board committees and adopt new internal controls and disclosure controls and procedures. In addition, we will incur additional expenses associated with our SEC reporting requirements. For example, under Section 404 of the Sarbanes-Oxley Act, for our annual report on Form 10-K for our fiscal year ending December 31, 2010, we will need to document and test our internal control procedures, our management will need to assess and report on the effectiveness of on our internal control over financial reporting and our independent accountants will need to issue an opinion on the effectiveness of those controls. Furthermore, if we identify any issues in complying with those requirements (for example, if we or our accountants identified a material weakness or significant deficiency in our internal control over financial reporting), we could incur additional costs rectifying those issues, and the existence of those issues could adversely affect us, our reputation or investor perceptions of us. We also expect that it will be difficult and expensive to obtain director and officer liability insurance, and we may be required to accept reduced policy limits and coverage or incur substantially higher costs to obtain the same or similar coverage. As a result, it may be more difficult for us to attract and retain qualified persons to serve on our board of directors or as executive officers. Advocacy efforts by stockholders and third-parties may also prompt even more changes in governance and reporting requirements. We expect that the additional reporting and other obligations imposed on us by these rules and regulations will increase our legal and financial compliance costs and the costs of our related legal, accounting and administrative activities by approximately $1.4 million per year. These increased costs will require us to divert a significant amount of money that we could otherwise use to expand our business and achieve our strategic objectives.
Our ability to raise capital in the future may be limited, and our failure to raise capital when needed could prevent us from growing.
We may in the future be required to raise capital through public or private financing or other arrangements. Such financing may not be available on acceptable terms, or at all, and our failure to raise capital when needed could harm our business. Additional equity financing may dilute the interests of our common stockholders, and debt financing, if available, may involve restrictive covenants and
30
could reduce our profitability. If we cannot raise funds on acceptable terms, we may not be able to grow our business or respond to competitive pressures.
Risks Related to Ownership of Our Common Stock
The trading price of our common stock has been and may continue to be volatile.
The trading prices of many newly publicly-traded companies are highly volatile. Since our initial public offering in October 2009 through March 16, 2010, the closing sale price of our common stock as reported by the Nasdaq Global Market has ranged from a low of $10.31 on February 10, 2010 to a high of $15.18 on November 11, 2009.
Certain factors may continue to cause the market price of our common stock to fluctuate, including:
- •
- fluctuations in our quarterly financial results or the quarterly financial results of companies perceived to be similar to
us;
- •
- changes in market valuations of similar companies;
- •
- success of competitive products or services;
- •
- changes in our capital structure, such as future issuances of debt or equity securities;
- •
- announcements by us, our competitors, our clients or our suppliers of significant products or services, contracts,
acquisitions or strategic alliances;
- •
- regulatory developments in the United States or foreign countries;
- •
- litigation involving our company, our general industry or both;
- •
- additions or departures of key personnel;
- •
- investors' general perception of us; and
- •
- changes in general economic, industry and market conditions.
In addition, as a result of the current economic crisis, the trading price of our common stock could decline for reasons unrelated to our business, financial condition or results of operations. The current economic environment has negatively affected demand for our services. If any of the foregoing occurs, it could cause our stock price to fall.
Because a limited number of stockholders will control the majority of the voting power of our common stock, investors in this offering will not be able to determine the outcome of stockholder votes.
Eric P. Lefkofsky, Richard A. Heise, Jr., Bradley A. Keywell, affiliates of the Nazarian family and affiliates of New Enterprise Associates, directly or indirectly, beneficially own and have the ability to exercise voting control over, in the aggregate, 61% of our outstanding common stock. As a result, these stockholders are able to exercise significant control over all matters requiring stockholder approval, including the election of directors, any amendments to our certificate of incorporation and significant corporate transactions. These stockholders may exercise this control even if they are opposed by our other stockholders. Without the consent of these stockholders, we could be delayed or prevented from entering into transactions (including the acquisition of our company by third-parties) that may be viewed as beneficial to us or our other stockholders. In addition, this significant concentration of stock ownership may adversely affect the trading price of our common stock if investors perceive disadvantages in owning stock in a company with controlling stockholders.
31
Our quarterly results are difficult to predict and may vary from quarter to quarter, which may result in our failure to meet the expectations of investors and increased volatility of our stock price.
The continued use of our services by our clients depends, in part, on the business activity of our clients and our ability to meet their cost saving needs, as well as their own changing business conditions. In addition, a significant percentage of our revenue is subject to the discretion of our transactional clients, who may stop using our services at any time, and the transportation industry in which we operate is subject to some degree of seasonal sales fluctuations as shipments generally are lower during and after the winter holiday season because many of our retail clients ship goods and stock inventories prior to the winter holiday season. Therefore, the number, size and profitability of shipments may vary significantly from quarter to quarter. As a result, our quarterly operating results are difficult to predict and may fall below the expectations of current or potential investors in some future quarters, which could lead to a significant decline in the market price of our stock and volatility in our stock price.
If equity research analysts do not publish research or reports about our business or if they issue unfavorable commentary or downgrade our common stock, the price of our common stock could decline.
The trading market for our common stock relies in part on the research and reports that equity research analysts publish about us and our business. We do not control these analysts. The price of our stock could decline if one or more equity analysts downgrade our stock or if those analysts issue other unfavorable commentary or cease publishing reports about us or our business.
We do not currently intend to pay dividends, which may limit the return on your investment in us.
We currently intend to retain all available funds and any future earnings for use in the operation and expansion of our business and do not anticipate paying any cash dividends in the foreseeable future.
If our board of directors authorizes the issuance of preferred stock, holders of our common stock could be diluted and harmed.
Our board of directors has the authority to issue up to 2,500,000 shares of preferred stock in one or more series and to establish the preferred stock's voting powers, preferences and other rights and qualifications without any further vote or action by the stockholders. The issuance of preferred stock could adversely affect the voting power and dividend liquidation rights of the holders of common stock. In addition, the issuance of preferred stock could have the effect of making it more difficult for a third-party to acquire, or discouraging a third-party from acquiring, a majority of our outstanding voting stock or otherwise adversely affect the market price of our common stock. It is possible that we may need, or find it advantageous, to raise capital through the sale of preferred stock in the future.
Item 1B. Unresolved staff comments
None.
32
Our principal executive offices are located in Chicago, Illinois. We also maintain sales offices in Los Angeles, California, Vancouver, Washington, Park City, Utah, Troy, Michigan, Little Rock, Arkansas, Buffalo, Minnesota and Matteson, Illinois. We believe that our facilities are generally suitable to meet our needs for the foreseeable future; however, we will continue to seek additional space as needed to satisfy our growth. We conduct our business from the properties listed below, all of which are leased. The terms and leases vary and have expiration dates ranging from October 31, 2011 to December 1, 2015. As of December 31, 2009, we conducted our business from the following properties:
Location
|
Use | |
|---|---|---|
| Chicago, Illinois | Corporate Headquarters | |
| Matteson, Illinois | Business Development | |
| Los Angeles, California | Business Development | |
| Vancouver, Washington | Business Development | |
| Park City, Utah | Business Development | |
| Troy, Michigan | Business Development | |
| Little Rock, Arkansas | Business Development | |
| Buffalo, Minnesota | Business Development |
We are not party to any legal proceedings that we believe would have a material adverse effect on our business, financial condition or operating results.
33
Item 5. Market for Registrant's Common Equity, Related Stockholder Matters and Issuer Purchases of Equity Securities
Market Information
Our common stock is listed and has been traded on the Nasdaq Global Market under the symbol "ECHO" since October 2, 2009. The following table sets for the high and low closing sales price for our common stock as reported by the Nasdaq Global Market for each of the periods listed.
2009
|
High | Low | |||||
|---|---|---|---|---|---|---|---|
Fourth Quarter (from October 2, 2009) |
$ | 15.18 | $ | 12.05 | |||
2010 |
High |
Low |
|||||
First Quarter (through March 16, 2010) |
$ | 13.66 | $ | 10.31 | |||
Holders
As of March 8, 2010, there were 48 holders of record of our common stock. The holders of our common stock are entitled to one vote per share.
Dividends
We currently do not intend to pay any dividends on our common stock. We intend to retain all available funds and any future earnings for use in the operation and the expansion of our business. Any determination in the future to pay dividends will depend on our financial condition, capital requirements, operating results and other factors deemed relevant by our board of directors, including any contractual or statutory restrictions on our ability to pay dividends.
Recent Sales of Unregistered Securities
None.
Use of Proceeds from Registered Securities
In connection with our initial public offering, we offered and sold 5,700,000 shares of common stock at price of $14.00 per share. The offer and sale of the shares in the initial public offering were registered under the Securities Act of 1933, as amended, pursuant to a registration statement on Form S-1 (File No. 333-150514), which was declared effective by the Securities and Exchange Commission on October 1, 2009. The managing underwriters in this offering were Morgan Stanley & Co. Incorporated, Credit Suisse Securities (USA) LLC, William Blair & Company, L.L.C., Thomas Weisel Partners LLC, Barrington Research Associates, Inc. and Craig-Hallum Capital Group, Inc.
After deducting underwriting discounts and commissions and offering related expenses, our net proceeds from the initial public offering were approximately $68.6 million. In connection with the offering, we paid underwriting discounts and commissions of approximately $5.6 million and paid approximately $5.6 million in offering expenses.
We used a portion of these net proceeds to repay all outstanding principal and accrued interest under our line of credit with JPMorgan Chase Bank, N.A., which bears interest at a rate of either the prime rate or LIBOR plus 2.25% and matured on July 31, 2010 (approximately $14.0 million), and approximately $6.9 million of our net proceeds from the offering to repay all outstanding principal and accrued interest under our term loan payable to EGL Mezzanine LLC, which bore interest at a rate of 13.0% and was set to mature on June 2, 2012, members of which included certain of our directors,
34
officers and stockholders, and which we incurred in connection with our acquisition of RayTrans Distribution Services. In addition to the foregoing purposes, we used approximately $3.5 million of the net proceeds to make required accrued dividend payments to the holders of our Series B and D preferred shares, which holders include certain of our director or entities owned or controlled by them. We plan to invest the remaining proceeds to further expand our sales force, continue to acquire or make strategic investments in complementary businesses and for working capital and other general corporate purposes.
Issuer Purchases of Equity Securities
None.
Item 6. Selected Consolidated Financial Data
The following table presents selected consolidated financial and other data as of and for the periods indicated. The share amounts and per share dollar amounts below give effect to the one-for-two reverse stock split retroactively. You should read the following information together with the more detailed information contained in "Management's Discussion and Analysis of Financial Condition and Results of Operations" and our consolidated financial statements and the accompanying notes.
| |
Years ended December 31, | ||||||||||||||||
|---|---|---|---|---|---|---|---|---|---|---|---|---|---|---|---|---|---|
| |
2005 | 2006 | 2007 | 2008 | 2009 | ||||||||||||
| |
(dollars and shares in thousands, except per share data) |
||||||||||||||||
Consolidated statements of operations data: |
|||||||||||||||||
Revenue |
$ | 7,322 | $ | 33,195 | $ | 95,461 | $ | 202,807 | $ | 259,561 | |||||||
Transportation costs |
6,152 | 27,704 | 75,535 | 159,717 | 203,893 | ||||||||||||
Gross profit |
1,170 | 5,491 | 19,926 | 43,090 | 55,668 | ||||||||||||
Operating expenses: |
|||||||||||||||||
Commissions |
156 | 866 | 4,433 | 11,799 | 15,816 | ||||||||||||
General and administrative |
1,472 | 4,387 | 12,037 | 23,115 | 29,001 | ||||||||||||
Depreciation and amortization |
67 | 691 | 1,845 | 3,231 | 4,991 | ||||||||||||
Total operating expenses |
1,695 | 5,944 | 18,315 | 38,145 | 49,808 | ||||||||||||
Income (loss) from continuing operations |
(525 | ) | (453 | ) | 1,611 | 4,945 | 5,860 | ||||||||||
Other income (expense) |
12 | 201 | 191 | (144 | ) | (1,275 | ) | ||||||||||
Income (loss) before income taxes and discontinued operations |
(513 | ) | (252 | ) | 1,802 | 4,801 | 4,585 | ||||||||||
Income tax benefit (expense) |
— | 220 | (749 | ) | (1,926 | ) | 611 | ||||||||||
Income (loss) before discontinued operations |
(513 | ) | (32 | ) | 1,053 | 2,875 | 5,196 | ||||||||||
Loss from discontinued operations |
— | (214 | ) | — | — | — | |||||||||||
Net income (loss) |
(513 | ) | (246 | ) | 1,053 | 2,875 | 5,196 | ||||||||||
Dividends on preferred shares |
(154 | ) | (749 | ) | (1,054 | ) | (1,054 | ) | (807 | ) | |||||||
Net income (loss) applicable to common stockholders |
$ | (667 | ) | $ | (995 | ) | $ | (1 | ) | $ | 1,821 | $ | 4,389 | ||||
Net income (loss) per share of common stock: |
|||||||||||||||||
Basic |
$ | (0.06 | ) | $ | (0.09 | ) | $ | — | $ | 0.15 | $ | 0.30 | |||||
Diluted |
$ | (0.06 | ) | $ | (0.09 | ) | $ | — | $ | 0.14 | $ | 0.29 | |||||
Shares used in per share calculations: |
|||||||||||||||||
Basic |
10,774 | 11,194 | 11,713 | 12,173 | 14,703 | ||||||||||||
Diluted |
10,774 | 11,194 | 11,713 | 12,817 | 15,089 | ||||||||||||
Unaudited pro forma income tax benefit (expense)(1) |
$ | 205 | $ | (34 | ) | ||||||||||||
Unaudited pro forma net loss(1) |
$ | (308 | ) | $ | (280 | ) | |||||||||||
35
| |
Years ended December 31, | |||||||||||||||
|---|---|---|---|---|---|---|---|---|---|---|---|---|---|---|---|---|
| |
2005 | 2006 | 2007 | 2008 | 2009 | |||||||||||
| |
(dollars and shares in thousands, except per share data) |
|||||||||||||||
Other data: |
||||||||||||||||
Enterprise clients(2) |
12 | 27 | 62 | 92 | 116 | |||||||||||
Transactional clients served in period(3) |
202 | 650 | 4,566 | 11,952 | 15,259 | |||||||||||
Total clients(4) |
214 | 677 | 4,628 | 12,044 | 15,375 | |||||||||||
Employees, agents and independent contractors(5) |
44 | 105 | 344 | 664 | 835 | |||||||||||
- (1)
- Unaudited
pro forma data presented gives effect to our conversion on June 7, 2006 into a corporation as if it occurred at the beginning of the period
presented. Unaudited pro forma income tax benefit (expense) represents a combined federal and state effective tax rate of 40% and does not consider potential tax loss carrybacks, carryforwards or
realizability of deferred tax assets. Unaudited pro forma net loss represents our net loss for the periods presented as adjusted to give effect to the pro forma income tax benefit (expense) prior to
our conversion to a C corporation, as we were not subject to income tax due to our treatment as a partnership for tax purposes.
- (2)
- Reflects
number of enterprise clients on the last day of the applicable period.
- (3)
- Reflects
number of transactional clients served in the applicable period.
- (4)
- Reflects
total number of enterprise clients determined on the last day of the applicable period and number of transactional clients served in the applicable
period.
- (5)
- Reflects number of employees, agents and independent contractors on the last day of the applicable period.
| |
As of December 31, | |||||||||||||||
|---|---|---|---|---|---|---|---|---|---|---|---|---|---|---|---|---|
| |
2005 | 2006 | 2007 | 2008 | 2009 | |||||||||||
| |
(in thousands) |
|||||||||||||||
Consolidated balance sheet data: |
||||||||||||||||
Cash and cash equivalents |
$ | 1,444 | $ | 8,853 | $ | 1,569 | $ | 1,873 | $ | 47,804 | ||||||
Working capital |
2,985 | 7,891 | 3,556 | 3,209 | 65,637 | |||||||||||
Total assets |
5,814 | 17,048 | 27,106 | 45,909 | 132,675 | |||||||||||
Total liabilities |
2,107 | 5,602 | 12,540 | 27,082 | 38,885 | |||||||||||
Series D convertible preferred shares |
— | 17,648 | 18,695 | 19,742 | — | |||||||||||
Cash dividends per common share |
— | — | — | — | — | |||||||||||
Total stockholders' equity (deficit) |
$ | 3,707 | $ | (6,202 | ) | $ | (4,129 | ) | $ | (915 | ) | $ | 93,790 | |||
36
Item 7. Management's Discussion and Analysis of Financial Condition and Results of Operations
The following discussion should be read in conjunction with the consolidated financial statements and accompanying notes and the information contained in this Annual Report on Form 10-K. It contains forward-looking statements that involve risks and uncertainties, and is based on the beliefs of our management, as well as assumptions made by, and information currently available to, our management. Our actual results could differ materially from those anticipated by our management in these forward-looking statements as a result of various factors, including those discussed below and elsewhere in this Annual Report on Form 10-K, particularly under the heading "Risk Factors."
Overview
We are a leading provider of technology enabled transportation and supply chain management services, delivered on a proprietary technology platform serving the transportation and logistics needs of our clients. Our proprietary web-based technology platform compiles and analyzes data from our network of over 24,000 transportation providers to serve our clients' shipping and freight management needs. Our technology platform, composed of web-based software applications and a proprietary database, enables us to identify excess transportation capacity, obtain competitive rates, and execute thousands of shipments every day while providing high levels of service and reliability. We focus primarily on arranging transportation across the major modes, including truckload (TL), less than truck load (LTL) and small parcel, and we also offer inter-modal (which involves moving a shipment by rail and truck), domestic air, expedited and international transportation services.
We procure transportation and provide logistics services for more than 15,600 clients across a wide range of industries, such as manufacturing, construction, consumer products and retail. Our clients fall into two categories, enterprise and transactional. We typically enter into multi-year contracts with our enterprise clients, which are often on an exclusive basis for a specific transportation mode or point of origin. As part of our value proposition, we also provide core logistics services to these clients. We provide transportation and logistics services to our transactional clients on a shipment-by-shipment basis, typically with individual, or spot market, pricing.
Recent Developments
Initial Public Offering
In October 2009, we completed an initial public offering of shares of our common stock. We offered and sold 5,700,000 shares of common stock at a price to the public of $14.00 per share. All 5,700,000 shares were sold by us. The net proceeds to us from the Initial Public Offering (IPO) were $68.6 million, which, in part, we used for dividend payments to certain shareholders, and to repay outstanding indebtedness under our line of credit and loan agreement with certain existing shareholders.
Acquisition of Mountain Logistics, Inc.
On May 17, 2007, we acquired Mountain Logistics, Inc. (which was doing business as Transportation Management Group but now operates under the Echo name), a third-party logistics provider with offices in Park City, Utah and Los Angeles, California. As a result of the acquisition, we believe we have established a significant presence in the West Coast market by gaining over 200 West Coast clients and 43 sales agents. The purchase price was $8.8 million, consisting of $4.3 million cash paid in 2007 and expenses incurred directly related to the acquisition as well as the payment of contingent consideration of $250,000 and $350,000 in 2008 and 2009, respectively, and $3.9 million related to the vesting of 275,000 common shares as certain performance measures were met effective October 1, 2009. The additional purchase price related to the vesting of the common shares was based
37
on the fair market value of the Company's stock at the time of vesting and resulted in additional goodwill.
In addition, the former owners of Mountain Logistics will receive up to an additional aggregate amount of $5.9 million in cash, payable upon the achievement of certain performance measures by or prior to October 31, 2010. As of December 31, 2009, the Company believes it is highly probable that $1.4 million of the $5.9 million will be paid in the first quarter of 2010. Any payment will be recorded as additional goodwill.
Our 2007 results of operations include the results of operations of Mountain Logistics beginning May 1, 2007. In 2006, Mountain Logistics generated revenues of $12.0 million.
Acquisition of Bestway Solutions LLC
On October 15, 2007, we acquired Bestway Solutions LLC, a third-party logistics provider located in Vancouver, Washington. As a result of the acquisition, we believe we have established a Pacific Northwest presence. The purchase price was $1.3 million, consisting of $834,000 in cash, 25,000 shares of restricted common stock (after giving effect to the one-for-two reverse stock split) with a fair value of $214,500 and expenses incurred directly related to the acquisition, as well as the payment of contingent consideration of approximately $101,100 in each of 2008 and 2009.
In addition, the former owners of Bestway will, subject to certain exceptions, receive up to an additional aggregate amount of $101,100 in cash upon the achievement of certain performance measures by or prior to September 30, 2010. Any payment will be recorded as additional goodwill
Our 2007 results of operations include the results of operations of Bestway beginning October 1, 2007. In 2006, Bestway generated revenues of approximately $6.0 million.
Acquisition of RayTrans Distribution Services, Inc.
On June 2, 2009, we acquired substantially all of the assets of RayTrans Distribution Services, Inc., a third-party provider of brokerage services in the commercial trucking market based in Matteson, Illinois. At the time of the acquisition, RayTrans Distribution Services was the primary beneficiary of three variable interest entities, RayTrans Trucking, LLC, Universal Trans, LLC and Wheel-e, LLC. We did not acquire these entities and we did not assume any of their liabilities in connection with our acquisition of RayTrans Distribution Services. These three entities are not considered variable interest entities of ours subsequent to the acquisition. The acquisition consideration for RayTrans Distribution Services consisted of approximately $5.4 million in cash paid in June 2009.
In addition, the former owners of RayTrans Distribution Services, Inc. may receive up to an additional aggregate amount of $6.5 million in cash upon the achievement of certain performance measures by or prior to May 31, 2012. Pursuant to the adoption of ASC Topic 805 effective January 1, 2009, any changes to the contingent consideration obligation will be recorded in selling, general and administrative expenses.
Our 2009 results of operations include the results of operations of RayTrans Distribution Services, Inc. beginning June 1, 2009. In 2008, RayTrans Distribution Services, Inc. generated revenues of $42.7 million.
Revenue
We generate revenue through the sale of transportation and logistics services to our clients. Revenue is recognized when the client's product is delivered by a third-party carrier. Since our Inception, our growth rates have decreased as our revenue has grown. Our revenue was $95.5 million, $202.8 million and $259.6 million for the years ended December 31, 2007, 2008 and 2009, respectively,
38
reflecting growth rates of 188%, 112% and 28%, respectively, as compared to the corresponding prior year.
Our revenue is generated from two different types of clients: enterprise and transactional. Our enterprise accounts typically generate higher dollar amounts and volume than our transactional relationships. We categorize a client as an enterprise client if we have a contract with the client for the provision of services on a recurring basis. Our contracts with enterprise clients typically have a multi-year term and are often exclusive for a certain transportation mode or point of origin. In several cases, we provide substantially all of a client's transportation and logistics requirements. We categorize all other clients as transactional clients. We provide services to our transactional clients on a shipment-by-shipment basis. As of December 31, 2009, we had 116 enterprise clients and, for the year ended December 31, 2009 we served over 15,000 transactional clients. For the year ended December 31, 2009, we entered into contracts with 24 new enterprise clients. For the years ended December 31, 2007, 2008 and 2009, enterprise clients accounted for 56%, 43% and 42% of our revenue, respectively, and transactional clients accounted for 44%, 57% and 58% of our revenue, respectively. We expect to continue to grow both our enterprise and transactional client base in the future, although the rate of growth for each type of client will vary depending on opportunities in the marketplace.
Revenue recognized per shipment will vary depending on the transportation mode, fuel prices, shipment weight and density and mileage of the product shipped. The primary modes of shipment that we transact in are TL, LTL and small parcel. Other transportation modes include inter-modal, domestic air, expedited services and international. Typically, our revenue is lower for an LTL shipment than for a TL shipment, and revenue per shipment is higher for shipments in modes other than TL, LTL and small parcel. Material shifts in the percentage of our revenue by transportation mode could have a significant impact on our revenue growth. In 2009, LTL accounted for 45% of our revenue, TL accounted for 35% of our revenue, small parcel accounted for 7% of our revenue and other transportation modes accounted for 13% of our revenue.
The transportation industry has historically been subject to seasonal sales fluctuations as shipments generally are lower during and after the winter holiday season because many companies ship goods and stock inventories prior to the winter holiday season. While we have experienced some seasonality, differences in our revenue between periods have been driven primarily by growth in our client base.
Transportation costs and net revenue
We act primarily as a service provider to add value and expertise in the procurement and execution of transportation and logistics services for our clients. Our fee structure is primarily variable, although we have entered into a limited number of fixed fee arrangements that represent an insignificant portion of our revenue. Net revenue consists of transportation revenue minus transportation cost. Our transportation costs consists primarily of the direct cost of transportation paid to the carrier.
Net revenue is the primary indicator of our ability to procure services provided by carriers and other third-parties and is considered by management to be the primary measurement of our growth. Although our transportation cost is typically lower for an LTL shipment than for a TL shipment, our net revenue margin is typically higher for an LTL shipment than for a TL shipment. Material shifts in the percentage of our revenue by transportation mode, including small parcel, could have a significant impact on our net revenue. The discussion of results of operations below focuses on changes in our net revenues and expenses as a percentage of net revenue margin. In 2007, 2008 and 2009, our net revenue was $19.9 million, $43.1 million and $55.7 million, respectively, reflecting growth rates of 116% and 29% in 2008 and 2009, respectively, compared to corresponding prior year.
39
Operating expenses
Our costs and expenses excluding transportation costs consist of commissions paid to our sales personnel, general and administrative expenses to run our business and depreciation and amortization.
Commissions paid to our sales personnel, including employees and agents, are a significant component of our operating expenses. These commissions are based on the net revenue we collect from the clients for which they have primary responsibility. In 2007, 2008 and 2009, commission expense was 22.2%, 27.4% and 28.4%, respectively, as a percentage of our net revenue. The percentage of net revenue paid as commissions will vary depending on the type of client, composition of the sales team and mode of transportation. Commission expense, stated as a percentage of net revenue, could increase or decrease in the future depending on the composition of our revenue growth and the relative impact of changes in sales teams and service offerings.
We accrue for commission expense when we recognize the related revenue. Some of our sales personnel receive a monthly advance to provide them with a more consistent income stream. Cash paid to our sales personnel in advance of commissions earned is reflected as a prepaid expense on our balance sheet. As our sales personnel earn commissions, a portion of their commission payment is withheld and offset against their prepaid commission balance, if any.
Our general and administrative expenses, which excludes commission expense, primarily consist of compensation costs for our operations, information systems, finance and administrative support employees. In 2007, 2008 and 2009, our general and administrative expenses were $12.0 million, $23.1 million and $29.0 million, respectively. In 2007, 2008 and 2009, general and administrative expenses as a percentage of net revenue were 60.4%, 53.6% and 52.1%, respectively.
Our depreciation expense is primarily attributable to our depreciation of purchases of computer hardware and software, equipment, furniture and fixtures, and the capitalization of internally developed software. In 2007, 2008 and 2009, depreciation expense was $1.4 million, $2.5 million and $3.9 million, respectively.
Our amortization expense is attributable to our amortization of intangible assets acquired from business combinations, including client relationships, tradenames and non-compete agreements. In 2007, 2008 and 2009, amortization expense was $0.5 million, $0.7 million and $1.1 million, respectively.
Reverse Stock Split and Recapitalization
Prior to our initial public offering, on September 25, 2009, we effectuated a one-for-two reverse stock split of all outstanding shares of our Series A common stock, Series B preferred stock and Series D preferred stock. Immediately following the reverse stock split, we exchanged all outstanding shares of our Series A common stock, Series B preferred stock and Series D preferred stock for newly issued shares of common stock on approximately a one-for-one basis.
Income Taxes
On June 7, 2006, our company completed a conversion pursuant to which Echo Global Logistics, LLC, a limited liability company, converted to Echo Global Logistics, Inc., a corporation. As a limited liability company, we were treated as a partnership for federal income tax purposes. As a result, all items of income, expense, gain and loss of Echo were generally reportable on the tax returns of members of Echo Global Logistics, LLC.
As a result of our conversion, we account for income taxes in accordance with ASC Topic 740 (previously SFAS No. 109, Accounting for Income Taxes), under which deferred assets and liabilities are recognized based upon anticipated future tax consequences attributable to differences between financial statement carrying values of assets and liabilities and their respective tax bases. In connection with our
40
conversion, we used $9.4 million of our net proceeds from the issuance of our Series D preferred stock to redeem certain of our Series A common units. Because we redeemed the units as a limited liability company, the cash distribution was taxable to the members and our tax basis increased resulting in the recognition of a deferred tax asset of $3.8 million, for which we recorded a valuation allowance of $2.0 million and a corresponding net increase to additional paid in capital of $2.0 million. The Company evaluated this valuation allowance as of December 31, 2009 and determined it was more likely than not that the existing deferred tax assets would be fully realized, thus the valuation allowance was reduced to zero with the corresponding income tax benefit recorded to income tax expense in 2009.
Critical Accounting Policies
Revenue Recognition
In accordance with ASC Topic 605-20 (previously Emerging Issues Task Force (EITF) Issue 91-9, Revenue and Expense Recognition for Freight Services in Process), transportation revenue and related transportation costs are recognized when the shipment has been delivered by a third-party carrier. Fee for service revenue is recognized when the services have been rendered. At the time of delivery or rendering of services, as applicable, the Company's obligation to fulfill a transaction is complete and collection of revenue is reasonably assured.
In accordance with ASC Topic 605-45 (previously EITF Issue 99-19, Reporting Revenue Gross as a Principal versus Net as an Agent), the Company generally recognizes revenue on a gross basis, as opposed to a net basis similar to a commission arrangement, because it bears the risks and benefits associated with revenue-generated activities by, among other things: (1) acting as a principal in the transaction; (2) establishing prices; (3) managing all aspects of the shipping process; and (4) taking the risk of loss for collection, delivery, and returns. Certain transactions to provide specific services are recorded at the net amount charged to the client due to the following key factors: (a) the Company does not have latitude in establishing pricing; and (b) the Company has credit risk for only the net revenue earned from its client while the carrier has credit risk for the transportation costs.
Accounts Receivable and Allowance for Doubtful Accounts
Accounts receivable are uncollateralized customer obligations due under normal trade terms. Invoices require payment within 30 to 90 days from the invoice date. Accounts receivable are stated at the amount billed to the customer. Customer account balances with invoices past due 90 days are considered delinquent. The Company generally does not charge interest on past due amounts.
The carrying amount of accounts receivable is reduced by an allowance for doubtful accounts that reflects management's best estimate of amounts that will not be collected. The allowance is based on historical loss experience and any specific risks identified in client collection matters. Accounts receivable are charged off against the allowance for doubtful accounts when it is determined that the receivable is uncollectible.
Goodwill and Other Intangibles
Goodwill represents the excess of purchase price and related costs over the value assigned to the net tangible and identifiable intangible assets of businesses acquired. In accordance with ASC Topic 350 (previously SFAS No. 142, Goodwill and Other Intangible Assets), goodwill is not amortized, but instead is tested for impairment annually, or more frequently if circumstances indicate a possible impairment may exist. The Company evaluates the recoverability of goodwill using a two-step impairment test. For goodwill impairment test purposes, the Company has one reporting unit. In the first step, the fair value for the Company is compared to its carrying value including goodwill. In the case that the fair value is less than the carrying value, a second step is performed that compares the implied fair value of goodwill to the carrying value of the goodwill. The fair value for the implied goodwill is determined
41
based on the difference between the fair value of the reporting unit and the net fair values of the identifiable assets and liabilities excluding goodwill. If the implied fair value of the goodwill is less than the carrying value, the difference is recognized as an impairment. Absent any special circumstances that could require an interim test, the Company has elected to test for goodwill impairment during the fourth quarter of each year. This guidance also requires that intangible assets with finite lives be amortized over their respective estimated useful lives and reviewed for impairment whenever impairment indicators exist in accordance with ASC Topic 360 (previously SFAS No. 144, Accounting for the Impairment or Disposal of Long-Lived Assets). The Company's intangible assets consist of customer relationships, noncompete agreements, and trade names, which are being amortized on the straight-line basis over their estimated weighted-average useful lives of 6 years, 3 years and 3 years, respectively.
Contract Costs
Cost of contracts represents the incremental direct costs incurred related to the acquisition or origination of certain customer contracts. Costs capitalized are amortized over the life of the contracts.
Stock-Based Compensation
The Company accounts for stock-based compensation in accordance with ASC Topic 718 "Compensation—Stock Compensation," which requires all share-based payments to employees, including grants of stock options, to be recognized in the income statement based upon their fair values. Share-based employee compensation costs are recognized as a component of selling, general and administrative expense in the consolidated statements of income. See Note 14—Stock-Based Compensation Plans for a description of the Company's accounting for stock-based compensation plans.
In 2006, we granted 775,000 options at exercise prices ranging from $1.54 to $5.76 per share. The fair value of our common stock for options granted in 2006 was determined by our management contemporaneously and approved by our board of directors. Our management utilized a discounted cash flow method to determine that our common stock had a fair value per share of $0.52 as of March 31, 2006, $1.54 as of June 30, 2006, $2.12 as of September 30, 2006 and $2.16 as of December 31, 2006. Our revenue was $33.2 million in 2006, compared to $7.3 million in 2005, and the increase in the value of our common stock attributable to the growth of our business was reflected accordingly. All options granted in 2006 had exercise prices that were at or above the fair value of our common stock.
We granted 89,250 options during the six months ended June 30, 2007 at exercise prices ranging from $2.16 to $7.00 per share, which were at or above the fair value of our common stock. We granted 333,500 options between July 1, 2007 and September 30, 2007 at exercise prices ranging from $8.00 to $8.10 per share, which was at or above the fair value of our common stock. The fair values of our common stock for options granted from January 1, 2007 to September 30, 2007 were determined through the contemporaneous application of a discounted cash flow method performed by our management and approved by our board of directors. We did not obtain contemporaneous valuations by an unrelated valuation specialist because our internal resources had the necessary knowledge to perform the valuation utilizing a methodology consistent with the AICPA Guide, Valuation of Privately-Held Company Equity Securities. In November 2007, a contemporaneous valuation of our common stock was performed using a discounted cash flow debt-free method under the income approach to determine that the fair value of our common stock was $8.80 per share. During the fourth quarter of 2007, we granted 115,000 options at an exercise price of $8.80 per share. Our revenue was $95.5 million in 2007, compared to $33.2 million in 2006, and the increase in the value of our common stock attributable to the growth of our business was reflected accordingly.
In the three months ended March 31, 2008, we granted 15,000 options at an exercise price ranging from $10.28 to $20.00 per share, which was above the fair value of our common stock. Management
42
determined the fair value of our common stock contemporaneously through the application of a discounted cash flow methodology.
In the three months ended June 30, 2008, we granted 105,000 options at an exercise price of $11.72 per share, of which 35,000 vested immediately, 62,500 will vest ratably over five years, and 7,500 will vest ratably over four years. The $11.72 per share exercise price was equal to the fair value of our common stock as determined contemporaneously by management through the application of a discounted cash flow valuation methodology. In accordance with SFAS No. 123(R), we used the Black-Scholes-Merton option valuation model to determine that compensation expense of $473,450 will be recorded for these options. Of that amount, $123,400 has been recognized as expense at the date of grant for the options that vested immediately, and the remaining $350,050 will be expensed ratably over the remaining portion of the relevant vesting period.
In the three months ended September 30, 2008, we granted 46,500 options at an exercise price of $13.58 per share, of which no shares vested immediately, 12,500 will vest ratably over four years, 9,000 will vest ratably over three years and 25,000 will vest ratably over fifteen months. The $13.58 per share exercise price was equal to the fair value of our common stock as determined contemporaneously by management through the application of a discounted cash flow valuation methodology. In accordance with SFAS No. 123(R), we used the Black-Scholes-Merton option valuation model to determine that compensation expense of $202,900 will be recorded for these options over the relevant vesting period.
In the three months ended December 31, 2008, we granted 218,700 options at an exercise price of $10.18 per share, of which no shares vested immediately, 75,000 will vest ratably over four years, 30,000 will vest ratably over three years and 113,700 will vest ratably over five years. The $10.18 per share exercise price was equal to the fair value of our common stock as determined contemporaneously by management through the application of a discounted cash flow valuation methodology. In accordance with SFAS No. 123(R), we used the Black-Scholes-Merton option valuation model to determine that compensation expense of $332,604 will be recorded for these options over the relevant vesting period.
In the six months ended June 30, 2009, we granted 215,000 options at exercise prices ranging from $6.84 to $6.94 per share, of which no shares vested immediately, 125,000 will vest ratably over 4.5 years and 90,000 will vest ratably over four years. The range of exercise prices was equal to the fair value of our common stock as determined contemporaneously by management through the application of a discounted cash flow valuation methodology. In accordance with SFAS No. 123(R), we used the Black-Scholes-Merton option valuation model to determine that compensation expense of $628,300 will be recorded for these options over the relevant vesting period.
We did not obtain a contemporaneous valuation by an unrelated valuation specialist during 2008 and 2009 because our internal resources had the necessary knowledge to perform the valuation utilizing a methodology consistent with the AICPA Guide, Valuation of Privately-Held Company Equity Securities.
In 2007, we granted options with exercise prices ranging from $2.16 to $8.80 per share. We determined that the fair value of our common stock increased from $2.16 to $8.80 per share in 2007. The reasons for this increase are as follows:
In the fourth quarter of 2006, the following significant events occurred which had an effect on the fair value of our common stock in 2007: (1) Samuel K. Skinner, the former Secretary of Transportation and Chief of Staff of the United States of America, was appointed as our Chairman, (2) Douglas R. Waggoner, former Chief Executive Officer of USF Bestway, was appointed as our Chief Executive Officer, (3) we launched our transactional call center and (4) we signed five new enterprise accounts.
In the first quarter of 2007, the following significant events occurred: (1) the total number of enterprise clients increased by seven, (2) we launched our upgraded technolgy platform, Optimizer, which formed the basis of the back office software application today referred to as the ETM technology platform, and (3) we unveiled our EchoTrak client web portal, which allowed us to deploy the
43
application to thousands of external users via the internet and also dramatically reduced internal administrative costs associated with supporting our enterprise clients.
In the second quarter of 2007, the following significant events occurred: (1) the total number of enterprise clients increased by eight, and (2) we completed our acquisition of Mountain Logistics, Inc., which provided us with access to approximately 200 clients, 43 sales agents and a presence in the West Coast market.
In the third quarter of 2007, the following significant events occurred: (1) the total number of enterprise clients increased by eight, (2) we completed our acquisition of Bestway, which provided us access to approximately 100 clients and a presence in the Pacific Northwest, and (3) the transactional call center was reconfigured into a regional structure, and we increased our staffing plan to approximately 50 new sales representatives per quarter.
In the fourth quarter of 2007, the following significant events occurred: (1) the total number of enterprise clients increased by 12, (2) we released EchoTrak 2.0, which included significant enhancements to our pricing engine allowing us to scale more rapidly by offering an improved LTL pricing interface, and (3) we engaged investment bankers to initiate the initial public offering process and began drafting our registration statement.
In the first three quarters of 2008, the following significant events occurred: (1) the total number of enterprise clients increased by 34, (2) we hired approximately 170 new sales representatives in our transactional call center, and (3) we had more than doubled our average shipments per month from the previous year. As a result of these factors, the fair value of our common stock rose to a high of $13.58 per share.
In the fourth quarter of 2008, there was a significant decline in the demand for transportation services in the economy. As a result, our forecast for 2009 and beyond was reduced from previously estimated results, thus reducing the fair value of our common stock to $6.84 per share by the end of the year.
In the first six months of 2009, the following significant events occurred: (1) the total number of enterprise clients increased by 15, and (2) we increased productivity of our existing transactional call center. As a result of these factors, the fair value of our common stock rose to $6.94 per share.
We believe that the per share fair value of our option grants increased from $6.94 as of June 30, 2009 to $14.00, the initial public offering price, as a result of the following developments, among others:
- •
- Our revenue increased by $11.2 million, or 22.8%, to $60.3 million during the three months ended
June 30, 2009 from $49.1 million during the three months ended March 31, 2009. This revenue increase followed two consecutive quarters of revenue declines;
- •
- Our operating income increased by $1.2 million, or 988%, to $1.3 million during the three months ended
June 30, 2009 from $0.1 million during the three months ended March 31, 2009. This increase in operating income followed two consecutive quarters of operating income declines;
- •
- Since June 30, 2009, the probability of our initial public offering has increased, which would allow us to reduce
our debt and continue to invest in our business;
- •
- Since June 30, 2009, we have stopped applying a 5% lack of marketability discount to our enterprise value because
the probability of our initial public offering has increased;
- •
- On June 2, 2009, we acquired RayTrans Distribution Services, a non-asset based logistics provider with offices in Matteson, Illinois. As a result of the acquisition, we expanded our presence in the flatbed, over-sized, auto-haul and unrefrigerated, or dry-van, brokerage services.
44
- •
- On July 15, 2009, we acquired Freight Management Inc., a non-asset based logistics provider with
offices in Minnesota. As a result of the acquisition, we expanded our geographical presence and added 500 new transactional clients and 15 new sales agents;
- •
- Since June 30, 2009, we have added five new enterprise clients and 6,769 new transactional clients; and
- •
- Since June 30, 2009, we have added 63 new sales representatives and 43 new sales agents.
We also added approximately 400 transactional clients, which expands our customer base and presents opportunities to market our broader range of transportation management services;
Determining the fair value of our common stock requires making complex and subjective judgments. The discounted cash flow method values the business by discounting future available cash flows to present value at an approximate rate of return. The cash flows are determined using forecasts of revenue, net income and debt-free future cash flow. Our revenue forecasts for 2007 and the first three quarters of 2008 were based on expected annual growth rates ranging from 20% to 75%. In light of the significant changes in the economic environment during the fourth quarter of 2008 and the first six months of 2009, our revenue forecasts for the fourth quarter of 2008 and the first six months of 2009 were based on expected annual growth rates ranging from 15% to 38%. The assumptions underlying the forecasts were consistent with our business plan. We applied a discount rate of 20% in 2007, 2008 and the first six months of 2009 to calculate the present value of our future available cash flows, which we determined through utilization of the Capital Asset Pricing Model for companies in the "expansion" stage of development. Through the first half of 2009, we also applied a 5% lack of marketability discount to our enterprise value, which took into account that investments in private companies are less liquid than similar investments in public companies. The resulting value was allocated to our common stock outstanding. There is inherent uncertainty in all of these estimates.
Results of Operations
The following table sets forth our consolidated statements of income data for the periods presented in both thousands of dollars and as a percentage of our net revenue:
| |
Years Ended December 31, | |||||||||||
|---|---|---|---|---|---|---|---|---|---|---|---|---|
| |
2007 | 2008 | 2009 | |||||||||
Consolidated statements of operations data: |
||||||||||||
Revenue |
$ | 95,461 | $ | 202,807 | $ | 259,561 | ||||||
Transportation costs |
75,535 | 159,717 | $ | 203,893 | ||||||||
Net revenue |
$ | 19,926 | $ | 43,090 | $ | 55,668 | ||||||
Operating expenses: |
||||||||||||
Commissions |
4,433 | 11,799 | 15,816 | |||||||||
General and administrative expenses |
12,037 | 23,115 | 29,001 | |||||||||
Depreciation and amortization |
1,845 | 3,231 | 4,991 | |||||||||
Total operating expenses |
18,315 | 38,145 | 49,808 | |||||||||
Income from operations |
$ | 1,611 | $ | 4,945 | $ | 5,860 | ||||||
Stated as a percentage of net revenue: |
||||||||||||
Net revenue |
100.0 | % | 100.0 | % | 100.0 | % | ||||||
Operating expenses: |
||||||||||||
Commissions |
22.2 | % | 27.4 | % | 28.4 | % | ||||||
General and administrative expenses |
60.4 | % | 53.6 | % | 52.1 | % | ||||||
Depreciation and amortization |
9.3 | % | 7.5 | % | 9.0 | % | ||||||
Total operating expenses |
91.9 | % | 88.5 | % | 89.5 | % | ||||||
Income from operations |
8.1 | % | 11.5 | % | 10.5 | % | ||||||
45
Comparison of years ended December 31, 2009 and 2008
Revenue
Our revenue increased by $56.8 million, or 28.0%, to $259.6 million in 2009 from $202.8 million in 2008. The increase was attributable to the increase in the number of our clients, the total number of shipments executed on behalf of, and services provided to these clients. This was partially offset by a decrease in the transportation rates due to pricing declines caused by a weaker economy. In addition, $14.4 million of revenue was generated in 2009 from the RayTrans Distribution Services acquisition.
Our revenue from enterprise clients increased by $21.7 million, or 24.8%, to $109.1 million in 2009 from $87.4 million in 2008, resulting from an increase in the number of enterprise clients and shipments executed and services provided. As we increased our number of transactional clients, our percentage of revenue from enterprise clients decreased to 42% of our revenue in 2009 from 43% of our revenue in 2008. As of December 31, 2009, we had 116 enterprise clients under contract, which was an increase of 24, compared to 92 enterprise clients under contract as of December 31, 2008. Our shipment volume and revenue per enterprise client decreased in 2009 due to the overall domestic economic climate.
Our revenue from transactional clients increased by $35.1 million, or 30.4%, to $150.5 million in 2009 from $115.4 million in 2008. The growth in revenue from transactional clients during this period was driven by the increase in the number of our transactional clients due to the addition of transactional sales representatives and sales agents, including those acquired in connection with the acquisition of RayTrans Distribution Services. Our percentage of revenue from transactional clients increased to 58% of our revenue in 2009 from 57% of our revenue in 2008. We served over 15,000 transactional in 2009, an increase of approximately 3,000 compared to the 12,000 transactional clients served in 2008.
Transportation costs
Our transportation costs increased by $44.2 million, or 27.7%, to $203.9 million in 2009 from $159.7 million in 2008. The growth in the total number of shipments executed on behalf of our clients accounted for most of the increase in our transportation costs during this period. Our transportation costs as a percentage of revenue decreased to 78.6% in 2009 from 78.8% in 2008.
Net revenue
Net revenue increased by $12.6 million, or 29.2%, to $55.7 million in 2009 from $43.1 million in 2008. The growth in the total number of shipments executed on behalf of our clients accounted for most of the increase in our net revenue during this period. The remaining increase in net revenue was the result of the $2.8 million generated from the RayTrans Distribution Services acquisition. Net revenue margins increased to 21.4% in 2009 from 21.2% in 2008. The increase in net revenue margins was the result of our ability to negotiate more favorable terms on our shipments and an increase in our transactional sales, which typically have higher net revenue margins.
Operating expenses
Commission expense increased by $4.0 million, or 33.9%, to $15.8 million in 2009 from $11.8 million in 2008. This increase is attributable to the increase in net revenue.
General and administrative expenses increased by $5.9 million, or 25.5%, to $29.0 million in 2009 from $23.1 million in 2008. The increase is primarily the result of hiring personnel to support our growth. As a percentage of net revenue, general and administrative expenses decreased to 52.1% in 2009 from 53.6% in 2008. The decrease, as a percentage of net revenue, reflects our ability to add
46
clients and sales personnel in order to increase our net revenue without the same corresponding increase in our general and administrative expenses.
Depreciation and amortization
Depreciation expense increased by $1.4 million, or 55.9%, to $3.9 million in 2009 from $2.5 million in 2008. The increase in depreciation expense is primarily attributable to purchases of computer hardware and software, equipment, furniture and fixtures, and the capitalization of internally developed software. Amortization expense increased by $0.4 million, or 49.4%, to $1.1 million in 2009 from $0.7 million in 2008. The increase in amortization expense the result of the intangibles acquired in the RayTrans and FMI acquisitions completed in 2009.
Income from operations
Income from operations increased by $1.0 million to $5.9 million in 2009 from $4.9 million in 2008. The increase in income from operations is attributable to the increase in net revenue in excess of the increase in operating expenses, due to improved leverage gained through the growth of our business.
Other expense and income tax
Other expense increased to $1.3 million in 2009 from $0.1 million in 2008. The increase is due to interest expense of approximately $0.8 million related to additional borrowings on our line of credit during and the subordinated debt agreement entered into in 2009. In addition, there was a $200,000 increase in other expense related to miscellaneous tax expenses.
Provision for income taxes decreased by $2.5 million to a benefit of $0.6 million in 2009 from income tax expense of $1.9 million in 2008. The decrease was the result of the reversal of the $2.0 million valuation allowance recorded initially in June 2006. Periodically, we review the continuing need for the valuation allowance based on the factors existing at the time of review. We evaluated this valuation allowance as of December 31, 2009 and determined that the full valuation allowance is no longer needed. In addition, the decrease was the result of the impact of elections regarding research and development tax credits.
Net Income
Net income increased by $2.2 million to $5.2 million in 2009 from $2.9 million in 2008 related to the items previously discussed.
Comparison of years ended December 31, 2008 and 2007
Revenue
Our revenue increased by $107.3 million, or 112%, to $202.8 million in 2008 from $95.5 million in 2007. The increase in the number of our clients, and the total number of shipments executed on behalf of, and services provided to, these clients, accounted for most of our revenue growth during this period. Our revenue from enterprise clients increased by $34.2 million, or 64%, to $87.4 million in 2008 from $53.2 million in 2007. The increase in the number of our enterprise clients, and the total number of shipments executed on behalf of, and services provided to, these clients, accounted for our enterprise revenue growth during this period. Our percentage of revenue from enterprise clients decreased to 43% in 2008 from 56% in 2007 as we increased the number of our transactional clients. As of December 31, 2007 and 2008, we had 62 and 92 enterprise clients, respectively, or an increase in the total number of our enterprise clients by 30 in 2008.
Our revenue from transactional clients increased by $73.1 million, or 173%, to $115.4 million in 2008 from $42.3 million in 2007. The growth in revenue from transactional clients during this period
47
was driven by the increase in the total number of our transactional clients due to the addition of transactional sales representatives and sales agents. Our percentage of revenue from transactional clients increased to 57% in 2008 from 44% in 2007. In 2007 and 2008, we served 4,566 and 11,952 transactional clients, respectively, or an increase in the total number of our transactional clients by 7,386 in 2008.
Transportation costs
Our transportation costs increased by $84.2 million, or 111%, to $159.7 million in 2008 from $75.5 million in 2007. The growth in the total number of shipments executed on behalf of our clients accounted for most of the increase in our transportation costs during this period. Our transportation costs as a percentage of revenue decreased to 78.8% in 2008 from 79.1% in 2007. The improvement as a percentage of revenue is primarily due to a higher percentage of revenue from our transactional clients. Our transactional clients have typically given us more LTL volume than TL volume, and typically the transportation cost per shipment is lower for LTL than TL.
Gross profit
Gross profit increased by $23.2 million, or 116%, to $43.1 million in 2008 from $19.9 million in 2007. The growth in the total number of shipments executed on behalf of our clients accounted for most of the increase in our gross profit during this period. Gross profit margins increased to 21.2% in 2008 from 20.9% in 2007. The increase in gross profit margins was the result of our ability to negotiate more favorable terms on our shipments and an increase in our transactional sales, which typically have higher gross profit margins.
Operating expenses
Commission expense increased by $7.4 million, or 166%, to $11.8 million in 2008 from $4.4 million in 2007. As a percentage of gross profit, commission expense increased to 27.4% in 2008 from 22.2% in 2007. The increase in commission expense as a percentage of gross profit in 2008 is partially attributable to the significant growth of our transactional sales during that time, which typically have higher commission rates. The increase is also attributable to our transition from early stage reliance on senior management relationships, with respect to which we generally do not pay commissions, to reliance on a dedicated sales force, to whom we do pay commissions.
General and administrative expenses increased by $11.1 million, or 92.0%, to $23.1 million in 2008 from $12.0 million in 2007. The increase is primarily the result of hiring personnel to support our growth. As a percentage of gross profit, general and administrative expenses decreased to 53.6% in 2008 from 60.4% in 2007. The decrease, as a percentage of gross profit, reflects our ability to add clients and sales personnel in order to increase our gross profit without incurring a corresponding increase in our general and administrative expenses. Stock-based compensation expense increased by $303,950, or 94%, to $626,994 in 2008 from $323,044 in 2007, due to additional stock options we granted in 2008.
Depreciation and amortization
Depreciation expense increased by $1.1 million, or 84.4%, to $2.5 million in 2008 from $1.4 million in 2007. The increase in depreciation expense is primarily attributable to purchases of computer hardware and software, equipment, furniture and fixtures, and the capitalization of internally developed software. Amortization expense from intangible assets increased by $0.2 million in 2008 due to the acquisition of intangible assets of Mountain Logistics in May 2007 and Bestway in October 2007. In connection with the Mountain Logistics acquisition, we acquired intangible assets, including client relationships and non-compete agreements, with a value of $3.0 million, which are being amortized on
48
a straight-line basis over their applicable useful lives. In connection with the Bestway acquisition, we acquired intangible assets, consisting of client relationships with a value of $0.4 million, which are being amortized on a straight-line basis over their applicable useful lives.
Income from operations
Income from operations increased by $3.3 million, or 207%, to $4.9 million in 2008 from $1.6 million in 2007. The increase in income from operations resulted from an increase in gross profit partially offset by an increase in operating expenses.
Other income and expense and income tax
Other income and expense decreased by $334,566, to an expense of $143,871 in 2008 from other income of $190,695 in 2007. The decrease is due to the additional borrowings on our line of credit during 2008. Income tax expense increased $1.2 million to $1.9 million in 2008 from $0.7 million in 2007. Our effective tax rate was approximately 40% in both 2007 and 2008.
Net income
Net income increased by $1.8 million, or 173%, to $2.9 million in 2008 from $1.1 million in 2007.
Quarterly Results of Operations
The following table represents our unaudited statement of operations data for our most recent eight fiscal quarters. You should read the following table in conjunction with our consolidated financial statements and related notes appearing elsewhere in this Annual Report on Form 10-K. The results of operations of any quarter are not necessarily indicative of the results that may be expected for any future period. The per share dollar amounts below give effect to the one-for-two reverse stock split retroactively for all periods presented.
| |
Mar. 31, 2008 |
June 30, 2008 |
Sept. 30, 2008 |
Dec. 31, 2008 |
Mar. 31, 2009 |
June 30, 2009 |
Sept. 30, 2009 |
Dec. 31, 2009 |
|||||||||||||||||
|---|---|---|---|---|---|---|---|---|---|---|---|---|---|---|---|---|---|---|---|---|---|---|---|---|---|
| |
(in thousands, except per share data) |
||||||||||||||||||||||||
Revenue |
$ | 38,929 | $ | 50,936 | $ | 58,338 | $ | 54,604 | $ | 49,064 | $ | 60,290 | $ | 70,168 | $ | 80,039 | |||||||||
Net revenue |
8,101 | 10,833 | 12,301 | 11,855 | 11,014 | 13,240 | 15,443 | 15,971 | |||||||||||||||||
Operating Income |
718 | 1,860 | 1,287 | 1,080 | 122 | 1,328 | 2,333 | 2,076 | |||||||||||||||||
Net income |
421 | 1,103 | 553 | 799 | 28 | 691 | 1,299 | 3,178 | |||||||||||||||||
Net income (loss) applicable to common stockholders |
158 | 840 | 288 | 534 | (237 | ) | 429 | 1,034 | 3,164 | ||||||||||||||||
Net income (loss) per share of common stock: |
|||||||||||||||||||||||||
Basic |
$ | 0.01 | $ | 0.07 | $ | 0.02 | $ | 0.04 | $ | (0.02 | ) | $ | 0.03 | $ | 0.08 | $ | 0.15 | ||||||||
Diluted |
$ | 0.01 | $ | 0.07 | $ | 0.02 | $ | 0.04 | $ | (0.02 | ) | $ | 0.03 | $ | 0.08 | $ | 0.15 | ||||||||
Impact of Inflation
We believe that our results of operations are not materially impacted by moderate changes in the inflation rate. Inflation and changing prices did not have a material impact on our operations in 2007, 2008 and 2009.
Liquidity and Capital Resources
As of December 31, 2009, we had $47.8 million in cash and cash equivalents, $65.9 million in working capital and $20.0 million available under our credit facility.
49
Cash provided by (used in) operating activities
For the year ended December 31, 2009, $5.6 million of cash was used in operating activities, representing a decrease of $7.3 million compared to the year ended December 31, 2008. In the year ended December 31, 2009, we generated $5.2 million of operating cash flow from net income, as compared to $2.9 million for the year ended December 31, 2008, or an increase of $2.3 million. This cash flow generation was offset by a change in net current assets of $15.5 million, which was primarily attributable to increases in accounts receivable and prepaid expenses, offset in part by an increase in accounts payable. This increase in net current assets was attributable to the growth in our business. In the year ended December 31, 2008, the increase in net current assets was $6.9 million. The higher increase in cash utilized due to changes in net current assets of $8.6 million in the year ended December 31, 2009 was due to the settlement and payment of a disputed liability which resulted in a $1.7 million reduction in accounts payable as well as an acceleration of the timing of payments made to our vendors in an effort to improve their cash flow in response to the overall slowdown in the economy.
Cash used in investing activities
Cash used in investing activities was $11.5 million and $5.1 million during the years ended December 31, 2009 and 2008, respectively. The primary investing activities during these periods were acquisition related payments, the procurement of computer hardware and software and the internal development of computer software. During the year ended December 31, 2009, we used $6.8 million for new acquisitions, and paid a $0.4 million earn-out payment to the former owners of Mountain Logistics.
Cash provided by financing activities
During the year ended December 31, 2009, net cash provided by financing activities was $63.0 million compared to $3.7 million during the year ended December 31, 2008. This was primarily attributable to the $74.2 million in cash generated from the initial public offering completed in October 2009, offset by public offering costs paid of $2.7 million and dividends paid to preferred shareholders of $3.5 million. In addition, we paid $5.0 million related to our outstanding line of credit.
Credit facility
As of December 31 2009, we had no amounts outstanding on a $20.0 million line of credit with JPMorgan Chase Bank, N.A., which was due to expire on July 31, 2010. Any outstanding borrowings are collateralized by substantially all of our assets. The maximum amount outstanding under our line of credit cannot exceed 80% of the book value of our eligible accounts receivable. Our line of credit contains limitations on our ability to incur indebtedness, create liens and make certain investments. Interest on the line of credit is payable monthly at an interest rate equal to either: (1) the prime rate or (2) LIBOR plus 2.25%. We have discretion in determining if specific advances against the line of credit are drawn down as a prime rate advance or a LIBOR advance. The terms of the credit line include various covenants, including covenants that require us to maintain a maximum leverage ratio and a minimum interest coverage ratio. As of December 31, 2009, we were not in violation of any of these various covenants.
Term loan
In June 2009, we entered into a $7.5 million term loan payable to EGL Mezzanine LLC, members of which include certain of our directors, officers and stockholders. The term loan, which was amended and restated on August 26, 2009, requires 36 monthly principal and interest payments of $0.25 million, matures on September 2, 2012 and bears interest at a rate of 13.0% per year. The proceeds from
50
borrowings under the term loan were used for working capital purposes and to fund the acquisition of substantially all of the assets of RayTrans Distribution Services. The term loan was paid in full in October 2009. Early termination of the loan required an early termination fee of approximately $300,000.
Anticipated uses of cash
Our priority is to continue to grow our revenue and net revenue. We anticipate that our operating expenses and planned expenditures will constitute a material use of cash, and we expect to use available cash to expand our sales force, to enhance our technology, to acquire or make strategic investments in complementary businesses and for working capital and other general corporate purposes. We also expect to use available cash to make approximately $17.0 million of potential earn-out payments due in connection with our acquisitions. We currently expect to use up to $6.0 million for capital expenditures through the end of 2010. We also expect that we will use up to $10.0 million through the end of 2010 to fund working capital requirements. We expect the use of cash for working capital purposes will be offset by the cash flow generated from operating earnings during this period.
Historically, our average accounts receivable lifecycle has been longer than our average accounts payable lifecycle, meaning that we have used cash to pay carriers in advance of collecting from our clients. We elect to provide this benefit to foster strong relationships with our clients and carriers. As our business grows, we expect this use of cash to continue. The amount of cash we use will depend on the growth of our business.
Off-Balance Sheet Arrangements
We do not have any off-balance sheet arrangements.
Contractual Obligations
As of December 31, 2009, we had the following contractual obligations:
| |
Total | Less than 1 year |
1-3 years | 3-5 years | More than 5 years |
|||||||||||
|---|---|---|---|---|---|---|---|---|---|---|---|---|---|---|---|---|
Capital lease |
$ | 787 | $ | 343 | $ | 444 | $ | — | $ | — | ||||||
Operating lease |
11,927 | 2,223 | 4,495 | 3,826 | 1,383 | |||||||||||
Contingent consideration obligations(1) |
17,034 | 6,117 | 8,834 | 2,083 | — | |||||||||||
Total |
$ | 29,748 | $ | 8,683 | $ | 13,773 | $ | 5,909 | $ | 1,383 | ||||||
- (1)
- Amounts relate to contingent consideration for the Mountain Logistics, Inc., Bestway Solutions, LLC, RayTrans Distribution Services, Inc. and Freight Management, Inc. acquisitions.
Recent Accounting Pronouncements
In December 2007, the Financial Accounting Standards Board (FASB) issued ASC Topic 810 (previously Statement of Financial Accounting Standards (SFAS) No. 160, Noncontrolling Interests in Consolidated Financial Statements, an amendment of ARB No. 51, Consolidated Financial Statements). The guidance establishes accounting and reporting guidance for a noncontrolling ownership interest in a subsidiary and deconsolidation of a subsidiary. The standard requires that a noncontrolling ownership interest in a subsidiary be reported as equity in the consolidated statement of financial position and any related net income attributable to the parent be presented on the face of the consolidated statement of income. The guidance is effective as of the beginning of an entity's first fiscal year that begins after December 15, 2008. The Company's adoption of this guidance on January 1, 2009 had no effect on the consolidated financial statements.
51
In December 2007, the FASB issued ASC Topic 805 (previously SFAS No. 141 (revised 2007), Business Combinations. which replaces SFAS No. 141, Business Combinations), and establishes principles and requirements for how an acquirer: (1) recognizes and measures in its financial statements the identifiable assets acquired, liabilities assumed, and any noncontrolling interest in the acquiree; (2) recognizes and measures the goodwill acquired in a business combination or gain from a bargain purchase; and (3) determines what information to disclose. The guidance is effective for business combinations in which the acquisition date is in the first fiscal year after December 15, 2008. The Company adopted the guidance on January 1, 2009, and has applied this to the acquisitions completed in 2009.
In April 2008, the FASB issued ASC Topic 350 (previously FSP No. 142-3, Determination of the Useful Life of Intangible Assets). This guidance amends the factors an entity should consider in developing renewal or extension assumptions used in determining the useful life of recognized intangible assets under the guidance. This new guidance applies prospectively to intangible assets that are acquired individually or with a group of other assets in business combinations and assets acquisitions. The guidance is effective for financial statements issued for fiscal years and interim period beginning after December 15, 2008. The Company adoption of the guidance on January 1, 2009 had no effect on the consolidated financial statements.
In September 2006, the FASB issued ASC Topic 820 (previously SFAS No. 157, Fair Value Measurements). This guidance defines fair value, establishes a framework for measuring fair value in generally accepted accounting principles, and expands disclosures about fair value measurements. This Statement applies under other accounting pronouncements that require or permit fair value measurements, the FASB having previously concluded in those accounting pronouncements that fair value is the relevant measurement attribute. Accordingly, this Statement does not require any new fair value measurements. The guidance is effective for financial statements issued for fiscal years beginning after November 15, 2007, and interim periods within those fiscal years. In accordance with this interpretation, the Company adopted the guidance with respect to its financial assets and liabilities that are measured at fair value within the financial statements as of January 1, 2008. The adoption of the guidance did not have a material impact on the Company's fair value measurements. As of January 1, 2009 the Company adopted the guidance for all nonfinancial assets and nonfinancial liabilities. There was no impact on the Company's consolidated financial statements upon adoption.
In October 2008, the FASB issued ASC Topic 820-10 (previously FSP 157-3, Determining the Fair Value of a Financial Assets When the Market for That Asset is Not Active). This position clarifies the application of the guidance in a market that is not active and addresses application issues such as the use of internal assumptions when relevant observable data does not exist, the use of observable market information when the market is not active, and the use of market quotes when assessing the relevance of observable and unobservable data. The position is effective for all periods presented in accordance with Topic 820. The guidance is effective immediately and did not have an impact on the Company upon adoption.
In May 2009, the FASB issued ASC Topic 855 (previously SFA No. 165, "Subsequent Events" ("SFAS 165"). The guidance sets forth the period after the balance sheet date during which management of a reporting entity should evaluate events or transactions that may occur for potential recognition or disclosure in the financial statements, the circumstances under which an entity should recognize events or transactions occurring after the balance sheet date in its financial statements, and the disclosures that an entity should make about events or transactions that occurred after the balance sheet date. In February 2010, the FASB issued Accounting Standards Update ("ASU") No. 2010-09 to amend ASC 855 which applies with immediate effect. The ASU removes the requirement to disclose the date through which subsequent events were evaluated in both originally issued and reissued financial statements for SEC Filers.
52
In June 2009, the FASB issued ASC Topic 105 (previously SFAS No. 168, The FASB Accounting Standards Codification and the Hierarchy of Generally Accepted Accounting Principles—a replacement of FASB Statement No. 162 (SFAS 168). The guidance stipulates the FASB Accounting Standards Codification is the source of authoritative U.S. GAAP recognized by the FASB to be applied by nongovernmental entities. The guidance is effective for interim and annual periods ending after September 15, 2009. In conjunction with the issuance of the guidance, the SEC issued interpretive guidance Final Rule 80 (FR-80) regarding FASB's Accounting Standards Codification. Under FR-80, the SEC clarified that the ASC is not the authoritative source for SEC guidance and that the ASC does not supersede any SEC rules or regulations. Further, any references within the SEC rules and staff guidance to specific standards under U.S. GAAP should be understood to mean the corresponding reference in the ASC. FR-80 is also effective for interim and annual periods ending after September 15, 2009. The adoption of these pronouncements did not have a material impact on the Company's consolidated results of operations and financial condition. The Company began using the FASB Accounting Standards Codification as its source of authoritative U.S. GAAP beginning with the third quarter ending September 30, 2009.
In October 2009, the FASB issued ASC Topic 605 (previously ASU No. 2009-13, Multiple Deliverable Revenue Arrangements—a consensus of the FASB Emerging Issues Task Force (ASU 2009-13)). The guidance addresses the accounting for multiple-deliverable arrangements to enable vendors to account for products or services (deliverables) separately rather than as a combined unit. The guidance is effective prospectively for revenue arrangements entered into or materially modified in fiscal years beginning on or after June 15, 2010, with early adoption permitted. The Company is currently evaluating the impact that the adoption of this guidance may have on the Company's consolidated financial statements.
In January 2010, the FASB issued ASC 820 (previously "Improving Disclosures about Fair Value Measurements" (ASU 2010-06) . This guidance improves disclosures originally required under SFAS No. 157. ASU 2010-16 is effective for interim and annual periods beginning after December 15, 2009, except for the disclosures about purchases, sales, issuances and settlements in the roll forward of activity in Level 3 fair value measurements. Those disclosures are effective for fiscal years beginning after December 15, 2010, and for interim periods within those years. The Company is currently evaluating the impact that the adoption of this guidance may have on the Company's consolidated financial statements.
Item 7A. Quantitative and Qualitative Disclosures About Market Risk
Commodity Risk
We pass through increases in fuel prices to our clients. As a result, we believe that there is no material risk exposure to fluctuations in fuel prices.
Interest Rate Risk
We have exposure to changes in interest rates on our line of credit. The interest rate on our line of credit fluctuates based on the prime rate or LIBOR plus 2.25%. Assuming the $20,000,000 line of credit was fully drawn, a 1.0% increase in the prime rate would increase our annual interest expense by $200,000.
Our interest income is sensitive to changes in the general level of U.S. interest rates, in particular because all of our investments are in cash equivalents. Due to the short-term nature of our investments, we believe that there is no material risk exposure.
We do not use derivative financial instruments for speculative trading purposes.
53
Item 8. Financial Statements and Supplementary Data
INDEX TO FINANCIAL STATEMENTS AND
FINANCIAL STATEMENT SCHEDULE
54
Report of Independent Registered Public Accounting Firm
The
Board of Directors and Stockholders
Echo Global Logistics, Inc.
We have audited the accompanying consolidated balance sheets of Echo Global Logistics, Inc. and Subsidiaries (the Company) as of December 31, 2009 and 2008, and the related consolidated statements of operations, shareholders' equity (deficit), and cash flows for each of the three years in the period ended December 31, 2009. Our audits also included the financial statement schedule listed in the Index at Item 15(a). These financial statements are the responsibility of the Company's management. Our responsibility is to express an opinion on these financial statements based on our audits.
We conducted our audits in accordance with the standards of the Public Company Accounting Oversight Board (United States). Those standards require that we plan and perform the audit to obtain reasonable assurance about whether the financial statements are free of material misstatement. We were not engaged to perform an audit of the Company's internal control over financial reporting. Our audits included consideration of internal control over financial reporting as a basis for designing audit procedures that are appropriate in the circumstances, but not for the purpose of expressing an opinion on the effectiveness of the Company's internal control over financial reporting. Accordingly, we express no such opinion. An audit also includes examining, on a test basis, evidence supporting the amounts and disclosures in the financial statements, assessing the accounting principles used and significant estimates made by management, and evaluating the overall financial statement presentation. We believe that our audits provide a reasonable basis for our opinion.
In our opinion, the financial statements referred to above present fairly, in all material respects, the consolidated financial position of Echo Global Logistics, Inc. and Subsidiaries at December 31, 2009 and 2008, and the consolidated results of their operations and their cash flows for each of the three years in the period ended December 31, 2009, in conformity with U.S. generally accepted accounting principles. Also, in our opinion, the related financial statement schedule, when considered in relation to the basic financial statements taken as a whole, presents fairly in all material respects the information set forth therein.
Ernst & Young LLP
Chicago,
IL
March 17, 2010
55
Echo Global Logistics, Inc.
Consolidated Balance Sheets
| |
December 31, | |||||||
|---|---|---|---|---|---|---|---|---|
| |
2008 | 2009 | ||||||
Assets |
||||||||
Current assets: |
||||||||
Cash and cash equivalents |
$ | 1,872,922 | $ | 47,803,704 | ||||
Accounts receivable, net of allowance for doubtful accounts of $688,197 and $1,323,916, respectively |
23,589,973 | 43,689,684 | ||||||
Taxes receivable |
780,474 | 344,117 | ||||||
Prepaid expenses |
3,619,788 | 6,420,750 | ||||||
Other current assets |
— | 391,054 | ||||||
Total current assets |
29,863,157 | 98,649,309 | ||||||
Property and equipment, net |
7,289,389 | 8,153,741 | ||||||
Intangibles and other assets: |
||||||||
Goodwill |
2,291,694 | 18,651,496 | ||||||
Intangible assets, net of accumulated amortization of $1,185,472 and $2,243,765, respectively |
2,163,553 | 4,527,043 | ||||||
Other assets |
3,163,055 | 459,735 | ||||||
Deferred income taxes |
1,138,175 | 2,233,964 | ||||||
Total assets |
$ | 45,909,023 | $ | 132,675,288 | ||||
Liabilities and stockholders' deficit |
||||||||
Current liabilities: |
||||||||
Accounts payable—trade |
$ | 16,549,594 | $ | 27,039,510 | ||||
Amounts due to restricted stockholders |
78,750 | — | ||||||
Current maturities of capital lease obligations |
188,234 | 302,518 | ||||||
Line of credit |
5,000,000 | — | ||||||
Accrued expenses |
3,246,133 | 3,058,102 | ||||||
Due to seller—short term |
— | 717,738 | ||||||
Deferred income taxes |
1,591,098 | 1,894,204 | ||||||
Total current liabilities |
26,653,809 | 33,012,072 | ||||||
Due to seller—long term |
— | 5,452,303 | ||||||
Capital lease obligations, net of current maturities |
428,463 | 420,840 | ||||||
Total liabilities |
27,082,272 | 38,885,215 | ||||||
Series D, convertible preferred shares, $0.0002 par value, 3,129,496 shares authorized, 3,129,496 shares issued and outstanding at December 31, 2008, liquidation preference of $26,100,000 |
19,741,826 | — | ||||||
Stockholders' equity (deficit) |
||||||||
Series B, convertible preferred shares, $0.0002 par value, 62,500 shares authorized, 62,500 shares issued and outstanding at December 31, 2008, liquidation preference of $62,500 |
27,416 | — | ||||||
Series A common, par value $0.0002 per share, 17,500,000 shares authorized, 12,323,352 shares issued and outstanding at December 31, 2008; |
2,466 | — | ||||||
Common stock, par value $0.0001 per share, no shares authorized, no shares issued or outstanding at December 31, 2008; 100,000,000 shares authorized, 21,768,659 shares issued and outstanding at December 31, 2009 |
— | 2,177 | ||||||
Additional paid-in capital |
(1,974,698 | ) | 88,368,796 | |||||
Retained earnings |
1,029,741 | 5,419,100 | ||||||
Total stockholders' equity (deficit) |
(915,075 | ) | 93,790,073 | |||||
Total liabilities and stockholders' equity (deficit) |
$ | 45,909,023 | $ | 132,675,288 | ||||
See accompanying notes.
56
Echo Global Logistics, Inc.
Consolidated Statements of Income
| |
Years Ended December 31, | |||||||||||
|---|---|---|---|---|---|---|---|---|---|---|---|---|
| |
2007 | 2008 | 2009 | |||||||||
REVENUE |
$ | 95,460,985 | $ | 202,807,631 | $ | 259,560,658 | ||||||
COSTS AND EXPENSES: |
||||||||||||
Transportation costs |
75,534,754 | 159,717,355 | 203,892,962 | |||||||||
Selling, general, and administrative expenses |
16,469,454 | 34,914,278 | 44,816,750 | |||||||||
Depreciation and amortization |
1,845,134 | 3,230,803 | 4,990,919 | |||||||||
INCOME FROM OPERATIONS |
1,611,643 | 4,945,195 | 5,860,027 | |||||||||
Interest income |
208,055 | 20,259 | 23,971 | |||||||||
Interest expense |
(11,936 | ) | (111,738 | ) | (792,303 | ) | ||||||
Other, net |
(5,424 | ) | (52,392 | ) | (506,255 | ) | ||||||
OTHER INCOME (EXPENSE) |
190,695 | (143,871 | ) | (1,274,587 | ) | |||||||
INCOME BEFORE PROVISION FOR INCOME TAXES |
1,802,338 | 4,801,324 | 4,585,440 | |||||||||
INCOME TAX BENEFIT (EXPENSE) |
(749,638 | ) | (1,925,768 | ) | 610,544 | |||||||
NET INCOME |
1,052,700 | 2,875,556 | 5,195,984 | |||||||||
DIVIDENDS ON PREFERRED SHARES |
(1,054,381 | ) | (1,054,380 | ) | (806,625 | ) | ||||||
NET INCOME APPLICABLE TO COMMON SHAREHOLDERS |
$ | (1,681 | ) | $ | 1,821,176 | $ | 4,389,359 | |||||
Basic net income per share |
$ | — | $ | 0.15 | $ | 0.30 | ||||||
Diluted net income per share |
$ | — | $ | 0.14 | $ | 0.29 | ||||||
See accompanying notes.
57
Echo Global Logistics, Inc.
Consolidated Statements of Stockholders' Equity (Deficit)
Years ended December 31, 2007, 2008 and 2009
| |
Common A | Series B Preferred | Common Stock | |
|
|
|
|||||||||||||||||||||||||
|---|---|---|---|---|---|---|---|---|---|---|---|---|---|---|---|---|---|---|---|---|---|---|---|---|---|---|---|---|---|---|---|---|
| |
Stockholder's Receivable |
Additional Paid-In Capital |
Retained Earnings |
|
||||||||||||||||||||||||||||
| |
Shares | Amount | Shares | Amount | Shares | Amount | Total | |||||||||||||||||||||||||
Balance at January 1, 2007 |
11,314,185 | $ | 2,263 | 62,500 | $ | 12,375 | — | $ | — | $ | (290,405 | ) | $ | (5,136,162 | ) | $ | (789,754 | ) | $ | (6,201,683 | ) | |||||||||||
Repayment of receivable |
— | — | — | — | — | — | 288,000 | — | — | 288,000 | ||||||||||||||||||||||
Proceeds from issuance of shares |
300,000 | 60 | — | — | — | — | — | 954,940 | — | 955,000 | ||||||||||||||||||||||
Vesting of restricted shares |
173,334 | 35 | — | — | — | — | — | 86,632 | — | 86,667 | ||||||||||||||||||||||
Issuance of shares in connection with SelecTrans transaction |
75,000 | 15 | — | — | — | — | — | 161,985 | — | 162,000 | ||||||||||||||||||||||
Issuance of shares in connection with Bestway acquisition |
25,000 | 5 | — | — | — | — | — | 214,495 | — | 214,500 | ||||||||||||||||||||||
Exercise of stock options |
35,000 | 7 | — | — | — | — | — | 693 | — | 700 | ||||||||||||||||||||||
Tax benefit from exercise of stock options |
— | — | — | — | — | — | — | 36,696 | — | 36,696 | ||||||||||||||||||||||
Preferred Series B dividends |
— | — | — | 7,521 | — | — | — | — | (7,521 | ) | — | |||||||||||||||||||||
Preferred Series D dividends |
— | — | — | — | — | — | — | — | (1,046,860 | ) | (1,046,860 | ) | ||||||||||||||||||||
Share compensation expense |
— | — | — | — | — | — | — | 323,044 | — | 323,044 | ||||||||||||||||||||||
Net income |
— | — | — | — | — | — | — | — | 1,052,700 | 1,052,700 | ||||||||||||||||||||||
Balance at December 31, 2007 |
11,922,519 | 2,385 | 62,500 | 19,896 | — | — | (2,405 | ) | (3,357,677 | ) | (791,435 | ) | (4,129,236 | ) | ||||||||||||||||||
Repayment of receivable |
— | — | — | — | — | — | 2,405 | — | — | 2,405 | ||||||||||||||||||||||
Proceeds from issuance of shares |
37,500 | 8 | — | — | — | — | — | 219,992 | — | 220,000 | ||||||||||||||||||||||
Vesting of restricted shares |
290,833 | 58 | — | — | — | — | — | 183,358 | — | 183,416 | ||||||||||||||||||||||
Exercise of stock options |
72,500 | 15 | — | — | — | — | — | 352,635 | — | 352,650 | ||||||||||||||||||||||
Tax benefit from exercise of stock options |
— | — | — | — | — | — | — | — | — | — | ||||||||||||||||||||||
Preferred Series B dividends |
— | — | — | 7,520 | — | — | — | — | (7,520 | ) | — | |||||||||||||||||||||
Preferred Series D dividends |
— | — | — | — | — | — | — | — | (1,046,860 | ) | (1,046,860 | ) | ||||||||||||||||||||
Share compensation expense |
— | — | — | — | — | — | — | 626,994 | — | 626,994 | ||||||||||||||||||||||
Net income |
— | — | — | — | — | — | — | — | 2,875,556 | 2,875,556 | ||||||||||||||||||||||
Balance at December 31, 2008 |
12,323,352 | $ | 2,466 | 62,500 | $ | 27,416 | $ | — | $ | — | — | $ | (1,974,698 | ) | $ | 1,029,741 | $ | (915,075 | ) | |||||||||||||
Preferred Series B dividends |
— | — | — | (27,404 | ) | — | — | — | — | (5,751 | ) | (33,155 | ) | |||||||||||||||||||
Preferred Series D dividends |
— | — | — | — | — | — | — | — | (800,874 | ) | (800,874 | ) | ||||||||||||||||||||
Share compensation expense |
— | — | — | — | — | — | — | 521,764 | — | 521,764 | ||||||||||||||||||||||
Exercise of stock options |
81,250 | 16 | — | — | — | — | — | 151,985 | — | 152,001 | ||||||||||||||||||||||
Vesting of restricted shares |
157,500 | 32 | — | — | 275,000 | 28 | — | 3,928,690 | — | 3,928,750 | ||||||||||||||||||||||
Conversion of Preferred Series D |
3,169,057 | 317 | — | 17,052,851 | — | 17,053,168 | ||||||||||||||||||||||||||
Conversion to Common Stock |
(12,562,102 | ) | (2,514 | ) | (62,500 | ) | (12 | ) | 12,624,602 | 1,262 | — | 1,264 | — | — | ||||||||||||||||||
Tax benefit from exercise of stock options |
— | — | — | — | — | — | — | 112,636 | — | 112,636 | ||||||||||||||||||||||
Initial public offering proceeds |
— | — | — | — | 5,700,000 | 570 | — | 68,574,304 | — | 68,574,874 | ||||||||||||||||||||||
Net income |
— | — | — | — | — | — | — | 5,195,984 | 5,195,984 | |||||||||||||||||||||||
Balance at Decmber 31, 2009 |
— | $ | — | — | $ | — | 21,768,659 | $ | 2,177 | $ | — | $ | 88,368,796 | $ | 5,419,100 | $ | 93,790,073 | |||||||||||||||
See accompanying notes.
58
Echo Global Logistics, Inc.
Consolidated Statements of Cash Flows
| |
Years Ended December 31, | |||||||||||
|---|---|---|---|---|---|---|---|---|---|---|---|---|
| |
2007 | 2008 | 2009 | |||||||||
Operating activities |
||||||||||||
Net income |
$ | 1,052,700 | $ | 2,875,556 | $ | 5,195,984 | ||||||
Adjustments to reconcile net income to net cash provided by (used in) operating activities: |
||||||||||||
Deferred income taxes |
749,638 | 1,925,768 | (792,683 | ) | ||||||||
Noncash stock compensation expense |
323,044 | 626,994 | 521,764 | |||||||||
Depreciation and amortization |
1,845,134 | 3,230,803 | 4,990,919 | |||||||||
Contingent consideration included in due to seller |
— | — | (982,620 | ) | ||||||||
Change in assets, net of acquisitions: |
||||||||||||
Accounts receivable |
(6,415,338 | ) | (9,740,390 | ) | (16,540,665 | ) | ||||||
Taxes receivable |
— | (780,474 | ) | 436,357 | ||||||||
Prepaid expenses and other assets |
(336,119 | ) | (6,099,037 | ) | (3,274,551 | ) | ||||||
Change in liabilities, net of acquisitions: |
||||||||||||
Accounts payable |
2,396,605 | 6,426,213 | 6,351,831 | |||||||||
Accrued expenses and other |
787,235 | 3,251,023 | (1,508,476 | ) | ||||||||
Net cash provided by (used in) operating activities |
402,899 | 1,716,456 | (5,602,140 | ) | ||||||||
Investing activities |
||||||||||||
Purchases of property and equipment |
(3,992,993 | ) | (4,710,764 | ) | (4,273,593 | ) | ||||||
Payments for acquisitions, net of cash aquired |
(4,838,819 | ) | (389,794 | ) | (7,226,281 | ) | ||||||
Net cash used in investing activities |
(8,831,812 | ) | (5,100,558 | ) | (11,499,874 | ) | ||||||
Financing activities |
||||||||||||
Repayment of member receivable |
288,000 | 2,405 | — | |||||||||
Principal payments on capital lease obligations |
(113,081 | ) | (151,419 | ) | (246,724 | ) | ||||||
Borrowings (payments) on credit line |
— | 5,000,000 | (5,000,000 | ) | ||||||||
Tax benefit of stock options exercised |
36,696 | — | 112,636 | |||||||||
Borrowings on subordinated debt from related party |
— | — | 7,500,000 | |||||||||
Payments on subordinated debt from related party |
— | — | (7,500,000 | ) | ||||||||
Payment of costs associated with initial public offering |
— | (1,721,847 | ) | (2,676,430 | ) | |||||||
Repayments to related parties |
(63,311 | ) | (13,324 | ) | — | |||||||
Issuance of shares, net of issuance costs |
996,200 | 572,650 | 152,001 | |||||||||
Payment of dividends on preferred shares |
— | — | (3,522,687 | ) | ||||||||
Initial public offering proceeds |
— | — | 74,214,000 | |||||||||
Net cash provided by financing activities |
1,144,504 | 3,688,465 | 63,032,796 | |||||||||
Increase (decrease) in cash and cash equivalents |
(7,284,409 |
) |
304,363 |
45,930,782 |
||||||||
Cash and cash equivalents, beginning of period |
8,852,968 | 1,568,559 | 1,872,922 | |||||||||
Cash and cash equivalents, end of period |
$ | 1,568,559 | $ | 1,872,922 | $ | 47,803,704 | ||||||
Supplemental disclosure of cash flow information |
||||||||||||
Cash paid during the year for interest |
$ | 11,936 | $ | 61,893 | $ | 741,844 | ||||||
Cash paid for income taxes |
9,500 | 774,525 | 125,000 | |||||||||
Noncash investing activity |
||||||||||||
Issuance of common stock in connection with Mountain Logistics acquisition |
— | — | 3,850,000 | |||||||||
Issuance of restricted stock in connection with Bestway acquisition |
214,500 | — | — | |||||||||
Issuance of common stock in connection with SelecTrans acquisition |
162,000 | — | — | |||||||||
Purchase of furniture and equipment with capital lease |
414,041 | 467,155 | 353,385 | |||||||||
Noncash financing activity |
||||||||||||
Vesting of restricted shares |
66,667 | 183,416 | 78,750 | |||||||||
Due to seller |
— | — | 7,252,661 | |||||||||
See accompanying notes.
59
Echo Global Logistics, Inc. and Subsidiaries
Notes to Consolidated Financial Statements
Years Ended December 31, 2007, 2008 and 2009
1. Description of Business
Echo Global Logistics, Inc. (the Company) is a leading provider of technology-enabled transportation and supply chain management services, delivered on a proprietary technology platform serving the transportation and logistics needs of its clients. The Company provides services across all major transportation modes, including truckload (TL), less-than truck-load (LTL), small parcel, inter-modal, domestic air, and international. The Company's core logistics services include rate negotiation, shipment execution and tracking, carrier management, routing compliance, freight bill audit, and payment and performance management and reporting functions, including executive dashboard tools.
The Company was formed on January 3, 2005, and commenced operations in March 2005. The Company was originally established as a limited liability company (LLC). Effective June 7, 2006, the Company converted its legal form to a C corporation organized and existing under the General Corporation Law of the State of Delaware.
On June 7, 2006, the Company completed its conversion to a corporate structure whereby Echo Global Logistics LLC converted to Echo Global Logistics, Inc. As a result, each Series A common unit of the LLC converted to a fully paid share of Series A Common Stock, with a par value of $0.0002 per share. In addition, each Series B and C preferred unit of the LLC converted to fully paid shares of Series B Preferred Stock and Series A Common Stock, respectively, both with a par value of $0.0002 per share. In connection with the conversion, the undistributed losses as of the conversion date were classified to additional paid-in capital.
2. Summary of Significant Accounting Policies
Basis of Presentation
The condensed consolidated financial statements include the accounts of Echo Global Logistics, Inc. and its subsidiaries (the Company). All significant intercompany accounts and transactions have been eliminated in the consolidation. The consolidated statements of income include the results of entities or assets acquired from the effective date of the acquisition for accounting purposes.
Preparation of Financial Statements and Use of Estimates
The preparation of consolidated financial statements in conformity with accounting principles generally accepted in the United States (U.S. GAAP) requires management to make estimates and assumptions that affect the reported amounts of assets and liabilities and disclosures of contingent assets and liabilities as of the date of the financial statements and the reported amounts of revenue and expenses during the reporting periods. Actual results can differ from those estimates.
Fair Value of Financial Instruments
As of December 31, 2008 and 2009, the carrying value of the Company's financial investments, which consist of cash and cash equivalents, accounts receivable, accounts payable, capital lease obligations, and a line of credit, approximate their fair values due to their short term nature. The fair value of due to seller is determined based on the likelihood of contingent earn-out payments.
60
Echo Global Logistics, Inc. and Subsidiaries
Notes to Consolidated Financial Statements (Continued)
Years Ended December 31, 2007, 2008 and 2009
2. Summary of Significant Accounting Policies (Continued)
Reverse Stock Split
As of September 24, 2009, the Company's Board of Directors approved a resolution to effect a one-for-two reverse stock split of the Company's capital stock with a corresponding change to the par value of the capital stock. The reverse stock split became effective on September 25, 2009. Any fractional shares resulting from the reverse stock split were rounded down to the nearest whole share and stockholders were entitled to cash in lieu of any fractional shares. All share numbers and per share amounts for all periods presented have been adjusted retroactively to reflect the one-for-two reverse stock split.
Revenue Recognition
In accordance with ASC Topic 605-20 (previously Emerging Issues Task Force (EITF) Issue 91-9, Revenue and Expense Recognition for Freight Services in Process), transportation revenue and related transportation costs are recognized when the shipment has been delivered by a third-party carrier. Fee for service revenue is recognized when the services have been rendered. At the time of delivery or rendering of services, as applicable, the Company's obligation to fulfill a transaction is complete and collection of revenue is reasonably assured.
In accordance with ASC Topic 605-45 (previously EITF Issue 99-19, Reporting Revenue Gross as a Principal versus Net as an Agent), the Company generally recognizes revenue on a gross basis, as opposed to a net basis similar to a commission arrangement, because it bears the risks and benefits associated with revenue-generated activities by, among other things: (1) acting as a principal in the transaction; (2) establishing prices; (3) managing all aspects of the shipping process; and (4) taking the risk of loss for collection, delivery, and returns. Certain transactions to provide specific services are recorded at the net amount charged to the client due to the following key factors: (a) the Company does not have latitude in establishing pricing; and (b) the Company has credit risk for only the net revenue earned from its client while the carrier has credit risk for the transportation costs.
Rebates
The Company has entered into agreements with certain clients to rebate to them a portion of the costs that they pay to the Company for transportation services, based on certain conditions and/or pricing schedules that are specific to each individual agreement, but that are typically constructed as a percentage of the costs that its clients incur.
Rebates are recognized at the same time that the related transportation revenue is recognized and are recorded as a reduction of transportation revenue.
Segment Reporting
The Company has adopted the provisions of ASC Topic 280 (previously Statement of Financial Accounting Standards (SFAS) No. 131, Disclosure About Segments of an Enterprise and Related Information), which establishes accounting standards for segment reporting.
The Company's chief operating decision-maker assesses performance and makes resource allocation decisions for the business as a single operating segment, transportation, and logistics service.
61
Echo Global Logistics, Inc. and Subsidiaries
Notes to Consolidated Financial Statements (Continued)
Years Ended December 31, 2007, 2008 and 2009
2. Summary of Significant Accounting Policies (Continued)
Therefore, the Company has only one reportable segment in accordance with this guidance. The Company has provided all enterprise wide disclosures required by this guidance.
Cash and Cash Equivalents
The Company considers all highly liquid investments with a maturity of three months or less when purchased to be cash equivalents.
Accounts Receivable and Allowance for Doubtful Accounts
Accounts receivable are uncollateralized customer obligations due under normal trade terms. Invoices require payment within 30 to 90 days from the invoice date. Accounts receivable are stated at the amount billed to the customer. Customer account balances with invoices past due 90 days are considered delinquent. The Company generally does not charge interest on past due amounts.
The carrying amount of accounts receivable is reduced by an allowance for doubtful accounts that reflects management's best estimate of amounts that will not be collected. The allowance is based on historical loss experience and any specific risks identified in client collection matters. Accounts receivable are charged off against the allowance for doubtful accounts when it is determined that the receivable is uncollectible.
Property and Equipment
Property and equipment are stated at cost. Depreciation is computed using the straight-line method over the estimated useful lives of the respective assets. The estimated useful lives, by asset class, are as follows:
Computer equipment and software |
3 years | |||
Office equipment |
5 years | |||
Furniture and fixtures |
7 years |
Capital leases are amortized over the shorter of the useful life or related lease term.
Internal Use Software
The Company has adopted the provisions of ASC Topic 350 (previously American Institute of Certified Public Accountants (AICPA) Statement of Position (SOP) 98-1), Accounting for the Costs of Software Developed or Obtained for Internal Use. Accordingly, certain costs incurred in the planning and evaluation stage of internal use computer software are expensed as incurred. Costs incurred during the application development stage are capitalized and included in property and equipment. Capitalized internal use software costs are amortized over the expected economic life of three years using the straight-line method. The total amortization expense for the years ended December 31, 2007, 2008 and 2009 was $1,060,027, $1,765,729 and $2,671,009 respectively. At December 31, 2008 and 2009, the net book value of internal use software costs was $3,765,247 and $4,543,744, respectively.
62
Echo Global Logistics, Inc. and Subsidiaries
Notes to Consolidated Financial Statements (Continued)
Years Ended December 31, 2007, 2008 and 2009
2. Summary of Significant Accounting Policies (Continued)
Goodwill and Other Intangibles
Goodwill represents the excess of purchase price and related costs over the value assigned to the net tangible and identifiable intangible assets of businesses acquired. In accordance with ASC Topic 350 (previously SFAS No. 142, Goodwill and Other Intangible Assets), goodwill is not amortized, but instead is tested for impairment annually, or more frequently if circumstances indicate a possible impairment may exist. The Company evaluates the recoverability of goodwill using a two-step impairment test. For goodwill impairment test purposes, the Company has one reporting unit. In the first step, the fair value for the Company is compared to its carrying value including goodwill. In the case that the fair value is less than the carrying value, a second step is performed that compares the implied fair value of goodwill to the carrying value of the goodwill. The fair value for the implied goodwill is determined based on the difference between the fair value of the reporting unit and the net fair values of the identifiable assets and liabilities excluding goodwill. If the implied fair value of the goodwill is less than the book value, the difference is recognized as an impairment. Absent any special circumstances that could require an interim test, the Company has elected to test for goodwill impairment during the fourth quarter of each year. This guidance also requires that intangible assets with finite lives be amortized over their respective estimated useful lives and reviewed for impairment whenever impairment indicators exist in accordance with ASC Topic 360 (previously SFAS No. 144, Accounting for the Impairment or Disposal of Long-Lived Assets). The Company's intangible assets consist of customer relationships, noncompete agreements, and trade names, which are being amortized on the straight-line basis over their estimated weighted-average useful lives of 6 years, 3 years and 3 years, respectively.
Income Taxes
The Company accounts for income taxes in accordance with ASC Topic 740 (previously SFAS No. 109, Accounting for Income Taxes), under which deferred assets and liabilities are recognized based upon anticipated future tax consequences attributable to differences between financial statement carrying values of assets and liabilities and their respective tax bases. A valuation allowance is established to reduce the carrying value of deferred tax assets if it is considered more likely than not that such assets will not be realized. Any change in the valuation allowance would be charged to income in the period such determination was made.
In July 2006, the Financial Accounting Standards Board (FASB) issued Interpretation of ASC Topic 740 (previously FIN 48, Accounting for Uncertainty in Income Taxes). This guidance clarifies the accounting for uncertainty in income taxes recognized in an enterprise's financial statements in accordance with the guidance. This guidance also prescribes a recognition threshold and measurement attribute for financial statement recognition and measurement that a tax position is required to meet before being recognized in the financial statements. The guidance also provides guidance on derecognition, classification, interest and penalties, accounting in interim periods, disclosure, and transition. The Company adopted the guidance as of January 1, 2007.
Stock-Based Compensation
The Company accounts for stock-based compensation in accordance with ASC Topic 718 (previously SFAS No. 123R, Share-Based Payments) which requires all share-based payments to employees, including grants of stock options, to be recognized in the income statement based upon
63
Echo Global Logistics, Inc. and Subsidiaries
Notes to Consolidated Financial Statements (Continued)
Years Ended December 31, 2007, 2008 and 2009
2. Summary of Significant Accounting Policies (Continued)
their fair values. Share-based employee compensation costs are recognized as a component of selling, general and administrative expense in the consolidated statements of income. See Note 14—Stock-Based Compensation Plans for a description of the Company's accounting for stock-based compensation plans.
Contract Costs
Cost of contracts represents the incremental direct costs incurred related to the acquisition or origination of certain customer contracts. Costs capitalized are amortized over the life of the contracts.
Reclassifications
Certain prior year amounts have been reclassified to conform to the current year presentation.
3. New Accounting Pronouncements
In December 2007, the Financial Accounting Standards Board (FASB) issued ASC Topic 810 (previously Statement of Financial Accounting Standards (SFAS) No. 160, Noncontrolling Interests in Consolidated Financial Statements, an amendment of ARB No. 51, Consolidated Financial Statements). The guidance establishes accounting and reporting guidance for a noncontrolling ownership interest in a subsidiary and deconsolidation of a subsidiary. The standard requires that a noncontrolling ownership interest in a subsidiary be reported as equity in the consolidated statement of financial position and any related net income attributable to the parent be presented on the face of the consolidated statement of income. The guidance is effective as of the beginning of an entity's first fiscal year that begins after December 15, 2008. The Company's adoption of this guidance on January 1, 2009 had no effect on the consolidated financial statements.
In December 2007, the FASB issued ASC Topic 805 (previously SFAS No. 141 (revised 2007), Business Combinations. which replaces SFAS No. 141, Business Combinations), and establishes principles and requirements for how an acquirer: (1) recognizes and measures in its financial statements the identifiable assets acquired, liabilities assumed, and any noncontrolling interest in the acquiree; (2) recognizes and measures the goodwill acquired in a business combination or gain from a bargain purchase; and (3) determines what information to disclose. The guidance is effective for business combinations in which the acquisition date is in the first fiscal year after December 15, 2008. The Company adopted the guidance on January 1, 2009, and has applied this to the acquisitions completed in 2009.
In April 2008, the FASB issued ASC Topic 350 (previously FSP No. 142-3, Determination of the Useful Life of Intangible Assets). This guidance amends the factors an entity should consider in developing renewal or extension assumptions used in determining the useful life of recognized intangible assets under the guidance. This new guidance applies prospectively to intangible assets that are acquired individually or with a group of other assets in business combinations and assets acquisitions. The guidance is effective for financial statements issued for fiscal years and interim period beginning after December 15, 2008. The Company adoption of the guidance on January 1, 2009 had no effect on the consolidated financial statements.
64
Echo Global Logistics, Inc. and Subsidiaries
Notes to Consolidated Financial Statements (Continued)
Years Ended December 31, 2007, 2008 and 2009
3. New Accounting Pronouncements (Continued)
In September 2006, the FASB issued ASC Topic 820 (previously SFAS No. 157, Fair Value Measurements). This guidance defines fair value, establishes a framework for measuring fair value in generally accepted accounting principles, and expands disclosures about fair value measurements. This Statement applies under other accounting pronouncements that require or permit fair value measurements, the FASB having previously concluded in those accounting pronouncements that fair value is the relevant measurement attribute. Accordingly, this Statement does not require any new fair value measurements. The guidance is effective for financial statements issued for fiscal years beginning after November 15, 2007, and interim periods within those fiscal years. In accordance with this interpretation, the Company adopted the guidance with respect to its financial assets and liabilities that are measured at fair value within the financial statements as of January 1, 2008. The adoption of the guidance did not have a material impact on the Company's fair value measurements. As of January 1, 2009 the Company adopted the guidance for all nonfinancial assets and nonfinancial liabilities. There was no impact on the Company's consolidated financial statements upon adoption.
In October 2008, the FASB issued ASC Topic 820-10 (previously FSP 157-3, Determining the Fair Value of a Financial Assets When the Market for That Asset is Not Active). This position clarifies the application of the guidance in a market that is not active and addresses application issues such as the use of internal assumptions when relevant observable data does not exist, the use of observable market information when the market is not active, and the use of market quotes when assessing the relevance of observable and unobservable data. The position is effective for all periods presented in accordance with Topic 820. The guidance is effective immediately and did not have an impact on the Company upon adoption.
In May 2009, the FASB issued ASC Topic 855 (previously SFA No. 165, "Subsequent Events" ("SFAS 165"). The guidance sets forth the period after the balance sheet date during which management of a reporting entity should evaluate events or transactions that may occur for potential recognition or disclosure in the financial statements, the circumstances under which an entity should recognize events or transactions occurring after the balance sheet date in its financial statements, and the disclosures that an entity should make about events or transactions that occurred after the balance sheet date. In February 2010, the FASB issued Accounting Standards Update ("ASU") No. 2010-09 to amend ASC 855 which applies with immediate effect. The ASU removes the requirement to disclose the date through which subsequent events were evaluated in both originally issued and reissued financial statements for SEC Filers.
In June 2009, the FASB issued ASC Topic 105 (previously SFAS No. 168, The FASB Accounting Standards Codification and the Hierarchy of Generally Accepted Accounting Principles—a replacement of FASB Statement No. 162 (SFAS 168). The guidance stipulates the FASB Accounting Standards Codification is the source of authoritative U.S. GAAP recognized by the FASB to be applied by nongovernmental entities. The guidance is effective for interim and annual periods ending after September 15, 2009. In conjunction with the issuance of the guidance, the SEC issued interpretive guidance Final Rule 80 (FR-80) regarding FASB's Accounting Standards Codification. Under FR-80, the SEC clarified that the ASC is not the authoritative source for SEC guidance and that the ASC does not supersede any SEC rules or regulations. Further, any references within the SEC rules and staff guidance to specific standards under U.S. GAAP should be understood to mean the corresponding reference in the ASC. FR-80 is also effective for interim and annual periods ending after September 15, 2009. The adoption of these pronouncements did not have a material impact on the Company's consolidated results of operations and financial condition. The Company began using the FASB
65
Echo Global Logistics, Inc. and Subsidiaries
Notes to Consolidated Financial Statements (Continued)
Years Ended December 31, 2007, 2008 and 2009
3. New Accounting Pronouncements (Continued)
Accounting Standards Codification as its source of authoritative U.S. GAAP beginning with the third quarter ending September 30, 2009.
In October 2009, the FASB issued ASC Topic 605 (previously ASU No. 2009-13, Multiple Deliverable Revenue Arrangements—a consensus of the FASB Emerging Issues Task Force (ASU 2009-13)). The guidance addresses the accounting for multiple-deliverable arrangements to enable vendors to account for products or services (deliverables) separately rather than as a combined unit. The guidance is effective prospectively for revenue arrangements entered into or materially modified in fiscal years beginning on or after June 15, 2010, with early adoption permitted. The Company is currently evaluating the impact that the adoption of this guidance may have on the Company's consolidated financial statements.
In January 2010, the FASB issued ASC 820 (previously "Improving Disclosures about Fair Value Measurements" (ASU 2010-06) . This guidance improves disclosures originally required under SFAS No. 157. ASU 2010-16 is effective for interim and annual periods beginning after December 15, 2009, except for the disclosures about purchases, sales, issuances and settlements in the roll forward of activity in Level 3 fair value measurements. Those disclosures are effective for fiscal years beginning after December 15, 2010, and for interim periods within those years. The Company is currently evaluating the impact that the adoption of this guidance may have on the Company's consolidated financial statements.
4. Acqusitions
Mountain Logistics Acquisition
Effective May 1, 2007, the Company acquired Mountain Logistics, Inc. (which was doing business as Transportation Management Group but now operates under the Echo Global Logistics, Inc. name), a non-asset-based third-party logistics provider with offices in Park City, Utah, and Los Angeles, California. As a result of the acquisition, the Company believes it has established a significant presence in the West Coast market by gaining over 200 West Coast clients and 43 sales agents. The acquisition provided the Company with a strategic entry into new geographies and an assembled workforce that has significant experience and knowledge of the industry. The purchase price was $8.8 million, consisting of $4.3 million cash paid in 2007 and expenses incurred directly related to the acquisition as well as the payment of contingent consideration of $250,000 and $350,000 in 2008 and 2009, respectively, and $3.9 million related to the vesting of 275,000 common shares as certain performance measures were met effective October 1, 2009. The additional purchase price related to the vesting of the shares was based on the fair market value of the Company's stock at the time of vesting and resulted in additional goodwill. An additional $5.9 million in cash may become payable upon the achievement of certain performance measures by or prior to May 31, 2010. The performance measures are based on both annual and cumulative targets of gross profit recognized, less commission expense incurred. The additional contingent consideration will be recorded as goodwill when those liabilities are resolved and distributable. The consolidated financial statements of the Company include the financial results of this acquisition beginning on May 1, 2007.
The following table summarizes the fair values of the assets acquired and the liabilities assumed at the date of acquisition. The customer relationships have a life of 5 years, the noncompete agreements have a weighted-average life of 10 months, and the trade names have a life of 3 years. The goodwill is fully deductible for U.S. income tax purposes.
66
Echo Global Logistics, Inc. and Subsidiaries
Notes to Consolidated Financial Statements (Continued)
Years Ended December 31, 2007, 2008 and 2009
4. Acqusitions (Continued)
The allocation of the purchase price is as follows:
Current assets (including cash of $348,039) |
$ | 2,859,710 | ||
Property and equipment |
55,491 | |||
Customer relationships |
2,720,000 | |||
Noncompete agreements |
69,000 | |||
Trade names |
190,000 | |||
Goodwill |
5,680,966 | |||
Liabilities assumed |
(2,805,871 | ) | ||
Net assets acquired |
$ | 8,769,296 | ||
The following unaudited pro forma information presents a summary of the Company's consolidated statements of operations for the years ended December 31, 2007, as if the Company had acquired Mountain Logistics as of January 1.
| |
2007 | |||
|---|---|---|---|---|
Revenue |
$ | 102,956,135 | ||
Income from operations |
1,733,844 | |||
Net income |
32,820 | |||
Basic earnings per share |
— | |||
Diluted earnings per share |
— | |||
Bestway Acquisition
Effective October 1, 2007, the Company acquired Bestway Solutions LLC, a nonasset based third-party logistics provider located in Vancouver, Washington. As a result of the acquisition, the Company brings a Pacific Northwest presence to its customer and carrier base. The acquisition provided the Company with a strategic entry into new geographies and an assembled workforce that has significant experience and knowledge of the industry. The purchase price was $1.3 million, consisting of $834,000 in cash, 25,000 shares of restricted common stock issued (fair value of $214,500), and expenses incurred directly related to the acquisition, as well as the payment of contingent consideration of approximately $101,100 in both 2008 and 2009. The fair value of the common stock was $8.58 per share, as determined contemporaneously by the Company through application of a discounted cash flow methodology. An additional $101,100 in cash may become payable contingent upon the achievement of certain performance measures by or prior to September 30, 2010. The performance measures are based on annual targets of gross profit recognized. The additional contingent consideration will be recorded as goodwill when the liabilities are resolved and distributable. The consolidated financial statements of the Company include the financial results of this acquisition beginning October 1, 2007.
RayTrans Distribution Services, Inc. Acquisition
Effective June 1, 2009, the Company acquired RayTrans Distribution Services, Inc. (RDS), a non-asset based third-party logistics provider with offices in Matteson, Illinois and the results of RDS have been included in the consolidated financial statements since that date. The acquisition provided
67
Echo Global Logistics, Inc. and Subsidiaries
Notes to Consolidated Financial Statements (Continued)
Years Ended December 31, 2007, 2008 and 2009
4. Acqusitions (Continued)
the Company with strategic growth of its presence in the truckload business and added an assembled workforce that has significant experience and knowledge of the industry.
The acquisition-date fair value of the consideration transferred totaled $9,226,511, which consisted of the following:
Fair value of consideration transferred |
||||
Cash |
$ | 5,384,069 | ||
Contingent consideration |
3,842,442 | |||
Total |
$ | 9,226,511 | ||
The contingent consideration arrangement requires the Company to pay an additional $6.5 million in cash if certain performance measures are achieved by or prior to May 31, 2012. The performance measures are based on both annual and cumulative targets of adjusted EBITDA. EBITDA relates to earnings before interest, taxes, depreciation and amortization. The fair value of the contingent consideration arrangement at the acquisition date was $3.8 million. Pursuant to the adoption of ASC Topic 805 effective January 1, 2009, any changes to the contingent consideration obligation will be recorded in selling, general and administrative expense. For the year ended December 31, 2009, the Company recorded a reduction of $795,297 to the contingent consideration obligation as a result of adjustments to RDS' forecasted financial performance resulting in a liability due to seller of $3.2 million at December 31, 2009. The reduction in contingent consideration is included in general administrative expenses in the consolidated income statement. The Company estimates these contingent payments to be approximately 47% of total eligible payments due prior to May 31, 2012. The Company expects total undiscounted contingent consideration payments to RDS to be between $4.0 million and $6.5 million. There were no other contingent liabilities assumed in the acquisition.
The following table summarizes the fair values of the assets acquired and the liabilities assumed at the date of acquisition.
Accounts receivable |
$ | 3,314,551 | ||
Other assets |
244,595 | |||
Goodwill |
7,488,042 | |||
Customer relationships |
2,820,000 | |||
Non-compete agreements |
70,000 | |||
Internally developed software |
170,000 | |||
Accounts payable |
(4,007,612 | ) | ||
Other current liabilities |
(873,065 | ) | ||
Net assets acquired |
$ | 9,226,511 | ||
The Company recorded a change in the estimated fair values of the assets acquired and liabilities assumed to goodwill related to the finalization of the intangible valuation and adjustments to working capital. Goodwill of $7.5 million represents the premium the Company paid over the fair value of the net tangible and intangible assets it acquired. The Company paid this premium for a number of reasons, including expanding its presence in the flatbed, over-sized, auto-haul and other specific services as well as traditional dry van brokerage; adding more than 400 transactional clients, which expands its pipeline of clients to which the Company can market its transportation and supply chain management
68
Echo Global Logistics, Inc. and Subsidiaries
Notes to Consolidated Financial Statements (Continued)
Years Ended December 31, 2007, 2008 and 2009
4. Acqusitions (Continued)
services. In addition, the Company gained approximately 1,500 new carriers that provide specialized transportation services to its existing clients. The amount of goodwill deductible for U.S. income tax purposes is $3.0 million, excluding future contingent consideration payments.
The customer relationships have a life of seven years and the non-compete agreements have a life of five years.
The amounts of revenue and net income of RDS included in the Company's consolidated income statement from the acquisition date to the twelve months ended December 31, 2009 are $14,400,066 and $765,725, respectively. The following unaudited pro forma information presents a summary of the Company's consolidated statements of operations for the years ended December 31, 2008 and 2009 as if the Company had acquired RDS as of January 1.
| |
2008 | 2009 | |||||
|---|---|---|---|---|---|---|---|
Revenue |
$ | 245,536,958 | $ | 271,645,130 | |||
Income from operations |
5,359,090 | 6,448,280 | |||||
Net income |
2,370,201 | 5,248,883 | |||||
Net income applicable to common shareholders |
1,315,821 | 4,442,258 | |||||
Basic earnings per share |
$ | 0.11 | $ | 0.30 | |||
Diluted earnings per share |
$ | 0.10 | $ | 0.29 | |||
Freight Management Inc.
Effective July 1, 2009 the Company acquired Freight Management Inc. (FMI), a non-asset based third-party logistics provider with offices in Buffalo, Minnesota and the results of FMI have been included in the consolidated financial statements since that date. The Company agreed to purchase the assets and assume certain liabilities of FMI for $1.4 million. An additional $4.6 million in cash consideration may become payable upon achievement of certain performance measures by or prior to July 31, 2012. As a result of the acquisition, the Company recorded $4.6 million of goodwill, of which $3.3 million related to contingent consideration. Pursuant to the adoption of ASC Topic 805 effective January 1, 2009, any changes to the contingent consideration obligation will be recorded in selling, general and administrative expense. The Company expects total undiscounted contingent consideration payments to FMI to be between $3.0 million and $4.4 million. For the year ended December 31, 2009, the Company recorded a reduction of $187,323 to the contingent consideration obligation as a result of adjustments to forecasted financial performance of FMI resulting in a liability due to seller of $3.0 million at December 31, 2009. The reduction in contingent consideration is included in general administrative expenses in the consolidated income statement. Pro forma results of the acquisition have been not been included as the acquisition does not have a material impact on the Company's financial statements.
5. Fair Value Measurement
As discussed in Note 2, the Company adopted ASC Topic 820 (previously SFAS No. 157, Fair Value Measurements) on January 1, 2008 for its financial assets and financial liabilities. The guidance requires enhanced disclosures about assets and liabilities measured at fair value. The Company's financial assets primarily relate to money market funds and financial liabilities primarily relate to contingent earn-out payments of $6.3 million.
69
Echo Global Logistics, Inc. and Subsidiaries
Notes to Consolidated Financial Statements (Continued)
Years Ended December 31, 2007, 2008 and 2009
5. Fair Value Measurement (Continued)
The guidance includes a fair value hierarchy that is intended to increase consistency and comparability in fair value measurements and related disclosures. The fair value hierarchy is based on observable or unobservable inputs to valuation techniques that are used to measure fair value. Observable inputs reflect assumptions market participants would use in pricing an asset or liability based on market data obtained from independent sources while unobservable inputs reflect a reporting entity's pricing based upon its own market assumptions. The fair value hierarchy consists of the following three levels:
- •
- Level 1: Inputs are quoted prices in active markets for identical assets or liabilities.
- •
- Level 2: Inputs are quoted prices for similar assets or liabilities in an active market, quoted prices for
identical or similar assets or liabilities in markets that are not active, and inputs other than quoted prices that are observable and market-corroborated inputs, which are derived
principally from or corroborated by observable market data.
- •
- Level 3: Inputs that are derived from valuation techniques in which one or more significant inputs or value drivers are unobservable.
The significant inputs used to derive the fair value due to seller include financial forecasts of future operating results, the probability of reaching the forecast and the associated discount rate. The probability of the contingent consideration ranges from 5% to 55% with a discount rate of 12%. The following table sets forth the Company's financial liabilities measured at fair value on a recurring basis and the basis of measurement at December 31, 2009:
| |
Total Fair Value Measurement |
Level 1 | Level 2 | Level 3 | |||||||||
|---|---|---|---|---|---|---|---|---|---|---|---|---|---|
Assets: |
|||||||||||||
Money market funds |
$ | 45,019,944 | $ | 45,019,944 | $ | — | $ | — | |||||
Liabilities: |
|||||||||||||
Due to seller |
$ | (6,170,041 | ) | $ | — | $ | — | $ | (6,170,041 | ) | |||
The following table provides a reconciliation of the beginning and ending balances for the assets measured at fair value using significant unobservable inputs (Level 3):
| |
Due to Seller | Fair Value Measurements at Reporting Date Using Significant Unobservable Inputs (Level 3) |
||||||
|---|---|---|---|---|---|---|---|---|
Balance at December 31, 2008 |
$ | — | ||||||
Contingent earnout payments—Acquisitions |
(7,152,661 | ) | ||||||
Contingent earnout payments—change in fair value |
982,620 | |||||||
Balance at December 31, 2009 |
$ | (6,170,041 | ) | |||||
For the year ended December 31, 2009, the Company recorded an adjustment to the original contingent consideration obligations recorded upon the acquisitions of RDS and FMI. The adjustments
70
Echo Global Logistics, Inc. and Subsidiaries
Notes to Consolidated Financial Statements (Continued)
Years Ended December 31, 2007, 2008 and 2009
5. Fair Value Measurement (Continued)
were the result of using revised forecasts and updated fair value measurements that adjusted the Company's potential earnout payments related to the purchase of RDS and FMI.
For the year ended December 31, 2009, the Company recognized a benefit of $982,620 in selling, general, and administrative expenses in the statement of income due to the change in fair value measurements using significant unobservable inputs.
6. Property and Equipment
Property and equipment at December 31, 2008 and 2009, consisted of the following:
| |
2008 | 2009 | |||||
|---|---|---|---|---|---|---|---|
Computer equipment |
$ | 2,121,119 | $ | 3,137,510 | |||
Software, including internal use software |
6,823,652 | 10,259,308 | |||||
Furniture and fixtures |
2,561,799 | 2,906,730 | |||||
|
11,506,570 | 16,303,548 | |||||
Less accumulated depreciation |
(4,217,181 | ) | (8,149,807 | ) | |||
|
$ | 7,289,389 | $ | 8,153,741 | |||
Depreciation expense, including amortization of capitalized internal use software, was $1,367,951, $2,522,514 and $3,932,626 for the years ended December 31, 2007, 2008 and 2009, respectively.
7. Intangibles and Other Assets
The following is a summary of goodwill as of December 31:
Balance as of December 31, 2007 |
$ | 1,854,926 | |||
Additional purchase price related to the purchase of Mountain Logistics, Inc. |
250,000 | ||||
Finalization of purchase accounting related to the purchase of Bestway, LLC |
186,768 | ||||
Balance as of December 31, 2008 |
2,291,694 | ||||
Additional purchase price related to the purchase of Mountain Logistics, Inc. |
4,200,000 | ||||
Additional purchase price related to the purchase of Bestway, LLC |
101,100 | ||||
Goodwill acquired related to the purchase of RayTrans Distribution Services, Inc |
7,488,042 | ||||
Goodwill acquired related to the purchase of Freight Management, Inc. |
4,570,660 | ||||
Balance as of December 31, 2009 |
$ | 18,651,496 | |||
71
Echo Global Logistics, Inc. and Subsidiaries
Notes to Consolidated Financial Statements (Continued)
Years Ended December 31, 2007, 2008 and 2009
7. Intangibles and Other Assets (Continued)
The following is a summary of amortizable intangible assets as of December 31, 2008 and December 31, 2009:
| |
2008 | 2009 | Weighted- Average Life |
|||||||
|---|---|---|---|---|---|---|---|---|---|---|
Customer relationships |
$ | 3,090,025 | $ | 6,441,808 | 6.0 years | |||||
Noncompete agreements |
69,000 | 139,000 | 2.9 years | |||||||
Trade names |
190,000 | 190,000 | 3.0 years | |||||||
|
3,349,025 | 6,770,808 | 5.8 years | |||||||
Less accumulated amortization |
(1,185,472 | ) | (2,243,765 | ) | ||||||
Intangible assets, net |
$ | 2,163,553 | $ | 4,527,043 | ||||||
Amortization expense related to intangible assets was $477,183, $708,289 and $1,058,293 for the years ended December 31, 2007, 2008 and 2009, respectively.
The estimated amortization expense for the next five years and thereafter is as follows:
2010 |
$ | 1,333,514 | ||
2011 |
1,221,107 | |||
2012 |
740,434 | |||
2013 |
437,714 | |||
2014 |
367,530 | |||
Thereafter |
426,744 | |||
|
$ | 4,527,043 | ||
Approximately $3,118,000 of costs associated with preparing for the Company's anticipated initial public offering are included in other assets in the December 31, 2008 consolidated balance sheet. These amounts were recorded as a reduction of the IPO proceeds in additional-paid-in-capital in 2009.
8. Accrued Expenses
The components of accrued expenses at December 31, 2008 and 2009 are as follows:
| |
2008 | 2009 | |||||
|---|---|---|---|---|---|---|---|
Accrued compensation |
$ | 460,203 | $ | 384,526 | |||
Accrued rebates |
705,149 | 943,446 | |||||
Deferred rent |
596,700 | 784,674 | |||||
Other |
1,484,081 | 945,456 | |||||
Total accrued expenses |
$ | 3,246,133 | $ | 3,058,102 | |||
9. Line of Credit
In October 2008, the Company entered into a $15.0 million line of credit with JPMorgan Chase Bank, N.A., which was due to expire on September 30, 2009. On August 26, 2009, the Company entered into an amended agreement, subsequently amended on September 8, 2009, which provides for
72
Echo Global Logistics, Inc. and Subsidiaries
Notes to Consolidated Financial Statements (Continued)
Years Ended December 31, 2007, 2008 and 2009
9. Line of Credit (Continued)
a $20.0 million line of credit and expires on July 31, 2010. The maximum amount outstanding under its line of credit cannot exceed 80% of the book value of the Company's eligible accounts receivable. The Company's line of credit contains limitations on its ability to incur indebtedness, create liens and make certain investments. Interest on the line of credit is payable monthly at an interest rate equal to either: (1) the prime rate or (2) LIBOR plus 2.25%. The Company has discretion in determining if specific advances against the line of credit are drawn down as a prime rate advance or a LIBOR advance. The terms of the credit line include various covenants, including covenants that require the Company to maintain a maximum leverage ratio and a minimum interest coverage ratio. The Company had $5.0 million outstanding on the line of credit as of December 31, 2008. No borrowings were outstanding as of December 31, 2009 as the total amount outstanding was paid in full subsequent to the IPO.
10. Commitments and Contingencies
In April 2007, as amended August 2008, the Company entered into an operating lease agreement for a new office facility. The lease agreement expires in November 2015, and has escalating base monthly rental payments ranging from $29,798 to $162,410, plus an additional monthly payment for real estate taxes and common area maintenance fees related to the building. The Company has an option to renew this lease for an additional five-year term at a lease rate that is equal to the prevailing fair market value at that time.
Additionally, the Company entered into various capital leases for the acquisition of office furniture and equipment whereby it can purchase the underlying assets for a nominal amount at the end of the lease term. The cost and accumulated amortization of the furniture and equipment capitalized in conjunction with these capital leases was $881,196 and $112,182 as of December 31, 2008, and $1,234,581 and $319,163 as of December 31, 2009, respectively. The related amortization expense is included in depreciation and amortization expense on the accompanying statements of operations.
During 2007, the Company also assumed contractual operating and capital lease obligations through acquisitions, which consisted primarily of building operating leases expiring at various dates through 2017.
73
Echo Global Logistics, Inc. and Subsidiaries
Notes to Consolidated Financial Statements (Continued)
Years Ended December 31, 2007, 2008 and 2009
10. Commitments and Contingencies (Continued)
The Company recognizes operating lease rental expense on a straight-line basis over the term of the lease. The total rent expense for the years ended December 31, 2007, 2008, and 2009, was $663,299, $1,175,691 and $2,261,395, respectively.
Future minimum annual rental payments, excluding immaterial sublease income, are as follows:
| |
Capital Leases |
Operating Leases |
|||||
|---|---|---|---|---|---|---|---|
2010 |
$ | 343,304 | $ | 2,223,224 | |||
2011 |
293,486 | 2,284,566 | |||||
2012 |
150,633 | 2,210,791 | |||||
2013 |
— | 2,034,167 | |||||
2014 |
— | 1,791,313 | |||||
Thereafter |
— | 1,382,985 | |||||
|
787,423 | 11,927,046 | |||||
Less amounts representing interest expense |
(64,065 | ) | — | ||||
|
$ | 723,358 | $ | 11,927,046 | |||
11. Income Taxes
On June 7, 2006, the Company converted from a limited liability company to a C-corporation. As a result of this conversion, the Company now accounts for income taxes in accordance with ASC Topic 740 (previously SFAS No. 109, Accounting for Income Taxes), under which deferred assets and liabilities are recognized based upon anticipated future tax consequences attributable to differences between financial statement carrying values of assets and liabilities and their respective tax bases. As a result of the $9.4 million share redemption occurring in June 2006 (see Note 12), the tax basis of the Company increased resulting in the recognition of a deferred tax asset of $3.8 million, for which a valuation allowance of $2.0 million was recorded with a corresponding net increase to additional paid-in capital of $2.0 million. Periodically, the Company reviews the continuing need for the valuation allowance based on the factors existing at the time of the review. The Company evaluated this valuation allowance as of December 31, 2009 and determined that it was more likely than not that the existing deferred tax assets would be fully realized, and the valuation allowance was reduced to zero which was recorded as a tax benefit in 2009.
Effective January 1, 2007, the Company adopted the provisions of ASC Topic 740 (previously FIN 48), a summary of which is provided in Note 2. The Company did not have any unrecognized tax benefits at adoption and, therefore, there was no effect on the Company's financial condition or results of operations as a result of implementing the guidance. In addition, there were no increases or decreases for the years ended December 31, 2007 and 2008. For the year ended December 31, 2009, the Company recognized an increase of $72,856 in unrecognized tax benefits. This was included in deferred tax liabilities as of December 31, 2009. The Company's policy is to recognize interest and penalties on unrecognized tax benefits as a component of income tax expense. As of the date of adoption, the Company did not have any accrued interest or penalties associated with unrecognized tax benefits nor did the Company record any interest or penalties during 2007, 2008 and 2009.
74
Echo Global Logistics, Inc. and Subsidiaries
Notes to Consolidated Financial Statements (Continued)
Years Ended December 31, 2007, 2008 and 2009
11. Income Taxes (Continued)
The following is a reconciliation of the total amounts of unrecognized tax benefits excluding interest and penalties for the 2009 annual reporting period:
| |
2008 | 2009 | |||||
|---|---|---|---|---|---|---|---|
Balance at January 1 |
$ | — | $ | — | |||
Gross increases—current period tax positions |
— | 72,856 | |||||
Balance at December 31 |
$ | — | $ | 72,856 | |||
The Company does not believe it will have any significant changes in the amount of unrecognized tax benefits in the next 12 months. The evaluation was performed for the tax years ended December 31, 2006, 2007, 2008 and 2009, which remains subject to examination by major tax jurisdictions.
The provision for income taxes consists of the following components for the years ended December 31, 2007, 2008 and 2009:
| |
2007 | 2008 | 2009 | ||||||||
|---|---|---|---|---|---|---|---|---|---|---|---|
Current: |
|||||||||||
Federal |
$ | — | $ | — | $ | 115,645 | |||||
State |
— | — | 80,915 | ||||||||
Total current |
— | — | 196,530 | ||||||||
Deferred: |
|||||||||||
Federal |
583,169 | 1,599,198 | (539,000 | ) | |||||||
State |
166,469 | 326,570 | (268,104 | ) | |||||||
Total deferred |
749,638 | 1,925,768 | (807,104 | ) | |||||||
Income tax expense (benefit) |
$ | 749,638 | $ | 1,925,768 | $ | (610,544 | ) | ||||
The provision for income taxes for the years ended December 31, 2006, 2007, 2008 and 2009, differs from the amount computed by applying the U.S. federal income tax rate of 34% to pretax income because of the effect of the following items:
| |
2007 | 2008 | 2009 | |||||||
|---|---|---|---|---|---|---|---|---|---|---|
Tax expense at U.S. federal income tax rate |
$ | 612,794 | $ | 1,632,451 | $ | 1,559,050 | ||||
State income taxes, net of federal income tax effect |
82,665 | 230,824 | 98,168 | |||||||
Nondeductible expenses and other |
23,955 | 85,419 | 73,573 | |||||||
Effect of state rate change on deferred items |
23,512 | (20,140 | ) | 50,730 | ||||||
Deferred tax asset valuation allowance |
— | — | (1,964,642 | ) | ||||||
Research and development credit |
— | — | (487,466 | ) | ||||||
Unrecognized tax benefits reassessment |
— | — | 72,856 | |||||||
Provision to return adjustments |
6,712 | (2,786 | ) | (12,813 | ) | |||||
|
$ | 749,638 | $ | 1,925,768 | $ | (610,544 | ) | |||
75
Echo Global Logistics, Inc. and Subsidiaries
Notes to Consolidated Financial Statements (Continued)
Years Ended December 31, 2007, 2008 and 2009
11. Income Taxes (Continued)
At December 31, 2008 and 2009, the Company's deferred tax assets and liabilities consisted of the following:
| |
2008 | 2009 | ||||||
|---|---|---|---|---|---|---|---|---|
Current deferred tax assets: |
||||||||
Reserves and allowances |
$ | 298,287 | $ | 896,357 | ||||
Total current deferred tax assets |
298,287 | 896,357 | ||||||
Noncurrent deferred tax assets: |
||||||||
Intangible assets |
3,464,816 | 2,753,729 | ||||||
Stock options |
296,275 | 420,175 | ||||||
Research and development credit |
— | 414,609 | ||||||
Net operating loss carryforward |
1,160,152 | 531,269 | ||||||
Total noncurrent deferred tax assets |
4,921,243 | 4,119,782 | ||||||
Total deferred tax assets |
5,219,530 | 5,016,139 | ||||||
Less valuation allowance for deferred tax assets |
(1,964,642 | ) | — | |||||
Total deferred tax assets, net of valuation allowances |
3,254,888 | 5,016,139 | ||||||
Total current deferred tax liability: |
||||||||
Prepaid and other expenses |
1,889,385 | 2,790,561 | ||||||
Noncurrent deferred tax liabilities: |
||||||||
Fixed assets |
1,818,426 | 1,885,818 | ||||||
Total deferred tax liabilities |
3,707,811 | 4,676,379 | ||||||
Net deferred tax asset (liability) |
$ | (452,923 | ) | $ | 339,760 | |||
As of December 31, 2009, the Company has a federal net operating loss carryforward of $1,300,000 that expires in 2027 and a state net operating loss carryforward of $1,500,000 that expires between 2018 and 2027.
12. Stockholders' Equity (Deficit)
Series A Common Stock
The Company had authorized 17,500,000 of Series A common shares, of which 12,323,352 were issued and outstanding at December 31, 2008. As of December 31, 2009 the Company had no shares of Series A Common Stock issued or outstanding.
In June 2006, the Company issued 3,129,496 Series D preferred shares for $5.56 per share and used a portion of the proceeds to redeem 1,690,648 shares of Series A common stock for $9.4 million. The 1,690,648 shares were redeemed from the following entities and individuals: (a) Polygal Row, LLC, which is an investment vehicle that was created during the formation of the Company; at the time of the redemption, two of its members served on the Company's Board of Directors and the other members had no affiliation with the Company; (b) Frog Ventures, LLC, which is an investment vehicle that is majority-owned by Kimberly Keywell, the wife of Bradley A. Keywell, one of the Company's founders (Mrs. Keywell is not affiliated with the Company other than through her ownership and her husband); (c) Echo Global Logistics Series C Investment Partners, LLC, an investment vehicle formed
76
Echo Global Logistics, Inc. and Subsidiaries
Notes to Consolidated Financial Statements (Continued)
Years Ended December 31, 2007, 2008 and 2009
12. Stockholders' Equity (Deficit) (Continued)
to purchase the Company's Series C preferred stock; at the time of the redemption, two of its members served on the Company's Board of Directors and the other members had no affiliation with the Company; and (d) two employees who owned stock in the Company at the time of the redemption.
The terms and conditions relating to the issuance of the Series D preferred stock and related redemption transactions were determined through arm's-length negotiations among the Series D preferred investors, the holders of a majority of the Series A common units, and the Company. As part of the arm's-length negotiations, the parties agreed that $9.4 million of the Series D investment would be used to redeem shares of Series A common stock on a pro rata basis excluding shares held by affiliates of the Nazarian family, who invested in the Series D preferred stock, and InnerWorkings, Inc., an investor that was in the midst of its initial public offering. The parties also agreed on the ownership percentages that the shares of Series D preferred stock and Series A common stock, each as a class, would represent in the Company on a post-transaction basis. This percentage interest was the key factor in determining the redemption price. To arrive at the appropriate ownership percentage for the holders of Series A common stock, it was agreed that $9.4 million of the Series D investment would redeem 1,690,648 shares of Series A common stock at a redemption price of $5.56 per share. A redemption price of more or less than $5.56 per share would have resulted in the holders of Series A common stock, as a class, owning a larger or smaller percentage of the Company, on a post-transaction basis, than was agreed to in the arm's-length negotiations relating to the Series D investment.
The Company did not consider the Series A redemption value of $5.56 per share to represent the fair value of the Series A common shares at that time because it was the result of the negotiation, the primary purpose of which was to establish the post-financing equity interests. The Series A common valuation of $1.54 per share that was utilized by the Company for other Series A common share transactions at that time was the result of a valuation methodology employed by the Company consistently for all periods in accordance with the AICPA Guide, Valuation of Privately Held Company Equity Securities Issued as Compensation.
No compensation expense was recorded in accordance with ASC Topic 740 (SFAS No. 123(R)), as the redemption was a negotiated transaction and was not for services rendered by or on behalf of the Company. There was no service requirement in connection with the redemption.
As of September 24, 2009, immediately following the reverse stock split (see Note 2), the 12,562,102 shares of Series A Common Stock were converted to 12,562,102 shares of newly issued common stock.
Series B Preferred Shares
The Company had authorized 62,500 Series B preferred shares, all of which were issued for proceeds of $125,000 and were outstanding at December 31, 2007 and 2008. The Series B preferred shares were entitled to annual dividends payable at a rate of 6% of the Series B original issue price. The Series B preferred shares also had a liquidation preference over Series A common shares of 100% of the Series B original issue price plus accrued but unpaid dividends. No common holders would be paid until all Series B holders' distributions have been satisfied. As of December 31, 2008, the accrued preferred dividend due to Series B holders was $27,404.
The Series B preferred shares could be automatically converted into Series A common shares: (i) in the event that holders of at least 80% of the outstanding shares of Series B preferred stock consented to a conversion, or (ii) upon the closing of a firmly underwritten public offering pursuant to an effective registration statement under the Securities Act of 1933, as amended, covering the offer and sale of common stock for the Company's account, or (iii) upon a merger, acquisition, sale of voting
77
Echo Global Logistics, Inc. and Subsidiaries
Notes to Consolidated Financial Statements (Continued)
Years Ended December 31, 2007, 2008 and 2009
12. Stockholders' Equity (Deficit) (Continued)
control, or a sale of substantially all of the assets of the Company in which shareholders of the Company do not own the majority of the outstanding shares of the surviving corporation where the aggregate proceeds payable to holders of Series D preferred stock equal a per-share price not less than two times the original purchase price of the Series D preferred stock.
The number of shares of Series A common stock to which a Series B preferred stock holder was entitled upon conversion is calculated by multiplying the applicable conversion rate then in effect (currently 1.0) by the number of Series B preferred shares to be converted. The conversion rate for the Series B preferred shares was subject to change in accordance with anti-dilution provisions contained in the agreement with those holders. More specifically, the conversion price was subject to adjustment to prevent dilution on a weighted-average basis in the event that the Company issues additional shares of common stock or securities convertible or exercisable for common stock at a purchase price less than the then effective conversion price. As of December 31, 2006, 2007, and 2008, 62,500 Series A common shares would have been required to be issued upon the conversion of all of the issued and outstanding shares of Series B preferred stock.
In determining the appropriate accounting for the conversion feature for the Series B preferred stock, the Company first evaluated the host instrument (i.e., the Series B preferred stock) using the guidance provided by ASC Topic 815-10 (EITF Topic D-109, Determining the Nature of a Host Contract Related to a Hybrid Financial Instrument Issued in the Form of a Share under FASB Statement No. 133), to determine whether the Series B preferred stock is considered to be a debt or equity host instrument. In connection with this evaluation, the Company considered the economic characteristics and risks of the host instrument based on all stated or implied substantive terms to assess whether the instrument is deemed more like equity or debt. The Company performed a detailed analysis of the features of the Series B preferred stock, including redemption features, dividend rights, voting rights, protective covenants, and conversion rights. As a result of its analysis, the Company determined that the Series B preferred stock instrument is deemed to be more akin to an equity instrument. Accordingly, the conversion feature is clearly and closely related to the Series B preferred stock host instrument, and the conversion feature is not within the scope of ASC Topic 815 (SFAS No. 133, Accounting for Derivative Instruments and Hedging Activities.
Additionally, the Company evaluated provisions of ASC Topic 470 (EITF 98-5, Accounting for Convertible Securities with Beneficial Conversion Features or Contingently Adjustable Conversion Ratios (codified within the Accounting Standards Codification, and EITF 00-27, Application of Issue No. 98-5 to Certain Convertible Instruments), to determine if the conversion feature in the Series B preferred stock instrument was considered to be a "beneficial conversion feature" in accordance with the guidance. The conversion feature did not have any intrinsic value at the commitment date (i.e., the date of the agreements) as the conversion rate is equal to or in excess of the fair value of the common stock. As a result, the conversion feature is not considered a beneficial conversion feature within the scope of either guidance.
As of September 24, 2009, immediately following the reverse stock split (see Note 2), the 62,500 shares of Series B Preferred Stock were converted to 62,500 shares of newly issued common stock. Accrued dividends of $33,155 were paid on October 7, 2009, the closing date of the initial public offering.
78
Echo Global Logistics, Inc. and Subsidiaries
Notes to Consolidated Financial Statements (Continued)
Years Ended December 31, 2007, 2008 and 2009
12. Stockholders' Equity (Deficit) (Continued)
Series D Preferred Shares
In June 2006, the Company entered into an agreement with New Enterprise Associates 12, Limited Partnership (NEA) and affiliates of the Nazarian family whereby NEA and affiliates of the Nazarian family agreed to purchase 3,129,496 shares of the Company's Series D preferred stock for $17.4 million, or $5.56 per share, which resulted in proceeds received by the Company of $17,053,169, net of issuance costs. All of the shares were outstanding at December 31, 2007 and 2008.
Affiliates of the Nazarian family were previous investors in the Company, but had not provided services to or participated in other transactions with the Company. NEA was a private investor that had not previously participated in any investment or other transactions with the Company. There are no related parties of the Company that hold an ownership interest in NEA or entities used by affiliates of the Nazarian family to invest in the Series D preferred shares.
The value of the Series D preferred stock, based on arm's-length negotiations with NEA and affiliates of the Nazarian family, was determined to be $5.56 per share. Factors contributing to a value that exceeded that of the Series A common stock were: (a) rights of first refusal and co-sale rights; (b) board representation rights; (c) information and inspection rights; (d) registration rights; (e) indemnification rights; (f) a liquidation preference equal to 150% of the Series D issuance price; (g) optional redemption rights; (h) a 6% accruing dividend; and (i) weighted-average anti-dilution protection. The value of the Class A common stock was determined in accordance with the guidance outlined in the AICPA Guide, Valuation of Privately Held Company Equity Securities Issued as Compensation and was consistently applied by the Company for all periods presented.
The Series D preferred shares were entitled to annual dividends payable at a rate of 6% of the Series D original issue price. The Series D preferred shares also had a liquidation preference of 150% of the Series D original issue price plus any accrued but unpaid dividends. No Series A or Series B holders were paid until all Series D holders' distributions were satisfied. As of December 31, 2008, the accrued preferred dividend due to Series D holders was $2,688,657.
The Series D preferred stock was fully redeemable at the greater of cost, plus accrued but unpaid dividends, or the fair market value of the shares agreed to by the Board and the holders any time on or after the five-year anniversary of the closing of the Series D preferred stock financing, or June 7, 2011. A majority of the then-outstanding Series D preferred stock holders must consent to this redemption.
The Series D preferred stock could be automatically converted into Series A common stock: (i) in the event that holders of at least a majority of the outstanding shares of Series D preferred stock consent to a conversion, or (ii) upon the closing of a firmly underwritten public offering pursuant to an effective registration statement under the Securities Act of 1933, as amended, covering the offer and sale of common stock for the Company's account on the following conditions: (a) at a per-share price not less than two times the original purchase price of the Series D preferred stock, and (b) for a total offering not less than $25 million (before deduction of underwriters' commission and expenses), or (iii) upon a merger, acquisition, sale of voting control, or a sale of substantially all of the assets of the Company in which shareholders of the Company do not own the majority of the outstanding shares of the surviving corporation where the aggregate proceeds payable to holders of Series D preferred shares equals a per-share price not less than two times the original purchase price of the Series D preferred stock. The number of shares of Series A common stock to which a Series D preferred stockholder is
79
Echo Global Logistics, Inc. and Subsidiaries
Notes to Consolidated Financial Statements (Continued)
Years Ended December 31, 2007, 2008 and 2009
12. Stockholders' Equity (Deficit) (Continued)
entitled upon conversion is calculated by multiplying the applicable conversion rate then in effect by the number of Series D preferred shares to be converted. The conversion rate for the Series D preferred shares is subject to change in accordance with anti-dilution provisions contained in the agreement with those holders. More specifically, the conversion price is subject to adjustment to prevent dilution on a weighted-average basis in the event that the Company issues additional shares of common stock or securities convertible or exercisable for common stock at a purchase price less than the then-effective conversion price.
As of December 31, 2008, 3,129,496 Series A common shares would have been required to be issued upon the conversion of all of the issued and outstanding shares of Series D preferred stock.
In determining the appropriate accounting for the conversion feature for the Series D preferred stock, the Company first evaluated the host instrument (i.e., the Series D preferred stock) using the guidance provided by ASC Topic 815-10 (EITF Topic D-109), to determine whether the Series D preferred stock is considered to be a debt or equity host instrument. In connection with this evaluation, the Company considered the economic characteristics and risks of the host instrument based on all stated or implied substantive terms to assess whether the instrument is deemed more like equity or debt. The Company performed a detailed analysis of the features of the Series D preferred stock, including redemption features, dividend rights, voting rights, protective covenants, and conversion rights. As a result of its analysis, the Company determined that the Series D preferred stock instrument is deemed to be more akin to an equity instrument. Accordingly, the conversion feature is clearly and closely related to the Series D preferred stock host instrument, and the conversion feature is not within the scope of SFAS No. 133, Accounting for Derivative Instruments and Fledging Activities.
Additionally, the Company evaluated provisions of ASC Topic 470 (EITF 98-5, Accounting for Convertible Securities with Beneficial Conversion Features or Contingently Adjustable Conversion Ratios and EITF 00-27, Application of Issue No. 98-5 to Certain Convertible Instruments), to determine if the conversion feature in the Series D preferred stock instrument is considered to be a "beneficial conversion feature" in accordance with the guidance. The conversion feature did not have any intrinsic value at the commitment date (i.e., the date of the agreements) as the conversion rate is equal to or in excess of the fair value of the common stock. As a result, the conversion feature is not considered a beneficial conversion feature within the scope of the guidance.
As of September 24, 2009, immediately following the reverse stock split (see Note 2), 3,129,496 shares of Series D Preferred Stock were converted to 3,169,057 shares of newly issued common stock. Accrued dividends of $3,489,531 were paid on October 7, 2009, the closing date of the initial public offering.
Unvested Series A Common Stock
The Company sold an aggregate amount of 705,000 unvested shares of Series A common stock in 2006 and 2007 to certain members of management and the Board of Directors for $390,500. The shares vest over a period of one to three years, and the Company has the right to repurchase these shares if a service requirement is not met. The Company sold the unvested common shares at prices ranging from $0.50 to $8.10 per share, which were equal to fair value at the time of each transaction. As a result, no compensation expense was recorded related to these transactions.
80
Echo Global Logistics, Inc. and Subsidiaries
Notes to Consolidated Financial Statements (Continued)
Years Ended December 31, 2007, 2008 and 2009
12. Stockholders' Equity (Deficit) (Continued)
As of December 31, 2007 and 2008, the total number of these shares that had vested was 256,667 and 547,500, respectively. Upon vesting, the shares are classified as outstanding shares and reflected on the statement of stockholders' equity (deficit). Prior to vesting, the payment received for the portion of shares that is unvested is classified as a current liability on the balance sheets. As of December 31, 2008, amounts due to stockholders holding unvested Series A common stock totaled was $78,750. There were no unvested common stock shares as of December 31, 2009.
Initial Public Offering
In October 2009, the Company completed an initial public offering of shares of its common stock. The Company offered and sold 5,700,000 shares of common stock at a price to the public of $14.00 per share. All 5,700,000 shares were sold by the Company. The net proceeds to the Company from the Initial Public Offering (IPO) were $68.6 million, which, in part, the Company used for dividend payments to certain shareholders, and to repay outstanding indebtedness under its line of credit and loan agreement with certain existing shareholders.
13. Earnings Per Share
Basic earnings per common share is calculated by dividing net income available to common shareholders by the weighted average number of common shares outstanding. Diluted earnings per share is calculated by dividing net income by the weighted average shares outstanding plus share equivalents that would arise from the exercise of share options and the conversion of preferred shares. Conversion of 3,191,996 of Series B and D preferred shares were excluded from the calculation for the year ended December 31 , 2007 and 2008 as they were anti-dilutive. The Series B and Series D preferred shares converted to common stock effective September 24, 2009 (see Note 12). Employee stock options totaling 1,781,084, 442,700, and 51,500 for 2007, 2008 and 2009 respectively, were excluded from the calculation of diluted earnings per share, as they were anti-dilutive. The computation of basic and diluted earnings per common share for the years ended December 31, 2007, 2008 and 2009 are as follows:
| |
Year Ended December 31, | ||||||||||
|---|---|---|---|---|---|---|---|---|---|---|---|
| |
2007 | 2008 | 2009 | ||||||||
Numerator: |
|||||||||||
Net income |
$ | 1,052,700 | $ | 2,875,556 | $ | 5,195,984 | |||||
Preferred stock dividends |
(1,054,381 | ) | (1,054,380 | ) | (806,625 | ) | |||||
Net income applicable to common shareholders |
$ | (1,681 | ) | $ | 1,821,176 | $ | 4,389,359 | ||||
Denominator: |
|||||||||||
Denominator for basic earnings per share—weighted-average shares |
11,712,643 | 12,172,716 | 14,702,760 | ||||||||
Effect of dilutive securities: |
|||||||||||
Employee stock options |
— | 644,298 | 386,233 | ||||||||
Denominator for dilutive earnings per share |
11,712,643 | 12,817,014 | 15,088,993 | ||||||||
Basic net income per common share |
$ | — | $ | 0.15 | $ | 0.30 | |||||
Diluted net income per common share |
$ | — | $ | 0.14 | $ | 0.29 | |||||
81
Echo Global Logistics, Inc. and Subsidiaries
Notes to Consolidated Financial Statements (Continued)
Years Ended December 31, 2007, 2008 and 2009
14. Stock-Based Compensation Plans
In March 2005, the Company adopted the 2005 Stock Option Plan providing for the issuance of stock options of Series A common shares. During the fourth quarter of 2009, the Company adopted the 2008 Stock Incentive Plan (The Plan). Upon adoption, the 2005 Stock Option Plan was merged into the Stock Incentive Plan and ceased to separately exist. Outstanding awards under the Stock Option Plan are now subject to the Stock Incentive Plan and no additional awards may be made under the Stock Option Plan on or after the effective date of the Stock Incentive Plan. A total of 750,000 shares of common stock have been reserved for issuance under the Plan. The plan is administered by the Board of Directors who determine the exercise price of options, the number of options to be issued, and the vesting period. As specified in the Plan, the exercise price per share shall not be less than the fair market value on the effective date of grant. The term of an option does not exceed 10 years, and the options generally vest ratably over one to five years from the date of grant.
Using the Black-Scholes-Merton option valuation model and the assumptions listed below, the Company recorded $323,044, $626,994 and $521,764 in compensation expense with corresponding tax benefits of $125,987, $244,527 and $203,488 for the years ended December 31, 2007, 2008 and 2009, respectively.
The following assumptions were utilized in the valuation for options granted in 2007, 2008 and 2009:
| |
2007 | 2008 | 2009 | |||
|---|---|---|---|---|---|---|
Dividend yield |
— | — | — | |||
Risk-free interest rate |
4.56% - 5.03% | 1.16% - 3.62% | 2.28% - 3.39% | |||
Weighted-average expected life |
6.7 years | 6.3 years | 7.1 years | |||
Volatility |
33.5% | 33.5% | 33.5% |
The volatility assumption used in the valuation for options granted was determined by analyzing the volatilities of comparable companies that are in a similar industry and stage of development as the Company. The expected life of options granted for all periods was determined using the simplified method under Staff Accounting Bulletin No. 110 (SAB 110) and is calculated by taking the average of the vesting term and contractual life of the option grant. The simplified method under SAB 110 may be used as the Company does not have sufficient historical exercise data to provide a reasonable basis upon which to estimate the expected life.
82
Echo Global Logistics, Inc. and Subsidiaries
Notes to Consolidated Financial Statements (Continued)
Years Ended December 31, 2007, 2008 and 2009
14. Stock-Based Compensation Plans (Continued)
A summary of stock option activity is as follows:
| |
Shares | Weighted- Average Exercise Price |
Weighted- Average Remaining Contractual Term (Years) |
Aggregate Intrinsic Value |
||||||||||
|---|---|---|---|---|---|---|---|---|---|---|---|---|---|---|
Outstanding at January 1, 2007 |
847,500 | $ | 2.82 | 9.6 | $ | 315,700 | ||||||||
Granted |
537,750 | 7.48 | ||||||||||||
Exercised |
(35,000 | ) | 0.02 | $ | 182,000 | |||||||||
Forfeited or canceled |
(17,500 |
) |
0.02 |
|||||||||||
Outstanding at December 31, 2007 |
1,332,750 | 4.80 | 9.0 | $ | 5,324,700 | |||||||||
Granted |
385,200 | 11.26 | ||||||||||||
Exercised |
(72,500 | ) | 5.46 | $ | 495,750 | |||||||||
Forfeited or canceled |
(151,250 |
) |
4.44 |
|||||||||||
Outstanding at December 31, 2008 |
1,494,200 | 6.32 | 8.3 | $ | 764,292 | |||||||||
Granted |
292,850 | 8.49 | ||||||||||||
Exercised |
(81,250 | ) | 1.87 | $ | 511,750 | |||||||||
Forfeited or canceled |
(42,900 |
) |
9.44 |
|||||||||||
Outstanding at December 31, 2009 |
1,662,900 | $ | 6.84 | 7.9 | $ | 9,721,099 | ||||||||
Options vested and exercisable at December 31, 2009 |
783,948 | $ | 5.66 | 7.3 | $ | 5,514,067 | ||||||||
The following table provides information about stock options granted and vested in the years ended December 31:
| |
2007 | 2008 | 2009 | ||||||||
|---|---|---|---|---|---|---|---|---|---|---|---|
Options granted: |
|||||||||||
Range of exercise prices per share of options granted |
$ | 2.16 - 8.80 | $ | 10.18 - 20.00 | $ | 6.84 - 14.06 | |||||
Options vested/exercisable: |
|||||||||||
Grant date fair value of options vested |
$ | 153,200 | $ | 1,538,526 | $ | 3,361,447 | |||||
Aggregate intrinsic value of options vested and exercisable at end of period |
$ | 1,839,950 | $ | 1,872,282 | $ | 5,514,067 | |||||
The aggregate intrinsic value of options outstanding and exercisable represents the total pretax intrinsic value (the difference between the fair value of the Company's stock on the last day of each fiscal year and the exercise price, multiplied by the number of options where the exercise price exceeds the fair value) that would have been received by the option holders had all option holders exercised their options as of December 31, 2007, 2008 and 2009, respectively. These amounts change based on the fair market value of the Company's stock, which was $8.80, $6.84 and $12.69, on the last business day of the years ended December 31, 2007, 2008 and 2009, respectively.
Determining the fair value of the Company's common stock prior to the initial public offering requires making complex and subjective judgments. The discounted cash flow method values the business by discounting future available cash flows to present value at an approximate rate of return. The cash
83
Echo Global Logistics, Inc. and Subsidiaries
Notes to Consolidated Financial Statements (Continued)
Years Ended December 31, 2007, 2008 and 2009
14. Stock-Based Compensation Plans (Continued)
flows are determined using forecasts of revenue, net income, and debt-free future cash flow. The Company's revenue forecasts for 2007 and the first three quarters of 2008 were based on expected annual growth rates ranging from 20% to 75%. In light of the significant changes in the economic environment during the fourth quarter of 2008 and the first six months of 2009, the Company's revenue forecasts for the fourth quarter of 2008 and the first six months of 2009 were based on expected annual growth rates ranging from 15% to 38%. The assumptions underlying the forecasts were consistent with the Company's business plan. The Company applied a discount rate of 20% in 2007, 2008 and the first six months of 2009 to calculate the present value of its future available cash flows, which was determined by the Company through utilization of the Capital Asset Pricing Model for companies in the "expansion" stage of development. Through the first half of 2009, the Company also applied a 5% lack of marketability discount to its enterprise value, which took into account that investments in private companies are less liquid than similar investments in public companies. The resulting value was allocated to the Company's common stock outstanding. There is inherent uncertainty in all of these estimates.
There was $1,664,001 and $1,530,334 of total unrecognized compensation costs related to the stock-based compensation granted under the plans as of December 31, 2008 and 2009, respectively. This cost is expected to be recognized over a weighted-average period of 3.1 years.
15. Benefit Plans
The Company adopted a 401(k) savings plan effective September 1, 2005, covering all of the Company's employees upon completion of 90 days of service. Employees may contribute a percentage of eligible compensation on both a before-tax basis and an after-tax basis. The Company has the right to make discretionary contributions to the plan. For the years ended December 31, 2007, 2008 and 2009, the Company did not make any contributions to the plan.
16. Significant Customer Concentration
Revenue from Archway Marketing Services accounted for 16%, 9% and 7% of the Company's total revenue for the years ended December 31, 2007, 2008 and 2009, respectively. Revenue from Cenveo accounted for 11%, 6% and 4% of the Company's total revenue for the years ended December 31, 2007, 2008 and 2009, respectively. All remaining revenue for the years ending December 31, 2007, 2008 and 2009, consisted of revenue generated from customers that were individually less than 10% of the Company's total revenue in those periods.
17. Related Parties
In August 2007, in connection with Mr. Bradley A. Keywell's service on the Company's Board of Directors, the Company granted an option to purchase 100,000 shares of its common stock at an exercise price of $8.10 per share to Holden Ventures, LLC, an entity controlled by Mr. Keywell, which vests in equal annual installments on March 15, 2008, 2009 and 2010. The exercise price was equal to the fair value of the Company's common stock as determined through the contemporaneous application of a discounted cash flow methodology by its management. The options are being accounted for in accordance with SFAS No. 123(R) (codified within the Accounting Standards Codification (ASC) Topic 718), as they were granted to a board member who is required to provide service in order for the options to vest and become excercisable. The Company used the Black-Scholes-Merton option
84
Echo Global Logistics, Inc. and Subsidiaries
Notes to Consolidated Financial Statements (Continued)
Years Ended December 31, 2007, 2008 and 2009
17. Related Parties (Continued)
valuation model to determine the compensation cost, which is being amortized ratably over the vesting period and recorded as an increase to selling, general and administrative expenses in the consolidated statements of income. The Company recognized $45,419, $136,258 and $90,020 of expense with respect to these options during 2007, 2008 and 2009, respectively, and will recognize $38,710 over the future vesting period of these options.
Certain stockholders and directors of the Company have a direct and/or indirect ownership interest in InnerWorkings, Inc. (InnerWorkings), a publicly traded company that provides print procurement services. InnerWorkings is one of the Company's stockholders. As of December 31, 2009, InnerWorkings owned 627,778 shares of the Company's common stock, or 2.9% of total shares outstanding on a fully-diluted basis.
In November 2005, the Company entered into a sublease agreement with InnerWorkings to sublease a portion of InnerWorkings' office space for approximately $7,500 per month and increased the amount of space subleased in January 2007 with an increase in lease payments to approximately $17,000 per month. The sub-lease agreement expired without penalty in April 2007. In June 2007, the Company entered into a new agreement with InnerWorkings to sublease a portion of InnerWorkings' office space for approximately $14,000 per month with monthly payments escalating to approximately $19,000 per month in 2008, $21,000 per month in 2009 and 2% annually thereafter. The agreement requires InnerWorkings to provide 12 months notice in advance of cancelling the sublease. The total expenses incurred for subleased office space during the years ended December 31, 2007 and 2008 were $178,080 and $232,002, respectively. The lease terminated in 2009 and no expenses for subleased office space were incurred in 2009. Innerworkings has also provided print procurement services to the Company during 2007, 2008, and 2009. As consideration for these services, the Company incurred expenses of $88,246, $140,000 and $60,555 for the years ended December 31, 2007, 2008 and 2009, respectively.
The Company provided transportation and logistics services to InnerWorkings during 2007, 2008 and 2009 and recognized $748,636, $2,700,001 and $4,199,204, respectively, for such services during the years ended December 31, 2007, 2008 and 2009, respectively. Effective October 1, 2006, the Company entered into a referral agreement with InnerWorkings whereby the Company agreed to pay InnerWorkings a fee equal to 5% of gross profit from shipments generated from clients that were referred to the Company by InnerWorkings, subject to a $75,000 cap per year per client. The Company recorded approximately $75,000 of referral fees in 2007. The Company incurred no referral fees for the year ended December 31, 2008. The Company terminated this agreement on February 18, 2008.
In June 2006, the Company entered into a supplier rebate program with InnerWorkings, pursuant to which the Company provides InnerWorkings with an annual rebate on all freight expenditures in an amount equal to 5% of revenue received from InnerWorkings. In April 2008, this rebate program was amended to provide InnerWorkings with an annual rebate on all freight expenditures in an amount equal to 3% of revenue received from InnerWorkings, plus an additional 2% of revenue for amounts paid within 15 days. Total supplier rebates to InnerWorkings were $14,970, $66,092 and $37,985 in 2007, 2008 and 2009, respectively.
85
Echo Global Logistics, Inc. and Subsidiaries
Notes to Consolidated Financial Statements (Continued)
Years Ended December 31, 2007, 2008 and 2009
17. Related Parties (Continued)
As of December 31, 2008 and 2009, the Company had a net receivable due from InnerWorkings of $24,903 and $1,168,538, respectively, which is included in accounts receivable in the balance sheet. The Company had no payables due to InnerWorkings as of December 31, 2008 and 2009, respectively.
During 2009, one of the Company's stockholders who is a director of the Company became a director of Manpower Inc., a publicly traded company that serves the employment services industry. For the year ended December 2009, the Company provided transportation and logistics services to Manpower and recognized $37,144 for such services. As of December 31, 2009, the Company had a net receivable due from Manpower of $7,883.
In 2007 and 2008 the Company subleased a portion of its office space to MediaBank, LLC (MediaBank), a provider of integrated procurement technology and analytics to the advertising industry whose investors include certain stockholders and directors of the Company. The sub-lease agreement was terminated on August 31, 2008. For the years ended December 31, 2007 and 2008, the Company received sublease rental income of $72,551 and $114,368, respectively. The Company had no amounts due to or from MediaBank as of December 31, 2008 or 2009.
In January 2009, the Company entered into an Independent Contract Referral Services Agreement with Holden Ventures, LLC. Under the terms of the agreement, the Company will pay Holden Ventures 10% of the gross margin, or the actual payments received minus actual expenses that the Company receives from clients by Holden Ventures. This agreement may be terminated by either party upon 15 days written notice and prohibits Holden Ventures from competing with the Company's business and soliciting its clients and employees for one year following the termination of the agreement. As of December 31, 2009, no payments have been made to Holden Ventures under the terms of this agreement.
In June 2009, the Company entered into a $7.5 million loan agreement with EGL Mezzanine LLC, members of which include certain of the Company's directors, officers and stockholders. Interest and principal on the loan was payable monthly at an interest rate equal to 13%, with a maturity date of June 2012. A portion of the funds were used for the acquisition of RDS. The loan was paid off in its entirety on October 7, 2009, with an early termination interest payment of approximately $300,000.
The Company subleases a portion of its office space to The Pointe, LLC (The Pointe), a web-based collective buying power organization whose investors include certain stockholders and directors of the Company. The sublease agreement was entered into on May 1, 2009, which was subsequently amended effective November 1, 2009. The agreement requires the Company to provide 30 days notice in advance of cancelling the sublease. For the year ended December 31, 2009, the Company received sublease rental income of $65,575. The Company had no amounts due to or from The Point as of December 31, 2009.
86
Echo Global Logistics, Inc. and Subsidiaries
Notes to Consolidated Financial Statements (Continued)
Years Ended December 31, 2007, 2008 and 2009
18. Quarterly Financial Data (Unaudited)
| |
Year Ended December 31, 2008 | ||||||||||||
|---|---|---|---|---|---|---|---|---|---|---|---|---|---|
| |
First Quarter |
Second Quarter |
Third Quarter |
Fourth Quarter |
|||||||||
Revenue |
$ | 38,928,983 | $ | 50,936,478 | $ | 58,337,878 | $ | 54,604,292 | |||||
Net revenue |
8,101,304 | 10,832,642 | 12,301,416 | 11,854,914 | |||||||||
Net income |
420,599 | 1,102,647 | 553,180 | 799,130 | |||||||||
Net income applicable to common stockholders |
158,444 | 840,492 | 288,145 | 534,095 | |||||||||
Net income per share: |
|||||||||||||
Basic |
$ | 0.01 | $ | 0.07 | $ | 0.02 | $ | 0.04 | |||||
Diluted |
$ | 0.01 | $ | 0.07 | $ | 0.02 | $ | 0.04 | |||||
| |
Year Ended December 31, 2009 | ||||||||||||
First Quarter |
Second Quarter(1) |
Third Quarter(2) |
Fourth Quarter(3) |
||||||||||
Revenue |
$ | 49,063,748 | $ | 60,290,183 | $ | 70,167,741 | $ | 80,038,986 | |||||
Net revenue |
11,013,802 | 13,239,732 | 15,442,802 | 15,971,360 | |||||||||
Net income |
27,536 | 691,710 | 1,298,635 | 3,178,103 | |||||||||
Net income (loss) applicable to common stockholders |
(237,498 | ) | 429,557 | 1,033,622 | 3,163,678 | ||||||||
Net income per share: |
|||||||||||||
Basic |
$ | (0.02 | ) | $ | 0.03 | $ | 0.08 | $ | 0.15 | ||||
Diluted |
$ | (0.02 | ) | $ | 0.03 | $ | 0.08 | $ | 0.15 | ||||
- (1)
- The
Company acquired RayTrans Distribution Services, Inc. in June 2009 and the financial results of this acquisition are included in the
consolidated financial statements beginning June 1, 2009.
- (2)
- The
Company acquired Freight Management Inc, LLC in July 2009 and the financial results of this acquisition are included in the consolidated
financial statements beginning July 1, 2009.
- (3)
- As discussed in Note 11, the financial results of the fourth quarter 2009 includes the release of a $1.9 million deferred tax asset valuation allowance, which related to the 2006 conversion from a limited-liability company to a C-Corporation.
19. Legal Matters
In the normal course of business, the Company is subject to potential claims and disputes related to its business, including claims for freight lost or damaged in transit. Some of these matters may be covered by the Company's insurance and risk management programs or may result in claims or adjustments with our carriers. Management does not believe that the outcome of such matters will have a materially adverse effect on its financial position or results of operations.
87
SCHEDULE II—VALUATION AND QAULIFYING ACCOUNTS
Valuation and Qualifying Accounts
| |
2007 | 2008 | 2009 | ||||||||
|---|---|---|---|---|---|---|---|---|---|---|---|
Allowance for doubtful accounts: |
|||||||||||
Balance at beginning of year |
$ | 100,875 | $ | 430,150 | $ | 688,197 | |||||
Provision, charged to expense |
345,785 | 585,000 | 970,761 | ||||||||
Write-offs, less recoveries |
(16,510 | ) | (326,953 | ) | (335,042 | ) | |||||
Balance at end of year |
430,150 | 688,197 | 1,323,916 | ||||||||
Income tax valuation allowance: |
|||||||||||
Balance at beginning of year |
1,964,642 | 1,964,642 | 1,964,642 | ||||||||
Release of valuation allowance recorded in connection with |
— | — | (1,964,642 | ) | |||||||
Balance at end of year |
1,964,642 | 1,964,642 | — | ||||||||
88
Item 9. Changes in and Disagreements with Accountants on Accounting and Financial Disclosure
None.
Item 9A. Controls and Procedures
Evaluation of Disclosure Controls and Procedures.
Under the supervision and with the participation of our senior management, including our chief executive officer and chief financial officer, we conducted an evaluation of the effectiveness of the design and operation of our disclosure controls and procedures, as defined in Rules 13a-15(e) and 15d-15(e) under the Securities Exchange Act of 1934, as amended (the "Exchange Act"), as of the end of the period covered by this Annual Report (the "Evaluation Date"). Based on this evaluation, our chief executive officer and chief financial officer concluded as of the Evaluation Date that our disclosure controls and procedures were effective such that the information relating to the Company, including consolidated subsidiaries, required to be disclosed in our Securities and Exchange Commission ("SEC") reports (i) is recorded, processed, summarized and reported within the time periods specified in SEC rules and forms, and (ii) is accumulated and communicated to the Company's management, including our chief executive officer and chief financial officer, as appropriate to allow timely decisions regarding required disclosure.
Internal Control over Financial Reporting
This annual report does not include a report of management's assessment regarding internal control over financial reporting or an attestation report of the Company's registered public accounting firm due to a transition period established by rules of the Securities and Exchange Commission for newly public companies.
Changes in Internal Control Over Financial Reporting
There have been no changes in our internal control over financial reporting during the quarterly period ended December 31, 2009 that have materially affected, or are reasonably likely to materially affect, our internal control over financial reporting.
Effective April 1, 2010, Scott A. Frisoni will no longer serve as the Company's Executive Vice President of Sales. Mr. Frisoni will continue his employment with the Company as Director of Business Development.
Item 10. Directors, Executive Officers and Corporate Governance
Certain information required by this Item 10 relating to our directors and executive officers is incorporated by reference herein from our 2010 proxy statement to be filed with the SEC not later than 120 days after the close of our fiscal year ended December 31, 2009.
We
have adopted a code of ethics, which is posted in the Investor section on our website at
http://www.echo.com. We intend to include on our website any amendments to, or waivers from, a provision of
the code of ethics that applies to our
principal executive officer, principal financial officer, or controller that relates to any element of the code of ethics definition contained in Item 406(b) of SEC Regulation S-K.
89
Item 11. Executive Compensation
Certain information required by this Item 11 relating to remuneration of directors and executive officers and other transactions involving management is incorporated by reference herein from our 2010 proxy statement to be filed with the SEC not later than 120 days after the close of our fiscal year ended December 31, 2009.
Item 12. Securtity Owenership of Certain Beneficial Owners and Management and Related Stockholder Matters
Securities Authorized For Issuance Under Equity Compensation Plan
Plan Category
| |
Number of Securities to be(a) Issued Upon Exercise of Outstanding Options |
Weighted Average Exercise Price of Outstanding Options |
Number of Securities Remaining Available for Future Issuance under Equity Compensation Plans (Excluding Securities Reflected in Column (a)) |
|||||||
|---|---|---|---|---|---|---|---|---|---|---|
Equity compensation plans approved by secruity holders(1) |
1,662,900 | $ | 6.84 | 477,500 | (2) | |||||
Equity compensation plans not approved by secruity holders(3) |
— | — | — | |||||||
Total |
1,662,900 | $ | 6.84 | — | ||||||
- (1)
- Includes
our 2005 Stock Option Plan, which was merged with our 2008 Stock Incentive Plan
- (2)
- Includes
shares remaining available for future issuance under our 2008 Stock Incentive Plan
- (3)
- There are no equity compensation plans in place not approved by our stockholders
Certain information required by this Item 12 relating to security ownership of certain beneficial owners and management is incorporated by reference herein from our 2010 proxy statement to be filed with the SEC not later than 120 days after the close of our fiscal year ended December 31, 2009.
Item 13. Certain Relationships and Related Transactions, and Director Independence
Certain information required by this Item 13 relating to certain relationships and related transactions and director independence is incorporated by reference herein from our 2010 proxy statement to be filed with the SEC not later than 120 days after the close of our fiscal year ended December 31, 2009.
Item 14. Principal Accounting Fees and Services
Certain information required by this Item 14 regarding principal accounting fees and services is incorporated by reference herein from the section entitled "Matters Concerning Our Independent Registered Public Accounting Firm" in our 2010 proxy statement to be filed with the SEC not later than 120 days after the close of our fiscal year ended December 31, 2009.
90
Item 15. Exhibits, Financial Statement Schedules
(a)(1) Financial Statements: Reference is made to the Index to Financial Statements and Financial Statement Schedule in the section entitled "Financial Statements and Supplementary Data" in Part II, Item 8 of this Annual Report on Form 10-K.
(2) Financial Statement Schedule: Reference is made to the Index to Financial Statements and Financial Statement Schedule in the section entitled "Financial Statements and Supplementary Data" in Part II, Item 8 of this Annual Report on Form 10-K. Schedules not listed above are omitted because they are not required or because the required information is given in the consolidated financial statements or notes thereto.
(3) Exhibits: Exhibits are as set forth in the section entitled "Exhibit Index" which follows the section entitled "Signatures" in this Annual Report on Form 10-K. Certain of the exhibits listed in the Exhibit Index have been previously filed with the Securities and Exchange Commission pursuant to the requirements of the Securities Act of 1933, as amended, and the Securities Exchange Act of 1934, as amended. Such exhibits are identified by the parenthetical references following the listing of each such exhibit and are incorporated by reference.
Exhibits which are incorporated herein by reference can be inspected and copied at the public reference rooms maintained by the SEC in Washington, D.C., New York, New York, and Chicago, Illinois. Please call the SEC at 1-800-SEC-0330 for further information on the public reference rooms. SEC filings are also available to the public from commercial document retrieval services and at the Web site maintained by the SEC at http://www.sec.gov.
91
Pursuant to the requirements of Section 13 or 15(d) of the Securities Exchange Act of 1934, as amended, the Registrant has duly caused this report to be signed on its behalf by the undersigned, thereunto duly authorized.
| ECHO GLOBAL LOGISTICS, INC. | ||||
By: |
/s/ DOUGLAS R. WAGGONER Douglas R. Waggoner Chief Executive Officer |
|||
Pursuant to the requirements of the Securities Exchange Act of 1934, as amended, this report has been signed below by the following persons on behalf of the registrant and in the capacities and on the dates indicated.
Signature
|
Title
|
Date
|
||
|---|---|---|---|---|
| /s/ DOUGLAS R. WAGGONER Douglas R. Waggoner |
Chief Executive Officer (principal executive officer) and Director |
March 17, 2010 | ||
/s/ DAVID B. MENZEL David B. Menzel |
Chief Financial Officer (principal accounting and financial officer) |
March 17, 2010 |
||
/s/ SAMUEL K. SKINNER Samuel K. Skinner |
Chairman of the Board |
March 17, 2010 |
||
/s/ JOHN R. WALTER John R. Walter |
Director |
March 17, 2010 |
||
/s/ JOHN F. SANDNER John F. Sandner |
Director |
March 17, 2010 |
||
/s/ PETER J. BARRIS Peter J. Barris |
Director |
March 17, 2010 |
||
/s/ ANTHONY R. BOBULINSKI Anthony R. Bobulinski |
Director |
March 17, 2010 |
92
Signature
|
Title
|
Date
|
||
|---|---|---|---|---|
| /s/ ERIC P. LEFKOFSKY Eric P. Lefkofsky |
Director | March 17, 2010 | ||
/s/ BRADLEY A. KEYWELL Bradley A. Keywell |
Director |
March 17, 2010 |
||
/s/ MATTHEW W. FERGUSON Matthew W. Ferguson |
Director |
March 17, 2010 |
93
| Exhibit No. | Description | ||
|---|---|---|---|
| 3.1 | (1) | Amended and Restated Certificate of Incorporation. | |
| 3.2 | (1) | By-laws. | |
| 3.3 | (1) | Second Amended and Restated Certificate of Incorporation. | |
| 3.4 | (1) | Amended and Restated By-laws. | |
| 4.1 | (1) | Specimen Common Stock Certificate. | |
| 4.2 | (1) | Investor Rights Agreement effective as of June 7, 2006 by and among Echo Global Logistics, Inc. and certain investors set forth therein. | |
| 4.3 | (1) | Waiver of Investor Rights, dated as of July 24, 2009, by and among Echo Global Logistics, Inc. and certain investors set forth therein. | |
| 4.4 | (1) | Form of Recapitalization Agreement. | |
| 10.1 | (1)† | Echo Global Logistics, LLC 2005 Stock Option Plan. | |
| 10.2 | (1)† | Amended and Restated Echo Global Logistics, Inc. 2008 Stock Incentive Plan. | |
| 10.3 | (1)† | Echo Global Logistics, Inc. Annual Incentive Plan. | |
| 10.4 | (1)† | Employment Agreement, dated as of September 24, 2009, by and between Echo Global Logistics, Inc. and Douglas R. Waggoner. | |
| 10.5 | (1)† | Employment Agreement, dated as of April 7, 2008, by and between Echo Global Logistics, Inc. and David B. Menzel. | |
| 10.6 | (1)† | Employment Agreement, dated as of March 1, 2005, by and between Echo Global Logistics, Inc. and Vip Sandhir. | |
| 10.7 | (1)† | Employment Agreement, dated as of September 24, 2009, by and between Echo Global Logistics, Inc. and Orazio Buzza. | |
| 10.8 | (1)† | Employment Agreement, dated as of September 24, 2009, by and between Echo Global Logistics, Inc. and David Rowe. | |
| 10.9 | (1)† | Employment Agreement, dated as of January 1, 2008, by and between Echo Global Logistics, Inc. and Scott P. Pettit. | |
| 10.10 | (1) | Confidential Separation Agreement by and between Echo Global Logistics, Inc. and Scott P. Pettit. | |
| 10.11 | (1) | Irrevocable Proxy Agreement dated March 31, 2008 by and between Echo Global Logistics, Inc. and Scott P. Pettit. | |
| 10.12 | (1) | Form of Indemnification Agreement. | |
| 10.13 | (1) | Asset Purchase Agreement effective as of July 21, 2007 by and among Echo Global Logistics, Inc., SelecTrans, LLC, Douglas R. Waggoner, Allison L. Waggoner and Daryl P. Chol. | |
| 10.14 | (1) | Asset Purchase Agreement dated June 2, 2009 by and among Echo/RT Holdings, LLC, RayTrans Distribution Services, Inc., RayTrans Holdings, Inc. and James A. Ray. | |
| 10.15 | (1) | Amended and Restated Loan and Security Agreement, dated August 26, 2009, by and between Echo Global Logistics, Inc. and EGL Mezzanine LLC. | |
94
| Exhibit No. | Description | ||
|---|---|---|---|
| 10.16 | (1) | Amended and Restated Credit Agreement, dated August 26, 2009, by and between Echo Global Logistics, Inc. and JPMorgan Chase Bank, N.A., as amended by the First Amendment to Amended and Restated Credit Agreement, dated as of September 8, 2009. | |
| 21.1 | (1) | Subsidiaries of Echo. | |
| 31.1 | Certification of Chief Executive Officer pursuant to Section 302 of the Sarbanes-Oxley Act 2002. | ||
| 31.2 | Certification of Chief Financial Officer pursuant to Section 302 of the Sarbanes-Oxley Act of 2002. | ||
| 32.1 | Certification of Chief Executive Officer and Chief Financial Officer pursuant to 18 U.S.C. Section 1350, as adopted pursuant to Section 906 of the Sarbanes-Oxley Act of 2002. | ||
- (1)
- Incorporated
by reference to Form S-1 Registration Statement (File No. 333-150514).
- †
- Management contract or compensatory plan or arrangement of the Company.
95