Attached files
Table of Contents
UNITED STATES
SECURITIES AND EXCHANGE COMMISSION
Washington, D.C. 20549
FORM 10-K
(Mark One)
| x | ANNUAL REPORT PURSUANT TO SECTION 13 OR 15(d) OF THE SECURITIES EXCHANGE ACT OF 1934 |
For the fiscal year ended December 31, 2009
or
| ¨ | TRANSITION REPORT PURSUANT TO SECTION 13 OR 15(d) OF THE SECURITIES EXCHANGE ACT OF 1934 |
For the transition period from to
Commission File Number 000-52642
Westway Group, Inc.
(Exact name of registrant as specified in its charter)
| Delaware | 20-4755936 | |
| (State or other jurisdiction of incorporation or organization) |
(I.R.S. Employer Identification No.) | |
| 365 Canal Street, Suite 2900, New Orleans, LA | 70130 | |
| (Address of principal executive offices) | (Zip Code) | |
(504) 525-9741
(Registrant’s telephone number, including area code)
Securities registered pursuant to Section 12(b) of the Act:
| Title of each class |
Name of exchange on which registered | |
| Class A Common Stock, $0.0001 par value | The NASDAQ Stock Market LLC | |
| Warrants, each exercisable to purchase one share of Class A Common Stock | The NASDAQ Stock Market LLC | |
| Units, each consisting of one share of Class A Common Stock and two Warrants | The NASDAQ Stock Market LLC |
Securities registered pursuant to Section 12(g) of the Act: None
Indicate by check mark if the registrant is a well-known seasoned issuer, as defined in Rule 405 of the Securities Act. ¨ Yes x No
Indicate by check mark if the registrant is not required to file reports pursuant to Section 13 or Section 15(d) of the Act. ¨ Yes x No
Indicate by check mark whether the registrant (1) has filed all reports required to be filed by Section 13 or 15(d) of the Securities Exchange Act of 1934 during the preceding 12 months (or for such shorter period that the registrant was required to file such reports), and (2) has been subject to such filing requirements for the past 90 days. x Yes ¨ No
Indicate by check mark whether the registrant has submitted electronically and posted on its corporate Web site, if any, every Interactive Data File required to be submitted and posted pursuant to Rule 405 of Regulation S-T (§232.405 of this chapter) during the preceding 12 months (or for such shorter period that the registrant was required to submit and post such files). ¨ Yes ¨ No
Indicate by check mark if disclosure of delinquent filers pursuant to Item 405 of Regulation S-K (§ 229.405 of this chapter) is not contained herein, and will not be contained, to the best of registrant’s knowledge, in definitive proxy or information statements incorporated by reference in Part III of this Form 10-K or any amendment to this Form 10-K. ¨
Indicate by check mark whether the registrant is a large accelerated filer, an accelerated filer, a non-accelerated filer, or a smaller reporting company. See the definitions of “large accelerated filer,” “accelerated filer” and “smaller reporting company” in Rule 12b-2 of the Exchange Act. (Check one):
| Large accelerated filer | ¨ | Accelerated filer | x | |||||
| Non-accelerated filer | ¨ | (Do not check if a smaller reporting company) | Smaller reporting company | ¨ | ||||
Indicate by check mark whether the registrant is a shell company (as defined in Rule 12b-2 of the Exchange Act). ¨ Yes x No
The aggregate market value of the voting and non-voting common equity held by non-affiliates of the registrant computed by reference to the price at which the registrant’s Class A Common Stock, par value $0.0001 per share, was last sold as of June 30, 2009, the last business day of the registrant’s most recently completed second fiscal quarter, was $51.4 million.
As of March 8, 2010, 13,951,933 shares of our Class A Common Stock, par value $0.0001 per share, and 12,624,003 shares of our Class B Common Stock, par value $0.0001, were outstanding. The number of shares of our Class A common stock outstanding stated above includes 1,000,000 shares issued to Shermen WSC Holding LLC and held in escrow to be released upon achievement of earnings or share price targets.
DOCUMENTS INCORPORATED BY REFERENCE
Portions of the registrant’s definitive proxy statement for its 2010 annual meeting of stockholders, which is expected to be filed with the Securities and Exchange Commission by April 30, 2010, are incorporated by reference into Part III of this Form 10-K.
Table of Contents
Westway Group, Inc. Index to Form 10-K
| Certain Defined Terms | 4 | |||
| Special Note Regarding Forward-Looking Statements | 4 | |||
| PART I | ||||
| Item 1. | 5 | |||
| 5 | ||||
| 7 | ||||
| 10 | ||||
| 13 | ||||
| 15 | ||||
| 20 | ||||
| 24 | ||||
| 26 | ||||
| 26 | ||||
| 27 | ||||
| 27 | ||||
| Item 1A. | 27 | |||
| Item 1B. | 42 | |||
| Item 2. | 42 | |||
| 42 | ||||
| 44 | ||||
| Item 3 | 45 | |||
| Item 4. | 46 | |||
| PART II | ||||
| Item 5. | 46 | |||
| Item 6. | 49 | |||
| Item 7. | Management Discussion and Analysis of Financial Condition and Results of Operations |
51 | ||
| 51 | ||||
| 52 | ||||
| 53 | ||||
| 54 | ||||
| 56 | ||||
| 62 | ||||
| 63 | ||||
| 66 | ||||
| 73 | ||||
| 73 | ||||
| 75 | ||||
| Item 7A. | 75 | |||
2
Table of Contents
| Item 8. | 77 | |||
| 82 | ||||
| 84 | ||||
| 86 | ||||
| 89 | ||||
| 90 | ||||
| 92 | ||||
| 92 | ||||
| 93 | ||||
| 94 | ||||
| 103 | ||||
| 108 | ||||
| 109 | ||||
| 111 | ||||
| 111 | ||||
| 112 | ||||
| 112 | ||||
| 113 | ||||
| 113 | ||||
| 115 | ||||
| 118 | ||||
| 120 | ||||
| 121 | ||||
| 121 | ||||
| 126 | ||||
| 130 | ||||
| 131 | ||||
| Item 9. | Changes in and Disagreements with Accountants on Accounting and Financial Disclosure |
132 | ||
| Item 9A. | 132 | |||
| Item 9B. | 133 | |||
| PART III | ||||
| Item 10. | 134 | |||
| Item 11. | 134 | |||
| Item 12. | Security Ownership of Certain Beneficial Owners and Management and Related Stockholder Matters |
134 | ||
| Item 13. | Certain Relationships and Related Transactions, and Director Independence |
134 | ||
| Item 14. | 134 | |||
| PART IV | ||||
| Item 15. | 135 | |||
| SIGNATURES | 136 | |||
| EXHIBIT INDEX | 137 | |||
3
Table of Contents
Unless the context otherwise requires, when used in this annual report on Form 10-K:
| • | the “Company” or “we” or “us” or “Westway Group, Inc.” means the public company now named Westway Group, Inc. (which was named Shermen WSC Acquisition Corp. before May 28, 2009), together with its wholly-owned subsidiaries; |
| • | “WGI” means the public company now named Westway Group, Inc. only, not including any of its subsidiaries; |
| • | the “acquired business” or “predecessor” means the bulk liquid storage and liquid feed supplements businesses, prior to acquisition, that were acquired by the Company from the ED&F Man group in the business combination; |
| • | the “business combination” means the set of transactions consummated on May 28, 2009, by which the Company acquired the acquired business; |
| • | “ED&F Man” means ED&F Man Holdings Limited, on an unconsolidated basis; |
| • | “ED&F Man group” means ED&F Man and its direct and indirect subsidiaries; and |
| • | “Holdings” means Westway Holdings Corporation, a subsidiary of ED&F Man and member of the ED&F Man group; |
| • | In circumstances where we wish to stress that we are limiting the time period when we are referring to the Company, we have referred to the Company before the business combination as “Shermen WSC Acquisition Corp.” or simply “Shermen”; |
| • | “Class A common stock” means our Class A Common Stock, par value $0.0001 per share (this class is listed on NASDAQ; generally, shares of this class automatically convert into shares of Class B common stock at any time they become owned by a member of the ED&F Man group); |
| • | “Class B common stock” means our Class B Common Stock, par value $0.0001 per share (this class is not listed on NASDAQ; generally, shares of this class automatically convert into shares of Class A common stock at any time they cease to be owned by a member of the ED&F Man group); and |
| • | “Series A Convertible Preferred Stock” means our Series A Perpetual Convertible Preferred Stock, par value $.0001 per share (this class is not listed on NASDAQ). |
SPECIAL NOTE REGARDING FORWARD-LOOKING STATEMENTS
This Annual Report on Form 10-K includes statements reflecting assumptions, expectations, projections, plans, intentions, or beliefs about future events that are intended as “forward-looking statements.” The forward-looking statements are made within the meaning of Section 27A of the Securities Act of 1933, as amended, and Section 21E of the Securities Exchange Act of 1934, as amended. We intend the forward-looking statements in this Annual Report on Form 10-K or made by us elsewhere to be covered by the safe harbor provisions for forward-looking statements contained in the Private Securities Litigation Reform Act of 1995, and we are including this statement for purposes of complying with these safe harbor provisions.
We have based our forward-looking statements on our current expectations and projections about future events, trends, and uncertainties. There are a number of important factors that could cause our actual results and financial position to differ materially from those contemplated by our forward-looking statements. Our forward-looking statements are not guarantees of future performance and are subject to risks, uncertainties and assumptions, including, among other things, the risk factors discussed in the “Risk Factors” section of this Form 10-K.
Our business is highly complex and competitive, with many different factors affecting results. Any or all of our forward-looking statements may turn out to be wrong, and actual results may differ materially from those expressed or implied by our forward-looking statements. They can be affected by inaccurate assumptions or by known or unknown risks, uncertainties and other factors, many of which are beyond our control. We undertake no obligation to publicly update or revise any forward-looking statements, whether as a result of new information, future events, or otherwise.
4
Table of Contents
PART I
| ITEM 1. | BUSINESS |
We were originally incorporated as Shermen WSC Acquisition Corp., a “special purpose acquisition” corporation, in Delaware on April 18, 2006. We were formed for the purpose of acquiring an operating business in the agriculture industry through a merger, capital stock exchange, asset acquisition, stock purchase, or other similar business combination. From inception through May 28, 2009, we did not have any business or operations. Our activities were limited to raising capital in our initial public offering and subsequently identifying and acquiring an operating business.
On May 28, 2009, we completed the acquisition of the bulk liquid storage and liquid feed supplements businesses of the ED&F Man group (which we refer to as the “acquired business” or our “predecessor”) by effecting mergers of the two principal subsidiaries of ED&F Man engaged in the bulk liquid storage and liquid feed supplements businesses (Westway Terminal Company, Inc. and Westway Feed Products, Inc.) into two of our wholly-owned subsidiaries (now named Westway Terminal Company LLC and Westway Feed Products LLC) and by purchasing the equity interests of the other subsidiaries of ED&F Man engaged in the bulk liquid storage or liquid feed supplements businesses. The business combination was approved by our stockholders on May 26, 2009. In conjunction with the completion of the business combination, we changed our name from Shermen WSC Acquisition Corp. to Westway Group, Inc.
The consideration we paid in connection with the closing of the business combination consisted of approximately 12.6 million newly-issued shares of our Class B common stock (fair value of $63.1 million), approximately 30.9 million newly-issued shares of our Series A Convertible Preferred Stock (fair value of $177.3 million), including 12.2 million escrowed shares that are to be released from escrow only if the Company achieves certain earnings or share price targets, and $103.0 million in cash, plus certain post closing adjustments of $1.1 million which were settled in cash. If the targets are achieved and the shares are released from escrow, the Company estimates the aggregate value of the consideration to be $344.6 million.
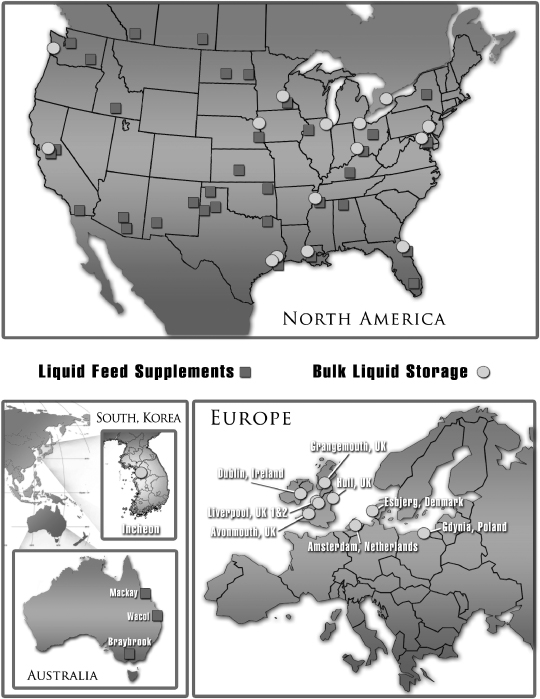
Through our wholly-owned subsidiaries, we are a leading provider of bulk liquid storage and related value-added services, and a leading manufacturer and distributor of liquid animal feed supplements. We operate an extensive global network of 62 operating facilities providing 348 million gallons of total bulk liquid storage capacity and producing approximately 1.6 million tons of liquid feed supplements annually.
Our bulk liquid storage business is a global business with locations at key port and terminal sites throughout North America and in Western Europe and Asia. Our infrastructure includes a network of 25 terminals offering storage to manufacturers and consumers of agricultural and industrial liquids.
Our liquid feed supplements business produces liquid animal feed supplements that are sold directly to end users, which we refer to as “ranchers,” and feed manufacturers, primarily supplying the beef and dairy livestock industries. By using formulation processes that are tailored specifically to the needs of our customers, we blend molasses and essential nutrients to form feed rations that help to maximize the genetic potential of livestock.
This complementary relationship between our bulk liquid storage and liquid feed supplements businesses benefits from synergies including co-location of facilities, enhanced raw material supply logistics for liquid feed supplements, increased operational efficiency resulting from cross-business knowledge exchange, and resource optimization.
We also benefit significantly from the breadth of markets served by our businesses. Our bulk liquid storage business has maintained a long-term presence in a number of highly strategic, deep water ports around the world. This location advantage provides our international customer base access to strategic storage locations and the highest level of service for these critical markets. Our liquid feed supplements business is the leading North American manufacturer of liquid feed supplements and the only supplier with a true U.S. national footprint.
5
Table of Contents
World Wide Locations
6
Table of Contents
At the beginning of 2009, we were a special purpose acquisition company named Shermen WSC Acquisition Corp. We neither engaged in any operations nor generated any revenues, other than interest income earned on the proceeds of our initial public offering and our private placement of warrants to our founders.
Since January 1, 2009, we have taken advantage of a number of opportunities and achieved a number of significant milestones. These include concluding the business combination in which we acquired the bulk liquid storage and liquid feed supplements businesses of the ED&F Man group, securing a credit facility with a syndicate of quality banks, and listing our Class A common stock on the NASDAQ stock market. These accomplishments and others since January 1, 2009 are discussed below.
First Quarter 2009
Having entered into an agreement with the ED&F Man group in November 2008 for the acquisition of their bulk liquid storage and liquid feed supplements businesses in exchange for shares of our common and preferred stock and cash, during the first quarter of 2009 we focused primarily on advancing the proposed business combination to a successful consummation. In January 2009 we filed our first preliminary proxy statement in connection with the proposed business combination. In February 2009 we held presentations for certain of our stockholders, as well as other persons who might be interested in purchasing our securities, regarding the transactions contemplated by the agreement between us and the ED&F Man group.
Second Quarter 2009
In the second quarter of 2009, after further work by us and the ED&F Man group, the proposed business combination was successfully consummated, and, with a new board and management team, we began operation of the bulk liquid storage and liquid feed supplements businesses that we acquired from the ED&F Man group. Meanwhile, our bulk liquid storage business embarked on two new expansion projects.
In May 2009, we entered into an amended and restated transaction agreement with the ED&F Man group that modified the terms under which we would acquire their bulk liquid storage and liquid feed supplements businesses. Among other things, the amended and restated agreement provided for ED&F Man to provide us with a $100 million revolving credit facility to facilitate the business combination and for purposes including working capital and capital expenditures. Also in May, as reflected in the amended and restated transaction agreement, ED&F Man sponsored a trust that acquired shares of our common stock through open market transactions, later voted them in favor of the business combination, and at the closing of the business combination exchanged the shares of our common stock for shares of ED&F Man held by employees who had elected to participate in the exchange.
On May 26, 2009, at our annual meeting, our stockholders approved the proposed business combination, as well as the amendment and restatement of our certificate of incorporation, which provided for our two classes of common stock and our new Series A Convertible Preferred stock, among other things. To facilitate the consummation of the business combination, we also entered into a letter agreement with the ED&F Man group and Shermen WSC Holding LLC that provided, among other things, for (i) ED&F Man’s consent to our purchase of 2,514,369 shares of our common stock in privately negotiated transactions (from stockholders who had indicated an intention to vote against the proposed business combination) and (ii) Shermen WSC Holding LLC’s agreement to return to us for cancellation 3,266,608 shares of our common stock. Meanwhile, 9,189,990 shares of our common stock were converted into the right to receive cash from our trust account established in connection with our initial public offering.
We completed our acquisition of the bulk liquid storage and liquid feed supplements businesses of the ED&F Man group on May 28, 2009. The business combination was effected by merging the two principal subsidiaries of
7
Table of Contents
ED&F Man that engaged in the bulk liquid storage and liquid feed supplements businesses into two of our wholly-owned subsidiaries and by our purchase of the equity securities of ED&F Man’s other subsidiaries that also engaged in the bulk liquid storage and liquid feed supplements businesses. In exchange, we paid $103 million in cash and issued 12,624,003 shares of our Class B common stock and 30,886,830 shares of our Series A Convertible Preferred stock to a subsidiary of ED&F Man (of which 12,181,818 shares of Series A Convertible Preferred stock were deposited in escrow for release upon our achievement of certain earnings or share price targets). We also incurred one-time business combination expenses of $13.9 million for advisory, investment banking, accounting, legal, and other professional and consulting fees. Various agreements were entered into at the closing of the business combination between us and the ED&F Man group, including but not limited to a molasses supply agreement, a storage strategic alliance agreement and terminal service agreement, a shared services agreement, a stockholders agreement, a stock escrow agreement, a registration rights agreement, and a $100 million interim credit facility agreement and related letter agreement.
As a result of the business combination, ED&F Man and its affiliates became our largest stockholder, owning 47.5% of our outstanding common stock and 100% of our Series A Convertible Preferred stock. The composition of our board of directors changed, with an ED&F Man subsidiary choosing three of our seven directors, and the holders of our Class A common stock (formerly our only class of common stock) electing the other four. Our new management was drawn from former management personnel of the ED&F Man group, and we changed our name to Westway Group, Inc. We began operation of the bulk liquid storage and liquid feed supplements businesses on May 29, 2009. We believe that the business combination provided an excellent platform for the growth of the bulk liquid storage and liquid feed supplements businesses and that they will reap strong benefits from our public company status.
In June 2009, in accordance with agreements made in connection with the business combination, our board of directors declared a special cash dividend of $1.00 per share, on our common stock, which dividend was waived by ED&F Man and its affiliates and by Shermen WSC Holding LLC.
In May 2009, about a week before the business combination, Westway Terminal Company, Inc., the principal ED&F Man subsidiary engaged in the bulk liquid storage business, reached an agreement with an international petroleum company for the storage of lube oils at the subsidiary’s Port Allen terminal located at the Port of Greater Baton Rouge in Louisiana. The new agreement provided for storage of 73,000 barrels in existing tankage, to commence in August 2009, and for storage of 95,000 barrels in new construction, to begin in October 2010, which we refer to as the Phase 1 expansion of the Port Allen terminal facility. The new agreement is expected to add approximately $2.2 million to our annual revenue. Similarly, in June 2009, we opened Phase 1 of a custom-built bulk liquid storage terminal for Nynas Americas at our Houston No. 1 terminal. The state-of-the-art, customized logistics hub, located along the Houston Ship Channel and initially consisting of 25 tanks with a storage capacity of 400,000 barrels, was designed to provide dedicated logistics, blending, and special loading facilities for Nynas specialty products and to accommodate maximum flexibility. Phase 1, which began in June, involved the transition of transformer oils. Phase 2 began in October when all other products were transitioned. The facility was completed at the end of 2009.
Third Quarter 2009
In the third quarter of 2009, we took advantage of several opportunities for acquisition and expansion. In July 2009, we acquired a bulk liquid storage facility, with 7.6 million gallons of capacity, located outside of San Francisco, California.
In August 2009, we launched the Phase 1 expansion of our Port Allen terminal facility. Phase 1 of our expansion plan included the construction of four 1-million gallon bulk liquid storage tanks. In September 2009, after having secured an additional long-term contract for storage at the Port Allen facility, we launched a second phase of the expansion, which is expected to provide an additional 1.5 million gallons of capacity, along with additional dock line and infrastructure, including truck loading and rail.
8
Table of Contents
In October 2009, we completed the acquisition of the storage assets and property of Southside River Rail Terminal, Inc., located in Cincinnati, Ohio, which was one of the largest independent, full-service bulk liquid handling facilities in the Mid-West U.S. The purchase price was approximately $20 million. The new facility is located immediately adjacent to one of our existing liquid animal feed supplement operations, and it handles barges, rail and truck operations, with 37 million gallons of bulk liquid storage capacity.
In August 2009, the Company entered into a $100 million revolving credit facility agreement with ED&F Man Treasury Management plc (“ED&F Man Treasury”) an affiliate of ED&F Man, that replaced and terminated the $100 million interim facility agreement that was previously entered into between the same parties upon the consummation of the business combination. The basic economic terms of the new agreement were substantially similar to the economic terms of the earlier agreement.
During the third quarter we also dealt with a change in management and the filing of a registration statement. In July 2009, Steve Boehmer was appointed Executive Vice President (and acting President) of Westway Feed Products, LLC as of August 1, 2009, and President of Westway Feed in September 2009. Mr. Boehmer previously served as Vice President Operations of Westway Feed or its predecessor from January 2003 to July 2009 and as National Operations Manager of the predecessor from August 1999 to January 2003. He has over 34 years of experience in the feed industry.
In August 2009, we filed with the SEC our Post-Effective Amendment No. 2 to our registration statement on Form S-1 relating to the shares of our Class A common stock issuable upon exercise of warrants that we previously issued to investors in connection with our initial public offering. The post-effective amendment became effective on August 7, 2009.
Fourth Quarter 2009
In the fourth quarter of 2009, we secured a significant new credit facility with a syndicate of banks, obtained listing of our Class A common stock on NASDAQ, and completed several expansion projects, while continuing to work on others.
In November 2009, we secured a new 3-year, $175 million senior secured revolving credit facility, provided by a nine-bank syndicate led by JPMorgan Chase Bank, N.A. and arranged by JPMorgan Securities Inc. In addition to JPMorgan Chase Bank, N.A., the initial syndicate consisted of Regions Bank, Capital One, N.A., Compass Bank, Rabobank Nederland, Suntrust Bank, Whitney National Bank, Societe Generale, and CoBank ACB. We were pleased with the high level of interest and willingness to commit significant funding to us by the syndicate of quality banks.
The new facility replaced the $100 million facility previously provided by ED & F Man Treasury. The new $175 million facility was used to refinance the approximately $88 million balance under the ED & F Man Treasury credit facility, leaving $87 million of available credit under the new facility for general corporate purposes, which could include among other things working capital, capital expenditures, and acquisitions. We believe the credit provided by this new facility signifies the completion of another important step in our growth strategy.
The new facility allows borrowing at the London Interbank Offered Rate (“LIBOR”) plus 350 bpts. The terms of the new facility are similar to those of the ED& F Man Treasury facility, except for the collateral provided and an accordion feature which allows the new facility to be expanded to $200 million. The new facility is described in detail below in “Liquidity and Capital Resources” section of Item 7 of this Form 10-K.
In December 2009, we were notified that our application to list our Class A common stock, warrants, and units on the NASDAQ stock market had been approved, and they began trading under the symbols “WWAY,” “WWAYW,” and “WWAYU,” respectively. We were very pleased to list our securities on NASDAQ, one of the
9
Table of Contents
world’s preeminent stock exchanges. We view this upgrade from the OTC Bulletin Board as a significant milestone in our development, as we hope to obtain higher visibility within the investment community and the media, leading to improved liquidity of our stock and the attraction of new stockholders.
We currently have several major facilities that were under construction and came on-line at the end of 2009 which will add to our core earning capacity, notably Gray’s Harbor, located in Washington state, and Phase 4 of our Houston No. 1 facility. Earnings from these facilities are not expected to be fully reflected in our results of operations until the first quarter of 2010.
Since January 1, 2010
In February 2010, as required by and as additional security for our obligations under the bank syndicate credit agreement, Westway Terminal Company LLC, Westway Terminal Cincinnati LLC, and Westway Feed Products LLC, all subsidiaries of ours, entered into seven first priority mortgage liens on their fee or leasehold interests, as applicable, in certain terminal and feed facilities having an aggregate fair market value of approximately $120 million. The facilities include two terminal facilities and one feed facility in Houston, Texas; a terminal facility and a feed facility in Cincinnati, Ohio; and a terminal facility in Grays Harbor, Aberdeen, Washington.
Also in February 2010, we filed with the SEC a registration statement on Form S-3 registering approximately 21.2 million shares of our Class A common stock for sale by various of our shareholders, including a subsidiary of ED&F Man, various former and current employees of the ED&F Man group, and various of our directors and officers. This registration statement became effective February 10, 2010.
In March 2010, we and the ED&F Man group reached a non-binding agreement in principle for the ED&F Man group’s lease of our Port of Inchon, South Korea terminal and all of the improvements and equipment thereon, to commence upon the expiration in May, 2010 of the terminal service agreement between the parties. Currently, the ED&F Man group is our sole bulk liquid storage customer at the Korean terminal. Pursuant to the proposed lease, the ED&F Man group would take full control and responsibility for the Korean terminal and the improvements and equipment thereon, hire our employees at the terminal, and operate the terminal for the storage of its bulk liquids. The lease would be a triple-net lease (where all expenses, insurance and taxes related to the leased property would be paid by the lessee) and would provide for rental to be paid to us in the amount of $400,000 per year. The lease is also expected to have a principal term of three years and grant an option to the ED&F Man group for the purchase of the Korean terminal and all of its improvements and equipment for a purchase price of $3,000,000, exercisable at any time during the term of the lease.
Risks
Our statements about our corporate plans, including our expansion plans, their cost, and their effect on our terminal capabilities and storage capacity, and statements about our hopes to obtain more visibility, stock liquidity, and stockholders, are forward-looking and involve not only opportunities and challenges but also risks. Important factors that could cause our actual results to differ materially include changes in demand for bulk liquid storage or for liquid animal feed supplements, unanticipated delays in construction or increased construction costs due to weather, disputes with contractors, or opposition by environmental groups, and our results of operations and general market conditions in the future. For a more detailed description of risks that we face, please see the “Risk Factors” section, Item 1A of this Form 10-K.
Increase Volumes of Existing Products and Services
We believe that global demand for our bulk liquid storage service and liquid feed supplements products will continue to increase over the long-term, although such demand may decline from time to time in particular years depending on global economic conditions.
10
Table of Contents
In the bulk liquid storage business, despite the uncertainty that is affecting the wider economy, growth is expected to be driven by the underlying expansion in long-term demand for a wide variety of agricultural and industrial raw materials that are fundamental to our target industries and sectors. In 2010, however, we are anticipating a reduction in demand for storage of molasses in Europe by our largest customer, the ED&F Man group. We are endeavoring to secure other customers to use the storage in Europe for other products, which typically support higher profit margins than molasses.
Likewise, in the long-term, we expect the liquid feed supplements business to continue to benefit from increasing global demand for higher protein content livestock feed and the ongoing shift toward liquid supplements from traditional dry feed products. This trend has become particularly significant in recent years as prices for traditional corn and dry protein meals have been highly volatile. In 2010, however, we expect that the weak state of the U.S. beef and dairy industries will continue to depress demand for cows and consequently animal feed, including liquid feed supplements.
In anticipation of long-term growing demand, we expect to utilize the significant capital resources provided by the business combination to increase storage and production volumes at existing facilities and to open new facilities at strategic locations in North America, Europe and Asia. For example, planning is underway on a 4.16 million gallon expansion of our existing storage facility in Amsterdam, Netherlands, and a 3.1 million gallon infill expansion in Houston, TX. We are also adding an additional 5.7 million gallons of capacity in Port Allen, LA during 2010. In the liquid feed supplements business, we intend to leverage our position as an international leader in liquid livestock supplement technology to market our products to various developing nations outside of North America. Additionally in North America, we intend to expand our successful feedlot liquid supplement business to states beyond the Texas panhandle.
When evaluating new facility development opportunities, we utilize a series of objective criteria to assess the potential benefits of additional infrastructure, logistics capability, overall environmental condition, political stability, and payback period. Through this process, we will analyze, prior to commitment, whether the proposed investments are expected to generate attractive financial returns and how to minimize execution risk. In addition, prior to construction or expansion of any new facilities, we will seek to secure significant interest from potential customers in order to ensure that our investments are supported by contracted base revenues.
Pursue Acquisitions
The bulk liquid storage and liquid feed supplement industry sectors remain highly fragmented, with numerous small and mid-sized companies operating in North America, Europe and Asia. We believe this market fragmentation provides us with significant opportunities for expansion. Our management maintains an active dialogue with numerous potential acquisition targets and frequently explores opportunities in the context of our strategic goals and financial return expectations. Our management team has significant experience acquiring and integrating new businesses in order to increase the size and scope of our operations, and intends to continue to pursue this strategy as new opportunities become available in the future. Our management has a history of successfully identifying both financially and strategically attractive targets. When evaluating potential acquisitions, our management team intends to focus on those opportunities which will increase storage or production capacity in key markets, enhance our product and service offering, or provide entry into strategically attractive geographies.
Develop New Products and Services
We are committed to developing a range of products and services that will further embed our business as a critical component in our customers’ supply chain, resulting in revenue and earnings growth opportunities for the Company.
In bulk liquid storage, we intend to offer new or expanded services to our customers through our high quality infrastructure and state-of-the-art technical competencies. In 2009, we brought a custom base oil blending
11
Table of Contents
system online at our Houston facility which was specifically designed for optimal market flexibility for one of our customers and resulted in an attractive 50 month payback period to us. Our base oil blending system provided this customer with a long-term technical solution to meet the demands of their ever changing market.
In addition, we intend to pursue opportunities to expand our product offering to accommodate storage of complementary agricultural and industrial liquids. For example, we are currently exploring the development of a major new hub for handling methanol at one of our facilities. Methanol is an important supply item for the bio-diesel industry, as well as for an array of other industrial manufacturing processes.
In our liquid feed supplements business, we see potential to further invest in the development and manufacture of innovative, nutritionally-enhanced livestock feed supplements by leveraging our strong research and development capabilities. Our strategy is to find products that incorporate and/or expand on newly developed technologies or raw materials that have not been previously utilized. These products typically provide the most significant potential for profit and have the most potential to differentiate us in the marketplace. For example, we are currently exploring new product opportunities related to emerging liquid by-products from the biofuel industry, edible packaging alternatives, new applications for calcium hydroxide (a reactive ingredient used to harden block products and in the manufacture of some of our suspension products), and low-cost suspension products for the beef industry. Suspension products are liquid feed supplements that contain insoluble ingredients (e.g. limestone or potassium chloride).
Expand into Complementary Businesses
We believe our international network of facilities, extensive management experience, and core operating capabilities in the manufacturing, storage, and distribution of liquid products creates numerous opportunities for us to expand into complementary businesses. For example, our management sees significant potential in exploring the North American liquid fertilizer market as an expansion opportunity. Distribution of traditional fertilizer products reflects competitive dynamics and infrastructure requirements similar to our existing liquid feed supplements business, and we have significant experience in storing and handling these products through our bulk liquid storage business.
Pursue International Joint Venture and Royalty Agreements
We intend to actively explore joint venture and strategic alliance opportunities with global business partners to expand our business interests and geographic network. In bulk liquid storage, we are exploring various strategic alliance agreements with biodiesel manufacturing companies that would utilize our tank capacity for both raw materials and finished product storage. Such partnerships would position us as a critical component of our partners’ supply chains and have the potential to create lasting commercial relationships. For example, in Houston, the construction of a biodiesel production plant by a third party on land leased by us has been completed. As a result of this arrangement, our Houston tank capacity will be utilized for all inbound and outbound liquids under contract for this third party.
In liquid feed supplements, we (including our predecessor) have expanded our geographic market in Australia through the Champion Liquid Feeds Pty Ltd. joint venture. Prior to establishing the joint venture in 2001, we had no exposure to Australia, and our joint venture partner, Australia’s largest manufacturer and distributor of dry animal feed products, had little exposure to the liquid feed supplement market. By combining our and their respective areas of expertise, we have created a successful liquid feed manufacturer that is poised for significant future growth in this market. In addition, there are significant opportunities to leverage our technological leadership in liquid feed supplements by establishing royalty agreements with complementary organizations for the manufacturing and distribution of our products worldwide.
12
Table of Contents
Leverage Relationship with the ED&F Man Group
Our strong ongoing relationship with the ED&F Man group provides significant opportunities for future growth. In the bulk liquid storage business, it is anticipated that the continued long-term growth and diversification of the ED&F Man group’s global trading of liquid agricultural products is likely to provide further opportunities to deploy and expand our storage footprint and service opportunities. For example, within the last several years, the ED&F Man group has significantly increased its trading activities in bio-diesel and tropical oils (e.g., palm and coconut oils). Currently, the global market for bio-diesel as a fuel substitute has declined due to changes in U.S. government policy; however, we anticipate a global expansion of tropical oils, which will provide additional growth opportunities. Should the U.S. government policy change, whereby the dollar per gallon blended tax credit is reinstated, we expect there would be a positive impact on this segment of the industry. Our liquid feed supplements business has the potential to benefit from the supply of new raw materials by the ED&F Man group for use in the production of new liquid feed supplement products. We will also be in the unique position to leverage the ED&F Man group’s global business network and strong agricultural commodity operating experience as we expand into new geographies and complementary businesses. Our Australian investment in Champion Liquid Feeds Pty Ltd. was a direct result of the ED&F Man group’s relationships in that region.
Forward-Looking Statements
This section regarding our growth strategies contains numerous forward-looking statements, including our statements about future growth in demand for various products and services and about our plans, intentions, or hopes to increase storage and production volumes, open new facilities, expand terminal capacity through target infill development, market products in developing nations, expand our feedlot liquid supplement business, pursue acquisitions, invest in the development of and develop new products and services, explore the North American fertilizer market, and explore joint venture and strategic alliance opportunities. There are a number of important factors that could cause actual results to differ materially from our forward-looking statements, including the factors discussed at length in the “Risk Factors” section, Item 1A of this Form 10-K.
Broad Geographic Footprint and Strategic Location of Facilities
We operate an extensive global network of 62 operating facilities providing 348 million gallons of total bulk liquid storage capacity and approximately 1.6 million tons of annual liquid feed supplements production. In our bulk liquid storage business, we operate 25 terminal locations globally, with a strong presence in the U.S. and Western Europe and an initial presence in Asia via our facility in Inchon, South Korea. Many of our storage facilities are located in highly strategic deep water port locations such as Houston, TX; Philadelphia, PA; Jacksonville, FL; Baltimore, MD; and Grays Harbor, WA in the U.S., as well as Amsterdam, Netherlands; Gydnia, Poland; and Liverpool, U.K. in Europe. In our liquid feed supplements business, we operate 37 facilities strategically located throughout the U.S. and Western Canada, including three facilities in Australia through our 50% interest in Champion.
Additionally, we benefit from our broad geographic footprint and the extensive experience of our management. We operate in a variety of regional, national and international markets. In our bulk liquid storage business, we offer our customers a truly global storage solution with a high level of expertise across multiple markets. We provide tailored services for customers initially commencing operations or requiring local infrastructure in specific markets. Our access to extensive high quality storage capacity in critical deep water port locations is a differentiating factor in the marketplace. The strategic locations of our bulk liquid storage terminals and the barriers to entry of additional competitors at these locations constitute key strengths of our bulk liquid storage business.
In liquid feed supplements, we provide the broadest geographic coverage of any North American liquid feed supplements manufacturer, and are the only producer capable of supplying all lower 48 U.S. states, as well
13
Table of Contents
as five provinces in Canada and parts of northern Mexico. Moreover, our seven deep-water port locations and a key alliance at the Melbourne, Australia port gives us a competitive advantage over other liquid feed supplements companies in our markets by allowing us to more readily obtain feed ingredients economically. By these means we are able to leverage our global network and extensive market insights to explore expansion opportunities in complementary markets.
Differentiated Product and Service Offering
We provide a differentiated service to manufacturers, bulk liquid traders, and those corporations looking to minimize cost and maximize flexibility of service in both the bulk liquid storage and liquid feed supplement markets.
In our bulk liquid storage business, we are one of the few service providers capable of providing a truly global service across a broad range of agricultural and industrial liquids. We offer numerous tailored services such as heating, blending, testing and transloading (the transfer of products from one transportation vehicle, such as a rail car or a ship, to a truck) and have customized our service contracts to meet specific customer requirements. Our bulk liquid storage business is nimble, responsive, and able to meet the changing storage- related needs of our customers.
We offer a broad range of liquid feed supplements, ranging from simple molasses-based blends and mill products to highly complex suspension products. Further, our proprietary manufacturing processes allow us to customize our feed products to meet specific customer nutritional requirements and to respond to changing availability of raw materials.
The range of our product and service offerings and our attention to a high level of customer service enables us to differentiate ourselves in the marketplace and to maintain our leading market positions in the bulk liquid storage and liquid feed supplements sectors. Our business approach reinforces the strategic nature of our relationships with customers, who we believe generally view us more as a long-term partner rather than merely as an industrial supplier.
Strong Relationships with Blue-Chip Customers
We have developed long-standing relationships with numerous well-established global customers, many of whom have been doing business with us (or our predecessor) for more than 10 years. Our ability to attract and retain these blue-chip customers is the direct result of our differentiated product and unparalleled customer service. Ongoing strategic customer relationships facilitate the achievement of long-term contracts, which in turn provide for more stable revenue and income streams.
To reduce the risk of unused capacity in our facilities, we build upon strategic relationships by tailoring new products and services to meet specific customer needs. For example, commissioning of the new 13.4 million gallon facility in Gray’s Harbor, WA in 2009 was the direct response to a specific customer need for bulk liquid storage in the Pacific Northwest. In this case, our staff worked closely with the customer to determine size, location and functionality of the new facility to meet the customer’s specifications. As a result, we were able to secure a long-term commitment for all of the new storage capacity at the new facility before beginning construction. Establishment of this site allows us to gain access to a key, previously untapped, North American market, thereby providing us with the ability to expand our storage capacity in this important market in the future.
In the liquid feed supplements business, quality customers and strategic alliances with industry leaders are key elements contributing to our growth. For example, we (through our predecessor) were able to secure the role of exclusive provider of liquid suspension and molasses blended products to a major US based cattle feed operation in 1995. This relationship has grown over the years and is now expected to lead to additional opportunities for growth in this market.
14
Table of Contents
Strategic Relationship with the ED&F Man Group
Our acquisition of the bulk liquid storage and liquid feed supplements businesses provided independence in the market and the capital resources necessary to optimize future growth, while maintaining the benefits of a close strategic relationship with the ED&F Man group. To this end, we and the ED&F Man group have entered into agreements that establish us as the ED&F Man group’s preferred supplier of bulk liquid storage services globally and establish the ED&F Man group as our preferred supplier of cane molasses for our liquid feed supplements business.
High-Quality and Experienced Management Team
We have a highly experienced senior management team comprised of Peter Harding as Chief Executive Officer, Thomas Masilla as Chief Financial Officer, Wayne N. Driggers as Chief Operating Officer, Scott MacKenzie as President of our bulk liquid storage business, and Steve Boehmer as President of our liquid feed supplements business. Mr. Harding has worked in agri-business for 35 years, and Messrs. Driggers, MacKenzie and Boehmer have 30, 20, and 34 years of relevant industry experience, respectively. Mr. Masilla possesses over 35 years of executive and financial management experience in publicly traded entities.
We also benefit from the commitment of a talented pool of middle managers who possess strong operational and market experience across our various functions and geographies. In particular, we believe one of the important strengths of our Company is our health, safety, environmental, and quality team, which provides continual reviews for policy and regulatory compliance, minimizes exposure to loss, ensures the highest quality of service to our customers, and maintains the life of our facilities. In keeping with our strategy for future growth, our management team possess the skill and experience of having designed and executed numerous acquisitions, new site openings, expansions of facilities, and new product introductions.
Overview
Our bulk liquid storage business operates a network of facilities located in North America, Western Europe, and Asia, providing storage and related services to manufacturers and purchasers of bulk liquid products. We coordinate closely with our customers’ technical services and product handling experts in designing and adapting the customized product handling systems required for each customer’s specific product. By this means, our facilities become critical links in the distribution chains of our customers. Our customers represent a diverse group of multi-national, national, and regional corporations. Our value-added services are customer specific and include transloading of bulk liquids as well as acting as regional distribution centers for our customers on an entirely outsourced basis. Underpinning all of our services is our foremost objective, which is to differentiate our service quality by achieving the highest level of customer satisfaction. Our proprietary systems, rapid execution, and superior commodity management expertise has led to many long-term customer relationships.
During the last three fiscal years (and during the approximate 7 month period from November 1, 2008 to May 28, 2009) our bulk liquid storage business (or its predecessor) had the following net revenues (in thousands) from external customers, operating income, and total assets:
| Predecessor | ||||||||||||
| Fiscal Year Ended December 31, 2009(1) |
November 1, 2008 through May 28, 2009 |
Fiscal Year Ended October 31, 2008 |
Fiscal Year Ended October 31, 2007 | |||||||||
| Net Revenues |
$ | 45,134 | $ | 40,715 | $ | 79,754 | $ | 69,630 | ||||
| Operating Income |
$ | 15,086 | $ | 12,722 | $ | 25,879 | $ | 18,459 | ||||
| Total Assets |
$ | 353,083 | $ | 115,680 | $ | 108,326 | ||||||
| (1) | Year ended December 31, 2009 includes only 217 days of acquired business operations. |
15
Table of Contents
Services—by Product Stored
We serve many diverse markets, focusing on the provision of bulk liquid storage services for a wide range of products that are best described by using eight primary product groupings, set out below. Our terminals handle a broad spectrum of specialty products through a number of features, including rail capacity, dedicated pipelines, on-scale, top-loading of trucks, heating capacity, and multiple tank sizes, including small and medium capacity tanks. This diverse product portfolio helps to minimize our exposure to significant customer risk. We are also active in businesses related to bulk liquid storage, such as direct transloading (primarily from railcars to trucks), blending, and dilutions.
The product groups stored by our bulk liquid storage business worldwide are further described as follows:
| • | Molasses and Liquid Animal Feed Products. Historically, storage of molasses for the liquid feed supplements and yeast production industries has comprised a major single component of our bulk liquid storage business. We are well positioned in this product category, given our significant experience handling highly viscous liquids and our specialized infrastructure that includes large, positive displacement pumps and large diameter pipelines. Due to our ongoing, long-term relationship with the ED&F Man group, these products are expected to remain a key part of our storage portfolio. |
| • | Vegetable Oils, Tallows, and Greases. For decades, we or our predecessor have handled customer requirements for storage and transportation of vegetable oils, tallows and greases. These products are utilized in the food, biofuels, industrial soaps, detergent, and biochemical industries and require specialized services such as heated tankage and kosher certification. |
| • | Lignin Sulphonate, Calcium Chloride, and Liquid Fertilizers. Our experience with non-hazardous bulk solutions such as calcium chloride, urea ammonium nitrate, and lignin sulphonate is extensive. These products are tied to basic industries such as agriculture and paper production. Because these products are corrosive, specialized tank linings are required to maintain quality control and safe handling. |
| • | Petroleum, Petro-Chemicals, Waxes, and Petroleum Oil. Our position in this category is primarily concentrated in storing niche products, such as paraffin waxes and lubrication oils, derived from the petroleum refining process for candle, coatings and automotive markets, in addition to certain other heavy industries. The heat and viscosity requirements of these products lend themselves to our high value-added service model. Generally, we do not handle petroleum fuels, gasoline, or traditional petro-chemicals (e.g. benzene or toluene). |
| • | Chemicals. Since the mid 1990s, we or our predecessor have expanded our storage services into a more diverse range of chemical products, for producers and distributors serving manufacturing and industrial markets. Subsequent improvements in industry-specific expertise have provided us with the experience necessary to handle these products. We conduct a thorough risk analysis when evaluating all new chemical opportunities to ensure minimal safety or environmental risk. |
| • | Caustics. Chloralkali products, including sodium and potassium hydroxide, are stored on behalf of industrial use producers and distributors and comprised the first product for which our predecessor commenced storage for external customers in the 1970s. Specialized heated tank linings and piping systems are utilized to protect product quality and ensure efficient handling of products for, among others, municipalities and the sanitation and paper production industries. |
| • | Methyl Esters (Bio-diesel). We or our predecessor have been handling methyl esters since 2002 on behalf of producers and distributors. Our employees are familiar with the unique properties of methyl esters and systems that exist to ensure that our quality control and safe handling standards are maintained. These systems include standardized handling processes and the use of specialized sealants to prevent moisture intrusion. The ED&F Man group’s trading of bio-fuels provides a base volume for us and is expected to be an opportunity for growth. |
16
Table of Contents
| • | Asphalts. We handle asphalt products used in roadways and in roofing applications. At our Baltimore, MD and St. Paul, MN facilities, special systems have been constructed to handle asphalts. We have boilers, hot oil systems, tank heating coils, and insulated tanks and pipelines which are necessary to keep these products flowing properly through our facilities. |
For each of the last three fiscal years (and for the approximate 7-month period from November 1, 2008 to May 28, 2009), no single class of similar services (i.e., services for the same product group) accounted for 10% or more of our total overall consolidated net revenue.
Services—by Activity Performed
We provide our customers with a broad range of value-added services across all stages of the bulk liquid storage value chain:
| Receipt |
Storage |
Handling |
Distribution |
Transloading |
Other | |||||
| Custom facilities Lab diagnostics | Carbon scrubbing Dry air treatment Foam systems Gauging Hot oil systems Lined/stainless tanks Nitrogen treatment |
Additive injection Custom blending Direct transfer Drumming Filtration Heating Packaging Piggable lines Recirculation Dilutions |
Logistics planning Rail scaling Rail services |
Rail to truck Truck to rail Ship to rail |
Audit Documentation FEMAS certification Food grading GMP certification ISO certification Marketing |
We work closely with our customers to design service packages and contracts that meet their specific storage and handling requirements. This process results in a varying degree of complexity across customer relationships and generates long-term, collaborative relationships. For example, some customers require only basic storage services such as tank storage, product receipt and delivery services, and occasional transloading. Others have more complex requirements, including the provision of temperature regulation, blending, or diagnostic testing services. At the greatest degree of complexity, we are able to operate regional distribution centers, functioning on an entirely outsourced basis and providing a full complement of value-added services, such as logistics planning and product marketing. The breadth of services and flexibility we provide to customers differentiates us in the marketplace and provides management with a distinct advantage when competing for new business.
Customers
Our customer-focused approach results in a number of long-standing relationships with major customers. No single customer, or group of customers under common control or that are affiliates of each other, accounts for more than 10% of our consolidated total revenues. The ED&F Man group accounts for 19% of the revenues of our bulk liquid storage business, which to that extent is dependent on the ED&F Man group, and the loss of the ED&F Man group as a customer would have a material adverse effect on our bulk liquid storage business. As discussed in more detail below in the subsection entitled “Our Relationship with the ED&F Man Group,” we have a long-term contractual relationship as a preferred supplier of bulk liquid storage to the ED&F Man group. Our bulk liquid storage business is not dependent on any other single or few customers, the loss of which would have a material adverse effect on the business.
A large proportion of our bulk liquid storage business’ sales are derived from highly-regarded multi-national corporations, many of which are included in the Forbes Global 2000 list of largest companies. Our relationships
17
Table of Contents
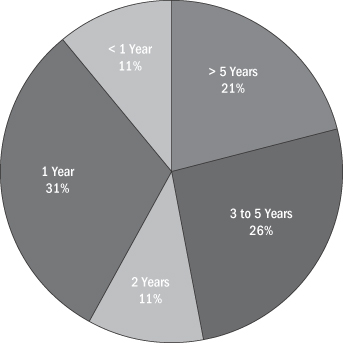
with these customers have resulted in longer term contracts. Approximately 58% of our bulk liquid storage contracts are two years or more in length and approximately 47% are three years or longer as of December 31, 2009. This is set out below in more detail:
Length of Storage Contracts—Terminals Worldwide as of December 31, 2009
Seasonality
Our bulk liquid storage business generally is not seasonal, but it is to a degree affected by the economy. Utilization of our terminal facilities is dependent in large part on the level of demand for customer products stored in our terminals in the markets served by these facilities. Demand for our terminal services generally increase or decrease with the demand for the stored products. For example, the demand for molasses generally is higher during winter and lower during summer. Despite this seasonality, the overall seasonal impact on the volume of product throughput at our terminals is not material.
Demand for most of the customer products we store tends to increase or decrease with the relative strength of the economy. The recent contraction in the global financial and credit markets has adversely affected the liquidity and the credit available to many enterprises and accordingly has lowered the demand for many products.
Working Capital Practices
Our bulk liquid storage business requires us to use working capital for maintenance, repairs, and upgrades to our storage facilities, as well as for personnel costs prior to receiving payments from customers. Our working capital requirements will vary with the timing of maintenance, repair, and upgrade projects throughout the year.
We normally invoice our customers for liquid bulk storage on the first of each month with repayment terms of 30 days. The average days outstanding for 2009 were approximately 28 days.
18
Table of Contents
Government Contracting
Many of our storage terminal facilities are located on land leased from federal, foreign, state or local governments, frequently from a local port authority. We have had excellent relationships with the port authorities over the years. We are aware, however, that at our Avonmouth terminal, the Port of Bristol is evaluating the market conditions for building a new container terminal. The proposed project scope of this container terminal would impact the continuance of our lease at our Avonmouth terminal. At this time, no decision has been made by the Port of Bristol.
Competition
Competitive Conditions
Our bulk liquid storage business competes in international, national, regional, and local markets, throughout the United States, western Canada, northern Mexico, portions of Western Europe, and Korea. The competitive environment in which we operate, the number of competitors, and our market position varies across different markets.
In the international market, competitors include multi-national providers such as NuStar Energy L.P. and Royal Vopak N.V. In the United States, at a national level, beyond NuStar, other major competitors include Kinder Morgan Energy Partners, International-Matex Tank Terminals (50% owned by Macquarie Infrastructure Company LLC), and TransMontaigne. At locations in Europe, such as Denmark and Poland, competition also derives from smaller independent storage businesses and former state-owned installations.
The principal competition for each of our facilities comes from other third-party bulk liquid storage facilities located in the same regional or local market. In regional and local markets, we face competition from independent storage businesses operating in a number of markets served by us, such as Simon Storage Ltd. (owned by Interpipeline Fund) in the United Kingdom. In some regional and local markets, such as St. Paul, MN, Jacksonville, FL, and Toledo, OH, our facilities represent a significant proportion of available bulk liquid storage capacity. In other markets, such as Houston, TX, our facilities represent only a small proportion of available bulk liquid storage capacity and have numerous competitors with facilities of similar or larger size and with similar capabilities.
The breadth of service we provide also results in customer offerings that compete directly with LBC Holdings LLC (owned by Challenger Infrastructure Fund), Royal Vopak N.V., and Stolt-Nielsen S.A. for more tailored, complex, and value-added services.
Across product groups, our bulk liquid storage business competes with companies having a primary focus in the storage of specific products, such as hydrocarbons and derivatives, as well as with businesses providing a more broad range of services.
We also compete with other companies involved in the bulk liquid storage business for acquisition and expansion opportunities.
Principal Methods of Competition
Independent terminal owners principally compete on the basis of the location and versatility of terminals, service, and price.
A favorably located terminal will have access to various cost-effective transportation modes both to and from the terminal. Transportation modes typically include waterways, railroads, and roadways.
19
Table of Contents
Terminal versatility is a function of the operator’s ability to offer complex handling requirements for diverse products. The services typically provided by the terminal include, among other things, the safe storage of the product at specified temperature, moisture, and other conditions, as well as receipt at and delivery from the terminal, all of which must be in compliance with applicable environmental regulations.
A terminal operator’s ability to obtain attractive pricing is often dependent on the quality, versatility, and reputation of the facilities owned by the operator. Although many products require modest terminal modification, operators with versatile storage capabilities typically require less modification prior to usage, ultimately making the storage cost to the customer more attractive.
Factors Affecting Competitive Position
Positive factors pertaining to our competitive position are discussed at length above in the subsection entitled “Competitive Strengths.” Negative factors pertaining to our competitive position include the fact that some of our competitors are larger than we are, have greater financial resources and lower costs of capital and control more storage capacity than we do, and accordingly sometimes are able to offer a better price or greater storage capacity. There are also occasions where a competitor has a facility in a location that enables it to serve a particular customer’s need more economically than our nearest facility. These negative factors are further described in the “Risk Factors” section of this Form 10-K.
Liquid Feed Supplements Business
Overview
Through our 37 strategically located facilities in North America, western Canada, and eastern Australia, we provide liquid feed supplements to the lower 48 U.S. states, five Canadian provinces, northern Mexico, and Australia. By using formulation processes that are tailored specifically to the needs of customers, we blend molasses and essential nutrients to form feed rations that help to maximize the genetic potential of livestock. Typically, these supplements contain concentrated forms of protein, energy, minerals, and vitamins, which normally comprise 5-10% of an animal’s daily diet. Beef cattle, dairy cattle, and horses consume the majority of our liquid feed supplements. We invest in research into new products and manufacturing processes in order to maintain the strength of our competitive position. To date, we have capitalized on the value of our intellectual property through a joint venture in Australia, and we are currently analyzing similar opportunities in New Zealand and Mexico.
In the United States, the liquid feed supplements industry dates back to the first report of a simple molasses-urea mix being fed to cattle in 1943, with the first commercial liquid supplement being introduced in 1951. Today, the industry has expanded into a dynamic, growing market, with new products blended into a wide variety of liquids and other ingredients to meet the needs of multiple livestock industries. Our manufacturing and distribution locations allow us to provide nutritional liquid feed supplements to the majority of the U.S. livestock markets. In addition, eight of our facilities are positioned at deep water port locations, allowing the receipt of off-shore ingredients such as molasses and condensed molasses solubles. These deep water port terminals provide a strategic barrier to entry into the North American liquid feed supplements business. The balance of our manufacturing locations are either strategically located on navigable inland river systems or have direct railroad access.
20
Table of Contents
During the last three fiscal years (and during the approximate 7 month period from November 1, 2008 to May 28, 2009), our liquid feed supplements business (or its predecessor) had the following net revenues (in thousands) from external customers, operating income, and total assets:
| Predecessor | ||||||||||||
| Fiscal Year ended December 31, 2009(1) |
November 1, 2008 through May 28, 2009 |
Fiscal Year ended October 31, 2008 |
Fiscal Year ended October 31, 2007 | |||||||||
| Net Revenues |
$ | 143,653 | $ | 171,304 | $ | 290,569 | $ | 222,871 | ||||
| Operating Income |
$ | 8,918 | $ | 6,784 | $ | 6,297 | $ | 3,991 | ||||
| Total Assets |
$ | 140,784 | $ | 96,064 | $ | 79,228 | ||||||
| (1) | Year ended December 31, 2009 includes only 217 days of acquired business operations. |
Products
Our finished products provide supplemental nutrients that allow livestock to perform to their maximum genetic potential. We use specialized manufacturing of complex formulations of several raw basic ingredients, including proteins, minerals, and vitamins, to produce complex liquid and block supplements for sale to livestock feed operators, dry feed mills, or distributors. We also produce less complex products that are utilized as an ingredient in livestock feeds specifically to enhance the appearance, preserve the product, improve the palatability, or act as a binding agent for other dry feed ingredients. Specialized least-cost formulation programs allow us to maximize margins while providing the best performing product for the customer.
Our product classes and their more specific subcategories are as follows:
Complex Liquid Feed Protein Supplements, Suspensions, and Mill Products
| • | Liquid Protein Supplements. Liquid protein supplements are typically either a “free choice” in pastures, or part of a “complete ration” for either dairy or beef animals. Free choice applications normally involve the use of a “lick wheel” feeder in pastures, where the animals are consuming approximately 90-95% of their daily diet of dormant native grasses/improved pastures or preserved forages (hay). These pastures are normally low in nutrients such as protein, energy, phosphors, and other minerals. Accordingly, the nutrient-dense liquid feed supplements provide a way to balance the nutritional requirements of livestock, allowing them to reproduce or gain weight at an optimum rate. In applications where liquid protein supplements are part of a complete ration, the inclusion rate of the supplement depends on the nutrient profile of the other dry feed ingredients. Nutrient profiles of the supplement can be adjusted to balance the nutrients of the dry feed ingredients. Livestock that consume the complete ration form of liquid feed supplements are normally held in confinement rather than in open pasture. Liquid protein supplements are utilized in virtually all regions of the United States and western Canada. They are marketed through both distributor and dealer networks as well as sold directly from us to the end users. |
| • | Liquid Suspension Products. Liquid suspension products are the most complex liquid feed supplements that we manufacture. Thixotropic technology allows insoluble ingredients such as calcium carbonate, potassium chloride, feathermeal, and salt to be suspended in a liquid supplement that can “flow.” These supplements provide a wide range of minerals, proteins, and medications, which are mainly utilized in confined beef feeding operations and large dairies. The largest concentration of customers of our liquid suspension products is in the Texas panhandle and northern California. In Texas, such supplements are sold directly to the end user, whereas in northern California they are marketed through large distributors. |
| • | Mill Products. Mill products are specialized molasses-based products sold to dry feed milling companies and mixed with other dry feed ingredients. These specialized products are used in two primary types of applications in the dry feed milling industry: texturized horse feed and pelleted products fed to different classes of livestock. Our “E-Z Glo” product is a mill product fortified with |
21
Table of Contents
| high-quality vegetable oil, minerals, and preservatives that is included in texturized horse feed as 5-15% of overall product content. Our “Pellet Partner” product is a mill product containing liquid lignin, a by-product from the timber industry, that is used to bind dry feed ingredients to form pellets or cubes. Mill products are utilized in dry feed mills throughout the United States. They are mainly sold direct to the feed mills. |
Molasses and Molasses Blends
| • | Molasses. Molasses is a standardized 79.5 brix product that is sold predominantly to the commercial dry feed industry. Standardized molasses is typically used for a coating on textured feeds and dry feed products. |
| • | Blends. Blends are the simplest form of value-added products. Typically blends include molasses blended with one or more of the following ingredients: corn steep liquor, condensed molasses solubles, whey permeate, distillers’ solubles, lignin sulphonate, and/or glycerine. Blends are normally utilized in complete feed rations to reduce the dust and improve the palatability of the ration. Virtually all blends are fed in confined feeding operations and are incorporated into livestock rations that do not use a protein supplement or a suspension. We use distribution and direct supply formats for the sale of blends. |
Other
| • | Blocks/Tubs. Blocks, or tubs as they are sometimes referred to, are a solid feed supplement that is fed, unmixed with any other food, as a free choice protein supplement to cattle on pasture or improved pastures. The primary package size is 200 lbs. and is marketed through a series of distributors and local farm stores. The majority of our blocks are toll manufactured for other feed companies and sold through their respective labels and fed primarily to beef cattle, dairy cattle, and horses, with some products sold for sheep, goats, and wild game. |
| • | Dried Products. Dried products results from mixing ground soybean hulls and sunflower hulls with cane molasses and drying the mix through a rotating drum drier. Dried products are typically used as either a sweetener to dry feed rations, or as a binding agent for other dry feed ingredients in the manufacture of solid feed supplements known as “blocks.” Target customers include small confined feeding operators that use it as a sweetener, and specialty small block manufacturers that use it as a binder and sweetener. All dried product marketing to confined feeding operators is done through a series of distributors. The majority of our dried products are consumed by beef and dairy cattle, with little consumed by horses, sheep, goats, swine, or poultry. |
| • | Other Ingredients. This category is comprised of liquid whey permeate, renewable fuel by-products, and other liquid ingredients sold typically direct to customers. |
For each of the last three fiscal years (and for the approximate 7-month period from November 1, 2008 to May 28, 2009), the percentage of consolidated net revenues contributed by each class of similar products that accounted for 10% or more of our overall consolidated net revenue in any of the last three fiscal years was as follows:
| Predecessor | ||||||||||||
| Fiscal Year ended December 31, 2009(1) |
November 1, 2008 through May 28, 2009 |
Fiscal Year ended October 31, 2008 |
Fiscal Year ended October 31, 2007 |
|||||||||
| Complex Liquid Feed Protein Supplements, Suspensions, and Mill Products |
43 | % | 44 | % | 45 | % | 48 | % | ||||
| Molasses and Molasses Blends |
21 | % | 22 | % | 20 | % | 19 | % | ||||
| Other |
12 | % | 15 | % | 13 | % | 10 | % | ||||
| (1) | Year ended December 31, 2009 includes only 217 days of acquired business operations. |
22
Table of Contents
Champion Liquid Feeds Pty Ltd
In addition to serving markets in North America, we also have a presence in the Australian feed market through our 50% interest in Champion. Champion was formed in 2001 for the purpose of manufacturing and distributing liquid feed supplements in Australia. Prior to the formation of the joint venture, our joint venture partner, the largest dry feed distributor in Australia, owned and operated one liquid feed supplement plant in southern Queensland, which was producing approximately 28,000 tons of liquid feed supplements per year. By leveraging its existing intellectual property, the acquired business gained access to a significant new agricultural market for liquid feed supplements. In the year ended June 30, 2009, Champion produced 35,500 tons of liquid feed supplements and an additional 30,000 tons of unprocessed molasses for the livestock industry. In December 2008, Champion commissioned two new liquid suspension plants in central Queensland and Victoria. In the future, we expect that Champion will be able to supply a complete range of liquid feed supplements to Victoria, New South Wales, and Queensland.
Customers
No single customer, or group of customers under common control or that are affiliates of each other, accounts for more than 10% of our consolidated total revenues. Our liquid feed supplements business is not dependent on any single or few customers, the loss of which would have a material adverse effect on the business.
Sources and Availability of Raw Materials
Molasses is one of our primary inputs. We have a long term contract through May 2019 to purchase heavy brix cane molasses meeting certain quality standards, from the ED&F Man group using pricing formulas related to the market price of imported molasses. This contract is expected to provide us with the majority of our molasses needs in 2010. We believe we will be able to obtain a sufficient supply of molasses for the foreseeable future. In addition we have significant volumes of other food and agricultural raw materials purchased through fixed or indexed pricing mechanisms. We expect that we will be able to obtain sufficient supplies of needed ingredients in 2010 and the foreseeable future.
Intellectual Property
The patent, trademarks, licenses and other intellectual properties that we hold contribute to our overall success. However, our overall success is not dependent upon any single portion of our intellectual property. The collective body of our intellectual property affords us the opportunity to effectively and profitably utilize a wide range of human-food industry and other co-products to help meet the needs of the livestock industry as well as certain other industries.
Seasonality
The liquid feed supplement business, which is predominately driven by cattle feeding, is typically stronger in the fall and winter months (Feed Season) because cattle are fed grasses during the spring and summer months. Range cattle are typically fed liquid supplements during late fall as grass nourishment diminishes and/or is dormant due to the winter climate. This seasonality is also impacted by the “calving season”. Range cattle “typically” calve in the January through March time frame, requiring heavier supplementation during the late gestation/lactation period. This seasonality is also driven in part by the colder weather which requires more feed for body maintenance purposes. This cold weather effect impacts to a lesser degree other species such as horses, sheep and goats, which typically are not fed liquid supplements but are fed dry feeds or supplements top dressed with liquid coatings.
23
Table of Contents
Working Capital Practices
Our liquid feed supplements business requires us to use substantial working capital for purchasing molasses as well as paying personnel costs prior to receiving payments from customers. Our working capital requirements vary with the seasonal nature of demand for our liquid feed supplements as we build and store inventories during periods of lower demand in order to sell them during periods of higher demand.
This seasonal nature of demand also affects our accounts receivable and accounts payable balances, which vary depending on timing of payments. The largest payable is to the ED&F Man group. We normally invoice our customers for liquid feed supplement purchases the day after delivery, with average repayment terms of 30 days. The average collection time for 2009 was approximately 31 days. Collection times vary depending on economic conditions and prices.
Competition
Competitive Conditions
In the liquid feed supplements business, we are the largest producer of such products in North America. Our business operates in a highly competitive environment, and our competition in North America falls into three categories: liquid-based products, the commercial dry feed industry, and large livestock producers who utilize commodity ingredients direct from suppliers. Regionally, we compete against a number of liquid animal feed companies that have been able to establish a customer base through ingredient supply contracts or integration into their customers’ businesses.
Principal Methods of Competition
We operate in markets with competition based on price, quality, and service. We focus on managing our unit costs, improving efficiencies via technological advancements, research and development, productivity enhancements, and utilization of available by-product streams.
Factors Affecting Our Competitive Position
Positive factors pertaining to our competitive position are discussed at length above in the subsection entitled “Competitive Strengths.” Negative factors pertaining to our competitive position include the fact that some of our competitors are larger than we are and have greater financial resources and lower costs of capital than we do, and accordingly sometimes are able to offer a better price. There are also occasions where a competitor has a facility in a location that enables it to serve a particular customer’s need more economically than our nearest facility. These negative factors are further described in the “Risk Factors” section of this Form 10-K.
Our Relationship with the ED&F Man Group
Our relationship with the ED&F Man group provides a number of benefits to both our bulk liquid storage and liquid feed supplements businesses. In particular, the benefits of being the preferred supplier of bulk liquid storage to the ED&F Man group, combined with relative security over the quality and quantity of molasses supplied to our liquid feed supplements business by the ED&F Man group, provides us with a degree of certainty regarding the ongoing operational characteristics of our business and our ability to service our customers in the future. In tandem with further investment opportunities made possible by the business combination, the relationship with the ED&F Man group can provide us with a material platform from which growth can be generated in the future.
24
Table of Contents
Preferred Supplier Arrangements
Our long-term relationship as a preferred supplier of bulk liquid storage to the ED&F Man group’s various trading divisions is a major part of our success and growth strategy. The key long-term contract setting forth our preferred supplier status is the storage strategic alliance agreement and terminal service agreement, which is described in “Certain Relationships and Related Transactions—Related Transactions—Storage Strategic Alliance Agreement and Terminal Service Agreement” in the prospectus we filed with the SEC on August 7, 2009. Our contractual relationships with the ED&F Man group further secure a relationship that has been in place for 20 years. The ED&F Man group provides global expansion opportunities, and as a preferred supplier, we expect to secure a minimum load volume that will support both our existing and new locations. The terms of the agreement have a pricing mechanism very close to market prices.
Molasses Supply Contract
Molasses, as an ingredient, is utilized in our liquid feed supplement formulations. Historically, the acquired business relied upon the ED&F Man group to source and provide the logistics for supplying us with this basic ingredient. We and the ED&F Man group have established a long-term molasses supply agreement, pursuant to which the ED&F Man group will be our primary supplier of cane molasses, with a pricing mechanism that approximates the fair market value of imported molasses. The molasses supply agreement is described in “Certain Relationships and Related Transactions—Related Transactions—Molasses Supply Agreement” in the prospectus we filed with the SEC on August 7, 2009. We, however, will continue to source all domestic beet molasses and beet molasses by-products from other domestic and cross border suppliers.
Shared Services
Historically, the acquired business was supported by the ED&F Man group, which provided a number of corporate and back office functions and services. The ED&F Man group has been contracted to provide us with shared services under transitional arrangements that allow us to ensure an orderly adjustment to operate as a fully independent business as soon as practical or as is most appropriate for our business. The basis for this transitional arrangement is set out in the shared services agreement, which is described in “Certain Relationships and Related Transactions—Related Transactions—Shared Services Agreement” in the prospectus we filed with the SEC on August 7, 2009. In summary, the ED&F Man group will continue to provide certain human resources, information technology, accounting administration, and invoicing and other services for a period of one year at a minimum following the separation. We will also provide the ED&F Man group with certain transitional services within the U.S., consisting of human resources, information technology, invoicing, and other administrative services during the same period. Following this contracted period, transitional arrangements exist to facilitate the final separation of activities, function by function at the mutual agreement of both parties. We are terminating this agreement in 2010. We are being charged on the same basis as we have been historically, subject to contracted normal increases for inflation.
Historically, arrangements have existed to ensure that services are provided on a basis that is reflective of normal volumes, market prices, and typical business practice. Contract rates and services are negotiated at arms length and on the basis of prevailing market rates for similar storage and services, or rates that the business is able to obtain from third parties.
25
Table of Contents
Financial Information about the Bulk Liquid Storage and Liquid Feed Supplement Geographic Areas
Revenues from External Customers
For each of the last three fiscal years (and for the approximate 7-month period from November 1, 2008 to May 28, 2009), our net revenues (in thousands) from external customers were attributable geographically as follows:
| Predecessor | ||||||||||||
| Fiscal Year ended December 31, 2009(1) |
November 1, 2008 through May 28, 2009 |
Fiscal Year ended October 31, 2008 |
Fiscal Year ended December 31, 2007 | |||||||||
| United States |
$ | 168,173 | $ | 191,891 | $ | 329,539 | $ | 259,655 | ||||
| All Foreign Countries |
$ | 20,614 | $ | 20,128 | $ | 40,784 | $ | 32,846 | ||||
| Total |
$ | 188,787 | $ | 212,019 | $ | 370,323 | $ | 292,501 | ||||
| (1) | Year ended December 31, 2009 includes only 217 days of acquired business operations. |
Revenues from external customers have been attributed to particular countries according to the location of our facilities. There were no individual foreign countries from which the revenues from external customers were material. For further financial information about our activities in different geographical areas, see Note 17 to our consolidated financial statements.
Long-Lived Assets
For each of the last three fiscal years, our long-lived assets (in thousands) were located as follows:
| Predecessor | |||||||||
| Fiscal Year ended December 31, 2009(1) |
Fiscal Year ended October 31, 2008 |
Fiscal Year ended December 31, 2007 | |||||||
| United States |
$ | 230,439 | $ | 106,913 | $ | 100,082 | |||
| All Foreign Countries |
$ | 98,516 | $ | 33,921 | $ | 32,165 | |||
| Total |
$ | 328,955 | $ | 140,834 | $ | 132,247 | |||
| (1) | Year ended December 31, 2009 includes only 217 days of acquired business operations. |
There were no individual foreign countries in which our long-lived assets were material.
Foreign Operations Risks and Dependence
The risks attendant to our foreign operations are generally the same as those attendant to our U.S. operations, except there is additional foreign currency exchange rate risk. For a discussion of exchange rate risks, see Item 7A, “Quantitative and Qualitative Disclosures about Market Risk,” of this Form 10-K. For a detailed discussion of the risks attendant to our businesses, see Item 1A, “Risk Factors,” immediately following this Item. The limited degree of dependence of our segments on foreign operations is illustrated by the foregoing geographic breakdowns of our revenues from external customers and of the locations of our long-lived assets.
As of March 10, 2010, we had 499 employees.
26
Table of Contents
We are required to comply with the health and safety requirements in each of the jurisdictions in each of the countries in which we operate. In order to achieve this, management approaches the issue of health and safety from the top down, focusing on key operational risks and seeking to ensure that our policy, process and practice are in conformity with legal and normal business practices. The risks relating to the safe handling, storage and regulation of each of our bulk liquid storage and liquid feed supplements operations are managed as a central element of our businesses. We strive to ensure that customer assets, our employees, and the environment remain fully protected from all risks wherever possible. The regulatory and legal environments within which liquid products are handled by our business differ with the geography, markets, product offerings, and sophistication within which we operate.
In addition, we comply with applicable health and safety requirements in Europe and elsewhere by following our European Health, Safety, Environmental, and Quality (“HSEQ”) policy or local legal requirements that govern the care and safeguarding of the health and safety of our employees and the environment.
We are required to comply with Federal Food and Drug Administration requirements as well as local State feed control requirements. To meet and exceed these requirements we have developed and implemented an extensive Standard Operating Procedures Manual, which comprises all aspects of quality, FDA, training, manufacturing, administrative, and security compliance.
Our compliance with Federal, State, foreign, and local regulations relating to the protection of the environment are not expected to have a material effect upon our capital expenditures, earnings, or competitive position, and our estimated capital expenditures for environmental control facilities for the remainder of 2010 and for 2011 are not material.
Information Available on Our Website
We make available free of charge on or through our website, as soon as reasonably practicable after we electronically file with or furnish to the SEC, our annual report on Form 10-K and our quarterly reports on Form 10-K and any amendments thereof, and (via a link to EDGAR) our current reports on Form 8-K and any amendments thereof. Our internet address is www.westway.com. Additionally, we have adopted a Code of Conduct and Ethics, applicable to all employees, officers and directors, which is available on our website, along with our corporate governance principles, audit committee charter, nominating committee charter, compensation committee charter, and whistle blower policy.
| ITEM 1A. | RISK FACTORS |
You should carefully consider each of the following risks. These risks and other factors may affect our forward-looking statements, including those contained in this report or made by us elsewhere, such as in investor calls or conference presentations.
If any of the following risks or uncertainties develops into actual events, this could significantly and adversely affect our business, prospects, financial condition, or operating results. In any such case, the trading price of our common stock could decline materially.
The risks and uncertainties described below are not the only ones that we face. Additional risks and uncertainties not presently known to us or that we currently believe to be immaterial also may adversely affect our business. In describing these risk factors, we are not undertaking to address or update each factor in future filings or communications regarding our business or results.
27
Table of Contents
Risks Related to Our Business and Operations Generally
Our business is highly dependent on the ED&F Man group.
Our liquid feed supplements business relies to a significant extent on the ED&F Man group as a supplier of the raw materials used as components of our products. We intend to continue sourcing a substantial portion of these raw materials from the ED&F Man group in the future. In the event that we are unable to purchase these raw materials on reasonable terms from the ED&F Man group, we may be unable to find suitable alternatives to meet our raw material needs, which could adversely affect our financial condition and results of operations.
Moreover, our supply agreement with the ED&F Man group for the supply of heavy brix cane molasses meeting certain quality standards prices molasses based upon the molasses import market, regardless of whether the molasses actually supplied is imported or domestic. In 2009, there was a decoupling of the price of domestic molasses from the price of imported molasses, with the former being lower. It is not clear to what extent we are able to take advantage of the lower cost of cane molasses in the domestic market due to our obligations under the molasses supply agreement with the ED&F Man group. Should we not be able to do so, we may be at a competitive disadvantage to competitors who make significant cane molasses purchases in the domestic market. It is clear, however, that we are free to buy beet molasses, whether domestic or imported, from third parties, and we often do so.
The ED&F Man group is also an important customer of our bulk liquid storage business. We expect to derive a significant portion of our revenue from this relationship for the foreseeable future. Events that adversely affect the business operations of the ED&F Man group could adversely affect our financial condition or results of operations. Therefore, we will be indirectly subject to the business risks of the ED&F Man group, which are not always similar to the business risks we will face. For example, a material decline in demand for molasses or a significant decrease in the ED&F Man group’s ability to negotiate marketing contracts on favorable terms, could result in a material decline in the use of our liquid storage capacity at our bulk liquid storage facilities, which could cause our revenue and results of operations to decline. In addition, if the ED&F Man group is unable to meet its contractual commitments to us for any reason, then our revenue and cash flow could decline.
We may not be successful in identifying suitable development or acquisition opportunities, or purchasing or financing such opportunities on an acceptable basis.
Part of our business strategy includes developing or acquiring additional assets that complement our existing asset base, including developing or acquiring additional terminal, transportation, and storage facilities and the expansion of our existing liquid storage capacity. We may not be able to identify suitable development or acquisition opportunities, or we may not be able to purchase or finance any development or acquisition on terms that we find acceptable. Additionally, we compete against other companies for development locations and acquisitions. We can provide no assurance that we will be successful in the acquisition or development of any assets or businesses appropriate for our growth strategy.
We may enter into agreements for or consummate acquisitions with little or no notice to our stockholders.
We regularly consider and enter into discussions regarding potential acquisitions, and we are currently contemplating potential acquisitions. Any such transaction would be subject to negotiation of mutually agreeable terms and conditions and approval of the parties’ respective boards of directors. While there are currently no unannounced purchase agreements for the acquisition of any material business or assets, such transactions can be effected quickly, may occur at any time, and may be significant in size relative to our existing assets or operations. Our capitalization and results of operations may change significantly as a result of these activities, and you will not have the opportunity to evaluate the economic, financial, and other relevant information that we will consider in connection with any future acquisitions or development opportunities.
28
Table of Contents
We may not be able to integrate effectively and efficiently with any future operations we may develop or acquire. Any future developments or acquisitions may substantially increase the levels of our indebtedness and contingent liabilities, may impose substantial costs and delays, and may cause other unanticipated adverse impacts.
Unexpected costs or challenges may arise whenever businesses with different operations and management are combined. For example, the incurrence of substantial unforeseen environmental and other liabilities, including liabilities arising from a newly-developed site or the operation of an acquired business or asset prior to our acquisition for which we are not indemnified, or for which indemnity is inadequate, may adversely affect our ability to realize the anticipated benefit from the development or acquisition. Inefficiencies and difficulties may arise because of unfamiliarity with new assets and new geographic areas of any acquired locations or businesses. With acquisitions in particular, successful business combinations will require our management and other personnel to devote significant amounts of time to integrating the acquired business or assets with our existing operations. These efforts may temporarily distract our attention from day-to-day business, the development or acquisition of new properties, and other business opportunities. If we do not successfully integrate any past or future acquisitions, or if there is any significant delay in achieving such integration, our business and financial condition could be adversely affected.
We are the borrower under a credit facility with a syndicate of banks as the lenders. The amount we borrow under this facility or its terms may restrict our operating flexibility, could adversely affect our financial health, and could prevent us from fulfilling certain financial obligations.
We are the borrower under a credit agreement dated as of November 12, 2009, with JPMorgan Chase Bank, N.A., as administrative agent, Regions Bank, as syndication agent, Capital One, N.A., Rabobank Nederland, SunTrust Bank, and Compass Bank (doing business as BBVA Compass), as documentation agents, and the lenders from time to time party thereto (initially, JPMorgan Chase Bank, N.A., Regions Bank, Capital One, N.A., Rabobank Nederland, Suntrust Bank, Compass Bank, Compass Bank, Whitney National Bank, Societe Generale, and CoBank ACB). The credit agreement was delivered and became effective on November 16, 2009.
This $175 million revolving credit facility is scheduled to terminate on November 12, 2012, provides for loans at variable rates of interest, and is secured by most of our assets, various pledges of equity, and various guarantees by subsidiaries in our group. We have the option during the term of the revolving credit facility, subject to certain conditions including the willingness of one or more of the lenders or a new lender to commit additional funds, to increase the revolving credit facility by an aggregate principal amount of up to $25 million (the “accordion feature”). For a discussion of the terms of the credit agreement and its security, see the “Liquidity and Capital Resources” section of the “Management’s Discussion and Analysis of Financial Condition and Results of Operations” part of this registration statement.
Our borrowings under this credit facility are being used primarily for working capital and to assist us in funding capital expenditures, including acquisitions. As of December 31, 2009, our total indebtedness under this facility was $91.6 million, leaving $83.4 million available for additional borrowing. The amount we borrow under this facility could significantly affect our operating flexibility, our financial health, and our ability to fulfill certain financial obligations. For example, the more we borrow under the facility:
| • | the more difficult it may be for us to satisfy our current and future debt obligations; |
| • | the more dependent we may be on the credit facility and the more any default under or termination of the credit facility may adversely affect us; |
| • | the greater the portion of cash flows from operating activities we must dedicate to the payment of principal and interest on the indebtedness, thereby reducing the funds available for other purposes; |
| • | the more we may be at a competitive disadvantage to competitors who are not as leveraged; and |
| • | the more vulnerable we are to interest rate fluctuations, as the indebtedness under the facility bears interest at variable rates. |
29
Table of Contents
Likewise, the terms of the credit agreement may restrict our operating flexibility, financial health, or ability to fulfill certain financial obligations. For example, the terms of the credit agreement:
| • | include not only first priority liens and security interests on the majority of our assets, but also a negative pledge on substantially all our non-mortgaged assets that restricts the encumbrance of such assets, subject to narrow exceptions; |
| • | require us to maintain certain financial covenants, including (a) a maximum consolidated total leverage ratio (as defined in the credit agreement, but generally, funded debt to EBITDA) of no more than 3.5 to 1 at the end of each quarter in 2010, 3.25 to 1 at the end of each quarter in 2011, and 3.0 to 1 at the end of each quarter thereafter; and (b) a minimum consolidated interest coverage ratio (as defined in the credit agreement, but generally, EBITDA to interest expense) of not less than 3.0 to 1 at the end of each quarter; |
| • | put restrictions on our ability to make capital expenditures, dispose of assets, incur indebtedness, encumber assets, pay dividends, redeem securities, make investments, change the nature of our business, acquire or dispose of a subsidiary, enter into transactions with affiliates, enter into hedging agreements, or merge, consolidate, liquidate, or dissolve; |
| • | provide for the possibility of acceleration of our debt and the termination of all loan commitments under the facility upon the occurrence of an event of default; and |
| • | require the consent of each lender directly affected with respect to most time extensions or forgiveness of any amounts owed. |
Our acquisition strategy and expansion programs require access to new capital. Tightened credit markets or more expensive capital could impair our ability to grow.
Our business strategies include acquiring additional terminal, transportation and storage facilities and the expansion of our existing liquid storage capacity. Although the bank syndicate credit facility into which we entered in November 2009 provides significant financing for corporate purposes including future acquisitions and expansion, additional funds are expected to be required to grow our business further and fully implement these strategies. Any equity or additional debt financing used to raise such additional funds, if available at all, may not be on favorable terms. An inability to access the capital markets may result in a substantial increase in leverage and have a detrimental impact on our creditworthiness. If adequate additional financing cannot be obtained, our business strategies may not be able to be fully implemented, and our financial condition and results of operations could be adversely affected.
Our business involves many hazards and operational risks, including adverse weather conditions, which could result in substantial liabilities and increased operating costs.
Our operations are subject to the many hazards inherent in the storage of liquid products, including, but not limited to:
| • | leaks or accidental releases of products or other materials into the environment, whether as a result of human error or otherwise; |
| • | extreme weather conditions, such as hurricanes, tropical storms, and rough seas, which are common along the Gulf Coast; |
| • | explosions, fires, accidents, mechanical malfunctions, faulty measurement and other operating errors; and |
| • | acts of terrorism or vandalism. |
If any of these events were to occur, substantial losses could be incurred as a result of personal injury or loss of life, severe damage to or destruction of storage tanks, processing facilities, or related property and equipment, or pollution or other environmental damage. These events could result in curtailment or suspension of related
30
Table of Contents
operations and potentially substantial unanticipated costs for the repair or replacement of property and environmental cleanup. In addition, if there are accidental releases or spills of products at the liquid storage facilities, we could be faced with material third-party costs and liabilities, including those relating to claims for damages to property and persons. Furthermore, events like hurricanes can affect large geographical areas, which could cause us to suffer additional costs and delays in connection with subsequent repairs and operations, because contractors and other resources are not available or are only available at substantially increased costs following widespread catastrophes.
Risks Related to Our Bulk Liquid Storage Business
The obligations of several of our key customers under their liquid storage services agreements with us may be reduced or suspended in some circumstances, which could adversely affect our financial condition and results of operations.
Our agreements with several of our significant customers provide that, if any of a number of events, referred to as events of force majeure, occur and the event renders performance impossible with respect to a facility, usually for a specified minimum period of days, customer obligations would be temporarily suspended with respect to that facility. In that case, a significant customer’s minimum revenue commitment may be reduced or the contract may be subject to termination. As a result, our revenue and results of operations could be adversely affected. By significant customers, we mean our third-party customers that account for 3% or more of the gross revenues of the bulk liquid storage business, of which there are approximately six.
If one or more of our significant customers do not continue to engage us to provide services after the expiration of those customers’ current liquid storage services agreements with us and we are unable to secure comparable alternative arrangements, our financial condition and results of operations could be adversely affected.
Our liquid storage services agreements with our customers ordinarily provide for terms of between 12 and 36 months. After the expiration of each of these liquid storage services agreements, the customers may elect not to continue to engage us to provide services. In addition, even if a significant customer does engage us, the terms of any renegotiated agreement may be less favorable than the agreement it replaces. In either case, we may not be able to generate sufficient additional revenue from third parties to replace any shortfall in revenue or increase in costs. Additionally, substantial costs may be incurred if modifications to liquid storage facilities are required in order to attract substitute customers or provide alternative services. To the extent a significant customer does not extend or renew its liquid storage services agreement, if we extend or renew the liquid storage services agreement on less favorable terms, or if substantial costs are incurred to attract substitute customers, our financial condition and results of operations could be adversely affected.
Competition from other businesses providing liquid storage that are able to supply our significant customers with liquid storage capacity at a lower price could adversely affect our financial condition and results of operations.
We face competition from other liquid storage facilities that may be able to supply significant customers with integrated liquid storage services on a more competitive basis. We compete with multi-national, national, and regional liquid storage companies, of widely varying sizes, financial resources, and experience. Our ability to compete could be harmed by factors beyond our control, including, but not limited to:
| • | price competition from liquid storage and transportation companies, some of which are substantially larger than we are and have greater financial resources and control substantially greater product storage capacity; |
| • | the perception that another company may provide better service; and |
| • | the availability of alternative supply points or supply points located closer to customers’ operations. |
31
Table of Contents
If we are unable to compete with services offered by other enterprises, our financial condition and results of operations could be adversely affected.
Some of our liquid storage facilities have been in service for many years, potentially resulting in increased maintenance or remediation expenditures, which could adversely affect our results of operations.
Our liquid storage assets are generally long-lived assets. As a result, some of these assets have been in service for many years. The age and condition of these assets could result in increased maintenance or remediation expenditures. Any significant increase in these expenditures could adversely affect our financial condition, results of operations, and cash flows.
The impact of environmental regulation on our liquid storage facilities could adversely affect our level of cash flow.
Environmental regulation could result in increased operating and capital costs. Our business operations are subject to federal, state, local, and some foreign laws and regulations relating to environmental protection. For example, if an accidental leak, release, or spill of chemicals or other products occurs at one of our liquid storage facilities, we could experience significant operational disruptions and may have to pay a significant amount to clean up the leak, release or spill or pay for government penalties, address natural resource damage, compensate for human exposure or property damage, or a combination of these measures. The resulting costs and liabilities could negatively affect our level of cash flow. The impact of U.S. Environmental Protection Agency standards or future environmental measures could increase costs significantly if environmental laws and regulations become stricter.
Risks Related to Our Liquid Feed Supplements Business
The availability, demand for, and price of agricultural commodities and agricultural commodity products can be affected by weather, disease, and other factors beyond our control.
Weather conditions have historically caused volatility in the agricultural commodity industry and consequently in that segment of our operating results related to liquid feed supplements. Weather conditions have at times caused crop failures or significantly reduced harvests, which can adversely affect the supply and pricing of the agricultural commodities that we sell and use in our business, such as molasses, and negatively affect the creditworthiness of our customers and suppliers. The availability and price of agricultural commodities are also subject to other unpredictable factors, such as plantings, government farm programs and policies, demand from the biofuels industry, price volatility as a result of increased participation by non-commercial market participants in commodity markets, and changes in global demand resulting from population growth and changes in standards of living. In addition, the supply and price of agricultural commodities can be affected by factors such as plant disease. Demand for liquid feed supplements can also be adversely affected by weather conditions affecting natural sources of animal nutrition, as well as by the outbreak of disease in livestock and poultry, as further described below under “We are subject to animal feed industry risks.” These factors could cause volatility in the agricultural commodity industry and, consequently, in our financial condition and results of operations.
We are subject to animal feed industry risks.
We are subject to animal feed industry risks. These risks include, but are not limited to, product spoilage or contamination, government regulation of the animal feed industry including processing and labeling regulations, shifting customer preferences and concerns including concerns regarding genetically modified organisms as well as other environmental concerns, and potential product liability claims. These matters could adversely affect our financial condition and results of operations.
32
Table of Contents
The sale of livestock feed products involves the risk of injury to those animals as well as human consumers of those animals. Such hazards could result from tampering by unauthorized third parties; product contamination (such as listeria, E. coli. and salmonella) or spoilage; the presence of foreign objects, substances, chemicals, and other agents; residues introduced during the growing, storage, handling or transportation phases; or products that are improperly formulated or do not contain the proper mixture of ingredients. Should any of these or similar hazards occur, consumption of our products might cause serious health-related illnesses and we might be subject to claims or lawsuits relating to such matters. Any sale by us of adulterated or defective products, including products manufactured wholly or in part by third parties, could lead to an increased risk of exposure to product liability claims, product recalls, governmental fines or other sanctions, and increased scrutiny by Federal and state regulatory agencies. Such claims or liabilities may not be covered by our insurance or by any rights of indemnity or contribution. In addition, even if a product liability claim is not successful or is not fully pursued, the negative publicity surrounding any assertion that our products caused illness or injury could have a material adverse effect on our reputation with existing and potential customers and on our brand image. Furthermore, the outbreak of disease in livestock or poultry, even if unrelated to our products, could adversely affect demand for liquid feed supplements used in livestock and poultry feed. A decrease in demand for our liquid feed supplements could adversely affect our revenues and results of operations.
Our liquid feed supplements business is vulnerable to cyclicality in the agricultural commodities industry, highly dependent on agricultural commodity prices, and susceptible to changes in raw material prices, which are subject to significant volatility and uncertainty.
Our liquid feed supplements business is affected by variations in supply and processing capacity for the liquid feed supplements that we sell and the raw materials that we use. These variations have resulted in cyclical fluctuations in the liquid feed supplements business’ profitability. The price of liquid feed supplements is influenced by market demand, factors affecting crop yields, farmer planting and husbandry decisions, and general economic, market and regulatory factors. The significance and relative effect of these factors on the price of liquid feed supplements is difficult to predict. Any factor that tends to negatively affect the demand for livestock and poultry, such as increased supply and cost, could decrease the price for liquid feed supplements and potentially harm our business. In addition, we could also have difficulty, from time to time, in physically sourcing the raw materials for liquid feed supplements on economical terms due to supply shortages. Such a shortage could require us to suspend operations until such raw materials are available at favorable economical terms, which could have an adverse effect on our business, financial condition, and results of operations.
Government policies and regulations affecting the agricultural sector and related industries could adversely affect our financial condition and results of operations.
Agricultural production and trade flows are significantly affected by government policies and regulations. Governmental policies affecting the agricultural industry, such as taxes, tariffs, duties, subsidies and import and export restrictions on agricultural commodities and commodity products, can influence industry profitability, the planting of certain crops, or grazing of certain types of livestock, versus other uses of agricultural resources, whether unprocessed or processed commodity products are traded, and the volume and types of imports and exports. In addition, international trade disputes can adversely affect agricultural commodity trade flows by limiting or disrupting trade between countries or regions. Future government policies could adversely affect the supply of, demand for, and prices of our products, could restrict our ability to do business in existing and target markets, and could cause a deterioration in our financial condition and results of operations.
Competition in the industry may reduce our sales and margins.
In the liquid feed supplements business, we are the largest producer of liquid feed products in North America. Our business operates in a highly competitive environment. We compete with companies that have substantial capital resources, research and development staffs, facilities, diversity of product lines and brand recognition. Increased competition as to any of our products could result in reduced prices which would reduce our sales and margins. Our competitors may succeed in entering markets in which we currently have a competitive advantage. Our competitors may succeed in developing new or enhanced products which are better
33
Table of Contents
than ours. These companies may also prove to be more successful in marketing, distributing, and selling their products. Any of these events could have an adverse effect on our results of operations or financial condition.
Other Risks Related to Our Business and Operations Generally
We are required to comply with Section 404 of the Sarbanes-Oxley Act of 2002 in 2010.
Although we believe that we have maintained disclosure controls and procedures and internal controls over our financial reporting as required under the federal securities laws with respect to our activities, we were not required to establish and maintain such disclosure controls and procedures and internal controls over our financial reporting before the business combination as are required following the business combination as a result of our having substantial operations.
Section 404 of the Sarbanes-Oxley Act of 2002 requires us to document and test the effectiveness of our internal controls over financial reporting in accordance with an established control framework and to report on our management’s conclusion as to the effectiveness of these internal controls over financial reporting with respect to the acquired business beginning with the fiscal year ending December 31, 2010. We also must have an independent registered public accounting firm test the internal controls over financial reporting and report on the effectiveness of such controls. Any delays or difficulty in satisfying these requirements could adversely affect our future results of operations and our share price. We could incur significant costs to comply with these requirements.
We could, in the future, discover areas of internal control over financial reporting that need improvement. Further, we and our auditors may experience greater difficulty in establishing a system of internal control over financial reporting now that we are an operating company. There can be no assurance that remedial measures will result in adequate internal control over financial reporting in the future. Any failure to implement the required new or improved controls, or difficulties encountered in their implementation, could materially adversely affect our results of operations or could cause us to fail to meet our reporting obligations. If we are unable to conclude that we have effective internal control over financial reporting, or if our auditors are unable to provide an unqualified report regarding the effectiveness of internal control over financial reporting as required by Section 404, investors could lose confidence in the reliability of our financial statements, which could result in a decrease in the value of our share price. In addition, failure to comply with Section 404 of the Sarbanes-Oxley Act of 2002 could potentially subject us to sanctions or investigation by the SEC or other regulatory authorities.
Our business depends, in part, upon certain individuals who may not necessarily continue to be affiliated with us.
We are dependent, in part, on the efforts of key members of our management team, including Messrs. Peter Harding, Wayne Driggers, Steve Boehmer, and Scott Mackenzie. The loss of services of one or more of these individuals, each of whom has substantial experience in the bulk liquid storage and liquid feed supplements businesses, as applicable, could have an adverse effect on our business strategies and the growth and development of our business. If one or more of these individuals were no longer affiliated with us, or if we ceased to receive advisory services from them, our inability to recruit other employees of equivalent talent could have an adverse effect on our financial condition and results of operations. We do not have employment contracts with any members of our management team.
Cost overruns and delays in our expansion activities could adversely affect our business.
We currently have several significant expansion projects underway or planned. A variety of factors outside of our control, including weather or natural disasters, shortages of materials, construction equipment, or skilled labor, unforeseen engineering, geological, or environmental problems, poor performance by or disputes with contractors, opposition by environmental groups, or difficulties in obtaining permits or other regulatory approvals, could result in delays in construction or increased construction costs that have a material adverse effect on our return on investment, results of operations, or cash flows.
34
Table of Contents
The unaudited pro forma financial information is not necessarily an indication of our financial condition or results of operations.
The unaudited pro forma financial statements contained in this Form 10-K are not an indication of our financial condition or results of operations. The unaudited pro forma financial statements have been derived from our and our predecessor’s historical financial statements and many adjustments and assumptions have been made after giving effect to the business combination. The information upon which these adjustments and assumptions have been made is preliminary, and these kinds of adjustments and assumptions are difficult to make with complete accuracy. As a result, our actual financial condition and results of operations may not be consistent with, or evident from, these pro forma financial statements.
Certain U.S. federal income tax deductions currently available may be eliminated as a result of future legislation.
The Administration’s Proposed Fiscal Year 2010 Budget includes proposed legislation that would, if enacted into law, make significant changes to United States tax laws, including the elimination of certain key U.S. federal income tax incentives, including the discontinuance of foreign tax credits. It is unclear whether any change will be enacted or how soon any such change could become effective. The passage of any legislation as a result of these proposals or any other similar changes in U.S. federal income tax laws could eliminate certain tax deductions that are currently available to the Company and any such change could negatively affect our financial condition and results of operations.
Risks Related to Ownership of Our Securities
Our issuance of preferred stock could adversely affect our common stockholders.
Our certificate of incorporation was amended and restated in May 2009 to authorize the issuance of additional shares of preferred stock with such designations, preferences and relative, participating, optional or special rights and such qualifications, limitations or restrictions as may be determined from time to time by our board of directors. Accordingly, our board of directors is empowered, without stockholder approval, to issue greater amounts of preferred stock with dividends, liquidation, conversion, voting or other rights that could adversely affect the relative voting power or other rights of the holders of our common stock. In the event of issuance, the preferred stock could be used as a method of discouraging, delaying or preventing a change in control, which could have the effect of discouraging bids for us and thereby potentially prevent stockholders from receiving the maximum value for their shares. Pursuant to our amended and restate certificate of incorporation, our board of directors is authorized to issue 40,000,000 shares of preferred stock. Currently, 33,000,000 shares of preferred stock are designated in our amended and restated certificate of incorporation as Series A Perpetual Convertible Preferred Stock, par value $.0001 per share, which we refer to herein as the “Series A Convertible Preferred Stock,” and there are an additional 7,000,000 shares of preferred stock available for designation.
Our outstanding warrants may be exercised in the future, which would result in dilution to our stockholders and increase the number of shares of our Class A common stock eligible for future resale in the public market, which could have an adverse effect on the market price of our Class A common stock.
In connection with our initial public offering, we issued approximately 46.0 million warrants as components of the units. Each of the warrants is exercisable for the purchase of one share of Class A common stock at $5.00 per share. We also sold a total of approximately 5.2 million founder warrants to a number of our current and former directors and officers through our sponsor, Shermen WSC Holding LLC, in a private placement concurrently with the initial public offering. Each of the founder warrants is exercisable for the purchase of one share of Class A common stock at $5.00 per share, with a cashless exercise provision.
35
Table of Contents
We also issued options to the underwriters to purchase 700,000 units, each consisting of one share of common stock and two warrants, each exercisable for the purchase of one share of Class A common stock at $6.25 per share. Unless sooner exercised, redeemed, or extended, all of the warrants are scheduled to expire on May 24, 2011.
As a result of the foregoing, at December 31, 2009, there were warrants outstanding to purchase approximately 51.2 million shares of our Class A common stock at $5.00 per share and there were options outstanding to purchase units that included warrants to purchase an additional 1.4 million shares of our Class A common stock at $6.25 per share. At the same time, as of the close of business on December 31, 2009, there were approximately 13.9 million shares of our Class A common stock outstanding, at a market price of $5.04 per share.
Each of the warrants likely will be exercised only if the market price of our Class A common stock is above the warrant’s exercise price. To the extent the warrants are exercised, additional shares of our Class A common stock will be issued, which will result in dilution to our stockholders and will increase the number of shares of Class A common stock eligible for resale in the public market. Sales of such shares of Class A common stock in the public market could adversely affect the market price of our Class A common stock.
A substantial number of shares of our Class B common stock were issued in connection with the business combination, which shares, if sold by ED&F Man or its affiliates to persons who are not affiliated with ED&F Man, will automatically convert into shares of our Class A common stock. Such sales and conversions may adversely affect the price of our Class A common stock.
At the closing of the business combination, we issued approximately 12.6 million shares of our Class B common stock to a wholly-owned subsidiary of ED&F Man named Westway Holdings Corporation (which we refer to herein as “Holdings”). These shares remained outstanding as of December 31, 2009.
Subject to conditions set forth in our amended and restated certificate of incorporation, shares of our Class B common stock, if sold by Holdings to a person not affiliated with ED&F Man, will automatically convert into shares of our Class A common stock. In February 2010 we registered shares of our Class A common stock for issuance upon such sales by Holdings. Any such sales by Holdings may adversely affect the price of our Class A common stock.
A substantial number of shares of our Series A preferred stock were issued in connection with the business combination to an ED&F Man subsidiary. Any shares of Series A preferred stock that are sold to persons who are not affiliated with ED&F Man will become convertible into shares of Class A common stock. Such sales and conversions may adversely affect the price of our Class A common stock.
At the closing of the business combination, we issued approximately 30.9 million shares of our Series A Convertible Preferred Stock to Holdings, a subsidiary of ED&F Man. Although approximately 12.2 million of these shares were delivered to an escrow agent for deposit into an escrow account, to be released to Holdings only upon our achievement of certain earnings or share price targets (discussed in the next subsection), the remaining approximately 18.7 million shares of our Series A Convertible Preferred Stock were issued without being subject to the escrow agreement.
Subject to conditions set forth in our amended and restated certificate of incorporation, shares of our Series A Convertible Preferred Stock are convertible into shares of our common stock. In particular, shares of our Series A Convertible Preferred Stock held by ED&F Man or its affiliates are convertible by them only into Class B common stock, and then only up to an amount that would result in their holding, collectively, 49.5% of our common stock. On the other hand, shares of our Series A Convertible Preferred Stock, if sold by Holdings to a person not affiliated with ED&F Man, will be convertible into shares of our Class A common stock. Any such sales by Holdings may adversely affect the price of our Class A common stock.
36
Table of Contents
The shares issued to Holdings are restricted and Holdings will not be able to transfer any of its shares of Series A Convertible Preferred Stock until 18 months after the closing of the business combination and, in the case of the shares of Series A Convertible Preferred Stock held in escrow, unless and until such shares are released to Holdings upon the achievement by us of the earnings or share price targets (discussed in the next subsection).
A substantial number of shares of our Series A Convertible Preferred Stock and Class A common stock are held in escrow to be released only upon our achievement of certain earnings or share price targets. Our achievement of such targets, resulting in the release of shares from escrow, may adversely affect the market price of our Class A common stock.
Approximately 12.2 million shares of our Series A Convertible Preferred Stock issued to Holdings, a subsidiary of ED&F Man, and 1 million shares of our Class A common stock issued to our sponsor Shermen WSC Holdings LLC are currently being held in escrow to be released to the respective owners only upon our achievement of certain earnings or share price performance targets. Placement in escrow does not affect the voting rights or conversion rights of the escrowed shares, but does restrict access to dividends and salability. Our achievement of the targets, resulting in the release of shares from escrow, may adversely affect the market price of our Class A common stock. Generally, the earnings and share price performance targets and the amounts of shares to be released upon their achievement are as follows:
— if the closing share price of our common stock on any five trading days within a seven trading day consecutive period has exceeded $6.50 per share, or our reported EBITDA (as defined) has exceeded $52 million for any 12 month period, then approximately 4.1 million shares of the Series A Convertible Preferred Stock in escrow and any accrued dividends thereon are to be released to Holdings and 958,333 shares of the common stock in escrow and any dividends thereon are to be released to Shermen WSC Holding LLC.
— if the closing share price of our common stock on any five trading days within a seven trading day consecutive period has exceeded $7.00 per share, or our reported EBITDA (as defined) has exceeded $57 million for any 12 month period, then another approximately 4.1 million shares of our Series A Convertible Preferred Stock and any accrued dividends thereon are to be released to Holdings (but no earlier than November 1, 2010) and another 41,667 shares of our common stock and any dividends thereon are to be released to Shermen WSC Holding LLC.
— if the closing share price of our common stock on any five trading days within a seven trading day consecutive period has exceeded $7.50 per share, or our reported EBITDA (as defined) has exceeded $62 million for any 12 month period, then the final approximately 4.1 million shares of our Series A Convertible Preferred Stock and any accrued dividends thereon are to be released to Holdings (but no earlier than November 1, 2011).
For purposes of the earnings targets, “EBITDA” is defined in the stock escrow agreement to mean income (loss) before net interest (defined as the aggregate of interest expense and interest income), income tax, and depreciation and amortization (as further defined by certain accounting principles). For a more detailed description of the earnings and share price performance targets, please see “Certain Relationships and Related Transactions—Related Transactions—Stock Escrow Agreement” in the Prospectus filed by us with the SEC on August 7, 2009.
We may issue additional equity securities which may dilute your interest.
To expand our business, we may consider offering and issuing additional equity or equity-linked securities. Holders of our securities may experience a dilution in their ownership percentage or in the net tangible book value per share held by them if this occurs. The number of shares that we may issue for cash without stockholder approval is limited by the rules of the NASDAQ stock exchange; however, there are exceptions which allow companies to issue a limited number of equity securities which could result in dilution.
37
Table of Contents
An active market for our Class A common stock may not develop.
On December 21, 2009, our Class A common stock, warrants and units became listed on the Nasdaq Capital Market, trading under the symbols “WWAY,” “WWAYW,” and “WWAYU,” respectively. Before that date, our securities were quoted on the Over-the-Counter Bulletin Board. Notwithstanding the listing of our Class A common stock, warrants and units on Nasdaq, we cannot assure you that a regular trading market for our securities will develop on Nasdaq or elsewhere or, if developed, that any market will be sustained. Accordingly, the lack of liquidity of our securities remains a potential risk.
The value of our Class A common stock may be adversely affected by market volatility.
Even if an active trading market develops, the market price of shares of our Class A common stock may be highly volatile and could be subject to wide fluctuations. In addition, the trading volume in shares of our Class A common stock may fluctuate and cause significant price variations to occur. If the market price of shares of our Class A common stock declines significantly, you may be unable to resell your shares at or above your purchase price, if at all. We cannot assure you that the market price of our shares will not fluctuate or decline significantly in the future. Some of the factors that could adversely affect the market price of shares of our Class A common stock or result in fluctuations in the price or trading volume of our shares include:
| • | variations in our quarterly operating results or dividends; |
| • | failure to meet analysts’ earnings estimates or failure to meet, or the lowering of, our own earnings guidance; |
| • | publication of research reports about us or the agriculture industry or the failure of securities analysts to cover our shares; |
| • | departures of key personnel; |
| • | adverse market reaction to any indebtedness we may incur or securities we may issue in the future; |
| • | actions by stockholders; |
| • | changes in market valuations of similar companies; |
| • | speculation in the press or investment community; |
| • | changes or proposed changes in laws or regulations or differing interpretations thereof affecting our business or enforcement of these laws and regulations, or announcements relating to these matters; |
| • | adverse publicity about the agriculture industry generally or individual scandals, specifically; |
| • | fluctuations for reasons unrelated to the agriculture business or our results of operations (for example, we believe some investors closely link the performance of commodity-related stocks with the stocks of agriculture-related companies); and |
| • | general market and economic conditions. |
If our securities are delisted from trading on Nasdaq, our investors’ ability to make transactions in our securities could be limited.
Nasdaq has established certain standards for the continued listing of a security on the Nasdaq Capital Market. The standards for continued listing include, among other things, that the company have at least 300 public holders, that there be at least 500,000 publicly held shares with a market value of at least $1,000,000, and that the minimum bid price for the listed securities be at least $1.00 per share. If we ceased to meet the standards for continued listing and our securities were delisted from Nasdaq, the price of our securities and ability of holders to sell such securities could be adversely affected.
38
Table of Contents
An effective registration statement may not be in place when an investor desires to exercise warrants, thus precluding that investor from being able to exercise his, her or its warrants and causing those warrants to be practically worthless.
No warrant will be exercisable and we will not be obligated to issue shares of common stock in response unless at the time a holder seeks to exercise such warrant, we have filed a registration statement under the Securities Act of 1933, as amended, relating to the common stock issuable upon exercise of the warrant and maintain a current prospectus relating to that common stock, and the common stock has been registered or qualified or deemed to be exempt under the securities laws of the state of residence of the holder of the warrants. Under the terms of the warrant agreement governing the terms of our warrants, we have agreed to use our best efforts to meet these conditions and to maintain a current prospectus relating to the common stock issuable upon exercise of the warrants until the expiration of the warrants. In August 2009, we filed with the SEC our Post-Effective Amendment No. 2 to our registration statement on Form S-1 relating to the shares of common stock issuable upon exercise of warrants that we previously issued to investors in connection with our initial public offering. The post-effective amendment became effective on August 7, 2009. However, we cannot assure you that we will be able in the future to meet the conditions and maintain a current prospectus, and if we do not maintain a current prospectus related to the common stock issuable upon exercise of the warrants, holders will be unable to exercise their warrants and we will not be required to settle any such warrant exercise, whether by net cash settlement or otherwise. If the prospectus relating to the common stock issuable upon the exercise of the warrants is not current or if the common stock is not qualified or exempt from qualification in the jurisdictions in which the holders of the warrants reside, the warrants may have no value, the market for the warrants may be limited, and the warrants may expire worthless. Notwithstanding the foregoing, the insider warrants purchased by our initial stockholders simultaneously with the consummation of our initial public offering may be exercisable for unregistered shares of common stock even if the prospectus relating to the common stock issuable upon exercise of the warrants is not current.
Our stock ownership is highly concentrated, with ED&F Man and its affiliates owning 47.5% of our outstanding common stock as of March 10, 2010. This level of ownership, combined with other rights that were granted to the ED&F Man group at the closing of the business combination, allow it to significantly influence our affairs going forward.
ED&F Man and its affiliates own 47.5% of our common stock as of March 10, 2010. Subject to the provisions of our amended and restated certificate of incorporation, for so long as ED&F Man and its affiliates own at least 35% of the outstanding shares of our common stock, the holders of our Class B common stock (Holdings, a subsidiary of ED&F Man) have the right to elect three of the seven members of our board of directors. This right allows the ED&F Man group to have a significant impact on the determination of our corporate and management policies, including any potential acquisitions, asset sales, and other significant corporate transactions. We have entered into a Stockholder’s Agreement, dated May 28, 2009, with Holdings, which provides that Holdings, so long as it and its affiliated entities collectively own more than a specified percentage of our outstanding common stock (assuming conversion of the Series A Convertible Preferred Stock held by ED&F Man and its affiliates into shares of our common stock), has certain informational and veto rights regarding our operations and activities. See “Certain Relationships and Related Transactions—Related Transactions—Stockholder’s Agreement” in the Prospectus filed by the Company with the SEC on August 7, 2009.
Holdings has the voting power to significantly influence our policies, business, and affairs and has the ability to influence the outcome of any corporate transaction or other matter, including mergers, consolidations, and the sale of all or substantially all of our assets. This concentration in control may decrease the ability of our other stockholders to influence our affairs, and may have the effect of delaying, deterring, or preventing a change of control that otherwise could result in a premium in the price of our common stock.
39
Table of Contents
The interests of the ED&F Man group may not coincide with the interests of other holders of our common stock. The ED&F Man group is the largest supplier to our liquid feed supplements business and the largest customer of our bulk liquid storage business. While the amended and restated certificate of incorporation contains provisions on interested transactions designed to minimize conflicts, the ED&F Man group may have a view on our strategies and policies that is different from that of our other stockholders.
Our amended and restated certificate of incorporation provides that the holders of our Class A common stock will be entitled to elect four members of our board of directors in three classes. This partial classification of our board of directors may make it more difficult to change our management or effect a change in control.
Pursuant to our amended and restated certificate of incorporation, the holders of our Class A common stock are entitled to elect four of the seven members of our board of directors in three classes. Messrs. Francis Jenkins, Jr., Moshenek, Harding and Toffolon are designated as the four directors elected by the holders of our Class A common stock. Mr. Toffolon is a Class I Director and is to serve until our 2010 annual meeting of stockholders. Mr. Moshenek is a Class II Director and is to serve until our 2011 annual meeting of stockholders. Messrs. Francis Jenkins, Jr. and Harding are Class III Directors and are to serve until our 2012 annual meeting of stockholders. In addition, if any person or group other than ED&F Man and its subsidiaries at any time acquires or proposes to acquire or publicly announces its intention to acquire 20% or more of our voting power, the holders of our Class B common stock (who must be ED&F Man and its affiliates) may by notice to us elect to effect a change in the way our directors are classified and elected, so that, among other things:
| • | the term of office of each of the three directors elected by the holders of the Class B common stock would upon delivery of that notice become classified along with that of our other directors, with each of the three directors becoming a member of the class of directors which was elected at the last annual meeting of our stockholders prior to the notice; and |
| • | the holders of our Class B common stock and the holders of our Series A Convertible Preferred Stock (voting on an as-converted basis) would, subject to the limits on their combined voting power, vote together with the holders of our Class A common stock and not separately by class or series, in any election of our directors held at any meeting of our stockholders following that notice. |
Our classified board structure and the rights of the holders of our Class B common stock and our Series A Convertible Preferred Stock to change the classification of directors are intended to provide us with a greater likelihood of continuity of management. A classified board of directors may also serve to deter hostile takeovers or proxy contests because a person could only seek to change, in any given year, no more than one-third of the members of the board of directors entitled to be elected by the holders of our Class A common stock. However, these provisions or measures may limit the ability of our stockholders to sell their shares at a premium over the then current market price by discouraging a third party from seeking to obtain control of us.
Certain of our directors and executive officers own securities of ED&F Man or one or more of ED&F Man’s affiliates and, thus, may have interests that are different from, or in addition to, the interests of our other stockholders.
Certain of our directors and executive officers own securities of ED&F Man or one or more of ED&F Man’s affiliates. Mr. Harding acquired shares in ED&F Man through ED&F Man’s employee equity incentive plans. Messrs. Howell and James Jenkins hold securities of ED&F Man as well. The ownership of such securities, in connection with the possibility that the interests of the ED&F Man group may not coincide with the interests of our other stockholders, may provide these directors and executive officers with interests that are different from our non-ED&F Man associated stockholders.
Approximately 12.2 million shares of our Series A Convertible Preferred Stock issued to Holdings, a subsidiary of ED&F Man, and 1 million shares of our common stock issued to our sponsor, Shermen WSC Holding LLC, are being held in escrow. Because the release of these shares is to be conditioned upon our
40
Table of Contents
achievement of certain earnings or share price targets, officers and directors associated with ED&F Man or Shermen WSC Holding LLC may have the incentive to take actions intended to cause the achievement of these targets, even if such actions would not be in our best interests.
At the closing, we delivered to an escrow agent for deposit into an escrow account approximately 12.2 million shares of our Series A Convertible Preferred Stock, issued to ED&F Man, as part of the consideration for the business combination. These shares are to be released to ED&F Man only upon our achievement of the earnings or share price targets described under the heading “Certain Relationships and Related Transactions—Related Transactions—Stock Escrow Agreement” in the prospectus we filed with the SEC on August 7, 2009. Our sponsor, Shermen WSC Holding LLC, also agreed that 1,000,000 shares of our common stock, which would otherwise be released to Shermen WSC Holding LLC on November 18, 2009, will remain in escrow subject to the satisfaction of the same earnings or share price targets.
Because a number of our directors and officers have interests in, or are affiliated with, either ED&F Man or Shermen WSC Holding LLC, such directors and officers may have the incentive to direct us to take actions intended to cause us to achieve such targets, even if such actions are not in our long-term interest. For instance, such officers and directors may have an additional incentive to have us acquire additional lines of business, which could increase the likelihood that we would satisfy the applicable earnings targets.
We are a holding company with no business operations of our own and depend on our subsidiaries for cash.
We are a holding company with no material assets other than equity in our wholly-owned subsidiaries. Accordingly, all of our operations are conducted by our wholly-owned subsidiaries and their subsidiaries. We currently expect that the earnings and cash flow of our subsidiaries will primarily be retained and used by them in their operations, including servicing any debt obligations they may have now or in the future. Accordingly, although we do not anticipate paying any dividends in the foreseeable future, our subsidiaries may not be able to generate sufficient cash flow to distribute funds to us in order to allow us to pay future dividends on, or make any distributions with respect to, our common stock.
Our amended and restated certificate of incorporation grants the holders of our Series A Convertible Preferred Stock certain rights that could limit our ability to take specified actions, including the payment of dividends to holders of our common stock.
The respective rights, preferences, and limitations of the different classes of our common and preferred stock are governed by our amended and restated certificate of incorporation. Certain of the rights granted to the holders of our Series A Convertible Preferred Stock could limit our ability to take specified corporate actions. For instance, in the event that holders of shares of Series A Convertible Preferred Stock have not received a quarterly dividend owed on these shares, we would be prohibited from declaring or paying dividends to the holders of our common stock, until such quarterly dividend is paid.
In addition, while the holders of Series A Convertible Preferred Stock are not generally entitled to vote on matters submitted to a vote of holders of shares of our common stock, such holders, voting as a single and separate class, have the right to approve, among other things, our ability to:
| • | amend, alter, or repeal any provision of our certificate of incorporation or by-laws (by any means, including by merger, consolidation, reclassification or otherwise) so as to, or in a manner that would, adversely affect the preferences, rights, privileges, or powers of the holders of our Series A Convertible Preferred Stock or in a manner inconsistent with the stockholder’s agreement between us and Holdings (a subsidiary of ED&F Man); |
| • | reclassify any common stock or any other security junior to our Series A Convertible Preferred Stock into shares or other securities having any preference or priority as to payment of dividends, or the distribution of assets or profits superior to, or on parity with, any such preference or priority of the shares of our Series A Convertible Preferred Stock; |
41
Table of Contents
| • | create, increase the number of authorized shares of or issue, or obligate ourselves to issue, any class of equity securities or series of preferred stock, including any security convertible into or exchangeable or exercisable for any equity security, having any preference or priority superior to or on parity with our Series A Convertible Preferred Stock; |
| • | increase the number of authorized shares of preferred stock or Series A Convertible Preferred Stock; |
| • | conduct an offer to repurchase shares of our common stock, other than the repurchase or redemption of warrants to purchase shares of Class A common stock (other than from Shermen WSC Holding LLC or any of our officers or directors) for an aggregate purchase price not greater than $15.0 million; or |
| • | sell, convey, or otherwise dispose of or encumber all, or substantially all, of our assets, or enter into a transaction resulting in our acquisition by another person (except for any such transaction after which our stockholders would own more than half of the voting securities of the surviving entity or its parent and that would not entail a change in our certificate of incorporation or bylaws that would require the consent of the holders of our Series A Convertible Preferred Stock). |
| ITEM 1B. | UNRESOLVED STAFF COMMENTS |
The registrant has not received any written comments from the SEC staff regarding its periodic or current reports under the Securities Exchange Act, not less than 180 days before the end of its fiscal year to which this annual report on Form 10-K relates, that remain unresolved and are material.
| ITEM 2. | PROPERTIES |
We benefit from a significant, long-term presence in many major international coastal locations. Typically, our coastal operations utilize storage locations owned by us or land leased to us under long-term arrangements by state or city run port authorities in the United States or by port authorities in Europe.
All of our 25 bulk liquid storage locations are either owner-occupied or operated under lease agreements with tightly mandated maintenance, building, and usage control. The leases normally provide for a fixed annual rent cost, based on quantifiable inflation ratchet arrangements, and significant lease periods, often in excess of ten years. For all properties, we attach a high degree of importance to protecting and maintaining public land and the environment.
Our largest bulk liquid storage facility locations by storage capacity, whether owned or leased by us, are as follows:
| Bulk Liquid Storage Facility Location |
Storage Capacity (Million Gallons) |
% of Total Storage Capacity(1) |
Owned or Leased | |||
| Houston, TX (No. 1) |
58 | 17% | Owned (80%) and leased (20%) | |||
| Cincinnati, OH |
37 | 11% | Owned (100%) | |||
| Houston, TX (No. 2) |
33 | 9% | Owned (19%) and leased (81%) | |||
| Amsterdam, the Netherlands |
29 | 8% | Leased | |||
| Philadelphia, PA |
20 | 6% | Leased | |||
| Baltimore, MD |
19 | 5% | Leased | |||
| Jacksonville, FL |
16 | 5% | Leased | |||
| Port Allen, LA |
16 | 5% | Leased | |||
| Hamilton, Canada |
16 | 5% | Leased |
| (1) | Capacity details are expressed as a function of the 348 million total gallons of storage currently available to us. |
42
Table of Contents
| • | Houston, TX (No. 1). The Houston No. 1 facility is our largest terminal location globally, having approximately 58 million gallons of capacity, including additional tank construction that recently was completed and added 14.9 million gallons of capacity. This facility provides deep water access through two docks on the Houston ship channel and uses two tracts of land leased from the Port of Houston. Historically, this terminal has represented a primary molasses hub for the ED&F Man group and now serves a broad range of customers and industries. Houston is considered to be the single most concentrated bulk liquid storage location in the United States. |
| • | Cincinnati, OH. The Cincinnati facility is located immediately west of downtown Cincinnati and has approximately 37 million gallons of capacity. The facility is suitably located on the Ohio River and accommodates barge, rail and truck transportation modes. This convenient location of the terminal allows for easy access to the Ohio Valley and beyond. Of the approximate 32 acres of land owned by us, roughly 9.6 acres are available for terminal expansion. |
| • | Houston, TX (No. 2). The Houston No. 2 facility, which is located two miles from the Houston No. 1 facility, is a two berth, deep water terminal also located on the Houston ship channel. Its storage capacity comprises approximately 33 million gallons spread across contiguous lots that are owned by and leased from the Port of Houston and another third-party. The facility serves the same markets as the Houston No. 1 facility. |
| • | Amsterdam, the Netherlands. The Amsterdam facility is our largest single storage capacity outside of North America and is considered by us to be one of our significant strategic investments. Due to its location within the key shipping area of Amsterdam, Antwerp, and Rotterdam, historic demand for storage has been consistently high. The facility currently provides capacity of approximately 29 million gallons. |
| • | Philadelphia, PA. The Philadelphia facility comprises a 10-acre deep water site on the Delaware River. The property is leased from Conrail Inc. and provides approximately 20 million gallons of storage serving regional agriculture and oil refining markets. Other specialty products, including plasticizers, non-petroleum oils, and construction products are also stored in Philadelphia. |
| • | Baltimore, MD. The Baltimore facility comprises 7 acres of deep water storage and is leased from the Maryland Port Administration in Baltimore harbor. The facility has storage capacity of approximately 19 million gallons and serves large regional agriculture, construction materials, lubrication oils, bio-diesel and specialty chemicals markets requiring storage for export and domestic use. |
| • | Jacksonville, FL. The Jacksonville facility provides us with approximately 16 million gallons of bulk liquid storage capacity using deep water property leased from the Jacksonville Port Authority. The facility has traditionally served local agricultural markets and the pulp and paper industry. |
| • | Port Allen, LA. The Port Allen facility comprises an approximately 16.3 million gallon deep water terminal located on the Mississippi River that is leased from the Port of Baton Rouge. The facility is one of our largest molasses terminals and serves the Louisiana sugar industry. |
| • | Hamilton, Canada. The Hamilton facility provides approximately 16 million gallons of capacity on a 17 acre site on the Great Lakes and is leased from the Hamilton Port Authority. The facility serves a large local rendering industry, as well as typical agricultural markets. |
The vast majority of our tanks are constructed from carbon steel and incorporate a variety of internal lining systems that are used to protect the tanks and to preserve the quality of the stored products. We store a considerable number of products requiring the application of heat to preserve the product characteristics. We use a combination of internal steam coils, external heat exchangers, and hot water circulating systems when storing heat-sensitive products. Facility upgrades required to meet the needs of certain stored chemicals are performed as necessary and include leak prevention, automated gauging and loading, vapor control, and fire prevention. We believe that our facilities are well maintained, suitable for our business, and occupy sufficient space to meet our operating needs.
43
Table of Contents
We are a Responsible Care partner company that is committed to safeguarding the health, safety, and security of our employees, customers, and neighbors. We focus on protecting the environment by minimizing the impact of our bulk liquid storage and distribution operations. We are committed to the Responsible Care Guiding Principles and to the implementation of the Responsible Care Management System to facilitate continual improvement of our health, safety, environment, and security performance.
We believe that we have generally satisfactory title to the properties we own and use in our businesses, subject to liens for current taxes, liens incident to minor encumbrances, and easements and restrictions, which do not materially detract from the value of such property or the interests in those properties or the use of such properties in our businesses. In compliance with a credit agreement entered into by us in November 2009, we have granted first priority mortgage liens on the fee or leasehold interests, as applicable, in four terminal facilities (two in Houston, Texas, one in Cincinnati, Ohio, and one in Grays Harbor, Washington).
Our bulk liquid storage capacity utilization percentage was approximately 95% at December 31, 2009, which is consistent with our 2008 capacity utilization.
Our 37 North American, Canadian, and Australian liquid feed facilities are strategically located throughout the continental United States, western Canada, and eastern Australia, allowing us to provide nutritional livestock supplements to the majority of the North American livestock marketplace as well as eastern Australia.
Our liquid feed supplements business is built around a number of geographical markets categorized by the livestock operations and products that are typical to each. The functionality of each facility is dependent on the demographics of the livestock industry in its geographic area. Plants supplying free choice protein supplements (liquid or block) are located in areas of large free-grazing ranches or smaller hobby farm/ranch operations. Ten of our manufacturing facilities produce suspension supplements, which are the most complex liquid feed supplements, and are located in the densely-confined livestock feeding areas, such as the northern Texas panhandle and north-central California. Other products, such as fortified molasses for the dry feed milling industry or general-purpose molasses blends, are generally manufactured at our plant locations.
While each plant is unique as to its storage capacity of raw feed ingredients, manufacturing capability/capacity, and geographical area served, all of our plants can take full advantage of our proprietary least-cost “Brill” product blending and formulation program. This program allows maximum utilization of the various ingredients, while maintaining the nutrient specifications of the liquid feed supplements, thereby generating the highest gross margin for the finished product given the parameters.
We own 17 of our operating liquid facilities and lease the remaining facilities. Typically, our leases of liquid feed supplement facilities are with major port authorities and railroad companies of the United States, although a small number are with private individuals or leasing companies (such as office buildings and toll mill sites). The majority of our leases are more than 15 years in length with a small number that are only one year in duration but subject to annual rollover. Our leases from port authorities typically contain a ten year primary period, normally with two five year renewals at our option and exercise of a renewal requires formal notification from us. All our leases from railroad companies are currently annual leases with evergreen provisions incorporating annual inflation increases. All of our leases include provisions for removing equipment and returning the site to the conditions prior to execution of the original lease, together with provisions for regular testing and remediation of soil quality. We believe that our facilities are well maintained, suitable for our business and occupy sufficient space to meet our operating needs.
44
Table of Contents
Our largest liquid feed supplements manufacturing facilities based on their official name plate capacity, whether owned or leased by us, are as follows:
| Liquid Feed Supplement Facility Location |
Owned/ Leased |
Products Manufactured |
Name Plate Capacity (tons/year) |
% of total |
|||||
| Stockton, CA |
Owned | LS, S | 320,000 | 10 | % | ||||
| Hereford, TX |
Leased | LS, S | 200,000 | 7 | % | ||||
| Dimmitt, TX |
Owned | LS, S | 200,000 | 7 | % | ||||
| Houston, TX |
Owned | LS | 185,000 | 6 | % | ||||
| Baltimore, MD |
Leased | LS | 175,000 | 6 | % |
LS—Liquid Feed Supplements including liquid protein supplements, mill products, and blends (molasses plus one or two other ingredients)
S—Suspensions
Total annual production was approximately 1.6 million tons, each ton comprising 2000 lbs. in weight.
Our liquid feed supplements facilities can be classified into three broad groupings: liquid feed supplements plants, suspension plants, and other plants. Common infrastructure at all sites includes relatively large, steel storage tanks that are typically designed to store viscous liquid products that are heated and have an air agitation system. Typical customer purchases utilize truck transportation of approximately 24 tons each and require a finished feed tank capacity of approximately 5,000-6,000 gallons. We have systems in place to manage “traceability” of all finished product shipments for the benefit of our customers.
Liquid Feed Supplement Plants. Liquid supplement plants typically manufacture liquid protein supplements, feed mill products, or simple blends. Twenty-four of our plants have the ability to manufacture liquid protein supplements.
Suspension Plants. Suspension plants require specific dry ingredient storage infrastructure and mixing systems. Suspension formulations normally contain up to 30% insoluble feed ingredients, such as calcium carbonate, potassium chloride, and protein meals. These dry feed ingredients are finely ground and suspended in various liquid ingredients. Ten of our plants have the ability to manufacture suspension products.
Other Plants. Other plants consist of facilities that manufacture dried molasses, blocks, and whey. Five of our plants fall into this grouping, as well as one joint venture site.
We currently have obtained FCI (Facility Certification Institute) certification for all of our U.S. owned and leased manufacturing sites.
We believe that we have generally satisfactory title to the properties we own and use in our businesses, subject to liens for current taxes, liens incident to minor encumbrances, and easements and restrictions, which do not materially detract from the value of such property or the interests in those properties or the use of such properties in our businesses. In compliance with a credit agreement entered into by us in November 2009, we have granted first priority mortgage liens on the fee or leasehold interests, as applicable, in two feed facilities (one in Houston, Texas, and one in Cincinnati, Ohio).
| ITEM 3. | LEGAL PROCEEDINGS |
The Company is not involved in any legal proceedings which are anticipated to have a material effect on its business, financial position, results of operations or liquidity, nor is the Company aware of any proceedings that are pending or threatened which may have a material effect on its business, financial position, results of operations or liquidity. From time to time, the Company is subject to legal proceedings and claims in the ordinary course of business operations.
| ITEM 4. | RESERVED |
45
Table of Contents
PART II
| ITEM 5. | MARKET FOR REGISTRANT’S COMMON EQUITY, RELATED STOCKHOLDER MATTERS AND ISSUER REPURCHASES OF EQUITY SECURITIES |
Market Information
The shares of our Class A common stock, warrants, and units are currently listed for trading on the NASDAQ stock market under the symbols WWAY, WWAYW, and WWAYU, respectively. Before December 21, 2009 but after the business combination on May 28, 2009, our Class A common stock, warrants, and units were quoted on the OTC Bulletin Board under the symbols WTWG, WTWGW, and WTWGU, respectively. Prior to the business combination on May 28, 2009, our common stock, warrants, and units were quoted on the OTC Bulletin Board under the symbols SACQ, SACQW, and SACQU.
Each warrant listed for trading on NASDAQ entitles the holder to purchase from us one share of our Class A common stock at an exercise price of $5.00. The warrants will expire at 5:00 p.m., New York City time, on May 24, 2011, or earlier upon redemption.
Each unit listed for trading on NASDAQ consists of one share of our Class A common stock and two warrants.
The public trading market for our Class A common stock is somewhat sporadic and not yet firmly established. Our Class B common stock and our Series A Convertible Preferred stock are not publicly traded.
The following table sets forth the quarterly high and low sales prices of our Class A common stock, warrants, and units as reported on the NASDAQ stock market for the period from December 21, 2009 through December 31, 2009:
| Class A Common Stock | Warrants | Units | ||||||||||
| High | Low | High | Low | High | Low | |||||||
| 2009 Fourth Quarter(1) |
5.19 | 4.31 | 0.31 | 0.25 | 6.01 | 6.01 | ||||||
| (1) | Our Class A common stock, warrants, and units commenced trading on the NASDAQ stock market on December 21, 2009. |
The following table sets forth the quarterly high and low bid information of our Class A common stock, warrants, and units as reported by the OTC Bulletin Board for each quarter during the last two fiscal years, except (i) the “2009 Fourth Quarter” figures only cover the period from October 1, 2009 through December 20, 2009, and (ii) before the business combination on May 28, 2009, we had only one class of common stock. The OTC Bulletin Board quotations reflect inter-dealer prices, are without retail mark-up, markdowns, or commissions, and may not represent actual transactions.
| Common Stock | Warrants | Units | ||||||||||||||||
| High | Low | High | Low | High | Low | |||||||||||||
| 2008 First Quarter |
$ | 5.65 | $ | 5.58 | $ | 0.32 | $ | 0.10 | $ | 6.37 | $ | 5.85 | ||||||
| 2008 Second Quarter |
5.77 | 5.60 | 0.17 | 0.12 | 6.07 | 5.08 | ||||||||||||
| 2008 Third Quarter |
5.78 | 5.67 | 0.15 | 0.06 | 6.00 | 5.84 | ||||||||||||
| 2008 Fourth Quarter |
5.75 | 5.29 | 0.10 | 0.01 | 5.84 | 5.20 | ||||||||||||
| 2009 First Quarter |
5.90 | 5.72 | 0.08 | 0.02 | 6.00 | 5.65 | ||||||||||||
| 2009 Second Quarter(2) |
6.00 | 1.25 | 0.30 | 0.06 | 6.54 | 6.00 | ||||||||||||
| 2009 Third Quarter |
4.75 | 3.70 | 0.32 | 0.20 | 6.01 | 6.01 | ||||||||||||
| 2009 Fourth Quarter(3) |
5.20 | 3.75 | 0.33 | 0.19 | 6.01 | 6.01 | ||||||||||||
| (2) | Our outstanding common stock became Class A common stock on May 28, 2009. |
| (3) | Our Class A common stock, warrants, and units commenced trading on the NASDAQ stock market on December 21, 2009. |
46
Table of Contents
Holders
As of March 8, 2010, there were approximately 715 holders of record of our Class A common stock, 6 holders of record of our warrants, and 6 holders of record of our units. There were also 1 holder of record of our Class B common stock and 1 holder of record of our Series A preferred stock. We believe the actual number of holders of our Class A common stock is substantially more than indicated.
Dividends
During the last two fiscal years, the only dividends we declared were a special cash dividend of $1.00 per share, paid on June 18, 2009 to our shareholders of record as of the close of business on June 8, 2009 (other than those who waived receipt of the dividend). The dividend was paid in connection with our acquisition of the bulk liquid storage and liquid feed supplements businesses of the ED&F Man group.
Our credit agreement with the bank syndicate provides that we will not declare or make, or agree to pay or make, directly or indirectly, any cash dividends until all principal, interest, fees, and other amounts payable under the loan documents have been paid in full and all commitments and letters of credit have expired or terminated.
Our amended and restated certificate of incorporation provides that no cash dividends may be declared or paid on any share of our Class A common stock or Class B common stock unless a like dividend is declared or paid on shares of both classes of common stock simultaneously.
Our amended and restated certificate of incorporation further provides that our Series A Convertible Preferred stock shall rank senior and prior to our common stock with respect to the payment of cash dividends in the amount of $0.0344 per shares of Series A Convertible Preferred stock (referred to as “base dividends”) that accrue on a quarterly basis, cumulatively, until May 28, 2016, whether or not earned or declared, and whether or not there are any profits, surplus, or other of our funds legally available for the payment of dividends. We may pay or set aside funds for the payment of a cash dividend in respect of our common stock if, and only if, (i) all accrued and unpaid base dividends on the Series A Convertible Preferred stock have been declared and paid for all prior Series A dividend periods and (ii) our board of directors has declared, and we pay, contemporaneously with the payment of such dividend, the accrued, but unpaid, portion of each base dividend payable to the holders of Series A Convertible Preferred stock with respect to the Series A dividend period in which such payment of a cash dividend in respect of our common stock would occur.
Our amended and restated certificate of incorporation further provides that no cash dividend may be declared, set aside, or paid on our common stock for so long as any shares of our Series A Convertible Preferred stock are outstanding, unless we have obtained the written consent or affirmative vote of holders of at least a majority of the voting power of the outstanding shares of Series A Convertible Preferred stock, voting separately as a single class.
In light of our expansion strategy and other corporate purposes for which we may spend funds, as well as the restrictions in our credit agreement and amended and restated certificate of incorporation, we do not presently have an intention to pay cash dividends in the foreseeable future.
Securities Authorized for Issuance under Equity Compensation Plans
As of December 31, 2009, we had no compensation plans (including individual compensation arrangements) under which our equity securities are authorized for issuance.
47
Table of Contents
Performance Graph
The following graph compares the cumulative total return for our common stock from June 18, 2007, the date our common stock started trading separately, through May 28, 2009, the date of our business combination, and then of our Class A common stock from May 28, 2009, through December 31, 2009, with the comparable return of two indices, the NASDAQ Composite Index and the Russell 2000. The graph assumes $100 invested on June 18, 2007 in our common stock and $100 invested at the same time in each of the two listed indices. The stock price performance shown on the graph is not necessarily indicative of future price performance.
COMPARISON OF 30 MONTH CUMULATIVE TOTAL RETURN*
Among Westway Group, Inc., The NASDAQ Composite Index
And The Russell 2000 Index
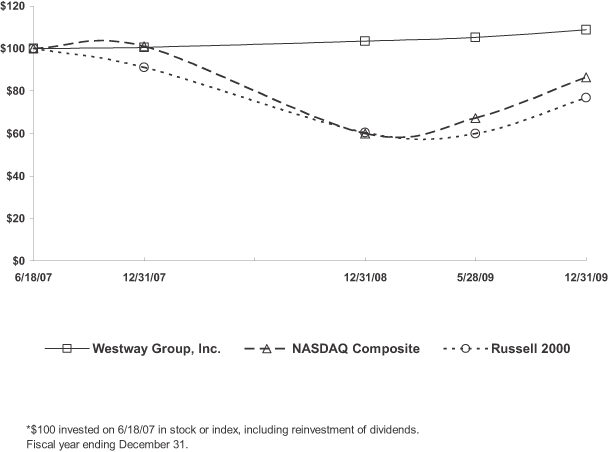
| Base Period 6/18/07 |
INDEXED RETURNS Years Ending | |||||||||
| Company/Index |
12/31/07 | 12/31/08 | 5/28/09 | 12/31/09 | ||||||
| Westway Group Inc. |
100 | 100.54 | 103.42 | 105.22 | 108.73 | |||||
| NASDAQ Composite Index |
100 | 100.93 | 59.86 | 67.18 | 86.33 | |||||
| Russell 2000 Index |
100 | 91.16 | 60.36 | 59.91 | 76.76 | |||||
| NASDAQ Non-Financial Index—(1) |
100 | 101.54 | 50.46 | 88.24 | 152.93 | |||||
| (1) | In our previously filed 10-K, we selected the NASDAQ Non-Financial Index to compare in the performance graph. We do not feel the companies in the NASDAQ Non-Financial Index have similar market capitalization |
48
Table of Contents
| to us anymore based on our new capital structure; therefore we have replaced this index with the Russell 2000 index. Given our particular combination of business segments, we do not feel we can reasonably identify an appropriate published industry or line-of-business index or peer group at this time. |
Unregistered Sales of Equity Securities
We did not make any sales of equity securities during the fourth quarter of 2009 that were not registered under the Securities Act. On December 15, 2009, we granted 3,100 shares of our Class A common stock to non-executive employees of the Company (100 shares to each of 31 employees). Information with respect to our sales of equity securities in the first three quarters of 2009 was previously included on our quarterly reports on Form 10-Q or in current reports on Form 8-K.
Repurchases of Equity Securities
The table below provides information on purchases made by the Company or any affiliated purchaser thereof during the indicated months of shares of the Company’s equity securities that were registered pursuant to section 12 of the Exchange Act.
| Period |
(a) Total number of shares purchased |
(b) Average price paid per share |
(c) Total number of shares purchased as part of publicly announced plans or programs |
(d) Maximum number (or approximate dollar value) of shares that may yet be purchased under the plans or programs | ||||
| 10-1-09 to 10-31-09 |
0 | 0 | 0 | 0 | ||||
| 11-1-09 to 11-30-09 |
0 | 0 | 0 | 0 | ||||
| 12-1-09 to 12-31-09 |
0 | 0 | 0 | 0 |
| ITEM 6. | SELECTED FINANCIAL DATA |
The following table summarizes our selected historical consolidated financial information, which should be read in conjunction with “Management’s Discussion and Analysis of Financial Condition and Results of Operations” and the financial statements and related notes included elsewhere in this document. The information as of and for the period ended December 31, 2009 includes the results of the acquired business operations for only the 217 days beginning May 29, 2009 and ending December 31, 2009. Prior to May 29, 2009, our efforts were limited to organizational activities, activities relating to the IPO, activities relating to identifying and evaluating prospective acquisition candidates, activities relating to negotiating and consummating the acquisition, and activities relating to general corporate matters; we neither engaged in any operations nor generated any revenue, other than interest income earned on the proceeds of the initial public offering.
49
Table of Contents
WESTWAY GROUP, INC.
SELECTED HISTORICAL FINANCIAL DATA
(US dollars in thousands, except for share data and per share amount)
| Year Ended December 31, 2009(1) |
Year Ended December 31, 2008 |
Year Ended December 31, 2007 |
April 18, 2006 December 31, (inception) to 2006 |
|||||||||||
| Income Statement Data: |
||||||||||||||
| Total net revenue |
$ | 188,787 | $ | — | $ | — | $ | — | ||||||
| Business combination expenses |
13,891 | — | — | — | ||||||||||
| Net income/(loss) |
(3,727 | ) | 741 | 1,166 | (16 | ) | ||||||||
| Income/(loss) per share subject to possible redemption, basic and diluted |
— | — | 0.06 | — | ||||||||||
| Income/(loss) per share not subject to possible redemption: |
||||||||||||||
| Basic |
$ | (0.26 | ) | $ | 0.04 | $ | 0.06 | $ | (0.01 | ) | ||||
| Diluted |
$ | (0.26 | ) | $ | 0.03 | $ | 0.04 | $ | (0.01 | ) | ||||
| Cash dividends declared per common share |
$ | 1.00 | $ | — | $ | — | $ | — | ||||||
| Selected Balance Sheet Data (at period end): |
||||||||||||||
| Current assets |
$ | 83,517 | $ | 138,665 | $ | 191 | $ | 21 | ||||||
| Property, plant and equipment |
324,587 | — | — | — | ||||||||||
| Total assets |
517,698 | 139,377 | 139,182 | 479 | ||||||||||
| Current liabilities |
59,349 | 486 | 1,032 | 470 | ||||||||||
| Long-term obligations |
162,988 | 3,312 | 3,312 | — | ||||||||||
| Common stock subject to redemption, including deferred interest, |
— | 55,067 | 55,097 | — | ||||||||||
| Total stockholders’ equity |
295,361 | 80,512 | 79,741 | 9 | ||||||||||
| (1) | Twelve months ended December 31, 2009 includes only 217 days of acquired business operations from May 29, 2009 to December 31, 2009. |
Before May 29, 2009, our acquired business (predecessor) was organized and managed on a combined basis as part of a division under ED&F Man. The combined carve-out financial data of the predecessor for operations prior to the acquisition are presented below. The financial data on a consolidated basis subsequent to the acquisition of the predecessor are not comparative to the combined carve-out financial statements of the predecessor prior to such acquisition principally because the basis for the acquired assets and liabilities have been adjusted to fair value pursuant to U.S. GAAP in our financial statements after the acquisition and because the predecessor operations reported on a different calendar as disclosed in our definitive proxy statement filed on Schedule 14-A filed with the U.S. Securities and Exchange Commission on May 14, 2009.
The predecessor combined carve-out financial data includes allocations of expenses arising from shared services and infrastructure provided by the ED&F Man group. These expenses primarily relate to employee compensation and benefits, office facilities and services arising from the provision of corporate functions including tax, legal and compliance, risk management, finance, internal audit, and executive management. These expenses are allocated using estimates that management considers to be a reasonable reflection of the utilization of services provided to, or benefits received by our predecessor. Costs included in the predecessor combined carve-out financial statements for such services provided to our predecessor are included in selling, general and administrative expenses. These costs may not be representative of the costs for us to operate.
50
Table of Contents
The following table summarizes our predecessor combined carve-out selected historical financial information for the bulk liquid storage and liquid feed supplements businesses of ED&F Man group prior to the May 28, 2009 business combination.
PREDECESSOR COMBINED CARVE-OUT
SELECTED HISTORICAL FINANCIAL DATA
(US dollars in thousands)
| November 1, 2008 Through May 28, 2009 |
Year ended October 31, | |||||||||||||||||
| 2008 | 2007 | 2006 | 2005 | 2004 | ||||||||||||||
| Income Statement Data: |
||||||||||||||||||
| Total net revenues |
$ | 212,019 | $ | 370,323 | $ | 292,501 | $ | 302,400 | $ | 284,616 | $ | 257,660 | ||||||
| Net income |
$ | 13,383 | $ | 26,967 | $ | 17,562 | $ | 10,492 | $ | 6,868 | $ | 10,267 | ||||||
| Year ended October 31, | ||||||||||||||||||
| 2008 | 2007 | 2006 | 2005 | 2004 | ||||||||||||||
| Selected Balance Sheet Data: |
||||||||||||||||||
| Current assets |
$ | 64,373 | $ | 48,477 | $ | 49,315 | $ | 56,773 | $ | 44,449 | ||||||||
| Property, plant and equipment |
137,390 | 129,362 | 116,033 | 111,802 | 110,691 | |||||||||||||
| Total assets |
211,744 | 187,554 | 172,735 | 175,505 | 161,519 | |||||||||||||
| Current liabilities |
49,599 | 44,042 | 41,933 | 30,870 | 21,199 | |||||||||||||
| Long-term obligations |
24,343 | 21,508 | 22,588 | 24,978 | 22,253 | |||||||||||||
| Total liabilities and minority interest |
75,128 | 66,780 | 64,574 | 55,897 | 43,500 | |||||||||||||
| ED&F Man net invested capital |
136,616 | 120,774 | 108,161 | 119,607 | 118,018 | |||||||||||||
In March 2009, the Company determined there was a reclassification error in the previously issued predecessor combined carve-out financial statements whereby operating costs from one of the combined operating entities were erroneously included in costs of sales for the year ended October 31, 2008 and erroneously excluded from selling, general and administrative expenses. The predecessor combined carve-out financial statements for the year ended October 31, 2008 were restated to reflect this reclassification and reduce costs of sales by $6.0 million and increase selling, general and administrative expenses by a corresponding amount to reflect the reclassification of the operating costs. The restatement resulted in no change to operating income or net income.
Various uncertainties that might cause the data in the tables above not to be indicative of our future financial condition or results of operations are addressed in the “Risk Factors” section of this Form 10-K.
| ITEM 7. | MANAGEMENT DISCUSSION AND ANALYSIS OF FINANCIAL CONDITION AND RESULTS OF OPERATIONS |
Understanding Our Financial Information
The discussion under “Results of Operations—Pro Forma with Acquired Business” on page 57 includes selected pro forma financial information derived from the Company’s and the acquired business’ audited results, as if the Company and the acquired business were combined as of January 1, 2008.
The discussion under “Results of Operations—Actual” on page 64 includes the results of the acquired business since May 29, 2009 only, and does not include the results of the acquired business before then. Prior to the acquisition of the acquired business on May 28, 2009, the Company had no operations nor did it generate operating revenue, as it was considered a “special purpose acquisition company.”
51
Table of Contents
The following discussion and analysis provides information management believes to be relevant to an understanding of our financial condition and results of operations. We begin this discussion and analysis with a general overview of our recent business combination and our segments. We then discuss our material ongoing arrangements with the ED&F Man group, followed by details regarding our critical accounting estimates. We then review the pro forma results of operations for the acquired business as if the acquired business were combined with us as of January 1, 2008, followed by a brief review of our key performance indicators. We then discuss and analyze our actual operating results, followed by a discussion and analysis of our “Liquidity and Capital Resources.” We conclude with a brief review of “Factors that Affect Financial Performance” to give the reader a further understanding of the nature and challenges of our business.
Westway Group, Inc., together with its wholly-owned subsidiaries (the “Company” or “we” or “us”) is a leading global provider of bulk liquid storage and related value-added services and the largest manufacturer and distributor of liquid feed supplements for the livestock industry in North America. Our Class A common stock is currently traded on the NASDAQ stock market under the symbol “WWAY”.
The May 2009 Business Combination
Before 2009, our predecessor businesses were organized and managed on a combined basis as part of a division under ED&F Man Holdings Limited (“ED&F Man”), a company with global operations headquartered in the United Kingdom. On November 25, 2008, a business combination agreement was signed whereby ED&F Man’s bulk liquid storage and liquid feed supplements businesses would be acquired by us under our former name Shermen WSC Acquisition Corp. (“Shermen” renamed Westway Group, Inc. upon completion of the business combination) in exchange for common and preferred stock and cash. Previously, Shermen was organized in 2006 as a “special purpose acquisition company” solely for the purpose of acquiring, through a merger, capital stock exchange, asset acquisition, stock purchase or other similar business combination, an operating business.
The business combination was completed on May 28, 2009, whereby the bulk liquid storage and liquid feed supplements businesses of the ED&F Man group were acquired by Shermen. ED&F Man and its affiliates became the largest stockholder, owning 47.5% of the outstanding common stock and 100% of the Series A Convertible Preferred Stock—a portion of which was deposited into escrow for release upon the achievement of certain earnings or stock price targets—and Shermen’s name was changed to “Westway Group, Inc.”
In connection with the business combination, we entered into several agreements with the ED&F Man group: (1) ED&F Man Liquid Products Corporation, a subsidiary of ED&F Man, agreed to supply molasses to our liquid feed supplements operation; (2) Westway Terminal Company, LLC, a subsidiary of ours, entered into a strategic alliance with ED&F Man relating to the use of our bulk liquid storage facilities; and (3) both ED&F Man and we will provide certain operational and administrative support services to each other on a shared service basis.
To facilitate the business combination and for other purposes, including working capital and capital expenditures, we and ED&F Man Treasury Management plc (“ED&F Man Treasury”), an affiliate of ED&F Man, entered into a credit facility agreement whereby ED&F Man Treasury agreed to make available a $100 million two-year revolving credit facility to us. Additionally, ED&F Man Treasury agreed to provide an incremental $1 million foreign exchange facility, an incremental $5 million foreign currency overdraft facility, and a facility for standby and documentary letters of credit, bonds, and guarantees to us. The credit facility agreement was replaced by a very similar agreement among the same parties in August 2009, which in turn was paid off and terminated the $100 million two-year revolving credit facility in its entirety in November 2009 when we obtained a $175 million 3-year revolving credit facility from a syndicate of banks.
52
Table of Contents
Lines of Business, Locations of Operations, and Principal Products and Services
We currently operate an extensive global network of 25 operating storage facilities providing 348 million gallons of total bulk liquid storage capacity (including capacity acquired in our recent Cincinnati terminal transaction on October 15, 2009) and 37 operating liquid feed supplement facilities producing approximately 1.6 million tons of liquid feed supplements annually.
Our bulk liquid storage business is a global business with infrastructure that includes a network of 25 terminals offering storage to manufacturers and consumers of agricultural and industrial liquids, located at key port and terminal locations throughout North America, in Western Europe, and in Asia. We coordinate closely with our customers in designing and adapting the customized product handling systems required for each specific product. Our value-added services are customer specific and also include transloading of bulk liquids and acting as regional distribution centers. A key strategic aspect of our storage business is the fact that it has maintained a long-term presence in a number of highly critical, deep water ports from which it can offer its international customer base access to storage combined with the highest level of service in these important markets.
Our liquid feed supplements business produces liquid animal feed supplements that are sold directly to end users, feed manufacturers, distributors (primarily supplying beef and dairy), and livestock industries. By using formulation processes that are tailored specifically to the needs of our customers, we blend molasses and essential nutrients to form feed rations that help to maximize the genetic potential of livestock. Our 37 manufacturing and distribution locations allow us to provide nutritional liquid feed supplements to the majority of the U.S. and Canadian livestock market. In addition, 8 of our facilities are positioned at deep water port locations, allowing for the more efficient receipt of imported ingredients such as molasses and condensed molasses solubles, and therefore provide a competitive advantage to us since approximately 40% of the molasses consumed for livestock supplements in the U.S. is imported. The balance of our manufacturing locations are either strategically located on navigable inland river systems or have direct railroad access. We believe that our liquid feed supplements business is the leading North American manufacturer of liquid animal feed supplements and the only such supplier with a true national footprint in the U.S.A.
Synergistically, the bulk liquid storage and liquid feed supplements businesses mutually benefit from co-location of facilities, including enhanced raw material supply logistics for liquid feed supplements and increased operational efficiency resulting from the exchange of cross-business knowledge. We currently own and/or lease 122 acres of developable land adjacent to our existing facilities.
Our Corporate segment includes unallocated general and administrative expenses including, in part, executive, legal, finance, information technology, and human resources expenses, as well as interest expenses related to corporate debt.
The Company is headquartered in New Orleans, LA and has 499 employees world wide as of March 10, 2010.
Material Ongoing Arrangements with the ED&F Man Group
As a result of the business combination on May 28, 2009, ED&F Man and its affiliates became our largest stockholder, owning 47.5% of our outstanding common stock and 100% of our Series A Convertible Preferred Stock, a portion of which was deposited into escrow for release upon the achievement of certain earnings or stock price targets.
Prior to the business combination, as a consequence of being owned by ED&F Man, the acquired business maintained a significant commercial relationship with the ED&F Man group. After the business combination, a significant commercial relationship has continued. It now centers on the following agreements.
53
Table of Contents
Preferred Supplier Arrangements
Our long-term relationship as a preferred supplier of bulk liquid storage to the ED&F Man group’s various trading divisions is a major part of our success and growth strategy. We believe that our relationship with the ED&F Man group provides us with global expansion opportunities. As a preferred supplier, we expect to secure a minimum load volume that will support both our existing and new locations. The terms of the agreement have a pricing mechanism very close to market prices.
Molasses Supply Contract
Molasses is an important ingredient utilized in our liquid feed supplement formulations. We and the ED&F Man group have established a long-term molasses supply agreement, pursuant to which the ED&F Man group will be our primary supplier of cane molasses, with a pricing mechanism which approximates the market price of imported molasses.
Shared Services
The ED&F Man group agreed to provide transitional services to us for a period of twelve months following the business combination. The ED&F Man group has been providing certain human resources, information technology, accounting administration, invoicing, treasury management, and other services. In addition, we have to provide transitional services to the ED&F Man group for a period of twelve months following the business combination, consisting mostly of the same type of services. Following this contracted period, transitional arrangements exist to facilitate the final separation of activities, function by function, at the mutual agreement of both parties. We are currently in the process of terminating this agreement, which is expected to occur during 2010.
Insurance Participation Agreement
We have a participation agreement with a captive insurance company owned by ED&F Man. The captive underwrites the self-insured portion of certain risks insured by us through the captive and charges a premium for the first layer claims exposure. Under this agreement all of our transactions are segregated from the ED&F Man group’s business.
The preparation of financial statements in accordance with U.S. generally accepted accounting principles requires management to make assumptions, judgments, and other estimates that affect the amounts reported in the financial statements. In any given period, the actual facts and results could differ materially from the estimates used in preparing financial statements.
A detailed summary of our significant accounting policies appears in Note 3 to our consolidated financial statements included in this Form 10-K. Certain of these policies involve accounting estimates that we deem critical due to the subjectivity, complexity, or difficulty of the assumptions, judgments, or other estimates required to be made; the degree of uncertainty at the time the assumption, judgment, or other estimate is made; and the likelihood that materially different amounts could be reported using different assumptions, judgments, or other estimates.
Management periodically discusses the development, selection, application, and disclosure of our key accounting policies, as well as the critical accounting estimates, with the Audit Committee of the Board of Directors. The accounting estimates we currently consider to be critical are as follows:
54
Table of Contents
Acquisitions
Our 2009 acquisitions of businesses resulting in our control are accounted for under the purchase method of accounting. The amounts assigned to the identifiable assets acquired and liabilities assumed in connection with acquisitions are based on estimated fair values as of the date of the acquisition, with the remainder, if any, recorded as goodwill. The fair values are determined by our management, taking into consideration information supplied by the management of the acquired business and other relevant information. Such information includes valuations supplied by independent appraisal for significant business combinations. The valuations are based on one or more of three methods: future cash flow projections for the acquired assets, discounted to present value (income approach), the price at which comparable assets are purchased under similar circumstances (market approach), and an estimate of the current cost to purchase or replace the asset (cost approach). The determination of fair value requires significant judgment by management. In accordance with generally accepted accounting principles, the final allocation is expected to be made within one year of the acquisition.
Goodwill and Indefinite-Lived Intangible Assets
We test goodwill for impairment annually or on a more frequent basis if events or changes in circumstances occur that indicate potential impairment. There is a two-step methodology for determining impairment that begins with an estimation of the fair value of the reporting unit. The first step is a screen for potential impairment, and the second step measures the amount of impairment, if any.
We tested goodwill created in the bulk liquid storage and liquid feed supplement acquisition for impairment on October 1, 2009. The reporting unit for the impairment test was Westway Group Inc, as goodwill has not been allocated to reporting units as the valuation is still preliminary. The result of the assessment resulted in no indicators of impairment. Moreover, no significant events occurred or major circumstances changed relating to the acquired business since the business combination, including adverse changes in the key assumptions or variables that contradict the preliminary valuation.
Property, Plant & Equipment
When purchased, the values of our property, plant & equipment are recorded initially at historical cost. However, when an item is acquired as part of the acquisition of a business (including the business combination on May 28, 2009), as has been the case for most of our property, plant & equipment, its value is initially recorded according to its estimated fair value. This value reflects management’s assumptions about the assumptions that would be made by market participants if they were to buy or sell each identified asset on an individual basis. Once an item is initially recorded, however purchased, it is later depreciated using the straight-line method over its estimated useful life, subject to adjustments due to economic or functional obsolescence.
The major portion of our property, plant & equipment consists of storage tanks that were purchased as part of the business combination or an acquisition. We estimated the fair value of each such tank by estimating the cost to construct or buy a similar asset of equivalent utility at current prices. In order to establish a depreciation schedule, we also estimated the remaining useful lives of the storage tanks. The estimation of useful lives of such length is inherently uncertain, difficult, and imprecise. Factors such as changes in competition, regulation, or environmental matters may cause us to change our estimates. Changes in the estimated useful lives of the property, plant and equipment could have a material adverse effect on our results of operations.
U.S. GAAP requires write-downs to be recorded on long-lived assets used in operations when indicators of impairment are present and the undiscounted cash flows estimated to be generated by those assets are less than the assets’ carrying amount. In assessing potential impairment, we consider the operating performance and projected undiscounted cash flows of the relevant assets. If the projected cash flows are estimated to be less than the assets’ carrying value, we may have to record impairment charges. The fair value of the assets is estimated based on discounted future cash flows or independent appraisals from third parties.
55
Table of Contents
Income Taxes
We record deferred tax assets or liabilities based on differences between the financial reporting and tax basis of assets and liabilities using currently enacted rates and laws that we assume will still be in effect when we expect the differences to reverse. Due to changing tax laws and state income tax rates, significant judgment is required to estimate the effective tax rate expected to apply to tax differences that are expected to reverse in the future.
We hold, through our wholly owned affiliates, cash balances in the countries in which we operate, including amounts held outside the United States. Most of the amounts held outside the United States could be repatriated to the United States, but, under current law, may be subject to United States federal income taxes, less applicable foreign tax credits. Repatriation of some foreign balances is restricted by local laws, including the imposition of withholding taxes, in some jurisdictions.
Results of Operations—Pro Forma with Acquired Business
The actual results of operations of the Company for 2009, 2008, and 2007 do not provide a very meaningful basis for comparison since we were only an operating company during 2009 and then only for 217 days. To provide a more meaningful comparison, we present in this section the pro forma combined operational results for 2009 of the Company together with the acquired business (the bulk liquid storage and liquid feed supplements businesses we acquired from the ED&F Man group on May 28, 2009), and we compare them to the pro forma combined operational results for 2008 of the Company together with the acquired business. The following selected pro forma financial information was prepared from the Company’s and acquired business’ audited results, as if the Company and the acquired business were combined as of January 1, 2008.
The pro forma results of operations do not include business combination costs ($13.9 million), formation and operating costs associated with Shermen ($476,000 and $869,00 for the year ended December 31, 2009 and 2008 respectively), or interest income from the trust account held by Shermen ($138,000 and $2.4 million for the years ended December 31, 2009 and 2008 respectively). The pro forma adjustments include an imputed interest expense based on historical borrowings and average interest rates of the acquired business for the periods presented before May 29, 2009, since before the business combination ED&F Man group’s debt and interest and other financing related costs were not specifically identified as corporate borrowings from the ED&F Man group. The pro forma adjustments for the periods before May 29, 2009 include assumed corporate general and administrative costs associated with operating as a public company, which were assumed to be comparable in amount to the actual corporate general and administrative costs after May 28, 2009. The pro forma results include an adjustment that assumes a full year of dividends payable on 30,886,830 shares of Series A Convertible Preferred Stock, including escrowed shares, at $0.0344 per share for both 2009 and 2008.
The pro forma results include the operating results of the Southside River Rail-Terminal acquisition on October 15, 2009, as well as amortization of debt issuance costs incurred as a result of the syndicated bank credit facility entered into on November 12, 2009, along with additional facility fees related to this new facility.
In addition to providing a more meaningful basis for comparison, the pro forma information is also useful because it provides investors with information about the continuing impact of the business combination on May 28, 2009 by showing how it might have affected our historical financial statements if the business combination had been consummated on January 1, 2008 instead. The pro forma information should assist investors in analyzing our future prospects because it illustrates the possible scope of the change in our historical financial position and results of operations caused by the business combination. The pro forma results of operations are not necessarily indicative of results of operations that may have actually occurred had the business combination taken place on January 1, 2008, or the future financial position or operating results of the Company. The pro forma adjustments are based upon available information and assumptions that we believe are reasonable.
56
Table of Contents
The presentation of the pro forma results is not intended to be considered in isolation or as a substitute for the actual historical financial information prepared and presented in accordance with U.S. GAAP.
The unaudited pro forma financial statements were assembled based on financial statement information prepared and presented in accordance with U.S. GAAP, and then adjusted as discussed above.
57
Table of Contents
WESTWAY GROUP, INC.
PRO FORMA CONSOLIDATED STATEMENTS OF OPERATIONS (in thousands) (unaudited)
| Bulk Liquid Storage Year Ended December 31, |
Liquid Feed Supplements Year Ended December 31, |
Corporate and Other Year Ended December 31, |
Total Year Ended December 31, |
||||||||||||||||||||||||||||
| 2009 | 2008 | 2009 | 2008 | 2009 | 2008 | 2009 | 2008 | ||||||||||||||||||||||||
| (Pro Forma) | (Pro Forma) | (Pro Forma) | (Pro Forma) | (Pro Forma) | (Pro Forma) | (Pro Forma) | (Pro Forma) | ||||||||||||||||||||||||
| Net revenues |
|||||||||||||||||||||||||||||||
| Third parties |
$ | 59,853 | $ | 57,962 | $ | 255,346 | $ | 298,337 | $ | — | $ | — | $ | 315,199 | $ | 356,299 | |||||||||||||||
| Related parties—ED&F Man |
14,037 | 14,367 | 195 | 683 | — | — | 14,232 | 15,050 | |||||||||||||||||||||||
| Total net revenues |
73,890 | 72,329 | 255,541 | 299,020 | — | — | 329,431 | 371,349 | |||||||||||||||||||||||
| Cost of sales |
|||||||||||||||||||||||||||||||
| Third parties |
— | — | 132,056 | 171,492 | — | — | 132,056 | 171,492 | |||||||||||||||||||||||
| Related parties—purchases from ED&F Man |
— | — | 74,682 | 75,604 | — | — | 74,682 | 75,604 | |||||||||||||||||||||||
| Total cost of sales |
— | — | 206,738 | 247,096 | — | — | 206,738 | 247,096 | |||||||||||||||||||||||
| Other operating costs and expenses |
31,038 | 29,913 | 21,081 | 23,144 | 269 | 0 | 52,388 | 53,057 | |||||||||||||||||||||||
| Depreciation |
12,189 | 10,253 | 3,962 | 3,881 | 56 | 56 | 16,207 | 14,190 | |||||||||||||||||||||||
| Selling, general and administrative expenses |
7,299 | 8,335 | 10,989 | 11,257 | 11,710 | 11,710 | 29,998 | 31,302 | |||||||||||||||||||||||
| Total operating expenses |
50,526 | 48,501 | 242,770 | 285,378 | 12,035 | 11,766 | 305,331 | 345,645 | |||||||||||||||||||||||
| Operating income (loss) |
23,364 | 23,828 | 12,771 | 13,642 | (12,035 | ) | (11,766 | ) | 24,100 | 25,704 | |||||||||||||||||||||
| Other income (expense) |
|||||||||||||||||||||||||||||||
| Interest expense, net |
— | — | — | — | (2,688 | ) | (2,383 | ) | (2,688 | ) | (2,383 | ) | |||||||||||||||||||
| Gain/(Loss) on disposal of property, plant and equipment |
(79 | ) | (2 | ) | 12 | (100 | ) | — | — | (67 | ) | (102 | ) | ||||||||||||||||||
| Total other income (expense) |
(79 | ) | (2 | ) | 12 | (100 | ) | (2,688 | ) | (2,383 | ) | (2,755 | ) | (2,485 | ) | ||||||||||||||||
| Income (loss) before income tax provision and equity in loss of unconsolidated subsidiary |
23,285 | 23,826 | 12,783 | 13,542 | (14,723 | ) | (14,149 | ) | 21,345 | 23,219 | |||||||||||||||||||||
| Income tax provision |
— | — | — | — | (7,137 | ) | (7,390 | ) | (7,137 | ) | (7,390 | ) | |||||||||||||||||||
| Equity in loss of unconsolidated subsidiary |
— | — | — | — | (118 | ) | (156 | ) | (118 | ) | (156 | ) | |||||||||||||||||||
| Income (loss) from continuing operations |
23,285 | 23,826 | 12,783 | 13,542 | (21,978 | ) | (21,695 | ) | 14,090 | 15,673 | |||||||||||||||||||||
| Net income from San Pedro discountinued operations, net of tax |
— | — | — | — | — | 1,063 | — | 1,063 | |||||||||||||||||||||||
| Net income (loss) |
23,285 | 23,826 | 12,783 | 13,542 | (21,978 | ) | (20,632 | ) | 14,090 | 16,736 | |||||||||||||||||||||
| Net loss attributable to non-controlling interest |
— | — | — | — | 73 | 80 | 73 | 80 | |||||||||||||||||||||||
| Income (loss) attributable to Westway Group, Inc. |
23,285 | 23,826 | 12,783 | 13,542 | (21,905 | ) | (20,552 | ) | 14,163 | 16,816 | |||||||||||||||||||||
| Preferred dividends |
— | — | — | — | (4,250 | ) | (4,250 | ) | (4,250 | ) | (4,250 | ) | |||||||||||||||||||
| Net income (loss) applicable to common stockholders |
$ | 23,285 | $ | 23,826 | $ | 12,783 | $ | 13,542 | $ | (26,155 | ) | $ | (24,802 | ) | $ | 9,913 | $ | 12,566 | |||||||||||||
58
Table of Contents
Pro Forma Results for the Year Ended December 31, 2009 Compared to the Year Ended December 31, 2008
Bulk Liquid Storage
Pro Forma Net Revenue
Total net revenue, including transactions between us and the ED&F Man group, increased $1.6 million, or 2%, to $73.9 million for the year ended December 31, 2009 when compared to $72.3 million for the year ended December 31, 2008.
In the United States, an increase in net revenue of $4.4 million, or 11%, to $46.2 million for the year ended December 31, 2009 from $41.8 million for the year ended December 31, 2008 reflected our expansion in this business during 2009. Our Houston, TX facilities added 14.9 million gallons of capacity in 2009. Our Grays Harbor, Washington facility opened in November 2009 with a capacity of 13.5 million gallons. In October 2009, we acquired the storage assets and property of Southside River-Rail Terminal in Cincinnati, which added an additional 37 million gallons of capacity.
Outside of the United States, revenue decreased by $2.9 million, or 9%, to $27.7 million for the year ended December 31, 2009 from $30.5 million for the year ended December 31, 2008. Reductions in revenue outside of the United States reflected lower ED&F Man group molasses and third party volume as customers were maintaining lower storage volumes due to economic conditions. This was partially offset by increased third party revenue in our Amsterdam terminal as a result of 10 new storage tanks added between June 2008 and February 2009, adding 5.2 million gallons of additional capacity. Lower foreign exchange rates for the Euro, British Pound, and Canadian Dollar also negatively impacted the Company, resulting in a combined negative impact on earnings from these three currencies of approximately 9%. Geographically, the largest foreign reduction in net revenue for the period was reflected in the UK, Canada, and the Netherlands.
Pro Forma Other Operating Expenses
Other operating costs and expenses of $31.0 million increased by $1.1 million, or 4%, for the year ended December 31, 2009 from $29.9 million for the year ended December 31, 2008, driven by increased facility security costs and repairs and maintenance in the United States, as well as the release of certain provisions in 2008 relating to a previously sold facility. Other operating expenses also increased due to additional operating costs resulting from the operations of the Southside River-Rail Terminal acquired in October 2009.
Pro Forma Depreciation
Depreciation costs increased by $1.9 million, or 19%, to $12.2 million for the year ended December 31, 2009 from $10.3 million for the year ended December 31, 2008. This was mainly due to our recent capital investments in the United States.
Pro Forma Selling, General, and Administrative Expenses
For the year ended December 31, 2009, selling, general and administrative expenses for the bulk liquid storage business decreased by $1.0 million, or 12%, to $7.3 million compared to $8.3 million for the year ended December 31, 2008. This was mainly due to reduced payroll related costs globally and the closure of the UK head office after the business combination in May 2009.
Pro Forma Operating Income
Operating income decreased slightly by $464,000, or 2%, to $23.4 million for the year ended December 31, 2009 from $23.8 million for the year ended December 31, 2008, reflecting the impact of lower ED&F Man group molasses volume and lower exchange rates in our European operations, as well as increased operating costs and
59
Table of Contents
depreciation costs from our capital investments. This was partially offset by increased capacity from our Houston, Grays Harbor and Amsterdam expansions, additional capacity from our Southside River-Rail Terminal acquisition, and reduced selling, general, and administrative expenses. Net operating margins decreased slightly to 32% for the year ended December 31, 2009 from 33% for the year ended December 31, 2008.
Liquid Feed Supplements
Pro Forma Net Revenue
For the year ended December 31, 2009, net revenue for the liquid feed supplements business was $255.5 million, which was a decrease of $43.5 million, or 15%, compared to net revenue of $299.0 million for the year ended December 31, 2008. This decrease in net revenue was driven by a decrease in volume for the year ended December 31, 2009 of 13% to 1,584,847 tons, compared to 1,824,982 tons for the year ended December 31, 2008, reflective of lower demand due to customers shifting to lower cost feed alternatives from molasses-based feed blends. This shift in part was due to adverse weather effects on customer demand and poor economic conditions in the cattle and dairy industries. Economic recession, high unemployment, and large supplies of competing pork and poultry meat adversely affected cattle prices and the demand for beef throughout 2009, and as a result, cattlemen searched for lower input costs. A reduction in range cattle herds in the drought stricken Central/Southern Texas area also had a significant impact on lower feed volumes. In the dairy sector, milk prices in 2009 remained depressed and reductions in feed costs were not sufficient to overcome decreases in milk prices, forcing dairymen to use lower priced molasses alternatives to our products. A nationwide program to reduce dairy herds in an effort to help support milk prices also affected feed demand. Price per ton decreased by $2.61 in the twelve months ended December 31, 2009 from the year ended December 31, 2008.
Pro Forma Cost of Sales
For the year ended December 31, 2009, cost of sales for liquid feed supplements, including related party purchases from the ED&F Man group, was $206.7 million, which was a decrease of $40.4 million, or 16%, compared to cost of sales of $247.1 million for the year ended December 31, 2008. The decrease was directly related to decreasing volumes and lower costs in key non-molasses raw material inputs, as well as lower volume and lower molasses prices in the last quarter of 2009 compared to 2008. Successful ingredient negotiations with key suppliers reduced input costs on non molasses purchases, while the cost of purchases of molasses from the ED&F Man group decreased by 1% for the year ended December 31, 2009 compared to 2008. Overall, cost per ton decreased by $4.95 for the year ended December 31, 2009 from the year ended December 31, 2008.
Pro Forma Gross Profit (Net Revenues less Cost of Sales)
Despite the decrease of $3.1 million, or 6%, in gross profit (net revenues less cost of sales) for the year ended December 31, 2009 from the year ended December 31, 2008, gross profit per ton increased by $2.34 due to effective implementation of marketing initiatives shifting from commodity based products to value added products, and improvement in our industrial sales initiatives. In addition, gross profit per ton was aided by raw material cost reductions in feed ingredient prices and successful contract negotiation with key suppliers. Decreases in molasses prices for the quarter ending December 31, 2009 compared to December 31, 2008 also had a positive impact on gross profits.
Pro Forma Other Operating Expenses
Other operating costs and expenses decreased by $2.1 million, or 9%, to $21.1 million for the year ended December 31, 2009 from $23.1 million for the year ended December 31, 2008, consistent with underlying cost control and reduced energy costs primarily due to our energy conservation initiatives and lower natural gas and electrical rates. Other factors include lower variable operating costs as a result of decreased sales volumes and continued implementation of automation at four of our largest sites.
60
Table of Contents
Pro Forma Depreciation
Depreciation costs of $4.0 million for the year ended December 31, 2009 increased by $81,000 compared to $3.9 million for the year ended December 31, 2008 due to our recent capital investments in the United States and Canada.
Pro Forma Selling, General, and Administrative Expenses
For year ended December 31, 2009, selling, general and administrative expenses for the liquid feed supplements business decreased by $268,000, or 2%, to $11.0 million compared to $11.3 million for the year ended December 31, 2008, reflecting modest cost reduction measures and reduced payroll related costs.
Pro Forma Operating Income
Operating income decreased by $871,000 to $12.8 million for the year ended December 31, 2009 from $13.6 million for the year ended December 31, 2008. Poor economic conditions in the dairy and cattle industries impacted sales volumes, but also resulted in reductions in the cost of goods, along with variable input and operational expense reductions. Our programs and initiatives to improve operational efficiencies and reduce selling, general, and administrative expenses in 2009 also partially offset the effect of the decrease in sales volume. Operating margin remained consistent at 5% for the years ended December 31, 2009 and 2008.
Corporate
Pro Forma Selling, General and Administrative Expenses
Corporate selling, general and administrative expenses for the year ended December 31, 2008 and the period from January 1, 2009 through May 28, 2009 were assumed to be comparable in amount to those incurred in operating as a public company during the period from May 29, 2009 to December 31, 2009, such that these expenses were assumed to be $11.7 million for each of 2009 and 2008.
Pro Forma Interest Expense, Net
Interest expense, net of interest income, was $2.7 million for the year ended December 31, 2009, an increase of $305,000, or 13%, from $2.4 million for the year ended December 31, 2008, which was driven by higher interest rates and higher borrowings in 2009, along with additional facility fees and debt amortization costs associated with the new syndicated credit facility beginning in November 2009. This was partially offset by increased capitalized interest as a result of more ongoing capital projects during 2009.
Pro Forma Income Tax Provision
Income tax provision of $7.1 million for the year ended December 31, 2009 decreased by $253,000 from $7.4 million for the year ended December 31, 2008. The change was primarily due to the impact of lower operating results from the bulk liquid storage and liquid feed supplements segments and by increased interest expense.
Pro Forma Income from San Pedro Discontinued Operations
For the year ended December 31, 2008, $1.1 million of income related to the operations of our San Pedro, CA facility that was discontinued in September 2008.
Pro Forma Preferred Dividends
Preferred dividends for the years ended December 31, 2009 and 2008 of $4.3 million reflect for each year an assumed full year of dividends payable on 30,886,830 shares of Series A Convertible Preferred Stock, including escrowed shares, at $0.0344 per share, although such shares were not issued and did not begin to accrue dividends until May 28, 2009.
61
Table of Contents
Pro Forma Net Income (Loss) Applicable to Common Stockholders
Overall, net income applicable to common stockholders decreased by $2.7 million, or 21%, to $9.9 million for the year ended December 31, 2009, compared to $12.6 million for the year ended December 31, 2008, primarily resulting from poor economic conditions in the U.S. dairy and cattle industries impacting on liquid feed supplement operating income, and lower ED&F Man volume and lower foreign exchange rates for our European bulk liquid storage operations. The discontinuance of our San Pedro facility in the U.S. in 2008 and increased interest expense in 2009 due to higher borrowing levels and interest rates also contributed to the decrease.
In evaluating our financial performance, management has identified for this discussion and analysis the following key performance indicators, measured on a pro forma basis consistent with the presentation in the section above entitled “Results of Operations—Pro Forma with Acquired Business”:
| Year Ended December 31, |
||||||
| 2009 (Pro Forma) |
2008(1) (Pro Forma) |
|||||
| Bulk liquid storage Net Operating Income Margin %(2) |
31.6 | % | 32.9 | % | ||
| Bulk liquid storage Percentage Capacity Utilization |
95 | % | 95 | % | ||
| Liquid feed supplements Gross Profit Margin %(3) |
19.1 | % | 17.4 | % | ||
| Liquid feed supplements Volume (tons) |
1,584,847 | 1,824,982 | ||||
| (1) | Excludes income from San Pedro discontinued operations |
| (2) | Net Operating income margin % is derived from operating income divided by total net revenue |
| (3) | Gross profit margin % is derived from total net revenues less cost of sales, divided by total net revenue |
We believe that operating income margin is a key performance indicator to the profitability of our bulk liquid storage business. We look at revenues and expenses per barrel of capacity at each storage facility to analyze operating income margin against budgets.
We believe that capacity utilization is also key to the profitability of our bulk liquid storage business. Once the high fixed cost of constructing a terminal has been incurred, the marginal cost of providing each additional increment of storage services is much less than the marginal revenues received from such services. Once current capacity is utilized, additional tanks may be built on existing sites to further leverage the property we already possess. Additionally, we may grow profitability by identifying additional strategic locations, either to acquire existing bulk liquid terminals or to develop new bulk liquid terminals.
We believe that gross profit margin is a key performance indicator to the profitability of our liquid feed supplements business. This highly visible indicator provides us with measurable guidelines to monitor our cost of goods, which in the liquid feed supplements business can be volatile. Net sales are considered a poor indicator of performance as large fluctuations can occur from period to period due to volatility in the underlying commodity ingredient prices.
We believe that volume is also a key performance indicator to the profitability of our liquid feed supplements business. Once the fixed costs of an operating facility are met, all revenue which exceed the variable costs contributes to the profitability of our business.
62
Table of Contents
This section includes the results of the acquired business since May 29, 2009 only, and does not include the results of the acquired business before then. Prior to the acquisition of the acquired business on May 28, 2009, the Company had no operations and generated no operating revenue, as it was considered a “special purpose acquisition company.”
Accordingly, our operating results for 2009 include the results of the acquired business operations for only 217 days beginning May 29, 2009 and ending December 31, 2009. Prior to May 29, 2009, our efforts were limited to organizational activities, activities relating to the IPO, activities relating to identifying and evaluating prospective acquisition candidates, activities relating to negotiating and consummating the acquisition, and activities relating to general corporate matters; we neither engaged in any operations nor generated any revenue, other than interest income earned on the proceeds of the initial public offering. The results for 2008 and 2007 represent Shermen results only.
WESTWAY GROUP, INC.
CONSOLIDATED STATEMENTS OF OPERATIONS
(in thousands)
| Twelve Months Ended December 31, |
||||||||||||
| 2009 | 2008 | 2007 | ||||||||||
| Net revenue |
||||||||||||
| Bulk liquid storage |
$ | 36,590 | $ | — | $ | — | ||||||
| Liquid feed supplements |
143,378 | — | — | |||||||||
| Related parties—ED&F Man |
8,819 | — | — | |||||||||
| Total net revenue |
188,787 | — | — | |||||||||
| Cost of sales—liquid feed supplements |
115,416 | — | — | |||||||||
| Other operating costs and expenses |
29,876 | 869 | 871 | |||||||||
| Depreciation |
11,060 | — | — | |||||||||
| Selling, general and administrative expenses |
18,510 | — | — | |||||||||
| Business combination expenses |
13,891 | — | — | |||||||||
| Total operating expenses |
188,753 | 869 | 871 | |||||||||
| Operating income (loss) |
34 | (869 | ) | (871 | ) | |||||||
| Other income (expense) |
||||||||||||
| Interest income |
181 | 2,396 | 2,988 | |||||||||
| Interest expense |
(1,499 | ) | — | — | ||||||||
| Loss on disposal of property, plant & equipment |
(59 | ) | — | — | ||||||||
| Total other income (expense) |
(1,377 | ) | 2,396 | 2,988 | ||||||||
| Income (loss) before income tax provision and equity in earnings of unconsolidated subsidiary |
(1,343 | ) | 1,527 | 2,117 | ||||||||
| Income tax provision |
(2,518 | ) | (786 | ) | (951 | ) | ||||||
| Equity in earnings of unconsolidated subsidiary |
134 | — | — | |||||||||
| Net income (loss) |
(3,727 | ) | 741 | 1,166 | ||||||||
| Net loss attributable to non-controlling interest |
67 | — | — | |||||||||
| Net income (loss) attributable to Westway Group, Inc. |
$ | (3,660 | ) | $ | 741 | $ | 1,166 | |||||
| Preferred dividends |
(2,515 | ) | — | — | ||||||||
| Net income (loss) applicable to common stockholders |
$ | (6,175 | ) | $ | 741 | $ | 1,166 | |||||
63
Table of Contents
Results for 2009 Compared to 2008
As noted above, our operating results for the year ended December 31, 2009 include the results of the acquired business operations for only the 217 days beginning May 29, 2009 and ending December 31, 2009. We had no business operations in 2008.
Net Revenue
Net revenue of $188.8 million consisted of revenue for 217 days from our bulk liquid storage and liquid feed supplement operations for the year ending December 31, 2009.
The bulk liquid storage segment, representing 24% of total net revenue, generated revenue of $45.1 million from three primary sources: fixed income, volume related income, and income from ancillary services. Geographically, 63% of bulk liquid storage segment total net revenue was realized in the United States, with the remaining 37% realized outside of the United States. $8.5 million of bulk liquid storage segment total net revenue, or 19%, came from transactions with the ED&F Man group.
The liquid feed supplement segment, representing the remaining 76% of total net revenue, generated $143.4 million of revenue from liquid feed supplement product sales, with a small proportion of revenue arising from solid or more traditional animal feeds. Geographically, 97% of liquid feed supplement segment total net revenue was realized in the United States, with the remaining 3% realized outside of the United States. The volume of animal feed sold during the 217 days of totaled 906,172 tons for the year ending December 31, 2009.
Costs of Sales
Costs of sales totaling $115.4 million for the year ended December 31, 2009 related to the cost of molasses and other ingredients for 217 days in our liquid feed supplement operations, as well as promotional expenses. Purchases of molasses from ED&F Man totaled $44.0 million, or 38%, of total costs of sales.
Other operating Costs and Expenses
Other operating costs and expenses of $29.9 million included costs for 217 days of operating our bulk liquid storage and liquid feed supplement facilities for year ending December 31, 2009. Major components of these costs included payroll, repairs, utilities, and insurance. Of the total operating costs and expenses, the bulk liquid storage segment represented 61%, and the liquid feed supplement segment represented 36%. For year ended December 31, 2009 and 2008, formation and operating expenses of $476,000 and $869,000 respectively reflected Shermen’s costs to identify a business acquisition. These corporate related expenses made up the remaining 3% of total other operating costs in the year ended December 31, 2009.
Depreciation
Depreciation expense of $11.1 million for the year ended December 31, 2009 consisted of depreciation of fixed assets utilized in our bulk liquid storage and liquid feed supplement operations for 217 days. Of the total depreciation, the bulk liquid storage segment represented 73%, and the liquid feed supplement segment represented the remaining 27%.
Selling, General, and Administrative Expenses
Selling, general, and administrative expenses of $18.5 million included costs associated with payroll, office, and other administrative expenses of our bulk liquid storage and liquid feed supplement operations for 217 days ended December 31, 2009. Also included were corporate general and administrative costs. Of the total selling, general, and administrative expenses, the bulk liquid storage segment represented 19%, the liquid feed supplement segment represented 30%, and the corporate segment represented the remaining 51%.
64
Table of Contents
Business Combination Expenses
Business combination expenses related to acquisition-related costs incurred to effect the May 28, 2009 business combination. These costs included advisory, investment banking, legal, accounting, and other professional or consulting fees. For the year end ended December 31, 2009, these costs totaled $13.9 million. There were no such costs incurred for the year ended December 31, 2008.
Operating Income
Operating income of $34,000 for the year ended December 31, 2009 resulted from operating income of $15.1 million from the 217 days of operation of the bulk liquid storage segment and $8.9 million from the liquid feed supplements segment, which was largely offset by corporate costs of $24.0 million, including $13.9 million of business combination expenses. Geographically, 70% of combined bulk liquid storage and liquid feed supplement operating income was realized in the United States, while the remaining 30% was realized outside of the United States.
Interest Income
Interest income for the year ended December 31, 2009 and 2008 of $138,000 and $2.4 million respectively came from the trust account held by Shermen as a consequence of funds raised through our initial public offering of approximately $136.9 million. The remaining $43,000 of interest income for the year ended December 31, 2009 was the result of interest on excess cash.
Interest Expense
Interest expense for the year ended December 31, 2009 of $1.5 million reflected 167 days of interest on our credit facility and borrowing line with ED&F Man Treasury which was replaced with a new $175 million credit agreement with a syndicate of banks for the remaining 50 days of the year. Both facilities had interest rate terms of one-month London Interbank Offered Rate, or LIBOR, plus 3.5% per year. Interest expense was reduced by $882,000 for the year ended December 31, 2009 as a result of capitalized interest.
Income Taxes
Income tax provision for the year ended December 31, 2009 was $2.5 million, compared to $786,000 for the year ended December 31, 2008. The most significant items affecting our effective tax rate were business combination costs incurred in 2009, that for tax purposes, were capital in nature and therefore non-deductible.
Preferred Dividends
Preferred dividends for the year ended December 31, 2009 of $2.5 million reflected 217 days of dividends payable on $30,886,830 shares of Series A Convertible Preferred Stock, including escrowed shares, at $0.0344 per share. There was no preferred stock issued in 2008.
Results for 2008 Compared to 2007
As noted above, our results for the years ended December 31, 2008 and 2007 were limited to organizational activities, activities relating to the IPO, activities relating to identifying and evaluating prospective acquisition candidates, activities relating to negotiating and consummating the acquisition, and activities relating to general corporate matters. We neither engaged in any operations nor generated any revenue, other than interest income earned on the proceeds of the initial public offering and our private placement of the founder warrants.
For the fiscal year ended December 31, 2008, net income totaled $741,077, which consisted of $2,396,262 of interest income from the trust account offset by $869,030 of formation and operating expenses and $786,155 of provision for income taxes.
65
Table of Contents
For the fiscal year ended December 31, 2007, net income totaled $1,166,226, which consisted of $2,988,057 of interest income from the trust account offset by $870,520 of formation and operating expenses and $951,311 of provision for income taxes.
Interest income from the trust account excludes earnings on funds held in the trust account associated with our common stock that was subject to possible conversion.
As of December 31, 2008, we had no unrestricted cash available to us for our activities in connection with identifying and conducting due diligence of a suitable business combination, and for general corporate matters. The following table shows the total funds held in the trust account through December 31, 2008:
| Gross proceeds from our initial public offering of common stock and financing transaction |
$ | 138,000,000 | ||
| Gross proceeds from private placement warrant holders |
3,650,000 | |||
| Underwriters’ fee |
(4,140,000 | ) | ||
| Blue Sky fees |
(25,000 | ) | ||
| Custodial fees |
(17,100 | ) | ||
| Funds not placed in trust |
(607,900 | ) | ||
| Cash placed in trust on May 31, 2007 |
136,860,000 | |||
| Total investment income earned on assets held in trust, May 31, 2007 through December 31, 2008 |
5,384,319 | |||
| Subtotal |
142,244,319 | |||
| Withdrawals from the trust during the period May 31, 2007 through December 31, 2008: | ||||
| Payments for income taxes |
(2,163,466 | ) | ||
| Transfers to the Company’s operating account for payment of additional offering costs, general and administrative expenses and for working capital purposes (latter being limited to a maximum of $1,500,000) |
(1,444,239 | ) | ||
| Unspent monies in checking |
(190,455 | ) | ||
| Custodial transfer fees |
(350 | ) | ||
| Total transfers from custodial accounting to checking |
(3,798,510 | ) | ||
| Total assets held in trust account as of December 31, 2008 |
$ | 138,445,809 | ||
Liquidity and Capital Resources
General
Cash and Working Capital
During 2009, our cash and cash equivalents increased by $9.5 million to a total of $9.7 million at December 31, 2009. This increase was the result of cash provided by operating activities for approximately 7 months of $13.8 million, cash used in investing activities of $11.5 million, and cash provided by financing activities of $6.9 million.
Our working capital (by which we mean total current assets less total current liabilities) decreased from $138.2 million at December 31, 2008, when we were still a special purpose acquisition company, to $24.2 million at December 31, 2009, primarily as a result of the release of $138.4 million in cash held in our trust account to fund the business combination on May 28, 2009. The effect of the release of trust funds was partially offset by the working capital balance of the acquired business at the time of the business combination, which was $18.7 million, as well as by an increase in our working capital since the business combination in the amount of $5.5 million.
66
Table of Contents
Sources
After the business combination on May 28, 2009, our capital requirements have been financed primarily with cash flows from operations and with borrowings under our credit facilities from time to time. At December 31, 2009, we had $83.4 million of borrowing capacity available under our $175 million bank revolving credit facility.
Our internal sources of liquidity include our cash balances, our cash equivalents (which are readily convertible to cash), and our current cash flows from operations. Our external sources of liquidity include our bank revolving credit facility. Our available sources of liquidity include the balance still available to be drawn down under the credit facility. Moreover, the credit facility can be increased by another $25 million pursuant to its “accordion” feature.
Uses
After the business combination on May 28, 2009, we used cash to fund ongoing operations, including paying for purchases of raw materials, leases of land and equipment, payroll, to fund capital expenditures for maintenance, expansions, and acquisitions, and to pay debt service and taxes.
Trends
We consider it to be too soon after the business combination on May 28, 2009 to definitively identify any known material trends in our liquidity and capital resources. We do note, however, that the cash flows from operations of the bulk liquid storage and liquid feed supplements businesses, both while owned by the ED&F Man group and after we acquired them on May 28, 2009, have been significantly positive each fiscal year for the last 3 years. We expect them to be positive again in 2010. We also note that, while the capital expenditures of the two businesses for expansion and acquisitions have generally been increasing and are likely to continue, we have no plans to engage in another acquisition comparable in significance to the business combination consummated on May 28, 2009. Thus, we do not expect to incur acquisition expenditures or business combination expenses in 2010 comparable in amount to those experienced in 2009.
Our businesses have not been severely affected by the global recession, although it appears to have reduced some of our customers’ demand for our products and services. Recent order activity has been relatively stable.
Historical Cash Flows
Our cash flows from operating, investing, and financing activities, as reflected in our Consolidated Statements of Cash Flow, are summarized in the following table:
| Predecessor | ||||||||||||||||||||||||
| Fiscal Year ended December 31, 2009(1) |
Fiscal Year ended December 31, 2008 |
Fiscal Year ended December 31, 2007 |
November 1, 2008 through May 28, 2009 |
Fiscal Year ended October 31, 2008 |
Fiscal Year ended December 31, 2007 |
|||||||||||||||||||
| Cash provided by (used in) operating activities |
$ | 13,836 | $ | (115 | ) | $ | 1,765 | $ | 30,487 | $ | 28,592 | $ | 30,339 | |||||||||||
| Cash provided by (used in) investing activities |
(11,535 | ) | 144 | (138,590 | ) | (31,342 | ) | (22,821 | ) | (22,103 | ) | |||||||||||||
| Cash provided by (used in) financing activities |
6,942 | — | 136,965 | 855 | (5,771 | ) | (8,236 | ) | ||||||||||||||||
| (1) | —Year ended December 31, 2009 includes only 217 days of acquired business operations. |
67
Table of Contents
Operating Activities
Consolidated cash provided by operating activities mainly comprises the cash from operations of our bulk liquid storage and liquid feed supplements businesses, partially offset by expenses paid at the corporate level, such as professional fees and interest on amounts drawn on our credit facility.
Our cash flow generated by operating activities during 2009 was $13.8 million, an increase of $14.0 million compared to 2008. We began operations only after the business combination on May 28, 2009, and so we engaged in operations for only approximately the last 7 months of the year. Moreover, our cash flow from operations in 2009 was significantly reduced by $13.9 million in one-time business combination expenses (mostly professional fees) related to the business combination on May 28, 2009.
Cash provided by operating activities was generated primarily from bulk liquid storage rentals, volume fees, and ancillary service fees and sales of liquid feed supplements. Cash was used in operating activities mainly for costs of raw materials such as molasses, maintenance expenses, payroll costs, utilities, professional services, interest, and taxes.
Investing Activities
Net cash used in investing activities was $11.5 million during 2009, primarily resulting from $104.1 million we paid to the ED&F Man group as part of the consideration for the acquired business, $19.9 million we paid for the acquisition of the Southside River terminal facility assets in Cincinnati, Ohio, and $26.0 million for other additional capital expenditures. This was partially offset by the release of $138.4 million in cash held in our trust account at the closing of the business combination on May 28, 2009.
The cash used in our investing activities has primarily been spent on acquisitions of businesses and on expansion of our existing facilities.
Capital Expenditures
During 2009, capital expenditures for our bulk liquid storage and liquid feed supplements businesses were $22.6 million and $3.0 million, respectively, with our corporate office capital expenditures totaling $400,000.
After the May 28, 2009 business combination, consistent with our strategy of investment in deep water locations and expansion of existing sites in our bulk liquid storage business, we spent $19.9 million to acquire the Southside River terminal facility in Cincinnati, Ohio, and $3 million to acquire a terminal facility in Stockton, California. We also invested $3.3 million on expansion of our Houston No. 1 terminal facility in Texas and $7.8 million on expansion of our Gray’s Harbor terminal facility in Washington state. In addition, we spent $3.1 million on maintenance capital expenditures on equipment in our bulk liquid storage business.
After the May 28, 2009 business combination, in our liquid feed supplements business, we spent $3.0 million on maintenance capital expenditures on equipment in our liquid feed supplements business.
Financing Activities
In 2009, our financing activities provided net cash of $5.9 million. This primarily resulted from proceeds from our credit facilities of $180.6 million, including $45.6 million at the time of our business combination on May 28, 2009 to help fund the acquisition (particularly of working capital) and $20.0 million in October 2009 to finance the acquisition of the Southside River terminal facility. Partially offsetting these cash inflows were payments on our credit facilities of $91.8 million, as well as several actions we took in connection with the business combination: our redemption of 9,189,000 shares of our common stock on May 28, 2009 for $55.1 million, our repurchase of 2,514,369 shares of our Class A common stock in May and June 2009 for
68
Table of Contents
$15.1 million, and our payment of a special cash dividend (waived by certain stockholders) of $1.00 per share of Class A common stock in June 2009 in the amount of $11.4 million.
Significant non-cash activities included our issuance on May 28, 2009 of 30,886,830 newly-issued shares of Series A Convertible Preferred Stock, with a fair value of $177.3 million, and 12,624,003 newly issued shares of Class B common stock, with a fair value of $63.1 million, to Holdings, an ED&F Man subsidiary, as part of the consideration for the acquired business.
ED&F Man Credit Facility
To facilitate the consummation of the business combination on May 28, 2009, ED&F Man Treasury, an ED&F Man affiliate, provided us with a two-year, $100 million revolving credit facility that would have matured on May 27, 2011, and a $5 million working capital borrowing line that was scheduled to mature on January 8, 2010. We initially drew down $45.6 million under this facility in May 2009. In October 2009, we drew down an additional $20 million under this facility to finance our purchase of the Southside River terminal facility. Interest accrued on amounts borrowed under the facility at LIBOR plus 3.5%, and a commitment fee was payable in the event that the facility was not refinanced by November 28, 2009. This facility was replaced by a very similar facility among the same parties in August, 2009. This revolving credit facility was paid-off in full and terminated in November 2009 when we entered into a new credit agreement with a syndicate of banks led by JP Morgan Chase.
Bank Syndicate Credit Facility
In November 2009, we entered into a new three-year, $175 million revolving credit facility with a syndicate of banks led by JP Morgan Chase scheduled to terminate on November 12, 2012. During the term, we have the option, subject to certain conditions including the willingness of a lender to commit additional funds, to increase the credit facility by up to $25 million (the “accordion” feature). Up to $10 million of the credit facility is available for the issuance of letters of credit. We may also make short-term borrowings of up to $10 million under a “swingline” facility. We initially drew down $90.6 million under the credit facility in November 2009, primarily to pay off our prior credit facility with ED&F Man Treasury. As of December 31, 2009, the total balance outstanding on the bank credit facility was $91.6 million.
The interest rate for each loan is, at our option, either (a) LIBOR, adjusted by the statutory reserve rate, plus 3.5% per year, or (b) 2.625% per year plus the highest of (i) JP Morgan Chase’s public prime rate, (ii) the federal funds effective rate plus 0.5%, and (iii) the one-month LIBOR adjusted by the statutory reserve rate plus 1.0%. We must pay a commitment fee of 0.625% per year on the average daily unused amount of the credit facility. The revolving credit facility is secured by (a) guarantees by all of our domestic wholly-owned subsidiaries (one of which owns all our foreign subsidiaries); (b) first priority liens on substantially all our domestic personal property; (c) pledge of 100% of the equity of all our domestic wholly-owned subsidiaries and 65% of the equity of our foreign wholly-owned subsidiary that owns all our other foreign subsidiaries; and (d) first mortgage liens on our fee or leasehold interests in facilities having a fair market value of approximately $120 million.
The credit facility includes various customary covenants and other provisions, including a negative pledge on substantially all our non-mortgaged assets restricting their encumbrance, and restrictions on our ability to make capital expenditures, dispose of assets, incur indebtedness, encumber assets, pay dividends, redeem securities, make investments, change the nature of our business, acquire or dispose of a subsidiary, enter into transactions with affiliates, enter into hedging agreements, or merge, consolidate, liquidate, or dissolve. We also must maintain certain financial covenants, including (a) a specially-defined maximum consolidated total leverage ratio, measured quarterly, of no more than 3.5 to 1 in 2010, 3.25 to 1 in 2011, and 3.0 to 1 thereafter; and (b) a specially-defined minimum consolidated interest coverage ratio, measured quarterly, of not less than 3.0 to 1. Our actual ratios with respect to these two financial covenant tests as of December 31, 2009 were 2.3 to 1 and 15.0 to 1, respectively.
69
Table of Contents
Events of default include, among other things, covenant violations, events having a material adverse effect, and change of control (specially defined). Based on our December 31, 2009 financial position and the current market conditions for our products and services, we anticipate that we will be able to comply with our covenants through 2010. For further details regarding our credit facility, see our Form 8-K filed with the SEC on August 17, 2009.
Future Cash Flows
This section consists almost entirely of forward-looking statements. Important factors that could cause our actual results to differ materially from the statements in this section include changes in the expected profitability of one or both of our businesses, changes in the amount or timing of our expected investments, or changes in the amount or timing of our expected draws under our credit facilities.
Contractual Obligations
As part of the normal course of our business, we incur certain contractual obligations that require us to make payments of cash in the future. The following table sets forth information concerning our known and reasonably estimable contractual obligations as of December 31, 2009 (in thousands):
| Total | Less than 1 year (2010) |
1—3 years (2011— 2012) |
3—5 years (2013— 2014) |
More than 5 years (2015 on) | |||||||||||
| Long-Term Debt(1) |
$ | 91,633 | $ | — | $ | 91,633 | $ | — | $ | — | |||||
| Interest on Long-Term Debt(2) |
11,338 | 3,944 | 7,394 | — | — | ||||||||||
| Operating Leases(3) |
40,533 | 3,998 | 7,404 | 6,455 | 22,676 | ||||||||||
| Purchase Obligation(4) |
610,380 | 64,250 | 128,500 | 128,500 | 289,130 | ||||||||||
| Capital Commitments(5) |
2,167 | 2,167 | |||||||||||||
| Total |
$ | 756,051 | $ | 74,359 | $ | 234,931 | $ | 134,955 | $ | 311,806 | |||||
(1) Long-Term Debt
Our long-term debt as of December 31, 2009 consists of $91.6 million outstanding under our $175 million bank syndicate credit facility. The facility matures on November 12, 2012.
(2) Interest on Long-Term Debt
Interest payments for our credit facility were calculated using the balance as of December 31, 2009 and the applicable average interest rate at year end of approximately 3.735% and a 0.625% fee on unused commitments with an expiration date of November 2012.
(3) Operating Leases
We have long-term operating leases at various bulk liquid storage facilities and liquid feed supplements manufacturing and distribution facilities. Many of our facilities are situated on land that is leased from port authorities. Typically our leases extend beyond five years.
For purposes of this table, lease terms have been calculated from the date we took possession of the facility, including any periods of free or reduced rent, and have been calculated through any lease extensions available to us that are reasonably assured of being exercised. The figures represent the minimum annual rentals required to be paid under operating leases.
70
Table of Contents
(4) Purchase Obligations
We and the ED&F Man group have a long-term molasses supply agreement, pursuant to which the ED&F Man group is expected to continue to be our primary supplier of cane molasses. The agreement has a pricing mechanism that approximates the market price of imported molasses. The initial term of the agreement is for a period of 10 years, beginning May 28, 2009, after which the agreement provides for automatic renewals for successive one-year periods unless either party gives notice of non-renewal. The estimated purchase obligation has been calculated using the current price and monthly volume commitments. The payments under the agreement are subject to market risk.
(5) Capital Commitments
In the normal course of business, we make investments in the properties and facilities utilized by our bulk liquid storage and liquid feed supplements businesses. As a result, at any given time, we have outstanding contracts with third parties reflecting long-term commitments for capital expenditures not yet incurred. At December 31, 2009, the aggregate amount of these commitments totaled $2.2 million.
Other than those set forth in the table, we have no other known and reasonably estimated long-term contractual liabilities. Because they are contingent and not sufficiently estimable in amount and timing, the table does not include most contingent liabilities, such as liabilities for deferred income taxes (which are also not contractual), incentive compensation, employee benefits, derivative instruments (such as warrants), potential but uncommitted capital expenditures, potential share repurchases, and environmental or other litigation claims (which may or may not be based on contract). The table also does not include the numerous contractual obligations that may be expected in the future but have not yet been entered into, such as most ordinary operating expenses as well as long-term debt that may be incurred upon the refinancing of the current credit facility that is scheduled to mature in November 2012.
Capital Expenditures
For 2010, based on our current exchange rate expectation, we budgeted approximately $59.1 million of capital expenditures, including approximately $17.5 million for maintenance capital expenditures and $41.6 million for expansion capital expenditures, although we continue to evaluate our capital budget and may make changes as economic conditions warrant.
Maintenance capital expenditures include the refurbishment of storage tanks, piping, and dock facilities, and environmental capital expenditures, principally for improvements in containment measures.
We currently have ongoing expansion projects for the construction of 5.6 million gallons of new storage capacity and associated infrastructure at Port Allen, LA, which is expected to be put into service in the second quarter of 2010, and the construction of an aggregate 8.2 million gallons of new capacity and associated infrastructure at Hull, United Kingdom, Amsterdam, Netherlands, and Houston, TX, which is expected to be put into service in the fourth quarter of 2010. Other smaller expansion projects are also being pursued.
Sources
We expect our principal sources of liquidity in 2010 to be our cash from operations and our credit facility, as to which the available borrowing capacity on December 31, 2009 was $83.4 million. We are not predicting any material changes in the mix or relative cost of our capital resources in 2010 from how they stood on December 31, 2009.
Our operating activities for 2010 are expected to generate positive cash flow significantly greater than in 2009, considering that in 2010 we expect to operate for a full 12 months rather than just 7 months and we do not
71
Table of Contents
expect to incur business combination expenses comparable in amount to those incurred in connection with the business combination consummated on May 28, 2009. As cash flow from operations is a key source of liquidity for us, a decrease in demand for our products or services would reduce the availability of funds, especially any decrease in demand for bulk liquid storage services by the ED&F Man group, our largest customer.
We expect that our operating expenses, maintenance capital expenditures, interest payments, and tax payments will generally be funded by cash from operating activities.
We believe cash generated from operations, combined with our availability to draw on our current credit facility, will be sufficient to fund our expansion and acquisition capital expenditures in 2010. Our expansion and acquisition capital expenditures can generally be accelerated or scaled back depending on our liquidity.
We expect that our debt principal payments will generally be funded by refinancing as such principal payments come due.
Our credit facility includes covenants that materially limit our ability to undertake other debt financing. We believe that the recent rise of the stock market in the latter half of 2009 may make it easier for us to use our equity as consideration in acquisitions and may raise the possibility of our issuing additional shares of our Class A common stock to raise additional capital.
Any liquidity in excess of our operating expenses and planned capital expenditures is expected to be utilized to repay part of our credit facility or to finance the implementation of our growth strategy, which at this time is focused on expanding our bulk liquid storage business.
Adequacy
Short-term
We believe that our current cash and cash equivalents, credit facility, and the cash flow we anticipate to generate from operating activities will provide us with sufficient liquidity to satisfy our working capital needs, to make our planned capital expenditures, and to meet our commitments through at least the next 12 months. We do not believe that we are reasonably likely to be in incurable breach of any material covenants relating to our outstanding debt during 2010.
Our cash generated from operating activities is subject to fluctuations in the global economic condition. We believe that the reduced availability of credit due to current economic conditions has reduced and may reduce the demand of some of our customers for our products and services, but we do not expect to suffer a cash crisis that will prevent us from completing our committed expansion projects.
Long-term
Beyond 2010, we believe that we will likely have the ability to generate sufficient liquidity and capital resources to meet our future cash requirements, including our debt obligations, for the reasonably foreseeable future. We base our assessment of the sufficiency of our liquidity and capital resources on the following assumptions:
* our businesses will continue to generate significant operating cash flow;
* the ongoing maintenance capital expenditures associated with our businesses may be readily funded from their operating cash flow or available financing; and
* we will be able to refinance or extend maturing debt on terms that can be supported by the performance of our businesses.
72
Table of Contents
We believe that our financing arrangements provide us with sufficient financial flexibility to fund our operations, debt service requirements, and capital expenditure plans. Our ability to access additional debt or equity capital in the long-term depends on the availability of capital markets, our operating and financial performance, and pricing on commercially reasonable terms. From time-to-time, we review our long-term financing and capital structure. As a result of our review, we may periodically explore alternatives to our current capital structure and financing, including the issuance of additional equity or long-term debt, refinancing our credit facility, and other restructurings or financings. In addition, we may from time to time seek to repurchase a portion of our outstanding equity, both common stock and warrants, in open market purchases, privately negotiated transactions, or otherwise. These repurchases, if any, will depend on prevailing market conditions based on our liquidity requirements, contractual restrictions, government regulations, and other factors. The amount of repurchases may be material and may involve significant amounts of cash and/or financing availability.
Off Balance Sheet Arrangements
In connection with our initial public offering of units in 2007, we granted the representatives of the underwriters an option to purchase an aggregate of 700,000 units, with an option purchase price of $7.50 per unit. Each unit consists of one share of common stock and two warrants. The terms of the units subject to this option are similar to the units sold in our initial public offering and the exercise price for each warrant in the unit is $6.25 per share. This option to purchase units is now exercisable at any time, in whole or in part, and expires on May 24, 2011.
With the exception of operating lease commitments described in Note 18, “Commitments and Contingencies,” of our financial statements, we do not have any other off balance sheet arrangements.
Factors that Affect Financial Performance
The Company’s performance is affected by a number of factors that cause fluctuation in the results of operations and overall financial performance. The most significant factors are described below.
Bulk Liquid Storage
In our bulk liquid storage business, we have long standing relationships with a range of customers, a number of which are significant both in overall market position and contribution to the Company. Contracts are typically in excess of one year in length and provide a significant pipeline of future revenue, in respect of which both cost and revenue structures utilize inflationary pricing mechanisms. Although customer retention has historically been high, changes in the customer base can occur and could have an impact on profitability. Furthermore, our performance continues to be affected by the trading and storage requirements of the ED&F Man group, although we believe that the bulk liquid storage business is largely protected from dependence on single customers or territories by the range of countries in which it operates and the breadth of services it provides to customers.
We have foreign currency exposure, which can have either favorable or unfavorable impact on our earnings from time to time, but the majority of our transactions are conducted and reported in U.S. dollars. Refer to Item 7A, “Quantitative and Qualitative Disclosures About Market Risk” in this Form 10-K for further discussion of foreign currency exchange risk.
Wherever possible we work to secure contractual commitments with third parties prior to construction in an effort to minimize the delay between construction of facilities and achievement of profitable levels of utilization. Results can be adversely affected when utilization rates remain low.
Our performance is linked to the underlying economic demand for access to the regional supply chain network and logistics infrastructure for delivering goods and services to the market. Our storage rates are driven by customer demand and the available bulk liquid storage capacity at each of our regional terminal locations.
73
Table of Contents
Fluctuations in commodity pricing and commodity imbalances can increase or reduce the market demand for storage. Demand for our services has remained consistent despite a slowdown in economic conditions due to our extensive regional network and the vital link we provide for the delivery of bulk liquid products to the downstream market.
Liquid Feed Supplements
Our liquid feed supplements business provides a range of liquid feed supplements to customers both large and small across a wide range of regions within the United States, Canada, and Australia. Historically, customer relationships usually are long and, although particular sales are not generally contracted in excess of one month ahead of delivery, the relationships usually result in stable income streams. Even so, changes in the customer base do occur and do have an impact on our profitability. The business can be significantly affected by the overall health of the cattle and dairy markets.
Our performance is also affected by the underlying price of the agricultural by-products utilized in the business. The market prices of non-liquid feed stocks that compete directly with the liquid feed supplements business are dependent on conditions affecting their supply overall, such as climatic conditions that drive crop yield, quality, and availability. Accordingly, conditions of good or poor supply affect the demand for liquid feed supplements and pricing in turn. The liquid feed supplements business is potentially more affected by changes in the availability and quality of agricultural commodities because of its higher proportion of agricultural commodity costs to its total costs.
The liquid feed supplements business can be significantly affected by adverse weather conditions such as droughts, hard winters, and flooding. Moreover, the months of April through July are traditionally seasonal low months for our liquid feed supplements business. The second quarter is historically weaker than the first quarter, and the fall and winter months are normally the strongest.
Corporate
Borrowings under our corporate revolving credit facility bear interest at a variable rate based on LIBOR or short-term U.S. market rates, at our option. We currently do not hedge our exposure to interest rates. If market interest rates were to increase or decrease, there is a potential impact in our earnings. Refer to Item 7A, “Quantitative and Qualitative Disclosures About Market Risk” in this Form 10-K for further discussion of interest rate risk.
In 2009, the pursuit and consummation of the business combination by which we acquired the bulk liquid storage and liquid feed supplements businesses of the ED&F Man group caused us to incur significant corporate expenses. We do not expect to engage in any comparable transaction of such significance in the foreseeable future.
Overall
The Company is subject to a number of risks that have the potential to influence the future profitability of both operating segments, as described below.
Our businesses operate in environments that require strict adherence to environmental protection and health and safety regulation. A significant event such as contamination, leakage, or other material damage has the potential to significantly harm our financial performance. We believe that our compliance with each of these requirements is at or above the best practice requirements and that we have a strong track record in this regard.
Price inflation that is not directly linked to agricultural commodities, such as consumer price inflation, can also affect the overall performance of the Company, particularly as it is reflected in employee compensation, energy, maintenance and construction costs. We do not consider the Company to be unduly affected by this factor compared with our competitors or the industry at large.
74
Table of Contents
Finally, for additional information regarding important risks that may affect our business, financial condition, and operating results, see Part I, Item 1A, “Risk Factors” in this Form 10-K.
Future Application of Accounting Standards
In February 2010, the FASB amended a previously issued accounting standard to require all companies that file financial statements with the SEC to evaluate subsequent events through the date the financial statements are issued. The standard was further amended to exempt these companies from the requirement to disclose the date through which subsequent events have been evaluated. This amendment is effective for us for interim and annual periods ending after June 15, 2010. Because this new standard only requires additional disclosures, its adoption will have no effect on our consolidated financial position, results of operations, or cash flow.
Management does not believe that there are any accounting standards that have been issued, are required to be adopted by the Company in the future, and are reasonably likely to have a material impact on the information reported in our future financial statements.
| ITEM 7A. | QUANTITATIVE AND QUALITATIVE DISCLOSURES ABOUT MARKET RISKS |
We are exposed to market risks, including interest rate, foreign currency, and commodity risks. We neither hold nor issue financial instruments for trading purposes, and we have not entered into any derivative financial instrument transactions to manage or reduce market risk.
Our objective in managing our exposure to fluctuations in interest rates, foreign currency exchange rates, and commodity prices is to decrease the volatility of our earnings and cash flows affected by potential changes in underlying rates and prices. We monitor these risks and manage such risks on specific transactions. The risk management process primarily uses analytical techniques and sensitivity analysis.
Adverse effects of potential changes in market risks to which we are exposed are discussed below. The following discussion does not, however, consider the effects of the reduced level of overall economic activity that could exist following such changes, such as a significant increase in interest rates. Further, in the event of changes of such magnitude, we would likely take actions to mitigate our exposure to such changes.
A limitation that may cause the sensitivity analyses discussed below not to reflect fully the net market risk of the Company arises from assuming that hypothetical changes in market rates and prices move in the same direction within each risk category. The resulting sensitivity analyses do not incorporate information regarding the sign and amount of co-movements in prices or rates.
Except for any historical facts, this Item 7A consists of forward-looking statements. Important factors that could cause our actual results to differ materially include any significant actions the Company may take in the future to manage its exposure to market risk, any entry by the Company into a new credit facility on significantly different terms than the existing credit facility, and any substantial changes in the worldwide geographic distribution of our business.
Interest Rate Risk
The fair value of our cash and cash equivalents at December 31, 2009, approximated its carrying value due to the short-term duration of the cash-equivalent financial instruments. Our earnings are exposed to interest rate risk associated with borrowings under our revolving credit facility. Borrowings under our revolving credit facility bear interest at a variable rate based on LIBOR or short-term U.S. market rates, at our option. We currently do not use derivative instruments to manage our interest rate risk, but we may in the future. We continuously monitor our level of borrowings to evaluate our potential exposure to interest rate risk, including our assessment of the current and future economic environment.
75
Table of Contents
At December 31, 2009, we had outstanding borrowings of approximately $91.6 million under our revolving credit facility. Based on the outstanding balance of our variable-interest-rate debt at December 31, 2009, if both LIBOR and short-term U.S. market interest rates were to increase or decrease by 100 basis points, the potential annual decrease or increase, respectively, in our annual pre-tax earnings would be approximately $950,00 and in our after-tax net earnings would be approximately $600,000. We are assuming a constant outstanding principal balance under our revolving credit facility and a hypothetical shift in market interest rates in the indicated direction throughout 2010. Changes in our outstanding principal balance or other changes in interest rates would lead to different results.
In 2008, we had not yet consummated the business combination, and the net proceeds of our initial public offering held in a trust account were invested by the trustee only in U.S. government securities having a maturity of 180 days or less, or in money market funds. Given the limited risk, we did not view our interest rate risk to be significant.
Foreign Currency Exchange Rate Risk
Our foreign operations represent approximately 30% and 26% of our total bulk liquid storage and liquid feed supplements segments operating income and asset base respectively. We maintain various operations in multiple foreign locations detailed in the table below. These foreign operations generally incur local operating costs and generate revenues in currencies other than the U.S. Dollar. These foreign currency revenues and expenses expose us to foreign currency risk and give rise to foreign currency exchange gains and losses. We do not presently hedge against the risks of foreign currently fluctuations. In the event of significant fluctuations in foreign currencies, we may experience declines in revenue and adverse impacts on operating results and such changes could be material. To manage foreign currency risk, we closely monitor the working capital requirements of our foreign operations, as well as movements in foreign exchange rates. We are continuing to evaluate the possible future use of foreign currency hedging strategies where we deem appropriate.
The following table lists the foreign countries in which we do business and the functional currency of each:
| Functional Currencies | ||
| Canada | Canadian Dollar | |
| United Kingdom | British Pound | |
| Netherlands | Euro | |
| Ireland | Euro | |
| Denmark | Danish Krone | |
| Poland | Polish Zloty | |
| Korea | Korean Won | |
| Australia | Australian Dollar | |
We have identified the Canadian Dollar, the British Pound, and the Euro as the currencies with the most potential to impact our net earnings. A hypothetical 15% increase or decrease in all three of these foreign currency exchange rates against the U.S. dollar, would potentially increase or decrease, respectively, our annual pre-tax earnings (which are expressed in U.S. dollars) by approximately $1.3 million and our after-tax net earnings by approximately $900,000 in the aggregate. We are assuming comparable net income to 2009 in foreign countries of these foreign currencies and a hypothetical shift in foreign currency exchange rates in the indicated direction throughout 2010.
In 2008, we had not yet consummated the business combination, had not engaged in any substantial commercial business, and were not exposed to risks associated with foreign currency exchange rates.
76
Table of Contents
Commodity Price Risk
In the normal course of operations, our business is exposed to market risks arising from adverse changes in the prices of the commodities stored, consumed, and produced in our business.
Bulk Liquid Storage
We do not face significant risks relating directly to short-term movements in commodity prices in our bulk liquid storage business, as we primarily store and/or handle products for a fee and are not engaged in significant unmatched purchases and resales of commodity products.
Liquid Feed Supplements
The liquid feed supplements business is potentially more affected by changes in the prices of commodities because it directly consumes and produces for sale various agricultural commodities. It has a high proportion of agricultural commodity costs to its total costs. However, our liquid feed supplements business does not utilize many fixed-price long-term supply or purchase contracts, but mainly uses short-term contracts or floating-price long-term contracts. We believe we have adequate primary and secondary sources of supply for each of our key commodity ingredients and that, in periods of rising prices, we expect to recover a majority of the increased cost in the form of higher selling prices. However, recoveries typically lag the effect of cost increases due to the nature of our markets.
Typically greater than 60% of our raw material inputs are purchased from markets that can be volatile and are not provided the protections of standard risk management tools. Many of these ingredients are purchased from the food industry (corn, soybean, sugar milling), as well as from other industrial production. As such, the ingredients purchased by us are by-product streams ancillary to our suppliers’ main product stream and do not necessarily synchronize with the seasonality of our business. This requires us to make future purchase and storage commitments based upon knowledge of our industry as well as the production and pricing of numerous other industries.
When the price of certain raw ingredients increases, we can generally adjust our feed formulas by substituting lower-cost, alternative ingredients to produce feeds with comparable nutritional value. By using our least-cost product formulation system, we can determine optimal formulations that meet our nutritional standards and maintain product quality. In addition, through pricing the results are marginally affected by the cost of commodity inputs. Industry practices in animal feed pass cost fluctuations on to the customer in the long term, but do not protect against significant sudden short term movements in input costs. The liquid feed industry generally prices products based on gross margin per ton of feed. This practice tends to mitigate the impact of volatility in commodity ingredient markets on our animal feed profits. As ingredient costs fluctuate, the changes are generally passed on to customers through semi-monthly or monthly changes in prices.
In 2008, we had not yet consummated the business combination, had not engaged in any substantial commercial business, and were not exposed to risks associated with commodity prices.
| ITEM 8. | FINANCIAL STATEMENTS AND SUPPLEMENTARY DATA |
INDEX
77
Table of Contents
REPORT OF INDEPENDENT REGISTERED PUBLIC ACCOUNTING FIRM
The Stockholders and Board of Directors
Westway Group, Inc.
We have audited the accompanying consolidated balance sheet of Westway Group, Inc. as of December 31, 2009, and the related consolidated statements of operations, stockholders’ equity, comprehensive income, and cash flows for the year then ended. These financial statements are the responsibility of the Company’s management. Our responsibility is to express an opinion on these financial statements based on our audit.
We conducted our audit in accordance with the standards of the Public Company Accounting Oversight Board (United States). Those standards require that we plan and perform the audit to obtain reasonable assurance about whether the financial statements are free of material misstatement. We were not engaged to perform an audit of the Company’s internal control over financial reporting. Our audit included consideration of internal control over financial reporting as a basis for designing audit procedures that are appropriate in the circumstances, but not for the purpose of expressing an opinion on the effectiveness of the Company’s internal control over financial reporting. Accordingly, we express no such opinion. An audit also includes examining, on a test basis, evidence supporting the amounts and disclosures in the financial statements, assessing the accounting principles used and significant estimates made by management, and evaluating the overall financial statement presentation. We believe that our audit provides a reasonable basis for our opinion.
In our opinion, the financial statements referred to above present fairly, in all material respects, the consolidated financial position of Westway Group Inc. at December 31, 2009, and the consolidated results of its operations and its cash flows for the year ended December 31, 2009, in conformity with U.S. generally accepted accounting principles.
/s/ Ernst & Young LLP
New Orleans, Louisiana
March 15, 2010
78
Table of Contents
REPORT OF INDEPENDENT REGISTERED PUBLIC ACCOUNTING FIRM
To the Board of Directors and Stockholders of
Shermen WSC Acquisition Corp.
We have audited the accompanying balance sheets of Shermen WSC Acquisition Corp. (a corporation in the development stage) (the “Company”) as of December 31, 2008 and the related statements of operations and cash flows for the years ended December 31, 2008 and 2007, and stockholders’ equity from December 31, 2006 through December 31, 2008. We have also audited the Company’s internal control over financial reporting as of December 31, 2008, based on criteria established in Internal Control—Integrated Framework issued by the Committee of Sponsoring Organizations of the Treadway Commission (COSO). The Company’s management is responsible for these financial statements, for maintaining effective internal control over financial reporting, and for its assessment of the effectiveness of internal control over financial reporting, included in the accompanying Management’s Annual Report on Internal Control over Financial Reporting. Our responsibility is to express an opinion on these financial statements and an opinion on the Company’s internal control over financial reporting based on our audits.
We conducted our audits in accordance with the standards of the Public Company Accounting Oversight Board (United States). Those standards require that we plan and perform the audits to obtain reasonable assurance about whether the financial statements are free of material misstatement and whether effective internal control over financial reporting was maintained in all material respects. Our audit of the financial statements included examining, on a test basis, evidence supporting the amounts and disclosures in the financial statements, assessing the accounting principles used and significant estimates made by management, as well as evaluating the overall financial statement presentation. Our audit over internal control over financial reporting included obtaining an understanding of internal control over financial reporting, assessing the risk that a material weakness exists, and testing and evaluating the design and operating effectiveness of internal control based on the assessed risk. Our audits also included performing such other procedures as we considered necessary in the circumstances. We believe that our audits provide a reasonable basis for our opinion.
A company’s internal control over financial reporting is a process designed to provide reasonable assurance regarding the reliability of financial reporting and the preparation of financial statements for external purposes in accordance with generally accepted accounting principles. A company’s internal control over financial reporting includes those policies and procedures that (1) pertain to the maintenance of records that, in reasonable detail, accurately and fairly reflect the transactions and dispositions of the assets of the company; (2) provide reasonable assurance that transactions are recorded as necessary to permit preparation of financial statements in accordance with generally accepted accounting principles, and that receipts and expenditures of the company are being made only in accordance with authorizations of management and directors of the company; and (3) provide reasonable assurance regarding prevention or timely detection of unauthorized acquisition, use, or disposition of the company’s assets that could have a material effect on the financial statements.
Because of its inherent limitations, internal control over financial reporting may not prevent or detect misstatements. Also, projections of any evaluation of effectiveness to future periods are subject to the risk that controls may become inadequate because of changes in conditions, or that the degree of compliance with the policies or procedures may deteriorate.
The accompanying financial statements have been prepared assuming that Shermen WSC Acquisition Corp. will continue as a going concern. As discussed in Note A to the financial statements, Shermen WSC Acquisition Corp. will face a mandatory liquidation if a business combination is not consummated by May 30, 2009, which raises substantial doubt about its ability to continue as a going concern. The financial statements do not include any adjustments that might result from the outcome of this uncertainty.
In our opinion, the financial statements referred to above present fairly, in all material respects, the financial position of the Company as of December 31, 2008, and the results of its operations and its cash flows for the years ended December 31, 2008 and 2007 in conformity with accounting principles generally accepted in the United States of America. Also in our opinion, the Company maintained, in all material respects, effective internal control over financial reporting as of December 31, 2008, based on criteria established in Internal Control—Integrated Framework issued by the Committee of Sponsoring Organizations of the Treadway Commission (COSO).
| /S/ ROTHSTEIN, KASS & COMPANY, P.C. |
| Rothstein, Kass & Company, P.C. Roseland, New Jersey March 9, 2009 |
79
Table of Contents
REPORT OF INDEPENDENT REGISTERED PUBLIC ACCOUNTING FIRM
The Directors of ED&F Man:
We have audited the accompanying combined carve-out balance sheet of the bulk liquid storage and liquid feed supplements businesses (Westway Group) of ED&F Man group as described in Note 2 to the financial statements, as of October 31, 2008 and the related combined carve-out statements of income and cash flows and changes in the ED&F Man net invested capital for each of the years in the two-year period ended October 31, 2008. These financial statements are the responsibility of ED&F Man’s management. Our responsibility is to express an opinion on the financial statements based on our audits.
We conducted our audits in accordance with the standards of the Public Company Accounting Oversight Board (United States). Those standards require that we plan and perform the audit to obtain reasonable assurance about whether the financial statements are free of material misstatement. We were not engaged to perform an audit of the Group’s internal control over financial reporting. Our audits include consideration of internal control over financial reporting as a basis for designing audit procedures that are appropriate in the circumstances, but not for the purpose of expressing an opinion on the effectiveness of the Group’s internal control over financial reporting. Accordingly, we express no such opinion. An audit also includes examining, on a test basis, evidence supporting the amounts and disclosures in the financial statements, assessing the accounting principles used and significant estimates made by management, as well as evaluating the overall financial statement presentation. We believe that our audits provide a reasonable basis for our opinion.
In our opinion, the combined carve-out financial statements referred to above present fairly, in all material respects, the financial position of the Westway Group as of October 31, 2008 and the results of its operations and its cash flows for each of the years in the two-year period ended October 31, 2008 in accordance with U.S. generally accepted accounting principles.
As discussed in note 3 to the accompanying combined carve-out financial statements, Westway Group has restated its financial statements for the fiscal year ended October 31, 2008.
/s/ Ernst & Young LLP
London, England
January 19, 2009, except as to notes 3 and 17,
which are as of March 9, 2009.
80
Table of Contents
REPORT OF INDEPENDENT REGISTERED PUBLIC ACCOUNTING FIRM
The Stockholders and Board of Directors
Westway Group, Inc. (acquirors of Westway Group of ED&F Man group)
We have audited the accompanying combined carve-out statements of income and cash flows of the bulk liquid storage and liquid feed supplements businesses (Westway Group) of ED&F Man group as described in Note 2 to the financial statements for the period from November 1, 2008 to May 28, 2009. These financial statements are the responsibility of the Company’s management. Our responsibility is to express an opinion on these financial statements based on our audit.
We conducted our audit in accordance with the standards of the Public Company Accounting Oversight Board (United States). Those standards require that we plan and perform the audit to obtain reasonable assurance about whether the financial statements are free of material misstatement. We were not engaged to perform an audit of Westway Group’s internal control over financial reporting. Our audit included consideration of internal control over financial reporting as a basis for designing audit procedures that are appropriate in the circumstances, but not for the purpose of expressing an opinion on the effectiveness of Westway Group’s internal control over financial reporting. Accordingly, we express no such opinion. An audit also includes examining, on a test basis, evidence supporting the amounts and disclosures in the financial statements, assessing the accounting principles used and significant estimates made by management, and evaluating the overall financial statement presentation. We believe that our audits provide a reasonable basis for our opinion.
In our opinion, the financial statements referred to above present fairly, in all material respects, the combined carve-out results of operations and cash flows of Westway Group for the period from November 1, 2008 to May 28, 2009, in conformity with U.S. generally accepted accounting principles.
/s/ Ernst & Young LLP
New Orleans, Louisiana
March 15, 2010
81
Table of Contents
WESTWAY GROUP, INC.
(in thousands, except share data)
| As of | |||||||
| December 31, 2009 |
December 31, 2008 | ||||||
| ASSETS |
|||||||
| Current assets: |
|||||||
| Cash and cash equivalents |
$ | 9,710 | $ | 190 | |||
| Cash held in trust fund (restricted) |
— | 138,446 | |||||
| Trade accounts receivable from third parties, net |
38,665 | — | |||||
| Trade accounts receivable from related parties—the ED&F Man group |
5,054 | — | |||||
| Inventories |
20,407 | — | |||||
| Prepaid expenses |
2,593 | 29 | |||||
| Other current assets |
7,088 | — | |||||
| Total current assets |
83,517 | 138,665 | |||||
| Investment in unconsolidated subsidiary |
4,368 | — | |||||
| Property, plant and equipment, net |
324,587 | — | |||||
| Goodwill |
89,970 | — | |||||
| Other intangibles, net |
5,954 | — | |||||
| Other non-current assets |
3,055 | — | |||||
| Deferred income taxes |
6,247 | 712 | |||||
| Total assets |
$ | 517,698 | $ | 139,377 | |||
| LIABILITIES AND STOCKHOLDERS’ EQUITY |
|||||||
| Current liabilities: |
|||||||
| Trade accounts payable to third parties |
$ | 6,658 | $ | 200 | |||
| Trade accounts payable to related parties—the ED&F Man group |
23,844 | — | |||||
| Goods received and not yet invoiced |
8,273 | — | |||||
| Payroll |
8,945 | — | |||||
| Accrued expenses and other current liabilities |
11,629 | 286 | |||||
| Total current liabilities |
59,349 | 486 | |||||
| Borrowings under credit facilities |
91,633 | — | |||||
| Deferred income taxes |
71,355 | — | |||||
| Deferred underwriters’ fee |
— | 3,312 | |||||
| Total liabilities |
222,337 | 3,798 | |||||
| Commitments and contingencies |
|||||||
| Common stock subject to redemption (2008: 9,199,999 shares at redemption value) |
— | 54,744 | |||||
| Deferred interest related to common stock subject to redemption, net of taxes |
— | 323 | |||||
| Stockholders’ equity: |
|||||||
| Preferred stock; $0.0001 par value; 7,000,000 shares authorized; none issued at December 31, 2009. (December 31, 2008: $.0001 par value; 1,000,000 shares authorized; none issued) |
— | — | |||||
| Series A Convertible Preferred Stock; $0.0001 par value; 33,000,000 authorized; 30,886,830 issued and outstanding at December 31, 2009 (liquidation preference $5.50 per share plus accrued dividends) (December 31, 2008: no shares authorized or issued) |
177,291 | — | |||||
| Common Stock; $0.0001 par value; 235,000,000 shares authorized; 26,561,766 issued and outstanding at December 31, 2009 represented by 13,940,833 convertible Class A and 12,624,003 convertible Class B shares. (December 31, 2008: $.0001 par value; 100,000,000 shares authorized; 28,750,000 shares issued and outstanding) |
3 | 3 | |||||
| Additional paid-in capital |
133,456 | 78,941 | |||||
| Accumulated other comprehensive income (loss) |
2,397 | — | |||||
| Retained earnings (accumulated deficit) |
(4,284 | ) | 1,568 | ||||
| Treasury stock at cost—2,352,569 shares (December 31, 2008: 0 shares) |
(14,115 | ) | — | ||||
| Total Westway Group, Inc. stockholders’ equity |
294,748 | 80,512 | |||||
| Non-controlling interest |
613 | — | |||||
| Total stockholders’ equity |
295,361 | 80,512 | |||||
| Total liabilities and stockholders’ equity |
$ | 517,698 | $ | 139,377 | |||
The accompanying notes are an integral part of these consolidated financial statements.
82
Table of Contents
WESTWAY GROUP, INC.
CONSOLIDATED BALANCE SHEET
(in thousands)
| Predecessor Combined Carve-Out Balance Sheet |
||||
| as of October 31, 2008 |
||||
| ASSETS |
||||
| Current assets |
||||
| Accounts receivable from third parties (net of allowances of $259) |
$ | 39,166 | ||
| Accounts receivable from ED&F Man |
532 | |||
| Inventories |
21,490 | |||
| Prepaid expenses and other current assets |
3,185 | |||
| Total current assets |
64,373 | |||
| Non-current assets |
||||
| Investments |
2,916 | |||
| Property, plant & equipment, net |
137,390 | |||
| Goodwill |
4,972 | |||
| Deferred tax assets |
1,565 | |||
| Income taxes recoverable |
528 | |||
| Total non-current assets |
147,371 | |||
| Total assets |
$ | 211,744 | ||
| LIABILITIES AND ED&F MAN NET INVESTED CAPITAL |
||||
| Current liabilities |
||||
| Accounts payable to third parties |
$ | 13,932 | ||
| Accounts payable to ED&F Man |
9,483 | |||
| Accrued invoices |
7,394 | |||
| Payroll accruals |
5,473 | |||
| Other accrued expenses |
7,851 | |||
| Income taxes payable |
5,466 | |||
| Total current liabilities |
49,599 | |||
| Non-current liabilities |
||||
| Deferred tax liabilities |
24,343 | |||
| Other liabilities |
69 | |||
| Total non-current liabilities |
24,412 | |||
| Minority interest |
1,117 | |||
| Commitments and Contingencies |
— | |||
| ED&F Man net invested capital |
||||
| Net invested capital excluding accumulated other comprehensive (loss)/income |
136,695 | |||
| Accumulated other comprehensive (loss)/income |
(79 | ) | ||
| ED&F Man net invested capital |
136,616 | |||
| Total liabilities and ED&F Man net invested capital |
$ | 211,744 | ||
The accompanying notes are an integral part of these consolidated financial statements.
83
Table of Contents
WESTWAY GROUP, INC.
CONSOLIDATED STATEMENTS OF OPERATIONS
(in thousands, except per share amounts)
| Twelve months ended December 31, |
||||||||||||
| 2009 | 2008 | 2007 | ||||||||||
| Net revenue |
||||||||||||
| Bulk liquid storage |
$ | 36,590 | $ | — | $ | — | ||||||
| Liquid feed supplements |
143,378 | — | — | |||||||||
| Related parties—the ED&F Man group |
8,819 | — | — | |||||||||
| Total net revenue |
188,787 | — | — | |||||||||
| Cost of sales—liquid feed supplements |
115,416 | — | — | |||||||||
| Other operating costs and expenses |
29,876 | 869 | 871 | |||||||||
| Depreciation |
11,060 | — | — | |||||||||
| Selling, general and administrative expenses |
18,510 | — | — | |||||||||
| Business combination expenses |
13,891 | — | — | |||||||||
| Total operating expenses |
188,753 | 869 | 871 | |||||||||
| Operating income (loss) |
34 | (869 | ) | (871 | ) | |||||||
| Other income (expense) |
||||||||||||
| Interest income |
181 | 2,396 | 2,988 | |||||||||
| Interest expense |
(1,499 | ) | — | — | ||||||||
| Loss on disposal of property, plant & equipment |
(59 | ) | — | — | ||||||||
| Total other income (expense) |
(1,377 | ) | 2,396 | 2,988 | ||||||||
| Income (loss) before income tax provision and equity in earnings of unconsolidated subsidiary |
(1,343 | ) | 1,527 | 2,117 | ||||||||
| Income tax provision |
(2,518 | ) | (786 | ) | (951 | ) | ||||||
| Equity in earnings of unconsolidated subsidiary |
134 | — | — | |||||||||
| Net income (loss) |
(3,727 | ) | 741 | 1,166 | ||||||||
| Net loss attributable to non-controlling interest |
67 | — | — | |||||||||
| Net income (loss) attributable to Westway Group, Inc. |
(3,660 | ) | 741 | 1,166 | ||||||||
| Preferred dividends |
(2,515 | ) | — | — | ||||||||
| Net income (loss) applicable to common stockholders |
$ | (6,175 | ) | $ | 741 | $ | 1,166 | |||||
| Number of common shares subject to possible redemption, basic & diluted |
— | 9,199,999 | 5,444,000 | |||||||||
| Income per common shares subject to possible redemption, basic & diluted |
— | $ | 0.00 | $ | 0.06 | |||||||
| Weighted average number of common shares equivalent outstanding not subject to possible redemption: |
||||||||||||
| Basic |
23,690,843 | 19,550,001 | 14,360,000 | |||||||||
| Diluted |
23,690,843 | 23,491,944 | 17,963,000 | |||||||||
| Net income (loss) per share of common stock: |
||||||||||||
| Basic |
$ | (0.26 | ) | $ | 0.04 | $ | 0.06 | |||||
| Diluted |
$ | (0.26 | ) | $ | 0.03 | $ | 0.04 | |||||
| Basic and diluted earnings per share attributable to Series A convertible preferred stock |
— | — | — | |||||||||
| Basic and diluted earnings per share attributable to common shares |
— | — | — | |||||||||
| Series A convertible preferred stock weighted average shares outstanding, basic and diluted |
— | — | — | |||||||||
| Common share weighted average shares outstanding, basic and diluted |
— | — | — | |||||||||
The accompanying notes are an integral part of these consolidated financial statements.
84
Table of Contents
WESTWAY GROUP, INC.
CONSOLIDATED STATEMENTS OF OPERATIONS
(in thousands)
| Predecessor Combined Carve-Out Statements of Operations |
||||||||||||
| November 1, 2008 through May 28, 2009 |
Year ended October 31, | |||||||||||
| 2009(1) | 2008(2) | 2007 | ||||||||||
| Net revenue |
||||||||||||
| Bulk liquid storage |
$ | 33,632 | $ | 65,643 | $ | 60,020 | ||||||
| Liquid feed supplements |
171,135 | 290,569 | 222,871 | |||||||||
| Related parties—ED&F Man |
7,252 | 14,111 | 9,610 | |||||||||
| Total revenue |
212,019 | 370,323 | 292,501 | |||||||||
| Cost of Sales (restated)(2) |
176,716 | 302,329 | 240,119 | |||||||||
| Gross Profit (restated)(2) |
35,303 | 67,994 | 52,382 | |||||||||
| Selling, General and Administrative Expenses (restated)(2) |
15,797 | 35,818 | 29,932 | |||||||||
| Income from operations |
19,506 | 32,176 | 22,450 | |||||||||
| (Expense)/income from investments |
(248 | ) | (174 | ) | 67 | |||||||
| (Loss)/gain on disposals of property, plant & equipment |
(12 | ) | 6,875 | 4,184 | ||||||||
| Total non-operating (expense)/income |
(260 | ) | 6,701 | 4,251 | ||||||||
| Income before taxes |
19,246 | 38,877 | 26,701 | |||||||||
| Income tax expense |
(5,839 | ) | (12,041 | ) | (9,237 | ) | ||||||
| Minority interest |
(24 | ) | 131 | 98 | ||||||||
| Net income |
$ | 13,383 | $ | 26,967 | $ | 17,562 | ||||||
| (1) | —Operations as predecessor ceased on May 28, 2009. |
| (2) | —Restated for reclassification of operating costs (see note 3). |
The accompanying notes are an integral part of these consolidated financial statements.
85
Table of Contents
WESTWAY GROUP, INC.
CONSOLIDATED STATEMENTS OF STOCKHOLDERS’ EQUITY
For the period from December 31, 2006 to December 31, 2009
(in thousands)
| Westway Group, Inc. Stockholders’ Equity | ||||||||||||||||||||||||||||||||||||||||||
| Series A Convertible Preferred Stock |
Common Stock Class A |
Common Stock Class B |
Additional Paid-In Capital |
Retained Earnings (Accumulated Deficit) |
Accumulated Other Comprehensive Income |
Common Stock Held in Treasury |
Total Westway Group, Inc. stockholders’ equity |
Non- controlling Interest |
Total Stockholders’ Equity |
|||||||||||||||||||||||||||||||||
| (in thousands (except per share, |
Number of Shares |
At Par Value |
Number of Shares |
At Par Value |
Number of Shares |
At Par Value |
Number of Shares |
At Cost | ||||||||||||||||||||||||||||||||||
| Balances as of December 31, 2006 |
5,750 | $ | 1 | $ | 24 | $ | (16 | ) | $ | 9 | $ | 9 | ||||||||||||||||||||||||||||||
| Sale of units at $6 per unit |
23,000 | 2 | 137,998 | 138,000 | 138,000 | |||||||||||||||||||||||||||||||||||||
| Sale of warrants issued to Founders at $0.70 per warrant |
3,650 | 3,650 | 3,650 | |||||||||||||||||||||||||||||||||||||||
| Underwriting and offering fees and expenses |
(4,790 | ) | (4,790 | ) | (4,790 | ) | ||||||||||||||||||||||||||||||||||||
| Proceeds from public offering of common stock subject to possible redemption (9,200 shares common stock at redemption value $5.95 per share) |
(54,744 | ) | (54,744 | ) | (54,744 | ) | ||||||||||||||||||||||||||||||||||||
| Underwriters’ discount and offering costs related to public offering and over- allotment option |
(3,197 | ) | (3,197 | ) | (3,197 | ) | ||||||||||||||||||||||||||||||||||||
| Change in balance of Trust Account relating to common stock subject to possible redemption, net of tax |
(353 | ) | (353 | ) | (353 | ) | ||||||||||||||||||||||||||||||||||||
| Net income applicable to common stockholder |
1,166 | 1,166 | 1,166 | |||||||||||||||||||||||||||||||||||||||
| Balance, December 31, 2007 |
— | $ | — | 28,750 | $ | 3 | — | $ | — | $ | 78,941 | $ | 797 | $ | — | — | $ | — | $ | 79,741 | $ | — | $ | 79,741 | ||||||||||||||||||
| Change in balance of Trust Account relating to common stock subject to possible redemption, net of tax |
30 | 30 | 30 | |||||||||||||||||||||||||||||||||||||||
| Net income applicable to common stockholder |
741 | 741 | 741 | |||||||||||||||||||||||||||||||||||||||
| Balance, December 31, 2008 |
— | $ | — | 28,750 | $ | 3 | — | $ | — | $ | 78,941 | $ | 1,568 | $ | — | — | $ | — | $ | 80,512 | $ | — | $ | 80,512 | ||||||||||||||||||
86
Table of Contents
| Westway Group, Inc. Stockholders’ Equity | |||||||||||||||||||||||||||||||||||||||||||||||
| Series A Convertible Preferred Stock |
Common Stock Class A |
Common Stock Class B |
Additional Paid-In Capital |
Retained Earnings (Accumulated Deficit) |
Accumulated Other Comprehensive Income |
Common Stock Held in Treasury |
Total Westway Group, Inc. stockholders’ equity |
Non- controlling Interest |
Total Stockholders’ Equity |
||||||||||||||||||||||||||||||||||||||
| (in thousands) |
Number of Shares |
At Par Value |
Number of Shares |
At Par Value |
Number of Shares |
At Par Value |
Number of Shares |
At Cost | |||||||||||||||||||||||||||||||||||||||
| Cancellation of shares following exercise of conversion rights |
(9,190 | ) | (1 | ) | (338 | ) | (339 | ) | (339 | ) | |||||||||||||||||||||||||||||||||||||
| Repurchase of shares at $6.00 per share |
(2,514 | ) | 2,514 | (15,086 | ) | (15,086 | ) | (15,086 | ) | ||||||||||||||||||||||||||||||||||||||
| Cancellation of shares previously held by sponsor |
(3,267 | ) | — | — | |||||||||||||||||||||||||||||||||||||||||||
| Issuance of shares at $5.00 per share |
12,624 | 1 | 63,119 | 63,120 | 63,120 | ||||||||||||||||||||||||||||||||||||||||||
| Convertible preferred shares issued at $5.74 per share |
18,705 | 107,367 | 107,367 | 107,367 | |||||||||||||||||||||||||||||||||||||||||||
| Deferred convertible preferred shares issued at $5.74 per share |
12,182 | 69,924 | 69,924 | 69,924 | |||||||||||||||||||||||||||||||||||||||||||
| Cash dividends declared and paid, $1.00 per class A common share |
(11,382 | ) | (11,382 | ) | (11,382 | ) | |||||||||||||||||||||||||||||||||||||||||
| Convertible preferred dividend accrued |
(2,515 | ) | (2,515 | ) | (2,515 | ) | |||||||||||||||||||||||||||||||||||||||||
| Reversal of accretion of trust account relating to common stock subject to possible redemption, net of tax |
323 | 323 | 323 | ||||||||||||||||||||||||||||||||||||||||||||
| Reversal of previously accrued underwriters’ discount and offering costs related to public offering |
3,312 | 3,312 | 3,312 | ||||||||||||||||||||||||||||||||||||||||||||
| Issuance of common shares ranging from $4.17 to $5.00 per share from treasury |
162 | (196 | ) | (162 | ) | 971 | 775 | 775 | |||||||||||||||||||||||||||||||||||||||
| Non-controlling interest |
680 | 680 | |||||||||||||||||||||||||||||||||||||||||||||
| Comprehensive income (loss) |
|||||||||||||||||||||||||||||||||||||||||||||||
| Net (loss) income |
(3,660 | ) | (3,660 | ) | (67 | ) | (3,727 | ) | |||||||||||||||||||||||||||||||||||||||
| Other comprehensive income: |
|||||||||||||||||||||||||||||||||||||||||||||||
| Foreign currency translation |
2,397 | 2,397 | — | 2,397 | |||||||||||||||||||||||||||||||||||||||||||
| Other comprehensive income |
2,397 | 2,397 | — | 2,397 | |||||||||||||||||||||||||||||||||||||||||||
| Total comprehensive income |
(1,263 | ) | (67 | ) | (1,330 | ) | |||||||||||||||||||||||||||||||||||||||||
| Balance, December 31, 2009 |
30,887 | $ | 177,291 | 13,941 | $ | 2 | 12,624 | $ | 1 | $ | 133,456 | $ | (4,284 | ) | $ | 2,397 | 2,352 | $ | (14,115 | ) | $ | 294,748 | $ | 613 | $ | 295,361 | |||||||||||||||||||||
The accompanying notes are an integral part of these consolidated financial statements.
87
Table of Contents
WESTWAY GROUP, INC.
CONSOLIDATED STATEMENTS OF STOCKHOLDERS’ EQUITY
(in thousands)
| Predecessor Combined Carve-Out
Statements of Changes in ED&F Man Net Invested Capital |
|||||||||
| ED&F Man Net Invested Capital excluding Other Comprehensive Income |
Accumulated Other Comprehensive Income |
ED&F Man Net Invested Capital |
|||||||
| Balance at October 31, 2006 |
104,556 | 3,605 | 108,161 | ||||||
| Comprehensive Income: |
|||||||||
| Net income |
17,562 | — | 17,562 | ||||||
| Other comprehensive income |
— | 2,610 | 2,610 | ||||||
| Total Comprehensive Income |
|||||||||
| Net equity transactions with ED&F Man |
(6,455 | ) | — | (6,455 | ) | ||||
| Distribution to ED&F Man |
(1,104 | ) | — | (1,104 | ) | ||||
| Balance at October 31, 2007 |
114,559 | 6,215 | 120,774 | ||||||
| Comprehensive Income: |
|||||||||
| Net income |
26,967 | — | 26,967 | ||||||
| Other comprehensive loss |
— | (6,294 | ) | (6,294 | ) | ||||
| Total Comprehensive Income |
20,673 | ||||||||
| Net equity transactions with ED&F Man |
(4,831 | ) | — | (4,831 | ) | ||||
| Balance at October 31, 2008 |
136,695 | (79 | ) | 136,616 | |||||
88
Table of Contents
WESTWAY GROUP, INC.
CONSOLIDATED STATEMENTS OF COMPREHENSIVE INCOME
(in thousands)
| Year Ended December 31, | ||||||||||
| 2009 | 2008 | 2007 | ||||||||
| Net income (loss) |
($ | 3,727 | ) | $ | 741 | $ | 1,166 | |||
| Other comprehensive income (loss) net of tax effect: |
||||||||||
| Foreign currency translation |
2,397 | — | — | |||||||
| Comprehensive income (loss) |
(1,330 | ) | 741 | 1,166 | ||||||
| Comprehensive income (loss) attributable to non-controlling interest |
67 | — | — | |||||||
| Comprehensive income (loss) attributable to Westway Group Inc. |
($ | 1,263 | ) | $ | 741 | $ | 1,166 | |||
The accompanying notes are an integral part of these consolidated financial statements.
89
Table of Contents
WESTWAY GROUP, INC.
CONSOLIDATED STATEMENTS OF CASH FLOWS
(in thousands)
| Twelve months ended December 31, |
||||||||||||
| 2009 | 2008 | 2007 | ||||||||||
| Cash flows from operating activities: |
||||||||||||
| Net income (loss) |
$ | (3,727 | ) | $ | 741 | $ | 1,166 | |||||
| Adjustments to reconcile net income (loss) to net cash provided by (used in) operating activities: |
||||||||||||
| Deferred tax benefit |
3,538 | (311 | ) | (401 | ) | |||||||
| Provision for doubtful accounts receivable |
255 | |||||||||||
| Depreciation and amortization |
11,060 | — | — | |||||||||
| Amortization of deferred financing costs |
129 | |||||||||||
| Equity earnings in unconsolidated investments |
(192 | ) | — | — | ||||||||
| Loss on sale of property and equipment |
59 | — | — | |||||||||
| Stock to employees and underwriters |
775 | — | — | |||||||||
| Changes in operating assets and liabilities: |
||||||||||||
| (Increase) decrease in accounts receivable |
(5,731 | ) | — | — | ||||||||
| (Increase) decrease in inventory |
(210 | ) | — | — | ||||||||
| (Increase) decrease in income taxes recoverable |
(4,266 | ) | — | — | ||||||||
| (Increase) decrease in prepaid expenses |
(2,707 | ) | 1 | (30 | ) | |||||||
| Increase (decrease) in accounts payable |
9,650 | 113 | 85 | |||||||||
| Increase (decrease) in accrued liabilities and other current liabilities |
4,998 | — | — | |||||||||
| Increase (decrease) in income tax payable |
205 | (659 | ) | 945 | ||||||||
| Net cash provided by operating activities |
13,836 | (115 | ) | 1,765 | ||||||||
| Cash flows from investing activities |
||||||||||||
| Decrease in restricted cash held in trust account |
138,446 | 144 | (138,590 | ) | ||||||||
| Acquisition of business—SouthSide River-Rail Inc. |
(19,879 | ) | — | — | ||||||||
| Acquisition of business—Bulk liquid storage and liquid feed supplements businesses |
(104,148 | ) | — | — | ||||||||
| Capital expenditures for property, plant and equipment, net of sales proceeds |
(25,954 | ) | — | — | ||||||||
| Net cash used in investing activities |
(11,535 | ) | 144 | (138,590 | ) | |||||||
| Cash flows from financing activities: |
||||||||||||
| Payments for note payable, stockholder |
— | — | (150 | ) | ||||||||
| Payments of offering costs |
— | — | (4,535 | ) | ||||||||
| Proceeds from issuance of common stock in initial public offering |
— | — | 141,650 | |||||||||
| Proceeds from credit facilities |
180,646 | — | — | |||||||||
| Payments on credit facilities |
(91,787 | ) | ||||||||||
| Payment of deferred financing costs |
(365 | ) | ||||||||||
| Purchase of treasury stock |
(15,086 | ) | — | — | ||||||||
| Payment of cash dividends |
(11,382 | ) | — | — | ||||||||
| Redemption of redeemable common stock following exercise of conversion rights |
(55,084 | ) | — | — | ||||||||
| Net cash provided by financing activities |
6,942 | — | 136,965 | |||||||||
| Effects of exchange rate changes on cash and cash equivalents |
277 | — | — | |||||||||
| Net increase in cash and cash equivalents |
9,520 | 29 | 140 | |||||||||
| Cash and cash equivalents, beginning of period |
190 | 161 | 21 | |||||||||
| Cash and cash equivalents, end of period |
$ | 9,710 | $ | 190 | $ | 161 | ||||||
| Supplemental disclosures of cash flow information: |
||||||||||||
| Cash paid for income taxes |
$ | 2,993 | $ | 1,756 | $ | — | ||||||
| Cash paid for interest |
$ | 1,957 | $ | — | $ | — | ||||||
| Non-cash financing and investing activities: |
||||||||||||
| Accrual (reduction) in deferred underwriter liability |
$ | (3,312 | ) | $ | 3,312 | $ | 3,312 | |||||
| Series A Convertible Preferred stock issued to ED&F Man for acquired business |
$ | 177,291 | $ | — | $ | — | ||||||
| Class B common stock issued to ED&F Man for acquired business |
$ | 63,120 | $ | — | $ | — | ||||||
| Preferred dividends |
$ | 2,515 | $ | — | $ | — | ||||||
| Stock issued from treasury shares |
$ | 971 | $ | — | $ | — | ||||||
The accompanying notes are an integral part of these consolidated financial statements.
90
Table of Contents
WESTWAY GROUP, INC.
CONSOLIDATED STATEMENTS OF CASH FLOWS
(in thousands)
| Predecessor Combined Carve-Out Statements of Cash Flows |
||||||||||||
| November 1, 2008 through May 28, 2009(1) |
Years ended October 31, | |||||||||||
| 2008 | 2007 | |||||||||||
| Cash Flows From Operating Activities |
||||||||||||
| Net income |
$ | 13,383 | $ | 26,967 | $ | 17,562 | ||||||
| Adjustments to reconcile net income to net cash provided by operating activities: |
||||||||||||
| Depreciation |
8,564 | 15,258 | 15,077 | |||||||||
| Loss/(gain) on disposals of property, plant and equipment |
12 | (6,875 | ) | (4,184 | ) | |||||||
| Expense/(income) from investments |
135 | 174 | (67 | ) | ||||||||
| (Decrease)/increase in deferred tax assets/liabilities |
1,313 | 3,128 | (1,593 | ) | ||||||||
| Increase/(decrease) in minority interest |
5 | (131 | ) | (98 | ) | |||||||
| Share based compensation expense |
728 | 940 | 677 | |||||||||
| Changes in operating Assets and Liabilities: |
||||||||||||
| (Increase) decrease in accounts receivable |
10,512 | (9,691 | ) | 27 | ||||||||
| (Increase) decrease in inventory |
1,357 | (5,694 | ) | 986 | ||||||||
| Decrease (increase) in prepaid and other |
1,427 | (511 | ) | (175 | ) | |||||||
| Increase in income taxes recoverable |
528 | (528 | ) | — | ||||||||
| (Decrease) increase in accounts payable |
(609 | ) | 2,019 | (46 | ) | |||||||
| (Decrease) increase in accrued expenses |
(2,611 | ) | 4,753 | 1,593 | ||||||||
| Increase (decrease) in tax payable |
(4,809 | ) | (1,215 | ) | 562 | |||||||
| (Decrease) increase in other liabilities |
552 | (2 | ) | 18 | ||||||||
| Net cash provided by operating activities |
30,487 | 28,592 | 30,339 | |||||||||
| Cash flows from investing activities |
||||||||||||
| Capital expenditures in property, plant and equipment |
(31,944 | ) | (34,974 | ) | (28,934 | ) | ||||||
| Investments in joint ventures |
(397 | ) | (1,200 | ) | (162 | ) | ||||||
| Proceeds from disposals of property, plant and equipment |
999 | 13,353 | 6,993 | |||||||||
| Net cash used in investing activities |
(31,342 | ) | (22,821 | ) | (22,103 | ) | ||||||
| Cash flows from financing activities |
||||||||||||
| Change in ED&F Man Net Invested Capital |
855 | (5,771 | ) | (7,132 | ) | |||||||
| Distribution to/(from) ED&F Man |
— | (1,104 | ) | |||||||||
| Net cash used in investing activities |
$ | 855 | $ | (5,771 | ) | (8,236 | ) | |||||
| Net change in cash and cash equivalents |
||||||||||||
| Cash and cash equivalents at beginning of year |
— | — | — | |||||||||
| Cash and cash equivalents at end of year |
— | — | — | |||||||||
| (1) | Operations as predecessor ceased on May 28, 2009. |
The accompanying notes are an integral part of these consolidated financial statements.
91
Table of Contents
WESTWAY GROUP, INC.
NOTES TO CONSOLIDATED FINANCIAL STATEMENTS
Shermen WSC Acquisition Corp. (“Shermen”) was a special purpose acquisition company created on April 18, 2006 and was formed to acquire an operating business in the agriculture industry through a merger, capital stock exchange, asset acquisition, stock purchase, or other similar business combination. On November 25, 2008, Shermen entered into a transaction agreement with ED&F Man Holdings Limited (“ED&F Man”), its subsidiary Westway Holdings Corporation (“Holdings”) and certain other parties to acquire the worldwide bulk liquid storage and liquid feed supplements businesses previously owned by the ED&F Man group (the “acquired business” or “predecessor”). This business combination was consummated on May 28, 2009. On May 28, 2009, Shermen WSC Acquisition Corp. changed its name to Westway Group, Inc. We refer to Westway Group, Inc. (formerly Shermen WSC Acquisition Corp.), together with its wholly-owned subsidiaries, as the “Company” or “we” or “us”.
The consideration we paid in connection with the closing of the business combination consisted of approximately 12.6 million newly-issued shares of our Class B common stock (fair value of $63.1 million), approximately 30.9 million newly-issued shares of our Series A Convertible Preferred Stock (fair value of $177.3 million), including 12.2 million escrowed shares that are to be released from escrow only if the Company achieves certain earnings or share price targets, and $103.0 million in cash, plus certain post closing adjustments of $1.1 million which were settled in cash. If the targets are achieved and the shares are released from escrow, the Company estimates the aggregate value of the consideration to be $344.6 million.
To facilitate the consummation of the business combination, ED&F Man Treasury Management plc (“ED&F Man Treasury”), an affiliate of ED&F Man, indirect holder of 47.5% of common stock in the Company, provided us with a two-year, $100 million revolving credit facility maturing on May 27, 2011, and a $5 million working capital borrowing line that was scheduled to mature on January 8, 2010. Interest accrued on amounts borrowed under the facility and borrowing line at the London Interbank Offered Rate (“LIBOR”) plus 3.5%, and a commitment fee of 1.4% was payable on any undrawn, uncancelled portion of the facility. The credit facility agreement was replaced by a very similar agreement among the same parties in August 2009, which in turn was paid off and terminated the revolving credit facility in its entirety in November 2009 when the Company obtained a $175 million 3-year revolving credit facility from a syndicate of banks.
The Company is comprised of the bulk liquid storage and liquid feed supplements businesses acquired from the ED&F Man group, including the following operating subsidiaries and affiliates:
| Acquired Business |
Business Segment | |
| Westway Terminal Co. LLC |
Bulk liquid storage | |
| Westway Terminals Korea Ltd |
Bulk liquid storage | |
| Westway Terminals Esbjerg ApS |
Bulk liquid storage | |
| Westway Terminals Nederland B.V |
Bulk liquid storage | |
| Westway Terminals UK Ltd |
Bulk liquid storage | |
| Westway Terminals Hibernian Ltd |
Bulk liquid storage | |
| Westway Terminals Poland Sp. Zoo. |
Bulk liquid storage | |
| Westway Terminal & Feed Canada Inc. |
Bulk liquid storage/Liquid feed supplements | |
| Westway Feed Products, LLC |
Liquid feed supplements | |
| Sunnyside Feed LLC (51% owned) |
Liquid feed supplements | |
| Westway (Australia) PTY Ltd |
Liquid feed supplements | |
| Champion Liquid Feeds (50% owned associate) |
Liquid feed supplements |
92
Table of Contents
WESTWAY GROUP, INC.
NOTES TO CONSOLIDATED FINANCIAL STATEMENTS—(Continued)
The Company formed a wholly-owned subsidiary, Westway Terminal Cincinnati LLC, on September 29, 2009 to acquire the bulk liquid storage assets and property of Southside River-Rail Terminal, Inc. on October 15, 2009.
The consolidated financial statements include the consolidated results of operations and the consolidated assets and liabilities of the Company, including its wholly-owned and majority-owned subsidiaries. Pro forma consolidated financial information, reflecting the ownership of the acquired business as if it had been owned on the first day of the financial period presented, is presented in Note 4. The businesses acquired from the ED&F Man group are deemed to be a “predecessor” to the Company. As a result, the combined carve-out financial statements of the acquired business for operations prior to the acquisition are presented. Our results of operations and cash flows on a consolidated basis subsequent to the acquisition of the acquired business are not comparative to the combined carve-out financial statements of the acquired business results of operations and cash flows prior to such acquisition (“predecessor statements”) principally because the basis for the acquired assets and liabilities have been adjusted to fair value pursuant to U.S. GAAP in our financial statements and because the predecessor operations reported on a different calendar as disclosed in our definitive proxy statement filed on Schedule 14-A filed with the U.S. Securities and Exchange Commission on May 14, 2009.
The accompanying consolidated statements of operations, stockholders’ equity, comprehensive income, and cash flows for the twelve months ended December 31, 2009 include the activities of Shermen through May 28, 2009, and the 217 day operations of the acquired business from May 29, 2009 through December 31, 2009.
The accompanying consolidated financial statements have been prepared in accordance with U.S. generally accepted accounting principles (“U.S. GAAP”) and pursuant to the rules of the U.S. Securities and Exchange Commission (“SEC”). The information furnished herein reflects all adjustments which are, in the opinion of management, necessary for a fair statement of the results for the periods reported. With the exception of certain adjustments associated with the acquisition of the acquired business, all such adjustments are, in the opinion of management, of a normal recurring nature. The Company eliminated all significant intercompany accounts and transactions among our wholly owned subsidiaries.
In the 2008 annual report on Form 10-K, the Company disclosed that the lack of assurance that the Company would be able to successfully complete a business combination within the required time frame raised substantial doubt about the Company’s ability to continue as a going concern. With the completion of the business combination and release of the funds held in trust, there is no longer substantial doubt about the Company’s ability to continue as a going concern.
Predecessor Combined Carve-out Accounting
The predecessor combined carve-out financial statements have been prepared in conformity with U.S. GAAP. The predecessor combined carve-out financial statements may not necessarily reflect the results of operations, financial position and cash flows if the predecessor had actually existed on a stand-alone basis during the periods presented and these combined carve-out financial statements may not be indicative of future performance.
Transactions between the predecessor and ED&F Man and its affiliates are herein referred to as related party transactions. The ED&F Man net invested capital in these combined carve-out financial statements constitutes ED&F Man’s investment in the predecessor and represents the excess of total assets over total liabilities. Net
93
Table of Contents
WESTWAY GROUP, INC.
NOTES TO CONSOLIDATED FINANCIAL STATEMENTS—(Continued)
invested capital includes the effects of carve-out allocations from ED&F Man and the funding of the predecessor through the in-house banking, cash pooling arrangements and related party transactions to and from related parties with ED&F Man, and the predecessor’s cumulative net income, including other comprehensive income directly recognized in net invested capital. All significant intercompany balances and transactions between the entities combined herein have been eliminated.
The predecessor combined carve-out financial statements include the predecessor’s direct expenses as well as allocations of expenses arising from shared services and infrastructure provided by ED&F Man. These expenses primarily relate to employee compensation and benefits, office facilities and services arising from the provision of corporate functions including tax, legal and compliance, risk management, finance, internal audit, and executive management. These expenses are allocated using estimates that management considers to be a reasonable reflection of the utilization of services provided to, or benefits received by the predecessor. The method and basis of allocations used in preparing these combined carve-out financial statements are described below. Costs included in the combined carve-out financial statements for such services provided to the predecessor are included in selling, general and administrative expenses in the accompanying combined carve-out statements of income.
In preparing these predecessor combined carve-out financial statements, cost items and balance sheet items that have been identified as related to the predecessor operations have been carved out and allocated to the predecessor in full. Those items that are not subject to a direct relationship have been allocated directly or on a proportional basis using revenue or number of employees as is most appropriate. Costs related to shared services and corporate services, such as tax, legal and compliance, risk management, finance, internal audit, and executive management have been allocated to the predecessor on a proportional basis using a basis of allocation that would be expected to reasonably reflect the proportion of the predecessor’s incurrence of such costs. Management believes that the allocation methods described above provide a reasonable allocation of costs. However, these costs may not be representative of the costs necessary for the predecessor to operate as a stand-alone entity and management is unable to estimate what such stand-alone costs would have been during the periods presented.
The predecessor combined carve-out financial statements do not include an allocation of ED&F Man’s debt, interest, deferred financing costs, and other financing related costs because none of these items were specifically identified as trade receivables, trade payables, and corporate advances to or borrowings from ED&F Man. Transactions other than those specifically identified as corporate advances to or borrowings from ED&F Man have been accounted for using the invested equity method (“invested capital”) approach. Income taxes, where applicable, have been accounted for in these combined carve-out financial statements as if the predecessor were a separate taxable entity.
3. SUMMARY OF SIGNIFICANT ACCOUNTING POLICIES
Basis of Consolidation
The consolidated financial statements include the accounts of Westway Group, Inc. and its wholly-owned and majority-owned subsidiaries. All intercompany transactions have been eliminated in consolidation. Investments in which the Company has a 20% to 50% voting interest and where the Company exercises significant influence over the investee are accounted for using the equity method.
Use of Estimates
The preparation of the financial statements in conformity with U.S. GAAP requires management to make estimates and assumptions that affect the reported amounts of assets and liabilities and disclosure of contingent
94
Table of Contents
WESTWAY GROUP, INC.
NOTES TO CONSOLIDATED FINANCIAL STATEMENTS—(Continued)
assets and liabilities at the date of the financial statements and the reported amounts of revenue and expenses during the reporting period. Actual results could differ from those estimates. Significant estimates include allowances for doubtful accounts, useful lives for depreciation and amortization, purchase price accounting valuations of the acquired business, asset impairments, valuation of goodwill, deferred taxes and tax contingency reserves, and other contingent liabilities.
Revenue Recognition
The Company recognizes revenue in accordance with SEC Staff Accounting Bulletin No. 104, “Revenue Recognition”, and U.S. GAAP, at prices fixed by contract or purchase orders and upon delivery of the service or product to the customer.
The Company generates revenue through contracts from its bulk liquid storage business by providing three primary types of services: fixed income, volume or throughput income, and income from ancillary services. Fixed income services generate revenue from storage services at each of the Company’s terminals and are based on a fixed fee per month for tank rental, input/output from storage tanks, or combination of both. The Company recognizes revenue from fixed income contracts in the period the service is rendered. Volume services generate revenue based on the volume of liquid entering or exiting at each terminal location and is based on tonnage. The Company recognizes revenue for volume services as the volumes are entered into or withdrawn from its storage facilities. Ancillary income services generate revenue from customer-specific storage requirements including energy, overtime, and other infrastructure costs. Revenue relating to ancillary income services is recognized based on terms stipulated in the customer contract and are recorded at the time the service is provided. Provisions for ancillary services may be included in fixed price storage services or in volume or throughput income services. Revenue is recorded for the services available under each contract as the services are provided.
The Company generates revenue from its liquid feed supplements business through sales of liquid and dry animal feed supplements. Revenue is recognized upon delivery.
Revenue is recorded net of any discounts, volume rebates, and sales taxes. Shipping and handling costs are included within cost of sales in the statements of operations.
The Company provides for sales returns and allowances, as a reduction of revenue, at the time of shipment and makes estimates of these amounts based on historical experience.
Cash and Cash Equivalents
Cash and cash equivalents consist of all highly liquid investments in third party money market funds, deposits, and investments available for current use with an initial maturity of three months or less.
Investments
Investments in which the Company retains a 20% to 50% voting interest and exercises significant influence over the investee are accounted for using the equity method. The Company has evaluated its relationships with investees and has determined that these entities are not variable interest entities and therefore are not required to be consolidated in the financial statements. Accordingly, the Company’s proportional share of the respective investments earnings or losses is included in the caption “equity in earnings (loss) of unconsolidated subsidiary” in its statements of operations. The Company evaluates its investments for potential impairment indicators on an ongoing basis. This evaluation requires the exercise of judgment based upon the specific facts and circumstances of each investment. If impairment indicators exist, the Company will evaluate whether the impairment is other-than-temporary.
95
Table of Contents
WESTWAY GROUP, INC.
NOTES TO CONSOLIDATED FINANCIAL STATEMENTS—(Continued)
Accounts Receivable
The Company maintains an allowance for estimated potential credit losses on accounts receivable. Management reviews the composition of accounts receivable and analyzes historical bad debts, customer concentrations, customer credit worthiness, current economic trends, and changes in customer payment patterns to evaluate the adequacy of the allowance. Losses on accounts receivable are charged against the allowance when, in management’s judgment, further collection efforts would not result in a reasonable likelihood of collection. Consistent with industry practices, we generally require payment from our customers within 30 days. As of December 31, 2009, our allowance for doubtful accounts was $255,000.
Inventories
Inventories, principally raw materials which includes molasses and other supplements held for use and sale in the liquid feed supplements business, are stated at the lower of cost (weighted average) or market value. As inventory is usually not blended until ordered by the customer, work-in-progress and finished goods are generally not significant. Management compares the cost of inventories, as determined by the weighted average cost method, with the market value, and any allowance determined appropriate is made by writing down the inventories to their market value, if lower than cost. Costs include those costs incurred in bringing the inventories to their present location and condition.
Property, Plant & Equipment
Property, plant and equipment are stated at cost. Expenditures on maintenance and repairs are charged to earnings as incurred; additions, renewals and improvements are capitalized. When property, plant and equipment is retired or otherwise disposed of, the related cost and accumulated depreciation are removed from the respective accounts, and any gain or loss is included as a component of non-operating income. Estimated useful lives are periodically reviewed and, when warranted, are updated. Land is not depreciated. Assets under construction are not depreciated until the facility is fully commissioned and it is the Company’s policy to capitalize interest cost incurred on debt during the construction of major projects. Depreciation of property, plant and equipment is disclosed within total operating expenses using the straight-line method for all assets with estimated lives as follows:
| Buildings |
20-50 years | |
| Leasehold improvements |
Shorter of the asset’s estimated useful life, the length of the lease or 15 years | |
| Equipment, including tanks, and vehicles |
3 to 39 years |
Asset Retirement Obligations
Asset retirement obligations are legal obligations associated with the retirement of long-lived assets that result from the acquisition, construction, development or normal use of the asset. U.S. GAAP requires that the fair value of a liability related to the retirement of long-lived assets be recorded at the time a legal obligation is incurred. Once an asset retirement obligation is identified and a liability is recorded, a corresponding asset is recorded, which is depreciated over the remaining useful life of the asset. After the initial measurement, the liability is adjusted to reflect changes in the asset retirement obligation’s fair value. If and when it is determined that a legal obligation has been incurred, the fair value of any liability is determined based on estimates and assumptions related to retirement costs, future inflation rates and interest rates. The Company has asset retirement obligations with respect to certain of our assets due to various legal obligations to clean and/or dispose of those assets at the time they are retired. However, these assets can be used for extended and indeterminate
96
Table of Contents
WESTWAY GROUP, INC.
NOTES TO CONSOLIDATED FINANCIAL STATEMENTS—(Continued)
periods of time as long as they are properly maintained and/or upgraded. It is the Company’s practice and current intent to maintain such assets and continue making improvements to the assets based on technological advances. As a result, the Company believes that these assets have indeterminate lives for purposes of estimating asset retirement obligations, because dates or ranges of dates upon which the Company would retire these assets cannot reasonably be estimated at this time. Accordingly, the Company has not recorded an asset retirement obligation, or corresponding asset, because the future dismantlement and removal dates of long-lived assets, and the amount of any associated costs, are indeterminable. When a date or range of dates can reasonably be estimated for the retirement of any asset, the Company estimates the cost of performing the retirement activities and records a liability for the fair value of that cost using established present value techniques.
Goodwill
The Company has preliminarily recorded goodwill as a result of the acquisition of the bulk liquid storage and liquid feed supplements businesses in May 2009, as well as the acquisition of Southside River-Rail Inc in October 2009. U.S. GAAP requires that the excess of purchase price over the fair value of assets acquired, net of liabilities assumed, be recorded as goodwill.
Intangible Assets
The Company has preliminarily recorded an intangible asset for its liquid feed supplement business tradename. The Company has determined that the tradename is an indefinite lived asset. All indefinite-lived intangible assets are subject to impairment testing at least annually, unless events occur or circumstances change between annual tests that would more likely than not reduce the indefinite-lived intangible asset’s fair value below its carrying value. For additional discussion of intangible assets, see Note 4.
Impairment of Long-Lived Assets, Goodwill, and Other Intangible Assets
Long-Lived Assets
Long-lived assets are reviewed for impairment whenever events or changes in circumstances indicate that their carrying amount may not be recoverable in accordance with U.S. GAAP. An impairment loss would be determined when estimated undiscounted future pre-tax cash flows from the use of the asset or group of assets are less than its carrying amount. In estimating future undiscounted cash flows, the Company uses historical cash flows, the expected growth rate of revenue and expenses, the expected effect of capital expenditures, and the estimated remaining useful life of the asset, holding periods, and future market and economic conditions. Measurement of an impairment loss is based on the excess of the carrying amount of the asset or group of assets over the long-lived asset fair value.
Goodwill and Other Intangible Assets
The Company conducts impairment tests on goodwill and other indefinite lived intangible assets annually or more frequently if impairment indicators exist. Impairment tests for goodwill include comparing the fair value of the respective reporting units, which the Company has preliminarily identified as the two operating segments, with their carrying amount, including goodwill. Goodwill is evaluated using a two-step impairment test at the reporting unit level. The first step compares the carrying amount of a reporting unit, including goodwill, with its fair value. If the carrying amount of a reporting unit exceeds its fair value, a second step is completed to determine the amount of goodwill impairment loss to record. In the second step, an implied fair value of the reporting unit’s goodwill is determined by allocating the fair value of the reporting unit to all of the assets and liabilities other than goodwill. The amount of impairment loss is equal to the excess of the carrying amount of the goodwill over the implied fair value of that goodwill.
97
Table of Contents
WESTWAY GROUP, INC.
NOTES TO CONSOLIDATED FINANCIAL STATEMENTS—(Continued)
Business Combinations
The Company accounts for business combinations under the provisions of U.S. GAAP that provide companies with the principles and requirements on how an acquirer recognizes and measures in its financial statements the identifiable assets acquired, liabilities assumed, and any noncontrolling interest in the acquiree, as well as the recognition and measurement of goodwill acquired in a business combination. U.S. GAAP also requires certain disclosures to enable users of the financial statements to evaluate the nature and financial effects of a business combination. Acquisition costs associated with a business combination will generally be expensed as incurred.
Our acquisitions of business resulting in our control are accounted for under the purchase method of accounting. The amounts assigned to the identifiable assets acquired and liabilities assumed in connection with acquisitions are based on estimated fair values as of the date of the acquisition, with the remainder, if any, recorded as goodwill. The fair values are determined by our management, taking into consideration information supplied by the management of the acquired business and other relevant information. Such information includes valuations supplied by independent appraisals for significant business combinations. The determination of fair value requires significant judgment by management. In accordance with generally accepted accounting principles, the final allocation is expected to be made within one year of the acquisition.
Fair Value Measurements
U.S. GAAP establishes a framework for measuring fair value and mandates disclosures about fair value measurements. U.S. GAAP defines fair value as the price that would be received to sell an asset or paid to transfer a liability in an orderly transaction between market participants. A fair value measurement assumes that the transaction to sell the asset or transfer the liability occurs in the principal market for the asset or liability or, in the absence of a principal market, the most advantageous market for the asset or liability. Under U.S. GAAP, the price in the principal (or most advantageous) market used to measure the fair value of the asset or liability is not adjusted for transaction costs. An orderly transaction is a transaction that assumes exposure to the market for a period prior to the measurement date to allow for marketing activities that are usual and customary for transactions involving such assets and liabilities; it is not a forced transaction. Market participants are buyers and sellers in the principal market that are (i) independent, (ii) knowledgeable, and (iii) able and willing to complete a transaction.
U.S. GAAP requires the use of valuation techniques that are consistent with one or more of the market approach, the income approach, or the cost approach. The market approach uses prices and other relevant information generated by market transactions involving identical or comparable assets and liabilities. The income approach uses valuation techniques to convert future amounts, such as cash flows or earnings, to a single present value on a discounted basis. The cost approach is based on the amount that currently would be required to replace the service capacity of an asset (replacement cost). Valuation techniques should be consistently applied. Inputs to valuation techniques refer to the assumptions that market participants would use in pricing the asset or liability. Inputs may be observable, meaning those that reflect the assumptions market participants would use in pricing the asset or liability developed based on market data obtained from independent sources, or unobservable, meaning those that reflect the reporting entity’s own assumptions about the assumptions market participants would use in pricing the asset or liability developed based on the best information available in the circumstances. In that regard, U.S. GAAP establishes a fair value hierarchy for valuation inputs that gives the highest priority to quoted prices in active markets for identical assets or liabilities and the lowest priority to unobservable inputs. The fair value hierarchy is as follows:
Level 1 Inputs—Unadjusted quoted prices in active markets for identical assets or liabilities that the reporting entity has the ability to access at the measurement date.
98
Table of Contents
WESTWAY GROUP, INC.
NOTES TO CONSOLIDATED FINANCIAL STATEMENTS—(Continued)
Level 2 Inputs—Inputs other than quoted prices included in Level 1 that are observable for the asset or liability, either directly or indirectly. These might include quoted prices for similar assets or liabilities in active markets, quoted prices for identical or similar assets or liabilities in markets that are not active, inputs other than quoted prices that are observable for the asset or liability (including interest rates, volatilities, prepayment speeds, credit risks) or inputs that are derived principally from or corroborated by market data by correlation or other means.
Level 3 Inputs—Unobservable inputs for determining the fair values of assets or liabilities that reflect an entity’s own assumptions about the assumptions that market participants would use in pricing the assets or liabilities.
These fair value principles of U.S. GAAP are utilized in the accounting for the acquired business.
Discontinued Operations
Discontinued operations are reported when a component comprising operations and cash flows that can be clearly distinguished from the rest of the Company, has been disposed of or is classified as held for sale, operationally and for financial reporting purposes, and when both of the following criteria are met (1) the operations and cash flows of the component will be (or have been) eliminated from the ongoing operations of the Company as a result of the disposal transaction and (2) we will not have any significant continuing involvement in the operations of the component after the disposal transaction.
There have been no instances of discontinued operations during the periods covered in these consolidated statements, except for pro forma disclosure in Note 4.
Fair Value of Financial Instruments
The Company measures the fair value of financial instruments in accordance with U.S. GAAP. The carrying value of cash, accounts receivable, accounts payable, and accrued liabilities approximates their fair values because of their short term to maturity. The fair value of the Company’s other liabilities, recalculated at current interest rates, approximates their carrying value.
Pension and Other Benefit Plans
The Company accounts for the cost of its defined contribution plans on an accrual basis in accordance with U.S. GAAP. The cost to the Company under defined contribution plans for the year ended December 31, 2009 was $1.2 million. No costs were recorded for year ended December 31, 2008.
Historically, employees of the businesses acquired from ED&F Man group participated in an ED&F Man group defined benefit pension plan for all U.S. domiciled employees of the ED&F Man group. This plan was frozen to new members and further accrual of benefits from July 1, 2005 onwards. On completion of the business combination on May 28, 2009, both past and future liabilities arising under this defined benefit scheme remained the responsibility of the ED&F Man group.
The Company currently does not have a share-based employee compensation plan.
99
Table of Contents
WESTWAY GROUP, INC.
NOTES TO CONSOLIDATED FINANCIAL STATEMENTS—(Continued)
Predecessor Equity Compensation
Employees of the predecessor participated in ED&F Man’s share-based employee compensation plans, the financial effect of which is described in Note 18. The predecessor recognized compensation expense related to these plans in accordance with ASC 718 Compensation—Stock Compensation (“ASC 718”), formerly SFAS No. 123 (revised 2004), “Share-Based Payment” (“SFAS 123(R)”). The compensation expense for share-based awards is based on awards that are expected to vest and is reduced for estimated forfeitures. The predecessor did not grant stock options with market or performance conditions.
As prescribed by ASC 718, the predecessor used the estimated fair value of the underlying stock to value stock awards with an exercise price of zero (stock award plans) and uses the Black Scholes model to value other share-based compensation plans.
The predecessor recorded compensation expense related to share-based employee compensation plans of $940,000 and $678,000 for the years ended October 31, 2008, and 2007, respectively, which is included in “selling, general and administrative expenses”.
Income taxes
U.S. GAAP requires an asset and liability approach to financial accounting and reporting for income taxes. Deferred income tax assets and liabilities are computed for differences between the financial statement and tax bases of assets and liabilities that will result in future taxable or deductible amounts, based on enacted tax laws and rates applicable to the periods in which the differences are expected to affect taxable income. Valuation allowances are established, when necessary, to reduce deferred tax assets to the amount expected to be realized. The Company considers many factors when assessing the likelihood of future realization including its recent cumulative earnings experience by taxing jurisdiction, expectations of future taxable income, the carryforward periods available for tax reporting purposes and other relevant factors.
The Company complies with the provisions of U.S. GAAP that prescribes a recognition threshold and a measurement attribute for the financial statement recognition and measurement of tax positions taken or expected to be taken in a tax return. For those benefits to be recognized, a tax position must be more-likely-than-not to be sustained upon examination by taxing authorities. There were no unrecognized tax benefits as of December 31, 2009 and 2008. The Company recognizes accrued interest and penalties related to unrecognized tax benefits as income tax expense. No amounts were accrued for the payment of interest and penalties at December 31, 2009 and 2008. Management is currently unaware of any issues under review that could result in significant payments, accruals or material deviation from its position.
Foreign Currency Translation and Transactions
The consolidated financial statements of the Company have been prepared in U.S. dollars (“dollars”), as the dollar is the Company’s reporting currency. Since the Company’s operations are funded in U.S. dollars and a substantial portion of its costs is incurred in U.S. dollars, management believes that the dollar is the primary currency of the economic environment in which the Company operates.
In accordance with U.S. GAAP, the assets, liabilities and results of operations of certain Company foreign subsidiaries are measured using their functional currency which is the currency of the foreign economic environment in which they operate. Upon consolidating these subsidiaries with the Company, their assets and liabilities are translated to U.S. dollars at currency exchange rates as of the balance sheet date, revenue and expenses are translated at the weighted average currency exchange rate for the applicable reporting period, and
100
Table of Contents
WESTWAY GROUP, INC.
NOTES TO CONSOLIDATED FINANCIAL STATEMENTS—(Continued)
stockholder’s equity accounts at historical exchange rates during the applicable reporting periods. Translation adjustments resulting from the process of translating these subsidiaries’ financial statements are reported in other comprehensive income (loss) in the statements of stockholders’ equity. Upon disposal or liquidation of a foreign subsidiary, these cumulative translation adjustments are recognized as income or expense.
Certain Company subsidiaries enter into transactions denominated in currencies other than their functional currency. Changes in currency exchange rates between the subsidiary’s functional currency and the currency in which a transaction is denominated are recognized in the statement of operations in the period in which the currency rates change.
Comprehensive Income
U.S. GAAP requires that comprehensive income, which is the total of net income and all other non-owner changes in capital, be displayed in the financial statements. The components of the Company’s comprehensive income as presented in the financial statements of stockholders’ equity include net income and unrealized gains and losses from foreign currency translation.
Segment Reporting
U.S. GAAP requires a company to report financial and descriptive information about its specified operating segments. Operating segments are components of an enterprise for which separate financial information is available and is evaluated regularly by the chief operating decision maker in deciding how to allocate resources and in assessing performance. The Company has determined that it has two reportable operating segments—Bulk Liquid Storage and Liquid Feed Supplements, and one non-operating segment—Corporate. The Company does not allocate corporate administrative and general expenses, interest income, or interest expense to the two operating segments.
Commitments and Contingencies
The Company leases land, office space, and equipment under non-cancelable operating leases with various expiration dates. The Company is responsible for maintenance costs and property taxes on certain of the operating leases. The Company has not entered into any capital leases as defined by U.S. GAAP.
Earnings (loss) per share
The Company complies with the accounting and disclosure provision of U.S. GAAP that requires dual presentation of basic and diluted income (loss) per common share for all periods presented and uses the treasury stock method to calculate diluted earnings per share. Basic income per share excludes dilution and is computed by dividing net income (loss) applicable to common stockholders by the weighted average number of common shares and, when dilutive, participating preferred shares outstanding for the period. Diluted income per share reflects the potential dilution that could occur if securities or other contracts to issue common stock were exercised or converted into common stock or resulted in the issuance of common stock that then share in the income of the Company. The difference between the number of shares used to compute basic income per share and diluted income per share relates to additional incremental shares to be issued upon the assumed exercise of stock warrants and options to purchase stock units, net of shares hypothetically repurchased at the average market price with the proceeds of exercise. The Series A Convertible Preferred Stock is a participating security; therefore net income is allocated to both common stock and Series A Convertible Preferred Stock based on the ratio of number of shares, if converted, to the total number of shares.
101
Table of Contents
WESTWAY GROUP, INC.
NOTES TO CONSOLIDATED FINANCIAL STATEMENTS—(Continued)
The Company’s statement of operations for 2008 includes a presentation of earnings per share for common stock subject to possible redemption in a manner similar to the two-class method of earnings per share. Basic and diluted net loss per share amounts for the maximum number of shares subject to possible conversion are calculated by dividing the net interest attributable to common shares subject to redemption by the weighted average number of common shares subject to possible redemption. Basic and diluted net loss per share amounts for the common shares outstanding not subject to possible redemption are calculated by dividing the net loss (exclusive of the net interest income attributable to common shares subject to redemption) by the weighted average number of common shares (not subject to possible redemption).
Concentration of credit risk
The Company is exposed to concentrations of credit risk associated with its cash and cash equivalents. The Company minimizes its credit risk relating to these positions by primarily conducting business with large, well-established financial institutions. The Company has not experienced losses on these accounts, and management believes the Company is not exposed to significant risks on such accounts.
The Company is also exposed to concentrations of credit risk relating to its receivables due from customers in the bulk liquid storage and liquid feed supplement industries. The Company does not generally require collateral or other security to support its outstanding receivables. The Company minimizes its credit risk relating to receivables by performing ongoing credit evaluations and, to date, credit losses have not been material. The Company provides storage of liquid products to the ED&F Man group, an affiliated customer that accounted for 18.9% of total bulk liquid storage revenue for the year ended December 31, 2009. At December 31, 2009, 11.6% of the Company’s accounts receivables were due from the ED&F Man group. See Related-Party Transactions (Note 5) for further discussions of affiliate transactions.
Subsequent Events
In accordance with U.S. GAAP, the Company evaluates events or transactions that occur during the period after the balance sheet date for potential recognition or disclosure in the financial statements.
Predecessor Restatement
In March 2009, the Company determined there was a reclassification error in the previously issued predecessor combined carve-out financial statements whereby operating costs from one of the combined operating entities were erroneously included in costs of sales for the year ended October 31, 2008 and erroneously excluded from selling, general and administrative expenses. The combined carve-out financial statements for the year ended October 31, 2008 were restated to reflect this reclassification and reduce cost of sales by $6.0 million and increase selling, general and administrative expenses by a corresponding amount to reflect the reclassification of the operating costs. The restatement resulted in no change to operating income or net income. Furthermore, as a result of the change, the segment information included in Note 17 has been adjusted as well. The Company also restated the segments disclosures in Note 17 for the year ended October 31, 2007 due to a typographical error in the information included therein which resulted in allocating revenue within the liquid supplements segment from USA to Rest of World in the amount of $6.1 million with corresponding changes to various subtotals based on the correction of the revenue figures.
102
Table of Contents
WESTWAY GROUP, INC.
NOTES TO CONSOLIDATED FINANCIAL STATEMENTS—(Continued)
Recent Accounting Developments
In February 2010, the FASB amended a previously issued accounting standard to require all companies that file financial statements with the SEC to evaluate subsequent events through the date the financial statements are issued. The standard was further amended to exempt these companies from the requirement to disclose the date through which subsequent events have been evaluated. This amendment is effective for us for interim and annual periods ending after June 15, 2010. Because this new standard only requires additional disclosures, its adoption will have no effect on our consolidated financial position, results of operations, or cash flow.
Bulk Liquid Storage and Liquid Feed Supplements Businesses
On November 25, 2008, the Company entered into a transaction agreement, as amended and restated as of May 1, 2009 (as so amended and restated, the “Transaction Agreement”), with ED&F Man Holdings Limited (“ED&F Man”), its subsidiary Westway Holdings Corporation (“Holdings”) and certain other parties. Pursuant to the Transaction Agreement, the Company acquired the bulk liquid storage and liquid feed supplements businesses of the ED&F Man group in exchange for shares of the Company’s common and preferred stock and cash (the “business combination”).
The business combination was consummated on May 28, 2009. The material terms of the Transaction Agreement, as well as a description of the business combination, have been previously disclosed in the Company’s definitive proxy statement on Schedule 14A filed with the Securities and Exchange Commission (“SEC”) on May 14, 2009 (the “Proxy Statement”) in the sections entitled “Proposal No. 1. The Transaction Agreement Proposal” beginning on page 55, “Background of the Business Combination” beginning on page 178, “Factors Considered in Approving the Business Combination” beginning on page 184, and “The Transaction Agreement” beginning on page 199. The acquisition was recorded in accordance with U.S. GAAP and the Company was identified as the accounting acquirer. The allocation of the purchase price to the fair values of the acquired assets and liabilities is outlined below, with the Company preliminarily recording the acquisition-date fair values on the following major classes of consideration:
| (in thousands) | ||||
| Cash |
$ | 103,000 | ||
| Company common stock |
63,120 | |||
| Company preferred stock |
107,367 | |||
| Contingent consideration |
69,924 | |||
| Working capital and other adjustments |
1,148 | |||
| Total allocable purchase price |
$ | 344,559 | ||
| Accounts receivable |
38,243 | |||
| Inventories |
20,197 | |||
| Prepaid expenses and other current assets |
1,671 | |||
| Goodwill |
87,870 | |||
| Tradename |
5,900 | |||
| Property, plant & equipment |
290,439 | |||
| Other non current assets |
8,726 | |||
| Current liabilities |
(41,425 | ) | ||
| Long term liabilities |
(67,062 | ) | ||
| Total preliminary purchase price allocation |
$ | 344,559 | ||
103
Table of Contents
WESTWAY GROUP, INC.
NOTES TO CONSOLIDATED FINANCIAL STATEMENTS—(Continued)
At the closing of the business combination, the following consideration was paid by the Company:
Cash—$103.0 million in cash was paid to ED&F Man, including a short term promissory note in the aggregate principal amount of $2.7 million that was used in lieu of cash as consideration in respect of ED&F Man Korea Limited.
Common Stock—12.6 million shares of the Company’s newly issued class B common stock, par value $.0001 per share, were issued to ED&F Man as consideration. The stock was valued at $5.00 per share, which was based on the closing price of a share of the Company’s common stock on the OTC market on April 7, 2009 of $6.00 less a $1.00 special dividend per share to be paid to public shareholders shortly after the closing of the business combination. The fair value of this consideration totaled $63.1 million.
Preferred Stock—18.7 million shares of the Company’s newly issued Series A Convertible Preferred Stock at a fair value per share of $5.74, totaling $107.4 million. The fair value has been calculated using a market approach for the fair value of the preferred stock and an income approach to determine the fair value of the future dividends.
Contingent consideration—As contingent consideration, 12.2 million shares of deferred Series A Convertible Preferred Stock at a fair value per share of $5.74, totaling $69.9 million were placed into escrow and will be released to ED&F Man upon the achievement of certain earnings and share price targets. The fair value has been calculated using a market approach for the fair value of the preferred stock and an income approach to determine the fair value of the future dividends.
Working capital and other adjustments—The consideration payable to ED&F Man was subject to post-closing adjustments relating to targeted amounts for net indebtedness and net working capital. The net effect of these adjustments was $1.1 million. Working capital also included approximately $10 million of accounts receivable related to the sale of the Canadian fish oil and molasses trading businesses that were transferred to the ED&F Man group prior to May 28, 2009.
The purchase price allocation is preliminary. The preliminary estimates of fair values recorded at December 31, 2009 are Level 3 inputs determined by management based on various market, cost, and income analyses and recent asset appraisals. The final determination of the purchase price allocation will be based on the fair values of assets acquired and liabilities assumed. The purchase price allocation will remain preliminary until the Company completes a third-party valuation and determines the fair values of assets acquired and liabilities assumed, determines actual transaction costs, and finalizes working capital adjustments. The final amounts allocated to assets acquired and liabilities assumed could differ significantly from the preliminarily recorded amounts. During the fourth quarter of 2009, the Company decreased goodwill by $3.9 million primarily due to upward adjustments to the preliminarily recorded fair value of property, plant, and equipment acquired. The Company has assigned useful lives to the property, plant, and equipment acquired in the business combination in accordance with U.S. GAAP.
Goodwill
The preliminary allocation of the purchase price includes $87.9 million of asset valuation attributable to goodwill. Goodwill represents the amount by which the total purchase price exceeds the aggregate fair values of the assets acquired and liabilities assumed in the business combination, other than goodwill. Goodwill was not deductible for tax purposes. The Company tested goodwill created in the bulk liquid storage and liquid feed supplement acquisition for impairment on October 1, 2009. The reporting unit for the impairment test was Westway Group Inc, as goodwill has not been allocated to reporting units as the valuation is still preliminary. The result of the assessment resulted in no indicators of impairment. Moreover, no significant events occurred or
104
Table of Contents
WESTWAY GROUP, INC.
NOTES TO CONSOLIDATED FINANCIAL STATEMENTS—(Continued)
major circumstances changed relating to the acquired business since the business combination, including adverse changes in the key assumptions or variables that contradict the preliminary valuation. As a result, we did not recognize any impairment charges during the year ended December 31, 2009.
Tradename
The Company has preliminarily recorded an intangible asset of $5.9 million for its liquid feed supplement business tradename. The Company has determined that the tradename is an indefinite lived asset which is subject to impairment testing at least annually. A fair value analysis was performed relating to the May 28, 2009 business combination and no significant changes were identified by the Company since then that would suggest any changes in the fair value of the preliminary tradename value assigned.
Property, Plant, and Equipment
The Company has preliminarily allocated $290.4 million for the fair value of property, plant, and equipment based on preliminary valuations performed by management using current prices at which comparable assets are purchased under similar circumstances (market approach) and an estimate of the current cost to purchase or replace the assets (cost approach).
Investments
The Company has preliminarily allocated $5.0 million for the fair value of investments, including a 50:50 dry feed distributor joint venture in Australia and an investment in a 49:51 liquid feed supplements joint venture in Mandan, North Dakota. The valuations are based on preliminary valuations performed by management using future cash flow projections for the investments, discounted to present value (income approach), and the price at which comparable investments are purchased under similar circumstances (market approach).
Working Capital
The Company has preliminarily allocated $18.7 million for the fair value of working capital. No material adjustments were identified between the working capital carrying value and fair value based on preliminary valuations.
Pro Forma Results
The following are pro forma unaudited consolidated statements of operations for the Company for the twelve months ended December 31, 2009 and 2008 assuming the acquisition of the acquired business occurred on January 1, 2009 and 2008, respectively.
105
Table of Contents
WESTWAY GROUP, INC.
PRO FORMA CONSOLIDATED STATEMENTS OF OPERATIONS
(in thousands, except per share amounts)
(unaudited)
| December 31, | ||||||||
| 2009 | 2008 | |||||||
| (Pro Forma) | (Pro Forma) | |||||||
| Net revenue |
||||||||
| Bulk liquid storage |
$ | 59,853 | $ | 57,962 | ||||
| Liquid feed supplements |
255,346 | 298,337 | ||||||
| Related parties—ED&F Man |
14,232 | 15,050 | ||||||
| Total net revenue |
329,431 | 371,349 | ||||||
| Cost of sales—liquid feed supplements |
206,738 | 247,096 | ||||||
| Other operating costs and expenses |
52,388 | 53,057 | ||||||
| Depreciation |
16,207 | 14,190 | ||||||
| Selling, general and administrative expenses |
29,998 | 31,302 | ||||||
| Total operating expenses |
305,331 | 345,645 | ||||||
| Operating income |
24,100 | 25,704 | ||||||
| Other expenses |
||||||||
| Interest, net |
(2,688 | ) | (2,383 | ) | ||||
| Loss on disposal of property, plant, and equipment |
(67 | ) | (102 | ) | ||||
| Total other expenses |
(2,755 | ) | (2,485 | ) | ||||
| Income before income tax provision and equity in earnings of unconsolidated subsidiary |
21,345 | 23,219 | ||||||
| Income tax provision |
(7,137 | ) | (7,390 | ) | ||||
| Equity in earnings of unconsolidated subsidiary |
(118 | ) | (156 | ) | ||||
| Income from continuing operations |
14,090 | 15,673 | ||||||
| Net income from discontinued operations, net of tax(1) |
— | 1,063 | ||||||
| Net income |
14,090 | 16,736 | ||||||
| Net loss attributable to non-controlling interest |
73 | 80 | ||||||
| Net income attributable to Westway Group, Inc. |
$ | 14,163 | $ | 16,816 | ||||
| Preferred dividends |
(4,250 | ) | (4,250 | ) | ||||
| Net income applicable to common stockholders |
$ | 9,913 | $ | 12,566 | ||||
| Weighted average number of common shares equivalent outstanding: |
||||||||
| Basic(2) |
57,422,816 | 57,409,866 | ||||||
| Diluted(3) |
57,422,816 | 57,409,866 | ||||||
| Earnings per share of common stock: |
||||||||
| Basic |
$ | 0.17 | $ | 0.22 | ||||
| Diluted |
$ | 0.17 | $ | 0.22 | ||||
| Basic and diluted earnings per share attributable to Series A convertible preferred stock |
$ | 0.17 | $ | 0.22 | ||||
| Basic and diluted earnings per share attributable to common shares |
$ | 0.17 | $ | 0.22 | ||||
| Series A convertible preferred stock weighted average shares outstanding, basic and diluted(2) |
30,886,830 | 30,886,830 | ||||||
| Common share weighted average shares outstanding, basic and diluted |
26,535,986 | 26,523,036 | ||||||
| (1) | In 2008, the Company exited the San Pedro, CA facility. This operation was reported in the bulk liquid storage segment in previous periods. Financial information for the 2008 periods presented above has been restated to remove the effects of this operation to reflect the reclassification from continuing to discontinued operations. |
| (2) | As the Series A convertible preferred stock is considered a participating security, we have included these shares within the basic computation of EPS under the two-class method. |
| (3) | As the warrants were issued with exercise prices ranging from $5.00 to $6.25, they have not been included for pro forma results of operations since the average market price of our Class A common stock is below this range. |
106
Table of Contents
WESTWAY GROUP, INC.
NOTES TO CONSOLIDATED FINANCIAL STATEMENTS—(Continued)
The Company derived the unaudited pro forma results of operations from (1) the unaudited consolidated financial statements of the acquired business from January 1, 2008 to December 31, 2008 and from January 1, 2009 to May 28, 2009 (the date of the business combination), (2) the consolidated results of operations of the Company for the 217 days beginning May 29, 2009 and ending December 31, 2009, and (3) the consolidated financial statements of Shermen from January 1, 2008 to December 31, 2008 and from January 1, 2009 to May 28, 2009 while operating as a special purpose acquisition company. The pro forma results of operations are not necessarily indicative of results of operations that may have actually occurred had the business combination taken place on the dates noted, or the future financial position or operating results of the Company. The pro forma adjustments are based upon available information and assumptions that the Company believes are reasonable. The pro forma adjustments include an imputed interest expense based on historical borrowings and average interest rates of the acquired business for the periods presented before May 29, 2009, since before the business combination ED&F Man group’s debt and interest and other financing related costs were not specifically identified as corporate borrowings from the ED&F Man group. The pro forma results of operations do not include business combination costs ($13.9 million), formation and operating costs associated with Shermen ($476,000 and $869,000 for the year ended December 31, 2009 and 2008 respectively), or interest income from the trust account held by Shermen ($138,000 and $2.4 million for the year ended December 31, 2009 and 2008 respectively). The pro forma adjustments for the periods before May 29, 2009 include assumed corporate general and administrative costs associated with operating as a public company, which were assumed to be comparable in amount to the actual corporate general and administrative costs after May 28, 2009. The pro forma results include an adjustment that assumes a full year of dividends payable on 30,886,830 shares of Series A Convertible Preferred Stock, including escrowed shares, at $0.0344 per share for both 2009 and 2008. The pro forma results include the operating results of the Southside River Rail-Terminal acquisition on October 15, 2009, as well as amortization of debt issuance costs incurred as a result of the syndicated bank credit facility entered into on November 12, 2009, along with additional facility fees related to this new facility.
Southside River-Rail Inc.
On October 15, 2009, the Company, through its wholly-owned subsidiary Westway Terminal Cincinnati LLC, completed the acquisition of the storage assets and property of Southside River-Rail Terminal, Inc. located in Cincinnati, Ohio. The purchase price for this acquisition was approximately $19.9 million in cash. The acquired terminal handles barges, rail and truck operations, and it has approximately 37 million gallons of bulk liquid storage capacity, consisting of over 45 tanks designed to meet the specialized storage, handling and transportation requirements of most types of liquid products.
The acquisition was recorded in accordance with U.S. GAAP and the Company was identified as the accounting acquirer. The allocation of the purchase price to the fair values of the acquired assets and liabilities is outlined below, with the Company preliminarily recording the acquisition-date fair values on the following major classes of consideration:
| (in thousands) | |||
| Cash |
$ | 19,879 | |
| Total allocable purchase price |
$ | 19,879 | |
| Property, plant & equipment |
17,719 | ||
| Goodwill |
2,100 | ||
| Other intangibles |
60 | ||
| Total preliminary purchase price allocation |
$ | 19,879 | |
107
Table of Contents
WESTWAY GROUP, INC.
NOTES TO CONSOLIDATED FINANCIAL STATEMENTS—(Continued)
We have completed the purchase price allocations for our acquisition of Southside River-Rail Terminal Inc. on a preliminary basis, subject to adjustments in accordance with the purchase agreement and other adjustments should new or additional facts about the business become known. We expect to finalize the allocations by the first quarter of 2010. This acquisition did not have a material impact on our financial position or results of operations. No significant events occurred or major circumstances changed relating to Southside River-Rail, Inc. since the business combination, including adverse changes in the key assumptions or variables that contradict the preliminary valuation.
The changes in the carrying amount of goodwill based on the preliminary purchase price allocation of the acquisitions made in 2009 are as follows (in thousands):
| Balance at December 31, 2008 |
$ | — | |
| Acquired goodwill—Bulk liquid storage and liquid feed supplements |
87,870 | ||
| Acquired goodwill—Southside River-Rail Inc. |
2,100 | ||
| Balance at December 31, 2009 |
$ | 89,970 |
Other intangible assets based on the preliminary purchase price allocation of the acquisitions made in 2009 consist of the following (in thousands):
| December 31, | |||||||
| 2009 | 2008 | ||||||
| Liquid feed supplements tradename (indefinite life) |
$ | 5,900 | $ | — | |||
| Non-compete agreements (2 year useful life) |
60 | — | |||||
| 5,960 | — | ||||||
| Less accumulated amortization |
(6 | ) | — | ||||
| $ | 5,954 | $ | — | ||||
The liquid feed supplements tradename preliminarily allocated has an indefinite useful life and is not subject to amortization. However, we evaluate the remaining useful life of this intangible asset and test for impairment periodically as required. The non-compete agreements have finite useful lives and we amortize these agreements using the straight-line method over their respective useful lives. The useful lives for our non-compete agreements are based on their contractual terms.
Prior to the business combination, as a consequence of being owned by ED&F Man, the acquired business maintained a significant commercial relationship with the ED&F Man group. After the business combination, this relationship has continued, with the Company acting as the preferred supplier of storage services to the ED&F Man group and the ED&F Man group acting as the preferred provider of molasses requirements to the liquid feed supplements business. In addition, ED&F Man has agreed to provide transitional services to the Company for a minimum period of twelve months following the business combination. The Company has also agreed to provide transitional services to the ED&F Man group for the same period.
During each of the financial periods presented, the Company (or its predecessor) provided storage of liquid products to the ED&F Man group. For the year ended December 31, 2009, net revenue earned from the ED&F Man group by the Company was $8.5 million, representing 18.9% of total bulk liquid storage net revenue.
108
Table of Contents
WESTWAY GROUP, INC.
NOTES TO CONSOLIDATED FINANCIAL STATEMENTS—(Continued)
In addition, during each of the financial periods presented, the Company (or its predecessor) acquired molasses from the ED&F Man group for our liquid feed supplements business. For the year ended December 31, 2009, our costs of purchases from the ED&F Man group were $44.0 million, representing 38.1% of total liquid feed supplement cost of sales. These costs are included in cost of sales in the consolidated statements of income.
As a consequence of these relationships, the consolidated financial statements of the Company include amounts owing from the ED&F Man group and amounts payable to the ED&F Man group in respect of the bulk liquid storage and liquid feed supplements businesses as of December 31, 2009. At December 31, 2009, 11.6% of the Company’s trade accounts receivables were due from the ED&F Man group and 78.2% of the Company’s trade accounts payables were due to the ED&F Man group.
ED&F Man Treasury, an affiliate of ED&F Man, indirect holder of 47.5% of the common stock in the Company, provided the Company with a two year, $100 million revolving credit facility maturing on May 27, 2011, and a $5 million working capital borrowing line that was scheduled to mature on January 8, 2010. Interest accrued on amounts borrowed under the facility and borrowing line at LIBOR plus 3.5%, and a commitment fee of 1.4% was payable on any undrawn, uncancelled portion of the facility. A facility fee of up to $1.5 million would have been payable to ED&F Man in the event that the facility had not been refinanced by November 28, 2009. There was no utilized portion of this credit facility and borrowing line, as it was paid off and terminated in its entirety on November 12, 2009 when the Company obtained a $175 million 3-year revolving credit facility from a syndicate of banks.
In connection with transitional treasury management services provided by the ED&F Man group, at December 31, 2009, the Company had net deposits of $7.8 million in cash from the Company’s international subsidiaries held with ED&F Man Treasury, bearing interest at the one-month LIBOR rate.
The Company also incurs service charges in respect of directly attributable divisional and central ED&F Man corporate costs in each financial period for services rendered to the Company’s bulk liquid storage and liquid feed supplements businesses. The Company has recharged the ED&F Man group in respect to transitional services provided, consisting of human resources, information technology, accounting administration, invoicing, and other services.
The company has a participation agreement with a captive insurance company owned by ED&F Man. The captive underwrites the self-insured portion of certain risks insured by the Company through the captive and charges a premium for the first layer claims exposure. Under this agreement all transactions of the Company are segregated from the ED&F Man group’s business.
The Company calculated earnings (loss) per share in accordance with U.S. GAAP. The Series A Convertible Preferred Stock is a participating security because it may participate in dividends with common stock. Accordingly, net income is allocated to each security based on the ratio of the number of shares, if converted, to the total number of shares. We have included these shares within the computation of EPS under the two-class method for the twelve months ended December 31, 2009. The Company has included the effect of the preferred dividends in the numerator for the twelve months ended December 31, 2009 as it is deemed a contractual obligation. The Company used the treasury stock method to calculate the diluted earnings per share based on the outstanding warrants issued in the private placement, the initial public offering and the over allotment. As a result, the Company added 0, 3,941,943, and 3,603,080 shares as of the years ended December 31, 2009, 2008 and 2007 respectively, to its basic weighted average number of shares to arrive at the diluted shares used in its calculation of weighted average diluted earnings per share. As the warrants were issued with exercise prices ranging from $5.00 to $6.25, they have not been added to basic weighted average number of shares for the year ended December 31, 2009 since the average price of our common stock was below this range.
109
Table of Contents
WESTWAY GROUP, INC.
NOTES TO CONSOLIDATED FINANCIAL STATEMENTS—(Continued)
The calculation of basic and diluted earnings per share is as follows (in thousands except share amounts):
| Year Ended December 31, | ||||||||||
| 2009(1) | 2008 | 2007 | ||||||||
| Numerator |
||||||||||
| Net Income (Loss) Applicable to Common Stockholders—Basic |
$ | (6,175 | ) | $ | 741 | $ | 1,166 | |||
| Net Income (Loss)—Diluted |
$ | (3,660 | ) | $ | 741 | $ | 1,166 | |||
| Denominator |
||||||||||
| Number of common shares subject to possible redemption, basic & diluted |
— | 9,199,999 | 5,444,000 | |||||||
| Weighted average number of common shares equivalent outstanding not subject to possible redemption: |
||||||||||
| Basic |
23,690,843 | 19,550,001 | 14,360,000 | |||||||
| Plus: |
||||||||||
| Effect of dilutive outstanding warrants |
— | 3,941,943 | 3,603,080 | |||||||
| Diluted |
23,690,843 | 23,491,944 | 17,963,080 | |||||||
| Basic and Diluted Earnings Per Common Share |
||||||||||
| Net Income per common shares subject to possible redemption, basic & diluted |
— | $ | 0.00 | $ | 0.06 | |||||
| Net Income Available to Common Stockholders—Basic |
$ | (0.26 | ) | $ | 0.04 | $ | 0.06 | |||
| Net Income Available to Common Stockholders—Diluted |
$ | (0.26 | ) | $ | 0.03 | $ | 0.04 | |||
| Basic and diluted earnings per share attributable to Series A convertible preferred stock |
— | — | — | |||||||
| Basic and diluted earnings per share attributable to common shares |
— | — | — | |||||||
| Series A convertible preferred stock weighted average shares outstanding, basic and diluted |
— | — | — | |||||||
| Common share weighted average shares outstanding, basic and diluted |
— | — | — | |||||||
| (1) | Twelve months ended December 31, 2009 includes only 217 days of acquired business operations. |
Shares of Series A Convertible Preferred Stock were antidilutive for the year ended December 31, 2009 due to the Company’s net loss.
The number of additional shares that could potentially dilute earnings per share in the future that were not included in the computation of diluted earnings per share due to the average price of our common stock during 2009 is summarized as follows:
| Twelve months ending December 31, 2009 | ||
| Initial public offering warrants |
46,000,000 | |
| Founder warrants(2) |
5,214,286 | |
| Underwriter options to purchase units, with one share of common stock per unit(2) |
700,000 | |
| Underwriter options to purchase units, with two warrants per unit(2) |
1,400,000 | |
| 53,314,286 |
| (2) | Founder warrants and underwriter options to purchase units have a potentially less dilutive effect because they have a cashless exercise provision. |
110
Table of Contents
WESTWAY GROUP, INC.
NOTES TO CONSOLIDATED FINANCIAL STATEMENTS—(Continued)
7. INVESTMENT IN TRUST ACCOUNT; MARKETABLE SECURITIES
As of December 31, 2009 there were no investment securities in the Company’s trust account. The securities have been utilized as a result of the Company completing the acquisition of the bulk liquid storage and feed supplements businesses on May 28, 2009. Investment securities at December 31, 2008 consisted of (a) approximately $138,444,809 in Treasury Bills and (b) approximately $1,000 in a mutual fund that invests in U.S. Treasury securities.
Investment in unconsolidated subsidiary
On January 17, 2000, the acquired business had formed, without initial investment, Champion Liquid Feeds (“CLF”), a 50:50 joint venture with a dry feed distributor in Australia. Through its relationship, CLF provides the Company with access to a manufacturer and distributor of liquid feed supplements in Australia, based out of CLF’s plant in southern Queensland. CLF recently commissioned two new liquid suspension plants in central Queensland and Victoria, which will provide the ability to supply a complete range of liquid feed supplements to Victoria, New South Wales and Queensland. The Company uses the equity method to account for its share in CLF.
Activity in the investment account is as follows:
| Predecessor | |||||||||||||
| As of December 31, | As of October 31, | ||||||||||||
| 2009 | 2008 | 2008 | 2007 | ||||||||||
| At start of year |
$ | — | $ | — | 2,885 | $ | 1,070 | ||||||
| Additions |
3,642 | — | 1,290 | 1,419 | |||||||||
| Foreign exchange |
592 | — | (1,085 | ) | 329 | ||||||||
| (Expense)/income for the year |
134 | — | (174 | ) | 67 | ||||||||
| At end of year |
$ | 4,368 | $ | — | $ | 2,916 | $ | 2,885 | |||||
The Company has preliminarily allocated an initial purchase price for the fair value of the investment in CLF. The valuations are based preliminary valuations performed by management using future cash flow projections for the investments, discounted to present value (income approach), and the price at which comparable investments are purchased under similar circumstances (market approach).
As of December 31, 2009, $134,000 of the equity in undistributed earnings of 50 percent or less owned entities accounted for by the equity method was included in our consolidated retained earnings.
Investment in consolidated subsidiary
On December 29, 2006, Sunnyside Feed L.L.C (“Sunnyside”) was established for the purposes of constructing and operating a liquid feed supplements facility in Mandan, North Dakota in order to serve local beef and dairy industries. The Company’s 49% partner in Sunnyside is Sunnyside Properties LLC. The Company has preliminarily allocated an initial investment of $1.3 million in Sunnyside. Consistent with its accounting policies, the Company consolidates 100% of the assets and liabilities of Sunnyside in the balance sheets as well as 100% of the income /(expense) from operations. Sunnyside Properties LLC’s interest in the pre-tax income/(expense) and the net assets of Sunnyside are shown separately, as a non-controlling interest, in the statements of operations and the balance sheets, respectively. The liquid feed supplements facility commenced production in March 2007.
111
Table of Contents
WESTWAY GROUP, INC.
NOTES TO CONSOLIDATED FINANCIAL STATEMENTS—(Continued)
The Company has preliminarily allocated an initial purchase price for the fair value of the investment in Sunnyside. The valuations are based preliminary on valuations performed by management using future cash flow projections for the investments, discounted to present value (income approach), and the price at which comparable investments are purchased under similar circumstances (market approach).
The Company evaluates its investments for potential impairment indicators on an ongoing basis. This evaluation requires the exercise of judgment based upon the specific facts and circumstances of each investment. If impairment indicators exist, the Company will evaluate whether the impairment is other-than-temporary. The Company determined that there was no impairment of its investments as of December 31, 2009.
9. BUSINESS COMBINATION EXPENSES
As required by U.S. GAAP, acquisition-related costs are costs the acquirer incurs to effect a business combination. These costs include advisory, legal, accounting and other professional or consulting fees. In accordance with U.S. GAAP, we have accounted for these business combination costs as expenses in the periods in which the costs were incurred and the services were received. The below table provides a breakout of business combination costs by category for the twelve months ended December 31, 2009 (in thousands):
| Year ended December 31, 2009 | |||
| Investment banking advisory |
$ | 5,935 | |
| Legal |
2,526 | ||
| Accounting |
4,660 | ||
| Printing |
463 | ||
| Other |
307 | ||
| Total business combination expenses |
$ | 13,891 | |
10. PROPERTY, PLANT AND EQUIPMENT, NET
The bulk liquid storage segment’s property, plant, and equipment consists principally of storage tanks, related equipment, and leasehold improvements. The liquid feed supplements segment’s property, plant, and equipment consists principally of liquid feed tanks, related equipment, and buildings. The Company’s property, plant and equipment balances net of accumulated depreciation were as follows (in thousands):
| December 31, 2009 |
||||
| Land |
$ | 12,745 | ||
| Property, plant and equipment—Bulk liquid storage |
260,655 | |||
| Property, plant and equipment—Liquid feed supplements |
54,044 | |||
| 327,444 | ||||
| Less: accumulated depreciation (since business combination) |
(11,054 | ) | ||
| Assets under construction, including capitalized interest of $882 |
8,197 | |||
| Property, plant and equipment, net |
$ | 324,587 | ||
Prior to 2009, the Company had no property, plant, and equipment.
Depreciation expense was $11.1 million for the year ended December 31, 2009 (year ended December 31, 2008: $0)
112
Table of Contents
WESTWAY GROUP, INC.
NOTES TO CONSOLIDATED FINANCIAL STATEMENTS—(Continued)
The Company has preliminarily allocated $290.4 million for the fair value of property, plant, and equipment of the liquid bulk storage and liquid feed supplements businesses acquired in May 2009. This allocation is based on preliminary valuations performed by management using current prices at which comparable assets are purchased under similar circumstances (market approach) and an estimate of the current cost to purchase or replace the assets (cost approach).
Predecessor Combined Carve-Out Property, plant & equipment consisted of the following:
| Predecessor | ||||
| As of October 31, | ||||
| 2008 | ||||
| Freehold buildings |
$ | 14,139 | ||
| Freehold land |
9,125 | |||
| Leasehold improvements |
15,909 | |||
| Assets under construction |
21,123 | |||
| Equipment & vehicles |
209,203 | |||
| Total |
269,499 | |||
| Less accumulated depreciation |
(132,109 | ) | ||
| Total property, plant and equipment, net |
$ | 137,390 | ||
Predecessor depreciation expense for the years ended October 31, 2008 and 2007 (and for the approximate 7-month period from November 1, 2008 to May 28, 2009) was $15.3 million, $15.1 million, and $8.6 million respectively. These charges are included in cost of sales in the combined carve-out statements of income.
A summary of inventories were as follows (in thousands):
| Predecessor | ||||||
| December 31, 2009 |
October 31, 2008 | |||||
| Finished goods |
$ | 1,855 | $ | 1,574 | ||
| Raw materials |
17,799 | 19,916 | ||||
| Other |
753 | — | ||||
| Total inventories |
$ | 20,407 | $ | 21,490 | ||
Other inventory consists of packaging and other operating supplies. Prior to 2009, the Company had no inventories.
12. BORROWINGS UNDER CREDIT FACILITY
ED&F Man Credit Facility
On August 6, 2009, the Company, Westway Holdings Netherlands BV, a wholly-owned indirect subsidiary of the Company (“Westway Netherlands”), and ED&F Man Treasury Management plc (“ED&F Man Treasury”) entered into a $100.0 million facility agreement (the “Final Facility Agreement”). Under the Final Facility Agreement, ED&F Man Treasury agreed to make revolving credit loans in an aggregate principal amount at any time outstanding of up to $100.0 million to the Company, Westway Netherlands, and any other of the Company’s subsidiaries that the Company nominated and ED&F Man Treasury approved. ED&F Man Treasury is an
113
Table of Contents
WESTWAY GROUP, INC.
NOTES TO CONSOLIDATED FINANCIAL STATEMENTS—(Continued)
affiliate of ED&F Man, a significant shareholder and strategic ally of the Company. The facility was scheduled to mature on May 27, 2011 and accrued interest on amounts borrowed at LIBOR plus 3.5%. A commitment fee of 1.4% was payable on any undrawn, uncalled portion of the facility and a fee of up to $1.5 million would have been payable to ED&F Man in the event that the facility had not been refinanced by November 28, 2009.
The Final Facility Agreement replaced and terminated the $100.0 million facility agreement dated May 28, 2009, by and among the Company, Westway Netherlands, and ED&F Man Treasury (the “Interim Facility Agreement”) that was entered into upon the consummation of the business combination. The Interim Facility Agreement was entered into to facilitate the consummation of the business combination while a final document was being prepared. All substantive terms and conditions of the facility are consistent in both the initial and final versions of the Credit Agreement.
Bank Syndicate Credit Facility
The Company entered into a new three-year, $175 million revolving credit facility with a syndicate of banks scheduled to terminate on November 12, 2012, after paying off in its entirety and terminating the $100 million credit facility with ED&F Man. The public company, Westway Group, Inc. (“WGI”), as borrower, entered into a Credit Agreement dated as of November 12, 2009, with JPMorgan Chase Bank, N.A., as administrative agent, Regions Bank, as syndication agent, Capital One, N.A., Rabobank Nederland, SunTrust Bank, and Compass Bank (doing business as BBVA Compass), as documentation agents, and the lenders from time to time party thereto (initially, JPMorgan Chase Bank, N.A., Regions Bank, Capital One, N.A., Rabobank Nederland, Suntrust Bank, Compass Bank, Whitney National Bank, Societe Generale, and CoBank ACB) (the “Credit Agreement”). The Credit Agreement was delivered and became effective on November 16, 2009.
In addition, WGI has the option during the term of the credit facility, subject to certain conditions including the willingness of one or more of the lenders or a new lender to commit additional funds, to increase the credit facility by an aggregate principal amount of up to $25 million (which option we sometimes refer to as the “accordion feature”). The proceeds of the loans are to be used by WGI to refinance its debt with ED&F Man Treasury, to pay fees and expenses in connection with the refinancing, and for general corporate purposes of WGI and its subsidiaries, which includes among other things working capital, capital expenditures, and acquisitions.
The interest rate is at the Company’s option of either the London Interbank Offered Rate, or LIBOR, for the applicable interest period chosen by the Company, adjusted by the statutory reserve rate, plus 3.5% per year (unless increased by the majority lenders to adequately and fairly reflect the lenders’ costs), or the highest of (i) the administrative agent’s publicly announced prime rate at its principal office in New York City, (ii) the federal funds effective rate plus 0.5%, and (iii) the one-month LIBOR, adjusted by the statutory reserve rate, plus 1.0% (the highest being the “alternative base rate”), plus 2.625% per year. The Company also pays a commitment fee of 0.625% per year on the average daily unused amount of the credit facility, which fee is payable quarterly in arrears.
The Company initially drew down $90.6 million under the facility in November 2009, primarily to pay off the prior credit facility with ED&F Man Treasury, thereby refinancing certain amounts previously borrowed to consummate the business combination as well as working capital. As of December 31, 2009, the total balance outstanding on the credit facility was $91.6 million.
Financial Covenants
Financial covenants in the credit facility required the Company to have (a) a maximum consolidated total leverage ratio as defined in the Credit Agreement (generally, funded debt to EBITDA) of no more than 3.5 to 1
114
Table of Contents
WESTWAY GROUP, INC.
NOTES TO CONSOLIDATED FINANCIAL STATEMENTS—(Continued)
as of the last day of the fourth quarter of 2009; and (b) a minimum consolidated interest coverage ratio as defined in the Credit Agreement (generally, EBITDA to interest expense) of not less than 3.0 to 1 as of the last day of the fourth quarter of 2009. Our actual ratios with respect to these two financial covenant tests as of December 31, 2009 were 2.3 to 1 and 15.0 to 1, respectively. Failure to meet these or any of the other covenants could result in additional costs and fees to amend the credit facility or could result in termination of the credit facility.
Deferred Financing Costs
We capitalize financing costs we incur related to implementing and amending our debt. We record these costs as Other assets on our Consolidated Balance Sheets and amortize them over the contractual life of the related debt. The changes in deferred financing costs are as follows (in thousands):
| As of December 31, 2009 |
||||
| Balance at beginning of year |
$ | — | ||
| Financing costs deferred |
3,139 | |||
| Balance at end of year |
3,139 | |||
| Less accumulated amortization |
(129 | ) | ||
| $ | 3,010 | |||
The provision for income taxes consisted of provisions for federal, state and foreign income taxes. The Company operates globally with operations in various locations outside the United States. Accordingly, the effective income tax rate is a composite rate reflecting the earnings in the various locations and the applicable rates.
Income (loss) before income taxes and equity earnings (loss) is attributable to the following jurisdictions (in thousands):
| Year Ended December 31, | ||||||||||
| 2009 | 2008 | 2007 | ||||||||
| United States |
$ | (5,163 | ) | $ | 1,527 | $ | 2,117 | |||
| Foreign |
3,820 | — | — | |||||||
| Total |
$ | (1,343 | ) | $ | 1,527 | $ | 2,117 | |||
The benefit (provision) for income taxes consisted of the following (in thousands):
| Year Ended December 31, | ||||||||||||
| 2009 | 2008 | 2007 | ||||||||||
| Current benefit (provision) |
||||||||||||
| Federal |
$ | 1,727 | $ | (680 | ) | $ | (852 | ) | ||||
| State and local |
196 | (417 | ) | (500 | ) | |||||||
| Foreign |
(1,036 | ) | — | — | ||||||||
| Total current |
$ | 887 | $ | (1,097 | ) | $ | (1,352 | ) | ||||
115
Table of Contents
WESTWAY GROUP, INC.
NOTES TO CONSOLIDATED FINANCIAL STATEMENTS—(Continued)
| Year Ended December 31, | ||||||||||||
| 2009 | 2008 | 2007 | ||||||||||
| Deferred benefit (provision) |
||||||||||||
| Federal |
(2,884 | ) | 234 | 250 | ||||||||
| State and local |
(437 | ) | 77 | 151 | ||||||||
| Foreign |
(84 | ) | — | — | ||||||||
| Total deferred |
(3,405 | ) | 311 | 401 | ||||||||
| Income tax benefit (provision) |
$ | (2,518 | ) | $ | (786 | ) | $ | (951 | ) | |||
| Effective tax rate benefit (provision) |
(187 | %) | (51 | %) | (45 | %) | ||||||
We made payments related to income taxes totaling $3.0 million in 2009 and $1.8 million in 2008.
The actual income tax expense differs from the amounts computed by applying the U.S. federal statutory rate of 35% to pre-tax earnings (loss) as follows:
| Year ended December 31, | ||||||||||||
| 2009 | 2008 | 2007 | ||||||||||
| Income tax benefit (provision) applying U.S. federal statutory rate |
$ | 472 | $ | (534 | ) | $ | (741 | ) | ||||
| Increase/(decrease) in rate resulting from: |
||||||||||||
| Foreign income taxed at different rates |
1,210 | — | — | |||||||||
| Valuation allowance for losses not deductible |
(131 | ) | — | — | ||||||||
| Expenses which are not deductible for tax purposes |
(3,937 | ) | — | — | ||||||||
| State income tax, net of Federal |
82 | (252 | ) | (210 | ) | |||||||
| Minority interest |
(36 | ) | — | — | ||||||||
| U.S. tax on foreign earnings to be repartriated |
(178 | ) | — | — | ||||||||
| Actual income tax provision |
$ | (2,518 | ) | $ | (786 | ) | $ | (951 | ) | |||
The actual income tax provision differs from the federal statutory amount in 2009 principally due to business combination costs incurred that, for tax purposes, were capital in nature and therefore non-deductible. The difference in the actual income tax provision from the federal statutory amount in 2008 was principally due to differences in state and local income taxes.
The net deferred tax liability consists of the following deferred tax liabilities:
| December 31, | |||||||
| 2009 | 2008 | ||||||
| Property and equipment |
$ | (69,072 | ) | $ | — | ||
| Goodwill |
(1,519 | ) | — | ||||
| Other |
(764 | ) | — | ||||
| Total deferred tax liabilities |
(71,355 | ) | — | ||||
| Property and equipment |
3,332 | — | |||||
| Amounts not yet deductible for tax purposes |
2,778 | 712 | |||||
| Other |
137 | — | |||||
| Total deferred tax assets |
6,247 | 712 | |||||
| Net deferred tax assets (liabilities) |
$ | (65,108 | ) | $ | 712 | ||
116
Table of Contents
WESTWAY GROUP, INC.
NOTES TO CONSOLIDATED FINANCIAL STATEMENTS—(Continued)
At December 31, 2009, the Company provided deferred tax of $178,000 on our undistributed foreign earnings.
We are not aware of any uncertain tax positions for the periods ended December 31, 2009 and 2008.
Predecessor income taxes have been provided for all items included in the combined carve-out statements of income regardless of when such items were reported for tax purposes or when the taxes were actually paid or refunded. Current tax liabilities and receivables were transferred to ED&F Man and are included in “ED&F Man net invested capital.”
The Predecessor Combined Carve-Out provision for income taxes is comprised of the following:
| Predecessor | ||||||||||
| November 1, 2008 through May 28, |
Year ended October 31, | |||||||||
| 2009 | 2008 | 2007 | ||||||||
| Current tax expense |
$ | 4,526 | $ | 11,254 | $ | 10,831 | ||||
| Deferred tax expense/(benefit) from temporary differences |
1,313 | 787 | (1,594 | ) | ||||||
| Total |
$ | 5,839 | $ | 12,041 | $ | 9,237 | ||||
Predecessor current tax expense (benefit) includes amounts applicable to US federal income taxes of $7.4 million and $7.3 million in 2008 and 2007, respectively.
Predecessor deferred Income tax expense (benefit) related to US federal income taxes was $0.8 million and $1.0 million in 2008 and 2007, respectively.
The Predecessor Combined Carve-Out net deferred tax liability consists of the following deferred tax liabilities:
| Predecessor | |||
| Year ended October 31, 2008 | |||
| Property and equipment |
$ | 22,112 | |
| Goodwill |
1,612 | ||
| Other |
619 | ||
| Total deferred tax liabilities |
24,343 | ||
| Net operating loss carry forwards |
— | ||
| Amounts not yet deductible for tax purposes |
1,332 | ||
| Other |
233 | ||
| Total deferred tax assets |
1,565 | ||
| Net deferred tax liabilities |
$ | 22,778 | |
117
Table of Contents
WESTWAY GROUP, INC.
NOTES TO CONSOLIDATED FINANCIAL STATEMENTS—(Continued)
A reconciliation of the Predecessor Combined Carve-Out U.S. federal statutory income tax rate to actual income tax rate is as follows:
| Predecessor | |||||||||
| November 1, 2008 through May 28, 2009 |
Year ended October 31, | ||||||||
| 2008 | 2007 | ||||||||
| U.S. Federal statutory income tax rate |
35.00 | % | 35.00 | % | 35.00 | % | |||
| Increase/(decrease) in rate resulting from: |
|||||||||
| State income tax, net of Federal benefit |
2.50 | % | 4.00 | % | 5.00 | % | |||
| Income taxes outside the U.S. |
(2.44 | )% | (2.39 | )% | (3.46 | )% | |||
| Reduction in U.S. rates on U.S. deferred tax |
(4.17 | )% | (4.08 | )% | — | % | |||
| Other |
(0.55 | )% | (1.56 | )% | (1.95 | )% | |||
| Actual income tax rate |
30.34 | 30.97 | % | 34.59 | % | ||||
Predecessor deferred U.S. taxes have not been recorded for temporary differences related to investments in certain foreign subsidiaries and corporate joint ventures. These temporary differences were approximately $21.5 million as of October 31, 2008, and consisted primarily of undistributed earnings relating to the year ended October 31, 2003 onwards and are considered permanently invested in operations outside the U.S. Determination of the deferred income tax liability on these unremitted earnings is not practicable because such liability, if any, is dependent upon circumstances existing if and when remittance occurs.
Class A Common Stock
As of December 31, 2009, there were outstanding 13,940,833 shares of the Company’s Class A common stock. The following transactions occurred on May 28, 2009 (a) the conversion of 9,189,990 shares of Class A common stock into the right to receive a portion of the trust account established in connection with our initial public offering, (b) the repurchase by us of 2,514,369 shares of Class A common stock, and (c) the cancellation by the Company of 3,266,608 shares of Class A common stock previously held by Shermen WSC Holding LLC. The Company also issued from treasury stock 120,000 shares of Class A common stock to Lazard Capital Markets LLC on August 5, 2009, in exchange for an aggregate purchase price of $600,000, which was paid through the offsetting of fees owed to Lazard by two of the Company’s wholly-owned subsidiaries. The Company also issued from treasury stock 38,700 (on September 1, 2009) and 3,100 (on December 15, 2009) shares of Class A common stock to Westway Group, Inc. non-executive employees.
If ED&F Man or any of its affiliates acquires beneficial ownership of shares of Class A Common Stock, these shares will automatically convert into an equal number of shares of Class B Common Stock.
On June 18, 2009, the Company paid a special cash dividend of $1.00 per share of Class A common stock (except as waived by Shermen WSC Holding LLC).
Class B Common Stock
On May 28, 2009, the Company issued in the name of Westway Holdings Corporation (“Holdings”), a subsidiary of ED&F Man, 12,624,003 newly-issued shares of Class B common stock, par value $0.0001 per share, of the Company. The shares were issued in a private placement not involving a public offering under the Securities Act of 1933. The Company has not engaged in general solicitation or advertising with regard to this issuance of its shares of common stock and has not offered securities to the public in connection with this issuance.
118
Table of Contents
WESTWAY GROUP, INC.
NOTES TO CONSOLIDATED FINANCIAL STATEMENTS—(Continued)
If any shares of Class B Common Stock cease to be owned beneficially or of record by ED&F Man or any of its affiliates, these shares will automatically convert into an equal number of shares of Class A Common Stock.
Series A Convertible Preferred Stock
The Company also issued in the name of Holdings, 30,886,830 newly-issued shares of Series A Convertible Preferred Stock. The shares were issued in a private placement not involving a public offering under the Securities Act of 1933. The Company has not engaged in general solicitation or advertising with regard to the issuance of its shares of preferred stock and has not offered securities to the public in connection with this issuance. For a period of seven years following the business combination, shares of Series A Convertible Preferred Stock accrue dividends at the rate of $.0344 per share per quarter. Holders of shares of Series A Convertible Preferred Stock are entitled to participate equally and ratably with the holders of shares of common stock in all dividends and distributions paid on shares of our common stock as if, immediately prior to each record date for payment of such dividend or distribution, the shares of Series A Convertible Preferred Stock then outstanding were converted into shares of the Company’s common stock. In addition, no dividends will be able to be paid to holders of shares of the Company’s common stock, unless and until the Company has complied with the obligation to pay the quarterly dividend on shares of the Series A Convertible Preferred Stock.
On May 28, 2009, the Company delivered to an escrow agent for deposit into an escrow account 12,181,818 of the 30,886,830 newly issued shares of Series A Convertible Preferred Stock issued to Holdings as part of consideration for the business combination, pursuant to a stock escrow agreement. These shares will be released to Holdings only upon the achievement by the Company of certain earnings or share price targets as determined in the Stock Escrow Agreement. As of December 31, 2009, neither of these achievements was met.
In the event of any voluntary or involuntary liquidation, dissolution or winding up of the Company, the holders of shares of Series A Convertible Preferred Stock will be entitled to receive the greater of (a) $5.50 per such share of Series A Convertible Preferred Stock, in each case plus an amount equal to any dividends accrued thereon and remaining unpaid thereon and (b) at any time, the payment such holders would have received had such holders, immediately prior to such liquidation, dissolution or winding up, converted such share of Series A Convertible Preferred Stock into shares of Common Stock, in each case, before any payment or distribution of any assets or profits of the Company is made or set apart for holders of any Series A Junior Securities. If the assets distributable in any such event to the holders of the Series A Convertible Preferred Stock are insufficient to permit the payment to such holders of the full preferential amounts to which they may be entitled, such assets shall be distributed ratably among the holders of the Series A Convertible Preferred Stock in proportion to the full preferential amount each such holder would otherwise be entitled to receive.
Redeemable Common Stock
The Company accounted for redeemable common stock in accordance with U.S. GAAP. Securities that are redeemable for cash or other assets are classified outside of permanent equity if they are redeemable at the option of the holder. In addition, if the redemption causes a liquidation event, the redeemable securities should not be classified outside of permanent equity. At December 31, 2009, the Company did not have any redeemable common stock.
Warrants and Units
Certain of the directors and officers of the Company purchased through Shermen WSC Holding LLC, in a private placement, 5,214,286 founder warrants immediately prior to our initial public offering in 2007 at a price of $0.70 per founder warrant (an aggregate purchase price of approximately $3,650,000) from the Company and
119
Table of Contents
WESTWAY GROUP, INC.
NOTES TO CONSOLIDATED FINANCIAL STATEMENTS—(Continued)
not as part of the offering. Each founder warrant is exercisable for one share of common stock at an exercise price of $5.00 per share. Each founder warrant is exercisable at any time but is scheduled to expire on May 24, 2011. These certain directors and officers agreed that these founder warrants purchased by them would not be sold or transferred until the completion of a business combination. An additional 46,000,000 warrants underlying 23,000,000 of the Company’s units were originally issued in our initial public offering pursuant to a prospectus dated May 24, 2007. Each initial public offering warrant is exercisable for one share of common stock at an exercise price of $5.00 per share. Each initial public offering warrant is exercisable at any time but is scheduled to expire on May 24, 2011.
In connection with our initial public offering of units in 2007, we granted the representatives of the underwriters an option to purchase an aggregate of 700,000 units, with an option purchase price of $7.50 per unit. Each unit consists of one share of common stock and two warrants. The terms of the units subject to this option are similar to the units sold in the Company’s initial public offering and the exercise price for each warrant in the unit is $6.25 per share. This option to purchase Units is now exercisable at any time, in whole or in part, and expires on May 24, 2011.
15. COMMITMENTS AND CONTINGENCIES
The following table sets forth our non-cancelable operating lease commitments as of December 31, 2009 (in thousands):
| Operating Lease Commitments | |||
| 2010 |
$ | 3,998 | |
| 2011-2012 |
7,404 | ||
| 2013-2014 |
6,455 | ||
| Thereafter |
22,676 | ||
| Total |
$ | 40,533 | |
The Company has a substantial property portfolio, with major deep water port locations in the United States, the United Kingdom, the Netherlands and the remainder of Western Europe, along with liquid feed supplements processing and distribution facilities in the United States, Canada, and Australia. Many of the bulk liquid storage and liquid feed supplements facilities are situated on land that is leased from port authorities under operating leases. The Company also has a small number of facilities leases and leases with railroad companies. Total rental expense under operating leases amounted to $2.5 million for the year ended December 31, 2009. Rent expense for the year ended December 31, 2008 was limited to the corporate activities relating to identifying and evaluating prospective acquisition candidates.
In the normal course of business, we make investments in the property and facilities utilized by the bulk liquid storage and liquid feed supplements businesses. As a result, at any point in the financial calendar, we have outstanding contracts with third parties reflecting the cost of committed capital expenditures not yet incurred. At December 31, 2009, the aggregate amount of these commitments totaled $2.2 million. At October 31, 2008, the aggregate amount of these commitments totaled $6.5 million for the predecessor.
The Company and the ED&F Man group have established a long-term molasses supply agreement, pursuant to which the ED&F Man group is the primary supplier of cane molasses to the Company, with a pricing mechanism which approximates the market price of imported molasses.
120
Table of Contents
WESTWAY GROUP, INC.
NOTES TO CONSOLIDATED FINANCIAL STATEMENTS—(Continued)
From time to time, the Company is subject to various claims and litigation arising in the ordinary course of business, including product liability, property, and terminal operator’s liability. While the outcome of any litigation is inherently unpredictable, the Company does not believe, based on currently available facts, that the ultimate resolution of any of these matters will have a material adverse impact on the financial condition, results of operations or cash flows.
As of December 31, 2008, the Company held certain financial assets that are required to be measured at fair value on a recurring basis, which included investments held in the Company’s trust account. The following table presents information about the Company’s assets that are measured at fair value on a recurring basis as of December 31, 2008, and indicates the fair value hierarchy of the valuation techniques the Company utilized to determine such fair value. In general, fair values determined by Level 1 inputs utilize quoted prices (unadjusted) in active markets for identical assets or liabilities. Fair values determined by Level 2 inputs utilize data points that are observable such as quoted prices, interest rates and yield curves. Fair values determined by Level 3 inputs utilize unobservable data points for the asset or liability, and includes situations where there is little, if any, market activity for the asset or liability:
| Description |
Fair Value at December 31, 2008 |
Quoted Prices in Active Markets (Level 1) |
Significant Other Observable Inputs (Level 2) |
Significant Unobservable Inputs (Level 3) | ||||||||
| Assets: |
||||||||||||
| Investments held in Trust Account |
$ | 138,445,809 | $ | 138,445,809 | $ | — | $ | — | ||||
| Total |
$ | 138,445,809 | $ | 138,445,809 | $ | — | $ | — | ||||
The fair values of the Company’s investments held in the Trust Account is determined through market, observable and corroborated sources.
The Company operates its business in two reportable operating segments: bulk liquid storage business and liquid feed supplements. These businesses represent distinct businesses that are managed separately because of differing products and services. Each of these businesses has distinct operating, marketing and sales strategies, and our chief operating decision maker reviews the performance of these businesses based on these segments. The Company also has one non-operating segment—Corporate. Prior to the business combination, the Company had no operating segments.
These segments follow the accounting principles described in note 3. Intersegment revenues are accounted for at prices which approximate market.
Bulk Liquid Storage
Our bulk liquid storage segment generates revenue through contracts by providing three primary types of services: fixed income, volume or throughput income, and income from ancillary services. Each of these sources of income is recorded net of any discounts, volume rebates, and sales taxes. These sources of income reflect the individual nature of the Company’s relationships with its global, regional or local customer bases, which typically comprise contracts spanning one or more years. Contracts vary according to the provision of services, ranging from the simple transloading of products from delivery into storage, but more typically extend into more
121
Table of Contents
WESTWAY GROUP, INC.
NOTES TO CONSOLIDATED FINANCIAL STATEMENTS—(Continued)
complex product management and storage services. Fixed income services generate revenue from storage services at each of our terminals and are based on a fixed fee per month for tank rental, input/output from storage tanks or combination of both. We recognize revenue from fixed income services in the period the service is rendered. Volume services generate revenue based on the volume of liquid entering or exiting at each terminal location and is based on tonnage. We recognize revenue for volume services as the volumes are entered into or withdrawn from its storage facilities. Ancillary income services generate revenue from customer-specific storage requirements including energy, overtime, and other infrastructure costs. Revenue relating to ancillary income services is recognized based on terms stipulated in the customer contract and are recorded at the time the service is provided. Provisions for ancillary services may be included in fixed price storage services or in volume or throughput income services. Revenue is recorded for the services available under each contract as the services are provided. Bulk liquid storage services are provided through a number of international locations, but are currently managed as one business from our headquarters in New Orleans, Louisiana.
Liquid Feed Supplements
The liquid feed supplements segment generates income from liquid feed supplements, with a small proportion of income arising from solid or more traditional animal feeds. The business is focused on the processing of animal feeds from their raw liquid constituents into a blended product that varies according to customer and livestock requirements. Revenue is recorded net of any discounts, volume rebates, and sales taxes. Shipping and handling costs are included within cost of sales in the consolidated statements of income. Our liquid feed supplements segment incorporates a research and development program focused on delivering product that is distinct, based on customer, livestock and geographical requirements, and is capable of being varied to reflect commodity prices or other factors. The liquid feed supplements segment is organized around a series of broad regional territories in the United States that reflect the characteristics of beef cattle, dairy and feedlot markets. The liquid feed supplements segment is currently managed from, and headquartered in, Tomball, TX.
Corporate
Corporate operating expenses are not allocated to the Company’s reportable segments. The corporate segment includes interest expenses related to corporate debt and unallocated general and administrative expenses including, in part, executive, legal, finance, information technology, and human resource expenses.
122
Table of Contents
WESTWAY GROUP, INC.
NOTES TO CONSOLIDATED FINANCIAL STATEMENTS—(Continued)
Results of Operations by Business Segment
The Company’s operations by business segment are as follows (in thousands):
Twelve Months Ended December 31, 2009
| Bulk Liquid Storage | Liquid Feed Supplements |
Corporate | Total | |||||||||||||
| Total net revenue—(1) |
$ | 45,134 | $ | 143,653 | $ | — | $ | 188,787 | ||||||||
| Total cost of sales—(1) |
— | (115,416 | ) | — | (115,416 | ) | ||||||||||
| Operating costs and expenses |
(18,351 | ) | (10,780 | ) | (745 | ) | (29,876 | ) | ||||||||
| Depreciation |
(8,034 | ) | (3,000 | ) | (26 | ) | (11,060 | ) | ||||||||
| Selling, general & administrative expenses |
(3,489 | ) | (5,519 | ) | (9,502 | ) | (18,510 | ) | ||||||||
| Business combination expense(2) |
(174 | ) | (20 | ) | (13,697 | ) | (13,891 | ) | ||||||||
| Income / (expense) from operations |
15,086 | 8,918 | (23,970 | ) | 34 | |||||||||||
| Interest, net |
(58 | ) | 13 | (1,273 | ) | (1,318 | ) | |||||||||
| Loss on Disposal of Property, Plant & |
||||||||||||||||
| Equipment |
(60 | ) | 1 | — | (59 | ) | ||||||||||
| Total non-operating (expense) / income |
(118 | ) | 14 | (1,273 | ) | (1,377 | ) | |||||||||
| Income (loss) before taxes |
$ | 14,968 | $ | 8,932 | $ | (25,243 | ) | $ | (1,343 | ) | ||||||
| Capital expenditures |
$ | 22,640 | $ | 2,986 | $ | 392 | $ | 26,018 | ||||||||
| Plant, property & equipment—net |
$ | 269,589 | $ | 54,632 | $ | 366 | $ | 324,587 | ||||||||
| Goodwill and intangibles |
$ | 60,415 | $ | 35,509 | $ | — | $ | 95,924 | ||||||||
| Total assets |
$ | 353,083 | $ | 140,784 | $ | 23,831 | $ | 517,698 | ||||||||
| (1) | Includes intersegment eliminations |
| (2) | Includes one-time business combination expenses of $13.9 million for advisory, investment banking, accounting, legal, and other professional and consulting fees. |
The twelve months ended December 31, 2009 includes only 217 days of acquired business operations. The disclosures of segment data are based on preliminary values assigned in purchase accounting. See Note 4. The Company had no operating segments for the year ended December 30, 2008.
The following table presents revenues from external customers attributable to individual countries that represent at least 10% of net revenues based on each principal place of business for the years indicated:
| Year ended December 31, | ||||||
| 2009 | 2008 | |||||
| United States |
$ | 168,173 | $ | — | ||
| Rest of the World |
20,614 | — | ||||
| Total |
$ | 188,787 | $ | — | ||
123
Table of Contents
WESTWAY GROUP, INC.
NOTES TO CONSOLIDATED FINANCIAL STATEMENTS—(Continued)
The following table presents long lived-assets attributable to individual countries that represent at least 10% of total long-lived assets based on each principal place of business for the years indicated:
| Year ended December 31, | ||||||
| 2009 | 2008 | |||||
| United States |
$ | 230,439 | $ | — | ||
| Rest of the World |
98,516 | — | ||||
| Total |
$ | 328,955 | $ | — | ||
Predecessor Combined Carve-Out Period from November 1, 2008 to May 28, 2009
| Bulk Liquid Storage | Liquid Feed Supplements | Total | ||||||||||||||||||||||||||
| USA | Rest of World | Total | USA | Rest of World | Total | |||||||||||||||||||||||
| Revenues |
||||||||||||||||||||||||||||
| Third parties |
$ | 22,285 | $ | 11,347 | $ | 33,632 | $ | 166,713 | $ | 4,422 | $ | 171,135 | $ | 204,767 | ||||||||||||||
| Related parties |
2,724 | 4,359 | 7,083 | 169 | — | 169 | 7,252 | |||||||||||||||||||||
| Total Revenues(1) |
25,009 | 15,706 | 40,715 | 166,882 | 4,422 | 171,304 | 212,019 | |||||||||||||||||||||
| Cost of sales(1) |
(10,500 | ) | (3,574 | ) | (14,074 | ) | (105,428 | ) | (3,216 | ) | (108,644 | ) | (122,718 | ) | ||||||||||||||
| Related parties |
— | — | — | (45,434 | ) | — | (45,434 | ) | (45,434 | ) | ||||||||||||||||||
| Depreciation |
(4,787 | ) | (1,467 | ) | (6,254 | ) | (2,257 | ) | (53 | ) | (2,310 | ) | (8,564 | ) | ||||||||||||||
| Total Cost of Sales |
(15,287 | ) | (5,041 | ) | (20,328 | ) | (153,119 | ) | (3,269 | ) | (156,388 | ) | (176,716 | ) | ||||||||||||||
| Gross Profit |
9,722 | 10,665 | 20,387 | 13,763 | 1,153 | 14,916 | 35,303 | |||||||||||||||||||||
| Selling, general & administrative expenses |
4,045 | 3,620 | 7,665 | 7,815 | 317 | 8,132 | 15,797 | |||||||||||||||||||||
| Income from Operations |
5,677 | 7,045 | 12,722 | 5,948 | 836 | 6,784 | 19,506 | |||||||||||||||||||||
| Expense from investments |
— | — | — | — | (248 | ) | (248 | ) | (248 | ) | ||||||||||||||||||
| Gain/(loss) on disposals of plant, property & equipment |
(19 | ) | (3 | ) | (22 | ) | 10 | — | 10 | (12 | ) | |||||||||||||||||
| Total Non-Operating Income/(Expense) |
(19 | ) | (3 | ) | (22 | ) | 10 | (248 | ) | (238 | ) | (260 | ) | |||||||||||||||
| Income before Taxes |
5,658 | 7,042 | 12,700 | 5,958 | 588 | 6,546 | 19,246 | |||||||||||||||||||||
| Income tax expense |
(1,599 | ) | (1,811 | ) | (3,410 | ) | (2,223 | ) | (206 | ) | (2,429 | ) | (5,839 | ) | ||||||||||||||
| Minority interest |
— | — | — | (24 | ) | — | (24 | ) | (24 | ) | ||||||||||||||||||
| Net Income |
$ | 4,059 | $ | 5,231 | $ | 9,290 | $ | 3,711 | $ | 382 | $ | 4,093 | $ | 13,383 | ||||||||||||||
| Capital expenditure |
$ | 22,246 | $ | 7,158 | $ | 29,404 | $ | 2,530 | $ | 10 | $ | 2,540 | $ | 31,944 | ||||||||||||||
| (1) | Includes intersegment eliminations. |
124
Table of Contents
WESTWAY GROUP, INC.
NOTES TO CONSOLIDATED FINANCIAL STATEMENTS—(Continued)
Predecessor Combined Carve-Out Year Ended October 31, 2008
| Bulk Liquid Storage | Liquid Feed Supplements | |||||||||||||||||||||||||||||||
| USA | Rest of World(1) |
Total(1) | USA | Rest of World |
Total | Inter- segment Eliminations |
Total(1) | |||||||||||||||||||||||||
| Revenues |
||||||||||||||||||||||||||||||||
| Third parties |
$ | 41,018 | $ | 24,625 | $ | 65,643 | $ | 282,760 | $ | 7,809 | $ | 290,569 | $ | — | $ | 356,212 | ||||||||||||||||
| Related parties |
5,761 | 8,350 | 14,111 | — | — | — | — | 14,111 | ||||||||||||||||||||||||
| Inter-segment |
895 | 23 | 918 | 100 | — | 100 | (1,018 | ) | — | |||||||||||||||||||||||
| Total Revenues |
47,674 | 32,998 | 80,672 | 282,860 | 7,809 | 290,669 | (1,018 | ) | 370,323 | |||||||||||||||||||||||
| Cost of sales (restated)(1) |
(18,015 | ) | (5,583 | ) | (23,598 | ) | (184,827 | ) | (6,883 | ) | (191,710 | ) | — | (215,308 | ) | |||||||||||||||||
| Related parties |
— | — | — | (72,781 | ) | — | (72,781 | ) | 1,018 | (71,763 | ) | |||||||||||||||||||||
| Depreciation |
(8,404 | ) | (2,970 | ) | (11,374 | ) | (3,784 | ) | (100 | ) | (3,884 | ) | — | (15,258 | ) | |||||||||||||||||
| Total Cost of Sales (restated)(1) |
(26,419 | ) | (8,553 | ) | (34,972 | ) | (261,392 | ) | (6,983 | ) | (268,375 | ) | 1,018 | (302,329 | ) | |||||||||||||||||
| Gross Profit (restated)(1) |
21,255 | 24,445 | 45,700 | 21,468 | 826 | 22,294 | — | 67,994 | ||||||||||||||||||||||||
| Selling, general & administrative expenses (restated)(1) |
6,751 | 13,070 | 19,821 | 15,369 | 628 | 15,997 | — | 35,818 | ||||||||||||||||||||||||
| Income from Operations |
14,504 | 11,375 | 25,879 | 6,099 | 198 | 6,297 | — | 32,176 | ||||||||||||||||||||||||
| Expense from investments |
— | — | — | — | (174 | ) | (174 | ) | — | (174 | ) | |||||||||||||||||||||
| Gain/(loss) on disposals of plant, property & equipment |
6,974 | — | 6,974 | (102 | ) | 3 | (99 | ) | — | 6,875 | ||||||||||||||||||||||
| Total Non-Operating Income/(Expense) |
6,974 | — | 6,974 | (102 | ) | (171 | ) | (273 | ) | — | 6,701 | |||||||||||||||||||||
| Income before Taxes |
21,478 | 11,375 | 32,853 | 5,997 | 27 | 6,024 | — | 38,877 | ||||||||||||||||||||||||
| Income tax expense |
(6,562 | ) | (2,948 | ) | (9,510 | ) | (2,513 | ) | (18 | ) | (2,531 | ) | — | (12,041 | ) | |||||||||||||||||
| Minority interest |
— | — | — | 131 | — | 131 | — | 131 | ||||||||||||||||||||||||
| Net Income |
$ | 14,916 | $ | 8,427 | $ | 23,343 | $ | 3,615 | $ | 9 | $ | 3,624 | $ | — | $ | 26,967 | ||||||||||||||||
| Capital expenditure |
$ | 20,834 | $ | 8,658 | $ | 29,492 | $ | 5,254 | $ | 228 | $ | 5,482 | $ | — | $ | 34,974 | ||||||||||||||||
| Plant, property & equipment—net |
$ | 77,961 | $ | 29,484 | $ | 107,445 | $ | 28,952 | $ | 993 | $ | 29,945 | $ | — | $ | 137,390 | ||||||||||||||||
| Goodwill |
$ | — | $ | — | $ | — | $ | 4,972 | $ | — | $ | 4,972 | $ | — | $ | 4,972 | ||||||||||||||||
| Total Assets |
$ | 81,239 | $ | 34,441 | $ | 115,680 | $ | 90,553 | $ | 5,511 | $ | 96,064 | $ | — | $ | 211,744 | ||||||||||||||||
| (1) | Restated for reclassification of operating costs. See Note 3. |
125
Table of Contents
WESTWAY GROUP, INC.
NOTES TO CONSOLIDATED FINANCIAL STATEMENTS—(Continued)
Predecessor Combined Carve-Out Year Ended October 31, 2007
| Bulk Liquid Storage | Liquid Feed Supplements | |||||||||||||||||||||||||||||||
| USA | Rest of World |
Total | USA(1) | Rest of World(1) |
Total | Inter- segment Eliminations |
Total | |||||||||||||||||||||||||
| (restated) | (restated) | |||||||||||||||||||||||||||||||
| Revenues |
||||||||||||||||||||||||||||||||
| Third parties |
$ | 37,396 | $ | 22,624 | $ | 60,020 | $ | 216,810 | $ | 6,061 | $ | 222,871 | $ | — | $ | 282,891 | ||||||||||||||||
| Related parties |
5,449 | 4,161 | 9,610 | — | — | — | — | 9,610 | ||||||||||||||||||||||||
| Inter-segment |
823 | — | 823 | 690 | — | 690 | (1,513 | ) | — | |||||||||||||||||||||||
| Total Revenues |
43,668 | 26,785 | 70,453 | 217,500 | 6,061 | 223,561 | (1,513 | ) | 292,501 | |||||||||||||||||||||||
| Cost of sales |
(20,281 | ) | (4,924 | ) | (25,205 | ) | (132,259 | ) | (4,724 | ) | (136,983 | ) | — | (162,188 | ) | |||||||||||||||||
| Related parties |
— | — | — | (64,341 | ) | (26 | ) | (64,367 | ) | 1,513 | (62,854 | ) | ||||||||||||||||||||
| Depreciation |
(7,810 | ) | (2,961 | ) | (10,771 | ) | (4,207 | ) | (99 | ) | (4,306 | ) | — | (15,077 | ) | |||||||||||||||||
| Total Cost of Sales |
(28,091 | ) | (7,885 | ) | (35,976 | ) | (200,807 | ) | (4,849 | ) | (205,656 | ) | 1,513 | (240,119 | ) | |||||||||||||||||
| Gross Profit |
15,577 | 18,900 | 34,477 | 16,693 | 1,212 | 17,905 | — | 52,382 | ||||||||||||||||||||||||
| Selling, general & administrative expenses |
5,306 | 10,712 | 16,018 | 13,372 | 542 | 13,914 | — | 29,932 | ||||||||||||||||||||||||
| Income from Operations |
10,271 | 8,188 | 18,459 | 3,321 | 670 | 3,991 | — | 22,450 | ||||||||||||||||||||||||
| Income from investments |
— | — | — | — | 67 | 67 | — | 67 | ||||||||||||||||||||||||
| (Loss)/gain on disposals of plant, property & equipment |
(3 | ) | (183 | ) | (186 | ) | 4,449 | (79 | ) | 4,370 | — | 4,184 | ||||||||||||||||||||
| Total Non-Operating (Expense)/Income |
(3 | ) | (183 | ) | (186 | ) | 4,449 | (12 | ) | 4,437 | — | 4,251 | ||||||||||||||||||||
| Income before taxes |
10,268 | 8,005 | 18,273 | 7,770 | 658 | 8,428 | — | 26,701 | ||||||||||||||||||||||||
| Income tax expense |
(3,902 | ) | (2,107 | ) | (6,009 | ) | (3,214 | ) | (14 | ) | (3,228 | ) | — | (9,237 | ) | |||||||||||||||||
| Minority interest |
— | — | — | 98 | — | 98 | — | 98 | ||||||||||||||||||||||||
| Net Income |
$ | 6,366 | $ | 5,898 | $ | 12,264 | $ | 4,654 | $ | 644 | $ | 5,298 | $ | — | $ | 17,562 | ||||||||||||||||
| Capital expenditure |
$ | 18,428 | $ | 4,547 | $ | 22,975 | $ | 5,886 | $ | 73 | $ | 5,959 | $ | — | $ | 28,934 | ||||||||||||||||
| Plant, property & equipment—net |
$ | 72,498 | $ | 24,551 | $ | 97,049 | $ | 27,585 | $ | 4,728 | $ | 32,313 | $ | — | $ | 129,362 | ||||||||||||||||
| Goodwill |
$ | — | $ | — | $ | — | $ | 4,972 | $ | — | $ | 4,972 | $ | — | $ | 4,972 | ||||||||||||||||
| Total Assets |
$ | 76,249 | $ | 32,077 | $ | 108,326 | $ | 72,881 | $ | 6,347 | $ | 79,228 | $ | — | $ | 187,554 | ||||||||||||||||
| (1) | Restated for reclassification of revenue between USA and Rest of World. See Note 3. |
18. EQUITY COMPENSATION—PREDECESSOR
Stock Award Plans
ED&F Man has two stock award plans: the ED&F Man Loyalty Plan (the “Loyalty Plan”) and the Deferred Incentive Plan (“DIP”). The Group’s stock award plans provide for the granting of options to purchase shares to officers and key employees for no consideration, with an exercise price of $0, on the date of grant and do not require shareholder approval. Awards granted under the Loyalty Plan vest over four years and lapse one year after vesting. Awards granted under the DIP vest on a pro-rata basis over two to four years and lapse 20 business days after vesting.
126
Table of Contents
WESTWAY GROUP, INC.
NOTES TO CONSOLIDATED FINANCIAL STATEMENTS—(Continued)
These stock awards are valued at the fair market value of the underlying shares at the date of grant since there is no exercise price. Fair market value of the underlying ED&F Man stock is determined based on ED&F Man’s management estimates through contemporaneous valuations. Treasury shares are used to satisfy stock award exercises. The fair market value at the time of grant, less an estimate for pre-vesting forfeitures, is amortized to expense over the period of vesting. Based on historical experience, the Group estimates pre-vesting forfeitures to be approximately 7% of the stock awards.
The predecessor compensation cost charged against income for these plans was $940,000 and $533,000, for years ended October 31, 2008 and 2007 respectively. The associated predecessor total income tax benefit recognized in the income statement was $371,000 and $213,000, for years ended October 31, 2008 and 2007 respectively.
The details of the predecessor stock award activity for the two years ended October 31, 2008 are as follows:
| Predecessor | |||
| Number of Stock Awards |
|||
| Stock Awards outstanding as of October 31, 2006 |
1,091,951 | ||
| Granted |
135,583 | ||
| Exercised |
(274,611 | ) | |
| Cancellations/Forfeitures |
— | ||
| Stock Awards outstanding as of October 31, 2007 |
952,923 | ||
| Granted |
521,861 | ||
| Exercised |
(309,762 | ) | |
| Cancellations/Forfeitures |
— | ||
| Stock Awards outstanding as of October 31, 2008 |
1,165,022 |
The details of predecessor outstanding, vested and exercisable shares at October 31, 2008 were as follows:
| Predecessor | ||||||
| Number of Stock Awards |
Weighted Average remaining contractual Life (Years) |
Aggregate Intrinsic Value | ||||
| Stock Awards outstanding as of October 31, 2008 |
1,165,022 | 2.02 | 3,342 | |||
| Stock Awards vested and expected to vest at October 31, 2008 |
1,083,470 | 2.02 | 3,108 | |||
| Exercisable as of October 31, 2008 |
— | n/a | n/a | |||
The total intrinsic values of the stock awards exercised during the years ended October 31, 2008 and 2007 were $889,000 and $762,000 respectively. The weighted-average grant date intrinsic value of stock awards granted during the years ended October 31, 2008 and 2007 are $2.87 and $2.77 respectively. No cash was received from the exercise of these stock awards as the exercise price was $0 for these awards, as described above. The tax benefit recognized related to compensation expense for stock awards amounted to $152,000 and $193,000 for the years ended October 31, 2008 and 2007 respectively. The actual tax benefit realized for the tax deductions from stock award exercises was $235,000 and $185,000 for the years ended October 31, 2008 and 2007 respectively.
127
Table of Contents
WESTWAY GROUP, INC.
NOTES TO CONSOLIDATED FINANCIAL STATEMENTS—(Continued)
The following table summarizes information about predecessor non-vested stock awards for the two years ended October 31, 2008 (unaudited):
| Predecessor | ||||||
| Number of Stock Awards |
Weighted Average Grant Date Fair Value | |||||
| Non vested stock awards as of October 31, 2006 |
1,091,951 | $ | 1.88 | |||
| Granted |
135,583 | $ | 2.77 | |||
| Vested |
(274,611 | ) | $ | 1.48 | ||
| Forfeited |
— | — | ||||
| Non vested stock awards as of October 31, 2007 |
952,923 | $ | 2.12 | |||
| Granted |
521,861 | $ | 2.87 | |||
| Vested |
(309,762 | ) | $ | 1.72 | ||
| Forfeited |
— | — | ||||
| Non vested stock awards as of October 31, 2008 |
1,165,022 | $ | 2.56 | |||
As of October 31, 2008, there was approximately $1,281,000 of total unrecognized compensation cost related to non-vested stock awards which is expected to be recognized over a weighted-average period of 1.9 years. The total fair value of stock awards that vested during the years ended October 31, 2008 and 2007 was $889,000 and $762,000 respectively.
Total compensation expense recognized to date related to stock awards that vested during the years ended October 31, 2008 and 2007 amounted to $528,000 and $411,000 respectively.
Employee Share Purchase Plan
ED&F Man has an employee stock purchase plan (“ESPP”) for eligible employees. The plan was created on February 27, 2002 and is administered by the ED&F Man Employee Trust (the “Trust”). Under this plan, for every one share in ED&F Man purchased in cash by eligible employees, employees receive two additional shares (“Additional Shares”) and concurrently enter into a non recourse, interest free loan agreement with the Trust for the value of these additional two shares. The non-recourse employee loans are secured only by the stock and have no expiry date. For accounting purposes the non-recourse loans and shares together are valued as a stock option. The ESPP is therefore compensatory and in accordance with U.S. GAAP, the fair value of the ESPP awards is measured using the Black-Scholes option pricing model. As there is no requisite service period, the expense is recognized immediately. There were no awards under the ESPP in 2008.
The following weighted-average assumptions were used to determine the fair value of the ESPP awards granted in 2008, and 2007:
| Predecessor | |||||
| Year ended October 31, | |||||
| 2008 | 2007 | ||||
| Expected dividend yield |
n/a | 0 | % | ||
| Expected volatility |
n/a | 6.13 | % | ||
| Risk free interest rates |
n/a | 4.84 | % | ||
| Expected term—options |
n/a | 4 years | |||
| Expected term ESPP |
n/a | 12 years | |||
128
Table of Contents
WESTWAY GROUP, INC.
NOTES TO CONSOLIDATED FINANCIAL STATEMENTS—(Continued)
The expected dividend yield was assumed to be 0% during the year ended October 31, 2007 because ED&F Man did not pay, and Management did not expect to pay, a dividend. ED&F Man has an internal market for shares in which shares may only be exchanged at the “fair price” defined by the Articles of Association. ED&F Man has a history of trades at the defined price creating the internal market and therefore has determined this is an appropriate approximation of fair value. Expected volatility was derived from an analysis of the ED&F Man’s defined fair price from the period of incorporation to the date of each reporting period. The weighted average risk-free rates are the average interest rates of U.S. Treasury yields that match the expected lives of the outstanding employee stock purchase plan on the dates of grant. The expected term represents the period over which the ESPP awards are expected to be outstanding based on historical data. In accordance with U.S. GAAP, the Group estimates pre-vesting forfeitures to be 0% for the ESPP awards granted during the years ended October 31, 2008, and 2007, based on historical experience.
The compensation cost that has been charged against income for the ESPP was $0 and $144,000 for the years ended October 31, 2008 and 2007 respectively. No income tax benefit was recognized in the combined carve-out statements of income for the ESPP arrangements for any period.
During the year ended October 31, 2008 no common stock (shares purchased by non recourse loans) were purchased. For the year ended October 31, 2007, 117,568 shares were purchased pursuant to the agreement with the Trust. The weighted average grant-date fair value of each designated share purchased under the ESPP was therefore $1.22 in the year ended October 31, 2007.
The following table summarizes information concerning outstanding and exercisable ESPP awards as of October 31, 2008:
| Predecessor | |||||||
| ESPP Awards outstanding and exercisable | |||||||
| Number Outstanding |
Weighted Average Remaining Life |
Weighted Average Exercise Price |
Aggregate Intrinsic Value | ||||
| 19,404 | N/A | 1.28 | $ | 31,000 | |||
| 28,924 | N/A | 1.48 | $ | 40,000 | |||
| 48,402 | N/A | 1.72 | $ | 58,000 | |||
| 67,329 | N/A | 2.03 | $ | 56,000 | |||
| 117,050 | N/A | 2.39 | $ | 57,000 | |||
| 117,568 | N/A | 2.77 | $ | 11,000 | |||
| 398,677 | N/A | 2.24 | $ | 253,000 | |||
129
Table of Contents
WESTWAY GROUP, INC.
NOTES TO CONSOLIDATED FINANCIAL STATEMENTS—(Continued)
19. Quarterly Financial Data (Unaudited)
The unaudited consolidated results of operations by quarter are summarized below (in thousands except per share data). For comparative purposes, net loss per share for the predecessor was calculated using the weighted average number of common shares outstanding for the Company as of December 31, 2009 and does not reflect the actual basic and diluted weighted shares outstanding at the end of the applicable periods.
| Year Ended December 31, 2009 | ||||||||||||||
| First Quarter | Second Quarter(1) | Third Quarter | Fourth Quarter | |||||||||||
| Net Revenues |
$ | — | $ | 25,767 | $ | 73,705 | $ | 89,315 | ||||||
| Cost of sales |
— | 16,236 | 44,852 | 54,328 | ||||||||||
| Operating income (loss) |
(321 | ) | (12,421 | ) | 5,898 | 6,878 | ||||||||
| Net income (loss) |
$ | (117 | ) | $ | (9,491 | ) | $ | 4,087 | $ | 1,794 | ||||
| Net income (loss) attributable to Westway Group, Inc. |
(117 | ) | (9,862 | ) | 3,084 | 3,235 | ||||||||
| Net income (loss) per share subject to possible redemption—basic & diluted |
$ | (0.01 | ) | $ | — | $ | — | $ | — | |||||
| Net income (loss) per common share—basic |
$ | (0.01 | ) | $ | (0.50 | ) | $ | 0.05 | $ | 0.04 | ||||
| Net income (loss) per common share—diluted |
$ | (0.01 | ) | $ | (0.50 | ) | $ | 0.05 | $ | 0.04 | ||||
| (1) | Includes one-time business combination expenses of $13.9 million for advisory, investment banking, accounting, legal, and other professional and consulting fees. |
| Year Ended December 31, 2008 | ||||||||||||||||
| First Quarter | Second Quarter | Third Quarter | Fourth Quarter | |||||||||||||
| Net Revenues |
$ | — | $ | — | $ | — | $ | — | ||||||||
| Cost of sales |
— | — | — | — | ||||||||||||
| Operating Income |
(187 | ) | (204 | ) | (295 | ) | (183 | ) | ||||||||
| Net income (loss) |
$ | 417 | $ | 73 | $ | 342 | $ | (91 | ) | |||||||
| Net income (loss) attributable to Westway Group, Inc. |
417 | 73 | 342 | (91 | ) | |||||||||||
| Net income (loss) per share subject to possible redemption—basic & diluted |
$ | 0.04 | $ | 0.01 | $ | 0.01 | $ | (0.01 | ) | |||||||
| Net income (loss) per common share—basic |
$ | 0.02 | $ | 0.00 | $ | 0.02 | $ | 0.00 | ||||||||
| Net income (loss) per common share—diluted |
$ | 0.01 | $ | 0.00 | $ | 0.01 | $ | 0.00 | ||||||||
| Predecessor Combined Carve-out For Period November 1, 2008 through May 28, 2009 | ||||||||||||
| First Quarter ended January 31, 2009 |
Second Quarter ended April 30, 2009 |
Third Quarter ended July 31, 2009(1) |
Fourth Quarter ended October 31, 2009(1) | |||||||||
| Net revenues |
$ | 105,264 | $ | 84,276 | $ | 22,479 | $ | — | ||||
| Cost of revenues |
87,611 | 70,163 | 18,942 | — | ||||||||
| Gross profit |
17,653 | 14,113 | 3,537 | — | ||||||||
| Net income (loss) |
7,438 | 4,913 | 1,032 | — | ||||||||
| (1) | Operations as predecessor ceased on May 28, 2009. |
130
Table of Contents
WESTWAY GROUP, INC.
NOTES TO CONSOLIDATED FINANCIAL STATEMENTS—(Continued)
| Predecessor Combined Carve-out For Year Ended October 31, 2008 | ||||||||||||
| First Quarter ended January 31, 2008(2) |
Second Quarter ended April 30, 2008(2) |
Third Quarter ended July 31, 2008 |
Fourth Quarter ended October 31, 2008 | |||||||||
| Net revenues |
$ | 97,941 | $ | 86,319 | $ | 86,368 | $ | 99,695 | ||||
| Cost of revenues (restated)(2) |
80,520 | 69,160 | 70,951 | 81,698 | ||||||||
| Gross profit (restated)(2) |
17,421 | 17,159 | 15,417 | 17,997 | ||||||||
| Net income (loss) |
5,618 | 6,193 | 3,558 | 11,598 | ||||||||
| (2) | Restated for reclassification of operating costs. See Note 3. |
In February 2010, as required by and as additional security for our obligations under the Credit Agreement, Westway Terminal Company LLC, Westway Terminal Cincinnati LLC, and Westway Feed Products LLC, all subsidiaries of ours, entered into seven first priority mortgage liens on their fee or leasehold interests, as applicable, in certain terminal and feed facilities having an aggregate fair market value of approximately $120 million. The facilities include two terminal facilities and one feed facility in Houston, Texas; a terminal facility and a feed facility in Cincinnati, Ohio; and a terminal facility in Grays Harbor, Aberdeen, Washington.
In March 2010, the Company and the ED&F Man group reached a non-binding agreement in principle for the ED&F Man group’s lease of the Company’s Port of Inchon, South Korea terminal and all of the improvements and equipment thereon, to commence upon the expiration in May, 2010 of the terminal service agreement between the parties. Currently, the ED&F Man group is the Company’s sole bulk liquid storage customer at the Korean terminal. Pursuant to the proposed lease, the ED&F Man group would take full control and responsibility for the Korean terminal and the improvements and equipment thereon, hire the Company’s employees at the terminal, and operate the terminal for the storage of its bulk liquids. The lease would be a triple-net lease (where all expenses, insurance and taxes related to the leased property would be paid by the lessee) and would provide for rental to be paid to the Company in the amount of $400,000 per year. The lease is also expected to have a principal term of three-years and grant an option to the ED&F Man group for the purchase of the Korean terminal and all of its improvements and equipment for a purchase price of $3,000,000, exercisable at any time during the term of the lease.
131
Table of Contents
| ITEM 9. | CHANGES IN AND DISAGREEMENTS WITH ACCOUNTANTS ON ACCOUNTING AND FINANCIAL DISCLOSURE |
Dismissal of Independent Public Accountants
On June 30, 2009, Rothstein, Kass & Company, P.C. was dismissed as the principal accountant to audit the financial statements of Westway Group, Inc. (the “Company”). The decision to change accountants was approved by the Audit Committee of the Board of Directors.
The reports of Rothstein, Kass & Company, P.C. on the Company’s financial statements for the fiscal years ended December 31, 2008 and December 31, 2007 did not contain an adverse opinion or a disclaimer of opinion and were not qualified or modified as to uncertainty, audit scope, or accounting principles, except that the audit report of Rothstein, Kass & Company, P.C. for the financial statements of the Company as of December 31, 2008 contained a paragraph stating:
“The accompanying financial statements have been prepared assuming that Shermen WSC Acquisition Corp. will continue as a going concern. As discussed in Note A to the financial statements, Shermen WSC Acquisition Corp. will face a mandatory liquidation if a business combination is not consummated by May 30, 2009, which raises substantial doubt about its ability to continue as a going concern. The financial statements do not include any adjustments that might result from the outcome of this uncertainty.”
During the Company’s two most recent fiscal years (ended December 31, 2008 and 2007) and the subsequent interim period preceding the dismissal, (i) there were no disagreements with Rothstein, Kass & Company, P.C. on any matter of accounting principles or practices, financial statement disclosure, or auditing scope or procedure, which disagreements, if not resolved to the satisfaction of Rothstein, Kass & Company, P.C., would have caused it to make reference to the subject matter of the disagreements in connection with its report, and (ii) there were no “reportable events” as that term is described in Item 304(a)(1)(v) of Regulation S-K.
Engagement of New Independent Public Accountants
On June 30, 2009, the Company newly engaged Ernst & Young LLP as the principal accountant to audit the Company’s financial statements. Ernst & Young LLP has acted as the auditors of ED&F Man Holdings, Ltd., including its bulk liquid storage and liquid feed supplements businesses that were acquired by the Company on May 28, 2009. Ernst & Young LLP audited the combined carve-out financial statements of the acquired business that were included in the Company’s proxy statement dated March 9, 2009.
During the Company’s two most recent fiscal years (ended December 31, 2008 and 2007) and the subsequent interim period prior to engaging Ernst & Young LLP, neither the Company nor someone on its behalf consulted Ernst & Young LLP regarding either (i) the application of accounting principles to a specified transaction, either completed or proposed, or the type of audit opinion that might be rendered on the Company’s financial statements, as to which either a written report was provided to the Company or oral advice was provided that Ernst & Young LLP concluded was an important factor considered by the Company in reaching a decision as to the accounting, auditing, or financial reporting issue; or (ii) any matter that was either the subject of a disagreement or a reportable event (in each case as defined in Item 304(a)(2)(ii) of Regulation S-K).
| ITEM 9A. | CONTROLS AND PROCEDURES |
Evaluation of Disclosure Controls and Procedures
Based on management’s evaluation (with the participation of our Chief Executive Officer (CEO) and Chief Financial Officer (CFO)), as of the end of the period covered by this report, our CEO and CFO have concluded that our disclosure controls and procedures (as defined in Rules 13a-15(e) and 15d-15(e) under the Securities Exchange Act of 1934, as amended (the Exchange Act)) are effective to provide reasonable assurance that information required to be disclosed by us in reports that we file or submit under the Exchange Act is recorded,
132
Table of Contents
processed, summarized, and reported within the time periods specified in Securities and Exchange Commission rules and forms and is accumulated and communicated to management, including our principal executive officer and principal financial officer, as appropriate to allow timely decisions regarding required disclosure.
Internal Control over Financial Reporting
Our management is responsible for establishing and maintaining adequate internal control over financial reporting. This annual report does not include a report of management’s assessment regarding internal control over financial reporting or the related attestation report of our registered independent public accounting firm. Before May 28, 2009, we were a special purpose acquisition company organized to acquire an operating business. On May 28, 2009, we consummated the business combination by which we acquired the bulk liquid storage and liquid feed supplements businesses of the ED&F Man group in exchange for shares of our common stock and preferred stock and cash. Our management considers this acquisition to be material and significant to us and our consolidated financial statements. Upon the completion of the business combination, our legacy internal controls, which were not appropriate for an operating company, were entirely replaced by those of the acquired business, which were appropriate for an operating company but not designed to support reporting under Section 13(a) of the Exchange Act nor to comply with the requirements of the Sarbanes-Oxley Act of 2002 with respect to internal control over financial reporting. Due to the business combination during 2009 and the complete replacement of our internal controls with those of the acquired business, and consistent with guidelines established by the Securities and Exchange Commission, management has excluded the assessment of all of the Company’s internal control over financial reporting and has not conducted an evaluation or assessment of the effectiveness of our internal control over financial reporting as of December 31, 2009.
Changes in Internal Control over Financial Reporting During the Last Fiscal Quarter
During the fourth quarter of 2009, we continued the process of establishing and materially revising our policies and procedures for internal control over financial reporting with the intention of ensuring they are appropriate for reporting under Section 13(a) of the Exchange Act and in full compliance with the requirements of the Sarbanes-Oxley Act of 2002, which process we expect to complete during 2010.
Inherent Limitations on Effectiveness of Controls
Because of inherent limitations, disclosure controls and procedures provide only reasonable, and not absolute, assurance that their objectives are met.
| ITEM 9B. | OTHER INFORMATION |
None.
133
Table of Contents
PART III
| ITEM 10. | DIRECTORS, EXECUTIVE OFFICERS AND CORPORATE GOVERNANCE |
Information with respect to this item is incorporated herein by reference to Westway Group Inc.’s Proxy Statement for its Annual Meeting of Stockholders to be held in 2010.
We have adopted a Code of Conduct and Ethics that applies to all of our employees, including our principal executive officer, principal financial officer, principal accounting officer, controller, and any persons performing similar functions. Our Code of Conduct and Ethics is posted on our internet website, which is www.westway.com. Also, we will provide to any person without charge, upon request, a copy of our Code of Conduct and Ethics; such request may be made by sending a letter to Tom Masilla, Westway Group, Inc., 365 Canal Street, Suite 2900 New Orleans, LA 70130. We intend to satisfy the disclosure requirement under Item 10 of Form 8-K regarding an amendment to, or waiver from, certain provisions of our Code of Conduct and Ethics by posting any such information on our internet website.
| ITEM 11. | EXECUTIVE COMPENSATION |
Information with respect to this item is incorporated herein by reference to Westway Group Inc.’s Proxy Statement for its Annual Meeting of Stockholders to be held in 2010.
| ITEM 12. | SECURITY OWNERSHIP OF CERTAIN BENEFICIAL OWNERS AND MANAGEMENT AND RELATED STOCKHOLDER MATTERS |
Information with respect to this item is incorporated herein by reference to Westway Group Inc.’s Proxy Statement for its Annual Meeting of Stockholders to be held in 2010.
| ITEM 13. | CERTAIN RELATIONSHIPS AND RELATED TRANSACTIONS, AND DIRECTOR INDEPENDENCE |
Information with respect to this item is incorporated herein by reference to Westway Group Inc.’s Proxy Statement for its Annual Meeting of Stockholders to be held in 2010.
| ITEM 14. | PRINCIPAL ACCOUNTANT FEES AND SERVICES |
Information with respect to this item is incorporated herein by reference to Westway Group Inc.’s Proxy Statement for its Annual Meeting of Stockholders to be held in 2010.
134
Table of Contents
PART IV
| ITEM 15. | EXHIBITS AND FINANCIAL STATEMENT SCHEDULES |
List of Financial Statements Filed as Part of this Report
The following consolidated financial statements are filed in Item 8 of Part II of this report:
| Financial Statement |
Page | |
| 82 | ||
| 84 | ||
| 86 | ||
| 89 | ||
| 90 |
List of Financial Statement Schedules Filed as Part of this Report
Financial statement schedules have not been included because they are not required, not applicable, immaterial, or the information required has been included elsewhere herein.
List of Exhibits Filed as Part of this Report
See the Exhibit Index following the Signature page, which index is hereby incorporated by reference.
135
Table of Contents
Pursuant to the requirements of Section 13 or 15(d) of the Securities Exchange Act of 1934, the registrant has duly caused this report to be signed on its behalf by the undersigned, thereunto duly authorized.
| WESTWAY GROUP, INC. | ||||||
| March 16, 2010 | By: | /S/ PETER J. M. HARDING | ||||
| Peter J. M. Harding Chief Executive Officer and Director | ||||||
Pursuant to the requirements of the Securities Exchange Act of 1934, this report has been signed below by the following persons on behalf of the registrant and in the capacities and on the dates indicated.
| March 16, 2010 | By: | /S/ FRANCIS P. JENKINS, JR. | ||||
| Francis P. Jenkins, Jr. Chairman and Director | ||||||
| March 16, 2010 | By: | /S/ G. KENNETH MOSHENEK | ||||
| G. Kenneth Moshenek Director | ||||||
| March 16, 2010 | By: | /S/ PETER J. M. HARDING | ||||
| Peter J. M. Harding Director and Chief Executive Officer | ||||||
| March 16, 2010 | By: | /S/ PHILIP A. HOWELL | ||||
| Philip A. Howell Director | ||||||
| March 16, 2010 | By: | /S/ JAMES B. JENKINS | ||||
| James B. Jenkins Director | ||||||
| March 16, 2010 | By: | /S/ JOHN E. TOFFOLON, JR. | ||||
| John E. Toffolon, Jr. Director | ||||||
| March 16, 2010 | By: | /S/ GREGORY F. HOLT | ||||
| Gregory F. Holt Director | ||||||
| March 16, 2010 | By: | /S/ THOMAS A. MASILLA, JR. | ||||
| Thomas A. Masilla, Jr. Chief Financial Officer and Principal Accounting Officer | ||||||
136
Table of Contents
The descriptions of various agreements in this Form 10-K do not purport to describe all of the terms of the agreements and are qualified in their entirety by reference to the complete text of the agreements, which are filed as exhibits to this Form 10-K and are incorporated herein by reference. The agreements have been filed to provide investors with information regarding their terms, but not to provide any other factual information about the Company. The representations and warranties and other provisions of the agreements allocate risks and establish rights and obligations among the parties thereto, and should not be relied on by investors as statements of fact. Moreover, information concerning the subject matter of the representations, warranties, and other provisions may change after the date of the agreements, which subsequent information may or may not be fully reflected in the Company’s public disclosures.
| Exhibit |
Exhibit Title | |
| 2.1 | Amended and Restated Transaction Agreement, dated May 1, 2009, among Westway Group, Inc. (formerly known as Shermen WSC Acquisition Corp.), Terminal Merger Sub LLC, Feed Merger Sub LLC, ED&F Man Holdings Limited, Westway Holdings Corporation, Westway Terminal Company Inc. and Westway Feed Products, Inc. (incorporated by reference to Exhibit 2.1 of the Company’s Current Report on Form 8-K filed with the SEC on May 8, 2009) | |
| 3.1 | Amended and Restated Certificate of Incorporation, filed with the Secretary of State of the State of Delaware on May 28, 2009 (incorporated by reference to Exhibit 3.1 of the Company’s Quarterly Report, as Amended, on Form 10-Q/A filed with the SEC on August 17, 2009) | |
| 3.2 | Amended and Restated By-laws (incorporated by reference to Exhibit 3.2 of the Company’s Quarterly Report, as Amended, on Form 10-Q/A filed with the SEC on August 17, 2009) | |
| 4.1 | Amended and Restated Certificate of Incorporation, filed with the Secretary of State of the State of Delaware on May 28, 2009 (incorporated by reference to Exhibit 3.1 of the Company’s Quarterly Report, Amended, on Form 10-Q/A filed with the SEC on August 17, 2009) | |
| 4.2 | Amended and Restated By-laws (incorporated by reference to Exhibit 3.2 of the Company’s Quarterly Report, as Amended, on Form 10-Q/A filed with the SEC on August 17, 2009) | |
| 4.3 | Stockholder’s Agreement, dated May 28, 2009, between Westway Group, Inc. and Westway Holdings Corporation (incorporated by reference to Exhibit 10.2 of the Company’s Quarterly Report, as Amended, on Form 10-Q/A filed with the SEC on August 17, 2009) | |
| 4.4 | Interim Facility Agreement, dated May 28, 2009, between Westway Group, Inc., Westway Holdings Netherlands BV, and ED&F Man Treasury Management plc (incorporated by reference to Exhibit 10.8 of the Company’s Form 8-K filed with the SEC on June 2, 2009) | |
| 4.5 | Letter Agreement, dated May 28, 2009, between Westway Group, Inc. and ED&F Man Treasury Management plc (incorporated by reference to Exhibit 10.9 of the Company’s Form 8-K filed with the SEC on June 2, 2009) | |
| 4.6 | Facility Agreement, dated August 6, 2009, between Westway Group, Inc., Westway Holdings Netherlands BV, and ED&F Man Treasury Management plc (incorporated by reference to Exhibit 10.12 of the Company’s Quarterly Report, as Amended, on Form 10-Q/A filed with the SEC on August 17, 2009) | |
| 4.7 | Credit Agreement, dated as of November 12, 2009, among Westway Group, Inc. as borrower, JPMorgan Chase Bank, N.A., as administrative agent, Regions Bank, as syndication agent, CoBank ACB, Rabobank Nederland, SunTrust Bank, and Compass Bank (doing business as BBVA Compass), as documentation agents, and the lenders from time to time parties thereto (incorporated by reference to Exhibit 4.1 of the Company’s Current Report on Form 8-K filed with the SEC on November 17, 2009) | |
137
Table of Contents
| Exhibit |
Exhibit Title | |
| 10.1 | Stock Escrow Agreement, dated May 28, 2009, among Westway Group, Inc., Westway Holdings Corporation, Shermen WSC Holding LLC, and Continental Stock Transfer & Trust Company (incorporated by reference to Exhibit 10.1 of the Company’s Quarterly Report, as Amended, on Form 10-Q/A filed with the SEC on August 17, 2009) | |
| 10.2 | Stockholder’s Agreement, dated May 28, 2009, between Westway Group, Inc. and Westway Holdings Corporation (incorporated by reference to Exhibit 10.2 of the Company’s Quarterly Report, as Amended, on Form 10-Q/A filed with the SEC on August 17, 2009) | |
| 10.3 | Registration Rights Agreement, dated May 28, 2009, among Westway Group, Inc., Westway Holdings Corporation, and certain employees of ED&F Man Holdings Limited or one or more of its affiliates (incorporated by reference to Exhibit 10.3 of the Company’s Quarterly Report, as Amended, on Form 10-Q/A filed with the SEC on August 17, 2009) | |
| 10.4 | †Molasses Supply Agreement, dated May 28, 2009, between Westway Feed Products LLC (a wholly owned subsidiary of Westway Group, Inc.) and ED&F Man Holdings Limited (incorporated by reference to Exhibit A to Exhibit 2.1 of the Company’s Form 8-K filed with the SEC on January 20, 2009) | |
| 10.5 | †Storage Strategic Alliance Agreement and Terminal Service Agreement, dated May 28, 2009, between Westway Terminal Company LLC (a wholly owned subsidiary of Westway Group, Inc.) and ED&F Man Holdings Limited (incorporated by reference to Exhibit I to Exhibit 2.1 of the Company’s Form 8-K filed with the SEC on January 20, 2009) | |
| 10.6 | Shared Services Agreement, dated May 28, 2009, between Westway Group, Inc. and ED&F Man Holdings Limited (incorporated by reference to Exhibit 10.6 of the Company’s Quarterly Report, as Amended, on Form 10- Q/A filed with the SEC on August 17, 2009) | |
| 10.7 | Letter Agreement, dated May 26, 2009, between Westway Group, Inc. (formerly Shermen WSC Acquisition Corp.), Shermen WSC Holding LLC, Terminal Merger Sub LLC, Feed Merger Sub LLC, ED&F Man Holdings Limited, Westway Holdings Corporation, Westway Terminal Company Inc., and Westway Feed Products, Inc. (incorporated by reference to Exhibit 10.7 of the Company’s Form 8-K filed with the SEC on June 2, 2009) | |
| 10.8 | Interim Facility Agreement, dated May 28, 2009, between Westway Group, Inc., Westway Holdings Netherlands BV, and ED&F Man Treasury Management plc (incorporated by reference to Exhibit 10.8 of the Company’s Form 8-K filed with the SEC on June 2, 2009) | |
| 10.9 | Letter Agreement, dated May 28, 2009, between Westway Group, Inc. and ED&F Man Treasury Management plc. (incorporated by reference to Exhibit 10.9 of the Company’s Form 8-K filed with the SEC on June 2, 2009) | |
| 10.10 | Stock Purchase Agreement, dated May 26, 2009, between Westway Group, Inc. (formerly known as Shermen WSC Acquisition Corp.), HBK Master Fund L.P., and HBK Special Opportunity Fund I L.P. (incorporated by reference to Exhibit 10.10 of the Company’s Quarterly Report, as Amended, on Form 10-Q/A filed with the SEC on August 17, 2009) | |
| 10.11 | Stock Purchase Agreement, dated May 26, 2009, between Westway Group, Inc. (formerly known as Shermen WSC Acquisition Corp.) and Fir Tree SPAC Holdings II LLC (incorporated by reference to Exhibit 10.11 of the Company’s Quarterly Report, as Amended, on Form 10-Q/A filed with the SEC on August 17, 2009) | |
| 10.12 | Facility Agreement, dated August 6, 2009, between Westway Group, Inc., Westway Holdings Netherlands BV, and ED&F Man Treasury Management plc (incorporated by reference to Exhibit 10.12 of the Company’s Quarterly Report, as Amended, on Form 10-Q/A filed with the SEC on August 17, 2009) | |
138
Table of Contents
| Exhibit |
Exhibit Title | |
| 10.13 | Credit Agreement, dated as of November 12, 2009, among Westway Group, Inc. as borrower, JPMorgan Chase Bank, N.A., as administrative agent, Regions Bank, as syndication agent, CoBank ACB, Rabobank Nederland, SunTrust Bank, and Compass Bank (doing business as BBVA Compass), as documentation agents, and the lenders from time to time parties thereto (incorporated by reference to Exhibit 4.1 of the Company’s Current Report on Form 8-K filed with the SEC on November 17, 2009) | |
| 10.14 | Guarantee and Collateral Agreement, dated as of November 12, 2009, among Westway Group, Inc., Westway Terminal Company LLC, Westway Terminal Cincinnati LLC, Westway Feed Products, LLC, Westway International Holdings, Inc., and Westway Holdings International, LLC, as grantors, in favor of JPMorgan Chase Bank, N.A., as administrative agent, for the lenders from time to time parties to the Credit Agreement (incorporated by reference to Exhibit 4.2 of the Company’s Current Report on Form 8-K filed with the SEC on November 17, 2009) | |
| 10.15 | Deed of Pledge over Membership Interests, dated November 12, 2009, between Westway International Holdings, Inc., as pledgor, JPMorgan Chase Bank, N.A., as pledgee, and Westway Netherlands Cooperatief U.A. (incorporated by reference to Exhibit 4.3 of the Company’s Current Report on Form 8-K filed with the SEC on November 17, 2009) | |
| 10.16 | Deed of Trust, Security Agreement, Fixture Filing, and Assignment of Leases and Rents, executed as of February 10, 2010 by Westway Feed Products LLC to Jack Smith, Trustee, for the benefit of JPMorgan Chase Bank, N.A., as administrative agent for the lenders from time to time parties to the Credit Agreement (incorporated by reference to Exhibit 10.1 of the Company’s Current Report on Form 8-K filed with the SEC on February 17, 2010) | |
| 10.17 | Leasehold Deed of Trust, Security Agreement, Fixture Filing, and Assignment of Leases and Rents, executed as of February 10, 2010 by Westway Terminal Company LLC to Jack Smith, Trustee, for the benefit of JPMorgan Chase Bank, N.A., as administrative agent for the lenders from time to time parties to the Credit Agreement (incorporated by reference to Exhibit 10.2 of the Company’s Current Report on Form 8-K filed with the SEC on February 17, 2010) | |
| 10.18 | Deed of Trust, Security Agreement, Fixture Filing, and Assignment of Leases and Rents, executed as of February 10, 2010 by Westway Terminal Company LLC to Jack Smith, Trustee, for the benefit of JPMorgan Chase Bank, N.A., as administrative agent for the lenders from time to time parties to the Credit Agreement (incorporated by reference to Exhibit 10.3 of the Company’s Current Report on Form 8-K filed with the SEC on February 17, 2010) | |
| 10.19 | Leasehold Deed of Trust, Security Agreement, Fixture Filing, and Assignment of Leases and Rents, executed as of February 10, 2010 by Westway Terminal Company LLC to Jack Smith, Trustee, for the benefit of JPMorgan Chase Bank, N.A., as administrative agent for the lenders from time to time parties to the Credit Agreement (incorporated by reference to Exhibit 10.4 of the Company’s Current Report on Form 8-K filed with the SEC on February 17, 2010) | |
| 10.20 | Open-End Mortgage, Security Agreement, Fixture Filing, and Assignment of Leases and Rents, executed as of February 10, 2010 by Westway Feed Products LLC for the benefit of JPMorgan Chase, N.A., as administrative agent for the lenders from time to time parties to the Credit Agreement (incorporated by reference to Exhibit 10.5 of the Company’s Current Report on Form 8-K filed with the SEC on February 17, 2010) | |
| 10.21 | Open-End Mortgage, Security Agreement, Fixture Filing, and Assignment of Leases and Rents, executed as of February 10, 2010 by Westway Terminal Cincinnati LLC for the benefit of JPMorgan Chase, N.A., as administrative agent for the lenders from time to time parties to the Credit Agreement (incorporated by reference to Exhibit 10.6 of the Company’s Current Report on Form 8-K filed with the SEC on February 17, 2010) | |
139
Table of Contents
| Exhibit |
Exhibit Title | |
| 10.22 | Leasehold Deed of Trust, Security Agreement, Fixture Filing, and Assignment of Leases and Rents, executed as of February 10, 2010 by Westway Terminal Company LLC to Chicago Title Insurance Company, Trustee, for the benefit of JPMorgan Chase, N.A., as administrative agent for the lenders from time to time parties to the Credit Agreement (incorporated by reference to Exhibit 10.7 of the Company’s Current Report on Form 8-K filed with the SEC on February 17, 2010) | |
| 21.1 | List of Subsidiaries | |
| 23.1 | Consent of Rothstein, Kass & Company, P.C. | |
| 23.2 | Consent of Ernst & Young LLP. (New Orleans Office re. 2009) | |
| 23.3 | Consent of Ernst & Young LLP. (New Orleans Office re. certain predecessor information) | |
| 23.4 | Consent of Ernst & Young LLP. (London Office) | |
| 31.1 | Certification of Principal Executive Officer, pursuant to Section 302 of the Sarbanes-Oxley Act of 2002 | |
| 31.2 | Certification of Principal Financial Officer, pursuant to Section 302 of the Sarbanes-Oxley Act of 2002 | |
| 32.1 | Certification of Principal Executive Officer, pursuant to Section 906 of the Sarbanes-Oxley Act of 2002 | |
| 32.2 | Certification of Principal Financial Officer, pursuant to Section 906 of the Sarbanes-Oxley Act of 2002 | |
| † | Portions of such exhibit have been omitted pursuant to a separate confidential treatment request and such information has been filed separately with the SEC. |
140