Attached files
Table of Contents
UNITED STATES SECURITIES AND EXCHANGE COMMISSION
Washington, D.C. 20549
Form 10-K
(Mark One)
| þ | ANNUAL REPORT PURSUANT TO SECTION 13 OR 15(d) OF THE SECURITIES EXCHANGE ACT OF 1934 |
For the fiscal year ended December 31, 2009
Or
| ¨ | TRANSITION REPORT PURSUANT TO SECTION 13 OR 15(d) OF THE SECURITIES EXCHANGE ACT OF 1934 |
Commission file number: 000-51382
Volcom, Inc.
(Exact name of registrant as specified in its charter)
| Delaware | 33-0466919 | |
| (State or other jurisdiction of incorporation or organization) |
(I.R.S. Employer Identification No.) | |
| 1740 Monrovia Avenue Costa Mesa, California |
92627 | |
| (Address of principal executive offices) | (Zip Code) | |
(949) 646-2175
(Registrant’s telephone number, including area code)
Securities registered pursuant to Section 12(b) of the Act:
| Title of Each Class | Name of Each Exchange on Which Registered | |
| Common stock, $0.001 par value | The NASDAQ Global Select Market |
Securities registered pursuant to Section 12(g) of the Act:
None
Indicate by check mark if the registrant is a well-known seasoned issuer, as defined in Rule 405 of the Securities Act. Yes ¨ No þ
Indicate by check mark if the registrant is not required to file reports pursuant to Section 13 or Section 15(d) of the Act. Yes ¨ No þ
Indicate by check mark whether the registrant (1) has filed all reports required to be filed by Section 13 or 15(d) of the Securities Exchange Act of 1934 during the preceding 12 months (or for such shorter period that the registrant was required to file such reports) and (2) has been subject to such requirements for the past 90 days. Yes þ No ¨
Indicate by check mark whether the registrant has submitted electronically and posted on its corporate Web site, if any, every Interactive Data File required to be submitted and posted pursuant to Rule 405 of Regulation S-T (§232.405 of this chapter) during the preceding 12 months (or for such shorter period that the registrant was required to submit and post such files). Yes ¨ No ¨
Indicate by check mark if disclosure of delinquent filers pursuant to Item 405 of Regulation S-K is not contained herein, and will not be contained, to the best of the registrant’s knowledge, in definitive proxy or information statements incorporated by reference in Part III of this Form 10-K or any amendment to this Form 10-K. þ
Indicate by check mark whether the registrant is a large accelerated filer, an accelerated filer, a non-accelerated filer, or a smaller reporting company. See the definitions of “large accelerated filer,” “accelerated filer” and “smaller reporting company” in Rule 12b-2 of the Exchange Act. (Check one):
| Large accelerated filer ¨ |
Accelerated filer þ | Non-accelerated filer ¨ | Smaller reporting company ¨ | |||
| (Do not check if a smaller reporting company) |
Indicate by check mark whether the registrant is a shell company (as defined in Rule 12b-2 of the Act). Yes ¨ No þ
The aggregate market value of Common Stock held by non-affiliates of the registrant as of June 30, 2009, the end of the most recently completed second quarter, was approximately $237.1 million.
As of March 8, 2010, there were 24,374,362 shares of the registrant’s common stock, par value $0.001, outstanding.
DOCUMENTS INCORPORATED BY REFERENCE
Part III incorporates information by reference from the registrant’s definitive proxy statement (the “Proxy Statement”) for the 2010 Annual Meeting of Stockholders, which will be held on May 4, 2010.
Table of Contents
| Page | ||||
| PART I. | ||||
| Item 1. |
1 | |||
| Item 1A. |
15 | |||
| Item 1B. |
24 | |||
| Item 2. |
24 | |||
| Item 3. |
24 | |||
| Item 4. |
24 | |||
| PART II. | ||||
| Item 5. |
25 | |||
| Item 6. |
28 | |||
| Item 7. |
Management’s Discussion and Analysis of Financial Condition and Results of Operations |
30 | ||
| Item 7A. |
45 | |||
| Item 8. |
46 | |||
| Item 9. |
Changes in and Disagreements with Accountants on Accounting and Financial Disclosure |
46 | ||
| Item 9A. |
46 | |||
| Item 9B. |
49 | |||
| PART III. | ||||
| Item 10. |
49 | |||
| Item 11. |
49 | |||
| Item 12. |
Security Ownership of Certain Beneficial Owners and Management and Related Stockholder Matters |
49 | ||
| Item 13. |
Certain Relationships and Related Transactions, and Director Independence |
49 | ||
| Item 14. |
49 | |||
| PART IV. | ||||
| Item 15. |
49 | |||
i
Table of Contents
Cautionary Note Regarding Forward-Looking Statements
This annual report on Form 10-K and other documents we file with the Securities and Exchange Commission, or SEC, contain “forward-looking statements” within the meaning of Section 27A of the Securities Act of 1933 and Section 21E of the Exchange Act, and we intend that such forward-looking statements be subject to the safe harbors created thereby. These statements relate to future events or our future financial performance. We have attempted to identify forward-looking statements with terminology including “anticipate,” “believe,” “can,” “continue,” “could,” “estimate,” “expect,” “intend,” “may,” “plan,” “potential,” “predict,” “should” or “will” or similar expressions as they relate to us and our business, industry, markets, retailers, licensees, manufacturers and consumers. Such forward-looking statements, including but not limited to statements relating to expected growth and strategies, future operating and financial results, financial expectations and current business indicators, are based upon current information and expectations, and are subject to change based on factors beyond our control.
Although we believe that the expectations reflected in the forward-looking statements are reasonable, we cannot guarantee future results, levels of activity, performance or achievements. Actual results could differ materially from these forward-looking statements as a result of numerous factors, some of which are described herein under Item 1A “Risk Factors”. We are not under any duty to update any of the forward-looking statements after the date of this Form 10-K to conform these statements to actual results, unless required by law.
PART I
| ITEM 1. | BUSINESS |
We are an innovative designer, marketer and distributor of premium quality young mens and young womens clothing, footwear, accessories and related products under the Volcom brand name. We believe that we have one of the world’s leading brands in the action sports industry, built upon our history in the boardsports of skateboarding, snowboarding and surfing. Our position as a premier brand in these three boardsports differentiates us from many of our competitors within the broader action sports industry and has enabled us to generate strong growth in revenues and operating income.
Our products, which include, among others, t-shirts, fleece, bottoms, tops, jackets, boardshorts, denim, outerwear, sandals, girls swimwear and a complete collection of kids and boys clothing, combine fashion, functionality and athletic performance. We develop and introduce products that we believe set the industry standard for style and quality in each of our product categories. We seek to offer products that appeal to both boardsport participants and those who affiliate themselves with the broader action sports youth lifestyle.
The Volcom brand, symbolized by The Volcom Stone
 , is athlete-driven, innovative and creative. We have consistently followed our motto of “youth against establishment,” and our brand is inspired by the energy of youth culture. We reinforce our brand image
through the sponsorship of world-class athletes, targeted grassroots marketing events, distinctive advertising, and by producing and selling music under our Volcom Entertainment label and boardsports-influenced films through Veeco Productions, our
film division. We believe our multi-faceted marketing approach integrates our brand image with the lifestyles and aspirations of our consumers.
, is athlete-driven, innovative and creative. We have consistently followed our motto of “youth against establishment,” and our brand is inspired by the energy of youth culture. We reinforce our brand image
through the sponsorship of world-class athletes, targeted grassroots marketing events, distinctive advertising, and by producing and selling music under our Volcom Entertainment label and boardsports-influenced films through Veeco Productions, our
film division. We believe our multi-faceted marketing approach integrates our brand image with the lifestyles and aspirations of our consumers.
On January 17, 2008, we acquired all of the outstanding membership interests of Electric Visual Evolution LLC, or Electric, for $26.3 million plus transaction costs of $1.2 million. Known for its Volt logo, Electric is a core action sports lifestyle brand. The company’s growing product line includes sunglasses, goggles, t-shirts, bags, hats, belts and other accessories. Electric is headquartered in Orange County, California and is operated as a subsidiary of Volcom.
We seek to enhance our brand image by controlling the distribution of our products. We sell to retailers that we believe merchandise our products in an environment that supports and reinforces our brand and that provide a superior in-store experience. This strategy has enabled us to develop strong relationships with key boardsport and
1
Table of Contents
youth lifestyle retailers that share our focus. Our retail customers are primarily comprised of specialty boardsports retailers and several retail chains. Some of these include 17th Street Surf, B.C. Surf, Below the Belt, Froghouse, HIC, Hotline, Huntington Surf & Sport, IG Performance, Jack’s Surfboards, K5 Board Shop, Macy’s, Nordstrom, Pacific Sunwear, Ron Jons, Showcase, Snowboard Connection, Spyder, Sun Diego, Surfside Sports, The Room, Tilly’s, Town and Country, Val Surf, West Beach and Zumiez. Our products are sold over the Internet through selected authorized online retailers. At December 31, 2009, we operated 13 full-price Volcom branded retail stores and licensed an additional eight full-price stores located in strategic markets around the world, where we are able to present our brand message directly to our target market. Additionally, we own two multibrand Laguna Surf & Sport stores and license nine Volcom outlet stores.
Volcom branded products are currently sold throughout the United States and in over 40 countries internationally by either us or international licensees. We serve the United States, Europe, Canada, Latin America, Asia Pacific and Puerto Rico through our in-house sales personnel, independent sales representatives and distributors. Revenues from our United States segment were $188.8 million, $237.1 million and $228.5 million for 2009, 2008 and 2007, respectively. Revenues from our European segment were $70.7 million, $73.0 million and $40.1 million for 2009, 2008, and 2007, respectively. Revenues from our Electric segment were $21.1 million and $24.2 million for 2009 and 2008, respectively. We also license our brand in other areas of the world, including Australia, Indonesia, South Africa, Brazil and Argentina, to entities that we believe have valuable local market insight and strong relationships with retailers in their respective territories. We receive royalties on the sales of Volcom branded products sold by our licensees. Pursuant to an agreement between us and Volcom Europe (our former European licensee), Volcom Europe produced and distributed the Spring 2007 Volcom line in Europe and paid us our same royalty rate as required under the license agreement. As a result, we experienced a decrease in our licensing revenues and an increase in our selling, general and administrative expense while we built the necessary infrastructure and hired employees to establish and support our own operations in Europe. Our product revenues have increased in Europe as we now recognize revenue from the direct sale of our products in this territory.
As part of our strategy to take direct control of our European operations, we constructed a new European headquarters in Anglet, France, which was completed in February 2007, and delivered our first full season product line during the third quarter of 2007. We furthered our international expansion in 2008 by completing the acquisition of our distributor of Volcom branded products in Japan. In 2009, we took direct control of the Volcom brand in the United Kingdom. Domestically, in 2008, we acquired the assets of Laguna Surf & Sport, a California-based retail chain currently operating two retail stores.
Volcom was founded in 1991 by Richard Woolcott and Tucker Hall in Orange County, California, the epicenter of boardsports culture. We reincorporated in Delaware in April 2005. We believe we were the first major apparel company founded on the boardsports of skateboarding, snowboarding and surfing. Our founders set out to build a company that combined their passion for these sports with their love of art, music and film. Since that time, Richard has led a committed, talented management team to create one of the leading action sports brands in the world. Stockholders may obtain a copy of our SEC reports, free of charge, from the SEC’s website at www.sec.gov or from our website at www.volcom.com, or by writing to Investor Relations, Volcom, Inc., 1740 Monrovia Avenue, Costa Mesa, California 92627. Information contained on our website is not incorporated by reference herein.
Financial Information About Segments, Product Lines and Geographic Regions
Information regarding our segments, product lines and geographic areas in which we operate is contained in Note 15 to our Consolidated Financial Statements for the years ended December 31, 2009, 2008 and 2007.
Products
We design and distribute an innovative collection of young mens and young womens clothing, footwear and accessories inspired by the boardsports of skateboarding, snowboarding and surfing. Our products are created for participants in these sports, as well as those who affiliate themselves with the broader action sports lifestyle. Our
2
Table of Contents
products incorporate a distinctive mixture of fashion and function, combined with quality, comfort and athletic performance. Our premiere product collections include the eco-friendly V.Co-Logical® Series, the rider-collaborative V.Co-Operative™ Series, the Volcom Stone-Age Series and the Featured Artist Series. Our clothing not only exemplifies our lifestyle, but enhances the ability to live it. All of our clothes and accessories are sold under the Volcom and Electric brands and typically retail at premium prices.
We have seven primary product categories: mens, girls, boys, footwear, girls swim, snow and Electric. The principal products sold within these categories are:
T-Shirts and Fleece. We believe our prints and designs distinguish our t-shirts and fleece from those of our competitors and are staple items for our consumers. The majority of these items display a distinctive art style, utilizing unique treatments, placements of screened images, designs and embroideries. On some of our t-shirts and fleece, we promote our Featured Artist Series, a program in which we work closely with select team riders and relevant artists associated with our target market to design certain products. Most pieces prominently display the Volcom name or the Volcom Stone logo.
Tops and Jackets. Our knit and woven tops and casual jackets are recognizable for their bold and creative styling. Many of our designs are built on traditional fashions, with a distinctive Volcom image or style feature that creates a distinguishing look our consumers have come to expect.
Bottoms. We design a variety of casual and dress pants, shorts and skirts. Our bottoms are generally made using cotton or cotton-blend fabrics. Our bottoms are designed to be both functional and distinctive and generally have one or more elements that provide a unique Volcom look.
Denim. Volcom Brand Jeans have a tradition of vintage inspiration mixed with modern cuts. With distinctive styles, including certain V.Co-Operative signature product styles, the line is consistently invigorated with new fits and bodies. Each piece is carefully handcrafted, focusing on only the finest fabrications. The detail, denims and washes reveal our level of dedication to this category. The ongoing “Road-Tested Denim” marketing campaign recognizes the influence of the “rock and roll” lifestyle by portraying team riders, musicians and artists in authentic contexts.
Boardshorts. We introduced our boardshorts line in 1992 and have continually evolved the program. The Volcom Pipehouse on the North Shore of Oahu, Hawaii is home to the research and development of our boardshort program, as exemplified in “The Proving Grounds” marketing campaign. Our boardshorts are known for their superior performance, art inspired prints and unique embellishments.
Outerwear. Our outerwear products, which were introduced in 2000, consist of technically advanced jackets and pants that are designed to meet the demands of snowboarding. Our outerwear is designed with a number of technical features and fabrics and includes significant input from our snowboard team. Some of the technical aspects of our outerwear include Gore-Tex® fabrics, taped and welded seam construction, waterproof zippers, our patented Zip-Tech™ jacket/pant connection system and most recently the revolutionary Thermal Defense System™, with strategically insulated outerwear. We believe that our outerwear provides consumers with a distinctive mix of fashion and technical performance, which distinguishes it from many of our competitors’ products.
Accessories. We also sell a variety of accessories such as hats, wallets, socks, belts and bags to complement our clothing lines.
Footwear. We introduced a complete line of sandals and bedroom slippers branded Volcom Creedlers in 2006. These products are sold year-round and are offered in our mens, boys and girls categories. They are generally distributed within our existing customer base.
3
Table of Contents
Swim. We introduced our girls swimwear line in 2007. The girls swimwear product complements our existing girls business and is merchandised with the girls sportswear, sandals and accessories. Our swimwear is generally distributed within our existing customer base.
Music and Film. We also generate revenues from the sale of music produced by our record label, Volcom Entertainment, and films produced by Veeco Productions, our film production division.
Electric. Since our acquisition of Electric in January 2008, we offer a full line of innovative and high-quality sunglasses and goggles as well as t-shirts, fleece and accessories under the Electric brand name.
Product Design
We believe that our reputation for creativity and innovation enables us to design products that continuously evolve in style and functionality while remaining attractive to consumers in our target market and to our retail accounts. We have put in place design processes that we believe allow us to respond quickly to changing consumer tastes and preferences.
We employ design and product development teams located in our Orange County, California headquarters and our European headquarters. These teams are organized into groups that separately focus on our mens, girls, boys, snow, footwear and girls swimwear categories. In addition to our in-house design team, each of our international licensees employs designers and merchandisers to create products that reflect local trends, while maintaining our brand image. Our in-house design team and designers from our international licensees generally meet several times each year to collaboratively develop designs that reflect fashion trends from around the world. Additionally, design teams for each product category participate in annual travel to locations known for their influence on fashion and style, such as New York, Paris, London, Sydney and Tokyo. Our domestic designers and those of our international licensees share the majority of our seasonal styles, resulting in a consistent look for Volcom products sold worldwide. We also involve our team riders and core retail accounts in the design process. We believe that team rider input adds to the style and functionality of our products and reinforces the credibility and authenticity of our brand. We also believe that involving our retailers provides us with additional insight into consumer preferences.
Our design calendar is typically organized around five major seasons: spring, summer, fall, snow and holiday. As a result of the feedback gathered from our sponsored athletes and core retailers, we are able to incorporate new looks and features into each season’s product line. These changes range from evolutions within our basic product lines to new fashion-forward styles.
Manufacturing and Sourcing
We generally contract for the manufacture of each of our product lines separately based on our fabric and design requirements. We do not own or operate any manufacturing facilities, and source our products from independently-owned manufacturers. Our apparel and accessories are generally purchased or imported as finished goods, and we purchase only a limited amount of raw materials. Our manufacturers operate facilities using advanced machinery and equipment, and we believe these manufacturers represent some of the strongest in their industry. In 2009, we imported over 74% of our products from China and Mexico, with Asian manufacturers producing the majority of our imported products. Our t-shirts are screen-printed in the United States, which has resulted in short lead times and has enabled us to react quickly to reorder demand from our retailers and distributors.
We have developed a sourcing process that allows us to maintain production flexibility and to avoid the capital expenditures and ongoing costs of operating an in-house manufacturing function. Approximately 63% and 12% of our total product costs during 2009 and approximately 66% and 14% of our total product costs during 2008 were derived from manufacturing operations in China and Mexico, respectively. We also contract with
4
Table of Contents
several domestic screen printers. Other than Dragon Crowd and Ningbo Jehson Textiles, two of our manufacturers located in China that accounted for 17% and 16% of our product costs during 2009, respectively, and for 18% and 14% of our product costs during 2008, respectively, no single manufacturer of finished goods accounted for more than 10% of our production expenditures during 2009 or 2008. We do not have any long-term contracts with our manufacturers, choosing instead to retain the flexibility to re-evaluate our sourcing and manufacturing decisions. We evaluate our vendors primarily on the quality of their work, ability to deliver on time and cost. Representatives from our design and production staff visit and formally assess our foreign contract manufacturers multiple times per year. We also use the services of third parties to assist us in quality control and to ensure that our manufacturers are in compliance with applicable labor practices. These third parties generally perform periodic social compliance audits, provide regular quality inspections, monitor delivery deadlines and assess overall vendor performance. We believe that our commitment to quality control and our monitoring procedures are an important and effective means of maintaining the quality of our products and our reputation among consumers.
We work directly with local sourcing agents aligned with foreign contract manufacturers to direct our production needs to factories that meet our quality and timing needs. We typically choose our manufacturers based on their expertise in specific product lines. Many of our manufacturers specialize in multiple product lines, allowing us to reallocate orders, if necessary, to manufacturers with whom we have established relationships. We believe this enhances the efficiency and consistency of our sourcing operations. In addition, we maintain relationships with numerous qualified manufacturers that are available to provide additional capacity on an as-needed basis. We regularly research, test and add alternate and back-up manufacturers to our network to ensure that we maintain a constant flow of products in order to meet the needs of our retailers and distributors. In addition, we source products with multiple vendors allowing for competitive pricing and manufacturing flexibility. Based on our historical experience with a wide range of manufacturers, we believe alternate manufacturing sources are available at comparable costs.
We arrange for the production of a majority of our products primarily based on orders received. We have traditionally received a significant portion of our customer orders prior to placement of our initial manufacturing orders. We use these early season orders, and our experience, to project overall demand for our products in order to secure manufacturing capacity and to enable our manufacturers to order sufficient raw materials. We believe that our ability to effectively forecast seasonal orders, combined with our flexible sourcing model, limits our sourcing risk, increases our ability to deliver our products to our customers on time, helps us better manage our inventory and contributes to our overall profitability.
Imports and Import Restrictions
Our independent buying agents, primarily in China and Hong Kong, and to a lesser extent, in other foreign countries, assist us in selecting and overseeing the majority of our independent third-party manufacturing and sourcing. These agents also monitor economic and other trade regulations in addition to facilitating our quality control function.
Our products manufactured abroad are subject to U.S. customs laws, which impose tariffs as well as import quota restrictions for textiles and apparel. Quota represents the right, pursuant to bilateral or other international trade arrangements, to export amounts of certain categories of merchandise into a country or territory pursuant to a visa or license. China’s accession agreement for membership in the World Trade Organization, or WTO, provides that WTO member countries may re-impose quotas on specific categories of products in the event it is determined that imports from China have surged and are threatening to create a market disruption for such categories of products (so called “safeguard quota provisions”). The United States may unilaterally impose additional duties in response to a particular product being imported (from China or other countries) in such increased quantities as to cause (or threaten) serious damage to the relevant domestic industry (generally known as “anti-dumping” actions). We do not expect the limitations on imports from China to materially affect our operations because we believe we will be able to meet our needs from countries not affected by the restrictions or tariffs or from domestic sources.
5
Table of Contents
The United States and other countries in which our products are manufactured and sold may, from time to time, impose new duties, tariffs, surcharges or other import controls or restrictions, including the imposition of “safeguard quota”, or adjust presently prevailing duty or tariff rates or levels. In an effort to minimize our potential exposure to import risk, we actively monitor import restrictions and quota fill rates and, if needed, can shift production to other countries or manufacturers.
Additionally, China offers a rebate tax on exports to control the amount of exports from China, which can affect our cost either positively or negatively. These potential cost increases, along with the rising currency and labor shortages in China, may have an impact on our business. While we do not believe the limitations on imports from China will have a material effect on our operations, there may be increased pressure on costs and we intend to closely monitor our sourcing in China to avoid disruptions.
With the passage of the Consumer Product Safety Improvement Act of 2008 and similar state laws, such as California’s Proposition 65, there are new requirements mandated for the textiles and apparel industries. These requirements relate to all metal and painted trim items and certain other raw materials used in children’s apparel, as well as flammability standards in certain types of textiles. The Consumer Product Safety Commission, or CPSC, will require certification and testing for lead in paint and metal trims, pointed or sharp edge items, Phthalates, and fabric flammability to meet the CPSC’s limits. We will continue to monitor the situation and intend to abide by all rules and changes made by the CPSC and similar state laws. This could have a negative impact on the cost of our goods and poses a potential risk if we do not adhere to these requirements.
Distribution and Sales
We seek to enhance our brand image by controlling the distribution of our products around the world and selling to retailers that we believe merchandise our products in an environment that supports and reinforces our brand image. Our retail customers are primarily comprised of specialty boardsports retailers and several retail chains. We encourage our retailers to maintain specific merchandise presentation standards. Our products are offered over the Internet through selected authorized online retailers. Beginning in mid-2010, we intend to launch our own direct to consumer ecommerce platform. At December 31, 2009, we operated 13 full-price Volcom branded retail stores and licensed an additional eight full-price stores located in strategic markets around the world. Additionally, we own two multibrand Laguna Surf & Sport stores and license nine Volcom outlet stores. In addition to our retail accounts, we sell to distributors in Latin America, Asia Pacific and other developing markets throughout the world.
Our specialty retailers attract skateboarders, snowboarders and surfers who we believe have influence over fashion trends and demand for boardsports products. We focus on our relationships with these specialty retailers, as we believe they represent the foundation of the boardsports market. We collaborate with our specialty retailers by providing in-store marketing displays, which include racks, wall units and point-of-purchase materials that promote our brand image. We believe that these programs have enabled us to grow our sales within these accounts and will enable us to increase our floor space going forward. We also sponsor events and programs at our retailers such as autograph signings and boardsport demonstrations with our team riders. We believe that our relationships with our retailers are a critical element of our success.
We maintain a national sales force of independent sales representatives. These representatives are compensated on a commission basis, which we believe provides them with strong incentives to promote our products. We are typically the exclusive apparel brand sold by these representatives, who may also sell complementary products from other companies. For certain of our larger retail accounts and distributors, we manage the sales relationship in-house rather than using independent sales representatives.
We employ an in-house sales team to serve major national accounts, such as Dillards, Macy’s, Nordstrom, Pacific Sunwear, Tilly’s and Zumiez. We also employ an in-house sales team to serve international territories not represented by one of our international licensees, such as Canada, Asia Pacific, Latin America and Puerto Rico.
6
Table of Contents
In order to maintain sufficient inventories to meet the demands of our retailers, we typically pre-book orders in advance of delivery. None of our sales agreements with any of our customers provides for any rights of return. As is customary in our industry, we do approve returns on a case-by-case basis at our sole discretion to protect our brand and our image.
We inspect, sort, pack and ship substantially all of our products, other than those sold by our licensees or in Canada and Japan, from our distribution warehouse located in Orange County, California for our United States operations, and from our warehouses in Anglet, France and Saint Geours de Maremne, France for our European operations. We distribute our products sold in Canada and Japan through third-party distribution centers located in Kamloops, British Columbia and Tokyo, Japan, respectively. All products received into these distribution centers are subject to our strict quality control standards, which include cross-referencing each style back to the pre-production and fit comments, which were made throughout the production cycle, reviewing design comments against product shipments, overall shipment inspection for water or other damage by our receiving department, and garment inspection and specification measurements by our quality control department.
Licensing
We serve Australia, Brazil, South Africa, Indonesia and Argentina (including Paraguay and Uruguay) through license agreements with five independent licensees. Our license agreement with our European licensee terminated on December 31, 2006. In 2007, as part of our international strategy, we have established our own operations in Europe in order to take direct control of the Volcom brand in Europe. We have a 13.9% ownership interest in our Australian licensee, Volcom Australia.
Our international license agreements grant our licensees exclusive, non-transferable rights to produce and sell specified Volcom branded products in their respective geographic areas. Our licensees pay us a specified royalty rate on their sales of these products. The license agreements require the licensee to follow our quality, design, marketing and distribution standards so that all products sold by licensees are consistent with the style, image, design and quality of other products we sell. We retain the right to require each licensee to discontinue selling any product that we believe does not meet our quality and design requirements. Each licensee is also required to provide us with samples of the Volcom branded products it intends to sell.
Our international license agreements expire as follows:
| Licensee |
Expiration Date |
Extension Termination Date | ||
| Australia |
June 30, 2012 | N/A | ||
| Brazil |
December 31, 2013 | N/A | ||
| South Africa |
December 31, 2011 | N/A | ||
| Indonesia |
December 31, 2014 | N/A | ||
| Argentina (including Paraguay and Uruguay) |
December 31, 2013 | December 31, 2018 |
In the future, we may assume responsibility for serving territories that are currently represented by our licensees in order to better control our international distribution and branding. We may accomplish this by acquiring some of our licensees or by establishing our operations abroad in anticipation of the expiration of our license agreements. We believe directly controlling our international distribution will result in increased international revenues and profitability. Certain of our license agreements may be extended at the option of the licensee for an additional five-year term after the initial expiration of the agreement. Pursuant to our international growth strategy, we established our own operations in Europe in anticipation of the expiration of our licensing agreement with our European licensee on December 31, 2006. We completed the construction of our European headquarters in Anglet, France in February 2007, and delivered our first full season of product line during the third quarter of 2007.
7
Table of Contents
Advertising and Promotion
Our brand message blends elements of our athletes, fashion, art, music and film. We employ a multi-faceted advertising and promotion strategy. We do not generally use outside marketing agencies, preferring instead to utilize our internal marketing and art departments to create our advertisements and manage our various grassroots programs. Our advertising and promotional strategy primarily consists of athlete sponsorship, Volcom branded events, co-sponsored events, print advertisements, music, film, our Featured Artist Series, our Volcom branded retail stores and online marketing programs.
Athlete Sponsorship
We believe that sponsoring high-profile skateboarding, snowboarding, surfing and motocross athletes, as well as supporting emerging talents, is an essential promotional tool to continue building our brand. We believe our association with top athletes builds brand equity and authenticity, and strengthens the link between our products and our target consumers. We seek credibility in our target market by maintaining a strong sponsorship presence with our athletes in order to differentiate us from our competitors.
We sponsor domestic and international teams of leading athletes that wear our apparel, use our products and prominently display the Volcom brand and the Volcom Stone logo in competitions and other public appearances. We also produce films featuring our athletes, and support contests and other events in which our athletes promote our products. Some of our best-known athletes in each of our three boardsports and motocross include the following:
Skateboarding
| • | Geoff Rowley — Geoff won the prestigious Thrasher Skater of the Year in 2000 and has been on the cover of many major skateboard publications. He remains one of the highest profile skateboarders at the core level on our team. He has been focusing much time and energy into the development of Volcom’s Stone-Age line, a skate specific line catering to core skateshops. He was featured in Flip Skateboard’s highly anticipated “Extremely Sorry” video, which was released in 2009, and was featured on the covers of Thrasher Magazine and Skateboard Magazine. |
| • | Mark Appleyard — Mark was named the Transworld Street Skater of the Year in 2007 and 2003. Mark was also the Thrasher Skater of the Year in 2003 and won the Transworld Reader’s Choice Award for 2004. Mark is currently a featured character in the highly popular EA Sports Skate 2 video game. Mark was recently featured on the cover of Transworld Skateboarding. |
| • | Rune Glifberg — In 2008, Rune won the Vans Pro-tec Pool Party for the third time in four years in Orange County, California and won a Gold Medal at the X-Games in the Superpark event. He also won the Quiksilver Bowlriders in Malmo, Sweden for the second year running as well as winning the Wellington Bowl-A-Rama in Wellington New Zealand in 2008. Rune also had the cover and a 16 page interview in the July 2008 Issue of Thrasher Magazine. |
| • | Lyn-Z Adams Hawkins — At the age of 20, Lyn-Z is at the forefront of professional female skaters. Lyn-Z entered her first pro contest at the age of 12. Since then, she has won three X games Vert gold medals and two silvers. She was also the first female skater to skate the ‘Mega Ramp’ and in November of 2009, she became the first female to land a 540 McTwist during a skateboarding display in Paris, France. Lyn-Z is also currently featured in the newest Tony Hawk video game. |
Snowboarding
| • | Gigi Rüf — Gigi has been a Volcom team rider for more than a decade and wears Volcom Outerwear. He was featured on the cover of the February 2008 issue of Snowboarder, the March 2008 issue of Transworld Snowboarding and three additional magazine covers in Europe. He was awarded |
8
Table of Contents
| the number three spot in Snowboarder Magazine’s 10 Best Riders Of The Year and multiple nominations at the Transworld Rider Poll Awards in 2008. Gigi was also featured on the cover of Transworld Snowboarding Magazine, accompanied by a 12-page interview, and the cover of Frequency Photo Book in 2008. Gigi is working on his own snowboard film due out in late 2010. |
| • | Terje Haakonsen — Terje’s championships include, among others, two-time Air & Style Champion, three-time U.S. Open Half-Pipe Champion, three-time International Snowboard Federation World Half-Pipe Champion, six-time Mt. Baker Banked Slalom Champion and five-time European Half-Pipe Champion. Recently, Terje set the world record (9.8 meters) for the biggest backside 360 at the 2007 Arctic Challenge. In 2008, Terje released a television show on Fuel TV featuring six episodes of his travels around the globe. |
| • | Bjorn Leines — Bjorn placed fourth in Slopestyle at the 2005 X Games, won the 2003 Red Bull Heavy Metal, has twice been ranked second by Snowboarder magazine for Rider of the Year, is a featured rider in Xbox games Amped and Amped 2 and has been a Transworld Snowboarding Magazine Reader’s Choice Award nominee. |
| • | Kevin Pearce — Kevin won his first major international event during the 2006/2007 season at the Toyota Big Air in Sapporo, Japan. Also during the 2006/2007 season, he went on to win the Nippon Open Slopestyle, The Arctic Challenge quarter-pipe contest, and received second place at the Abominable Snow Jam in both half-pipe and quarter-pipe. Kevin finished the 2006/2007 season ranked fourth in the Ticket To Ride (TTR) world rankings for the 2006/2007 season. In the 2007/2008 season, Kevin won The Munich Air and Style, landing a cab 1260 in front of 30,000 fans. Kevin has also landed third on the podium at the X-Trial quarter-pipe in Tokyo, Japan, and won the European Open half-pipe in Laax, Switzerland. At the 2008 Winter X-Games in Aspen, Colorado, Kevin earned second in Big Air, second in Slopestyle and third in Super-Pipe. Kevin also won the Air and Style quarter-pipe contest in Innsbruck, Austria, as well as the 2008 Arctic Challenge in Norway. In 2008, he was crowned the champion of the TTR World Snowboard Tour. In 2009, Kevin earned a halfpipe victory at the European open, third place in the halfpipe at the Mt. Snow Dew Tour and a second place finish at the Winter X Games. Kevin also had an interview in Snowboard Magazine and was ranked second in Snowboarder Magazine’s 10 Best Riders of the Year. |
| • | Tyler Flanagan — At the age of 16, Tyler is one of the youngest members of the Volcom snow team, having joined the team when he was just nine years old. He recently won his first pro contest, the 2010 Dew Tour Slopestyle in Breckenridge, Colorado. Tyler also had two second place finishes at the 2010 Mammoth Grand Prix Slopestyle and 2010 Utah Dew Tour Slopestyle. |
| • | Janna Meyen — Janna was the first female 4-peat X Games gold medalist. She was named “Most Influential Female Snowboarder of All Time” by Snowboarder Magazine in 2008 and was crowned the 2004 Women’s Rider of the Year by Transworld Snowboarding Magazine. Her abilities range from big mountain riding to halfpipe, slopestyle and handrails. In 2009, she placed third in slopestyle at the Dew Tour in Lake Tahoe, CA. Janna finished in third place at the 2010 Winter X Games, bringing her total Winter X medal count to six. |
| • | Elena Hight — Elena was the youngest member of the 2006 U.S. Winter Olympic Snowboarding team and placed sixth at the Winter Olympic Halfpipe event. Elena had back-to-back wins at the Vans Cup snowboard halfpipe competition in 2007 and 2008. She finished with a third overall placement in the 2009 Winter Dew Tour. She was voted Women’s 2006 Rookie of the Year by Transworld Snowboarding Magazine and the 2006 Grom of the Year at the Fuel Action Sports TV Awards. Elena participated in her second Olympics in 2010, finishing in tenth place. She also won the girls halfpipe at the Dew Tour in Utah. |
Surfing
| • | Bruce Irons — For the last 10 years in surfing, there has been so few to compare with the mystique and marketability of Bruce Irons. Aside from great competitive success, including an Eddie Aikau Big |
9
Table of Contents
| Wave Invitational win, two titles at the famous Banzai Pipeline, and several other Association of Surfing Professionals (ASP) Tour wins, Bruce is considered to be among the most influential surfers in the world. Although Bruce has steered away from full-time competition, he will continue to compete in select ASP and specialty events, and his primary focus is set where he excels the most, his free surfing. Bruce’s style and approach in big hollow waves is second to none, and he continues to set the standard at the world’s most intense waves like Pipeline and Teahupo’o. He continues to be covered by surf media in all forms, and his surf travels will be documented for years to come. |
| • | Dean Morrison — Dean is on the ASP’s World Championship Tour (WCT). Dean consistently finishes in the top 10 of the WCT year-end tour standings. Dean finished second at the WCT Pipe Masters event in December 2007, and more recently secured a third place finish at the same event in December 2009. He is noted as one of the best performing Australians on the North Shore of Oahu, and is consistently featured throughout the pages of the major surf magazines and the prestigious Surfline.com website. He won the WCT event at his home break at Snapper Rock, Australia in 2003. |
| • | Ozzie Wright — Ozzie is one of the world’s most unique and talented free surfers. The combination of his talent, including surfing, art and music, has proven that he is one of the most marketable athletes in the sport. Ozzie is best known for his persona and his innovative and progressive aerials. He has been featured on numerous surf magazine covers and interviews worldwide. Ozzie’s band “The Goons of Doom” continually gains notoriety as they tour globally. Ozzie is an avid artist and his art is consistently featured throughout the Volcom clothing line. |
| • | Dusty Payne — In the past few years, Dusty has received extensive media exposure and won many important contests. Dusty finished in the eighth spot on the ASP’s World Qualifying Series (WQS) in 2009, and he will be competing in his rookie season on the WCT in 2010. He was featured on three major U.S. surf magazine covers in 2009, and in numerous major magazine interviews and spreads. He placed third in the 2009 year-end results on the Transworld Business Exposure Meter. In 2009, Dusty was featured as one of the six of the world’s best up and coming riders in Taylor Steele’s new film project called Modern Collective. Dusty also won Surfer Magazine’s “Best Male Performance” award for our Veeco Productions project entitled “BS!” in 2009. |
| • | Mitch Coleborn — Mitch caught the surfing world by storm in 2009 with his casual mix of progressive tricks and old school power surfing. After a great amateur career in Australia, Mitch spent two years building his worldwide profile, and now is looking to compete on the ASP’s WQS. Mitch was also featured as one of the six of the world’s best up and coming riders in Taylor Steele’s new film project called Modern Collective. Mitch also had a breakthrough and star role in our Veeco Productions project entitled “BS!”. |
Motocross
| • | Ryan Villopoto — Ryan is currently one of the fastest motocross racers in the world, with numerous race wins and a total of four championship titles to his name, including the 2007 Lites Supercross Championship, and the 2006, 2007 and 2008 Lites Motocross Championship. Ryan has also helped lead Team USA to three Motocross Des Nation victories. |
| • | Nico Izzi — With over 200 amateur wins, Nico’s skills in the 85 class propelled him into the limelight at an early age, and set up his future as a pro. This past season Nico has had solid podium finishes in both the Supercross and Motocross 250 classes. He also received Rookie of the Year honors in the 250 class for 2008. Nico just got back to racing after an injury and is competing in the Supercross 250 class. |
We sponsor additional high-profile athletes. Some of these athletes include Gavin Beschen, Caswell Berry, Dennis Busenitz, Dustin Dollin, David Gonzalez, Alex Gray, Coco Ho, Seth Huot, Mark Landvik, Pat Moore, Luan Oliveira, Alex Perelson, Iouri Podladtchikov, Darrell Stanton, Nick Trapasso and Wille Yli-Luoma.
10
Table of Contents
We have contractual relationships with our sponsored athletes whereby we compensate them for promoting our products. Sponsorship arrangements are typically structured to give our athletes financial incentives to maintain a highly visible profile. Our contracts typically grant us an unlimited license for the use of the athletes’ names and likenesses, and typically require the athletes to maintain exclusive association with our apparel. In turn, we agree to make cash payments to the athletes for various public appearances, magazine exposure and competitive victories while wearing our products. In addition to cash payments, we also generally provide limited free products for the athletes’ use, and fund some travel expenses incurred by sponsored athletes in conjunction with promoting our products.
Volcom Branded Events
An important aspect of our marketing platform is our creation and support of grassroots skateboard, snowboard and surfing events in markets worldwide. We describe the driving philosophy behind many of these events as “Let The Kids Ride Free,” which we believe embodies our anti-establishment brand image. We believe that these events help our brand reach a wide audience within our target market. Hundreds of competitors and spectators typically attend these events.
We run a “Let The Kids Ride Free” contest series for each of skateboarding, snowboarding and surfing. These contests include the Wild in the Parks Skate Series, the Peanut Butter and Rail Jam Snow Series and the Totally Crustaceous Surf Series. These contests are held around the world both by us and by our international licensees. At these events, we emphasize fun and excitement for participants and spectators. The contests are open on a first-come, first-served basis and entry is free, so amateurs and first time competitors can compete alongside professionals. Additionally, free beverages and food are often provided, along with giveaways from us and other companies. We have a global championship event for each series where we invite the top qualifiers from each region to compete.
In January 2010, along with Electric, we hosted our first major ASP sanctioned surf contest at Pipeline on Oahu’s North Shore titled the “Volcom Pipeline Pro.” Surfers from around the world attended this WQS event to compete for the prestigious title. The event was broadcasted live on high definition webcast.
In 2010, we will be sponsoring the street portion of the Maloof Money Cup in New York City, New York and Orange County, California titled the “Volcom Street Pro.” This is an invitation-only event, where the best riders from around the world will compete for one of the richest prize purses in skateboarding. The event will be broadcast on Fox Network, Fuel TV and via webcast.
We organize, produce and manage these events through our internal marketing department, which is responsible for choosing venues, arranging sponsored athlete attendance, marketing and working at each contest. By promoting Volcom branded events throughout the year, we are able to collect consumer feedback and insight that, we believe, allows us to keep our brand connected to our target market and enables us to keep our products fresh and relevant.
Print Advertisements
We place the majority of our print advertisements in boardsports magazines such as Thrasher, Transworld Skateboarding and Snowboarding, Snowboarder, Surfing and Surfer. We also advertise in fashion lifestyle magazines such as Complex, Elle, Teen Vogue and Vice. We combine athletes, lifestyle, innovative visual designs and our unique style into our advertisements. Our internal art department designs all of our advertisements, including most of those placed in international publications to support our licensees. We do not generally use outside advertising agencies. By maintaining complete creative control of our advertisements, we are able to ensure that our brand image remains consistent with our heritage and passion for action sports.
11
Table of Contents
Music
We operate our own music and entertainment label, Volcom Entertainment, which identifies and signs musical artists and produces and distributes recordings in the form of CDs, digital downloads, vinyl LPs and wireless media worldwide through our retail accounts, music retailers and online distribution channels. Some of our best-known artists include Year Long Disaster, a rock band from Los Angeles, California; Valient Thorr, a rock band from Chapel Hill, North Carolina; Riverboat Gamblers, a rock band from Austin, Texas; Pepper, an alternative band from Kona, Hawaii; and ASG, a rock band from Wilmington, North Carolina. We believe that this component of our marketing platform provides us with a creative and artistic medium to connect with our target market and differentiates us from our competitors.
While we currently generate modest revenues from sales of music, these products reinforce our brand image and enhance our marketing efforts. The music and bands are also integrated into the Volcom brand seasonally via a line of music and musician inspired clothing. The entertainment label also helps produce marketing and product marketing campaigns to drive sales and general brand awareness, which not only involves our signed bands but also high profile acts like Pearl Jam, who we worked closely with in 2009.
During 2007, we launched “The Volcom Tour,” an annual company branded international music tour featuring our artists and other high profile acts. We also operate and sponsor an annual music competition for unsigned rock bands called the “Band Joust.” In 2008, we launched a subscription based vinyl record club coined “Volcom Ent Vinyl Club”, which delivers subscribers collectable vinyl singles on a bi-monthly basis. Additionally, our bands play at tradeshows, account demonstrations and other Volcom events.
In North America, we have entered into a music distribution arrangement with The Orchard, which is a full service, publicly traded, independent marketing and distribution company that specializes in music and video entertainment. In the rest of the world, we are exclusive with ADA Global, a music distribution company owned by Warner Music Group. These arrangements provide us with a greater array of worldwide distribution options for our bands. We intend to continue to promote Volcom Entertainment as an enhancement to our brand.
Film
We produce skateboarding, snowboarding and surfing films that feature our sponsored athletes through Veeco Productions, our film production division. We started this division in 1993, and believe that our films, like our music, are an integral part of our marketing and branding efforts.
Veeco has produced over 15 films including Alive We Ride, The Garden, Subjekt: Haakonsen, Magnaplasm, Chichagof, The Bruce Movie, BS! and Escramble. In 2007, our Australian licensee produced Let’s Live, a skateboard movie starring the Volcom Australia skateboard team as well as other international Volcom riders. Our films have been critically acclaimed and have won awards such as Best Core Film at the X-Dance Film Festival, Best Cinematography for a Snow Movie at the Unvailed Band and Board Event, Surfer Magazine’s Video of the Year and Surfer Magazine’s Video Award for Best Performance by a Male Surfer (Bruce Irons — twice). In our films, we feature Volcom team riders such as Geoff Rowley, Terje Haakonsen and Bruce Irons wearing Volcom branded products, which emphasizes our boardsports heritage and close association with leading boardsports athletes. Our films are distributed to our retail customers, as well as music and video stores.
In 2008, Veeco Productions entered into distribution deals with iTunes and Fuel TV. Currently, we sell four movies on iTunes and have produced and released multiple movies specifically for Fuel TV.
Featured Artist Series
In 1995, we introduced the Volcom Featured Artist Series. This series was developed to showcase the artistic depth of our brand. We produce t-shirts and other products featuring the artwork of team riders, employees and other talented artists affiliated with us and the action sports community. The art created by our
12
Table of Contents
featured artists has been shown in art shows around the world, including exclusive exhibits at some of our company-owned retail stores. The Volcom Featured Artist Series is important to our brand and differentiates us from our competition.
Retail
We currently operate 13 full-price Volcom branded retail stores located in strategic markets around the world. We believe that operating company-owned, branded retail stores is an effective way for us to promote our products, athletes and brand image. The Volcom stores are stocked with much of our product line, as well as limited edition goods only available in our stores. Our Volcom stores regularly host events with our athletes, Volcom featured artists and musicians, which attract consumers and enable us to showcase our brand. The design and layout of the stores, which include an assortment of our apparel, art presentations, a music listening station with Volcom Entertainment titles and a Veeco Productions section with our film titles, exemplifies our philosophy of change and youth culture. Our licensees currently operate eight Volcom branded retail stores in such places as Germany, South Africa and Thailand. We also own two multibrand Laguna Surf & Sport stores and license nine Volcom outlet stores.
The Volcom Pipehouse
In February 2007, we purchased one of the most famous houses in surfing history directly in front of the Pipeline surf break on the North Shore of Oahu, Hawaii, commonly referred to as the Pipehouse. This house is our second residence in front of the world renowned Pipeline surf break. This home is the headquarters for top Volcom team riders and is also used as a research and development center for product design and testing and retailer roundtables. The original Volcom house will continue to accommodate the majority of Volcom’s domestic and international up-and-coming team riders and serve as a marketing location throughout the year. We believe these two properties provide Volcom with a unique global marketing platform.
Online Marketing
Our website, located at www.volcom.com, serves as an additional medium for us to communicate our brand message. Visitors to our website are able to view our line of apparel and accessories, read news releases, learn about our team riders and view information about our Volcom branded events. Our website offers a directory of our traditional, store-based retailers and we sell our films and music direct to consumers on our website. In the past, we have generally not sold apparel on our website, other than certain Volcom Entertainment products. In 2010, we are making investments related to our direct to consumer ecommerce platform, which we intend to launch in mid-2010. As a means to further connect with our core consumers, we allow visitors to sign-up for email distributions of periodic news releases as well as updates on our product line, team riders and Volcom branded events. Information contained on our website does not constitute part of, nor is it incorporated into, this Form 10-K.
Competition
We compete globally with companies of various size and scale, many of whom are significantly larger than we are and have substantially greater resources than we have. We believe our most significant direct competitors currently include Quiksilver Inc., including the Quiksilver, Roxy and DC brands; Billabong International Limited, including the Billabong and Element brands; Burton; and Nike, including several Nike related brands and Hurley. We also compete with smaller companies that focus on one or more boardsport segments. The boardsports market is susceptible to rapid changes in consumer preferences, which could affect acceptance of our products.
We compete primarily on the basis of successful brand management and recognition, marketing and product design, style, performance and quality. We believe that we compete favorably with our competitors on these
13
Table of Contents
bases, although because several of our competitors are companies with greater resources than we have, they have been able to allocate these resources toward brand building and marketing programs that are greater in scope and size than ours. In order to further our success and continued growth we believe it will be necessary to:
| • | maintain our reputation as a popular lifestyle brand among the skateboarding, snowboarding and surfing community and others who associate themselves with the action sports youth lifestyle; |
| • | continue to develop and respond to global fashion and lifestyle trends in our target market; |
| • | advance our brand as an authentic, “anti-establishment” brand while continuing to grow as a global business; |
| • | design stylish, high-quality products at appropriate prices for our target market; and |
| • | continue to convey our lifestyle message to our target market worldwide. |
Principal Customers
In 2009, 2008 and 2007, 20%, 28% and 33%, respectively, of our product revenues were derived from our five largest customers. Other than Pacific Sunwear, which accounted for 11%, 16% and 18% of our product revenues in 2009, 2008 and 2007, respectively, no single customer accounted for more than 10% of our product revenues during 2009, 2008 or 2007. We believe that revenues from our five largest accounts, including Pacific Sunwear, will continue to decrease as a percentage of our overall revenues as we continue to diversify our account base and expand internationally.
Credit and Collection
We extend credit to our customers based on an assessment of a customer’s financial condition, generally without requiring collateral. To assist in the scheduling of production and the shipping of products within our snow category, consistent with industry practice, we offer customers discounts for placing pre-season orders and extended payment terms for taking delivery before the peak shipping season. These extended payment terms increase our exposure to the risk of uncollectible receivables. However, throughout the year, we perform credit evaluations of our customers, and we adjust credit limits based on payment history and the customer’s creditworthiness. We continually monitor our collections and maintain a reserve for estimated credit losses based on our historical experience and any specific customer collections issues that are identified. While such credit losses have historically been within our expectations and reserves, we cannot assure you that we will continue to experience the same credit loss rates we have experienced in the past.
Intellectual Property
We own the Volcom and Volcom Stone Design trademarks and various combinations of these marks in approximately 100 countries around the world, along with several issued and pending patents in the United States, Canada, China, Europe, and Japan. We also own the Electric and Electric Volt logo trademarks in more than 20 countries around the world, as well as several design patent registrations in the United States. Our pending and registered trademarks in the United States and other nations are primarily used on apparel and related accessories, sunglasses, goggles and for retail services. We also apply for and register our Volcom Entertainment and Veeco Productions trademarks in the United States and internationally mainly for use with our music and film products. We believe our trademarks and registered trademarks and our other intellectual property are crucial to the successful marketing and sale of our products, and we attempt to vigorously prosecute and defend our rights throughout the world. Each trademark registered with the U.S. Patent and Trademark Office has a duration of ten years and is subject to an indefinite number of renewals for a like period upon appropriate application. Trademarks registered outside of the United States typically have a duration of between seven and fourteen years depending upon the jurisdiction and are also generally subject to an indefinite number of renewals for a like period upon appropriate application.
14
Table of Contents
Government Regulation
Our products are subject to governmental health safety regulations in most countries where they are sold, including the United States, the European Union and Australia, as well as import duties and tariffs on products being imported into countries outside of the United States. In addition, we are subject to various state and Federal regulations generally applicable to similar businesses. We regularly inspect our production techniques and standards for compliance with applicable requirements including the Customs Trade Partnership Act Against Terrorism.
Management Information Systems
We use an integrated software package for substantially all of our operations. The software package is specifically designed for apparel distributors and producers. This software package is used for stock keeping unit, or SKU, management and classification inventory tracking, purchase order management, merchandise distribution, automated ticket generation, general ledger functions, sales auditing, accounts payable management and integrated financial management. The system provides summary data for all departments and a daily executive summary report used by management to observe business and financial trends.
Employees
We believe our employees are among our most valuable resources and have been an important part of our success. As of December 31, 2009, we had a total of 492 full-time domestic and European employees. We are not party to any labor agreements and none of our employees are represented by a labor union. We consider our relationship with our employees to be excellent and have never experienced a work stoppage.
| ITEM 1A. | RISK FACTORS |
Before deciding to purchase, hold or sell our common stock, you should carefully consider the risks described below in addition to the other cautionary statements and risks described elsewhere, and the other information contained, in this Report and in our other filings with the SEC, including our subsequent reports on Forms 10-Q and 8-K. The risks and uncertainties described below are not the only ones we face. Additional risks and uncertainties not presently known to us or that we currently deem immaterial may also affect our business. If any of these known or unknown risks or uncertainties actually occurs with material adverse effects on us, our business, financial condition and results of operations could be seriously harmed. In that event, the market price for our common stock will likely decline, and you may lose all or part of your investment.
The current global economic environment coupled with cyclical economic trends in apparel retailing could have a material adverse effect on our results of operations.
The apparel industry historically has been subject to substantial cyclicality. As the economic conditions in the global economy have deteriorated during the past two years, discretionary consumer spending has declined. The current global economic slowdown may result in lower than expected orders of our products and put negative pressure on our gross margins due to the promotional environment. Reduced sales by our wholesale customers may lead to lower retail inventory levels, reduced orders from suppliers like Volcom, or order cancelations. Reduced sales by some of our wholesale customers, along with the possibility of their reduced access to, or inability to access, the credit markets, may result in various retailers experiencing significant financial difficulties. Financial difficulties of customers could result in reduced sales to those customers or could result in store closures, bankruptcies or liquidations. Higher credit risk relating to receivables from customers experiencing financial difficulty may result. Many of our retail customers, including Pacific Sunwear, have reported negative same store sales growth comparisons and difficult holiday seasons. The economic downturn in the United States, European and broader global economy or continued uncertainties regarding future economic prospects could have a material adverse effect on our results of operations.
15
Table of Contents
One retail customer represents a material amount of our revenues, and the loss of this retail customer or reduced purchases from this retail customer may have a material adverse effect on our operating results.
Pacific Sunwear accounted for approximately 11% of our product revenues in 2009 and approximately 16% in 2008. We do not have a long-term contract with Pacific Sunwear, and all of its purchases from us have historically been on a purchase order basis. Sales to Pacific Sunwear decreased 42%, or $22.0 million, for 2009 compared to 2008. We currently expect a decrease in revenue from Pacific Sunwear in the first quarter of 2010 compared to first quarter of 2009. We recognize that any customer concentration creates risks and we are, therefore, assessing strategies to lessen our concentration with Pacific Sunwear. We cannot predict whether such strategies will reduce, in whole or in part, our sales concentration with Pacific Sunwear in the near or long term. Because Pacific Sunwear has represented such a significant amount of our product revenues, our results of operations are likely to be adversely affected by any Pacific Sunwear decision to decrease its rate of purchases of our products. A continuing decrease in its purchases of our products, a cancellation of orders of our products or a change in the timing of its orders will have an adverse affect on our operating results.
If we are unable to successfully integrate the operations of Electric or our other acquisitions, including our Japanese and UK territories, our business and earnings may be negatively affected.
We occasionally consider and, as we believe appropriate, make acquisitions that we believe are complementary to our business. Acquisitions involve significant integration efforts. Successful integration of an acquired company will depend primarily on our ability to consolidate operations, systems, procedures, properties and personnel. Acquisitions also pose other risks commonly associated with similar transactions, including unanticipated liabilities, unexpected costs and the diversion of management’s attention to the integration. We cannot assure you that we will be able to integrate an acquired company’s operations without encountering difficulties including, but not limited to, the loss of key employees, the disruption of its respective ongoing businesses or possible inconsistencies in standards, controls, procedures and policies. If we have difficulties integrating an acquired company, we might not achieve the economic benefits we expect to result from the acquisition, and this may hurt our business and earnings. In addition, we may experience greater than expected costs or difficulties relating to the integration of a business and may not realize expected benefits from the acquisition within the expected time frame, if at all.
As a result of our acquisition of Electric, we face greater challenges in managing an additional brand and related products.
While we believe that we have significant experience in managing our clothing, accessories and related products with the Volcom brand name and their respective channels of distribution, with our acquisition of Electric, we have further penetrated the action sports industry and have added a second brand and additional product categories. If we are unable to effectively manage our multiple product lines, our profitability and cash flow may be reduced and our brand image and reputation could be harmed.
We may be adversely affected by the financial condition of our retailers.
Some of our retailers have experienced financial difficulties as a result of the recent economic environment and the related decline in discretionary consumer spending. A retailer experiencing such difficulties will generally not purchase and sell as many of our products as it would under normal circumstances and may cancel orders. We extend credit to our retailers based on our assessment of the retailer’s financial condition, generally without requiring collateral. A retailer experiencing financial difficulties generally increases our exposure to the risk of uncollectible receivables. While such credit losses have historically been within our expectations and reserves, we cannot assure you that this will continue. In addition, product sales are dependent in part on retailers continuing investments in high quality merchandising and in creating appealing store environments which attract consumers. Retailers who experience financial difficulties may reduce, delay, or cease making such investments, which may result in lower sales of our products. Such financial difficulties on the part of our retailers could have a material adverse effect on our results of operations and financial condition.
16
Table of Contents
Our international operations involve inherent risks which could result in harm to our business.
We currently source the majority of our products from third-party manufacturers located outside of the United States, primarily in China and Mexico, and a considerable portion of our revenues are derived from product sales outside of the United States. Accordingly, we are subject to the risks generally associated with global trade and doing business abroad, which include foreign laws and regulations, varying consumer preferences across geographic regions, political unrest, disruptions or delays in cross-border shipments and changes in economic conditions in countries in which we manufacture or sell products. In addition, disease outbreaks, terrorist acts and military conflict have increased the risks of doing business abroad. These factors, among others, could affect our ability to manufacture products or procure materials, our ability to import products, our ability to sell products in international markets, and our cost of doing business. If any of these or other factors make the conduct of business in a particular country undesirable or impractical, our business could be adversely affected. In addition, many of our imported products are subject to duties, tariffs or quotas that affect the cost and quantity of various types of goods imported into the United States and other countries. Any country in which our products are produced or sold may eliminate, adjust or impose new quotas, duties, tariffs, safeguard measures, anti-dumping duties, cargo restrictions to prevent terrorism, restrictions on the transfer of currency, or other charges or restrictions, any of which could have an adverse effect on our results of operations and financial condition.
If we fail to comply with federal or state consumer product laws, it could materially affect our gross margin and financial performance.
With the passage of the Consumer Product Safety Improvement Act of 2008 and similar state laws, such as California’s Proposition 65, there are new requirements mandated for the textiles and apparel industries. These requirements relate to all metal and painted trim items and certain other raw materials used in children’s apparel, as well as flammability standards in certain types of textiles. The Consumer Product Safety Commission, or CPSC, will require certification and testing for lead in paint and metal trims, pointed or sharp edge items, Phthalates, and fabric flammability to meet the CPSC’s limits. We will continue to monitor the situation and intend to abide by all rules and changes made by the CPSC and similar state laws. This could have a negative impact on the cost of our goods and poses a potential risk if we do not adhere to these requirements.
Our balance sheet includes a significant amount of intangible assets and goodwill. A decline in the estimated fair value of an intangible asset or of a reporting unit could result in an asset impairment charge, which would be recorded as an operating expense.
Under current accounting standards, we estimate the fair value of acquired assets, including intangible assets, and assumed liabilities arising from a business acquisition. The excess, if any, of the cost of the acquired business over the fair value of net tangible assets acquired is allocated to intangible assets and goodwill.
At December 31, 2009, we had approximately $6.8 million of non-amortizing trademark and other non-amortizing intangible assets and $1.3 million of goodwill on our balance sheet. These assets are not required to be amortized under current accounting rules. In addition, we had approximately $3.0 million of intangible assets, net of accumulated amortization, that are being amortized under current accounting rules. The combined amounts represent 4% of our total assets and 5% of total stockholders’ equity.
Goodwill and non-amortizing intangible assets must be tested for impairment annually or in the event of an impairment indicator. We evaluate the recoverability of goodwill based on a two-step impairment test. The first step compares the fair value of each reporting unit with its carrying amount, including goodwill. If the carrying amount exceeds the fair value, then the second step of the impairment test is performed to measure the amount of any impairment loss. Fair value is determined based on estimated future cash flows, discounted at a rate that approximates our cost of capital. Intangible assets that are being amortized must be tested for impairment whenever events or circumstances indicate that their carrying value might not be recoverable.
17
Table of Contents
The fair value of a reporting unit could decline if forecasted revenues or cash flows were to be lower in the future due to effects of the global recession or other causes. If the carrying value of intangible assets or of goodwill were to exceed its fair value, the asset would be written down to its fair value, with the impairment loss recognized as a noncash charge. In 2009, we had impairment charges of $0.1 million associated with the intangible assets related to Volcom Europe, Electric and Laguna Surf & Sport. In 2008, we had impairment charges of $16.2 million associated with the goodwill and intangible assets related to Electric and Laguna Surf & Sport. In 2007, we had impairment charges of $0.2 million associated with the goodwill related to Welcom Distribution SARL. A significant reduction in the estimated future cash flows could result in additional impairment losses, which could have a material adverse effect on our results of operations and financial condition.
If we are required to establish new manufacturing relationships due to the termination of current key manufacturing relationships with large contractors such as Ningbo Jehson Textiles and Dragon Crowd, we would likely experience increased costs, disruptions in the manufacture and shipment of our products and a loss of revenue.
Our manufacturers could cease to provide products to us with little or no notice. We also understand that some factories in China, where we produced approximately 63% of our goods in 2009, are closing due to rising costs and an inability to operate at a profit. If factories where we produce goods were to close or stop producing goods for us, it could result in delayed deliveries to our retailers, could adversely impact our revenues in a given season and could require the establishment of new manufacturing relationships. The establishment of new manufacturing relationships involves numerous uncertainties, such as whether the new manufacturers will perform to our expectations and produce quality products in a timely, cost-efficient manner on a consistent basis, either of which could make it difficult for us to meet our retailers’ orders on satisfactory commercial terms. Furthermore, purchases from two contractors, Dragon Crowd and Ningbo Jehson Textiles, totaled approximately 17% and 16%, respectively, of our product costs in 2009, and approximately 18% and 14%, respectively, of our product costs in 2008. The loss of either of these manufacturers would likely require us to establish new manufacturing relationships, which would likely cause increased costs, disruptions in the manufacture and shipment of our products and a corresponding loss of revenues.
If we are unable to continue to develop innovative and stylish products, demand for our products may decrease and our brand image may be harmed.
The boardsports apparel industry is subject to constantly and rapidly changing consumer preferences based on fashion trends and performance features. Our success depends largely on our ability to anticipate, gauge and respond to these changing consumer demands and fashion trends in a timely manner while preserving the relevancy and authenticity of our brand. In addition, we generally make decisions regarding product designs several months in advance of the time when consumer acceptance can be measured.
Our success is largely dependent upon our ability to continue to develop innovative and stylish products. As is typical with new products, market acceptance of new designs and products we may introduce is subject to uncertainty. We cannot assure you that our efforts will be successful. The failure of new product designs or new product lines to gain market acceptance could adversely affect our business and our brand image. Achieving market acceptance for new products may also require substantial marketing efforts and expenditures to expand consumer demand. These requirements could strain our management, financial and operational resources. If we do not continue to develop stylish and innovative products that provide better design and performance attributes than the products of our competitors and that are accepted by consumers, we may lose consumer loyalty, which could result in a decline in our revenues and market share.
Consolidation amongst our retail customers or changes in the mix of our retailers could impact our gross margin and brand image, which could have a material adverse effect on our results of operations.
We sell our products through a mix of retailers, including specialty boardsports retailers and several retail chains. Consolidation amongst our retail customers or changes in the mix of our retailers, including the growth of
18
Table of Contents
online retailers, could adversely affect our gross margin and could negatively affect both our brand image and our reputation with our consumers. A negative change in our gross margin or our brand image and acceptance could have a material adverse effect on our results of operations and financial condition.
Our business could be harmed if we fail to maintain proper inventory levels.
We have traditionally received a substantial portion of our customer orders prior to placement of our initial manufacturing orders. However, we also maintain an inventory of selected core products that we anticipate will be in high demand, such as t-shirts. We may be unable to sell the products we have ordered in advance from manufacturers or that we have in our inventory. The current economic environment has made accurate projecting of inventory levels increasingly challenging. Inventory levels in excess of customer demand may result in inventory write-downs, or the sale of excess inventory at discounted or close-out prices, all of which could adversely affect our gross margins. These events could significantly harm our operating results and impair our brand image. Conversely, if we underestimate consumer demand for our products or if our manufacturers fail to supply quality products in a timely manner, we may experience inventory shortages. Inventory shortages might result in unfilled orders, negatively impact retailer relationships, diminish brand loyalty and result in lost revenues, any of which could harm our business.
Fluctuations in foreign currency exchange rates could harm our results of operations.
We are exposed to gains and losses resulting from fluctuations in foreign currency exchange rates relating to certain sales, licensing revenues, and product purchases of our international subsidiaries that are denominated in currencies other than their functional currencies. We are also exposed to foreign currency gains and losses resulting from domestic transactions that are not denominated in U.S. dollars (primarily sales of goods to Canada, collection of receivables denominated in Canadian dollars and purchases of sunglasses in Euro). As part of our overall strategy to manage the level of exposure to the risk of fluctuations in foreign currency exchange rates, we entered into forward exchange contracts to hedge a portion of our European operations U.S. dollar denominated inventory purchases. If we are unsuccessful in using various foreign currency exchange contracts our profits and cash flows could be significantly reduced. In some cases, as part of our risk management strategies, we may choose not to hedge our exposure to foreign currency exchange rate changes. If we misjudge these risks, there could be a material adverse effect on our operating results and financial position.
Furthermore, we are exposed to gains and losses resulting from the effect that fluctuations in foreign currency exchange rates have on the reported results in our consolidated financial statements due to the translation of the statements of operations and balance sheets of our international subsidiaries into U.S. dollars. We have not used foreign currency exchange contracts to hedge the profit and loss effects of this translation effect. We translate our revenues and expenses at average exchange rates during the period. As a result, the reported revenues and expenses of our international subsidiaries would decrease if the U.S. dollar increased in value in relation to other currencies, including the Euro, Swiss Franc, British pound or Japanese yen.
We do not have long-term contracts with any of our retailers, and the loss of orders for our products from our retailers may have a material adverse effect on our operating results.
We do not maintain long-term contracts with any of our retailers, and retailers generally purchase products from us on a purchase order basis. As a result, our retailers generally may, with little or no notice or penalty, decide to cease ordering and selling our products, or could materially reduce their orders in any period. If certain retailers, individually or in the aggregate, choose to no longer sell our products, it may be difficult for us to change our distribution to other retailers in a timely manner, which could have a material adverse effect on our financial condition and results of operations.
Any inability to receive timely deliveries from our manufacturers could harm our business.
We face the risk that the manufacturers with whom we contract to produce our products may not produce and deliver our products on a timely basis or at all. Our products are generally produced by independent, foreign
19
Table of Contents
manufacturers. We cannot be certain that we will not experience operational difficulties with our manufacturers, such as reductions in the availability of production capacity, errors in complying with product specifications, insufficient quality control, failures to meet production deadlines or increases in manufacturing costs. The failure of any manufacturer to perform to our expectations could result in supply shortages or untimely deliveries of certain products, either of which could harm our business.
The purchasing decisions of consumers are highly subjective and can be influenced by many factors, such as brand image, marketing programs and product design. Several of our competitors enjoy substantial competitive advantages, including greater brand recognition, longer operating histories, more comprehensive product lines and greater financial resources for competitive activities, such as sales and marketing and strategic acquisitions. The number of our direct competitors and the intensity of competition may increase as we expand into other product lines or as other companies expand into our product lines. Our competitors may enter into business combinations or alliances that strengthen their competitive positions or prevent us from taking advantage of such combinations or alliances. Our competitors also may be able to respond more quickly and effectively than we can to new or changing opportunities, standards or consumer preferences, which could result in a decline in our revenues and market share.
The market price of our common stock is highly volatile and may result in investors selling shares of our common stock at a loss.
The trading price of our common stock is highly volatile and subject to wide fluctuations in price in response to various factors, many of which are beyond our control, including:
| • | actual or anticipated variations in quarterly operating results; |
| • | changes in financial estimates by securities analysts; |
| • | conditions or trends in the fashion and boardsports industries; and |
| • | changes in the market valuations of similar companies. |
In addition, the stock market in general and the NASDAQ in particular have experienced extreme price and volume fluctuations that have often been unrelated or disproportionate to the operating performance of listed companies. Industry factors may seriously harm the market price of our common stock, regardless of our operating performance. In the past, following periods of volatility in the market, securities class-action litigation has often been instituted against companies. Such litigation, if instituted against us, could result in substantial costs and diversion of management’s attention and resources and could further a decline in the market price of our common stock. Stock price volatility may result in investors selling shares of our common stock at a loss.
If our marketing efforts do not effectively maintain and expand our brand name recognition, we may not be able to achieve our growth strategy.
We believe that broader recognition and favorable perception of our brand by consumers in our target market is essential to our future success. To increase brand recognition, we believe we must continue to devote significant amounts of time and resources to advertising and promotions. These expenditures, however, may not result in an increase in favorable recognition of our brand or a sufficient increase in revenues to cover such advertising and promotional expenses. In addition, even if our brand recognition increases, our consumer base and our revenues may not increase, and may in fact decline, either of which could harm our business.
If we are unable to maintain and expand our endorsements by professional athletes, our ability to market and sell our products may be harmed.
A key element of our marketing strategy has been to obtain endorsements from prominent boardsports athletes, which contributes to our authenticity and brand image. We believe that this strategy has been an
20
Table of Contents
effective means of gaining brand exposure worldwide and creating broad appeal for our products. We cannot assure you that we will be able to maintain our existing relationships with these individuals in the future or that we will be able to attract new athletes to endorse our products. Larger companies with greater access to capital for athlete sponsorship may in the future increase the cost of sponsorship for these athletes to levels we may choose not to match. If this were to occur, our sponsored athletes may terminate their relationships with us and endorse the products of our competitors and we may be unable to obtain endorsements from other comparable athletes.
We also are subject to risks related to the selection of athletes to endorse our products. We may select athletes who are unable to perform at expected levels or who are not sufficiently marketable. In addition, negative publicity concerning any of our athletes could harm our brand and adversely impact our business. If we are unable in the future to secure prominent athletes and arrange athlete endorsements of our products on terms we deem to be reasonable, we may be required to modify our marketing platform and to rely more heavily on other forms of marketing and promotion, which may not prove to be as effective.
If we fail to secure or protect our intellectual property rights, counterfeiters may be able to copy and sell imitations of our products and competitors may be able to use our designs, each of which could harm our reputation, reduce our revenues and increase our costs.
We rely on intellectual property laws to protect our proprietary rights with respect to our trademarks and pending patents. We are susceptible to injury from the counterfeiting of our products, which may harm our reputation for producing high-quality products or force us to incur additional expense in enforcing our rights. It is difficult and expensive to detect and prevent counterfeiting. Despite our efforts to protect our intellectual property, counterfeiters may continue to violate our intellectual property rights by using our trademarks and imitating our products, which could potentially harm our brand, reputation and financial condition.
Since our products are sold internationally, we are also dependent on the laws of foreign countries to protect our intellectual property. These laws may not protect intellectual property rights to the same extent or in the same manner as the laws of the United States. We cannot be certain that our efforts to protect our intellectual property will be successful or that the costs associated with protecting our rights abroad will not negatively impact our results of operations. We may face significant expenses and liability in connection with the protection of our intellectual property rights both inside and outside of the United States. Infringement claims and lawsuits likely would be expensive to resolve and would require substantial management time and resources. Any adverse determination in litigation could subject us to the loss of our rights to a particular trademark, which could prevent us from manufacturing, selling or using certain aspects of our products or could subject us to substantial liability, any of which would harm our results of operations. Aside from infringement claims against us, if we fail to secure or protect our intellectual property rights, our competitors may be able to use our designs. If we are unable to successfully protect our intellectual property rights or resolve any conflicts, our results of operations may be harmed.
Our current executive officers and management personnel are critical to our success, and the loss of these individuals could harm our business, brand and image.
We are heavily dependent on our current executive officers and management. The loss of any executive officers or management personnel, or the inability to attract or retain qualified personnel, could delay the development and introduction of, and harm our ability to sell, our products and damage our brand image. We believe that our future success is highly dependent on the contributions, talents and leadership of Richard Woolcott, our Chairman, Chief Executive Officer and co-founder. While our other key executive officers have substantial experience and have made significant contributions to our business, Richard remains a driving force behind our brand image and philosophy. We have not entered into an employment agreement with Richard and we cannot be certain that he will stay with us. Richard’s services would be very difficult to replace. We do not carry key man insurance and do not expect to carry such insurance in the future. We may not be able to retain our current executive officers and management personnel, which could have a material adverse effect on our results of operations.
21
Table of Contents
Our ability to attract and retain qualified design and sales and marketing personnel is critical to our success, and any inability to attract and retain such personnel could harm our business.
Our future success may also depend on our ability to attract and retain additional qualified design and sales and marketing personnel. We face competition for these individuals worldwide, and there is a significant concentration of boardsports apparel and action sports companies based in and around our headquarters in Orange County, California. We may not be able to attract or retain these employees, which could have a material adverse effect on our results of operations and financial condition.
Any shortage of raw materials could impair our ability to ship orders of our products in a cost-efficient manner or could cause us to miss the delivery requirements of our customers, which could harm our business.
The capacity of our manufacturers to manufacture our products is dependent, in part, upon the availability of raw materials. Our manufacturers may experience shortages of raw materials, which could result in delays in deliveries of our products by our manufacturers or in increased costs to us. Any shortage of raw materials or inability to control costs associated with manufacturing could increase the costs for our products or impair our ability to ship orders of our products in a cost-efficient manner and could cause us to miss the delivery requirements of our customers. As a result, we could experience cancellation of orders, refusal to accept deliveries or a reduction in our prices and margins, any of which could harm our financial performance and results of operations.
Our business could suffer if any of our or our licensees’ key manufacturers fails to use acceptable labor practices.
It is difficult to monitor and control the labor practices of our independent manufacturers. The violation of labor or other laws by an independent manufacturer utilized by us or a licensee of ours, or the divergence of an independent manufacturer’s or licensing partner’s labor practices from those generally accepted as ethical in the United States, could damage our reputation or interrupt, or otherwise disrupt the shipment of finished products to us or our licensees if such manufacturer is ordered to cease its manufacturing operations due to violations of laws or if such manufacturer’s operations are adversely affected by such failure to use acceptable labor practices. If this were to occur, it could have a material adverse effect on our financial condition and results of operations.
We may not be able to compete effectively, which could cause our revenues and market share to decline.
The boardsports apparel industry, and the apparel industry in general, is highly competitive. We compete with numerous domestic and foreign designers, distributors, marketers and manufacturers of apparel, accessories and other related products, some of which are significantly larger and have greater resources than we do. We believe that in order to compete effectively, we must continue to maintain our brand image and reputation, be flexible and innovative in responding to rapidly changing market demands and consumer preferences, and offer consumers a wide variety of high-quality apparel at premium prices. We compete primarily on the basis of brand image, style, performance and quality.
Our revenues and operating income fluctuate on a seasonal basis and decreases in sales or margins during our peak seasons could have a disproportionate effect on our overall financial condition and results of operations.
Historically, our operating results have been subject to seasonal trends when measured on a quarterly basis. In the past, we have experienced greater revenues in the second half of the year than those in the first half due to a concentration of shopping around the fall and holiday seasons, and pricing differences between our products sold during the first and second half of the year, as products we sell in the fall and holiday seasons generally have higher prices per unit than products we sell in the spring and summer seasons. We typically sell more of our
22
Table of Contents
summer products (boardshorts, t-shirts and sunglasses) in the first half of the year and a majority of our winter products (pants, long sleeve shirts, sweaters, fleece, jackets, outerwear and goggles) in the second half of the year. We anticipate that this seasonal impact on our revenues is likely to continue. Additionally, our business in Europe is extremely seasonal with revenues concentrated primarily in the first and third quarters, shipment of low margin samples concentrated in the second and fourth quarters, and a relatively steady pace of selling, general and administrative expenses throughout the year. Because a substantial portion of our operating income is derived from our third and fourth quarter revenues, a shortfall in expected third and fourth quarter revenues would cause our annual operating results to suffer significantly.
We face business, political, operational, financial and economic risks because a portion of our revenues are from international customers, substantially all of our products are sourced overseas and our licensees operate outside of the United States.
We and our international licensees are subject to risks inherent in international business, many of which are beyond our and our licensees’ control, including:
| • | difficulties obtaining domestic and foreign export, import and other governmental approvals, permits and licenses, and compliance with foreign laws, which could halt, interrupt or delay our operations if we cannot obtain such approvals, permits and licenses; |
| • | difficulties encountered by our international licensees or us in staffing and managing foreign operations or international sales; |
| • | transportation delays and difficulties of managing international distribution channels; |
| • | longer payment cycles for, and greater difficulty collecting, accounts receivable and royalty payments; |
| • | trade restrictions, higher tariffs, currency fluctuations or the imposition of additional regulations relating to import or export of our products, especially in China, where a large portion of our products are manufactured, which could force us to seek alternate manufacturing sources or increase our expenses; |
| • | unexpected changes in regulatory requirements, royalties and withholding taxes that restrict the repatriation of earnings and effects on our effective income tax rate due to profits generated or lost in foreign countries; |
| • | political and economic instability, including weakening financial institutions, regional or global recessions, wars, terrorism, political unrest, boycotts, curtailment of trade and other business restrictions; and |
| • | natural disasters. |
Any of these factors could reduce our revenues, decrease our gross margins or increase our expenses and could materially adversely affect our revenues and results of operations. To the extent that we establish our own operations in international territories where we have previously utilized a licensee, such as in Europe, we will increasingly become subject to risks associated with operating outside of the United States.
If the ownership of our common stock continues to be highly concentrated, it may prevent you and other stockholders from influencing significant corporate decisions and may result in conflicts of interest that could cause our stock price to decline.
As of December 31, 2009, our executive officers, directors and their affiliates beneficially own or control approximately 21.3% of the outstanding shares of our common stock, of which René Woolcott and Richard Woolcott own approximately 6.2% and 12.9%, respectively, of the 24,374,362 outstanding shares. Accordingly, our current executive officers, directors and their affiliates, acting as a group, will have substantial control over the outcome of corporate actions requiring stockholder approval, including the election of directors, any merger,
23
Table of Contents
consolidation or sale of all or substantially all of our assets or any other significant corporate transactions. These stockholders may also delay or prevent a change of control of us, even if such a change of control would benefit our other stockholders. The significant concentration of stock ownership may adversely affect the trading price of our common stock due to investors’ perception that conflicts of interest may exist or arise.
| ITEM 1B. | UNRESOLVED STAFF COMMENTS |
None
| ITEM 2. | PROPERTIES |
Our principle executive and administrative offices are located in Costa Mesa, California. Our primary warehousing and distribution facility is located in Irvine, California. As a result of the existing and planned improvements to our current headquarters and the additional Irvine distribution facility, we believe our current facilities will be adequate to meet our needs for the next twelve months.
The location, general use, approximate size and final lease option term of our material properties as of December 31, 2009, none of which is owned by us, except for the building in Anglet, France, are set forth below:
| Location |
Use | Term | Square Feet | |||
| Costa Mesa, California |
Global headquarters | July 2024 | 104,000 | |||
| Irvine, California |
Distribution center | September 2017 | 164,000 | |||
| San Clemente, California |
Electric headquarters | March 2010 | 8,000 | |||
| Anglet, France(1) |
European headquarters | May 2036 | 34,000 | |||
| Saint Geours de Maremne, France |
European warehouse | October 2019 | 68,000 |
| (1) | We own the facilities located on this leased land in Anglet, France. |
As of December 31, 2009, we also operated 15 retail stores located around the world on leased premises. We anticipate that we will be able to extend those leases that expire in the near future on terms satisfactory to us, or, if necessary, locate substitute facilities on acceptable terms.
| ITEM 3. | LEGAL PROCEEDINGS |
We are subject to various claims, complaints and legal actions in the normal course of business from time to time. We do not believe we have any currently pending litigation of which the outcome will have a material adverse effect on our operations or financial position.
| ITEM 4. | REMOVED AND RESERVED |
24
Table of Contents
PART II
| ITEM 5. | MARKET FOR REGISTRANT’S COMMON EQUITY, RELATED STOCKHOLDER MATTERS AND ISSUER PURCHASES OF EQUITY SECURITIES |
Market Information and Holders
Our common stock has traded on the NASDAQ National Market and NASDAQ Global Select Market under the symbol “VLCM” since June 30, 2005. Prior to that time there was no public market for our common stock. The following table sets forth, for the periods indicated, the high and low closing sale prices for our common stock as reported on the NASDAQ National Market and NASDAQ Global Select Market, as applicable:
| Price Range of Common Stock | ||||||
| High | Low | |||||
| Year Ended December 31, 2009 |
||||||
| First Quarter (March 31, 2009) |
$ | 11.86 | $ | 6.63 | ||
| Second Quarter (June 30, 2009) |
$ | 14.84 | $ | 9.75 | ||
| Third Quarter (September 30, 2009) |
$ | 17.17 | $ | 11.25 | ||
| Fourth Quarter (December 31, 2009) |
$ | 19.23 | $ | 15.33 | ||
| Year Ended December 31, 2008 |
||||||
| First Quarter (March 31, 2008) |
$ | 22.98 | $ | 13.82 | ||
| Second Quarter (June 30, 2008) |
$ | 28.88 | $ | 18.57 | ||
| Third Quarter (September 30, 2008) |
$ | 26.00 | $ | 16.25 | ||
| Fourth Quarter (December 31, 2008) |
$ | 17.41 | $ | 6.39 | ||
The approximate number of holders of record of our common stock as of March 8, 2010 was 47.
On March 8, 2010, the last reported sale price of our common stock on the NASDAQ Global Select Market was $19.04 per share.
Dividend Policy
We have never declared or paid any dividends on our common stock since our initial public offering. We do not currently anticipate paying any cash dividends in the foreseeable future. Any future determination to pay cash dividends will be at the discretion of our board of directors and will depend upon our financial condition, operating results, capital requirements and such other factors as our board of directors deems relevant.
Unregistered Sale of Equity Securities and Issuer Purchases of Equity Securities
We did not sell any unregistered equity securities or purchase any of our securities during the period ended December 31, 2009.
25
Table of Contents
Equity Compensation Plans
The following table summarizes information about our common stock that may be issued upon the exercise of options, warrants and rights under all of our compensation plans as of December 31, 2009:
| Plan Category |
Number of Securities to be Issued upon Exercise of Outstanding Options, Warrants and Rights (a) |
Weighted-average Exercise Price of Outstanding Options, Warrants and Rights (b) |
Number of Securities Remaining Available for Future Issuance under Equity Compensation Plans (Excluding Securities Reflected in Column (a)) (c) |
|||||
| Equity compensation plans approved by security holders |
1,103,158 | $ | 16.52 | 2,923,142 | (1) | |||
| Equity compensation plans not approved by security holders |
N/A | N/A | N/A | |||||
| Total |
1,103,158 | $ | 16.52 | 2,923,142 | ||||
| (1) | Does not include the automatic increase of 487,487 shares of common stock on January 2, 2010 under the Amended and Restated 2005 Stock Incentive Plan. |
We do not maintain any equity-based compensation plan that has not been approved by our stockholders or any employee stock purchase plan.
26
Table of Contents
Performance Graph1
The following graph shows a comparison of cumulative total returns for Volcom, the NASDAQ Composite Index and the Standard & Poor’s Apparel, Accessories and Luxury Goods Index during the period commencing on June 30, 2005 (the date of our first day of trading) and ending on December 31, 2009. The comparison assumes $100 was invested on June 30, 2005 in each of our common stock (at the initial offering price), the NASDAQ Composite Index and the Standard & Poor’s Apparel, Accessories and Luxury Goods Index and assumes the reinvestment of all dividends, if any. The comparisons in the table are required by the Securities and Exchange Commission and are not intended to forecast or be indicative of possible future performance of our common stock.
COMPARISON OF 54 MONTH CUMULATIVE TOTAL RETURN*
Among Volcom, Inc, The NASDAQ Composite Index
And The S&P Apparel, Accessories & Luxury Goods Index
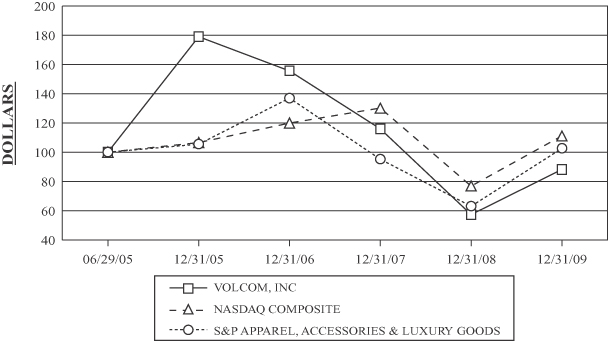
| * | $100 invested on 6/29/05 in stock & 5/31/05 in index-including reinvestment of dividends. Fiscal year ending December 31. |
Copyright © 2009 S&P, a division of The McGraw-Hill Companies Inc. All rights reserved.
Annual Percentage Return
| 06/29/05 | 12/31/05 | 12/31/06 | 12/31/07 | 12/31/08 | 12/31/09 | |||||||
| Volcom, Inc |
100.00 | 179.00 | 155.63 | 115.95 | 57.37 | 88.11 | ||||||
| NASDAQ Composite |
100.00 | 106.51 | 119.84 | 130.04 | 76.85 | 111.01 | ||||||
| S&P Apparel, Accessories & Luxury Goods |
100.00 | 105.53 | 136.92 | 95.22 | 63.07 | 102.63 |
(1) This section is not “soliciting material,” is not deemed “filed” with the SEC and is not to be incorporated by reference in any of our filings under the Securities Act or the Exchange Act whether made before or after the date hereof and irrespective of any general incorporation language in any such filing.
27
Table of Contents
| ITEM 6. | SELECTED FINANCIAL DATA |
The following selected consolidated financial data should be read in conjunction with “Management’s Discussion and Analysis of Financial Condition and Results of Operations” and our consolidated financial statements and the related notes to those statements included elsewhere in this Form 10-K. The consolidated statements of operations data for the years ended December 31, 2009, 2008 and 2007 and the balance sheet data as of December 31, 2009 and 2008 are derived from our audited consolidated financial statements included elsewhere in this Form 10-K. The consolidated statements of operations data for the years ended December 31, 2006 and 2005 and the balance sheet data as of December 31, 2007, 2006 and 2005 are derived from our audited consolidated financial statements not included herein. Historical results are not necessarily indicative of the results to be expected in the future, and the results for the years presented should not be considered indicative of our future results of operations.
| Year Ended December 31, | ||||||||||||||||
| 2009 | 2008 | 2007 | 2006 | 2005 | ||||||||||||
| (In thousands, except share and per share data) | ||||||||||||||||
| Consolidated Statements of Operations Data: |
||||||||||||||||
| Revenues: |
||||||||||||||||
| Product revenues |
$ | 278,598 | $ | 332,110 | $ | 265,193 | $ | 201,186 | $ | 156,716 | ||||||
| Licensing revenues |
2,041 | 2,194 | 3,420 | 4,072 | 3,235 | |||||||||||
| Total revenues |
280,639 | 334,304 | 268,613 | 205,258 | 159,951 | |||||||||||
| Cost of goods sold |
139,844 | 171,208 | 138,570 | 103,237 | 78,632 | |||||||||||
| Gross profit |
140,795 | 163,096 | 130,043 | 102,021 | 81,319 | |||||||||||
| Operating expenses: |
||||||||||||||||
| Selling, general and administrative expenses |
110,847 | 112,464 | 79,411 | 58,417 | 42,939 | |||||||||||
| Asset impairments |
— | 16,230 | — | — | — | |||||||||||
| Total operating expenses |
110,847 | 128,694 | 79,411 | 58,417 | 42,939 | |||||||||||
| Operating income |
29,948 | 34,402 | 50,632 | 43,604 | 38,380 | |||||||||||
| Other income (loss) |
1,892 | (906 | ) | 4,374 | 4,069 | 1,101 | ||||||||||
| Income before provision for income taxes |
31,840 | 33,496 | 55,006 | 47,673 | 39,481 | |||||||||||
| Provision for income taxes |
10,096 | 11,787 | 21,671 | 18,920 | 10,475 | |||||||||||
| Income before equity in earnings of investee |
21,744 | 21,709 | 33,335 | 28,753 | 29,006 | |||||||||||
| Equity in earnings of investee |
— | — | — | — | 331 | |||||||||||
| Net income |
$ | 21,744 | $ | 21,709 | $ | 33,335 | $ | 28,753 | $ | 29,337 | ||||||
| Net income per share: |
||||||||||||||||
| Basic |
$ | 0.89 | $ | 0.89 | $ | 1.37 | $ | 1.19 | $ | 1.36 | ||||||
| Diluted |
$ | 0.89 | $ | 0.89 | $ | 1.37 | $ | 1.18 | $ | 1.34 | ||||||
| Weighted-average shares outstanding: |
||||||||||||||||
| Basic |
24,352,146 | 24,337,923 | 24,302,893 | 24,227,845 | 21,627,821 | |||||||||||
| Diluted |
24,363,544 | 24,357,652 | 24,419,802 | 24,304,627 | 21,839,626 | |||||||||||
28
Table of Contents
| Year Ended December 31, 2005 | |||
| (In thousands, except per share data) | |||
| Pro Forma Net Income Data(1): |
|||
| Income before provision for income taxes, as reported |
$ | 39,481 | |
| Pro forma provision for income taxes |
16,223 | ||
| Pro forma income before equity in earnings of investee |
23,258 | ||
| Equity in earnings of investee |
331 | ||
| Pro forma net income |
$ | 23,589 | |
| Pro forma net income per share: |
|||
| Basic |
$ | 1.09 | |
| Diluted |
$ | 1.08 | |
| Pro forma weighted-average shares outstanding: |
|||
| Basic |
21,627,821 | ||
| Diluted |
21,839,626 | ||
| As of December 31, | |||||||||||||||
| 2009 | 2008 | 2007 | 2006 | 2005 | |||||||||||
| (In thousands) | |||||||||||||||
| Consolidated Balance Sheet Data: |
|||||||||||||||
| Cash and cash equivalents |
$ | 76,180 | $ | 79,613 | $ | 92,962 | $ | 85,414 | $ | 71,712 | |||||
| Working capital |
178,205 | 151,710 | 147,347 | 121,069 | 98,470 | ||||||||||
| Total assets |
253,033 | 221,623 | 202,494 | 149,748 | 111,381 | ||||||||||
| Long-term capital lease obligations, less current portion |
— | 23 | 33 | 106 | 183 | ||||||||||
| Total stockholders’ equity |
218,967 | 193,703 | 172,855 | 133,997 | 102,680 | ||||||||||
| (1) | Pro forma net income data reflects the provision for income taxes that would have been recorded had we been subject to Federal and state income taxes as a C corporation, and not been exempt from paying income taxes other than California franchise taxes due to our S corporation election, from January 1, 2002 to June 29, 2005. |
29
Table of Contents
| ITEM 7. | MANAGEMENT’S DISCUSSION AND ANALYSIS OF FINANCIAL CONDITION AND RESULTS OF OPERATIONS |
The following discussion of our financial condition and results of operations should be read in conjunction with our consolidated financial statements and related notes included elsewhere in this Form 10-K. This discussion contains forward-looking statements that involve risks and uncertainties. Our actual results may differ materially from those anticipated in these forward-looking statements due to known and unknown risks, uncertainties and other factors, including those risks discussed in Item 1A. “Risk Factors” and elsewhere in this Form 10-K. Those risk factors expressly qualify all subsequent oral and written forward-looking statements attributable to us or persons acting on our behalf. We do not have any intention or obligation to update forward-looking statements included in this Form 10-K after the date of this Form 10-K, except as required by law.
Overview
We are an innovative designer, marketer and distributor of premium quality young mens and young womens clothing, footwear, accessories and related products under the Volcom brand name. We seek to offer products that appeal to participants in skateboarding, snowboarding, surfing and motocross, and those who affiliate themselves with the broader action sports lifestyle. Our products, which include, among others, t-shirts, fleece, bottoms, tops, jackets, boardshorts, denim, outerwear, sandals, girls swimwear and a complete collection of kids and boys clothing, combine fashion, functionality and athletic performance. We develop and introduce products that we believe set the industry standard for style and quality in each of our product categories.
On January 17, 2008, we acquired all of the outstanding membership interests of Electric Visual Evolution LLC, or Electric, for $26.3 million plus transaction costs of $1.2 million. Known for its Volt logo, Electric is a core action sports lifestyle brand. Electric’s growing product line includes sunglasses, goggles, t-shirts, bags, hats, belts and other accessories.
As part of our strategy to take direct control of our European operations, we constructed a new European headquarters in Anglet, France, which was completed in February 2007, and delivered our first full season product line during the third quarter of 2007. We furthered our international expansion in 2008 by completing the acquisition of our distributor of Volcom branded products in Japan. In 2009, we took direct control of the Volcom brand in the United Kingdom. Domestically, in 2008, we acquired the assets of Laguna Surf & Sport, a California-based retail chain currently operating two retail stores.
Volcom branded products are currently sold throughout the United States and in over 40 countries internationally by either us or international licensees. We serve the United States, Europe, Canada, Latin America, Asia Pacific and Puerto Rico through our in-house sales personnel, independent sales representatives and distributors. In these areas, Volcom branded products are sold to retailers that we believe merchandise our products in an environment that supports and reinforces our brand image and provide a superior in-store experience. Our retail customers are primarily specialty boardsports retailers and several retail chains.
In Australia, Indonesia, South Africa, Brazil and Argentina (including Paraguay and Uruguay), we license the Volcom brand to entities that we believe have local market insight and strong relationships with retailers in their respective territories. We receive royalties on the sales of Volcom branded products sold by our licensees. Our license agreements specify quality, design, marketing and distribution standards for the Volcom branded products distributed by our licensees. Our licensees are not controlled and operated by us, and the amount of our licensing revenues could decrease in the future. As these license agreements expire, we may assume direct responsibility for serving these licensed territories. We established our own operations in Europe in anticipation of the expiration of the licensing agreement with our European licensee on December 31, 2006. Pursuant to an agreement between us and Volcom Europe (our former European licensee), Volcom Europe produced and distributed the Spring 2007 Volcom line in Europe and paid us our same royalty rate as required under the license agreement. As a result, we experienced a decrease in our licensing revenues and an increase in our selling,
30
Table of Contents
general and administrative expense while we built the necessary infrastructure and hired employees to establish and support our own operations in Europe. Our product revenues have increased in Europe as we now recognize revenue from the direct sale of our products in this territory.
Our revenues increased from $160.0 million in 2005 to $280.6 million in 2009. In June 2007, we began direct distribution of our product in Europe, which has contributed to our increase in sales. The operations of our newly acquired subsidiary, Electric, are included in our operating results since January 17, 2008, which also contributed to our increase in revenues. The recent global macroeconomic environment has continued to put significant pressure on discretionary consumer spending worldwide. While we believe Volcom is well positioned from a business and financial perspective, we are not immune to global economic conditions. We believe it is these conditions that caused our revenues to decrease $53.7 million to $280.6 million in 2009 from $334.3 million in 2008. Based upon our experience and consumer reaction to our products and brand image, we believe that the increase in our revenues from 2005 to 2009 resulted primarily from increased brand recognition and growing acceptance of our products at existing retail accounts. We believe that our marketing programs, product designs and product quality, and our relationships with our retailers contributed to this increased demand and market penetration. In addition, several of our largest retailers have opened additional stores and those store openings likely have contributed to an increase in our product revenues; however, period-over-period increases in our product revenues as judged solely by additional store openings by our largest retailers may not be a useful or accurate measure of revenue increases because our products may not be carried in every new store. Growth of our revenues will depend in part on the demand for our products by consumers, our ability to effectively distribute our products and our ability to design products consistent with the changing fashion interests of boardsports participants and those who affiliate themselves with the broader action sports youth lifestyle.
Sales to Pacific Sunwear decreased 42%, or $22.0 million, for 2009 compared to 2008. We currently expect a decrease in revenue from Pacific Sunwear in the first quarter of 2010 compared to first quarter of 2009. Pacific Sunwear remains an important customer for us and we are working both internally and with Pacific Sunwear to maximize our business with them. We believe our brand continues to be an important part of the Pacific Sunwear business. We also recognize that any customer concentration creates risks and we are, therefore, assessing strategies to lessen our concentration with Pacific Sunwear.
Our gross margins are affected by our ability to accurately forecast demand and avoid excess inventory by matching purchases of finished goods to preseason orders, which decreases our percentage of sales at discount or close-out prices. Gross margins are also impacted by our ability to control our sourcing costs and, to a lesser extent, by changes in our product mix and geographic distribution channel. If the current global economic environment persists or worsens in 2010, we may determine it to be necessary to offer additional discounts, which may reduce our gross margins and could adversely impact our financial performance and results of operations. Our gross margins have also historically been seasonal, with the first quarter typically having the highest margin. If we misjudge forecasting inventory levels or our sourcing costs increase and we are unable to raise our prices, our gross margins may decline.
We currently source the majority of our products from third-party manufacturers located primarily in China and Mexico. As a result, we may be adversely affected by the disruption of trade with these countries, the imposition of new regulations related to imports, duties, taxes and other charges on imports, and significant decreases in the value of the U.S. dollar against foreign currencies. We seek to mitigate the possible disruption in product flow by diversifying our manufacturing across numerous manufacturers and by using manufacturers in countries that we believe to be politically stable. We do not enter into long-term contracts with our third-party manufacturers. Rather, we typically enter into contracts with each manufacturer to produce one or more product line for a particular selling season. This strategy has enabled us to maintain flexibility in our sourcing.
Our products manufactured abroad are subject to U.S. customs laws, which impose tariffs as well as import quota restrictions for textiles and apparel. Quota represents the right, pursuant to bilateral or other international trade arrangements, to export amounts of certain categories of merchandise into a country or territory pursuant to
31
Table of Contents
a visa or license. Additionally, China offers a rebate tax on exports to control the amount of exports from China, which can affect our cost either positively or negatively. These potential cost increases, along with the rising currency and labor shortages in China, may have an impact on our business. While we do not believe the limitations on imports from China will have a material effect on our operations, there may be increased pressure on costs and we intend to closely monitor our sourcing in China to avoid disruptions.
With the passage of the Consumer Product Safety Improvement Act of 2008 and similar state laws, such as California’s Proposition 65, there are new requirements mandated for the textiles and apparel industries. These requirements relate to all metal and painted trim items and certain other raw materials used in children’s apparel, as well as flammability standards in certain types of textiles. The Consumer Product Safety Commission, or CPSC, will require certification and testing for lead in paint and metal trims, pointed or sharp edge items, Phthalates, and fabric flammability to meet the CPSC’s limits. We will continue to monitor the situation and intend to abide by all rules and changes made by the CPSC and similar state laws. This could have a negative impact on the cost of our goods and poses a potential risk if we do not adhere to these requirements.
Over the past five years, our selling, general and administrative expenses have increased on an absolute dollar basis as we have increased our spending on marketing, advertising and promotions, strengthened our management team, hired additional personnel and made investments in new territories and initiatives. As a percentage of revenues, our selling, general and administrative expenses have increased from 26.8% in 2005 to 39.5% in 2009. This increase was primarily due to additional expenses in the United States segment associated with growth and brand building initiatives, including costs associated with our transition to a new warehouse facility in Irvine, California. In addition, we have made investments in our recently acquired distributors in Japan and the UK, which has increased our selling, general and administrative expenses as a percentage of revenues. Our selling, general and administrative expenses have decreased on an absolute dollar basis from $112.5 million in 2008 to $110.8 million in 2009. This decrease in absolute dollars was due primarily to our company-wide expense reduction initiatives enacted in 2009, and decreases in commissions expense and amortization expense. However, our selling, general and administrative expenses as a percentage of revenues have increased from 33.6% in 2008 to 39.5% in 2009. This increase in selling, general and administrative expenses as a percentage of revenues was due primarily to the deleveraging of certain fixed costs over a lower revenue base as well as incremental expenses associated with our recently acquired distributors in Japan and the UK, and incremental expenses associated with our additional retail stores.
Critical Accounting Policies
Our consolidated financial statements have been prepared in accordance with accounting principles generally accepted in the United States of America. To prepare these consolidated financial statements, we must make estimates and assumptions that affect the reported amounts of assets and liabilities. These estimates also affect our reported revenues and expenses. Judgments must also be made about the disclosure of contingent liabilities. Actual results could be significantly different from these estimates. We believe that the following discussion addresses the accounting policies that are necessary to understand and evaluate our reported financial results.
Revenue Recognition
Revenues are recognized upon shipment, at which time transfer of title occurs and risk of ownership passes to the customer. None of our sales agreements with any of our customers provides for any rights of return. However, we do approve returns on a case-by-case basis at our sole discretion to protect our brand and our image. We record an allowance for anticipated returns through a reduction in revenues in the period that the related revenues are recorded. Sales returns allowances are estimated based upon historical returns, current economic trends, changes in customer demands and sell-through of products. Historically, our actual sales returns have not been materially different from management’s original estimates. We do not believe there is a reasonable likelihood that there will be a material change in the future estimates or assumptions used to calculate
32
Table of Contents
the allowance for sales returns. However, if the actual sales returns are significantly different than the recorded estimated allowance, we may be exposed to losses or gains that could be material. For example, assuming there had been a 10% increase in our 2009 returns, pre-tax income for the year ended December 31, 2009 would have been reduced by approximately $1.1 million.
Licensing revenues are recorded when earned based on a stated percentage of the licensees’ sales of Volcom branded products.
Accounts Receivable
We extend credit to our customers and do not require collateral. Our payment terms are typically net-30 with terms up to net-120 for certain products. Throughout the year, we perform credit evaluations of our customers, and we adjust credit limits based on payment history and the customer’s current creditworthiness. We continuously monitor our collections and maintain an allowance for doubtful accounts based on our historical experience of bad debts, current customer receivable balances, age of customer receivable balances, the customer’s financial condition, current economic trends and any specific customer collection issues that have been identified, all of which are subject to change. Historically, our losses associated with uncollectible accounts have been consistent with our estimates, but we cannot assure you that we will continue to experience the same credit loss rates that we have experienced in the past. If the actual uncollected amounts significantly exceed the estimated allowance, our operating results would be adversely affected. Assuming there had been a 10% increase in our 2009 allowance for doubtful accounts, pre-tax income for the year ended December 31, 2009 would have been reduced by approximately $0.5 million. Allowances for doubtful accounts are reported as a component of selling, general and administrative expenses when they arise.
Inventories
We value inventories at the lower of the cost or the current estimated market value of the inventory. We regularly review our inventory quantities on hand and adjust inventory values for excess and obsolete inventory based primarily on estimated forecasts of product demand and market value. Demand for our products could fluctuate significantly. The demand for our products could be negatively affected by many factors, including the following:
| • | weak economic conditions; |
| • | changes in consumer preferences; |
| • | buying patterns of our retailers; |
| • | retailers cancelling orders; and |
| • | unseasonable weather. |
Some events, including terrorist acts or threats and trade restrictions and safeguards, could also interrupt the production and importation of our products or otherwise increase the cost of our products. Additionally, our estimates of product demand and market value could be inaccurate, which could result in excess or obsolete inventory. As a result, our operations and financial performance could be negatively affected. Assuming there had been a 10% increase in our 2009 allowance for excess or obsolete inventory, our pre-tax income for the year ended December 31, 2009 would have been reduced by $0.2 million.
Goodwill and Intangible Assets
We account for goodwill and intangible assets in accordance with Accounting Standards Codification, or ASC, 350. Goodwill and intangible assets with indefinite lives are not amortized but are tested for impairment annually and also in the event of an impairment indicator. We evaluate the recoverability of goodwill based on a
33
Table of Contents
two-step impairment test. The first step compares the fair value of each reporting unit with its carrying amount, including goodwill. If the carrying amount exceeds the fair value, then the second step of the impairment test is performed to measure the amount of any impairment loss. Fair value is determined based on estimated future cash flows, discounted at a rate that approximates our cost of capital. Such estimates are subject to change and we may be required to recognize an impairment loss in the future. Any impairment losses are reflected in operating income. In 2009, we recorded an impairment loss associated with the non-amortizing intangible assets related to Volcom Europe. In 2008, we recorded an impairment loss associated with the goodwill and non-amortizing intangible assets related to the 2008 acquisitions of Electric and Laguna Surf & Sport. In 2007, we recorded an impairment loss associated with the goodwill related to its subsidiary, Welcom Distribution SARL. See Note 7 to the Consolidated Financial Statements for further discussion.
Long-Lived Assets
We acquire assets in the normal course of our business. We evaluate the recoverability of the carrying amount of these long-lived assets (including fixed assets and other amortizable intangible assets) whenever events or changes in circumstances indicate that the carrying value of an asset may not be recoverable. An impairment loss would be recognized when the carrying value exceeds the undiscounted future cash flows estimated to result from the use and eventual disposition of the asset. Impairments, if any, would be recognized in operating earnings. We continually use judgment when applying these impairment rules to determine the timing of the impairment tests, the undiscounted cash flows used to assess impairments and the fair value of a potentially impaired asset. The reasonableness of our judgment could significantly affect the carrying value of our long-lived assets. In 2009 and 2008, we recorded impairment losses associated with its amortizing intangible assets related to the 2008 acquisitions of Electric and Laguna Surf & Sport. See Note 7 to the Consolidated Financial Statements for further discussion.
Investment in Unconsolidated Investee
We account for our investments in unconsolidated investees using the cost method if we do not have the ability to exercise significant influence over the operating and financial policies of the investee. We assess such investments for impairment when there are events or changes in circumstances that may have a significant adverse effect on the fair value of the investment. If, and when, an event or change in circumstances that may have a significant adverse effect on the fair value of the investment is identified, we estimate the fair value of the investment and, if the reduction in value is determined to be other than temporary, we record an impairment loss on the investment.
Income Taxes
We adopted the provisions of guidance included in ASC 740 on January 1, 2007. The guidance included in ASC 740 prescribes a recognition threshold and measurement attribute for the financial statement recognition and measurement of a tax position taken or expected to be taken in a tax return. We must recognize the tax benefit from an uncertain tax position only if it is more likely than not that the tax position will be sustained on examination by the taxing authorities, based on the technical merits of the position. The tax benefits recognized in the financial statements from such a position are measured based on the largest benefit that has a greater than fifty percent likelihood of being realized upon ultimate resolution. As a result of the implementation of guidance included in ASC 740, we recognized a $0.1 million increase in the liability for unrecognized tax benefits, which was accounted for as a reduction to the January 1, 2007 balance of retained earnings. See Note 14 to the Consolidated Financial Statements for further discussion.
We record a provision and liability for federal, state and foreign income taxes using an annual effective tax rate. Deferred income taxes are recorded at our effective tax rate. Management’s judgment is required in assessing the realizability of our deferred tax assets. We consider future taxable income and ongoing prudent and feasible tax planning strategies in assessing the value of our deferred tax assets. If we determine that it is more
34
Table of Contents
likely than not that these assets will not be realized, we would reduce the value of these assets to their expected realizable value, thereby decreasing net income. Evaluating the value of these assets is necessarily based on our judgment. If we subsequently determined that the deferred tax assets that had been written down would, in our judgment, be realized in the future, the value of the deferred tax assets would be increased, thereby increasing net income in the period when that determination was made.
Stock-Based Compensation
We account for stock-based compensation in accordance with ASC 718. We account for all stock-based compensation transactions using a fair-value method and recognize the fair value of each award as an expense over the service period. The fair value of restricted stock awards is based upon the market price of our common stock at the grant date. We estimate the fair value of stock option awards, as of the grant date, using the Black-Scholes option-pricing model. The use of the Black-Scholes model requires that we make a number of estimates, including the expected option term, the expected volatility in the price of our common stock, the risk-free rate of interest and the dividend yield on our common stock. If our expected option term and stock-price volatility assumptions were different, the resulting determination of the fair value of stock option awards could be materially different. In addition, judgment is also required in estimating the number of share-based awards that we expect will ultimately vest upon the fulfillment of service conditions (such as time-based vesting). If the actual number of awards that ultimately vest differs significantly from these estimates, stock-based compensation expense and our results of operations could be materially impacted.
Foreign Currency Translation
We own international subsidiaries that operate with the local currency as their functional currency. Our international subsidiaries generate revenues and collect receivables at future dates in the customers’ local currencies, and purchase inventory primarily in U.S. dollars. Accordingly, we are exposed to gains and losses that result from the effect of changes in foreign currency exchange rates on foreign currency denominated transactions. During 2008 and 2009, we entered into forward exchange contracts to hedge a portion of our European operations U.S. dollar denominated inventory purchases. For all contracts that qualify as cash flow hedges, we record the changes in the fair value of the derivatives in other comprehensive income. Our assets and liabilities that are denominated in foreign currencies are translated at the rate of exchange on the balance sheet date. Revenues and expenses are translated using the average exchange rate for the period. Gains and losses from translation of foreign subsidiary financial statements are included in accumulated other comprehensive income.
A portion of our domestic sales are made in Canadian dollars. In addition, our recently acquired Electric subsidiary purchases sunglass inventory in Euros. As a result, our domestic operations are exposed to transaction gains and losses that result from movements in foreign currency exchange rates. Changes in our assets and liabilities that are denominated in foreign currencies are translated into U.S. dollars at the rate of exchange on the balance sheet date, and are reflected in our statement of operations.
General
Our revenues consist of both our product revenues and our licensing revenues. Our product revenues are derived primarily from the sale of young mens and young womens clothing, accessories and related products under the Volcom brand name. We offer Volcom branded apparel and accessory products in six main categories: mens, girls, boys, footwear, girls swim and snow. Product revenues also include revenues from music and film sales. Beginning in January 2008, we added the full product line from Electric, which includes sunglasses, goggles, soft goods and other accessories sold under the Electric brand name. Amounts billed to customers for shipping and handling are included in product revenues. Licensing revenues consist of royalties on product sales by our international licensees in Europe (through delivery of our Spring 2007 line), Australia, Indonesia, South Africa, Brazil and Argentina.
35
Table of Contents
Our cost of goods sold consists primarily of product costs, retail packaging, freight costs associated with shipping goods to customers, quality control and inventory shrinkage. There is no cost of goods sold associated with our licensing revenues.
Our selling, general and administrative expenses consist primarily of wages and related payroll and employee benefit costs, handling costs, sales and marketing expenses, advertising costs, legal and accounting professional fees, insurance, utilities and other facility related costs, such as rent and depreciation.
Results of Operations
The following table sets forth selected items in our consolidated statements of operations for the periods presented, expressed as a percentage of revenues:
| Year Ended December 31, | |||||||||
| 2009 | 2008 | 2007 | |||||||
| Revenues |
100.0 | % | 100.0 | % | 100.0 | % | |||
| Cost of goods sold |
49.8 | 51.2 | 51.6 | ||||||
| Gross profit |
50.2 | 48.8 | 48.4 | ||||||
| Operating expenses: |
|||||||||
| Selling, general and administrative expenses |
39.5 | 33.6 | 29.6 | ||||||
| Asset impairments |
— | 4.9 | — | ||||||
| Total operating expenses |
39.5 | 38.5 | 29.6 | ||||||
| Operating income |
10.7 | 10.3 | 18.8 | ||||||
| Other income (expense) |
0.6 | (0.3 | ) | 1.7 | |||||
| Income before provision for income taxes |
11.3 | 10.0 | 20.5 | ||||||
| Provision for income taxes |
3.6 | 3.5 | 8.1 | ||||||
| Net income |
7.7 | % | 6.5 | % | 12.4 | % | |||
Year Ended December 31, 2009 Compared to Year Ended December 31, 2008
Revenues
Consolidated revenues in 2009 were $280.6 million, a decrease of $53.7 million, or 16.1%, compared to $334.3 million in 2008. Revenues from our United States segment were $188.8 million in 2009, a decrease of $48.3 million, or 20.4% compared to $237.1 million in 2008. Revenues from our Europe segment were $70.7 million in 2009, a decrease of $2.3 million, or 3.2% compared to $73.0 million in 2008. Revenues from our Electric segment were $21.1 million in 2009, a decrease of $3.1 million, or 12.8% compared to $24.2 million in 2008. We believe our overall decline in revenues was driven primarily by the state of the global macroeconomic environment and the decline in discretionary consumer spending worldwide. The decrease in our European segment revenues was affected by $3.8 million of net detrimental changes in foreign currency rates. The primary functional currency of our European operations is the Euro. On a Euro to Euro basis, revenues in our European segment increased approximately 2% in 2009 compared to 2008.
Revenues from our five largest customers were $56.8 million in 2009, a decrease of $37.3 million, or 39.7%, compared to $94.1 million in 2008. Excluding revenues from Pacific Sunwear, which decreased $22.0 million, or 42.3%, to $30.0 million, total revenues from our remaining five largest customers decreased $15.3 million, or 36.4%, to $26.8 million in 2009 from $42.1 million in 2008. We currently expect a decrease in revenue from Pacific Sunwear in the first quarter of 2010 compared to first quarter of 2009.
Consolidated product revenues decreased $53.5 million, or 16.1%, in 2009 to $278.6 million from $332.1 million in 2008. Revenues from mens products decreased $25.5 million, or 15.7%, to $136.8 million in
36
Table of Contents
2009, compared to $162.3 million in 2008. Revenues from girls products decreased $22.0 million, or 27.3%, to $58.5 million in 2009 compared to $80.5 million in 2008. Revenues from our Electric subsidiary decreased $3.1 million, or 12.8%, to $21.1 million in 2009 compared to $24.2 million in 2008. Revenues from boys products, which include our line of kids clothing for young boys ages 4 to 7, decreased $1.9 million, or 8.4%, to $20.0 million in 2009 compared to $21.9 million in 2008. Revenues from footwear products decreased $1.3 million, or 22.9%, to $4.4 million in 2009 compared to $5.7 million in 2008. Revenues from our girls swim line decreased $0.4 million, or 6.5%, to $5.7 million in 2009 compared to $6.1 million in 2008. Revenues from snow products increased $1.5 million, or 5.1%, to $29.7 million in 2009 compared to $28.2 million in 2008.
Product revenues by geographic region include revenues from our Electric operating segment, and are allocated based on customer location. Such product revenues in the United States were $138.7 million, or 49.8% of our product revenues, and $195.9 million, or 59.0% of our product revenues, in 2009 and 2008, respectively. Product revenues in Europe were $75.3 million, or 27.0% of our product revenues, and $77.9 million, or 23.5% of our product revenues, in 2009 and 2008, respectively. Product revenues in the rest of the world consist primarily of product revenues from sales in the Canadian and Asia Pacific regions, and do not include sales by our international licensees. Such product revenues in the rest of the world were $64.6 million, or 23.2% of our product revenues, and $58.3 million, or 17.5% of our product revenues, in 2009 and 2008, respectively.
Gross Profit
In 2009, consolidated gross profit decreased $22.3 million, or 13.7%, to $140.8 million compared to $163.1 million in 2008. Gross profit as a percentage of revenues, or gross margin, increased 140 basis points to 50.2% in 2009 compared to 48.8% in 2008. Gross margin related specifically to product revenues increased 140 basis points to 49.8% in 2009 compared to 48.4% in 2008. Gross margin on product from the U.S. segment increased 280 basis points to 48.3% in 2009 compared to 45.5% in 2008, primarily due to limited year-end markdowns as a result of an overall less promotional selling environment and tighter inventory controls, combined with an increased margin in Japan due to the acquisition of our Japanese distributor in November 2008. Gross margin from the European segment decreased 360 basis points to 52.0% in 2009 compared to 55.6% in 2008, primarily due to currency fluctuations related to the strengthening of the U.S. dollar to the Euro compared to the same period last year, which affected their U.S. dollar inventory purchases. Gross margin from the Electric segment decreased 50 basis points to 55.3% in 2009 compared to 55.8% in 2008, primarily due to higher inventory liquidation than in the prior year.
Operating Expenses
In 2009, consolidated total operating expenses decreased $17.9 million, or 13.9%, to $110.8 million compared to $128.7 million in 2008. In 2008, operating expenses included a $16.2 million non-cash asset impairment charge on goodwill and intangible assets related to the 2008 acquisitions of Electric and Laguna Surf & Sport. These impairment charges were driven by the economic downturn, whereby our estimated future cash flows expected from these reporting units were significantly reduced causing decreases in their estimated fair market values. The remaining $1.7 million decrease in selling, general and administrative expenses was due primarily to decreased commissions expense of $2.7 million associated with a decrease in revenues between periods, decreased amortization expense of $1.4 million associated with the impairment of amortizing intangible assets during the fourth quarter of 2008 and a net decrease in various other expense categories of $1.1 million. These decreases were offset by an increase in selling, general and administrative expenses due to incremental expenses of $3.5 million associated with our recently acquired Japanese distributor. As a percentage of revenues, selling, general and administrative expenses increased to 39.5% in 2009 from 33.6% in 2008. The 5.9% increase in selling, general and administrative expenses as a percentage of revenues was due primarily to the deleveraging of certain fixed costs over a lower revenue base as well as incremental expenses associated with our recently acquired distributors in Japan and the UK, and incremental expenses associated with our additional retail stores.
37
Table of Contents
Operating Income
As a result of the factors above, consolidated operating income in 2009 decreased $4.5 million to $29.9 million compared to $34.4 million in 2008. Operating income as a percentage of revenues increased to 10.7% in 2009 from 10.3% in 2008.
Other Income
Other income primarily includes net interest income and foreign currency gains and losses. Interest income in 2009 was $0.4 million compared to $0.9 million in 2008. This decrease in interest income was due to lower returns on our cash and cash equivalents and short-term investments. Foreign currency gain (loss) increased to a $1.5 million gain in 2009 compared to a $1.8 million loss in 2008, which was due primarily to fluctuations in the Euro and Canadian dollar exchange rates against the U.S. dollar.
Provision for Income Taxes
We computed our provision for income taxes for 2009 using an annual effective tax rate of 31.7%, which is a decrease of 350 basis points from 35.2% in 2008 due primarily to the 2008 income tax effect of the goodwill and intangible asset impairment. The provision for income taxes decreased $1.7 million to $10.1 million in 2009 compared to $11.8 million in 2008.
Net Income
As a result of the factors above, net income remained consistent at $21.7 million in 2009 and 2008.
Year Ended December 31, 2008 Compared to Year Ended December 31, 2007
Revenues
Consolidated revenues in 2008 were $334.3 million, an increase of $65.7 million, or 24.5%, compared to $268.6 million in 2007. Revenues from our European segment were $73.0 million in 2008, an increase of $32.9 million, compared to $40.1 million in 2007. The increase in revenues from our European segment was a result of the transition of our European operations from a licensee model to a direct control model during the third quarter of 2007. The operations of Electric have been included in our operating results since January 17, 2008, and contributed $24.2 million in revenues in 2008. Revenues from our five largest customers were $94.1 million in 2008, an increase of $5.3 million, or 5.9%, compared to $88.8 million in 2007. Excluding revenues from Pacific Sunwear, which increased $3.4 million, or 6.9%, to $52.0 million, total revenues from our remaining five largest customers increased $1.9 million, or 4.7%, to $42.1 million in 2008 from $40.2 million in 2007. We believe our overall domestic revenue growth was driven primarily by the increasing popularity of our brand across our target markets and increasing acceptance of our products at retail as a result of marketing and advertising programs that effectively promoted our brand, a compelling product offering, high-quality standards and strong relationships with our retailers. Further, several of our largest retailers opened additional stores during 2008 and those store openings likely contributed to an increase in our product revenues; however, period-over-period increases in our product revenues as judged solely by additional store openings by our largest retailers may not be a useful or accurate measure of revenue increases because our products may not be carried in every new store.
Consolidated product revenues increased $66.9 million, or 25.2%, in 2008 to $332.1 million from $265.2 million in 2007. Revenues from mens products increased $29.2 million, or 22.0%, to $162.3 million in 2008, compared to $133.1 million in 2007. Revenues from snow products increased $6.0 million, or 26.9%, to $28.2 million in 2008 compared to $22.2 million in 2007. Revenues from girls products increased $3.2 million, or 4.1%, to $80.5 million in 2008 compared to $77.3 million in 2007. Revenues from our girls swim line increased $2.4 million, or 64.1%, to $6.1 million in 2008 compared to $3.7 million in 2007. Revenues from boys
38
Table of Contents
products, which include our line of kids clothing for young boys ages 4 to 7, increased $1.9 million, or 9.2%, to $21.9 million in 2008 compared to $20.0 million in 2007. Revenues from our new Electric subsidiary were $24.2 million in 2008.
Licensing revenues decreased 35.8% to $2.2 million in 2008 from $3.4 million in 2007 as a result of the transition of our European operations from a licensee model to a direct control model.
Product revenues by geographic region include revenues from our Electric operating segment, and are allocated based on customer location. Such product revenues in the United States were $195.9 million, or 59.0% of our product revenues, and $174.3 million, or 65.7% of our product revenues, in 2008 and 2007, respectively. Product revenues in Europe were $77.9 million, or 23.5% of our product revenues, and $40.1 million, or 15.1% of our product revenues, in 2008 and 2007, respectively. Product revenues in the rest of the world consist primarily of product revenues from sales in Canada and Asia Pacific, and do not include sales by our international licensees. Such product revenues in the rest of the world were $58.3 million, or 17.5% of our product revenues, and $50.8 million, or 19.2% of our product revenues, in 2008 and 2007, respectively.
Gross Profit
In 2008, consolidated gross profit increased $33.1 million, or 25.4%, to $163.1 million compared to $130.0 million in 2007. Gross profit as a percentage of revenues, or gross margin, increased 40 basis points to 48.8% in 2008 compared to 48.4% in 2007. Gross margin related specifically to product revenues increased 70 basis points to 48.4% in 2008 compared to 47.7% in 2007. Gross margin on product from the U.S. segment decreased 200 basis points to 45.5% in 2008 compared to 47.5% in 2007, primarily due to additional discounts that we believe were the result of the soft domestic retail environment. These U.S. segment gross margin pressures were partially offset by our European segment delivering gross margin on product of 55.6% due to strong full-price sell through and foreign currency gains during 2008. This compares to a gross margin on product of 48.9% in 2007, when our European segment was undergoing its transition from a licensee model to a direct control model in the third quarter of 2007.
Operating Expenses
In 2008, consolidated total operating expenses increased $49.3 million, or 62.1%, to $128.7 million compared to $79.4 million in 2007. This increase includes the $16.2 million non-cash asset impairment charge on goodwill and intangible assets related to the 2008 acquisitions of Electric and Laguna Surf & Sport. These impairment charges were driven by the economic downturn, whereby our estimated future cash flows expected from these reporting units were significantly reduced causing decreases in their estimated fair market values. The remaining $33.1 million increase in selling, general and administrative expenses was due primarily to increased expenses of $8.0 million related to the transition of our European operations from a licensee model to a direct control model, expenses of $14.7 million from our newly acquired subsidiary, Electric, and expenses of $1.0 million from our recently acquired Japanese operations. We also had increased payroll and payroll-related expenses of $2.6 million due to expenditures on infrastructure and personnel, increased rent expense of $2.1 million due to our additional retail store leases and Irvine warehouse location, increased depreciation expense of $1.2 million, increased bad debt expense of $0.9 million, and a net increase of $2.6 million in various other expense categories. As a percentage of revenues, selling, general and administrative expenses increased to 33.6% in 2008 from 29.6% in 2007. The 4.0% increase in selling, general and administrative expenses as a percentage of revenues was due primarily to the factors mentioned above.
Operating Income
As a result of the factors above, consolidated operating income in 2008 decreased $16.2 million to $34.4 million compared to $50.6 million in 2007. Operating income as a percentage of revenues decreased to 10.3% in 2008 from 18.8% in 2007.
39
Table of Contents
Other Income
Other income primarily includes net interest income and foreign currency gains and losses. Interest income in 2008 was $0.9 million compared to $4.0 million in 2007. This decrease in interest income was due to lower cash balances and lower returns on invested cash. Foreign currency gain (loss) decreased to a $1.8 million loss in 2008 compared to a $0.4 million gain in 2007, which was due primarily to foreign exchange losses associated with our Canadian accounts receivables, as the U.S. dollar strengthened significantly against the Canadian dollar in 2008.
Provision for Income Taxes
We computed our provision for income taxes for 2008 using an annual effective tax rate of 35.2%, which is a decrease of 420 basis points from 39.4% in 2007 due primarily to the effect of the foreign tax rate differential, which was partially offset by the income tax effect of the goodwill and intangible asset impairment recorded in 2008. The provision for income taxes decreased $9.9 million to $11.8 million in 2008 compared to $21.7 million in 2007.
Net Income
As a result of the factors above, net income decreased $11.6 million, or 34.9%, to $21.7 million in 2008 from $33.3 million in 2007.
Liquidity and Capital Resources
Our primary cash needs are working capital and capital expenditures. These sources of liquidity may be impacted by fluctuations in demand for our products, ongoing investments in our infrastructure and expenditures on marketing and advertising.
The following table sets forth, for the periods indicated, our beginning balance of cash and cash equivalents, net cash flows from operating, investing and financing activities and our ending balance of cash and cash equivalents:
| Year Ended December 31, | ||||||||||||
| 2009 | 2008 | 2007 | ||||||||||
| (In thousands) | ||||||||||||
| Cash and cash equivalents at beginning of period |
$ | 79,613 | $ | 92,962 | $ | 85,414 | ||||||
| Cash flow from operating activities |
36,209 | 24,672 | 19,279 | |||||||||
| Cash flow from investing activities |
(40,670 | ) | (38,659 | ) | (14,973 | ) | ||||||
| Cash flow from financing activities |
(83 | ) | 635 | 1,623 | ||||||||
| Effect of exchange rate changes on cash |
1,111 | 3 | 1,619 | |||||||||
| Cash and cash equivalents at end of period |
$ | 76,180 | $ | 79,613 | $ | 92,962 | ||||||
As of December 31, 2009, we had $76.2 million in cash and cash equivalents compared to $79.6 million in cash and cash equivalents as of December 31, 2008.
40
Table of Contents
Cash from operating activities consists primarily of net income adjusted for certain non-cash items including asset impairments, depreciation, deferred income taxes, provision for doubtful accounts, excess tax benefits related to the exercise of stock options, loss on disposal of property and equipment, stock-based compensation and the effect of changes in working capital and other activities. In 2009 and 2008, cash from operating activities was $36.2 million and $24.7 million, respectively. The $11.5 million increase in cash from operating activities between the periods was attributable to the following:
| (In |
Attributable to | |||
| $ | 15,222 | Increase in cash flows from accounts payable due to the timing of payments | ||
| 9,578 | Increase in cash flows due to fluctuations in the income tax receivable/payable balance and deferred income tax balance between periods | |||
| 8,355 | Increase in cash flows from accounts receivable due to the timing of sales and collections | |||
| (16,096 | ) | Decrease in non-cash asset impairment charges due to the 2008 impairment of goodwill and intangible assets associated with the acquisitions of Electric and Laguna Surf & Sport | ||
| (3,994 | ) | Decrease in cash flows from inventory as we strategically used cash to build inventory levels in basic and carryover styles to be available for potential in-season business | ||
| (1,260 | ) | Decrease in cash flows from prepaid expenses and other current assets due to increased prepayments on marketing, advertising and international consumption taxes | ||
| (268 | ) | Net decrease in cash flows from all other operating activities | ||
| $ | 11,537 | Total | ||
Cash from investing activities was a use of cash of $40.7 million and $38.7 million in 2009 and 2008, respectively. During 2009, the cash used in investing activities was primarily due to the net purchase of short-term investments of $35.0 million, purchases of property and equipment of $4.8 million, of which $1.6 million was related to the purchase of equipment for the new European warehouse, and $0.9 million spent on taking direct control of the UK territory from our UK distributor. During 2008, the cash used in investing activities was primarily for the acquisitions of Electric, Laguna Surf & Sport and our Japanese distributor, which were purchased for $32.1 million, net of cash acquired. Capital expenditures during 2008 included the ongoing purchase of investments in computer equipment, warehouse equipment, marketing initiatives and in-store buildouts at customer retail locations.
During 2009, the cash used in financing activities was $0.1 million, and is primarily due to principal payments on capital lease obligations. During 2008, the cash provided by financing activities was $0.6 million, and is primarily due to the proceeds and excess tax benefits related to the exercise of stock options and cash received from government grants, offset by principal payment on capital lease obligations.
We currently have no material cash commitments, except for our normal recurring trade payables, expense accruals, operating leases, capital leases and athlete endorsement agreements. We believe that our cash and cash equivalents, short-term investments, cash flow from operating activities and available borrowings under our credit facility will be sufficient to meet our capital requirements for at least the next 12 months.
Credit Facilities
We maintain a $40.0 million unsecured credit agreement with a bank (which includes a line of credit, foreign exchange facility and letter of credit sub-facilities). The amended credit agreement, which expires on August 31, 2010, may be used to fund our working capital requirements. Borrowings under this agreement bear
41
Table of Contents
interest, at our option, either at the bank’s prime rate (3.25% at December 31, 2009) or LIBOR plus 1.25%. Under this credit facility, we had $1.9 million outstanding in letters of credit at December 31, 2009. At December 31, 2009 there were no outstanding borrowings under this credit facility, and $38.1 million was available under the credit facility. The credit agreement requires compliance with conditions precedent that must be satisfied prior to any borrowing, as well as ongoing compliance with specified affirmative and negative covenants, including covenants related to our financial condition, including requirements that we maintain a minimum net profit after tax and a minimum EBITDA. At December 31, 2009, we were in compliance with all restrictive covenants.
Contractual Obligations and Commitments
We did not have any off-balance sheet arrangements or outstanding balances on our credit facility as of December 31, 2009. The following table summarizes, as of December 31, 2009, the total amount of future payments due in various future periods:
| Payments Due by Period | |||||||||||||||||||||
| Total | 2010 | 2011 | 2012 | 2013 | 2014 | Thereafter | |||||||||||||||
| (In thousands) | |||||||||||||||||||||
| Operating lease obligations |
$ | 31,394 | $ | 5,353 | $ | 4,843 | $ | 4,535 | $ | 3,408 | $ | 3,423 | $ | 9,832 | |||||||
| Capital lease obligations |
56 | 56 | — | — | — | — | — | ||||||||||||||
| Professional athlete sponsorships |
11,845 | 5,370 | 1,990 | 1,530 | 1,005 | 700 | 1,250 | ||||||||||||||
| Contractual letters of credit |
1,877 | 1,877 | — | — | — | — | — | ||||||||||||||
| Total |
$ | 45,172 | $ | 12,656 | $ | 6,833 | $ | 6,065 | $ | 4,413 | $ | 4,123 | $ | 11,082 | |||||||
We lease certain land and buildings under non-cancelable operating leases. The leases expire at various dates through 2036, excluding extensions at our option, and contain provisions for rental adjustments, including in certain cases, adjustments based on increases in the Consumer Price Index. The leases generally contain renewal provisions for varying periods of time.
In June 2008, we entered into a lease agreement for a new warehouse facility located in close proximity to our existing European headquarters in France. The landlord has completed construction on the warehouse, and product shipments began in November 2009. The lease runs for a period of nine years, with an option to terminate after six years.
We lease computer and office equipment pursuant to capital lease obligations. These leases bear interest at rates ranging from 2.9% to 10.7% per year, and expire at various dates through October 2010.
We establish relationships with professional athletes in order to promote our products and brand. We have entered into endorsement agreements with professional skateboarding, snowboarding, surfing and motocross athletes. Many of these contracts provide incentives for magazine exposure and competitive victories while wearing or using our products. It is not possible to determine the precise amounts that we will be required to pay under these agreements as they are subject to many variables. The amounts listed above are the approximate amounts of the minimum obligations required to be paid under these contracts. The additional estimated maximum amount that could be paid under our existing contracts, assuming that all bonuses, victories and similar incentives are achieved during the five-year period ending December 31, 2014, is approximately $4.2 million. The actual amounts paid under these agreements may be higher or lower than the amounts discussed above as a result of the variable nature of these obligations.
Our contractual letters of credit have maturity dates of less than one year. We use these letters of credit to purchase finished goods.
42
Table of Contents
We adopted the provisions of guidance included in ASC 740 on January 1, 2007. At December 31, 2009, we had $68,000 of total unrecognized tax benefits recorded as liabilities and we are uncertain as to if or when such amounts may be settled.
Seasonality
Historically, we have experienced greater revenue in the second half of the year than in the first half due to a concentration of shopping around the fall and holiday seasons and pricing differences between our products sold during the first and second half of the year, as products we sell in the fall and holiday seasons generally have higher prices per unit than products we sell in the spring and summer seasons. We typically sell more of our summer products (boardshorts, t-shirts and sunglasses) in the first half of the year and a majority of our winter products (pants, long sleeve shirts, sweaters, fleece, jackets, outerwear and goggles) in the second half of the year. We anticipate that this seasonal impact on our revenues is likely to continue. In addition, our direct European operations began shipping product during the second half of 2007 which caused a slightly higher concentration of revenues in the second half of 2007 over historical levels. Our business in Europe is extremely seasonal with revenues concentrated primarily in the first and third quarters, shipment of low margin samples concentrated in the second and fourth quarters, and a relatively steady pace of selling, general and administrative expenses throughout the year. During the two-year period ended December 31, 2009, approximately 55% of our revenues, 55% of our gross profit and 75% of our operating income (excluding non-cash asset impairment charges) were generated in the second half of the year, with the third quarter generally generating most of our operating income due to fall, holiday and snow shipments. Accordingly, our results of operations for the first and second quarters of any year are not indicative of the results we expect for the full year.
As a result of the effects of seasonality, particularly in preparation for the fall and holiday shopping seasons, our inventory levels and other working capital requirements generally begin to increase during the second quarter and into the third quarter of each year. Based on our current cash and short-term investment position, we do not anticipate borrowing under our credit facility in the near term.
Backlog
We typically receive the bulk of our orders for each of our seasons up to four months prior to the date the products are shipped to customers. Generally, these orders are not subject to cancellation prior to the date of shipment. At December 31, 2009, our order backlog was approximately $73.7 million, compared to approximately $75.6 million at December 31, 2008. For a variety of reasons, including the timing of release dates for our seasonal product collections, the timing of shipments, timing of order deadlines, timing of receipt of orders, product mix of customer orders and the amount of in-season orders, backlog may not be a reliable measure of future sales for any succeeding period. For these reasons, backlog figures in one year may not be directly comparable to backlog figures in another year when measured at the same date.
Inflation
We do not believe inflation has had a material impact on our results of operations in the past. There can be no assurance that our business will not be affected by inflation in the future.
Vulnerability Due to Concentrations
One customer, Pacific Sunwear, accounted for approximately 11% and 16% of our product revenues in 2009 and 2008, respectively. No other customer accounted for more than 10% of our product revenues in 2009 or 2008.
Sales to Pacific Sunwear decreased 42%, or $22.0 million, for 2009 compared to 2008. We currently expect a decrease in revenue from Pacific Sunwear in the first quarter of 2010 compared to first quarter of 2009. Pacific
43
Table of Contents
Sunwear remains an important customer for us and we are working both internally and with Pacific Sunwear to maximize our business with them. We believe our brand continues to be an important part of the Pacific Sunwear business. We also recognize that any customer concentration creates risks and we are, therefore, assessing strategies to lessen our concentration with Pacific Sunwear.
We do not own or operate any manufacturing facilities and source our products from independently-owned manufacturers. Purchases from Dragon Crowd and Ningbo Jehson Textiles totaled approximately 17% and 16%, respectively, of our product costs in 2009, and 18% and 14%, respectively, of our product costs in 2008.
Recent Accounting Pronouncements
See Note 1 to the Consolidated Financial Statements for a discussion of recent accounting pronouncements.
44
Table of Contents
| ITEM 7A. | QUANTITATIVE AND QUALITATIVE DISCLOSURES ABOUT MARKET RISK |
Foreign Currency Risk
In the normal course of business, we are exposed to foreign currency exchange rate risks (see Note 17 to the Consolidated Financial Statements) that could impact our results of operations. We are exposed to gains and losses resulting from fluctuations in foreign currency exchange rates relating to certain sales, licensing revenues and product purchases of our international subsidiaries that are denominated in currencies other than their functional currencies. We are also exposed to foreign currency gains and losses resulting from domestic transactions that are not denominated in U.S. dollars. Furthermore, we are exposed to gains and losses resulting from the effect that fluctuations in foreign currency exchange rates have on the reported results in our consolidated financial statements due to the translation of the operating results and financial position of our international subsidiaries. Changes in foreign currency rates affect our results of operations and distort comparisons between periods. For example, when the U.S. dollar strengthens compared to the Euro, there is a negative effect on our reported results from our European operation because it takes more profits in Euro to generate the same amount of profits in stronger U.S. dollars. We do not enter into foreign currency exchange contracts to hedge the translation of operating results and financial position of our international subsidiaries.
A portion of our domestic sales are made in Canadian dollars. In 2009, 2008 and 2007, we derived 10.7%, 9.6% and 11.7% of our product revenues, respectively, from sales in Canada. As a result, we are exposed to fluctuations in the value of Canadian dollar denominated receivables and payables, foreign currency investments, primarily consisting of Canadian dollar deposits, and cash flows related to repatriation of those investments. A weakening of the Canadian dollar relative to the U.S. dollar could negatively impact the profitability of our products sold in Canada and the value of our Canadian receivables, as well as the value of repatriated funds we may bring back to the United States from Canada. Account balances denominated in Canadian dollars are marked-to-market every period using current exchange rates and the resulting changes in the account balance are included in our income statement as other income. If recent foreign currency market volatility continues and the Canadian dollar weakens, our results could be adversely affected. Based on the balance of Canadian dollar receivables of approximately $7.2 million at December 31, 2009, an assumed 10% strengthening of the U.S. dollar would result in pretax foreign currency losses of $0.7 million.
We are exposed to foreign currency exchange rate risks between the Euro and the U.S. dollar, as a portion of our European operations purchases inventory in U.S. dollars. This exposure is partially offset as a portion of our domestic Electric operations purchases inventory in Euro. In addition, we are also exposed to foreign currency gains and losses resulting from various other European operations transactions that are denominated in U.S. dollars. A weakening of the Euro relative to the U.S. dollar could have a negative impact on our net exposure of the Euro to the U.S. dollar. If recent foreign currency market volatility continues and the Euro weakens compared to the U.S. dollar, our results could be adversely affected. Based on our net Euro exposure of approximately $8.3 million, an assumed 10% strengthening of the U.S. dollar would result in pre-tax foreign currency losses of $1.2 million.
We generally purchase Volcom branded finished goods from our manufacturers in U.S. dollars. However, we source substantially all of these finished goods abroad and their cost may be affected by changes in the value of the relevant currencies. Price increases caused by currency exchange rate fluctuations could increase our costs. If we are unable to increase our prices to a level sufficient to cover the increased costs, it could adversely affect our margins and we may become less price competitive with companies who manufacture their products in the United States.
Interest Rate Risk
We maintain a $40.0 million unsecured credit agreement (which includes a line of credit, foreign exchange facility and letter of credit sub-facilities) with no balance outstanding at December 31, 2009. The credit agreement, which expires on August 31, 2010, may be used to fund our working capital requirements. Borrowings under this
45
Table of Contents
agreement bear interest, at our option, either at the bank’s prime rate (3.25% at December 31, 2009) or LIBOR plus 1.25%. Based on the average interest rate on our credit facility during 2009, and to the extent that borrowings were outstanding, we do not believe that a 10% change in interest rates would have a material effect on our results of operations or financial condition.
| ITEM 8. | CONSOLIDATED FINANCIAL STATEMENTS AND SUPPLEMENTARY DATA |
Information with respect to this item is set forth in “Index to Consolidated Financial Statements” under Part IV, Item 15 of this report.
| ITEM 9. | CHANGES IN AND DISAGREEMENTS WITH ACCOUNTANTS ON ACCOUNTING AND FINANCIAL DISCLOSURE |
None
| ITEM 9A. | CONTROLS AND PROCEDURES |
Disclosure Controls and Procedures
We maintain disclosure controls and procedures that are designed to ensure that information required to be disclosed in our Exchange Act reports is recorded, processed, summarized and reported within the time periods specified in the Securities and Exchange Commission’s rules and forms, and that such information is accumulated and communicated to our management, including our Chief Executive Officer and our Chief Financial Officer, as appropriate, to allow timely decisions regarding required disclosures. Our management, including our Chief Executive Officer and our Chief Financial Officer, does not expect that our disclosure controls or procedures will prevent all error and all fraud. A control system, no matter how well conceived and operated, can provide only reasonable, not absolute, assurance that the objectives of the control system are met. Further, the benefits of controls must be considered relative to their costs. Because of the inherent limitations in all control systems, no evaluation of controls can provide absolute assurance that all control issues and instances of fraud, if any, within Volcom have been detected. These inherent limitations include the realities that judgments in decision-making can be faulty, and that breakdowns can occur because of simple error or mistake. Additionally, controls can be circumvented by the individual acts of some persons, by collusion of two or more people, or by management override of the control. The design of any system of controls is also based in part upon certain assumptions about the likelihood of future events, and there can be no assurance that any design will succeed in achieving its stated goals under all potential future conditions. Because of the inherent limitations in a cost-effective control system, misstatements due to error or fraud may occur and not be detected.
We carried out an evaluation, under the supervision and with the participation of our management, including our Chief Executive Officer and our Chief Financial Officer, of the effectiveness of the design and operation of our disclosure controls and procedures as of December 31, 2009, the end of the annual period covered by this report. The evaluation of our disclosure controls and procedures included a review of the disclosure controls’ and procedures’ objectives, design, implementation and the effect of the controls and procedures on the information generated for use in this report. In the course of our evaluation, we sought to identify data errors, control problems or acts of fraud and to confirm the appropriate corrective actions, including process improvements, were being undertaken.
Based on the foregoing, our Chief Executive Officer and our Chief Financial Officer concluded that, as of the end of the period covered by this report, our disclosure controls and procedures were effective and were operating at the reasonable assurance level.
46
Table of Contents
Internal Control Over Financial Reporting
There has been no change in the Company’s internal controls over financial reporting (as such term is defined in Rules 13a-15(f) and 15d-15(f) under the Exchange Act) during the Company’s most recent fiscal quarter that has materially affected, or is reasonably likely to materially affect, the Company’s internal controls over financial reporting.
Management’s Report on Internal Control Over Financial Reporting
The Company’s management is responsible for establishing and maintaining adequate internal control over financial reporting, as such term is defined in Exchange Act Rules 13a-15(f) and 15d-15(f). Under the supervision and with the participation of the Company’s management, including the Company’s Chief Executive Officer and Chief Financial Officer, the Company has conducted an evaluation of the effectiveness of its internal control over financial reporting as of December 31, 2009, based on the framework in Internal Control — Integrated Framework issued by the Committee of Sponsoring Organizations of the Treadway Commission. Based on management’s evaluation under the framework in Internal Control — Integrated Framework, management concluded that the Company’s internal control over financial reporting was effective as of December 31, 2009.
The Company’s independent registered public accounting firm that audited the consolidated financial statements included in the annual report containing the disclosure required by this Item has issued an attestation report on the Company’s internal control over financial reporting. This report appears under the Report of Independent Registered Public Accounting Firm On Internal Control Over Financial Reporting, which is included below.
47
Table of Contents
REPORT OF INDEPENDENT REGISTERED PUBLIC ACCOUNTING FIRM
Board of Directors and Stockholders
Volcom, Inc.
We have audited the internal control over financial reporting of Volcom, Inc. and subsidiaries (the “Company”) as of December 31, 2009, based on criteria established in Internal Control — Integrated Framework issued by the Committee of Sponsoring Organizations of the Treadway Commission. The Company’s management is responsible for maintaining effective internal control over financial reporting and for its assessment of the effectiveness of internal control over financial reporting, included in the accompanying Management’s Report on Internal Control Over Financial Reporting. Our responsibility is to express an opinion on the Company’s internal control over financial reporting based on our audit.
We conducted our audit in accordance with the standards of the Public Company Accounting Oversight Board (United States). Those standards require that we plan and perform the audit to obtain reasonable assurance about whether effective internal control over financial reporting was maintained in all material respects. Our audit included obtaining an understanding of internal control over financial reporting, assessing the risk that a material weakness exists, testing and evaluating the design and operating effectiveness of internal control based on the assessed risk, and performing such other procedures as we considered necessary in the circumstances. We believe that our audit provides a reasonable basis for our opinion.
A company’s internal control over financial reporting is a process designed by, or under the supervision of, the company’s principal executive and principal financial officers, or persons performing similar functions, and effected by the company’s board of directors, management, and other personnel to provide reasonable assurance regarding the reliability of financial reporting and the preparation of financial statements for external purposes in accordance with generally accepted accounting principles. A company’s internal control over financial reporting includes those policies and procedures that (1) pertain to the maintenance of records that, in reasonable detail, accurately and fairly reflect the transactions and dispositions of the assets of the company; (2) provide reasonable assurance that transactions are recorded as necessary to permit preparation of financial statements in accordance with generally accepted accounting principles, and that receipts and expenditures of the company are being made only in accordance with authorizations of management and directors of the company; and (3) provide reasonable assurance regarding prevention or timely detection of unauthorized acquisition, use, or disposition of the company’s assets that could have a material effect on the financial statements.
Because of the inherent limitations of internal control over financial reporting, including the possibility of collusion or improper management override of controls, material misstatements due to error or fraud may not be prevented or detected on a timely basis. Also, projections of any evaluation of the effectiveness of the internal control over financial reporting to future periods are subject to the risk that the controls may become inadequate because of changes in conditions, or that the degree of compliance with the policies or procedures may deteriorate.
In our opinion, the Company maintained, in all material respects, effective internal control over financial reporting as of December 31, 2009, based on the criteria established in Internal Control — Integrated Framework issued by the Committee of Sponsoring Organizations of the Treadway Commission.
We have also audited, in accordance with the standards of the Public Company Accounting Oversight Board (United States), the consolidated financial statements as of and for the year ended December 31, 2009 of the Company and our report dated March 16, 2010 expressed an unqualified opinion on those financial statements.
/s/ Deloitte & Touche LLP
Costa Mesa, California
March 16, 2010
48
Table of Contents
| ITEM 9B. | OTHER INFORMATION |
None
PART III
| ITEM 10. | DIRECTORS, EXECUTIVE OFFICERS AND CORPORATE GOVERNANCE |
Information with respect to this item is incorporated by reference from our definitive Proxy Statement.
| ITEM 11. | EXECUTIVE COMPENSATION |
Information with respect to this item is incorporated by reference from our definitive Proxy Statement.
| ITEM 12. | SECURITY OWNERSHIP OF CERTAIN BENEFICIAL OWNERS AND MANAGEMENT AND RELATED STOCKHOLDER MATTERS |
Information with respect to this item is incorporated by reference from our definitive Proxy Statement.
| ITEM 13. | CERTAIN RELATIONSHIPS AND RELATED TRANSACTIONS, AND DIRECTOR INDEPENDENCE |
Information with respect to this item is incorporated by reference from our definitive Proxy Statement.
| ITEM 14. | PRINCIPAL ACCOUNTING FEES AND SERVICES |
Information with respect to this item is incorporated by reference from our definitive Proxy Statement.
PART IV
| ITEM 15. | EXHIBITS, FINANCIAL STATEMENT SCHEDULES |
(a) 1. The financial statements listed in the “Index to Consolidated Financial Statements” at page F-1 are filed as a part of this report.
2. Financial statement schedules are omitted because they are not applicable or the required information is shown in the financial statements or notes thereto.
3. Exhibits included or incorporated herein. See Exhibit Index.
49
Table of Contents
INDEX TO CONSOLIDATED FINANCIAL STATEMENTS
F-1
Table of Contents
REPORT OF INDEPENDENT REGISTERED PUBLIC ACCOUNTING FIRM
Board of Directors and Stockholders
Volcom, Inc.
We have audited the accompanying consolidated balance sheets of Volcom, Inc. and subsidiaries (the “Company”) as of December 31, 2009 and 2008, and the related consolidated statements of operations, stockholders’ equity and comprehensive income, and cash flows for each of the three years in the period ended December 31, 2009. These financial statements are the responsibility of the Company’s management. Our responsibility is to express an opinion on these financial statements based on our audits.
We conducted our audits in accordance with the standards of the Public Company Accounting Oversight Board (United States). Those standards require that we plan and perform the audit to obtain reasonable assurance about whether the financial statements are free of material misstatement. An audit includes examining, on a test basis, evidence supporting the amounts and disclosures in the financial statements. An audit also includes assessing the accounting principles used and significant estimates made by management, as well as evaluating the overall financial statement presentation. We believe that our audits provide a reasonable basis for our opinion.
In our opinion, such consolidated financial statements present fairly, in all material respects, the financial position of Volcom, Inc. and subsidiaries as of December 31, 2009 and 2008, and the results of their operations and their cash flows for each of the three years in the period ended December 31, 2009, in conformity with accounting principles generally accepted in the United States of America.
We have also audited, in accordance with the standards of the Public Company Accounting Oversight Board (United States), the Company’s internal control over financial reporting as of December 31, 2009, based on the criteria established in Internal Control — Integrated Framework issued by the Committee of Sponsoring Organizations of the Treadway Commission and our report dated March 16, 2010 expressed an unqualified opinion on the Company’s internal control over financial reporting.
/s/ Deloitte & Touche LLP
Costa Mesa, California
March 16, 2010
F-2
Table of Contents
CONSOLIDATED BALANCE SHEETS
| As of December 31, | ||||||
| 2009 | 2008 | |||||
| (In thousands, except share and per share data) | ||||||
| Assets |
||||||
| Current assets: |
||||||
| Cash and cash equivalents |
$ | 76,180 | $ | 79,613 | ||
| Short-term investments |
35,000 | — | ||||
| Accounts receivable — net of allowances of $8,626 (2009) and $6,998 (2008) |
53,792 | 60,914 | ||||
| Inventories |
33,250 | 27,086 | ||||
| Prepaid expenses and other current assets |
4,353 | 2,596 | ||||
| Income taxes receivable |
725 | 3,309 | ||||
| Deferred income taxes |
7,700 | 4,947 | ||||
| Total current assets |
211,000 | 178,465 | ||||
| Property and equipment — net |
26,348 | 26,716 | ||||
| Investment in unconsolidated investee |
330 | 330 | ||||
| Deferred income taxes |
3,545 | 4,028 | ||||
| Intangible assets — net |
9,784 | 10,578 | ||||
| Goodwill |
1,291 | 665 | ||||
| Other assets |
735 | 841 | ||||
| Total assets |
$ | 253,033 | $ | 221,623 | ||
| Liabilities and Stockholders’ Equity |
||||||
| Current liabilities: |
||||||
| Accounts payable |
$ | 22,788 | $ | 15,291 | ||
| Accrued expenses and other current liabilities |
9,957 | 11,393 | ||||
| Current portion of capital lease obligations |
50 | 71 | ||||
| Total current liabilities |
32,795 | 26,755 | ||||
| Long-term capital lease obligations |
— | 23 | ||||
| Other long-term liabilities |
1,203 | 1,048 | ||||
| Income taxes payable — non-current |
68 | 94 | ||||
| Commitments and contingencies (Note 10) |
||||||
| Stockholders’ equity: |
||||||
| Common stock, $0.001 par value — 60,000,000 shares authorized; 24,374,362 (2009 and 2008) shares issued and outstanding |
24 | 24 | ||||
| Additional paid-in capital |
92,192 | 90,456 | ||||
| Retained earnings |
123,679 | 101,935 | ||||
| Accumulated other comprehensive income |
3,072 | 1,288 | ||||
| Total stockholders’ equity |
218,967 | 193,703 | ||||
| Total liabilities and stockholders’ equity |
$ | 253,033 | $ | 221,623 | ||
See the accompanying notes to consolidated financial statements.
F-3
Table of Contents
CONSOLIDATED STATEMENTS OF OPERATIONS
| Year Ended December 31, | ||||||||||
| 2009 | 2008 | 2007 | ||||||||
| (In thousands, except share and per share data) | ||||||||||
| Revenues: |
||||||||||
| Product revenues |
$ | 278,598 | $ | 332,110 | $ | 265,193 | ||||
| Licensing revenues |
2,041 | 2,194 | 3,420 | |||||||
| Total revenues |
280,639 | 334,304 | 268,613 | |||||||
| Cost of goods sold |
139,844 | 171,208 | 138,570 | |||||||
| Gross profit |
140,795 | 163,096 | 130,043 | |||||||
| Operating expenses: |
||||||||||
| Selling, general and administrative expenses |
110,847 | 112,464 | 79,411 | |||||||
| Asset impairments |
— | 16,230 | — | |||||||
| Total operating expenses |
110,847 | 128,694 | 79,411 | |||||||
| Operating income |
29,948 | 34,402 | 50,632 | |||||||
| Other income (loss): |
||||||||||
| Interest income, net |
358 | 901 | 3,973 | |||||||
| Foreign currency gain (loss) |
1,534 | (1,807 | ) | 401 | ||||||
| Total other income (loss) |
1,892 | (906 | ) | 4,374 | ||||||
| Income before provision for income taxes |
31,840 | 33,496 | 55,006 | |||||||
| Provision for income taxes |
10,096 | 11,787 | 21,671 | |||||||
| Net income |
$ | 21,744 | $ | 21,709 | $ | 33,335 | ||||
| Net income per share: |
||||||||||
| Basic |
$ | 0.89 | $ | 0.89 | $ | 1.37 | ||||
| Diluted |
$ | 0.89 | $ | 0.89 | $ | 1.37 | ||||
| Weighted-average shares outstanding: |
||||||||||
| Basic |
24,352,146 | 24,337,923 | 24,302,893 | |||||||
| Diluted |
24,363,544 | 24,357,652 | 24,419,802 | |||||||
See the accompanying notes to consolidated financial statements.
F-4
Table of Contents
CONSOLIDATED STATEMENTS OF STOCKHOLDERS’ EQUITY AND COMPREHENSIVE INCOME
| Common Stock | Additional Paid-In Capital |
Retained Earnings |
Accumulated Other Comprehensive Income |
Comprehensive Income |
Total | ||||||||||||||||||||
| Shares | Amount | ||||||||||||||||||||||||
| (In thousands, except share data) | |||||||||||||||||||||||||
| Balance at January 1, 2007 |
24,295,420 | $ | 24 | $ | 86,773 | $ | 47,019 | $ | 181 | $ | 133,997 | ||||||||||||||
| ASC 740 Adjustment (Note 14) |
— | — | — | (128 | ) | — | (128 | ) | |||||||||||||||||
| Stock-based compensation |
— | — | 934 | — | — | 934 | |||||||||||||||||||
| Exercise of stock options |
54,100 | — | 1,028 | — | — | 1,028 | |||||||||||||||||||
| Tax benefits related to stock-based compensation |
— | — | 450 | — | — | 450 | |||||||||||||||||||
| Comprehensive income: |
|||||||||||||||||||||||||
| Net income |
— | — | — | 33,335 | — | $ | 33,335 | 33,335 | |||||||||||||||||
| Foreign currency translation adjustment |
— | — | — | — | 3,239 | 3,239 | 3,239 | ||||||||||||||||||
| Comprehensive income |
$ | 36,574 | |||||||||||||||||||||||
| Balance at December 31, 2007 |
24,349,520 | $ | 24 | $ | 89,185 | $ | 80,226 | $ | 3,420 | $ | 172,855 | ||||||||||||||
| Stock-based compensation |
— | — | 985 | — | — | 985 | |||||||||||||||||||
| Issuance of restricted stock |
10,000 | — | — | — | — | — | |||||||||||||||||||
| Exercise of stock options |
14,842 | — | 273 | — | — | 273 | |||||||||||||||||||
| Tax benefits related to stock-based compensation |
— | — | 13 | — | — | 13 | |||||||||||||||||||
| Comprehensive income: |
|||||||||||||||||||||||||
| Net income |
— | — | — | 21,709 | — | $ | 21,709 | 21,709 | |||||||||||||||||
| Unrealized loss on foreign currency cash flow hedges, net of tax |
(223 | ) | (223 | ) | (223 | ) | |||||||||||||||||||
| Foreign currency translation adjustment |
— | — | — | — | (1,909 | ) | (1,909 | ) | (1,909 | ) | |||||||||||||||
| Comprehensive income |
$ | 19,577 | |||||||||||||||||||||||
| Balance at December 31, 2008 |
24,374,362 | $ | 24 | $ | 90,456 | $ | 101,935 | $ | 1,288 | $ | 193,703 | ||||||||||||||
| Stock-based compensation |
— | — | 1,795 | — | — | 1,795 | |||||||||||||||||||
| Tax benefits (detriment) related to stock-based compensation |
— | — | (59 | ) | — | — | (59 | ) | |||||||||||||||||
| Comprehensive income: |
|||||||||||||||||||||||||
| Net income |
— | — | — | 21,744 | — | $ | 21,744 | 21,744 | |||||||||||||||||
| Unrealized gain on foreign currency cash flow hedges, net of tax |
254 | 254 | 254 | ||||||||||||||||||||||
| Foreign currency translation adjustment |
— | — | — | — | 1,530 | 1,530 | 1,530 | ||||||||||||||||||
| Comprehensive income |
$ | 23,528 | |||||||||||||||||||||||
| Balance at December 31, 2009 |
24,374,362 | $ | 24 | $ | 92,192 | $ | 123,679 | $ | 3,072 | $ | 218,967 | ||||||||||||||
See the accompanying notes to consolidated financial statements.
F-5
Table of Contents
CONSOLIDATED STATEMENTS OF CASH FLOWS
| Year Ended December 31, | ||||||||||||
| 2009 | 2008 | 2007 | ||||||||||
| (In thousands) | ||||||||||||
| Cash flows from operating activities: |
||||||||||||
| Net income |
$ | 21,744 | $ | 21,709 | $ | 33,335 | ||||||
| Adjustments to reconcile net income to net cash provided by operating activities: |
||||||||||||
| Depreciation and amortization |
6,360 | 7,315 | 2,895 | |||||||||
| Provision for doubtful accounts |
2,490 | 2,332 | 831 | |||||||||
| Loss on disposal of property and equipment |
77 | 1 | 24 | |||||||||
| Asset impairments |
134 | 16,230 | 161 | |||||||||
| Excess tax benefits related to exercise of stock options |
— | (34 | ) | (444 | ) | |||||||
| Stock-based compensation |
1,795 | 985 | 934 | |||||||||
| Deferred income taxes |
(2,277 | ) | (6,349 | ) | (191 | ) | ||||||
| Changes in operating assets and liabilities: |
||||||||||||
| Accounts receivable |
5,241 | (3,114 | ) | (23,736 | ) | |||||||
| Inventories |
(5,838 | ) | (1,844 | ) | (6,789 | ) | ||||||
| Prepaid expenses and other current assets |
(1,759 | ) | (499 | ) | (311 | ) | ||||||
| Income taxes receivable/payable |
2,485 | (3,021 | ) | (339 | ) | |||||||
| Other assets |
103 | (306 | ) | (242 | ) | |||||||
| Accounts payable |
7,126 | (8,096 | ) | 9,396 | ||||||||
| Accrued expenses |
(1,623 | ) | (1,059 | ) | 3,791 | |||||||
| Other long-term liabilities |
151 | 422 | (36 | ) | ||||||||
| Net cash provided by operating activities |
36,209 | 24,672 | 19,279 | |||||||||
| Cash flows from investing activities: |
||||||||||||
| Purchase of property and equipment |
(4,798 | ) | (5,915 | ) | (14,989 | ) | ||||||
| Business acquisitions, net of cash acquired |
(890 | ) | (32,138 | ) | — | |||||||
| Purchase of intangible assets |
— | (589 | ) | — | ||||||||
| Purchase of short-term investments |
(74,932 | ) | (278 | ) | — | |||||||
| Sale of short-term investments |
39,932 | 278 | — | |||||||||
| Purchase of additional shares in cost method investee |
— | (32 | ) | — | ||||||||
| Proceeds from sale of property and equipment |
18 | 15 | 16 | |||||||||
| Net cash used in investing activities |
(40,670 | ) | (38,659 | ) | (14,973 | ) | ||||||
| Cash flows from financing activities: |
||||||||||||
| Principal payments on capital lease obligations |
(83 | ) | (127 | ) | (78 | ) | ||||||
| Proceeds from government grants |
— | 455 | 229 | |||||||||
| Proceeds from the exercise of stock options |
— | 273 | 1,028 | |||||||||
| Excess tax benefits related to exercise of stock options |
— | 34 | 444 | |||||||||
| Net cash (used in) provided by financing activities |
(83 | ) | 635 | 1,623 | ||||||||
| Effect of exchange rate changes on cash |
1,111 | 3 | 1,619 | |||||||||
| Net (decrease) increase in cash and cash equivalents |
(3,433 | ) | (13,349 | ) | 7,548 | |||||||
| Cash and cash equivalents — Beginning of period |
79,613 | 92,962 | 85,414 | |||||||||
| Cash and cash equivalents — End of period |
$ | 76,180 | $ | 79,613 | $ | 92,962 | ||||||
| Supplemental disclosures of cash flow information: |
||||||||||||
| Cash paid during the period for: |
||||||||||||
| Interest |
$ | 4 | $ | 110 | $ | 35 | ||||||
| Income taxes |
10,380 | 20,804 | 22,799 | |||||||||
See the accompanying notes to consolidated financial statements.
F-6
Table of Contents
Supplemental disclosures of noncash investing and financing activities:
At December 31, 2009 and 2008, the Company accrued for $112,000 and $63,000 of property and equipment purchases, respectively.
Upon adoption of the guidance included in ASC 740 on January 1, 2007, the Company recorded a $128,000 increase to income taxes payable and a reduction to retained earnings.
During the year ended December 31, 2009, the Company acquired property pursuant to a capital lease obligation in the amount of $29,000.
F-7
Table of Contents
NOTES TO CONSOLIDATED FINANCIAL STATEMENTS
1. Organization and Summary of Significant Accounting Policies
Volcom, Inc. and subsidiaries (the “Company” or “Volcom”) is a designer, marketer and distributor of young mens and womens clothing, footwear, accessories and related products under the Volcom brand name. The Company initially incorporated in the state of California in 1991 as Stone Boardwear, Inc. and has been doing business as Volcom since June 1991. The Company was reincorporated in Delaware in April 2005 and changed its name to Volcom, Inc. The Company is based in Costa Mesa, California. In 2008, the Company acquired all of the outstanding membership interests of Electric Visual Evolution LLC (“Electric”). Known for its Volt logo, Electric is a core action sports lifestyle brand. Electric was founded in 2000 and is headquartered in Orange County, California.
Principles of Consolidation — The accompanying consolidated financial statements include the accounts of Volcom, Inc. and its wholly owned subsidiaries. All intercompany accounts and transactions have been eliminated.
Basis of Presentation — The accompanying consolidated financial statements have been prepared in accordance with accounting principles generally accepted in the United States of America.
Correction — The Company has corrected the classification of the long-term portion of deferred rent in its 2008 consolidated balance sheet. This correction resulted in a reclassification of $634,000 out of accrued expenses and other current liabilities into other long-term liabilities. This reclassification has been appropriately reflected in the Consolidated Statement of Cash Flows for the year ended December 31, 2008.
Cash and Cash Equivalents — The Company considers all highly liquid investments with a maturity at date of purchase of three months or less to be cash equivalents.
Concentration of Credit Risks — The Company is subject to significant concentrations of credit risk, primarily from its cash and cash equivalents, short-term investments and accounts receivable. The Company invests its cash and cash equivalents and short-term investments with financial institutions with high credit standing. At December 31, 2009 and 2008, the majority of the Company’s cash and cash equivalents and short-term investments were held at financial institutions in the United States that are insured by the Federal Deposit Insurance Corporation up to $250,000. Uninsured balances aggregate approximately $59.6 million (including foreign accounts) as of December 31, 2009.
The Company performs ongoing credit evaluations of its customers and adjusts credit limits based upon payment history and the customer’s current creditworthiness. The Company maintains an allowance for estimated losses resulting from the failure of its customers to make required payments. An estimate of uncollectible amounts is made by management based upon historical bad debts, current customer receivable balances, age of customer receivable balances, the customer’s financial condition and current economic trends, all of which are subject to change. Actual uncollected amounts have been consistent with the Company’s expectations. Allowances for doubtful accounts are reported as a component of selling, general and administrative expenses. At December 31, 2009, no single customer represented over 10% of the Company’s outstanding accounts receivable balance. At December 31, 2008, approximately 13% of the Company’s outstanding accounts receivable balance was from one customer.
Inventories — Inventories are stated at the lower of cost (first-in, first-out) or market. The Company regularly reviews inventory quantities on hand and adjusts inventory values for excess and obsolete inventory based primarily on estimated forecasts of product demand and net realizable value.
F-8
Table of Contents
VOLCOM, INC. AND SUBSIDIARIES
NOTES TO CONSOLIDATED FINANCIAL STATEMENTS—(Continued)
Property and Equipment — The Company’s property and equipment are stated at cost and depreciated on a straight-line basis over their estimated useful lives, which generally range from three to 30 years. Leasehold improvements are depreciated over the shorter of the estimated useful life of the asset or the lease term. Maintenance and repairs on the Company’s property and equipment are charged to operations when incurred. Depreciable lives by fixed asset category are as follows:
| Furniture and fixtures |
3 to 5 years | |
| Office equipment |
3 to 5 years | |
| Computer equipment |
3 years | |
| Leasehold improvements |
3 to 10 years | |
| Buildings |
15 to 30 years |
Investment in Unconsolidated Investee — The Company accounts for its investments in unconsolidated investees using the cost method if the Company does not have the ability to exercise significant influence over the operating and financial policies of the investee. The Company assesses such investments for impairment when there are events or changes in circumstances that may have a significant adverse effect on the fair value of the investment. If, and when, an event or change in circumstances that may have a significant adverse effect on the fair value of the investment is identified, the Company estimates the fair value of the investment and, if the reduction in value is determined to be other than temporary, records an impairment loss on the investment.
Long-Lived Assets — The Company assesses its long-lived assets for potential impairment whenever events or changes in circumstances indicate that the asset’s carrying value may not be recoverable. The carrying amount of a long-lived asset (asset group) is not recoverable if it exceeds the sum of the undiscounted cash flows expected to result from the use and eventual disposition of the asset (asset group). Once the carrying amount of a long-lived asset (asset group) is deemed to no longer be recoverable, an impairment loss would be recognized equal to the difference between the current carrying amount and the fair value of the long-lived asset (asset group). In 2009 and 2008, the Company determined that there were impairment losses associated with its amortizing intangible assets related to the 2008 acquisitions of Electric and Laguna Surf & Sport. See Note 7 to the Consolidated Financial Statements for further discussion.
Goodwill and Intangible Assets — The Company accounts for goodwill and intangible assets in accordance with Accounting Standards Codification (“ASC”) 350. Goodwill and intangible assets with indefinite lives are not amortized but are tested for impairment annually and also in the event of an impairment indicator. The Company evaluates the recoverability of goodwill based on a two-step impairment test. The first step compares the fair value of each reporting unit with its carrying amount, including goodwill. If the carrying amount exceeds the fair value, then the second step of the impairment test is performed to measure the amount of any impairment loss. Fair value is determined based on estimated future cash flows, discounted at a rate that approximates the Company’s cost of capital. Such estimates are subject to change and the Company may be required to recognize an impairment loss in the future. Impairment losses are reflected in operating income. In 2009, the Company recorded an impairment loss associated with the non-amortizing intangible assets related to Volcom Europe. In 2008, the Company determined that there was an impairment loss associated with the goodwill and non-amortizing intangible assets related to the 2008 acquisitions of Electric and Laguna Surf & Sport. In 2007, the Company determined that there was an impairment loss associated with the goodwill related to its subsidiary, Welcom Distribution SARL. See Note 7 to the Consolidated Financial Statements for further discussion.
Fair Value of Financial Instruments — ASC 825 requires management to disclose the estimated fair value of certain assets and liabilities defined by ASC 825 as financial instruments. At December 31, 2009, the Company believes that the carrying amount of cash and cash equivalents, accounts receivable and accounts payable approximate fair value because of the short maturity of these financial instruments.
F-9
Table of Contents
VOLCOM, INC. AND SUBSIDIARIES
NOTES TO CONSOLIDATED FINANCIAL STATEMENTS—(Continued)
Revenue Recognition — Product revenues are recognized upon shipment, at which time transfer of title occurs, risk of ownership passes to the customer and collectability is reasonably assured. Taxes collected from the Company’s customers are recorded on a net basis. Allowances for estimated returns are provided when product revenues are recorded based on historical experience, current economic trends, changes in customer demands and sell-through of products, and are reported as reductions in product revenues.
Licensing revenues are recorded when earned based on a stated percentage of the licensees’ sales of Company branded products.
Shipping and Handling — Amounts billed to customers for shipping and handling are recorded as revenues. Freight costs associated with shipping goods to customers are included in cost of sales. Handling costs of $5.7 million, $6.8 million and $4.7 million are included in selling, general and administrative expenses for the years ended December 31, 2009, 2008 and 2007, respectively.
Significant Concentrations — During the years ended December 31, 2009, 2008 and 2007, sales to a single customer totaled approximately 11%, 16% and 18%, respectively, of product revenues. No other single customer represented over 10% of product revenues.
During each of the years ended December 31, 2009, 2008 and 2007, the Company made purchases from two suppliers that totaled more than 10% of total product costs. For the years ended December 31, 2009, 2008 and 2007, purchases from those two suppliers were approximately 33%, 32% and 33% of total product costs, respectively.
Advertising and Promotion — The Company’s promotion and advertising programs include athlete sponsorships, Volcom branded events, print advertisements, music, films and online marketing. Costs of advertising, promotion and point-of-sale materials are expensed as incurred and included in selling, general and administrative expenses. For the years ended December 31, 2009, 2008 and 2007, these expenses totaled $21.9 million, $21.7 million and $14.5 million, respectively. As of December 31, 2009, 2008 and 2007, the Company had no deferred advertising costs.
Income Taxes —The Company records a provision and liability for federal, state and foreign income taxes using an annual effective tax rate. Deferred income taxes are recorded at the Company’s effective tax rate. Management’s judgment is required in assessing the realizability of its deferred tax assets. The Company considers future taxable income and ongoing prudent and feasible tax planning strategies in assessing the value of the Company’s deferred tax assets. If the Company determines that it is more likely than not that these assets will not be realized, the Company would reduce the value of these assets to their expected realizable value, thereby decreasing net income. Evaluating the value of these assets is necessarily based on the Company’s judgment. If the Company subsequently determined that the deferred tax assets that had been written down would, in our judgment, be realized in the future, the value of the deferred tax assets would be increased, thereby increasing net income in the period when that determination was made. As of December 31, 2009 and 2008, the Company recorded a valuation allowance of approximately $324,000 and $178,000, respectively, against deferred tax assets that the Company believes are not more likely than not to be realized.
The guidance included in ASC 740 prescribes a recognition threshold and measurement attribute for the financial statement recognition and measurement of a tax position taken or expected to be taken in a tax return. The Company must recognize the tax benefit from an uncertain tax position only if it is more likely than not that the tax position will be sustained on examination by the taxing authorities, based on the technical merits of the position. The tax benefits recognized in the financial statements from such a position are measured based on the
F-10
Table of Contents
VOLCOM, INC. AND SUBSIDIARIES
NOTES TO CONSOLIDATED FINANCIAL STATEMENTS—(Continued)
largest benefit that has a greater than fifty percent likelihood of being realized upon ultimate resolution. As a result of the implementation of the guidance included in ASC 740, the Company recognized a $128,000 increase in the liability for unrecognized tax benefits, which was accounted for as a reduction to the January 1, 2007 balance of retained earnings. See Note 14 for further discussion.
Foreign Currency and Derivatives — The Company owns subsidiaries that operate with the local currency as their functional currency. The Company’s international subsidiaries generate revenues and collect receivables at future dates in the customers’ local currencies, and purchase inventory primarily in U.S. dollars. Accordingly, the Company is exposed to gains and losses that result from the effect of changes in foreign currency exchange rates on foreign currency denominated transactions. The Company’s assets and liabilities that are denominated in foreign currencies are translated at the rate of exchange on the balance sheet date. Revenues and expenses are translated using the average exchange rate for the period. Gains and losses from translation of foreign subsidiary financial statements are included in accumulated other comprehensive income (“OCI”).
On the date the Company enters into a derivative contract, management designates the derivative as a hedge of the identified exposure. The Company formally documents all relationships between hedging instruments and hedged items, as well as the risk management objective and strategy for entering into various hedge transactions. In this documentation, the Company identifies the asset, liability, firm commitment, or forecasted transaction that has been designated as a hedged item and indicates how the hedging instrument is expected to hedge the risks related to the hedged item. The Company formally measures effectiveness of its hedging relationships both at the hedge inception and on an ongoing basis in accordance with its risk management policy. The Company would discontinue hedge accounting prospectively (i) if management determines that the derivative is no longer effective in offsetting changes in the cash flows of a hedged item, (ii) when the derivative expires or is sold, terminated, or exercised, (iii) if it becomes probable that the forecasted transaction being hedged by the derivative will not occur, (iv) because a hedged firm commitment no longer meets the definition of a firm commitment, or (v) if management determines that designation of the derivative as a hedge instrument is no longer appropriate.
Derivative financial instruments are recognized as either assets or liabilities in the balance sheet and are measured at fair value. The accounting for changes in the fair value of a derivative depends on the use and type of the derivative. The Company’s derivative financial instruments consist of foreign currency exchange contracts that the Company uses to manage its exposure to the risk of foreign currency exchange rates. The Company’s objectives are to reduce the volatility of earnings and cash flows associated with changes in foreign currency exchange rates. The Company does not enter into derivative financial instruments for speculative or trading purposes.
A portion of the Company’s domestic sales are made in Canadian dollars. In addition, the Company’s Electric subsidiary purchases sunglass inventory in Euros. As a result, the Company is exposed to transaction gains and losses that result from movements in foreign currency exchange rates. Changes in the Company’s assets and liabilities that are denominated in these foreign currencies are translated into U.S. dollars at the rate of exchange on the balance sheet date, and are reflected in the Company’s consolidated statements of operations.
Comprehensive Income — Comprehensive income represents the results of operations adjusted to reflect all items recognized under accounting standards as components of comprehensive earnings.
F-11
Table of Contents
VOLCOM, INC. AND SUBSIDIARIES
NOTES TO CONSOLIDATED FINANCIAL STATEMENTS—(Continued)
The components of comprehensive income for the Company include net income, unrealized gains or losses on foreign currency cash flow hedges and foreign currency adjustments that arise from the translation of the Company’s international subsidiaries financial statements into U.S. dollars. The components of accumulated other comprehensive income, net of tax, are as follows:
| As of December 31, | |||||||
| 2009 | 2008 | ||||||
| (In thousands) | |||||||
| Unrealized gain (loss) on foreign currency cash flow hedges, net of tax |
$ | 31 | $ | (223 | ) | ||
| Foreign currency translation adjustment |
3,041 | 1,511 | |||||
| $ | 3,072 | $ | 1,288 | ||||
Net Income Per Share — The Company calculates net income per share in accordance with ASC 260. Basic net income per common share is calculated by dividing net income by the weighted-average number of common shares outstanding during the reporting period. Diluted net income per common share reflects the effects of potentially dilutive securities, which consists solely of restricted stock and stock options using the treasury stock method. A reconciliation of the numerator and denominator used in the calculation of basic and diluted net income per share is as follows:
| Year Ended December 31, | |||||||||
| 2009 | 2008 | 2007 | |||||||
| (In thousands, except share data) | |||||||||
| Numerator — Net income applicable to common stockholders |
$ | 21,744 | $ | 21,709 | $ | 33,335 | |||
| Denominator: |
|||||||||
| Weighted-average common stock outstanding for basic earnings per share |
24,352,146 | 24,337,923 | 24,302,893 | ||||||
| Effect of dilutive securities: |
|||||||||
| Stock options and restricted stock |
11,398 | 19,729 | 116,909 | ||||||
| Adjusted weighted-average common stock and assumed conversions for diluted earnings per share |
24,363,544 | 24,357,652 | 24,419,802 | ||||||
For the years ended December 31, 2009, 2008 and 2007, stock options of 1,103,158, 437,558 and 10,000, respectively, were excluded from the weighted-average number of shares outstanding because their effect would be antidilutive.
Stock-Based Compensation — The Company accounts for stock-based compensation under the fair value recognition provisions of ASC 718. The Company accounts for all stock-based compensation using a fair-value method and recognizes the fair value of each award as an expense over the service period. See Note 11 to the Consolidated Financial Statements for further discussion.
Use of Estimates in the Preparation of the Financial Statements — The preparation of financial statements in conformity with accounting principles generally accepted in the United States of America requires management to make estimates and assumptions that affect the reported amounts of assets and liabilities and disclosure of contingent assets and liabilities at the date of the financial statements and the reported amount of revenues and expenses during the reporting period. Actual results could differ from those estimates.
F-12
Table of Contents
VOLCOM, INC. AND SUBSIDIARIES
NOTES TO CONSOLIDATED FINANCIAL STATEMENTS—(Continued)
Recent Accounting Pronouncements — In October 2009, the Financial Accounting Standards Board (“FASB”) issued ASU No. 2009-13, which amends the guidance in ASC 605. ASU 2009-13 eliminates the residual method of accounting for revenue on undelivered products and instead, requires companies to allocate revenue to each of the deliverable products based on their relative selling price. In addition, this ASU expands the disclosure requirements surrounding multiple-deliverable arrangements. ASU 2009-13 will be effective for revenue arrangements entered into for fiscal years beginning on or after June 15, 2010. The Company is currently evaluating the impact ASU 2009-13 will have on its consolidated financial position and results of operations.
In January 2010, the FASB issued ASU 2010-06, which amends ASC 820 to add new requirements for disclosures about transfers into and out of Levels 1 and 2 and separate disclosures about purchases, sales, issuances, and settlements relating to Level 3 measurements. The ASU also clarifies existing fair value disclosures about the level of disaggregation and about inputs and valuation techniques used to measure fair value. The ASU is effective for the first reporting period (including interim periods) beginning after December 15, 2009, except for the requirement to provide the Level 3 activity of purchases, sales, issuances, and settlements on a gross basis, which will be effective for fiscal years beginning after December 15, 2010, and for interim periods within those fiscal years. The Company is currently evaluating the impact ASU 2010-06 will have on its consolidated financial position or results of operations.
2. Acquisitions
Effective January 17, 2008, the Company acquired all of the outstanding membership interests of Electric, a core action sports lifestyle brand with growing product lines including sunglasses, goggles, t-shirts, bags, hats, belts and other accessories. The operations of Electric have been included in the Company’s results since January 17, 2008. The purchase price of approximately $26.3 million, excluding transaction costs, consisted of cash consideration of $25.3 million and a working capital adjustment of $1.0 million in cash, and is subject to certain indemnities. Transaction costs totaled $1.2 million. The sellers also will be eligible to earn up to an additional $12.0 million in cash upon achieving certain financial milestones through December 31, 2010. Electric operates as a wholly-owned subsidiary of the Company. Goodwill arises from the synergies the Company believes can be achieved by the integration of certain aspects of Electric’s production of softgoods and accessories. No goodwill associated with this acquisition is deductible for tax purposes. Amortizing intangible assets consist of customer relationships, non-compete agreements, backlog and athlete contracts with estimated useful lives of 20 years, 4 years, 3 months and 15 months, respectively. These intangible assets are amortized in a manner that reflects the pattern in which the economic benefits of the intangible assets are consumed.
The assets and liabilities of Electric were recorded at estimated fair value as of the date of acquisition under the purchase method of accounting. The following table summarizes the allocation of the purchase price to the fair values of the assets acquired and the liabilities assumed at the date of acquisition:
| (In thousands) | ||||
| Current assets |
$ | 10,277 | ||
| Property and equipment |
1,110 | |||
| Other assets |
19 | |||
| Amortizing intangible assets |
13,310 | |||
| Non-amortizing trademarks |
10,500 | |||
| Goodwill |
935 | |||
| Total assets acquired |
36,151 | |||
| Liabilities assumed |
(8,680 | ) | ||
| Net assets acquired |
$ | 27,471 | ||
F-13
Table of Contents
VOLCOM, INC. AND SUBSIDIARIES
NOTES TO CONSOLIDATED FINANCIAL STATEMENTS—(Continued)
In 2009, the Company recorded an $18,000 impairment charge on the intangible assets of Electric. In 2008, the Company recorded a $14.8 million impairment charge on the goodwill and intangible assets of Electric. See Note 7 to the Consolidated Financial Statements for further discussion.
Effective August 1, 2008, the Company acquired certain assets and liabilities of Laguna Surf & Sport. The assets and liabilities were recorded at estimated fair value as of the date of acquisition under the purchase method of accounting. Total net tangible assets acquired were $342,000 with $305,000 of the remaining purchase price allocated to amortizing intangible assets including trademarks and favorable leases, and $1.4 million allocated to goodwill. The operations of the retail chain have been included in the Company’s results since August 1, 2008. The effects of this acquisition are not considered material. Accordingly, pro forma information reflecting this acquisition has been omitted. In 2009, the Company recorded a $3,000 impairment charge on the intangible assets of Laguna Surf & Sport. In 2008, the Company recorded a $1.4 million impairment charge on the goodwill related to this acquisition. See Note 7 to the Consolidated Financial Statements for further discussion.
Effective November 1, 2008, the Company acquired certain assets of its distributor of Volcom branded products in Japan for $3.6 million, excluding transaction costs. Transaction costs totaled $240,000. The acquired assets were recorded at estimated fair value as of the date of acquisition under the purchase method of accounting. Total net tangible assets acquired were $1.5 million with $1.7 million of the remaining purchase price allocated to amortizing intangible assets including customer relationships, backlog and non-compete agreements, and $611,000 allocated to goodwill. The operations of this entity have been included in the Company’s results since November 1, 2008. The effects of this acquisition are not considered material. Accordingly, pro forma information reflecting this acquisition has been omitted.
Effective September 2008, the Company entered into an agreement for the transition and sale of certain assets of its UK distributor, whereby the Company took direct control of the UK territory beginning with the delivery of the Spring 2009 product line, which began shipping in January 2009. The acquisition closed in March 2009 and the total purchase price was $826,000. The acquired assets were recorded at estimated fair value as of the date of acquisition under the purchase method of accounting. There were no significant tangible assets acquired and $256,000 of the purchase price was allocated to an amortizing intangible asset called customer relationships, with the remaining $570,000 allocated to goodwill. The effects of this acquisition are not considered material. Accordingly, pro forma information reflecting this acquisition has been omitted.
3. Allowances for Doubtful Accounts and Product Returns
| Allowance for Doubtful Accounts |
Allowance for Product Returns |
Total | |||||||||
| (In thousands) | |||||||||||
| Balance, January 1, 2007 |
$ | 495 | $ | 828 | $ | 1,323 | |||||
| Provision |
831 | 5,903 | |||||||||
| Deductions |
(67 | ) | (5,207 | ) | |||||||
| Balance, December 31, 2007 |
1,259 | 1,524 | 2,783 | ||||||||
| Provision |
2,332 | 12,642 | |||||||||
| Deductions |
(135 | ) | (10,624 | ) | |||||||
| Balance, December 31, 2008 |
3,456 | 3,542 | 6,998 | ||||||||
| Provision |
2,490 | 11,146 | |||||||||
| Deductions |
(1,218 | ) | (10,790 | ) | |||||||
| Balance, December 31, 2009 |
$ | 4,728 | $ | 3,898 | $ | 8,626 | |||||
F-14
Table of Contents
VOLCOM, INC. AND SUBSIDIARIES
NOTES TO CONSOLIDATED FINANCIAL STATEMENTS—(Continued)
The provision for doubtful accounts represents charges to selling, general and administrative expenses for estimated bad debts, whereas the provision for product returns is reported as a direct reduction of revenues. As the economic conditions in the global economy have deteriorated during the past two years, the Company has experienced an increase in its provisions required for doubtful accounts and product returns over previous historical levels.
4. Inventories
Inventories are as follows:
| As of December 31, | ||||||
| 2009 | 2008 | |||||
| (In thousands) | ||||||
| Finished goods |
$ | 31,348 | $ | 25,277 | ||
| Work-in-process |
297 | 269 | ||||
| Raw materials |
1,605 | 1,540 | ||||
| $ | 33,250 | $ | 27,086 | |||
5. Property and Equipment
Property and equipment are as follows:
| As of December 31, | ||||||||
| 2009 | 2008 | |||||||
| (In thousands) | ||||||||
| Furniture and fixtures |
$ | 8,750 | $ | 6,714 | ||||
| Office equipment |
2,392 | 2,666 | ||||||
| Computer equipment |
7,130 | 6,405 | ||||||
| Leasehold improvements |
11,112 | 9,608 | ||||||
| Buildings |
7,614 | 7,215 | ||||||
| Land |
4,723 | 4,723 | ||||||
| Construction in progress |
308 | 225 | ||||||
| 42,029 | 37,556 | |||||||
| Less accumulated depreciation |
(15,681 | ) | (10,840 | ) | ||||
| Property and equipment — net |
$ | 26,348 | $ | 26,716 | ||||
Depreciation and amortization expense related to property and equipment was approximately $5.4 million, $5.1 million and $2.8 million for the years ended December 31, 2009, 2008 and 2007, respectively.
6. Investment in Unconsolidated Investee
Since 1998, the Company has held an ownership interest in the common stock of Volcom Australia, a licensee of the Company’s products located in Australia. In February 2008, the Company purchased an additional 0.4% ownership in Volcom Australia for $32,000, which brought the Company’s total ownership interest to 13.9%. The investment is accounted for under the cost method, as the Company does not have the ability to exercise significant influence over the financial and operating policies of the investee. At December 31, 2009 and 2008, the Company’s investment in Volcom Australia was $330,000.
F-15
Table of Contents
VOLCOM, INC. AND SUBSIDIARIES
NOTES TO CONSOLIDATED FINANCIAL STATEMENTS—(Continued)
7. Goodwill and Intangible Assets
The changes in the carrying amount of goodwill are as follows:
| United States | Europe | Electric | Consolidated | |||||||||||||
| Balance as of January 1, 2008: |
||||||||||||||||
| Goodwill, gross |
$ | — | $ | 158 | $ | — | $ | 158 | ||||||||
| Accumulated impairment losses |
— | (158 | ) | — | (158 | ) | ||||||||||
| Goodwill, net |
— | — | — | — | ||||||||||||
| Acquisitions |
1,985 | — | 935 | 2,920 | ||||||||||||
| Impairment losses |
(1,373 | ) | — | (935 | ) | (2,308 | ) | |||||||||
| Disposals and other, net(1) |
53 | — | — | 53 | ||||||||||||
| Balance as of December 31, 2008: |
||||||||||||||||
| Goodwill, gross |
2,038 | 158 | 935 | 3,131 | ||||||||||||
| Accumulated impairment losses |
(1,373 | ) | (158 | ) | (935 | ) | (2,466 | ) | ||||||||
| Goodwill, net |
665 | — | — | 665 | ||||||||||||
| Acquisitions |
570 | — | — | 570 | ||||||||||||
| Impairment losses |
— | — | — | — | ||||||||||||
| Disposals and other, net(1) |
56 | — | — | 56 | ||||||||||||
| Balance as of December 31, 2009: |
||||||||||||||||
| Goodwill, gross |
2,664 | 158 | 935 | 3,757 | ||||||||||||
| Accumulated impairment losses |
(1,373 | ) | (158 | ) | (935 | ) | (2,466 | ) | ||||||||
| Goodwill, net |
$ | 1,291 | $ | — | $ | — | $ | 1,291 | ||||||||
| (1) | Disposals and other, net primarily reflects the impact of foreign currency translation on existing balances. |
A summary of intangible assets is as follows:
| As of December 31, 2009 | As of December 31, 2008 | |||||||||||
| Gross Carrying Amount |
Accumulated Amortization |
Gross Carrying Amount |
Accumulated Amortization | |||||||||
| (In thousands) | ||||||||||||
| Amortizing intangible assets |
$ | 6,422 | $ | 3,396 | $ | 6,363 | $ | 2,649 | ||||
| Non-amortizing trademarks |
6,300 | — | 6,300 | — | ||||||||
| Other non-amortizing intangible assets |
458 | — | 564 | — | ||||||||
| $ | 13,180 | $ | 3,396 | $ | 13,227 | $ | 2,649 | |||||
At December 31, 2009, the Company recorded a $112,000 impairment charge associated with land-use rights, a non-amortizing intangible asset, for a Company owned retail store in Europe. At December 31, 2008, as part of the Company’s annual impairment test in accordance with ASC 350, it was determined that the goodwill and non-amortizing intangible assets associated with the 2008 acquisitions of Electric and Laguna Surf & Sport were impaired, as the carrying amount of the reporting units, including goodwill, exceeded the fair value of the reporting units. The fair value of assets was estimated using a combination of a discounted cash flow and market approach. The value implied by the test was affected by (1) reduced future cash flows expected for the Electric segment, (2) the discount rates which were applied to future cash flows, and (3) current market estimates of value. The discount rates applied and current estimates of market values were affected by the existing macro-
F-16
Table of Contents
VOLCOM, INC. AND SUBSIDIARIES
NOTES TO CONSOLIDATED FINANCIAL STATEMENTS—(Continued)
economic conditions, contributing to the estimated decline in value. Total impairment charges of $6.5 million were incurred for the year ended December 31, 2008 related to goodwill and non-amortizing intangible assets. At December 31, 2007, it was determined that the goodwill associated with Welcom Distribution SARL was impaired and the Company recorded a $161,000 impairment charge.
For the years ended December 31, 2009 and 2008, certain amortizing intangible assets associated with Electric and Laguna Surf & Sport were determined to be impaired in accordance with ASC 360. The Company recorded impairment charges of $21,000 and $9.7 million for the years ended December 31, 2009 and 2008, respectively.
Amortizing intangible assets include customer relationships, trademarks, non-compete agreements, backlog, leasehold rights, athlete contracts and reacquired license rights. Other non-amortizing intangible assets consist of trademarks and land use rights. Amortizable intangible assets are amortized by the Company using estimated useful lives of 3 months to 20 years with no residual values. Fluctuations in the gross carrying amounts of intangible assets associated with the Company’s international subsidiaries are due to the effect of changes in foreign currency exchange rates. Intangible amortization expense for the years ended December 31, 2009, 2008 and 2007, was approximately $929,000, $2.3 million and $47,000, respectively. The Company’s annual amortization expense is estimated to be approximately $538,000, $442,000, $390,000, $340,000 and $285,000 in the fiscal years ending December 31, 2010, 2011, 2012, 2013 and 2014, respectively.
8. Accrued Expenses and Other Current Liabilities
Accrued expenses and other current liabilities consist of the following:
| As of December 31, | ||||||
| 2009 | 2008 | |||||
| (In thousands) | ||||||
| Payroll and related accruals |
$ | 4,708 | $ | 5,045 | ||
| Other |
5,249 | 6,348 | ||||
| $ | 9,957 | $ | 11,393 | |||
9. Line of Credit
In September 2008, the Company amended its unsecured credit agreement with a bank, to increase its line of credit from $20.0 million to $40.0 million (which includes a line of credit, foreign exchange facility and letter of credit sub-facilities). The amended credit agreement, which expires on August 31, 2010, may be used to fund the Company’s working capital requirements. Borrowings under this agreement bear interest, at the Company’s option, either at the bank’s prime rate (3.25% at December 31, 2009) or LIBOR plus 1.25%. Under this credit facility, the Company had $1.9 million outstanding in letters of credit at December 31, 2009. At December 31, 2009 there were no outstanding borrowings under this credit facility, and $38.1 million was available under the credit facility. The credit agreement requires compliance with conditions precedent that must be satisfied prior to any borrowing, as well as ongoing compliance with specified affirmative and negative covenants, including covenants related to the Company’s financial condition, including requirements that the Company maintain a minimum net profit after tax and a minimum earnings before interest, taxes, depreciation and amortization (“EBITDA”). At December 31, 2009, the Company was in compliance with all restrictive covenants.
F-17
Table of Contents
VOLCOM, INC. AND SUBSIDIARIES
NOTES TO CONSOLIDATED FINANCIAL STATEMENTS—(Continued)
10. Commitments and Contingencies
Operating Leases — The Company leases certain office, warehouse and retail facilities under long-term operating lease agreements. Total rent expense for the years ended December 31, 2009, 2008 and 2007, was $6.8 million, $4.6 million and $2.4 million, respectively.
The following is a schedule of future minimum lease payments required under such leases as of December 31, 2009 (in thousands):
| Year Ending December 31, |
|||
| 2010 |
$ | 5,353 | |
| 2011 |
4,843 | ||
| 2012 |
4,535 | ||
| 2013 |
3,408 | ||
| 2014 |
3,423 | ||
| Thereafter |
9,832 | ||
| $ | 31,394 | ||
Capital Leases — The Company has leased computer and office equipment pursuant to capital lease obligations. These leases bear interest at rates ranging from 2.9% to 10.7% per year, and expire at various dates through October 2010. The gross amount of capital lease assets was $137,000 and $483,000 at December 31, 2009 and 2008, respectively, and accumulated amortization was $85,000 and $452,000 at December 31, 2009 and 2008, respectively. Future commitments under capital lease obligations at December 31, 2009 are as follows (in thousands):
| Total payments including interest during the year ending December 31, 2010 |
$ | 56 | ||
| Less interest portion |
(6 | ) | ||
| Total principal payments (current portion of capital lease obligation) remaining at December 31, 2010 |
$ | 50 | ||
Professional Athlete Sponsorships — The Company establishes relationships with professional athletes in order to promote its products and brands. The Company has entered into endorsement agreements with professional athletes in skateboarding, snowboarding, surfing and motocross. Many of these contracts provide incentives for magazine exposure and competitive victories while wearing or using the Company’s products. Such expenses are an ordinary part of the Company’s operations and are expensed as incurred. The following is a schedule of future estimated minimum payments required under such endorsement agreements as of December 31, 2009 (in thousands):
| Year Ending December 31, |
|||
| 2010 |
$ | 5,370 | |
| 2011 |
1,990 | ||
| 2012 |
1,530 | ||
| 2013 |
1,005 | ||
| 2014 |
700 | ||
| Thereafter |
1,250 | ||
| $ | 11,845 | ||
The amounts listed above are the approximate amounts of the minimum obligations required to be paid under these contracts. The additional estimated maximum amount that could be paid under the Company’s
F-18
Table of Contents
VOLCOM, INC. AND SUBSIDIARIES
NOTES TO CONSOLIDATED FINANCIAL STATEMENTS—(Continued)
existing contracts, assuming that all bonuses, victories and similar incentives are achieved during the five-year period ending December 31, 2014, is approximately $4.2 million. The actual amounts paid under these agreements may be higher or lower than the amounts discussed above as a result of the variable nature of these obligations.
Litigation — The Company is involved from time to time in litigation incidental to its business. In the opinion of management, the resolution of any such matter currently pending will not have a material adverse effect on the Company’s consolidated financial position or results of operations.
Indemnities and Guarantees — During its normal course of business, the Company has made certain indemnities and guarantees under which it may be required to make payments in relation to certain transactions. These include (i) intellectual property indemnities to the Company’s customers and licensees in connection with the use, sale and license of Company products, (ii) indemnities to various lessors in connection with facility leases for certain claims arising from such facility or lease, (iii) indemnities to vendors and service providers pertaining to claims based on the negligence or willful misconduct of the Company, and (iv) indemnities involving the accuracy of representations and warranties in certain contracts. The duration of these indemnities, commitments and guarantees varies, and in certain cases, may be indefinite. The majority of these indemnities, commitments and guarantees do not provide for any limitation on the maximum potential future payments the Company could be obligated to make. The Company has not been required to record nor has it recorded any liability for these indemnities, commitments and guarantees in the accompanying consolidated balance sheets.
11. Stockholders’ Equity
The Company accounts for stock-based compensation under the fair value recognition provisions of ASC 718. The Company accounts for all stock-based compensation using a fair-value method and recognizes the fair value of each award as an expense over the service period. The Company uses the Black-Scholes option-pricing model to value compensation expense. Forfeitures are estimated at the date of grant based on historical employee turnover rates and reduce the compensation expense recognized. Depending upon the option grant, the expected option term is based upon historical industry data on employee exercises and management’s expectation of exercise behavior, or is estimated based on the simplified method as prescribed in ASC 718. For options granted concurrently with the Company’s initial public offering of common stock, the expected volatility of the Company’s stock price was based upon the historical volatility of similar entities whose share prices were publicly available. For options granted subsequent to the Company’s public offering, expected volatility is based on the historical volatility of the Company’s stock. The risk-free interest rate is based upon the current yield on U.S. Treasury securities having a term similar to the expected option term. Dividend yield is estimated at zero because the Company does not anticipate paying dividends in the foreseeable future. The fair value of employee stock-based awards is amortized using the straight-line method over the vesting period.
During the years ended December 31, 2009, 2008 and 2007, the Company recognized approximately $1.8 million, or $1.2 million net of tax, $985,000, or $638,000 net of tax, and $934,000 or $566,000 net of tax, respectively, in stock-based compensation expense, which includes the impact of all stock-based awards and is included in selling, general and administrative expenses.
Stock Compensation Plans — In 1996, the Company adopted the 1996 Stock Option Plan (the “1996 Plan”), which authorized the Company to grant or issue options to purchase up to a total of 4,663,838 shares of the Company’s common stock. In June 2005, the Company’s Board of Directors and stockholders approved the 2005 Incentive Award Plan (the “Incentive Plan”), as amended and restated in February 2007, and re-approved by the stockholders in May 2009. A total of 2,300,000 shares of common stock were initially authorized and reserved
F-19
Table of Contents
VOLCOM, INC. AND SUBSIDIARIES
NOTES TO CONSOLIDATED FINANCIAL STATEMENTS—(Continued)
for issuance under the Incentive Plan for incentives such as stock options, stock appreciation rights, restricted stock awards, restricted stock units, performance shares and deferred stock awards. The actual number of awards reserved for issuance under the Incentive Plan automatically increases on the first trading day in January of each calendar year by an amount equal to 2% of the total number of shares of common stock outstanding on the last trading day in December of the preceding calendar year, but in no event will any such annual increase exceed 750,000 shares. As of December 31, 2009, there were 2,923,142 shares available for issuance pursuant to new stock option grants or other equity awards. Under the Incentive Plan, stock options have been granted at an exercise price equal to the fair market value of the Company’s stock at the time of grant. The vesting period for stock options is determined by the Board of Directors or the Compensation Committee of the Board of Directors, as applicable, and the stock options generally expire 10 years from the date of grant or 90 days after employment or services are terminated.
Stock Option Awards — In June 2005, the Company’s Board of Directors approved the grant of 586,526 options to purchase the Company’s common stock. The Company granted these options under the Incentive Plan at the effective date of the Company’s initial public offering at an exercise price of $19.00, which was equal to the initial public offering price. The stock options have vesting terms whereby 10,526 options vested immediately, 210,000 options vested on December 15, 2005 and the remaining 366,000 options vest 20% per annum over five years. The fair value of these awards was calculated through the use of the Black-Scholes option-pricing model assuming an exercise price equal to the fair market value of the Company’s stock and the following additional significant weighted-average assumptions: expected life of 4.2 years; volatility of 47.5%; risk-free interest rate of 3.73%; and no dividends during the expected term.
In May 2007, the Company’s Board of Directors approved the grant of 2,000 options to purchase the Company’s common stock to each independent member of the Company’s Board of Directors (10,000 options in total). The Company granted these options at the fair market value of the Company’s common stock on the date of grant. The stock options vested one year from the date of grant. The fair value of these awards was calculated through the use of the Black-Scholes option-pricing model assuming an exercise price equal to the fair market value of the Company’s stock and the following additional significant weighted-average assumptions: expected life of 2.0 years; volatility of 55.7%; risk-free interest rate of 4.68%; and no dividends during the expected term.
In May 2008, the Company’s Board of Directors approved the grant of 2,000 options to purchase the Company’s common stock to each independent member of the Company’s Board of Directors (10,000 options in total). The Company granted these options at the fair market value of the Company’s common stock on the date of grant. The stock options vested one year from the date of grant. The fair value of these awards was calculated through the use of the Black-Scholes option-pricing model assuming an exercise price equal to the fair market value of the Company’s stock and the following additional significant weighted-average assumptions: expected life of 2.0 years; volatility of 61.9%; risk-free interest rate of 2.38%; and no dividends during the expected term.
In May 2009, the Company’s Board of Directors approved the grant of 670,000 options to purchase the Company’s common stock. The Company granted these options at the fair market value of the Company’s common stock on the date of grant. The stock option vesting periods range from one to five years from the date of grant. The fair value of these awards was calculated through the use of the Black-Scholes option-pricing model assuming an exercise price equal to the fair market value of the Company’s stock and the following additional significant weighted-average assumptions: expected life ranging from 1.0 to 6.5 years; volatility ranging from 69.7% to 90.7%; risk-free interest rate ranging from 0.53% to 3.22%; and no dividends during the expected term.
F-20
Table of Contents
VOLCOM, INC. AND SUBSIDIARIES
NOTES TO CONSOLIDATED FINANCIAL STATEMENTS—(Continued)
A summary of the Company’s stock option activity under the Incentive Plan is as follows:
| Year Ended December 31, | ||||||||||||||||||
| 2009 | 2008 | 2007 | ||||||||||||||||
| Number of Options |
Weighted- Average Exercise Price |
Number of Options |
Weighted- Average Exercise Price |
Number of Options |
Weighted- Average Exercise Price | |||||||||||||
| Outstanding, beginning of year |
437,558 | $ | 19.67 | 442,400 | $ | 19.52 | 487,700 | $ | 19.00 | |||||||||
| Granted |
670,000 | 14.46 | 10,000 | 25.42 | 10,000 | 42.07 | ||||||||||||
| Exercised |
— | — | (14,842 | ) | 19.00 | (54,100 | ) | 19.00 | ||||||||||
| Canceled or forfeited |
(4,400 | ) | 17.04 | — | — | (1,200 | ) | 19.00 | ||||||||||
| Outstanding, end of year |
1,103,158 | $ | 16.52 | 437,558 | $ | 19.67 | 442,400 | $ | 19.52 | |||||||||
| Options exercisable, end of year |
367,658 | $ | 19.80 | 291,758 | $ | 19.79 | 228,700 | $ | 19.00 | |||||||||
| Weighted-average fair value of options granted during the year |
$ | 9.20 | $ | 9.00 | $ | 14.25 | ||||||||||||
Additional information regarding stock options outstanding as of December 31, 2009, is as follows:
| Options Outstanding | Options Exercisable | |||||||||||
| Range of |
Number of Options |
Weighted- Average Remaining Life (yrs) |
Weighted- Average Exercise Price |
Number of Options |
Weighted- Average Exercise Price | |||||||
| $13.43 | 8,000 | 9.4 | $ | 13.43 | — | — | ||||||
| $14.47 | 660,100 | 9.3 | $ | 14.47 | — | — | ||||||
| $19.00 | 415,058 | 5.5 | $ | 19.00 | 347,658 | $ | 19.00 | |||||
| $25.42 | 10,000 | 8.4 | $ | 25.42 | 10,000 | $ | 25.42 | |||||
| $42.07 | 10,000 | 7.4 | $ | 42.07 | 10,000 | $ | 42.07 | |||||
As of December 31, 2009, there was unrecognized compensation expense of $5.3 million related to unvested stock options, which the Company expects to recognize over a weighted-average period of 2.8 years. The aggregate intrinsic value of options exercised during the years ended December 31, 2009, 2008 and 2007 was zero, $104,000 and $1.1 million, respectively. The aggregate intrinsic value of options outstanding as of December 31, 2009 was $1.5 million. The aggregate intrinsic value of options exercisable was zero, as the Company’s share price at December 31, 2009 was below the exercise price of all options exercisable. The weighted-average remaining contractual term of options currently exercisable is 5.6 years. The Company issues new shares upon the exercise of options or granting of restricted stock.
As of December 31, 2009, the total number of outstanding options vested or expected to vest (based on anticipated forfeitures) was 1,062,748 which had a weighted-average exercise price of $16.58. The average remaining life of these options was 7.8 years and the aggregate intrinsic value was $1.4 million at December 31, 2009.
Restricted Stock Awards — The Company’s Incentive Plan provides for awards of restricted shares of common stock. Restricted stock awards have time-based vesting and are subject to forfeiture if employment terminates prior to the end of the service period. Restricted stock awards are valued at the grant date based upon the market price of the Company’s common stock and the fair value of each award is charged to expense over the service period.
F-21
Table of Contents
VOLCOM, INC. AND SUBSIDIARIES
NOTES TO CONSOLIDATED FINANCIAL STATEMENTS—(Continued)
In 2005, the Company granted a total of 20,000 shares of restricted stock to employees. The restricted stock awards have a purchase price of $0.001 per share and vest 20% per year over a five-year period. The total fair value of the restricted stock awards is $660,000, of which $132,000 was amortized to expense during each of the years ended December 31, 2009, 2008 and 2007, respectively.
In 2006, the Company granted a total of 15,000 shares of restricted stock to employees. The restricted stock awards have a purchase price of $0.001 per share and vest 20% per year over a five-year period. The total value of the restricted stock awards is $405,000, of which $81,000 was amortized to expense during each of the years ended December 31, 2009, 2008 and 2007, respectively.
In 2008, the Company granted 10,000 shares of restricted stock to a service provider. The restricted stock award has a purchase price of $0.001 per share and vests 20% per year over a five-year period. The total value of the restricted stock award is $254,000, of which $51,000 and $34,000 was amortized to expense during the years ended December 31, 2009 and 2008, respectively.
Restricted stock activity for the year ended December 31, 2009 is as follows:
| Shares of Restricted Stock |
Weighted- Average Grant-Date Fair Value | |||||
| Outstanding restricted stock at January 1, 2009 |
27,000 | $ | 28.20 | |||
| Granted |
— | — | ||||
| Vested |
(9,000 | ) | 29.32 | |||
| Canceled or forfeited |
— | — | ||||
| Outstanding restricted stock at December 31, 2009 |
18,000 | $ | 27.64 | |||
As of December 31, 2009, there was unrecognized compensation expense of $353,000 related to all unvested restricted stock awards, which the Company expects to recognize on a straight-line basis over a weighted-average period of approximately 1.5 years.
12. Retirement Savings Plan
The Company has a 401(k) profit sharing plan (the “401(k) Plan”) covering all eligible full-time employees over age 21 with six months of service. The Company’s contributions to the 401(k) Plan are made at the discretion of management. Contributions by the Company amounted to $26,000, $121,000 and $82,000 for the years ended December 31, 2009, 2008 and 2007, respectively.
13. Licensing
In addition to the Company’s licensing arrangement with its investee in Australia described in Note 6, the Company has entered into licensing arrangements with independent licensees in Brazil, South Africa, Indonesia and Argentina (including Paraguay and Uruguay). Pursuant to the license agreements, the Company is paid a royalty based on a stated percentage of the net sales of its licensees.
The Company’s license agreement with its European licensee expired on December 31, 2006. Pursuant to an arrangement between the Company and its European licensee, the European licensee produced and distributed the Spring 2007 Volcom line in Europe and paid the Company its same royalty rate as required under the license agreement. Included in licensing revenues is $1.2 million from Volcom Europe for the year ended December 31, 2007. In anticipation of the expiration of this license agreement, the Company established its own operations in Europe and took direct control of the Volcom brand in Europe.
F-22
Table of Contents
VOLCOM, INC. AND SUBSIDIARIES
NOTES TO CONSOLIDATED FINANCIAL STATEMENTS—(Continued)
Certain of the Company’s existing license agreements may be extended at the option of the licensee for an additional five-year term after the initial expiration of the agreement. The Company’s international license agreements expire as follows:
| Licensee |
Expiration Date | Extension Termination Date | ||
| Australia |
June 30, 2012 | N/A | ||
| Brazil |
December 31, 2013 | N/A | ||
| South Africa |
December 31, 2011 | N/A | ||
| Indonesia |
December 31, 2014 | N/A | ||
| Argentina (including Paraguay and Uruguay) |
December 31, 2013 | December 31, 2018 |
14. Income Taxes
The Company and its subsidiaries file tax returns in the U.S. federal jurisdiction and in many state and foreign jurisdictions. The Company is no longer subject to U.S. federal income tax examinations for years before 2006 and is no longer subject to state and local or foreign income tax examinations by tax authorities for years before 2005. The Company is currently not undergoing any audits.
The provision for income taxes consists of the following:
| Year Ended December 31, | ||||||||||||
| 2009 | 2008 | 2007 | ||||||||||
| (In thousands) | ||||||||||||
| Current: |
||||||||||||
| Federal |
$ | 9,522 | $ | 12,903 | $ | 18,372 | ||||||
| State |
1,701 | 3,189 | 3,811 | |||||||||
| Foreign |
1,143 | 2,004 | (301 | ) | ||||||||
| Total current |
12,366 | 18,096 | 21,882 | |||||||||
| Deferred: |
||||||||||||
| Federal |
(2,060 | ) | (4,564 | ) | (729 | ) | ||||||
| State |
(161 | ) | (1,181 | ) | (222 | ) | ||||||
| Foreign |
(49 | ) | (564 | ) | 740 | |||||||
| Total deferred |
(2,270 | ) | (6,309 | ) | (211 | ) | ||||||
| Provision for income taxes |
$ | 10,096 | $ | 11,787 | $ | 21,671 | ||||||
A reconciliation of income tax expense computed at U.S. federal statutory rates to income tax expense for the years ended December 31, 2009, 2008 and 2007 is shown below.
| Year Ended December 31, | |||||||||
| 2009 | 2008 | 2007 | |||||||
| Provision for taxes at U.S. federal statutory rate |
35.0 | % | 35.0 | % | 35.0 | % | |||
| State income taxes, net of federal income tax benefit |
3.1 | 3.9 | 4.2 | ||||||
| Foreign tax rate differential |
(6.3 | ) | (6.8 | ) | — | ||||
| Goodwill and intangible asset impairment |
— | 3.0 | — | ||||||
| Foreign tax credit |
(0.7 | ) | (0.5 | ) | (0.4 | ) | |||
| Other |
0.6 | 0.6 | 0.6 | ||||||
| Effective income tax rate |
31.7 | % | 35.2 | % | 39.4 | % | |||
F-23
Table of Contents
VOLCOM, INC. AND SUBSIDIARIES
NOTES TO CONSOLIDATED FINANCIAL STATEMENTS—(Continued)
The components of deferred tax assets and liabilities are as follows at December 31:
| 2009 | 2008 | |||||||
| (In thousands) | ||||||||
| Deferred tax assets: |
||||||||
| Accrued liabilities |
$ | 734 | $ | 749 | ||||
| State income taxes |
52 | 577 | ||||||
| Allowances for doubtful accounts and product returns |
2,624 | 2,147 | ||||||
| Foreign net operating losses |
328 | 256 | ||||||
| Inventory costs |
2,217 | 266 | ||||||
| Intangible assets |
4,420 | 5,029 | ||||||
| Stock-based compensation |
1,501 | 901 | ||||||
| Other |
433 | 245 | ||||||
| Total deferred tax assets |
12,309 | 10,170 | ||||||
| Deferred tax liabilities: |
||||||||
| Intangible assets |
(148 | ) | (167 | ) | ||||
| Depreciation |
(591 | ) | (662 | ) | ||||
| Other |
(1 | ) | (188 | ) | ||||
| Total deferred tax liabilities |
(740 | ) | (1,017 | ) | ||||
| Deferred income taxes |
11,569 | 9,153 | ||||||
| Valuation allowance |
(324 | ) | (178 | ) | ||||
| Net deferred income taxes |
$ | 11,245 | $ | 8,975 | ||||
For the years ended December 31, 2009 and 2008, excess tax benefits (detriment) from stock-based compensation of $(59,000) and $4,000, respectively, were recorded as a (reduction) addition to paid-in capital.
The Company has a foreign net operating loss of approximately $1.4 million, of which $21,000 expires in 2015, $61,000 expires in 2023, $42,000 expires in 2024 and the remaining $1.3 million does not expire as it carries forward indefinitely. The Company does not provide for U.S. Federal, state or additional foreign taxes on certain foreign earnings that management intends to permanently reinvest.
As of December 31, 2009 and 2008, the Company recorded a valuation allowance of approximately $324,000 and $178,000, respectively, against deferred tax assets that the Company believes are not more likely than not to be realized.
The Company adopted the provisions of guidance included in ASC 740 on January 1, 2007. Upon the adoption of the guidance, the Company recognized a $128,000 increase in the liability for unrecognized tax benefits, which was accounted for as a reduction to the January 1, 2007 balance of retained earnings.
At December 31, 2009, the Company had $68,000 of total unrecognized tax benefits, all of which, if recognized, would favorably affect the effective income tax rate in any future periods. It is reasonably possible that a change in the unrecognized tax benefits could occur within the next 12 months. However, the Company anticipates that any change would not be significant and would not have a material impact on the consolidated statements of operations or consolidated balance sheets.
The Company recognizes interest and/or penalties related to unrecognized tax benefits in income tax expense. During the years ended December 31, 2009, 2008 and 2007, the Company recognized approximately
F-24
Table of Contents
VOLCOM, INC. AND SUBSIDIARIES
NOTES TO CONSOLIDATED FINANCIAL STATEMENTS—(Continued)
$2,000, $6,000 and $6,000 of interest and penalties associated with uncertain tax positions. At December 31, 2009 and 2008, the Company had $12,000 and $14,000, respectively, accrued for interest and penalties. To the extent interest and penalties are not assessed with respect to uncertain tax positions, amounts accrued will be reduced and reflected as a reduction of the overall income tax provision.
The following is a tabular reconciliation of the total amounts of unrecognized tax benefits (excluding the liability for interest and penalties) for the year:
| Unrecognized tax benefits balance at January 1, 2007 |
$ | 126,000 | ||
| Gross increases — tax positions in prior years |
23,000 | |||
| Gross decreases — tax positions in prior years |
(66,000 | ) | ||
| Unrecognized tax benefits balance at December 31, 2007 |
83,000 | |||
| Gross increases — tax positions in prior years |
— | |||
| Gross decreases — tax positions in prior years |
— | |||
| Lapse of statute of limitations |
(3,000 | ) | ||
| Unrecognized tax benefits balance at December 31, 2008 |
80,000 | |||
| Gross increases — tax positions in prior years |
— | |||
| Gross decreases — tax positions in prior years |
— | |||
| Lapse of statute of limitations |
(24,000 | ) | ||
| Unrecognized tax benefits balance at December 31, 2009 |
$ | 56,000 | ||
15. Segment Information
Operating segments are defined as components of an enterprise about which separate financial information is available that is evaluated regularly by the chief operating decision maker in deciding how to allocate resources and in assessing performance. The Company operates exclusively in the consumer products industry in which the Company designs, produces and distributes clothing, accessories, eyewear and related products. Based on the nature of the financial information that is received by the chief operating decision maker, the Company operates in three operating and reportable segments, the United States, Europe and Electric. The United States segment primarily includes Volcom product revenues generated from customers in the United States, Canada, Asia Pacific, Central America and South America that are served by the Company’s United States and Japanese operations, as well as licensing revenues and revenues generated from Company-owned domestic retail stores, including Laguna Surf & Sport. The European segment primarily includes Volcom product revenues generated from customers in Europe that are served by the Company’s European operations. The Electric segment includes Electric product revenues generated from customers worldwide, primarily in the United States, Canada, Europe and Asia Pacific. All intercompany revenues, expenses, payables and receivables are eliminated in consolidation and are not reviewed when evaluating segment performance. Each segment’s performance is evaluated based on revenues, gross profit and operating income. The accounting policies of the segments are the same as those described in the summary of significant accounting policies in Note 1.
F-25
Table of Contents
VOLCOM, INC. AND SUBSIDIARIES
NOTES TO CONSOLIDATED FINANCIAL STATEMENTS—(Continued)
Information related to the Company’s operating segments is as follows:
| Year Ended December 31, | |||||||||||
| 2009 | 2008 | 2007 | |||||||||
| (In thousands) | |||||||||||
| Total revenues: |
|||||||||||
| United States |
$ | 188,856 | $ | 237,109 | $ | 228,494 | |||||
| Europe |
70,686 | 73,005 | 40,119 | ||||||||
| Electric |
21,097 | 24,190 | — | ||||||||
| Consolidated |
$ | 280,639 | $ | 334,304 | $ | 268,613 | |||||
| Gross profit: |
|||||||||||
| United States |
$ | 92,356 | $ | 109,028 | $ | 110,412 | |||||
| Europe |
36,766 | 40,582 | 19,631 | ||||||||
| Electric |
11,673 | 13,486 | — | ||||||||
| Consolidated |
$ | 140,795 | $ | 163,096 | $ | 130,043 | |||||
| Operating income (loss): |
|||||||||||
| United States |
$ | 17,831 | $ | 33,019 | $ | 45,790 | |||||
| Europe |
13,529 | 17,470 | 4,842 | ||||||||
| Electric |
(1,412 | ) | (16,087 | ) | — | ||||||
| Consolidated |
$ | 29,948 | $ | 34,402 | $ | 50,632 | |||||
| As of December 31, | ||||||
| 2009 | 2008 | |||||
| (In thousands) | ||||||
| Identifiable assets: |
||||||
| United States |
$ | 170,463 | $ | 143,776 | ||
| Europe |
61,351 | 55,997 | ||||
| Electric |
21,219 | 21,850 | ||||
| Consolidated |
$ | 253,033 | $ | 221,623 | ||
Although the Company operates within three reportable segments, it has several different product categories within the segments, for which the revenues attributable to the each product category are as follows:
| Year Ended December 31, | |||||||||
| 2009 | 2008 | 2007 | |||||||
| (In thousands) | |||||||||
| Mens |
$ | 136,836 | $ | 162,340 | $ | 133,073 | |||
| Girls |
58,530 | 80,461 | 77,326 | ||||||
| Snow |
29,661 | 28,217 | 22,243 | ||||||
| Boys |
20,039 | 21,867 | 20,023 | ||||||
| Footwear |
4,374 | 5,676 | 6,127 | ||||||
| Girls swim |
5,725 | 6,126 | 3,734 | ||||||
| Electric |
21,097 | 24,190 | — | ||||||
| Other |
2,336 | 3,233 | 2,667 | ||||||
| Subtotal product categories |
278,598 | 332,110 | 265,193 | ||||||
| Licensing revenues |
2,041 | 2,194 | 3,420 | ||||||
| Total consolidated revenues |
$ | 280,639 | $ | 334,304 | $ | 268,613 | |||
F-26
Table of Contents
VOLCOM, INC. AND SUBSIDIARIES
NOTES TO CONSOLIDATED FINANCIAL STATEMENTS—(Continued)
Other includes revenues primarily relate to the Company’s Volcom Entertainment division, films and related accessories.
The table below summarizes product revenues by geographic regions, which includes revenues generated worldwide by the Electric operating segment and are allocated based on customer location:
| Year Ended December 31, | |||||||||
| 2009 | 2008 | 2007 | |||||||
| (In thousands) | |||||||||
| United States |
$ | 138,736 | $ | 195,846 | $ | 174,254 | |||
| Canada |
29,742 | 31,993 | 31,041 | ||||||
| Asia Pacific |
22,116 | 13,245 | 8,434 | ||||||
| Europe |
75,333 | 77,897 | 40,119 | ||||||
| Other |
12,671 | 13,129 | 11,345 | ||||||
| $ | 278,598 | $ | 332,110 | $ | 265,193 | ||||
Long-lived assets (excluding deferred tax assets) by geographic region are as follows:
| As of December 31, | ||||||
| 2009 | 2008 | |||||
| (In thousands) | ||||||
| United States |
$ | 24,535 | $ | 26,930 | ||
| Europe |
10,739 | 8,852 | ||||
| Asia Pacific |
3,214 | 3,348 | ||||
| $ | 38,488 | $ | 39,130 | |||
16. Fair Value Measurements of Financial Instruments
The Company’s financial assets and liabilities are measured and reported on a fair value basis in accordance with ASC 820. ASC 820 defines fair value, establishes a framework for measuring fair value in accordance with generally accepted accounting principles, and expands disclosure about fair value measurements. It also establishes a three-level hierarchy of fair value measurements for ranking the quality and reliability of the information used to determine fair values. ASC 820 requires that assets and liabilities carried at fair value will be classified and disclosed in one of the following three categories:
| • | Level 1 — Quoted market prices in active markets for identical instruments |
| • | Level 2 — Quoted market prices in active markets for similar instruments; quoted prices for identical or similar instruments that are not active; and model-derived valuations in which all significant inputs are observable in active markets; and |
| • | Level 3 — Valuations derived from valuation techniques in which one or more significant inputs are unobservable. |
The Company’s financial assets and liabilities include cash and cash equivalents, short-term investments, accounts receivable, accounts payable and foreign currency exchange contracts. The Company believes the carrying amounts of cash and cash equivalents, accounts receivable and accounts payable approximate fair value due to their short term maturities. The fair value of the Company’s short-term investments is determined based on quoted market prices in active markets and model-derived valuations in which all significant inputs are
F-27
Table of Contents
VOLCOM, INC. AND SUBSIDIARIES
NOTES TO CONSOLIDATED FINANCIAL STATEMENTS—(Continued)
observable in active markets. The fair value of the Company’s foreign currency exchange contracts is determined based on observable inputs that are corroborated by market data.
The following table presents information on the Company’s financial instruments (in thousands):
| December 31, 2009 | December 31, 2008 | |||||||||||||||||||||||
| Fair Value Measurements | Fair Value Measurements | |||||||||||||||||||||||
| Carrying Amount |
Level 1 | Level 2 | Level 3 | Carrying Amount |
Level 1 | Level 2 | Level 3 | |||||||||||||||||
| Financial assets: |
||||||||||||||||||||||||
| Short-term investments |
$ | 35,000 | $ | 25,000 | $ | 10,000 | $ | — | $ | — | $ | — | $ | — | $ | — | ||||||||
| Foreign currency exchange contracts |
79 | — | 79 | — | — | — | — | — | ||||||||||||||||
| Financial liabilities: |
||||||||||||||||||||||||
| Foreign currency exchange contracts |
$ | 48 | — | $ | 48 | $ | — | $ | 344 | — | $ | 344 | $ | — | ||||||||||
17. Derivative Financial Instruments
The Company is exposed to gains and losses resulting from fluctuations in foreign currency exchange rates relating to certain sales, licensing revenues, and product purchases of its international subsidiaries that are denominated in currencies other than their functional currencies. The Company is also exposed to foreign currency gains and losses resulting from domestic transactions that are not denominated in U.S. dollars. Furthermore, the Company is exposed to gains and losses resulting from the effect that fluctuations in foreign currency exchange rates have on the reported results in the Company’s consolidated financial statements due to the translation of the operating results and financial position of the Company’s international subsidiaries.
As part of its overall strategy to manage the level of exposure to the risk of fluctuations in foreign currency exchange rates, the Company enters into forward foreign currency exchange contracts to hedge a portion of its European operations U.S. dollar denominated inventory purchases. All of the Company’s forward foreign currency exchange contracts qualified for hedge accounting and the changes in the fair value of the derivatives are recorded in other comprehensive income. As of December 31, 2009, the Company was hedging forecasted transactions expected to occur through August 2010. Assuming exchange rates at December 31, 2009 remain constant, $28,000 of gains, net of tax, related to hedges of these transactions are expected to be reclassified into earnings during the next eight months.
On the date the Company enters into a derivative contract, the Company designates the derivatives as a hedge of the identified exposure. The Company formally documents all relationships between hedging instruments and hedged items, as well as the risk-management objective and strategy for entering into various hedge transactions. The Company identifies in this documentation the asset, liability, firm commitment, or forecasted transaction that has been designated as a hedged item and indicates how the hedging instrument is expected to hedge the risks related to the hedged item. The Company formally measures effectiveness of its hedging relationships both at the hedge inception and on an ongoing basis in accordance with the Company’s risk management policy. The Company will discontinue hedge accounting prospectively:
| • | if the Company determines that the derivative is no longer effective in offsetting changes in the cash flows of a hedged item; |
| • | when the derivative expires or is sold, terminated or exercised; |
F-28
Table of Contents
VOLCOM, INC. AND SUBSIDIARIES
NOTES TO CONSOLIDATED FINANCIAL STATEMENTS—(Continued)
| • | if it becomes probable that the forecasted transaction being hedged by the derivative will not occur; |
| • | if a hedged firm commitment no longer meets the definition of a firm commitment; or |
| • | if the Company determines that designation of the derivative as a hedge instrument is no longer appropriate. |
The Company has entered into forward foreign currency exchange contracts with a bank and is exposed to foreign currency losses in the event of nonperformance by this bank. The Company anticipates, however, that this bank will be able to fully satisfy its obligations under the contracts. Accordingly, the Company does not obtain collateral or other security to support the contracts.
As of December 31, 2009, the Company had U.S. dollar denominated forward foreign currency contracts outstanding to hedge a portion of its European operations U.S. dollar denominated inventory purchases with a notional amount of $5.6 million and a net fair value of $31,000, which mature from February 2010 through August 2010. Some outstanding contracts were in a loss position and the $48,000 liability is included in accrued liabilities in the accompanying consolidated balance sheet. The remaining outstanding contracts were in a gain position and the $79,000 asset is included in prepaid expenses and other current assets in the accompanying consolidated balance sheet.
For derivative instruments that are designated and qualify as cash flow hedges, the effective portion of the gain or loss on the derivative is reported as a component of other comprehensive income and reclassified into earnings in the same period or periods which the hedged transaction affects earnings. The following table summarizes the effective portions of gains (losses) of foreign exchange derivative instruments in the consolidated statements of operations:
| Year Ended December 31, 2009 | Year Ended December 31, 2008 | |||||||||||
| (In thousands) | ||||||||||||
| Amount | Location | Amount | Location | |||||||||
| Loss recognized in OCI on foreign currency derivatives |
$ | (237 | ) | OCI | $ | (309 | ) | OCI | ||||
| Loss reclassified from accumulated OCI into income |
(578 | ) | Cost of goods sold | — | Cost of goods sold | |||||||
F-29
Table of Contents
VOLCOM, INC. AND SUBSIDIARIES
NOTES TO CONSOLIDATED FINANCIAL STATEMENTS—(Continued)
18. Quarterly Financial Data (Unaudited)
A summary of quarterly financial data (unaudited) is as follows (in thousands, except per share data):
| Quarter Ended | |||||||||||||
| March 31 | June 30 | September 30 | December 31 | ||||||||||
| Year ended December 31, 2009 |
|||||||||||||
| Total revenues |
$ | 68,319 | $ | 54,216 | $ | 93,916 | $ | 64,188 | |||||
| Gross profit |
34,382 | 26,354 | 48,483 | 31,576 | |||||||||
| Operating income |
6,348 | 504 | 19,658 | 3,439 | |||||||||
| Net income |
4,220 | 872 | 13,257 | 3,397 | |||||||||
| Net income per share, basic |
$ | 0.17 | $ | 0.04 | $ | 0.54 | $ | 0.14 | |||||
| Net income per share, diluted |
$ | 0.17 | $ | 0.04 | $ | 0.54 | $ | 0.14 | |||||
| Year ended December 31, 2008 |
|||||||||||||
| Total revenues |
$ | 80,554 | $ | 72,456 | $ | 111,669 | $ | 69,625 | |||||
| Gross profit |
42,175 | 34,766 | 55,211 | 30,943 | |||||||||
| Operating income (loss) |
14,398 | 6,863 | 24,906 | (11,765 | )(1) | ||||||||
| Net income (loss) |
9,340 | 4,846 | 16,272 | (8,749 | ) | ||||||||
| Net income (loss) per share, basic |
$ | 0.38 | $ | 0.20 | $ | 0.67 | $ | (0.36 | ) | ||||
| Net income (loss) per share, diluted |
$ | 0.38 | $ | 0.20 | $ | 0.67 | $ | (0.36 | ) | ||||
| (1) | Operating loss for the quarter ended December 31, 2008 includes a $16.2 million non-cash asset impairment charge on goodwill and intangible assets related to the 2008 acquisitions of Electric and Laguna Surf & Sport. |
Earnings per basic and diluted share are computed independently for each of the quarters presented based on diluted shares outstanding per quarter and, therefore, may not sum to the totals for the year.
F-30
Table of Contents
SIGNATURES
Pursuant to the requirements of Section 13 or 15(d) of the Securities Exchange Act of 1934, the Registrant has duly caused this report to be signed on its behalf by the undersigned thereunto duly authorized.
| VOLCOM, INC. | ||
| By: | /S/ RICHARD R. WOOLCOTT | |
| Richard R. Woolcott Chairman and Chief Executive Officer | ||
Date: March 16, 2010
Pursuant to the requirement of the Securities Exchange Act of 1934, this report has been signed below by the following persons on behalf of the registrant and in the capacities and on the dates indicated.
| Signature |
Title |
Date | ||
| /s/ Richard R. Woolcott Richard R. Woolcott |
Chairman and Chief Executive Officer (Principal Executive Officer) | March 16, 2010 | ||
| /s/ Douglas P. Collier Douglas P. Collier |
Chief Financial Officer (Principal Financial and Accounting Officer) | March 16, 2010 | ||
| /s/ René R. Woolcott René R. Woolcott |
Director | March 16, 2010 | ||
| /s/ Douglas S. Ingram Douglas S. Ingram |
Director | March 16, 2010 | ||
| /s/ Anthony M. Palma Anthony M. Palma |
Director | March 16, 2010 | ||
| /s/ Joseph B. Tyson Joseph B. Tyson |
Director | March 16, 2010 | ||
| /s/ Carl W. Womack Carl W. Womack |
Director | March 16, 2010 | ||
| /s/ Kevin G. Wulff Kevin G. Wulff |
Director | March 16, 2010 | ||
F-31
Table of Contents
EXHIBIT INDEX
| Number |
Description | |
| 3.1* | Restated Certificate of Incorporation of Volcom, Inc. | |
| 3.2* | Amended and Restated Bylaws of Volcom, Inc. | |
| 3.3* | Certificate of Amendment of Restated Certificate of Incorporation of Volcom, Inc. | |
| 4.1* | Specimen Common Stock certificate. | |
| 10.1*† | Form of Indemnification Agreement between Volcom and each of its directors and officers. | |
| 10.2 | Credit Agreement by and between Bank of the West and Volcom, Inc., dated as of July 20, 2006 (incorporated by reference in the Company’s Current Report on Form 8-K filed on July 24, 2006). | |
| 10.3* | Third Amendment to Credit Agreement by and between Bank of the West and Volcom, Inc., dated as of September 30, 2008 (incorporated by reference in the Company’s Current Report on Form 8-K filed on November 10, 2008). | |
| 10.4* | Lease dated as of May 19, 1999 by and between Griswold Industries and Stone Boardwear, Inc. (the predecessor entity to Volcom, Inc.) for the real property known as 1740 Monrovia Avenue, Costa Mesa. | |
| 10.5* | Volcom, Inc. 2005 Incentive Award Plan. | |
| 10.6* | Volcom, Inc. Amended and Restated 2005 Incentive Award Plan (incorporated by reference in the Company’s Annual Report on Form 10-K filed on March 14, 2007). | |
| 10.7* | Form of Restricted Stock Award Grant Notice and Agreement. | |
| 10.8* | Form of Stock Option Grant Notice and Agreement. | |
| 10.9* | Software License Agreement by and between Innovative Systems, LLC and Volcom Stone Board Wear, Inc., made and effective September 1, 2002. | |
| 10.10 | Real Estate Development Agreement dated May 5, 2006 between Volcom SAS and Société d’Equipement des Pays de l’Adour (English Translation) (incorporated by reference in the Company’s Current Report on Form 8-K filed on May 9, 2006). | |
| 10.11 | Agreement of Purchase and Sale, dated as of January 15, 2008, by and among Volcom, Inc., Skelly Acquisition Corp., Electric Visual Evolution LLC, and each of the members of Electric Visual Evolution LLC (incorporated herein by reference to the Company’s Current Report on Form 8-K filed on January 18, 2008). | |
| 10.12 | First Amendment to lease between Griswold Industries and Stone Boardwear, Inc. (the predecessor entity to Volcom, Inc.) for the real property known as 1740 Monrovia Avenue dated October 6, 2008 (incorporated by reference in the Company’s Annual Report on Form 10-K filed on March 16, 2009). | |
| 21.1 | Subsidiaries of Volcom, Inc. | |
| 23.1 | Consent of Independent Registered Public Accounting Firm (Deloitte & Touche LLP). | |
| 31.1 | Certification of the Principal Executive Officer, as required pursuant to Section 302 of the Sarbanes-Oxley Act of 2002. | |
| 31.2 | Certification of the Principal Financial and Accounting Officer, as required pursuant to Section 302 of the Sarbanes-Oxley Act of 2002. | |
| 32 | Certifications of the Principal Executive Officer and Principal Financial and Accounting Officer, as required pursuant to Section 906 of the Sarbanes-Oxley Act of 2002. | |
| * | Incorporated by reference to Volcom, Inc.’s Registration Statement on Form S-1 (File Number: 333-124498) |
| † | All current directors and executive officers of Volcom, Inc. have entered into the Indemnity Agreement with Volcom, Inc. |