Attached files
| file | filename |
|---|---|
| EX-32.2 - EX-32.2 - VITAL IMAGES INC | a09-35845_1ex32d2.htm |
| EX-21.1 - EX-21.1 - VITAL IMAGES INC | a09-35845_1ex21d1.htm |
| EX-23.1 - EX-23.1 - VITAL IMAGES INC | a09-35845_1ex23d1.htm |
| EX-32.1 - EX-32.1 - VITAL IMAGES INC | a09-35845_1ex32d1.htm |
| EX-31.1 - EX-31.1 - VITAL IMAGES INC | a09-35845_1ex31d1.htm |
| EX-31.2 - EX-31.2 - VITAL IMAGES INC | a09-35845_1ex31d2.htm |
| EX-10.22 - EX-10.22 - VITAL IMAGES INC | a09-35845_1ex10d22.htm |
| EX-10.21 - EX-10.21 - VITAL IMAGES INC | a09-35845_1ex10d21.htm |
| EX-10.23 - EX-10.23 - VITAL IMAGES INC | a09-35845_1ex10d23.htm |
UNITED STATES
SECURITIES AND EXCHANGE COMMISSION
WASHINGTON, D.C. 20549
FORM 10-K
|
x |
ANNUAL REPORT PURSUANT TO SECTION 13 OR 15(d) OF THE SECURITIES EXCHANGE ACT OF 1934 |
For the fiscal year ended December 31, 2009
OR
|
o |
TRANSITION REPORT PURSUANT TO SECTION 13 OR 15(d) OF THE SECURITIES EXCHANGE ACT OF 1934 |
For the transition period from to
Commission file number: 0-22229
Vital Images, Inc.
(Exact name of registrant as specified in its charter)
|
Minnesota |
|
42-1321776 |
|
(State or other jurisdiction of |
|
(I.R.S. Employer Identification No.) |
|
incorporation or organization) |
|
|
|
5850 Opus Parkway, Suite 300 |
|
|
|
Minnetonka, MN 55343-4414 |
|
55343-4414 |
|
(Address of principal executive offices) |
|
(Zip Code) |
(952) 487-9500
(Registrant’s telephone number, including area code)
Securities registered pursuant to Section 12(b) of the Act:
|
|
Title of Each Class |
|
Name of Each Exchange on Which Registered |
|
|
|
Common Stock, $.01 par value |
|
NASDAQ Global Select Market |
|
Securities registered pursuant to Section 12(g) of the Act: None
Indicate by check mark if the registrant is a well-known seasoned issuer, as defined in Rule 405 of the Securities Act. Yes o No x
Indicate by check mark if the registrant is not required to file reports pursuant to Section 13 or Section 15(d) of the Exchange Act. Yes o No x
Indicate by check mark whether the registrant (1) has filed all reports required to be filed by Section 13 or 15(d) of the Securities Exchange Act of 1934 during the preceding 12 months (or for such shorter period that the registrant was required to file such reports), and (2) has been subject to such filing requirements for the past 90 days. Yes x No o
Indicate by check mark whether the registrant has submitted electronically and posted on its corporate Web site, if any, every Interactive Data File required to be submitted and posted pursuant to Rule 405 of Regulation S-T (§ 232.405 of this chapter) during the preceding 12 months (or for such shorter period that the registrant was required to submit and post such files). Yes o No o
Indicate by check mark if disclosure of delinquent filers pursuant to Item 405 of Regulation S-K is not contained herein, and will not be contained, to the best of registrant’s knowledge, in definitive proxy or information statements incorporated by reference in Part III of this Form 10-K or any amendment to this Form 10-K. o
Indicate by check mark whether the registrant is a large accelerated filer, an accelerated filer, a non-accelerated filer, or a smaller reporting company. See the definitions of “large accelerated filer,” “accelerated filer” and “smaller reporting company” in Rule 12b-2 of the Exchange Act.
|
Large accelerated filer o |
|
Accelerated filer x |
|
|
|
|
|
Non-accelerated filer o |
|
Smaller reporting company o |
|
(Do not check if a smaller reporting company) |
|
|
Indicate by check mark whether the registrant is a shell company (as defined in Rule 12b-2 of the Exchange Act). Yes o No x
As of June 30, 2009, the last day of the registrant’s most recently completed second fiscal quarter, the aggregate market value of the registrant’s common stock held by non-affiliates of the registrant was $161,839,241. The common stock is the registrant’s only class of voting stock.
The number of shares outstanding of the issuer’s class of common stock as of March 9, 2010 was 14,425,889 shares.
DOCUMENTS INCORPORATED BY REFERENCE
Portions of registrant’s definitive Proxy Statement in connection with the Annual Meeting of Stockholders to be held May 11, 2010 (“2010 Proxy Statement”) are incorporated by reference into Part III of this Form 10-K, as indicated in Items 10 through 14 of Part III.
Vital Images, Inc.
Form 10-K
Cautionary Statement Regarding Forward-Looking Information
Vital Images desires to take advantage of the “safe harbor” provisions of the Private Securities Litigation Reform Act of 1995 (the “Reform Act”) and is filing this cautionary statement in connection with the Reform Act. This Annual Report on Form 10-K and any other written or oral statements made by us or on our behalf may include forward-looking statements that reflect our current views with respect to future events and future financial performance. Certain statements in this Annual Report on Form 10-K are “forward-looking statements” within the meaning of Section 27(a) of the Securities Act of 1933 and Section 21E of the Securities Exchange Act of 1934. You can identify these forward-looking statements by our use of the words “believes,” “anticipates,” “forecasts,” “projects,” “could,” “plans,” “expects,” “may,” “will,” “would,” “intends,” “estimates” and similar expressions, whether in the negative or affirmative. We wish to caution you that any forward-looking statements made by us or on our behalf are subject to uncertainties and other factors that could cause such statements to be wrong. We cannot guarantee that we actually will achieve these plans, intentions or expectations. Actual results or events could differ materially from the plans, intentions and expectations disclosed in the forward-looking statements that we make. These statements are only predictions and speak only of our views as of the date the statements were made. Although we believe that the expectations reflected in the forward-looking statements are reasonable, we cannot guarantee future results, levels of activity, and/or performance of achievements. We do not assume any obligation to update or revise any forward-looking statements that we make, whether as a result of new information, future events or otherwise.
Factors that may impact forward-looking statements include, among others, our abilities to maintain the technological competitiveness of our current products, develop new products, successfully market our products, respond to competitive developments, develop and maintain partnerships with providers of complementary technologies, manage our costs and the challenges that may come with growth of our business, and attract and retain qualified sales, technical and management employees. We are also affected by the growth and regulation of the medical technology industry, including the acceptance of advanced visualization by hospitals, clinics, and universities, product clearances and approvals by the United States Food and Drug Administration and similar regulatory bodies outside the United States, and reimbursement and regulatory practices by Medicare, Medicaid, and private third-party payer organizations. We are also affected by other factors identified in our filings with the Securities and Exchange Commission, some of which are set forth in the section entitled “Item 1A. Risk Factors” in this Annual Report on Form 10-K (and many of which we have discussed in prior filings). Although we have attempted to list comprehensively these important factors, we also wish to caution investors that other factors may prove to be important in the future in affecting our operating results. New factors emerge from time to time, and it is not possible for us to predict all of these factors, nor can we assess the impact each factor or combination of factors may have on our business.
Our Business
Vital Images, Inc. (“Vital Images,” “we,” “us,” or “our”) is a leading provider of advanced visualization and image analysis solutions for use by medical professionals in clinical analysis and therapy planning for medical conditions. We provide software, customer education, software maintenance and support, professional services and, on occasion, third-party hardware to our customers. Our technology rapidly transforms complex data generated by diagnostic imaging equipment into functional digital images that can be manipulated and analyzed using our specialized applications to better understand internal anatomy and pathology. Our solutions are designed to improve physician workflow and productivity, enhance the ability to make clinical decisions, facilitate less invasive patient care, and complement often significant capital investments in diagnostic imaging equipment made by our customers. Our software is compatible with equipment from all major manufacturers of diagnostic imaging equipment, such as computed tomography (“CT”) scanners, and can be integrated into picture archive and communication systems (“PACS”). Many hospitals use PACS to acquire, distribute and archive medical images and diagnostic reports, reducing the need for film and increasing reliance on advanced visualization solutions such as ours. We also offer a Web-based solution that provides physicians with anywhere, anytime access to medical images and visualization tools through any Internet-enabled computer.
We were founded and incorporated in Iowa in September 1988, and we re-incorporated in Minnesota in March 1997. Our principal executive offices are located at 5850 Opus Parkway, Suite 300, Minnetonka, MN 55343 (telephone (952) 487-9500, facsimile (952) 487-9510, e-mail — info@vitalimages.com ). From May 24, 1994 through May 11, 1997, we were a wholly-owned subsidiary of Bio-Vascular, Inc., which is now known as Synovis Life Technologies, Inc.
Our corporate website address is www.vitalimages.com. To access our Annual Reports on Form 10-K, Quarterly Reports on Form 10-Q, Current Reports on Form 8-K, other reports and documents filed with or furnished to the United States Securities and Exchange Commission (the “SEC”) and amendments to these reports free of charge, go to the “Investors” section of our website, then to the “Financial Information” category, and then to the “SEC Filings” subcategory, where we make such filings available as soon as reasonably practicable after they are filed with or furnished to the SEC. The “Corporate Governance” category of the Investors section of our website also contains free copies of the Charters for the Audit Committee, Compensation Committee, and Governance Committee of our Board of Directors, as well as our Code of Business Conduct and Ethics, which is our written code of ethics under Section 406 of the Sarbanes-Oxley Act of 2002. Each of the above referenced documents can also be obtained free of charge (other than a reasonable charge for copying exhibits to our reports on Forms 10-K, 10-Q or 8-K) in print by any shareowner who requests them from our investor relations department. The investor relations department’s email address is investorrelations@vitalimages.com and its mail address is: Investor Relations, Vital Images, Inc., 5850 Opus Parkway, Suite 300, Minnetonka, MN 55343. Information available on our website is not incorporated by reference into this Annual Report on Form 10-K.
You may also obtain copies of our SEC filings on the SEC’s website at www.sec.gov or at the SEC’s Public Reference Room at 100 F Street N.E., Washington, D.C. 20549. You may obtain information on the operation of the Public Reference Room by calling the SEC at 1-800-SEC-0330.
Products and Services
Our software solutions are used with medical diagnostic equipment, primarily in clinical analysis and therapy planning. Our software applies proprietary technologies to a variety of data supplied by CT scanners to allow medical clinicians to create 2D, 3D and 4D views of human anatomy and to non-invasively navigate within these images to better visualize and understand internal structures and pathologies. Our main customers are hospitals and clinics, university medical schools and diagnostic imaging centers. We market our products and services to these customers both directly through our own sales force and indirectly through digital imaging equipment manufacturers and PACS companies, who sell our products with other products they either manufacture or acquire from third parties.
Our products initially were used by radiologists on dedicated workstations to interpret data generated by scanning equipment. Our main product for this type of use was and remains Vitrea®. Over time, other medical specialists, primarily cardiologists, began to use advanced visualization software on dedicated workstations. As additional types of specialists began desiring access to the benefits provided by advanced visualization tools, we began to integrate our products onto workstations connected to PACS and to offer a server-based advanced visualization solution called ViTALConnect®.
In 2008, we further expanded access to our advanced visualization products throughout the entirety of the hospital enterprise with our introduction, at that time, of Vital Enterprise. Our enterprise offerings expand the relevance of our advanced visualization options products beyond the radiology department to referring physicians and surgical specialists, particularly in the areas of cardiology, cardiovascular, oncology, neurology and gastroenterology. Our current enterprise offering is called Vitrea Enterprise Suite, which combines all of our proprietary advanced visualization tools into one offering, and may include our proprietary back-end data management software, Vital Image Management System. Vitrea Enterprise Suite can be used by every medical professional that practices with our customer’s enterprise. Both our enterprise and workstation products also serve as an integration platform for applications offered by our visualization technology partners.
Our products work with equipment from all major manufacturers of diagnostic imaging systems, including Toshiba Medical Systems Corporation (“Toshiba”), GE Healthcare (“GE”), Siemens Medical Systems, Inc. (“Siemens”) and Philips Medical Systems (“Philips”). Our products may also be integrated into PACS, such as those marketed by
McKesson Corporation (“McKesson”) and Sectra AB (“Sectra”), and run on off-the-shelf third-party computer hardware.
In addition to software products and installation services, we provide maintenance and support services, as well as certain other services, such as professional consulting services and customer education. We offer maintenance and support services for our software solutions pursuant to which we provide error correction, software enhancements, updates and upgrades, telephone support and other general support services. We provide customer education services for our customers, both in connection with their acquisition of our software and as independent purchases. We conduct customer education programs for our software at our headquarters in Minnetonka, Minnesota, at customers’ locations and at various designated locations through the United States.
We have also signed reseller distribution agreements that allow us to distribute products from certain third parties. These third-party products include MeVis Medical Solutions Inc.’s ImageChecker® CT software applications for the detection of lung nodules; Mirada Solutions Ltd.’s Fusion 7D™ software application for the anatomical alignment of two different image data sets from two different types of diagnostic equipment, such as combining images from CT and PET scanners; Merge Healthcare Incorporated’s CADstream™ breast MRI software; and Medis Inc.’s QMass® MR software.
Marketing and Distribution
We market our products both as standalone software packages and as part of integrated software and hardware systems to radiologists, surgeons, primary care physicians and medical researchers. We market our products directly to end-user customers and through business partners, including diagnostic imaging equipment manufacturers, PACS companies, and software developers, all of whom sell our products with products they either manufacture or acquire from third parties.
Our marketing partners include Toshiba, which markets our software to its customers through its subsidiaries and distributors worldwide. Our agreement with Toshiba commenced in 2001, and it has been extended multiple times, most recently through December 31, 2013. The Marketing and Distribution Agreement, which was entered into by Toshiba and us on November 21, 2008, is a typical reseller or distributor agreement, under which Toshiba resells our imaging products in connection with its sales of its own scanner equipment. Under the Marketing and Distribution Agreement, Toshiba markets and resells our products to its customers. Our sales team may provide assistance to Toshiba in its sales efforts, in a similar manner to how our sales team provides assistance to our other resellers, and we provide back-up technical support for problems that Toshiba cannot resolve. The Marketing and Distribution Agreement ensures a minimum amount of purchases from us by Toshiba. Because purchases by Toshiba have exceeded their commitments, these minimum purchase obligations have not been triggered to date, nor do we have reason to expect these provisions to be triggered in the future. Sales through Toshiba are a material portion of our revenues, comprising approximately 54% of our 2009 revenues, 52% of our 2008 revenues and 47% of our 2007 revenues.
We also have marketing and reseller agreements with several other companies, such as McKesson, Sectra and Cerner Corp., under which these companies may resell our products to their customers as add-on components to their products.
Geographic Information
Our export sales and long-lived assets by significant geographic areas are presented in Note 10 of the Consolidated Financial Statements in our 2009 Annual Report on Form 10-K, listed in Item 15(a)(1) of the Form 10-K.
Research and Development
Our research and development activities are focused on the development of new products and on improvements to existing products. Research and development expense was $16.3 million, $20.3 million and $18.5 million for the years ended December 31, 2009, 2008 and 2007, respectively.
In addition to our Marketing and Distribution Agreement with Toshiba, noted above, we also have entered into a Technology Development Agreement, which became effective on January 8, 2009 and calls for development of
software or clinical applications by us under Product Development Plans, as such term is defined in the Technology Development Agreement. Each Product Development Plan is separately entered into between Toshiba and us and discusses the key features of the project, including the product to be developed, development milestones, and the amount and timing of funding to be provided by Toshiba for the development effort. Upon completion of the project, we can sell the product that is developed both through Toshiba and, after a 180-day exclusivity period, through our direct sales force, although the exclusivity period may be waived for certain projects. We dedicate a specific number of our personnel exclusively to each project that is funded by Toshiba. The Technology Development Agreement currently will terminate six months following the end of all active Product Development Plans, although it may renew upon written agreement by Toshiba and us. If at any time no projects are ongoing during the term of the Technology Development Agreement, Toshiba will continue to provide funding to us at the rates set forth in the Agreement for up to six months for any of our personnel who are assigned to and actively engaged on projects related to errors reported in any project software that was previously released. In addition, Toshiba will also continue to provide funding for the dedicated project personnel for up to six months during the term, if no project is ongoing, or for up to six months after the term, to assist us to cover reallocation and/or termination costs. Funding received by us under the Technology Development Agreement is accounted for as an offset to research and development expense. We recognized a credit to research and development expenses of $1.1 million under the Technology Development Agreement in 2009.
Competition
The advanced visualization market is highly competitive, subject to rapid change and is significantly affected by new product introductions and other market activities of industry participants. Our products compete based on a multitude of factors, including quality, performance, functionality, clinical features, quality of support and service, reputation, brand and price. Our primary competitors are diagnostic imaging system suppliers, which are typically large, multinational companies with far greater financial and technical resources. They also have well-established sales and distribution networks for their products. These companies, including GE, Siemens, and Philips, develop and market medical imaging systems, such as CT and MR equipment, which may be purchased with integrated medical imaging capabilities. Our software works on the products offered by each of these companies. To win business against equipment manufacturers, we must convince customers to buy our solution separately from their purchase of imaging equipment instead of buying integrated systems from our competitors or we must persuade them that introducing our enterprise product throughout their hospitals will provide them with unique benefits not provided by our competitors.
We also face competition from PACS vendors and other suppliers of medical imaging systems and software. PACS companies sometimes provide medical imaging capability in addition to their image archiving and networking products. Some of the diagnostic equipment manufacturers, including GE and Philips, also offer PACS that comprise a large share of the PACS market. Vendors of hospital, clinical and radiology information systems have also diversified into the PACS and medical imaging product lines, either through internal development or business development and partnership channels. These companies, which may be large or small, attempt to offer an integrated system covering a full range of administrative, clinical and radiology information management capabilities to healthcare providers. Other suppliers of medical imaging systems and software, such as TeraRecon, Inc., compete on the basis of volume rendering or other visualization technologies, specific applications or market niches. We are seeing additional competitors enter our market, but have yet to see these competitors attain a meaningful share of the market.
Intellectual Property
We rely primarily on a combination of trade secret and copyright law, employee and third-party nondisclosure agreements and other protective measures to protect intellectual property rights pertaining to our products and technologies. We do not own all of the software and other technologies used in our products, but we believe we have the necessary licenses from third parties to use that technology in our current products. It may be necessary to renegotiate with such third parties for any new versions of current products or any new products. Such third-party licenses may not be available on reasonable terms, or at all.
Governmental Regulation
As medical devices, our software solutions are subject to extensive and rigorous regulation by numerous governmental authorities, principally the U.S. Food and Drug Administration (“FDA”) and corresponding foreign agencies. In the United States, the FDA administers the Federal Food, Drug, and Cosmetic Act, its amendments (the “FD&C Act”) and its related regulations. The FD&C Act and these regulations classify medical devices as Class I, II or III devices, which are subject to general controls, special controls or pre-market approval requirements, respectively. Most Class I and II devices, as well as some Class III devices, can be cleared for marketing pursuant to a 510(k) pre-market notification. The process of obtaining a 510(k) clearance typically can take several months to a year or longer.
Class III devices generally require more stringent clinical investigation and pre-market clearance requirements. In such cases, the FDA will require that the manufacturer submit a pre-market approval (“PMA”) application that must be reviewed and approved by the FDA prior to the sale and marketing of the device in the United States. The process of obtaining a PMA can be expensive, uncertain and lengthy, frequently requiring anywhere from one to several years from the date of FDA submission, if approval is obtained at all. Moreover, a PMA, if granted, may include significant limitations on the indicated uses for which a product may be marketed.
Our software is classified as a Class II medical device and has received marketing clearances from the FDA as the result of 510(k) pre-market notifications. Specifically, our software in general release has been cleared to be marketed for use with CT, MR and PET scanners. Future products, add-on options to existing software, and expanded claims of efficacy will likely require additional 510(k) pre-market notifications.
There can be no assurance that future FDA review processes will not involve delays or that clearances will be granted on a timely basis. In recent years, the FDA has increased its level of scrutiny of medical devices involving software, which requires us to produce additional documentation about the safety and effectiveness of our devices in order to obtain regulatory clearance, and which can lengthen the time required to obtain such clearance. Further, if any of our current or future products become classified as Class III devices, they could be subject to an even more expensive, uncertain and lengthy approval process, and approval, if granted, could include significant limitations on the indicated uses for which a product may be marketed.
We are also subject to regulation in foreign countries in which we sell our products. Many of the regulations applicable to our products in such countries are similar to those of the FDA, but the regulations in several countries, particularly in Asia, may be more particular than those of the FDA, and significantly greater time and resources may be required to obtain approval in those countries. Our ability to successfully market and sell our products in foreign markets depends in large part on our ability to comply with such foreign regulatory requirements. Our products have been Conformité Europeene (“CE”) marked, indicating conformance with applicable sections of the Medical Device Directive 93/42/EEC, as amended by 2007/47/EC, which allows the products to be marketed in the member countries of the European Communities.
We are also subject to periodic inspections by the FDA and similar foreign regulatory agencies, whose primary purpose is to audit our compliance with quality system regulations established by the FDA and other applicable government standards. Regulatory action may be initiated in response to audit deficiencies or product performance problems. We believe that our manufacturing and quality control procedures comply with all applicable requirements of the FDA and foreign regulatory agencies in countries in which we sell our products. We have received and maintain ISO 13485: 2007 Certification.
Medicare and Medicaid laws and regulations may impact the financial arrangements through which we market, sell and distribute our products and services to patients who are Medicare or Medicaid beneficiaries. Violations of these laws and regulations may result in civil and criminal penalties, including substantial fines and imprisonment. In a number of states, the scope of these laws and regulations has been extended to include the provision of services or products to all patients, regardless of the source of payment, although there is variation from state to state as to the exact provisions of such laws or regulations. In other states, and on a national level, several health care reform initiatives have been proposed which would have a similar impact. We believe that our operations and our marketing, sales and distribution practices currently comply with all current applicable fraud and abuse and physician anti-referral laws and regulations.
Employees
As of December 31, 2009, we had 246 full-time employees, with 87 involved in research and development, 70 in sales and marketing, 51 in technical support functions and 38 in administrative functions. We believe our relationship with our employees is good.
Item 1A. Risk Factors
The discussion of our business and operations included in this annual report on Form 10-K should be read together with the risk factors set forth below. They describe various risks and uncertainties to which we are or may become subject. These risks and uncertainties, together with other factors described elsewhere in this report, have the potential to affect our business, financial condition, results of operations, cash flows, strategies or prospects in a material and adverse manner. New risks may emerge at any time, and we cannot predict those risks or estimate the extent to which they may affect financial performance. Each of the risks described below could adversely impact the value of our securities. These statements, like all statements in this report, speak only as of the date of this report (unless another date is indicated), and we undertake no obligation to update or revise the statements in light of future developments.
We offer only one line of products, which is advanced visualization software, related services and hardware, and if our products do not continue to gain market acceptance, our financial results would be adversely affected.
Our current market success depends on our ability to successfully market advanced visualization software for clinical use, and on the ability and willingness of physicians to use enterprise-wide advanced visualization medical imaging software in clinical analysis and therapy planning. Our enterprise-wide advanced visualization software products are alternatives to the conventional methods traditionally used for viewing medical images in the clinical setting. Often, a purchase by a customer of our products means that it has chosen not to utilize software that was provided in connection with the customer’s purchase of a scanner, which means that the customer may pay additional amounts to obtain our products. The acceptance of our products by physicians and other clinicians will depend on our ability to educate those users as to the speed, ease-of-use and other benefits offered by our products and systems, as well as our timely introduction of new features and functions. There can be no assurance that users will prefer advanced visualization and analysis software solutions over less expensive 2D medical imaging software or that we will succeed in our efforts to further develop, commercialize and achieve market acceptance for our products or for any other product in the clinical setting. If our single line of products does not continue to gain market acceptance, our financial results will be adversely affected.
A substantial portion of our revenue is derived from sales of our software in connection with customer purchases of computer tomography, or CT, scanners, and any decline in the purchase of CT scanners or any difficulty we have in growing sales separately from sales of CT scanners could have a material adverse effect on our results of operations and financial condition.
Our business historically was tied to sales of our advanced visualization products on a workstation basis, which were typically purchased concurrently with a customer’s purchase of CT imaging equipment. The market for CT imaging equipment was down significantly in 2009 and is not expected to recover to its past levels within the foreseeable future. In order to improve the marketability of our products separately from sales of CT imaging equipment, during 2008, we evolved our products and business model into sales throughout a customer’s enterprise. We have sold our enterprise-wide advanced visualization products through our direct sales channel since then and began to grow sales of it through our reseller channel during 2009. However, there can be no assurance that sales of our enterprise-wide advanced visualization product through our reseller channel will not remain dependent upon the CT sales cycle, or that such products will be sold by our resellers at the same level as they previously sold our advanced visualization products on a workstation.
We presently depend on Toshiba for a significant portion of our total revenues. A reduction in the business from Toshiba could adversely affect our revenues and could seriously harm our business.
One of our principal distribution channels is to sell our medical imaging software in connection with medical imaging equipment sold by Toshiba. Sales to Toshiba accounted for 54% of our total revenue for the year ended December 31, 2009, 52% of our total revenue for the year ended December 31, 2008 and 47% of our total revenue
for the year ended December 31, 2007. Toshiba’s accounts receivable represented 36% of our accounts receivable at December 31, 2009 and 42% at December 31, 2008. Except for our agreement with Toshiba, we have no significant purchase commitments from any of our customers or business partners, and we generally make sales pursuant to individual transactions. Our joint distribution agreement with Toshiba commenced in 2001 and has been extended multiple times, most recently through December 31, 2013. However, Toshiba does have the ability to conduct in-house development of advanced visualization capabilities for all Toshiba modalities which could lead to a reduction in Toshiba’s need for our products in the future. A reduction, delay, or cancellation of orders from Toshiba, or our inability to collect accounts receivable from Toshiba, likely would have a material adverse effect on our financial condition and operating results.
We operate in a single industry and are therefore dependent upon payer reimbursement rates and market demand for advanced visualization products and services. If reimbursement rates decline or if our market does not grow as we expect, our business, results of operations and financial condition will be adversely affected.
State and federal governmental agencies and private payers are putting pressure on reimbursement rates for advanced visualization examinations, which can negatively affect demand for our products. Many of the major hospitals and medical research centers within the United States have already purchased scanners, PACS and advanced visualization technologies, causing future sales to be upgrades or replacements instead of new installations, potentially lengthening the sales cycles as customers feel less urgency to purchase and implement new systems.
Given the uncertainties associated with the developing stage of many of the geographic and medical specialty markets that we believe represent growth opportunities, there can be no assurance that they will develop in the manner we anticipate or that they will not require a level of investment greater than we expect. Additionally, some of our customers finance their acquisitions through third-party lenders. With the unpredictability of credit availability in the lending market, some customers who would otherwise purchase our products may not be able to obtain sufficient financing and therefore will not complete their purchases. Accordingly, there can be no assurance that the advanced visualization industry will provide growth opportunities for us and our software products or that our business strategies will be successful as the industry continues to evolve. Ultimately, if the advanced visualization industry fails to develop as we expect, our business, results of operations and financial condition will be materially and adversely affected.
Most of our products are used with CT scanning equipment, and are therefore dependent upon the amount of use of CT equipment. If usage of CT equipment is reduced, our business, results of operations and financial condition will be adversely affected.
Most of our products are used with CT scanning equipment, which uses ionizing radiation to generate images of the body. Recently, media and regulatory concern has been directed at the dosage of radiation that may be given to a patient undergoing a CT scan. The optimal radiation dose is “no more or less than what is necessary to produce a high-quality image,” according to a recent FDA white paper. If the current concern results in a reduction in market demand for CT scans, it is likely that the demand for our products could also be reduced. Unless we are successful in developing significant usage for our products other than in connection with CT image data, if the CT equipment manufacturers are unable to develop scanners that produce meaningful data at lower doses of radiation or we are unable to develop software that provides useful images based on the lower dosage levels, our financial results could be adversely affected. Further, recent healthcare regulatory reform seeks to increase the percentage of time of utilization for each scanner that is used in the United States. Utilization reform, while increasing usage of existing scanners, could reduce demand for future scanner purchases, and reduced demand for scanner purchases could materially and adversely affect our business, results of operations and financial condition.
We participate in a highly competitive industry. If we fail to compete effectively, our results of operations and financial condition would be adversely affected.
We face intense competition in the advanced visualization industry. We expect technology to continue to develop rapidly, and our success will depend to a large extent on our ability to maintain a competitive position with our products. Our competitors in the advanced visualization industry include large, established manufacturers of CT and MR imaging equipment. Companies such as GE, Siemens and Philips typically offer their own advanced visualization software and workstations as part of their integrated imaging and scanner systems. Our software works
on the products offered by each of these companies. To win business against equipment manufacturers, we must convince customers to buy our software solutions separately from their purchase of imaging equipment instead of buying integrated systems from our competitors.
In addition to having a competitive advantage in marketing advanced visualization tools as an integrated part of their imaging products, many of our competitors have significantly greater capital and staffing resources for research and development, more recognizable brand names, and more well-established marketing and distribution networks. Although price has been less significant than other factors, increasing competition may result in price reductions and reduced gross margins. Additionally, we face competition from other entities, such as PACS vendors and developers of competitive or ancillary software packages. The advanced visualization market is characterized by rapid innovation and technological change. For example, as scanners become faster and generate increasingly more slices, our software must maintain its capability to handle the increased data volumes generated by such scanners. We may devote time and resources to develop products that do not obtain market acceptance or for which the market is much smaller than we expected when we planned the products. Products developed by our competitors may render our products obsolete or non-competitive. Similarly, our competitors may succeed in developing or marketing products that are viewed as providing superior clinical performance, enterprise access and performance, or are less expensive than our current or future products.
As a result, we may not be able to compete effectively with such manufacturers or competing entities on each or any particular factor, including price, features and service.
As our products are accessed by additional medical professionals throughout an enterprise, the satisfaction of our customers may decrease.
Historically, our products were used by radiologists who received education on the use of imaging products in medical school and continuing education programs and to whom we provided training in connection with their purchases. For radiologists, use of medical imaging products is a relatively routine activity. As our products are used by additional medical professionals throughout an enterprise, they will be used by persons with less training and familiarity with imaging technologies. Occasional and less-trained users of imaging technology may find use of our products to be more difficult than do radiologists, which could increase our time and expenses supporting these users, thus negatively affecting our gross margins for support services. Further, these users may realize less satisfaction than do our historical customers, negatively affecting the adoption of our products elsewhere in the enterprise. Finally, occasional and less-trained users are more likely to use our products incorrectly. Although our products are intended to be secondary analytical devices, their incorrect use could result in errors by medical professionals in their treatment of patients, lowering their satisfaction with our products and potentially exposing us to legal and regulatory liability, which could affect our results of operations and ability to market our products.
We may make future acquisitions, which may be difficult to integrate, divert management resources, result in unanticipated costs or dilute our shareholders.
Part of our continuing business strategy is to evaluate possible acquisitions of, or investments in, companies, products or technologies that complement our current products, enhance our market coverage or technical capabilities, or offer growth opportunities. Future acquisitions could pose numerous risks to our operations, including:
· we may have difficulty integrating the purchased operations, technologies or products;
· we may incur substantial unanticipated integration costs;
· assimilating the acquired businesses may divert significant management attention and financial resources from our other operations and could disrupt our ongoing business;
· acquisitions could result in the loss of key employees, particularly those of the acquired operations;
· we may have difficulty retaining or developing the acquired businesses’ customers;
· acquisitions could adversely affect our existing business relationships with suppliers and customers;
· we may fail to realize the potential cost savings or other financial benefits and/or the strategic benefits of the acquisitions; and
· we may incur liabilities from the acquired businesses for infringement of intellectual property rights or other claims, and we may not be successful in seeking indemnification for such liabilities or claims.
Further, we may not receive the returns from an acquisition that were expected at the time of acquisition. In connection with any acquisition or investment, we could incur debt, be required to amortize expenses related to intangible assets, incur large and immediate write-offs, experience volatility in future earnings resulting from contingent consideration, assume liabilities, or issue stock that would dilute our current shareholders’ percentage of ownership. We may not be able to complete acquisitions or integrate the operations, products or personnel gained through any such acquisition without a material adverse effect on our business, financial condition and results of operations.
We sell our products internationally and are subject to various risks relating to such international activities, which could harm our international sales and profitability.
During the years ended December 31, 2009, 2008 and 2007, 34%, 29% and 19% of our total revenues, respectively, were attributable to international sales. Toshiba has been the primary source of our international sales. We are also developing direct international sales and marketing efforts. By doing business in international markets, we are exposed to risks separate and distinct from those we face in our domestic operations. Our international business may be adversely affected by changing economic conditions in foreign countries. Because most of our sales are currently denominated in U.S. dollars, if the value of the U.S. dollar increases relative to foreign currencies, our products could become more costly to the international consumer and therefore less competitive in international markets, which could adversely affect our profitability. Furthermore, the percentage of sales denominated in non-U.S. currencies may increase in the future, in which case fluctuations in exchange rates could affect demand for our products.
Most of our business in markets outside the United States is provided through third parties with whom we have marketing agreements. There can be no assurance that these third parties will wish to continue our relationships on an indefinite basis or under the same terms as the business is currently conducted. Further, although we have developed direct relationships with customers in markets outside the United States, we may not be successful in doing so at a sufficient level. The loss of or adverse changes in our relationships with our third-party business partners, and our failure to establish sufficient direct relationships with customers outside the United States, would have a material adverse impact on our business, financial condition and results of operations.
Engaging in international business inherently involves a number of other difficulties and risks, including:
· export restrictions and controls relating to technology;
· the availability and level of reimbursement within prevailing foreign healthcare payment systems;
· pricing pressure that we may experience internationally;
· required compliance with existing and new foreign regulatory requirements and laws;
· business customs in other countries that violate U.S. laws, such as the Foreign Corrupt Practices Act;
· laws and business practices favoring local companies;
· longer payment cycles;
· difficulties in enforcing agreements and collecting receivables through foreign legal systems;
· political and economic instability;
· potentially adverse tax consequences, tariffs and other trade barriers;
· international terrorism and anti-American sentiment;
· difficulties and costs of staffing and managing foreign operations;
· changes in currency exchange rates; and
· difficulties in enforcing intellectual property rights.
Our exposure to each of these risks may lower our revenues, increase our costs, lengthen our sales cycle and require significant management attention. We cannot assure you that one or more of these factors will not harm our business.
If our internal control over financial reporting is found to be inadequate, our financial results may not be accurate, raising concerns for investors and potentially adversely affecting our stock price.
Under Section 404 of the Sarbanes-Oxley Act of 2002, we are required to evaluate and determine the effectiveness of our internal controls over financial reporting. We have dedicated a significant amount of time and resources to
ensure compliance with this legislation in recent years and will continue to do so for future periods. We may encounter problems or delays in completing the evaluation, the implementation of improvements, and the receipt of a positive attestation, or any attestation at all, from our independent registered public accounting firm. In addition, our assessment of our internal controls may identify deficiencies that need to be addressed in our internal controls over financial reporting or other matters that may raise concerns for investors as to the accuracy of our reported financial results and adversely affect our stock price.
We may experience fluctuations in operating results, which may result in volatility in the price of our common stock.
We have in the past experienced, and may in the future experience, significant fluctuations in annual and quarterly operating results. If these fluctuations occur, they may result in volatility in the price of our common stock. Quarterly revenue and operating results may fluctuate as a result of a variety of factors that are outside of our control including, but not limited to, the timing of significant orders, the timing of product enhancements and new product introductions by us or our competitors, the pricing of our products, changes in customers’ budgets and competitive conditions. Our quarterly license and services revenue may fluctuate and may be difficult to forecast for a variety of reasons, including the following:
· a significant number of our existing and prospective clients’ decisions regarding whether to enter into license agreements with us are made within the last few weeks or days of each quarter;
· the size and number of license transactions can vary significantly;
· our dependence on Toshiba or any other major customer for a significant portion of our revenues;
· a decrease in license fee revenue which may likely result in a decrease in services revenue in the same or subsequent quarters;
· clients unexpectedly postponing or cancelling projects due to changes in their strategic priorities, project objectives, budget or personnel;
· the uncertainty caused by potential business combinations in the software industry, causing clients and prospective clients to cancel, postpone or reduce capital spending projects on software;
· client evaluations and purchasing processes that vary significantly from company to company, and a client’s internal approval and expenditure authorization process that is difficult and time consuming to complete, even after selection of a vendor;
· the number, timing and significance of software product enhancements and new software product announcements by us or our competitors;
· existing clients declining to renew support for our products, and market pressures that limit our ability to increase support fees or require clients to upgrade from older versions of our products; or
· prospective clients declining or deferring the purchase of new products or releases if we do not have sufficient client references for those products.
We are subject to government regulation of our products, which can result in additional costs or restrict our ability to market our products.
Our products are subject to regulation by the FDA and by comparable agencies in foreign countries. In the United States, the FDA regulates the development, introduction, manufacturing, labeling and record keeping procedures for medical devices, including medical imaging software and systems. Our medical devices require clearance or approval by the FDA before they can be commercially distributed in the United States. Modifications and enhancements to a medical device also require a new FDA clearance or approval if they could significantly affect its safety or effectiveness or would constitute a major change in its intended use, design or manufacture. The FDA requires every manufacturer to make this determination in the first instance, but the FDA may review any manufacturer’s decision and may require a new clearance or approval for the modification if it disagrees with the manufacturer’s decision. If the FDA requires us to seek clearance or approval for the modification of a previously cleared product for which we have concluded that new clearances or approvals are unnecessary, we may be required to cease marketing or to recall the modified product until we obtain clearance or approval, and we may be subject to significant regulatory fines or penalties, which could have a material adverse effect on our financial results and competitive position. The process of obtaining marketing clearance from the FDA for new products and new applications for existing products can be time-consuming and expensive. All of our current products are marketed pursuant to 510(k) pre-market clearance from the FDA. Our products have been cleared to be marketed for use with CT, MR and PET scanners. The FDA may not grant clearance with respect to our future products or enhancements, or future FDA review may involve delays that could adversely affect our ability to market such future products or
enhancements. In addition, the FDA, which is currently under political pressure regarding a handful of products that it cleared over the past few years, including some products that are used for medical imaging, is reviewing the process by which it grants clearance to products. Several of the potential changes could make the process to obtain regulatory clearance more difficult, lengthy and expensive. A more difficult and expensive regulatory clearance process, in addition to potentially causing us to defer or choose not to conduct promising areas of research and development, would by itself slow the time by which products for patient care reach market and could materially and adversely affect our business and results of operations. Further, these changes could affect our products as well as the scanning equipment that produce the data from which our products produce images. If the process becomes more difficult and expensive, medical device manufacturers, including scanning and imaging companies, could increase prices to compensate for the additional risks and costs. Increased prices could further reduce demand for our products, which would materially and adversely affect our business, results of operations and financial condition.
Even if we obtain regulatory clearances and approvals to market a product from the FDA, these approvals may entail limitations on the indicated uses of the product. Product clearances and approvals by the FDA can also be withdrawn due to failure to comply with regulatory standards or the occurrence of unforeseen problems following initial approval. The FDA could also limit or prevent the distribution of our products and has the power to require the recall of such products. FDA regulations depend heavily on administrative interpretation, and future interpretations made by the FDA or other regulatory bodies may adversely affect us. The FDA may inspect our facilities and operations to determine whether we are in compliance with various regulations relating to specification, development, documentation, validation, testing, quality control and product labeling. If the FDA determines that we are in violation of such regulations, it could impose civil penalties, including fines, recall or seize products and, in extreme cases, impose criminal sanctions. If we determine that our facilities, operations or products are not in compliance with FDA requirements, we may voluntarily suspend our operations or recall products.
We market our products both domestically and internationally. International regulatory bodies have established varying regulations governing product standards, packaging requirements, labeling requirements, import restrictions, tariff regulations, duties and tax requirements. Our inability or failure to comply with the varying regulations, or the imposition of new regulations, could restrict our ability to sell our products internationally and could adversely affect our business.
The imposition of requirements under the Health Insurance Portability and Accountability Act of 1996, or HIPAA, could adversely affect our business.
The HIPAA regulations require our customers to observe several requirements for the privacy and security of the protected health information (PHI) of their patients. Although the products and services we provide may technically not be covered under the HIPAA regulations, we may have access to PHI while working with our customers and our customers therefore routinely request that we sign “business associate” agreements with them. A “business associate” is a person or entity that performs certain functions or activities that involve the use or disclosure of protected health information on behalf of, or that provides services to, a covered entity. By law, the HIPAA Privacy Rule applies only to covered entities—health plans, healthcare clearinghouses, and certain healthcare providers. However, most healthcare providers do not carry out all of their healthcare activities and functions by themselves. Instead, they often use the services of a variety of other persons or businesses. The HIPAA Privacy Rule allows covered providers and health plans to disclose protected health information to these “business associates” if the providers or plans obtain satisfactory assurances that the business associate will use the information only for the purposes for which it was engaged by the covered entity, will safeguard the information from misuse, and will help the covered entity comply with some of the covered entity’s duties under the HIPAA Privacy Rule. Covered entities may disclose protected health information to an entity in its role as a business associate only to help the covered entity carry out its healthcare functions—not for the business associate’s independent use or purposes, except as needed for the proper management and administration of the business associate. These agreements are necessary for us in the normal course of servicing and supporting our products and may require us to incur liabilities if we disclose protected health information in a manner not allowed under any respective agreement. Our potential liabilities may include indemnifying our customer against any damages resulting from the disclosure. If we are not willing to or are unable to enter into a business associate agreement with current and potential customers, such customers may not purchase our products or services or discontinue previously-purchased services, which would have a material adverse effect on our business, financial condition, or results of operations.
We are subject to various federal and state “fraud and abuse” laws, and if we are unable to fully comply with such laws, we could face substantial penalties, which may adversely affect our business.
We are subject to various federal and state laws pertaining to health care fraud and abuse, including HIPAA and the following:
· the federal Anti-Kickback Statute, which prohibits persons from knowingly and willfully soliciting, offering, receiving or providing remuneration, directly or indirectly, in cash or in kind, to induce either the referral of an individual, or furnishing or arranging for a good or service, for which payment may be made under federal health care programs (such as Medicare and Medicaid);
· the federal False Claims Act, which prohibits anyone from knowingly presenting or causing to be presented a false or fraudulent claim for payment to the federal government;
· the federal False Statements Statute, which prohibits knowingly and willfully falsifying, concealing or covering up a material fact or making any materially false statement in connection with the delivery of or payment for health care benefits, items or services; and
· state law equivalents to these federal laws, which may not be limited to government reimbursed items, and may not contain identical exceptions.
If our past or present operations are found to be in violation of any of the laws described above or the other similar governmental regulations to which we are subject, we may be subject to the applicable penalty associated with the violation, including civil and criminal penalties, damages, fines, exclusion from federal health care programs and/or the curtailment or restructuring of our operations. Similarly, if the physicians or other providers or entities with which we do business are found to be non-compliant with applicable laws, they may be subject to sanctions, which could also have a negative impact on us. Any penalties, damages, fines, curtailment or restructuring of our operations could adversely affect our ability to operate our business and our financial results. The risk of our being found in violation of these laws is increased by the fact that their provisions are open to a variety of interpretations and are subject to further legal or regulatory change. Any action against us for violation of these laws, even if we successfully defend against it, could cause us to incur significant legal expenses, fines and other penalties, divert our management’s attention from the operation of our business and damage our reputation.
The protection of our intellectual property may be uncertain, and we may face possible claims of others.
Although we have received patents and have filed patent applications with respect to certain aspects of our technology, we generally do not rely principally on patent protection with respect to our products and technologies. Instead, we rely primarily on a combination of trade secret and copyright law, employee and third-party nondisclosure agreements and other protective measures to protect intellectual property rights pertaining to our products and technologies. Such measures may not provide meaningful protection of our trade secrets, know-how or other intellectual property in the event of any unauthorized use, misappropriation or disclosure. Others may independently develop similar technologies or duplicate our technologies. In addition, to the extent that we apply for any patents, such applications may not result in issued patents or, if issued, such patents may not be valid or of value. Third parties could, in the future, assert infringement or misappropriation claims against us with respect to our current or future products and technologies, or we may need to assert claims of infringement against third parties. Any infringement or misappropriation claim by us or against us could place significant strain on our financial resources, divert management’s attention from our business and harm our reputation. The costs of prosecuting or defending an intellectual property claim could be substantial and could adversely affect our business, even if we are ultimately successful in prosecuting or defending any such claims. If our products or technologies are found to infringe the rights of a third party, we could be required to pay significant damages or license fees or cease production, any of which could have a material adverse effect on our business.
We face the risk of product liability claims, and our product liability and errors and omissions insurance coverage may not be adequate to pay products liability claims, which could have a material adverse effect on our financial condition.
Our business exposes us to the risk of product liability claims that is inherent in the manufacturing and marketing of medical devices, including those which may arise from the misuse or malfunction of, or design flaws in, our products. We may be subject to product liability claims if our products cause, or merely appear to have caused, an injury. Claims may be made by patients, healthcare providers or others selling our products. Our product liability
and errors and omissions insurance is subject to deductibles and coverage limitations. Our current product liability insurance may not continue to be available to us on acceptable terms, if at all, and, if available, the coverages may not be adequate to protect us against any future product liability claims. Further, if additional products are approved for marketing, we may seek additional insurance coverage. If we are unable to obtain insurance at an acceptable cost or on acceptable terms with adequate coverages or otherwise protect against potential product liability claims, we will be exposed to significant liabilities, which may harm our business. A product liability claim, recall or other claim with respect to uninsured liabilities or for amounts in excess of insured liabilities could result in significant costs and damage to our reputation and future results, any of which would cause significant harm to our business.
If we fail to attract and retain qualified personnel, our business would be harmed.
Recruiting and retaining talented personnel is critical to our success. There is intense competition from other companies, research and academic institutions, government entities and other organizations for qualified personnel in the areas of our activities. We are located in Minnesota, but compete with companies nationally for employees, particularly those with unique skill sets, and not all potential employees view moving to Minnesota favorably. Further, the pace of change in our industry is rapid, and to keep pace we need to ensure that our existing employees continually upgrade their knowledge and skills. If we fail to identify, attract, retain and motivate these highly skilled personnel, we may be unable to continue our marketing and development activities and may experience interruptions or delays in the execution of our overall business strategy.
We depend on third-party reimbursement. A reduction or other change in reimbursement from third parties could negatively affect our business.
Our products are purchased by hospitals, clinics, imaging centers and other users, which bill various third-party payers, such as government health programs, private health insurance plans, managed care organizations and other similar programs, for the healthcare goods and services provided to their patients. There are currently Current Procedural Terminology, or CPT, reimbursement codes that describe most of the diagnostic procedures that use our products. However, the amount of reimbursement from third-party payers varies by site of service and geographic location and is subject to change. Payers may deny reimbursement if they determine that a product used in a procedure was not used in accordance with established payer protocol regarding cost-effective treatment methods or was used for an unapproved indication. Third-party payers are increasingly challenging the prices charged for medical services and, in some instances, have put pressure on service providers to lower their prices or reduce their services. We are unable to predict what changes will be made in the reimbursement methods used by third-party healthcare payers. Third-party payers may not consider as cost effective the procedures in which our products are used. Reimbursement for such procedures may not be available or, if available, payers’ low reimbursement levels may adversely affect our ability to sell our products on a profitable basis. In addition, there have been and may continue to be changes and proposals by legislators, regulators and third-party payers to curb further these costs in the future. For example, the Deficit Reduction Act of 2005, or the DRA, which was signed into law on February 8, 2006, imposed caps on Medicare payment rates for certain imaging services, including MR and PET, furnished in physicians’ offices and other non-hospital based settings. Under the caps, payments for specified imaging services cannot exceed the hospital outpatient payment rates for these services. Enactment of the DRA appeared to significantly affect one segment of our customer base, the standalone imaging center, and also appeared to reduce demand for imaging products among other segments of our customer base. A failure by hospitals and other users of our products to obtain reimbursement from third-party payers, changes in third-party payers’ policies toward reimbursement for procedures using our products, or legislative action could have a material adverse effect on our business, financial condition and results of operations.
Healthcare reform may negatively impact our business.
The levels of revenue and profitability of medical technology companies may be affected by the efforts of government and third-party payers to contain or reduce the costs of healthcare through various means. In the United States, there has been, and we expect that there will continue to be, a number of federal, state and private proposals to control healthcare costs. These proposals include legislative, regulatory and other initiatives and may contain measures intended to control public and private spending on healthcare as well as to provide universal public access to the healthcare system. If enacted, these proposals may result in a substantial restructuring of the healthcare delivery system. For example, the Congressional Budget Office has issued a report suggesting that radiology benefit managers could require pre-authorization, which could decrease the demand for imaging services. Further, proposals during 2009 included a tax that would be assessed against medical device companies. If such a tax is enacted at
rates discussed at various times, the amount we would owe could be a significant portion of our cash flows from operations. Significant changes in the nation’s healthcare system could have a substantial impact on the manner in which we conduct business and could have a material adverse effect on our business, financial condition and results of operations.
Consolidation in the healthcare industry could lead to demands for price concessions or limit or eliminate our ability to sell to certain of our significant market segments.
The cost of healthcare has risen significantly over the past decade, and numerous initiatives and reforms initiated by legislators, regulators and third-party payers to curb these costs have resulted in a consolidation trend in the medical device industry, as well as among our customers, including healthcare providers. This consolidation has resulted in greater pricing pressures and limitations on our ability to sell to important market segments, as group purchasing organizations, independent delivery networks and large single accounts, such as the Veterans Administration in the United States, continue to consolidate purchasing decisions for some of our healthcare provider customers. We expect that market demand, government regulation, third-party reimbursement policies and societal pressures will continue to change the worldwide healthcare industry, resulting in further business consolidations and alliances which may exert further downward pressure on the prices of our products and adversely impact our business, financial condition and results of operations.
We may incur goodwill impairment charges that adversely affect our operating results.
We review goodwill for impairment annually and more frequently if events and circumstances indicate that the asset may be impaired and that the carrying value may not be recoverable. We operate as one reporting unit and therefore compare our book value to our market value (consisting of market capitalization plus a control premium of 25%). If the market value exceeds the book value, goodwill is generally considered not to be impaired.
Failure of the global economy to recover from the recent downturn, or an extended delay in this recovery, may adversely impact our ability to improve our financial results and grow our business.
We have been affected by the general decline in the global economy, which resulted in contracted capital spending by hospitals and lower interest rates on our cash and investments. Disruptions in the financial markets and the related economic downturn also negatively impacted customer purchasing and payment patterns. Failure of the global economy to recover from this prolonged downturn, or an extended delay in this recovery, may have a material adverse effect on our financial condition and results of operations.
We may issue shares of preferred stock without the consent of our holders of common stock, which could adversely affect the rights of the holders of our common stock.
Our Articles of Incorporation authorize our Board of Directors, without any action by the holders of our common stock, to establish the rights and preferences of up to 5,000,000 shares of currently undesignated preferred stock. These shares of preferred stock could possess voting and conversion rights that could adversely affect the voting power of the holders of the common stock or dilute their ownership rights, and it may have the effect of delaying, deferring or preventing a change in control of Vital Images. No shares of preferred stock or other senior equity securities are currently designated, and currently we have no plan to designate or issue any such securities.
We are subject to certain laws and plans which may discourage takeover attempts that could be beneficial for shareholders.
We are subject to anti-takeover provisions of the Minnesota Business Corporation Act. These provisions may deter or discourage takeover attempts and other changes in control that are not approved by our Board of Directors, and they may have a depressive effect on any market for our stock. As a result, our shareholders may lose opportunities to dispose of their shares at the higher prices typically available in takeover attempts or that may be available under a merger proposal. In addition, these provisions may have the effect of permitting our current directors to retain their positions and place them in a better position to resist changes that our shareholders may wish to make if they are dissatisfied with the conduct of our business.
We have never paid any cash dividends and this practice is expected to continue which means appreciation in our stock price will be our shareholders’ only opportunity to achieve a return on their investment in our common stock.
We have not paid cash dividends on our common stock in the past, and we do not intend to do so in the foreseeable future. Consequently, appreciation in the market price of our common stock and the ability to sell shares at a profit represents our shareholders’ only opportunity to achieve a return on their investment.
Item 1B. Unresolved Staff Comments
None.
Our principal office is located in an office building in Minnetonka, Minnesota, where we currently occupy approximately 72,000 square feet under a lease that expires January 31, 2012. We also lease small offices in Den Haag, the Netherlands, and Beijing, China, for our operations in those countries. We consider our current facilities adequate for our current needs.
We are involved in various claims and legal actions in the normal course of business. We are of the opinion that the outcome of such legal actions will not have a significant adverse effect on our financial position, results of operations or cash flows. Notwithstanding our belief, an unfavorable resolution of some or all of these matters could materially affect our future results of operations or cash flows.
Item 5. Market for Registrant’s Common Equity, Related Stockholder Matters and Issuer Purchases of Equity Securities
Vital Images, Inc.’s common stock is quoted on The NASDAQ Global Select Market under the symbol “VTAL.” The table below reflects the high and low per share sale prices of our common stock as reported by The NASDAQ Global Select Market for each of the periods indicated. Such prices reflect inter-dealer prices, do not include adjustments for retail mark-ups, markdowns or commissions, and may not necessarily represent actual transactions.
|
|
|
High |
|
Low |
|
||
|
2009 |
|
|
|
|
|
||
|
Fourth Quarter |
|
$ |
13.18 |
|
$ |
11.35 |
|
|
Third Quarter |
|
$ |
13.75 |
|
$ |
10.19 |
|
|
Second Quarter |
|
$ |
12.25 |
|
$ |
9.64 |
|
|
First Quarter |
|
$ |
14.29 |
|
$ |
8.54 |
|
|
|
|
|
|
|
|
||
|
2008 |
|
|
|
|
|
||
|
Fourth Quarter |
|
$ |
15.24 |
|
$ |
10.23 |
|
|
Third Quarter |
|
$ |
16.95 |
|
$ |
11.86 |
|
|
Second Quarter |
|
$ |
17.13 |
|
$ |
12.43 |
|
|
First Quarter |
|
$ |
18.72 |
|
$ |
13.89 |
|
We have never paid or declared any cash dividends on our common stock and do not intend to pay dividends on our common stock in the foreseeable future. We expect to retain our future anticipated earnings to finance development and expansion of our business. As of February 28, 2010, there were approximately 5,900 beneficial owners and approximately 500 registered holders of record of our common stock.
On May 8, 2008, we announced a share repurchase program of up to $25.0 million of our common stock. On August 7, 2008, we announced additional repurchases of up to $15.0 million of our common stock. On March 3, 2009, we announced additional repurchases of up to 1.0 million shares of our common stock. As of December 31, 2009, we had purchased 3.3 million shares of our common stock for $44.3 million through only open market transactions. The active share repurchase program expires on March 1, 2011.
The following table presents information with respect to purchases of our common stock made during the quarter ended December 31, 2009 by us or our “affiliated purchaser,” as defined in Rule 10b-18(a)(3) under the Securities Exchange Act of 1934.
|
Period |
|
Total Number |
|
Average |
|
Total Number of |
|
Maximum Number of |
|
|
October 1-31, 2009 |
|
— |
|
N/A |
|
— |
|
587,608 |
|
|
November 1-30, 2009 |
|
— |
|
N/A |
|
— |
|
587,608 |
|
|
December 1-31, 2009 |
|
— |
|
N/A |
|
— |
|
587,608 |
|
|
|
|
— |
|
N/A |
|
— |
|
587,608 |
|
Performance Graph
Since April 24, 2007, our common stock has been quoted on The NASDAQ Global Select Market. From June 9, 2003 through April 23, 2007, our stock was quoted on The NASDAQ Global Market. From September 29, 2000 through June 6, 2003, our common stock was quoted on The NASDAQ SmallCap Market (now known as The NASDAQ Capital Market). The following graph shows changes during the period from December 31, 2004 to
December 31, 2009 in the value of $100 invested in: (1) Vital Images, Inc.’s common stock; (2) the Total Return Index for The NASDAQ Composite; and (3) NASDAQ Non-Financial Stocks. The values of each investment as of the dates indicated are based on share prices plus any dividends paid in cash, with the dividends reinvested on the date they were paid. The calculations exclude trading commissions and taxes.
Notwithstanding anything to the contrary set forth in any of our previous or future filings under the Securities Act of 1933 or the Securities Exchange Act of 1934 that might incorporate future filings by reference, including this Annual Report on Form 10-K, in whole or in part, the following performance graph shall not be deemed to be incorporated by reference into any such filings and shall not otherwise be deemed filed under such acts.
COMPARISON OF 5 YEAR CUMULATIVE TOTAL RETURN*
Among Vital Images, Inc., The NASDAQ Composite Index
And The NASDAQ Non-Financial Index
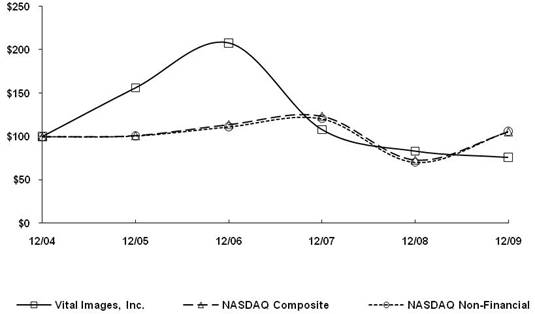
*$100 invested on 12/31/04 in stock or index, including reinvestment of dividends.
Fiscal year ending December 31.
|
|
|
12/31/04 |
|
12/31/05 |
|
12/31/06 |
|
12/31/07 |
|
12/31/08 |
|
12/31/09 |
|
||||||
|
Vital Images, Inc. |
|
$ |
100.00 |
|
$ |
156.12 |
|
$ |
207.76 |
|
$ |
107.88 |
|
$ |
83.04 |
|
$ |
75.76 |
|
|
NASDAQ Composite |
|
$ |
100.00 |
|
$ |
101.33 |
|
$ |
114.01 |
|
$ |
123.71 |
|
$ |
73.11 |
|
$ |
105.61 |
|
|
NASDAQ Non-Financial |
|
$ |
100.00 |
|
$ |
100.95 |
|
$ |
111.39 |
|
$ |
120.56 |
|
$ |
70.46 |
|
$ |
105.88 |
|
Item 6. Selected Financial Data (in thousands, except per share data)
|
|
|
2009 (1) |
|
2008 (1) |
|
2007 (1) |
|
2006 (1) |
|
2005 (1) |
|
|||||
|
Years ended December 31: |
|
|
|
|
|
|
|
|
|
|
|
|||||
|
Revenue |
|
$ |
58,230 |
|
$ |
68,141 |
|
$ |
70,176 |
|
$ |
70,512 |
|
$ |
51,717 |
|
|
Gross profit |
|
44,025 |
|
52,268 |
|
54,587 |
|
56,302 |
|
40,157 |
|
|||||
|
|
|
|
|
|
|
|
|
|
|
|
|
|||||
|
Operating expenses |
|
52,036 |
(2) |
62,093 |
(4) |
61,755 |
(5) |
49,371 |
|
32,592 |
(6) |
|||||
|
Operating (loss) income |
|
(8,011 |
) |
(9,825 |
) |
(7,168 |
) |
6,931 |
|
7,565 |
|
|||||
|
|
|
|
|
|
|
|
|
|
|
|
|
|||||
|
Net (loss) income |
|
$ |
(21,252 |
)(3) |
$ |
(2,800 |
) |
$ |
1,367 |
|
$ |
6,583 |
|
$ |
5,801 |
|
|
|
|
|
|
|
|
|
|
|
|
|
|
|||||
|
Net (loss) income per share-basic |
|
$ |
(1.48 |
) |
$ |
(0.17 |
) |
$ |
0.08 |
|
$ |
0.49 |
|
$ |
0.47 |
|
|
|
|
|
|
|
|
|
|
|
|
|
|
|||||
|
Weighted average common shares |
|
14,315 |
|
16,155 |
|
16,972 |
|
13,463 |
|
12,379 |
|
|||||
|
|
|
|
|
|
|
|
|
|
|
|
|
|||||
|
Net income per share-diluted |
|
$ |
(1.48 |
) |
$ |
(0.17 |
) |
$ |
0.08 |
|
$ |
0.46 |
|
$ |
0.44 |
|
|
|
|
|
|
|
|
|
|
|
|
|
|
|||||
|
Weighted average common shares |
|
14,315 |
|
16,155 |
|
17,457 |
|
14,259 |
|
13,283 |
|
|||||
|
|
|
|
|
|
|
|
|
|
|
|
|
|||||
|
At December 31: |
|
|
|
|
|
|
|
|
|
|
|
|||||
|
Working capital |
|
$ |
121,034 |
|
$ |
135,417 |
|
$ |
173,905 |
|
$ |
162,202 |
|
$ |
45,604 |
|
|
Total assets |
|
$ |
172,062 |
|
$ |
198,193 |
|
$ |
230,996 |
|
$ |
219,730 |
|
$ |
91,151 |
|
|
Long-term debt |
|
$ |
— |
|
$ |
— |
|
$ |
— |
|
$ |
— |
|
$ |
— |
|
|
Total stockholders’ equity |
|
$ |
146,722 |
|
$ |
168,691 |
|
$ |
202,216 |
|
$ |
190,902 |
|
$ |
68,789 |
|
(1) Includes equity-based compensation of $3,867, $5,007, $5,987, $5,063 and $335 for the fiscal years 2009, 2008, 2007, 2006 and 2005, respectively.
(2) Includes a $3,147 asset impairment charge related to the implementation of the Company’s enterprise resource planning system in the second quarter of 2009.
(3) Includes a $14,964 non-cash charge to the provision for income taxes to establish a full valuation allowance against the Company’s deferred tax assets in the second quarter of 2009.
(4) Includes a $660 restructuring charge related to a reduction in workforce of approximately 11% in November 2008.
(5) Includes an $885 charge related to the separation of Jay D. Miller, our former Chief Executive Officer, in the fourth quarter of 2007.
(6) Includes a loss on operating lease of $493 related to the relocation of our corporate headquarters in the first quarter of 2005.
Item 7. Management’s Discussion and Analysis of Financial Condition and Results of Operations
Executive summary
The financial results for Vital Images, Inc. (also referred to as “we”, “us” and “our”) have continued to be affected by the general decline in the U.S. economy, which has resulted in contracted capital spending by U.S. hospitals and lower interest rates on our cash and investments. Additionally, we have been impacted by weakness in the high-end computed tomography, or CT, and picture archiving and communication systems, or PACS, markets. We mitigated these negative factors through significant cost-control measures, while continuing to make strategic investments. Vital Images, Inc. summary 2009 results were as follows:
· Total revenue of $58.2 million, compared to $68.1 million for 2008 and $70.2 million for 2007.
· Gross margin of 75.6%, compared to 76.7% for 2008 and 77.8% for 2007.
· Operating expenses of $52.0 million, compared to $62.1 million for 2008 and $61.8 million for 2007.
· Operating loss of $8.0 million, compared to $9.8 million for 2008 and $7.2 million for 2007.
· Interest income of $1.1 million, compared to $4.6 million for 2008 and $8.9 million for 2007. A decline in interest rates resulted in a 0.8% return on investment in 2009, compared to 2.9% and 5.1% return on investments in 2008 and 2007, respectively.
· Net loss of $21.3 million, or $(1.48) loss per diluted share, compared to net loss of $2.8 million, or $(0.17) loss per diluted share, for 2008 and net income of $1.4 million, or $0.08 per diluted share, for 2007. The net loss for 2009 included $18.1 million of non-cash charges representing $(1.27) per diluted share.
Total cash, cash equivalents and marketable securities were $142.2 million as of December 31, 2009, compared to $147.0 million as of December 31, 2008. Working capital (defined as current assets less current liabilities) was $121.0 million as of December 31, 2009, compared to $135.4 million as of December 31, 2008. The decrease in cash, cash equivalents and marketable securities during 2009 was primarily the result of repurchases of our common stock totaling $6.1 million under share repurchase programs authorized by our Board of Directors in 2008 and 2009. The decrease in working capital during 2009 was primarily the result of purchases of noncurrent marketable securities, the balance of which increased $12.2 million during 2009.
Overview
We are a leading provider of advanced visualization and analysis solutions for use by medical professionals in clinical analysis and therapy planning for medical conditions. We provide software, customer education, software maintenance and support, professional services and, on occasion, third-party hardware to our customers. Our technology rapidly transforms complex data generated by diagnostic imaging equipment into functional digital images that can be manipulated and analyzed using our specialized applications to better understand internal anatomy and pathology. Our solutions are designed to improve physician workflow and productivity, enhance the ability to make clinical decisions, facilitate less invasive patient care, and complement often significant capital investments in diagnostic imaging equipment made by our customers. Our software is compatible with equipment from all major manufacturers of diagnostic imaging equipment, such as CT scanners, and can be integrated into PACS. Many hospitals use PACS to acquire, distribute and archive medical images and diagnostic reports, reducing the need for film and increasing reliance on advanced visualization solutions such as ours. We also offer a Web-based solution that provides physicians with anywhere, anytime access to medical images and visualization tools through any Internet-enabled computer.
We operate and manage our business as a single business segment — the development and marketing of software and related services for advanced visualization and analysis solutions for use by medical professionals in clinical analysis and therapy planning. We market our products and services through a direct sales force, resellers and independent distributors in the United States and in international markets. Our common stock is currently traded on The NASDAQ Global Select Market under the symbol “VTAL.”
Critical accounting policies and estimates
Our discussion and analysis of financial condition and results of operations are based upon our Consolidated Financial Statements, which have been prepared in accordance with accounting principles generally accepted in the United States of America. The notes to the Consolidated Financial Statements contained in this Annual Report
describe our significant accounting policies used in the preparation of the Consolidated Financial Statements. The preparation of these financial statements requires us to make estimates and assumptions that affect the reported amounts of assets and liabilities and disclosure of contingent assets and liabilities at the date of the financial statements and the reported amounts of revenues and expenses during the reporting periods. Actual results could differ from those estimates. We continually evaluate our critical accounting policies and estimates.
We believe the critical accounting policies listed below reflect significant judgments, estimates and assumptions used in the preparation of our Consolidated Financial Statements.
Allowance for doubtful accounts
We maintain an allowance for doubtful accounts in an amount estimated to be sufficient to provide adequate protection against losses resulting from extending credit to our customers. In judging the adequacy of the allowance for doubtful accounts, we consider multiple factors, including historical bad debt experience, the general economic environment, the need for specific client reserves and the aging of our outstanding receivables. A portion of this provision is included in operating expenses as a general and administrative expense and a portion of this provision is included as a reduction of license revenue. A considerable amount of judgment is required in assessing these factors. If the factors utilized in determining the allowance do not reflect future performance, then a change in the allowance for doubtful accounts would be necessary in the period such determination has been made, which would impact future results of operations. As of December 31, 2009, the allowance for doubtful accounts was $736,000 for gross accounts receivable of $12.9 million.
Deferred taxes
Significant judgment is required in determining the realizability of our deferred tax assets. We must assess the likelihood that our net deferred tax assets will be recovered from future taxable income, and to the extent we believe that recovery is not likely, we must establish a valuation allowance. Considerations for determining the realizability of our deferred tax assets primarily involve cumulative pre-tax income for financial reporting purposes, cumulative taxable income for the past three years, estimated future pre-tax income for financial reporting purposes and estimated future taxable income from our core business. We also consider the expiration dates and amounts of net operating loss carryforwards and other tax credits, and estimate the impact of future tax deductions from the exercise of stock options. These estimates are projected through the life of the related deferred tax assets based on assumptions which we believe to be reasonable and consistent with current operating results. After giving consideration to the above factors, during the three months ended June 30, 2009, we recorded a non-cash charge of $15.0 million to the provision for income taxes to establish a full valuation allowance against our deferred tax assets. If pretax results improve in future periods, we may be able to utilize the deferred tax assets to reduce tax payments.
Goodwill
We account for goodwill in accordance with the provisions of Accounting Standards Codification (ASC) Topic 350, Intangibles — Goodwill and Other. Under this accounting guidance, goodwill and intangible assets with indefinite lives are reviewed for impairment annually or more frequently if events or changes in circumstances indicate that the asset might be impaired. The first step of the goodwill impairment test, used to identify potential impairment, compares the fair value of a reporting unit with its carrying amount, including goodwill. We operate as one reporting unit and therefore compare the book value to the market value (consisting of market capitalization plus a control premium of 25%). As of December 31, 2009, we had 14.3 million shares outstanding, a closing stock price of $12.69 per share, a market value of $227.3 million, and a book value of $146.7 million, which would indicate that our goodwill of $9.1 million was not impaired. If the market value exceeds the book value, goodwill is considered not impaired, and thus the second step of the impairment test is not necessary. If our book value exceeds the market value, the second step of the goodwill impairment test is performed to measure the amount of impairment loss, if any. The second step of the goodwill impairment test, used to measure the amount of impairment loss, compares the implied fair value of the goodwill with the book value of the goodwill. If the carrying value of the goodwill exceeds the implied fair value of the goodwill, an impairment loss would be recognized in an amount equal to the excess. If market conditions continue to fluctuate, we may incur goodwill impairment charges that adversely affect our financial position and operating results.
Revenue Recognition
We follow specific and detailed guidelines in determining the proper amount of revenue to be recorded; however, certain judgments affect the application of our revenue recognition policy.
We recognize revenue in accordance with ASC Topic 985, Revenue Recognition. We recognize revenue when it is realized or realizable and earned. We consider revenue realized or realizable and earned when we have persuasive evidence of an arrangement, the product has been shipped or the services have been provided to the customer, the sales price is fixed or determinable, and collectability is probable.
Revenue results are difficult to predict, and any shortfall in revenue or delay in recognizing revenue could cause our operating results to vary significantly from period to period. The significant judgments for revenue recognition typically involve whether collectability can be considered probable and whether fees are fixed or determinable. Significant judgment is also required when evaluating and assessing revenue recognition relating to our distribution agreements with original equipment manufacturers, value-added resellers and independent distributors (collectively, “Resellers”). In addition, our transactions often consist of multiple element arrangements, which must be analyzed to determine the fair value of each element, the amount of revenue to be recognized upon shipment, if any, and the period and conditions under which deferred revenue should be recognized. As a result, if facts and circumstances change that affect our current judgments, our revenue could be materially different in the future.
Equity-based compensation
We recognize equity-based compensation expense under the fair value recognition provisions of ASC Topic 718, Compensation — Stock Compensation. We recognize equity-based compensation net of an estimated forfeiture rate and recognize compensation cost only for those shares expected to vest over the requisite service period of the award.
The fair value of each option award is estimated as of the date of grant using the Black-Scholes option valuation model. The Black-Scholes option valuation model requires the development of assumptions that are input into the model. These assumptions are the expected stock volatility, the risk-free interest rate, the option’s expected life and the dividend yield on the underlying stock. Expected volatility is calculated based on the historical volatility of our common stock over the expected option life and other appropriate factors. Risk-free interest rates are calculated based on continuously compounded U.S. Treasury risk-free rates for the appropriate term. Prior to March 9, 2006, the expected life of stock options was calculated by performing a detailed analysis of all historical stock option information available. On March 9, 2006, we began to grant options with a five-year legal life instead of the eight-year legal life that had historically been used. As a result, we elected to use the “simplified” method, to estimate the expected life of options granted on and after March 9, 2006. We will utilize the simplified method until sufficient historical information becomes available on the five-year legal life options. The dividend yield is assumed to be zero, as we have never paid or declared any cash dividends on our common stock and do not intend to pay dividends on our common stock in the foreseeable future. The expected forfeiture rate is estimated based on historical experience.
Determining the appropriate fair value model and calculating the fair value of equity-based payment awards require the input of the subjective assumptions described above. The assumptions used in calculating the fair value of equity-based payment awards represent management’s best estimates, which involve inherent uncertainties and the application of management judgment. As a result, if factors change and we use different assumptions, our equity-based compensation expense could be materially different in the future. In addition, we are required to estimate the expected forfeiture rate and recognize expense only for those shares expected to vest. If our actual forfeiture rate is materially different from our estimate, the equity-based compensation expense could be significantly different from what we have recorded in the current period. See Note 2 to the Consolidated Financial Statements for a further discussion of equity-based compensation.
Table of Contents
Results of Operations
The following table sets forth information from our Statements of Operations, expressed as a percentage of total revenue.
|
|
|
For the Year Ended December 31, |
|
||||
|
|
|
2009 |
|
2008 |
|
2007 |
|
|
|
|
|
|
|
|
|
|
|
Revenue: |
|
|
|
|
|
|
|
|
License fees |
|
39.1 |
% |
50.3 |
% |
56.5 |
% |
|
Maintenance and services |
|
57.9 |
|
47.6 |
|
42.0 |
|
|
Hardware |
|
3.0 |
|
2.1 |
|
1.5 |
|
|
Total revenue |
|
100.0 |
|
100.0 |
|
100.0 |
|
|
|
|
|
|
|
|
|
|
|
Cost of revenue: |
|
|
|
|
|
|
|
|
License fees |
|
5.7 |
|
7.2 |
|
6.7 |
|
|
Maintenance and services |
|
15.9 |
|
14.8 |
|
14.2 |
|
|
Hardware |
|
2.8 |
|
1.3 |
|
1.0 |
|
|
Impairment of patent |
|
— |
|
— |
|
0.3 |
|
|
Total cost of revenue |
|
24.4 |
|
23.3 |
|
22.2 |
|
|
|
|
|
|
|
|
|
|
|
Gross profit |
|
75.6 |
|
76.7 |
|
77.8 |
|
|
|
|
|
|
|
|
|
|
|
Operating expenses: |
|
|
|
|
|
|
|
|
Sales and marketing |
|
38.8 |
|
40.8 |
|
42.0 |
|
|
Research and development |
|
28.1 |
|
29.9 |
|
26.3 |
|
|
General and administrative |
|
17.1 |
|
19.4 |
|
19.7 |
|
|
Asset impairment |
|
5.4 |
|
— |
|
— |
|
|
Restructuring charge |
|
— |
|
1.0 |
|
— |
|
|
Total operating expenses |
|
89.4 |
|
91.1 |
|
88.0 |
|
|
|
|
|
|
|
|
|
|
|
Operating (loss) income |
|
(13.8 |
) |
(14.4 |
) |
(10.2 |
) |
|
|
|
|
|
|
|
|
|
|
Interest income |
|
1.9 |
|
6.8 |
|
12.6 |
|
|
(Loss) income before income taxes |
|
(11.9 |
) |
(7.6 |
) |
2.4 |
|
|
|
|
|
|
|
|
|
|
|
(Benefit) provision for income taxes |
|
24.6 |
|
(3.5 |
) |
0.5 |
|
|
|
|
|
|
|
|
|
|
|
Net (loss) income |
|
(36.5 |
)% |
(4.1 |
)% |
1.9 |
% |
Revenue (dollars in thousands)
|
|
|
For the Year Ended December 31, |
|
Increase (Decrease) |
|
Percent Increase (Decrease) |
|
|||||||||||||
|
|
|
2009 |
|
2008 |
|
2007 |
|
2008 to 2009 |
|
2007 to 2008 |
|
2008 to 2009 |
|
2007 to 2008 |
|
|||||
|
Revenues: |
|
|
|
|
|
|
|
|
|
|
|
|
|
|
|
|||||
|
License fees |
|
$ |
22,766 |
|
$ |
34,290 |
|
$ |
39,673 |
|
$ |
(11,524 |
) |
$ |
(5,383 |
) |
(34 |
)% |
(14 |
)% |
|
Maintenance and services |
|
33,717 |
|
32,436 |
|
29,487 |
|
1,281 |
|
2,949 |
|
4 |
% |
10 |
% |
|||||
|
Hardware |
|
1,747 |
|
1,415 |
|
1,016 |
|
332 |
|
399 |
|
23 |
% |
39 |
% |
|||||
|
Total revenue |
|
$ |
58,230 |
|
$ |
68,141 |
|
$ |
70,176 |
|
$ |
(9,911 |
) |
$ |
(2,035 |
) |
(15 |
)% |
(3 |
)% |
License fee revenue (dollars in thousands)
The following table sets forth information on license fee revenue by source:
|
|
|
For the Year Ended December 31, |
|
Increase (Decrease) |
|
Percent Increase |
|
|||||||||||||
|
|
|
2009 |
|
2008 |
|
2007 |
|
2008 to |
|
2007 to |
|
2008 to |
|
2007 to |
|
|||||
|
License fee revenue: |
|
|
|
|
|
|
|
|
|
|
|
|
|
|
|
|||||
|
Direct and other distributors |
|
$ |
4,493 |
|
$ |
11,014 |
|
$ |
17,532 |
|
$ |
(6,521 |
) |
$ |
(6,518 |
) |
(59 |
)% |
(37 |
)% |
|
Toshiba |
|
18,273 |
|
23,276 |
|
22,141 |
|
(5,003 |
) |
1,135 |
|
(21 |
)% |
5 |
% |
|||||
|
Total license fees |
|
$ |
22,766 |
|
$ |
34,290 |
|
$ |
39,673 |
|
(11,524 |
) |
(5,383 |
) |
(34 |
)% |
(14 |
)% |
||
|
|
|
|
|
|
|
|
|
|
|
|
|
|
|
|
|
|||||
|
Percent of license fee revenue: |
|
|
|
|
|
|
|
|
|
|
|
|
|
|
|
|||||
|
Direct and other distributors |
|
20 |
% |
32 |
% |
44 |
% |
|
|
|
|
|
|
|
|
|||||
|
Toshiba |
|
80 |
|
68 |
|
56 |
|
|
|
|
|
|
|
|
|
|||||
|
Total license fee revenue |
|
100 |
% |
100 |
% |
100 |
% |
|
|
|
|
|
|
|
|
|||||
The decreases in license fee revenue for 2009 and 2008, compared to 2008 and 2007, respectively, were driven by the general decline in the U.S. economy starting in 2008 and continuing through 2009, which resulted in increased pricing pressures and contracted capital spending by U.S. hospitals.
Maintenance and services revenue (dollars in thousands)
|
|
|
For the Year Ended December 31, |
|
Increase (Decrease) |
|
Percent Increase |
|
|||||||||||||
|
|
|
2009 |
|
2008 |
|
2007 |
|
2008 to |
|
2007 to |
|
2008 to 2009 |
|
2007 to 2008 |
|
|||||
|
Maintenance and services revenue: |
|
|
|
|
|
|
|
|
|
|
|
|
|
|
|
|||||
|
Maintenance and support |
|
$ |
28,792 |
|
$ |
26,656 |
|
$ |
22,811 |
|
$ |
2,136 |
|
$ |
3,845 |
|
8 |
% |
17 |
% |
|
Customer education |
|
3,511 |
|
4,478 |
|
5,590 |
|
(967 |
) |
(1,112 |
) |
(22 |
)% |
(20 |
)% |
|||||
|
Professional services |
|
1,414 |
|
1,302 |
|
1,086 |
|
112 |
|
216 |
|
9 |
% |
20 |
% |
|||||
|
Total maintenance and services |
|
$ |
33,717 |
|
$ |
32,436 |
|
$ |
29,487 |
|
$ |
1,281 |
|
$ |
2,949 |
|
4 |
% |
10 |
% |
In 2009 and 2008, maintenance and services revenue was positively impacted by sales of our products on an enterprise basis, as a larger percentage of each enterprise sale is allocated to maintenance and services revenue than has historically been allocated for sales of our products on a workstation basis, as enterprise sales carry higher maintenance and services pricing. As was the case in 2009 and 2008, we expect that in future periods, although sales of our enterprise offering will result in proportionately lower license revenue upon sale, we will benefit from a recurring revenue stream from maintenance and services contracts.
The increase in maintenance and support revenue in 2009, compared to 2008, was due to an increase in the number of customers on maintenance contracts resulting from additional license sales. The increase in maintenance and support revenue in 2008, compared to 2007, was primarily driven by an increase in the number of customers on maintenance contracts, resulting from both additional license sales and improvement in the percentage of our existing customers on maintenance contracts.
An overall decrease in the number of license sales in 2009 and 2008, as compared to 2008 and 2007, respectively, contributed to lower customer education revenue in both 2009 and 2008.
Professional services revenue, which includes installation and other implementation-related services, increased in 2009 and 2008, due to increases in professional services resulting from sales of our product on an enterprise basis and the timing of services provided.
Hardware revenue
Hardware revenue increased 23% to $1.7 million in 2009, compared to $1.4 million in 2008, which was a 39% increase from $1.0 million in 2007. Hardware revenue increased due to the increased sales of our product on an enterprise basis, for which our customers frequently purchase hardware from us. Sales of hardware systems are not core to our strategy and will fluctuate from period to period depending upon the needs of our customers.
Cost of revenue and gross profit
Gross profit decreased 16% to $44.0 million in 2009, compared to $52.3 million in 2008, which was a 4% decrease from $54.6 million in 2007. Gross margin percentage decreased slightly to 75.6% in 2009 from 76.7% in 2008 and 77.8% in 2007, due to pricing pressures on new license sales and a greater percentage of total revenue relating to maintenance and services, which carries lower margins than license fees.
A comparison of gross profit and gross margin by revenue category is as follows (dollars in thousands):
|
|
|
For the Year Ended December 31, |
|
Increase (Decrease) |
|
Percent Increase |
|
|||||||||||||
|
|
|
2009 |
|
2008 |
|
2007 |
|
2008 to 2009 |
|
2007 to 2008 |
|
2008 to |
|
2007 to |
|
|||||
|
Gross profit: |
|
|
|
|
|
|
|
|
|
|
|
|
|
|
|
|||||
|
License fees |
|
$ |
19,465 |
|
$ |
29,368 |
|
$ |
34,948 |
|
$ |
(9,903 |
) |
$ |
(5,580 |
) |
(34 |
)% |
(16 |
)% |
|
Maintenance and services |
|
24,435 |
|
22,347 |
|
19,559 |
|
2,088 |
|
2,788 |
|
9 |
% |
14 |
% |
|||||
|
Hardware |
|
125 |
|
553 |
|
322 |
|
(428 |
) |
231 |
|
(77 |
)% |
72 |
% |
|||||
|
Impairment of patent |
|
— |
|
— |
|
(242 |
) |
— |
|
242 |
|
— |
% |
(100 |
)% |
|||||
|
Total gross profit |
|
$ |
44,025 |
|
$ |
52,268 |
|
$ |
54,587 |
|
$ |
(8,243 |
) |
$ |
(2,319 |
) |
(16 |
)% |
(4 |
)% |
|
|
|
|
|
|
|
|
|
|
|
|
|
|
|
|
|
|||||
|
Gross margin: |
|
|
|
|
|
|
|
|
|
|
|
|
|
|
|
|||||
|
License fees |
|
85.5 |
% |
85.6 |
% |
88.1 |
% |
|
|
|
|
|
|
|
|
|||||
|
Maintenance and services |
|
72.5 |
% |
68.9 |
% |
66.3 |
% |
|
|
|
|
|
|
|
|
|||||
|
Hardware |
|
7.2 |
% |
39.0 |
% |
31.7 |
% |
|
|
|
|
|
|
|
|
|||||
|
Total gross margin |
|
75.6 |
% |
76.7 |
% |
77.8 |
% |
|
|
|
|
|
|
|
|
|||||
Fluctuations in license fee gross margin are generally a result of average sales prices, changes in the product mix, and the mix between direct sales and sales to distribution partners, as well as mix between domestic and international sales. License fee gross margin remained relatively flat in 2009, compared to 2008, as a decrease in amortization expense was offset by pricing pressures and an increase, as a percent of total revenue, in sales through our distribution partners, which have lower margins. License fee gross margin decreased in 2008, compared to 2007, due to an increase in revenue, as a percent of total revenue, from international sales through our distribution partners, which typically have lower margins than U.S. direct sales.
Maintenance and services gross margin increased during 2009 and 2008, compared to 2008 and 2007, respectively, as a larger percentage of each enterprise sale is allocated to maintenance and services revenue than has historically been allocated for sales of our products on a workstation basis, as enterprise sales carry higher maintenance and services pricing, without a corresponding increase in costs. In addition, in 2009 and 2008, we recognized benefits of $552,000 and $391,000, respectively, to maintenance and support revenue arising from Toshiba billing adjustments. We will continue to invest in our customer education, installation, professional services and customer support areas in the future to adequately support our growing installed base of customers. We had 51, 53 and 55 maintenance and services personnel as of December 31, 2009, 2008 and 2007, respectively.
Gross margin for hardware decreased in 2009, compared to 2008, and increased in 2008, compared to 2007. Variances in gross margin for hardware are expected, as hardware sales are not a substantial part of the sales strategy.
During the third quarter 2007, we recognized a $242,000 patent impairment charge related to a patent application acquired in the HInnovation, Inc. acquisition in February 2004. This patent application was rejected by the United States Patent and Trademark Office on August 23, 2007, and we decided not to pursue this application further. The impairment was recorded as a separate item in cost of revenue, and it is included in the total gross margin percentage above.
Operating expenses
The following is a comparison of operating expenses as a percent of revenue as well as the percent increase or decrease in the total expense:
|
|
|
Percent of Revenue for the |
|
Percent Increase (Decrease) |
|
||||||
|
|
|
2009 |
|
2008 |
|
2007 |
|
2008 to 2009 |
|
2007 to 2008 |
|
|
Operating expenses: |
|
|
|
|
|
|
|
|
|
|
|
|
Sales and marketing |
|
38.8 |
% |
40.8 |
% |
42.0 |
% |
(19 |
)% |
(6 |
)% |
|
Research and development |
|
28.1 |
|
29.9 |
|
26.3 |
|
(20 |
)% |
10 |
% |
|
General and administrative |
|
17.1 |
|
19.4 |
|
19.7 |
|
(25 |
)% |
(4 |
)% |
|
Asset impairment |
|
5.4 |
|
— |
|
— |
|
100 |
% |
— |
% |
|
Restructuring charge |
|
— |
|
1.0 |
|
— |
|
(100 |
)% |
100 |
% |
|
Total operating expenses |
|
89.4 |
% |
91.1 |
% |
88.0 |
% |
(16 |
)% |
1 |
% |
Sales and marketing
Sales and marketing expenses were as follows (dollars in thousands):
|
|
|
For the Year Ended |
|
Increase (Decrease) |
|
Percent Increase |
|
|||||||||||||
|
|
|
2009 |
|
2008 |
|
2007 |
|
2008 to 2009 |
|
2007 to 2008 |
|
2008 to |
|
2007 to |
|
|||||
|
Salaries, benefits and bonus |
|
$ |
8,841 |
|
$ |
10,590 |
|
$ |
9,982 |
|
$ |
(1,749 |
) |
$ |
608 |
|
(17 |
)% |
6 |
% |
|
Overhead and other expenses |
|
3,558 |
|
4,050 |
|
4,306 |
|
(492 |
) |
(256 |
) |
(12 |
)% |
(6 |
)% |
|||||
|
Commissions |
|
2,050 |
|
3,588 |
|
4,634 |
|
(1,538 |
) |
(1,046 |
) |
(43 |
)% |
(23 |
)% |
|||||
|
Travel, meals and entertainment |
|
2,424 |
|
3,319 |
|
3,450 |
|
(895 |
) |
(131 |
) |
(27 |
)% |
(4 |
)% |
|||||
|
Trade shows and advertising |
|
2,839 |
|
3,422 |
|
3,612 |
|
(583 |
) |
(190 |
) |
(17 |
)% |
(5 |
)% |
|||||
|
Depreciation |
|
1,624 |
|
1,601 |
|
1,311 |
|
23 |
|
290 |
|
1 |
% |
22 |
% |
|||||
|
Equity-based compensation |
|
1,243 |
|
1,265 |
|
2,186 |
|
(22 |
) |
(921 |
) |
(2 |
)% |
(42 |
)% |
|||||
|
Total |
|
$ |
22,579 |
|
$ |
27,835 |
|
$ |
29,481 |
|
$ |
(5,256 |
) |
$ |
(1,646 |
) |
(19 |
)% |
(6 |
)% |
The decrease in salaries and benefits costs in 2009, compared to 2008, resulted from decreased average annual headcount. The decrease in commissions expense in 2009, compared to 2008, was due to a decreased amount of direct sales. The decrease in other expense categories in 2009, compared to 2008, was primarily due to decreased headcount and other broad-based cost control measures.
The decrease in expenses in 2008 compared to 2007 was due primarily to a decrease in commission expense related to the decrease in revenue and a decrease in equity-based compensation resulting from issuing equity awards at a lower exercise price, as well as significant cancellations of equity awards resulting from organizational changes.
We had 70, 69 and 89 sales and marketing personnel as of December 31, 2009, 2008 and 2007, respectively. The decrease in headcount as of December 31, 2008 was due primarily to the November 2008 reduction in force described in “Restructuring charge.”
Research and development
Research and development expenses were as follows (dollars in thousands):
|
|
|
For the Year Ended |
|
Increase (Decrease) |
|
Percent Increase |
|
|||||||||||||
|
|
|
2009 |
|
2008 |
|
2007 |
|
2008 to 2009 |
|
2007 to 2008 |
|
2008 to |
|
2007 to |
|
|||||
|
Salaries, benefits and bonus |
|
$ |
11,814 |
|
$ |
13,024 |
|
$ |
12,483 |
|
$ |
(1,210 |
) |
$ |
541 |
|
(9 |
)% |
4 |
% |
|
Overhead and other expenses |
|
3,535 |
|
3,607 |
|
3,406 |
|
(72 |
) |
201 |
|
(2 |
)% |
6 |
% |
|||||
|
Equity-based compensation |
|
945 |
|
1,179 |
|
949 |
|
(234 |
) |
230 |
|
(20 |
)% |
24 |
% |
|||||
|
Depreciation |
|
869 |
|
1,044 |
|
1,140 |
|
(175 |
) |
(96 |
) |
(17 |
)% |
(8 |
)% |
|||||
|
Consulting |
|
307 |
|
1,501 |
|
498 |
|
(1,194 |
) |
1,003 |
|
(80 |
)% |
201 |
% |
|||||
|
Development reimbursement |
|
(1,138 |
) |
— |
|
— |
|
(1,138 |
) |
— |
|
100 |
% |
— |
% |
|||||
|
Total |
|
$ |
16,332 |
|
$ |
20,355 |
|
$ |
18,476 |
|
$ |
(4,023 |
) |
$ |
1,879 |
|
(20 |
)% |
10 |
% |
The decrease in research and development expenses in 2009, compared to 2008, was due to reduced headcount resulting from our November 2008 reduction in force, lower utilization of consultants and other cost control measures. Additionally, during the 2009 first quarter, we entered into a development agreement with Toshiba, under which Toshiba provides funding in support of our research and development efforts, and the parties work collaboratively to develop and deliver innovative technology advancements for Toshiba’s medical equipment and our advanced visualization software solutions. In 2009, we recognized a credit of $1.1 million to our research and development expenses for reimbursement from Toshiba for development costs we incurred under the co-development agreement. The decrease in other expense categories in 2009, compared to 2008, was primarily due to decreased headcount and other broad-based cost control measures.
The major driver of higher research and development expenses in 2008 was new product initiatives, resulting in increased consulting expense and increased compensation expense due to higher average headcount in 2008 compared to 2007.
We had 87, 114 and 134 research and development personnel as of December 31, 2009, 2008 and 2007, respectively. The decrease in headcount as of December 31, 2009, was due primarily to the termination of 20 employees in our Beijing office in August 2009 in conjunction with our decision to discontinue test and product development activities in Beijing. The decrease in headcount as of December 31, 2008 was due primarily to the reduction in force described in “Restructuring charge.”
General and administrative
General and administrative expenses were as follows (dollars in thousands):
|
|
|
For the Year Ended |
|
Increase (Decrease) |
|
Percent Increase |
|
|||||||||||||
|
|
|
2009 |
|
2008 |
|
2007 |
|
2008 to 2009 |
|
2007 to 2008 |
|
2008 to |
|
2007 to |
|
|||||
|
Salaries, benefits and bonus |
|
$ |
4,582 |
|
$ |
4,583 |
|
$ |
5,211 |
|
$ |
(1 |
) |
$ |
(628 |
) |
(0 |
)% |
(12 |
)% |
|
Overhead and other expenses |
|
2,355 |
|
3,335 |
|
2,943 |
|
(980 |
) |
392 |
|
(29 |
)% |
13 |
% |
|||||
|
Professional and consulting services |
|
1,685 |
|
3,095 |
|
3,181 |
|
(1,410 |
) |
(86 |
) |
(46 |
)% |
(3 |
)% |
|||||
|
Equity-based compensation |
|
1,356 |
|
2,230 |
|
2,463 |
|
(874 |
) |
(233 |
) |
(39 |
)% |
(9 |
)% |
|||||
|
Total |
|
$ |
9,978 |
|
$ |
13,243 |
|
$ |
13,798 |
|
$ |
(3,265 |
) |
$ |
(555 |
) |
(25 |
)% |
(4 |
)% |
The decrease in general and administrative expenses in 2009, compared to 2008, was due in part to a lower utilization of consultants and reduced headcount resulting from the November 2008 reduction in force. Equity-based compensation decreased in 2009, compared to 2008, as previously issued equity awards became fully vested and as headcount decreased. The decrease in other expense categories in 2009, compared to 2008, was primarily due to decreased headcount and other broad-based cost control measures.
Salaries, benefits and bonus and equity-based compensation decreased for 2008, compared to 2007, as 2007 included an $885,000 pre-tax charge related to the separation of our former Chief Executive Officer. Of this charge,
$580,000 is included in salaries, benefits and bonus and $305,000 is included in equity-based compensation for 2007. Overhead expenses increased in 2008, compared to 2007, due to the increase in infrastructure.
We had 38, 44 and 49 general and administrative personnel as of December 31, 2009, 2008 and 2007, respectively. Decreases in headcount were the result of our cost-control measures.
Asset impairment
In 2007, we began the implementation of an enterprise resource planning (“ERP”) system. The ERP system was intended to replace numerous disconnected business management software applications and link the data contained within these disconnected systems to enable better management of our business and derive more useful data for various business functions, such as sales, marketing, finance and customer support.
Phase 1 of the implementation, which related to the replacement of our general ledger, was completed in 2007. The related capitalized costs are being depreciated over seven years and, as of December 31, 2009, the net book value of Phase 1 was $626,000. Phase 2 of the implementation, which consisted of replacing our various customer relationship management and order processing systems, was put on hold in 2008 in conjunction with our cost-control efforts, and we did not capitalize any costs relating to Phase 2 subsequent to October 2008. During the three months ended June 30, 2009, we determined, in conjunction with continued cost-control measures, that we would not implement Phase 2. As a result, in 2009 we recognized an asset impairment charge of $3.1 million related to the Phase 2 implementation.
Restructuring charge
During 2008, we continued to experience the effects of the industry-wide slowdown in the high-end CT market and the Deficit Reduction Act that significantly impacted our 2007 results. Additionally, in 2008, we were impacted by the general decline in the U.S. economy, which resulted in contracted capital spending by U.S. hospitals and lower interest rates on our cash and investments. We reduced our workforce by approximately 11% under a plan announced in November 2008 in order to align our operations with the current market conditions and improve profitability in 2009 and beyond.
In connection with the reduction in workforce, we incurred certain charges in 2008 totaling $660,000, which were primarily comprised of employee severance and other termination costs. The following table summarizes 2009 and 2008 restructuring transactions and related liability balances (in thousands):
|
|
|
Severance and |
|
|
|
Balance at January 1, 2008 |
|
$ |
— |
|
|
Restructuring charges |
|
660 |
|
|
|
Payments |
|
(519 |
) |
|
|
Balance at December 31, 2008 |
|
141 |
|
|
|
Payments |
|
(141 |
) |
|
|
Balance at December 31, 2009 |
|
$ |
— |
|
Actions with respect to the above activities were completed in the fourth quarter of 2008, and we did not incur any significant additional charges in 2009 related to the restructuring plan announced in November 2008.
Interest income
We generated $1.1 million of interest income in 2009, compared to $4.6 million in 2008 and $8.9 million in 2007. A decline in interest rates resulted in a 0.8% return on investments in 2009, compared to a 2.9% and 5.1% return on investments in 2008 and 2007, respectively.
Interest income is significantly impacted by changes in interest rates. We do not anticipate a significant improvement in interest rates in 2010 compared to 2009 due to general market conditions; interest rate changes may have a significant impact on results.
Income taxes
During the three months ended June 30, 2009, we recorded a non-cash charge of $15.0 million to the provision for income taxes to establish a full valuation allowance against our deferred tax assets based on our assessment of cumulative pretax results in recent years and projections of cumulative pretax results in future periods.
During 2009, we recognized $194,000 in one-time tax benefits resulting from tax legislation, which enabled us to receive cash payment for the monetization of certain historic research and development tax credits. Also as a result of the legislation, we recognized a $248,000 one-time tax benefit related to the refund of certain alternative minimum tax payments in prior years.
For 2010, we anticipate a consolidated tax provision of approximately $20,000 per quarter relating entirely to foreign operations.
Liquidity and capital resources
The following table sets forth certain relevant measures of our liquidity and capital resources (in thousands):
|
|
|
As of December 31, |
|
||||
|
|
|
2009 |
|
2008 |
|
||
|
Cash and cash equivalents |
|
$ |
120,317 |
|
$ |
109,706 |
|
|
Marketable securities |
|
21,907 |
|
37,287 |
|
||
|
Cash, cash equivalents and marketable securities |
|
$ |
142,224 |
|
$ |
146,993 |
|
|
|
|
|
|
|
|
||
|
Working capital |
|
$ |
121,034 |
|
$ |
135,417 |
|
|
|
|
|
|
|
|
||
|
Debt |
|
$ |
— |
|
$ |
— |
|
The decrease in our cash, cash equivalents and marketable securities as of December 31, 2009, compared to December 31, 2008, was primarily the result of repurchases of our common stock totaling $6.1 million under share repurchase programs authorized by our Board of Directors in 2008 and 2009. The decrease in working capital during 2009 was primarily the result of purchases of noncurrent marketable securities, the balance of which increased $12.2 million during 2009.
We believe our existing cash and investments will satisfy our foreseeable working capital requirements for at least the next 12 months. Additionally, we believe our liquidity and strong balance sheet enable us to execute our repurchases of common stock while still investing in our enterprise solution and marketing strategy and remaining well positioned to pursue strategic acquisitions if and when they emerge.
We have investments in marketable securities that are classified and accounted for as available-for-sale. As of December 31, 2009, $9.7 million of our marketable securities mature within one year and the remaining $12.2 million of our marketable securities mature in 2011.
Summary of Cash Flows
A summary of cash flows is as follows (in thousands):
|
|
|
For the Year Ended December 31, |
|
|||||||
|
|
|
2009 |
|
2008 |
|
2007 |
|
|||
|
Cash provided by (used in) |
|
|
|
|
|
|
|
|||
|
Operating activities |
|
$ |
2,374 |
|
$ |
8,581 |
|
$ |
13,902 |
|
|
Investing activities |
|
12,668 |
|
(10,246 |
) |
(15,870 |
) |
|||
|
Financing activities |
|
(4,431 |
) |
(35,314 |
) |
4,271 |
|
|||
|
Net change in cash and cash equivalents |
|
$ |
10,611 |
|
$ |
(36,979 |
) |
$ |
2,303 |
|
Operating activities
Net cash provided by operating activities decreased $6.2 million to $2.4 million in 2009, compared to $8.6 million in 2008, due to an $18.4 million increase in net loss and a $7.3 million decrease from changes in operating assets and liabilities, offset by an $19.5 million increase in non-cash operating items. The $7.3 million decrease in net cash from changes in operating assets and liabilities was primarily due to decreased sales and expenses in 2009, compared to 2008, and to the timing of receipts and payments in the ordinary course of business. Cash provided by non-cash operating items increased by $19.5 million in 2009 to $27.2 million, compared to $7.6 million in 2008, primarily resulted from a $14.7 million decrease in deferred tax assets due to a $15.0 million valuation allowance recorded in the second quarter of 2009 and a $3.1 million asset impairment in the second quarter of 2009.
Net cash provided by operating activities decreased $5.3 million in 2008 to $8.6 million, compared to $13.9 million in 2007, due to a $4.2 million decrease in net income and a $1.9 million decrease in non-cash operating items, offset by a $791,000 increase due to the timing of other receipts and payments in the ordinary course of business.
Investing activities
Net cash provided by investing activities was $12.7 million in 2009, compared to cash used by investing activities of $10.2 million in 2008 and $15.9 million in 2007.
We used $21.7 million, $76.4 million and $60.0 million to purchase investments in marketable securities during 2009, 2008 and 2007, respectively. We realized $36.8 million, $71.6 million and $50.7 million of proceeds from maturities and sales of marketable securities during 2009, 2008 and 2007, respectively. As of December 31, 2009, the marketable securities consist of U.S. government obligations and corporate commercial obligations.
We used $2.3 million, $5.4 million and $6.6 million for purchases of property and equipment in 2009, 2008 and 2007, respectively. The purchases for all periods were principally to upgrade computer equipment and to purchase computer equipment for new personnel. Purchases for 2008 and 2007 also included costs related to expanding our facilities. Additionally, in 2007, we began the implementation of an enterprise resource planning (“ERP”) system. We continued implementation of the ERP during 2008 and 2009, though we recognized an impairment charge related to Phase 2 in the second quarter of 2009, as noted in the “Asset impairment” section above. We anticipate that we will continue to purchase property and equipment in the normal course of business. The amount and timing of these purchases and the related cash outflows in future periods are difficult to predict and depend on a number of factors, including the hiring of employees and the rate of change of computer hardware.
Financing activities
Cash used by financing activities totaled $4.4 million and $35.3 million in 2009 and 2008, respectively, compared to cash provided by financing activities of $4.3 million in 2007. The primary use of cash in 2009 and 2008 was for the
repurchase of $6.1 million and $38.2 million of our common stock, respectively, under our share repurchase programs. The cash provided by financing activities in 2007 resulted primarily from the exercise of stock options granted under our stock plans and upon the exercise of warrants.
We have never paid or declared any dividends and do not intend to pay dividends in the near future.
The following summarizes our contractual obligations at December 31, 2009 and the effect such obligations are expected to have on our liquidity and cash flow in future periods (in thousands).
|
|
|
Total |
|
Less than 1 |
|
1 to 3 Years |
|
3 to 5 Years |
|
More than 5 |
|
|||||
|
|
|
|
|
|
|
|
|
|
|
|
|
|||||
|
Operating leases |
|
$ |
2,228 |
|
$ |
1,026 |
|
$ |
1,202 |
|
$ |
— |
|
$ |
— |
|
Off-balance-sheet arrangements
We did not have any off-balance sheet arrangements as of December 31, 2009 or 2008.
Purchase commitments
We had no significant outstanding purchase commitments as of December 31, 2009. We have entered into a number of technology licensing agreements that provide for the payment of royalties when we sell our software products; we are not obligated for any minimum payments under such agreements.
Foreign currency transactions
Our export sales are primarily negotiated, invoiced and paid in U.S. dollars, with a portion of sales transactions denominated in foreign currencies. As we expand our direct business internationally, we expect to enter into a higher percentage of sales transactions in foreign currencies and could be subject to greater gains or losses based on exchange rate fluctuations.
Inflation
We believe inflation has not had a material effect on our operations or financial condition.
Recent accounting pronouncements
Information regarding new accounting pronouncements is included in Note 2 to the Consolidated Financial Statements.
Item 7A. Quantitative and Qualitative Disclosures about Market Risk
Market risk refers to the risk that a change in the level of one or more market prices, interest rates, indices, volatilities, correlations or other market factors such as liquidity will result in losses for a certain financial instrument or group of financial instruments. We do not hold or issue financial instruments for trading purposes, and we do not enter into forward financial instruments to manage and reduce the impact of changes in foreign currency rates because, as disclosed above, our export sales are primarily negotiated, invoiced and paid in U.S. dollars, with a small percentage of sales transactions denominated in foreign currencies. Based on the controls in place and the relative size of the financial instruments entered into, we believe the risks associated with not using these instruments would not have a material adverse effect on our consolidated financial position or results of operations.
In addition, we do not engage in speculative transactions and do not use derivative instruments or engage in hedging activities. See the Notes to the Consolidated Financial Statements for a description of our accounting policies and other information related to these financial instruments.
In the normal course of business, we are exposed to market risks, including changes in interest rates and price changes, which could affect our operating results.
Interest rate risk
We place our cash, cash equivalents and marketable securities with a high-quality financial institution and have investment guidelines relative to diversification and maturities designed to maintain safety and liquidity. As of December 31, 2009, we had cash, cash equivalents and marketable securities totaling $142.2 million. If, during 2009, average short-term interest rates decreased by 0.5% from 2009 average rates, based on our quarterly average balance of cash, cash equivalents and marketable securities, our interest income from short-term investments would have decreased by approximately $690,000.
Foreign currency risk
Our export sales are primarily negotiated, invoiced and paid in U.S. dollars, with a portion of sales transactions denominated in foreign currencies. Therefore, fluctuations in the value of the dollar as compared to other foreign currencies have not had a significant effect on our results of operations or financial condition. As we expand our direct business internationally, we expect to enter into a higher percentage of sales transactions in foreign currencies and could be subject to greater gains or losses based on exchange rate fluctuations.
Item 8. Financial Statements and Supplementary Data
Our financial statements and Report of Independent Registered Public Accounting Firm thereon, all of which are included in this Annual Report on Form 10-K, are listed in Item 15(a)(1) of this Form 10-K.
Item 9. Changes in and Disagreements with Accountants on Accounting and Financial Disclosure
Not applicable.
Item 9A. Controls and Procedures
Evaluation of disclosure controls and procedures
We maintain disclosure controls and procedures that are designed to ensure that information required to be disclosed in the reports that we file or submit under the Securities Exchange Act of 1934, as amended (“Exchange Act”), is recorded, processed, summarized and reported within the time periods specified in the rules and forms of the Securities and Exchange Commission, and that such information is accumulated and communicated to our management, including our Chief Executive Officer and Chief Financial Officer, as appropriate, to allow timely decisions regarding required financial disclosure.
Our management, under the supervision of and with the participation of our Chief Executive Officer and Chief Financial Officer, has evaluated the effectiveness of our disclosure controls and procedures, as defined in Rules 13a-15(e) and 15d-15(e) under the Exchange Act, as of the end of the period covered by this report. Based on such evaluation, our Chief Executive Officer and Chief Financial Officer have concluded that, as of the end of the period covered by this report, our disclosure controls and procedures were effective.
Management’s report on internal control over financial reporting
Our management is responsible for establishing and maintaining adequate internal control over financial reporting. Our internal control over financial reporting is a process designed to provide reasonable assurance regarding the reliability of financial reporting and the preparation of financial statements for external purposes in accordance with generally accepted accounting principles. Because of its inherent limitations, internal control over financial reporting may not prevent or detect misstatements. Also, projections of any evaluation of effectiveness to future periods are subject to the risk that controls may become inadequate because of changes in conditions or that the degree of compliance with established policies or procedures may deteriorate.
Our management, under the supervision of and with the participation of our Chief Executive Officer and Chief Financial Officer, has evaluated the effectiveness of our internal control over financial reporting as of the end of the period covered by this report based on the criteria established in Internal Control — Integrated Framework issued by the Committee of Sponsoring Organizations of the Treadway Commission (COSO). Based on the results of this evaluation, we concluded that our internal control over financial reporting was effective as of the end of the period covered by this report.
The effectiveness of our internal control over financial reporting as of December 31, 2009 has been audited by PricewaterhouseCoopers LLP, an independent registered public accounting firm, as stated in their report which is included in Item 15(a)(1) of this Annual Report on Form 10-K.
Changes in internal control over financial reporting
There were no changes in internal control over financial reporting during the quarter ended December 31, 2009 that have materially affected, or are reasonably likely to materially affect, our internal control over financial reporting.
Item 9B. Other Information
None.
Table of Contents
Part III
Certain information required by Part III is omitted from this Annual Report on Form 10-K because we will file a definitive Proxy Statement relating to our 2010 Annual Meeting of Stockholders pursuant to Schedule 14A (the “Proxy Statement”) not later than 120 days after the end of the fiscal year covered by this Annual Report on Form 10-K, and certain information included therein is incorporated herein by reference as indicated below.
Item 10. Directors, Executive Officers and Corporate Governance
The information required by this Item 10 will be included under the captions “Election of Directors” and “Information Concerning Directors, Nominees and Executive Officers” in our Proxy Statement for our 2010 annual meeting of shareholders. Information concerning the compliance of our officers, directors and 10% shareholders with Section 16(a) of the Securities Exchange Act of 1934 is incorporated by reference to the information to be contained in the 2010 proxy statement under the caption “Information Concerning Directors Nominees and Executive Officers — Section 16(a) Beneficial Ownership Reporting Compliance.” The information regarding Audit Committee members and “Audit Committee Financial Experts” is incorporated by reference to the information to be contained in the 2010 proxy statement under the caption “Information Concerning Directors Nominees and Executive Officers — Board Committees.” The information regarding our Code of Business Ethics is incorporated by reference to the information to be contained in the 2010 proxy statement under the heading “Information Concerning Directors Nominees and Executive Officers — Code of Business Conduct and Ethics.”
Item 11. Executive Compensation
The information under the captions “Information Concerning Directors, Nominees and Executive Officers — Director Compensation,” “Information Concerning Directors, Nominees and Executive Officers — Compensation Discussion and Analysis,” “Information Concerning Directors, Nominees and Executive Officers — Compensation Committee Report,” “Information Concerning Directors, Nominees and Executive Officers — Executive Compensation” and “Information Concerning Directors, Nominees and Executive Officers — Compensation Committee Interlocks and Insider Participation” to be contained in the 2010 proxy statement is incorporated herein by reference.
Item 12. Security Ownership of Certain Beneficial Owners and Management and Related Stockholder Matters
The information under the captions “Beneficial Ownership of Common Stock” and “Information Concerning Directors, Nominees and Executive Officers — Securities Authorized for Issuers Under Equity Compensation Plans” to be contained in the 2010 proxy statement is incorporated herein by reference.
Item 13. Certain Relationships and Related Transactions, and Director Independence
The information under the caption “Information Concerning Directors, Nominees and Executive Officers — Independent Directors” and “Information Concerning Directors, Nominees and Executive Officers — Policy and Procedures with Respect to Related Person Transactions” to be contained in the 2010 proxy statement is incorporated herein by reference.
Item 14. Principal Accountant Fees and Services
The information under the caption “Ratification of Appointment of PricewaterhouseCoopers LLP as Independent Registered Public Accounting Firm” to be contained in the 2010 proxy statement is incorporated herein by reference.
Table of Contents
Part IV
Item 15. Exhibits and Financial Statement Schedules
(a) The following Consolidated Financial Statements of Vital Images, Inc. and Report of Independent Registered Public Accounting Firm thereon are included herein:
|
(1) |
Financial Statements |
|
|
|
|
|
|
|
37 |
|
|
|
Consolidated Balance Sheets as of December 31, 2009 and 2008 |
38 |
|
|
Consolidated Statements of Operations for the years ended December 31, 2009, 2008 and 2007 |
39 |
|
|
40 |
|
|
|
Consolidated Statements of Cash Flows for the years ended December 31, 2009, 2008 and 2007 |
41 |
|
|
42 |
|
|
|
|
|
|
(2) |
All other schedules to the Consolidated Financial Statements required by Article 12 of Regulation S-X are not required under the related instructions or are inapplicable and therefore have been omitted. |
|
|
|
|
|
|
(3) |
Listing of Exhibits |
|
|
|
|
|
|
|
The Exhibits required to be a part of this Report are listed in the Index to Exhibits. |
|
(b) Exhibits
Included in Item 15(a)(3) above.
Table of Contents
Signatures
Pursuant to the requirements of Section 13 or 15(d) of the Securities Exchange Act of 1934, the Registrant has duly caused this Report to be signed on its behalf by the undersigned, thereunto duly authorized, in Minneapolis, Minnesota, on the 16th day of March, 2010.
|
|
|
|
Vital Images, Inc. |
|
|
|
|
|
|
|
|
By: |
/s/Peter J. Goepfrich |
|
|
|
|
Peter J. Goepfrich |
|
|
|
|
Chief Financial Officer |
Pursuant to the requirement of the Securities Exchange Act of 1934, this Report has been signed by the following persons in the capacities and on the dates indicated.
|
Signature |
|
Title |
|
Date |
|
|
|
|
|
|
|
/s/ Michael H. Carrel |
|
President, Chief Executive Officer and Director |
|
March 16, 2010 |
|
Michael H. Carrel |
|
(Principal Executive Officer) |
|
|
|
|
|
|
|
|
|
/s/Peter J. Goepfrich |
|
Chief Financial Officer and Treasurer |
|
March 16, 2010 |
|
Peter J. Goepfrich |
|
(Principal Financial Officer and Principal Accounting Officer) |
|
|
|
|
|
|
|
|
|
/s/James B. Hickey, Jr. |
|
Chairman of the Board and Director |
|
March 16, 2010 |
|
James B. Hickey, Jr. |
|
|
|
|
|
|
|
|
|
|
|
/s/ Oran E. Muduroglu |
|
Director |
|
March 16, 2010 |
|
Oran E. Muduroglu |
|
|
|
|
|
|
|
|
|
|
|
/s/ Gregory J. Peet |
|
Director |
|
March 16, 2010 |
|
Gregory J. Peet |
|
|
|
|
|
|
|
|
|
|
|
/s/Richard W. Perkins |
|
Director |
|
March 16, 2010 |
|
Richard W. Perkins |
|
|
|
|
|
|
|
|
|
|
|
/s/Douglas M. Pihl |
|
Director |
|
March 16, 2010 |
|
Douglas M. Pihl |
|
|
|
|
|
|
|
|
|
|
|
/s/Michael W. Vannier |
|
Director |
|
March 16, 2010 |
|
Michael W. Vannier |
|
|
|
|
|
|
|
|
|
|
|
/s/Sven A. Wehrwein |
|
Director |
|
March 16, 2010 |
|
Sven A. Wehrwein |
|
|
|
|
Report of Independent Registered Public Accounting Firm
To the Board of Directors and Stockholders of Vital Images, Inc.:
In our opinion, the accompanying consolidated balance sheets and the related consolidated statements of operations, of stockholders’ equity and comprehensive income (loss) and of cash flows present fairly, in all material respects, the financial position of Vital Images, Inc. and its subsidiaries at December 31, 2009 and December 31, 2008, and the results of its operations and its cash flows for each of the three years in the period ended December 31, 2009, in conformity with accounting principles generally accepted in the United States of America. Also in our opinion, the Company maintained, in all material respects, effective internal control over financial reporting as of December 31, 2009, based on criteria established in Internal Control - Integrated Framework issued by the Committee of Sponsoring Organizations of the Treadway Commission (COSO). The Company’s management is responsible for these financial statements, for maintaining effective internal control over financial reporting and for its assessment of the effectiveness of internal control over financial reporting, included in Management’s Report on Internal Control over Financial Reporting appearing under Item 9A. Our responsibility is to express opinions on these financial statements and on the Company’s internal control over financial reporting based on our integrated audits. We conducted our audits in accordance with the standards of the Public Company Accounting Oversight Board (United States). Those standards require that we plan and perform the audits to obtain reasonable assurance about whether the financial statements are free of material misstatement and whether effective internal control over financial reporting was maintained in all material respects. Our audits of the financial statements included examining, on a test basis, evidence supporting the amounts and disclosures in the financial statements, assessing the accounting principles used and significant estimates made by management, and evaluating the overall financial statement presentation. Our audit of internal control over financial reporting included obtaining an understanding of internal control over financial reporting, assessing the risk that a material weakness exists, and testing and evaluating the design and operating effectiveness of internal control based on the assessed risk. Our audits also included performing such other procedures as we considered necessary in the circumstances. We believe that our audits provide a reasonable basis for our opinions.
A company’s internal control over financial reporting is a process designed to provide reasonable assurance regarding the reliability of financial reporting and the preparation of financial statements for external purposes in accordance with generally accepted accounting principles. A company’s internal control over financial reporting includes those policies and procedures that (i) pertain to the maintenance of records that, in reasonable detail, accurately and fairly reflect the transactions and dispositions of the assets of the company; (ii) provide reasonable assurance that transactions are recorded as necessary to permit preparation of financial statements in accordance with generally accepted accounting principles, and that receipts and expenditures of the company are being made only in accordance with authorizations of management and directors of the company; and (iii) provide reasonable assurance regarding prevention or timely detection of unauthorized acquisition, use, or disposition of the company’s assets that could have a material effect on the financial statements.
Because of its inherent limitations, internal control over financial reporting may not prevent or detect misstatements. Also, projections of any evaluation of effectiveness to future periods are subject to the risk that controls may become inadequate because of changes in conditions, or that the degree of compliance with the policies or procedures may deteriorate.
/s/ PricewaterhouseCoopers LLP
Minneapolis, Minnesota
March 16, 2010
Vital Images, Inc.
Consolidated Balance Sheets
(In thousands, except per share amounts)
|
|
|
December 31, |
|
||||
|
|
|
2009 |
|
2008 |
|
||
|
Assets |
|
|
|
|
|
||
|
Current assets: |
|
|
|
|
|
||
|
Cash and cash equivalents |
|
$ |
120,317 |
|
$ |
109,706 |
|
|
Marketable securities |
|
9,673 |
|
37,287 |
|
||
|
Accounts receivable, net |
|
12,196 |
|
13,047 |
|
||
|
Deferred income taxes |
|
— |
|
654 |
|
||
|
Prepaid expenses and other current assets |
|
2,686 |
|
2,179 |
|
||
|
Total current assets |
|
144,872 |
|
162,873 |
|
||
|
Marketable securities |
|
12,234 |
|
— |
|
||
|
Property and equipment, net |
|
5,485 |
|
11,519 |
|
||
|
Deferred income taxes |
|
— |
|
13,904 |
|
||
|
Other intangible assets, net |
|
382 |
|
808 |
|
||
|
Goodwill |
|
9,089 |
|
9,089 |
|
||
|
Total assets |
|
$ |
172,062 |
|
$ |
198,193 |
|
|
|
|
|
|
|
|
||
|
Liabilities and Stockholders’ Equity |
|
|
|
|
|
||
|
Current liabilities: |
|
|
|
|
|
||
|
Accounts payable |
|
$ |
2,588 |
|
$ |
3,792 |
|
|
Accrued compensation |
|
3,574 |
|
2,936 |
|
||
|
Accrued royalties |
|
812 |
|
1,057 |
|
||
|
Other current liabilities |
|
1,364 |
|
1,947 |
|
||
|
Deferred revenue |
|
15,500 |
|
17,724 |
|
||
|
Total current liabilities |
|
23,838 |
|
27,456 |
|
||
|
Deferred revenue |
|
1,033 |
|
1,164 |
|
||
|
Deferred rent |
|
469 |
|
882 |
|
||
|
Total liabilities |
|
25,340 |
|
29,502 |
|
||
|
|
|
|
|
|
|
||
|
Commitments and contingencies (Note 4) |
|
|
|
|
|
||
|
|
|
|
|
|
|
||
|
Stockholders’ equity: |
|
|
|
|
|
||
|
Preferred stock: $0.01 par value; 5,000 shares authorized; none issued or outstanding |
|
— |
|
— |
|
||
|
Common stock: $0.01 par value; 40,000 shares authorized; 14,330 issued and outstanding as of December 31, 2009; and 14,673 shares issued and outstanding as of December 31, 2008 |
|
143 |
|
147 |
|
||
|
Additional paid-in capital |
|
168,058 |
|
168,738 |
|
||
|
Accumulated deficit |
|
(21,632 |
) |
(380 |
) |
||
|
Accumulated other comprehensive income |
|
153 |
|
186 |
|
||
|
Total stockholders’ equity |
|
146,722 |
|
168,691 |
|
||
|
Total liabilities and stockholders’ equity |
|
$ |
172,062 |
|
$ |
198,193 |
|
The accompanying notes are an integral part of the Consolidated Financial Statements.
Vital
Images, Inc.
Consolidated Statements of Operations
(In thousands, except for per share amounts)
|
|
|
For the Year Ended December 31, |
|
|||||||
|
|
|
2009 |
|
2008 |
|
2007 |
|
|||
|
|
|
|
|
|
|
|
|
|||
|
Revenue: |
|
|
|
|
|
|
|
|||
|
License fees |
|
$ |
22,766 |
|
$ |
34,290 |
|
$ |
39,673 |
|
|
Maintenance and services |
|
33,717 |
|
32,436 |
|
29,487 |
|
|||
|
Hardware |
|
1,747 |
|
1,415 |
|
1,016 |
|
|||
|
Total revenue |
|
58,230 |
|
68,141 |
|
70,176 |
|
|||
|
|
|
|
|
|
|
|
|
|||
|
Cost of revenue: |
|
|
|
|
|
|
|
|||
|
License fees |
|
3,301 |
|
4,922 |
|
4,725 |
|
|||
|
Maintenance and services |
|
9,282 |
|
10,089 |
|
9,928 |
|
|||
|
Hardware |
|
1,622 |
|
862 |
|
694 |
|
|||
|
Impairment of patent |
|
— |
|
— |
|
242 |
|
|||
|
Total cost of revenue |
|
14,205 |
|
15,873 |
|
15,589 |
|
|||
|
|
|
|
|
|
|
|
|
|||
|
Gross profit |
|
44,025 |
|
52,268 |
|
54,587 |
|
|||
|
|
|
|
|
|
|
|
|
|||
|
Operating expenses: |
|
|
|
|
|
|
|
|||
|
Sales and marketing |
|
22,579 |
|
27,835 |
|
29,481 |
|
|||
|
Research and development |
|
16,332 |
|
20,355 |
|
18,476 |
|
|||
|
General and administrative |
|
9,978 |
|
13,243 |
|
13,798 |
|
|||
|
Asset impairment (Note 3) |
|
3,147 |
|
— |
|
— |
|
|||
|
Restructuring charge |
|
— |
|
660 |
|
— |
|
|||
|
Total operating expenses |
|
52,036 |
|
62,093 |
|
61,755 |
|
|||
|
|
|
|
|
|
|
|
|
|||
|
Operating loss |
|
(8,011 |
) |
(9,825 |
) |
(7,168 |
) |
|||
|
|
|
|
|
|
|
|
|
|||
|
Interest income |
|
1,091 |
|
4,643 |
|
8,886 |
|
|||
|
(Loss) income before income taxes |
|
(6,920 |
) |
(5,182 |
) |
1,718 |
|
|||
|
|
|
|
|
|
|
|
|
|||
|
Provision (benefit) for income taxes |
|
14,332 |
|
(2,382 |
) |
351 |
|
|||
|
|
|
|
|
|
|
|
|
|||
|
Net (loss) income |
|
$ |
(21,252 |
) |
$ |
(2,800 |
) |
$ |
1,367 |
|
|
|
|
|
|
|
|
|
|
|||
|
Net (loss) income per share – basic |
|
$ |
(1.48 |
) |
$ |
(0.17 |
) |
$ |
0.08 |
|
|
Net (loss) income per share – diluted |
|
$ |
(1.48 |
) |
$ |
(0.17 |
) |
$ |
0.08 |
|
|
|
|
|
|
|
|
|
|
|||
|
Weighted average common shares outstanding - basic |
|
14,315 |
|
16,155 |
|
16,972 |
|
|||
|
Weighted average common shares outstanding - diluted |
|
14,315 |
|
16,155 |
|
17,457 |
|
|||
The accompanying notes are an integral part of the Consolidated Financial Statements.
Vital Images, Inc.
Consolidated Statements of Stockholders’ Equity and Comprehensive Income (Loss)
(In thousands)
|
|
|
|
|
|
|
|
|
Retained |
|
Accumulated |
|
|
|
|
|
||||||
|
|
|
|
|
|
|
Additional |
|
Earnings / |
|
Other |
|
Total |
|
|
|
||||||
|
|
|
Common Stock |
|
Paid-In |
|
(Accumulated |
|
Comprehensive |
|
Stockholders’ |
|
Comprehensive |
|
||||||||
|
|
|
Shares |
|
Amount |
|
Capital |
|
Deficit) |
|
Income / (Loss) |
|
Equity |
|
Income (Loss) |
|
||||||
|
|
|
|
|
|
|
|
|
|
|
|
|
|
|
|
|
||||||
|
Balances as of December 31, 2006 |
|
16,908 |
|
$ |
169 |
|
$ |
189,669 |
|
$ |
1,053 |
|
$ |
11 |
|
$ |
190,902 |
|
$ |
6,614 |
|
|
|
|
|
|
|
|
|
|
|
|
|
|
|
|
|
|
||||||
|
Issuance of common stock upon exercise of stock options |
|
221 |
|
3 |
|
2,352 |
|
|
|
|
|
2,355 |
|
|
|
||||||
|
Tax benefit related to exercise of stock options and release of restricted stock |
|
|
|
|
|
1,443 |
|
|
|
|
|
1,443 |
|
|
|
||||||
|
Issuance of common stock under employee stock purchase plan |
|
27 |
|
— |
|
521 |
|
|
|
|
|
521 |
|
|
|
||||||
|
Grant of restricted stock to employees |
|
14 |
|
— |
|
— |
|
|
|
|
|
— |
|
|
|
||||||
|
Forfeiture or cancellation of restricted stock |
|
(5 |
) |
— |
|
— |
|
|
|
|
|
— |
|
|
|
||||||
|
Common stock surrendered for payment of payroll tax liability resulting from the vesting of restricted stock |
|
(12 |
) |
— |
|
(347 |
) |
|
|
|
|
(347 |
) |
|
|
||||||
|
Stock-based compensation |
|
|
|
|
|
5,987 |
|
|
|
|
|
5,987 |
|
|
|
||||||
|
Change in unrealized gain or loss on investments, net of tax |
|
|
|
|
|
|
|
|
|
(8 |
) |
(8 |
) |
$ |
(8 |
) |
|||||
|
Cumulative translation adjustment |
|
|
|
|
|
|
|
|
|
(4 |
) |
(4 |
) |
(4 |
) |
||||||
|
Net income |
|
|
|
|
|
|
|
1,367 |
|
|
|
1,367 |
|
1,367 |
|
||||||
|
Balances as of December 31, 2007 |
|
17,153 |
|
172 |
|
199,625 |
|
2,420 |
|
(1 |
) |
202,216 |
|
$ |
1,355 |
|
|||||
|
|
|
|
|
|
|
|
|
|
|
|
|
|
|
|
|
||||||
|
Issuance of common stock upon exercise of stock options |
|
243 |
|
2 |
|
1,927 |
|
|
|
|
|
1,929 |
|
|
|
||||||
|
Tax benefit related to exercise of stock options and release of restricted stock |
|
|
|
|
|
50 |
|
|
|
|
|
50 |
|
|
|
||||||
|
Issuance of common stock under employee stock purchase plan |
|
43 |
|
— |
|
490 |
|
|
|
|
|
490 |
|
|
|
||||||
|
Grant of restricted stock to employees |
|
30 |
|
— |
|
— |
|
|
|
|
|
— |
|
|
|
||||||
|
Forfeiture or cancellation of restricted stock |
|
(27 |
) |
— |
|
— |
|
|
|
|
|
— |
|
|
|
||||||
|
Common stock surrendered for payment of payroll tax liability resulting from the vesting of restricted stock |
|
(12 |
) |
— |
|
(174 |
) |
|
|
|
|
(174 |
) |
|
|
||||||
|
Stock-based compensation |
|
|
|
|
|
5,007 |
|
|
|
|
|
5,007 |
|
|
|
||||||
|
Repurchases of common stock |
|
(2,757 |
) |
(27 |
) |
(38,187 |
) |
|
|
|
|
(38,214 |
) |
|
|
||||||
|
Change in unrealized gain or loss on investments, net of tax |
|
|
|
|
|
|
|
|
|
187 |
|
187 |
|
$ |
187 |
|
|||||
|
Net loss |
|
|
|
|
|
|
|
(2,800 |
) |
|
|
(2,800 |
) |
(2,800 |
) |
||||||
|
Balances as of December 31, 2008 |
|
14,673 |
|
147 |
|
168,738 |
|
(380 |
) |
186 |
|
168,691 |
|
$ |
(2,613 |
) |
|||||
|
|
|
|
|
|
|
|
|
|
|
|
|
|
|
|
|
||||||
|
Issuance of common stock upon exercise of stock options |
|
163 |
|
2 |
|
1,151 |
|
|
|
|
|
1,153 |
|
|
|
||||||
|
Issuance of common stock under employee stock purchase plan |
|
51 |
|
— |
|
496 |
|
|
|
|
|
496 |
|
|
|
||||||
|
Grant of restricted stock to employees |
|
15 |
|
— |
|
— |
|
|
|
|
|
— |
|
|
|
||||||
|
Common stock surrendered for payment of payroll tax liability resulting from the vesting of restricted stock |
|
(10 |
) |
— |
|
(119 |
) |
|
|
|
|
(119 |
) |
|
|
||||||
|
Stock-based compensation |
|
|
|
|
|
3,867 |
|
|
|
|
|
3,867 |
|
|
|
||||||
|
Repurchases of common stock |
|
(562 |
) |
(6 |
) |
(6,075 |
) |
|
|
|
|
(6,081 |
) |
|
|
||||||
|
Change in unrealized gain or loss on investments, net of tax |
|
|
|
|
|
|
|
|
|
(33 |
) |
(33 |
) |
$ |
(33 |
) |
|||||
|
Net loss |
|
|
|
|
|
|
|
(21,252 |
) |
|
|
(21,252 |
) |
(21,252 |
) |
||||||
|
Balances as of December 31, 2009 |
|
14,330 |
|
$ |
143 |
|
$ |
168,058 |
|
$ |
(21,632 |
) |
$ |
153 |
|
$ |
146,722 |
|
$ |
(21,285 |
) |
The accompanying notes are an integral part of the Consolidated Financial Statements.
Vital Images, Inc.
Consolidated Statements of Cash Flows
(In thousands)
|
|
|
For the Year Ended December 31, |
|
|||||||
|
|
|
2009 |
|
2008 |
|
2007 |
|
|||
|
|
|
|
|
|
|
|
|
|||
|
Cash flows from operating activities: |
|
|
|
|
|
|
|
|||
|
Net (loss) income |
|
$ |
(21,252 |
) |
$ |
(2,800 |
) |
$ |
1,367 |
|
|
Adjustments to reconcile net income to net cash provided by operating activities: |
|
|
|
|
|
|
|
|||
|
Depreciation and amortization of property and equipment |
|
4,843 |
|
4,919 |
|
4,517 |
|
|||
|
Amortization of identified intangible assets |
|
426 |
|
1,044 |
|
1,205 |
|
|||
|
Loss on disposal of assets |
|
111 |
|
— |
|
— |
|
|||
|
Asset impairment |
|
3,147 |
|
— |
|
242 |
|
|||
|
Provision for doubtful accounts |
|
279 |
|
519 |
|
239 |
|
|||
|
Deferred income taxes |
|
14,664 |
|
(2,521 |
) |
(16 |
) |
|||
|
Excess tax benefit from stock transactions |
|
— |
|
(481 |
) |
(1,395 |
) |
|||
|
Amortization of discount and accretion of premium on marketable securities |
|
238 |
|
(473 |
) |
(857 |
) |
|||
|
Employee stock-based compensation |
|
3,867 |
|
5,007 |
|
5,987 |
|
|||
|
Amortization of deferred rent |
|
(394 |
) |
(375 |
) |
(338 |
) |
|||
|
Changes in operating assets and liabilities: |
|
|
|
|
|
|
|
|||
|
Accounts receivable |
|
572 |
|
2,396 |
|
3,388 |
|
|||
|
Prepaid expenses and other assets |
|
(507 |
) |
262 |
|
(513 |
) |
|||
|
Accounts payable |
|
(936 |
) |
623 |
|
(363 |
) |
|||
|
Accrued expenses and other liabilities |
|
(329 |
) |
(740 |
) |
(1,142 |
) |
|||
|
Deferred revenue |
|
(2,355 |
) |
1,201 |
|
1,382 |
|
|||
|
Deferred rent |
|
— |
|
— |
|
199 |
|
|||
|
Net cash provided by operating activities |
|
2,374 |
|
8,581 |
|
13,902 |
|
|||
|
|
|
|
|
|
|
|
|
|||
|
Cash flows from investing activities: |
|
|
|
|
|
|
|
|||
|
Purchases of property and equipment |
|
(2,335 |
) |
(5,434 |
) |
(6,577 |
) |
|||
|
Purchases of marketable securities |
|
(21,749 |
) |
(76,395 |
) |
(59,974 |
) |
|||
|
Proceeds from maturities of marketable securities |
|
36,752 |
|
70,002 |
|
49,931 |
|
|||
|
Proceeds from sales of marketable securities |
|
— |
|
1,581 |
|
750 |
|
|||
|
Net cash provided by (used in) investing activities |
|
12,668 |
|
(10,246 |
) |
(15,870 |
) |
|||
|
|
|
|
|
|
|
|
|
|||
|
Cash flows from financing activities: |
|
|
|
|
|
|
|
|||
|
Repurchases of common stock |
|
(6,081 |
) |
(38,214 |
) |
— |
|
|||
|
Proceeds from sale of common stock under stock plans |
|
1,650 |
|
2,419 |
|
2,876 |
|
|||
|
Excess tax benefit from stock transactions |
|
— |
|
481 |
|
1,395 |
|
|||
|
Net cash (used in) provided by financing activities |
|
(4,431 |
) |
(35,314 |
) |
4,271 |
|
|||
|
|
|
|
|
|
|
|
|
|||
|
Net increase (decrease) in cash and cash equivalents |
|
10,611 |
|
(36,979 |
) |
2,303 |
|
|||
|
|
|
|
|
|
|
|
|
|||
|
Cash and cash equivalents, beginning of period |
|
109,706 |
|
146,685 |
|
144,382 |
|
|||
|
|
|
|
|
|
|
|
|
|||
|
Cash and cash equivalents, end of period |
|
$ |
120,317 |
|
$ |
109,706 |
|
$ |
146,685 |
|
|
|
|
|
|
|
|
|
|
|||
|
Supplemental cash flow information: |
|
|
|
|
|
|
|
|||
|
Purchases of property and equipment with accounts payable |
|
$ |
97 |
|
$ |
366 |
|
$ |
525 |
|
The accompanying notes are an integral part of the Consolidated Financial Statements.
Vital
Images, Inc.
Notes to Consolidated Financial Statements
1. Business description
Vital Images, Inc. (the “Company”) is a leading provider of advanced visualization and image analysis solutions for use by medical professionals in clinical analysis and therapy planning for medical conditions. The Company provides software, customer education, software maintenance and support, professional services and, on occasion, third-party hardware to its customers. The Company’s technology rapidly transforms complex data generated by diagnostic imaging equipment into functional digital images that can be manipulated and analyzed using its specialized applications to better understand internal anatomy and pathology. The Company’s solutions are designed to improve physician workflow and productivity, enhance the ability to make clinical decisions, facilitate less invasive patient care, and complement often significant capital investments in diagnostic imaging equipment made by its customers. The Company’s software is compatible with equipment from all major manufacturers of diagnostic imaging equipment, such as computed tomography, or CT, scanners, and can be integrated into picture archiving and communication systems, or PACS. Many hospitals use PACS to acquire, distribute and archive medical images and diagnostic reports, reducing the need for film and increasing reliance on advanced visualization solutions such as the Company’s. The Company also offers a Web-based solution that provides physicians with anywhere, anytime access to medical images and visualization tools through any Internet-enabled computer.
The Company views its operations and manages its business as one reportable segment — the development and marketing of software and related services for advanced visualization and analysis solutions for use by medical professionals in clinical analysis and therapy planning. Factors used to identify the Company’s single operating segment include the financial information available for evaluation by the chief operating decision maker in making decisions about how to allocate resources and assess performance. The Company markets its products and services through a direct sales force and independent distributors in the United States and international markets.
Certain reclassifications have been made to prior period operating expense amounts in order to conform to the current period presentation. Specifically, expenses related to certain product development related activities were reclassified from general and administrative expense and sales and marketing expense to research and development expense and therefore had no effect on previously reported stockholder’s equity, net loss, or net cash flows.
Operating expenses for the years ended December 31, 2008 and 2007, as reported and as reclassified were as follows:
|
|
|
For the Year Ended |
|
For the Year Ended |
|
||||||||
|
|
|
December 31, 2008 |
|
December 31, 2007 |
|
||||||||
|
|
|
As Reported |
|
As Reclassified |
|
As Reported |
|
As Reclassified |
|
||||
|
Operating expenses: |
|
|
|
|
|
|
|
|
|
||||
|
Sales and marketing |
|
$ |
30,294 |
|
$ |
27,835 |
|
$ |
31,991 |
|
$ |
29,481 |
|
|
Research and development |
|
17,131 |
|
20,355 |
|
15,204 |
|
18,476 |
|
||||
|
General and administrative |
|
14,008 |
|
13,243 |
|
14,560 |
|
13,798 |
|
||||
|
Restructuring charge |
|
660 |
|
660 |
|
— |
|
— |
|
||||
|
Total operating expenses |
|
$ |
62,093 |
|
$ |
62,093 |
|
$ |
61,755 |
|
$ |
61,755 |
|
2. Summary of significant accounting policies
Basis of presentation
The Consolidated Financial Statements include the accounts of the Company and its wholly-owned subsidiaries. All intercompany accounts and transactions have been eliminated.
Table of Contents
Use of estimates
The preparation of financial statements in conformity with accounting principles generally accepted in the United States of America requires management to make estimates and assumptions that affect the reported amounts of assets and liabilities and disclosure of contingent assets and liabilities at the date of the financial statements and the reported amounts of revenues and expenses during the reporting period. Actual results could differ from those estimates.
Fair value of financial instruments
The Company’s financial instruments consist primarily of cash, cash equivalents, and marketable securities, for which the current carrying amounts approximate fair market values based on quoted market prices.
Cash and cash equivalents
Cash and cash equivalents consist of cash and temporary investments with maturities of 90 days or less when purchased. The carrying amount of cash equivalents approximates fair value due to the short maturity of these instruments.
Marketable securities
Management determines the appropriate classification of marketable securities at the time of purchase and reevaluates such designation as of each balance sheet date. Currently, all marketable securities held by the Company are classified as available-for-sale. Available-for-sale securities are carried at fair value as determined by quoted market prices with unrealized gains and losses, net of tax, reported as a separate component of stockholders’ equity. If an unrealized loss for any investment is considered to be other-than-temporary, the loss will be recognized in the consolidated income statement in the period the determination is made. The cost basis of securities sold is determined using the specific identification method. The cost of marketable securities is adjusted for amortization of premiums and accretion of discounts to maturity. Such amortization and accretion is included in interest income. Interest and dividends on securities classified as available-for-sale are included in interest income.
The Company adopted Accounting Standards Codification (ASC) Topic 820, Fair Value Measurements, as of January 1, 2008, with the exception of the application of Topic 820 to nonrecurring nonfinancial assets and nonfinancial liabilities which was adopted as of January 1, 2009.
Topic 820 establishes a valuation hierarchy for disclosure of the inputs to valuation used to measure fair value. This hierarchy prioritizes the inputs into three broad levels. Level 1 inputs are quoted prices (unadjusted) in active markets for identical assets or liabilities. Level 2 inputs are quoted prices for similar assets and liabilities in active markets or inputs that are observable for the asset or liability, either directly or indirectly through market corroboration, for substantially the full term of the financial instrument. Level 3 inputs are unobservable inputs based on our own assumptions used to measure assets and liabilities at fair value. A financial asset’s or liability’s classification within the hierarchy is determined based on the lowest level input that is significant to the fair value measurement.
The following tables provide the assets and liabilities carried at fair value measured on a recurring basis as of December 31, 2009 and 2008 (in thousands):
|
|
|
|
|
Fair Value Measurements at December 31, 2009 Using |
|
||||||||
|
|
|
Total Carrying |
|
Quoted price in |
|
Significant other |
|
Significant |
|
||||
|
|
|
December 31, 2009 |
|
(Level 1) |
|
(Level 2) |
|
(Level 3) |
|
||||
|
Cash equivalents: |
|
|
|
|
|
|
|
|
|
||||
|
Money market |
|
$ |
114,830 |
|
$ |
114,830 |
|
$ |
— |
|
$ |
— |
|
|
|
|
|
|
|
|
|
|
|
|
||||
|
Marketable securities: |
|
|
|
|
|
|
|
|
|
||||
|
Corporate debt |
|
16,911 |
|
16,911 |
|
— |
|
— |
|
||||
|
Government debt |
|
4,996 |
|
4,996 |
|
— |
|
— |
|
||||
|
Total marketable securities |
|
21,907 |
|
21,907 |
|
— |
|
— |
|
||||
|
Total cash equivalents and marketable securities |
|
$ |
136,737 |
|
$ |
136,737 |
|
$ |
— |
|
$ |
— |
|
|
|
|
|
|
Fair Value Measurements at December 31, 2008 Using |
|
||||||||
|
|
|
Total Carrying |
|
Quoted price in |
|
Significant other |
|
Significant |
|
||||
|
|
|
December 31, 2008 |
|
(Level 1) |
|
(Level 2) |
|
(Level 3) |
|
||||
|
|
|
|
|
|
|
|
|
|
|
||||
|
Cash equivalents: |
|
|
|
|
|
|
|
|
|
||||
|
Money market |
|
$ |
108,102 |
|
$ |
108,102 |
|
$ |
— |
|
$ |
— |
|
|
|
|
|
|
|
|
|
|
|
|
||||
|
Marketable securities: |
|
|
|
|
|
|
|
|
|
||||
|
Corporate debt |
|
2,255 |
|
1,998 |
|
257 |
|
— |
|
||||
|
Government debt |
|
35,032 |
|
35,032 |
|
— |
|
— |
|
||||
|
Total marketable securities |
|
37,287 |
|
37,030 |
|
257 |
|
— |
|
||||
|
Total cash equivalents and marketable securities |
|
$ |
145,389 |
|
$ |
145,132 |
|
$ |
257 |
|
$ |
— |
|
Cash equivalents and marketable securities measured at fair value using quoted market prices are classified within Level 1 of the valuation hierarchy.
Marketable securities classified within Level 2 of the valuation hierarchy consisted of an asset-backed security. The valuation of this asset-backed security was determined by reviewing quoted market prices for traded lots of the same or similar securities. This security was rated AAA and fully matured during 2009. The Company did not realize any loss on this security.
As of December 31, 2009 and 2008, the Company’s marketable securities were as follows (in thousands):
|
|
|
December 31, 2009 |
|
December 31, 2008 |
|
||||||||||||||
|
|
|
Adjusted Cost |
|
Aggregate Fair |
|
Net Unrealized |
|
Adjusted |
|
Aggregate Fair |
|
Net Unrealized |
|
||||||
|
|
|
|
|
|
|
|
|
|
|
|
|
|
|
||||||
|
Corporate debt |
|
$ |
16,766 |
|
$ |
16,911 |
|
$ |
145 |
|
$ |
2,253 |
|
$ |
2,255 |
|
$ |
2 |
|
|
Government debt |
|
4,988 |
|
4,996 |
|
8 |
|
34,742 |
|
35,032 |
|
290 |
|
||||||
|
|
|
$ |
21,754 |
|
$ |
21,907 |
|
$ |
153 |
|
$ |
36,995 |
|
$ |
37,287 |
|
$ |
292 |
|
As of December 31, 2009 and 2008, the Company’s gross unrealized gains and losses were as follows (in thousands):
|
|
|
December 31, 2009 |
|
December 31, 2008 |
|
||||||||||||||
|
|
|
Gross |
|
Gross |
|
Net Unrealized |
|
Gross |
|
Gross |
|
Net Unrealized |
|
||||||
|
Corporate debt |
|
$ |
145 |
|
$ |
— |
|
$ |
145 |
|
$ |
9 |
|
$ |
(7 |
) |
$ |
2 |
|
|
Government debt |
|
8 |
|
— |
|
8 |
|
290 |
|
— |
|
290 |
|
||||||
|
|
|
$ |
153 |
|
$ |
— |
|
$ |
153 |
|
$ |
299 |
|
$ |
(7 |
) |
$ |
292 |
|
The carrying values of available-for-sale securities are at fair value. There were no material realized gains or losses on any investments for the years ended December 31, 2009, 2008 or 2007.
The Company analyzes its investments for impairment on an ongoing basis. Factors considered in determining whether an unrealized loss is a temporary loss or an other-than-temporary loss include the length of time and extent to which the securities have been in an unrealized loss position and the Company’s ability and intent to hold the investment for a period of time sufficient to allow for any anticipated market recovery.
Accounts receivable and allowance for doubtful accounts
Accounts receivable are initially recorded at a selling price, which approximates fair value upon the sale of goods or services to customers. The Company maintains an allowance for doubtful accounts to reflect accounts receivable at net realizable value. In judging the adequacy of the allowance for doubtful accounts, the Company considers multiple factors, including historical bad debt experience, the general economic environment, the need for specific client reserves and the aging of the Company’s receivables. A portion of this provision is included in operating expenses as a general and administrative expense and a portion of this provision is included as a reduction of license revenue. A considerable amount of judgment is required in assessing these factors. If the factors utilized in determining the allowance do not reflect future performance, then a change in the allowance for doubtful accounts would be necessary in the period such determination has been made, which would impact future results of operations.
Concentration of credit risk
Financial instruments that potentially subject the Company to concentrations of credit risk consist primarily of cash and cash equivalents, marketable securities and trade accounts receivable. Deposits with the Company’s bank may exceed the amount of insurance provided on such deposits. The Company’s investment policy, approved by its Investment Committee, limits the amount the Company may invest in any one type of investment, thereby reducing credit risk concentrations. A significant portion of the Company’s accounts receivable relates to Toshiba Medical Systems Corporation, McKesson Corporation and Medtronic Inc., totaling 36%, 14% and 12% of accounts receivable, respectively, as of December 31, 2009. The Company reviews the creditworthiness of its customers prior to product shipment and generally does not require collateral.
Property and equipment
Property and equipment are recorded at cost. Depreciation is computed using the straight-line method over the related asset’s estimated useful life, generally three to seven years. Equipment is generally depreciated over three to seven years, furniture and fixtures are generally depreciated over seven years, computer software is generally depreciated over three to seven years, and leasehold improvements are amortized over the shorter of their estimated useful lives or the remaining terms of the related leases. The asset cost and related accumulated depreciation or amortization are adjusted for asset retirement or disposal, with the resulting gain or loss, if any, credited or charged to results of operations.
Long-lived assets
The Company reviews long-lived assets (or asset groups) for impairment whenever events or changes in circumstances indicate the carrying amount may not be recoverable, in accordance with ASC Topic 360, Property, Plant and Equipment. Events or changes in circumstances that indicate the carrying amount may not be recoverable include, but are not limited to, a significant decrease in the market value of the business or asset acquired, a significant adverse change in the extent or manner in which the business or asset acquired is used, or a significant adverse change in the business climate. If such events or changes in circumstances are present, the undiscounted cash flows method is used to determine whether the asset is impaired. Cash flows would include the estimated terminal value of the asset and exclude any interest charges. To the extent the carrying value of the asset exceeds the undiscounted cash flows over the estimated remaining life of the asset, the impairment is measured using the discounted cash flows. The discount rate utilized would be based on management’s best estimate of the related risks and return at the time the impairment assessment is made.
Goodwill
The Company accounts for goodwill in accordance with the provisions of ASC Topic 350, Intangibles — Goodwill and Other. Under this accounting guidance, goodwill and intangible assets with indefinite lives are reviewed for impairment annually or more frequently if events or changes in circumstances indicate that the asset might be impaired. The first step of the goodwill impairment test, used to identify potential impairment, compares the fair value of a reporting unit with its carrying amount, including goodwill. The Company operates as one reporting unit and therefore compares the book value to the market value (market capitalization plus a control premium). If the market value exceeds the book value, goodwill is considered not impaired, and thus the second step of the impairment test is not necessary. If the Company’s book value exceeds the market value, the second step of the goodwill impairment test is performed to measure the amount of impairment loss, if any. The second step of the goodwill impairment test, used to measure the amount of impairment loss, compares the implied fair value of the goodwill with the book value of the goodwill. If the carrying value of the goodwill exceeds the implied fair value of the goodwill, an impairment loss would be recognized in an amount equal to the excess. Any loss recognized cannot exceed the carrying amount of goodwill. The Company completed the annual goodwill impairment assessment as of December 31, 2009, in which no impairment was recorded. If market conditions continue to fluctuate, the Company may incur goodwill impairment charges that adversely affect its financial position and operating results.
Revenue recognition
The Company recognizes revenue in accordance with ASC Topic 985, Revenue Recognition. The Company recognizes revenue when it is realized or realizable and earned. The Company considers revenue realized or realizable and earned when it has persuasive evidence of an arrangement, the product has been shipped or the services have been provided to the customer, the sales price is fixed or determinable, and collectability is probable.
License fee revenue is derived from the licensing of computer software. Hardware revenue is derived from the sale of system hardware, including peripheral equipment. Maintenance and service revenue is derived from software maintenance and from telephone support, installation, customer education and consulting services. The Company’s software licenses are generally sold as part of an arrangement that includes maintenance and support and often installation and customer education services.
The Company licenses software and sells products and services to end users and also indirectly through original equipment manufacturers, value-added resellers and independent distributors (collectively, “Resellers”). Terms offered by the Company do not generally differ between end users and Resellers. The Company generally offers terms that require payment within 30 to 90 days after product delivery. In rare situations where the Company offers terms that require payment beyond 90 days after product delivery, revenue is deferred until the payment becomes due. The Company does not generally offer rights of return or acceptance clauses to its customers. In rare situations where the Company provides rights of return or acceptance clauses, revenue is deferred until the clause expires. The Company evaluates the credit worthiness of all customers. In circumstances in which the Company does not have experience selling to a customer and lacks adequate credit information to conclude that collection is probable, revenue is deferred until collection is reasonably assured and all other revenue recognition criteria in the arrangement have been met. If all other revenue recognition criteria are met, license revenue from Resellers is recognized on a sell-in or sell-through basis depending on the arrangement with the Reseller. The Company
recognizes revenue from Resellers on a sell-in basis if the Reseller i) assumes all risk of the purchase, ii) has the ability and obligation to pay regardless of receiving payment from the end user, and iii) all other revenue recognition criteria are met. The majority of revenue generated through Resellers has been on a sell-in basis. The following are other revenue recognition criteria applied by the Company:
· Software and Hardware — Revenue from license fees and hardware is recognized when shipment of the product has occurred, no significant Company obligations with regard to implementation remain and the Company’s services are not considered essential to the functionality of other elements of the arrangement.
· Services — Revenue from maintenance and support arrangements is deferred and recognized ratably over the term of the maintenance and support arrangements. Revenue from customer education, installation and consulting services is recognized as the services are provided to customers or upon contractual expiration of such services.
· Multiple-Element Arrangements — The Company enters into arrangements with customers that include a combination of software products, system hardware, maintenance and support (which includes when-and-if-available unspecified upgrades), or installation and customer education services. For such arrangements, the Company recognizes revenue using the residual method. The Company allocates the total arrangement fee among the various elements of the arrangement based on the fair value of each of the undelivered elements determined by vendor-specific objective evidence. The fair value of installation and customer education services and maintenance and support services is established based upon sold separately pricing for the services or stated renewal rate. In software arrangements for which the Company does not have vendor-specific objective evidence of fair value for all elements, revenue is deferred until the earlier of when vendor-specific objective evidence is determined for the undelivered elements (residual method) or when all elements for which the Company does not have vendor-specific objective evidence of fair value have been delivered.
· Subscription Arrangements — Revenue from subscription arrangements is recognized ratably over the subscription period. Revenue from subscription arrangements is allocated to license revenue, maintenance and service revenue, and hardware revenue in a manner consistent with the allocation of revenue under the residual method for the same elements in non-subscription transactions.
Equity-based compensation
The Company accounts for equity-based compensation in accordance with ASC Topic 718, Compensation — Stock Compensation, which requires the measurement and recognition of compensation expense for all equity-based payment awards made to employees and directors, including employee stock options, restricted stock and employee stock purchases related to the Employee Stock Purchase Plan, based on estimated fair values.
Equity-based compensation expense recognized under ASC Topic 718 for the years ended December 31, 2009, 2008 and 2007 was $3.9 million, $5.0 million and $6.0 million, respectively.
Stock Options
ASC Topic 718 requires companies to estimate the fair value of equity-based payment awards on the date of grant using an option-pricing model. The Company uses the Black-Scholes option-pricing model, which requires the input of assumptions, including an estimate of the average period of time employees will retain vested stock options before exercising them, the estimated volatility of the Company’s common stock price over the expected term, and the number of options that will ultimately be forfeited before completing vesting requirements. Changes in the assumptions can materially affect the estimate of fair value of equity-based compensation and, consequently, the related expense recognized. The value of the portion of the award that is ultimately expected to vest is recognized as expense over the requisite vesting period.
Equity-based compensation expense recognized for the years ended December 31, 2009, 2008 and 2007 included compensation expense for equity-based payment awards granted on or prior to December 31, 2005 but not yet vested as of that date. Because equity-based compensation expense recognized for the years ended December 31, 2009, 2008 and 2007 is based on awards ultimately expected to vest, it has been reduced for estimated forfeitures.
ASC Topic 718 requires forfeitures to be estimated at the time of grant and revised, if necessary, in subsequent periods if actual forfeitures differ from those estimates.
The following table illustrates how equity-based compensation was allocated to the income statement as well as the effect on net income of all equity-based compensation recognized (in thousands, except per share data):
|
|
|
For the Year Ended December 31, |
|
|||||||
|
|
|
2009 |
|
2008 |
|
2007 |
|
|||
|
Cost of revenue |
|
$ |
323 |
|
$ |
333 |
|
$ |
389 |
|
|
Sales and marketing |
|
1,243 |
|
1,265 |
|
2,186 |
|
|||
|
Research and development |
|
945 |
|
1,179 |
|
949 |
|
|||
|
General and administrative |
|
1,356 |
|
2,230 |
|
2,463 |
|
|||
|
Equity-based compensation before income taxes |
|
3,867 |
|
5,007 |
|
5,987 |
|
|||
|
Income tax benefit |
|
(1,354 |
) |
(1,771 |
) |
(1,964 |
) |
|||
|
Total equity-based compensation after income taxes |
|
$ |
2,513 |
|
$ |
3,236 |
|
$ |
4,023 |
|
For purposes of calculating the fair value of options, the weighted average fair value of options granted during 2009, 2008 and 2007 were $3.74, $5.50 and $13.47, respectively. The weighted-average fair values for the options were based on the fair values on the dates of grant. The fair values for the options were calculated using the Black-Scholes option-pricing model, with the following weighted-average assumptions and expense adjusted using the following expected forfeiture rate assumptions:
|
|
|
For the Year Ended December 31, |
|
||||
|
|
|
2009 |
|
2008 |
|
2007 |
|
|
Expected option life |
|
3.69 years |
|
3.75 years |
|
3.75 years |
|
|
Expected volatility factor |
|
49 |
% |
46 |
% |
52 |
% |
|
Expected dividend yield |
|
0 |
% |
0 |
% |
0 |
% |
|
Risk-free interest rate |
|
1.67 |
% |
2.33 |
% |
4.46 |
% |
|
Expected forfeiture rate |
|
2 |
% |
1 |
% |
1 |
% |
Prior to March 9, 2006, the expected life of stock options was calculated by performing a detailed analysis of all historical stock option information available. On March 9, 2006, the Company began to grant options with a five-year legal life instead of the eight-year legal life that it had previously used. As a result, the Company has elected to use the “simplified” method to estimate the expected life of options granted on and after March 9, 2006. The Company will utilize the simplified method until sufficient historical information becomes available on the five-year legal life options. The expected volatility is calculated based on the historical volatility of the Company’s common stock over the expected option life and other appropriate factors. The expected dividend yield is based on the Company’s intent not to issue dividends for the foreseeable future. Risk-free interest rates are calculated based on continuously compounded U.S. Treasury risk-free rates for the appropriate term. The expected forfeiture rate is estimated based on historical experience.
As of December 31, 2009, there was $5.4 million of unrecognized compensation expense related to stock options that is expected to be recognized over a weighted-average period of 2.6 years.
Restricted Stock
The Company has granted nonvested shares of common stock (“restricted stock”) to certain employees under its 1997 Stock Option and Incentive Plan and 2006 Long-Term Incentive Plan. With the exception of shares of restricted stock subject to performance vesting, as noted below, restricted stock generally vests 25% annually beginning one year after the grant date. The Company records equity-based compensation expense equal to the fair market value of the common stock on the date of grant ratably over the vesting period. Equity-based compensation expense related to restricted stock was $328,000, $491,000 and $741,000 for the years ended December 31, 2009, 2008 and 2007, respectively.
In the first quarter of 2007, the Company granted shares of restricted stock with performance-based vesting to certain employees. The Company granted a total of 13,500 restricted shares with a total grant-date fair value of $464,000. As of December 31, 2009, after forfeitures, 6,700 restricted shares with a total grant-date fair value of $230,000 remained outstanding. Vesting of the awards was dependent upon achievement of certain Company performance metrics for fiscal years 2007 through 2009. The performance metrics were not achieved for the years ended December 31, 2009, 2008 and 2007, and therefore the awards, all of which remain unvested, will be forfeited upon the Company’s filing its Form 10-K for the year ended December 31, 2009. No equity-based compensation expense for the awards was recognized for the years ended December 31, 2009, 2008 and 2007. The first quarter of 2007 was the only period in which the Company granted restricted stock awards with performance-based vesting.
As of December 31, 2009, there was $440,000 of unrecognized compensation expense related to restricted stock awards that is expected to be recognized over a weighted-average period of 2.4 years. The aggregate fair value of restricted stock that vested was $325,000, $488,000 and $1.0 million for the years ended December 31, 2009, 2008 and 2007, respectively.
Employee Stock Purchase Plan
Employee Stock Purchase Plan (“ESPP”) compensation expense was $156,000, $154,000 and $161,000 for the years ended December 31, 2009, 2008 and 2007, respectively.
The fair value of stock compensation expense associated with the Company’s ESPP was estimated on the date of grant using the Black-Scholes option pricing model with the following weighted-average assumptions:
|
|
|
For the Year Ended December 31, |
|
||||
|
|
|
2009 |
|
2008 |
|
2007 |
|
|
Expected life of ESPP options |
|
3 months |
|
3 months |
|
3 months |
|
|
Expected volatility factor |
|
42 |
% |
46 |
% |
51 |
% |
|
Expected dividend yield |
|
0 |
% |
0 |
% |
0 |
% |
|
Risk-free interest rate |
|
0.15 |
% |
1.81 |
% |
4.59 |
% |
ASC Topic 718 requires the benefits of tax deductions from the exercise of stock options and settlement of restricted stock awards in excess of the compensation cost recognized for those options and stock awards to be classified as financing cash inflows rather than operating cash inflows on a prospective basis. This amount is shown as “Excess tax benefit from stock transactions” on the Consolidated Statement of Cash Flows.
The Company has elected to calculate its historical pool of windfall tax benefits (that is, the amount that would have accumulated as of the adoption date of ASC Topic 718) using the alternative (“short-cut”) method and the “tax law ordering approach” to determine when the historic tax benefits are realized (tax benefits realized based on provisions in the tax law that identify the sequence in which stock option deductions are utilized for tax purposes). The Company will continue to track the balance of the pool of windfall tax benefits based on windfalls or shortfalls incurred after the adoption date.
Research and development costs
Costs related to research, design and development of products are charged to research and development expense as incurred. Software development costs are capitalized beginning when a product’s technological feasibility has been established and ending when a product is available for general release to customers. The Company uses the working model approach to determine technological feasibility. Generally, the Company’s products are released soon after technological feasibility has been established. As a result, the Company has not capitalized any software development costs because such costs have not been significant.
Income taxes
The Company provides for income taxes using the liability method under ASC Topic 740, Income Taxes, which requires recognition of deferred tax assets and liabilities for the expected future tax consequences of events that have
been included in the financial statements. Under this statement, deferred tax assets and liabilities are determined based on the difference between the financial statement and tax basis of assets and liabilities using enacted tax rates in effect for the year in which the differences are expected to reverse. Deferred tax assets are reduced by a valuation allowance when it is more likely than not that some component or all of the deferred tax assets will not be realized. Tax rate changes are reflected in income during the period such changes are enacted.
Computation of net income per share
Basic earnings per share is computed using net income and the weighted average number of common shares outstanding. Diluted earnings per share reflect the weighted average number of common shares outstanding plus any potentially dilutive shares outstanding during the period. Potentially dilutive shares consist of shares issuable upon the exercise of stock options and warrants, as well as unvested restricted stock.
The computations for basic and diluted net income per share are as follows (in thousands, except per share amounts):
|
|
|
For the Year Ended December 31, |
|
|||||||
|
|
|
2009 |
|
2008 |
|
2007 |
|
|||
|
|
|
|
|
|
|
|
|
|||
|
Numerator: |
|
|
|
|
|
|
|
|||
|
Net (loss) income |
|
$ |
(21,252 |
) |
$ |
(2,800 |
) |
$ |
1,367 |
|
|
|
|
|
|
|
|
|
|
|||
|
Denominator: |
|
|
|
|
|
|
|
|||
|
Denominator for weighted average common shares outstanding – basic |
|
14,315 |
|
16,155 |
|
16,972 |
|
|||
|
|
|
|
|
|
|
|
|
|||
|
Dilution associated with the company’s stock based compensation plans |
|
— |
|
— |
|
485 |
|
|||
|
|
|
|
|
|
|
|
|
|||
|
Denominator: |
|
|
|
|
|
|
|
|||
|
Denominator for weighted average common shares outstanding – diluted |
|
14,315 |
|
16,155 |
|
17,457 |
|
|||
|
|
|
|
|
|
|
|
|
|||
|
Net (loss) income per share – basic |
|
$ |
(1.48 |
) |
$ |
(0.17 |
) |
$ |
0.08 |
|
|
Net (loss) income per share – diluted |
|
$ |
(1.48 |
) |
$ |
(0.17 |
) |
$ |
0.08 |
|
|
|
|
|
|
|
|
|
|
|||
|
Antidilutive stock options and restricted stock awards excluded from above calculation |
|
2,689 |
|
2,515 |
|
809 |
|
|||
Comprehensive income (loss)
Comprehensive income (loss) as defined by ASC Topic 220, Comprehensive Income, includes net income and items defined as other comprehensive income. This accounting guidance requires that items defined as other comprehensive income, such as foreign currency translation adjustments and unrealized gains and losses on certain marketable securities, be separately classified in the financial statements. Such items are reported in the consolidated statements of stockholders’ equity as comprehensive income (loss).
Recent accounting pronouncements
In October 2009, the Financial Accounting Standards Board (FASB) issued Accounting Standards Update (ASU) No. 2009-13, Multiple-Deliverable Revenue Arrangements—a consensus of the FASB Emerging Issues Task Force, that provides amendments to the criteria for separating consideration in multiple-deliverable arrangements. The ASU does not apply to arrangements for which industry specific allocation and measurement guidance exists, such as long-term construction contracts and software transactions. ASU No. 2009-13 is effective for the Company beginning January 1, 2011. The Company may elect to adopt the provisions prospectively to new or materially modified arrangements beginning on the effective date or retrospectively for all periods presented. The Company
does not expect that the adoption of this standard will have a material impact on the Company’s consolidated financial statements.
In October 2009, the FASB issued ASU No. 2009-14, Certain Revenue Arrangements That Include Software Elements—a consensus of the FASB Emerging Issues Task Force, that reduces the types of transactions that fall within the current scope of software revenue recognition guidance. Existing software revenue recognition guidance requires that its provisions be applied to an entire arrangement when the sale of any products or services containing or utilizing software when the software is considered more than incidental to the product or service. The ASU also provides guidance on how to allocate transaction consideration when an arrangement contains both deliverables within the scope of software revenue guidance (software deliverables) and deliverables not within the scope of that guidance (non-software deliverables). ASU No. 2009-14 is effective for the Company beginning January 1, 2011. The Company may elect to adopt the provisions prospectively to new or materially modified arrangements beginning on the effective date or retrospectively for all periods presented. However, the Company must elect the same transition method for this guidance as that chosen for ASU No. 2009-13. The Company does not expect that the adoption of this standard will have a material impact on the Company’s consolidated financial statements.
In January 2010, the FASB issued ASU No. 2010-6, Improving Disclosures About Fair Value Measurements, that amends existing disclosure requirements under ASC Topic 820 by adding required disclosures about items transferring into and out of levels 1 and 2 in the fair value hierarchy; adding separate disclosures about purchase, sales, issuances, and settlements relative to level 3 measurements; and clarifying, among other things, the existing fair value disclosures about the level of disaggregation. For the Company this ASU is effective for the first quarter of 2010, except for the requirement to provide level 3 activity of purchases, sales, issuances, and settlements on a gross basis, which is effective beginning the first quarter of 2011. Since this standard impacts disclosure requirements only, its adoption will not have a material impact on the Company’s consolidated results of operations or financial condition.
3. Financial statement components
Allowance for doubtful accounts
The allowance for doubtful accounts activity was as follows (in thousands):
|
|
|
For the Year Ended December 31, |
|
|||||||
|
|
|
2009 |
|
2008 |
|
2007 |
|
|||
|
|
|
|
|
|
|
|
|
|||
|
Beginning balance |
|
$ |
638 |
|
$ |
505 |
|
$ |
266 |
|
|
Provision |
|
279 |
|
519 |
|
239 |
|
|||
|
Write-offs |
|
(181 |
) |
(386 |
) |
— |
|
|||
|
Recoveries |
|
— |
|
— |
|
— |
|
|||
|
Ending balance |
|
$ |
736 |
|
$ |
638 |
|
$ |
505 |
|
Property and equipment, net
The components of property and equipment were as follows (in thousands):
|
|
|
December 31, |
|
||||
|
|
|
2009 |
|
2008 |
|
||
|
|
|
|
|
|
|
||
|
Equipment |
|
$ |
14,734 |
|
$ |
13,551 |
|
|
Furniture and fixtures |
|
4,092 |
|
3,993 |
|
||
|
Computer software |
|
4,358 |
|
7,572 |
|
||
|
Leasehold improvements |
|
2,629 |
|
2,521 |
|
||
|
Total property and equipment |
|
25,813 |
|
27,637 |
|
||
|
Less accumulated depreciation and amortization |
|
(20,328 |
) |
(16,118 |
) |
||
|
Property and equipment, net |
|
$ |
5,485 |
|
$ |
11,519 |
|
In 2007, the Company began the implementation of an enterprise resource planning (“ERP”) system. The ERP system was intended to replace numerous disconnected business management software applications and link the data contained within these disconnected systems to enable better management of the Company’s business and derive more useful data for various business functions, such as sales, marketing, finance and customer support.
Phase 1 of the implementation, which related to the replacement of the Company’s general ledger, was completed in 2007. The related capitalized costs are being depreciated over seven years and, as of December 31, 2009, the net book value of Phase 1 was $626,000. Phase 2 of the implementation, which consisted of replacing the Company’s various customer relationship management and order processing systems, was put on hold in 2008 in conjunction with its cost-control efforts. In 2009, the Company determined, in conjunction with continued cost-control measures, that it would not implement Phase 2. As a result, in 2009 the Company recognized an asset impairment charge of $3.1 million related to the Phase 2 implementation.
Other intangible assets, net
Acquired intangible assets subject to amortization were as follows (in thousands):
|
|
|
December 31, 2009 |
|
December 31, 2008 |
|
||||||||||||||
|
|
|
Gross Carrying |
|
Accumulated |
|
Net Carrying |
|
Gross Carrying |
|
Accumulated |
|
Net Carrying |
|
||||||
|
|
|
|
|
|
|
|
|
|
|
|
|
|
|
||||||
|
Software technology |
|
$ |
3,400 |
|
$ |
(3,400 |
) |
$ |
— |
|
$ |
3,400 |
|
$ |
(3,334 |
) |
$ |
66 |
|
|
Patents and patent applications |
|
2,500 |
|
(2,118 |
) |
382 |
|
2,500 |
|
(1,758 |
) |
742 |
|
||||||
|
Total intangible assets subject to amortization |
|
$ |
5,900 |
|
$ |
(5,518 |
) |
$ |
382 |
|
$ |
5,900 |
|
$ |
(5,092 |
) |
$ |
808 |
|
During the 2007, the Company recognized a $242,000 patent impairment charge related to a patent application acquired in the HInnovation, Inc. acquisition in February 2004. This patent application was rejected by the United States Patent and Trademark Office on August 23, 2007, and the Company decided not to pursue this application further.
Intangible assets subject to amortization are amortized on a straight-line basis over the estimated period of benefit. Amortization expense was $426,000, $1.0 million and $1.2 million for the years ended December 31, 2009, 2008 and 2007, respectively. The estimated future annual amortization expense for identified intangible assets is as follows (in thousands):
|
2010 |
|
$ |
360 |
|
|
2011 |
|
22 |
|
|
|
|
|
$ |
382 |
|
The preceding expected amortization expense is an estimate. Actual amortization expense may differ from estimates due to additional intangible asset acquisitions, impairment of intangible assets, accelerated amortization of intangible assets, and other events.
Goodwill
There were no changes to the carrying value of goodwill for the years ended December 31, 2009 and 2008. The Company’s goodwill has never been impaired.
Deferred revenue
The components of deferred revenue were as follows (in thousands):
|
|
|
December 31, |
|
||||
|
|
|
2009 |
|
2008 |
|
||
|
|
|
|
|
|
|
||
|
Maintenance and support |
|
$ |
13,043 |
|
$ |
13,912 |
|
|
Customer education |
|
2,036 |
|
3,034 |
|
||
|
Professional services |
|
848 |
|
788 |
|
||
|
Software |
|
255 |
|
616 |
|
||
|
Hardware and other |
|
351 |
|
538 |
|
||
|
Total deferred revenue |
|
16,533 |
|
18,888 |
|
||
|
Less current portion |
|
(15,500 |
) |
(17,724 |
) |
||
|
Long-term portion of deferred revenue |
|
$ |
1,033 |
|
$ |
1,164 |
|
4. Commitments and contingencies
Operating lease commitments
The Company rents office space and certain office equipment under operating leases. In addition to minimum lease payments, the office leases require payment of a proportionate share of real estate taxes and building operating expenses. Total rent expense, including an allocation of the lessor’s operating costs, was $1.8 million, $1.8 million and $1.7 million for the years ended December 31, 2009, 2008 and 2007, respectively.
In March 2004, the Company signed a non-cancelable operating lease for a new office facility in Minnetonka, Minnesota. The new lease term started in February 2005 and expires in January 2012. The Company moved into the Minnetonka location and moved out of its Plymouth, Minnesota location in February 2005.
The Company recorded deferred rent of $1.6 million in the first quarter of 2005 relating to estimated payments by the Minnetonka lessor for the benefit of the Company. Such payments are considered lease incentives under ASC Topic 840, Leases, and are amortized as a reduction of rent expense over the term of the Minnetonka lease.
During the year ended December 31, 2007, the Company expanded its Minnetonka headquarters and received leasehold improvements paid for by the Minnetonka lessor of $199,000. Such leasehold improvements were recorded as an asset by the Company and amortized over the shorter of their estimated useful lives or the remaining terms of the related leases, with a corresponding amount recorded as deferred rent and amortized as a reduction of rent expense over the term of the Minnetonka lease.
The deferred rent balance was $882,000 ($413,000 was classified as current) and $1.3 million ($394,000 was classified as current) as of December 31, 2009 and 2008, respectively.
The minimum lease payments, excluding estimated taxes and operating cost rent obligations, are approximately (in thousands):
|
Year |
|
Amount |
|
|
|
2010 |
|
$ |
1,026 |
|
|
2011 |
|
1,020 |
|
|
|
2012 |
|
182 |
|
|
|
Total |
|
$ |
2,228 |
|
Other items
Under general contract terms, the Company sometimes includes an indemnification clause in its software licensing agreement providing that the Company will indemnify the licensee against liability and damages arising from any claims of patent, copyright, trademark or trade secret infringement by the Company’s software. The Company has incurred insignificant costs as a result of this type of indemnification clause, and the Company does not maintain a product warranty liability related to such indemnification clauses.
The Company has entered into various employment agreements with certain executives of the Company, which include provisions for severance payments subject to certain conditions and events.
The Company recorded an $885,000 charge in the fourth quarter of 2007 related to the resignation of Jay D. Miller, the company’s former president and chief executive officer, of which $580,000 related to 2008 cash payments and $305,000 related to equity-based compensation.
The Company is involved in various claims and legal actions in the normal course of business. Management is of the opinion that the outcome of such legal actions will not have a significant adverse effect on the Company’s financial position, results of operations or cash flows. Notwithstanding management’s belief, an unfavorable resolution of some or all of these matters could materially affect the Company’s future results of operations or cash flows.
5. Stockholders’ equity
Background
On October 28, 1996, the Board of Directors of Bio-Vascular, Inc. (“Bio-Vascular”), now known as Synovis Life Technologies, Inc., the former parent of the Company, approved a plan to spin off and establish the Company as an independent, publicly-owned company. On May 12, 1997 (the “Distribution Date”), Bio-Vascular distributed all of the shares of the Company to the shareholders of Bio-Vascular (the “Distribution”), and on that date the Company began operating as an independent public company. All Bio-Vascular shareholders of record as of May 5, 1997 received one share of the Company’s common stock for each two shares of Bio-Vascular stock held on that date and cash in lieu of fractional shares.
Share Repurchase Program
During 2008, the Company’s Board of Directors approved a share repurchase program, which authorized open market transactions of up to $40.0 million, including fees and expenses, of the Company’s common stock. On March 3, 2009, the Company announced additional repurchases of up to 1.0 million shares of its common stock. The program authorizes management to repurchase shares from time to time, depending on market conditions. During 2008, the Company completed stock repurchases of 2.8 million shares for $38.2 million, inclusive of fees and expenses. During 2009, the Company completed stock repurchases of 562,000 shares for $6.1 million, inclusive of fees and expenses. As of December 31, 2009, the Company had purchased 3.3 million shares of its common stock for $44.3 million through open market transactions. The maximum number of shares that may yet be purchased under the plans or programs was 588,000 shares as of December 31, 2009. The active share repurchase program expires on March 1, 2011.
At time of repurchase, shares are returned to the status of authorized and unissued shares. The Company has accounted for the repurchases as constructively retired and recorded such repurchases as a reduction of common stock and additional paid-in capital.
Stock option plans
In May 1997, Bio-Vascular, Inc., which is now known as Synovis Life Technologies, Inc., as the sole shareholder of the Company, approved and adopted the Vital Images, Inc. 1997 Stock Option and Incentive Plan (the “1997 Plan”), which became effective on the Distribution Date. Under the terms of the 1997 Plan, the Board of Directors or a committee of the Board may grant options and other equity-based awards to key employees to purchase shares of the Company’s common stock at an option exercise price equal to or greater than 85% of the fair market value on the date of grant. The options are exercisable at such times, in installments or otherwise, as the Board of Directors or a committee of the Board may determine. Generally, these options have a term of five or eight years and are exercisable as to 28% of the total grant one year after the date of grant and 2% per month thereafter. The total number of shares of common stock that may be issued or awarded under the 1997 Plan was 4,100,000 shares. The 1997 Plan expired on March 19, 2007, and no more rights to purchase shares will be granted from it.
Also in May 1997, Bio-Vascular, as the sole shareholder of the Company, approved and adopted the Vital Images, Inc. 1997 Director Stock Option Plan (the “Director Plan”), which became effective on the Distribution Date. The Director Plan provides non-employee directors with automatic grants of stock options and allows the Board of Directors to make additional discretionary option grants to any or all directors. Options that are granted under the Director Plan are granted with an option price equal to the fair market value on the date of grant, have a term of five or eight years, are non-qualified options, and become exercisable in three equal annual installments beginning on the first occurring December 31 after the date of grant. The total number of shares of common stock that may be issued or awarded under the Director Plan was 500,000 shares. The Director Plan expired on March 19, 2007, and no more rights to purchase shares will be granted from it.
On May 4, 2006, the shareholders of the Company approved the Vital Images, Inc. 2006 Long-Term Incentive Plan (the “2006 Plan”). The 2006 Plan provides that the total number of shares of the Company’s common stock that may be subject to options, restricted stock awards and other equity awards granted under the 2006 Plan shall not exceed 900,000 shares. On June 3, 2008, the shareholders of the Company approved an amendment to the 2006 Plan to increase the shares reserved under the plan by 1.6 million shares, resulting in total shares reserved for issuance under the 2006 Plan of 2.5 million shares. The 2006 Plan provides the Board of Directors or a committee of the Board the authority to grant incentive stock options qualified as such under Section 422 of the Internal Revenue Code of 1986 and nonqualified stock options, awards of restricted stock, stock appreciation rights, other equity-based awards, cash-based awards or any combination of such awards subject to the terms of the 2006 Plan. As of December 31, 2009, 894,106 shares remained available for the grant of awards under the 2006 Plan.
The following table summarizes stock option activity for 2009, 2008 and 2007:
|
|
|
Shares Underlying |
|
Weighted-Average |
|
Weighted-Average |
|
Aggregate |
|
||
|
|
|
|
|
|
|
|
|
|
|
||
|
Total outstanding as of December 31, 2006 |
|
1,797,179 |
|
$ |
16.24 |
|
|
|
|
|
|
|
|
|
|
|
|
|
|
|
|
|
||
|
Options granted |
|
469,595 |
|
$ |
30.99 |
|
|
|
|
|
|
|
Options exercised |
|
(220,604 |
) |
$ |
10.68 |
|
|
|
|
|
|
|
Options cancelled |
|
(64,766 |
) |
$ |
26.66 |
|
|
|
|
|
|
|
|
|
|
|
|
|
|
|
|
|
||
|
Total outstanding as of December 31, 2007 |
|
1,981,404 |
|
$ |
20.03 |
|
|
|
|
|
|
|
|
|
|
|
|
|
|
|
|
|
||
|
Options granted |
|
1,081,070 |
|
$ |
14.77 |
|
|
|
|
|
|
|
Options exercised |
|
(242,525 |
) |
$ |
7.95 |
|
|
|
|
|
|
|
Options cancelled |
|
(367,090 |
) |
$ |
23.93 |
|
|
|
|
|
|
|
|
|
|
|
|
|
|
|
|
|
||
|
Total outstanding as of December 31, 2008 |
|
2,452,859 |
|
$ |
18.32 |
|
|
|
|
|
|
|
|
|
|
|
|
|
|
|
|
|
||
|
Options granted |
|
576,220 |
|
$ |
9.86 |
|
|
|
|
|
|
|
Options exercised |
|
(163,008 |
) |
$ |
7.07 |
|
|
|
|
|
|
|
Options cancelled |
|
(226,304 |
) |
$ |
20.52 |
|
|
|
|
|
|
|
|
|
|
|
|
|
|
|
|
|
||
|
Total outstanding as of December 31, 2009 |
|
2,639,767 |
|
$ |
16.98 |
|
2.73 |
|
$ |
2,182 |
|
|
Options exercisable as of: |
|
|
|
|
|
|
|
|
|
||
|
December 31, 2007 |
|
1,206,104 |
|
$ |
14.71 |
|
|
|
|
|
|
|
December 31, 2008 |
|
1,259,018 |
|
$ |
18.98 |
|
|
|
|
|
|
|
December 31, 2009 |
|
1,470,633 |
|
$ |
19.67 |
|
2.28 |
|
$ |
563 |
|
Various price ranges and weighted average information for options outstanding and exercisable as of December 31, 2009 are as follows:
|
|
|
Options Outstanding |
|
Options Exercisable |
|
||||||||||||
|
Range of |
|
Number |
|
Weighted Average |
|
Weighted |
|
Number |
|
Weighted |
|
||||||
|
$ |
7.25 |
- |
$ |
9.60 |
|
460,324 |
|
3.17 |
|
$ |
8.79 |
|
114,974 |
|
$ |
8.81 |
|
|
$ |
9.94 |
- |
$ |
12.60 |
|
497,215 |
|
2.52 |
|
$ |
11.91 |
|
178,165 |
|
$ |
12.04 |
|
|
$ |
12.64 |
- |
$ |
15.24 |
|
506,952 |
|
3.27 |
|
$ |
15.10 |
|
221,344 |
|
$ |
15.08 |
|
|
$ |
15.25 |
- |
$ |
16.57 |
|
493,887 |
|
3.14 |
|
$ |
15.70 |
|
367,366 |
|
$ |
15.85 |
|
|
$ |
16.65 |
- |
$ |
32.14 |
|
553,924 |
|
1.82 |
|
$ |
27.41 |
|
484,566 |
|
$ |
27.10 |
|
|
$ |
32.16 |
- |
$ |
35.70 |
|
127,465 |
|
2.21 |
|
$ |
33.36 |
|
104,218 |
|
$ |
33.41 |
|
|
|
|
|
|
2,639,767 |
|
2.73 |
|
$ |
16.98 |
|
1,470,633 |
|
$ |
19.67 |
|
||
The aggregate intrinsic value of options (that is, the amount by which the market price of the stock on the date of exercise exceeded the exercise price of the option) exercised during the years ended December 31, 2009, 2008 and 2007 was $773,000, $1.5 million and $4.4 million, respectively. The Company issues new shares when stock option awards are exercised. Cash received from the exercise of stock options for the years ended December 31, 2009, 2008 and 2007 was $1.2 million, $1.9 million and $2.4 million, respectively. The total tax benefit related to tax deductions from options exercised for the years ended December 31, 2009, 2008 and 2007 was $255,000, $490,000 and $1.5 million, respectively.
Cash Tender Offer for Employee Stock Options
On February 22, 2010, the Company filed a cash tender offer for certain employee stock options. The tender offer is planned to terminate, unless otherwise extended by the Company in its sole discretion, 20 business days after its commencement. The tender offer applies to outstanding stock options held by employees with an exercise price equal to or greater than $25.00 per share. The price to be offered for each eligible stock option is a discount to its Black-Scholes fair value. The Company’s management may participate in this offer, but non-employee members of the Company’s board of directors may not. As of February 16, 2010, there were approximately 406,000 eligible options. If all eligible options are tendered and accepted in the offer, the aggregate cash purchase price would be approximately $213,000.
As a result of the tender offer, the Company will incur an equity-based compensation charge of up to $760,000, consisting of the remaining unamortized equity-based compensation expense associated with the eligible options tendered in the offer. This charge would be reflected in the financial results of the fiscal quarter in which the offer is completed, currently anticipated to be the first quarter of 2010.
The tender offer is subject to a number of other terms and conditions set forth in the offering documents. Neither the Company’s management nor its board of directors makes any recommendation in connection with the tender offer.
Restricted stock
The Company grants nonvested shares of common stock (“restricted stock”) to certain employees under the 1997 Plan and the 2006 Plan. The restricted stock generally vests 25% annually beginning one year after the grant date. The following table summarizes the restricted stock activity for the years ended December 31, 2009, 2008 and 2007:
|
|
|
Restricted |
|
Weighted-Average |
|
|
|
Total outstanding as of December 31, 2006 |
|
115,677 |
|
$ |
21.65 |
|
|
Shares granted |
|
14,250 |
|
$ |
34.21 |
|
|
Shares vested |
|
(35,677 |
) |
$ |
20.88 |
|
|
Shares forfeited/cancelled |
|
(4,647 |
) |
$ |
24.53 |
|
|
Total outstanding as of December 31, 2007 |
|
89,603 |
|
$ |
23.81 |
|
|
Shares granted |
|
30,000 |
|
$ |
13.74 |
|
|
Shares vested |
|
(29,816 |
) |
$ |
20.98 |
|
|
Shares forfeited/cancelled |
|
(27,210 |
) |
$ |
25.42 |
|
|
Total outstanding as of December 31, 2008 |
|
62,577 |
|
$ |
19.63 |
|
|
Shares granted |
|
15,000 |
|
$ |
12.02 |
|
|
Shares vested |
|
(28,085 |
) |
$ |
18.64 |
|
|
Shares forfeited/cancelled |
|
(369 |
) |
$ |
24.48 |
|
|
Total outstanding as of December 31, 2009 |
|
49,123 |
|
$ |
17.83 |
|
The total tax benefit related to tax deductions from restricted stock vested during the years ended December 31, 2009, 2008 and 2007 was $118,000, $183,000 and $368,000, respectively.
Employee stock purchase plan
The ESPP was approved and adopted by Bio-Vascular, as the sole shareholder of the Company, in May 1997. The ESPP, which became effective on July 1, 1997, enables eligible employees to purchase the Company’s common stock at a price equal to 85% of the fair market value of the stock on the date an offering period commences or on the date an offering period terminates, whichever is lower. Shares of common stock are offered under the ESPP during a series of offering periods, with each offering period running for a calendar quarter. On June 3, 2008, the shareholders of the Company approved an amendment to the ESPP to increase, from 250,000 shares of common stock to 400,000 shares of common stock, the number of aggregate shares of common stock that can be issued and sold to participating employees of the Company under the ESPP. The ESPP covers substantially all employees,
subject to certain limitations. Each employee may elect to have up to 10% of his or her base pay withheld and applied toward the purchase of shares in each such offering period. As of December 31, 2009, 82,258 shares of common stock remained reserved for future purchases under the ESPP.
6. Income taxes
The Company has adopted accounting guidance related to uncertain tax positions. This accounting guidance prescribes a recognition threshold and measurement attribute for recognition and measurement of a tax position taken or expected to be taken in a tax return. It also provides guidance on de-recognition, classification, interest and penalties, accounting in interim periods, disclosure and transition. The adoption of uncertain tax position guidance did not have a material impact on the Company’s Consolidated Financial Statements. Additionally, the adoption of the guidance had no impact on retained earnings or the gross liability for uncertain tax positions. The Company had no uncertain tax positions as of December 31, 2009 and 2008.
The Company did not have any material unrecognized tax benefits as of December 31, 2009 and 2008. The Company recognizes potential accrued interest and penalties related to unrecognized tax benefits as a component of income tax expense. To the extent interest and penalties are not assessed with respect to uncertain tax positions, amounts accrued will be reduced and reflected as a reduction of the overall income tax provision. The Company recorded no interest and penalties during the year ended December 31, 2009 and 2008 and had no accrued interest and penalties as of December 31, 2009. The Company is no longer subject to U.S. federal tax examinations by tax authorities for tax years before 2006. The Company is open to state tax audits until the applicable statute of limitations expires.
The components of income before income taxes were as follows (in thousands):
|
|
|
For the Year Ended December 31, |
|
|||||||
|
|
|
2009 |
|
2008 |
|
2007 |
|
|||
|
Income before income taxes: |
|
|
|
|
|
|
|
|||
|
U.S. |
|
$ |
(7,343 |
) |
$ |
(5,710 |
) |
$ |
1,313 |
|
|
International |
|
423 |
|
528 |
|
405 |
|
|||
|
|
|
(6,920 |
) |
(5,182 |
) |
1,718 |
|
|||
The income tax provision included the following components (in thousands):
|
|
|
For the Year Ended December 31, |
|
|||||||
|
|
|
2009 |
|
2008 |
|
2007 |
|
|||
|
Current income taxes: |
|
|
|
|
|
|
|
|||
|
Federal |
|
$ |
— |
|
$ |
— |
|
$ |
112 |
|
|
State |
|
— |
|
— |
|
140 |
|
|||
|
Foreign |
|
107 |
|
139 |
|
115 |
|
|||
|
|
|
107 |
|
139 |
|
367 |
|
|||
|
Deferred income taxes: |
|
|
|
|
|
|
|
|||
|
Federal |
|
14,417 |
|
(2,296 |
) |
93 |
|
|||
|
State |
|
(192 |
) |
(225 |
) |
(109 |
) |
|||
|
Foreign |
|
— |
|
— |
|
— |
|
|||
|
|
|
14,225 |
|
(2,521 |
) |
(16 |
) |
|||
|
Provision for income taxes |
|
$ |
14,332 |
|
$ |
(2,382 |
) |
$ |
351 |
|
During 2009, the Company recognized $194,000 in one-time tax benefits resulting from tax legislation, which enabled the Company to receive cash payment for the monetization of certain historic research and development tax credits. Also as a result of the legislation, the Company recognized a $248,000 one-time tax benefit related to the refund of certain alternative minimum tax payments in prior years.
A reconciliation of the Company’s income tax provision computed using the federal statutory rate to the tax provision reported in the Company’s statements of operations is as follows (in thousands):
|
|
|
For the Year Ended December 31, |
|
|||||||
|
|
|
2009 |
|
2008 |
|
2007 |
|
|||
|
Tax provision (benefit) computed at the federal statutory rate |
|
$ |
(2,353 |
) |
$ |
(1,762 |
) |
$ |
584 |
|
|
State taxes, net of federal benefit |
|
(111 |
) |
(132 |
) |
96 |
|
|||
|
Increase (decrease) in tax from: |
|
|
|
|
|
|
|
|||
|
Stock-based compensation |
|
49 |
|
52 |
|
244 |
|
|||
|
Research and development tax credits |
|
(495 |
) |
(725 |
) |
(682 |
) |
|||
|
Business meals and entertainment |
|
93 |
|
119 |
|
119 |
|
|||
|
Foreign tax rate differential |
|
(36 |
) |
(39 |
) |
(23 |
) |
|||
|
Change in valuation allowance |
|
17,205 |
|
108 |
|
(4 |
) |
|||
|
Other, net |
|
(20 |
) |
(3 |
) |
17 |
|
|||
|
Provision (benefit) for income taxes |
|
$ |
14,332 |
|
$ |
(2,382 |
) |
$ |
351 |
|
The significant components of the Company’s tax-effected net deferred tax assets were as follows (in thousands):
|
|
|
December 31, 2009 |
|
December 31, 2008 |
|
||||||||
|
|
|
Deferred tax |
|
Deferred tax |
|
Deferred tax |
|
Deferred tax |
|
||||
|
|
|
|
|
|
|
|
|
|
|
||||
|
Net operating loss carryforwards |
|
$ |
5,464 |
|
$ |
— |
|
$ |
4,418 |
|
$ |
— |
|
|
Research and development tax credit |
|
4,585 |
|
— |
|
4,285 |
|
— |
|
||||
|
Equity-based compensation |
|
4,329 |
|
— |
|
3,736 |
|
— |
|
||||
|
Depreciation and amortization |
|
1,598 |
|
— |
|
1,286 |
|
— |
|
||||
|
Accrued expenses and allowances |
|
813 |
|
— |
|
760 |
|
— |
|
||||
|
Deferred revenue |
|
388 |
|
— |
|
425 |
|
— |
|
||||
|
Other |
|
23 |
|
— |
|
270 |
|
— |
|
||||
|
Identified intangible assets |
|
— |
|
140 |
|
— |
|
295 |
|
||||
|
Unrealized gain on investments |
|
— |
|
56 |
|
— |
|
106 |
|
||||
|
Total deferred taxes before valuation allowance |
|
17,200 |
|
196 |
|
15,180 |
|
401 |
|
||||
|
Less valuation allowance |
|
(17,200 |
) |
(196 |
) |
(221 |
) |
— |
|
||||
|
Net deferred taxes |
|
$ |
— |
|
$ |
— |
|
$ |
14,959 |
|
$ |
401 |
|
Realizability of deferred tax assets
Companies are required to assess whether a valuation allowance should be recorded against their deferred tax assets based on the consideration of all available evidence, using a “more likely than not” realization standard. The four sources of taxable income that must be considered in determining whether deferred tax assets will be realized are: 1) future reversals of existing taxable temporary differences; 2) future taxable income exclusive of reversing temporary differences and carryforwards; 3) taxable income in prior carryback years if carryback is permitted under the tax law; and 4) tax planning strategies.
The Company has evaluated its deferred tax assets each reporting period, including making an assessment of cumulative pretax results in recent years and projections of cumulative pretax results in future periods. As a general guideline, the Company considered the cumulative pretax results from the most recent three years. A significant
negative factor in the Company’s assessment at June 30, 2009 was that the Company would transition to a three-year historical cumulative pretax loss during 2009, as highly profitable quarters in 2006 were removed from the cumulative three-year pretax results. In addition, uncertain near-term market and economic conditions reduced the Company’s ability to rely on projections of future taxable income in assessing the realization of the Company’s deferred tax assets. As a result, during the three months ended June 30, 2009, the Company recorded a non-cash charge of $15.0 million to the provision for income taxes to establish a full valuation allowance against its deferred tax assets. If pretax results improve in future periods, the Company may be able to utilize the deferred tax assets to reduce tax payments.
Net operating loss carryforwards and other tax credit carryforwards
The Company had federal tax loss carryforwards of approximately $15.5 million, representing a $5.3 million deferred tax asset as of December 31, 2009. The federal tax loss carryforwards will expire in 2019 through 2028 if not utilized. The Company had a full valuation allowance against this deferred tax asset as of December 31, 2009.
The Company had state tax loss carryforwards of approximately $3.7 million, representing a $199,000 deferred tax asset as of December 31, 2009. The state tax loss carryforwards will expire at various dates through 2025 if not utilized. The Company had a full valuation allowance against this deferred tax asset as of December 31, 2009.
The Company had other federal and state tax credits and carryforwards of approximately $4.7 million, representing a $4.7 million deferred tax asset as of December 31, 2009. The federal and state credits and carryforwards will expire in 2010 through 2029 if not utilized. The Company had a full valuation allowance against this deferred tax asset as of December 31, 2009.
Changes in the valuation allowance were as follows (in thousands):
|
|
|
For the Year Ended December 31, |
|
|||||||
|
|
|
2009 |
|
2008 |
|
2007 |
|
|||
|
|
|
|
|
|
|
|
|
|||
|
Beginning balance |
|
$ |
221 |
|
$ |
139 |
|
$ |
185 |
|
|
Additions |
|
17,225 |
|
108 |
|
— |
|
|||
|
Reversals |
|
(442 |
) |
— |
|
(4 |
) |
|||
|
Write-offs |
|
— |
|
(26 |
) |
(42 |
) |
|||
|
Ending balance |
|
$ |
17,004 |
|
$ |
221 |
|
$ |
139 |
|
Net operating loss carryforward limitations
Under Section 382 of the Internal Revenue Code of 1986, certain stock transactions which significantly change ownership, including the sale of stock and the granting of options to purchase stock, could limit the amount of net operating loss carryforwards that may be utilized on an annual basis to offset taxable income in future periods. Management believes that any past changes in ownership, as defined by Section 382, would not materially impact the Company’s ability to utilize loss carryforwards.
7. Employee benefit plan
The Company maintains the Vital Images, Inc. Salary Savings Plan (the “Plan”), which is intended to qualify under Section 401(k) of the Internal Revenue Code of 1986, as amended. The Plan covers substantially all employees. Each employee may elect to contribute to the Plan through payroll deductions up to 100% of his or her salary, subject to certain limitations. At the discretion of the Board of Directors, the Company may make matching contributions equal to a percentage of the salary reduction contributions or other discretionary amounts. The Company paid matching contributions of $372,000, $412,000 and $410,000 in 2009, 2008 and 2007, respectively.
8. Research and development
In January 2009, the Company and Toshiba entered into a development agreement under which Toshiba provides funding in support of the Company’s research and development efforts, and the parties work collaboratively to develop and deliver innovative technology advancements for Toshiba’s medical equipment and the Company’s advanced visualization software solutions. Software developed under the agreement is owned by the Company, and intellectual property in either party’s possession that may be useful in the development efforts or that is produced during the development activities is subject to cross-licenses. For payments received under the agreement, the Company’s policy is to offset research and development expense in the period in which the related costs are incurred. The agreement does not provide for recourse of payments previously offset against incurred expenses. The Company received payments of $1,024,000 in 2009, and recognized credits of $1,137,000 in 2009, to its research and development expense for reimbursement from Toshiba to offset the development costs the Company incurred during the respective periods under the agreement. The remaining unpaid balance of $113,000 was included in other current assets as of December 31, 2009.
9. Restructuring charge
The Company reduced its workforce by approximately 11% under a plan announced in November 2008 in order to align the Company’s operations with market conditions and improve profitability in future periods. In connection with the reduction in workforce, the Company incurred certain charges in 2008 totaling $660,000, which were primarily comprised of employee severance and other termination costs. The following table summarizes 2008 restructuring transactions, subsequent payments, and related liability balances (in thousands):
|
|
|
Severance and |
|
|
|
Balance at January 1, 2008 |
|
$ |
— |
|
|
Restructuring charges |
|
660 |
|
|
|
Payments |
|
(519 |
) |
|
|
Balance at December 31, 2008 |
|
141 |
|
|
|
Payments |
|
(141 |
) |
|
|
Balance at December 31, 2009 |
|
$ |
— |
|
Actions with respect to the above activities were completed in the fourth quarter of 2008.
10. Significant customers and geographic data
Customers accounting for more than 10% of the Company’s total revenue are as follows (in thousands):
|
|
|
For the Year Ended December 31, |
|
|||||||
|
|
|
2009 |
|
2008 |
|
2007 |
|
|||
|
|
|
|
|
|
|
|
|
|||
|
Toshiba Medical Systems Corporation |
|
$ |
31,457 |
|
$ |
35,275 |
|
$ |
32,710 |
|
|
Percentage of total revenue |
|
54 |
% |
52 |
% |
47 |
% |
|||
Customers accounting for more than 10% of the Company’s accounts receivable are as follows (in thousands):
|
|
|
December 31, |
|
||
|
|
|
2009 |
|
2008 |
|
|
|
|
|
|
|
|
|
Toshiba Medical Systems Corporation |
|
36 |
% |
42 |
% |
|
McKesson Information Solutions LLC |
|
14 |
% |
7 |
% |
|
Medtronic Inc. |
|
12 |
% |
— |
% |
The majority of the Company’s long-lived assets are located in the United States.
Export revenue accounted for 34%, 29% and 19% of total revenue for the years ended December 31, 2009, 2008 and 2007, respectively. The Company’s export sales are primarily negotiated, invoiced and paid in U.S. dollars, with a portion of sales transactions denominated in foreign currencies.
Sales to customers located in the following geographic areas are summarized as follows (in thousands):
|
|
|
For the Year Ended December 31, |
|
|||||||
|
|
|
2009 |
|
2008 |
|
2007 |
|
|||
|
|
|
|
|
|
|
|
|
|||
|
United States |
|
$ |
38,251 |
|
$ |
48,473 |
|
$ |
56,630 |
|
|
Europe |
|
10,881 |
|
11,316 |
|
8,378 |
|
|||
|
Asia and Pacific |
|
4,867 |
|
4,383 |
|
2,907 |
|
|||
|
Other foreign |
|
4,231 |
|
3,969 |
|
2,261 |
|
|||
|
|
|
$ |
58,230 |
|
$ |
68,141 |
|
$ |
70,176 |
|
11. Selected quarterly financial data (unaudited)
The following summarized unaudited quarterly financial data has been prepared using the unaudited quarterly financial statements of the Company (in thousands, except per share data):
|
|
|
First Quarter |
|
Second Quarter |
|
Third Quarter |
|
Fourth Quarter |
|
||||
|
|
|
|
|
|
|
|
|
|
|
||||
|
2009 |
|
|
|
|
|
|
|
|
|
||||
|
Total revenue |
|
$ |
14,788 |
|
$ |
13,375 |
|
$ |
14,300 |
|
$ |
15,767 |
|
|
Gross profit |
|
$ |
11,232 |
|
$ |
10,125 |
|
$ |
10,836 |
|
$ |
11,832 |
|
|
Net loss |
|
$ |
(251 |
) |
$ |
(19,621 |
) |
$ |
(750 |
) |
$ |
(630 |
) |
|
Loss per share – basic and diluted (1) |
|
$ |
(0.02 |
) |
$ |
(1.37 |
) |
$ |
(0.05 |
) |
$ |
(0.04 |
) |
|
|
|
|
|
|
|
|
|
|
|
||||
|
2008 |
|
|
|
|
|
|
|
|
|
||||
|
Total revenue |
|
$ |
17,317 |
|
$ |
15,707 |
|
$ |
17,679 |
|
$ |
17,438 |
|
|
Gross profit |
|
$ |
13,397 |
|
$ |
12,106 |
|
$ |
13,619 |
|
$ |
13,146 |
|
|
Net loss |
|
$ |
(594 |
) |
$ |
(1,577 |
) |
$ |
(243 |
) |
$ |
(386 |
) |
|
Loss per share – basic and diluted (1) |
|
$ |
(0.03 |
) |
$ |
(0.09 |
) |
$ |
(0.02 |
) |
$ |
(0.03 |
) |
(1) The sum of the quarterly earnings (loss) per share may not equal the annual earnings per share due to changes in average shares outstanding.
Vital Images, Inc.
Form 10-K
Index to Exhibits
|
Item |
|
Description |
|
|
|
|
|
3.1 |
|
Articles of Incorporation of the Company, incorporated by reference to Exhibit 3.1 to the Company’s Registration Statement on Form 10 dated March 13, 1997 (“Form 10”). |
|
|
|
|
|
3.2 |
|
By-laws of the Company, incorporated by reference to Exhibit 3.2 to the Form 10. |
|
|
|
|
|
4.1 |
|
Form of common stock certificate of the Company, incorporated by reference to Exhibit 4.3 to the Form 10. |
|
|
|
|
|
10.1 |
|
Employee Stock Purchase Plan, incorporated by reference to Exhibit 10.10 to the Form 10.* |
|
|
|
|
|
10.2 |
|
1997 Stock Option and Incentive Plan, as amended, incorporated by reference to Exhibit 10.11 to the Form 10 and Exhibit 99.9 to the Company’s Registration Statement on Form S-8 dated May 23, 2005.* |
|
|
|
|
|
10.3 |
|
1997 Director Stock Option Plan, as amended, incorporated by reference to Exhibit 10.12 to the Form 10 and Exhibit 99.14 to the Company’s Registration Statement on Form S-8 dated May 23, 2005.* |
|
|
|
|
|
10.4 |
|
Form of Change in Control Agreement between Vital Images, Inc. and Steven P. Canakes, incorporated by reference to Exhibit 10.31 to the Company’s Annual Report on Form 10-K for the year ended December 31, 2000.* |
|
|
|
|
|
10.5 |
|
Employment Agreement dated September 8, 2005 by and between Vital Images, Inc. and Steven P. Canakes, incorporated by reference to Exhibit 99.7 to the Company’s Current Report on Form 8-K dated September 12, 2005.* |
|
|
|
|
|
10.6 |
|
Change in Control Agreement dated May 16, 2005, by and between Vital Images, Inc. and Michael H. Carrel, incorporated by reference to Exhibit 99.4 to the Company’s Current Report on Form 8-K dated May 19, 2005.* |
|
|
|
|
|
10.7 |
|
2006 Long Term Incentive Plan incorporated by reference to Exhibit 10.1 to the Company’s Current Report on Form 8-K dated May 9, 2006.* |
|
|
|
|
|
10.8 |
|
Employment Agreement dated January 12, 2008 by and between Vital Images, Inc. and Michael H. Carrel, incorporated by reference to Exhibit 10.13 to the Company’s Annual Report on Form 10-K for the year ended December 31, 2007.* |
|
|
|
|
|
10.9 |
|
Employment Agreement dated January 12, 2008 by and between Vital Images, Inc. and Peter J. Goepfrich, incorporated by reference to Exhibit 10.14 to the Company’s Annual Report on Form 10-K for the year ended December 31, 2007.* |
|
|
|
|
|
10.10 |
|
Separation and Non-Compete Agreement dated January 16, 2008 by and between Vital Images, Inc. and Jay D. Miller, incorporated by reference to Exhibit 10.19 to the Company’s Annual Report on Form 10-K for the year ended December 31, 2007.* |
|
Item |
|
Description |
|
|
|
|
|
10.11 |
|
Separation and Non-Compete Agreement dated June 30, 2008 by and between Vital Images, Inc. and Philip I. Smith, incorporated by reference to Exhibit 10.1 to the Company’s Quarterly Report on Form 10-Q for the quarter ended June 30, 2008.* |
|
|
|
|
|
10.12 |
|
Separation and Non-Compete Agreement dated September 11, 2008 by and between Vital Images, Inc. and Susan A. Wood, Ph. D., incorporated by reference to Exhibit 10.1 to the Company’s Quarterly Report on Form 10-Q for the quarter ended September 30, 2008.* |
|
|
|
|
|
10.13 |
|
Offer letter dated August 5, 2008 by and between Vital Images, Inc. and Vikram Simha, incorporated by reference to Exhibit 10.17 to the Company’s Annual Report on Form 10-K for the year ended December 31, 2008.* b |
|
|
|
|
|
10.14 |
|
Employment Agreement dated August 6, 2008 by and between Vital Images, Inc. and Vikram Simha, incorporated by reference to Exhibit 10.18 to the Company’s Annual Report on Form 10-K for the year ended December 31, 2008.* |
|
|
|
|
|
10.15 |
|
Change in Control Agreement dated August 5, 2008, by and between Vital Images, Inc. and Vikram Simha, incorporated by reference to Exhibit 10.19 to the Company’s Annual Report on Form 10-K for the year ended December 31, 2008.* |
|
|
|
|
|
10.16 |
|
Offer letter dated December 10, 2008 by and between Vital Images, Inc. and Reza A. Ghanbari, incorporated by reference to Exhibit 10.20 to the Company’s Annual Report on Form 10-K for the year ended December 31, 2008.* |
|
|
|
|
|
10.17 |
|
Employment Agreement dated December 10, 2008 by and between Vital Images, Inc. and Reza A. Ghanbari, incorporated by reference to Exhibit 10.21 to the Company’s Annual Report on Form 10-K for the year ended December 31, 2008.* |
|
|
|
|
|
10.18 |
|
Change in Control Agreement dated December 10, 2008, by and between Vital Images, Inc. and Reza A. Ghanbari, incorporated by reference to Exhibit 10.22 to the Company’s Annual Report on Form 10-K for the year ended December 31, 2008.* |
|
|
|
|
|
10.19 |
|
Marketing and Distribution Agreement between Vital Images, Inc. and Toshiba Medical Systems Corporation dated November 21, 2008, incorporated by reference to Exhibit 10.23 to the Company’s Annual Report on Form 10-K for the year ended December 31, 2008. b |
|
|
|
|
|
10.20 |
|
Development Agreement between Vital Images, Inc. and Toshiba Medical Systems Corporation dated January 8, 2009, incorporated by reference to Exhibit 10.24 to the Company’s Annual Report on Form 10-K for the year ended December 31, 2008. b |
|
|
|
|
|
10.21 |
|
Offer letter dated September 25, 2009 by and between Vital Images, Inc. and Aaron Erkan Akyuz, filed herewith.* |
|
|
|
|
|
10.22 |
|
Employment Agreement dated October 1, 2009 by and between Vital Images, Inc. and Aaron Erkan Akyuz, filed herewith.* |
|
|
|
|
|
10.23 |
|
Change in Control Agreement dated September 25, 2009, by and between Vital Images, Inc. and Aaron Erkan Akyuz, filed herewith.* |
|
Item |
|
Description |
|
|
|
|
|
21.1 |
|
Subsidiaries of Registrant, filed herewith. |
|
|
|
|
|
23.1 |
|
Consent of PricewaterhouseCoopers LLP, filed herewith. |
|
|
|
|
|
31.1 |
|
Certification of Chief Executive Officer Pursuant to Rules 13a-14(a)/15d-14(a) under the Securities Exchange Act of 1934 and Section 302 of the Sarbanes-Oxley Act of 2002, filed herewith. |
|
|
|
|
|
31.2 |
|
Certification of Chief Financial Officer Pursuant to Rules 13a-14(a)/15d-14(a) under the Securities Exchange Act of 1934 and Section 302 of the Sarbanes-Oxley Act of 2002, filed herewith. |
|
|
|
|
|
32.1 |
|
Certification of Chief Executive Officer Pursuant to 18 U.S.C. Section 1350, as Adopted Pursuant to Section 906 of the Sarbanes-Oxley Act of 2002, filed herewith. |
|
|
|
|
|
32.2 |
|
Certification of Chief Financial Officer Pursuant to 18 U.S.C. Section 1350, as Adopted Pursuant to Section 906 of the Sarbanes-Oxley Act of 2002, filed herewith. |
* Indicates a management contract or compensatory plan or arrangement.
b Portions of such exhibit are treated as confidential pursuant to a request for that confidential treatment filed with the Commission by Vital Images.