Attached files
| file | filename |
|---|---|
| EX-23.1 - EXHIBIT 23.1 - TechTarget Inc | a2197081zex-23_1.htm |
| EX-31.1 - EXHIBIT 31.1 - TechTarget Inc | a2197081zex-31_1.htm |
| EX-21.1 - EXHIBIT 21.1 - TechTarget Inc | a2197081zex-21_1.htm |
| EX-31.2 - EXHIBIT 31.2 - TechTarget Inc | a2197081zex-31_2.htm |
| EX-32.1 - EXHIBIT 32.1 - TechTarget Inc | a2197081zex-32_1.htm |
Use these links to rapidly review the document
TABLE OF CONTENTS
Item 8. Financial Statements and Supplementary Data
UNITED STATES
SECURITIES AND EXCHANGE COMMISSION
Washington, D.C. 20549
Form 10-K
| ý | ANNUAL REPORT PURSUANT TO SECTION 13 OR 15(d) OF THE SECURITIES EXCHANGE ACT OF 1934 | |
For the fiscal year ended December 31, 2009 |
||
o |
TRANSITION REPORT PURSUANT TO SECTION 13 OR 15(d) OF THE SECURITIES EXCHANGE ACT OF 1934 |
|
For the transition period from to |
||
Commission file number: 1-33472

TechTarget, Inc.
(Exact name of Registrant as Specified in Its Charter)
| Delaware (State or Other Jurisdiction of Incorporation or Organization) |
04-3483216 (I.R.S. Employer Identification No.) |
|
275 Grove Street Newton, Massachusetts (Address of Principal Executive Offices) |
02466 (Zip Code) |
|
Registrant's telephone number, including area code: (617) 431-9200 |
||
Securities registered pursuant to Section 12(b) of the Exchange Act:
None.
Securities registered pursuant to Section 12(g) of the Exchange Act:
Common Stock, $0.001 Par Value
Indicate by check mark if the registrant is a well-known seasoned issuer, as defined in Rule 405 of the Securities Act. Yes o No ý
Indicate by check mark if the registrant is not required to file reports pursuant to Section 13 or Section 15(d) of the Exchange Act. Yes o No ý
Indicate by check mark whether the registrant (1) has filed all reports required to be filed by Section 13 or 15(d) of the Securities Exchange Act of 1934 during the preceding 12 months (or for such shorter period that the registrant was required to file such reports), and (2) has been subject to such filing requirements for the past 90 days. Yes ý No o
Indicate by check mark whether the registrant has submitted electronically and posted on its corporate Web site, if any, every Interactive Data File required to be submitted and posted pursuant to Rule 405 of Regulation S-T (§ 232.405 of this chapter) during the preceding 12 months (or for such shorter period that the registrant was required to submit and post such files). Yes o No o
Indicate by check mark if disclosure of delinquent filers pursuant to Item 405 of Regulation S-K is not contained herein, and will not be contained, to the best of registrant's knowledge, in definitive proxy or information statements incorporated by reference in Part III of this Form 10-K or any amendment to this Form 10-K. o
Indicate by check mark whether the registrant is a large accelerated filer, an accelerated filer, a non-accelerated filer, or a smaller reporting company. See the definitions of "large accelerated filer," "accelerated filer" and "smaller reporting company" in Rule 12b-2 of the Exchange Act. (Check One):
| Large Accelerated Filer o | Accelerated Filer ý | Non-Accelerated Filer o (Do not check if a smaller reporting company) |
Smaller Reporting Company o |
Indicate by check mark whether the registrant is a shell company (as defined in Rule 12b-2 of the Exchange Act). Yes o No ý
The aggregate market value of the registrant's common stock held by non-affiliates of the registrant was approximately $51.3 million as of June 30, 2009 (based on a closing price of $4.00 per share as quoted by the Nasdaq Global Market as of such date). In determining the market value of non-affiliate common stock, shares of the registrant's common stock beneficially owned by officers, directors and affiliates have been excluded. The determination of affiliate status is not necessarily a conclusive determination for other purposes.
The registrant had 42,285,769 shares of Common Stock, $0.001 par value per share, outstanding as of February 26, 2010.
DOCUMENTS INCORPORATED BY REFERENCE
Part III of this Annual Report incorporates by reference certain information from the registrant's definitive proxy statement for the 2010 annual meeting of shareholders.
2
This Annual Report on Form 10-K contains forward-looking statements that are based on the beliefs of management and assumptions made by and information currently available to them. The words "expect," "anticipate," "believe," "may," "estimate," "intend" and similar expressions are intended to identify such forward-looking statements. Forward-looking statements involve risks, uncertainties and assumptions including those described in "Risk Factors," which could cause our actual results to be materially different from results expressed or implied by such forward-looking statements.
Overview
TechTarget, Inc. was incorporated in Delaware on September 14, 1999. We are a leading provider of specialized online content that brings together buyers and sellers of corporate IT products. We sell customized marketing programs that enable IT vendors to reach corporate IT decision makers who are actively researching specific IT purchases. We operate a network of over 60 websites, each of which focuses on a specific IT sector, such as storage, security or networking.
IT professionals rely on our websites for key decision support information tailored to their specific areas of responsibility. We complement our online offerings with targeted in-person events that enable advertisers to engage buyers at critical stages of their decision-making process for IT purchases. We work with our advertiser customers to develop customized marketing programs, often providing them with multiple offerings in order to more effectively target their desired audience. Our service offerings address both lead generation and branding objectives of our advertising customers. The majority of our 2009 revenues are associated with lead generation advertising campaigns.
As IT professionals have become increasingly specialized, they have come to rely on our sector-specific websites for purchasing decision support. Our content strategy enables IT professionals to navigate the complex and rapidly changing IT landscape where purchasing decisions can have significant financial and operational consequences. Our content strategy includes three primary sources of content which IT professionals use to assist them in their pre-purchase research: independent content, vendor generated content and user generated content. As of December 31, 2009, we employed over 100 full-time editors who create original content tailored for specific audiences, which we complement with content through our association with outside industry experts. In addition to utilizing our independent content, registered members are able to conduct their pre-purchase research by accessing vendor content such as white papers, webcasts, videocasts, virtual events and podcasts, across our network of websites. Our network of websites also allows users to seamlessly interact and contribute content which is highly valued by IT professionals during their research process.
We have a large and growing base of registered members, which totaled approximately 8.5 million as of December 31, 2009. The targeted nature of our user base enables IT vendors to reach a specialized audience efficiently because our content is highly segmented and aligned with the IT vendors' specific products. Since our founding in 1999, we have developed a broad customer base. During 2009 we delivered advertising campaigns for approximately 1,100 customers. No one customer represented more than 10% of revenues and the quarterly renewal rate of our top 100 customers has consistently exceeded 90%. We generated revenues of approximately $86.5 million in 2009, down from approximately $104.5 million in 2008. Over the same period, our Adjusted EBITDA decreased from approximately $21 million in 2008 to approximately $14 million in 2009.
Available Information
Our website address is www.techtarget.com. We make available free of charge through our website our Annual Reports on Form 10-K, Quarterly Reports on Form 10-Q and Current Reports on
3
Form 8-K, and amendments to these reports, as soon as reasonably practicable after we electronically file such material with, or furnish such material to, the Securities and Exchange Commission (SEC). Our reports filed with the SEC are also available at the SEC's website at www.sec.gov. Our Code of Business Conduct and Ethics, and any amendments to our Code of Business Conduct and Ethics Corporate Governance Guidelines and Board Committee Charters, are also available on our website. We are not including the information contained on our website as part of, or incorporating it by reference into, this Annual Report on Form 10-K. The public may read and copy any materials that we file with the SEC at the SEC's Public Reading Reference Room at 100 F Street NE, Washington, DC 20549, and the public may obtain information on the operation of the Public Reference Room by calling the SEC at 1-800-SEC-0330.
Industry Background
The ongoing shift from traditional print and broad-based advertising to targeted online advertising that the media business has been experiencing continues to accelerate. We believe the three major trends driving this shift continue to be:
- •
- Targeted Content Channels Lead to Greater Efficiency for
Advertisers. The desire of advertisers to reach customers efficiently has led to the development and proliferation of market-specific
content channels throughout all forms of media. Targeted content channels increase advertising efficiency by enabling advertisers to market specifically to the audience they are trying to reach.
Content providers are finding new ways, such as specialized cable television channels, magazines and events, to offer increasingly targeted content to their audience and advertisers. The Internet has
enabled even more market-specific content offerings, and the proliferation of market-specific websites provides advertisers with efficient and targeted media to reach their customers.
- •
- The Internet Improves Advertisers' Ability to Increase and Measure
Return on Investment. Advertisers are increasingly focused on measuring and improving their return on investment, or ROI. Before the
advent of Internet-based marketing, there were limited tools for accurately measuring the results of marketing campaigns in a timely fashion. The Internet has enabled advertisers to track individual
users and their responses to their marketing programs. With the appropriate technology, vendors now have the ability to assess and benchmark the efficacy of their online advertising campaigns
cost-effectively and in real-time. As a result, advertisers are now increasingly demanding a measurable ROI across all forms of media.
- •
- The Internet Is Increasingly Critical in Researching Large, Complex and Costly Purchases. The Internet has improved the efficiency and effectiveness of researching purchases. The vast quantity of information available on the Internet, together with search engines and directories that facilitate information discovery, enables potential purchasers to draw information from many sources, including independent experts, peers and vendors, in an efficient manner. These benefits are most apparent in the research of complex and costly purchases which require information from a variety of sources. By improving the efficiency of product research, the Internet enables potential purchasers to save significant time and review a wider range of product selections.
Corporate IT Purchasing
The trends toward targeted content channels, increased focus on ROI by advertisers and Internet-based product research are evident in the corporate IT market. Over the past two decades, corporate IT purchases have grown in size and complexity. The corporate IT market is comprised of multiple, large sectors, such as storage, security and networking. Each of these sectors can, in turn, be further divided into sub-sectors that contain products addressing the areas of specialization within an enterprise's IT environment. For example, within the multi-billion dollar storage sector, there are
4
numerous sub-sectors such as storage area networks, storage management software and backup software. Furthermore, the products in each sub-sector may service entirely independent markets. For example, backup software for use in Windows environments can be distinct from that designed for use in Linux environments.
In view of the complexities, high cost and importance of IT decision-making, corporate IT purchasing decisions are increasingly being researched by teams of functional experts with specialized knowledge in their particular areas, rather than by one central IT professional, such as a chief information officer. The corporate IT purchasing process typically requires a lengthy sales cycle. The "sales cycle" is the sequence of stages that a typical customer goes through when deciding to purchase a product or service from a particular vendor. Key stages of a sales cycle typically consist of a customer recognizing or identifying a need; identifying possible solutions and vendors through research and evaluation; and finally, making a decision to purchase the product or service. Through various stages of this sales cycle, IT professionals rely upon multiple inputs from independent experts, peers and IT vendors. Although there is a vast amount of information available, the aggregation and validation of these inputs from various sources can be difficult and time-consuming.
The long sales cycle for corporate IT purchases, as well as the need for information support, requires substantial investment on the part of IT vendors, which drives the significant marketing expenditures in the corporate IT market. In addition, technology changes at an accelerated pace and there are often multiple solutions to a particular IT need. With each new product or product enhancement, IT vendors implement new advertising campaigns and IT professionals must research new technologies.
The Opportunity
Corporate IT professionals increasingly are demanding specialized websites and events tailored to the sub-sectors of IT solutions that they purchase. Prior to widespread Internet adoption, corporate IT buyers researching purchases relied largely on traditional IT media, consisting of broad print publications and large industry trade shows. As technology, vendors and IT professionals have all become much more specialized, the Internet has emerged as a preferred purchase research medium that has drastically reduced and improved research time. Despite this, most traditional IT media remains general in nature and disproportionately oriented towards print. Consequently, IT professionals continue to expend time searching inefficiently for information that is appropriate to their more specialized IT purchase requirements.
IT advertisers seek high-ROI marketing platforms that provide access to the specific sectors of IT buyers that align with the solutions they sell. Traditional IT media companies with print-based revenue models service a large circulation with broad content. This minimizes the likelihood of a vendor reaching a buyer while he or she is actively researching the purchase of a solution that falls within the vendor's particular market sector. Although the Internet now offers advertisers a superior means to reach IT buyers while they are conducting research, the web properties operated by these traditional IT media companies offer online content and audiences that are in many cases derivative of their existing print efforts. Without a more targeted marketing platform oriented to IT professionals' need for decision support for specialized IT purchases, traditional IT media companies have faced difficulty meeting the ROI needs of IT marketers.
Our Solution
Our specialized content strategy enables IT vendors to reach corporate IT professionals who are actively researching purchases in specific IT sectors. Our online network of websites is complemented by conferences, seminars and other in-person events. Prior to December 2008, we also published a limited number of highly targeted print magazines in which IT vendors could reach IT professionals. As
5
of December 2008, we discontinued publishing all print magazines and do not anticipate publishing any print magazines in the future. IT professionals rely on our platform for decision support information tailored to their specific purchasing needs. Our solution benefits from the following competitive advantages:
- •
- Large and Growing Community of Registered Members. We have
built a registered member database with detailed business information on approximately 8.5 million IT professionals as of December 31, 2009. We have collected detailed business and
technology profiles with respect to our registered members, which allows us to provide them with more specialized content and our advertisers with highly targeted audiences and sales leads.
- •
- Strong Advertiser Relationships. Since our founding in
1999, we have developed a broad customer base that now comprises approximately 1,100 active advertisers and the quarterly renewal rate of our top 100 customers has consistently exceeded 90%.
- •
- Substantial Experience in Online Media. We have over ten
years of experience in developing our online media content, with a focus on providing targeted information to IT professionals and a targeted audience to vendors. Our experience enables us to develop
new online properties rapidly, and to acquire and efficiently integrate select properties that further serve IT professionals. We have also developed an expertise in implementing integrated, targeted
marketing campaigns designed to maximize the measurability of, and improvement in, ROI.
- •
- Significant Brand Recognition Among Advertisers and IT
Professionals. Our brand is well-recognized by advertisers who value our integrated marketing capabilities and
high-ROI advertising programs. At the same time, our sector-specific websites command brand recognition among IT professionals, who rely on these websites because of their specificity and
depth of content.
- •
- Favorable Search Engine Rankings. Due to our long history
of using a targeted approach toward online publishing, our network of websites has produced a large repository of archived content that allows us to appear on search result pages when users perform
targeted searches on search engines such as Google. We are successful in attracting traffic from search engines, which, in turn, increases our registered membership.
- •
- Proprietary Lead Management Technology. Our proprietary lead management technology enables IT vendors to prioritize and manage efficiently the leads we provide, improving the efficacy of their sales teams and optimizing the ROI on their marketing expenditures with us.
Our solution increases efficiency for both IT professionals and IT vendors. It facilitates the ability of IT professionals to find specific information related to their purchase decisions, while enabling IT vendors to reach IT buyers that are actively researching specific solutions related to vendors' products and services. Set forth below are several ways our solution benefits IT professionals and IT vendors:
- •
- Provides Access to Integrated, Sector-Specific
Content. Our websites provide IT professionals with sector-specific content from the three fundamental sources they value in researching
IT purchasing decisions: industry experts, peers and vendors. Our staff of editors creates content specific to the sectors we serve and the key sub-sectors within them. This content is
integrated with other content generated by our network of third-party industry experts, member-generated content and content from IT vendors. The reliability, breadth and depth, and accessibility of
our content offering enable IT professionals to make more informed purchases.
- •
- Increases Efficiency of Purchasing Decisions. By accessing targeted and specialized information, IT professionals are able to research important purchasing decisions more effectively. Our
Benefits to IT Professionals
6
- •
- Targets Active Buyers Efficiently. Our highly targeted
content attracts specific, targeted audiences that are actively researching purchasing decisions. Using our registered member database, we are able to target further those registered members most
likely to be of value to IT vendors. Advertising to a targeted audience minimizes advertiser expenditures on irrelevant audiences, increasing advertising efficiency.
- •
- Generates Measurable, High ROI. Our targeted online
content offerings enable us to generate and collect valuable business information about each user and his or her technology preferences. This information is provided by users prior to accessing
specific content and can be further customized to advertisers' needs to support their advertising programs. As users access sponsored content, we register and process this information, and deliver
qualified actionable leads in real-time. As a result, our advertisers are able to measure and improve the ROI on their advertising expenditures with us.
- •
- Generates and Prioritizes Qualified Sales Leads. Our IT
vendors also use our detailed member database and integrated advertising campaigns to identify and market to the audience members they consider to have the highest potential value. Once the leads have
been delivered, our proprietary lead management technology enables customers to categorize, prioritize and market more effectively to these leads.
- •
- Maximizes Awareness and Shortens the Sales Cycle. As a
leading distributor of vendor-provided IT white papers, webcasts, videocasts, virtual events, and podcasts, we offer IT vendors the opportunity to educate IT professionals during the research process,
prior to any direct interaction with vendor salespeople. By distributing proprietary content and reaching their target audiences via our platform, IT vendors can educate audiences, demonstrate their
product capabilities and proactively brand themselves as specific product leaders. As a result, an IT professional is knowledgeable about the vendors' specifications and product by the time he or she
engages with the vendor, which reduces time and cost expended by the vendor's sales force.
- •
- Reaches IT Professionals at Critical Stages of the Purchase Decision Process. Because our content platform includes online and event offerings, IT vendors can market to IT professionals at critical stages of the purchase decision process through multiple touch points. In addition to targeting IT professionals as they conduct purchase research on our website, IT vendors can have face-to-face interactions with qualified buyers seeking to finalize purchase decisions at our in-person events.
integrated content offering minimizes the time spent searching for and evaluating content, and maximizes the time available for consuming quality content. Furthermore, we provide this specialized, targeted content through a variety of media that together address critical stages of the purchase decision process.
Benefits to IT Vendors
Our Strategy
Our goal is to deliver superior performance by enhancing our position as a leading provider of specialized content that connects IT professionals with IT vendors in the sectors and sub-sectors that we serve. In order to achieve this goal, we intend to:
- •
- Continue to Develop Our Content Platform and Service Offerings. We intend to continue to launch additional websites and develop our platform in order to capitalize on the ongoing shift from traditional broad-based media toward more focused online content that increases the efficiency of advertising spending. We intend to capture additional revenues from existing and new customers by continuing to develop our content and to segment it to deliver an increasingly
7
- •
- Expand into Complementary Sectors. We intend to complement
our current offerings by continuing to expand our business in order to capitalize on strategic opportunities in existing, adjacent, or new sectors that we believe to be well-suited to our
business model and core competencies. Based on our experience, we believe we are able to capitalize rapidly and cost-effectively on new market opportunities.
- •
- Expand Our International Presence. We intend to expand our
addressable market by continuing to increase our presence in countries outside the United States. Having launched our own websites in the United Kingdom in 2008, and in India and Spain in 2009, we
expect to penetrate foreign markets further by directly launching additional sector specific websites in the UK, Spain and India and in additional foreign markets, as well as by licensing our content
in new foreign territories and if deemed appropriate making strategic acquisitions and investments in overseas entities. During 2009, less than 5% of our revenues were derived from international
customers. We believe many of the current trends contributing to our domestic online revenue opportunity also are occurring in international markets and therefore present a future revenue opportunity.
- •
- Selectively Acquire or Partner with Complementary Businesses. We have used acquisitions as a means of rapidly expanding our content and service offerings, web traffic and registered members. Historically, our acquisitions can be classified into three categories; content-rich blogs or other individually published sites, typically generating less than one million dollars in revenues; early stage revenue sites, typically generating between one and five million dollars in annual revenues; and later stage revenue sites, typically generating greater than five million dollars in annual revenues. We intend to continue to pursue selected acquisition or partnership opportunities in our core markets and in adjacent markets for products with similar characteristics.
specialized audience to the IT vendors who advertise across our media. We also intend to continue to deliver a highly engaged and growing audience to advertisers and to develop innovative marketing programs.
8
Platform & Content
Our integrated content platform consists of a network of websites that we complement with targeted in-person events. At critical stages of the purchase decision process, these content offerings meet IT professionals' needs for expert, peer and IT vendor information, and provide a platform on which IT vendors can launch targeted marketing campaigns that generate measurable, high ROI.
The diagram below provides a representation of the media services provided by our platform and the media groups we currently use to categorize our content offerings:
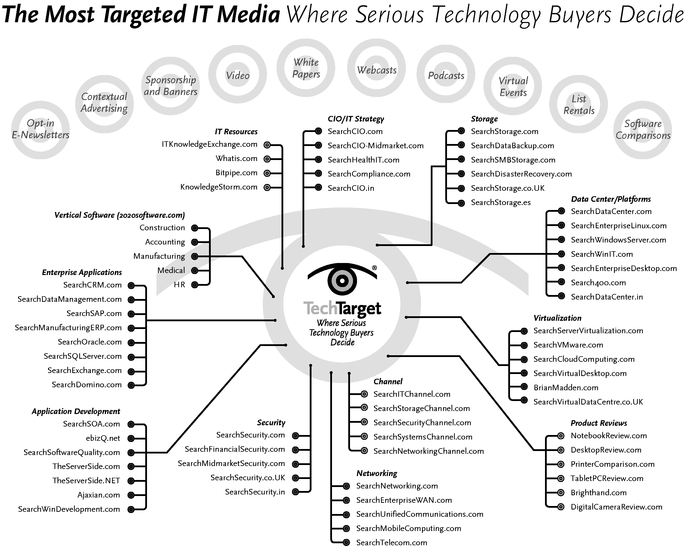
9
Media Groups
Based upon the logical clustering of our users' respective job responsibilities and the marketing focus of the products that our customers are advertising, we currently categorize our content offerings across ten distinct media groups. Each of these media groups services a wide range of IT vendor sectors and sub-sectors and is driven by the key areas of IT professionals' interests described below:
- •
- Security. Every aspect of enterprise computing now depends
on secure connectivity, data and applications. The security sector is constantly growing to adapt to new forms of threats and to secure new technologies such as mobile devices and wireless networks.
Compliance regulations along with highly publicized identity and intellectual property thefts are driving interest and investment in increasingly sophisticated security solutions that supplement
common perimeter security solutions such as firewalls and antivirus software. Our online properties in this sector, SearchSecurity.com, SearchFinancialSecurity.com, SearchMidMarketSecurity.com and
SearchSecurity.co.UK offer navigable and structured guides on IT vendor and technology solutions in key sub-sectors such as network security, intrusion defense, identity management and
authentication, data and application security, and security information management software. Our annual Security Decisions conference anchors a calendar of topically-focused regional seminars on
issues such as compliance monitoring and data protection.
- •
- Networking. Broadly defined, the networking market
includes the hardware, software and services involved in the infrastructure and management of both Enterprise and Carrier voice and data networks. As new sub-sectors of networking have
emerged and grown in importance, IT networking professionals have increasingly focused their investments in such technologies as VoIP, wireless and mobile computing, and telecommunication
technologies. Our online properties in this sector, SearchNetworking.com, SearchEnterpriseWAN.com, SearchUnifiedCommunications.com, SearchMobileComputing.com and SearchTelecom.com aim to address the
specialized needs of these IT networking professionals by offering content targeted specifically to these emerging growth areas as well as key initiatives such as network security and access control,
application visibility and performance monitoring, WAN acceleration and optimization, voice/data/video convergence, and remote office management and connectivity.
- •
- Storage. The storage sector consists of the market for
disk storage systems and tape hardware and software that store and manage data. Growth is fueled by trends inherent in the industry, such as the ongoing need to maintain and supplement data stores,
and by external factors, such as expanded compliance regulations and increased focus on disaster recovery solutions. These latter trends have driven overall storage growth and led to new specialized
solutions such as remote replication software and information life cycle management solutions. At the same time, established storage sub-sectors, such as backup and SANs have been
invigorated by new technologies such as disk-based backup, continuous data protection and storage virtualization. Our online properties in this sector, SearchStorage.com,
SearchDataBackup.com, SearchSMBStorage.com, SearchDisasterRecovery.com and SearchStorage.co.UK address IT professionals seeking solutions in key sub-sectors such as fibre channel SANs,
IP & iSCSI SANs, NAS, backup hardware and software, and storage management software. The audiences at our in-person Storage Decision conferences are comprised almost exclusively of
storage decision makers from within IT organizations. These events are supplemented by regional seminars on topics such as backup and disaster recovery.
- •
- Data Center and Virtualization Technologies. Data centers house the systems and components, such as servers, storage devices, routers and switches, utilized in large-scale, mission-critical computing environments. A variety of trends and new technologies have reinvigorated the data center as a priority among IT professionals. Technologies, such as blade servers and server virtualization, have driven renewed investment in data center-class computing solutions. Server consolidation is now a focus, driven by the decline in large-scale computing prices relative to
10
distributed computing models. These trends have put pressure on existing data center infrastructure and are driving demand for solutions that address this. For example, the deployment of high-density servers has led to increased heat output and energy consumption in data centers. Power and cooling have thus become a significant cost in IT budgets, making data center energy efficiency a priority. Our key online properties in this sector provide targeted information on the IT vendors, technologies and solutions that serve these sub-sectors. Our properties in this sector include SearchDataCenter.com, covering disaster recovery, power and cooling, mainframe and UNIX servers, systems management, and server consolidation; SearchEnterpriseLinux.com, focused on Linux migration and infrastructures; Search400.com, covering mid-range computing. SearchServervirtualization.com covers the decision points and alternatives for implementing server virtualization, while SearchVMware.com and RTFM-ed.co.uk focus on managing and building out virtual environments on the most widely-installed server virtualization platform. The Transforming your Data Center seminar series hosts key decision makers from large data centers and covers key issues such as server virtualization, cloud computing vs. co-location and data center transformation and re-architecture.
- •
- CIO/IT Strategy Media Group. Our CIO/IT Strategy media group provides content targeted at Chief Information Officers, or CIOs, and senior IT executives, enabling them to make informed IT purchases throughout the critical stages of the purchase decision process. CIOs' areas of interest generally align with the major sectors of the IT market; however, CIOs increasingly are focused on the alignment between IT and their businesses' operations. Because businesses' IT strategies vary significantly based upon company size, we have segmented the CIO market by providing specific guidance to CIOs of large enterprises, mid-market enterprises and SMBs. Data center consolidation, compliance, ITIL/ IT service management, disaster recovery/business continuity, risk management and outsourcing (including software-as-a-service and cloud computing) have all drawn the attention of IT executives who need to understand the operational and strategic implications of these issues and technologies on their businesses. Accordingly, our targeted information resources for senior IT executives focus on ROI, implementation strategies, best practices and comparative assessment of vendor solutions related to these initiatives. Our online properties in this sector include SearchCIO.com, which provides
We also cover servers, application and desktop solutions deployed in distributed computing environments. The dominant platform, Windows®, no longer represents an offering of discrete operating systems, but rather a diverse computing environment with its own areas of specialization around IT functions such as database administration and security. As Windows servers have become more stable and scalable, they have taken share in data centers, and currently represent one of the largest server sub-sectors. Given the breadth of the Windows market, we have segmented our Windows-focused media based on IT professionals' infrastructure responsibilities and purchasing focus. Our online properties in this sector include SearchWinServer.com, covering servers, storage, and systems management; SearchSQLServer.com, SearchDomino.com, SearchExchange.com and SearchWinIT.com, each targeted toward senior management for distributed computing environments. This network of sites provides resources and advice to IT professionals pursuing solutions related to such topics as Windows backup and storage, server consolidation, and upgrade planning. SearchEnterpriseDesktop.com, SearchDesktopVirtualization.com, BrianMadden.com and LabMice.net all focus on the deployment and management of end-user computing environments. Combined with our two properties that focus on server virtualization, SearchDesktopVirtualization.com and BrianMadden.com, each focusing on desktop virtualization, gives us a comprehensive offering addressing the in fast-growing area of virtualization technologies. Our online offerings in this sector are supplemented by in-person regional seminars. Our BriForum conference focuses on desktop virtualization and related technologies.
11
- •
- Enterprise Applications. Our Enterprise Applications media
group focuses on mission critical software for mid-sized and large companies such as databases and data management applications, enterprise resource planning, and customer facing
applications such as CRM software. Because these applications are critical to the overall success of the businesses that use them, there is a high demand for specialized information by IT and business
professionals involved in their purchase, implementation, and ongoing support. Our properties in this sector include SearchCRM.com, SearchDataManagement.com, SearchOracle.com, SearchSAP.com and
SearchManufacturingERP.com, which are leading online resources that provide this specialized information to support mission critical business applications. They cover CRM, business intelligence, data
management, sales force automation, databases and ERP software.
- •
- Vertical Software. The SMB market supports a high degree
of specialization by software vendors, as applications are offered that address the business requirements of specific industry verticals such as construction, manufacturing, and many others. The
purchase of these applications requires extensive up-front research by companies that, in many cases, may not have large or highly specialized IT staffs. Our web site 2020software.com
helps decision-makers from small to mid-sized companies evaluate specialized business applications by providing side-by-side comparisons of the leading software
providers in categories such as manufacturing, human resources, financial and accounting, and construction software. Users of the site can request further information and trial software downloads from
multiple vendors in a single transaction, simplifying their research process.
- •
- Application Development. The application development
sector is comprised of a broad landscape of tools and languages that enable developers, architects and project managers to build, customize and integrate software for their businesses. Our application
development online properties focus on development in enterprise environments, the underlying languages such as .NET, Java and XML as well as related application development tools and integrated
development environments or IDEs. Several trends have had a profound impact on this sector and are driving growth. The desire for more flexible and interoperable applications architecture continues to
propel interest in SOA, BPM and web services technologies. Application integration, application testing and security, as well as AJAX and rich Internet applications are also key areas of continuing
focus for vendors and developers. Our online properties in this sector include TheServerSide.com and TheServerSide.NET which host independent communities of developers and architects using Java and
.NET respectively. Ajaxian.com serves web developers of rich internet applications and SearchWinDevelopment.com serves Windows developers who use the .Net platform. SearchSoftwareQuality.com offers
content focused on application testing and quality assurance while SearchSOA.com and eBizQ.net serve Architects, IT Managers and Line of Business Executives who are interested in building out service
oriented architectures, BPM and working with related technologies. Our online properties are supplemented by conferences on enterprise application development technologies.
- •
- Channel. Our Channel properties address the information needs of channel companies—classified as resellers, value added resellers, solution providers, systems integrators, managed service providers, and consultants—in the IT market. As IT professionals have become more
CIOs in large enterprises with strategic information focused on critical purchasing decisions; SearchCIO-Midmarket.com, which targets IT managers at small to medium-sized businesses; and SearchCompliance.com, which provides advice on IT-focused regulations and standards to IT and business executives and other senior IT managers. The CIO/IT Strategy Group also includes online resources and events targeted to IT decision makers in prominent vertical industries. SearchHealthIT.com provides strategic IT purchasing information and advice to senior IT and clinical professionals in hospitals, medical centers, university health centers and other care delivery organizations, as well as organizations in the life sciences sector.
12
- •
- TechnologyGuide.com operates a portfolio of Internet content sites that provide product reviews, price comparisons and user forums for technology products such as laptops, desktops and smartphones including NotebookReview.com™, Brighthand.com™ (covering smartphones) and TabletPCReview.com™, PrinterComparison.com, DesktopReview. com and DigitalCameraReview.com. These sites represent an ideal complement to our enterprise-IT-focused TechTarget sites because IT professionals purchase a large volume of laptops, desktops, smartphones and mobile computing devices. Thus, these sites offer additional, complementary, in-depth content for our IT audience, as well as access for our advertisers to the broader audiences that visit these sites for information.
specialized, IT vendors actively have sought resellers with specific expertise in the vendors' sub-sectors. Like IT professionals, channel solution providers now require more focused technical content in order to operate successfully in their sectors. The resulting dynamics in the channel are well-suited to our integrated, targeted content strategy. Our online properties in this sector include SearchITchannel.com, SearchStorageChannel.com, SearchSecurityChannel.com, SearchNetworkingChannel.com and SearchSystemsChannel.com. As channel companies resell, service and support hardware, software and services from vendors in a particular IT sector, the key areas of focus tend to parallel those for the sub-sectors addressed by our IT-focused properties: for storage, backup, storage virtualization and network storage solutions such as fibre channel SANs, NAS, IP SANs; for security, intrusion defense, compliance and identity management; for networking, wireless, network security and VoIP; for systems, blade servers, consolidation and server virtualization.
User Generated Content and Vendor Content
ITKnowledgeExchange.com is a site devoted entirely to user generated content, and represents our most concerted effort to date to facilitate peer to peer interaction amongst our users via blogs and a Question and Answer section. The site incorporates a number of important Web 2.0 features, such as the use of tag-based navigation that allows users to self-classify content, and wiki-based Q&A functionality that allows them to collaborate with each other to respond to technical questions and product recommendations submitted by other users.
Bitpipe.com and KnowledgeStorm.com are sites that we operate and that host vendor-provided content such as white papers, software downloads, videocasts and webcasts. Maintaining centralized collections of this vendor content helps our users conduct pre-purchase research more easily, and allows us to maximize the ability of this content to be found by search engines. We provide contextually relevant inclusion of vendor content from Bitpipe.com and KnowledgeStorm.com on the other sites in our network.
Media Offerings
We use the following online and event offerings to provide IT vendors with numerous touch points to reach key IT decision makers and to provide IT professionals with highly specialized content across multiple forms of media. We are experienced in assisting advertisers to develop custom advertising programs that maximize branding and ROI. The following is a description of the services we offer:
- •
- Online. Our network of websites forms the core of our content platform. Our websites provide IT professionals with comprehensive decision support information tailored to their specific areas of responsibility and purchasing decisions. Through our websites, we offer a variety of online media offerings to connect IT vendors to IT professionals. Our lead generation offerings allow IT vendors to maximize ROI by capturing qualified sales leads from the distribution and promotion of content to our audience of IT professionals. Our branding offerings provide IT vendors exposure to targeted audiences of IT professionals actively researching information related to their product and services. Our branding offerings include banners and e-newsletters. Banner advertising can be purchased on specific websites within our network. We also offer the ability to advertise in e-newsletters focused on key site sub-topics. These offerings give IT vendors the ability to increase their brand awareness to highly specialized IT sectors.
13
Our lead generation offerings include the following:
- •
- White Papers. White papers are technical documents created
by IT vendors to describe business or technical problems which are addressed by the vendors' products or services. IT vendors pay us to have their white papers distributed to our users and receive
targeted promotion on our relevant websites. Prior to viewing white papers, our registered members and visitors supply their corporate contact information and agree to receive further information from
the vendor. The corporate contact and other qualification information for these leads are supplied to the vendor in real time through our proprietary lead management software.
- •
- Webcasts, Podcasts and Videocasts. IT vendors pay us to
sponsor and host webcasts, podcasts, and videocasts that bring informational sessions directly to attendees' desktops and, in the case of podcasts, directly to their mobile devices. As is the case
with white papers, our users supply their corporate contact and qualification information to the webcast, podcast or videocast sponsor when they view or download the content. Sponsorship includes
access to the registrant information and visibility before, during and after the event.
- •
- Software Package Comparisons. Through our 2020software.com
website, IT vendors pay us to post information and specifications about their software packages, typically organized by application category. Users can request further information, which may include
downloadable trial software from multiple software providers in sectors such as CRM, accounting software and business analytics. IT vendors, in turn, receive qualified leads based upon the users who
request their information.
- •
- Promotional E-mails. IT vendors pay us to
further target the promotion of their white papers, webcasts, podcasts or downloadable trial software by including their content in our periodic e-mail updates to registered users of our
websites. Users who have voluntarily registered on our websites receive an e-mail update from us when vendor content directly related to their interests is listed on our sites.
- •
- List Rentals. We also offer IT vendors the ability to
message relevant registered members on topics related to their interests. IT vendors can rent our e-mail and postal lists of registered members using specific criteria such as company
size, geography or job title.
- •
- Contextual Advertising. Our contextual advertising
programs associate IT vendor white papers, webcasts or other content on a particular topic with our related sector-specific content. IT vendors have the option to purchase exclusive sponsorship of
content related to their product or category.
- •
- Third Party Revenue Sharing Arrangements. We have
arrangements with certain third parties, including for the licensing of our online content, for the renting of our database of opted-in email subscribers and for which advertising from
customers of certain third parties is made available to our website visitors. In each of these arrangements we are paid a share of the resulting revenue.
- •
- Events. Our in-person events bring together IT professionals to hear from industry experts and to talk to IT vendors about key topics of interest in the sectors we serve. The majority of our events are free to IT professionals and sponsored by IT vendors. Attendees are pre-screened based on event-specific criteria such as sector-specific budget size, company size, or job title. Our sponsors value the ability to meet with an audience of qualified IT decision makers who all have been pre-screened to determine a high level of buying interest and the ability to execute a purchase decision. We offer three types of events: multi-day conferences, seminars and custom events. Multi-day conferences provide independent expert content for our attendees, and allow vendors to purchase exhibit space and other sponsorship offerings that enable interaction with the attendees. We also hold single-day seminars on various topics in major cities. These seminars
14
provide independent content on key sub-topics in the sectors we serve, are free to qualified attendees and offer multiple vendors the ability to interact with specific, targeted audiences actively focused on buying decisions. Our custom events differ from our seminars in that they are exclusively sponsored by a single IT vendor, and the content is driven primarily by the sole sponsor.
Customers
We market to IT vendors targeting a specific audience within an IT sector or sub-sector. We maintain multiple points of contact with our customers in order to provide support throughout a given organization and during critical stages of the sales cycle. As a result, individual customers often run multiple advertising programs with us in order to reach discrete portions of our targeted audience. Our services are generally delivered under short-term contracts that run for the length of a given advertising program, typically less than 6 months in length. Since our founding in 1999, we have developed a broad customer base that now comprises approximately 1,100 active advertisers. During 2009, no one customer represented more than 10% of revenues and the quarterly renewal rate of our top 100 customers has consistently exceeded 90%.
Sales and Marketing
Since our inception in 1999, we have maintained an internal direct sales department that works closely with existing and potential customers to develop customized marketing programs that provide highly targeted access to IT professionals. We organize the sales force by the sector-specific media groups that we operate, as well as a national accounts team that works with our largest advertisers. We believe that our sector-specific sales organization and integrated approach to our service offerings allows our sales personnel to develop a high level of expertise in the specific sectors they cover, and to create effective marketing programs tailored to the customer's specific objectives. As of December 31, 2009, our sales and marketing staff consisted of 195 people. The majority of our sales staff is located in our Newton, Massachusetts headquarters and our office in San Francisco, California.
We pursue a variety of marketing initiatives designed to support our sales activities by building awareness of our brand to IT vendors, and positioning ourselves as a "thought leader" in ROI-based marketing. These initiatives include purchasing online and event sponsorships in media vehicles that target the technology advertising market, as well as engaging in direct communications with the database of advertising contacts we have built since inception. Examples of our direct communications include selected direct mail updates on new product launches and initiatives. We also produce in-person events, videocasts and white papers for technology marketers where we provide information on the latest best practices in the field of online marketing. Additionally we publish a blog for marketers entitled "My Educated Guess", which we use as a thought leadership vehicle to promote our ideas and viewpoints on a myriad of online subjects.
Online User Acquisition
Our primary source of traffic to our websites is through non-paid traffic sources, such as our existing registered member base and organic search engine traffic. Organic search engine traffic is also the primary source of new registered members for our sites. Because our sites focus on specific sectors of the IT market, our content is highly targeted and is an effective means for attracting search engine traffic and resulting members. We also make user-focused marketing expenditures designed to supplement our non-paid traffic and registered members. We employ a variety of online marketing vehicles such as keyword advertising on the major search engines and targeted list rentals of opt-in e-mail subscribers from a variety of targeted media sources.
15
Technological Infrastructure
We have developed an expandable operations infrastructure using hardware and software systems from established IT vendors to maintain our websites and online offerings. Our system hardware is co-located at an offsite data center. All of the critical components of the system are redundant, allowing us to withstand unexpected component failure and to undergo maintenance and upgrades. Our infrastructure is scalable, enabling us to make incremental additions that fit into the existing environment as our system requirements grow based on traffic and member growth. Our critical data is copied to backup tapes daily, which are sent to an off-site storage facility. We maintain a quality assurance process to monitor constantly our servers, processes and network connectivity. We have implemented these various redundancies and backup systems in order to minimize the risk associated with damage from fire, power loss, telecommunications failure, break-ins, computer viruses and other events beyond our control. We believe that continued development of our technological infrastructure is critical to our success. We have made, and expect to continue to make, technological improvements in this infrastructure to improve our ability to service our users and customers.
Competition
We compete for potential advertisers with a number of different types of companies, including: broad-based media outlets, such as television, newspapers and business periodicals that are designed to reach a wide audience; general purpose portals and search engines; and offline and online offerings of media companies that produce content specifically for IT professionals. The market for advertisers is highly competitive, and in each of the sectors we serve as well as across the services we offer, our primary competitors are the media companies that produce content specifically for IT professionals. Our four primary competitors for advertisers, each of which possess substantial resources to compete, are United Business Media, International Data Group, CNet and Ziff Davis Enterprise, Inc. In the online market we generally compete on the basis of target audience, quality and uniqueness of information content, ease of use of our websites for IT professionals, and the quality and quantity of sales leads generated for advertisers. Our events generally compete on the basis of the quality and integrity of our content offerings, the quality of our attendees, and the ability to provide events that meet the needs of particular sector segments. As with the competition for advertisers, we compete for the users who comprise our target audiences primarily with the media companies that produce content specifically for IT professionals such as United Business Media, International Data Group, CNet and Ziff Davis Enterprise, Inc.
User Privacy
We gather in-depth business information about our registered members who elect to provide us information through one or more of the online registration forms displayed on our websites, as well as through tracking certain behavioral activity of users of our sites. We post our privacy policy on our websites so that our users can access and understand the terms and conditions applicable to the collection and use of that information. Our privacy policy also discloses the types of information we gather, how we use it, and how a user can correct or change this information. Our privacy policy also explains the circumstances under which we share this information and with whom. Users who register for our websites have the option of indicating specific areas of interest in which they are willing to receive offers via e-mail or postal mail; these offers contain content created either by us or our third-party IT vendor customers. To protect our disclosures and obligations to our users, we impose constraints that are generally consistent with our commitments to our user community on the customers to whom we provide user data. Additionally, when we provide lists to third parties, including to our advertiser customers, it is under contractual terms that are generally consistent with our obligations to our users and with applicable laws and regulations.
16
Consumer Protection Regulation
General. Advertising and promotional activities presented to visitors on our websites are subject to federal and state consumer protection laws that regulate unfair and deceptive practices. We are also subject to various other federal and state consumer protection laws, including the ones described below.
CAN-SPAM Act. Effective January 1, 2004, the Controlling the Assault of Non-Solicited Pornography and Marketing Act of 2003, or the CAN-SPAM Act, became effective. The CAN-SPAM Act regulates commercial e-mails and provides a right on the part of the recipient to request the sender to stop sending messages, and establishes penalties for the sending of e-mail messages that are intended to deceive the recipient as to source or content. Under the CAN-SPAM Act, senders of commercial e-mails (and other persons who initiate those e-mails) are required to make sure that those e-mails do not contain false or misleading transmission information. Commercial e-mails are required to include a valid return e-mail address and other subject heading information so that the sender and the Internet location from which the message has been sent are accurately identified. Recipients must be furnished with an electronic method of informing the sender of the recipient's decision not to receive further commercial e-mails. In addition, the e-mail must include a postal address of the sender and notice that the e-mail is an advertisement. The CAN-SPAM Act may apply to the e-newsletters that our websites distribute to registered members and to some of our other commercial e-mail communications. However, on May 12, 2008, the FTC issued additional regulations related to the CAN-SPAM Act, including interpretations of the Act that indicate that e-newsletters, such as those we distribute to our registered members, would be exempt from most of the provisions of the CAN-SPAM Act. At this time, we are applying the CAN-SPAM requirements to these e-mail communications, and believe that our e-mail practices comply with the requirements of the CAN-SPAM Act.
Other Consumer Protection Regulation. The FTC and many state attorneys general are applying federal and state consumer protection laws to require that the online collection, use and dissemination of data, and the presentation of Web site content, comply with certain standards for notice, choice, security and access. Courts may also adopt these developing standards. In many cases, the specific limitations imposed by these standards are subject to interpretation by courts and other governmental authorities. In addition, on December 20, 2007, the FTC published for public comment proposed principles to address consumer privacy issues that may arise from so-called "behavioral targeting" (i.e. the tracking of a user's online activities in order to deliver advertising tailored to his or her interests) and to encourage industry self-regulation. On February 12, 2009, following public comment, the FTC released a Staff Report with its revised principles for self-regulation of behavioral targeting. Although the FTC excluded from the principles both "first-party" behavioral advertising and contextual advertising, with respect to other types of behavioral targeting that include the storage of more, and potentially sensitive, data or that collects information outside of the "traditional Web site context" (such as through a mobile device or by an ISP), the FTC has stated that it will continue to evaluate self-regulatory programs. We believe that we are in compliance with the consumer protection standards that apply to us, but a determination by a state or federal agency or court that any of our practices do not meet these standards could create liability to us, result in adverse publicity and affect negatively our businesses. New interpretations of these standards could also require us to incur additional costs and restrict our business operations.
In addition, several foreign governmental bodies, including the European Union, the United Kingdom and Canada have regulations dealing with the collection and use of personal information obtained from their citizens, some of which we may be subject to as a result of the expansion of our business internationally. We believe that we are in compliance with the regulations that apply to us, however, such laws may be modified and new laws may be enacted in the future. Any such developments (or developments stemming from enactment or modification of other laws) or the failure to anticipate accurately the application or interpretation of these laws could create liability to us, result in adverse publicity and affect negatively our businesses.
17
Intellectual Property
We regard our copyrights, domain names, trademarks, trade secrets and similar intellectual property as critical to our success, and rely upon copyright, trademark and trade secrets laws, as well as confidentiality agreements with our employees and others, and protective contractual provisions to protect the proprietary technologies and content that we have developed. We pursue the registration of our material trademarks in the United States and elsewhere. Currently, our TechTarget trademark and logo, as well as the KnowledgeStorm and certain other marks and logos are registered federally in the United States and selected foreign jurisdictions and we have applied for U.S. and foreign registrations for various other marks. In addition, we have registered over 1,000 domain names that are or may be relevant to our business, including "www.techtarget.com," "www.knowledgestorm.com," "www.bitpipe.com," "www.technologyguide.com" and those leveraging the "search" prefix used in the branding of many of our websites. We also incorporate a number of third-party software products into our technology platform pursuant to relevant licenses. Some of this software is proprietary and some is open source. We use third-party software to maintain and enhance, among other things, the content generation and delivery, and support our technology infrastructure. We are not substantially dependent upon these third-party software licenses and we believe the licensed software is generally replaceable, by either licensing or purchasing similar software from another vendor or building the software functions ourselves.
Employees
As of December 31, 2009, we had approximately 530 employees. Our current employees are not represented by a labor union and are not the subject of a collective bargaining agreement. We believe that we have a good relationship with our employees.
The following discussion highlights certain risks which may affect future operating results and share price. These are the risks and uncertainties we believe are most important for our existing and potential stockholders to consider. Additional risks and uncertainties not presently known to us, which we currently deem immaterial or which are similar to those faced by other companies in our industry or business in general, may also impair our business operations. If any of the following risks or uncertainties actually occurs, our business, financial condition and operating results would likely suffer.
Risks Relating to Our Business
Because we depend on our ability to generate revenues from the sale of advertising, fluctuations in advertising spending could have an adverse effect on our operating results.
The primary source of our revenues is the sale of advertising to our customers. Our advertising revenues accounted for approximately 98% of our total revenues for the year ended December 31, 2009. We believe that advertising spending on the Internet, as in traditional media, fluctuates significantly as a result of a variety of factors, many of which are outside of our control. These factors include:
- •
- variations in expenditures by advertisers due to budgetary constraints;
- •
- the cancellation or delay of projects by advertisers;
- •
- the cyclical and discretionary nature of advertising spending;
- •
- general economic conditions, as well as economic conditions specific to the Internet and online and offline media
industry; and
- •
- the occurrence of extraordinary events, such as natural disasters, international or domestic terrorist attacks or armed conflict.
18
Because all of our customers are in the IT industry, our revenues are subject to characteristics of the IT industry that can affect advertising spending by IT vendors.
The IT industry is characterized by, among other things, volatile quarterly results, uneven sales patterns, short product life cycles, rapid technological developments and frequent new product introductions and enhancements. As a result, our customers' advertising budgets, which are often viewed as discretionary expenditures, may increase or decrease significantly over a short period of time. In addition, the advertising budgets of our customers may fluctuate as a result of:
- •
- weakness in corporate IT spending resulting in a decline in IT advertising spending;
- •
- increased concentration in the IT industry as a result of consolidations, leading to a decrease in the number of current
and prospective customers, as well as an overall reduction in advertising;
- •
- spending by combined entities following such consolidations;
- •
- the timing of advertising campaigns around new product introductions and initiatives; and
- •
- economic conditions specific to the IT industry.
The ongoing economic recession and general economic, business, or industry conditions may continue to adversely affect the business of the Company, as well as our ability to forecast financial results.
The domestic and international economies continue to experience an ongoing recession. This recession has been magnified by factors including changes in the availability of credit, decreased business and consumer confidence and continuing high unemployment. These and other macro-economic conditions have contributed to increased volatility and diminished expectations for the global economy and expectations of future global economic growth. If the economic climate in the U.S. and abroad does not improve or deteriorates further, our customers or potential customers could reduce or delay their purchases of our offerings, which would adversely impact our revenues and our ability to sell our offerings, collect customer receivables and, ultimately, our profitability. Additionally, future economic conditions currently continue to have a high degree of inherent uncertainty. As a result, it continues to be difficult to estimate the level of growth or contraction for the economy as a whole, as well as for the various sectors of the economy, such as the IT market. Because all components of our budgeting and forecasting are dependent upon estimates of growth or contraction in the IT market and demand for our offerings, the prevailing economic uncertainties continue to render accurate estimates of future income and expenditures very difficult to make. We cannot predict the effect or duration of this economic slowdown or the timing or strength of a subsequent economic recovery, worldwide or in the IT industry. Further adverse changes may occur as a result of soft global, domestic or regional economic conditions, wavering consumer confidence, unemployment, declines in stock markets, or other factors affecting economic conditions generally. These changes may negatively affect the sales of our offerings, increase exposure to losses from bad debts, increase the cost and decrease the availability of financing, or increase the risk of loss on investments.
Lingering effects of financial market instability and continued uncertain conditions in the United States and global economies have in the past and could in the future adversely affect our revenues and operating results.
We believe that the lingering effects of the instability affecting the financial markets and a further deterioration in the current business climate within the United States and/or other geographic regions in which we do business have had, and could continue to have, a negative impact on our revenue and operating results. Because all of our clients are in the IT industry, the success of our business is intrinsically linked to the health, and subject to market conditions, of the IT industry. Regional, domestic and global economic weakness and uncertainty, and the limited access to sources of traditional capital and/or debt have resulted in some companies reassessing their spending, including for technology projects. In turn, many of our customers have reassessed and will, for the foreseeable
19
future, be likely to continue to scrutinize their spending on advertising campaigns. Prior market downturns in the IT industry have resulted in declines in advertising spending, which can cause longer sales cycles, deferral or delay of purchases by IT vendors and generally reduced expenditures for advertising and related services. Our revenues and profitability depend on the overall demand for advertising services from our customers. We believe that demand for our offerings has been in the past, and could be in the future, disproportionately affected by fluctuations, disruptions, instability or downturns in the economy and the IT industry, which may cause customers and potential customers to exit the industry or delay, cancel or reduce any planned expenditures for our advertising offerings. Furthermore, competitors may respond to market conditions by lowering prices and attempting to lure away our customers and prospects to lower cost offerings. In addition, the slowdown in the formation of new IT companies, and the decline in the growth of existing IT companies, may continue to cause a decline in demand for our offerings.
Our quarterly operating results are subject to fluctuations, and these fluctuations may adversely affect the trading price of our common stock.
We have experienced and expect to continue to experience fluctuations in our quarterly revenues and operating results. Our quarterly revenues and operating results may fluctuate from quarter to quarter due to a number of factors, many of which are outside of our control. In addition to the factors described elsewhere in this "Risk Factors" section, these factors include:
- •
- the spending priorities and advertising budget cycles of specific advertisers;
- •
- the addition or loss of advertisers;
- •
- the addition of new sites and services by us or our competitors; and
- •
- seasonal fluctuations in advertising spending.
Due to such risks, you should not rely on quarter-to-quarter comparisons of our results of operations as an indicator of our future results. Due to the foregoing factors, it is also possible that our results of operations in one or more quarters may fall below the expectations of investors and/or securities analysts. In such an event, the trading price of our common stock is likely to decline.
Our revenues are primarily derived from short-term contracts that may not be renewed.
The primary source of our revenues is the sale of advertising to our customers, and we expect that this will continue to be the case for the foreseeable future. Our advertising contracts are primarily short-term, typically less than 6 months, and are generally subject to termination without substantial penalty by the customer at any time, generally with minimal notice requirements. We cannot assure you that our current customers will fulfill their obligations under their existing contracts, continue to participate in our existing programs beyond the terms of their existing contracts or enter into any additional contracts for new programs that we offer. If a significant number of advertisers or a few large advertisers decided not to continue advertising on our websites or conducting or sponsoring events, we could experience a rapid decline in our revenues over a relatively short period of time.
If we are unable to deliver content and services that attract and retain users, our ability to attract advertisers may be affected, which could in turn have an adverse affect on our revenues.
Our future success depends on our ability to deliver original and compelling content and services to attract and retain users. Our user base is comprised of corporate IT professionals who demand specialized websites and events tailored to the sectors of the IT products for which they are responsible and that they purchase. Our content and services may not be attractive to a sufficient number of users to attract advertisers and generate revenues consistent with our estimates. We also may not develop
20
new content or services in a timely or cost-effective manner. Our ability to develop and produce this specialized content successfully is subject to numerous uncertainties, including our ability to:
- •
- anticipate and respond successfully to rapidly changing IT developments and preferences to ensure that our content remains
timely and interesting to our users;
- •
- attract and retain qualified editors, writers and technical personnel;
- •
- fund new development for our programs and other offerings;
- •
- successfully expand our content offerings into new platform and delivery mechanisms; and
- •
- promote and strengthen the brands of our websites and our name.
If we are not successful in maintaining and growing our user base, our ability to retain and attract advertisers may be affected, which could in turn have an adverse affect on our revenues.
Our inability to sustain our historical advertising rates could adversely affect our operating results.
The market for advertising has fluctuated over the past few years. If we are unable to maintain historical pricing levels for advertising on our websites and for sponsorships at our events, our revenues could be adversely affected.
Competition for advertisers is intense, and we may not compete successfully, which could result in a material reduction in our market share, the number of our advertisers and our revenues.
We compete for potential advertisers with a number of different types of offerings and companies, including: broad-based media outlets, such as television, newspapers and business periodicals that are designed to reach a wide audience; general purpose portals and search engines; and offline and online offerings of media companies that produce content specifically for IT professionals, including International Data Group, United Business Media, CNet and Ziff Davis Enterprise. Advertisers may choose our competitors over us not only because they prefer our competitors' online and events offerings to ours, but also because advertisers prefer to utilize other forms of advertising offered by our competitors that are not offered by us. Although less than 5% of our revenues for the year ended December 31, 2009 were derived from advertisers located outside of North America, as we continue to expand internationally, as we did in 2008 by operating our own websites in the United Kingdom and in 2009 in India and Spain, we expect to compete with many of the competitors mentioned above, as well as with established media companies based in particular countries or geographical regions. Many of these foreign-based media companies will be larger than we are and will have established relationships with local advertisers. Many of our current and potential competitors have longer operating histories, larger customer bases, greater brand recognition and significantly greater financial, marketing and other resources than we have. As a result, we could lose market share to our competitors in one or more of our businesses and our revenues could decline.
We depend upon Internet search engines to attract a significant portion of the users who visit our websites, and if we were listed less prominently in search result listings, our business and operating results would be harmed.
We derive a significant portion of our website traffic from users who search for IT purchasing content through Internet search engines, such as Google, MSN, Bing and Yahoo! A critical factor in attracting users to our websites is whether we are prominently displayed in response to an Internet search relating to IT content. Search result listings are determined and displayed in accordance with a set of formulas or algorithms developed by the particular Internet search engine. The algorithms determine the order of the listing of results in response to the user's Internet search. From time to time, search engines revise their algorithms. In some instances, these modifications may cause our
21
websites to be listed less prominently in unpaid search results, which will result in decreased traffic from search engine users to our websites. Our websites may also become listed less prominently in unpaid search results for other reasons, such as search engine technical difficulties, search engine technical changes and changes we make to our websites. In addition, search engines have deemed the practices of some companies to be inconsistent with search engine guidelines and have decided not to list their websites in search result listings at all. If we are listed less prominently or not at all in search result listings for any reason, the traffic to our websites likely will decline, which could harm our operating results. If we decide to attempt to replace this traffic, we may be required to increase our marketing expenditures, which also could harm our operating results.
We may not innovate at a successful pace, which could harm our operating results.
Our industry is rapidly adopting new technologies and standards to create and satisfy the demands of users and advertisers. It is critical that we continue to innovate by anticipating and adapting to these changes to ensure that our content-delivery platforms and services remain effective and interesting to our users, advertisers and partners. In addition, we may discover that we must make significant expenditures to achieve these goals. If we fail to accomplish these goals, we may lose users and the advertisers that seek to reach those users, which could harm our operating results.
We may be unable to continue to build awareness of our brands, which could negatively impact our business and cause our revenues to decline.
Building and maintaining recognition of our brands is critical to attracting and expanding our online user base and attendance at our events. We intend to continue to build existing brands and introduce new brands that will resonate with our targeted audiences, but we may not be successful. In order to promote these brands, in response to competitive pressures or otherwise, we may find it necessary to increase our marketing budget, hire additional marketing and public relations personnel or otherwise increase our financial commitment to creating and maintaining brand loyalty among our clients. If we fail to promote and maintain our brands effectively, or incur excessive expenses attempting to promote and maintain our brands, our business and financial results may suffer.
Given the tenure and experience of our Chief Executive Officer and President, and their guiding roles in developing our business and growth strategy since our inception, our growth may be inhibited or our operations may be impaired if we were to lose the services of either of them.
Our growth and success depends to a significant extent on our ability to retain Greg Strakosch, our Chief Executive Officer, and Don Hawk, our President, who founded the company and have developed, engineered and stewarded the growth and operation of our business since its inception. The loss of the services of either of these persons could inhibit our growth or impair our operations and cause our stock price to decline.
We may not be able to attract, hire and retain qualified personnel cost-effectively, which could impact the quality of our content and services and the effectiveness and efficiency of our management, resulting in increased costs and losses in revenues.
Our success depends on our ability to attract, hire and retain at commercially reasonable rates qualified technical, editorial, sales and marketing, customer support, financial and accounting, legal and other managerial personnel. The competition for personnel in the industries in which we operate is intense. Our personnel may terminate their employment at any time for any reason. Loss of personnel may also result in increased costs for replacement hiring and training. If we fail to attract and hire new personnel or retain and motivate our current personnel, we may not be able to operate our businesses effectively or efficiently, serve our customers properly or maintain the quality of our content and
22
services. In particular, our success depends in significant part on maintaining and growing an effective sales force. This dependence involves a number of challenges, including:
- •
- the need to hire, integrate, motivate and retain additional sales and sales support personnel;
- •
- the need to train new sales personnel, many of whom lack sales experience when they are hired; and
- •
- competition from other companies in hiring and retaining sales personnel.
We may fail to identify or successfully acquire and integrate businesses, products and technologies that would otherwise enhance our service offerings to our customers and users, and as a result our revenues may decline or fail to grow.
We have acquired, and in the future may acquire or invest in, complementary businesses, products or technologies. Acquisitions and investments involve numerous risks including:
- •
- difficulty in assimilating the operations and personnel of acquired businesses;
- •
- potential disruption of our ongoing businesses and distraction of our management and the management of acquired companies;
- •
- difficulty in incorporating acquired technology and rights into our offerings and services;
- •
- unanticipated expenses related to technology and other integration;
- •
- potential failure to achieve additional sales and enhance our customer bases through cross marketing of the combined
company's services to new and existing customers;
- •
- potential detrimental impact to our pricing based on the historical pricing of any acquired business with common clients
and the market generally;
- •
- potential litigation resulting from our business combinations or acquisition activities; and
- •
- potential unknown liabilities associated with the acquired businesses.
Our inability to integrate any acquired business successfully, or the failure to achieve any expected synergies, could result in increased expenses and a reduction in expected revenues or revenue growth. As a result, our stock price could fluctuate or decline. In addition, we cannot assure you that we will be successful in expanding into complementary sectors in the future, which could harm our business, operating results and financial condition.
The costs associated with potential acquisitions or strategic partnerships could dilute your investment or adversely affect our results of operations.
In order to finance acquisitions, investments or strategic partnerships, we may use equity securities, debt, cash, or a combination of the foregoing. Any issuance of equity securities or securities convertible into equity may result in substantial dilution to our existing stockholders, reduce the market price of our common stock, or both. Any debt financing is likely to have financial and other covenants that could have an adverse impact on our business if we do not achieve our projected results. In addition, the related increases in expenses could adversely affect our results of operations.
We have limited protection of our intellectual property and could be subject to infringement claims that may result in costly litigation, the payment of damages or the need to revise the way we conduct our business.
Our success and ability to compete are dependent in part on the strength of our proprietary rights, on the goodwill associated with our trademarks, trade names and service marks, and on our ability to use U.S. and foreign laws to protect them. Our intellectual property includes, among other things, our
23
original content, our editorial features, logos, brands, domain names, the technology that we use to deliver our services, the various databases of information that we maintain and make available by license, and the appearances of our websites. We claim common law protection on certain names and marks that we have used in connection with our business activities. Although we have applied for and obtained registration of many of our marks in countries outside of the United States where we do business, we have not been able to obtain registration of all of our key marks in such jurisdictions, in some cases due to prior registration or use by third parties employing similar marks. In addition to U.S. and foreign laws, we rely on confidentiality agreements with our employees and third parties and protective contractual provisions to safeguard our intellectual property. Policing our intellectual property rights worldwide is a difficult task, and we may not be able to identify infringing users. We cannot be certain that third party licensees of our content will always take actions to protect the value of our proprietary rights and reputation. Intellectual property laws and our agreements may not be sufficient to prevent others from copying or otherwise obtaining and using our content or technologies. In addition, others may develop non-infringing technologies that are similar or superior to ours. In seeking to protect our marks, copyrights, domain names and other proprietary rights, or in defending ourselves against claims of infringement that may be with or without merit, we could face costly litigation and the diversion of our management's attention and resources. These claims could result in the need to develop alternative trademarks, content or technology or to enter into costly royalty or licensing agreements, which could have a material adverse effect on our business, results of operations and financial condition. We may not have, in all cases, conducted formal evaluations to confirm that our technology and services do not or will not infringe upon the intellectual property rights of third parties. As a result, we cannot be certain that our technology, offerings, services or online content do not or will not infringe upon the intellectual property rights of third parties. If we were found to have infringed on a third party's intellectual property rights, the value of our brands and our business reputation could be impaired, and our business could suffer.
Our business could be harmed if we are unable to correspond with existing and potential users by e-mail.
We use e-mail as a significant means of communicating with our existing users. The laws and regulations governing the use of e-mail for marketing purposes continue to evolve, and the growth and development of the market for commerce over the Internet may lead to the adoption of additional legislation and/or changes to existing laws. If new laws or regulations are adopted, or existing laws and regulations are interpreted and/or amended or modified, to impose additional restrictions on our ability to send e-mail to our users or potential users, we may not be able to communicate with them in a cost-effective manner. In addition to legal restrictions on the use of e-mail, Internet service providers and others typically attempt to block the transmission of unsolicited e-mail, commonly known as "spam." If an Internet service provider or software program identifies e-mail from us as "spam," we could be placed on a restricted list that would block our e-mail to users or potential users who maintain e-mail accounts with these Internet service providers or who use these software programs. If we are unable to communicate by e-mail with our users and potential users as a result of legislation, blockage or otherwise, our business, operating results and financial condition could be harmed.
Changes in laws and standards relating to data collection and use, and the privacy of Internet users and other data could impair our efforts to maintain and grow our audience and thereby decrease our advertising revenue.
We collect information from our users who register on our websites or for services, or respond to surveys. Subject to each user's permission (or right to decline, which we refer to as an "opt-out"), we may use this information to inform our users of services that have indicated may be of interest to them. We may also share this information with our advertising clients for registered members who have elected to receive additional promotional materials and have granted us permission to share their information with third parties. The U.S. federal and various state governments have adopted or
24
proposed limitations on the collection, distribution and use of personal information of Internet users. Several foreign jurisdictions, including the European Union, the United Kingdom and Canada, have adopted legislation (including directives or regulations) that may increase the requirements for collecting, or limit our collection and use of, information from Internet users in these jurisdictions. In addition, growing public concern about privacy, data security and the collection, distribution and use of personal information has led to self-regulation of these practices by the Internet advertising and direct marketing industry, and to increased federal and state regulation. Because many of the proposed laws or regulations are in their early stages, we cannot yet determine the impact these regulations may have on our business over time. Although, to date, our efforts to comply with applicable federal and state laws and regulations have not hurt our business, additional, more burdensome laws or regulations, including consumer privacy and data security laws, could be enacted or applied to us or our customers. Such laws or regulations could impair our ability to collect user information that helps us to provide more targeted advertising to our users, thereby impairing our ability to maintain and grow our audience and maximize advertising revenue from our advertising clients. Additionally, the US Federal Trade Commission (the "FTC") and many state attorneys general are applying federal and state consumer protection laws to require that the online collection, use and dissemination of data, and the presentation of Web site content, comply with certain standards for notice, choice, security and access. Courts may also adopt these developing standards. In many cases, the specific limitations imposed by these standards are subject to interpretation by courts and other governmental authorities. In addition, on December 20, 2007, the FTC published for public comment proposed principles to address consumer privacy issues that may arise from so-called "behavioral targeting" (i.e. the tracking of a user's online activities in order to deliver advertising tailored to his or her interests) and to encourage industry self-regulation. On February 12, 2009, following public comment, the FTC released a Staff Report with its revised principles for self-regulation of behavioral targeting. Although the FTC currently appears to be less concerned with "first-party" behavioral and contextual advertising than other types of behavioral targeting that include the storage of more potentially sensitive, data or that collects information outside of the "traditional Web site context" (such as through a mobile device or by an ISP), the FTC has stated that it will continue to evaluate self-regulatory programs. In the event of additional legislation in this area, our ability to effectively target our users may be limited. We believe that we are in compliance with the consumer protection standards that apply to us, but a determination by a state or federal agency or court that any of our practices do not meet these standards could create liability to us, result in adverse publicity and affect negatively our businesses. New interpretations of these standards could also require us to incur additional costs and restrict our business operations. In addition, several foreign governmental bodies, including the European Union, the United Kingdom and Canada have regulations dealing with the collection and use of personal information obtained from their citizens, some of which we may be subject to as a result of the expansion of our business internationally. We believe that we are in compliance with the regulations that apply to us, however, such laws may be modified and new laws may be enacted in the future. Any such developments (or developments stemming from enactment or modification of other laws) or the failure to anticipate accurately the application or interpretation of these laws could create liability to us, result in adverse publicity and affect negatively our businesses.
There are a number of risks associated with expansion of our business internationally that could adversely affect our business.
We have license and other arrangements in various countries and maintain direct presences in the United Kingdom and India. In addition to facing many of the same challenges we face domestically, there are additional risks and costs inherent in expanding our business in international markets, including:
- •
- limitations on our activities in foreign countries where we have granted rights to existing business partners;
- •
- the adaptation of our websites and advertising programs to meet local needs and to comply with local legal regulatory requirements;
25
- •
- varied, unfamiliar and unclear legal and regulatory restrictions, as well as unforeseen changes in, legal and regulatory
requirements;
- •
- more restrictive data protection regulation, which may vary by country;
- •
- difficulties in staffing and managing multinational operations;
- •
- difficulties in finding appropriate foreign licensees or joint venture partners;
- •
- distance, language and cultural differences in doing business with foreign entities;
- •
- foreign political and economic uncertainty;
- •
- less extensive adoption of the Internet as an information source and increased restriction on the content of websites;
- •
- currency exchange-rate fluctuations; and
- •
- potential adverse tax requirements.
As a result, we may face difficulties and unforeseen expenses in expanding our business internationally and, even if we attempt to do so, we may be unsuccessful, which could harm our business, operating results and financial condition.
Changes in regulations could adversely affect our business and results of operations.
It is possible that new laws and regulations or new interpretations of existing laws and regulations in the United States and elsewhere will be adopted covering issues affecting our business, including:
- •
- privacy, data security and use of personally identifiable information;
- •
- copyrights, trademarks and domain names; and
- •
- marketing practices, such as e-mail or direct marketing.
Increased government regulation, or the application of existing laws to online activities, could:
- •
- decrease the growth rate of the Internet;
- •
- reduce our revenues;
- •
- increase our operating expenses; or
- •
- expose us to significant liabilities.
Furthermore, the relationship between regulations governing domain names and laws protecting trademarks and similar proprietary rights is still evolving. Therefore, we might be unable to prevent third parties from acquiring domain names that infringe or otherwise decrease the value of our trademarks and other proprietary rights. Any impairment in the value of these important assets could cause our stock price to decline. We cannot be sure what effect any future material noncompliance by us with these laws and regulations or any material changes in these laws and regulations could have on our business, operating results and financial condition.
26
As a creator and a distributor of content over the Internet, we face potential liability for legal claims based on the nature and content of the materials that we create or distribute.
Due to the nature of content published on our online network, including content placed on our online network by third parties, and as a creator and distributor of original content and research, we face potential liability based on a variety of theories, including defamation, negligence, copyright or trademark infringement, or other legal theories based on the nature, creation or distribution of this information. Such claims may also include, among others, claims that by providing hypertext links to websites operated by third parties, we are liable for wrongful actions by those third parties through these websites. Similar claims have been brought, and sometimes successfully asserted, against online services. It is also possible that our users could make claims against us for losses incurred in reliance on information provided on our networks. In addition, we could be exposed to liability in connection with material posted to our Internet sites by third parties. For example, many of our sites offer users an opportunity to post unmoderated comments and opinions. Some of this user-generated content may infringe on third party intellectual property rights or privacy rights or may otherwise be subject to challenge under copyright laws. Such claims, whether brought in the United States or abroad, could divert management time and attention away from our business and result in significant cost to investigate and defend, regardless of the merit of these claims. In addition, if we become subject to these types of claims and are not successful in our defense, we may be forced to pay substantial damages. Our insurance may not adequately protect us against these claims. The filing of these claims may also damage our reputation as a high quality provider of unbiased, timely analysis and result in client cancellations or overall decreased demand for our services.
We may be liable if third parties or our employees misappropriate our users' confidential business information.
We currently retain confidential information relating to our users in secure database servers. Although we observe security measures throughout our operations, we cannot assure you that we will be able to prevent individuals from gaining unauthorized access to these database servers. Any unauthorized access to our servers, or abuse by our employees, could result in the theft of confidential user information. If confidential information is compromised, we could lose customers or become subject to liability or litigation and our reputation could be harmed, any of which could materially and adversely affect our business and results of operations.
Our business, which is dependent on centrally located communications and computer hardware systems, is vulnerable to natural disasters, telecommunication and systems failures, terrorism and other problems, which could reduce traffic on our networks or websites and result in decreased capacity for advertising space.
Our operations are dependent on our communications systems and computer hardware, all of which are located in data centers operated by third parties. These systems could be damaged by fire, floods, earthquakes, power loss, telecommunication failures and similar events. Our insurance policies have limited coverage levels for loss or damages in these events and may not adequately compensate us for any losses that may occur. In addition, terrorist acts or acts of war may cause harm to our employees or damage our facilities, our clients, our clients' customers and vendors, or cause us to postpone or cancel, or result in dramatically reduced attendance at, our events, which could adversely impact our revenues, costs and expenses and financial position. We are predominantly uninsured for losses and interruptions to our systems or cancellations of events caused by terrorist acts and acts of war.
27
Our systems may be subject to slower response times and system disruptions that could adversely affect our revenues.
Our ability to attract and maintain relationships with users, advertisers and strategic partners will depend on the satisfactory performance, reliability and availability of our Internet infrastructure. Our Internet advertising revenues relate directly to the number of advertisements and other marketing opportunities delivered to our users. System interruptions or delays that result in the unavailability of Internet sites or slower response times for users would reduce the number of advertising impressions and leads delivered. This could reduce our revenues as the attractiveness of our sites to users and advertisers decreases. Our insurance policies provide only limited coverage for service interruptions and may not adequately compensate us for any losses that may occur due to any failures or interruptions in our systems. Further, we do not have multiple site capacity for all of our services in the event of any such occurrence.
We may experience service disruptions for the following reasons:
- •
- occasional scheduled maintenance;
- •
- equipment failure;
- •
- volumes of visits to our websites that exceed our infrastructure's capacity; and
- •
- natural disasters, telecommunications failures, power failures, other system failures, maintenance, viruses, hacking or other events outside of our control.
In addition, our networks and websites must accommodate a high volume of traffic and deliver frequently updated information. They have experienced in the past, and may experience in the future, slower response times or decreased traffic for a variety of reasons. There have been instances where our online networks as a whole, or our websites individually, have been inaccessible. Also, slower response times, which have occurred more frequently, can result from general Internet problems, routing and equipment problems involving third party Internet access providers, problems with third party advertising servers, increased traffic to our servers, viruses and other security breaches, many of which problems are out of our control. In addition, our users depend on Internet service providers and online service providers for access to our online networks or websites. Those providers have experienced outages and delays in the past, and may experience outages or delays in the future. Moreover, our Internet infrastructure might not be able to support continued growth of our online networks or websites. Any of these problems could result in less traffic to our networks or websites or harm the perception of our networks or websites as reliable sources of information. Less traffic on our networks and websites or periodic interruptions in service could have the effect of reducing demand for advertising on our networks or websites, thereby reducing our advertising revenues.
Our networks may be vulnerable to unauthorized persons accessing our systems, viruses and other disruptions, which could result in the theft of our proprietary information and/or disrupt our Internet operations making our websites less attractive and reliable for our users and advertisers.
Internet usage could decline if any well-publicized compromise of security occurs. "Hacking" involves efforts to gain unauthorized access to information or systems or to cause intentional malfunctions or loss or corruption of data, software, hardware or other computer equipment. Hackers, if successful, could misappropriate proprietary information or cause disruptions in our service. We may be required to expend capital and other resources to protect our websites against hackers. Our online networks could also be affected by computer viruses or other similar disruptive problems, and we could inadvertently transmit viruses across our networks to our users or other third parties. Any of these occurrences could harm our business or give rise to a cause of action against us. Providing unimpeded access to our online networks is critical to servicing our customers and providing superior customer service. Our inability to provide continuous access to our online networks could cause some of our
28
customers to discontinue purchasing advertising programs and services and/or prevent or deter our users from accessing our networks. Our activities and the activities of third party contractors involve the storage and transmission of proprietary and personal information. Accordingly, security breaches could expose us to a risk of loss or litigation and possible liability. We cannot assure that contractual provisions attempting to limit our liability in these areas will be successful or enforceable, or that other parties will accept such contractual provisions as part of our agreements.
We will continue to incur significant costs as a result of operating as a public company, and our management will be required to devote substantial time to new compliance initiatives.
We will continue to incur significant legal, accounting and other expenses as a public company. The Sarbanes-Oxley Act of 2002, as well as rules subsequently implemented by the SEC and the Nasdaq Stock Market, or Nasdaq, has imposed various new requirements on public companies, including requiring changes in corporate governance practices. Our management and other personnel will need to continue to devote a substantial amount of time to these compliance initiatives. Moreover, these rules and regulations have increased our legal and financial compliance costs and will make some activities more time-consuming and costly. For example, these rules and regulations may require us to incur substantial costs to maintain the same or similar director and officer liability insurance coverage.
In addition, the Sarbanes-Oxley Act requires, among other things, that we maintain effective internal controls for financial reporting and disclosure controls and procedures. In particular, although we have completed our system and process evaluation and testing of our internal controls over financial reporting to allow management and our independent registered public accounting firm to report on the effectiveness of our internal controls over financial reporting, as required by Section 404 of the Sarbanes-Oxley Act, ongoing compliance with Section 404 requires that we continue to incur substantial accounting expense and expend significant management efforts. We currently do not have an internal audit group, and have engaged outside accounting and advisory services with appropriate public company experience and technical accounting knowledge to assist with these ongoing compliance efforts. If we or our independent registered public accounting firm identifies future deficiencies in our internal controls over financial reporting that are deemed to be material weaknesses, as was the case for the year-end audits of 2008 and 2009, the market price of our stock could decline and we could be subject to sanctions or investigations by Nasdaq, the SEC or other regulatory authorities, which would require additional financial and management resources.
We have received two deficiency letters from The Nasdaq Stock Market within the past year relating to our failure to maintain compliance with Nasdaq's Listing Rule 5520(c)(1) as a result of our failure to timely file Securities and Exchange Commission reports. Nasdaq granted us an exception from the rule in each of these cases, but if we fail to comply with Nasdaq's listing rules in the future, Nasdaq may decide not to grant an additional exception. If we are unable to comply with Nasdaq's listing rules in the future and they do not grant an exception, we may be delisted by Nasdaq, which would have a material adverse effect on the trading volume of our stock and, likely, our stock price.
On May 14, 2009, we received a Nasdaq Staff Deficiency letter indicating that we were not in compliance with the filing requirement under Nasdaq Marketplace Rule 4310(c)(14) due to our failure to timely file our Quarterly Report on Form 10-Q for the fiscal quarter ended March 31, 2009. On November 13, 2009, we received a second Nasdaq Staff Deficiency letter indicating that we were not in compliance with the filing requirement under Nasdaq Marketplace Rule 5250(c)(1) due to our failure to timely file our Quarterly Report on Form 10-Q for the fiscal quarter ended September 30, 2009. Nasdaq granted us an exception from the rule in each of these cases and gave us the opportunity to become current with our compliance. We are now current with our SEC reporting requirements, and are in compliance with the relevant listing rule.
29
However, if we fail to comply with Nasdaq's listing rules in the future, Nasdaq may decide not to grant us additional exceptions to listing rules. If we are unable to comply with Nasdaq's listing rules in the future and they do not grant us an exception, we may be delisted by Nasdaq, which would have a material adverse effect on the trading volume of our stock and, likely, our stock price. A limited public market for our common shares may limit your ability to sell your shares, and may also result in other negative implications, including the potential loss of confidence by customers, strategic partners and employees, and loss of institutional investor interest in our common stock.
We have identified material weaknesses in our internal controls over financial reporting, which have not been fully remediated. In addition, we may experience additional material weaknesses in the future. Any material weaknesses in our internal control over financial reporting or our failure to remediate such material weaknesses could result in a material misstatement in our financial statements not being prevented or detected and could adversely affect investor confidence in the accuracy and completeness of our financial statements, as well as our stock price.
We have identified material weaknesses in our internal control over financial reporting relating to accounting for aging customer credits and unallocated general accrual accounting, and accounting for certain complex transactions involving revenue and stock-based compensation. These material weaknesses and our remediation plans are described further in Item 9A in this Annual Report on Form 10-K. Material weaknesses in our internal control over financial reporting could result in material misstatements in our financial statements not being prevented or detected. Although we have implemented a Sarbanes-Oxley Remediation Plan, we may experience difficulties or delays in achieving goals under this plan and completing remediation, or may not be able to successfully remediate material weaknesses at all. Any material weakness or unsuccessful remediation could harm investor confidence in the accuracy and completeness of our financial statements, which in turn could harm our business and have an adverse effect on our stock price and our ability to raise additional funds.
Our prior restatements, and the delay in our filing of several of our Periodic Reports has had, and may continue to have, an adverse impact on us, including increased costs, and the possibility of legal or administrative proceedings.
In June 2009, we restated a number of our previously filed financial statements as a result of an error in the manner in which we recognized certain online revenue. In November 2009, we identified an improper accounting practice related to certain customer credits being improperly removed as liabilities from our balance sheet, and as a result, delayed the filing of our Quarterly Report on Form 10-Q for the quarter ended September 30, 2009. We incurred substantial unanticipated costs for accounting, legal and other advisory fees in 2009 and 2010 in connection with these matters, and although the these matters are now resolved, we may incur additional related costs.
The Securities and Exchange Commission has commented on our Quarterly Report on Form 10-Q for the period ended September 30, 2009; we have responded to all questions in a manner we believe to be complete. However, the SEC may have further comments on that Report or others we may file, including this Annual Report on Form 10-K, which may divert more of our management's time and attention, and cause us to incur additional costs. Similarly, in the event litigation is pursued or other relief is sought by persons asserting claims for damages allegedly resulting from or based on these matters, or events related thereto, we may incur additional defense costs beyond our insurance coverage regardless of their outcome. Likewise, such events might cause a diversion of our management's time and attention. If we do not prevail in any such actions, we could be required to pay substantial damages or settlement costs.
30
Our ability to raise capital in the future may be limited.
Our business and operations may consume resources faster than we anticipate. In the future, we may need to raise additional funds to expand our sales and marketing and service development efforts or to make acquisitions. Additional financing may not be available on favorable terms, if at all. If adequate funds are not available on acceptable terms, we may be unable to fund the expansion of our sales and marketing and research and development efforts or take advantage of acquisition or other opportunities, which could seriously harm our business and operating results. If we incur debt, the debt holders would have rights senior to common stockholders to make claims on our assets and the terms of any debt could restrict our operations, including our ability to pay dividends on our common stock. Furthermore, if we issue additional equity securities, stockholders will experience dilution, and the new equity securities could have rights senior to those of our common stock. Because our decision to issue securities in any future offering will depend on market conditions and other factors beyond our control, we cannot predict or estimate the amount, timing or nature of our future offerings. Thus, our stockholders bear the risk of our future securities offerings reducing the market price of our common stock and diluting their interest.
The impairment of a significant amount of goodwill and intangible assets on our balance sheet could result in a decrease in earnings and, as a result, our stock price could decline.
In the course of our operating history, we have acquired assets and businesses. Some of our acquisitions have resulted in the recording of a significant amount of goodwill and/or intangible assets on our financial statements. We had approximately $101 million of goodwill and net intangible assets as of December 31, 2009. The goodwill and/or intangible assets were recorded because the fair value of the net tangible assets acquired was less than the purchase price. We may not realize the full value of the goodwill and/or intangible assets. As such, we evaluate goodwill and other intangible assets with indefinite useful lives for impairment on an annual basis or more frequently if events or circumstances suggest that the asset may be impaired. We evaluate other intangible assets subject to amortization whenever events or changes in circumstances indicate that the carrying amount of those assets may not be recoverable. If goodwill or other intangible assets are determined to be impaired, we will write off the unrecoverable portion as a charge to our earnings. If we acquire new assets and businesses in the future, as we intend to do, we may record additional goodwill and/or intangible assets. The possible write-off of the goodwill and/or intangible assets could negatively impact our future earnings and, as a result, the market price of our common stock could decline.
We will record substantial expenses related to our issuance of stock-based compensation which may have a material negative impact on our operating results for the foreseeable future.
Our stock-based compensation expenses are expected to be significant in future periods, which will have an adverse impact on our operating income and net income. We use highly subjective assumptions, including the option's expected life and the price volatility of the underlying stock. Changes in the subjective input assumptions can materially affect the amount of our stock-based compensation expense. In addition, an increase in the competitiveness of the market for qualified employees could result in an increased use of stock-based compensation awards, which in turn would result in increased stock-based compensation expense in future periods.
The trading value of our common stock may be volatile and decline substantially.
The trading price of our common stock is likely to be volatile and could be subject to wide fluctuations in response to various factors, some of which are beyond our control. In addition to the factors discussed in this "Risk Factors" section and elsewhere in this prospectus, these factors include:
- •
- our operating performance and the operating performance of similar companies;
- •
- the overall performance of the equity markets;
31
- •
- announcements by us or our competitors of acquisitions, business plans or commercial relationships;
- •
- threatened or actual litigation;
- •
- changes in laws or regulations relating to the provision of Internet content;
- •
- any major change in our board of directors or management;
- •
- publication of research reports about us, our competitors or our industry, or positive or negative recommendations or
withdrawal of research coverage by securities analysts;
- •
- our sale of common stock or other securities in the future;
- •
- large volumes of sales of our shares of common stock by existing stockholders; and
- •
- general political and economic conditions.
In addition, the stock market in general, and historically the market for Internet-related companies in particular, has experienced extreme price and volume fluctuations that have often been unrelated or disproportionate to the operating performance of those companies. Securities class action litigation has often been instituted against companies following periods of volatility in the overall market and in the market price of a company's securities. This litigation, if instituted against us, could result in substantial costs, divert our management's attention and resources and harm our business, operating results and financial condition.
Provisions of our certificate of incorporation, bylaws and Delaware law could deter takeover attempts.
Various provisions in our certificate of incorporation and bylaws could delay, prevent or make more difficult a merger, tender offer, proxy contest or change of control. Our stockholders might view any transaction of this type as being in their best interest since the transaction could result in a higher stock price than the then-current market price for our common stock. Among other things, our certificate of incorporation and bylaws:
- •
- authorize our board of directors to issue preferred stock with the terms of each series to be fixed by our board of
directors, which could be used to institute a "poison pill" that would work to dilute the share ownership of a potential hostile acquirer, effectively preventing acquisitions that have not been
approved by our board;
- •
- divide our board of directors into three classes so that only approximately one-third of the total number of
directors is elected each year;
- •
- permit directors to be removed only for cause;
- •
- prohibit action by less than unanimous written consent of our stockholders; and
- •
- specify advance notice requirements for stockholder proposals and director nominations. In addition, with some exceptions, the Delaware General Corporation Law restricts or delays mergers and other business combinations between us and any stockholder that acquires 15% or more of our voting stock.
Future sales of shares of our common stock by existing stockholders could depress the market price of our common stock.
If our existing stockholders sell, or indicate an intent to sell, substantial amounts of our common stock in the public market, the trading price of our common stock could decline significantly. A large portion of our outstanding shares of common stock are held by our officers, directors and affiliates. Two of our affiliates are venture capital funds, which are typically structured to have a finite life. As
32
these venture capital funds approach or pass the life of the fund, their decision to sell or hold our stock may be based not only on the underlying investment merits of our stock, but also on the requirements of their internal fund structure. Our directors, executive officers and affiliates beneficially own approximately 27 million shares of our common stock, which represents 65% of our shares outstanding as of December 31, 2009. If these additional shares are sold, or if it is perceived that they will be sold in the public market, the trading price of our common stock could decline substantially.
A limited number of stockholders will have the ability to influence the outcome of director elections and other matters requiring stockholder approval.
Our directors, executive officers and affiliates beneficially own approximately 65% of our outstanding common stock. These stockholders, if they act together, could exert substantial influence over matters requiring approval by our stockholders, including the election of directors, the amendment of our certificate of incorporation and bylaws and the approval of mergers or other business combination transactions. This concentration of ownership may discourage, delay or prevent a change in control of our company, which could deprive our stockholders of an opportunity to receive a premium for their stock as part of a sale of our company and might reduce our stock price. These actions may be taken even if they are opposed by other stockholders.
Item 1B. Unresolved Staff Comments
None.
In the first quarter of 2010, our corporate headquarters were relocated from Needham, Massachusetts to Newton, Massachusetts for which the Company entered into an agreement to lease approximately 87,875 square feet of office space. The lease commenced in February 2010 and has a term of 10 years. We also have leases for 12,995 square feet of office space in San Francisco, California, which expires January 2013 and 7,339 square feet in Alpharetta, Georgia which expires in January 2011. In addition, we have a lease for 25,762 square feet of office space in Alpharetta, Georgia, which we currently sublease to a third party. The lease and sublease expire in November, 2010. We do not own any real property. We believe that our leased facilities are, in general, in good operating condition and adequate for our current operations and that additional leased space can be obtained if needed.
We are not currently a party to any material legal proceedings and we are not aware of any pending or threatened litigation against us that could have a material adverse effect on our business, operating results or financial condition.
33
Item 5. Market for Registrant's Common Equity, Related Stockholder Matters and Issuer Purchases of Equity Securities
Our common stock is listed on the Nasdaq Global Market under the trading symbol "TTGT". The following table sets forth the high and low sales prices of our common stock, as reported by the Nasdaq Global Market, for each quarterly period in 2009 and 2008:
| |
High | Low | |||||
|---|---|---|---|---|---|---|---|
Fiscal 2009 |
|||||||
Quarter ended March 31, 2009 |
$ | 4.99 | $ | 2.30 | |||
Quarter ended June 30, 2009 |
$ | 5.38 | $ | 2.13 | |||
Quarter ended September 30, 2009 |
$ | 8.00 | $ | 3.98 | |||
Quarter ended December 31, 2009 |
$ | 6.94 | $ | 5.20 | |||
Fiscal 2008 |
|||||||
Quarter ended March 31, 2008 |
$ | 15.23 | $ | 10.49 | |||
Quarter ended June 30, 2008 |
$ | 15.11 | $ | 10.56 | |||
Quarter ended September 30, 2008 |
$ | 10.45 | $ | 6.00 | |||
Quarter ended December 31, 2008 |
$ | 6.67 | $ | 2.31 | |||
The closing sale price of our common stock, as reported by the Nasdaq Global Market, was $5.23 on February 26, 2010.
Holders
As of February 26, 2010 there were approximately 150 stockholders of record of our common stock based on the records of our transfer agent.
Dividends
We did not declare or pay any cash dividends on our common stock during the three most recent fiscal years. We currently intend to retain earnings, if any, to fund the development and growth of our business and do not anticipate paying other cash dividends on our common stock in the foreseeable future. Our payment of any future dividends will be at the discretion of our board of directors after taking into account various factors, including our financial condition, operating results, cash needs and growth plans.
Recent Sales of Unregistered Securities
Since January 1, 2006, we have issued the following securities that were not registered under the Securities Act:
- (a)
- Issuances of Capital Stock
As of November 2006, there were outstanding options to purchase 17,456 shares of our common stock at an exercise price of $2.36 per share, the issuance of which may not have been exempt from registration or certain qualification requirements under federal or state securities laws. To address this issue, we made a rescission offer that was completed in December 2006 to all holders of these options pursuant to which we offered to repurchase these options for cash or shares of our common stock. In connection with the completion of the rescission offer, we issued 10,726 shares and paid out $6,561 in cash, which included statutory interest. The sales of securities pursuant to the rescission offer were made in reliance upon the exemption from registration provided by Section 3(b) of the Securities Act of 1933 for transactions by an issuer not involving a
34
- (b)
- Grants and Exercises of Stock Options.
public offering. All of the foregoing securities are deemed restricted securities for purposes of the Securities Act.
- (c)
- Exercises of Warrants
During 2009 and 2008, pursuant to our 2007 Stock Option and Incentive plan we granted stock options to purchase shares of common stock of 755,000 and 1,127,295, respectively, with a weighted average exercise price per share of $5.82 and $5.24, respectively. During 2009 and 2008, options exercised were 304,349 and 463,082, respectively.
During 2009 and 2008, we granted restricted stock awards of 1,962,954 and 55,667, respectively, with a weighted average grant date fair value of $4.03 and $7.83, respectively.
During 2007, prior to our initial public offering, we granted stock options to purchase 75,000 shares of our common stock with an exercise price of $13.00 per share to a director. During 2007, prior to our initial public offering, pursuant to our 1999 Stock Option Plan, we issued and sold 333,636 shares of our common stock upon the exercise of stock options for aggregate consideration of $0.2 million.
During 2006, pursuant to our 1999 Stock Option Plan, we granted stock options to purchase 4,243,500 shares of common stock with a weighted average exercise price of $7.36 per share to our employees. During 2006, 371,634 options were exercised for aggregate consideration of $0.5 million.
The issuance of common stock upon exercise of the options was exempt either pursuant to Rule 701, as a transaction pursuant to a compensatory benefit plan, or pursuant to Section 4(2), as a transaction by an issuer not involving a public offering.
During 2008, we issued 6,886 shares of our common stock upon the cashless exercise of warrants. We did not receive any consideration from the cashless exercises apart from the surrender of the underlying warrants.
During 2007, we issued 52,764 shares of our common stock upon the cashless exercise of warrants. We did not receive any consideration from the cashless exercises apart from the surrender of the underlying warrants.
The issuances of common stock upon the exercise of the warrants were made in reliance upon the exemption from registration proved by Section 4(2) of the Securities Act for transactions by an issuer not involving a public offering. All of the foregoing securities are deemed restricted securities for purposes of the Securities Act.
Use of Proceeds from Public Offering of Common Stock
In May 2007, we completed our initial public offering (IPO) pursuant to a registration statement on Form S-1 (File No. 333-140503) that was declared effective by the SEC on May 16, 2007. Under the registration statement, we registered the offering and sale of an aggregate of 7,700,000 shares of our common stock, $0.001 par value, of which 6,427,152 shares were sold by the Company and 1,272,848 were sold by certain selling stockholders. All of the shares of common stock issued pursuant to the registration statement, including the shares sold by the selling stockholders, were sold at a price to the public of $13.00 per share.
As a result of the IPO, we raised a total of $83.2 million in net proceeds after deducting underwriting discounts and commissions of approximately $6.4 million and offering expenses of approximately $2.3 million. In May 2007 we repaid $12.0 million that we had borrowed against our revolving credit facility in conjunction with the acquisition of TechnologyGuide.com in April 2007. In
35
November 2007 we acquired KnowledgeStorm, Inc. for approximately $58 million, consisting of approximately $52 million in cash and 359,820 shares of unregistered common stock of TechTarget valued at $6.0 million. In November 2008 we acquired The Brian Madden Company LLC for approximately $1.3 million in cash.
We have applied the remaining net proceeds from the IPO to our working capital for general corporate purposes. We have no current agreements or commitments with respect to any material acquisitions. We have invested the remaining net proceeds in cash, cash equivalents and short-term investments, in accordance with our investment policy. None of the remaining net proceeds were paid, directly or indirectly, to directors, officers, persons owning ten percent or more of our equity securities, or any of our other affiliates.
Equity Compensation Plan Information
Information relating to compensation plans under which our equity securities are authorized for issuance is set forth under "Security Ownership of Certain Beneficial Owners and Management and Related Stockholder Matters" in Item 12 below.
36
Stock Performance Graph
The following graph compares the cumulative total return to stockholders of our common stock for the period from May 16, 2007, the date of our initial public offering, to December 31, 2009, to the cumulative total return of the Russell 2000 Index and the S&P 500 Media Industry Index for the same period. This graph assumes the investment of $100.00 on May 16, 2007 in our common stock, the Russell 2000 Index and the S&P 500 Media Industry Index and assumes any dividends are reinvested.
COMPARATIVE STOCK PERFORMANCE
Among TechTarget, Inc.
The Russell 2000 Index and
The S&P 500 Media Industry Index
COMPARISON OF 32 MONTH CUMULATIVE TOTAL RETURN*
Among TechTarget Inc, The Russell 2000 Index
And S&P 500 Media Industry
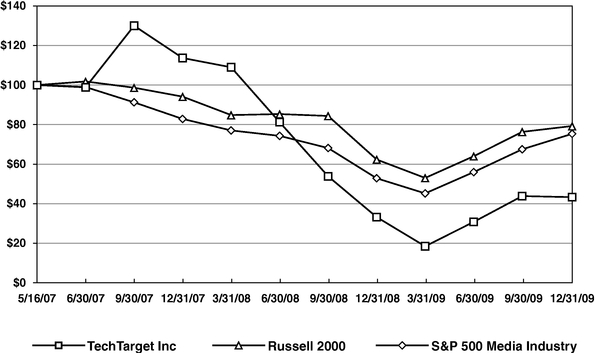
- *
- $100 invested on 5/16/07 in stock or index, including reinvestment of dividends. Fiscal year ending December 31.
| |
5/16/07 | 6/30/07 | 9/30/07 | 12/31/07 | 3/31/08 | 6/30/08 | 9/30/08 | 12/31/08 | 3/31/09 | 6/30/09 | 9/30/09 | 12/31/09 | |||||||||||||||||||||||||
|---|---|---|---|---|---|---|---|---|---|---|---|---|---|---|---|---|---|---|---|---|---|---|---|---|---|---|---|---|---|---|---|---|---|---|---|---|---|
TechTarget Inc |
100.00 | 98.85 | 130.00 | 113.69 | 109.00 | 81.23 | 53.85 | 33.23 | 18.46 | 30.77 | 43.85 | 43.31 | |||||||||||||||||||||||||
Russell 2000 |
100.00 | 101.82 | 98.67 | 94.15 | 84.83 | 85.33 | 84.38 | 62.34 | 53.02 | 63.99 | 76.32 | 79.28 | |||||||||||||||||||||||||
S&P 500 Media Industry |
100.00 | 99.00 | 91.26 | 82.87 | 77.06 | 74.30 | 68.14 | 52.85 | 45.21 | 55.97 | 67.50 | 75.33 | |||||||||||||||||||||||||
The information included under the heading "Stock Performance Graph" in Item 5 of this Annual Report on Form 10-K is "furnished" and not "filed" and shall not be deemed to be "soliciting material" or subject to Regulation 14A, shall not be deemed "filed" for purposes of Section 18 of the Securities Act of 1934, as amended, or otherwise subject to the liabilities of that section, nor shall it be deemed incorporated by reference in any filing under the Securities Act of 1933, as amended, or the Securities Act of 1934, as amended.
37
Item 6. Selected Consolidated Financial Data
The information set forth below is not necessarily indicative of results of future operations, and should be read in conjunction with Item 7, "Management's Discussion and Analysis of Financial Condition and Results of Operations" and the consolidated financial statements and related notes thereto included in Item 8 of this Form 10-K to fully understand factors that may affect the comparability of the information presented below.
| |
Years Ended December 31, | ||||||||||||||||
|---|---|---|---|---|---|---|---|---|---|---|---|---|---|---|---|---|---|
| |
2009 | 2008 | 2007 | 2006 | 2005 | ||||||||||||
| |
(in thousands, except share and per share data) |
||||||||||||||||
Consolidated Statement of |
|||||||||||||||||
Revenues: |
|||||||||||||||||
Online |
$ | 72,345 | $ | 77,373 | $ | 61,353 | $ | 51,372 | $ | 43,715 | |||||||
Events |
14,152 | 22,786 | 24,254 | 19,708 | 14,595 | ||||||||||||
| — | 4,385 | 6,643 | 8,119 | 8,501 | |||||||||||||
Total revenues |
86,497 | 104,544 | 92,250 | 79,199 | 66,811 | ||||||||||||
Cost of revenues: |
|||||||||||||||||
Online(1) |
19,378 | 21,404 | 15,575 | 12,988 | 10,476 | ||||||||||||
Events(1) |
5,600 | 9,531 | 8,611 | 6,493 | 6,202 | ||||||||||||
Print(1) |
— | 2,156 | 3,788 | 5,339 | 5,322 | ||||||||||||
Total cost of revenues |
24,978 | 33,091 | 27,974 | 24,820 | 22,000 | ||||||||||||
Gross profit |
61,519 | 71,453 | 64,276 | 54,379 | 44,811 | ||||||||||||
Operating expenses: |
|||||||||||||||||
Selling and marketing(1) |
32,002 | 33,481 | 28,048 | 20,305 | 18,174 | ||||||||||||
Product development(1) |
8,664 | 10,995 | 7,320 | 6,295 | 5,756 | ||||||||||||
General and administrative(1) |
19,527 | 14,663 | 12,592 | 8,756 | 7,617 | ||||||||||||
Depreciation |
2,219 | 2,406 | 1,610 | 1,144 | 1,792 | ||||||||||||
Amortization of intangible assets |
4,714 | 5,306 | 4,740 | 5,029 | 5,172 | ||||||||||||
Restructuring charge |
— | 1,494 | — | — | — | ||||||||||||
Total operating expenses |
67,126 | 68,345 | 54,310 | 41,529 | 38,511 | ||||||||||||
Operating (loss) income |
(5,607 | ) | 3,108 | 9,966 | 12,850 | 6,300 | |||||||||||
Interest income (expense), net |
267 | 1,440 | 1,831 | 321 | (30 | ) | |||||||||||
(Loss) income before (benefit from) provision for income taxes |
(5,340 | ) | 4,548 | 11,797 | 13,171 | 6,270 | |||||||||||
(Benefit from) provision for income taxes |
(224 | ) | 2,784 | 5,252 | 5,658 | (4,036 | ) | ||||||||||
Net (loss) income |
$ | (5,116 | ) | $ | 1,764 | $ | 6,545 | $ | 7,513 | $ | 10,306 | ||||||
Net (loss) income per common share(2): |
|||||||||||||||||
Basic |
$ | (0.12 | ) | $ | 0.04 | $ | 0.09 | $ | (0.42 | ) | $ | (0.04 | ) | ||||
Diluted |
$ | (0.12 | ) | $ | 0.04 | $ | 0.08 | $ | (0.42 | ) | $ | (0.04 | ) | ||||
Weighted average common shares outstanding: |
|||||||||||||||||
Basic |
41,864,789 | 41,424,920 | 28,384,303 | 7,824,374 | 7,370,680 | ||||||||||||
Diluted |
41,864,789 | 43,439,619 | 31,346,738 | 7,824,374 | 7,370,680 | ||||||||||||
Other Data: |
|||||||||||||||||
Adjusted EBITDA (unaudited)(3) |
$ | 13,949 | $ | 20,985 | $ | 22,150 | $ | 20,273 | $ | 13,342 | |||||||
38
| |
As of December 31, | |||||||||||||||
|---|---|---|---|---|---|---|---|---|---|---|---|---|---|---|---|---|
| |
2009 | 2008 | 2007 | 2006 | 2005 | |||||||||||
| |
(in thousands) |
|||||||||||||||
Consolidated Balance Sheet Data: |
||||||||||||||||
Cash, cash equivalents and investments |
$ | 82,557 | $ | 69,568 | $ | 62,001 | $ | 30,830 | $ | 46,879 | ||||||
Total assets |
$ | 214,063 | $ | 210,012 | $ | 202,488 | $ | 94,156 | $ | 96,516 | ||||||
Total liabilities |
$ | 16,199 | $ | 19,075 | $ | 25,155 | $ | 24,309 | $ | 36,269 | ||||||
Total redeemable convertible preferred stock |
$ | — | $ | — | $ | — | $ | 136,766 | $ | 126,004 | ||||||
Total stockholders' equity (deficit) |
$ | 197,864 | $ | 190,937 | $ | 177,334 | $ | (66,919 | ) | $ | (65,756 | ) | ||||
| |
Years Ended December 31, | |||||||||||||||||
|---|---|---|---|---|---|---|---|---|---|---|---|---|---|---|---|---|---|---|
| |
2009 | 2008 | 2007 | 2006 | 2005 | |||||||||||||
| |
(in thousands) |
|||||||||||||||||
(1) Amounts include stock-based compensation |
||||||||||||||||||
Cost of online revenue |
$ | 454 | $ | 407 | $ | 189 | $ | 87 | $ | — | ||||||||
Cost of events revenue |
94 | 91 | 53 | 31 | — | |||||||||||||
Cost of print revenue |
— | 6 | 15 | 12 | — | |||||||||||||
Selling and marketing |
5,342 | 4,813 | 2,999 | 606 | — | |||||||||||||
Product development |
535 | 473 | 334 | 90 | — | |||||||||||||
General and administrative |
6,198 | 2,881 | 2,244 | 424 | 78 | |||||||||||||
Total |
$ | 12,623 | $ | 8,671 | $ | 5,834 | $ | 1,250 | $ | 78 | ||||||||
- (2)
- Basic
and diluted net income (loss) per common share is computed by dividing the net income (loss) applicable to common stockholders by the
basic and diluted weighted-average number of common shares outstanding for the fiscal period. See "Note 2 of our Notes to Consolidated Financial Statements."
- (3)
- The following table reconciles net (loss) income to Adjusted EBITDA for the periods presented and is unaudited:
| |
Years Ended December 31, | |||||||||||||||
|---|---|---|---|---|---|---|---|---|---|---|---|---|---|---|---|---|
| |
2009 | 2008 | 2007 | 2006 | 2005 | |||||||||||
| |
(in thousands) |
|||||||||||||||
Net (loss) income |
$ | (5,116 | ) | $ | 1,764 | $ | 6,545 | $ | 7,513 | $ | 10,306 | |||||
Interest income (expense), net |
267 | 1,440 | 1,831 | 321 | (30 | ) | ||||||||||
(Benefit from) provision for income taxes |
(224 | ) | 2,784 | 5,252 | 5,658 | (4,036 | ) | |||||||||
Depreciation |
2,219 | 2,406 | 1,610 | 1,144 | 1,792 | |||||||||||
Amortization of intangible assets |
4,714 | 5,306 | 4,740 | 5,029 | 5,172 | |||||||||||
EBITDA |
1,326 | 10,820 | 16,316 | 19,023 | 13,264 | |||||||||||
Stock-based compensation |
12,623 | 8,671 | 5,834 | 1,250 | 78 | |||||||||||
Restructuring charge |
— | 1,494 | — | — | — | |||||||||||
Adjusted EBITDA |
$ | 13,949 | $ | 20,985 | $ | 22,150 | $ | 20,273 | $ | 13,342 | ||||||
Adjusted EBITDA is a metric used by management to measure operating performance. EBITDA represents net income (loss) before interest income (expense) net, provision for (benefit from) income taxes, depreciation and amortization. Adjusted EBITDA represents EBITDA as further adjusted to exclude stock-based compensation and restructuring charges. We present Adjusted EBITDA as a supplemental performance measure because we believe it facilitates operating performance comparisons from period to period and company to company by backing out potential differences caused by
39
variations in capital structures (affecting interest expense), tax positions (such as the impact on periods or companies of changes in effective tax rates or net operating losses), the age and book depreciation of fixed assets (affecting relative depreciation expense), and the impact of non-cash stock-based compensation expense costs. Because Adjusted EBITDA facilitates internal comparisons of operating performance on a more consistent basis, we also use Adjusted EBITDA in measuring our performance relative to that of our competitors. We also use Adjusted EBITDA in connection with our compensation of our executive officers and senior management. Adjusted EBITDA is not a measurement of our financial performance under GAAP and should not be considered as an alternative to net income, operating income or any other performance measures derived in accordance with GAAP or as an alternative to cash flow from operating activities as a measure of our profitability or liquidity. We understand that although Adjusted EBITDA is frequently used by securities analysts, lenders and others in their evaluation of companies, Adjusted EBITDA has limitations as an analytical tool, and you should not consider it in isolation, or as a substitute for analysis of our results as reported under GAAP. Some of these limitations are:
- •
- Adjusted EBITDA does not reflect our cash expenditures, or future requirements for capital expenditures or contractual
commitments;
- •
- Adjusted EBITDA does not reflect changes in, or cash requirements for, our working capital needs;
- •
- Adjusted EBITDA does not reflect the interest expense, or the cash requirements necessary to service interest or principal
payments, on our debts;
- •
- Although depreciation and amortization are non-cash charges, the assets being depreciated and amortized will
often have to be replaced in the future, and Adjusted EBITDA does not reflect any cash requirements for such replacements; and
- •
- Other companies in our industry may calculate Adjusted EBITDA differently than we do, limiting its usefulness as a comparative measure.
40
Item 7. Management's Discussion and Analysis of Financial Condition and Results of Operations
The following discussion and analysis of our financial condition and results of operations should be read in conjunction with the consolidated financial statements and accompanying notes included elsewhere in this Annual Report on Form 10-K. This discussion and analysis contains forward-looking statements that involve risks, uncertainties and assumptions. Our actual results could differ materially from those anticipated in these forward-looking statements as a result of various factors, including those discussed below and elsewhere in this Annual Report on Form 10-K particularly under the heading "Risk Factors."
Overview
Background
We are a leading provider of specialized online content that brings together buyers and sellers of corporate IT products. We sell customized marketing programs that enable IT vendors to reach corporate IT decision makers who are actively researching specific IT purchases.
Our integrated content platform consists of a network of websites that we complement with targeted in-person events. Throughout the critical stages of the purchase decision process, our content offerings meet IT professionals' needs for expert, peer and IT vendor information, and provide a platform on which IT vendors can launch targeted marketing campaigns that generate measurable, high ROI. As IT professionals have become increasingly specialized, they have come to rely on our sector-specific websites for purchasing decision support. Our content enables IT professionals to navigate the complex and rapidly changing IT landscape where purchasing decisions can have significant financial and operational consequences. Based upon the logical clustering of our users' respective job responsibilities and the marketing focus of the products that our customers are advertising, we currently categorize our content offerings across ten distinct media groups: Application Development; Channel; CIO/IT Strategy; Data Center and Virtualization; Enterprise Applications; Networking; Security; Storage; TechnologyGuide.com; and Vertical Software.
On November 9, 2009, we filed a Form 8-K disclosing that we were delaying the filing of our Quarterly Report on Form 10-Q for the third quarter of 2009. We further disclosed that we had identified an improper accounting practice relating to certain customer credits that were improperly eliminated as liabilities on our balance sheet. As a result, our Audit Committee conducted an investigation into this matter. The Audit Committee has completed its investigation and found no other improper conduct in connection with any other accounting practices. Total professional fees related to the investigation are approximately $1.5 million of which approximately $1.2 million was recorded in 2009, with the remaining amount to be included in 2010. We have concluded that there were certain errors in our previously reported financial statements.
To correct the customer credit errors, we recorded a net adjustment which increased accounts payable by $967,000 and decreased income before provision for income taxes by $967,000 in 2009. The aggregate net adjustment accumulated over several years and includes $57,000 from 2004 to 2006, $362,000 from 2007, $561,000 from 2008 and ($13,000) from 2009.
In addition to the customer credit matter mentioned above, we disclosed in our Quarterly Report on Form 10-Q for the first quarter of 2009 that we corrected in the first quarter of 2009 an error in the amount of $284,000 related to interest income which should have been recorded in the fourth quarter of 2008. Whereas the error was previously corrected in Q1 2009, the $284,000 adjustment is not included in the adjustments described above.
We assessed the materiality of these errors, both quantitatively and qualitatively, and concluded that the adjustments are not material to the prior annual financial statements or to the interim financial statements for 2009 (see Note 16 of "Notes to Consolidated Financial Statements").
41
During December 2008, in response to the then-current and anticipated future economic uncertainties, we implemented an expense reduction program that included a reduction in workforce, a reduction in a certain office lease, the elimination of our two print publications, and a continuation of strict controls on discretionary spending. During the twenty-four month period immediately preceding the announced workforce reduction, we had hired approximately 150 employees to support existing and anticipated growth. The reduction in workforce resulted in a decrease of our employees by approximately 76 full-time positions, representing approximately 12% of our total workforce. As a result of the expense reduction program, we incurred a pre-tax charge of $1.5 million in the fourth quarter of 2008.
Sources of Revenues
We sell advertising programs to IT vendors targeting a specific audience within a particular IT sector or sub-sector. We maintain multiple points of contact with our customers to provide support throughout their organizations and the sales cycle. As a result, our customers often run multiple advertising programs with us in order to reach discrete portions of our targeted audience. There are multiple factors that can impact our customers' advertising objectives and spending with us, including but not limited to, product launches, increases or decreases to their advertising budgets, the timing of key industry marketing events, responses to competitor activities and efforts to address specific marketing objectives such as creating brand awareness or generating sales leads. Our services are generally delivered under short-term contracts that run for the length of a given advertising program, typically less than 6 months in length.
We generate substantially all of our revenues from the sale of targeted advertising campaigns that we deliver via our network of websites, events and print publications.
Online. The majority of our revenue is derived from the delivery of our online offerings from our media groups. Online revenue represented 84%, 74%, and 67% of total revenues for the years ended December 31, 2009, 2008, and 2007, respectively. We expect the majority of our revenues to be derived through the delivery of online offerings for the foreseeable future. As a result of our customers' advertising objectives and preferences, the specific allocation of online advertising offerings sold and delivered by us, on a period by period basis, can fluctuate.
Through our websites we sell a variety of online media offerings to connect IT vendors to IT professionals. Our lead generation offerings allow IT vendors to capture qualified sales leads from the distribution and promotion of content to our audience of IT professionals. Our branding offerings provide IT vendors exposure to targeted audiences of IT professionals actively researching information related to their products and services.
Our branding offerings include banners and e-newsletters. Banner advertising can be purchased on specific websites within our network. We also offer the ability to advertise in e-newsletters focused on key site sub-topics across our portfolio of websites. These offerings give IT vendors the ability to increase their brand awareness to highly specialized IT sectors.
Our lead generation offerings include the following:
- •
- White Papers. White papers are technical documents created by IT vendors to describe business or technical problems that are addressed by the vendors' products or services. IT vendors pay us to have their white papers distributed to our users and receive targeted promotions on our relevant websites. Prior to viewing white papers, our registered members and visitors supply their corporate contact and qualification information and agree to receive further information from the vendor. The corporate contact and other qualification information for these leads are supplied to the vendor in real time through our proprietary lead management software.
42
- •
- Webcasts, Podcasts and Videocasts. IT vendors pay us to
sponsor and host webcasts, podcasts and videocasts that bring informational sessions directly to attendees' desktops and, in the case of podcasts, directly to their mobile devices. As is the case with
white papers, our users supply their corporate contact and qualification information to the webcast, podcast or videocast sponsor when they view or download the content. Sponsorship includes access to
the registrant information and visibility before, during and after the event.
- •
- Software Package Comparisons. Through our 2020software.com
website, IT vendors pay us to post information and specifications about their software packages, typically organized by application category. Users can request further information, which may include
downloadable trial software from multiple software providers in sectors such as customer relationship management, or CRM, accounting, and business analytics. IT vendors, in turn, receive qualified
leads based upon the users who request their information.
- •
- Promotional E-mails. IT vendors pay us to
further target the promotion of their white papers, webcasts, videocasts, podcasts or downloadable trial software by including their content in our periodic e-mail updates to registered
users of our websites. Users who have voluntarily registered on our websites receive an e-mail update from us when vendor content directly related to their interests is listed on our
sites.
- •
- List Rentals. We also offer IT vendors the ability to
message relevant registered members on topics related to their interests. IT vendors can rent our e-mail and postal lists of registered members using specific criteria such as company
size, geography or job title.
- •
- Contextual Advertising. Our contextual advertising
programs associate IT vendor white papers, webcasts, podcasts or other content on a particular topic with our related sector-specific content. IT vendors have the option to purchase exclusive
sponsorship of content related to their product or category.
- •
- Third Party Revenue Sharing Arrangements. We have arrangements with certain third parties, including for the licensing of our online content, for the renting of our database of opted-in email subscribers and for which advertising from customers of certain third parties is made available to our website visitors. In each of these arrangements we are paid a share of the resulting revenue.
Events. Events revenue represented 16%, 22%, and 26% of total revenues for the years ended December 31, 2009, 2008, and 2007, respectively. Most of our media groups operate revenue generating events. The majority of our events are free to IT professionals and are sponsored by IT vendors. Attendees are pre-screened based on event-specific criteria such as sector-specific budget size, company size, or job title. We offer three types of events: multi-day conferences, single-day seminars and custom events. Multi-day conferences provide independent expert content for our attendees and allow vendors to purchase exhibit space and other sponsorship offerings that enable interaction with the attendees. We also hold single-day seminars on various topics in major cities. These seminars provide independent content on key sub-topics in the sectors we serve, are free to qualified attendees, and offer multiple vendors the ability to interact with specific, targeted audiences actively focused on buying decisions. Our custom events differ from our conferences and seminars in that they are exclusively sponsored by a single IT vendor, and the content is driven primarily by the sole sponsor.
Print. Print revenue represented 0%, 4%, and 7% of total revenues for the years ended December 31, 2009, 2008, and 2007, respectively. During certain portions of fiscal years 2008 and 2007 we published monthly three controlled-circulation magazines that were free to subscribers and generated revenue solely based on advertising fees. We began publishing Storage magazine in 2002, Information Security magazine in 2003; and CIO Decisions magazine in 2005. We discontinued
43
publishing CIO Decisions magazine in November 2007 and both Storage and Information Security magazines in December 2008.
Cost of Revenues, Operating Expenses and Other
Expenses consist of cost of revenues, selling and marketing, product development, general and administrative, depreciation, amortization and restructuring charges. Personnel-related costs are a significant component of most of these expense categories.
Cost of Online Revenue. Cost of online revenue consists primarily of: salaries and related personnel costs; member acquisition expenses (primarily keyword purchases from leading Internet search sites); freelance writer expenses; website hosting costs; vendor expenses associated with the delivery of webcast, podcast, videocast and list rental offerings; and stock-based compensation expense.
Cost of Events Revenue. Cost of events revenue consists primarily of: facility expenses, including food and beverages for the event attendees; salaries and related personnel costs; event speaker expenses; and stock-based compensation expense.
Cost of Print Revenue. Cost of print revenue consists primarily of: printing and graphics expenses; mailing costs; salaries and related personnel costs; freelance writer expenses; subscriber acquisition expenses (primarily telemarketing); and stock-based compensation expense.
Selling and Marketing. Selling and marketing expense consists primarily of: salaries and related personnel costs; sales commissions; travel, lodging and other out-of-pocket expenses; and stock-based compensation expense. Sales commissions are recorded as expense when earned by the employee.
Product Development. Product development includes the creation and maintenance of our network of websites, advertiser offerings and technical infrastructure. Product development expense consists primarily of salaries and related personnel and vendor costs; and stock-based compensation expense.
General and Administrative. General and administrative expense consists primarily of: salaries and related personnel costs; facilities expenses; accounting, legal and other professional fees; and stock-based compensation expense. General and administrative expense may continue to increase as a percentage of total revenue for the foreseeable future as we invest in infrastructure to support continued growth and incur additional expenses related to being a publicly traded company, including increased audit and legal fees, costs of compliance with securities and other regulations, investor relations expense, and higher insurance premiums.
Depreciation. Depreciation expense consists of the depreciation of our property and equipment. Depreciation of property and equipment is calculated using the straight-line method over their estimated useful lives ranging from three to five years.
Amortization of Intangible Assets. Amortization of intangible assets expense consists of the amortization of intangible assets recorded in connection with our acquisitions. Separable intangible assets that are not deemed to have an indefinite life are amortized over their useful lives using the straight-line method over periods ranging from one to nine years.
Restructuring charges. Restructuring charges consists of employee severance and associated termination costs, costs associated with the reduction in certain office leases, contract termination costs in connection with the elimination of our two print publications as well as accelerated rental charges and leasehold improvement write-offs associated with the exit of facilities.
Interest Income (Expense), Net. Interest income (expense) net consists primarily of interest income earned on cash, cash equivalent and investment balances less interest expense incurred on bank term
44
loan balances. We historically have invested our cash in money market accounts, commercial paper corporate debt securities, municipal bonds and auction rate securities.
Application of Critical Accounting Policies and Use of Estimates
The discussion of our financial condition and results of operations is based upon our consolidated financial statements, which have been prepared in accordance with accounting principles generally accepted in the United States. The preparation of these financial statements requires us to make estimates, judgments and assumptions that affect the reported amount of assets, liabilities, revenues and expenses and related disclosure of contingent assets and liabilities. On an ongoing basis, we evaluate our estimates, including those related to revenue, long-lived assets, the allowance for doubtful accounts, stock-based compensation, and income taxes. We based our estimates of the carrying value of certain assets and liabilities on historical experience and on various other assumptions that we believe to be reasonable. In many cases, we could reasonably have used different accounting policies and estimates. In some cases, changes in the accounting estimates are reasonably likely to occur from period to period. Our actual results may differ from these estimates under different assumptions or conditions.
We believe the following critical accounting policies affect our more significant judgments used in the preparation of our consolidated financial statements. See the notes to our financial statements for information about these critical accounting policies as well as a description of our other accounting policies.
Revenue Recognition
We generate substantially all of our revenue from the sale of targeted advertising campaigns that we deliver via our network of websites, events and, prior to 2009, print publications. In all cases, we recognize revenue only when the price is fixed or determinable, persuasive evidence of an arrangement exists, the service is performed and collectability of the resulting receivable is reasonably assured.
Although each of our online media offerings can be sold separately, most of our online media sales involve multiple online offerings. Because objective evidence of fair value does not exist for all elements in our bundled advertising campaigns, no allocation can be made, and we recognize revenue on all services over the term of the arrangement.
Events. We sell our events separately from our other service offerings, and recognize event revenue in the period the event occurs. Amounts collected or billed prior to satisfying the above revenue recognition criteria are recorded as deferred revenue.
Print. When sold separately print advertising revenue was recognized at the time the applicable magazine was distributed. When print advertising campaigns were sold with online media offerings, we recognized revenue for all services in the advertising campaign over the term of the arrangement. Amounts collected or billed prior to satisfying the above revenue recognition criteria were recorded as deferred revenue.
Online. We recognize revenue from our specific online media offerings as follows when these items are sold separately:
- •
- White Papers. We recognize white paper revenue ratably
over the period in which the white paper is available on our websites.
- •
- Webcasts, Podcasts and Videocasts. We recognize webcast, podcast and videocast revenue ratably over the period in which the webcast, podcast or videocast is available on our websites.
45
- •
- Software Package Comparisons. We recognize software
package comparison revenue ratably over the period in which the software information is available on our websites.
- •
- Promotional E-mails and
E-newsletters. We recognize promotional e-mail revenue ratably over the period in which the related content
asset is available on our websites because promotional emails do not have standalone value from the related content asset. We recognize e-newsletter revenue in the period in which the
e-newsletter is sent.
- •
- List Rentals. We recognize list rental revenue in the
period in which the e-mail is sent to the list of registered members.
- •
- Banners. We recognize banner revenue in the period in
which the banner impressions occur.
- •
- Third Party Revenue Sharing Arrangements. Revenue from third party revenue sharing arrangements is recognized in the period in which the services are performed.
We offer customers the ability to purchase integrated ROI program offerings, which can include any of our online media offerings packaged together to address the particular customer's specific advertising requirements. As part of these offerings, we will guarantee a minimum number of qualified sales leads to be delivered over the course of the advertising campaign. We sometimes extend the scheduled end date of advertising campaigns to satisfy lead guarantees or to fulfill all elements of the campaign based on delayed receipt of advertising media collateral from the customer. We estimate the revenue reserve necessary to properly defer revenue recognition for extended advertising campaigns. These estimates are based on the Company's experience in managing and fulfilling these integrated ROI program offerings. Shortfalls in fulfilling lead guarantees before the scheduled completion date of an advertising campaign are satisfied within an average of 42 days of such scheduled completion date. These integrated ROI program offerings represented approximately 49%, 41% and 33% of our online revenues, and 41%, 31% and 22% of our total revenues for the years ended December 31, 2009, 2008, and 2007, respectively.
Amounts collected or billed prior to satisfying the above revenue recognition criteria are recorded as deferred revenue.
Long-Lived Assets
Our long-lived assets consist of property and equipment, goodwill and other intangible assets. Goodwill and other intangible assets have arisen principally from our acquisitions. The amount assigned to intangible assets is subjective and based on our estimates of the future benefit of the intangible assets using accepted valuation techniques, such as discounted cash flow and replacement cost models. Our long-lived assets, other than goodwill, are amortized over their estimated useful lives, which we determined based on the consideration of several factors including the period of time the asset is expected to remain in service. Intangible assets are amortized over their estimated useful lives, which range from one to nine years, using methods of amortization that are expected to reflect the estimated pattern of economic use. We evaluate the carrying value and remaining useful lives of long-lived assets, other than goodwill, whenever indicators of impairment are present. We evaluate the carrying value of goodwill annually, and whenever indicators of impairment are present. We use a discounted cash flow approach to determine the fair value of goodwill.
Fair Value of Financial Instruments
Financial instruments consist of cash and cash equivalents, short and long-term investments, accounts receivable, accounts payable, a term loan payable and an interest rate swap. The carrying value of these instruments approximates their fair values. The term loan was paid and interest rate swap terminated in December 2009.
46
Allowance for Doubtful Accounts
We offset gross trade accounts receivable with an allowance for doubtful accounts. The allowance for doubtful accounts is our best estimate of the amount of probable credit losses in our existing accounts receivable. We review our allowance for doubtful accounts on a regular basis, and all past due balances are reviewed individually for collectability. Account balances are charged against the allowance after all means of collection have been exhausted and the potential for recovery is considered remote. Provisions for allowance for doubtful accounts are recorded in general and administrative expense. If our historical collection experience does not reflect our future ability to collect outstanding accounts receivables, our future provision for doubtful accounts could be materially affected. To date, we have not incurred any write-offs of accounts receivable significantly different than the amounts reserved. The allowance for doubtful accounts was $0.5 million and $0.6 million at December 31, 2009 and 2008, respectively.
Stock-Based Compensation
We measure stock-based compensation at the grant date based on the fair value of the award and recognize stock-based compensation in the statement of operations using the straight line method over the vesting period of the award or using the accelerated method if the award is contingent upon performance goals. We use the Black-Scholes option pricing model to determine the fair value of stock-based awards. We calculated the fair values of the options granted using the following assumptions:
| |
Years Ended December 31, | |||||
|---|---|---|---|---|---|---|
| |
2009 | 2008 | 2007 | |||
Expected volatility |
75%–79% | 41%–71% | 47%–50% | |||
Expected term |
6.25 years | 6.25 years | 6.25 years | |||
Risk-free interest rate |
2.21%–2.89% | 1.71%–3.15% | 3.62%–5.04% | |||
Expected dividend yield |
—% | —% | —% | |||
Weighted-average grant date fair value per share |
$4.06 | $3.28 | $7.35 | |||
As there was no public market for our common stock prior to our initial public offering in May 2007, and there has been limited historical information on the volatility of our common stock since the date of our initial public offering, we determined the volatility for options granted in 2009, 2008 and 2007 based on an analysis of reported data for a peer group of companies that issued options with substantially similar terms. The expected volatility of options granted has been determined using an average of the historical volatility measures of this peer group of companies for a period equal to the expected life of the option. The expected life of options has been determined utilizing the "simplified" method. The risk-free interest rate is based on a zero coupon United States treasury instrument whose term is consistent with the expected life of the stock options. We have not paid and do not anticipate paying cash dividends on our shares of common stock; therefore, the expected dividend yield is assumed to be zero. We applied an annual forfeiture rate based on our historical forfeiture experience of 2.00%, 2.00% and 1.00% in determining the expense recorded in 2009, 2008 and 2007, respectively.
Internal Use Software and Website Development Costs
We capitalize costs of materials, consultants and compensation and related expenses of employees who devote time to the development of internal-use software and website applications and infrastructure involving developing software to operate our websites. However, we expense as incurred website development costs for new features and functionalities since it is not probable that they will result in additional functionality until they are both developed and tested with confirmation that they are more effective than the current set of features and functionalities on our websites. Our judgment is
47
required in determining the point at which various projects enter the states at which costs may be capitalized, in assessing the ongoing value of the capitalized costs and in determining the estimated useful lives over which the costs are amortized, which is generally three years. To the extent that we change the manner in which we develop and test new features and functionalities related to our websites, assess the ongoing value of capitalized assets or determine the estimated useful lives over which the costs are amortized, the amount of website development costs we capitalize and amortize in future periods would be impacted. We review capitalized internal use software and website development costs for recoverability whenever events or changes in circumstances indicate that the carrying amount of the asset may not be recoverable. We would recognize an impairment loss only if the carrying amount of the asset is not recoverable and exceeds its fair value. We capitalized internal-use software and website development costs of $1.5 million, $0.5 million and $1.0 million for the years ended December 31, 2009, 2008 and 2007, respectively.
Income Taxes
We are subject to income taxes in both the United States and foreign jurisdictions, and we use estimates in determining our provision for income taxes. We recognize deferred tax assets and liabilities based on temporary differences between the financial reporting and income tax bases of assets and liabilities using statutory rates.
Our deferred tax assets are comprised primarily of net operating loss, or (NOL), carryforwards. As of December 31, 2009, we had U.S. federal and state NOL carryforwards of approximately $7.0 million and $17.3 million, respectively, which may be used to offset future taxable income. The NOL carryforwards expire through 2027, and are subject to review and possible adjustment by the Internal Revenue Service. The Internal Revenue Code contains provisions that limit the NOL and tax credit carryforwards available to be used in any given year in the event of certain changes in the ownership interests of significant stockholders. The federal NOL carryforwards of $7.0 million available at December 31, 2009 were acquired from KnowledgeStorm and are subject to limitations on their use in future years.
Net Income (Loss) Per Share
We calculate basic earnings per share ("EPS") by dividing earnings available to common shareholders for the period by the weighted average number of common shares and vested restricted stock awards outstanding. Because the holders of unvested restricted stock awards do not have nonforfeitable rights to dividends or dividend equivalents, we do not consider these awards to be participating securities that should be included in our computation of earnings per share under the two-class method. Diluted EPS is computed using the weighted-average number of common shares and vested restricted stock awards outstanding during the period, plus the dilutive effect of potential future issuances of common stock relating to stock option programs and other potentially dilutive securities using the treasury stock method. In calculating diluted EPS, the dilutive effect of stock options is computed using the average market price for the respective period. In addition, the assumed proceeds under the treasury stock method include the average unrecognized compensation expense and assumed tax benefit of stock options that are in-the-money. This results in the "assumed" buyback of additional shares, thereby reducing the dilutive impact of stock options.
48
Results of Operations
The following table sets forth our results of operations for the periods indicated:
| |
Years Ended December 31, | |||||||||||||||||||
|---|---|---|---|---|---|---|---|---|---|---|---|---|---|---|---|---|---|---|---|---|
| |
2009 | 2008 | 2007 | |||||||||||||||||
| |
($ in thousands) |
|||||||||||||||||||
Revenues: |
||||||||||||||||||||
Online |
$ | 72,345 | 84 | % | $ | 77,373 | 74 | % | $ | 61,353 | 67 | % | ||||||||
Events |
14,152 | 16 | 22,786 | 22 | 24,254 | 26 | ||||||||||||||
| — | — | 4,385 | 4 | 6,643 | 7 | |||||||||||||||
Total revenues |
86,497 | 100 | 104,544 | 100 | 92,250 | 100 | ||||||||||||||
Cost of revenues: |
||||||||||||||||||||
Online |
19,378 | 23 | 21,404 | 21 | 15,575 | 17 | ||||||||||||||
Events |
5,600 | 6 | 9,531 | 9 | 8,611 | 9 | ||||||||||||||
| — | — | 2,156 | 2 | 3,788 | 4 | |||||||||||||||
Total cost of revenues |
24,978 | 29 | 33,091 | 32 | 27,974 | 30 | ||||||||||||||
Gross profit |
61,519 |
71 |
71,453 |
68 |
64,276 |
70 |
||||||||||||||
Operating expenses: |
||||||||||||||||||||
Selling and marketing |
32,002 | 37 | 33,481 | 32 | 28,048 | 30 | ||||||||||||||
Product development |
8,664 | 10 | 10,995 | 11 | 7,320 | 8 | ||||||||||||||
General and administrative |
19,527 | 23 | 14,663 | 14 | 12,592 | 14 | ||||||||||||||
Depreciation |
2,219 | 3 | 2,406 | 2 | 1,610 | 2 | ||||||||||||||
Amortization of intangible assets |
4,714 | 5 | 5,306 | 5 | 4,740 | 5 | ||||||||||||||
Restructuring charge |
— | — | 1,494 | 1 | — | — | ||||||||||||||
Total operating expenses |
67,126 | 78 | 68,345 | 65 | 54,310 | 59 | ||||||||||||||
Operating (loss) income |
(5,607 |
) |
(7 |
) |
3,108 |
3 |
9,966 |
11 |
||||||||||||
Interest income, net |
267 | — | 1,440 | 1 | 1,831 | 2 | ||||||||||||||
(Loss) income before (benefit from) provision for income taxes |
(5,340 | ) | (7 | ) | 4,548 | 4 | 11,797 | 13 | ||||||||||||
(Benefit from) provision for income taxes |
(224 | ) | — | 2,784 | 2 | 5,252 | 6 | |||||||||||||
Net (loss) income |
$ | (5,116 | ) | (7 | )% | $ | 1,764 | 2 | % | $ | 6,545 | 7 | % | |||||||
Comparison of Fiscal Years Ended December 31, 2009 and 2008
Revenues
| |
Years Ended December 31, | |||||||||||||
|---|---|---|---|---|---|---|---|---|---|---|---|---|---|---|
| |
2009 | 2008 | Increase (Decrease) |
Percent Change |
||||||||||
| |
($ in thousands) |
|||||||||||||
Revenues: |
||||||||||||||
Online |
$ | 72,345 | $ | 77,373 | $ | (5,028 | ) | (6 | )% | |||||
Events |
14,152 | 22,786 | (8,634 | ) | (38 | ) | ||||||||
| — | 4,385 | (4,385 | ) | (100 | ) | |||||||||
Total revenues |
$ | 86,497 | $ | 104,544 | $ | (18,047 | ) | (17 | )% | |||||
49
Online. The decrease in online revenue was primarily attributable to a $7.5 million decrease in revenue from lead generation offerings, due principally to a decrease in white paper, webcast and contextual advertising sales volumes. Additionally, revenue from third party revenue sharing arrangements decreased by approximately $1.8 million in 2009 as compared to 2008. These decreases were partially offset by a $4.2 million increase in branding revenue, primarily due to increased banner sales volume.
Events. The decrease was attributable in part to a $4.6 million decrease in seminar series and custom event revenue due to a decrease in number of seminar series and custom events produced in 2009 as compared to 2008. The decrease was also attributable to a $3.9 million decrease in revenue from multi-day conferences due to a decrease in the number of conferences produced in 2009 as compared to 2008.
Print. We did not recognize any print revenue in 2009 because we discontinued publishing both of our print publications, Storage and Information Security magazines, in December 2008.
Cost of Revenues and Gross Profit
| |
Years Ended December 31, | |||||||||||||
|---|---|---|---|---|---|---|---|---|---|---|---|---|---|---|
| |
2009 | 2008 | Increase (Decrease) |
Percent Change |
||||||||||
| |
($ in thousands) |
|||||||||||||
Cost of revenues: |
||||||||||||||
Online |
$ | 19,378 | $ | 21,404 | $ | (2,026 | ) | (9 | )% | |||||
Events |
5,600 | 9,531 | (3,931 | ) | (41 | ) | ||||||||
| — | 2,156 | (2,156 | ) | (100 | ) | |||||||||
Total cost of revenues |
$ | 24,978 | $ | 33,091 | $ | (8,113 | ) | (25 | ) | |||||
Gross profit |
$ | 61,519 | $ | 71,453 | $ | (9,934 | ) | (14 | )% | |||||
Gross profit percentage |
71 | % | 68 | % | ||||||||||
Cost of Online Revenue. The decrease in cost of online revenue was attributable in part to a $2.2 million decrease in member acquisition expenses, primarily related to keyword purchases. The decrease also reflects a $0.6 million decrease in production and hosting costs for online products due to the decreased sales volume of online services in 2009 as compared to 2008, as well as a decrease in consulting costs of $0.3 million. The decrease was partially offset by a $1.1 million increase in salaries and benefits.
Cost of Events Revenue. The decrease in cost of events revenue was attributable in part to a $1.6 million decrease in seminar series and custom event costs due to a decrease in events produced in 2009 compared to 2008. The decrease was also attributable to a $0.8 million decrease in multi-day conference costs due to a decrease in conferences produced in 2009 compared to 2008. The decrease also reflects a $1.2 million decrease in salaries and benefits due to a decrease in headcount in our events organization resulting from the expense reduction program implemented in December 2008, as well as a decrease of $0.3 million in travel and temporary help costs.
Cost of Print Revenue. We did not recognize any cost of print revenue in 2009 because we discontinued publishing both Storage and Information Security magazines in December 2008.
50
Gross Profit. Our gross profit is equal to the difference between our revenues and our cost of revenues for the period. The decrease in gross profit is attributable to a $3.1 million decrease in online gross profit, a $4.7 million decrease in events gross profit, and a $2.2 million decrease in print gross profit. Gross margin for 2009 was 71% as compared to 68% for 2008, primarily due to an increase in our online and events gross margins and having discontinued publishing both Storage and Information Security magazines in December 2008. Because the majority of our costs are labor-related and therefore fixed in nature, we expect our gross profit to fluctuate from period to period depending on the total revenues for the period as well as the relative contribution of online and events revenue to our total revenues.
Operating Expenses and Other
| |
For the Years Ended December 31, | |||||||||||||
|---|---|---|---|---|---|---|---|---|---|---|---|---|---|---|
| |
2009 | 2008 | Increase (Decrease) |
Percent Change |
||||||||||
| |
($ in thousands) |
|||||||||||||
Operating expenses: |
||||||||||||||
Selling and marketing |
$ | 32,002 | $ | 33,481 | $ | (1,479 | ) | (4 | )% | |||||
Product development |
8,664 | 10,995 | (2,331 | ) | (21 | ) | ||||||||
General and administrative |
19,527 | 14,663 | 4,864 | 33 | ||||||||||
Depreciation |
2,219 | 2,406 | (187 | ) | (8 | ) | ||||||||
Amortization of intangible assets |
4,714 | 5,306 | (592 | ) | (11 | ) | ||||||||
Restructuring charge |
— | 1,494 | (1,494 | ) | * | |||||||||
Total operating expenses |
$ | 67,126 | $ | 68,345 | $ | (1,219 | ) | (2 | ) | |||||
Interest income, net |
$ | 267 | $ | 1,440 | $ | (1,173 | ) | (81 | ) | |||||
(Benefit from) provision for income taxes |
$ | (224 | ) | $ | 2,784 | $ | (3,008 | ) | (108 | )% | ||||
- *
- Percentage is not meaningful
Selling and Marketing. The decrease in selling and marketing expense was attributable in part to a $1.7 million decrease in salaries, commissions, bonuses and benefits due to a decrease in headcount in our sales and marketing organizations resulting from the expense reduction program implemented in December 2008. The decrease also reflects a $0.5 million decrease in travel costs. The decrease is partially offset by an increase of $0.5 million in stock-based compensation and additional expense of $0.4 million to increase accounts payable related to customer credit errors.
Product Development. The decrease in product development expense was attributable to a $2.3 million decrease in salaries and benefits due to a decrease in headcount in our product development organization resulting from the expense reduction program implemented in December 2008.
General and Administrative. The increase in general and administrative expense was attributable in part to a $3.3 million increase in stock-based compensation due to expenses related to performance-based restricted stock awards issued in fiscal year 2009. The increase also reflects a $1.4 increase in professional fees primarily as a result of the investigation costs incurred in the fourth quarter of 2009 and a $0.6 million increase in other employee compensation. These increases were partially offset by a $0.3 million decrease in various contracted services and a $0.2 million decrease in bad debt expense.
Depreciation and Amortization of Intangible Assets. The decrease in depreciation expense was primarily attributable to certain assets acquired from KnowledgeStorm in November 2007 being fully depreciated during 2009. The decrease in amortization of intangible assets expense was primarily
51
attributable to certain intangible assets related to our acquisitions of TechnologyGuide.com in May 2007 and KnowledgeStorm in November 2007 becoming fully amortized during 2009.
Restructuring Charges. The decrease in restructuring charges was due to a $1.5 million charge in 2008 related to our expense reduction program. The restructuring charge included $0.9 million related to employee severance expense and $0.6 million related to non-cancelable lease and contract termination charges and the related write-off of fixed assets.
Interest Income, Net. The decrease in interest income, net reflects an adjustment to interest income of ($0.3 million) in 2009 related to interest income recognized in error in the fourth quarter of 2008, as well as lower interest rates during 2009 compared to 2008. The decreases were partially offset by a decrease in interest expense on our outstanding debt balance over that same period.
(Benefit From) Provision for Income Taxes. Our effective tax rate was (4%) and 61% for the years ended December 31, 2009 and 2008, respectively. The decrease in the effective tax rate was primarily due to a pretax loss of $5.3 million in 2009 as compared to pretax income of $4.5 million in 2008; partially offset by an increase in nondeductible stock-based compensation and a decrease in interest income exempt from Federal taxation.
Comparison of Fiscal Years Ended December 31, 2008 and 2007
Revenues
| |
Years Ended December 31, | |||||||||||||
|---|---|---|---|---|---|---|---|---|---|---|---|---|---|---|
| |
2008 | 2007 | Increase (Decrease) |
Percent Change |
||||||||||
| |
($ in thousands) |
|||||||||||||
Revenues: |
||||||||||||||
Online |
$ | 77,373 | $ | 61,353 | $ | 16,020 | 26 | % | ||||||
Events |
22,786 | 24,254 | (1,468 | ) | (6 | ) | ||||||||
| 4,385 | 6,643 | (2,258 | ) | (34 | ) | |||||||||
Total revenues |
$ | 104,544 | $ | 92,250 | $ | 12,294 | 13 | % | ||||||
Online. The increase in online revenue was attributable to a $10.9 million increase in revenue from lead generation offerings due primarily to an increase in webcast and white paper sales volumes. White paper sales volume increased in part due to our acquisition of KnowledgeStorm, in November 2007. The increase also reflects a $4.6 million increase in branding revenue, primarily due to increased banner sales volume. Additionally, revenue from third party revenue sharing arrangements increased by approximately $0.5 million in 2008 as compared to 2007.
Events. The decrease in events revenue was primarily attributable to a $1.7 million decrease in multi-day conference revenue due to fewer multi-day conferences held in 2008 as compared to 2007. The decrease was partially offset by a $0.3 million increase in seminar series and custom events revenue due to an increase in the number of seminar series and custom events produced in 2008 as compared to 2007.
Print. The decrease in print revenue was attributable to the continued shift of our customer's advertising budgets away from print and towards online offerings. Additionally, we discontinued publishing CIO Decisions magazine in November 2007 and both Storage and Information Security magazines in December 2008.
52
Cost of Revenues and Gross Profit
| |
Years Ended December 31, | |||||||||||||
|---|---|---|---|---|---|---|---|---|---|---|---|---|---|---|
| |
2008 | 2007 | Increase | Percent Change |
||||||||||
| |
($ in thousands) |
|||||||||||||
Cost of revenues: |
||||||||||||||
Online |
$ | 21,404 | $ | 15,575 | $ | 5,829 | 37 | % | ||||||
Events |
9,531 | 8,611 | 920 | 11 | ||||||||||
| 2,156 | 3,788 | (1,632 | ) | (43 | ) | |||||||||
Total cost of revenues |
$ | 33,091 | $ | 27,974 | $ | 5,117 | 18 | |||||||
Gross profit |
$ | 71,453 | $ | 64,276 | $ | 7,177 | 11 | % | ||||||
Gross profit percentage |
68 | % | 70 | % | ||||||||||
Cost of Online Revenue. Approximately $2.4 million of the increase in cost of online revenue is attributable to employee salaries, benefits and other compensation. This increase is primarily due to an increase in headcount in our online editorial and operations organizations, as well as increases to employee compensation. In addition, freelancer expenses increased $0.4 million in 2008 as compared to 2007. We increased headcount and freelancer expenditures to support the increase in online sales volume and to provide additional editorial content. The increase in cost of online revenue was also attributable in part to a $1.5 million increase in member acquisition expenses, primarily related to keyword purchases. The increase in cost of online revenue also reflects $1.1 million of additional third party production and hosting costs for online services due to the increased sales volume in 2008 as compared to 2007. The increase in cost of online revenue also reflects a $0.2 million increase in stock-based compensation.
Cost of Events Revenue. The increase in cost of events revenue was attributable in part to a $0.6 million increase in salaries, bonuses and benefits related to an increase in headcount in our events organization, as well as increases to employee compensation. The increase in headcount was to support anticipated growth in events revenue which did not occur. The increase also reflects a $0.4 million increase in seminar series and custom event costs due to an increase in the number of seminar series and custom events produced in 2008 as compared to 2007. The increase was partially offset by a $0.1 million decrease in multi-day conference costs due to fewer multi-day conferences held in 2008 as compared to 2007.
Cost of Print Revenue. The decrease in cost of print revenue was attributable to our efforts to reduce production costs for our publications in response to our customers' advertising budgets continuing to shift away from print and towards online offerings. Additionally, we discontinued publishing CIO Decisions magazine in November 2007 and both Storage and Information Security magazines in December 2008.
Gross Profit. Our gross profit is equal to the difference between our revenues and our cost of revenues for the period. The increase in gross profit is primarily attributable to a $10.2 million increase in online gross profit, offset by a decrease of $2.4 million in events gross profit and a decrease of $0.6 million in print gross profit. Gross margin for 2008 was 68%, as compared to 70% for 2007. Since the majority of our costs are labor-related and therefore are fixed in nature, we expect our gross profit to fluctuate from period to period depending on the total revenues for the period as well as the relative contribution of online and events revenue to our total revenues.
53
Operating Expenses and Other
| |
For the Years Ended December 31, | |||||||||||||
|---|---|---|---|---|---|---|---|---|---|---|---|---|---|---|
| |
2008 | 2007 | Increase (Decrease) |
Percent Change |
||||||||||
| |
($ in thousands) |
|||||||||||||
Operating expenses: |
||||||||||||||
Selling and marketing |
$ | 33,481 | $ | 28,048 | $ | 5,433 | 19 | % | ||||||
Product development |
10,995 | 7,320 | 3,675 | 50 | ||||||||||
General and administrative |
14,663 | 12,592 | 2,071 | 16 | ||||||||||
Depreciation |
2,406 | 1,610 | 796 | 49 | ||||||||||
Amortization of intangible assets |
5,306 | 4,740 | 566 | 12 | ||||||||||
Restructuring charge |
1,494 | — | 1,494 | * | ||||||||||
Total operating expenses |
$ | 68,345 | $ | 54,310 | $ | 14,035 | 26 | |||||||
Interest income, net |
$ | 1,440 | $ | 1,831 | $ | (391 | ) | (21 | ) | |||||
Provision for income taxes |
$ | 2,784 | $ | 5,252 | $ | (2,468 | ) | (47 | )% | |||||
- *
- Percentage is not meaningful
Selling and Marketing. The increase in selling and marketing expense was attributable in part to a $2.9 million increase in salaries, commissions, bonuses and benefits resulting principally from an increase in headcount in our sales and marketing organizations, as well as increases to employee compensation. The increase in headcount is a result of actual growth in revenues as well as anticipated growth which did not occur. The increase in selling and marketing expense also reflects a $1.8 million increase in stock-based compensation and a $543,000 increase in travel related costs.
Product Development. The increase in product development expense was attributable to a $3.1 million increase in salaries and benefits resulting principally from an increase in headcount in our product development organization, as well as increases to employee compensation. The increase in headcount was primarily a result of additional product development employees acquired in the acquisition of KnowledgeStorm in November 2007. The increase in product development expense also reflects a $343,000 increase in hardware and software maintenance expenses.
General and Administrative. The increase in general and administrative expense was attributable to a $1.4 million increase in facilities expense due to leasing additional office space in our Needham, MA headquarters beginning in July 2007, as well as office space acquired with KnowledgeStorm in November 2007. The increase in general and administrative expense was also attributable to a $637,000 increase in stock-based compensation, offset by a decrease of $1.5 million in other employee compensation. The increase is also due in part to an increase of $785,000 in expense related to audit, legal, insurance and other expenses attributable primarily to our being a publicly traded company for a full year, as well as an increase of $365,000 in bad debt expense.
Depreciation and Amortization of Intangible Assets. The increase in depreciation expense was primarily attributable to depreciation of assets acquired from KnowledgeStorm in November 2007. The increase in amortization of intangible assets expense was primarily attributable to amortization of intangible assets related to our acquisitions of TechnologyGuide.com in April 2007 and KnowledgeStorm in November 2007.
Restructuring Charge. The increase in restructuring charges was a result of a charge of $1.5 million in 2008 related to our expense reduction program. The restructuring charge included $0.9 million related to employee severance expense and $0.6 million related to non-cancelable lease and contract termination charges and the related write-off of fixed assets.
54
Interest Income, Net. The decrease in interest income, net reflects a decrease in interest income due to lower average cash and investment balances as well as lower interest rates during 2008 compared to 2007.
Provision for Income Taxes. The provision for income taxes as a percentage of income before taxes, or our annual effective tax rate, was 61% in 2008 and 45% in 2007. The increase in our effective tax rate is due primarily to a decrease in pretax income in 2008 and an increase in nondeductible stock-based compensation.
Selected Quarterly Results of Operations
The following table presents our unaudited quarterly consolidated results of operations and our unaudited quarterly consolidated results of operations as a percentage of revenue for the eight quarters ended December 31, 2009. The unaudited quarterly consolidated information has been prepared on the same basis as our audited consolidated financial statements. You should read the following table presenting our quarterly consolidated results of operations in conjunction with our audited consolidated financial statements and the related notes included elsewhere in this Annual Report. The operating results for any quarter are not necessarily indicative of the operating results for any future period.
| |
For the Three Months Ended | |||||||||||||||||||||||||
|---|---|---|---|---|---|---|---|---|---|---|---|---|---|---|---|---|---|---|---|---|---|---|---|---|---|---|
| |
2009 | 2008 | ||||||||||||||||||||||||
| |
Mar. 31 | Jun. 30 | Sep. 30 | Dec. 31 | Mar. 31 | Jun. 30 | Sep. 30 | Dec. 31 | ||||||||||||||||||
| |
(in thousands, except per share data) |
|||||||||||||||||||||||||
Revenues: |
||||||||||||||||||||||||||
Online |
$ | 16,282 | $ | 17,801 | $ | 18,191 | $ | 20,071 | $ | 18,210 | $ | 19,071 | $ | 20,420 | $ | 19,672 | ||||||||||
Events |
2,190 | 3,936 | 4,865 | 3,161 | 3,985 | 7,262 | 5,496 | 6,043 | ||||||||||||||||||
| — | — | — | — | 1,068 | 1,282 | 1,080 | 955 | |||||||||||||||||||
Total revenues |
18,472 | 21,737 | 23,056 | 23,232 | 23,263 | 27,615 | 26,996 | 26,670 | ||||||||||||||||||
Cost of revenues: |
||||||||||||||||||||||||||
Online |
4,880 | 4,776 | 4,789 | 4,933 | 5,169 | 5,481 | 5,462 | 5,292 | ||||||||||||||||||
Events |
1,081 | 1,455 | 1,741 | 1,323 | 1,827 | 2,923 | 2,328 | 2,453 | ||||||||||||||||||
| — | — | — | — | 546 | 632 | 580 | 398 | |||||||||||||||||||
Total cost of revenues |
5,961 | 6,231 | 6,530 | 6,256 | 7,542 | 9,036 | 8,370 | 8,143 | ||||||||||||||||||
Gross profit |
12,511 | 15,506 | 16,526 | 16,976 | 15,721 | 18,579 | 18,626 | 18,527 | ||||||||||||||||||
Operating expenses: |
||||||||||||||||||||||||||
Selling and marketing |
7,516 | 8,023 | 8,644 | 7,819 | 8,444 | 8,885 | 8,161 | 7,991 | ||||||||||||||||||
Product development |
2,081 | 2,194 | 2,276 | 2,113 | 2,762 | 2,890 | 2,788 | 2,555 | ||||||||||||||||||
General and administrative |
3,919 | 4,064 | 5,486 | 6,058 | 3,795 | 3,459 | 3,662 | 3,747 | ||||||||||||||||||
Depreciation |
536 | 498 | 510 | 675 | 724 | 581 | 579 | 522 | ||||||||||||||||||
Amortization of intangible assets |
1,215 | 1,181 | 1,166 | 1,152 | 1,480 | 1,332 | 1,259 | 1,235 | ||||||||||||||||||
Restructuring charge |
— | — | — | — | — | — | — | 1,494 | ||||||||||||||||||
Total operating expenses |
15,267 | 15,960 | 18,082 | 17,817 | 17,205 | 17,147 | 16,449 | 17,544 | ||||||||||||||||||
Operating (loss) income |
(2,756 | ) | (454 | ) | (1,556 | ) | (841 | ) | (1,484 | ) | 1,432 | 2,177 | 983 | |||||||||||||
Interest (expense) income, net |
(110 | ) | 174 | 130 | 73 | 418 | 268 | 248 | 506 | |||||||||||||||||
(Loss) income before (benefit from) provision for income taxes |
(2,866 | ) | (280 | ) | (1,426 | ) | (768 | ) | (1,066 | ) | 1,700 | 2,425 | 1,489 | |||||||||||||
(Benefit from) provision for income taxes |
(558 | ) | 263 | 12 | 59 | (630 | ) | 648 | 1,718 | 1,048 | ||||||||||||||||
Net (loss) income |
$ | (2,308 | ) | $ | (543 | ) | $ | (1,438 | ) | $ | (827 | ) | $ | (436 | ) | $ | 1,052 | $ | 707 | $ | 441 | |||||
Net (loss) income per share basic |
$ | (0.06 | ) | $ | (0.01 | ) | $ | (0.03 | ) | $ | (0.02 | ) | $ | (0.01 | ) | $ | 0.03 | $ | 0.02 | $ | 0.01 | |||||
Net (loss) income per share diluted |
$ | (0.06 | ) | $ | (0.01 | ) | $ | (0.03 | ) | $ | (0.02 | ) | $ | (0.01 | ) | $ | 0.02 | $ | 0.02 | $ | 0.01 | |||||
55
Seasonality
The timing of our revenues is affected by seasonal factors. Our revenues are seasonal primarily as a result of the annual budget approval process of many of our customers and the historical decrease in advertising activity in July and August. Revenues are usually the lowest in the first quarter of each calendar year, increase during the second quarter, decrease during the third quarter, and increase again during the fourth quarter. Events revenue may vary depending on which quarters we produce the event, which may vary when compared to previous periods. The timing of revenues in relation to our expenses, much of which does not vary directly with revenue, has an impact on the cost of online revenue, selling and marketing, product development, and general and administrative expenses as a percentage of revenue in each calendar quarter during the year.
The majority of our expenses are personnel-related and include salaries, stock-based compensation, benefits and incentive-based compensation plan expenses. As a result, we have not experienced significant seasonal fluctuations in the timing of our expenses period to period.
Liquidity and Capital Resources
Resources
Since 2003, we have funded our operations principally with cash flows generated by operations. In May 2007, we completed our initial public offering of 8.9 million shares of our common stock, of which 7.1 million shares were sold by us and 1.8 million shares were sold by stockholders of ours, all at a price to the public of $13.00 per share. We raised a total of $91.9 million in gross proceeds from the offering, or $83.2 million in net proceeds after deducting underwriting discounts and commissions of $6.4 million and other offering costs of approximately $2.3 million. We have used a portion of these proceeds to repay $12.0 million that we had borrowed against our revolving credit facility in conjunction with the acquisition of TechnologyGuide.com in April 2007 and to pay to the selling stockholders of KnowledgeStorm, Inc. approximately $52 million in November 2007 as partial consideration in that acquisition. We believe that our existing cash and cash equivalents, our cash flow from operating activities and available bank borrowings will be sufficient to meet our anticipated cash needs for at least the next twelve months. Our future working capital requirements will depend on many factors, including the operations of our existing business, our potential strategic expansion internationally, future acquisitions we might undertake, and the expansion into complementary businesses. To the extent that our cash and cash equivalents and cash flow from operating activities are insufficient to fund our future activities, we may need to raise additional funds through bank credit arrangements or public or private equity or debt financings. We also may need to raise additional funds in the event we determine in the future to effect one or more additional acquisitions of businesses. In the event additional funding is required, we may not be able to obtain bank credit arrangements or affect an equity or debt financing on terms acceptable to us or at all.
| |
As of December 31, | |||||||||
|---|---|---|---|---|---|---|---|---|---|---|
| |
2009 | 2008 | 2007 | |||||||
| |
(in thousands) |
|||||||||
Cash, cash equivalents and investments |
$ | 82,557 | $ | 69,568 | $ | 62,001 | ||||
Accounts receivable, net |
$ | 15,816 | $ | 17,622 | $ | 15,198 | ||||
Cash, Cash Equivalents and Investments
Our cash, cash equivalents and investments at December 31, 2009 were held for working capital purposes and were invested primarily in money market accounts and municipal bonds. We do not enter into investments for trading or speculative purposes.
56
Accounts Receivable, Net
Our accounts receivable balance fluctuates from period to period, which affects our cash flow from operating activities. The fluctuations vary depending on the timing of our service delivery and billing activity, cash collections, and changes to our allowance for doubtful accounts. We use days' sales outstanding, or DSO, calculated on a monthly basis, as a measurement of the quality and status of our receivables. We define DSO as accounts receivable divided by total revenue for the applicable period, multiplied by the number of days in the applicable period. DSO was 67 days at December 31, 2009, 60 days at December 31, 2008, and 57 days at December 31, 2007.
Operating Activities
| |
For the Years Ended December 31, | |||||||||
|---|---|---|---|---|---|---|---|---|---|---|
| |
2009 | 2008 | 2007 | |||||||
| |
(in thousands) |
|||||||||
Cash provided by operating activities |
$ | 19,733 | $ | 10,746 | $ | 13,315 | ||||
Cash used in investing activities(1) |
$ | (2,075 | ) | $ | (3,271 | ) | $ | (67,884 | ) | |
Cash (used in) provided by financing activities |
$ | (2,997 | ) | $ | 94 | $ | 85,753 | |||
- (1)
- Cash used in investing activities shown net of investment activity of ($17.9) million, $5.8 million and ($51.3) million for the years ended December 31, 2009, 2008 and 2007, respectively.
Cash provided by operating activities primarily consists of net (loss) income adjusted for certain non-cash items including depreciation and amortization, the provision for bad debt, stock-based compensation, deferred income taxes, and the effect of changes in working capital and other activities. Cash provided by operating activities for the year ended December 31, 2009 was $19.7 million compared to $10.7 million and $13.3 million in the years ended December 31, 2008 and 2007, respectively. The increase in cash provided by operations in 2009 compared to 2008 was primarily a result of net cash provided by changes in operating assets and liabilities of $4.5 million as compared to ($9.0) million in 2008. Significant components of the changes in assets and liabilities included a decrease in accounts receivable of $1.6 million in 2009 compared to an increase of $2.9 million in 2008 and a decrease in prepaid expenses and other current assets of $2.7 million in 2009 compared to an increase of $3.0 million in 2008. The increase in cash provided by changes in operating assets and liabilities in 2009 was partially offset by a $4.6 million decrease in net (loss) income adjusted for non-cash related items.
Investing Activities
Cash used in investing activities primarily consists of purchases of property and equipment and acquisitions of businesses. Cash used in investing activities, net of investment activity, for the year ended December 31, 2009 was $2.1 million for the purchase of property and equipment as well as website development costs. Cash used in investing activities, net of investment activity, for the year ended December 31, 2008 was $3.3 million and consisted of $2.0 million for the purchase of property and equipment and $1.3 million for the acquisition of The Brian Madden Company. Cash used in investing activities, net of investment activity, for the year ended December 31, 2007 was $67.9 million and consisted of $64.2 million for the acquisitions of TechnologyGuide.com in April 2007 and KnowledgeStorm in November 2007, net of cash acquired, $2.7 million for the purchase of property and equipment and $1.0 million to acquire certain assets of Ajaxian in February 2007.
We expect to spend approximately $2.0 million in capital expenditures in 2010 primarily for leasehold improvements, website development costs, computer equipment and related software, and internal-use software development costs. We are not currently party to any purchase contracts related to future capital expenditures.
57
Equity Financing Activities
We received proceeds from the exercise of common stock options and warrants totaling $0.1 million, $2.2 million and $2.5 million for the years ended December 31, 2009, 2008 and 2007, respectively. In May 2007, we completed our initial public offering of 8.9 million shares of our common stock, of which 7.1 million shares were sold by us and 1.8 million shares were sold by stockholders of ours, all at a price to the public of $13.00 per share. We raised a total of $91.9 million in gross proceeds from the offering, or $83.2 million in net proceeds after deducting underwriting discounts and commissions of $6.4 million and other offering costs of approximately $2.3 million.
Term Loan and Credit Facility Borrowings
On August 30, 2006, we entered into a credit agreement with Citizens Bank of Massachusetts, which included a $10.0 million term loan and a $20.0 million revolving credit facility. In December 2009, we reduced the revolving credit facility to $5.0 million.
We borrowed $12.0 million against our revolving credit facility in conjunction with the acquisition of TechnologyGuide.com in April 2007. The entire outstanding balance of $12.0 million was repaid in May 2007 with proceeds from our initial public offering. Our revolving credit facility matures on August 30, 2011. Unless earlier payment is required by an event of default, all principal and any unpaid interest will be due and payable on August 30, 2011. At our option, the revolving credit facility bears interest at either the lender's prime rate less 1.00% or the London Interbank Offered Rate, or LIBOR, plus the applicable LIBOR margin. The applicable LIBOR margin is based on the ratio of total funded debt to EBITDA for the preceding four fiscal quarters. As of December 31, 2009, the applicable LIBOR margin was 1.25%.
We are also required to pay an unused line fee on the daily unused amount of our revolving credit facility at a per annum rate based on the ratio of total funded debt to EBITDA for the preceding four fiscal quarters. As of December 31, 2009, unused availability under our revolving credit facility totaled $5 million and the per annum unused line fee rate was 0.20%.
Our term loan requires the payment of 39 consecutive monthly installments of $250,000 each, plus interest, the first such installment was due on September 30, 2006, with a final payment of the entire unpaid principal balance due on December 30, 2009. In September 2006, we entered into an interest rate swap agreement to mitigate interest rate fluctuation, and fix the interest rate on the term loan at 6.98%. The remaining balance of the term loan was paid and interest rate swap agreement was terminated in December 2009.
Borrowings under our credit agreements are collateralized by an interest in and lien on all of our assets and certain other guarantees and pledges. Our credit agreements contain certain affirmative and negative covenants, which require, among other things, that we meet certain financial ratio covenants and limit certain capital expenditures. At December 31, 2009, we were in compliance with all financial covenants under the credit agreement. We were in violation of one loan covenant under the credit agreement with Citizens Bank. We failed to file timely quarterly interim financial statements with the SEC. We received a waiver from the bank agreeing to extend delivery date of September 30, 2009 financial statements to February 26, 2010 and compliance was satisfied when we filed the financial statements in February 2010.
Contractual Obligations and Commitments
As of December 31, 2009, our principal commitments consist of obligations under leases for office space. The offices are leased under noncancelable operating lease agreements that expire through 2020.
58
The following table sets forth our commitments to settle contractual obligations in cash, net of minimum sublease payments of $0.3 million, as of December 31, 2009:
| |
Payments Due By Period | |||||||||||||||
|---|---|---|---|---|---|---|---|---|---|---|---|---|---|---|---|---|
| |
Total | Less than 1 Year |
1–3 Years | 3–5 Years | More than 5 Years |
|||||||||||
Operating leases(1) |
$ | 29,008 | $ | 1,329 | $ | 6,298 | $ | 5,758 | $ | 15,623 | ||||||
- (1)
- Operating leases are net of minimum sublease payments of $0.3 million due under a sublease agreement that expires in November 2010.
At December 31, 2009, we had an irrevocable standby letter of credit outstanding in the aggregate amount of $1.5 million. This letter of credit supports the lease we entered into in 2009 for our new corporate headquarters. This letter of credit extends annually through February 28, 2020 unless notification of termination is received.
Off-Balance Sheet Arrangements
We do not have any off-balance sheet arrangements.
Recent Accounting Pronouncements
See Note 2 of "Notes to Consolidated Financial Statements" for recent accounting pronouncements that could have an effect on us.
Item 7A. Quantitative and Qualitative Disclosures About Market Risk
Market risk represents the risk of loss that may impact our financial position due to adverse changes in financial market prices and rates. Our market risk exposure is primarily a result of fluctuations in foreign exchange rates and interest rates. We do not hold or issue financial instruments for trading purposes.
Foreign Currency Exchange Risk
Our subsidiary, TechTarget Limited, was established in July 2006 and is located in London, England. As of December 31, 2009, most of our international customer agreements have been denominated in U.S. dollars, and aggregate foreign currency payments made by us through this subsidiary have been less than $0.3 million during the year ended December 31, 2009. We currently believe our exposure to foreign currency exchange rate fluctuations is financially immaterial and therefore have not entered into foreign currency hedging transactions. We continue to review this issue and may consider hedging certain foreign exchange risks through the use of currency futures or options in the future.
Interest Rate Risk
At December 31, 2009, we had cash, cash equivalents and investments totaling $82.6 million. These amounts were invested primarily in money market accounts, government agency bonds and municipal bonds. The cash, cash equivalents and investments were held for working capital purposes. We do not enter into investments for trading or speculative purposes. Due to the short-term nature of these investments, we believe we do not have any material exposure to changes in the fair value of our investment portfolio as a result of changes in interest rates. Declines in interest rates, however, would reduce future investment income.
Our exposure to market risk also relates to the amount of interest expense we must pay under our revolving credit facility. The advances under this credit facility bear a variable rate of interest determined as a function of the lender's prime rate or LIBOR. At December 31, 2009, there were no amounts outstanding under our revolving credit facility.
59
Item 8. Financial Statements and Supplementary Data
Index to Consolidated Financial Statements
60
Report of Independent Registered Public Accounting Firm
The
Board of Directors and Stockholders of
TechTarget, Inc.
We have audited the accompanying consolidated balance sheets of TechTarget, Inc. as of December 31, 2009 and 2008, and the related consolidated statements of operations, redeemable convertible preferred stock and stockholders' equity, and cash flows for each of the three years in the period ended December 31, 2009. These financial statements are the responsibility of the Company's management. Our responsibility is to express an opinion on these financial statements based on our audits.
We conducted our audits in accordance with the standards of the Public Company Accounting Oversight Board (United States). Those standards require that we plan and perform the audit to obtain reasonable assurance about whether the financial statements are free of material misstatement. An audit includes examining, on a test basis, evidence supporting the amounts and disclosures in the financial statements. An audit also includes assessing the accounting principles used and significant estimates made by management, as well as evaluating the overall financial statement presentation. We believe that our audits provide a reasonable basis for our opinion.
In our opinion, the financial statements referred to above present fairly, in all material respects, the consolidated financial position of TechTarget, Inc. at December 31, 2009 and 2008, and the consolidated results of its operations and its cash flows for each of the three years in the period ended December 31, 2009, in conformity with U.S. generally accepted accounting principles.
We also have audited, in accordance with the standards of the Public Company Accounting Oversight Board (United States), TechTarget, Inc.'s internal control over financial reporting as of December 31, 2009, based on criteria established in Internal Control-Integrated Framework issued by the Committee of Sponsoring Organizations of the Treadway Commission and our report dated March 16, 2010 expressed an adverse opinion thereon.
| /s/ Ernst & Young LLP |
Boston,
Massachusetts
March 16, 2010
61
TechTarget, Inc.
Consolidated Balance Sheets
(in thousands, except share and per share data)
| |
December 31, | |||||||
|---|---|---|---|---|---|---|---|---|
| |
2009 | 2008 | ||||||
Assets |
||||||||
Current assets: |
||||||||
Cash and cash equivalents |
$ | 20,884 | $ | 24,130 | ||||
Short-term investments |
50,496 | 42,863 | ||||||
Accounts receivable, net of allowance for doubtful accounts of $483 and $642 as of December 31, 2009 and 2008, respectively |
15,816 | 17,622 | ||||||
Prepaid expenses and other current assets |
2,736 | 6,251 | ||||||
Deferred tax assets |
2,399 | 2,959 | ||||||
Total current assets |
92,331 | 93,825 | ||||||
Property and equipment, net |
3,760 |
3,904 |
||||||
Long-term investments |
11,177 | 2,575 | ||||||
Goodwill |
88,958 | 88,958 | ||||||
Intangible assets, net of accumulated amortization |
12,528 | 17,242 | ||||||
Other assets |
127 | 139 | ||||||
Deferred tax assets |
5,182 | 3,369 | ||||||
Total assets |
$ | 214,063 | $ | 210,012 | ||||
Liabilities and Stockholders' Equity |
||||||||
Current liabilities: |
||||||||
Accounts payable |
$ | 3,106 | $ | 3,404 | ||||
Accrued expenses and other current liabilities |
2,910 | 2,908 | ||||||
Accrued compensation expenses |
808 | 702 | ||||||
Current portion of bank term loan payable |
— | 3,000 | ||||||
Income taxes payable |
398 | — | ||||||
Deferred revenue |
8,402 | 8,749 | ||||||
Total current liabilities |
15,624 | 18,763 | ||||||
Long-term liabilities: |
||||||||
Other liabilities |
575 | 312 | ||||||
Total liabilities |
16,199 | 19,075 | ||||||
Commitments (Note 10) |
— | — | ||||||
Stockholders' equity: |
||||||||
Preferred stock, 5,000,000 shares authorized; no shares issued or outstanding |
— | — | ||||||
Common stock, $0.001 par value per share, 100,000,000 shares authorized; 42,109,965 and 41,616,963 shares issued and outstanding at December 31, 2009 and 2008, respectively |
42 | 42 | ||||||
Additional paid-in capital |
233,555 | 221,597 | ||||||
Warrants |
2 | 2 | ||||||
Accumulated other comprehensive income (loss) |
8 | (77 | ) | |||||
Accumulated deficit |
(35,743 | ) | (30,627 | ) | ||||
Total stockholders' equity |
197,864 | 190,937 | ||||||
Total liabilities and stockholders' equity |
$ | 214,063 | $ | 210,012 | ||||
See accompanying notes.
62
TechTarget, Inc.
Consolidated Statements of Operations
(in thousands, except share and per share data)
| |
For the Years Ended December 31, | ||||||||||
|---|---|---|---|---|---|---|---|---|---|---|---|
| |
2009 | 2008 | 2007 | ||||||||
Revenues: |
|||||||||||
Online |
$ | 72,345 | $ | 77,373 | $ | 61,353 | |||||
Events |
14,152 | 22,786 | 24,254 | ||||||||
| — | 4,385 | 6,643 | |||||||||
Total revenues |
86,497 | 104,544 | 92,250 | ||||||||
Cost of revenues: |
|||||||||||
Online(1) |
19,378 | 21,404 | 15,575 | ||||||||
Events(1) |
5,600 | 9,531 | 8,611 | ||||||||
Print(1) |
— | 2,156 | 3,788 | ||||||||
Total cost of revenues |
24,978 | 33,091 | 27,974 | ||||||||
Gross profit |
61,519 | 71,453 | 64,276 | ||||||||
Operating expenses: |
|||||||||||
Selling and marketing(1) |
32,002 | 33,481 | 28,048 | ||||||||
Product development(1) |
8,664 | 10,995 | 7,320 | ||||||||
General and administrative(1) |
19,527 | 14,663 | 12,592 | ||||||||
Depreciation |
2,219 | 2,406 | 1,610 | ||||||||
Amortization of intangible assets |
4,714 | 5,306 | 4,740 | ||||||||
Restructuring charge |
— | 1,494 | — | ||||||||
Total operating expenses |
67,126 | 68,345 | 54,310 | ||||||||
Operating (loss) income |
(5,607 | ) | 3,108 | 9,966 | |||||||
Interest income, net |
267 | 1,440 | 1,831 | ||||||||
(Loss) income before provision for income taxes |
(5,340 | ) | 4,548 | 11,797 | |||||||
(Benefit from) provision for income taxes |
(224 | ) | 2,784 | 5,252 | |||||||
Net (loss) income |
$ | (5,116 | ) | $ | 1,764 | $ | 6,545 | ||||
Net (loss) income per common share: |
|||||||||||
Basic |
$ | (0.12 | ) | $ | 0.04 | $ | 0.09 | ||||
Diluted |
$ | (0.12 | ) | $ | 0.04 | $ | 0.08 | ||||
Weighted average common shares outstanding: |
|||||||||||
Basic |
41,864,789 | 41,424,920 | 28,384,303 | ||||||||
Diluted |
41,864,789 | 43,439,619 | 31,346,738 | ||||||||
- (1)
- Amounts include stock-based compensation expense as follows:
Cost of online revenue |
$ | 454 | $ | 407 | $ | 189 | |||||
Cost of events revenue |
94 | 91 | 53 | ||||||||
Cost of print revenue |
— | 6 | 15 | ||||||||
Selling and marketing |
5,342 | 4,813 | 2,999 | ||||||||
Product development |
535 | 473 | 334 | ||||||||
General and administrative |
6,198 | 2,881 | 2,244 |
See accompanying notes.
63
TechTarget, Inc.
Consolidated Statements of Redeemable Convertible Preferred Stock and Stockholders' Equity (Deficit)
(in thousands, except share and per share data)
| |
Redeemable Convertible Preferred Stock |
|
|
|
|
|
|
|
||||||||||||||||||||||
|---|---|---|---|---|---|---|---|---|---|---|---|---|---|---|---|---|---|---|---|---|---|---|---|---|---|---|---|---|---|---|
| |
Common Stock | |
|
|
|
|
||||||||||||||||||||||||
| |
|
|
Accumulated Other Comprehensive Income (Loss) |
|
|
|||||||||||||||||||||||||
| |
Number of Shares |
Redemption Value |
Number of Shares |
$0.001 Par Value |
Additional Paid-In Capital |
Warrants | Accumulated Deficit |
Total Stockholders' Equity (Deficit) |
||||||||||||||||||||||
Balance, December 31, 2006 |
97,491,861 | $ | 136,766 | 7,969,830 | $ | 8 | $ | — | $ | 105 | $ | (56 | ) | $ | (66,976 | ) | $ | (66,919 | ) | |||||||||||
Accretion of redeemable convertible preferred stock |
2,613 | (2,613 | ) | (2,613 | ) | |||||||||||||||||||||||||
Reclassification from additional paid-in capital to accumulated deficit prior to initial public offering |
2,492 | (2,492 | ) | — | ||||||||||||||||||||||||||
Conversion of redeemable convertible preferred stock to common stock |
(97,491,861 | ) | (139,379 | ) | 24,372,953 | 24 | 108,822 | 356 | 30,532 | 139,734 | ||||||||||||||||||||
Sale of common stock in initial public offering, net of issuance costs |
7,072,097 | 7 | 83,154 | 83,161 | ||||||||||||||||||||||||||
Issuance of common stock from warrants, stock options and restricted stock awards |
1,306,916 | 2 | 2,862 | (398 | ) | 2,466 | ||||||||||||||||||||||||
Issuance of common stock to acquire KnowledgeStorm |
359,820 | 6,000 | 6,000 | |||||||||||||||||||||||||||
Excess tax benefit—stock options |
3,222 | 3,222 | ||||||||||||||||||||||||||||
Reclassification of preferred stock warrants to other liabilities |
(50 | ) | (50 | ) | ||||||||||||||||||||||||||
Stock-based compensation expense |
5,834 | 5,834 | ||||||||||||||||||||||||||||
Comprehensive income: |
||||||||||||||||||||||||||||||
Change in fair value of interest rate swap |
(46 | ) | (46 | ) | ||||||||||||||||||||||||||
Net income |
6,545 | 6,545 | ||||||||||||||||||||||||||||
Comprehensive income |
6,499 | |||||||||||||||||||||||||||||
Balance, December 31, 2007 |
— | $ | — | 41,081,616 | $ | 41 | $ | 209,773 | $ | 13 | $ | (102 | ) | $ | (32,391 | ) | $ | 177,334 | ||||||||||||
Issuance of common stock from warrants, stock options and restricted stock awards |
535,347 | 1 | 2,214 | (11 | ) | 2,204 | ||||||||||||||||||||||||
Excess tax benefit—stock options |
939 | 939 | ||||||||||||||||||||||||||||
Stock-based compensation expense |
8,671 | 8,671 | ||||||||||||||||||||||||||||
Comprehensive income: |
||||||||||||||||||||||||||||||
Change in fair value of interest rate swap |
26 | 26 | ||||||||||||||||||||||||||||
Unrealized gain on investments (net of tax expense of $10) |
10 | 10 | ||||||||||||||||||||||||||||
Unrealized loss on foreign currency translation |
(11 | ) | (11 | ) | ||||||||||||||||||||||||||
Net income |
1,764 | 1,764 | ||||||||||||||||||||||||||||
Comprehensive income |
1,789 | |||||||||||||||||||||||||||||
Balance, December 31, 2008 |
— | $ | — | 41,616,963 | $ | 42 | $ | 221,597 | $ | 2 | $ | (77 | ) | $ | (30,627 | ) | $ | 190,937 | ||||||||||||
Issuance of common stock from stock options and restricted stock awards |
493,002 | 133 | 133 | |||||||||||||||||||||||||||
Excess tax benefit—stock options |
(778 | ) | (778 | ) | ||||||||||||||||||||||||||
Stock-based compensation expense |
12,623 | 12,623 | ||||||||||||||||||||||||||||
Other |
(20 | ) | (20 | ) | ||||||||||||||||||||||||||
Comprehensive loss: |
||||||||||||||||||||||||||||||
Change in fair value of interest rate swap |
77 | 77 | ||||||||||||||||||||||||||||
Unrealized gain on investments (net of tax expense of ($5)) |
(4 | ) | (4 | ) | ||||||||||||||||||||||||||
Unrealized loss on foreign currency translation |
12 | 12 | ||||||||||||||||||||||||||||
Net loss |
(5,116 | ) | (5,116 | ) | ||||||||||||||||||||||||||
Comprehensive loss |
(5,031 | ) | ||||||||||||||||||||||||||||
Balance, December 31, 2009 |
— | $ | — | 42,109,965 | $ | 42 | $ | 233,555 | $ | 2 | $ | 8 | $ | (35,743 | ) | $ | 197,864 | |||||||||||||
See accompanying notes.
64
TechTarget, Inc.
Consolidated Statements of Cash Flows
(in thousands)
| |
For the Years Ended December 31, | |||||||||||
|---|---|---|---|---|---|---|---|---|---|---|---|---|
| |
2009 | 2008 | 2007 | |||||||||
Operating Activities: |
||||||||||||
Net (loss) income |
$ | (5,116 | ) | $ | 1,764 | $ | 6,545 | |||||
Adjustments to reconcile net (loss) income to net cash provided by operating activities: |
||||||||||||
Depreciation and amortization |
6,933 | 7,712 | 6,350 | |||||||||
Provision for bad debt |
221 | 441 | 78 | |||||||||
Amortization of investment premiums |
1,668 | 181 | 13 | |||||||||
Stock-based compensation |
12,623 | 8,671 | 5,834 | |||||||||
Non-cash interest expense |
13 | 9 | 312 | |||||||||
Deferred tax benefit |
(1,253 | ) | 1,746 | (1,715 | ) | |||||||
Excess tax benefit—stock options |
130 | (891 | ) | (3,126 | ) | |||||||
Non-cash portion of restructuring charge |
— | 49 | — | |||||||||
Other non-cash items |
(20 | ) | 85 | — | ||||||||
Changes in operating assets and liabilities, net of businesses acquired: |
||||||||||||
Accounts receivable |
1,595 | (2,871 | ) | (1,985 | ) | |||||||
Prepaid expenses and other current assets |
2,737 | (3,012 | ) | 2,048 | ||||||||
Other assets |
(1 | ) | 55 | 686 | ||||||||
Accounts payable |
(296 | ) | 476 | (246 | ) | |||||||
Income taxes payable |
398 | (1,330 | ) | (524 | ) | |||||||
Accrued expenses and other current liabilities |
2 | 305 | (855 | ) | ||||||||
Accrued compensation expenses |
106 | (1,898 | ) | (2,729 | ) | |||||||
Deferred revenue |
(347 | ) | (629 | ) | 2,786 | |||||||
Other liabilities |
340 | (117 | ) | (157 | ) | |||||||
Net cash provided by operating activities |
19,733 | 10,746 | 13,315 | |||||||||
Investing activities: |
||||||||||||
Purchases of property and equipment, and other assets |
(2,075 | ) | (2,037 | ) | (2,709 | ) | ||||||
Purchases of short-term investments |
(27,927 | ) | (60,284 | ) | (354,742 | ) | ||||||
Purchases of long-term investments |
(31,941 | ) | (17,114 | ) | — | |||||||
Proceeds from sales and maturities of short-term investments |
38,211 | 83,189 | 303,421 | |||||||||
Proceeds from sales and maturities of long-term investments |
3,750 | 77 | — | |||||||||
Acquisition of assets |
— | (50 | ) | (1,013 | ) | |||||||
Acquisition of businesses, net of cash acquired |
— | (1,184 | ) | (64,162 | ) | |||||||
Net cash (used in) provided by investing activities |
(19,982 | ) | 2,597 | (119,205 | ) | |||||||
Financing activities: |
||||||||||||
Proceeds from revolving credit facility |
— | — | 12,000 | |||||||||
Payments made on revolving credit facility |
— | — | (12,000 | ) | ||||||||
Payments on bank term loan payable |
(3,000 | ) | (3,000 | ) | (3,000 | ) | ||||||
Proceeds from initial public offering, net of stock issuance costs |
— | — | 83,161 | |||||||||
Excess tax benefit—stock options |
(130 | ) | 891 | 3,126 | ||||||||
Proceeds from exercise of warrants and stock options |
133 | 2,203 | 2,466 | |||||||||
Net cash (used in) provided by financing activities |
(2,997 | ) | 94 | 85,753 | ||||||||
Net (decrease) increase in cash and cash equivalents |
(3,246 | ) | 13,437 | (20,137 | ) | |||||||
Cash and cash equivalents at beginning of period |
24,130 | 10,693 | 30,830 | |||||||||
Cash and cash equivalents at end of period |
$ | 20,884 | $ | 24,130 | $ | 10,693 | ||||||
Supplemental disclosure of cash flow information: |
||||||||||||
Cash paid for interest |
$ | 139 | $ | 318 | $ | 620 | ||||||
Cash (refunded) paid for income taxes |
$ | (1,942 | ) | $ | 4,561 | $ | 4,484 | |||||
Supplemental disclosure of non-cash investing activities: |
||||||||||||
Issuance of common stock in connection with KnowledgeStorm acquisition |
$ | — | $ | — | $ | 6,000 | ||||||
Accrual for cash paid in connection with The Brian Madden Company acquisition |
$ | — | $ | 131 | $ | — | ||||||
See accompanying notes.
65
TechTarget, Inc.
Notes to Consolidated Financial Statements
Years Ended December 31, 2009, 2008 and 2007
(In thousands, except
share and per share data)
1. Organization and Operations
TechTarget, Inc. (the Company) is a leading provider of specialized online content that brings together buyers and sellers of corporate information technology, or IT, products. The Company sells customized marketing programs that enable IT vendors to reach corporate IT decision makers who are actively researching specific IT purchases.
The Company's integrated content platform consists of a network of websites that are complemented with targeted in-person events and, until December 2008, specialized IT magazines. Throughout the critical stages of the purchase decision process, these content offerings meet IT professionals' needs for expert, peer and IT vendor information, and provide a platform on which IT vendors can launch targeted marketing campaigns that generate measurable, high return on investment (ROI). As IT professionals have become increasingly specialized, they have come to rely on our sector-specific websites for purchasing decision support. The Company's content enables IT professionals to navigate the complex and rapidly changing IT landscape where purchasing decisions can have significant financial and operational consequences. Based upon the logical clustering of users' respective job responsibilities and the marketing focus of the products that the Company's customers are advertising, content offerings are currently categorized across ten distinct media groups: Application Development; Channel; CIO/IT Strategy; Data Center and Virtualization; Enterprise Applications; Networking; Security; Storage; TechnologyGuide.com; and Vertical Software.
On November 9, 2009, the Company disclosed that it had identified an improper accounting practice relating to certain customer credits that were improperly eliminated as liabilities on its balance sheet. As a result, the Company's Audit Committee conducted an investigation into this matter and found no other improper conduct in connection with any other accounting practices. Total professional fees related to the investigation are approximately $1.5 million of which approximately $1.2 million was recorded in 2009, with the remaining amount to be included in 2010. The Company has concluded that there were certain errors in its previously reported financial statements.
To correct the customer credit errors, the Company recorded a net adjustment which increased accounts payable by $967 and decreased income before provision for income taxes by $967 during the quarter ended September 30, 2009. The aggregate net adjustment accumulated over several years and includes $57 from 2004 to 2006, $362 from 2007, $561 from 2008 and ($13) from 2009.
In addition to the customer credit matter mentioned above, the Company disclosed in its Quarterly Report on Form 10-Q for the first quarter of 2009 that the Company corrected in the first quarter of 2009 an error in the amount of $284 related to interest income which should have been recorded in the fourth quarter of 2008. Whereas the error was previously corrected in Q1 2009, the $284 adjustment is not included in the adjustments described below.
The Company assessed the materiality of these errors, both quantitatively and qualitatively, and concluded that the adjustments are not material to the prior annual financial statements or to the interim financial statements for 2009 (See Note 16).
66
TechTarget, Inc.
Notes to Consolidated Financial Statements (Continued)
Years Ended December 31, 2009, 2008 and 2007
(In thousands, except share and per share data)
2. Summary of Significant Accounting Policies
The accompanying consolidated financial statements reflect the application of certain significant accounting policies as described below and elsewhere in these notes to the consolidated financial statements.
Principles of Consolidation
The accompanying consolidated financial statements include the accounts of the Company and its wholly owned subsidiaries, which include KnowledgeStorm, Inc., Bitpipe, Inc., TechTarget Securities Corporation and TechTarget Limited. KnowledgeStorm, Inc. was acquired by the Company on November 6, 2007 and is a leading online search resource providing vendor generated content targeted toward corporate IT professionals. Bitpipe, Inc. is a leading provider of in-depth IT content including white papers, product literature, and case studies from IT vendors. TechTarget Securities Corporation is a Massachusetts Securities Corporation incorporated in 2004. TechTarget Limited is a subsidiary doing business principally in the United Kingdom. All significant intercompany accounts and transactions have been eliminated in consolidation.
Use of Estimates
The preparation of financial statements in conformity with U.S. generally accepted accounting principles requires management to make estimates and assumptions that affect the reported amounts of assets and liabilities and disclosures of contingent assets and liabilities at the date of the financial statements and the reported amounts of revenues and expenses during the reporting period. Actual results could differ from those estimates.
Revenue Recognition
The Company generates substantially all of its revenue from the sale of targeted advertising campaigns that are delivered via its network of websites, events and, prior to 2009, print publications. Revenue is recognized only when the price is fixed or determinable, persuasive evidence of an arrangement exists, the service is performed and collectability of the resulting receivable is reasonably assured.
Although each of the Company's online media offerings can be sold separately, most of the Company's online media sales involve multiple online offerings. Because objective evidence of fair value does not exist for all elements in the Company's bundled advertising campaigns, no allocation can be made among the various elements, and the Company recognizes revenue on all items ratably over the term of the arrangement.
Event Sponsorships. Sponsorship revenue from events is recognized upon completion of the event in the period the event occurs. The majority of the Company's events are free to qualified attendees, however certain events are based on a paid attendee model. The Company recognizes revenue for paid attendee events upon completion of the event and receipt of payment from the attendee. Amounts collected or billed prior to satisfying the above revenue recognition criteria are recorded as deferred revenue.
67
TechTarget, Inc.
Notes to Consolidated Financial Statements (Continued)
Years Ended December 31, 2009, 2008 and 2007
(In thousands, except share and per share data)
2. Summary of Significant Accounting Policies (Continued)
Print Publications. When sold separately advertising revenues from print publications were recognized at the time the applicable publication was distributed. When print advertising campaigns were sold with other services, revenue was recognized for all services in the advertising campaign over the term of the arrangement. Amounts collected or billed prior to satisfying the above revenue recognition criteria were recorded as deferred revenue.
Online Media. Revenue for online media offerings is recognized for specific online media offerings as follows when these items are sold separately:
- •
- White Papers. White paper revenue is recognized ratably
over the period in which the white paper is available on the Company's websites.
- •
- Webcasts, Podcasts and Videocasts. Webcast, podcast and
videocast revenue is recognized ratably over the period in which the webcast, podcast or videocast is available on the Company's websites.
- •
- Software Package Comparisons. Software package comparison
revenue is recognized ratably over the period in which the software information is available on the Company's websites.
- •
- Promotional E-mails and
E-newsletters. Promotional e-mail revenue is recognized ratably over the period in which the related content
asset is available on its websites because promotional emails do not have standalone value from the related content asset. E-newsletter revenue is recognized in the period in which the
e-newsletter is sent.
- •
- List Rentals. List rental revenue is recognized in the
period in which the e-mail is sent to the list of registered members.
- •
- Banners. Banner revenue is recognized in the period in
which the banner impressions occur.
- •
- Third Party Revenue Sharing Arrangements. Revenue from third party revenue sharing arrangements is recognized in the period in which the services are performed.
The Company offers customers the ability to purchase integrated ROI program offerings, which can include any of its online media offerings packaged together to address the particular customer's specific advertising requirements. As part of these offerings, the Company will guarantee a minimum number of qualified sales leads to be delivered over the course of the advertising campaign. Scheduled end dates of advertising campaigns are sometimes extended to satisfy lead guarantees or fulfill all elements of the advertising campaign based on delayed receipt of advertising media collateral from the customer. The Company estimates the revenue reserve necessary to properly defer revenue recognition for extended advertising campaigns. These estimates are based on the Company's experience in managing and fulfilling these integrated ROI program offerings. Shortfalls in fulfilling lead guarantees before the scheduled completion date of an advertising campaign are satisfied within an average of 42 days of such scheduled completion date. These integrated ROI program offerings represented approximately 49%, 41% and 33% of the Company's online revenues, and 41%, 31% and 22% of the Company's total revenues for the years ended December 31, 2009, 2008 and 2007, respectively.
68
TechTarget, Inc.
Notes to Consolidated Financial Statements (Continued)
Years Ended December 31, 2009, 2008 and 2007
(In thousands, except share and per share data)
2. Summary of Significant Accounting Policies (Continued)
Amounts collected or billed prior to satisfying the above revenue recognition criteria are recorded as deferred revenue.
Fair Value of Financial Instruments
Financial instruments consist of cash and cash equivalents, short and long-term investments, accounts receivable, accounts payable, a term loan payable and an interest rate swap. The carrying value of these instruments approximates their estimated fair values.
Long-lived Assets
Long-lived assets consist of property and equipment, goodwill and other intangible assets. A specifically identified intangible asset must be recorded as a separate asset from goodwill if either of the following two criteria is met: (1) the intangible asset acquired arises from contractual or other legal rights; (2) the intangible asset is separable. Accordingly, intangible assets consist of specifically identified intangible assets. Goodwill is the excess of any purchase price over the estimated fair market value of net tangible assets acquired not allocated to specific intangible assets.
Goodwill and indefinite-lived intangible assets are not amortized, but are reviewed annually for impairment or more frequently if impairment indicators arise. Separable intangible assets that are not deemed to have an indefinite life are amortized over their useful lives, which range from one to nine years, using methods of amortization that are expected to reflect the estimated pattern of economic use and are reviewed for impairment when events or changes in circumstances suggest that the assets may not be recoverable. The Company performs its annual test of impairment of goodwill on December 31st of each year, and whenever events or changes in circumstances suggest that the carrying amount may not be recoverable. Based on this evaluation, the Company believes that, as of each of the balance sheet dates presented, none of the Company's goodwill or other long-lived assets was impaired.
Allowance for Doubtful Accounts
The Company reduces gross trade accounts receivable by an allowance for doubtful accounts. The allowance for doubtful accounts is the Company's best estimate of the amount of probable credit losses in the Company's existing accounts receivable. The Company reviews its allowance for doubtful accounts on a regular basis and all past due balances are reviewed individually for collectability. Account balances are charged off against the allowance after all means of collection have been exhausted and the potential for recovery is considered remote. Provisions for allowance for doubtful accounts are recorded in general and administrative expenses.
69
TechTarget, Inc.
Notes to Consolidated Financial Statements (Continued)
Years Ended December 31, 2009, 2008 and 2007
(In thousands, except share and per share data)
2. Summary of Significant Accounting Policies (Continued)
Below is a summary of the changes in the Company's allowance for doubtful accounts for the years ended December 31, 2009, 2008 and 2007.
| |
Balance at Beginning of Period |
Provision | Write-offs, net of recoveries |
Balance at End of Period |
|||||||||
|---|---|---|---|---|---|---|---|---|---|---|---|---|---|
Year ended December 31, 2007 |
$ | 580 | $ | 78 | $ | (234 | ) | $ | 424 | ||||
Year ended December 31, 2008 |
$ | 424 | $ | 441 | $ | (223 | ) | $ | 642 | ||||
Year ended December 31, 2009 |
$ | 642 | $ | 221 | $ | (380 | ) | $ | 483 | ||||
Property and Equipment
Property and equipment is stated at cost. Property and equipment acquired through acquisitions of businesses are initially recorded at fair value. Depreciation is calculated on the straight-line method based on the month the asset is placed in service over the following estimated useful lives:
| |
Estimated Useful Life | |
|---|---|---|
Furniture and fixtures |
5 years | |
Computer equipment and software |
2–3 years | |
Internal-use software and website development costs |
3–4 years | |
Leasehold improvements |
Shorter of useful life or life of lease |
Property and equipment consists of the following:
| |
As of December 31, | ||||||
|---|---|---|---|---|---|---|---|
| |
2009 | 2008 | |||||
Furniture and fixtures |
$ | 1,155 | $ | 1,439 | |||
Computer equipment and software |
4,868 | 5,989 | |||||
Leasehold improvements |
1,090 | 1,168 | |||||
Internal-use software and website development costs |
4,515 | 3,042 | |||||
|
11,628 | 11,638 | |||||
Less: Accumulated depreciation and amortization |
(7,868 | ) | (7,734 | ) | |||
|
$ | 3,760 | $ | 3,904 | |||
Depreciation expense was $2.2 million, $2.4 million, and $1.6 million for the years ended December 31, 2009, 2008 and 2007, respectively. Repairs and maintenance charges that do not increase the useful life of the assets are charged to operations as incurred. The Company wrote off approximately $0.6 million and $1.9 million of fully depreciated assets that were no longer in service during 2009 and 2008, respectively.
70
TechTarget, Inc.
Notes to Consolidated Financial Statements (Continued)
Years Ended December 31, 2009, 2008 and 2007
(In thousands, except share and per share data)
2. Summary of Significant Accounting Policies (Continued)
Internal Use Software and Website Development Costs
The Company capitalizes costs incurred during the development of its website applications and infrastructure as well as certain costs relating to internal use software. The estimated useful life of costs capitalized is evaluated for each specific project. Capitalized internal use software and website development costs are reviewed for recoverability whenever events or changes in circumstances indicate that the carrying amount of the asset may not be recoverable. An impairment loss shall be recognized only if the carrying amount of the asset is not recoverable and exceeds its fair value. The Company capitalized internal-use software and website development costs of $1.5 million, $0.5 million and $1.0 million for the years ended December 31, 2009, 2008 and 2007, respectively.
Concentrations of Credit Risk and Off-Balance Sheet Risk
Financial instruments that potentially expose the Company to concentrations of credit risk consist mainly of cash and cash equivalents and accounts receivable. The Company maintains its cash and cash equivalents principally in accredited financial institutions of high credit standing. The Company routinely assesses the credit worthiness of its customers. The Company generally has not experienced any significant losses related to individual customers or groups of customers in any particular industry or area. The Company does not require collateral. Due to these factors, no additional credit risk beyond amounts provided for collection losses is believed by management to be probable in the Company's accounts receivable.
No single customer represented 10% or more of total accounts receivable at December 31, 2009 and 2008. No single customer accounted for more than 10% of revenue for the years ended December 31, 2009, 2008 and 2007.
Derivative Instruments
The Company records all derivative instruments on its balance sheet at their fair value. In September, 2006, the Company entered into an interest rate swap agreement to mitigate interest rate fluctuations on its variable rate bank term loan, as further described in Note 9. The interest rate swap agreement was deemed to be a cash flow hedge and qualifies for hedge accounting using the shortcut method. Accordingly, changes in the fair value of the interest rate swap agreement are recorded in "accumulated other comprehensive loss" on the consolidated statements of redeemable convertible preferred stock and stockholders' deficit. The Company has no foreign exchange contracts, option contracts, or other hedging arrangements.
Income Taxes
The Company's deferred tax assets and liabilities are recognized based on temporary differences between the financial reporting and income tax bases of assets and liabilities using statutory rates. If required, a valuation allowance is established against net deferred tax assets if, based upon available evidence, it is more likely than not that some or all of the deferred tax assets will not be realized. The Company recognizes any interest and penalties related to unrecognized tax benefits in income tax expense.
71
TechTarget, Inc.
Notes to Consolidated Financial Statements (Continued)
Years Ended December 31, 2009, 2008 and 2007
(In thousands, except share and per share data)
2. Summary of Significant Accounting Policies (Continued)
Stock-Based Compensation
At December 31, 2009, the Company had two stock-based employee compensation plans which are more fully described in Note 11. Stock-based compensation is measured at the grant date based on the fair value of the award and is recognized in the statement of operations using the straight line method over the vesting period of the award or using the accelerated attribution method if vesting of the award is contingent upon attaining performance goals. The Company uses the Black-Scholes option pricing model to determine the fair value of stock-based awards.
Comprehensive Income (Loss)
Comprehensive income (loss) is defined to include all changes in equity during a period, except those resulting from investments by stockholders and distributions to stockholders. Other comprehensive income (loss) includes changes in the fair value of the Company's interest rate swap, unrealized gains (losses) on available for sale securities and foreign currency translation adjustments.
Net Income (Loss) Per Share
Basic earnings per share is computed based on the weighted average number of common shares and vested restricted stock awards outstanding during the period. Because the holders of unvested restricted stock awards do not have nonforfeitable rights to dividends or dividend equivalents, the Company does not consider these awards to be participating securities that should be included in its computation of earnings per share under the two-class method. Diluted earnings per share is computed using the weighted average number of common shares and vested restricted stock awards outstanding during the period, plus the dilutive effect of potential future issuances of common stock relating to stock option programs and other potentially dilutive securities using the treasury stock method. In calculating diluted earnings per share, the dilutive effect of stock options is computed using the average market price for the respective period. In addition, the assumed proceeds under the treasury stock method include the average unrecognized compensation expense and assumed tax benefit of stock options that are in-the-money. This results in the "assumed" buyback of additional shares, thereby reducing the dilutive impact of stock options.
A reconciliation of the numerator and denominator used in the calculation of basic and diluted net income (loss) per share is as follows:
| |
For the Years Ended December 31, | ||||||||||
|---|---|---|---|---|---|---|---|---|---|---|---|
| |
2009 | 2008 | 2007 | ||||||||
Numerator: |
|||||||||||
Net (loss) income |
$ | (5,116 | ) | $ | 1,764 | $ | 6,545 | ||||
Accretion of preferred stock dividends |
— | — | 3,948 | ||||||||
Total net income applicable to preferred stockholders |
— | — | 3,948 | ||||||||
Net (loss) income applicable to common stockholders |
$ | (5,116 | ) | $ | 1,764 | $ | 2,597 | ||||
72
TechTarget, Inc.
Notes to Consolidated Financial Statements (Continued)
Years Ended December 31, 2009, 2008 and 2007
(In thousands, except share and per share data)
2. Summary of Significant Accounting Policies (Continued)
| |
For the Years Ended December 31, | ||||||||||
|---|---|---|---|---|---|---|---|---|---|---|---|
| |
2009 | 2008 | 2007 | ||||||||
Denominator: |
|||||||||||
Basic: |
|||||||||||
Weighted average shares of common stock and vested restricted stock awards outstanding |
41,864,789 | 41,424,920 | 28,384,303 | ||||||||
Diluted: |
|||||||||||
Weighted average shares of common stock and vested restricted stock awards outstanding |
41,864,789 | 41,424,920 | 28,384,303 | ||||||||
Effect of potentially dilutive shares |
— | 2,014,699 | 2,962,435 | ||||||||
Total weighted average shares of common stock and vested restricted stock awards outstanding |
41,864,789 | 43,439,619 | 31,346,738 | ||||||||
Calculation of Net Income Per Common Share: |
|||||||||||
Basic: |
|||||||||||
Net (loss) income applicable to common stockholders |
$ | (5,116 | ) | $ | 1,764 | $ | 2,597 | ||||
Weighted average shares of stock outstanding |
41,864,789 | 41,424,920 | 28,384,303 | ||||||||
Net (loss) income per common share |
$ | (0.12 | ) | $ | 0.04 | $ | 0.09 | ||||
Diluted: |
|||||||||||
Net (loss) income applicable to common stockholders |
$ | (5,116 | ) | $ | 1,764 | $ | 2,597 | ||||
Weighted average shares of stock outstanding |
41,864,789 | 43,439,619 | 31,346,738 | ||||||||
Net (loss) income per common share(1) |
$ | (0.12 | ) | $ | 0.04 | $ | 0.08 | ||||
- (1)
- In calculating diluted earnings per share, shares related to outstanding stock options, unvested restricted stock awards and warrants were excluded for the year ended December 31, 2009 because the effect of including them would be anti-dilutive. Diluted net (loss) income per common share does not include the weighted-average effect of anti-dilutive common equivalent shares from stock options outstanding of 1,942,258 and 59,543 for 2008 and 2007, respectively.
Recent Accounting Pronouncements
Effective January 1, 2009, the Company adopted SFAS No. 141 (revised 2007), Business Combinations (SFAS 141(R)) which was primarily codified into FASB Accounting Standards Codification (ASC) 805, Business Combinations (ASC 805). Under current guidance, an entity is required to recognize the assets acquired, liabilities assumed, contractual contingencies, and contingent consideration at their fair value on the acquisition date. It further requires that acquisition-related costs be recognized separately from the acquisition and expensed as incurred; that restructuring costs generally be expensed in periods subsequent to the acquisition date; and that changes in accounting for deferred tax asset valuation allowances and acquired income tax uncertainties after the measurement period be recognized as a component of provision for taxes. In addition, acquired in-process research and development is capitalized as an intangible asset and amortized over its estimated useful life. The current guidance is effective on a prospective basis for all business combinations for which the
73
TechTarget, Inc.
Notes to Consolidated Financial Statements (Continued)
Years Ended December 31, 2009, 2008 and 2007
(In thousands, except share and per share data)
2. Summary of Significant Accounting Policies (Continued)
acquisition date is on or after January 1, 2009, with the exception of the accounting for valuation allowances on deferred taxes and acquired contingencies. With the adoption of the current guidance, any tax related adjustments associated with acquisitions that closed prior to January 1, 2009 will be recorded through income tax expense, whereas the previous accounting treatment would require any adjustment to be recognized through goodwill. The adoption of the current guidance had no impact on the Company's consolidated financial position or results of operations.
Effective January 1, 2009, the Company implemented Statement of Financial Accounting Standards No. 160, Noncontrolling Interests in Consolidated Financial Statements, an amendment to ARB No. 51 (SFAS 160) which was primarily codified into FASB ASC 810—Consolidation (ASC 810). This standard changed the accounting for and reporting of noncontrolling interest (previously called minority interest) in the consolidated financial statements. The adoption on January 1, 2009 did not have a material effect on the Company's consolidated financial position or results of operations.
Effective January 1, 2009, the Company adopted FASB Staff Position (FSP) No. 142-3, Determination of the Useful Life of Intangible Assets (FSP No. 142-3) which was primarily codified into FASB ASC 350, Intangibles—Goodwill and Other (ASC 350). The current guidance amends the factors considered in developing renewal or extension assumptions used to determine the useful life of a recognized intangible asset. The current guidance also requires enhanced disclosures when an intangible asset's expected future cash flows are affected by an entity's intent and/or ability to renew or extend the arrangement. The adoption did not have a material impact on the Company's consolidated financial position or results of operations.
Effective April 1, 2009, the Company adopted SFAS No. 165, Subsequent Events (SFAS 165) which was primarily codified into FASB ASC 855—Subsequent Events (ASC 855). The current guidance is intended to establish general standards of accounting for, and disclosure of, events that occur after the balance sheet date but before financial statements are issued. It requires the disclosure that the Company has evaluated subsequent events through the date of this filing. The adoption did not have a material impact on the Company's financial position or results of operations.
Effective April 1, 2009, the Company adopted FSP No. 115-2 and 124-2, Recognition and Presentation of Other-Than-Temporary Impairments (FSP 115-2 and 124-2) which was primarily codified into FASB ASC 320—Investments—Debt and Equity Securities (ASC 320). The current guidance provides new guidance on the recognition and presentation of an other-than-temporary impairments, as well as extends certain annual disclosure requirements to interim periods. The adoption did not have a material impact on the Company's financial position or results of operations.
Effective September 30, 2009, the Company adopted SFAS No. 168, The FASB Accounting Standards Codification (Codification) and the Hierarchy of Generally Accepted Accounting Principles—a replacement of Financial Statement No. 162 (SFAS 168) which was primarily codified into FASB ASC 105—Generally Accepted Accounting Principles. Current guidance establishes the FASB Accounting Standards Codification as the source of authoritative accounting principles recognized by the FASB to be applied by nongovernmental entities in preparation of financial statements in conformity with generally accepted accounting principles in the United States. All other accounting literature not
74
TechTarget, Inc.
Notes to Consolidated Financial Statements (Continued)
Years Ended December 31, 2009, 2008 and 2007
(In thousands, except share and per share data)
2. Summary of Significant Accounting Policies (Continued)
included in the Codification is non-authoritive. The adoption did not have a material impact on the Company's consolidated financial position or results of operations.
In September 2009, the FASB ratified Accounting Standards Update (ASU) 2009-13 (ASU 2009-13) (previously Emerging Issues Task Force (EITF) Issue No. 08-1, Revenue Arrangements with Multiple Deliverables (EITF 08-1)), which updates the existing multiple-element revenue arrangements guidance currently included in Accounting Standards Codification 605-25. ASU 2009-13 will require companies to allocate the overall consideration to each deliverable by using a best estimate of the selling price of individual deliverables in the arrangement in the absence of vendor-specific objective evidence or other third-party evidence of the selling price. ASU 2009-13 will be effective prospectively for revenue arrangements entered into or materially modified in fiscal years beginning on or after June 15, 2010 and early adoption will be permitted. The Company is currently evaluating the potential impact of the adoption of ASU 2009-13 on its consolidated results of operations and financial position and the Company's planned date of adoption.
3. Fair Value Measurements
The Company measures certain financial assets at fair value on a recurring basis, including cash equivalents, short and long-term investments, and equity investments. The fair value of these financial assets was determined based on three levels of input as follows:
- •
- Level 1. Quoted prices in active markets for
identical assets and liabilities;
- •
- Level 2. Observable inputs other than quoted prices
in active markets; and
- •
- Level 3. Unobservable inputs.
The fair value hierarchy of the Company's financial assets and liabilities carried at fair value and measured on a recurring basis is as follows:
| |
|
Fair Value Measurements at Reporting Date Using |
|||||||||||
|---|---|---|---|---|---|---|---|---|---|---|---|---|---|
| |
December 31, 2009 | Quoted Prices in Active Markets for Identical Assets (Level 1) |
Significant Other Observable Inputs (Level 2) |
Significant Unobservable Inputs (Level 3) |
|||||||||
Money market funds(1) |
$ | 6,271 | $ | 6,271 | $ | — | $ | — | |||||
Short-term investments |
50,496 | — | 50,496 | — | |||||||||
Long-term investments |
11,177 | — | 11,177 | — | |||||||||
Total |
$ | 67,944 | $ | 6,271 | $ | 61,673 | $ | — | |||||
75
TechTarget, Inc.
Notes to Consolidated Financial Statements (Continued)
Years Ended December 31, 2009, 2008 and 2007
(In thousands, except share and per share data)
3. Fair Value Measurements (Continued)
| |
|
Fair Value Measurements at Reporting Date Using |
|||||||||||
|---|---|---|---|---|---|---|---|---|---|---|---|---|---|
| |
December 31, 2008 | Quoted Prices in Active Markets for Identical Assets (Level 1) |
Significant Other Observable Inputs (Level 2) |
Significant Unobservable Inputs (Level 3) |
|||||||||
Money market funds(1) |
$ | 14,280 | $ | 14,280 | $ | — | $ | — | |||||
Short-term investments |
42,863 | — | 42,863 | — | |||||||||
Long-term investments |
2,575 | — | 2,575 | — | |||||||||
Interest rate swap(2) |
77 | — | 77 | — | |||||||||
Total |
$ | 59,795 | $ | 14,280 | $ | 45,515 | $ | — | |||||
- (1)
- Included
in cash equivalents on the accompanying consolidated balance sheet.
- (2)
- Included in other liabilities on the accompanying consolidated balance sheet.
4. Acquisitions
The Brian Madden Company
On November 19, 2008, the Company acquired substantially all of the assets of The Brian Madden Company LLC (BMC), for $1,315 in cash, of which $1,184 was paid on November 19, 2008 and the remaining balance of $131 was paid on September 11, 2009. BMC operates a website (BrianMadden.com) and an event addressing the topics of desktop virtualization, terminal services, and application virtualization. The acquisition provides the Company with an opportunity for growth within segments and in other markets in which it currently does not have a presence, primarily desktop and application virtualization.
In connection with this acquisition, the Company purchased $79 of property and equipment, $40 of prepaid expenses, recorded $636 of goodwill and recorded $560 of intangible assets related to customer relationships, a non-compete agreement and trade names with estimated useful lives ranging from three to five years.
The estimated fair value of $560 of acquired intangible assets is assigned as follows:
| |
Useful Life | Estimated Fair Value |
||||
|---|---|---|---|---|---|---|
Customer relationship intangible asset |
48 months | $ | 227 | |||
Non-compete agreement intangible asset |
36 months | 198 | ||||
Trade name intangible asset |
60 months | 135 | ||||
Total intangible assets |
$ | 560 | ||||
The Company engaged a third party valuation specialist to assist management in determining the fair value of the acquired assets of BMC. To value the customer relationship asset, an income approach was used, specifically a variation of the discounted cash-flow method. The projected net cash flows for
76
TechTarget, Inc.
Notes to Consolidated Financial Statements (Continued)
Years Ended December 31, 2009, 2008 and 2007
(In thousands, except share and per share data)
4. Acquisitions (Continued)
BMC were tax affected using an effective rate of 41% and then discounted using a discount rate of 25% to calculate the value of the customer relationship asset. Additionally, the present value of the sum of projected tax benefits was added to arrive at the total fair value of the customer relationship asset. To value the non-compete agreement a comparative business valuation method was used. Based on a non-compete term of 36 months, management projected net cash flows for the Company with and without the non-compete agreement in place. The present value of the sum of the difference between the net cash flows with and without the non-compete agreement in place was calculated, based on a discount rate of 25%. To value the trade name intangible asset a relief from royalty method was used to estimate the pre-tax royalty savings to the Company related to the BMC trade names. The projected net cash flows from the pre-tax royalty savings were tax affected using an effective rate of 41% and then discounted using a discount rate of 25% to calculate the value of the trade name intangible asset.
KnowledgeStorm, Inc.
On November 6, 2007 the Company acquired KnowledgeStorm, Inc. (KnowledgeStorm), which was a privately held company based in Alpharetta, Georgia, for $51,730 in cash and 359,820 shares of unregistered common stock of TechTarget valued at $6,000, as well as $230 in transaction costs. KnowledgeStorm is a leading online search resource providing vendor generated content addressing corporate IT professionals. KnowledgeStorm offers IT marketers products with a lead generation and branding focus to reach these corporate IT professionals throughout the purchasing decision process. The acquisition of KnowledgeStorm strengthens the Company's industry leadership position and increases its scale, customer penetration and product offerings for advertisers.
In connection with the acquisition, the Company recorded $45,101 of goodwill and $11,620 of other intangible assets related to customer relationships, technology, trade name, customer backlog and non-compete agreements with estimated useful lives ranging from 12 to 108 months. Of the goodwill recorded in conjunction with the acquisition, none is deductible for income tax purposes.
The following table summarizes the estimated fair values of the assets acquired and liabilities assumed at the date of acquisition.
| |
As of November 6, 2007 |
|||
|---|---|---|---|---|
Cash and cash equivalents |
$ | 2,813 | ||
Current assets |
1,328 | |||
Property and equipment, net |
782 | |||
Other assets |
39 | |||
Deferred tax assets |
1,797 | |||
Intangible assets |
11,620 | |||
Goodwill |
45,101 | |||
Total assets acquired |
63,480 | |||
Total liabilities assumed |
(5,520 | ) | ||
Net assets acquired |
$ | 57,960 | ||
77
TechTarget, Inc.
Notes to Consolidated Financial Statements (Continued)
Years Ended December 31, 2009, 2008 and 2007
(In thousands, except share and per share data)
4. Acquisitions (Continued)
Within approximately thirty days from the acquisition date, the Company's management completed its reorganization plan to consolidate KnowledgeStorm operations. Liabilities assumed in the acquisition include approximately $627 of involuntary termination benefits payable to terminated employees through May 2008, as well as approximately $111 of costs associated with exiting certain operating leases on office space leased by KnowledgeStorm under noncancelable leases that expire through December 2008.
The estimated fair value of $11,620 of acquired intangible assets is assigned as follows:
| |
Useful Life | Estimated Fair Value |
||||
|---|---|---|---|---|---|---|
Customer relationship intangible asset |
108 months | $ | 4,770 | |||
Member database intangible asset |
60 months | 4,060 | ||||
Trade name intangible asset |
84 months | 1,100 | ||||
Customer order backlog intangible asset |
12 months | 940 | ||||
SEO/SEM process intangible asset |
36 months | 690 | ||||
Non-compete agreement intangible asset |
12 months | 60 | ||||
Total intangible assets |
$ | 11,620 | ||||
The Company engaged a third party valuation specialist to assist management in determining the fair value of the acquired assets of KnowledgeStorm. To value the customer relationship and backlog intangible assets, an income approach was used, specifically a variation of the discounted cash-flow method. The projected net cash flows for KnowledgeStorm were tax affected using an effective rate of 41% and then discounted using a discount rate of 20.6%. Additionally, the present value of the sum of projected tax benefits was added to arrive at the total fair value of the customer relationship and backlog intangible assets. To value the member database intangible asset, a replacement cost methodology approach was used. The replacement cost of the member database was determined by applying the actual costs incurred to register a new member to the total number of registered members in the acquired database. Additionally, opportunity costs and the present value of the sum of projected tax benefits were added to arrive at the total fair value of the member database intangible asset. To value the trade name intangible asset a relief from royalty method was used to estimate the pre-tax royalty savings to the Company related to the KnowledgeStorm trade name. The projected net cash flows from the pre-tax royalty savings were tax affected using an effective rate of 41% and then discounted using a discount rate of 20.6% to calculate the value of the trade name intangible asset. To value the Search Engine Optimization (SEO)/ Search Engine Marketing (SEM) process intangible asset, a comparative business valuation method was used. Based on an expected life of three years, management projected net cash flows for the Company with and without the SEO/SEM process in place. The present value of the sum of the difference between the net cash flows with and without the SEO/SEM process in place was calculated using a discount rate of 20.6%. Additionally, the present value of the sum of projected tax benefits was added to arrive at the total fair value of the SEO/SEM process intangible asset.
78
TechTarget, Inc.
Notes to Consolidated Financial Statements (Continued)
Years Ended December 31, 2009, 2008 and 2007
(In thousands, except share and per share data)
4. Acquisitions (Continued)
The following unaudited pro forma results of operations for the year ended December 31, 2007 has been prepared as though the acquisition of KnowledgeStorm had occurred on January 1, 2006. This pro forma unaudited financial information is not indicative of the results of operations that may occur in the future.
| |
Year Ended December 31, |
||||
|---|---|---|---|---|---|
| |
2007 | ||||
| |
(unaudited) |
||||
Total revenues |
$ |
108,079 |
|||
Net income |
$ | 308 | |||
Net loss per common share: |
|||||
Basic and diluted |
$ | (0.13 | ) | ||
Results of operations for KnowledgeStorm have been included in the Company's results of operations since the acquisition date of November 6, 2007.
TechnologyGuide, Inc.
On April 26, 2007, the Company acquired substantially all of the assets of TechnologyGuide, Inc. (TechGuide), which was a privately-held company based in Cincinnati, OH, for $15,000 in cash, plus $15 in acquisition related transaction costs. TechGuide is a network of five online websites which includes; Notebookreview.com, Brighthand.com, TabletPCReview.com, DigitalCameraReview.com and SpotStop.com. The websites offer independent product reviews, price comparisons, and forum-based discussions for selected technology products. The acquisition provides the Company with opportunities for growth within the laptop/notebook PC and "smart phone" markets in which it did not have a material presence.
In connection with this acquisition, the Company recorded $7,035 of goodwill and $7,980 of intangible assets related to developed websites, customer relationships, and non-compete agreements with estimated useful lives ranging from 36 to 72 months.
The estimated fair value of $7,980 of acquired intangible assets is assigned as follows:
| |
Useful Life | Estimated Fair Value |
||||
|---|---|---|---|---|---|---|
Developed websites intangible asset |
72 months | $ | 5,400 | |||
Customer relationship intangible asset |
60 months | 1,790 | ||||
Non-compete agreements intangible asset |
36 months | 790 | ||||
Total intangible assets |
$ | 7,980 | ||||
The Company engaged a third party valuation specialist to assist management in determining the fair value of the acquired assets of TechGuide. To value the websites and customer relationship
79
TechTarget, Inc.
Notes to Consolidated Financial Statements (Continued)
Years Ended December 31, 2009, 2008 and 2007
(In thousands, except share and per share data)
4. Acquisitions (Continued)
intangible assets, an income approach was used, specifically a variation of the discounted cash-flow method. For the websites intangible asset, expenses and income taxes were deducted from estimated revenues attributable to the existing websites. For the customer relationship intangible asset, expenses and income taxes were deducted from estimated revenues attributable to the existing customers. The projected net cash flows for each were then tax affected using an effective rate of 41% and then discounted using a discount rate of 22.3% to determine the value of the intangible assets, respectively. Additionally, the present value of the sum of projected tax benefits was added to arrive at the total fair value of the intangible assets, respectively. To value the non-compete agreements a comparative business valuation method was used. Based on non-compete terms of 36 months, management projected net cash flows for the Company with and without the non-compete agreements in place. The present value of the sum of the difference between the net cash flows with and without the non-compete agreements in place was calculated, based on a discount rate of 22.3%.
Results of operations for TechGuide have been included in the Company's results of operations since the acquisition date of April 26, 2007.
Ajaxian.com
On February 27, 2007, the Company acquired substantially all of the assets of Ajaxian, Inc. (Ajaxian) for a purchase price of $1,013 in cash. Ajaxian is a provider of a website and two events dedicated to providing information and support for the community of developers for "Ajax" (Asynchronous JavaScript and XML), a web development technique for creating interactive web applications.
The Company did not acquire any tangible assets from Ajaxian. The following table summarizes the estimated fair value of the intangible assets acquired by the Company at the date of acquisition:
| |
Useful Life | Estimated Fair Value |
||||
|---|---|---|---|---|---|---|
Customer relationship intangible asset |
48 months | $ | 552 | |||
Non-compete agreement intangible asset |
36 months | 335 | ||||
Trade name intangible asset |
60 months | 126 | ||||
Total intangible assets |
$ | 1,013 | ||||
5. Restructuring Charges
In December 2008, the Company implemented an expense reduction program that included (i) a reduction in workforce, (ii) a reduction in certain office leases, (iii) the elimination of its two print publications, and (iv) a continuation of strict controls on discretionary spending. The Company implemented the cost reductions to lower its operating expenses in order to align its costs with the current business conditions with the goal of maintaining its profitability and investing as appropriate to gain market share. The Company's restructuring charge is comprised principally of employee severance and associated termination costs, costs associated with a reduction in certain office leases, contract
80
TechTarget, Inc.
Notes to Consolidated Financial Statements (Continued)
Years Ended December 31, 2009, 2008 and 2007
(In thousands, except share and per share data)
5. Restructuring Charges (Continued)
termination costs in connection with the elimination of its two print publications and write-offs of leasehold improvements associated with the exit of facilities. The Company had no restructuring charges or reserves in 2009 and 2007.
The activity in the Company's restructuring accrual for the years ended December 31, 2009 and 2008 is summarized as follows (in thousands):
| |
Restructuring Charge |
||||
|---|---|---|---|---|---|
Balance as of January 1, 2008 |
$ | — | |||
Employee severance pay and related costs |
886 | ||||
Non-cancelable lease, contract termination, and other charges |
559 | ||||
Write-offs of tenant improvements, furniture, and fixed assets |
49 | ||||
Restructuring charges |
1,494 | ||||
Cash paid related to employee severance and other costs |
(331 | ) | |||
Write-off of tenant improvements, furniture, and fixed assets |
(49 | ) | |||
Balance as of December 31, 2008 |
$ | 1,114 | |||
Cash paid related to employee severance and other costs |
(1,114 | ) | |||
Balance as of December 31, 2009 |
$ | — | |||
As of December 31, 2008, the Company's restructuring accrual balance of $1.1 million was included in the consolidated balance sheet in accrued expenses and other liabilities.
6. Cash, Cash Equivalents and Investments
Cash and cash equivalents consist of highly liquid investments with maturities of three months or less at date of purchase. Cash equivalents are carried at cost, which approximates their fair market value. Cash and cash equivalents consisted of the following:
| |
As of December 31, | ||||||
|---|---|---|---|---|---|---|---|
| |
2009 | 2008 | |||||
Cash |
$ | 14,613 | $ | 9,850 | |||
Money market funds |
6,271 | 14,280 | |||||
Total cash and cash equivalents |
$ | 20,884 | $ | 24,130 | |||
The Company's short and long-term investments are accounted for as available for sale securities. These investments are recorded at fair value with the related unrealized gains and losses included in accumulated other comprehensive income (loss), a component of stockholders' equity, net of tax. The unrealized gain, net of taxes, was $6 and $10 as of December 31, 2009 and 2008, respectively. Realized gains and losses on the sale of these investments are determined using the specific identification method. Realized gains totaled $17 in the year ended December 31, 2009. There were no realized gains or losses in 2008 and 2007.
81
TechTarget, Inc.
Notes to Consolidated Financial Statements (Continued)
Years Ended December 31, 2009, 2008 and 2007
(In thousands, except share and per share data)
6. Cash, Cash Equivalents and Investments (Continued)
Short and long-term investments consisted of the following:
| |
December 31, 2009 | |||||||||||||
|---|---|---|---|---|---|---|---|---|---|---|---|---|---|---|
| |
Cost | Gross Unrealized Gains |
Gross Unrealized Losses |
Estimated Fair Value |
||||||||||
Short and long-term investments: |
||||||||||||||
Government agency bonds |
$ | 8,168 | $ | — | $ | (9 | ) | 8,159 | ||||||
Municipal bonds |
53,495 | 42 | (23 | ) | 53,514 | |||||||||
Total short and long-term investments |
$ | 61,663 | $ | 42 | $ | (32 | ) | $ | 61,673 | |||||
| |
December 31, 2008 | |||||||||||||
|---|---|---|---|---|---|---|---|---|---|---|---|---|---|---|
| |
Cost | Gross Unrealized Gains |
Gross Unrealized Losses |
Estimated Fair Value |
||||||||||
Short and long-term investments: |
||||||||||||||
Municipal bonds |
$ | 45,419 | $ | 22 | $ | (3 | ) | $ | 45,438 | |||||
Total short and long-term investments |
$ | 45,419 | $ | 22 | $ | (3 | ) | $ | 45,438 | |||||
The Company had nineteen securities in an unrealized loss position at December 31, 2009. All of these securities have been in such a position for less than 12 months. The unrealized loss on these securities was $32 and the fair value was $27.4 million. As of December 31, 2009, the Company does not consider these investments to be other-than-temporarily impaired.
Municipal bonds have contractual maturity dates within eighteen months. All income generated from these investments is recorded as interest income.
7. Goodwill
The changes in the carrying amount of goodwill for the years ended December 31, 2009 and 2008 are as follows:
| |
As of December 31, | |||||||
|---|---|---|---|---|---|---|---|---|
| |
2009 | 2008 | ||||||
Balance as of beginning of period |
$ | 88,958 | $ | 88,326 | ||||
Goodwill acquired during the period |
— | 636 | ||||||
Adjustments |
— | (4 | ) | |||||
Balance as of end of period |
$ | 88,958 | $ | 88,958 | ||||
82
TechTarget, Inc.
Notes to Consolidated Financial Statements (Continued)
Years Ended December 31, 2009, 2008 and 2007
(In thousands, except share and per share data)
8. Intangible Assets
The following table summarizes the Company's intangible assets, net:
| |
|
As of December 31, 2009 | |||||||||||
|---|---|---|---|---|---|---|---|---|---|---|---|---|---|
| |
Estimated Useful Lives (Years) |
Gross Carrying Amount |
Accumulated Amortization |
Net | |||||||||
Customer, affiliate and advertiser relationships |
1-9 | $ | 11,508 | $ | (5,619 | ) | $ | 5,889 | |||||
Developed websites, technology and patents |
3-6 | 5,400 | (2,400 | ) | 3,000 | ||||||||
Trademark, trade name and domain name |
1-7 | 2,179 | (1,261 | ) | 918 | ||||||||
Proprietary user information database and Internet traffic |
3-5 | 4,750 | (2,257 | ) | 2,493 | ||||||||
Non-compete agreements |
1-3 | 1,323 | (1,095 | ) | 228 | ||||||||
Total intangible assets |
$ | 25,160 | $ | (12,632 | ) | $ | 12,528 | ||||||
| |
|
As of December 31, 2008 | |||||||||||
|---|---|---|---|---|---|---|---|---|---|---|---|---|---|
| |
Estimated Useful Lives (Years) |
Gross Carrying Amount |
Accumulated Amortization |
Net | |||||||||
Customer, affiliate and advertiser relationships |
1-9 | $ | 12,449 | $ | (4,641 | ) | $ | 7,808 | |||||
Developed websites, technology and patents |
3-6 | 5,400 | (1,500 | ) | 3,900 | ||||||||
Trademark, trade name and domain name |
1-7 | 2,179 | (912 | ) | 1,267 | ||||||||
Proprietary user information database and Internet traffic |
3-5 | 4,750 | (1,216 | ) | 3,534 | ||||||||
Non-compete agreements |
1-3 | 1,933 | (1,200 | ) | 733 | ||||||||
Total intangible assets |
$ | 26,711 | $ | (9,469 | ) | $ | 17,242 | ||||||
Intangible assets are amortized over their estimated useful lives, which range from one to nine years, using methods of amortization that are expected to reflect the estimated pattern of economic use. The remaining amortization expense will be recognized over a weighted-average period of approximately 2.5 years. Amortization expense was $4.7 million, $5.3 million and $4.7 million for the years ended December 31, 2009, 2008 and 2007, respectively.
The Company expects amortization expense of intangible assets to be as follows:
Years Ending December 31:
|
Amortization Expense |
|||
|---|---|---|---|---|
2010 |
$ | 4,202 | ||
2011 |
3,222 | |||
2012 |
2,462 | |||
2013 |
1,010 | |||
2014 |
661 | |||
Thereafter |
971 | |||
|
$ | 12,528 | ||
83
TechTarget, Inc.
Notes to Consolidated Financial Statements (Continued)
Years Ended December 31, 2009, 2008 and 2007
(In thousands, except share and per share data)
9. Bank Term Loan Payable
In August 2006, the Company entered into a credit agreement (the "Credit Agreement") with a commercial bank, which included a $10.0 million term loan (the "Term Loan") and a $20.0 million revolving credit facility (the "Revolving Credit Facility"). The Credit Agreement was amended in August 2007, in December 2008 and again in December 2009. The amendment in 2009 reduced the Revolving Credit Facility to $5.0 million.
The Revolving Credit Facility matures on August 30, 2011. Unless earlier payment is required by an event of default, all principal and unpaid interest will be due and payable on August 30, 2011. At the Company's option, the Revolving Credit Facility bears interest at either the Prime Rate less 1.00% or the LIBOR rate plus the applicable LIBOR margin. The applicable LIBOR margin is based on the ratio of total funded debt to EBITDA for the preceding four fiscal quarters. As of December 31, 2009, the applicable LIBOR margin was 1.25%.
The Company is also required to pay an unused line fee on the daily unused amount of its Revolving Credit Facility at a per annum rate based on the ratio of total funded debt to EBITDA for the preceding four fiscal quarters. As of December 31, 2009, unused availability under the Revolving Credit Facility totaled $5 million and the per annum unused line fee rate was 0.20%.
The Term Loan requires 39 consecutive monthly principal payments of $250, plus interest, beginning on September 30, 2006 through December 30, 2009. The Company paid the remaining balance on the Term Loan in December 2009.
In September 2006, the Company entered into an interest rate swap agreement with a commercial bank to mitigate the interest rate fluctuations on the Term Loan. With this interest rate swap agreement in place, the Company has fixed the annual interest rate at 6.98% for the Term Loan. The interest rate swap agreement terminated in December 2009. The Company deemed the interest rate swap agreement a cash flow hedge which qualified for special accounting using the shortcut method. Accordingly, changes in the fair value of the interest rate swap agreement were recorded in "accumulated other comprehensive loss" on the consolidated statements of redeemable convertible preferred stock and stockholders' equity (deficit). As of December 31, 2009 and 2008, the fair value of the cash flow hedge was $0 and $77, respectively, and is recorded in other liabilities. The interest rate swap agreement was terminated in December 2009.
Borrowings under the Credit Agreement are collateralized by a security interest in substantially all assets of the Company. Covenants governing the Credit Agreement require the maintenance of certain financial ratios. At December 31, 2009, the Company was in compliance with all financial covenants under the Credit Agreement. The Company was in violation of one loan covenant under the Credit Agreement. The Company failed to file timely quarterly interim financial statements with the SEC. The Company received a waiver from the bank agreeing to extend the delivery date of the September 30, 2009 financial statements to February 26, 2010 and compliance was satisfied when the Company filed the financial statements in February 2010.
84
TechTarget, Inc.
Notes to Consolidated Financial Statements (Continued)
Years Ended December 31, 2009, 2008 and 2007
(In thousands, except share and per share data)
10. Commitments and Contingencies
Operating Leases
The Company conducts its operations in leased office facilities under various noncancelable operating lease agreements that expire through March, 2020. In August 2009, the Company entered into an agreement to lease approximately 87,875 square feet of office space in Newton, Massachusetts. The lease commenced in February 2010 and has a term of 10 years. The Company is receiving certain rent concessions over the life of the lease.
Certain of the Company's operating leases include lease incentives and escalating payment amounts and are renewable for varying periods. The Company is recognizing the related rent expense on a straight-line basis over the term of the lease taking into account the lease incentives and escalating lease payments. Total rent expense under the Company's leases was approximately $3,189, $2,981 and $1,775 for the years ended December 31, 2009, 2008 and 2007, respectively.
Future minimum lease payments under noncancelable operating leases at December 31, 2009, net of minimum sublease rental payments of $0.3 million, are as follows:
Years Ending December 31:
|
Minimum Lease Payments |
|||
|---|---|---|---|---|
2010 |
1,329 | |||
2011 |
2,885 | |||
2012 |
3,413 | |||
2013 |
2,868 | |||
2014 |
2,890 | |||
Thereafter |
15,623 | |||
|
$ | 29,008 | ||
At December 31, 2009, the Company had an irrevocable standby letter of credit outstanding in the aggregate amount of $1.5 million. This letter of credit supports the lease the Company entered into in 2009 for its new corporate headquarters. This letter of credit extends annually thru February 28, 2020 unless notification of termination is received.
Litigation
From time to time and in the ordinary course of business, the Company may be subject to various claims, charges, and litigation. At December 31, 2009 and 2008, the Company did not have any pending claims, charges, or litigation that it expects would have a material adverse effect on its consolidated financial position, results of operations, or cash flows.
11. Stock-based Compensation
Stock Option Plans
In September 1999, the Company approved a stock option plan (the 1999 Plan) that provides for the issuance of up to 12,384,646 shares of common stock incentives. The 1999 Plan provides for the granting of incentive stock options (ISOs), nonqualified stock options (NSOs), and stock grants. These
85
TechTarget, Inc.
Notes to Consolidated Financial Statements (Continued)
Years Ended December 31, 2009, 2008 and 2007
(In thousands, except share and per share data)
11. Stock-based Compensation (Continued)
incentives may be offered to the Company's employees, officers, directors, consultants, and advisors, as defined. ISOs may be granted at no less than fair market value on the date of grant, as determined by the Company's Board of Directors (the Board) (no less than 110% of fair market value on the date of grant for 10% or greater stockholders), subject to limitations, as defined. Each option shall be exercisable at such times and subject to such terms as determined by the Board, generally four years, and shall expire within ten years of issuance.
In April 2007, the Board approved the 2007 Stock Option and Incentive Plan (the 2007 Plan), which was approved by the stockholders and became effective upon the consummation of the Company's IPO in May 2007. Effective upon the consummation of the IPO, no further awards will be made pursuant to the 1999 Plan, but any outstanding awards under the 1999 Plan will remain in effect and will continue to be subject to the terms of the 1999 Plan. The 2007 Plan allows the Company to grant ISOs, NSOs, stock appreciation rights, deferred stock awards, restricted stock and other awards. Under the 2007 Plan, stock options may not be granted at less than fair market value on the date of grant, and grants generally vest over a four year period. Stock options granted under the 2007 Plan expire no later than ten years after the grant date. The Company has reserved for issuance an aggregate of 2,911,667 shares of common stock under the 2007 Plan plus an additional annual increase to be added automatically on January 1 of each year, beginning on January 1, 2008, equal to the lesser of (a) 2% of the outstanding number of shares of common stock (on a fully-diluted basis) on the immediately preceding December 31 and (b) such lower number of shares as may be determined by the Company's compensation committee. The number of shares available for issuance under the 2007 Plan is subject to adjustment in the event of a stock split, stock dividend or other change in capitalization. Generally, shares that are forfeited or canceled from awards under the 2007 Plan also will be available for future awards. In addition, shares subject to stock options returned to the 1999 Plan, as a result of their expiration, cancellation or termination, are automatically made available for issuance under the 2007 Plan. As of December 31, 2009 a total of 319,129 shares were available for grant under the 2007 Plan.
Stock Options
The Company uses the Black-Scholes option pricing model to calculate the grant-date fair value of an option award. The Company calculated the fair values of the options granted using the following assumptions:
| |
Years Ended December 31, | |||||
|---|---|---|---|---|---|---|
| |
2009 | 2008 | 2007 | |||
Expected volatility |
75%-79% | 41%-71% | 47%-50% | |||
Expected term |
6.25 years | 6.25 years | 6.25 years | |||
Risk-free interest rate |
2.21%-2.89% | 1.71%-3.15% | 3.62%-5.04% | |||
Expected dividend yield |
—% | —% | —% | |||
Weighted-average grant date fair value per share |
$4.06 | $3.28 | $7.35 | |||
As there was no public market for the Company's common stock prior to the Company's IPO in May 2007, and limited historical information on the volatility of its common stock since the date of the Company's IPO, the Company determined the volatility for options granted in 2009, 2008 and 2007
86
TechTarget, Inc.
Notes to Consolidated Financial Statements (Continued)
Years Ended December 31, 2009, 2008 and 2007
(In thousands, except share and per share data)
11. Stock-based Compensation (Continued)
based on an analysis of the Company's stock and reported data for a peer group of companies that issued options with substantially similar terms. The expected volatility of options granted has been determined using an average of the historical volatility of the Company's stock and the peer group of companies for a period equal to the expected life of the option. The expected life of options has been determined utilizing the "simplified" method. The risk-free interest rate is based on a zero coupon United States treasury instrument whose term is consistent with the expected life of the stock options. The Company has not paid and does not anticipate paying cash dividends on its shares of common stock; therefore, the expected dividend yield is assumed to be zero. The Company applied an estimated annual forfeiture rate based on its historical forfeiture experience of 2.00%, 2.00%, and 1.00% in determining the expense recorded in 2009, 2008, and 2007, respectively.
A summary of the stock option activity under the Company's stock option plan for the year ended December 31, 2009 is presented below:
| |
Options Outstanding |
Weighted-Average Exercise Price Per Share |
Weighted-Average Remaining Contractual Term in Years |
Aggregate Intrinsic Value |
||||||||||
|---|---|---|---|---|---|---|---|---|---|---|---|---|---|---|
Options outstanding at December 31, 2008 |
7,765,578 | $ | 6.30 | |||||||||||
Options granted |
755,000 | 5.82 | ||||||||||||
Options exercised |
(304,349 | ) | 0.44 | |||||||||||
Options forfeited |
(131,757 | ) | 8.93 | |||||||||||
Options canceled |
(167,593 | ) | 7.66 | |||||||||||
Options outstanding at December 31, 2009 |
7,916,879 | $ | 6.40 | 6.4 | $ | 6,236 | ||||||||
Options exercisable at December 31, 2009 |
5,441,557 | $ | 6.14 | 5.4 | $ | 5,611 | ||||||||
Options vested or expected to vest at December 31, 2009(1) |
7,791,167 | $ | 6.40 | 6.4 | $ | 6,198 | ||||||||
- (1)
- In addition to the vested options, the Company expects a portion of the unvested options to vest at some point in the future. Options expected to vest is calculated by applying an estimated forfeiture rate to the unvested options.
During the years ended December 31, 2009, 2008 and 2007, the total intrinsic value of options exercised (i.e. the difference between the market price at exercise and the price paid by the employee to exercise the options) was $1,558, $3,677, and $13,760, respectively, and the total amount of cash received by the Company from exercise of these options was $133, $2,203, and $2,472, respectively. The total grant-date fair value of stock options granted after the adoption of SFAS No. 123(R) on January 1, 2006 that vested during the years ended December 31, 2009, 2008 and 2007 was $6,146, $4,189 and $6,223, respectively.
Unrecognized stock-based compensation expense of non-vested stock options of $11.2 million is expected to be recognized using the straight line method over a weighted-average period of 1.3 years.
87
TechTarget, Inc.
Notes to Consolidated Financial Statements (Continued)
Years Ended December 31, 2009, 2008 and 2007
(In thousands, except share and per share data)
11. Stock-based Compensation (Continued)
Restricted Stock Awards
Restricted stock awards are valued at the market price of a share of the Company's common stock on the date of the grant. A summary of the restricted stock award activity under the Company's stock option plan for the year ended December 31, 2009 is presented below:
| |
Shares | Weighted-Average Grant Date Fair Value Per Share |
Aggregate Intrinsic Value |
||||||||
|---|---|---|---|---|---|---|---|---|---|---|---|
Nonvested outstanding at December 31, 2008 |
464,476 | $ | 14.48 | ||||||||
Granted |
1,962,954 | 4.03 | |||||||||
Vested |
(191,905 | ) | 12.76 | ||||||||
Forfeited |
(18,625 | ) | 14.29 | ||||||||
Nonvested outstanding at December 31, 2009 |
2,216,900 | $ | 5.37 | $ | 12,481 | ||||||
Nonvested restricted stock awards outstanding at December 31, 2009 includes 1,925,000 awards with vesting schedules contingent upon the Company achieving a performance goal. The Company achieved the performance goal during the year ended December 31, 2009 and the restricted stock awards will vest over four years.
The total grant-date fair value of restricted stock awards that vested during the years ended December 31, 2009 and 2008 was $2,449 and $2,510, respectively. None of the restricted stock awards vested during the year ended December 31, 2007.
Unrecognized stock-based compensation expense of non-vested restricted stock awards of $7.4 million is expected to be recognized over a weighted-average period of 1.4 years.
12. Stockholders' Equity (Deficit)
Shares Authorized
In April 2007, the Board of Directors approved an amendment and restatement of the Company's Certificate of Incorporation to increase the authorized number of shares of common stock from 44,344,656 to 100,000,000, to authorize 5,000,000 shares of undesignated preferred stock, par value $0.001 per share, and to eliminate all reference to the designated Series Preferred Stock.
Stock Offering
In May 2007, the Company completed its initial public offering (IPO) of 8,855,000 shares of its common stock, of which 7,072,097 shares were sold by the Company and 1,782,903 shares were sold by certain of the Company's existing shareholders at a price to the public of $13.00 per share. The Company raised a total of $91,937 in gross proceeds from the offering, or $83,161 in net proceeds after deducting underwriting discounts and commissions of $6,436 and other offering costs of approximately $2,340. Upon the closing of the offering, all shares of the Company's redeemable convertible preferred stock automatically converted into 24,372,953 shares of common stock.
88
TechTarget, Inc.
Notes to Consolidated Financial Statements (Continued)
Years Ended December 31, 2009, 2008 and 2007
(In thousands, except share and per share data)
12. Stockholders' Equity (Deficit) (Continued)
Reverse Stock Split
On April 26, 2007, the Company's board of directors approved a 1-for-4 reverse stock split of the Company's outstanding common stock. The reverse stock split became effective immediately and all common share and per share amounts in the accompanying consolidated financial statements and notes to the consolidated financial statements have been retroactively adjusted for all periods presented to give effect to the reverse stock split.
Warrants
In connection with the Company's original Bank Term Loan agreement, in July 2001 the Company issued to the lender for the Bank Term Loan (the "Lender") a fully exercisable warrant to purchase up to 74,074 shares of series A redeemable convertible preferred stock at $0.5411 per share. In connection with an amendment to the Bank Term Loan agreement in April 2002 the Company issued to the Lender an additional fully exercisable warrant to purchase 55,443 shares of series A redeemable convertible preferred stock at a price of $0.5411 per share. Upon the closing of the Company's IPO in May 2007, these warrants outstanding converted into warrants to purchase an aggregate of 32,378 shares of the Company's common stock at an exercise price of $2.1644 per share. In 2007, the Lender exercised their warrants to purchase 32,378 shares of common stock using the conversion rights in the warrants. As result of the exercise using the conversion rights, the Company issued 26,740 shares of common stock to the Lender and cancelled the 5,638 shares received in lieu of payment of the exercise price.
In connection with an acquisition in May 2000, the Company issued to the seller a warrant to purchase 40,625 shares of common stock at a price of $2.36 per share. The warrant is exercisable immediately and expires on May 10, 2010. In 2007, the seller exercised warrants to purchase 30,981 shares of common stock using the conversion rights in the warrants. As result of the exercise using the conversion rights, the Company issued 26,024 shares of common stock to the seller and cancelled the 4,957 shares received in lieu of payment of the exercise price. In 2008, the seller exercised additional warrants to purchase 8,375 shares of common stock using the conversion rights in the warrants. As result of the exercise using the conversion rights, the Company issued 6,886 shares of common stock to the seller and cancelled the 1,489 shares received in lieu of payment of the exercise price.
At December 31, 2009 and 2008, there were 1,269 shares of the Company's common stock reserved for the exercise of all warrants.
Reserved Common Stock
As of December 31, 2009, the Company has reserved common stock for the following:
| |
Number of Shares |
|||
|---|---|---|---|---|
Options outstanding and available for grant under stock option plans |
10,588,140 | |||
Warrants |
1,269 | |||
|
10,589,409 | |||
89
TechTarget, Inc.
Notes to Consolidated Financial Statements (Continued)
Years Ended December 31, 2009, 2008 and 2007
(In thousands, except share and per share data)
13. Income Taxes
As of December 31, 2009, the Company had U.S. federal and state net operating loss (NOL) carryforwards of approximately $7.0 million and $17.3 million, respectively, which may be used to offset future taxable income. The NOL carryforwards expire through 2027, and are subject to review and possible adjustment by the Internal Revenue Service. The Internal Revenue Code contains provisions that limit the NOL and tax credit carryforwards available to be used in any given year in the event of certain changes in the ownership interests of significant stockholders. The federal NOL carryforwards of $7.0 million available at December 31, 2009 were acquired from KnowledgeStorm and are subject to limitations on their use in future years.
The income tax provision for the years ended December 31, 2009, 2008 and 2007 consisted of the following:
| |
Years Ended December 31, | ||||||||||
|---|---|---|---|---|---|---|---|---|---|---|---|
| |
2009 | 2008 | 2007 | ||||||||
Current: |
|||||||||||
Federal |
$ | 465 | $ | 88 | $ | 5,321 | |||||
State |
1,223 | 950 | 1,646 | ||||||||
Total current |
1,688 | 1,038 | 6,967 | ||||||||
Deferred: |
|||||||||||
Federal |
(1,314 | ) | 1,782 | (1,398 | ) | ||||||
State |
(598 | ) | (36 | ) | (317 | ) | |||||
Total deferred |
(1,912 | ) | 1,746 | (1,715 | ) | ||||||
|
$ | (224 | ) | $ | 2,784 | $ | 5,252 | ||||
The income tax provision for the years ended December 31, 2009, 2008 and 2007 differs from the amounts computed by applying the statutory federal income tax rate to the consolidated income (loss) before income taxes as follows:
| |
Years Ended December 31, | ||||||||||
|---|---|---|---|---|---|---|---|---|---|---|---|
| |
2009 | 2008 | 2007 | ||||||||
Provision computed at statutory rate |
$ | (1,869 | ) | $ | 1,592 | $ | 4,129 | ||||
Increase (reduction) resulting from: |
|||||||||||
Tax exempt interest income |
(133 | ) | (440 | ) | (712 | ) | |||||
Stock-based compensation |
1,426 | 1,012 | 792 | ||||||||
Other nondeductible expenses |
136 | 137 | 208 | ||||||||
State income tax provision |
197 | 581 | 752 | ||||||||
Change in deferred tax asset valuation reserve |
28 | — | — | ||||||||
Other |
(9 | ) | (98 | ) | 83 | ||||||
Provision for income taxes |
$ | (224 | ) | $ | 2,784 | $ | 5,252 | ||||
90
TechTarget, Inc.
Notes to Consolidated Financial Statements (Continued)
Years Ended December 31, 2009, 2008 and 2007
(In thousands, except share and per share data)
13. Income Taxes (Continued)
Significant components of the Company's net deferred tax assets and liabilities are as follows:
| |
As of December 31, | |||||||
|---|---|---|---|---|---|---|---|---|
| |
2009 | 2008 | ||||||
Deferred tax assets: |
||||||||
Net operating loss carryforwards |
$ | 2,797 | $ | 4,904 | ||||
Deferred revenue |
241 | 239 | ||||||
Accruals and allowances |
432 | 412 | ||||||
Depreciation |
— | 135 | ||||||
Stock-based compensation |
5,904 | 3,272 | ||||||
Deferred rent expense |
191 | 97 | ||||||
Gross deferred tax assets |
9,565 | 9,059 | ||||||
Less valuation allowance |
(1,020 | ) | (940 | ) | ||||
Total deferred tax assets |
8,545 | 8,119 | ||||||
Deferred tax liabilities: |
||||||||
Intangible asset amortization |
(873 | ) | (1,791 | ) | ||||
Depreciation |
(91 | ) | — | |||||
Total deferred tax liabilities |
(964 | ) | (1,791 | ) | ||||
Net deferred tax assets |
$ | 7,581 | $ | 6,328 | ||||
As reported: |
||||||||
Current deferred tax assets |
$ | 2,399 | $ | 2,959 | ||||
Non-current deferred tax assets |
5,182 | 3,369 | ||||||
Total deferred tax assets |
$ | 7,581 | $ | 6,328 | ||||
In evaluating the ability to realize the net deferred tax asset, the Company considers all available evidence, both positive and negative, including past operating results, the existence of cumulative losses in the most recent fiscal years, tax planning strategies that are prudent, and feasible and forecasts of future taxable income. In considering sources of future taxable income, the Company makes certain assumptions and judgments that are based on the plans and estimates that are used to manage the underlying business of the Company. Changes in the Company's assumptions and estimates may materially impact income tax expense for the period. The valuation allowance of $1.0 million and $0.9 million at December 31, 2009 and 2008, respectively, relates to state deferred tax assets acquired from KnowledgeStorm that the Company determined were not likely to be realized based on projections of future taxable income in Georgia. To the extent realization of the state deferred tax assets becomes probable, recognition of these acquired tax benefits would reduce income tax expense.
The Company may from time to time be assessed interest or penalties by major tax jurisdictions. The Company recognizes interest and penalties related to uncertain tax positions in income tax expense. The Company recognized interest and penalties totaling $5 and $17 in 2009 and 2008, respectively. The Company did not recognize any interest and penalties in 2007.
91
TechTarget, Inc.
Notes to Consolidated Financial Statements (Continued)
Years Ended December 31, 2009, 2008 and 2007
(In thousands, except share and per share data)
13. Income Taxes (Continued)
Tax years 2006 through 2009 are subject to examination by the federal and state taxing authorities. The Internal Revenue Service completed an audit of our 2006 tax return without identifying any material adjustments. There are no other income tax examinations currently in process.
14. Segment Information
The Company views its operations and manages its business as one operating segment based on factors such as how the Company manages its operations and how its chief operating decision making group, which consists of the Company's chief executive officer, president and executive vice president, reviews results and makes decisions on how to allocate resources and assess performance.
Geographic Data
Net sales to unaffiliated customers by geographic area were as follows:
| |
Years Ended December 31, | ||||||||||
|---|---|---|---|---|---|---|---|---|---|---|---|
| |
2009 | 2008 | 2007 | ||||||||
United States and Canada |
$ | 83,232 | $ | 101,401 | $ | 90,216 | |||||
International |
3,264 | 3,143 | 2,034 | ||||||||
Total |
$ | 86,497 | $ | 104,544 | $ | 92,250 | |||||
15. 401(k) Plan
The Company maintains a 401(k) retirement savings plan (the Plan) whereby employees may elect to defer a portion of their salary and contribute the deferred portion to the Plan. The Company contributes an amount equal to 50% of the employee's contribution to the Plan, up to an annual limit of two thousand dollars. The Company contributed $0.7 million, $0.8 million and $0.6 million to the Plan for the years ended December 31, 2009, 2008 and 2007, respectively. Employee contributions and the Company's matching contributions are invested in one or more collective investment funds at the participant's direction. The Company's matching contributions vest 25% annually and are 100% vested after four consecutive years of service.
92
TechTarget, Inc.
Notes to Consolidated Financial Statements (Continued)
Years Ended December 31, 2009, 2008 and 2007
(In thousands, except share and per share data)
16. Quarterly Financial Data (unaudited)
| |
For the Three Months Ended | |||||||||||||||||||||||||
|---|---|---|---|---|---|---|---|---|---|---|---|---|---|---|---|---|---|---|---|---|---|---|---|---|---|---|
| |
2009 | 2008 | ||||||||||||||||||||||||
| |
Mar. 31 | Jun. 30 | Sep. 30 | Dec. 31 | Mar. 31 | Jun. 30 | Sep. 30 | Dec. 31 | ||||||||||||||||||
Total revenues |
$ | 18,472 | $ | 21,737 | $ | 23,056 | $ | 23,232 | $ | 23,263 | $ | 27,615 | $ | 26,996 | $ | 26,670 | ||||||||||
Total cost of revenues |
5,961 | 6,231 | 6,530 | 6,256 | 7,542 | 9,036 | 8,370 | 8,143 | ||||||||||||||||||
Total gross profit |
12,511 | 15,506 | 16,526 | 16,976 | 15,721 | 18,579 | 18,626 | 18,527 | ||||||||||||||||||
Total operating expenses |
15,267 | 15,960 | 18,082 | 17,817 | 17,205 | 17,147 | 16,449 | 17,544 | ||||||||||||||||||
Operating (loss) income |
(2,756 | ) | (454 | ) | (1,556 | ) | (841 | ) | (1,484 | ) | 1,432 | 2,177 | 983 | |||||||||||||
Net (loss) income |
$ | (2,308 | ) | $ | (543 | ) | $ | (1,438 | ) | $ | (827 | ) | $ | (436 | ) | $ | 1,052 | $ | 707 | $ | 441 | |||||
Net (loss) income per common share: |
||||||||||||||||||||||||||
Basic |
$ | (0.06 | ) | $ | (0.01 | ) | $ | (0.03 | ) | $ | (0.02 | ) | $ | (0.01 | ) | $ | 0.03 | $ | 0.02 | $ | 0.01 | |||||
Diluted |
$ | (0.06 | ) | $ | (0.01 | ) | $ | (0.03 | ) | $ | (0.02 | ) | $ | (0.01 | ) | $ | 0.02 | $ | 0.02 | $ | 0.01 | |||||
Included in the first quarter of 2009 was the correction of an error in the amount of $284 related to interest income which should have been recorded in the fourth quarter of 2008 (See note 2).
Included in the third quarter of 2009 was the entry to correct the customer credit errors (See Note 2) which increased accounts payable by $967 and decreased income before provision for income taxes by $967. The aggregate net adjustment accumulated over several years and includes $57 from 2004 to 2006, $362 from 2007, $561 from 2008 and ($13) from 2009.
Included in the third quarter of 2009 was the correction of an error totaling $1.1 million related to stock-based compensation expense that should have been recorded in the first and second quarters of 2009. The additional stock-based compensation expense relates to 1,925,000 restricted stock awards granted during the first quarter of 2009. The vesting for the restricted stock awards is contingent upon the Company achieving an annual financial performance goal. The stock-based compensation expense related to the restricted stock awards was initially recognized on a straight-line basis over the vesting period but should have been recognized using the accelerated attribution method.
Included in the fourth quarter of 2009 was the correction of an error totaling $291 related to an exit charge that should have been recorded in the second quarter of 2009. The exit charge relates to office space that the Company exited in June 2009 but is obligated under a noncancelable lease agreement through November 2010.
The Company assessed the materiality of the errors noted above, both quantitatively and qualitatively, and concluded that the adjustments are not material to the prior annual financial statements or to the interim financial statements for 2009. As a result, the Company recorded the correction of the errors in the quarters in which they were realized. In addition, management noted these errors in their assessment of internal controls (see Item 9A)
Included in the fourth quarter of 2009 are professional fees related to the investigation of $1.2 million (See note 2).
93
TechTarget, Inc.
Notes to Consolidated Financial Statements (Continued)
Years Ended December 31, 2009, 2008 and 2007
(In thousands, except share and per share data)
17. Subsequent Events
On March 8, 2010, the Company acquired certain assets of ebizQ.net™ for $0.5 million in cash plus a future earn out potential. ebizQ.net is a leading website for business and information technology (IT) decision makers focused on Business Process Management (BPM) and Service-Oriented Architecture (SOA). ebizQ.net is an online community with more than 100,000 members that provides original editorial and independent content from leading industry analysts and experts via blogs, webinars, podcasts, white papers, and virtual events. The addition of ebizQ.net to the TechTarget network of technology websites complements the Company's existing web properties, providing a one-stop shop for IT and Line of Business professionals researching new products and technologies around these disciplines and marketers trying to reach them.
94
Item 9. Changes in and Disagreements with Accountants on Accounting and Financial Disclosure
Item 9A. Controls and Procedures
Disclosure Controls and Procedures
Our management, with the participation of our chief executive officer and chief financial officer, evaluated the effectiveness of our disclosure controls and procedures as of December 31, 2009. The term "disclosure controls and procedures," as defined in Rules 13a-15(e) and 15d-15(e) promulgated under the Securities Exchange Act, means controls and other procedures of a company that are designed to ensure that information required to be disclosed by a company in the reports that it files or submits under the Securities Exchange Act is recorded, processed, summarized and reported, within the time periods specified in the SEC's rules and forms. Disclosure controls and procedures include, without limitation, controls and procedures designed to ensure that information required to be disclosed by a company in the reports that it files or submits under the Securities Exchange Act is accumulated and communicated to the company's management, including its principal executive and principal financial officers, as appropriate, to allow timely decisions regarding required disclosure. Management recognizes that any controls and procedures, no matter how well designed and operated, can provide only reasonable assurance of achieving their objectives and management necessarily applies its judgment in evaluating the cost-benefit relationship of possible controls and procedures. Based on the evaluation of our disclosure controls and procedures as of December 31, 2009, and due to the material weaknesses in our internal control over financial reporting described in our accompanying Management's Report on Internal Control over Financial Reporting below, our chief executive officer and chief financial officer concluded that, as of such date, our disclosure controls and procedures were not effective at the reasonable assurance level. As further discussed below under "Remediation Plans", management is implementing measures that we believe will address these deficiencies in our controls and procedures.
Management's Report on Internal Control over Financial Reporting
Our management is responsible for establishing and maintaining adequate internal control over financial reporting for our company. Internal control over financial reporting is defined in Rule 13a-15(f) and 15d-15(f) promulgated under the Securities Exchange Act, as a process designed by, or under the supervision of, a company's principal executive and principal financial officers and effected by the company's board of directors, management and other personnel, to provide reasonable assurance regarding the reliability of financial reporting and the preparation of financial statements for external purposes in accordance with generally accepted accounting principles. Our internal control over financial reporting includes those policies and procedures that:
- •
- pertain to the maintenance of records that, in reasonable detail, accurately and fairly reflect the transactions and
dispositions of the assets of the company;
- •
- provide reasonable assurance that transactions are recorded as necessary to permit preparation of financial statements in
accordance with generally accepted accounting principles, and that receipts and expenditures of the company are being made only in accordance with authorizations of management and directors of the
company; and
- •
- provide reasonable assurance regarding prevention or timely detection of unauthorized acquisition, use or disposition of the company's assets that could have a material effect on the financial statements.
Because of its inherent limitations, internal control over financial reporting may not prevent or detect misstatements. Also, projections of any evaluation of effectiveness to future periods are subject
95
to the risk that controls may become inadequate because of changes in conditions, or that the degree of compliance with the policies or procedures may deteriorate.
Our management, including our chief executive officer and chief financial officer, assessed the effectiveness of our internal controls over financial reporting as of December 31, 2009. In connection with this assessment, we identified the following material weaknesses in internal control over financial reporting as of December 31, 2009. A material weakness is a deficiency, or a combination of deficiencies, in internal control over financial reporting such that there is a reasonable possibility that a material misstatement of the annual or interim financial statements will not be prevented or detected on a timely basis. In making this assessment, our management used the criteria set forth by the Committee of Sponsoring Organizations of the Treadway Commission in Internal Control—Integrated Framework. Because of the material weaknesses described below, management believes that, as of December 31, 2009, our internal control over financial reporting was not effective based on this criteria.
The independent registered public accounting firm, Ernst & Young LLP, has audited our consolidated financial statements and has issued an attestation report on our internal controls over financial reporting as of December 31, 2009 which is included herein.
Accounting for Certain Complex transactions involving revenue and stock-based compensation
Online Service Revenue Transactions. As a result of a review of our business processes pertaining to its online service revenue offerings and the related application of accounting policies and procedures to these business processes, management identified material weaknesses in internal control over financial reporting related to the misapplication of generally accepted accounting principles on revenue arrangements involving certain online service offerings, as well as our assessment of verifiable objective evidence of fair value for elements included in multiple element advertising campaigns. This misapplication of generally accepted accounting principles led to the restatement of previously issued financial statements and other financial information during 2009.
Performance Based Stock Awards. We corrected an error totaling $1,061,000 during the third quarter of 2009 related to stock-based compensation expense that should have been recorded in the first and second quarters of 2009. The additional stock-based compensation expense relates to 1,925,000 restricted stock awards granted during the first quarter of 2009. The vesting for the restricted stock awards is contingent upon us achieving an annual financial performance goal. The stock-based compensation expense related to the restricted stock awards was initially recognized on a straight-line basis over the vesting period but should have been recognized using the accelerated attribution method.
Accounting for Aging Customer Credits and Certain Unallocated Accruals.
As a result of an investigation conducted by our Audit Committee from November 2009 to January 2010, management identified material weaknesses in internal control over financial reporting related to the misapplication of generally accepted accounting principles to customer credits that were improperly eliminated as liabilities. This misapplication of generally accepted accounting principles led us to record a net adjustment which increased accounts payable by $967,000 and decreased income before provision for income taxes by $967,000 during the quarter ended September 30, 2009.
Management identified the following material weaknesses surrounding our internal controls over financial reporting:
- 1.
- Inadequate and ineffective controls over the accounting for certain complex transactions.
We did not have effective design or operational controls over the accounting for certain online service revenue transactions, specifically; our ability to apply generally accepted accounting principles as they relate to the recognition of revenue on transactions that include duration-based services and
96
multiple element advertising campaigns. This material weakness resulted in the misstatement of revenue for certain service offerings and multiple element campaigns, which required previously reported consolidated financial statements to be restated. We also did not have effective design on operational controls over the accounting for stock based compensation arrangements in accordance with generally accepted accounting principles which resulted in adjustments being recorded in the quarter ended September 30, 2009.
- 2.
- Inadequate and ineffective controls over adequacy of staffing of accounting group.
Our controls related to ensuring the adequacy of staffing of our accounting and finance department were inadequate and ineffective. This material weakness resulted in the misstatement of revenue for certain service offerings and multiple element campaigns, which required previously reported consolidated financial statements to be restated. This material weakness also resulted in our errors in accounting for stock based compensation, aging customer credits and certain unallocated accruals which resulted in adjustments being recorded in the quarter ended September 30, 2009.
- 3.
- Insufficient and ineffective review and supervision by management of certain accounting policies and procedures.
Management's monitoring and review controls over certain accounting policies and procedures as well as the business process controls surrounding certain complex online service revenue transactions were inadequate and ineffective. Management's oversight and related detective controls to ensure timely and proper identification and correction of errors for arrangements involving certain complex online service revenue transactions were inadequate and ineffective. This material weakness resulted in the misstatement of revenue for certain service offerings and multiple element campaigns, which required previously reported consolidated financial statements to be restated. This material weakness also resulted in our errors in accounting for stock based compensation, aging customer credits and certain unallocated accruals which resulted in adjustments being recorded in the quarter ended September 30, 2009.
- 4.
- Inadequate and ineffective accounting and reporting system for processing and reporting of certain complex service revenue transactions.
Our current accounting and financial reporting system and related internal controls are inadequate to carry out the volume and level of complexities associated with our online service revenue transactions. This material weakness resulted in the misstatement of revenue for certain service offerings and multiple element campaigns, which required previously reported consolidated financial statements to be restated.
- 5.
- Inadequate and ineffective controls over the use of debit memorandums to reclassify aged customer credits from the accounts receivable subsidiary ledger to an unallocated general accrual account.
We did not have effective design or operational controls to prevent the reclassification of customer liabilities from the accounts receivable subsidiary ledger to an unallocated general accrual account. This material weakness resulted in the misstatement of customer liabilities, which required an adjustment in the quarter ended September 30, 2009.
- 6.
- Inadequate education, training, and awareness of the process for reporting concerns with regard to accounting practices to finance management, management and/or the Audit Committee.
We did not have effective employee education and training to ensure communication of any concerns related to accounting practices are brought to the appropriate personnel or governing body on a timely manner.
97
Changes in Internal Control over Financial Reporting
Set below are changes in internal control over financial reporting (as defined in Rules 13a-15(f) and 15d-15(f) under the Securities Exchange Act) which occurred during the quarter ended September 30, 2009 related to accounting for certain complex service revenue transactions that has materially affected, or is reasonably likely to materially affect, our internal control over financial reporting.
- •
- Communicated revised revenue recognition policies and procedures to appropriate accounting staff, and trained them on
their usage and application.
- •
- Ensured that financial management is actively involved in oversight and monitoring of the recording and reporting of complex service revenue recognition transactions.
Remediation Plans
Management has identified the following measures to strengthen our internal control over financial reporting and to address the material weaknesses described above. We began implementing certain of these measures prior to the filing of this Form 10-K but changes made to our internal controls have not yet been in place for a sufficient time to have had a significant effect. Management expects to continue to develop remediation plans and implement additional changes to our internal control over financial reporting during 2010, described in detail hereafter. We believe that the actions taken to date, as well as our planned future actions, will adequately address the material weaknesses.
- 1.
- In order to improve controls over the accounting for certain complex transactions, we have initiated and intend to continue
to:
- •
- Assess the expertise of our staff responsible for recording complex transactions and address any identified deficiencies
in order to enhance and augment the depth of knowledge of our staff and reduce the risk of future accounting errors and financial statement misstatements.
- •
- Utilize specialized third party consultants to assist us in monitoring and ensuring the propriety of our revenue
recognition policies, procedures, and activities on a quarterly basis.
- •
- Communicate revised accounting policies and procedures to appropriate accounting staff, and train them on their usage and
application.
- •
- Ensure that finance management is heavily involved in oversight and monitoring of the recording and reporting of complex
service revenue recognition transactions during current and future reporting periods.
- •
- Review the controls over revenue recognition to ensure procedures exist to properly account for any changes in operations.
- 2.
- In order to improve controls over ensuring the adequacy of staffing of the accounting group, we have initiated and intend to continue
to:
- •
- Assess the depth and expertise of our staff responsible for complex transactions and revenue recognition and address any
identified deficiencies.
- •
- Work with our Human Resources department in aggressively identifying and recruiting future capable technical accounting
staff candidates. We are currently recruiting for the positions of a Director of Sarbanes Oxley and a Director of Financial Reporting. We expect to hire these positions in 2010.
- •
- Utilize specialized third party consultants to assist us in monitoring and ensuring the propriety of our revenue recognition policies, procedures, and activities on a quarterly basis.
98
- •
- Provide training to address relevant technical accounting matters including updating the appropriate personnel on recent
accounting pronouncements and other relevant accounting literature.
- 3.
- In order to improve controls to ensure sufficient and effective review and supervision by management of certain accounting policies
and procedures, we have initiated and intend to continue to:
- •
- Ensure that financial management is routinely reviewing and monitoring the application of and any changes to the
accounting policies and procedures underlying complex transactions during future reporting periods.
- •
- Ensure the proper evidence of this review is consistently documented during future reporting periods.
- •
- Ensure that financial management is heavily involved in oversight and monitoring of the recording and reporting of complex
transactions during future reporting periods.
- •
- Utilize specialized third party consultants to assist us in monitoring and ensuring the propriety of our revenue
recognition policies, procedures, and activities on a quarterly basis.
- •
- Consider implementation of additional automation, trending analyses, and management reporting to highlight potential
future issues surrounding complex transactions.
- •
- Implement a process, either formal or informal, whereby senior finance personnel are informed of all significant judgments
made during the close process.
- 4.
- In order to ensure the Company's accounting and reporting systems are adequate to carry out the level and complexities associated
with our service revenue transactions, we have initiated and intend to continue to:
- •
- We have purchased and intend to implement in Q1 2010 a software application which will assist in ensuring that the
Company's revenue accounting and reporting systems adequately address the complexities associated with our service revenue transactions.
- 5.
- In order to improve controls over the use of debit memorandum to reclassify aged customer credits from the accounts receivable
subsidiary ledger to the general accrual account we have initiated and intend to continue to:
- •
- Establish clearly defined policies and procedures relating to the disposition of customer credits.
- •
- Establish a policy whereby we disburse payment to customers or apply credits to customer invoices if an aged customer
credit is not used by the customer within a reasonable time after the credit has been issued to the customer's account.
- •
- Establish clearly defined policies and procedures related to the general accrual account to insure account activity is
proper, the liability fairly states incurred but not reported liabilities and the period end reconciliation is adequately reviewed by the appropriate finance personnel.
- 6.
- In order to improve education, training, and awareness of the process for reporting concerns with regard to accounting practices to
finance management, management and/or the Audit Committee, we have initiated and intend to continue to:
- •
- Provide additional training and education to all employees of the reporting processes and protocols for communicating any concerns relating to accounting practices within the Company. The training will emphasize the confidential nature of the process, as well as the importance of timely reporting concerns to finance management, management and the Audit Committee. In addition separate training will be provided to address relevant technical accounting matters including updating the appropriate personnel on recent accounting pronouncements and other relevant accounting literature.
99
Report of Independent Registered Public Accounting Firm
The
Board of Directors and Stockholders of
TechTarget, Inc.
We have audited TechTarget, Inc.'s internal control over financial reporting as of December 31, 2009, based on criteria established in Internal Control—Integrated Framework issued by the Committee of Sponsoring Organizations of the Treadway Commission (the COSO criteria). TechTarget, Inc.'s management is responsible for maintaining effective internal control over financial reporting, and for its assessment of the effectiveness of internal control over financial reporting included in the accompanying management's report on internal control over financial reporting. Our responsibility is to express an opinion on the company's internal control over financial reporting based on our audit.
We conducted our audit in accordance with the standards of the Public Company Accounting Oversight Board (United States). Those standards require that we plan and perform the audit to obtain reasonable assurance about whether effective internal control over financial reporting was maintained in all material respects. Our audit included obtaining an understanding of internal control over financial reporting, assessing the risk that a material weakness exists, testing and evaluating the design and operating effectiveness of internal control based on the assessed risk, and performing such other procedures as we considered necessary in the circumstances. We believe that our audit provides a reasonable basis for our opinion.
A company's internal control over financial reporting is a process designed to provide reasonable assurance regarding the reliability of financial reporting and the preparation of financial statements for external purposes in accordance with generally accepted accounting principles. A company's internal control over financial reporting includes those policies and procedures that (1) pertain to the maintenance of records that, in reasonable detail, accurately and fairly reflect the transactions and dispositions of the assets of the company; (2) provide reasonable assurance that transactions are recorded as necessary to permit preparation of financial statements in accordance with generally accepted accounting principles, and that receipts and expenditures of the company are being made only in accordance with authorizations of management and directors of the company; and (3) provide reasonable assurance regarding prevention or timely detection of unauthorized acquisition, use, or disposition of the company's assets that could have a material effect on the financial statements.
Because of its inherent limitations, internal control over financial reporting may not prevent or detect misstatements. Also, projections of any evaluation of effectiveness to future periods are subject to the risk that controls may become inadequate because of changes in conditions, or that the degree of compliance with the policies or procedures may deteriorate.
A material weakness is a deficiency, or combination of deficiencies, in internal control over financial reporting, such that there is a reasonable possibility that a material misstatement of the company's annual or interim financial statements will not be prevented or detected on a timely basis. The following material weaknesses have been identified and included in management's assessment:
- 1.
- Inadequate and ineffective controls over the accounting for certain complex transactions.
The Company did not have effective design or operational controls over the accounting for certain online service revenue transactions, specifically; the ability to apply generally accepted accounting principles as they relate to the recognition of revenue on transactions that include duration-based services and multiple element advertising campaigns. This material weakness resulted in the misstatement of revenue for certain service offerings and multiple element campaigns, which required previously reported consolidated financial statements to be restated. The Company also did not have effective design on organizational controls over the accounting for stock based compensation arrangements in accordance with generally accepted accounting principles which resulted in adjustments being recorded in the quarter ended September 30, 2009.
100
- 2.
- Inadequate and ineffective controls over adequacy of staffing of accounting group.
The Company's controls related to ensuring the adequacy of staffing of its accounting and finance department were inadequate and ineffective. This material weakness resulted in the misstatement of revenue for certain service offerings and multiple element campaigns, which required previously reported consolidated financial statements to be restated. This material weakness also resulted in errors in accounting for stock based compensation, aging customer credits and certain unallocated accruals which resulted in adjustments being recorded in the quarter ended September 30, 2009.
- 3.
- Insufficient and ineffective review and supervision by management of certain accounting policies and procedures.
Management's monitoring and review controls over certain accounting policies and procedures as well as the business process controls surrounding certain complex online service revenue transactions were inadequate and ineffective. Management's oversight and related detective controls to ensure timely and proper identification and correction of errors for arrangements involving certain complex online service revenue transactions were inadequate and ineffective. This material weakness resulted in the misstatement of revenue for certain service offerings and multiple element campaigns, which required previously reported consolidated financial statements to be restated. This material weakness also resulted in errors in accounting for stock based compensation, aging customer credits and certain unallocated accruals which resulted in adjustments being recorded in the quarter ended September 30, 2009.
- 4.
- Inadequate and ineffective accounting and reporting system for processing and reporting of certain complex service revenue transactions.
The Company's current accounting and financial reporting system and related internal controls are inadequate to carry out the volume and level of complexities associated with its online service revenue transactions. This material weakness resulted in the misstatement of revenue for certain service offerings and multiple element campaigns, which required previously reported consolidated financial statements to be restated.
- 5.
- Inadequate and ineffective controls over the use of debit memorandums to reclassify aged customer credits from the accounts receivable subsidiary ledger to an unallocated general accrual account.
The Company did not have effective design or operational controls to prevent the reclassification of customer liabilities from the accounts receivable subsidiary ledger to an unallocated general accrual account. This material weakness resulted in the misstatement of customer liabilities, which required an adjustment in the quarter ended September 30, 2009.
- 6.
- Inadequate education, training, and awareness of the process for reporting concerns with regard to accounting practices to finance management, management and/or the Audit Committee.
The Company did not have effective employee education and training to ensure communication of any concerns related to accounting practices are brought to the appropriate personnel or governing body on a timely manner.
We also have audited, in accordance with the standards of the Public Company Accounting Oversight Board (United States), the consolidated balance sheets of TechTarget, Inc. as of December 31, 2009 and 2008, and the related consolidated statements of operations, redeemable convertible preferred stock and stockholders' equity, and cash flows for each of the three years in the period ended December 31, 2009. These material weaknesses were considered in determining the nature, timing and extent of audit tests applied in our audit of the 2009 financial statements and this report does not affect our report dated March 16, 2010, which expressed an unqualified opinion on those financial statements.
101
In our opinion, because of the effect of the material weaknesses described above on the achievement of the objectives of the control criteria, TechTarget, Inc. has not maintained effective internal control over financial reporting as of December 31, 2009, based on the COSO criteria.
| /s/ Ernst & Young LLP |
Boston,
Massachusetts
March 16, 2010
None.
Item 10. Directors, Executive Officers and Corporate Governance.
The information required by this item will be set forth under the captions "Proposal 1: Election of Class III Directors," "Information About Continuing Directors," "Information About Executive Officers," "Code of Business Conduct and Ethics" and "Board Committees—Audit Committee" in our definitive proxy statement for the 2010 Annual Meeting of Stockholders, and is incorporated herein by reference. We are also required under Item 405 of Regulation S-K to provide information concerning delinquent filers of reports under Section 16 of the Securities Exchange Act of 1934, as amended. This information will be listed under the caption "Section 16(a) Beneficial Ownership Reporting Compliance" in our definitive proxy statement for the 2010 Annual Meeting of Stockholders. This information is incorporated herein by reference. The information regarding executive officers will be listed under the section captioned "Executive Officers of the Company" in our definitive proxy statement for the 2010 Annual Meeting of Stockholders. This information is incorporated herein by reference.
Item 11. Executive Compensation.
The information required by this item will be set forth under the captions "Director Compensation; Executive Officer Compensation," "Compensation Committee Report" and "Compensation Committee Interlocks and Insider Participation" in our definitive proxy statement for the 2010 Annual Meeting of Stockholders. This information is incorporated herein by reference.
Item 12. Security Ownership of Certain Beneficial Owners and Management and Related Stockholder Matters.
The information required by this item will be set forth under the captions "Stock Owned by Directors, Executive Officers and Greater-Than-5% Stockholders" and "Securities Authorized for Issuance Under Equity Compensation Plans" in our definitive proxy statement for the 2010 Annual Meeting of Stockholders. This information is incorporated herein by reference.
Item 13. Certain Relationships and Related Transactions, and Director Independence.
The information required by this item will be set forth under the captions "Related Party Transactions" and "Information About Corporate Governance" in our definitive proxy statement for the 2010 Annual Meeting of Stockholders. This information is incorporated herein by reference.
Item 14. Principal Accounting Fees and Services.
The information required by this item will be set forth under the caption "Independent Registered Public Accountants" in our definitive proxy statement for the 2010 Annual Meeting of Stockholders. This information is incorporated herein by reference.
102
Item 15. Exhibits, Financial Statement Schedules
- (a)
- Financial
Statements are filed as part of this Annual Report on Form 10-K.
- (b)
- The
following consolidated financial statements are included in Item 8:
- •
- Consolidated Balance Sheets as of December 31, 2009 and 2008
- •
- Consolidated Statements of Operations for the Years Ended December 31, 2009, 2008 and 2007
- •
- Consolidated Statements of Redeemable Convertible Preferred Stock and Stockholders' Equity (Deficit) for the Years Ended
December 31, 2009, 2008 and 2007
- •
- Consolidated Statements of Cash Flows for the Years Ended December 31, 2009, 2008 and 2007
- •
- Notes to Consolidated Financial Statements
- (c)
- Exhibit
Index.
- (d)
- The exhibits listed in the Exhibit Index immediately preceding the exhibits are filed as part of this Annual Report on Form 10-K.
103
Pursuant to the requirements of Section 13 or 15(d) of the Securities Exchange Act of 1934, the registrant has duly caused this report to be signed on its behalf by the undersigned, thereunto duly authorized.
| TECHTARGET, INC. Date: March 16, 2010 |
||||
By: |
/s/ GREG STRAKOSCH Greg Strakosch Chief Executive Officer and Director |
|||
Pursuant to the requirements of the Securities Exchange Act of 1934, this report has been signed below by the following persons on behalf of the registrant and in the capacities and on the dates indicated.
Signature
|
Title
|
Date
|
||
|---|---|---|---|---|
| /s/ GREG STRAKOSCH Greg Strakosch |
Chief Executive Officer and Director (Principal executive officer) |
March 16, 2010 | ||
/s/ ERIC SOCKOL Eric Sockol |
Chief Financial Officer (Principal financial and accounting officer) |
March 16, 2010 |
||
/s/ LEONARD FORMAN Leonard Forman |
Director |
March 16, 2010 |
||
/s/ JAY C. HOAG Jay C. Hoag |
Director |
March 16, 2010 |
||
/s/ BRUCE LEVENSON Bruce Levenson |
Director |
March 16, 2010 |
||
/s/ ROGER M. MARINO Roger M. Marino |
Director |
March 16, 2010 |
104
| |
|
|
Incorporated by Reference to | |||||||
|---|---|---|---|---|---|---|---|---|---|---|
| Exhibit Number |
Description | Form or Schedule |
Exhibit No. |
Filing Date with SEC |
SEC File Number |
|||||
| Articles of Incorporation and By-Laws | ||||||||||
| 3.1 | Fourth Amended and Restated Certificate of Incorporation of the Registrant | 10-Q | 3.1 | 11/13/2007 | 001-33472 | |||||
| 3.2 | Amended and Restated Bylaws of the Registrant | S-1/A | 3.3 | 03/20/2007 | 333-140503 | |||||
| Instruments Defining the Rights of Security Holders | ||||||||||
| 4.1 | Specimen Stock Certificate for shares of the Registrant's Common Stock | S-1/A | 4.1 | 04/10/2007 | 333-140503 | |||||
| Material Contracts | ||||||||||
| 10.1 | Second Amended and Restated Investors' Rights Agreement by and among the Registrant, the Investors named therein and SG Cowen Securities Corporation, dated as of December 17, 2004 | S-1 | 10.1 | 02/07/2007 | 333-140503 | |||||
| 10.2 | Form of Indemnification Agreement between the Registrant and its Directors and Officers | S-1/A | 10.2 | 05/15/2007 | 333-140503 | |||||
| 10.3# | 2007 Stock Option and Incentive Plan | S-1/A | 10.3 | 04/20/2007 | 333-140503 | |||||
| 10.4# | Form of Incentive Stock Option Agreement under the 2007 Stock Option and Incentive Plan | S-1/A | 10.4 | 04/20/2007 | 333-140503 | |||||
| 10.5# | Form of Non-Qualified Stock Option Agreement under the 2007 Stock Option and Incentive Plan | S-1/A | 10.5 | 04/20/2007 | 333-140503 | |||||
| 10.6# | Form of Non-Qualified Stock Option Agreement for Non-Employee Directors | S-1/A | 10.5.1 | 04/27/2007 | 333-140503 | |||||
| 10.7# | Form of Restricted Stock Agreement under the 2007 Stock Option and Incentive Plan | S-1/A | 10.6 | 04/20/2007 | 333-140503 | |||||
| 10.8# | Form of Restricted Stock Unit Agreement under the 2007 Stock Option and Incentive Plan | 10-K | 10.8 | 3/31/2008 | 001-33472 | |||||
| 10.9# | Restricted Stock Unit Agreement, dated December 18, 2007, by and between the Registrant and Kevin Beam | 10-K | 10.9 | 3/31/2008 | 001-33472 | |||||
| 10.10# | Restricted Stock Unit Agreement, dated December 18, 2007, by and between the Registrant and Don Hawk | 10-K | 10.10 | 3/31/2008 | 001-33472 | |||||
| 10.11# | Restricted Stock Unit Agreement, dated December 18, 2007, by and between the Registrant and Rick Olin | 10-K | 10.11 | 3/31/2008 | 001-33472 | |||||
105
| |
|
|
Incorporated by Reference to | |||||||
|---|---|---|---|---|---|---|---|---|---|---|
| Exhibit Number |
Description | Form or Schedule |
Exhibit No. |
Filing Date with SEC |
SEC File Number |
|||||
| 10.12# | Restricted Stock Unit Agreement, dated December 18, 2007, by and between the Registrant and Eric Sockol | 10-K | 10.12 | 3/31/2008 | 001-33472 | |||||
| 10.13# | Restricted Stock Unit Agreement, dated December 18, 2007, by and between the Registrant and Greg Strakosch | 10-K | 10.13 | 3/31/2008 | 001-33472 | |||||
| 10.14# | Executive Incentive Bonus Plan | S-1/A | 10.7 | 04/20/2007 | 333-140503 | |||||
| 10.15# | 1999 Stock Option Plan | S-1 | 10.8 | 02/07/2007 | 333-140503 | |||||
| 10.16# | Form of Incentive Stock Option Grant Agreement under the 1999 Stock Option Plan (for grants prior to September 27, 2006) | S-1 | 10.9 | 02/07/2007 | 333-140503 | |||||
| 10.17# | Form of Incentive Stock Option Grant Agreement under the 1999 Stock Option Plan (for grants on or after September 27, 2006) | S-1 | 10.10 | 02/07/2007 | 333-140503 | |||||
| 10.18# | Form of Incentive Stock Option Grant Agreement under the 1999 Stock Option Plan (for grants to executives) | S-1/A | 10.10.1 | 05/01/2007 | 333-140503 | |||||
| 10.19# | Form of Nonqualified Stock Option Grant Agreement under the 1999 Stock Option Plan | S-1 | 10.11 | 02/07/2007 | 333-140503 | |||||
| 10.20# | Lease Agreement between the Registrant and Wellsford/Whitehall Holdings, L.L.C. for the premises located at 117 Kendrick Street, Needham, MA, dated as of November 25, 2003 | S-1 | 10.12 | 02/07/2007 | 333-140503 | |||||
| 10.21# | First Amendment to Lease Agreement between the Registrant and Wellsford/Whitehall Holdings, L.L.C. for the premises located at 117 Kendrick Street, Needham, MA, dated July 27, 2004 | S-1 | 10.13 | 02/07/2007 | 333-140503 | |||||
| 10.22# | Second Amendment to Lease Agreement between the Registrant and Wellsford/Whitehall Holdings, L.L.C. for the premises located at 117 Kendrick Street, Needham, MA, dated December, 2004 | S-1 | 10.14 | 02/07/2007 | 333-140503 | |||||
| 10.23# | Third Amendment to Lease Agreement between the Registrant and Intercontinental Fund III for the premises located at 117 Kendrick Street, Needham, MA, dated September 21, 2006 | S-1 | 10.15 | 02/07/2007 | 333-140503 | |||||
| 10.24# | Credit Facility Agreement between the Registrant and Citizens Bank of Massachusetts, dated August 30, 2006 | S-1 | 10.16 | 02/07/2007 | 333-140503 | |||||
106
| |
|
|
Incorporated by Reference to | |||||||
|---|---|---|---|---|---|---|---|---|---|---|
| Exhibit Number |
Description | Form or Schedule |
Exhibit No. |
Filing Date with SEC |
SEC File Number |
|||||
| 10.25# | Amended and Restated Employment Agreement, dated January 17, 2008, by and between the Registrant and Greg Strakosch | 10-K | 10.25 | 3/31/2008 | 001-33472 | |||||
| 10.26# | Amended and Restated Employment Agreement, dated January 17, 2008, by and between the Registrant and Don Hawk | 10-K | 10.26 | 3/31/2008 | 001-33472 | |||||
| 10.27# | Amended and Restated Employment Agreement, dated January 17, 2008, by and between the Registrant and Eric Sockol | 10-K | 10.27 | 3/31/2008 | 001-33472 | |||||
| 10.28# | Amended and Restated Employment Agreement, dated January 17, 2008, by and between the Registrant and Kevin Beam | 10-K | 10.28 | 3/31/2008 | 001-33472 | |||||
| 10.29# | Amended and Restated Employment Agreement, dated January 17, 2008, by and between the Registrant and Rick Olin | 10-K | 10.29 | 3/31/2008 | 001-33472 | |||||
| 10.30 | Lease Agreement by and between MA-Riverside Project L.L.C., as landlord and TechTarget, Inc., as tenant | 8-K | 10.1 | 8/7/2009 | 001-33472 | |||||
| 10.31 | First Amendment (dated August 30, 2007) to Credit Facility Agreement dated August 30, 2006 between the Registrant and Citizens Bank of Massachusetts | 10-Q | 10.1 | 2/8/2010 | 001-33472 | |||||
| 10.32 | Second Amendment (dated December 18, 2008) to Credit Facility Agreement between the Registrant and Citizens Bank of Massachusetts, dated August 30, 2006 | 10-Q | 10.2 | 2/8/2010 | 001-33472 | |||||
| 10.33 | Third Amendment (dated December 17, 2009) to Credit Facility Agreement dated August 30, 2006 between the Registrant and Citizens Bank of Massachusetts | 10-Q | 10.3 | 2/8/2010 | 001-33472 | |||||
| 10.34 | First Amendment (dated December 17, 2009) to Revolving Promissory Note dated August 30, 2006 between the Registrant and Citizens Bank of Massachusetts | 10-Q | 10.4 | 2/8/2010 | 001-33472 | |||||
| 10.35 | Waiver of Specified Covenants (dated December 17, 2009) for Credit Facility Agreement dated August 30, 2006 between the Registrant and Citizens Bank of Massachusetts, now known as RBS Citizens, National Association | 10-Q | 10.5 | 2/8/2010 | 001-33472 | |||||
107
| |
|
|
Incorporated by Reference to | |||||||
|---|---|---|---|---|---|---|---|---|---|---|
| Exhibit Number |
Description | Form or Schedule |
Exhibit No. |
Filing Date with SEC |
SEC File Number |
|||||
| 10.36 | Waiver of Specified Covenants (dated January 28, 2010) for Credit Facility Agreement dated August 30, 2006 between the Registrant and Citizens Bank of Massachusetts, now known as RBS Citizens, National Association | 10-Q | 10.6 | 2/8/2010 | 001-33472 | |||||
Additional Exhibits |
||||||||||
| *21.1 | List of Subsidiaries | |||||||||
| *23.1 | Consent of Ernst & Young LLP | |||||||||
| *31.1 | Certification by Chief Executive Officer Pursuant to Rule 13a-14(a) and 15d-14(a) of the Securities Exchange Act of 1934, as amended. | |||||||||
| *31.2 | Certification by Chief Financial Officer Pursuant to Rule 13a-14(a) and 15d-14(a) of the Securities Exchange Act of 1934, as amended. | |||||||||
| *32.1 | Certification by Chief Executive Officer and Chief Financial Officer Pursuant to 18 U.S.C. Section 1350, as adopted pursuant to Section 906 of the Sarbanes-Oxley Act of 2002. | |||||||||
| 99.1 | Agreement and Plan of Merger by and among the Registrant, Catapult Acquisition Corp. and KnowledgeStorm, Inc. dated November 1, 2007 | 8-K | 99.1 | 11/07/2007 | 001-33472 | |||||
- *
- Filed
herewith.
- #
- Management contract or compensatory plan or arrangement filed as an Exhibit to this report pursuant to 15(a) and 15(c) of Form 10-K.
108