Attached files
| file | filename |
|---|---|
| 8-K - FORM 8-K - TUCSON ELECTRIC POWER CO | c97785e8vk.htm |
Exhibit 99.1
| UNISOURCE ENERGY CORPORATION TUCSON, ARIZONA NYSE: UNS March 16-18, 2010 |
| 2 CONTACT INFORMATION & SAFE HARBOR Paul J. Bonavia, Chairman, President and CEO Kevin P. Larson, SVP, CFO and Treasurer Investor Relations Contact Information M. Jo Smith, Director Chris Norman, Lead Analyst (520) 884.3650 (520) 884.3649 josmith@uns.com cnorman@uns.com Investor Information http://ir.uns.com Safe Harbor and Non-GAAP Measures This document contains forward-looking information that involves risks and uncertainties, that include, but are not limited to: state and federal regulatory and legislative decisions and actions; regional economic and market conditions which could affect customer growth and energy usage; weather variations affecting energy usage; the cost of debt and equity capital and access to capital markets; the performance of the stock market and changing interest rate environment, which affect the value of the company's pension and other postretirement benefit plan assets and the related contribution requirements and expense; unexpected increases in O&M expense; resolution of pending litigation matters; changes in accounting standards; changes in critical accounting estimates; the ongoing restructuring of the electric industry; changes to long-term contracts; the cost of fuel and power supplies; performance of TEP's generating plants; and other factors listed in UniSource Energy's Form 10-K and 10-Q filings with the Securities and Exchange Commission. The preceding factors may cause future results to differ materially from historical results or from outcomes currently expected by UniSource Energy. The Company's press releases and other communications may include certain non-Generally Accepted Accounting Principles (GAAP) financial measures. A "non-GAAP financial measure" is defined as a numerical measure of a company's financial performance, financial position or cash flows that excludes (or includes) amounts that are included in (or excluded from) the most directly comparable measure calculated and presented in accordance with GAAP in the Company's financial statements. Non-GAAP financial measures utilized by the Company include presentations of revenues, operating expenses, operating income and earnings (loss) per share. The Company uses these non-GAAP measures to evaluate the operations of the Company. Certain non-GAAP financial measures utilized by the Company exclude: the impact of non-recurring items: the effect of accounting changes or adjustments; expenses that are reimbursed by third parties; and other items. The Company's management believes that these non-GAAP financial measures provide useful information to investors by removing the effect of variances in GAAP reported results of operations that are not indicative of fundamental changes in the earnings or cash flow capacity of the Company's operations. Management also believes that the presentation of the non-GAAP financial measures is largely consistent with its past practice, as well as industry practice in general, and will enable investors and analysts to compare current non-GAAP measures with non-GAAP measures with respect to prior periods. |
| 2009 Demonstrated strength of vertically integrated utility UniSource Energy 2009 diluted EPS of $2.69 New rates contributed to a $40 million increase in TEP's retail revenues Effectively managed O&M costs and implemented process improvements, saving $8.5 million Reduced leverage, lowered interest costs and hedged variable rate exposure Strong cash flows provide foundation for investing in our utilities and growing the dividend Operating cash flows of $347 million exceeded capital expenditures of $287 million Increased dividend 20% Defined steps to achieve renewable energy objectives and provide for earnings growth Developed diverse portfolio of primarily solar resources that are cost effective and provide community benefits Focused efforts on meeting the ACC's goals of expanding Arizona-based renewable resources while encouraging utility investment by providing current recovery of costs, including a return on investment Completed sale of largest non-utility energy investment Sale of Sabinas resulted in a $6 million pre-tax gain 3 |
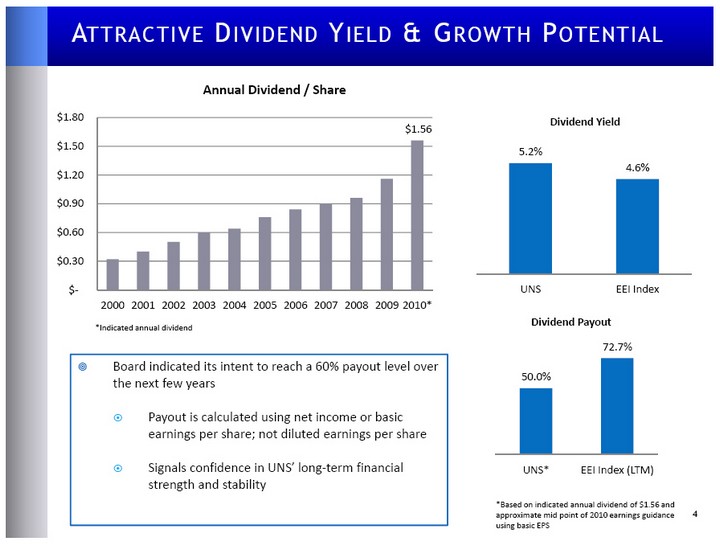
| ATTRACTIVE DIVIDEND YIELD & GROWTH POTENTIAL Board indicated its intent to reach a 60% payout level over the next few years Payout is calculated using net income or basic earnings per share; not diluted earnings per share Signals confidence in UNS' long-term financial strength and stability *Indicated annual dividend *Based on indicated annual dividend of $1.56 and approximate mid point of 2010 earnings guidance using basic EPS 4 |
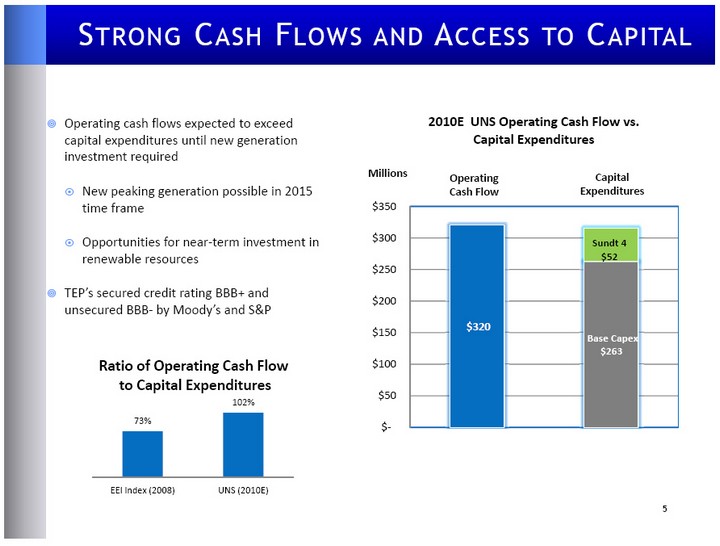
| STRONG CASH FLOWS AND ACCESS TO CAPITAL Operating cash flows expected to exceed capital expenditures until new generation investment required New peaking generation possible in 2015 time frame Opportunities for near-term investment in renewable resources TEP's secured credit rating BBB+ and unsecured BBB- by Moody's and S&P 5 5 Operating Cash Flow Capital Expenditures |
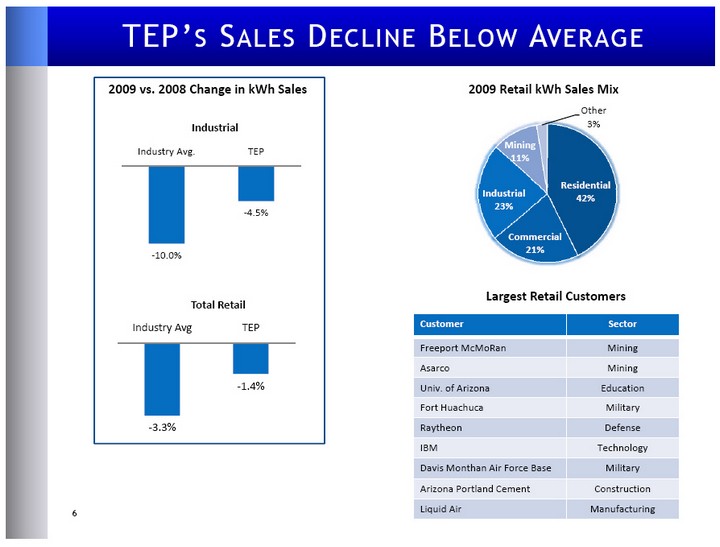
| TEP'S SALES DECLINE BELOW AVERAGE 6 Customer Sector Freeport McMoRan Mining Asarco Mining Univ. of Arizona Education Fort Huachuca Military Raytheon Defense IBM Technology Davis Monthan Air Force Base Military Arizona Portland Cement Construction Liquid Air Manufacturing Largest Retail Customers 2009 Retail kWh Sales Mix 2009 vs. 2008 Change in kWh Sales |
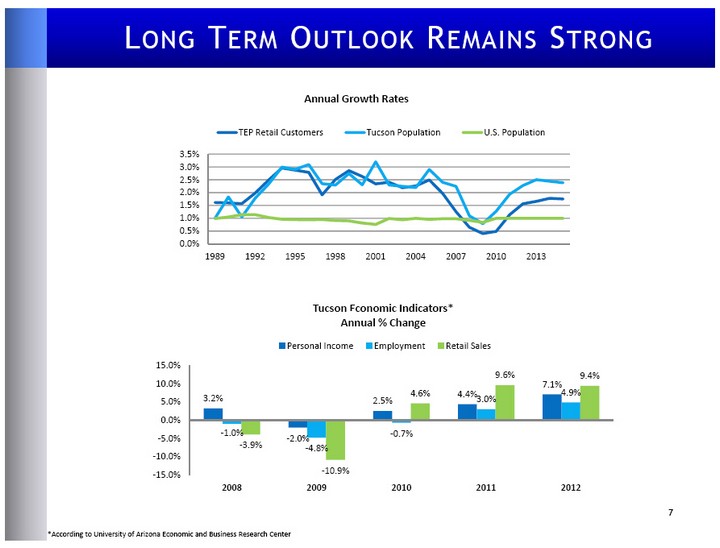
| LONG TERM OUTLOOK REMAINS STRONG 7 7 *According to University of Arizona Economic and Business Research Center |
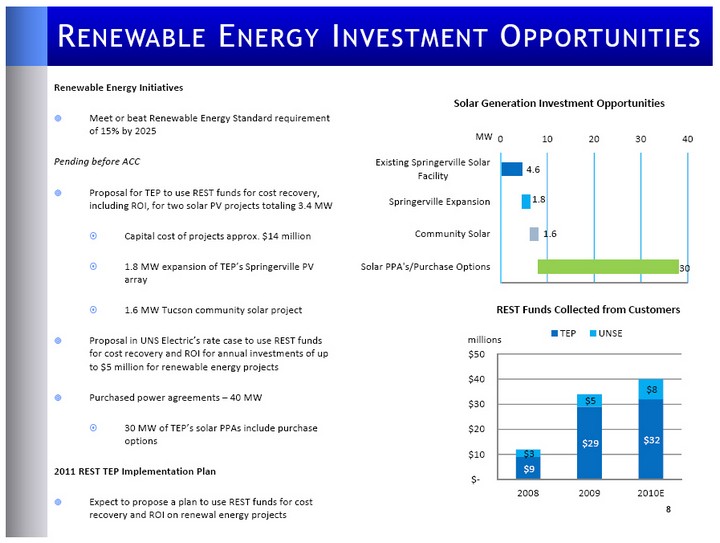
| RENEWABLE ENERGY INVESTMENT OPPORTUNITIES Renewable Energy Initiatives Meet or beat Renewable Energy Standard requirement of 15% by 2025 Pending before ACC Proposal for TEP to use REST funds for cost recovery, including ROI, for two solar PV projects totaling 3.4 MW Capital cost of projects approx. $14 million 1.8 MW expansion of TEP's Springerville PV array 1.6 MW Tucson community solar project Proposal in UNS Electric's rate case to use REST funds for cost recovery and ROI for annual investments of up to $5 million for renewable energy projects Purchased power agreements - 40 MW 30 MW of TEP's solar PPAs include purchase options 2011 REST TEP Implementation Plan Expect to propose a plan to use REST funds for cost recovery and ROI on renewal energy projects 8 |
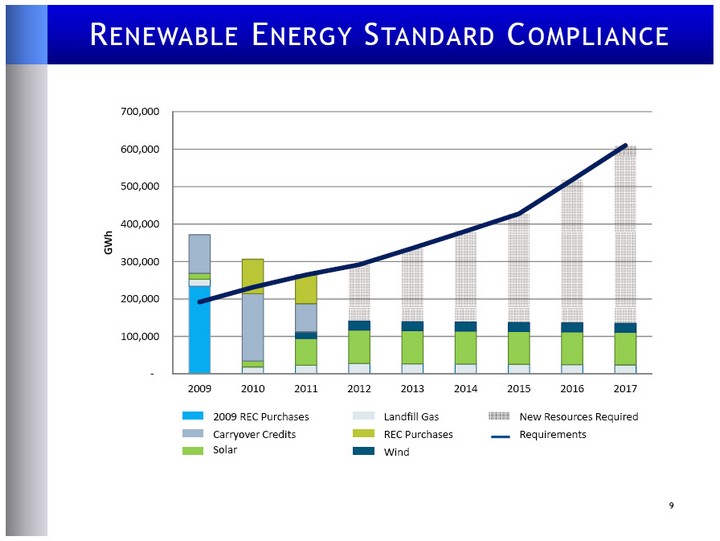
| RENEWABLE ENERGY STANDARD COMPLIANCE 9 2009 REC Purchases Carryover Credits Solar Landfill Gas REC Purchases Wind New Resources Required Requirements |
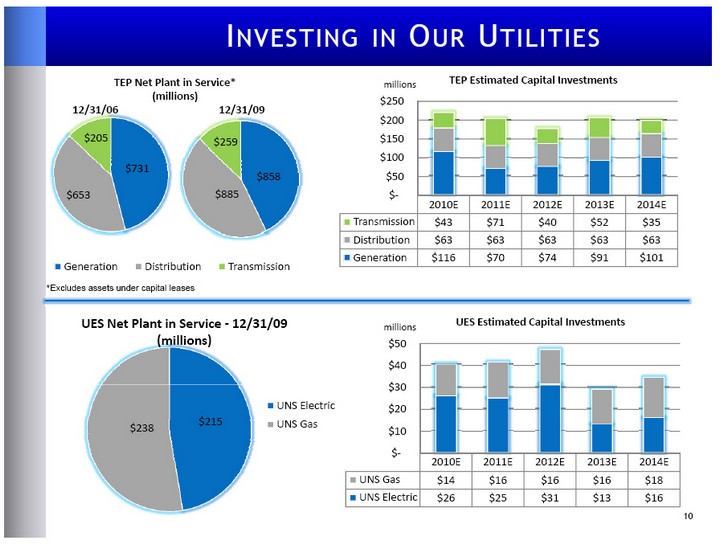
| INVESTING IN OUR UTILITIES 10 *Excludes assets under capital leases TEP Net Plant in Service* (millions) 12/31/06 12/31/09 |
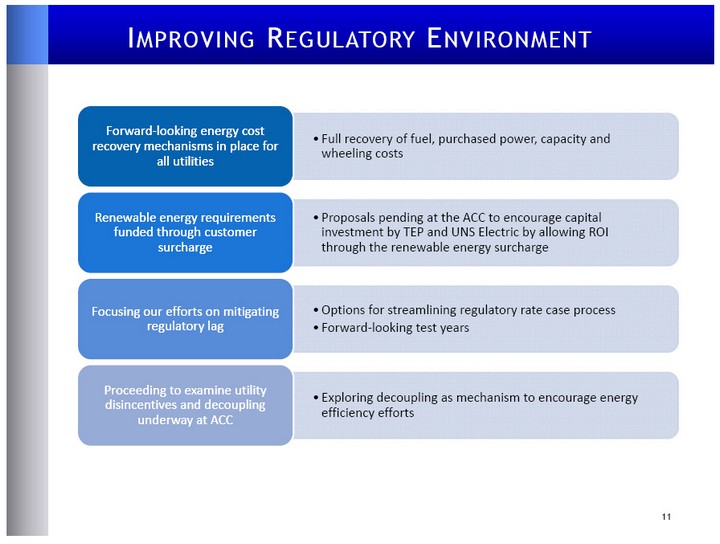
| IMPROVING REGULATORY ENVIRONMENT 11 |
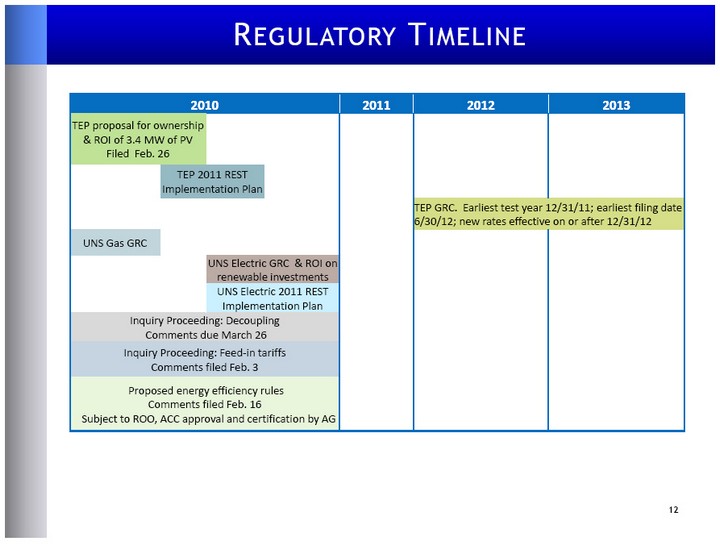
| REGULATORY TIMELINE 12 2010 2010 2010 2010 2011 2012 2013 TEP proposal for ownership & ROI of 3.4 MW of PV Filed Feb. 26 TEP proposal for ownership & ROI of 3.4 MW of PV Filed Feb. 26 TEP 2011 REST Implementation Plan TEP 2011 REST Implementation Plan TEP GRC. Earliest test year 12/31/11; earliest filing date 6/30/12; new rates effective on or after 12/31/12 TEP GRC. Earliest test year 12/31/11; earliest filing date 6/30/12; new rates effective on or after 12/31/12 UNS Gas GRC UNS Electric GRC & ROI on renewable investments UNS Electric GRC & ROI on renewable investments UNS Electric 2011 REST Implementation Plan UNS Electric 2011 REST Implementation Plan Inquiry Proceeding: Decoupling Comments due March 26 Inquiry Proceeding: Decoupling Comments due March 26 Inquiry Proceeding: Decoupling Comments due March 26 Inquiry Proceeding: Decoupling Comments due March 26 Inquiry Proceeding: Feed-in tariffs Comments filed Feb. 3 Inquiry Proceeding: Feed-in tariffs Comments filed Feb. 3 Inquiry Proceeding: Feed-in tariffs Comments filed Feb. 3 Inquiry Proceeding: Feed-in tariffs Comments filed Feb. 3 Proposed energy efficiency rules Comments filed Feb. 16 Subject to ROO, ACC approval and certification by AG Proposed energy efficiency rules Comments filed Feb. 16 Subject to ROO, ACC approval and certification by AG Proposed energy efficiency rules Comments filed Feb. 16 Subject to ROO, ACC approval and certification by AG Proposed energy efficiency rules Comments filed Feb. 16 Subject to ROO, ACC approval and certification by AG |
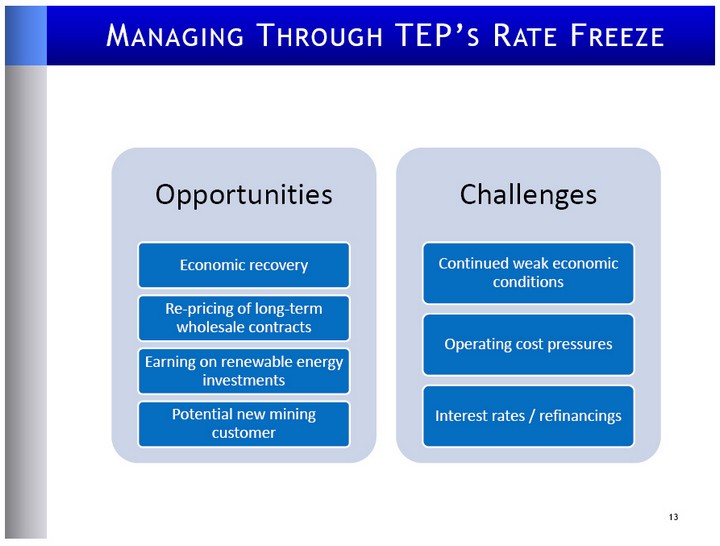
| MANAGING THROUGH TEP'S RATE FREEZE 13 |
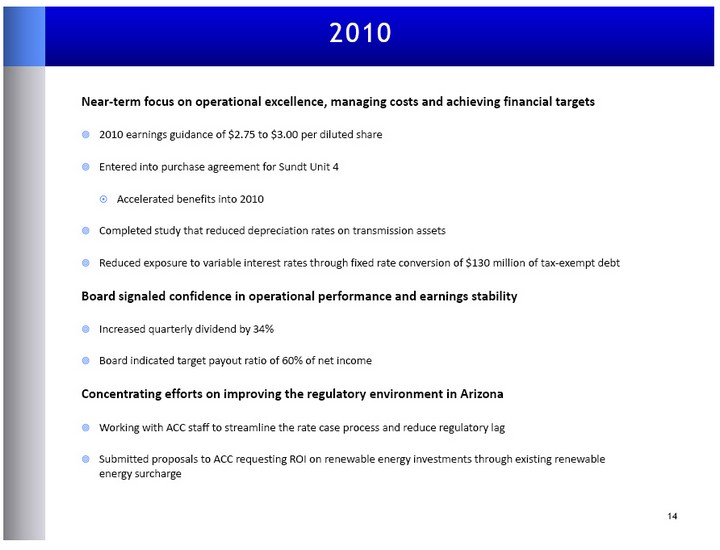
| 2010 14 Near-term focus on operational excellence, managing costs and achieving financial targets 2010 earnings guidance of $2.75 to $3.00 per diluted share Entered into purchase agreement for Sundt Unit 4 Accelerated benefits into 2010 Completed study that reduced depreciation rates on transmission assets Reduced exposure to variable interest rates through fixed rate conversion of $130 million of tax-exempt debt Board signaled confidence in operational performance and earnings stability Increased quarterly dividend by 34% Board indicated target payout ratio of 60% of net income Concentrating efforts on improving the regulatory environment in Arizona Working with ACC staff to streamline the rate case process and reduce regulatory lag Submitted proposals to ACC requesting ROI on renewable energy investments through existing renewable energy surcharge |
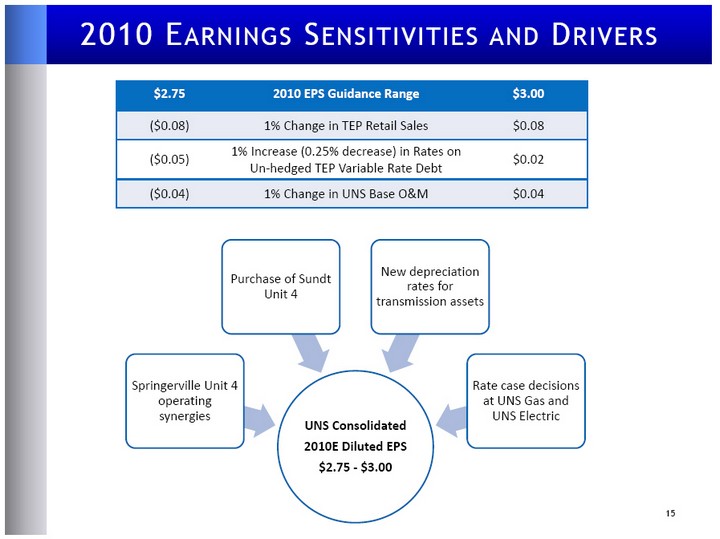
| 2010 EARNINGS SENSITIVITIES AND DRIVERS 15 15 $2.75 2010 EPS Guidance Range $3.00 ($0.08) 1% Change in TEP Retail Sales $0.08 ($0.05) 1% Increase (0.25% decrease) in Rates on Un-hedged TEP Variable Rate Debt $0.02 ($0.04) 1% Change in UNS Base O&M $0.04 |
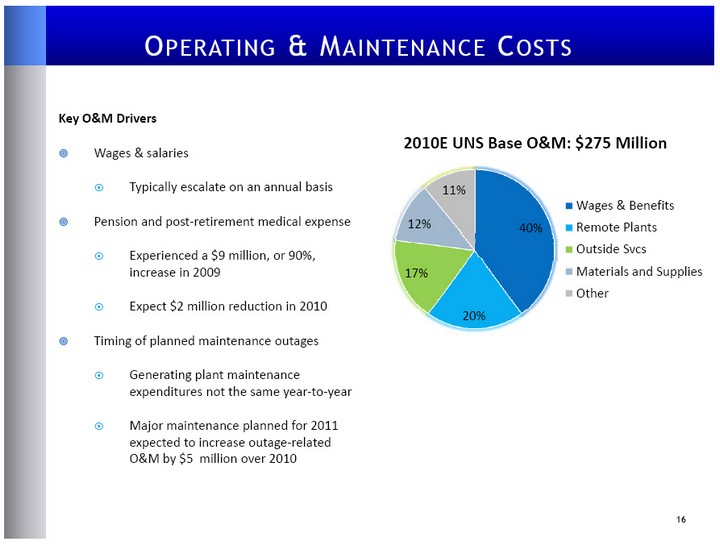
| OPERATING & MAINTENANCE COSTS Key O&M Drivers Wages & salaries Typically escalate on an annual basis Pension and post-retirement medical expense Experienced a $9 million, or 90%, increase in 2009 Expect $2 million reduction in 2010 Timing of planned maintenance outages Generating plant maintenance expenditures not the same year-to-year Major maintenance planned for 2011 expected to increase outage-related O&M by $5 million over 2010 16 16 |
| VALUE PROPOSITION 17 |

| 18 SUPPLEMENTAL INFORMATION |
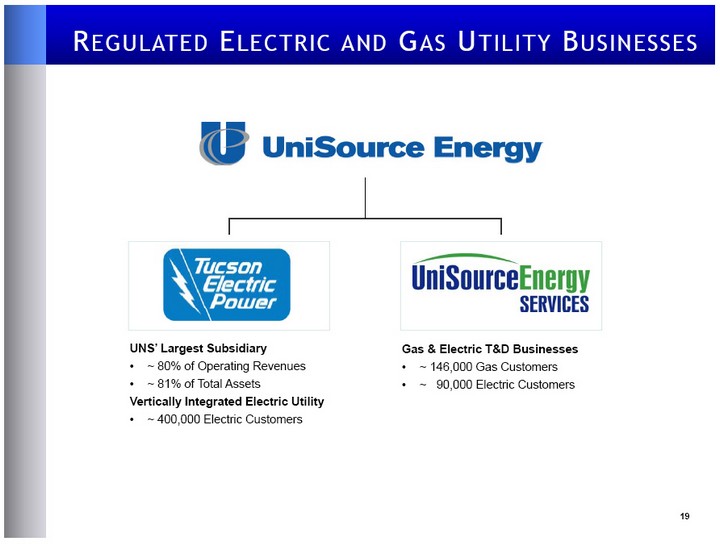
| 19 REGULATED ELECTRIC AND GAS UTILITY BUSINESSES UNS' Largest Subsidiary ~ 80% of Operating Revenues ~ 81% of Total Assets Vertically Integrated Electric Utility ~ 400,000 Electric Customers Gas & Electric T&D Businesses ~ 146,000 Gas Customers ~ 90,000 Electric Customers |
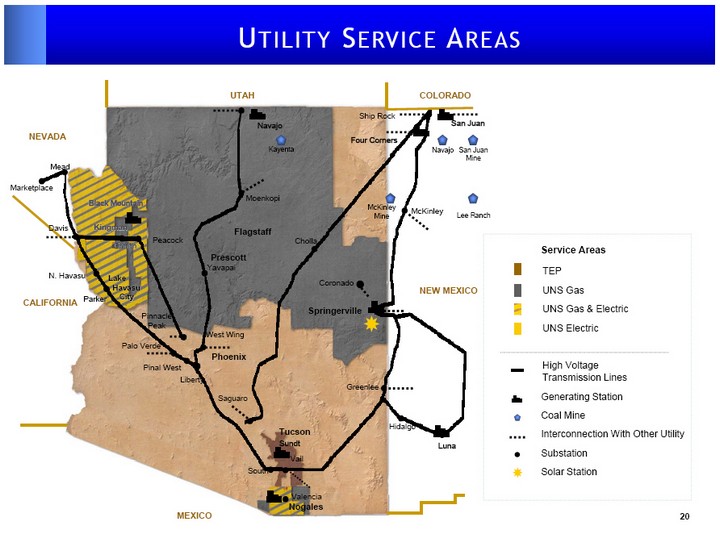
| 20 UTILITY SERVICE AREAS Navajo Sundt Moenkopi Peacock Marketplace Kayenta Tucson Generating Station Coal Mine Interconnection With Other Utility Substation Solar Station TEP UNS Gas UNS Gas & Electric UNS Electric Service Areas High Voltage Transmission Lines San Juan Ship Rock Four Corners San Juan Mine Navajo McKinley McKinley Mine Coronado Springerville Luna Hidalgo Greenlee South Vail Valencia Nogales Davis Mead Black Mountain Kingman Kingman Black Mountain Griffith Griffith N. Havasu Lake Havasu City Parker Parker Saguaro West Wing Liberty Palo Verde Phoenix Pinal West Cholla Flagstaff Lee Ranch Yavapai Prescott MEXICO NEVADA UTAH COLORADO CALIFORNIA NEW MEXICO Lake Havasu City Pinnacle Peak 20 |
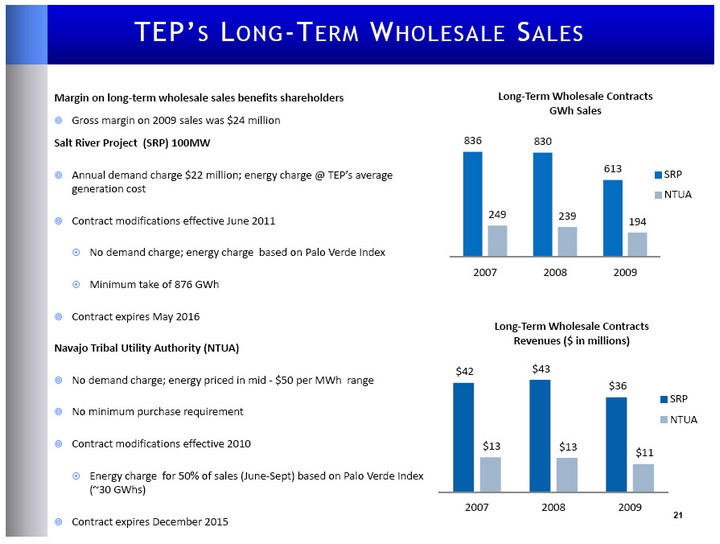
| 21 TEP'S LONG-TERM WHOLESALE SALES Margin on long-term wholesale sales benefits shareholders Gross margin on 2009 sales was $24 million Salt River Project (SRP) 100MW Annual demand charge $22 million; energy charge @ TEP's average generation cost Contract modifications effective June 2011 No demand charge; energy charge based on Palo Verde Index Minimum take of 876 GWh Contract expires May 2016 Navajo Tribal Utility Authority (NTUA) No demand charge; energy priced in mid - $50 per MWh range No minimum purchase requirement Contract modifications effective 2010 Energy charge for 50% of sales (June-Sept) based on Palo Verde Index (~30 GWhs) Contract expires December 2015 |
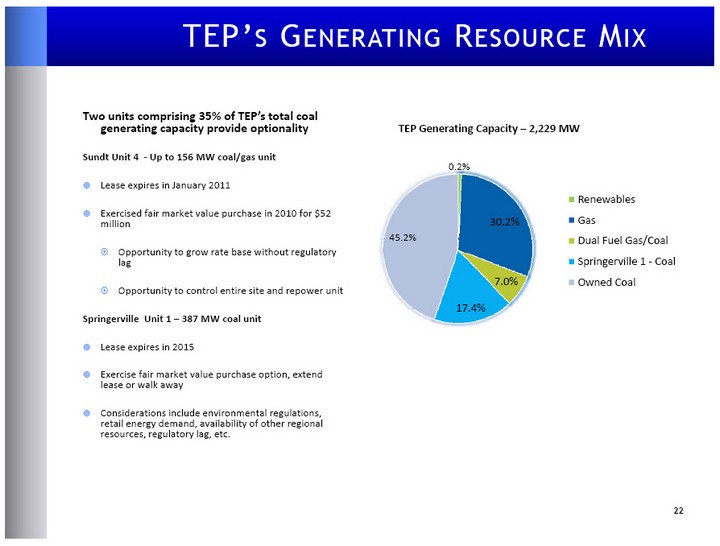
| TEP'S GENERATING RESOURCE MIX Two units comprising 35% of TEP's total coal generating capacity provide optionality Sundt Unit 4 - Up to 156 MW coal/gas unit Lease expires in January 2011 Exercised fair market value purchase in 2010 for $52 million Opportunity to grow rate base without regulatory lag Opportunity to control entire site and repower unit Springerville Unit 1 - 387 MW coal unit Lease expires in 2015 Exercise fair market value purchase option, extend lease or walk away Considerations include environmental regulations, retail energy demand, availability of other regional resources, regulatory lag, etc. 22 22 |
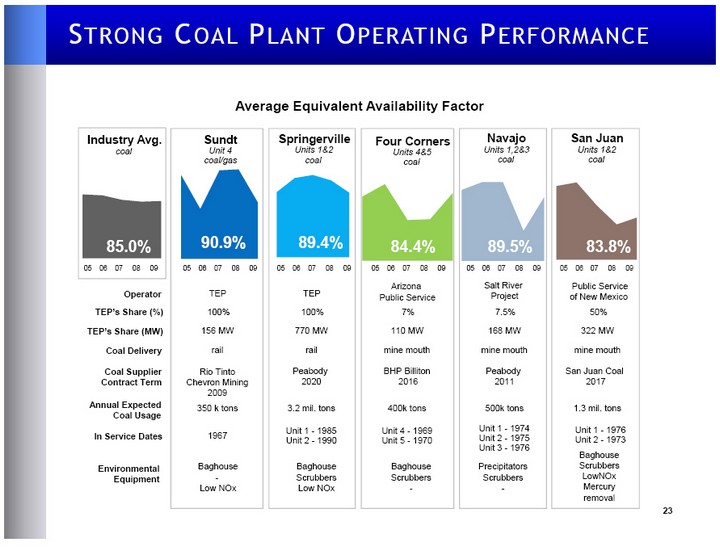
| 23 STRONG COAL PLANT OPERATING PERFORMANCE Average Equivalent Availability Factor Baghouse - Low NOx Environmental Equipment Operator TEP's Share (MW) Coal Delivery In Service Dates TEP's Share (%) TEP 156 MW rail 1967 100% TEP 770 MW rail Unit 1 - 1985 Unit 2 - 1990 100% Arizona Public Service 110 MW mine mouth Unit 4 - 1969 Unit 5 - 1970 7% Salt River Project 168 MW mine mouth Unit 1 - 1974 Unit 2 - 1975 Unit 3 - 1976 7.5% Public Service of New Mexico 322 MW mine mouth Unit 1 - 1976 Unit 2 - 1973 50% Coal Supplier Contract Term Peabody 2020 BHP Billiton 2016 Peabody 2011 San Juan Coal 2017 Rio Tinto Chevron Mining 2009 Annual Expected Coal Usage 350 k tons 3.2 mil. tons 400k tons 500k tons 1.3 mil. tons Baghouse Scrubbers Low NOx Baghouse Scrubbers - Precipitators Scrubbers - Baghouse Scrubbers LowNOx Mercury removal Sundt Unit 4 coal/gas Navajo Units 1,2&3 coal Industry Avg. coal Four Corners Units 4&5 coal San Juan Units 1&2 coal Springerville Units 1&2 coal 93% 87% 87% 83% 05 06 07 08 09 90.9% 89.4% 84.4% 89.5% 83.8% 85.0% 05 06 07 08 09 05 06 07 08 09 05 06 07 08 09 05 06 07 08 09 05 06 07 08 09 |
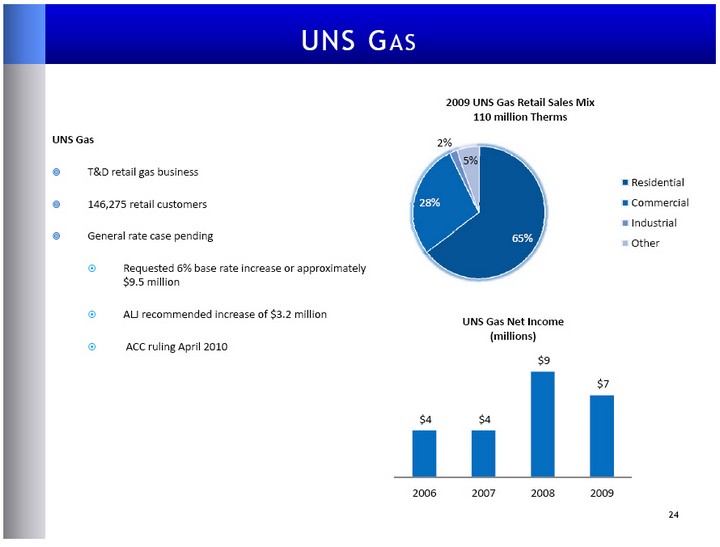
| 24 UNS GAS UNS Gas T&D retail gas business 146,275 retail customers General rate case pending Requested 6% base rate increase or approximately $9.5 million ALJ recommended increase of $3.2 million ACC ruling April 2010 |
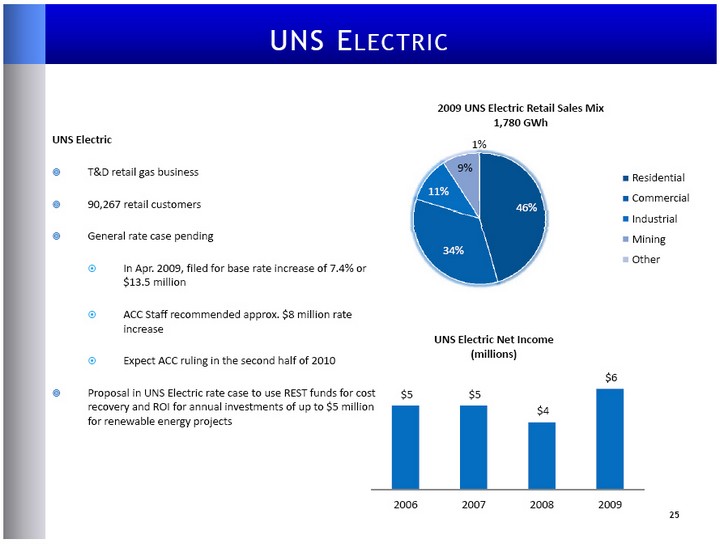
| 25 UNS ELECTRIC UNS Electric T&D retail gas business 90,267 retail customers General rate case pending In Apr. 2009, filed for base rate increase of 7.4% or $13.5 million ACC Staff recommended approx. $8 million rate increase Expect ACC ruling in the second half of 2010 Proposal in UNS Electric rate case to use REST funds for cost recovery and ROI for annual investments of up to $5 million for renewable energy projects |
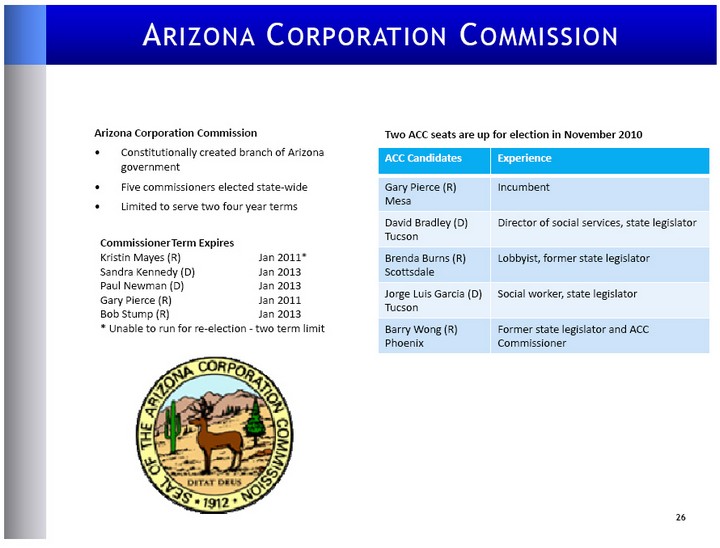
| ARIZONA CORPORATION COMMISSION 26 Commissioner Term Expires Kristin Mayes (R) Jan 2011* Sandra Kennedy (D) Jan 2013 Paul Newman (D) Jan 2013 Gary Pierce (R) Jan 2011 Bob Stump (R) Jan 2013 * Unable to run for re-election - two term limit Arizona Corporation Commission Constitutionally created branch of Arizona government Five commissioners elected state-wide Limited to serve two four year terms Two ACC seats are up for election in November 2010 ACC Candidates Experience Gary Pierce (R) Mesa Incumbent David Bradley (D) Tucson Director of social services, state legislator Brenda Burns (R) Scottsdale Lobbyist, former state legislator Jorge Luis Garcia (D) Tucson Social worker, state legislator Barry Wong (R) Phoenix Former state legislator and ACC Commissioner |
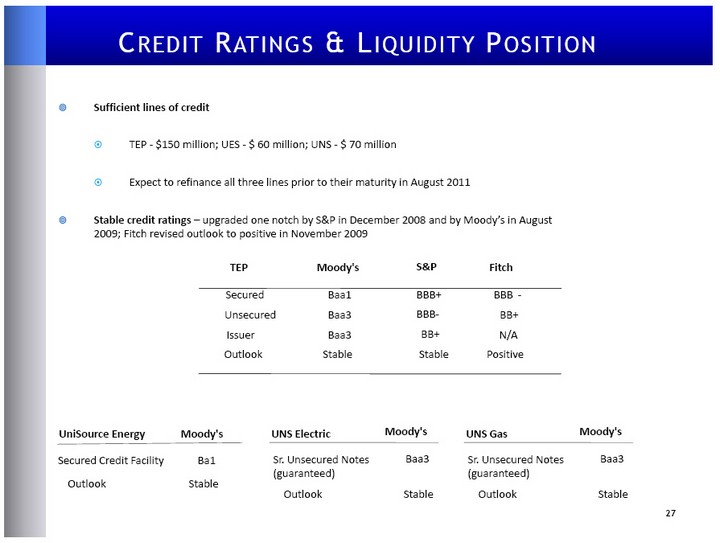
| 27 CREDIT RATINGS & LIQUIDITY POSITION Sufficient lines of credit TEP - $150 million; UES - $ 60 million; UNS - $ 70 million Expect to refinance all three lines prior to their maturity in August 2011 Stable credit ratings - upgraded one notch by S&P in December 2008 and by Moody's in August 2009; Fitch revised outlook to positive in November 2009 TEP Fitch Secured BBB - Unsecured BB+ Issuer N/A Outlook S&P BBB+ BBB- BB+ Stable Moody's Baa1 Baa3 Baa3 Stable Positive UniSource Energy Moody's Ba1 Stable Secured Credit Facility Outlook UNS Electric Moody's Baa3 Stable Sr. Unsecured Notes (guaranteed) Outlook UNS Gas Moody's Baa3 Stable Sr. Unsecured Notes (guaranteed) Outlook |
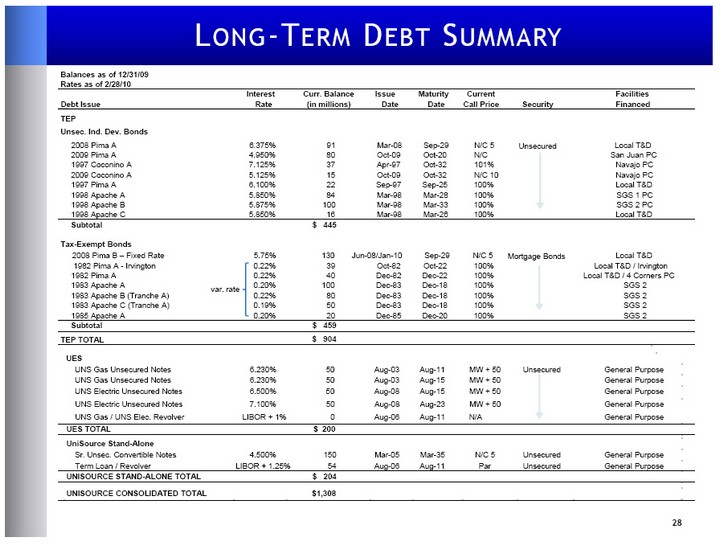
| 28 LONG-TERM DEBT SUMMARY Balances as of 12/31/09 Rates as of 2/28/10 Interest Curr. Balance Issue Maturity Current Facilities Debt Issue Rate (in millions) Date Date Call Price Security Financed TEP Unsec. Ind. Dev. Bonds 2009 Pima A 4.950% 80 Oct-09 Oct-20 N/C Unsecured San Juan PC 1997 Coconino A 7.125% 37 Apr-97 Oct-32 101% Navajo PC 2009 Coconino A 5.125% 15 Oct-09 Oct-32 N/C 10 Navajo PC 1997 Pima A 6.100% 22 Sep-97 Sep-25 100% Local T&D 1998 Apache A 5.850% 84 Mar-98 Mar-28 100% SGS 1 PC 1998 Apache B 5.875% 100 Mar-98 Mar-33 100% SGS 2 PC 1998 Apache C 5.850% 16 Mar-98 Mar-26 100% Local T&D Subtotal $ 445 Tax-Exempt Bonds 1982 Pima A - Irvington 0.22% 39 Oct-82 Oct-22 100% Mortgage Bonds Local T&D / Irvington 1982 Pima A 0.22% 40 Dec-82 Dec-22 100% Local T&D / 4 Corners PC 1983 Apache A 0.20% 100 Dec-83 Dec-18 100% SGS 2 1983 Apache B (Tranche A) 0.22% 80 Dec-83 Dec-18 100% SGS 2 1983 Apache C (Tranche A) 0.19% 50 Dec-83 Dec-18 100% SGS 2 1985 Apache A 0.20% 20 Dec-85 Dec-20 100% SGS 2 Subtotal $ 459 TEP TOTAL $ 904 2008 Pima A 6.375% 91 Mar-08 Sep-29 N/C 5 Local T&D UES UNS Gas Unsecured Notes 6.230% 50 Aug-03 Aug-11 MW + 50 Unsecured General Purpose UNS Gas Unsecured Notes 6.230% 50 Aug-03 Aug-15 MW + 50 General Purpose UNS Electric Unsecured Notes 6.500% 50 Aug-08 Aug-15 MW + 50 General Purpose UES TOTAL $ 200 UniSource Stand-Alone Sr. Unsec. Convertible Notes 4.500% 150 Mar-05 Mar-35 N/C 5 Unsecured General Purpose Term Loan / Revolver LIBOR + 1.25% 54 Aug-06 Aug-11 Par Unsecured General Purpose UNISOURCE STAND-ALONE TOTAL $ 204 UNISOURCE CONSOLIDATED TOTAL $1,308 UNS Gas / UNS Elec. Revolver LIBOR + 1% 0 Aug-06 Aug-11 N/A General Purpose 2008 Pima B - Fixed Rate 5.75% 130 Jun-08/Jan-10 Sep-29 N/C 5 Local T&D UNS Electric Unsecured Notes 7.100% 50 Aug-08 Aug-23 MW + 50 General Purpose var. rate |
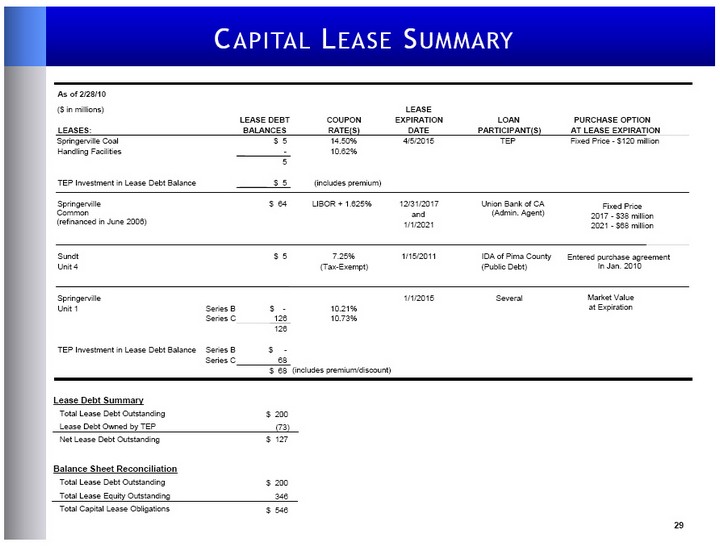
| 29 CAPITAL LEASE SUMMARY As of 2/28/10 ($ in millions) LEASE LEASE DEBT COUPON EXPIRATION LOAN LEASES: BALANCES RATE(S) DATE PARTICIPANT(S) Springerville Coal $ 5 14.50% 4/5/2015 TEP Handling Facilities - 10.62% 5 TEP Investment in Lease Debt Balance $ 5 (includes premium) Springerville $ 64 LIBOR + 1.625% 12/31/2017 Union Bank of CA (Admin. Agent) Common (refinanced in June 2006) and 1/1/2021 Sundt $ 5 7.25% 1/15/2011 IDA of Pima County Unit 4 (Tax-Exempt) (Public Debt) Springerville 1/1/2015 Several Unit 1 Series B $ - 10.21% Series C 126 10.73% 126 TEP Investment in Lease Debt Balance Series B $ - Series C 68 $ 68 (includes premium/discount) PURCHASE OPTION AT LEASE EXPIRATION Fixed Price - $120 million Fixed Price 2017 - $38 million 2021 - $68 million Entered purchase agreement In Jan. 2010 Market Value at Expiration Total Lease Debt Outstanding $ 200 Lease Debt Owned by TEP (73) Net Lease Debt Outstanding $ 127 Lease Debt Summary Total Lease Debt Outstanding $ 200 Balance Sheet Reconciliation Total Lease Equity Outstanding 346 Total Capital Lease Obligations $ 546 |