Attached files
| file | filename |
|---|---|
| EX-21 - SUBSIDIARIES OF THE REGISTRANT - TOWER BANCORP INC | dex21.htm |
| EX-32.2 - CERTIFICATION - TOWER BANCORP INC | dex322.htm |
| EX-23.2 - CONSENT OF PARENTEBEARD, LLC - TOWER BANCORP INC | dex232.htm |
| EX-31.1 - CERTIFICATION - TOWER BANCORP INC | dex311.htm |
| EX-23.1 - CONSENT OF KPMG LLP - TOWER BANCORP INC | dex231.htm |
| EX-32.1 - CERTIFICATION - TOWER BANCORP INC | dex321.htm |
| EX-31.2 - CERTIFICATION - TOWER BANCORP INC | dex312.htm |
Table of Contents
UNITED STATES
SECURITIES AND EXCHANGE COMMISSION
WASHINGTON, DC 20549
FORM 10-K
| x | ANNUAL REPORT PURSUANT TO SECTION 13 OR 15(d) OF THE SECURITIES EXCHANGE ACT OF 1934 |
For the fiscal year ended December 31, 2009,
or
| ¨ | TRANSITION REPORT PURSUANT TO SECTION 13 OR 15(d) OF THE SECURITIES EXCHANGE ACT OF 1934 |
Commission File Number: 001-34277

(Exact name of registrant as specified in its charter)
| Pennsylvania | 25-1445946 | |
| (State or other jurisdiction of incorporation) |
(IRS Employer Identification Number) | |
| 112 Market Street, Harrisburg, Pennsylvania | 17101 | |
| (Address of principal executive office) | (Zip Code) |
(717) 231-2700
(Registrant’s telephone number, including area code)
Securities registered pursuant to Section 12(b) of the Act:
| Title of each class |
Name of exchange on which registered | |
| Common Stock, No Par Value | The NASDAQ Stock Market, LLC |
Securities registered pursuant to Section 12(g) of the Act: None
Indicate by check mark whether the registrant is a well-known seasoned issuer, as defined in Rule 405 of the Securities Act. Yes ¨ No x
Indicate by check mark whether the registrant is not required to file reports pursuant to Section 13 or Section 15(d) of the Act. Yes ¨ No x
Indicate by check mark whether the registrant (1) has filed all reports required to be filed by Section 13 or 15(d) of the Securities Exchange Act of 1934 during the preceding 12 months (or for such shorter period that the registrant was required to file such reports), and (2) has been subject to such filing requirements for the past 90 days. Yes x No ¨
Indicate by check mark whether the registrant has submitted electronically and posted on its corporate Web site, if any, every Interactive Data File required to be submitted and posted pursuant to Rule 405 of Regulation S-T (§232.405 of this chapter) during the preceding 12 months (or for such shorter period that the registrant was required to submit and post such files). Yes ¨ No ¨
Indicate by check mark if disclosure of delinquent filers pursuant to Item 405 of Regulation S-K is not contained herein, and will not be contained, to the best of registrant’s knowledge, in definitive proxy or information statements incorporated by reference in Part III of this Form 10-K or any amendment to this Form 10-K. ¨
Indicate by check mark whether the registrant is a large accelerated filer, an accelerated filer, a non-accelerated filer, or a smaller reporting company. See the definitions of “large accelerated filer,” and “smaller reporting company” in Rule 12b-2 of the Exchange Act. (Check One):
| Large accelerated filed | ¨ | Accelerated filer | x | |||
| Non-accelerated filer | ¨ | Smaller reporting company | ¨ |
Indicate by check mark whether the registrant is a shell company (as defined in Rule 12b-2 of the Act). Yes ¨ No x
Aggregate market value of the Common Stock held by non-affiliates computed by reference to the price at which the common equity was last sold on June 30, 2009, determined using a per share closing price on that date of $35.15, as quoted on the NASDAQ Stock Market, was $116,590,652.
Number of shares outstanding of the registrant’s common stock as of February 28, 2010: 7,129,660.
DOCUMENTS INCORPORATED BY REFERENCE
Portions of the registrant’s Definitive Proxy Statement for the 2010 Annual Meeting of Shareholders are incorporated by reference in Part III of this Report.
Table of Contents
| Description |
Page | |||
| PART I | ||||
| Item 1. | 1 | |||
| Item 1A. | 9 | |||
| Item 1B. | 16 | |||
| Item 2. | 17 | |||
| Item 3. | 17 | |||
| Item 4. | 17 | |||
| PART II | ||||
| Item 5. | 18 | |||
| Item 6. | 21 | |||
| Item 7. | Management’s Discussion and Analysis of Financial Condition and Results of Operations |
22 | ||
| 43 | ||||
| Item 7A. | 47 | |||
| Item 8. | ||||
| 55 | ||||
| 57 | ||||
| 58 | ||||
| Consolidated Statements of Shareholders’ Equity and Comprehensive Income (Loss) |
59 | |||
| 60 | ||||
| 62 | ||||
| Management Report On Internal Control Over Financial Reporting |
100 | |||
| Item 9. | Changes in and Disagreements with Accountants on Accounting and Financial Disclosure |
101 | ||
| Item 9A. | 101 | |||
| Item 9B. | 101 | |||
| PART III | ||||
| Item 10. | 102 | |||
| Item 11. | 102 | |||
| Item 12. | Security Ownership of Certain Beneficial Owners and Management and Related Stockholder Matters |
102 | ||
| Item 13. | Certain Relationships and Related Transactions, and Director Independence |
102 | ||
| Item 14. | 102 | |||
| PART IV | ||||
| Item 15. | 103 | |||
| 106 | ||||
| 108 | ||||
Table of Contents
PART I
The information in this Form 10-K includes certain forward-looking statements, including statements relating to Tower’s financial condition, results of operations, asset quality and trends in its business that involve risks and uncertainties. Tower’s actual results may differ materially from the results discussed in these forward-looking statements. Factors that might cause such a difference include those discussed in Item 1. “Business,” Item 1A. “Risk Factors,” Item 7. “Management’s Discussion and Analysis of Financial Condition and Results of Operations”, as well as those discussed elsewhere in this Form 10-K.
| ITEM 1. | BUSINESS |
History and Business
Tower Bancorp, Inc. (the “Company” or “Tower”) is a Pennsylvania business corporation with principal executive offices at 112 Market Street, Harrisburg, Pennsylvania. We were incorporated in 1983 and registered as a bank holding company under the Bank Holding Company Act of 1956, as amended. As a bank holding company, we are subject to regulation and supervision by the Board of Governors of the Federal Reserve System.
On March 31, 2009, the Company merged with Graystone Financial Corp. (“Graystone”), a privately held, non-reporting corporation and a registered bank holding company under the Bank Holding Company Act of 1956, as amended (the “Merger”). Pursuant to an Agreement and Plan of Merger between the Company and Graystone (the “Merger Agreement”), the Company remains the surviving bank holding company and the First National Bank of Greencastle merged with and into Graystone Bank, the wholly-owned subsidiary of Graystone, with Graystone Bank as the surviving institution under the name “Graystone Tower Bank” (the “Bank Merger”). Graystone Tower Bank (the “Bank”) operates as the sole subsidiary of the Company through two divisions – “Graystone Bank, a division of Graystone Tower Bank”, consisting of the former Graystone Bank branches, and “Tower Bank, a division of Graystone Tower Bank,” consisting of the former branches of The First National Bank of Greencastle.
Our sole subsidiary bank, Graystone Tower Bank, was originally incorporated on September 2, 2005, as a Pennsylvania-chartered bank and commenced operations on November 10, 2005. As a state chartered bank, the Bank is subject to regulation by the Federal Deposit Insurance Corporation (“FDIC”) and the Pennsylvania Department of Banking and undergoes periodic examinations by these regulatory authorities.
Graystone Tower Bank is a full-service community bank operating twenty-seven offices in Centre, Cumberland, Dauphin, York, Fulton, Franklin, Lancaster and Lebanon Counties of Pennsylvania and Washington County of Maryland. Through the Bank, we offer a complete range of financial products to consumers, businesses, and not-for-profit customers through various delivery channels. The principal component of earnings for the Bank is net interest income, which is the difference between the yield on interest-earning assets and the cost of interest-bearing liabilities. The net interest margin, which is the ratio of net interest income to average earning assets, is affected by several factors including market interest rates, economic conditions, loan and lease demand, and deposit activity. The Bank seeks to maintain a steady net interest margin and consistent growth of net interest income. The Bank offeres residential mortgage services through a mortgage banking subsidiary, Graystone Mortgage, LLC, in which the Bank holds a 90% membership interest. Graystone Tower Bank also maintains a 20% interest in Dellinger, Dolan, McCurdy and Phillips Investment Advisors, LLC, which offers investment advisory services to high net worth individuals and not-for-profit entities, and 401(k) plans for business clients.
In addition to acquisition growth, our growth strategy focuses on organic loan and deposit growth through de-novo branch office expansion and investment in technology and teams of experienced community bankers. We have opened eleven de-novo branch offices since the Bank was incorporated in September 2005. During 2009, the Bank opened two de-novo branch offices in Lancaster and Lebanon Counties, PA, and as of December 31, 2009, the Bank had regulatory approval for three additional de-novo branch offices located in
1
Table of Contents
York and Centre Counties, PA. The de-novo branch office in Centre County, PA was opened in February 2010 and two York County, PA de-novo branch offices are expected to open later in 2010. Also, we are committed to investing in the latest technology to support continued growth and attracting and retaining experienced commercial and retail bankers that are passionate about our community banking relationship model.
On December 27, 2009, we entered into an Agreement and Plan of Merger (the “FCEC Merger Agreement”) with First Chester County Corporation (“First Chester”) pursuant to which First Chester will merge with and into the Company (the “FCEC Merger”), with the Company being the surviving corporation in the FCEC Merger. Expected to close in mid-2010 pending required regulatory and shareholder approvals and the satisfaction of other conditions, the FCEC Merger will broaden our geographic markets into demographically attractive and contiguous markets predominantly located in the Pennsylvania counties of Chester and Delaware. When completed, the FCEC Merger will result in the addition of approximately $1.3 billion in assets including over $950 million in gross loans held for investment, $980 million in deposits and 23 branches in southeastern Pennsylvania. Additional information related to the FCEC Merger can be found in the Company’s Current Report on Form 8-K filed with the SEC on December 28, 2009.
Employees
As of December 31, 2009, we had 286 full-time and 36 part-time employees.
Supervision and Regulation
We are subject to extensive regulation under federal and Pennsylvania banking laws, regulations and policies, including prescribed standards relating to capital, earnings, dividends, the repurchase or redemption of shares, loans or extensions of credit to affiliates and insiders, internal controls, information systems, internal audit systems, loan documentation, credit underwriting, asset growth, impaired assets and loan-to-value ratios. The bank regulatory framework is intended primarily for the protection of depositors, federal deposit insurance funds and the banking systems as a whole, and not for the protection of security holders.
The following summary sets forth certain of the material elements of the regulatory framework applicable to bank holding companies their subsidiaries and provides certain specific information about us and our subsidiaries. It does not describe all of the provisions of the statutes, regulations and policies that are identified. To the extent that the following information describes statutory and regulatory provisions, it is qualified in its entirety by express reference to each of the particular statutory and regulatory provisions. A change in applicable statutes, regulations or regulatory policy may have a material effect on the business of the Company.
Bank Holding Company Regulation
As a bank holding company, the Company is subject to regulation and examination by the Pennsylvania Department of Banking and the Federal Reserve Board. We are required to file with the Federal Reserve Board an annual report and such additional information as the Federal Reserve Board may require pursuant to the Bank Holding Company Act of 1956, as amended (the “BHC Act”). The BHC Act requires each bank holding company to obtain the approval of the Federal Reserve Board before it may acquire substantially all the assets of any bank, or before it may acquire ownership or control of any voting shares of any bank if, after such acquisition, it would own or control, directly or indirectly, more than five percent of the voting shares of such bank. Such a transaction may also require approval of the Pennsylvania Department of Banking. Pennsylvania law permits Pennsylvania bank holding companies to control an unlimited number of banks.
Pursuant to provisions of the BHC Act and regulations promulgated by the Federal Reserve Board thereunder, Tower may only engage in or own companies that engage in activities deemed by the Federal Reserve Board to
2
Table of Contents
be so closely related to the business of banking or managing or controlling banks as to be a proper incident thereto, and the holding company must obtain permission from the Federal Reserve Board prior to engaging in most new business activities.
A bank holding company and its subsidiaries are subject to certain restrictions imposed by the BHC Act on any extensions of credit to the bank or any of its subsidiaries, investments in the stock or securities thereof, and on the taking of such stock or securities as collateral for loans to any borrower. A bank holding company and its subsidiaries are also prevented from engaging in certain tie-in arrangements in connection with any extension of credit, lease or sale of property or furnishing of services.
Under Federal Reserve Board regulations, a bank holding company is required to serve as a source of financial and managerial strength to its subsidiary banks and may not conduct its operations in an unsafe or unsound manner. In addition, it is the Federal Reserve Board’s policy that in serving as a source of strength to its subsidiary banks, a bank holding company should stand ready to use available resources to provide adequate capital funds to its subsidiary banks during periods of financial stress or adversity and should maintain the financial flexibility and capital-raising capacity to obtain additional resources for assisting its subsidiary banks. A bank holding company’s failure to meet its obligations to serve as a source of strength to its subsidiary banks will generally be considered by the Federal Reserve Board to be an unsafe and unsound banking practice or a violation of the Federal Reserve Board regulations or both. This doctrine is commonly known as the “source of strength” doctrine.
The Federal banking regulators have adopted risk-based capital guidelines for bank holding companies. Currently, the required minimum ratio of total capital to risk-weighted assets (including off-balance sheet activities, such as standby letters of credit) is 8%. At least half of the total capital is required to be Tier 1 capital, consisting principally of common shareholders’ equity, non-cumulative perpetual preferred stock, a limited amount of cumulative perpetual preferred stock and minority interests in the equity accounts of consolidated subsidiaries, less goodwill. The remainder (Tier 2 capital) may consist of a limited amount of subordinated debt and intermediate-term preferred stock, certain hybrid capital instruments and other debt securities, perpetual preferred stock and a limited amount of the general loan loss allowance.
In addition to the risk-based capital guidelines, the federal banking regulators established minimum leverage ratio (Tier 1 capital to total assets) guidelines for bank holding companies. These guidelines provide for a minimum leverage ratio of 3% for those bank holding companies which have the highest regulatory examination ratings and are not contemplating or experiencing significant growth or expansion. All other bank holding companies are required to maintain a leverage ratio of at least 4%.
Regulation of Graystone Tower Bank
Graystone Tower Bank is a Pennsylvania-chartered banking institution and is subject to regulation, supervision and regular examination by the Pennsylvania Department of Banking and the Federal Deposit Insurance Corporation (“FDIC”). Federal and state banking laws and regulations govern, among other things, the scope of a bank’s business, the investments a bank may make, the reserves against deposits a bank must maintain, the loans a bank makes and collateral it takes, the maximum interest rates a bank may pay on deposits, the activities of a bank with respect to mergers and consolidations, and the establishment of branches, and management practices and other aspects of banking operations.
Dividend Restrictions
Tower is a legal entity separate and distinct from Graystone Tower Bank. Declaration and payment of cash dividends depends upon cash dividend payments to Tower by Graystone Tower Bank, which is our primary source of revenue and cash flow. Accordingly, the right of Tower, and consequently the right of our creditors and
3
Table of Contents
shareholders, to participate in any distribution of the assets or earnings of any subsidiary is necessarily subject to the prior claims of creditors of the subsidiary, except to the extent that claims of Tower in its capacity as a creditor may be recognized.
As a state chartered bank, Graystone Tower Bank is subject to regulatory restrictions on the payment and amounts of dividends under the Pennsylvania Banking Code. Further, the ability of banking subsidiaries to pay dividends is also subject to their profitability, financial condition, capital expenditures and other cash flow requirements. See Note 19 to the consolidated financial statements included at Item 8 of this Report.
The payment of dividends by Graystone Tower Bank and Tower may also be affected by other factors, such as the requirement to maintain adequate capital above regulatory guidelines. The federal banking agencies have indicated that paying dividends that deplete a depository institution’s capital base to an inadequate level would be an unsafe and unsound banking practice. Under the Federal Deposit Insurance Corporation Improvement Act of 1991, a depository institution may not pay any dividend if payment would cause it to become undercapitalized or if it already is undercapitalized. Moreover, the federal agencies have issued policy statements that provide that bank holding companies and insured banks should generally only pay dividends out of current operating earnings. Federal banking regulators have the authority to prohibit banks and bank holding companies from paying a dividend if the regulators deem such payment to be an unsafe or unsound practice.
Capital Adequacy and Operations
In December 1991, the Federal Deposit Insurance Corporation Improvement Act of 1991 (“FDICIA”) was enacted. FDICIA contains provisions limiting activities and business methods of depository institutions. FDICIA requires the primary federal banking regulators to promulgate regulations setting forth standards relating to, among other things, internal controls and audit systems; credit underwriting and loan documentation; interest rate exposure and other off-balance sheet assets and liabilities; and compensation of directors and officers. FDICIA also provides for expanded regulation of depository institutions and their affiliates, including parent holding companies, by such institutions’ primary federal banking regulator. Each primary federal banking regulator is required to specify, by regulation, capital standards for measuring the capital adequacy of the depository institutions it supervises and, depending upon the extent to which a depository institution does not meet such capital adequacy measures, the primary federal banking regulator may prohibit such institution from paying dividends or may require such institution to take other steps to become adequately capitalized.
FDICIA establishes five capital tiers, ranging from “well capitalized”, to “critically undercapitalized”. A depository institution is well capitalized if it significantly exceeds the minimum level required by regulation for each relevant capital measure. Under FDICIA, an institution that is not well capitalized is generally prohibited from accepting brokered deposits and offering interest rates on deposits higher than the prevailing rate in its market; in addition, “pass through” insurance coverage may not be available for certain employee benefit accounts. FDICIA also requires an undercapitalized depository institution to submit an acceptable capital restoration plan to the appropriate federal bank regulatory agency. One requisite element of such a plan is that the institution’s parent holding company must guarantee compliance by the institution with the plan, subject to certain limitations. In the event of the parent holding company’s bankruptcy, the guarantee, and any other commitments that the parent holding company has made to federal bank regulators to maintain the capital of its depository institution subsidiaries, would be assumed by the bankruptcy trustee and entitled to priority in payment.
At December 31, 2009, Graystone Tower Bank qualified as “well capitalized” under these regulatory capital standards. See Note 19 of the Notes to Consolidated Financial Statements included at Item 8 of this Report.
Community Reinvestment Act
Under the Community Reinvestment Act of 1977 (“CRA”), the FDIC is required to assess the record of all financial institutions regulated by it to determine if these institutions are meeting the credit needs of the community (including low and moderate income neighborhoods) which they serve. CRA performance
4
Table of Contents
evaluations are based on a four-tiered rating system: Outstanding, Satisfactory, Needs to Improve and Substantial Noncompliance. CRA performance evaluations are considered in evaluating applications for such things as mergers, acquisitions and applications to open branches. Graystone Tower Bank has a CRA rating of “Satisfactory.”
Restrictions on Transactions with Affiliates and Insiders
Graystone Tower Bank also is subject to the restrictions of Sections 23A, 23B, 22(g) and 22(h) of the Federal Reserve Act and Regulation O adopted by the Federal Reserve Board. Section 23A requires that loans or extensions of credit to an affiliate, purchases of securities issued by an affiliate, purchases of assets from an affiliate (except as may be exempted by order or regulation), the acceptance of securities issued by an affiliate as collateral and the issuance of a guarantee, acceptance of letters of credit on behalf of an affiliate (collectively, “Covered Transactions”) be on terms and conditions consistent with safe and sound banking practices. Section 23A also imposes quantitative restrictions on the amount of and collateralization requirements on such transactions. Section 23B requires that all Covered Transactions and certain other transactions, including the sale of securities or other assets to an affiliate and the payment of money or the furnishing of services to an affiliate, be on terms comparable to those prevailing for similar transactions with non-affiliates.
Section 22(g) and 22(h) of the Federal Reserve Act impose similar limitations on loans and extensions of credit from the bank to its executive officers, directors and principal shareholders and any of their related interests. The limitations restrict the terms and aggregate amount of such transactions. Regulation O implements the provisions of Sections 22(g) and 22(h) and requires maintenance of records of such transactions by the bank and regular reporting of such transactions by insiders. The FDIC also requires the bank, upon request, to disclose publicly loans and extensions of credit to insiders in excess of certain amounts.
Emergency Economic Stabilization Act of 2008
In response to the financial crises affecting the banking system and financial markets and going concern threats to investment banks and other financial institutions, on October 3, 2008, the Emergency Economic Stabilization Act of 2008 (the “EESA”) was signed into law. Pursuant to the EESA, the U.S. Treasury has the authority to, among other things, purchase up to $700 billion of mortgages, mortgage-backed securities and certain other financial instruments from financial institutions. On October 14, 2008, Secretary Paulson, after consulting with the Federal Reserve and the FDIC, announced that the Department of the Treasury would purchase equity stakes in a wide variety of banks and thrifts. Under this program, known as the Troubled Asset Relief Program (“TARP”) Capital Purchase Program, from the $700 billion authorized by the EESA, the Treasury made up to $250 billion of capital available to U.S. financial institutions in the form of preferred stock. In conjunction with the purchase of preferred stock, the Treasury would receive warrants to purchase common stock with an aggregate market price equal to 15% of the preferred investment. Participating financial institutions will be required to adopt the Treasury’s standards for executive compensation and corporate governance for the period during which the Treasury holds equity issued under TARP Capital Purchase Program. Tower determined not to participate in the TARP Capital Purchase Program.
Deposit Insurance and Premiums
The deposits of Graystone Tower Bank are insured up to applicable limits per insured depositor by the FDIC. In October 2008, the FDIC increased FDIC deposit insurance coverage per separately insured depositor for all account types to $250,000. While initially stipulated to be in effect through December 31, 2009, this increase has been subsequently extended through December 31, 2013 (at which point it will revert to $100,000 thereafter for most accounts other than IRAs and certain other types of retirement accounts up to a maximum of $250,000, if not extended by Congress). Additionally, through the Bank’s participation in the FDIC’s Transaction Account Guarantee Program, all non-interest bearing deposit transaction accounts are fully guaranteed through June 2010, regardless of the amount on deposit.
5
Table of Contents
As an FDIC-insured bank, Graystone Tower Bank is also subject to FDIC insurance assessments, which are imposed based upon the risk the institution poses to the Deposit Insurance Fund (“DIF”). Under this assessment system, risk is defined and measured using an institution’s supervisory ratings with certain other risk measures, including certain financial ratios. The annual rates for institutions in 2009 range from 12 basis points for “well managed,” “well capitalized” banks with the highest ratings, to 45 basis points for institutions posing the most risk to the DIF. The FDIC may raise or lower these assessment rates on a quarterly basis based on various factors to achieve a reserve ratio, which the FDIC currently has set at 1.25 percent of insured deposits. Due to recent bank failures and contingent loss reserves established by the FDIC against potential future bank failures, the reserve ratio is currently significantly below its target balance. Thus, in February 2009, the FDIC adopted a Final Rule on Assessments under which the quarterly initial base assessment rates increased substantially beginning in the second quarter of 2009. The FDIC then adopted a Final Rule on Special Assessment in May 2009, which imposed a 5 basis point special assessment on each institution’s assets minus Tier 1 capital as reported on the report of condition as of June 30, 2009, but capped the special assessment at 10 basis points times the institution’s assessment base for the second quarter 2009 risk-based assessment. On November 12, 2009, the FDIC adopted a final rule that required insured depository institutions to prepay, on December 30, 2009, their estimated quarterly risk-based assessments for the fourth quarter of 2009 and for all of 2010, 2011, and 2012, along with their quarterly risk-based assessment for the third quarter of 2009. The continued decline in the DIF balance may convince the FDIC to impose additional special emergency assessments in the future that could have a significant impact on Graystone Tower Bank’s capital levels and earnings. During 2009, the increase in FDIC annual rates, insured deposit growth and the special assessment, at 10 basis points, impacted our pretax earnings. The special assessment totaled $580 thousand. The prepayment for Graystone Tower Bank’s quarterly assessments amounted to $6.3 million and will be recognized as expense over a 3 year period.
In addition to DIF assessments, the FDIC assesses all insured deposits a special assessment to fund the repayment of debt obligations of the Financing Corporation (“FICO”). FICO is a government-sponsored entity that was formed to borrow the money necessary to carry out the closing and ultimate disposition of failed thrift institutions by the Resolution Trust Corporation in the 1990s. As of January 1, 2010, the annualized rate established by the FDIC for the FICO assessment was 1.06 basis points per $100 of insured deposits.
FDIC Temporary Liquidity Guarantee Program
In October 2008, the FDIC introduced the Temporary Liquidity Guarantee Program (“TLGP”), which is designed to improve the functions of the credit markets and to strengthen confidence in the financial system. The TLGP has two components (both of which involve participation fees to be paid by the participating institution): (i) a transaction account guarantee program, providing a full guaranty through June 2010 of noninterest-bearing deposit transaction accounts, such as business payroll accounts, regardless of the amount on deposit (the “Transaction Account Guarantee Program”) and (ii) a debt guarantee program, providing a guarantee of certain newly issued senior unsecured debt of FDIC-insured institutions and their holding companies (the “Debt Guarantee Program”). Graystone Tower Bank has elected to participate in the transaction account guarantee program. The Bank elected to not participate in the Debt Guarantee Program. However, we elected to participate in the Transaction Account Guarantee Program.
Other Federal Laws and Regulations
State usury and credit laws limit the amount of interest and various other charges collected or contracted by a bank on loans. the Bank’s loans are also subject to federal laws applicable to credit transactions, such as the following:
| • | Federal Truth-In-Lending Act, which governs disclosures of credit terms to consumer borrowers; |
| • | Home Mortgage Disclosure Act, requiring financial institutions to provide information to enable public officials to determine whether a financial institution is fulfilling its obligations to meet the housing needs of the community it serves; |
6
Table of Contents
| • | Equal Credit Opportunity Act prohibiting discrimination on the basis of race, creed or other prohibitive factors in extending credit; |
| • | Real Estate Settlement Procedures Act, which requires lenders to disclose certain information regarding the nature and cost of real estate settlements, and prohibits certain lending practices, as well as limits escrow account amounts in real estate transactions; |
| • | Fair Credit Reporting Act governing the manner in which consumer debts may be collected by collection agencies; and |
| • | Various rules and regulations of various federal agencies charged with the implementation of such federal laws. |
Additionally, our operations are subject to additional federal laws and regulations applicable to financial institutions, including, without limitation:
| • | Privacy provisions of the Gramm-Leach-Bliley Act and related regulations, which require us to maintain privacy policies intended to safeguard customer financial information, to disclose the policies to our customers and to allow customers to “opt out” of having their financial service providers disclose their confidential financial information to non-affiliated third parties, subject to certain exceptions; |
| • | Right to Financial Privacy Act, which imposes a duty to maintain confidentiality of consumer financial records and prescribes procedures for complying with administrative subpoenas of financial records; |
| • | Consumer protection rules for the sale of insurance products by depository institutions, adopted pursuant to the requirements of the Gramm-Leach-Bliley Act; and |
| • | USA Patriot Act, which requires financial institutions to take certain actions to help prevent, detect and prosecute international money laundering and the financing of terrorism. |
Effective July 1, 2010, a new federal banking rule under the Electronic Fund Transfer Act will prohibit financial institutions from charging consumers fees for paying overdrafts on automated teller machines (“ATM”) and one-time debit card transactions, unless a consumer consents, or opts in, to the overdraft service for those type of transactions. If a consumer does not opt in, any ATM transaction or debit that overdraws the consumer’s account will be denied. Overdrafts on the payment of checks and regular electronic bill payments are not covered by this new rule. Before opting in, the consumer must be provided a notice that explains the financial institution’s overdraft services, including the fees associated with the service, and the consumer’s choices. Financial institutions must provide consumers who do not opt in with the same account terms, conditions and features (including pricing) that they provide to consumers who do opt in.
Sarbanes-Oxley Act of 2002
On July 30, 2002, President Bush signed into law the Sarbanes-Oxley Act of 2002. The Sarbanes-Oxley Act represents a comprehensive revision of laws affecting corporate governance, accounting obligations and corporate reporting. The Sarbanes-Oxley Act is applicable to all companies with equity securities registered or that file reports under the Securities Exchange Act of 1934, including publicly held bank holding companies such as Tower. In particular, the Sarbanes-Oxley Act establishes: (i) requirements for audit committees, including independence, expertise, and responsibilities; (ii) additional responsibilities regarding financial statements for the Chief Executive Officer and Chief Financial Officer of the reporting company; (iii) standards for auditors and regulation of audits; (iv) increased disclosure and reporting obligations for the reporting company and its directors and executive officers; and (v) new and increased civil and criminal penalties for violations of the securities laws. Many of the provisions were effective immediately while other provisions become effective over a period of time and are subject to rulemaking by the SEC.
7
Table of Contents
Governmental Policies
Our earnings are significantly affected by the monetary and fiscal policies of governmental authorities, including the Federal Reserve Board. Among the instruments of monetary policy used by the Federal Reserve Board to implement these objectives are open-market operations in U.S. Government securities and federal funds, changes in the discount rate on member bank borrowings and changes in reserve requirements against member bank deposits. These instruments of monetary policy are used in varying combinations to influence the overall level of bank loans, investments and deposits, and the interest rates charged on loans and paid for deposits. The Federal Reserve Board frequently uses these instruments of monetary policy, especially its open-market operations and the discount rate, to influence the level of interest rates and to affect the strength of the economy, the level of inflation or the price of the dollar in foreign exchange markets. The monetary policies of the Federal Reserve Board have had a significant effect on the operating results of banking institutions in the past and are expected to continue to do so in the future. It is not possible to predict the nature of future changes in monetary and fiscal policies, or the effect which they may have on our business and earnings.
Other Legislative Initiatives
Proposals may be introduced in the United States Congress and in the Pennsylvania Legislature and before various bank regulatory authorities which would alter the powers of, and restrictions on, different types of banking organizations and which would restructure part or all of the existing regulatory framework for banks, bank holding companies and other providers of financial services. Moreover, other bills may be introduced in Congress which would further regulate, deregulate or restructure the financial services industry, including proposals to substantially reform the regulatory framework. It is not possible to predict whether these or any other proposals will be enacted into law or, even if enacted, the effect which they may have on our business and earnings.
Competition
Graystone Tower Bank’s principal market area consists of Centre, Cumberland, Dauphin, York, Fulton, Franklin, Lancaster and Lebanon Counties of Pennsylvania and Washington County of Maryland. It services a substantial number of depositors in this market area, with the greatest concentration within a radius of Greencastle, Harrisburg, and Lancaster, Pennsylvania.
The Bank, like other depository institutions, has been subjected to competition from less heavily regulated entities such as credit unions, brokerage firms, money market funds, consumer finance and credit card companies, and other commercial banks, many of which are larger than the Bank. The principal methods of competing effectively in the financial services industry include improving customer service through the quality and range of services provided, improving efficiencies and pricing services competitively. The Bank is competitive with the financial institutions in its service areas with respect to interest rates paid on time and savings deposits, service charges on deposit accounts and interest rates charged on loans.
The Bank continues to implement strategic initiatives focused on expanding our core businesses and to explore, on an ongoing basis, acquisition, divestiture, and joint venture opportunities. We analyze each of our products and businesses in the context of customer demands, competitive advantages, industry dynamics, and growth potential.
Additional Information
Our common stock is listed for quotation on the Global Market of The NASDAQ Stock Market under the symbol “TOBC.” Additional information about us can be found on the internet at www.towerbancorp.com. Electronic copies of the Company’s 2009 Annual Report on Form 10-K are available free of charge by visiting the “SEC Filings” section of www.towerbancorp.com. Electronic copies of quarterly reports on Form 10-Q and current reports on Form 8-K are also available at this internet address. These reports are posted as soon as reasonably practicable after they are electronically filed with the Securities and Exchange Commission (SEC).
8
Table of Contents
| Item 1A. | Risk Factors |
An investment in the Company’s common stock is subject to risks inherent to the Company’s business. The material risks and uncertainties that management believes affect the Company are described below. Before making an investment decision, you should carefully consider the risks and uncertainties described below together with all of the other information included or incorporated by reference in this report. The risks and uncertainties described below are not the only ones facing the Company. Additional risks and uncertainties that management is not aware of or focused on, or that management currently deems immaterial may also impair the Company’s business operations. This report is qualified in its entirety by these risk factors.
If any of the following risks actually occur, the Company’s financial condition and results of operations could be materially and adversely affected. If this were to happen, the value of the Company’s common stock could decline significantly, and you could lose all or part of your investment.
Risks Related to Our Business
Growing By Acquisition Entails Certain Risks.
On March 31, 2009, we completed a merger with Graystone Financial Corp. and on December 27, 2009, we entered into an agreement providing for the acquisition of First Chester County Corporation, which transaction is expected to close in mid-2010, pending receipt of required regulatory and shareholder approvals and the satisfaction of other conditions. Growth by acquisition involves risks. The success of our acquisitions may depend on, among other things, our ability to realize anticipated cost savings and to combine the businesses of the acquired company with our businesses in a manner that does not result in decreased revenues resulting from disruption of existing customer relationships of the acquired company. If we are not able to achieve these objectives, the anticipated benefits of an acquisition may not be realized fully or at all or may take longer to realize than planned.
Further, the asset quality or other financial characteristics of a company we plan to acquire may deteriorate between the date a merger or other acquisition agreement is entered into and the transaction is completed. Depending upon the terms we negotiate in the related merger or acquisition agreement, the deterioration may not allow us to fail to close the proposed transaction, such that we may be required to close the proposed transaction with such a company to the detriment of our future financial condition.
Additionally, if a pending acquisition is not completed due to the failure to satisfy certain conditions or otherwise, expenses incurred in connection therewith could have a material adverse impact on our financial condition because we would not have realized the expected benefits.
Legislative and regulatory actions taken now or in the future to address the current liquidity and credit crisis in the financial industry may significantly affect our financial condition, results of operations, liquidity or stock price.
Current economic conditions, particularly in the financial markets, have resulted in government regulatory agencies and political bodies placing increased focus and scrutiny on the financial services industry. The U.S. Government has intervened on an unprecedented scale, enacting and implementing numerous programs and actions targeted at the financial markets generally and the financial services industry in particular. In June 2009, the U.S. Department of the Treasury released a financial regulatory reform plan that would, if enacted, represent the most sweeping reform of financial regulation and financial services in decades.
These programs and proposals subject us and other financial institutions to additional restrictions, oversight and costs that may have an adverse impact on our business, financial condition, results of operations or the price of our common stock. If enacted, the Treasury Department’s financial reform plan would substantially increase
9
Table of Contents
regulation of the financial services industry and impose restrictions on the operations and general ability of firms within the industry to conduct business consistent with historical practices. Federal and state regulatory agencies also frequently adopt changes to their regulations or change the manner in which existing regulations are applied or enforced. We cannot predict the substance or impact of pending or future legislation, regulation or the application thereof. Compliance with such current and potential regulation and scrutiny may significantly increase our costs, impede the efficiency of our internal business processes, require us to increase our regulatory capital and limit our ability to pursue business opportunities in an efficient manner.
A continuation of recent turmoil in the financial markets, particularly if economic conditions worsen more than expected, could have an adverse effect on our financial position or results of operations.
In recent periods, United States and global markets, as well as general economic conditions, have been disrupted and are volatile. This situation is continuing and, since the beginning of the third quarter of 2008, has worsened significantly. The impact of this situation, together with concerns regarding the financial strength of financial institutions, has led to distress in credit markets and liquidity issues for financial institutions. Some financial institutions around the world have failed; others have been forced to seek acquisition partners. The United States and other governments have taken unprecedented steps to try to stabilize the financial system, including investing in financial institutions. Our business and our financial condition and results of operations could be adversely affected by (1) continued or accelerated disruption and volatility in financial markets, (2) continued capital and liquidity concerns regarding financial institutions generally and our counterparties specifically, (3) limitations resulting from further governmental action in an effort to stabilize or provide additional regulation of the financial system, or (4) recessionary conditions that are deeper or last longer than currently anticipated.
A substantial decline in the value of our Federal Home Loan Bank of Pittsburgh common stock may adversely affect our financial condition.
We own common stock of the Federal Home Loan Bank of Pittsburgh, or FHLB, in order to qualify for membership in the Federal Home Loan Bank system, which enables us to borrow funds under the Federal Home Loan Bank advance program. The carrying value and fair market value of our FHLB common stock was $6.1 million as of December 31, 2009.
Published reports indicate that certain member banks of the Federal Home Loan Bank system may be subject to asset quality risks that could result in materially lower regulatory capital levels. In December 2008, the FHLB had notified its member banks that it had suspended dividend payments and the repurchase of capital stock until further notice is provided. In an extreme situation, it is possible that the capitalization of a Federal Home Loan Bank, including the FHLB, could be substantially diminished or reduced to zero. Consequently, given that there is no market for the FHLB common stock, we believe that there is a risk that this investment could be deemed other than temporarily impaired at some time in the future. If this occurs, it may adversely affect our results of operations and financial condition.
Increases in FDIC insurance premiums may have a material adverse effect on our results of operations.
During 2008 and 2009, higher levels of bank failures have dramatically increased resolution costs of the Federal Deposit Insurance Corporation, or FDIC, and depleted the deposit insurance fund. In addition, the FDIC and the U.S. Congress have taken action to increase federal deposit insurance coverage, placing additional stress on the deposit insurance fund. In order to maintain a strong funding position and restore reserve ratios of the deposit insurance fund, the FDIC increased assessment rates of insured institutions uniformly by seven cents for every $100 of deposits beginning with the first quarter of 2009, with additional changes beginning April 1, 2009, which require riskier institutions to pay a larger share of premiums by factoring in rate adjustments based on secured liabilities and unsecured debt levels.
To further support the rebuilding of the deposit insurance fund, the FDIC imposed a special assessment on each insured institution, equal to five basis points of the institution’s total assets minus Tier 1 capital as of June 30,
10
Table of Contents
2009. For Graystone Tower Bank, this represented a charge of approximately $580 thousand, which was recorded as a pre-tax charge during the second quarter of 2009. The FDIC has indicated that future special assessments are possible, although it has not determined the magnitude or timing of any future assessments.
Additionally, on November 12, 2009, the FDIC adopted a final rule that required insured depository institutions to prepay, on December 30, 2009, their estimated quarterly risk-based assessments for the fourth quarter of 2009 and for all of 2010, 2011, and 2012, along with their quarterly risk-based assessment for the third quarter of 2009. The amount of the prepayment attributable to the fourth quarter of 2009 and all of 2010 is based upon a bank’s total base assessment rate in effect on September 30, 2009, which would be increased by 3 basis points for 2011 and 2012. In order to determine the amount of the prepayment, the assessment rate (as adjusted) is applied to the assessment base for the third quarter of 2009, increased quarterly to reflect an estimated 5 percent annual growth rate through 2012.
Under U.S. GAAP accounting rules, prepaid assessments, unlike special assessments, do not immediately affect bank earnings, although the prepayment reduced Graystone Tower Bank’s’s liquid assets by approximately $6.3 million. Banks record the entire amount of its prepaid assessment as a prepaid expense (asset) as of December 30, 2009 (the date of payment), and will record an expense (charge to earnings) for its regular quarterly assessment and an offsetting credit to the prepaid assessment until the asset is exhausted.
We are generally unable to control the amount of premiums that we are required to pay for FDIC insurance. If there are additional bank or financial institution failures, we may be required to pay even higher FDIC premiums. Our expenses for the year ended December 31, 2009 have been significantly and adversely affected by these increased and prepaid premiums and the special assessment. These increases and assessment and any future increases in insurance premiums or additional special assessments may materially adversely affect our results of operations.
The soundness of other financial services institutions may adversely affect our credit risk.
We rely on other financial services institutions through trading, clearing, counterparty, and other relationships. We maintain limits and monitor concentration levels of our counterparties as specified in our internal policies. Our reliance on other financial services institutions exposes us to credit risk in the event of default by these institutions or counterparties. These losses could adversely affect our results of operations and financial condition.
Changes in interest rates could adversely impact our financial condition and results of operations.
Our ability to make a profit, like that of most financial institutions, substantially depends upon our net interest income, which is the difference between the interest income earned on interest earning assets, such as loans and investment securities, and the interest expense paid on interest-bearing liabilities, such as deposits and borrowings. Changes in interest rates can increase or reduce net interest income and net income.
Different types of assets and liabilities may react differently, and at different times, to changes in market interest rates. When interest-bearing liabilities mature or reprice more quickly than interest-earning assets in a period, an increase in market rates of interest could reduce net interest income. When interest-earning assets mature or reprice more quickly than interest-bearing liabilities, falling interest rates could reduce net interest income. Changes in market interest rates are affected by many factors beyond our control, including inflation, unemployment, money supply, international events, and events in the United States and other financial markets.
We attempt to manage risk from changes in market interest rates, in part, by controlling the mix of interest rate sensitive assets and interest rate sensitive liabilities. However, interest rate risk management techniques are not exact and a rapid increase or decrease in interest rates could adversely affect our financial performance.
11
Table of Contents
Our loan portfolio includes a large number and amount of commercial and industrial loans, and commercial real estate related loans, which have a higher degree of risk than other types of loans.
We provide lending services to various types of small businesses, their owners, professionals and other individuals. Commercial loans are generally considered to have a higher degree of risk of default or loss than other types of loans, such as residential real estate loans, because repayment may be affected by general economic conditions, interest rates, the quality of management of the business, and other factors that may cause a borrower to be unable to repay its obligations. The current economic downturn may increase this risk of default or loss, which may adversely impact our results of operations and financial condition.
The severity and duration of the current recession and the composition of our loan portfolio could impact the level of loan charge-offs and the provision for loan losses and may affect our net income or loss.
National and regional economic conditions could impact the loan portfolio of Graystone Tower Bank. For example, an increase in unemployment, a decrease in real estate values or increases in interest rates, as well as other factors, could further weaken the economies of the communities we serve. Weakness in the market areas it serves could depress our earnings and, consequently, our financial condition because:
| • | borrowers may not be able to repay their loans; |
| • | the value of the collateral securing our loans to borrowers may decline; and |
| • | the overall quality of our loan portfolio may decline. |
Any of these scenarios could require that we charge-off a higher percentage of our loans and/or increase our provision for loan losses, which would negatively impact our results of operations.
In this regard, in establishing the size of our allowance for loan losses, we makes various general assumptions and judgments about the quality and collectability of our loan portfolio, including the creditworthiness of borrowers and the value of the real estate and other assets serving as collateral for the repayment of loans. The amount of our provision for loan losses and the percentage of loans we are required to charge-off may be impacted by adverse developments in and the overall risk composition of the loan portfolio. While we believe that our allowance for loan losses as of December 31, 2009 is sufficient to cover losses inherent in the loan portfolio on that date, we may be required to increase our loan loss provision or charge-off a higher percentage of loans due to adverse developments in or changes in the risk characteristics of the loan portfolio, thereby negatively impacting our results of operations. For example, a decrease in real estate values could cause higher loan losses and require higher loan loss provisions for loans that are secured by real estate.
We are required to make a number of judgments in applying accounting policies and different estimates and assumptions in the application of these policies could result in a decrease in capital and/or other material changes to our reports of financial condition and results of operations.
Material estimates that are particularly susceptible to significant change relate to the determination of the allowance for loan losses and reserve for unfunded lending commitments, the effectiveness of derivatives and other hedging activities, the fair value of certain financial instruments (securities, derivatives, and privately held investments), income tax assets or liabilities (including deferred tax assets and any related valuation allowance), share-based compensation, and accounting for acquisitions, including the fair value determinations and the analysis of goodwill impairment. While we have identified those accounting policies that are considered critical and have procedures in place to facilitate the associated judgments, different assumptions in the application of these policies could result in a decrease to net income and, possibly, capital and may have a material adverse effect on our financial condition and results of operations.
Difficulties in integrating past or future acquisitions could adversely affect our business.
We have spent and may continue to spend significant resources identifying businesses to acquire. The efficient and effective integration of any businesses Tower acquires into its organization is critical to our growth. Our
12
Table of Contents
completed acquisition of Graystone Financial Corp., our pending acquisition of First Chester County Corporation, and any future acquisitions, involve numerous risks including difficulties in integrating the culture, operations, technologies and personnel of the acquired companies, the diversion of management’s attention from other business concerns and the potential loss of customers. Failure to successfully integrate the operations of Graystone and First Chester could also harm our business, results of operations and cash flows.
We plan to pursue a growth strategy and there are risks associated with rapid growth.
Prior to our merger with Graystone Financial Corp., Graystone had experienced rapid growth since opening in November 2005. Tower’s management intends to continue to pursue a growth plan, which may include growth by acquisition, as well as leveraging our existing branch network and adding new branch locations in existing and new markets.
Our ability to manage growth successfully will depend on our ability to attract qualified personnel and maintain cost controls and asset quality while attracting additional loans and deposits on favorable terms, as well as on factors beyond our control, such as economic conditions and competition. If we grow too quickly and are not able to attract qualified personnel, control costs and maintain asset quality, this continued rapid growth could materially adversely affect our financial performance.
We may elect or need to seek additional capital in the future, but that capital may not be available when needed.
We are required by federal and state regulatory authorities to maintain adequate levels of capital to support our operations. In the future, we may elect or need to raise additional capital. Our ability to raise additional capital, if needed, will depend on conditions in the capital markets at that time, which are outside our control, and on our financial performance. Accordingly, we cannot assure you of our ability to raise additional capital if needed on acceptable terms. If we cannot raise additional capital when needed, our ability to expand our operations through internal growth or acquisitions could be materially impaired.
Future acquisitions could dilute your ownership of our common stock and may cause us to become more susceptible to adverse economic events.
We may issue shares of our common stock in connection with future acquisitions and other investments, which would dilute your ownership interest in Tower. While there is no assurance that these transactions will occur, or that they will occur on terms favorable to us, future business acquisitions could be material to us, and the degree of success achieved in acquiring and integrating these businesses into Tower could have a material effect on the value of our common stock. In addition, these acquisitions could require us to expend substantial cash or other liquid assets or to incur debt, which could cause us to become more susceptible to economic downturns and competitive pressures.
Our controls and procedures may fail or could be circumvented.
Our management has implemented a series of internal controls, disclosure controls and procedures, and corporate governance policies and procedures in order to ensure accurate financial control and reporting. However, any system of controls, no matter how well designed and operated, can only provide reasonable, not absolute, assurance that the objectives of the system are met. Any failure or circumvention of our controls and/or procedures could have a material adverse effect on our business and results of operation and financial condition.
Loss of our senior executive officers or other key employees could impair our relationship with our customers and adversely affect our business.
We have assembled a senior management team which has substantial background and experience in banking and financial services in the markets it serves. Loss of these key personnel could negatively impact our earnings because of their skills, customer relationships and/or the potential difficulty of promptly replacing them.
13
Table of Contents
An interruption or breach in security with respect to our information systems, as well as information systems of our outsourced service providers, could damage our reputation, result in a loss of customer business, subject us to additional regulatory scrutiny, or expose us to civil litigation, any of which could have a material adverse effect on our financial condition and results of operations.
We rely heavily on communications and information systems to conduct our business. Any failure, interruption or breach in security of these systems could result in failures or disruptions in our customer relationship management, general ledger, deposit, loan and other systems.
We continually encounter technological change.
Our future success depends, in part, on our ability to effectively embrace technology efficiencies to better serve customers and reduce costs. Failure to keep pace with technological change could potentially have an adverse effect on our business operations and financial condition.
Strong competition within our market area may limit our growth and profitability.
Competition in the banking and financial services industry is intense. We compete actively with other Pennsylvania and Maryland financial institutions, many larger than us, as well as with financial and non-financial institutions headquartered elsewhere. Commercial banks, savings banks, savings and loan associations, credit unions, and money market funds actively compete for deposits and loans. Such institutions, as well as consumer finance, insurance companies and brokerage firms, may be considered competitors with respect to one or more services they render. We will likely be generally competitive with all institutions in our service areas with respect to interest rates paid on time and savings deposits, service charges on deposit accounts, interest rates charged on loans and fees for trust and investment advisory services. Many of the institutions with which we compete have substantially greater resources and lending limits and may offer certain services that we do not or cannot provide. Our profitability depends upon our ability to successfully compete in our market area.
We operate in a highly regulated environment and may be adversely affected by changes in laws and regulations.
Tower and Graystone Tower Bank are subject to extensive regulation, supervision and examination by certain state and federal agencies including the FDIC, as insurer of Graystone Tower Bank’s deposits, the Federal Reserve, as regulator of Tower, and the Pennsylvania Department of Banking, as regulator of Pennsylvania chartered banks. Such regulation and supervision govern the activities in which an institution and its holding company may engage and are intended primarily to ensure the safety and soundness of financial institutions. Regulatory authorities have extensive discretion in their supervisory and enforcement activities, including the imposition of restrictions on operations, the classification of assets and determination of the level of the allowance for loan losses. Any change in such regulation and oversight, whether in the form of regulatory policy, regulations, legislation or supervisory action, may have a material impact on our operations.
Risks Related to Our Common Stock
The price of our common stock may fluctuate significantly, and this may make it difficult for you to resell shares of common stock owned by you at times or at prices you find attractive.
The price of our common stock on the NASDAQ Global Market constantly changes. We expect that the market price of our common stock will continue to fluctuate and there can be no assurance about the market prices for our common stock.
Our stock price may fluctuate as a result of a variety of factors, many of which are beyond our control. These factors include:
| • | our financial condition, performance, creditworthiness and prospects; |
14
Table of Contents
| • | quarterly variations in our operating results or the quality of our assets; |
| • | operating results that vary from the expectations of management, securities analysts and investors; |
| • | changes in expectations as to our future financial performance; |
| • | announcements of innovations, new products, strategic developments, significant contracts, acquisitions and other material events by us or our competitors; |
| • | the operating and securities price performance of other companies that investors believe are comparable to us; |
| • | future sales of our equity or equity-related securities; |
| • | the credit, mortgage and housing markets, the markets for securities relating to mortgages or housing, and developments with respect to financial institutions generally; |
| • | changes in global financial markets and global economies and general market conditions, such as interest or foreign exchange rates, stock, commodity or real estate valuations or volatility and other geopolitical, regulatory or judicial events; and |
| • | the relatively low trading volume of our common stock. |
The trading volume in our common stock is less than that of other financial services companies.
Our common stock has been listed on the NASDAQ Global Market under the symbol “TOBC” since April 6, 2009. The average daily trading volume for shares of our common stock is less than other financial services companies. Given the lower trading volume of our common stock, the sale of a significant number of these shares, or the expectation of such sales, could adversely affect the market price of our stock.
We may issue additional common stock or other equity securities in the future which could dilute the ownership interest of existing shareholders.
In order to maintain our capital at desired or regulatory-required levels or to replace existing capital, we may issue additional shares of common stock, or securities convertible into, exchangeable for or representing rights to acquire shares of common stock. We are generally not restricted from issuing such additional shares. We may sell any shares that we issue at prices below the current market price of our common stock, and the sale of these shares may significantly dilute shareholder ownership. We could also issue additional shares in connection with acquisitions of other financial institutions.
Offerings of debt, which would be senior to our common stock upon liquidation, and/or preferred equity securities which may be senior to our common stock for purposes of dividend distributions or upon liquidation, may adversely affect the market price of our common stock.
We may attempt to increase our capital resources or, if our or Graystone Tower Bank’s capital ratios fall below the required minimums, we or the Bank could be forced to raise additional capital by making additional offerings of debt or preferred equity securities, including medium-term notes, trust preferred securities, senior or subordinated notes and preferred stock. Upon liquidation, holders of our debt securities and shares of preferred stock and lenders with respect to other borrowings are likely to receive distributions of our available assets prior to the holders of our common stock. Additional equity offerings may dilute the holdings of our existing shareholders or reduce the market price of our common stock, or both. Holders of our common stock are not entitled to preemptive rights or other protections against dilution.
Our board of directors is authorized to issue one or more classes or series of preferred stock from time to time without any action on the part of the shareholders. Our board of directors also has the power, without shareholder approval, to set the terms of any such classes or series of preferred stock that may be issued, including voting
15
Table of Contents
rights, dividend rights, and preferences over our common stock with respect to dividends or upon our dissolution, winding up and liquidation and other terms. If we issue preferred stock in the future that has a preference over our common stock with respect to the payment of dividends or upon our liquidation, dissolution or winding up, or if we issue preferred stock with voting rights that dilute the voting power of our common stock, the rights of holders of our common stock or the market price of our common stock could be adversely affected.
Our ability to pay dividends is subject to limitations.
Tower Bancorp is a bank holding company and its operations are principally conducted by its subsidiary bank, Graystone Tower Bank. Accordingly, our ability to pay dividends depends on the receipt of dividends from Graystone Tower Bank. As a state chartered bank, Graystone Tower Bank is subject to regulatory restrictions on the payment and amounts of dividends under the Pennsylvania Banking Code. Further, the ability of banking subsidiaries to pay dividends is also subject to their profitability, financial condition, capital expenditures and other cash flow requirements. There is no assurance that our subsidiaries will be able to pay dividends in the future or that we will generate adequate cash flow to pay dividends in the future. The failure to pay dividends on our common stock could have a material adverse effect on the market price of our common stock.
Our management controls a substantial percentage of our stock and therefore have the ability to exercise significant control over our affairs.
Our directors and executive officers beneficially own in excess of 25% of our issued and outstanding common stock on a fully diluted basis. Such persons, as a group, will have sufficient votes to strongly influence the outcome of matters submitted to our shareholders, including the election of directors. This concentration of ownership might also have the effect of delaying or preventing a change in control of Tower.
Anti-takeover provisions and restrictions on ownership could negatively impact our shareholders.
Provisions of Pennsylvania law and our amended and restated articles of incorporation and bylaws could make it more difficult for a third party to acquire control of us or have the effect of discouraging a third party from attempting to acquire control of us. These provisions could make it more difficult for a third party to acquire us even if an acquisition might be in the best interest of our shareholders. In addition, the Bank Holding Company Act of 1956, as amended, or the BHCA, requires any bank holding company to obtain the approval of the Federal Reserve Board prior to acquiring more than 5% of our outstanding common stock. Any person other than a bank holding company is required to obtain prior approval of the Federal Reserve Board to acquire 10% or more of our outstanding common stock under the Change in Bank Control Act. Any holder of 25% or more of our outstanding common stock, other than an individual, is subject to regulation as a bank holding company under the BHCA.
| Item 1B. | Unresolved Staff Comments |
None.
16
Table of Contents
| Item 2. | Properties |
The following table summarizes the Company’s branch and office properties, by county, as of December 31, 2009.
| County |
State | Owned | Leased | Total | ||||
| Bank Branches |
||||||||
| Centre |
PA | — | 1 | 1 | ||||
| Cumberland |
PA | — | 2 | 2 | ||||
| Dauphin |
PA | — | 2 | 2 | ||||
| Franklin |
PA | 9 | — | 9 | ||||
| Fulton |
PA | 3 | 1 | 4 | ||||
| Lancaster |
PA | — | 4 | 4 | ||||
| Lebanon |
PA | — | 1 | 1 | ||||
| York |
PA | — | 1 | 1 | ||||
| Washington |
MD | 2 | 1 | 3 | ||||
| Total |
14 | 13 | 27 | |||||
| Administrative Office Locations |
||||||||
| Cumberland |
PA | — | 2 | 2 | ||||
| Dauphin |
PA | — | 1 | 1 | ||||
| Lebanon |
PA | — | 1 | 1 | ||||
| Lancaster |
PA | — | 1 | 1 | ||||
| Total |
— | 5 | 5 | |||||
Included in the Administrative Office Locations section of the above table, is the corporate operations center for Tower Bancorp, Inc. and Graystone Tower Bank, located at 1828 Good Hope Road, Enola, Pennsylvania and our principal executive offices located at 112 Market Street, Harrisburg, Pennsylvania.
| Item 3. | Legal Proceedings |
The nature of our business generates a certain amount of litigation involving matters arising in the ordinary course of business. However, in the opinion of management, there are no proceedings pending to which Tower is a party or to which our property is subject which, if determined adversely to Tower, would be material in relation to our shareholders’ equity or financial condition. In addition, no material proceedings are pending nor are known to be threatened or contemplated against us by governmental authorities or other parties.
| Item 4. | Reserved |
17
Table of Contents
PART II
| Item 5. | Market for Registrant’s Common Equity, Related Stockholder Matters and Issuer Purchases of Equity Securities |
Common Stock
As of December 31, 2009, the Company had 7,122,683 shares of no-par value common stock outstanding held by approximately 1,389 holders of record. Since April 6, 2009, the common stock of the Company has been traded on the Global Market of The NASDAQ Stock Market under the symbol “TOBC”. Prior to that, our common stock was traded on the Over-the-Counter Bulletin Board (“OTCBB”).
The following table presents, for the calendar quarters indicated, per share cash dividends declared and the high and low bid prices for our common stock as reported on the OTCBB, and since April 6, 2009, the high and low sales prices reported on the NASDAQ Global Market, in U.S. dollars. OTCBB quotations reflect inter-dealer prices, without markup, markdown or commissions, and may not represent actual transactions.
Dividends paid to Tower are primarily provided from Graystone Tower Bank’s dividends to Tower. The payment of dividends by Graystone Tower Bank to Tower is subject to the restrictions described in Note 19 to the Consolidated Financial Statements included in Item 8 of this Report, which information is incorporated by reference in this Item 5. In the merger agreement with Graystone Financial Corp. we committed to maintain our annual dividend rate of at least $1.12 per share for two years after the merger, which was consummated on March 31, 2009. subject to there being sufficient funds legally available to pay the dividend and further provided that we continue to be “well capitalized” on a consolidated basis in accordance with applicable regulatory guidelines following the payment of the dividend. We did not repurchase any shares of our common stock during the year ended December 31, 2009.
| Price Range | Cash Dividend | ||||||||
| Low | High | Paid Per Share | |||||||
| 2009 |
|||||||||
| First Quarter(1) (2) |
$ | 19.00 | $ | 26.50 | $ | 1.40 | |||
| Second Quarter |
22.50 | 37.50 | 0.28 | ||||||
| Third Quarter |
25.26 | 37.00 | 0.28 | ||||||
| Fourth Quarter |
19.06 | 26.75 | 0.28 | ||||||
| 2008 |
|||||||||
| First Quarter(1) |
$ | 38.25 | $ | 41.50 | $ | 0.28 | |||
| Second Quarter(1) |
37.10 | 39.45 | 0.28 | ||||||
| Third Quarter(1) |
28.50 | 11.25 | 0.28 | ||||||
| Fourth Quarter(1) |
19.00 | 32.00 | 0.28 | ||||||
(1) The cash dividend information included in this table for periods prior to March 31, 2009 relates to dividends declared and paid by Tower Bancorp Inc. prior to the merger with Graystone Financial Corp. Since the historical information of the Company is that of Graystone Financial Corp, resulting from the merger being accounted for as a reverse acquisition, these dividends are not reflected within the historical financial statements or associated footnotes.
(2) The cash dividend declared and paid by the Company during the first quarter of 2009 includes a special dividend of $1.12 per share as prescribed by the Merger Agreement.
18
Table of Contents
Securities Authorized for Issuance under Equity Compensation Plans
The following table provides information about options outstanding under the Company’s 2007 Stock Incentive Plan, 1995 Non-Qualified Stock Option Plan, and the Stock Option Plan for Outside Directors as of December 31, 2009:
| Plan Category |
Number of securities to be issued upon exercise of outstanding options, warrants and rights |
Weighted-average exercise price of outstanding options, warrants and rights |
Number of securities remaining available for future issuance under equity compensation plans (excluding securities reflected in first column) | ||||
| Equity compensation plans approved by security holders |
179,995 | $ | 25.98 | 155,594 | |||
| Equity compensation plans not approved by security holders |
— | — | — | ||||
| Total |
179,995 | $ | 25.98 | 155,594 | |||
Performance Graph
The graph below shows cumulative investment returns to shareholders based on the assumptions that an investment of $100.00 was made on December 31, 2004, in each of the following: (i) Tower Bancorp, Inc common stock; (ii) the stock of all companies traded on the broad-market Russell 3000 Index; (iii) the stock of all companies included in the SNL Bank Index; and (iv) a peer group consisting of banking and financial holding companies with total assets between $1-$5 billion that are included and tracked within the SNL Bank $1B-$5B Index.
The graph below is furnished under this Part II Item 5 of this Form 10-K and shall not be deemed to be “soliciting material” or to be “filed” with the Commission or subject to Regulation 14A or 14C, or to the liabilities of Section 18 of the Exchange Act of 1934, as amended.
19
Table of Contents
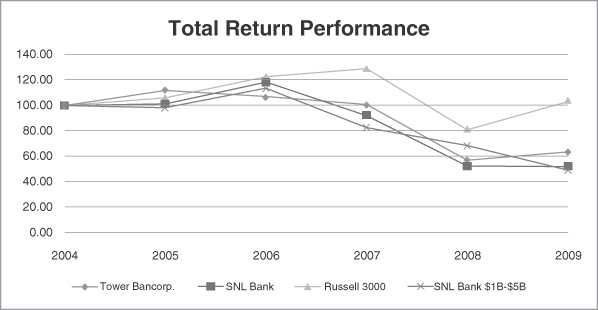
| Period Ending | ||||||||||||||||||
| Index |
2004 | 2005 | 2006 | 2007 | 2008 | 2009 | ||||||||||||
| Tower Bancorp, Inc. |
$ | 100.00 | $ | 111.91 | $ | 107.16 | $ | 100.85 | $ | 57.02 | $ | 63.68 | ||||||
| SNL Bank |
$ | 100.00 | $ | 101.36 | $ | 118.57 | $ | 92.14 | $ | 52.57 | $ | 52.03 | ||||||
| Russell 3000 |
$ | 100.00 | $ | 106.12 | $ | 122.80 | $ | 129.11 | $ | 80.94 | $ | 103.08 | ||||||
| SNL Bank $1B-$5B |
$ | 100.00 | $ | 98.29 | $ | 113.74 | $ | 82.85 | $ | 68.72 | $ | 49.26 | ||||||
Issuer Purchases of Equity Securities
Not Applicable.
20
Table of Contents
| Item 6. | Selected Financial Data |
5-YEAR CONSOLIDATED SUMMARY OF FINANCIAL RESULTS(1)
(dollars in thousands, except per-share data)
| Period from Sept. 2, 2005 (Inception date) to December 31, 2005 |
||||||||||||||||||||
| For the Years Ended December 31, | ||||||||||||||||||||
| 2009 | 2008 | 2007 | 2006 | |||||||||||||||||
| SUMMARY OF OPERATIONS | ||||||||||||||||||||
| Interest income |
$ | 56,383 | $ | 32,157 | $ | 24,313 | $ | 10,618 | $ | 251 | ||||||||||
| Interest expense |
20,428 | 16,481 | 13,586 | 5,899 | 98 | |||||||||||||||
| Net interest income |
35,955 | 15,676 | 10,727 | 4,719 | 153 | |||||||||||||||
| Provision for loan losses |
5,216 | 2,550 | 1,997 | 1,756 | 400 | |||||||||||||||
| Non-interest income |
8,828 | 3,089 | 1,592 | 367 | 5 | |||||||||||||||
| Non-interest expense |
31,949 | 13,800 | 10,674 | 6,413 | 1,321 | |||||||||||||||
| Merger expense |
2,080 | — | — | — | — | |||||||||||||||
| Income (loss) before income taxes |
5,538 | 2,415 | (352 | ) | (3,083 | ) | (1,563 | ) | ||||||||||||
| Income taxes |
1,829 | 333 | (6 | ) | — | — | ||||||||||||||
| Net income (loss) |
3,709 | 2,082 | (346 | ) | (3,083 | ) | (1,563 | ) | ||||||||||||
| PER COMMON SHARE | ||||||||||||||||||||
| Net Income (Loss) Per Common Share |
||||||||||||||||||||
| Basic |
$ | 0.72 | $ | 0.76 | $ | (0.19 | ) | $ | (2.88 | ) | $ | (1.54 | ) | |||||||
| Diluted |
$ | 0.72 | $ | 0.76 | $ | (0.19 | ) | $ | (2.88 | ) | $ | (1.54 | ) | |||||||
| Dividends declared |
$ | 0.84 | $ | — | $ | — | $ | — | $ | — | ||||||||||
| Weighted Average Common Shares Outstanding |
||||||||||||||||||||
| Basic |
5,156,078 | 2,734,027 | 1,867,767 | 1,070,519 | 1,014,300 | |||||||||||||||
| Diluted |
5,161,325 | 2,734,027 | 1,867,767 | 1,070,519 | 1,014,300 | |||||||||||||||
| Common shares outstanding at period end |
7,122,683 | 2,740,325 | 2,733,663 | 1,246,700 | 1,014,300 | |||||||||||||||
| Book value per share |
$ | 23.02 | $ | 19.99 | $ | 19.05 | $ | 11.21 | $ | 14.30 | ||||||||||
| Book value per share (tangible) |
$ | 20.86 | $ | 19.99 | $ | 19.05 | $ | 11.21 | $ | 14.30 | ||||||||||
| RATIOS | ||||||||||||||||||||
| Return on average assets |
0.32 | % | 0.38 | % | -0.10 | % | -1.98 | % | -5.48 | % | ||||||||||
| Return on average tangible assets |
0.35 | % | 0.38 | % | -0.10 | % | -1.98 | % | -5.48 | % | ||||||||||
| Return on average equity |
3.22 | % | 3.90 | % | -1.15 | % | -21.96 | % | -10.22 | % | ||||||||||
| Net interest margin |
3.49 | % | 2.97 | % | 3.24 | % | 3.10 | % | 2.89 | % | ||||||||||
| Efficiency ratio |
75.99 | % | 73.54 | % | 86.64 | % | 126.09 | % | 836.08 | % | ||||||||||
| Dividend Payout Ratio |
116.67 | % | 0.00 | % | 0.00 | % | 0.00 | % | 0.00 | % | ||||||||||
| Average equity to average assets ratio |
9.92 | % | 9.73 | % | 8.84 | % | 9.01 | % | 53.62 | % | ||||||||||
| PERIOD-END BALANCES | ||||||||||||||||||||
| Total assets |
$ | 1,470,583 | $ | 641,318 | $ | 446,412 | $ | 245,095 | $ | 65,091 | ||||||||||
| Investment securities |
189,853 | 19,904 | 27,931 | 63,734 | 36,807 | |||||||||||||||
| Loans, net of unearned income |
1,146,305 | 571,046 | 390,274 | 172,519 | 25,638 | |||||||||||||||
| Allowance for Loan Losses |
9,695 | 6,017 | 4,148 | 2,516 | 400 | |||||||||||||||
| Goodwill and intangible assets |
15,302 | — | — | — | — | |||||||||||||||
| Deposits and securities sold under repurchased agreements |
1,223,361 | 533,854 | 385,391 | 223,622 | 40,638 | |||||||||||||||
| Borrowings |
70,981 | 43,614 | 4,430 | 6,200 | 9,714 | |||||||||||||||
| Shareholders’ equity |
163,877 | 54,785 | 52,085 | 13,971 | 14,502 | |||||||||||||||
(1) Due to the merger of Tower Bancorp, Inc. and Graystone Financial Corp. on March 31, 2009, all periods prior to March 31, 2009 represent the results of Graystone Financial Corp. as the accounting acquirer in the merger
21
Table of Contents
| Item 7. | Management’s Discussion and Analysis of Financial Condition and Results of Operations |
OVERVIEW
Management’s discussion and analysis of the changes in the consolidated results of operations, financial condition, and cash flows of Tower Bancorp, Inc. and its subsidiary is set forth below for the periods indicated. Unless the context requires otherwise, the terms “Tower,” “we,” “us,” and “our” refer to Tower Bancorp, Inc. and its wholly-owned subsidiary, Graystone Tower Bank. Through Graystone Tower Bank, we provide banking and banking related services to our customers within our principal market areas consisting of Centre, Cumberland, Dauphin, Franklin, Fulton, Lancaster, Lebanon, and York Counties of Pennsylvania and Washington County, Maryland. The following discussion and analysis, the purpose of which is to provide investors and others with information that we believe to be necessary for an understanding of Tower’s financial condition, changes in financial condition, and results of operations, should be read in conjunction with the consolidated financial statements, notes, and other information contained in this report.
FORWARD-LOOKING STATEMENTS
We have made, and may continue to make, certain forward-looking statements in this Report, including information incorporated by reference in this Report. These forward-looking statements are intended to be covered by the safe harbor for forward-looking statements provided by the Private Securities Litigation Reform Act of 1995. Forward-looking statements are not statements of historical fact, and can be identified by the use of forward-looking terminology such as “believe,” “expect,” “may,” “will,” “should,” “project,” “plan,” “seek,” “target,” “intend” or “anticipate” or the negative thereof or comparable terminology. Forward-looking statements include discussions of strategy, financial projections and estimates and their underlying assumptions, statements regarding plans, objectives, expectations or consequences of various transactions, and statements about the future performance, operations, products and services of Tower and our subsidiaries. These forward-looking statements are subject to various assumptions, risks, uncertainties and other factors including, but not limited to, the risk factors discussed in this Report under Item 1A. “Risk Factors,” as well as the following: market risk; changes or adverse developments in economic, political, or regulatory conditions; a continuation or worsening of the current disruption in credit and other markets; the effect of competition and interest rates on net interest margin and net interest income; investment strategy and income growth; investment securities gains; declines in the value of securities which may result in charges to earnings; changes in rates of deposit and loan growth; asset quality and the impact on assets from adverse changes in the economy and in credit or other markets and resulting effects on credit risk and asset values; balances of risk-sensitive assets to risk-sensitive liabilities; salaries and employee benefits and other expenses; amortization of intangible assets; capital and liquidity strategies and other financial and business matters for future periods.
Because of the possibility of changes in these assumptions, actual results could differ materially from those contained in any forward-looking statements. We encourage readers of this Report to understand forward-looking statements to be strategic objectives rather than absolute targets of future performance. Forward-looking statements are qualified in their entirety by the risk factors and cautionary statements contained in this Report and speak only as of the date they are made. We do not undertake any obligation to update publicly any forward-looking statements to reflect circumstances or events that occur after the date the forward-looking statements are made or to reflect the occurrence of unanticipated events except as required by law.
Availability of Information
Our web-site address is www.towerbancorp.com. We make available free of charge, through the Investor Relations section of our web site, our Annual Reports on Form 10-K, Quarterly Reports on Form 10-Q, current reports on Form 8-K, and all amendments to those reports as soon as reasonably practicable after such material is electronically filed with or furnished to the Securities and Exchange Commission.
22
Table of Contents
Mergers and Acquisitions
On March 31, 2009, Tower Bancorp, Inc. completed the merger with Graystone Financial Corp., (“Graystone”) in an all stock transaction valued at approximately $57.9 million. The merger, while considered a merger of equals, is accounted for as a reverse acquisition by Graystone Financial Corp. of Tower Bancorp, Inc. using the acquisition method of accounting and, accordingly, the assets and liabilities of Tower Bancorp, Inc. have been recorded at their respective fair values on the date the merger was completed. Furthermore, the historical financial information included in Tower’s consolidated financial statements and related footnotes as reported in this Form 10-K is that of Graystone Financial Corp. The merger was effected by the issuance of shares of Tower Bancorp, Inc. common stock to Graystone shareholders. Each share of Graystone common stock was exchanged for 0.42 shares of Tower common stock, with any fractional shares as a result of the exchange, paid to Graystone shareholders in cash based on $19.78 per share of Tower common stock.
Pursuant to the Agreement and Plan of Merger, Tower Bancorp, Inc. is the surviving bank holding company and its wholly-owned subsidiary, The First National Bank of Greencastle, merged with and into Graystone’s wholly owned subsidiary, Graystone Bank, with Graystone Bank as the surviving institution, under the name “Graystone Tower Bank” (the “Bank”). The Bank operates as the sole subsidiary of Tower Bancorp, Inc. through two divisions – “Graystone Bank, a division of Graystone Tower Bank”, consisting of the former Graystone Bank branches, and “Tower Bank, a division of Graystone Tower Bank,” consisting of the former branches of The First National Bank of Greencastle.
The merger deepened Tower’s foundation in central Pennsylvania with expansion into Centre, Cumberland, Dauphin, Lancaster, Lebanon, and York Counties of Pennsylvania. As a result, the Bank now serves eight counties in Central Pennsylvania and one county in Maryland. Our operating philosophy will continue to be a community-oriented financial services company with a strong customer focus. We believe the merger has enhanced our business opportunities due to the Bank having a greater market share, market presence and the ability to offer more diverse and more profitable products, as well as a broader based and geographically diversified branch system to enhance deposit collection and the funding costs, and a higher legal lending limit to originate larger and more profitable commercial loans. We also believe that the merger of the two banks into one surviving bank, Graystone Tower Bank, will provide greater efficiency, customer service, and product delivery than it would achieve by operating under a multi-bank holding company structure.
On December 27, 2009, Tower Bancorp, Inc. and First Chester County Corporation (“First Chester”) entered into an Agreement and Plan of Merger pursuant to which Tower will acquire First Chester in an all-stock transaction valued at approximately $65 million or $10.22 per share based on the closing price of Tower common stock at the announcement of the Merger Agreement. In the merger, First Chester shareholders will receive 0.453 shares of Tower common stock for each share of First Chester common stock they hold on the effective date of the merger. As described in the definitive merger agreement, the exchange ratio is subject to upward or downward adjustment if loan delinquencies at First Chester increase or decrease beyond specified amounts.
As part of the definitive agreement, Tower’s subsidiary bank, Graystone Tower Bank, agreed to increase its lending facility with First Chester to up to $26 million as well as to purchase up to $100 million of residential mortgage and commercial loans from First National Bank of Chester County (“FNB”) in order for FNB to satisfy the regulatory capital requirements of the Office of the Comptroller of the Currency (the “OCC”). As of December 31, 2009, the Bank loaned $26 million to First Chester, the proceeds of which, First Chester contributed to FNB as Tier 1 capital. First Chester pledged 100% of in the capital stock of FNB to Graystone Tower Bank to secure repayment of the loan. The Bank has also purchased approximately $52 million in performing commercial loans from FNB during December of 2009.
Following the transaction, based on the 0.453 exchange ratio, current Tower shareholders will own approximately 71% and First Chester shareholders will own approximately 29% of the combined company’s common stock. The shareholders of both entities must approve the combination. Pending final regulatory and shareholder approvals, the merger is expected to be completed during the second quarter of 2010.
23
Table of Contents
RESULTS FROM OPERATIONS
Summary Financial Results
The merger of Tower Bancorp, Inc. and Graystone Financial Corp. on March 31, 2009 has had a significant impact on our results of operations. The results for the year ended December 31, 2009 include the operating results of the historic Graystone for the entire year and only the operating results since March 30, 2009 for the historical Tower, representing the period after consummation of the Merger which was effective before the opening of business on March 31, 2009. The year-to-date results also include pre-tax merger expenses of approximately $2.1 million incurred by Graystone. Under the United States Generally Accepted Accounting Principles (“U.S. GAAP”), these merger expenses are reflected in the statement of operations in the period in which the expenses are incurred. In addition, the prior year period and all historical information provided herein represents the results of Graystone as the accounting acquirer in the Merger. Consequently, comparisons to 2008 may not be particularly meaningful. The Graystone audited financial statements and footnotes for the year ended December 31, 2008 have been filed with the Securities and Exchange Commission (“SEC”) within Form 8-K/A on June 1, 2009.
For the year ending December 31, 2009, we recognized an after-tax net income of $3.7 million or $0.72 per diluted share, compared to net income of $2.1 million or $0.76 per diluted share 2008. The increase was primarily the result of the combined operations of the mergerd banks offset by expenses related to the FDIC special assessment of $580 thousand, the recognition of pre-tax merger related expenses of approximately $2.1 million, and writedown of deferred tax assets of $181 thousand. When excluding these items from earnings on an after-tax basis, net income would have been $5.9 million or $1.13 per diluted share. Net interest income before loan loss provision increased $20.3 million or 129.4% during 2009 compared to the same period in 2008. In addition to the net interest income contributed by the inclusion of the Tower Bank division’s operations, which added $12.0 million, this growth was also driven by organic growth of net interest-earning assets. The provision for loan losses increased by $2.7 million as a result of normal loan growth, requiring additional reserves to maintain appropriate loss coverage levels. Non-interest income increased by $5.7 million due to increased service charges on deposit accounts, commissions and fees, gains on sales of mortgage loans originated for sale, income generated from bank owned life insurance policies, and gains recognized in connection with the satisfaction of purchased impaired loans. Non-interest expense, excluding merger related expenses, increased by $18.1 million primarily due to increases in compensation costs, occupancy expenses, FDIC insurance premiums and data processing expenses incurred in order to support our continued growth of assets and deposits.
Net Interest Income
Net interest income is the most significant component of our net income. Net interest income increased $20.3 million or 129.4% to approximately $36.0 million for the year ended December 31, 2009, as compared to approximately $15.7 million for 2008. The $20.3 million increase in net interest income includes $12.0 million as a result of the net contribution from interest-earning assets and interest-earning liabilities from the Tower Bank division as result of the Merger on March 31, 2009. Excluding the effect of the Merger, net interest income increased by $8.3 million or 52.9% over the year ended December 31, 2008.
The following table provides a comparative average balance sheet and net interest income analysis for 2009 compared to 2008 and 2007. Interest income and yields are presented on a fully taxable-equivalent (FTE) basis, using a 34% Federal tax rate. The discussion following this table is based on these tax-equivalent amounts. We manage our risk associated with changes in interest rates through the techniques described in this Report under Item 7A. Quantitative and Qualitative Disclosures About Market Risk. All dollar amounts are in thousands.
24
Table of Contents
| For the Year Ended December 31, | ||||||||||||||||||||||||||||||
| 2009 | 2008 | 2007 | ||||||||||||||||||||||||||||
| Average Balance |
Interest | Average Rate |
Average Balance |
Interest | Average Rate |
Average Balance |
Interest | Average Rate |
||||||||||||||||||||||
| Interest-earning assets: |
||||||||||||||||||||||||||||||
| Federal funds sold and others |
$ | 32,565 | 123 | 0.38 | % | $ | 8,764 | 247 | 2.82 | % | $ | 22,378 | 1,150 | 5.14 | % | |||||||||||||||
| Investment securities (1) |
88,961 | 2,024 | 2.28 | % | 27,780 | 925 | 3.33 | % | 32,160 | 1,655 | 5.15 | % | ||||||||||||||||||
| Loans |
909,476 | 54,304 | 5.97 | % | 492,106 | 31,026 | 6.30 | % | 276,252 | 21,512 | 7.79 | % | ||||||||||||||||||
| Total interest-earning assets |
1,031,002 | 56,451 | 5.48 | % | 528,650 | 32,198 | 6.09 | % | 330,790 | 24,317 | 7.35 | % | ||||||||||||||||||
| Other assets |
128,214 | 20,367 | 10,289 | |||||||||||||||||||||||||||
| Total assets |
$ | 1,159,216 | $ | 549,017 | $ | 341,079 | ||||||||||||||||||||||||
| Interest-bearing liabilities: |
||||||||||||||||||||||||||||||
| Interest-bearing non-maturity deposits |
$ | 503,998 | 7,640 | 1.52 | % | $ | 130,038 | 3,165 | 2.43 | % | $ | 86,533 | 3,564 | 4.12 | % | |||||||||||||||
| Time deposits |
365,623 | 10,323 | 2.82 | % | 276,821 | 11,941 | 4.31 | % | 171,941 | 8,792 | 5.11 | % | ||||||||||||||||||
| Borrowings |
68,053 | 2,465 | 3.62 | % | 46,198 | 1,375 | 2.98 | % | 26,527 | 1,230 | 4.64 | % | ||||||||||||||||||
| Total interest-bearing liabilities |
937,674 | 20,428 | 2.18 | % | 453,057 | 16,481 | 3.64 | % | 285,001 | 13,586 | 4.77 | % | ||||||||||||||||||
| Demand deposits |
83,362 | 32,610 | 22,403 | |||||||||||||||||||||||||||
| Other liabilities |
23,144 | 9,952 | 3,532 | |||||||||||||||||||||||||||
| Stockholders’ equity |
115,037 | 53,398 | 30,143 | |||||||||||||||||||||||||||
| Total liabilities and stockholders’ equity |
$ | 1,159,216 | $ | 549,017 | $ | 341,079 | ||||||||||||||||||||||||
| Net interest spread |
3.30 | % | 2.45 | % | 2.58 | % | ||||||||||||||||||||||||
| Net interest income and interest rate margin FTE |
36,023 | 3.49 | % | 15,717 | 2.97 | % | 10,731 | 3.24 | % | |||||||||||||||||||||
| Tax equivalent adjustment |
(68 | ) | (41 | ) | (4 | ) | ||||||||||||||||||||||||
| Net interest income |
35,955 | 15,676 | 10,727 | |||||||||||||||||||||||||||
| Ratio of average interest-earning assets to average interest-bearing liabilities |
110.0 | % | 116.7 | % | 116.1 | % | ||||||||||||||||||||||||
(1) The average yields for investment securities available for sale are reported on a fully taxable-equivalent basis at a rate of 34%
25
Table of Contents
The following table sets forth a summary of changes in FTE interest income and expense resulting from changes in average balances (volumes) and changes in rates:
| Year Ended | Year Ended | ||||||||||||||||||||||
| December 31, 2009 vs. December 31, 2008 |
December 31, 2008 vs. December 31, 2007 |
||||||||||||||||||||||
| Increase (Decrease) Due to | Increase (Decrease) Due to | ||||||||||||||||||||||
| Volume | Rate | Total | Volume | Rate | Total | ||||||||||||||||||
| (in thousands) | (in thousands) | ||||||||||||||||||||||
| Interest income: |
|||||||||||||||||||||||
| Federal funds sold |
$ | 230 | $ | (354 | ) | $ | (124 | ) | $ | (519 | ) | $ | (384 | ) | $ | (903 | ) | ||||||
| Investment securities |
1,473 | (374 | ) | 1,099 | (203 | ) | (527 | ) | (730 | ) | |||||||||||||
| Loans |
25,003 | (1,725 | ) | 23,278 | 14,236 | (4,722 | ) | 9,514 | |||||||||||||||
| Total interest income |
26,706 | (2,453 | ) | 24,253 | 13,514 | (5,633 | ) | 7,881 | |||||||||||||||
| Interest expense: |
|||||||||||||||||||||||
| Interest-bearing non-maturity deposits |
6,067 | (1,592 | ) | 4,475 | 1,388 | (1,787 | ) | (399 | ) | ||||||||||||||
| Time deposits |
3,193 | (4,811 | ) | (1,618 | ) | 4,695 | (1,546 | ) | 3,149 | ||||||||||||||
| Borrowings |
747 | 343 | 1,090 | 691 | (546 | ) | 145 | ||||||||||||||||
| Total interest expenses |
10,007 | (6,061 | ) | 3,947 | 6,774 | (3,879 | ) | 2,895 | |||||||||||||||
| Net interest income |
$ | 16,699 | $ | 3,607 | $ | 20,306 | $ | 6,740 | $ | (1,754 | ) | $ | 4,986 | ||||||||||
2009 vs. 2008
Interest income increased approximately $24.3 million, or 75.3%. This increase was caused by an approximate $502.4 million or 95.0% increase in the average balance of interest-earning assets, which resulted in approximately $26.7 million increase to interest income. This increase was partially offset by a 61 basis point reduction in average rates that resulted in a reduction of interest income of approximately $2.4 million. Currently, we are committed to improving the average rate on loans through the use of interest rate floors, where possible, in our existing and new variable rate commercial loan portfolios.
Interest income on investment securities increased approximately $1.1 million or 118.8%. The average balance of investments held by the Bank increased from $27.8 million in 2008 to $89.0 million, which resulted in an increase of approximately $1.5 million in interest income. The increase in the average balance of investment securities relates primarily to the addition of securities acquired through the merger as well as additional investments purchased following our common stock offering in September 2009. The capital raised through the common stock offering was used to purchase higher-yielding collateralized mortgage obligation securities and SBA pooled loan securitizations as well as other lower risk debt securities. These investments served as an initial way for management to deploy the acquired capital into interest earning assets until the proceeds were required to fund future loan growth slated for the first quarter of 2010. This increase is offset by the reduction in the interest rates earned on securities primarily due to the overall reduced interest rate environment as compared to 2008. The reduction of 105 basis points on the average rate resulted in a reduction of interest income of $374 thousand.
Average yields on loans decreased 33 basis points or 5.3%, from 6.30% during 2008 to 5.97% during 2009. As mentioned above, the decrease is reflective of the reduced interest rate environment. During 2008, the Federal Reserve reduced the intended federal funds target rate from 4.11% at January 2, 2008 to 2.47% at June 30, 2008 and drastically cutting the rate to less than 1.00% during the middle of October 2008. During 2009, the intended federal funds target rate saw very little change as the rate remained below 0.25%. Due to the nominal levels of the intended federal funds target rate downward pressure was placed on the prime rate and all other lending rates, further adding to the reduced interest rate environment in 2009 as compared to 2008. Average yields did not decrease as severely as the reduction in the aforementioned rates since fixed rate loans, which represent
26
Table of Contents
approximately 25% of total loans held at December 31, 2009, do not reprice when short-term rates decline. Additionally, the total effect of downward loan repricing on variable rate loans will not coincide with the decrease in the aforementioned rates due to the fact that approximately 86% of our variable rate consumer loans at December 31, 2009 contain interest rate floors.
Interest expense increased $3.9 million or 24.0% during 2009 compared to 2008. This increase was caused by approximately $484.6 million or 107.0% increase in the average balance of interest-bearing liabilities, which resulted in approximately $10.0 million increase to interest expense. This increase was predominately offset by a 146 basis point reduction in the average rate paid on interest-bearing liabilities, which resulted in a reduction of interest expense of approximately $6.1 million. This reduction in average rates paid on interest-bearing liabilities was the result of lower rates paid on interest-bearing non-maturity deposit accounts, time deposits, and borrowings.
In future periods, assuming a prolonged flat or declining rate environment, we expect an increase in the total amount of net interest income driven by continued growth in average interest-earning assets, the continued use of floors in our variable rate commercial loan portfolio, and the continued repricing of a portion of our interest-bearing time deposit portfolio into lower rate products. Any significant changes such as rapid movement in interest rates set by the Federal Reserve, changes in the performance of our interest earning assets, the continued repricing of assets, and the inability to move deposit rates in similar increments as earning asset rates may mitigate this benefit in the future.
The benefit associated with an increase in interest rates in the future might not be immediately realized due to the use of interest rate floors. Presumably, an increase in future interest rates would cause repricing in all assets and liabilities linked to variable rate indices; however, as deposit products would experience any increase on a relatively immediate basis, loan products with floors in place would require a rate increase such that the resulting rate earned on the loan would exceed the floor. Refer to Item 7A Quantitative and Qualitative Disclosures About Market Risk for a more detailed discussion of interest rate risk.
2008 vs. 2007
Interest income increased approximately $7.9 million, or 32.4%. This increase was caused by approximately $197.9 million or 59.8% increase in the average balance of interest-earning assets, which resulted in approximately $13.5 million increase to interest income. This increase was partially offset by a 126 basis point reduction in average rates that resulted in a reduction of interest income of approximately $5.6 million.
Average yields on loans decreased 148 basis points or 19.0%, from 7.79% during 2007 to 6.30% during 2008. As mentioned above, the decrease is reflective of the reduced interest rate environment. From 2007 to 2008, the Federal Reserve reduced the intended federal funds target rate by 292 basis points from 3.06% at December 31, 2007 to 0.14% at December 31, 2008. This rate decrease, resultantly, placed downward pressure on the prime rate and all other lending rates, further adding to the reduced interest rate environment. Average yields did not decrease as severely as the reduction in the aforementioned rates since fixed rate loans, which represent approximately 20% of total loans held at December 31, 2008, do not reprice when short-term rates declined. Additionally, the total effect of downward loan repricing on variable rate loans will not coincide with the decrease in the aforementioned rates due to the fact that approximately 60% of our variable rate loans at December 31, 2008 contain interest rate floors.
Interest expense increased $2.9 million, or 21.3% during 2008 compared to 2007. This increase was caused by approximately $168.1 million or 59.0% increase in the average balance of interest-bearing liabilities, which resulted in approximately $6.8 million increase to interest expense. This increase was predominately offset by a
27
Table of Contents
113 basis point reduction in the average rate paid on interest-bearing liabilities, which resulted in a reduction of interest expense of approximately $3.9 million. This reduction in average rates paid on interest-bearing liabilities was the result of lower rates paid on interest-bearing non-maturity deposit accounts, time deposits, and borrowings.
Provision and Allowance for Credit Losses
We account for the credit risk associated with lending activities through our allowance for credit losses and provision for loan losses. The provision is the expense recognized on the consolidated statements of operations to adjust the allowance to its proper balance, as determined through the application of our allowance methodology procedures. These procedures include the evaluation of the risk characteristics of the portfolio and documentation in accordance with the U.S. GAAP, “Selected Loan Loss Allowance Methodology and Documentation Issues”. See the “Critical Accounting Policies” section of Management’s Discussion for a discussion of our allowance for credit loss evaluation methodology.
A summary of our loan loss experience follows:
ALLOWANCE FOR LOAN LOSSES
(dollars in thousands)
| Period from Sept. 2, 2005 (Inception date) to December 31, 2005 | ||||||||||||||||||
| For the Years Ended December 31, | ||||||||||||||||||
| 2009 | 2008 | 2007 | 2006 | |||||||||||||||
| Total loans outstanding at period end |
$ | 1,146,305 | $ | 571,046 | $ | 390,274 | $ | 172,519 | $ | 25,638 | ||||||||
| Daily average balance of loans, net of unearned income |
$ | 909,476 | $ | 492,106 | $ | 276,252 | $ | 105,995 | $ | 8,626 | ||||||||
| Balance at beginning of period |
$ | 6,017 | $ | 4,148 | $ | 2,156 | $ | 400 | $ | — | ||||||||
| Provision for loan losses |
5,216 | 2,550 | 1,997 | 1,756 | 400 | |||||||||||||
| Charge-offs |
||||||||||||||||||
| Commercial |
(1,398 | ) | (633 | ) | — | — | — | |||||||||||
| Consumer |
(193 | ) | (1 | ) | (5 | ) | — | — | ||||||||||
| Residential mortgages |
(7 | ) | (47 | ) | — | — | — | |||||||||||
| Total Charge-offs |
(1,598 | ) | (681 | ) | (5 | ) | — | — | ||||||||||
| Recoveries |
||||||||||||||||||
| Commercial |
47 | — | — | — | — | |||||||||||||
| Consumer |
13 | — | — | — | — | |||||||||||||
| Residential mortgages |
— | — | — | — | — | |||||||||||||
| Total Recoveries |
60 | — | — | — | — | |||||||||||||
| Net charge-offs |
(1,538 | ) | (681 | ) | (5 | ) | — | — | ||||||||||
| Balance at end of period |
$ | 9,695 | $ | 6,017 | $ | 4,148 | $ | 2,156 | $ | 400 | ||||||||
28
Table of Contents
CREDIT FAIR VALUE ADJUSTMENT ON PURCHASED LOANS
(dollars in thousands)
| Period from Sept. 2, 2005 (Inception date) to December 31, 2005 |
||||||||||||||||||||
| For the Years Ended December 31, | ||||||||||||||||||||
| 2009 | 2008 | 2007 | 2006 | |||||||||||||||||
| Balance at beginning of period |
$ | — | $ | — | $ | — | $ | — | $ | — | ||||||||||
| Credit Fair Value Adjustment Mark |
4,044 | — | — | — | — | |||||||||||||||
| Amortization |
(756 | ) | — | — | — | — | ||||||||||||||
| Charge-offs |
||||||||||||||||||||
| Commercial |
(61 | ) | — | — | — | — | ||||||||||||||
| Consumer |
(259 | ) | — | — | — | — | ||||||||||||||
| Residential mortgages |
(236 | ) | — | — | — | — | ||||||||||||||
| Total Charge-offs |
(556 | ) | — | — | — | — | ||||||||||||||
| Recoveries |
||||||||||||||||||||
| Commercial |
86 | — | — | — | — | |||||||||||||||
| Consumer |
123 | — | — | — | — | |||||||||||||||
| Residential mortgages |
1 | — | — | — | — | |||||||||||||||
| Total Recoveries |
210 | — | — | — | — | |||||||||||||||
| Net charge-offs |
(346 | ) | — | — | — | — | ||||||||||||||
| Balance at end of period |
$ | 2,942 | $ | — | $ | — | $ | — | $ | — | ||||||||||
| 2009 | 2008 | 2007 | 2006 | 2005 | ||||||||||||||||
| QUALITY ASSET RATIOS | ||||||||||||||||||||
| Loan loss reserve to total loans* |
0.85 | % | 1.05 | % | 1.06 | % | 1.25 | % | 1.56 | % | ||||||||||
| Credit loss reserve to total loans* |
1.11 | % | 1.05 | % | 1.06 | % | 1.25 | % | 1.56 | % | ||||||||||
| Non-accrual loans to total loans* |
0.41 | % | 0.24 | % | 0.02 | % | n/m | n/m | ||||||||||||
| Net charge-offs to average loans |
0.17 | % | 0.14 | % | 0.00 | % | n/m | n/m | ||||||||||||
| Non-performing assets to total assets |
0.53 | % | 0.23 | % | 0.02 | % | n/m | n/m | ||||||||||||
| Non-performing loans to total loans* |
0.60 | % | 0.26 | % | 0.02 | % | n/m | n/m | ||||||||||||
| Allowance for loan losses to non-performing loans |
142.07 | % | 409.32 | % | n/m | n/m | n/m | |||||||||||||
| Allowance for credit losses to non-performing loans* |
185.18 | % | 409.32 | % | n/m | n/m | n/m | |||||||||||||
n/m - not meaningful
* Total loans excludes the impaired loans purchased as part of the Merger
29
Table of Contents
The following table presents the aggregate amount of non-accrual and past due loans and other real estate owned:
NON PERFORMING ASSETS
(dollars in thousands)
| For the Year Ended | |||||||||||||||
| December 31, | |||||||||||||||
| 2009 | 2008 | 2007 | 2006 | 2005 | |||||||||||
| Non-accrual loans |
|||||||||||||||
| Commercial |
$ | 3,408 | $ | 1,127 | $ | — | $ | — | $ | — | |||||
| Consumer |
320 | 236 | — | — | — | ||||||||||
| Residential mortgages |
990 | 3 | 87 | — | — | ||||||||||
| Total non-accrual loans |
$ | 4,718 | $ | 1,366 | $ | 87 | $ | — | $ | — | |||||
| Accruing loans greater than 90 days past due |
|||||||||||||||
| Commercial |
634 | — | — | — | — | ||||||||||
| Consumer |
48 | 104 | — | — | — | ||||||||||
| Residential mortgages |
1,424 | — | — | — | — | ||||||||||
| Total accruing loans greater than 90 days past due |
2,106 | 104 | — | — | — | ||||||||||
| Non-performing loans |
6,824 | 1,470 | 87 | — | — | ||||||||||
| Other real estate owned |
927 | — | — | — | — | ||||||||||
| Non-performing assets |
$ | 7,751 | $ | 1,470 | $ | 87 | $ | — | $ | — | |||||
The following table summarizes the allocation of the allowance for loan losses by loan type:
| December 31, | ||||||||||||||||||||||||||||||
| 2009 | 2008 | 2007 | 2006 | 2005 | ||||||||||||||||||||||||||
| (dollars in thousands) | ||||||||||||||||||||||||||||||
| Allowance | % of Loans In Each Category |
Allowance | % of Loans In Each Category |
Allowance | % of Loans in Each Category |
Allowance | % of Loans in Each Category |
Allowance | % of Loans in Each Category |
|||||||||||||||||||||
| Commercial |
$ | 9,248 | 75.69 | % | $ | 5,672 | 89.58 | % | $ | 3,917 | 91.52 | % | $ | 2,044 | 94.81 | % | $ | 358 | 89.53 | % | ||||||||||
| Consumer |
129 | 7.51 | % | 289 | 9.52 | % | 205 | 4.65 | % | — | — | — | — | |||||||||||||||||
| Residential Mortgages |
318 | 16.80 | % | 56 | 0.90 | % | 26 | 3.83 | % | 112 | 5.19 | % | 42 | 10.47 | % | |||||||||||||||
| Total | $ | 9,695 | 100.00 | % | $ | 6,017 | 100.00 | % | $ | 4,148 | 100.00 | % | $ | 2,156 | 100.00 | % | $ | 400 | 100.00 | % | ||||||||||
The accounting estimates for loan losses are subject to changing economic conditions. At December 31, 2009, the non-accrual loans totaled $4.7 million compared to $1.4 million at December 31, 2008. Excluding the non-accrual loans purchased through the Merger of $2.2 million, non-accrual loans equaled $2.5 million at December 31, 2009 compared to $1.4 million at December 31, 2008. When analyzing the non-accrual loans on an individual basis, there are no individual non-accrual loans with an outstanding balance of greater than $450 thousand. Of the $4.7 million of non-accrual loans at December 31, 2009, $3.4 million or 72.2% related to commercial loans, $320 thousand or 6.8% to consumer loans and $990 thousand or 21.0% to mortgage loans. As of December 31, 2009, we had total impaired loans of $10.9 million. Included in impaired loans are loans on which management has stopped accruing interest in accordance with our loan accounting policy and impaired loans purchased as a result of the merger. Management discontinues the accrual of interest on a loan when the contractual payment of principal or interest has become 90 days past due or management has serious doubts about further collectability of principal or interest, even though the loan is currently performing. The impaired loan balance includes $6.2 million of impaired loans acquired as part of the merger, which were recorded at their
30
Table of Contents
individual fair values as determined based on management’s estimate of future cash flows. In order to reflect these purchased loans at fair value, we reduced their carrying value by $3.5 million at the time of the merger. For the remaining impaired loans, management performed an evaluation of expected future cash flows, including the anticipated cash flow from the sale of collateral. Based on these evaluations, management has determined that a reserve of $451 thousand is required against the impaired loans at December 31, 2009.
Management has performed a detailed review of the non-performing loans and of their related collateral and believes the allowance for loan losses remains adequate for the level of risk inherent in the loan portfolio. During 2009, the banking industry experienced increasing defaults in mortgage loans coupled with decreasing values of residential real estate values as a result of an economic downturn. In addition, the prolonged economic recession present throughout 2009 has resulted in increased delinquencies in our loan portfolio. Through our loan approval process and diligent loan monitoring, we have experienced a relatively low percentage of non-performing loans when compared to the total amount of loans.
Other real estate owned consists of four properties totaling $927 thousand at December 31, 2009. These properties have been through the foreclosure process and are currently in the process of being sold. These properties are recorded at their lower of cost or market value. Market value is based on the anticipated sales price less costs to sell for each respective property.
Other Income and Expenses
2009 vs. 2008
In addition to our focus on increasing net interest income through growth of interest-earning assets and expansion in our net interest spread, we remain committed to increasing non-interest income as a way to improve profitability and diversify our sources of revenue. Net interest income as a percentage of net interest income plus noninterest income was 80.3% for the year ended December 31, 2009, compared to 83.5% for the year ended December 31, 2008.
Other Income
The following table presents the components of other income for the past two years. All dollar amounts are in thousands:
| December 31, 2009 |
December 31, 2008 |
Increase (Decrease) | ||||||||||
| $ | % | |||||||||||
| Service charges on deposit accounts |
$ | 2,156 | $ | 809 | $ | 1,347 | 166.5 | % | ||||
| Other service charges, commissions and fees |
2,131 | 792 | 1,339 | 169.1 | % | |||||||
| Gain on sale of mortgage loans originated for sale |
1,521 | 528 | 993 | 188.1 | % | |||||||
| Gain on sale of other interest earnings assets |
364 | 240 | 124 | 51.7 | % | |||||||
| Income from bank owned life insurance |
1,034 | 305 | 729 | 239.0 | % | |||||||
| Other income |
1,622 | 415 | 1,207 | 290.8 | % | |||||||
| Total non-interest income |
$ | 8,828 | $ | 3,089 | $ | 5,739 | 185.8 | % | ||||
As a result of the merger, service charges on deposit accounts directly related to the Tower Bank division’s branches contributed $1.3 million to the overall change in service charges on deposit accounts. The majority of the increase in the other service charges, commissions and fees relates to debit card fees and trust services income which grew by $736 thousand and $424 thousand, respectively, during 2009 when compared to 2008. The increase in gains on sale of mortgage loans is the direct result of increased volume of loans sold into the secondary market at our Graystone Mortgage, LLC subsidiary, which has benefited from the increased residential refinancing that occurred during 2009. We have also experienced increases in residential mortgages for new home purchases during 2009 compared to the same year ago period. The increase in income from bank owned
31
Table of Contents
life insurance (“BOLI”) is partially due to the addition of bank owned life insurance as a result of the Merger which added $377 thousand. The remaining increase in BOLI income can be attributed to the fact that we only held BOLI contracts for two full quarters in 2008 compared to 2009 when the BOLI contracts were outstanding for the entire year. Finally, the increase in other income of $1.2 million relates to gains recognized in connection with the satisfaction of purchased impaired loans of approximately $681 thousand and other miscellaneous items. At the time of the Merger, management had discounted the carrying value of loans considered impaired to fair value based on anticipated future cash flow projections. During the fourth quarter of 2009, management realized nearly the full carrying value of two purchased impaired loans due to a refinancing with a third party institution and a sale of collateral by the borrower in an amount to satisfy their obligation with the Bank.
Other Expenses
The following table presents the components of other expenses for each of the past two years. All dollar amounts are in thousands:
| December 31, 2009 |
December 31, 2008 |
Increase (Decrease) | ||||||||||
| $ | % | |||||||||||
| Salaries and employee benefits |
$ | 15,841 | $ | 8,100 | $ | 7,741 | 95.6 | % | ||||
| Occupancy and equipment |
5,479 | 2,356 | 3,123 | 132.6 | % | |||||||
| Amortization of intangible assets |
532 | — | 532 | n/a | % | |||||||
| FDIC insurance premiums |
1,747 | 278 | 1,469 | 528.4 | % | |||||||
| Advertising and promotion |
972 | 369 | 603 | 163.4 | % | |||||||
| Data processing |
2,050 | 654 | 1,396 | 213.5 | % | |||||||
| Professional service fees |
1,155 | 518 | 637 | 123.0 | % | |||||||
| Other operating expenses |
4,173 | 1,525 | 2,648 | 173.6 | % | |||||||
| Merger related expenses |
2,080 | — | 2,080 | n/a | % | |||||||
| Total non-interest expenses |
$ | 34,029 | $ | 13,800 | $ | 20,229 | 146.6 | % | ||||
Salary and employee benefits increased $7.7 million or 95.6%. Salaries increased by $6.4 million while employee benefits increased by $1.3 million. As a result of the merger, salaries and employee benefits directly related to Tower Bank branches for 2009 contributed approximately $2.8 million to the increase in salary and benefit expenses. The remaining increased level of salary expense was driven by personnel costs in connection with the opening of 5 branches throughout Central Pennsylvania during the second half of 2008 and 2009. In addition, we continued to add experienced commercial lending personnel and deepen the back office operations staffing to support growth. We also incurred general merit increases for all eligible employees during March 2009.
Occupancy and equipment expense increased $3.1 million or 132.6%. The increase was partially related to the additional expense attributable to the Tower Bank division’s branches which contributed $1.3 million to occupancy and equipment expense. The remaining building and equipment expense increase related to the additional branch offices opened and the lease of the corporate operations center office space during the third quarter of 2009.
The amortization of intangible assets relates to the amortization of the core deposit intangible asset recognized as a result of the Merger.
The FDIC imposed a special assessment on all FDIC-insured banks based on total assets and Tier 1 capital as of June 30, 2009. As such, FDIC-insured institutions subject to the special assessment accrued the liability in their second quarter results (i.e. the quarter ending June 30, 2009 for calendar year end companies). Furthermore, the FDIC has the authority, after June 30, 2009, to impose additional emergency assessments on all FDIC-insured banks if it estimates the reserve ratio of the Deposit Insurance Fund will fall to a level that is believes would adversely affect public confidence or a level which would be close to zero or negative at the end of a calendar
32
Table of Contents
quarter. At this time we cannot estimate the probability of this event; however, any additional FDIC assessment and/or premium would be adverse to our future earnings. We expensed and paid $580 thousand for the special FDIC assessment during 2009. This special assessment accounts for a portion of the change in the FDIC insurance premiums expense for 2009 compared to 2008 with the remaining increase due to increases in regular quarterly premiums. On February 27, 2009, the FDIC announced that it was increasing federal deposit insurance premiums, beginning the second quarter of 2009, for all well managed, well capitalized banks to a range between 12 and 16 cents per $100 of insured deposits on an annual basis. At December 31, 2009, we had approximately $936.9 million in FDIC-insured deposits.
Data processing expense increased $1.4 million or 213.5%. These increases are directly related to increased data processing costs given the rapid growth in the Bank, including the Merger, between December 31, 2008 and December 31, 2009.
Other operating expenses increased $2.6 million or 173.6%. The portion of the increase that can be attributed directly to the Tower Bank branches equaled $359 thousand for 2009. The remaining increase was primarily due to increases in telephone and postage expense, supplies, directors’ fees, travel expenses, other state taxes and fees, and debt extinguishment charges of $460 thousand, $290 thousand, $288 thousand, $237 thousand, $252 thousand and $119 thousand, respectively. The debt extinguishment charge relates to the debt fair value discount recognized on the FHLB borrowings obtained through the Merger that had subsequently been paid-off during the second quarter of 2009. Additionally, we recognized $158 thousand of expenses and losses related to the maintenance and sales of properties classified as other real estate owned compared to no such related expenses in 2008.
The merger related expenses recognized during 2009 consist of $1.8 million associated with the merger with Graystone Financial Corp and $244 thousand associated with the pending acquisition of First Chester County Corporation. We recognized no merger related expenses during 2008 as the prevailing accounting literature permitted the deferral and capitalization of these expenses. During 2009, the authoritative accounting literature changed, requiring that all expenses incurred in association with merger and acquisition related activities be expensed as incurred.
2008 vs. 2007
Other Income
The following table presents the components of other income for the years ended December 31, 2008 and 2007. All dollar amounts are in thousands:
| December 31, 2008 |
December 31, 2007 |
Increase (Decrease) | ||||||||||
| $ | % | |||||||||||
| Service charges on deposit accounts |
$ | 809 | $ | 498 | $ | 311 | 62.4 | % | ||||
| Other service charges, commissions and fees |
792 | 539 | 253 | 46.9 | % | |||||||
| Gain on sale of mortgage loans originated for sale |
528 | 358 | 170 | 47.5 | % | |||||||
| Gain on sale of other interest earnings assets |
240 | 100 | 140 | 140.0 | % | |||||||
| Income from bank owned life insurance |
305 | — | 305 | — | % | |||||||
| Other income |
415 | 97 | 318 | 327.8 | % | |||||||
| Total non-interest income |
$ | 3,089 | $ | 1,592 | $ | 1,497 | 94.0 | % | ||||
The $1.5 million or 94.0% increase in total non-interest income is mostly attributable to increases in service charges on deposit accounts, other service charges and fees, and income recognized on the cash surrender value of bank owned life insurance, which increased $311 thousand, $253 thousand, and $305 thousand, respectively. The increase in service charges on deposits relates to the increase in the deposit balance from $359.1 million at
33
Table of Contents
December 31, 2007 to $525.5 million at December 31, 2008. The majority of the increase in the other service charges and fees relates to commercial banking fees and debit card fees which grew by $124 thousand and $72 thousand during 2008 when compared to 2007. During 2008, the Company purchased bank owned life insurance (“BOLI”) policy for $12 million as a means to offset compensation and benefits costs with tax free income generated from increases in the cash surrender value of the BOLI policies.
Other Expenses
The following table presents the components of other expenses for each of the past two years. All dollar amounts are in thousands:
| December 31, 2008 |
December 31, 2007 |
Increase (Decrease) | ||||||||||
| $ | % | |||||||||||
| Salaries and employee benefits |
$ | 8,100 | $ | 6,874 | $ | 1,226 | 17.8 | % | ||||
| Occupancy and equipment |
2,356 | 1,473 | 883 | 60.0 | % | |||||||
| FDIC insurance premiums |
278 | 160 | 118 | 73.8 | % | |||||||
| Advertising and promotion |
369 | 253 | 116 | 45.8 | % | |||||||
| Data processing |
654 | 436 | 218 | 50.0 | % | |||||||
| Professional service fees |
518 | 432 | 86 | 19.9 | % | |||||||
| Other operating expenses |
1,525 | 1,046 | 479 | 45.8 | % | |||||||
| Total non-interest expenses |
$ | 13,800 | $ | 10,674 | $ | 3,126 | 29.3 | % | ||||
Salary and employee benefits increased $1.2 million or 17.8%. Salaries increased by $1.5 million while employee benefits decreased $300 thousand. The increase of level of salary expense was driven by personnel costs in connection with our branch expansion into York, Pennsylvania in May 2008, Ephrata, Pennsylvania in July 2008, and State College, Pennsylvania in October 2008. In addition, we continued to deepen the back office staffing to support growth.
Occupancy and equipment expense increased $833 thousand or 60.0%. The building and equipment expense increase related to the addition of three branch offices during 2008 and increases in administrative office space.
Data processing expense increased $218 thousand or 50.0%. These increases are directly related to system upgrades required given the rapid growth in the Bank between December 31, 2007 and December 31, 2008.
Other operating expenses increased $479 thousand or 45.8%. The increase was primarily due to increases in telephone and postage expense, supplies, and travel expenses in connection with our branch expansion in 2008.
Income Taxes
Income tax expense was $1.8 million, and $333 thousand for the year ended December 31, 2009 and 2008, respectively, and a $6 thousand income tax benefit for year ended December 31, 2007. Our effective tax rate for the year ended December 31, 2009 was 33.0%. The effective tax rate was positively impacted by tax free income generated by increases in the cash surrender value of bank owned life insurance policies and earnings from tax-exempt securities, offset by non-deductible merger related expenses. Our effective tax rate was 13.8% for the year ended December 31, 2008 as a result of the release of a valuation allowance of $434 thousand established during 2007 related to the estimated ability to recover net operating loss benefits in future periods. The statutory tax rate for both periods was 34.0%.
At the time of the Merger, we established a full valuation allowance against the deferred tax asset related to unrealized losses within the equity securities portfolio since it is more likely than not that we will not recognize sufficient capital gains to offset the unrealized losses. Therefore, if we realize additional losses in future periods on sales of equity securities, there may be no tax benefit recognized, which will cause an increase in the our
34
Table of Contents
effective tax rate. To the extent that we can realize capital gains in future periods, a tax benefit due to the release of the valuation allowance might be recognized.
Effective June 1, 2007, we ceased to qualify as a small business corporation, as defined in Internal Revenue Code (IRC) § 1361(b) and thus our S corporation election under IRC § 1362(a) was terminated. As a result, we were taxed directly on our taxable income due to our status change from an S corporation to a C corporation beginning June 1, 2007.
For periods prior to June 1, 2007, we operated as an S corporation under the Internal Revenue Code. Accordingly, we incurred no federal or state corporate income tax expense. Any taxable income or loss generated was passed directly to our shareholders and taxed at the shareholder level. The effective tax rate for the period from June 1, 2007 to December 31, 2007 was 1.7%, which was primarily the result of the release of a valuation allowance of $336 thousand established during 2007 related to the estimated ability to recover net operating loss benefits in future periods. The statutory tax rate for 2007 was 34.0%.
For additional information regarding income taxes, see Note 13, “Income Taxes”, in the Notes to Consolidated Financial Statements.
FINANCIAL CONDITION
Total Assets
Total assets increased by $829.3 million, or 129.3%, to $1.5 billion at December 31, 2009 as compared to $641.3 million at December 31, 2008. The increase includes $532.1 million of assets received in connection with the merger on March 31, 2009. Excluding the assets received in the merger, our total assets grew by approximately $297.1 million or 46.3% between December 31, 2008 and December 31, 2009.
Loans, net
Our gross loan balance grew by $566.9 million, or 100.9%, to $1.1 billion during 2009. The increase includes $418.7 million of loans purchased in the merger on March 31, 2009. Excluding the fair value of loans purchased in the merger, gross loans grew by approximately $148.1 million or 26.4% since December 31, 2008. This increase in gross loans includes new commercial and consumer loan originations totaling $218.3 million, purchased loans of $55.3 million and a lending facility to First Chester County Corporation of $26 million. These increases were partially offset by a net decrease in existing loan balances of $167.3 million. Management believes that there continues to be strong demand for commercial and consumer loans to credit qualified businesses and individuals within our market areas, which management anticipates will result in continued loan growth during 2010.
The table below is the detail of the loan balances, net of unearned income and allowance for loan losses, for the past five years.
| For the Year Ended December 31, |
||||||||||||||||||||
| 2009 | 2008 | 2007 | 2006 | 2005 | ||||||||||||||||
| (dollars in thousands) | ||||||||||||||||||||
| Commercial |
$ | 861,673 | $ | 508,744 | $ | 356,880 | $ | 163,564 | $ | 22,978 | ||||||||||
| Consumer & other |
85,510 | 54,084 | 18,142 | — | — | |||||||||||||||
| Residential mortgage |
191,277 | 5,123 | 14,930 | 8,950 | 2,687 | |||||||||||||||
| Total Loans |
1,138,460 | 567,951 | 389,952 | 172,514 | 25,665 | |||||||||||||||
| Deferred costs (fees) |
(189 | ) | (229 | ) | (24 | ) | 5 | (26 | ) | |||||||||||
| Allowance for loan losses |
(9,695 | ) | (6,017 | ) | (4,148 | ) | (2,156 | ) | (400 | ) | ||||||||||
| Net Loans |
$ | 1,128,576 | $ | 561,705 | $ | 385,780 | $ | 170,363 | $ | 25,239 | ||||||||||
35
Table of Contents
The increase in mortgage loans of $186.2 million between December 31, 2008 and December 31, 2009 is predominately mortgage loans acquired in the Merger. The commercial loan portfolio continues to be the largest component of our loan portfolio, representing 75.7% and 89.6% of total loans at December 31, 2009 and December 31, 2008, respectively. In addition, we have $111.6 million in loan participations without recourse sold to unaffiliated banks through December 31, 2009, where we maintain the servicing rights with these relationships. During 2009, we purchased 22 loans from other unaffiliated banks, totaling $55.3 million. The net increase in purchased participations is primarily due to the purchase of 16 loans from First National Bank of Chester County for 98.5% of par resulting in a net purchase price of $51.7 million. The Bank is participating in 25 loans purchased from unaffiliated banks that have a total outstanding balance of $60.1 million at December 31, 2009. The borrowers on these loans are in-market customers and we have not experienced any losses due to nonperformance. Additionally, we have not participated in any shared national credit programs and we do not have any shared national credits in our loan portfolio. We expect continued loan growth as we focus on serving the credit needs of our market areas, while exercising prudent underwriting standards considering the economic uncertainties that are expected to continue. However, due to continued uncertain economic conditions resulting in lower levels of loan demand, we expect that loan growth may be slower than historically experienced.
Securities Available for Sale
The following table presents the amortized cost and fair value of investment securities for the past three years.
| December 31, 2009 | December 31, 2008 | December 31, 2007 | ||||||||||||||||
| (dollars in thousands) | ||||||||||||||||||
| Amortized Cost |
Fair Value | Amortized Cost |
Fair Value |
Amortized Cost |
Fair Value | |||||||||||||
| Equity securities |
$ | 1,156 | $ | 1,132 | $ | — | $ | — | $ | — | $ | — | ||||||
| U.S. Government sponsored agency securities |
56,437 | 56,384 | 18,402 | 18,605 | 26,493 | 26,518 | ||||||||||||
| U.S. Government sponsored agency mortgage-backed securities |
9,109 | 9,116 | — | — | — | — | ||||||||||||
| Collateralized mortgage obligations |
93,058 | 92,485 | — | — | — | — | ||||||||||||
| Municipal bonds |
7,093 | 7,188 | 1,279 | 1,299 | 1,399 | 1,413 | ||||||||||||
| Municipal bonds - taxable |
12,917 | 12,910 | — | — | — | — | ||||||||||||
| SBA Pool Loan Investments |
10,710 | 10,638 | — | — | — | — | ||||||||||||
| $ | 190,480 | $ | 189,853 | $ | 19,681 | $ | 19,904 | $ | 27,892 | $ | 27,931 | |||||||
At December 31, 2009, total available for sale securities were $189.9 million, an increase of $170.0 million from total available for sale securities of $19.9 million at December 31, 2008. The securities available for sale portfolio at December 31, 2008 consisted entirely of U.S. Government agency securities and municipal bonds of $19.9 million, of which $18.5 million matured or were called during 2009. As a result of the Merger, we acquired available for sale securities with a fair value balance of $58.3 million. These securities included $47.0 million of debt securities and $11.3 million of equities, with the equities consisting mostly of investments in banks, bank holding companies and financial institutions. Since March 31, 2009, we have purchased debt securities and sold various debt and equity securities to realign the holdings within the equity investment portfolio obtained through the Merger with our overall investment strategy by shifting the investments in higher-risk equity securities to fixed income debt securities with less exposure to market volatility.
Subsequent to the Merger, we have sold securities valued at approximately $10.2 million from the equity portfolio resulting in a net gain on sale of securities of $88 thousand for the year ended December 31, 2009. At December 31, 2009, management had identified equity securities with unrealized losses that were deemed to be other than temporary in nature and, as a result recognized an impairment charge of $156 thousand. The fair value of the remaining equity portfolio totaled $1.1 million at December 31, 2009. Many of the equity securities held in
36
Table of Contents
the portfolio at December 31, 2009 are financial institutions that management considers to be highly illiquid due to the nature of the institution and the manner in which shares are offered into the market. Certain positions held in the equity securities are in excess of the average daily trading volume. These securities, if determined to be traded in an active market, shall be measured within Level 1 as the product of the quoted price for the individual instrument times the quantity held. The quoted price shall not be adjusted because of the size of the position relative to trading volume (blockage factor). The use of a blockage factor is prohibited, even if a market’s normal daily trading volume is not sufficient to absorb the quantity held and placing orders to sell the position in a single transaction might affect the quoted price. We will continue to focus the composition of the portfolio to consist primarily of fixed income securities in an attempt to minimize volatility to future earnings. Considering the current volatility in the financial services industry and the fair value determinations, we continue to expect to recognize gains and losses through the statement of operations as a result of the difference between the fair value of these securities, and the proceeds recognized upon the sale of these securities.
Bank-owned Life Insurance
In July 2008, we purchased a bank-owned life insurance (“BOLI”) policy for $12 million as a means to offset a portion of current and future compensation and benefits costs through the recognition of tax-free income resulting from increases in the cash surrender value of the BOLI policies. The Bank’s deposits and proceeds from the sale of investment securities funded the BOLI. Earnings from the BOLI are recognized within non-interest income. In connection with the merger, we acquired an additional $11.3 million in cash surrender value of BOLI. At December 31, 2009, the total cash surrender value of the BOLI was $24.6 million.
Deposits
Total deposits at December 31, 2009 were $1.2 billion, an increase of $691.0 million from total deposits of $525.5 million at December 31, 2008. The increase includes $410.2 million of deposits assumed in connection with the merger on March 31, 2009. Excluding the deposits assumed in the merger, our total deposits grew by approximately $280.8 million or 53.4% between December 31, 2008 and December 31, 2009.
The table below displays the increases in deposits by type at December 31, 2009 as compared to December 31, 2008. All dollar amounts are in thousands:
| December 31, 2009 | December 31, 2008 | Increase/Decrease | ||||||||||||||||
| Amount | % | Amount | % | $ | % | |||||||||||||
| Non-interest bearing transaction accounts |
$ | 119,116 | 9.8 | % | $ | 42,466 | 8.1 | % | 76,650 | 180.50 | % | |||||||
| Interest checking accounts |
110,356 | 9.0 | % | 19,060 | 3.6 | % | 91,296 | 478.99 | % | |||||||||
| Money market accounts |
477,292 | 39.2 | % | 120,625 | 23.0 | % | 356,667 | 295.68 | % | |||||||||
| Savings accounts |
87,117 | 7.2 | % | 49,310 | 9.4 | % | 37,807 | 76.67 | % | |||||||||
| Time deposits of $100,000 or greater |
130,938 | 10.8 | % | 207,935 | 39.6 | % | (76,997 | ) | (37.03 | )% | ||||||||
| Time deposits, other |
291,650 | 24.0 | % | 86,074 | 16.4 | % | 205,576 | 238.84 | % | |||||||||
| Total deposits |
$ | 1,216,469 | 100 | % | $ | 525,470 | 100 | % | ||||||||||
The most significant increases in deposit type were in money market accounts and transaction accounts, which represented 39.2% and 18.8%, respectively, of total deposits at December 31, 2009 compared to 23.0% and 11.7% of total deposits at December 31, 2008. The increase in money market deposits is the result of management’s sales and marketing efforts to grow more stable deposits at a lower cost than higher-cost time deposits. The money market accounts include $23.1 million and $11.4 million of brokered money market deposits at December 31, 2009 and December 31, 2008, respectively. Adding to the growth in money market deposit accounts is the effect of money market deposits at Tower Bank division branch locations which totaled approximately $105.1 million at December 31, 2009, accounting for approximately 29% of the yearly growth in money market deposits. The increase in transaction accounts relates mostly to the transaction account balances held with Tower Bank division branches which equaled $120.3 million at December 31, 2009 representing
37
Table of Contents
71.6% of the total increase. Time deposits represent 34.8% of total deposits at December 31, 2009 compared to 56% of total deposits at December 31, 2008. The time deposits include $38.0 and $52.2 million of brokered certificates of deposit at December 31, 2009 and December 31, 2008, respectively. Overall, total brokered deposits decreased to $61.1 million or approximately 3.7% of our total deposits at December 31, 2009 as compared to $63.6 million or 12.1% of total deposits at December 31, 2008.
The following table presents the maturity of time deposits in denominations of $100 thousand or greater as of December 31, 2009 (in thousands).
| December 31, 2009 | |||
| Less than three months |
$ | 29,825 | |
| Over three months to six months |
27,994 | ||
| Over six months to twelve months |
14,053 | ||
| Over twelve months |
59,066 | ||
| Total |
$ | 130,938 | |
The average balances and weighted average rates paid on deposits for 2009, 2008 and 2007 are presented in the table below:
| December 31, 2009 | December 31, 2008 | December 31, 2007 | ||||||||||||||||
| (dollars in thousands) | ||||||||||||||||||
| Average Balance |
Average Rate |
Average Balance |
Average Rate |
Average Balance |
Average Rate |
|||||||||||||
| Non-interest bearing transaction accounts |
$ | 83,362 | N/A | $ | 32,610 | N/A | $ | 22,403 | N/A | |||||||||
| Interest checking accounts |
71,722 | 0.55 | % | 23,415 | 1.31 | % | 37,646 | 4.36 | % | |||||||||
| Money market accounts |
341,585 | 1.73 | % | 77,364 | 2.63 | % | 46,033 | 4.02 | % | |||||||||
| Savings accounts |
90,691 | 1.50 | % | 29,259 | 2.82 | % | 2,854 | 2.45 | % | |||||||||
| Time deposits, other |
365,623 | 2.82 | % | 276,821 | 4.31 | % | 171,941 | 5.11 | % | |||||||||
| Total |
$ | 952,983 | 1.88 | % | $ | 439,469 | 3.44 | % | $ | 280,877 | 4.40 | % | ||||||
As reflected above, we have decreased the average rate on our total deposits by 156 basis points between the 2008 and 2009. Although we operate in a very competitive environment for deposits, we have been able to grow our deposits from an average of $439.5 million to $953.0 million between December 31, 2008 and December 31, 2009 as a result of both organic and acquisition-related growth.
38
Table of Contents
Short-Term Borrowings and Long-Term Debt
| At or for the year ended December 31, |
||||||||||||
| (dollars in thousands) | ||||||||||||
| 2009 | 2008 | 2007 | ||||||||||
| Period-end balance: |
||||||||||||
| FHLB Borrowings |
$ | 59,251 | $ | 39,000 | $ | — | ||||||
| Securities sold under agreement of repurchase |
6,892 | 8,384 | 26,340 | |||||||||
| Lines of credit |
— | 4,614 | 4,430 | |||||||||
| Subordinated notes |
9,000 | — | — | |||||||||
| Fed Funds Purchased |
— | — | — | |||||||||
| Capital lease obligation |
2,729 | — | — | |||||||||
| Total borrowings |
$ | 77,872 | $ | 51,998 | $ | 30,770 | ||||||
| Maximum balance at any month end: |
||||||||||||
| FHLB Borrowings |
$ | 60,914 | $ | 39,000 | $ | — | ||||||
| Securities sold under agreement of repurchase |
9,698 | 33,575 | 26,340 | |||||||||
| Lines of credit |
11,064 | 4,614 | 6,630 | |||||||||
| Subordinated notes |
9,000 | — | — | |||||||||
| Fed Funds Purchased |
— | — | 10,612 | |||||||||
| Capital lease obligation |
2,729 | — | — | |||||||||
| Average balance: |
||||||||||||
| FHLB Borrowings |
$ | 52,823 | $ | 26,075 | $ | — | ||||||
| Securities sold under agreement of repurchase |
7,486 | 20,123 | 20,213 | |||||||||
| Lines of credit |
2,879 | 4,507 | 6,314 | |||||||||
| Subordinated notes |
4,875 | — | — | |||||||||
| Fed Funds Purchased |
120 | 451 | 232 | |||||||||
| Capital lease obligation |
227 | — | — | |||||||||
| Period-end weighted average interest rate: |
||||||||||||
| FHLB Borrowings |
3.80 | % | 3.17 | % | — | |||||||
| Securities sold under agreement of repurchase |
0.52 | % | 1.70 | % | 3.83 | % | ||||||
| Lines of credit |
7.61 | % | 4.62 | % | 7.21 | % | ||||||
| Subordinated notes |
9.52 | % | — | — | ||||||||
| Fed Funds Purchased |
1.66 | % | 2.35 | % | 5.34 | % | ||||||
| Capital lease obligation |
4.84 | % | — | — | ||||||||
Short-term borrowings decreased $9.3 million from December 31, 2008 to December 31, 2009 and securities sold under agreement to repurchase decreased $1.5 million from December 31, 2008 to December 31, 2009. At December 31, 2008, short-term borrowings included a $10 million advance from the Federal Home Loan Bank of Pittsburgh that was retired in the first quarter of 2009. As a result of the merger, we assumed $6.4 million of short-term outstanding borrowings all of which was retired during 2009. At year-end, short-term borrowings consisted of $5.3 million in advances from the Federal Home Loan Bank of Pittsburgh and $42 thousand in obligations under capital leases. During the year, three lines of credit with unaffiliated banks with a total outstanding balance of $7.2 million were fully repaid with net proceeds received from the common stock offering that occurred during the third quarter of 2009. These lines of credit with unaffiliated banks were payable on demand or had short-term maturities.
Long-term debt increased by $36.7 million from December 31, 2008 to December 31, 2009. At December 31, 2009, long-term debt consisted of $54.0 million in advances from the FHLB that had a maturity of greater than one year, $9.0 million of subordinated debt issued in June 2009 and $2.7 million in obligations under capital leases. As a result of the merger, we assumed $31.9 million of long-term debt of which $5.3 million has since
39
Table of Contents
been reclassified as short-term borrowings and $1.5 million has been retired. The total average rate incurred on borrowings and securities sold under agreement to repurchase during 2009 was 3.62% compared to an average rate of 2.98% during 2008.
Contractual Obligations and Other Commitments
The following table indicates certain of our funding obligations by time remaining until maturity as of December 31, 2009 as follows (in thousands):
| Less than 1 year |
Over 1 to 3 years |
Over 3 to 5 years |
Over 5 years |
Total | |||||||||||
| Certificates of deposit |
$ | 210,308 | $ | 109,868 | $ | 102,334 | $ | 78 | $ | 422,588 | |||||
| Borrowings (1) |
12,142 | 10,000 | — | 53,095 | 75,237 | ||||||||||
| Commitments to grant loans (2) |
12,350 | — | — | — | 12,350 | ||||||||||
| Unfunded commitments on lines of credit (2) |
267,683 | — | — | — | 267,683 | ||||||||||
| Letters of credit (2) |
25,524 | — | — | — | 25,524 | ||||||||||
| Operating leases |
1,690 | 3,449 | 3,316 | 15,788 | 24,243 | ||||||||||
| Capital Leases |
276 | 563 | 607 | 4,137 | 5,583 | ||||||||||
| Total contractual obligations |
$ | 529,973 | $ | 123,880 | $ | 106,257 | $ | 73,098 | $ | 833,208 | |||||
(1) - Borrowing includes FHLB borrowings and securities sold under agreement of repurchase
(2) - We do not expect all of our commitments and letters of credit to be fully funded. The total commitment amount related to these contractual obligations does not necessarily represent to future cash requirements for the Bank.
Stockholders’ Equity
Total stockholders’ equity increased $109.1 million or 199.1%, from $54.8 million at December 31, 2008 to $163.9 million at December 31, 2009. The increase of $109.1 million was due to equity received in the merger on March 31, 2009 of $57.9 million, and a common stock offering in which Tower received net proceeds of $51.6 million. The increase of $57.9 million related to the merger included the addition of approximately $45.9 million in net assets and $11.9 million of goodwill. Tower made a capital contribution to its wholly owned bank subsidiary, Graystone Tower Bank, in the amount of $43.5 million of the net proceeds received in the common stock offering. The remaining net proceeds were used to pay down short-term borrowings, long-term debt, and other operating expenses. The increase in accumulated comprehensive income is attributed to the unrealized gains on available for sales securities. The increase in our accumulated deficit is due to the declaration of dividends of $4.8 million to our stockholders offset by the net income of $3.7 million.
Regulatory Capital
We are subject to various regulatory capital requirements administered by banking regulators. Failure to meet minimum capital requirements can initiate certain actions by regulators that could have a material effect on our consolidated financial statements. The regulations require that banks maintain minimum amounts and ratios of total and Tier I capital (as defined in the regulations) to risk weighted assets (as defined), and Tier I capital to average assets (as defined). As of December 31, 2009, Tower and the Bank met the minimum requirements. In addition, capital ratios of Tower and the Bank exceeded the amounts required to be considered “well capitalized” as defined in the regulations.
On June 12, 2009, Tower issued, to private investors, $9 million of subordinated notes bearing an annual interest rate of 9.00%. Each note may be redeemed at the our discretion and contains a maturity date of July 1, 2014. Tower has contributed the net proceeds from the sale of the notes to the Bank, as Tier 1 capital to support the Bank’s continued growth, including ongoing lending activities in its local markets. The Notes are intended to
40
Table of Contents
qualify as Tier 2 capital at Tower Bancorp, Inc, for regulatory purposes, to the extent permitted. In accordance with applicable regulatory treatment one-fifth of the original principal amount of the Notes will be excluded each year from Tier 2 capital during the last five years prior to maturity. The following table summarizes Graystone Tower Bank and Tower Bancorp, Inc.’s regulatory capital ratios in comparison to regulatory requirements:
| December 31, 2009 |
December 31, 2008 |
Minimum Capital Adequacy |
|||||||
| Graystone Tower Bank |
|||||||||
| Total Capital (to Risk Weighted Assets) |
14.43 | % | 10.80 | % | 8.00 | % | |||
| Tier I Capital (to Risk Weighted Assets) |
13.58 | % | 9.80 | % | 4.00 | % | |||
| Tier I Capital (to Average Assets) |
11.13 | % | 9.20 | % | 4.00 | % | |||
| December 31, 2009 |
December 31, 2008 |
Minimum Capital Adequacy |
|||||||
| Tower Bancorp, Inc. |
|||||||||
| Total Capital (to Risk Weighted Assets) |
14.53 | % | 10.10 | % | 8.00 | % | |||
| Tier I Capital (to Risk Weighted Assets) |
13.05 | % | 9.10 | % | 4.00 | % | |||
| Tier I Capital (to Average Assets) |
10.70 | % | 8.50 | % | 4.00 | % | |||
Management believes, as of December 31, 2009, that the Company and the Bank met all capital adequacy requirements to which it is subject.
The Bank is subject to certain restrictions on the amount of dividends that it may declare due to regulatory considerations. The Pennsylvania Banking Code provides that cash dividends may be declared and paid only out of accumulated net earnings. As a result of the Merger, $24.4 million of accumulated earnings related to the pre-merger retained earnings of First National Bank of Greencastle, were transferred and reclassified into additional paid-in capital of Graystone Tower Bank. Based on approval received from the Pennsylvania Department of Banking, this amount is available for cash dividends and may be declared and paid in future periods. During the year, we declared dividends of $0.84 per share which totaled $4.8 million.
During the second quarter of 2009, the Board of Directors approved a Dividend Reinvestment and Stock Purchase Plan (“Plan”) to provide our shareholders with the opportunity to use cash dividends, as well as optional cash payments up to $50 thousand per quarter, to purchase additional shares of our common stock. We have reserved 1,000,000 shares of common stock, no par value, for issuance under the Plan. At our discretion, shares may be purchased under the Plan directly from Tower or in open market purchases from others by the plan agent. The purchase price for shares purchased from us with reinvested dividends is 95% of the fair market value of our common stock on the investment date. The purchase price for shares purchased with voluntary cash payments or any open market purchases is 100% of the fair market value of the our common stock on the investment date. During 2009, approximately $404 thousand in capital has been raised under the Plan.
Also during the second quarter of 2009, our Board of Directors and shareholders approved an Employee Stock Purchase Plan (“Employee Plan”) to provide our employees with the opportunity to purchase shares of our common stock directly from us. The purchase price for shares purchased under the Employee Plan is 95% of the fair market value of our common stock on the purchase date. During the 2009, approximately $65 thousand in capital has been raised under the Employee Plan.
In connection with the Emergency Economic Stabilization Act of 2009 and the Troubled Asset Recovery Program (TARP), the U.S. Department of the Treasury (UST) has initiated a Capital Purchase Program. Through this program, qualifying financial institutions are eligible to participate in the sale of senior preferred stock to the UST in an amount not less than 1% of total risk-weighted assets and not more than 3% of total risk-weighted assets. The senior preferred stock will pay cumulative dividends at a rate of 5% per year for the first five years and 9% thereafter. The UST would also receive warrants to purchase a number of shares of common stock of the financial institution having an aggregate market value equal to 15% of the senior preferred stock on the date of the investment, subject to certain reductions.
41
Table of Contents
In January 2009, Graystone received preliminary approval from the U.S. Treasury Department for the placement of up to $17.3 million in senior preferred stock. In March 2009, Graystone announced that it would not be participating in the U.S. Treasury Department’s Troubled Asset Relief Program Capital Purchase Program. Tower Bancorp, Inc. did not apply to participate in the Capital Purchase Program.
42
Table of Contents
QUARTERLY CONSOLIDATED RESULTS OF OPERATIONS (UNAUDITED)
(in thousands, except per-share data)
| Three Months Ended | |||||||||||||
| Dec. 31 | Sept. 30 | 30-Jun | 31-Mar | ||||||||||
| FOR THE YEAR 2009 |
|||||||||||||
| Interest income |
$ | 16,576 | $ | 15,724 | $ | 15,660 | $ | 8,423 | |||||
| Interest expense |
5,312 | 5,520 | 5,547 | 4,049 | |||||||||
| Net interest income |
11,264 | 10,204 | 10,113 | 4,374 | |||||||||
| Provision for loan losses |
1,400 | 800 | 650 | 2,366 | |||||||||
| Other income |
3,353 | 1,810 | 2,746 | 948 | |||||||||
| Other expenses |
9,909 | 8,694 | 9,681 | 5,774 | |||||||||
| Income (loss) before income taxes |
3,308 | 2,520 | 2,528 | (2,818 | ) | ||||||||
| Income tax expense (benefit) |
1,252 | 820 | 690 | (933 | ) | ||||||||
| Net income (loss) |
$ | 2,056 | $ | 1,700 | $ | 1,838 | $ | (1,885 | ) | ||||
| Net Income Per Common Share |
|||||||||||||
| Basic |
$ | 0.29 | $ | 0.30 | $ | 0.36 | $ | (0.68 | ) | ||||
| Diluted |
0.29 | 0.30 | 0.36 | (0.68 | ) | ||||||||
| Dividends declared |
0.28 | 0.28 | 0.28 | — | |||||||||
| Weighted Average Common Shares Outstanding |
|||||||||||||
| Basic |
7,114,900 | 5,638,851 | 5,058,119 | 2,765,717 | |||||||||
| Diluted |
7,115,386 | 5,652,292 | 5,065,180 | 2,765,717 | |||||||||
| FOR THE YEAR 2008 |
|||||||||||||
| Interest income |
$ | 8,635 | $ | 8,390 | $ | 7,725 | $ | 7,407 | |||||
| Interest expense |
4,315 | 4,159 | 4,039 | 3,968 | |||||||||
| Net interest income |
4,320 | 4,231 | 3,686 | 3,439 | |||||||||
| Provision for loan losses |
650 | 675 | 475 | 750 | |||||||||
| Other income |
795 | 1,044 | 609 | 640 | |||||||||
| Other expenses |
3,697 | 3,543 | 3,362 | 3,197 | |||||||||
| Income before income taxes |
768 | 1,057 | 458 | 132 | |||||||||
| Income taxes |
223 | 346 | 155 | (391 | ) | ||||||||
| Net income |
$ | 545 | $ | 711 | $ | 303 | $ | 523 | |||||
| Net Income Per Common Share |
|||||||||||||
| Basic |
$ | 0.20 | $ | 0.26 | $ | 0.11 | $ | 0.19 | |||||
| Diluted |
0.20 | 0.26 | 0.11 | 0.19 | |||||||||
| Weighted Average Common Shares Outstanding |
|||||||||||||
| Basic |
2,733,227 | 2,734,206 | 2,734,984 | 2,733,487 | |||||||||
| Diluted |
2,733,227 | 2,734,206 | 2,734,984 | 2,733,487 | |||||||||
43
Table of Contents
CRITICAL ACCOUNTING POLICIES
The following is a summary of those accounting policies that we consider to be most important to the portrayal of its financial condition and results of operations, as they require management’s most difficult judgments as a result of the need to make estimates about the effects of matters that are inherently uncertain.
Allowance for Credit Losses – The Company accounts for the credit risk associated with its lending activities through the allowance for credit losses. The allowance for credit losses consists of the allowance for loan losses and the credit risk fair value adjustment. The allowance for loan losses represents management’s estimate of losses inherent in the existing loan portfolio. The credit risk fair value adjustment represents the estimated fair value of cash flows for loan purchased as part of merger and acquisitions. The provision for loan losses is the periodic charge to earnings, which is necessary to adjust the allowance for loan losses to its proper balance. The Company assesses the adequacy of its allowance through a methodology that consists of the following:
| • | Identifying loans that require individual review. In general, these consist of large balance commercial loans and commercial mortgages that are rated less than “satisfactory” based upon the Company’s internal credit-rating process. |
| • | Assessing whether the loans identified for review are “impaired”. That is, whether it is probable that all amounts will not be collected according to the contractual terms of the loan agreement. |
| • | For loans reviewed, calculating the estimated fair value, using observable market prices, discounted cash flows or the value of the underlying collateral. |
| • | Classifying all non-impaired large balance loans based on credit risk ratings and allocating an allowance for loan losses based on appropriate factors, including recent loss history for similar loans. |
| • | Identifying all smaller balance homogeneous loans for evaluation collectively. In general, these loans include residential mortgages, consumer loans, installment loans, commercial loans and commercial mortgages rated “satisfactory” or better, smaller balance commercial loans and mortgages and lease receivables. |
| • | Homogeneous loans are segmented into groups with similar characteristics and an allowance for loan losses is allocated to each segment based on recent loss history and other relevant information. |
| • | Reviewing the results to determine the appropriate balance of the allowance for credit losses. This review gives additional consideration to factors such as the mix of loans in the portfolio, the balance of the allowance relative to total loans and non-performing assets, trends in the overall risk profile of the portfolio, trends in delinquencies and non-accrual loans and local and national economic conditions. |
| • | An unallocated allowance is maintained to recognize the inherent imprecision in estimating and measuring loss exposure. |
| • | Documenting the results of its review. |
The allowance review methodology is based on information known at the time of the review. Changes in factors underlying the assessment could have a material impact on the amount of the allowance that is necessary and the amount of provision to be charged against earnings. Such changes could impact future results.
Accounting for Business Combinations – The Company accounts for all business acquisitions using the purchase method of accounting as required by U.S. GAAP. FASB guidance establishes principles and requirements for how an acquirer: recognizes and measures in its financial statement the identifiable assets acquired, the liabilities assumed, and any noncontrolling interest in the acquiree; recognizes and measures the goodwill acquired in the business combination or a gain from a bargain purchase; and determines what information to disclose to enable users of the financial statements to evaluate the nature and financial effects of the business combination.
The purchase price is established as the value of securities issued for the acquisition, and cash consideration paid. The fair values of assets acquired and liabilities assumed are typically established through appraisals, observable
44
Table of Contents
market values or discounted cash flows. Management has engaged independent third-party valuation experts to assist in valuing certain assets, particularly intangibles. Other assets and liabilities are generally valued using the Company’s internal asset/liability modeling system. The assumptions used and the final valuations, whether prepared internally or by a third-party, are reviewed by management. Due to the complexity of purchase accounting, final determinations of values can be time consuming and, occasionally, amounts included in the Company’s consolidated balance sheets and consolidated statements of operations are based on preliminary estimates of value.
On April 1, 2009, the Financial Accounting Standards Board (“FASB”) issued guidance that clarifies that assets acquired and liabilities assumed in a business combination arising from contingencies be initially measured and recognized at its acquisition date fair value so long as the fair value can be determined during the measurement period. For any asset or liability whose acquisition date fair value cannot be determined, an asset or liability shall be recognized at its estimated fair value provided that there is both evidence that either the asset or liability existed as of the acquisition date and the amount can be reasonably estimated. This guidance is effective for assets or liabilities arising from contingencies in business combinations for which the acquisition date is on or after the beginning of the first annual reporting period beginning on or after December 15, 2008. The Company has adopted this guidance effective for the interim period ending March 31, 2009 and utilized the guidance to recognize liabilities assumed in relation to the merger with Graystone.
Goodwill and Intangible Assets – Intangible assets are amortized over their estimated lives. Some intangible assets have indefinite lives and are, therefore, not amortized. All intangible assets must be evaluated for impairment if certain events occur. Any impairment write-downs are recognized as expense on the consolidated statements of operations.
Goodwill is not amortized to expense, but is evaluated at least annually for impairment. The Company tests for impairment by first allocating its goodwill and other assets and liabilities, as necessary, to defined reporting units. A fair value is then determined for each reporting unit. If the fair values of the reporting units exceed their book values, no write-down of the recorded goodwill is necessary. If the fair values are less than the book values, an additional valuation procedure is necessary to assess the proper carrying value of the goodwill.
Business unit valuation is inherently subjective, with a number of factors based on assumptions and management judgments. Among these are future growth rates for the reporting units, selection of comparable market transactions, discount rates and earnings capitalization rates. Changes in assumptions and results due to economic conditions, industry factors and reporting unit performance and cash flow projections could result in different assessments of the fair values of reporting units and could result in impairment charges. If an event occurs or circumstances change that would more likely than not reduce the fair value of a reporting unit below its carrying amount, an impairment test between annual tests is necessary. Such events may include adverse changes in legal factors or in the business climate, adverse actions by a regulator, unauthorized competition, the loss of key employees, or similar events.
Income Taxes – The provision for income taxes is based upon net income before income taxes, adjusted for the effect of certain tax-exempt income and non-deductible expenses. In addition, certain items of income and expense are reported in different periods for financial reporting and tax return purposes. The tax effects of these temporary differences are recognized currently in the deferred income tax provision or benefit. Deferred tax assets or liabilities are computed based on the difference between the financial statement and income tax bases of assets and liabilities using the applicable enacted marginal tax rate.
The Company must also evaluate the likelihood that deferred tax assets will be recovered from future taxable income. If any such assets are more likely than not to not be recovered, a valuation allowance must be recognized. The assessment of the carrying value of deferred tax assets is based on certain assumptions, changes in which could have a material impact on the Company’s consolidated financial statements.
45
Table of Contents
The Company also adopted FASB guidance that clarifies the accounting for uncertainty in income taxes recognized in an enterprise’s financial statements. Specifically, the interpretation prescribes a recognition threshold and measurement attribute for the financial statement recognition and measurement of a tax position taken or expected to be taken in a tax return.
See also Note 13, “Income Taxes”, in the Notes to Consolidated Financial Statements.
Fair Value Measurements – On January 1, 2008, the Company adopted the FASB issued statement of fair value measurement as required by U.S. GAAP for all assets and liabilities required to be measured at fair value on a recurring basis and all financial assets and liabilities measured at fair value on a nonrecurring basis. The statement establishes a fair value hierarchy that prioritizes the inputs to valuation techniques used to measure fair value into the following three categories (from highest to lowest priority):
| • | Level 1 – Inputs that represent quoted prices for identical instruments in active markets. |
| • | Level 2 – Inputs that represent quoted prices for similar instruments in active markets, or quoted prices for identical instruments in non-active markets. Also includes valuation techniques whose inputs are derived principally from observable market data other than quoted prices, such as interest rates or other market-corroborated means. |
| • | Level 3 – Inputs that are largely unobservable, as little or no market data exists for the instrument being valued. |
As required by the statement, the Company has categorized all financial assets and liabilities and all nonfinancial assets and liabilities required to be measured at fair value on a recurring basis into the above three levels. In addition, the Company has categorized all financial assets and liabilities measured at fair value on a nonrecurring basis into the above three levels. See Note 17, “Fair Value Measurements” in the Notes to Consolidated Financial Statements for the disclosures required by statement.
The determination of fair value for assets and liabilities categorized as Level 3 assets requires a great deal of subjectivity due to the use of unobservable inputs. In addition, determining when a market is no longer active and placing little or no reliance on distressed market prices requires the use of management’s judgment. The need for greater management judgment in determining fair values for Level 3 assets and liabilities has further been heightened by the current challenging economic conditions, which have resulted in a great deal of volatility in the fair values of investment securities.
The Company engages third-party valuation experts to assist in valuing most of the assets and liabilities measured at fair value on a recurring basis which are classified as Level 2 or Level 3 items.
On April 9, 2009, the FASB issued guidance that assists in determining the fair value of financial instruments when the volume of market based transactions has significantly decreased. Additionally, it assists in determining whether or not current market transactions of financial instruments were conducted in an orderly fashion. This guidance does not change the fact that fair value is the price that would be received to sell an asset or paid to transfer a liability in an orderly transaction between market participants. We have adopted this guidance effective April 1, 2009 and the adoption expanded certain disclosure requirements, however, it did not have an impact on the Company’s financial condition, results of operation or liquidity.
On April 9, 2009, the FASB issued guidance that amends the other-than-temporary impairment guidance in U.S. GAAP for debt, but does not amend the existing recognition and measurement guidance related to other-than-temporary impairments of equity securities. We have adopted this statement effective April 1, 2009. There was no cumulative effect adjustment as there were no securities that were previously determined to be other than temporarily impaired. Beginning on April 1, 2009, we began analyzing debt securities for other-than-temporary impairment adjustments using this new guidance.
46
Table of Contents
On April 9, 2009, the FASB issued guidance that requires disclosures about fair value of financial instruments for interim reporting periods of publicly traded companies as well as in annual financial statements. This statement is effective for interim reporting periods ending after June 15, 2009, with early adoption permitted for periods ending after March 15, 2009. We have adopted this guidance effective for the interim period ending June 30, 2009.
Recent Accounting Pronouncements
For information regarding recent accounting pronouncements, refer to Note 1, “Summary of Significant Accounting Policies” of this Form 10-K.
| Item 7A. | Quantitative and Qualitative Disclosures About Market Risk |
Our exposure to market risk principally includes liquidity risk, interest rate risk, and market price risk which are discussed below.
Liquidity Risk
We manage our liquidity position on a daily basis as part of the daily settlement function and continuously as part of the formal asset liability management process. Our liquidity is maintained by managing several variables including, but not limited to:
| • | Pricing and dollar amount of core deposit products; |
| • | Pricing and dollar amount of in-market time deposits; |
| • | Growth rate of the loan portfolio (including the sale of loans on a participation basis); |
| • | Purchase and sale of federal funds; |
| • | Purchase and sale of investment securities; |
| • | Use of wholesale funding such as brokered deposits; and |
| • | Use of borrowing capacity at the FHLB. |
Management maintains a detailed liquidity contingency plan designed to respond to an overall decline in the condition of the banking industry or a problem specific to the Company. On a quarterly basis, the Asset Liability Committee (“ALCO”) of the board of directors reviews a comprehensive liquidity analysis along with any changes to the liquidity contingency plan.
As of December 31, 2009, we had a maximum borrowing capacity at the Federal Home Loan Bank of Pittsburgh (“FHLB”) of approximately $482.0 million of which approximately $59.3 million was used in the form of borrowings. Accordingly, we had unused borrowing capacity of $422.7 million at the FHLB. Based on the FHLB capital stock owned by the Bank as of December 31, 2009, we can access approximately $19.2 million of funding without the need to purchase additional FHLB stock. As of December 31, 2009, we had federal funds lines availability at three correspondent banks totaling $27.5 million. There were no funds drawn upon these facilities as of December 31, 2009.
We participate in obtaining wholesale funding sources in addition to core demand deposits. As of December 31, 2009, we had Certificate of Deposit Account Registry Service (“CDARS”) reciprocal deposits as an alternative source of funds in the amount of $15.3 million. We participate in a brokerage sweep program that provides for the deposit of funds with the benefit of insurance from the FDIC. The balance of this funding as of December 31, 2009 was approximately $23.1 million. We also issue brokered time deposits from time to time. As of December 31, 2009, the dollar amount of brokered time deposits, other than CDARS, was $22.8 million. Brokered deposits, exclusive of CDARS reciprocal deposits accounted for approximately 3.8% and 8.5% of total deposits as of December 31, 2009 and December 31, 2008, respectively. Time deposits comprise approximately
47
Table of Contents
$422.6 million or 34.8% of our deposit liabilities. At December 31, 2009, liquid assets (defined as cash and cash equivalents, loans held for sale, and securities available for sale exclusive of securities pledged as collateral or used in connection with customer repurchase agreements) totaled approximately $204.3 million or 16.8% of total deposits. This compares to $42.5 million, or 8.1%, of total deposits, at December 31, 2008.
Management is of the opinion that its liquidity position at December 31, 2009, is adequate to respond to fluctuations “on” and “off” balance sheet. In addition, management knows of no trends, demands, commitments, events or uncertainties that may result in, or that are reasonably likely to result in our inability to meet anticipated or unexpected liquidity needs.
Interest Rate Risk
We actively manage our interest rate sensitivity position. Interest rate sensitivity is the matching or mismatching of the repricing and rate structure of the interest-bearing assets and liabilities. Our primary objectives of interest rate risk management are to neutralize adverse impacts to net interest income arising from interest rate movements and to attain sustainable growth in net interest income. The Management Asset Liability Committee (“MALCO”) is primarily responsible for developing and implementing asset liability management strategies in accordance with the Asset and Liability Management Policy and Procedures (the “ALCO Policy”) approved by the board of directors. The MALCO generally meets on a monthly basis and is comprised of members of our senior management team. The ALCO of the board of directors meets on a quarterly basis to review the guidelines established by MALCO and the results of our interest rate risk analysis.
We manage interest rate sensitivity by changing the volume, mix, pricing and repricing characteristics of our assets and liabilities. We have not entered into separate derivative contracts such as interest rate swaps, caps, and floors.
The interest rate characteristics and interest repricing characteristics of the loan portfolio at December 31, 2009 are set forth in the tables below. Adjustable-rate loans represent loans that are currently in a fixed-rate, but are subject to repricing to either a fixed or variable rate at the related next repricing date.
| Interest Rate Characteristic |
Percentage of Portfolio |
||
| Fixed-rate loans |
25.0 | % | |
| Adjustable-rate loans |
40.4 | % | |
| Variable-rate loans |
34.6 | % | |
| Total |
100.0 | % | |
| Maturity Structure |
Percentage of Portfolio |
||
| One month or less |
33.6 | % | |
| Two to six months |
4.8 | % | |
| Six to twelve months |
9.2 | % | |
| One to two years |
8.1 | % | |
| Two to three years |
8.5 | % | |
| Three to five years |
23.5 | % | |
| Greater than five years |
12.3 | % | |
| 100.0 | % | ||
As of December 31, 2009, the loan portfolio contained $397.0 million of loans in the variable-rate interest mode. Of these loans, 86.3% had interest rate floors. The majority of these loans are indexed to prime, 1-Month LIBOR, and 3-Month LIBOR (i.e. the index plus a spread). While the interest rate floors provide the Company with interest rate protection given that the prime rate and LIBOR rates, plus the applicable spread, are substantially below these floors, these loans will not generate incremental income in an upward rising environment until the
48
Table of Contents
floors have been pierced. The compression on net interest margin related to these relationships will be influenced by a number of variables including, but not limited to, the volatility of the respective indices, the speed at which rates rise, and the interest rate sensitivity of deposit costs. To date, we have elected to manage this risk without the use of separate derivative contracts.
As of December 31, 2009, the mortgage loan portfolio contained $191.2 million of mortgages of which $64.6 million will reprice over the next twelve months. The mortgage loans that will reprice over the next twelve months have a current weighted average interest rate of approximately 4.45%. The majority of these mortgage loans are indexed to the one-year Treasury rate. In the current rate environment, these loans will reprice to new rates that are below the current contractual rates thereby putting pressure on net interest margin. In the event that the one-year Treasury rate rises, the loss of interest income from repricing will be lessened. We have been actively encouraging customers to refinance these loans into fixed-rate loans through our mortgage company subsidiary as a means of locking in historically low interest rates. Since June 30, 2009, the mortgage loan portfolio has been reduced by $21.6 million. We expect to continue this strategy and other initiatives to manage this interest rate risk. Furthermore, we expect that newly originated mortgage loan volume will principally be underwritten and sold into the secondary market through our mortgage subsidiary. To date, we have elected to manage this risk without the use of separate derivative contracts.
As of December 31, 2009, we reported deposit liabilities of approximately $1.2 billion and securities sold under agreements to repurchase of approximately $6.9 million. Comparatively, we reported deposit liabilities of approximately $525.5 million and securities sold under repurchase agreements of approximately $8.4 million at December 31, 2008. Approximately $410.2 million of deposit growth during calendar year 2009 was attributed to the Merger. We increased brokered deposits, exclusive of reciprocal in-market deposits, by $1.5 million between December 31, 2008 and December 31, 2009. The remaining $279.2 million of growth was attributed to deposit origination within markets we serve.
The maturity structure of the time deposit portfolio as of December 31, 2009, is summarized below.
| Certificates of Deposit Maturity Structure |
Dollars (millions) |
Percentage | ||||
| One months or less |
$ | 17.7 | 4.2 | % | ||
| Over one month through one year |
192.7 | 45.6 | % | |||
| Over one year through two years |
47.5 | 11.2 | % | |||
| Over two years |
164.7 | 39.0 | % | |||
| Total |
$ | 422.6 | 100.0 | % | ||
During the fourth quarter of 2009, we increased the dollar amount of time deposits maturing beyond two years by $61.0 million, as we seek to extend the maturity structure of the time deposit portfolio considering the current low interest rate environment. As noted above, approximately $211 million of time deposits will mature over the next year. Given existing market conditions, we expect to retain a significant portion of the maturing time deposit portfolio in the form of new time deposits or money market accounts at interest rates that are generally lower than current rates of the time deposits maturing over the next year. However, we are actively seeking to extend the weighted average life of the time deposit portfolio which may result in renewing a portion of the time deposit portfolio at rates that are higher than the rates of time deposits maturing over the next year.
We use several tools to assess and measure its interest rate risk including interest rate simulation analysis that is prepared on a quarterly basis. Each analysis is largely dependent on many assumptions and variables with past behaviors that may not prove to be effective predictors of future outcomes. These assumptions are reviewed on at least a quarterly basis.
Gap Analysis. We use gap analysis to compare the relationship of assets that are expected to reprice during a specific time frame (“Rate Sensitive Assets” or “RSA”) as compared to liabilities that are scheduled to reprice
49
Table of Contents
during an identical time period (“Rate Sensitive Liabilities” or “RSL”). When the ratio is greater than one, RSA exceed RSL and potentially exposes the bank to a risk of a decline in interest rates by virtue of a larger amount of assets repricing at lower interest rates than rate sensitive liabilities. The converse would be true of a RSA/RSL ratio less than 1.0. While gap analysis can be useful in evaluating the relationship of RSA to RSL, it does not capture other critical interest rate risk variables such as the extent of change that will take place when a RSA or RSL reprices, prepayment considerations, and other factors. Under the ALCO Policy, the interest rate simulation report measures the ratio of rate sensitive assets to rate sensitive liabilities at a one-year time frame. The ALCO Policy has established an acceptable relationship of RSA to RSL to a range of 80% to 120%.
During the third quarter of 2009, we modified the methodology used in computing repricing gap in the current economic environment in two ways. First, we modified the treatment of variable-rate loans with current interest rates below loan floors by classifying them as rate sensitive assets. As of December 31, 2009, we have $342 million of loans that are currently in the variable rate mode with interest rates indexed to the prime rate, the one-month LIBOR, and the three-month with current interest rates determined by floors. To the extent that these loans will not reprice until the floor have been pierced (approximately 175 basis points), these loans are technically not rate sensitive. However, for purposes of computing repricing gap, we have treated these loans as rate-sensitive to capture their behavior in more traditional interest rate environments. Second, we have classified all interest-bearing non-maturity deposits as repricing immediately. In the past, we time-weighted interest-bearing non-maturity deposits as a means of giving consideration to the extent to which such deposits were less interest rate sensitive than the rate shocks applied to the balance sheet. We believe that the new methodology is more conservative, albeit this methodology has the potential to highlight the inherent weaknesses of repricing gap analysis as explained above.
At December 31, 2009, our balance sheet was liability sensitive with a gap ratio of approximately 82.5%. The gap ratio is within policy guidelines. In large part, the liability sensitive position of the balance sheet is due to the increase in transaction, money market, and savings accounts in the deposit portfolio. This is an intentional strategy designed to strengthen on-balance sheet liquidity, acquire lower cost in-market deposits, and address consumer demand for FDIC-insured liquid deposits. Management believes the interest rate sensitivity of the Company’s non-maturity deposit portfolio is less than that of the general market. Accordingly, the lower level of interest rate sensitivity will partially mitigate the general effects of liability sensitivity. As of December 31, 2009, 96.2% of deposits were originated within markets we serve. The table below summarizes the repricing gap of the Company as of December 31, 2009.
| Repricing Gap Report as of December 31, 2009 (in thousands) | ||||||||||||||||||||||||
| 1 to 3 Months |
3 to 6 Months |
6 to 12 Months |
12-24 Months |
24 to 36 Months |
36 to 60 Months |
Greater than 60 Months / non-rate sensitive |
Total | |||||||||||||||||
| Assets |
||||||||||||||||||||||||
| Cash, due from banks, and Federal funds sold |
$ | 16,645 | $ | — | $ | — | $ | — | $ | — | $ | — | $ | 33,955 | $ | 50,600 | ||||||||
| Securities available for sale (1) |
28,314 | 16,826 | 18,269 | 42,548 | 26,423 | 32,587 | 23,754 | 188,721 | ||||||||||||||||
| Loans |
455,889 | 71,670 | 141,874 | 160,302 | 110,902 | 168,597 | 27,376 | 1,136,610 | ||||||||||||||||
| Other Assets |
— | — | — | — | — | — | 94,652 | 94,652 | ||||||||||||||||
| Total Assets |
$ | 500,848 | $ | 88,496 | $ | 160,143 | $ | 202,850 | $ | 137,325 | $ | 201,184 | $ | 179,737 | $ | 1,470,583 | ||||||||
50
Table of Contents
| Repricing Gap Report as of December 31, 2009 (in thousands) |
||||||||||||||||||||||||||||||||
| 1 to 3 Months |
3 to 6 Months |
6 to 12 Months |
12-24 Months |
24 to 36 Months |
36 to 60 Months |
Greater than 60 Months / non-rate sensitive |
Total | |||||||||||||||||||||||||
| Liabilities |
||||||||||||||||||||||||||||||||
| Non-interest bearing deposits |
$ | — | $ | — | $ | — | $ | — | $ | — | $ | — | $ | 119,116 | $ | 119,116 | ||||||||||||||||
| Interest-bearing transaction and savings deposits |
674,765 | — | — | — | — | — | — | 674,765 | ||||||||||||||||||||||||
| Time deposits |
79,916 | 83,047 | 58,644 | 50,363 | 66,145 | 84,394 | 79 | 422,588 | ||||||||||||||||||||||||
| Total deposits |
754,681 | 83,047 | 58,644 | 50,363 | 66,145 | 84,394 | 119,195 | 1,216,469 | ||||||||||||||||||||||||
| Borrowings, including repurchase agreements |
6,895 | 2 | 5,255 | 5,010 | 15,011 | 30,755 | 14,945 | 77,873 | ||||||||||||||||||||||||
| Other Liabilities |
— | — | — | — | — | — | 12,364 | 12,364 | ||||||||||||||||||||||||
| Total Liabilities |
$ | 761,576 | $ | 83,049 | $ | 63,899 | $ | 55,373 | $ | 81,156 | $ | 115,149 | $ | 145,504 | $ | 1,306,706 | ||||||||||||||||
| Equity |
— | — | — | — | — | — | 163,877 | 163,877 | ||||||||||||||||||||||||
| Total Liabilities and Equity |
$ | 761,576 | $ | 83,049 | $ | 63,899 | $ | 55,373 | $ | 81,156 | $ | 115,149 | $ | 310,381 | $ | 1,470,583 | ||||||||||||||||
| Repricing Assets |
500,848 | 88,496 | 160,143 | 202,850 | 137,325 | 201,184 | 85,085 | 1,375,931 | ||||||||||||||||||||||||
| Repricing Liabilities |
761,576 | 83,049 | 63,899 | 55,373 | 81,156 | 115,149 | 15,024 | 1,175,226 | ||||||||||||||||||||||||
| Period Repricing Gap |
(260,728 | ) | 5,447 | 96,244 | 147,477 | 56,169 | 86,035 | 70,061 | 200,705 | |||||||||||||||||||||||
| Period Repricing Gap Percentage |
65.8 | % | 106.6 | % | 250.6 | % | 366.3 | % | 169.2 | % | 174.7 | % | 566.3 | % | 117.1 | % | ||||||||||||||||
| Cumulative Repricing Gap Percentage |
65.8 | % | 69.8 | % | 82.5 | % | 98.8 | % | 104.3 | % | 111.3 | % | 117.1 | % | 117.1 | % | ||||||||||||||||
(1) Excludes equity investments available for sale and restricted investments
Net Interest Income at Risk. We assess the percentage change in net interest income assuming interest rate shocks (upward and downward) of 100, 200, and 300 basis points. Given the current rate environment, we limited the downward shock to 100 basis points, but included an upward shock of 400 basis points. This analysis captures the timing of the repricing of RSA and RSL as well as the degree of change (“beta”) in the interest rates of particular asset and liability products that occurs as interest rates move upward or downward. Under the Asset and Liability Management Policy and Procedures, the interest rate simulation report measures the percentage change in net interest income for one year assuming interest rate shocks of 100, 200, and 300 basis points. The ALCO Policy has established an acceptable negative percentage change in net interest income under 100, 200, and 300 basis point shocks of 20%.
The table below summarizes the Net Interest Income at Risk modeling results as of December 31, 2009.
| Actual | Policy | |||||
| Net Interest Income: Up 100 Bps (%) |
-2.12 | % | 20.0 | % | ||
| Net Interest Income: Up 200 Bps (%) |
-1.30 | % | 20.0 | % | ||
| Net Interest Income: Up 300 Bps (%) |
1.19 | % | 20.0 | % | ||
| Net Interest Income: Up 400 Bps (%) |
3.84 | % | N/A | |||
| Net Interest Income: Down 100 Bps (%) |
0.72 | % | 20.0 | % | ||
51
Table of Contents
Economic Value of Equity at Risk. We assess the present value of cash inflows of cash, investments, loans, bank-owned life insurance policies, when applicable, netted against the present value of cash outflows from deposits, repurchase agreements, borrowings, and other interest-bearing liabilities, all discounted to a measurement date. This measure is expressed as the percentage change in the present value of such cash flows when interest rates are shocked (upward and downward) at 100, 200, and 300 basis points. Under the Asset and Liability Management Policy and Procedures, the interest rate simulation reports measures the percentage change in economic value of equity at risk assuming interest rate shocks of 100, 200, and 300 basis points. Given the current rate environment, we limited the downward shock to 100 basis points, but included an upward shock of 400 basis points. The ALCO Policy has established an acceptable negative percentage change in economic value of equity at risk under 100, 200, and 300 basis point shocks of 20%.
The table below summarizes the Economic Value of Equity at Risk as of December 31, 2009.
| Actual | Policy | |||||
| Economic Value of Equity: Up 100 Bps (%) |
-5.10 | % | 20.0 | % | ||
| Economic Value of Equity: Up 200 Bps (%) |
-7.75 | % | 20.0 | % | ||
| Economic Value of Equity: Up 300 Bps (%) |
-8.08 | % | 20.0 | % | ||
| Economic Value of Equity: Up 400 Bps (%) |
-7.25 | % | N/A | |||
| Economic Value of Equity: Down 100 Bps (%) |
8.68 | % | 20.0 | % | ||
Market Price Risk
As of December 31, 2009, our investment portfolio had a market value of approximately $196.1 million. The investment portfolio is comprised of two separate components each of which is managed pursuant to a board approved investment policy. At the holding company level, we have a portfolio of equity securities of financial institutions (the “Equity Portfolio”) with a market value of approximately $1.1 million. At the bank level, the Bank has a portfolio with a market value of approximately $195.0 million comprised of debt securities summarized below and certain restricted investments related to business relationships with the Federal Home Loan Bank of Pittsburgh and a correspondent bank. As of December 31, 2008, we had a portfolio with a market value of approximately $22.0 million that was held at the bank level. This portfolio was comprised of government agency obligations, municipal obligations and certain restricted short-term investments related to business relationships with the Federal Home Loan Bank of Pittsburgh and a correspondent bank.
The investment portfolio increased $174 million during the calendar year 2009. Of this increase, $43.5 million was attributed to the infusion of cash from the public offering of our common stock, net of the repayment of short-term debt. The remaining increase was a result of the Merger, increased deposits, and net sales and purchases of securities related to maintaining higher levels of on-balance sheet liquidity. The maturities and cash flows from these investments have been structured to coincide with the lending activities of the bank. For example, the weighted average life of the bank investment portfolio is 2.7 years. We believe that the off balance sheet liquidity sources of the bank and the ability to raise in-market deposits at reasonable prices adequately mitigates the cash flow variability of the investment portfolio.
During the calendar year 2009, we added four new security classes to the bank investment portfolio: Government National Mortgage Association collateralized mortgage obligations, Small Business Administration loan pools, agency mortgage-backed securities, and taxable municipal securities. The Government National Mortgage Association collateralized mortgage obligations and Small Business Administration loan pool securities are secured by the full, faith, credit and taxing power of the United States of America and carry a zero risk weighting for regulatory capital purposes.
52
Table of Contents
Debt security market price risk is the risk that changes in the values of debt security investments could have a material impact on our financial position or results of operations. The table below summarizes the maturity structure of the portfolio as of December 31, 2009.
| Within 1 year | After 1 year but within 5 years |
After 5 years but within 10 years |
After 10 years | Total | ||||||||||||||||||||||||||
| (dollars in thousands) | ||||||||||||||||||||||||||||||
| Fair Value |
W/A yield | Fair Value |
W/A yield | Fair Value |
W/A yield | Fair Value |
W/A yield | Fair Value |
W/A yield | |||||||||||||||||||||
| U.S. Government agency obligations |
$ | 20,043 | 0.32 | % | $ | 28,857 | 1.57 | % | $ | 7,485 | 2.00 | % | $ | — | — | % | $ | 56,385 | 1.18 | % | ||||||||||
| State and municipal obligations |
677 | 3.80 | % | 4,731 | 3.24 | % | 9,207 | 4.11 | % | 5,484 | 4.86 | % | 20,099 | 4.10 | % | |||||||||||||||
| Asset-backed securities (1) |
— | — | — | — | — | — | — | — | 112,239 | 2.42 | % | |||||||||||||||||||
| Other securities (2) |
— | — | — | — | — | — | — | — | 6,254 | — | ||||||||||||||||||||
| Graystone Tower Bank Portfolio |
$ | 20,720 | $ | 33,588 | $ | 16,692 | $ | 5,484 | $ | 194,977 | 2.28 | % | ||||||||||||||||||
| Investment portfolio of equity securities held at the holding company |
1,132 | |||||||||||||||||||||||||||||
| Total investment securities |
$ | 196,109 | ||||||||||||||||||||||||||||
(1): Mortgage-backed securities include agency mortgage-backed securities; Government National Mortgage Association collateralized mortgage obligations, and Small Business Administration loan pools.
(2): Equity investments in business relationship banks such as the Federal Home Loan Bank and correspondent banks.
Equity market price risk is the risk that changes in the values of equity investments could have a material impact on our financial position or results of operations. The Equity Portfolio was acquired as a result of the merger. As of December 31, 2009, the equity portfolio was comprised of 16 different equity securities of financial institutions. The total asset sizes of the financial institutions ranged from less than $50 million to financial institutions with assets of approximately $900 million. The financial institutions are geographically diverse with concentrations in the mid-Atlantic and south-eastern states.
Management notes that U.S. GAAP precludes the consideration of the relationship of shares owned to the average daily trading volume. If the reporting entity holds a position in a single financial instrument (including a block) and the instrument is traded in an active market, the fair value of the position shall be measured within Level 1 as the product of the quoted price for the individual instrument times the quantity held. The quoted price shall not be adjusted because of the size of the position relative to trading volume (blockage factor). The use of a blockage factor is prohibited, even if a market’s normal daily trading volume is not sufficient to absorb the quantity held and placing orders to sell the position in a single transaction might affect the quoted price. U.S. GAAP also places heavy reliance on quoted prices and places a burden of proof on management to demonstrate that a market is not active. Generally a quoted price is treated as a Level 1 input even if the stock is thinly traded as is the case for many of the positions in the Equity Portfolio.
53
Table of Contents
The Equity Portfolio is comprised of several positions for which the number of shares held significantly exceeds the average daily trading volume. Management believes that the valuation methodology to determine fair value under U.S. GAAP along with the volatility of the financial institutions market may result in gains or losses over time as securities within the portfolio are sold.
54
Table of Contents
Report of Independent Registered Public Accounting Firm
The Board of Directors and Stockholders
Tower Bancorp, Inc.:
We have audited the accompanying consolidated balance sheets of Tower Bancorp, Inc. and subsidiary as of December 31, 2009, and the related consolidated statements of operations, changes in stockholders’ equity and comprehensive income, and cash flows for the year ended December 31, 2009. These consolidated financial statements are the responsibility of the Company’s management. Our responsibility is to express an opinion on these consolidated financial statements based on our audit. The accompanying consolidated financial statements of Tower Bancorp, Inc. and subsidiary as of December 31, 2008 and for the two-year period ended December 31, 2008, were audited by other auditors whose report thereon dated February 20, 2009, expressed an unqualified opinion on those statements.
We conducted our audit in accordance with the standards of the Public Company Accounting Oversight Board (United States). Those standards require that we plan and perform the audit to obtain reasonable assurance about whether the financial statements are free of material misstatement. An audit includes examining, on a test basis, evidence supporting the amounts and disclosures in the financial statements. An audit also includes assessing the accounting principles used and significant estimates made by management, as well as evaluating the overall financial statement presentation. We believe that our audit provide a reasonable basis for our opinion.
In our opinion, the consolidated financial statements referred to above present fairly, in all material respects, the financial position of Tower Bancorp, Inc. and subsidiary as of December 31, 2009 and the results of their operations and their cash flows for the period ended December 31, 2009, in conformity with U.S. generally accepted accounting principles.
(signed) KPMG LLP
Harrisburg, Pennsylvania
March 16, 2010
55
Table of Contents
Report of Independent Registered Public Accounting Firm
To the Board of Directors and Shareholders
Tower Bancorp, Inc.
We have audited the accompanying consolidated balance sheet of Graystone Financial Corp. and subsidiary as of December 31, 2008, and the related consolidated statements of operations, stockholders’ equity and cash flows for each of the years in the two-year period ended December 31, 2008. The Company’s management is responsible for these financial statements. Our responsibility is to express an opinion on these financial statements based on our audits.
We conducted our audits in accordance with the standards of the Public Company Accounting Oversight Board (United States). Those standards require that we plan and perform the audit to obtain reasonable assurance about whether the financial statements are free of material misstatement. The company is not required to have, nor were we engaged to perform, an audit of its internal control over financial reporting. Our audit included consideration of internal control over financial reporting as a basis for designing audit procedures that are appropriate in the circumstances, but not for the purpose of expressing an opinion on the effectiveness of the company’s internal control over financial reporting. Accordingly, we express no such opinion. An audit also includes examining, on a test basis, evidence supporting the amounts and disclosures in the financial statements, assessing the accounting principles used and significant estimates made by management, as well as evaluating the overall financial statement presentation. We believe that our audits provide a reasonable basis for our opinion.
In our opinion, the financial statements referred to above present fairly, in all material respects, the financial position of Graystone Financial Corp. and subsidiary as of December 31, 2008, and the results of their operations and their cash flows for each of the years in the two-year period ended December 31, 2008 in conformity with accounting principles generally accepted in the United States of America.
| /s/ ParenteBeard LLC |
| Lancaster, Pennsylvania |
| May 29, 2009 |
56
Table of Contents
| Item 8. | Financial Statements and Supplementary Data |
Tower Bancorp, Inc. and Subsidiary
Consolidated Balance Sheets
December 31, 2009 and 2008
(Amounts in thousands, except share data)
| December 31, 2009 |
December 31, 2008 |
|||||||
| Assets |
||||||||
| Cash and due from banks |
$ | 33,955 | $ | 24,765 | ||||
| Federal funds sold |
16,645 | 7,257 | ||||||
| Cash and cash equivalents |
50,600 | 32,022 | ||||||
| Securities available for sale |
189,853 | 19,904 | ||||||
| Restricted investments in bank stocks |
6,254 | 2,068 | ||||||
| Loans held for sale |
8,034 | 3,324 | ||||||
| Loans, net of allowance for loan losses of $9,695, and $6,017 |
1,128,576 | 561,705 | ||||||
| Premises and equipment, net |
29,810 | 4,546 | ||||||
| Accrued interest receivable |
4,974 | 2,402 | ||||||
| Deferred tax asset, net |
1,742 | 1,764 | ||||||
| Bank owned life insurance |
24,606 | 12,252 | ||||||
| Goodwill |
11,935 | — | ||||||
| Other intangible assets, net |
3,367 | — | ||||||
| Other assets |
10,832 | 1,331 | ||||||
| Total Assets |
$ | 1,470,583 | $ | 641,318 | ||||
| Liabilities and Stockholders’ Equity |
||||||||
| Liabilities |
||||||||
| Deposits: |
||||||||
| Non-interest bearing |
$ | 119,116 | $ | 42,466 | ||||
| Interest bearing |
1,097,353 | 483,004 | ||||||
| Total deposits |
1,216,469 | 525,470 | ||||||
| Securities sold under agreements to repurchase |
6,892 | 8,384 | ||||||
| Short-term borrowings |
5,292 | 14,614 | ||||||
| Long-term debt |
65,689 | 29,000 | ||||||
| Accrued interest payable |
1,090 | 888 | ||||||
| Other liabilities |
11,274 | 8,177 | ||||||
| Total Liabilities |
1,306,706 | 586,533 | ||||||
| Stockholders’ Equity |
||||||||
| Common stock, no par value; 50,000,000 shares authorized; 7,226,041 shares issued and 7,122,683 outstanding at December 31, 2009, and 2,740,325 shares issued and outstanding at December 31, 2008 |
— | — | ||||||
| Additional paid-in capital |
172,409 | 57,547 | ||||||
| Accumulated deficit |
(4,025 | ) | (2,909 | ) | ||||
| Accumulated other comprehensive (loss) income |
(414 | ) | 147 | |||||
| Less: cost of treasury stock, 103,358 shares at December 31, 2009 and zero shares at December 31, 2008 |
(4,093 | ) | — | |||||
| Total Stockholders’ Equity |
163,877 | 54,785 | ||||||
| Total Liabilities and Stockholders’ Equity |
$ | 1,470,583 | $ | 641,318 | ||||
See Notes to the Consolidated Financial Statements
57
Table of Contents
Tower Bancorp, Inc. and Subsidiary
Consolidated Statements of Operations
Years Ended December 31, 2009, 2008 and 2007
(Amounts in thousands, except share data)
| For the Year Ended December 31, | ||||||||||
| 2009 | 2008 | 2007 | ||||||||
| Interest Income |
||||||||||
| Loans, including fees |
$ | 54,304 | $ | 31,026 | $ | 21,512 | ||||
| Securities |
1,956 | 916 | 1,651 | |||||||
| Federal funds sold and other |
123 | 215 | 1,150 | |||||||
| Total Interest Income |
56,383 | 32,157 | 24,313 | |||||||
| Interest Expense |
||||||||||
| Deposits |
17,963 | 15,106 | 12,356 | |||||||
| Short-term borrowings |
398 | 559 | 775 | |||||||
| Long-term debt |
2,067 | 816 | 455 | |||||||
| Total Interest Expense |
20,428 | 16,481 | 13,586 | |||||||
| Net Interest Income |
35,955 | 15,676 | 10,727 | |||||||
| Provision for Loan Losses |
5,216 | 2,550 | 1,997 | |||||||
| Net Interest Income after Provision for Loan Losses |
30,739 | 13,126 | 8,730 | |||||||
| Non-Interest Income |
||||||||||
| Service charges on deposit accounts |
2,156 | 809 | 498 | |||||||
| Other service charges, commissions and fees |
2,131 | 792 | 539 | |||||||
| Gain on sale of mortgage loans originated for sale |
1,521 | 528 | 358 | |||||||
| Gain on sale of other interest earnings assets |
364 | 240 | 100 | |||||||
| Income from bank owned life insurance |
1,034 | 305 | — | |||||||
| Other income |
1,622 | 415 | 97 | |||||||
| Total Non-Interest Income |
8,828 | 3,089 | 1,592 | |||||||
| Non-Interest Expenses |
||||||||||
| Salaries and employee benefits |
15,841 | 8,100 | 6,874 | |||||||
| Occupancy and equipment |
5,479 | 2,356 | 1,473 | |||||||
| Amortization of intangible assets |
532 | — | — | |||||||
| FDIC insurance premiums |
1,747 | 278 | 160 | |||||||
| Advertising and promotion |
972 | 369 | 253 | |||||||
| Data processing |
2,050 | 654 | 436 | |||||||
| Professional service fees |
1,155 | 518 | 432 | |||||||
| Other operating expenses |
4,173 | 1,525 | 1,046 | |||||||
| Merger related expenses |
2,080 | — | — | |||||||
| Total Non-Interest Expenses |
34,029 | 13,800 | 10,674 | |||||||
| Net Income (Loss) Before Income Tax Benefit |
5,538 | 2,415 | (352 | ) | ||||||
| Income Tax Expense (Benefit) |
1,829 | 333 | (6 | ) | ||||||
| Net Income (Loss) |
$ | 3,709 | $ | 2,082 | $ | (346 | ) | |||
| Net Income (Loss) Per Common Share |
||||||||||
| Basic |
$ | 0.72 | $ | 0.76 | $ | (0.19 | ) | |||
| Diluted |
$ | 0.72 | $ | 0.76 | $ | (0.19 | ) | |||
| Dividends declared |
$ | 0.84 | $ | — | $ | — | ||||
| Weighted Average Common Shares Outstanding |
||||||||||
| Basic |
5,156,078 | 2,734,027 | 1,867,767 | |||||||
| Diluted |
5,161,325 | 2,734,027 | 1,867,767 | |||||||
See Notes to the Consolidated Financial Statements
58
Table of Contents
Tower Bancorp, Inc. and Subsidiary
Consolidated Statements of Changes in Stockholders’ Equity and Comprehensive Income
Years Ended December 31, 2009, 2008, and 2007
(Amounts in thousands, except share data)
| Common Stock |
Additional Paid-in Capital |
Accumulated Deficit |
Accumulated Other Comprehensive Income (Loss) |
Treasury Stock |
Total | |||||||||||||||||
| Balance—December 31, 2006 |
$ | — | $ | 18,650 | $ | (4,645 | ) | $ | (34 | ) | $ | — | $ | 13,971 | ||||||||
| Proceeds from sale of common stock |
37,315 | 37,315 | ||||||||||||||||||||
| Restricted common stock awards earned |
1,021 | 1,021 | ||||||||||||||||||||
| Stock option expense |
51 | 51 | ||||||||||||||||||||
| Comprehensive Income: |
||||||||||||||||||||||
| Net income |
(346 | ) | (346 | ) | ||||||||||||||||||
| Unrealized gain on securities available for sale |
73 | 73 | ||||||||||||||||||||
| Total Comprehensive Income |
(273 | ) | ||||||||||||||||||||
| Balance—December 31, 2007 |
$ | — | $ | 57,037 | $ | (4,991 | ) | $ | 39 | $ | — | $ | 52,085 | |||||||||
| Restricted common stock awards earned |
333 | 333 | ||||||||||||||||||||
| Stock option expense |
177 | 177 | ||||||||||||||||||||
| Comprehensive Income: |
||||||||||||||||||||||
| Net income |
2,082 | 2,082 | ||||||||||||||||||||
| Unrealized gain on securities available for sale net of taxes of $76 |
108 | 108 | ||||||||||||||||||||
| Total Comprehensive Income |
2,190 | |||||||||||||||||||||
| Balance—December 31, 2008 |
$ | — | $ | 57,547 | $ | (2,909 | ) | $ | 147 | $ | — | $ | 54,785 | |||||||||
| Restricted common stock awards earned |
295 | 295 | ||||||||||||||||||||
| Stock option expense |
569 | 569 | ||||||||||||||||||||
| Fair value of consideration exchanged in merger |
61,946 | (4,093 | ) | 57,853 | ||||||||||||||||||
| Cash dividends declared ($0.84 per share) |
(4,825 | ) | (4,825 | ) | ||||||||||||||||||
| Proceeds from the dividend reinvestment plan and the employee stock purchase plan |
469 | 469 | ||||||||||||||||||||
| Proceeds from common stock offering, net of expenses |
51,583 | 51,583 | ||||||||||||||||||||
| Comprehensive Income: |
||||||||||||||||||||||
| Net income |
3,709 | 3,709 | ||||||||||||||||||||
| Unrealized loss on securities available for sale, net of taxes of $228 |
(444 | ) | (444 | ) | ||||||||||||||||||
| Reclassification of realized gain on sale of securities, net of taxes of $61 |
(117 | ) | (117 | ) | ||||||||||||||||||
| Total Comprehensive Income |
3,148 | |||||||||||||||||||||
| Balance—December 31, 2009 |
$ | — | $ | 172,409 | $ | (4,025 | ) | $ | (414 | ) | $ | (4,093 | ) | $ | 163,877 | |||||||
See Notes to the Consolidated Financial Statements
59
Table of Contents
Tower Bancorp, Inc. and Subsidiary
Consolidated Statements of Cash Flows
Years Ended December 31, 2009, 2008, and 2007
(Amounts in thousands, except share data)
| 2009 | 2008 | 2007 | ||||||||||
| Cash Flows from Operating Activities |
||||||||||||
| Net income (loss) |
$ | 3,709 | $ | 2,082 | $ | (346 | ) | |||||
| Adjustments to reconcile net loss to net cash (used in) provided by operating activities: |
||||||||||||
| Provision for loan losses |
5,216 | 2,550 | 1,997 | |||||||||
| Net (accretion) and amortization on securities and loans |
(218 | ) | (49 | ) | (428 | ) | ||||||
| Depreciation and amortization |
(1,751 | ) | 761 | 507 | ||||||||
| Amortization of intangible assets |
532 | — | — | |||||||||
| Amortization of unearned compensation on restricted stock |
295 | 333 | 1,021 | |||||||||
| Stock compensation expense |
569 | 177 | 51 | |||||||||
| Deferred income tax expense (benefit) |
417 | (1,040 | ) | (800 | ) | |||||||
| (Increase) in accrued interest receivable |
(786 | ) | (341 | ) | (801 | ) | ||||||
| (Decrease)/ increase in accrued interest payable |
(496 | ) | 323 | 296 | ||||||||
| Net increase in the cash surrender value of life insurance |
(1,034 | ) | (305 | ) | — | |||||||
| Increase in other assets |
(8,327 | ) | (536 | ) | (471 | ) | ||||||
| (Decrease)/ increase in other liabilities |
(2,640 | ) | 4,236 | 2,908 | ||||||||
| Gain on sale of deposits |
— | (250 | ) | — | ||||||||
| (Gain) loss on sale of interest earning assets |
(1,729 | ) | (768 | ) | 458 | |||||||
| Loans originated for sale |
(136,710 | ) | (96,182 | ) | (54,782 | ) | ||||||
| Sale of loans |
138,520 | 93,732 | 53,978 | |||||||||
| Net Cash (Used in) Provided by Operating Activities |
(931 | ) | 4,723 | 3,588 | ||||||||
| Cash Flows from Investing Activities |
||||||||||||
| Proceeds from sales and maturities of securities available for sale |
110,028 | 53,134 | 98,355 | |||||||||
| Purchases of securities available for sale |
(221,419 | ) | (44,875 | ) | (62,167 | ) | ||||||
| Purchases of bank owned life insurance |
— | (12,000 | ) | — | ||||||||
| Net increase in loans |
(111,182 | ) | (183,638 | ) | (217,414 | ) | ||||||
| Loans purchased from unaffiliated banks |
(55,283 | ) | (4,827 | ) | — | |||||||
| Decrease (increase) of investment in restricted investments |
1,024 | (1,762 | ) | — | ||||||||
| Purchases of premises and equipment |
(4,382 | ) | (1,143 | ) | (3,937 | ) | ||||||
| Net proceeds from sale of premises and equipment |
11 | 1,470 | — | |||||||||
| Net cash received in merger |
9,017 | — | — | |||||||||
| Net Cash Used in Investing Activities |
(272,186 | ) | (193,641 | ) | (185,163 | ) | ||||||
60
Table of Contents
| 2009 | 2008 | 2007 | ||||||||||
| Cash Flows from Financing Activities |
||||||||||||
| Net proceeds from advances on long-term debt |
4,875 | 29,000 | (2,000 | ) | ||||||||
| Net (decrease) increase in short-term borrowings |
(39,709 | ) | 10,184 | 230 | ||||||||
| Net (decrease) in securities sold under agreements to repurchase |
(1,492 | ) | (17,956 | ) | (1,570 | ) | ||||||
| Net increase in deposits |
280,794 | 176,572 | 163,339 | |||||||||
| Proceeds from the issuance of common stock |
52,052 | — | 37,315 | |||||||||
| Dividends paid on common stock |
(4,825 | ) | — | — | ||||||||
| Net Cash Provided by Financing Activities |
291,695 | 197,800 | 197,314 | |||||||||
| Net Increase in Cash and Cash Equivalents |
18,578 | 8,882 | 15,739 | |||||||||
| Cash and Cash Equivalents - Beginning |
32,022 | 23,140 | 7,401 | |||||||||
| Cash and Cash Equivalents - Ending |
$ | 50,600 | $ | 32,022 | $ | 23,140 | ||||||
| Supplemental disclosure of information: |
||||||||||||
| Interest paid |
$ | 20,924 | $ | 16,139 | $ | 13,290 | ||||||
| Income taxes paid |
$ | 1,335 | $ | 1,597 | $ | 650 | ||||||
| Supplemental schedule of noncash investing and financing activities |
||||||||||||
| Common stock issued for acquisition of bank |
57,853 | — | — | |||||||||
| Other real estate acquired in settlement of loan |
927 | — | — | |||||||||
| Unrealized (loss) gain on investments securities available for sale (net of tax effects) |
(561 | ) | 108 | 73 | ||||||||
| Other-than-temporary impairment of investments |
(156 | ) | — | — | ||||||||
See Notes to the Consolidated Financial Statements
61
Table of Contents
NOTES TO CONSOLIDATED FINANCIAL STATEMENTS
(amounts in thousands except for share and per share data)
Note 1 – Summary of Significant Accounting Policies
Organization and Nature of Operations
Tower Bancorp, Inc. (the “Company”) is a registered bank holding company that was incorporated in 1983 under the Bank Holding Company Act of 1956, as amended. On March 31, 2009, the Company merged with Graystone Financial Corp. (“Graystone”), a privately held, non-reporting corporation and a registered bank holding company under the Bank Holding Company Act of 1956, as amended (the “Merger”). Pursuant to an Agreement and Plan of Merger between the Company and Graystone (the “Merger Agreement”), the Company remains the surviving bank holding company and the First National Bank of Greencastle has merged with and into Graystone Bank, the wholly-owned subsidiary of Graystone, with Graystone Bank as the surviving institution under the name “Graystone Tower Bank” (the “Bank Merger”). Graystone Tower Bank (the “Bank”) operates as the sole subsidiary of the Company through two divisions – “Graystone Bank, a division of Graystone Tower Bank,” consisting of the former Graystone Bank branches, and “Tower Bank, a division of Graystone Tower Bank,” consisting of the former branches of The First National Bank of Greencastle.
The Company’s activities consist of owning and supervising the Bank, which is engaged in providing banking and banking related services through its twenty-seven full service offices in Centre, Cumberland, Dauphin, Lebanon, York, Fulton, Franklin and Lancaster Counties of Pennsylvania and Washington County of Maryland. The Bank was originally incorporated on September 2, 2005, as a Pennsylvania-chartered bank and commenced operations on November 10, 2005. As a state chartered bank, the Bank is subject to regulation by the Federal Deposit Insurance Corporation (“FDIC”) and the Pennsylvania Department of Banking and undergoes periodic examinations by these regulatory authorities. The Company, as a bank holding company, is subject to regulation and supervision by the Board of Governors of the Federal Reserve System.
In January 2007, Graystone Mortgage, LLC commenced business as a mortgage banking subsidiary of the Bank, which holds a ninety percent (90%) interest in the mortgage subsidiary. Graystone Mortgage, LLC offers residential mortgage banking services within the Bank’s market areas.
In February 2007, the Bank entered into a purchase agreement with Dellinger, Dolan, McCurdy and Phillips Investment Advisors, LLC (“DDMP”). DDMP is a limited liability company that provides investment advisory and asset management services to individuals, businesses and nonprofit entities. In connection with the purchase agreement, the Bank purchased an aggregate of twenty percent (20%) of the issued and outstanding units of membership interests in DDMP. The investment is being accounted for using the equity method of accounting. The investment in DDMP is accounted for within the “Other Assets” line on the Balance Sheet. The income earned from the investment in DDMP is accounted for within the “Other Non-Interest Income” line on the Statement of Operations.
On December 27, 2009, Tower Bancorp, Inc. and First Chester County Corporation (“First Chester”) entered into an Agreement and Plan of Merger (the “FCEC Merger Agreement”) pursuant to which Tower will acquire First Chester in an all-stock transaction valued at approximately $65 million or $10.22 per share based on the closing price of Tower common stock at the announcement of this merger. In the merger, First Chester shareholders will receive 0.453 shares of Tower common stock for each share of First Chester common stock they hold on the effective date of the merger. As described in the definitive merger agreement, the exchange ratio is subject to upward or downward adjustment if loan delinquencies at First Chester increase or decrease beyond specified amounts.
As part of the definitive agreement, Tower’s subsidiary bank, Graystone Tower Bank, agreed to increase its lending facility with First Chester to up to $26 million as well as to purchase up to $100 million of residential mortgage and commercial loans from First National Bank of Chester County in order for the bank to satisfy the
62
Table of Contents
NOTES TO CONSOLIDATED FINANCIAL STATEMENTS—(Continued)
(amounts in thousands except for share and per share data)
regulatory capital requirements of the Office of the Comptroller of the Currency (the “OCC”). As of December 31, 2009, the Bank has loaned $26 million to First Chester. The Bank has also purchased approximately $52 million in loans from First National Bank of Chester County.
Following the transaction, based on the 0.453 exchange ratio, current Tower shareholders will own approximately 71% and First Chester shareholders will own approximately 29% of the combined company’s common stock. Pending regulatory approvals and approvals of shareholder of both entities, the merger is expected to be completed during the second quarter of 2010.
Basis of Presentation
The aforementioned merger between the Company and Graystone was considered a “merger of equals” and is accounted for as a reverse merger using the acquisition method of accounting with Graystone as the accounting acquirer. As a result, the historical financial information included in the Company’s financial statements and related footnotes as reported in this Form 10-K is that of Graystone.
The financial statements information at December 31, 2008 has been derived from the audited financial statements of Graystone at that date. The Graystone audited financial statements and footnotes for the year ended December 31, 2008 have been filed with the Securities and Exchange Commission (“SEC”) within Form 8-K/A on June 1, 2009.
The accompanying consolidated financial statements include the accounts of Tower Bancorp, Inc. and its wholly-owned subsidiary, Graystone Tower Bank and the Bank’s 90% owned mortgage subsidiary, Graystone Mortgage, LLC. All intercompany accounts and transactions are eliminated from the consolidated financial statements.
Our accounting and reporting policies conform to general practices within the banking industry and to U.S. generally accepted accounting principles (“GAAP”). Reclassifications of prior years’ amounts are made whenever necessary to conform to the current year’s presentation.
Use of Estimates
The preparation of financial statements in conformity with U.S. GAAP requires management to make estimates and assumptions that affect the reported amounts of assets and liabilities and disclosure of contingent assets and liabilities at the date of the financial statements and the reported amounts of revenues and expenses during the reporting period. Actual results could differ from those estimates. Material estimates that are particularly susceptible to significant change in the near term relate to the determination of the allowance for loan losses, the potential other-than-temporary impairment of investments, and the valuation of deferred tax assets.
Segment Information
The Company does not have any operating segments which require disclosure of additional information. While the Bank operates as two divisions, each engages in similar activities, provides similar products and services, and operates in the same general geographical area. The Corporation’s non-banking activities are immaterial and, therefore, separate information has not been disclosed.
Significant Group Concentrations of Credit Risk
Most of the Company’s activities are with customers located within central Pennsylvania and Washington County, Maryland. Note 3 discusses the types of securities in which the Company invests. Note 4 discusses the types of lending in which the Company engages. The Company does not have any significant concentrations to any one industry or customer.
63
Table of Contents
NOTES TO CONSOLIDATED FINANCIAL STATEMENTS—(Continued)
(amounts in thousands except for share and per share data)
Cash and Cash Equivalents
For purposes of reporting cash flows, cash and cash equivalents include cash on hand, amounts due from banks, and federal funds sold, all of which mature within 90 days. Federal funds are purchased and sold for one-day periods.
The Company is required under Federal Reserve Board regulations to maintain reserves against its transaction accounts. These reserves are generally held in the form of cash or noninterest earning accounts at the Company’s correspondent bank. Based on the nature of the Company’s transaction account deposits and the amount of vault cash on hand, the Company was not required to maintain a reserve balance with the Federal Reserve Board at December 31, 2009 or December 31, 2008.
Securities Available for Sale
Management determines the appropriate classification of debt and equity securities at the time of purchase and re-evaluates such designation as of each balance sheet date. Purchases and sales of investment securities are accounted for on a trade date basis.
All investment securities are classified as available for sale as the Company intends to hold such securities for an indefinite period of time but not necessarily to maturity. Securities available for sale are carried at fair value. Any decision to sell a security classified as available for sale would be based on various factors, including movement in interest rates, changes in maturity mix of the Company’s assets and liabilities, liquidity needs, regulatory capital considerations and other similar factors. Unrealized gains and losses are excluded from earnings and reported as increases or decreases in other comprehensive income or loss. Realized gains or losses, determined on the basis of the cost of the specific securities sold, are included in earnings. Premiums and discounts are recognized in interest income using the interest method over the terms of the securities.
Declines in the fair value of available for sale equity securities below their cost that are deemed to be other than temporary are reflected in earnings as realized losses. In estimating other-than-temporary impairment losses, management considers (1) the length of time and the extent to which the fair value has been less than cost, (2) the financial condition and near-term prospects of the issuer, and (3) the intent and ability of the Company to retain its investment in the issuer for a period of time sufficient to allow for any anticipated recovery in fair value.
In regard to debt securities, if the Company does not intend to sell the securities and it is more likely than not that the Company will not be required to sell the debt security prior to recovery, the Company will then evaluate whether a credit loss has occurred. To determine whether a credit loss has occurred, the Company compares the amortized cost of the debt security to the present value of the cash flows the Company expects to be collected. If the Company expects a cash flow shortfall, the Company will consider a credit loss to have occurred and will then consider the impairment to be other than temporary. The Company will recognize the amount of the impairment loss related to the credit loss in our results of operation, with the remaining portion of the loss recorded through comprehensive income, net of applicable taxes.
Restricted Investment in Bank Stocks
Restricted investment in bank stocks includes Atlantic Central Bankers Bank and Federal Home Loan Bank (FHLB) stocks. The stocks are carried at cost as these stocks are not actively traded and have no readily determinable market value.
As of December 31, 2009 and December 31, 2008, the Company had a restricted investment in the Federal Home Loan Bank of Pittsburgh “(FHLB)” of $6,124 and $2,018, respectively. In December 2008, the FHLB notified member banks that it was suspending dividend payments and the repurchase of capital stock.
64
Table of Contents
NOTES TO CONSOLIDATED FINANCIAL STATEMENTS—(Continued)
(amounts in thousands except for share and per share data)
Management determines whether these investments are impaired based on an assessment of the ultimate recoverability of their cost rather than by recognizing temporary declines in value. The determination of whether a decline affects the ultimate recoverability of their cost is influenced by criteria such as (1) the significance of the decline in net assets of the FHLB as compared to the capital stock amount for the FHLB and the length of time this situation has persisted, (2) commitments by the FHLB to make payments required by law or regulation and the level of such payments in relation to the operating performance of the FHLB, and (3) the impact of legislative and regulatory changes on institutions and, accordingly, on the customer base of the FHLB.
Management believes no impairment charge is necessary related to the investment in FHLB stock as of December 31, 2009.
Loans Held for Sale
Loans originated and intended for sale in the secondary market are carried at the lower of aggregate cost or fair value, as determined by aggregate outstanding commitments from investors or current investor yield requirements. Net unrealized losses are recognized through a valuation allowance by charges to income.
Mortgage loans held for sale are sold with the mortgage servicing rights released to another financial institution through a correspondent relationship. The correspondent financial institution absorbs all of the risk related to rate lock commitments. Gains or losses on sales of mortgage loans are recognized based on the difference between the selling price and the carrying value of the related mortgage loans sold.
Loans Receivable
Loans receivable that management has the intent and ability to hold for the foreseeable future or until maturity or payoff are stated at their outstanding unpaid principal balances, net of an allowance for loan losses and any deferred fees or costs. Interest income is accrued on the unpaid principal balance. Loan origination fees, net of certain direct origination costs, are deferred and recognized as an adjustment of the yield (interest income) of the related loans. The Company is amortizing these amounts over the contractual life of the loan.
The accrual of interest is discontinued when the contractual payment of principal or interest has become 90 days past due or management has serious doubts about further collectability of principal or interest, even though the loan is currently performing. A loan may remain on accrual status if it is in the process of collection and is either guaranteed or well secured. When a loan is placed on nonaccrual status, unpaid interest credited to income in the current year is reversed and unpaid interest accrued in prior years is charged against the allowance for loan losses. Interest received on nonaccrual loans generally is either applied against principal or reported as interest income, according to management’s judgment as to the collectability of principal. Generally, loans are restored to accrual status when the obligation is brought current, has performed in accordance with the contractual terms for a reasonable period of time and the ultimate collectability of the total contractual principal and interest is no longer in doubt.
Acquired Loans
Loans that we acquire in connection with acquisitions subsequent to January 1, 2009 are recorded at fair value with no carryover of the related allowance for credit losses. Fair value of the loans involves estimating the amount and timing of principal and interest cash flows expected to be collected on the loans and discounting those cash flows at a market rate of interest.
The excess of cash flows expected at acquisition over the estimated fair value is referred to as the accretable discount and is recognized into interest income over the remaining life of the loan. The difference between
65
Table of Contents
NOTES TO CONSOLIDATED FINANCIAL STATEMENTS—(Continued)
(amounts in thousands except for share and per share data)
contractually required payments at acquisition and the cash flows expected to be collected at acquisition is referred to as the nonaccretable discount. The nonaccretable discount includes estimated future credit losses expected to be incurred over the life of the loan. Subsequent decreases to the expected cash flows will require us to evaluate the need for an additional allowance for credit losses. Subsequent improvement in expected cash flows will result in the reversal of a corresponding amount of the nonaccretable discount which we will then reclassify as accretable discount that will be recognized into interest income over the remaining life of the loan.
Acquired loans that met the criteria for nonaccrual of interest prior to the acquisition may be considered performing upon acquisition, regardless of whether the customer is contractually delinquent. We expect to fully collect the new carrying value (i.e. fair value) of the loans. As such, we may no longer consider the loan to be nonaccrual or nonperforming and may accrue interest on these loans, including the impact of any accretable discount. In addition, charge-offs on such loans would be first applied to the nonaccretable difference portion of the fair value adjustment.
Allowance for Loan Losses
The allowance for loan losses is established through provisions for loan losses charged against income as losses are estimated to have occurred. Loans deemed to be uncollectible are charged against the allowance for loan losses, and subsequent recoveries, if any, are credited to the allowance.
The allowance for loan losses is maintained at a level considered adequate to provide for losses that can be reasonably estimated. Management’s periodic evaluation of the adequacy of the allowance is based on known and inherent risks in the portfolio, adverse situations that may affect the borrower’s ability to repay, the estimated value of any underlying collateral, composition of the loan portfolio, current economic conditions and other relevant factors. This evaluation is inherently subjective as it requires material estimates that may be susceptible to significant change.
The allowance consists of specific and general components. The specific component relates to loans that are classified as doubtful, substandard, or special mention. For such loans that are also classified as impaired, an allowance is established when the discounted cash flows (or collateral value or observable market price) of the impaired loan is lower than the carrying value of that loan. The general component covers non-classified loans that have been segmented into groups with similar characteristics and is based on historical loss experience adjusted for qualitative factors.
A loan is considered impaired when, based on current information and events, it is probable that the Company will be unable to collect the scheduled payments of principal or interest when due according to the contractual terms of the loan agreement. Factors considered by management in determining impairment include payment status, collateral value and the probability of collecting scheduled principal and interest payments when due. Loans that experience insignificant payment delays and payment shortfalls generally are not classified as impaired. Management determines the significance of payment delays and payment shortfalls on a case-by-case basis, taking into consideration all of the circumstances surrounding the loan and the borrower, including the length of the delay, the reasons for the delay, the borrower’s prior payment record and the amount of the shortfall in relation to the principal and interest owed. Impairment is evaluated on a loan by loan basis for commercial and construction loans and is measured as the difference between a loan’s carried value on the balance sheet and its fair market value. Based on the nature of the loan, its fair value reflects one of the following three measures: (i) the fair market value of collateral; (ii) the present value of the expected future cash flows; or (iii) the loan’s value as observable in the secondary market.
Large groups of smaller balance homogeneous loans are collectively evaluated for impairment. Accordingly, the Company does not separately identify individual consumer and home equity loans for impairment disclosures.
66
Table of Contents
NOTES TO CONSOLIDATED FINANCIAL STATEMENTS—(Continued)
(amounts in thousands except for share and per share data)
Other Real Estate Owned
Foreclosed properties are those properties for which the Company has taken physical possession in connection with loan foreclosure proceedings.
At the time of foreclosure, foreclosed real estate is recorded at lower of cost or fair value less cost to sell, which becomes the property’s new basis. Any write-downs based on the asset’s fair value at date of acquisition are charged to the allowance for loan losses. After foreclosure, these assets are carried as “other assets” at the new basis. Improvements to the property are added to the basis of the assets. Costs incurred in maintaining foreclosed real estate and subsequent adjustments to the carrying amount of the property are classified as “other expenses.”
Business Combinations and Intangible Assets
The Company accounts for its acquisitions using the purchase accounting method. Purchase accounting requires the total purchase price to be allocated to the estimated fair values of assets acquired and liabilities assumed, including certain intangible assets that must be recognized. Typically, this allocation results in the purchase price exceeding the fair value of net assets acquired, which is recorded as goodwill. Core deposit intangibles are a measure of the value of checking, money market and savings deposits acquired in business combinations accounted for under the purchase method. Core deposit intangibles and other identified intangibles with finite useful lives are amortized using the sum of the year’s digits over their estimated useful lives of up to fifteen years. The Corporation completes annual impairment tests for goodwill and other intangible assets. Identifiable intangible assets are evaluated for impairment if events and circumstances indicate a possible impairment. There can be no assurance that future goodwill impairment tests will not result in a charge to earnings. Core deposit intangibles are being amortized over their average estimated useful lives of ten years.
Mortgage servicing rights (MSRs) are recognized as separate assets when mortgage loans are sold and the servicing rights are retained. Capitalized residential MSRs are reported in other assets and are amortized into noninterest income in proportion to, and over the period of, the estimated future net servicing period of the underlying mortgage loans. Capitalized commercial MSRs are reported in other assets and are remeasured at fair value each reporting period. MSRs are evaluated for impairment based upon the fair value of the rights as compared to amortized cost. The Company engages a third party service provider who estimates the fair value of MSRs using discounted cash flow models that calculate the present value of estimated future net servicing income. The model uses readily available prepayment speed assumptions for the current interest rates of the portfolios serviced. MSRs are carried at the lower of amortized cost or estimated fair value. Impairment is recognized through a valuation allowance, to the extent that fair value is less than the unamortized capitalized amount.
Goodwill
Goodwill represents the excess of the purchase price over the underlying fair value of merged entities. The Company assesses goodwill for impairment annually as of October 31st of each year. If certain events occur which indicate goodwill might be impaired between annual tests, goodwill must be tested when such events occur. In making this assessment, management considers a number of factors including operating results, business plans, economic projections, anticipated futures cash flows, current market data, etc. There are inherent uncertainties related to these factors and management’s judgment in applying them to the analysis of goodwill impairment. Changes in economic and operating conditions could result in goodwill impairment in future periods. The Company tested goodwill for impairment as of October 31, 2009 and determined that no impairment had occurred.
67
Table of Contents
NOTES TO CONSOLIDATED FINANCIAL STATEMENTS—(Continued)
(amounts in thousands except for share and per share data)
Transfers of Financial Assets
The Company sells interests in loans receivable through loan participation sales. The Company accounts for these transactions as sales, when control over the assets is surrendered. Control over transferred assets is deemed to be surrendered when (1) the assets are isolated from the Company, (2) the transferee obtains the right (free of conditions that constrain it from taking advantage of that right) to pledge or exchange the transferred assets, and (3) the Company does not maintain effective control over the transferred assets through an agreement to repurchase them before their maturity.
Premises and Equipment
Premises and equipment are stated at cost less accumulated depreciation. Depreciation is computed on the straight-line method over the shorter of the remaining lease term, if applicable, or the economic life which is reflected in the following average lives:
| Years | ||
| Automobiles |
3 - 5 | |
| Building and leasehold improvements |
10 - 39 | |
| Furniture, fixtures, and equipment |
3 - 10 | |
| Software and computer equipment |
2 - 5 |
Bank Owned Life Insurance
The Company has purchased bank owned life insurance (“BOLI”) policies on certain employees as a means to generate tax-free income which is used to offset a portion of current and future employee benefit costs. The BOLI profits from the appreciation of the cash surrender value of the pool of insurance and is recorded as part of “Non-interest Income.”
Net Income Per Share
The Company’s basic net income per share is calculated as net income divided by the weighted average number of shares outstanding. For diluted net income per share, net income is divided by the weighted average number of shares outstanding plus the incremental number of shares added as a result of converting common stock equivalents, calculated using the treasury stock method. The Company’s common stock equivalents consist solely of outstanding stock options and restricted stock. The effects of options to issue common stock are excluded from the computation of diluted earnings per share in periods in which the effect would be antidilutive.
A reconciliation of the weighted average shares outstanding used to calculate basic net income per share and diluted net income per share follows:
| For the Year Ended | ||||||
| December 31, 2009 | December 31, 2008 | December 31, 2007 | ||||
| Weighted average shares outstanding (basic) |
5,156,078 | 2,734,027 | 1,867,767 | |||
| Impact of common stock equivalents |
5,247 | — | — | |||
| Weighted average shares outstanding (diluted) |
5,161,325 | 2,734,027 | 1,867,767 | |||
| Common stock equivalents excluded from earnings per share as their effect would have been anti-dilutive |
68,150 | 83,895 | — | |||
68
Table of Contents
NOTES TO CONSOLIDATED FINANCIAL STATEMENTS—(Continued)
(amounts in thousands except for share and per share data)
Stock-Based Compensation
The Company recognizes all share-based payments to employees in the consolidated statement of operations based on their fair values. The fair value of such equity instruments is recognized as an expense in the historical financial statements as services are performed. The Company uses the Black-Scholes Model to estimate the fair value of each option on the date of grant. The Black-Scholes Model estimates the fair value of employee stock options using a pricing model which takes into consideration the exercise price of the option, the expected life of the option, the current market price and its expected volatility, the expected dividends on the stock and the current risk-free interest rate for the expected life of the option. The Company typically grants stock options to employees with an exercise price equal to the fair value of the shares at the date of grant. The fair value of restricted stock is equivalent to the fair value on the date of grant and is amortized over the vesting period.
Dividend Reinvestment and Employee Stock Purchase Plans
The Dividend Reinvestment and Stock Purchase Plan (the “Reinvestment Plan”) was adopted in June 2009 and allows for the issuance of 1,000,000 shares of common stock. During 2009, 18,559 were issued under the Reinvestment Plan, with 981,441 shares available for future purchase as of December 31, 2009.
The Employee Stock Purchase Plan (the “Purchase Plan”) was adopted by shareholders in May 2009 and allows for the issuance of 250,000 shares of common stock. Employees may elect to make contributions to the Purchase Plan in an aggregate amount not less than 1% nor more than 10% of such employee’s total compensation. These contributions are then used to purchase stock during an offering period as defined by the Purchase Plan. The purchase price of the stock is based solely on the market price of the shares at the date of purchase. No compensation expense is recognized since the Purchase Plan qualifies as a non-compensatory plan. During 2009, 2,788 shares were issued under the Purchase Plan, with 247,212 shares available for future purchase as of December 31, 2009.
Advertising Costs
The Company charges advertising costs to expense as incurred.
Income Taxes
Deferred income taxes are provided on the liability method whereby deferred tax assets are recognized for deductible temporary differences and deferred tax liabilities are recognized for taxable temporary differences. Temporary differences are the differences between the reported amounts of assets and liabilities and their tax basis. Deferred tax assets are reduced by a valuation allowance when, in the opinion of management, it is more likely than not that some portion of the deferred tax assets will not be realized. Deferred tax assets and liabilities are adjusted for the effects of changes in tax laws and rates on the date of enactment.
The Company adopted the provisions of ASC 740, Accounting for Uncertainty in Income Taxes, on January 1, 2008. Previously, the Company had accounted for tax contingencies in accordance with ASC 450, Accounting for Contingencies. As required by ASC 740, the Company recognizes the financial statement benefit of a tax position only after determining that the relevant tax authority would more likely than not sustain the position following an audit. For tax positions meeting the more-likely-than-not threshold, the amount recognized in the financial statements is the largest benefit that has a greater than 50 percent likelihood of being realized upon ultimate settlement with the relevant tax authority. At the adoption date, the Company applied ASC 740 to all tax positions for which the statute of limitations remained open. As a result of the adoption of ASC 740, there was no material effect on the Company’s consolidated financial position or results of operations and no adjustment to retained earnings.
69
Table of Contents
NOTES TO CONSOLIDATED FINANCIAL STATEMENTS—(Continued)
(amounts in thousands except for share and per share data)
Comprehensive Income
Comprehensive income is defined as the change in equity from transactions and other events from nonowner sources. It includes all changes in equity except those resulting from investments by stockholders and distributions to stockholders. Comprehensive income includes net income and accounting for certain investments in debt and equity securities.
The Company has elected to report its comprehensive income in the statement of changes in stockholders’ equity. The only element of “other comprehensive income” that the Company has is the unrealized gains or losses on available for sale securities.
The components of the change in net unrealized gains (losses) on securities are as follows:
| 2009 | 2008 | 2007 | |||||||||
| Gross unrealized holding gains (losses) arising during the year |
$ | (672 | ) | $ | 184 | $ | 73 | ||||
| Reclassification adjustment for impairment losses recognized in net income |
156 | — | — | ||||||||
| Reclassification adjustment for losses (gains) realized in net income |
(334 | ) | — | — | |||||||
| Net unrealized holding gains (losses) before taxes |
(850 | ) | 184 | 73 | |||||||
| Tax effect |
289 | (76 | ) | — | |||||||
| Net change |
$ | (561 | ) | $ | 108 | $ | 73 | ||||
Financial Instruments with Off-Balance Sheet Risk
In the ordinary course of business, the Company has entered into off-balance sheet financial instruments consisting of commitments to extend credit and letters of credit. Such financial instruments are recorded in the consolidated balance sheet when they are funded. See Note 14 for further discussion.
Recent Accounting Pronouncements
In January 2010, the FASB issued an Accounting Standard Codification Update for improving disclosures about fair value measurements. This update requires companies to disclose, and provide the reasons for, all transfers of assets and liabilities between the Level 1 and 2 fair value categories. It also clarifies that companies should provide fair value measurement disclosures for classes of assets and liabilities which are subsets of line items within the balance sheet, if necessary. In addition, the update clarifies that companies provide disclosures about the fair value techniques and inputs for assets and liabilities classified within Level 2 or 3 categories. The disclosure requirements prescribed by this update are effective for fiscal years beginning after December 15, 2009, and for interim periods within those fiscal years, or March 31, 2010 for the Company. This update also requires companies to reconcile changes in Level 3 assets and liabilities by separately providing information about Level 3 purchases, sales, issuances and settlements on a gross basis. This provision of this update is effective for fiscal years beginning after December 15, 2010, and for interim periods within those fiscal years, or March 31, 2011 for the Company. The adoption of this update is not expected to materially impact the Company’s fair value measurement disclosures.
In September 2009, the FASB issued an Accounting Standard Codification Update for fair value measurements and disclosures related to investments in certain entities that calculate net asset value per share or its equivalent. The update permits, as a practical expedient, a reporting entity to measure the fair value of an investment that is
70
Table of Contents
NOTES TO CONSOLIDATED FINANCIAL STATEMENTS—(Continued)
(amounts in thousands except for share and per share data)
within the scope of the amendments in this update on the basis of the net asset value per share of the investment (or its equivalent) if the net asset value of the investment (or its equivalent) is calculated in a manner consistent with the measurement principles of this update as of the reporting entity’s measurement date. The update also requires disclosures by major category of investment about the attributes of investments within the scope of the update. The update is effective for interim and annual periods ending after December 15, 2009. The adoption of this update did not have a material impact on the Company’s consolidated financial statements as of December 31, 2009.
In August 2009, the FASB issued standards which amends fair value guidance by allowing companies to determine the fair value of liabilities using the perspective of an investor that holds the related obligation as an asset as opposed to measuring liabilities based on the price that would be paid to transfer a liability to a new obligor. These standards were effective September 30, 2009, and did not have a material impact on the Company’s consolidated financial statements.
In June 2009, the FASB issued a pronouncement that established the FASB Accounting Standards CodificationTM as the source of authoritative accounting principles recognized by the FASB to be applied by nongovernmental entities in the preparation of financial statements in conformity with GAAP. The pronouncement is effective for our consolidated financial statements for the interim and annual financial period after September 15, 2009. We have adopted this Statement effective for the interim period ending September 30, 2009. The adoption of this pronouncement did not have a material impact on our consolidated financial statements.
In June 2009, the FASB issued a pronouncement that amends the derecognition guidance in U.S. GAAP and eliminates the concept of qualifying special-purpose entities (“QSPE”s). This pronouncement is effective for fiscal years and interim periods beginning after November 15, 2009 and early adoption is prohibited. We will adopt this pronouncement on January 1, 2010 and have not yet determined the effect of the adoption on its consolidated financial statements.
In June 2009, the FASB issued a pronouncement, which amends the consolidation guidance applicable to variable interest entities (“VIE”s). An entity would consolidate a VIE, as the primary beneficiary, when the entity has both of the following characteristics: (a) the power to direct the activities of a VIE that most significantly impact the entity’s economic performance and (b) the obligation to absorb losses of the entity that could potentially be significant to the VIE or the right to receive benefits from the entity that could potentially be significant to the VIE. Ongoing reassessment of whether an enterprise is the primary beneficiary of a VIE is required. This pronouncement eliminates the quantitative approach previously required for determining the primary beneficiary of a VIE. The pronouncement is effective for fiscal years and interim periods beginning after November 15, 2009. We will adopt this pronouncement on January 1, 2010 and have not yet determined the effect of the adoption on its consolidated financial statements.
In May 2009, the FASB issued a pronouncement that establishes accounting principles to be applied to the accounting for and disclosure of subsequent events not addressed in other U.S. GAAP. This pronouncement is effective for interim or annual financial periods ending after June 15, 2009 and shall be applied prospectively. We have adopted this Statement effective for the interim period ending June 30, 2009. We have evaluated subsequent events for potential recognition or disclosure within the Annual report on Form 10-K in accordance with this guidance.
In April 2009, the FASB issued standards for recognition and presentation of other-than-temporary impairments. The standards (i) change existing guidance for determining whether an impairment is other- than-temporary for debt securities and (ii) replace the existing requirement that the entity’s management assert it has both the intent and ability to hold an impaired security until recovery with a requirement that management assert: (a) it does not
71
Table of Contents
NOTES TO CONSOLIDATED FINANCIAL STATEMENTS—(Continued)
(amounts in thousands except for share and per share data)
have the intent to sell the security; and (b) it is more likely than not it will not have to sell the security before recovery of its cost basis. Declines in the fair value of held-to-maturity and available-for-sale securities below their cost that are deemed to be other-than-temporary are reflected in earnings as realized losses to the extent the impairment is related to credit losses. The amount of impairment related to other factors is recognized in other comprehensive income. These standards were effective for interim and annual periods ending after June 15, 2009. The application of the provisions of these standards did not have a material impact on the Company’s consolidated financial statements as of December 31, 2009.
In April 2009, the FASB issued standards for determining fair value when the volume and level of activity for the asset or liability have significantly decreased and identifying transactions that are not orderly. The standards were effective prospectively for interim periods and annual years ending after June 15, 2009. The application of the provisions of these standards did not have a material impact on the Company’s consolidated financial statements as of December 31, 2009.
In April 2009, the FASB issued standards for accounting for assets acquired and liabilities assumed in a business combination that arise from contingencies. The standards provide guidance in respect of initial recognition and measurement, subsequent measurement, and disclosures concerning assets and liabilities arising from pre-acquisition contingencies in a business combination. The standards were effective for business combinations for which the acquisition date was on or after the beginning of the first annual reporting period beginning on or after December 15, 2008. The application of the provisions of these standards did not have a material impact on the Company’s consolidated financial statements as of December 31, 2009.
In June 2008, the FASB issued guidance that clarifies that all outstanding unvested share-based payment awards that contain rights to nonforfeitable dividends participate in undistributed earnings with common shareholders. Awards of this nature are considered participating securities and the two-class method of computing basic and diluted earnings per share must be applied. This guidance was effective for the Company on January 1, 2009. The adoption of this guidance did not have a material impact on our consolidated financial statements.
In December 2007, the FASB issued a pronouncement that establishes accounting and reporting standards for the noncontrolling interest in a subsidiary and for the deconsolidation of a subsidiary. The guidance became effective as of January 1, 2009. The adoption of this pronouncement did not have a material impact to our consolidated financial statements. In January 2010, the FASB issued updated guidance relating to the decrease in ownership of a subsidiary. The updated guidance is effective at the beginning of the first interim or annual reporting period ending on or after December 15, 2009 and should be applied retrospectively. The updated guidance is not expected to have a material impact on the Company’s consolidated financial statements.
Note 2 – Merger Accounting
On November 13, 2008, Graystone and the Company announced the execution of an agreement of merger, providing for the merger of Graystone with and into the Company. This merger became effective prior to the start of business on March 31, 2009. The Merger has been accounted for as a reverse merger using the acquisition method of accounting. For accounting purposes, Graystone is considered to be acquiring Tower in this transaction with the surviving legal entity operating under Tower Bancorp, Inc.’s articles of incorporation. Immediately following the holding company merger, the Company’s wholly-owned subsidiary, The First National Bank of Greencastle, merged with and into Graystone Bank, the wholly-owned subsidiary of Graystone, under the name “Graystone Tower Bank.” Graystone Tower Bank is, therefore, the wholly owned subsidiary of Tower Bancorp, Inc. and operates under the prior Graystone Bank charter.
72
Table of Contents
NOTES TO CONSOLIDATED FINANCIAL STATEMENTS—(Continued)
(amounts in thousands except for share and per share data)
To determine the accounting treatment of the Merger, management utilized the following facts in concluding that the transaction would be treated as a reverse merger, with Graystone as the accounting acquirer:
| • | The roles of Chief Executive Officer, Chief Operating Officer, Chief Financial Officer, Chief Credit Officer, and General Counsel of the post-combination entity have been assumed by the executives of Graystone. |
| • | Upon the effective date of the Merger, the Tower Board of Directors consists of twenty members, of which half of the members have been appointed from the historical Tower Board of Directors with the remaining ten directors having been appointed from the Graystone Board of Directors. |
| • | After the closing of the Merger and as a result of the fixed share exchange ratio of .42 shares of Tower common stock for each Graystone common share, the former Graystone shareholders, as a group, held approximately fifty-four percent of the outstanding shares of Tower stock. |
| • | Graystone contributed greater than fifty percent of the total assets and tangible equity to the combined entity, while Tower contributed greater than fifty percent of the net income to the combined entity. |
The acquisition-date fair value of the consideration transferred by the accounting acquirer (Graystone) for its interest in Tower is based on the number of equity interests Graystone would have to issue (measured on the transaction closing date) to give the owners of Tower the same percentage equity interest in the combined Tower entity that results from the reverse acquisition. The Company has utilized the closing price of Tower’s common stock on March 30, 2009 (since the merger was effective prior to the open of business on March 31, 2009) to determine the fair value of Tower stock to be utilized in the purchase price calculation which was determined to be $24.97. The table below illustrates the calculation of the consideration effectively transferred.
Purchase Price Calculation
| Graystone shares outstanding at March 30, 2009 |
6,523,584 | |||
| Exchange ratio |
0.42 | |||
| Tower shares issued to Graystone owners (excludes fractional shares) |
2,739,811 | |||
| Tower shares outstanding at March 30, 2009 |
2,316,823 | |||
| Total Tower shares at March 30, 2009 |
5,056,634 | |||
| Ownership % held by Graystone stockholders |
54.18 | % | ||
| Ownership % held by legacy Tower stockholders |
45.82 | % | ||
| Theoretical Graystone Share to be Issued as Consideration |
||||
| Graystone shares outstanding at March 30, 2009 |
6,523,584 | |||
| Ownership % held by Graystone stockholders |
54.18 | % | ||
| Theoretical total Graystone shares after consideration paid |
12,040,019 | |||
| Ownership % held by legacy Tower stockholders |
45.82 | % | ||
| Theoretical Graystone shares to be issued to Tower as consideration |
5,516,435 | |||
| Fair value of Graystone shares at March 30, 2009 (Tower share price * .42) |
$ | 10.49 | ||
| Fair value of theoretical Graystone shares issued as consideration |
57,853 | |||
| Cash paid for fractional shares |
2 | |||
| Total consideration paid |
$ | 57,855 | ||
73
Table of Contents
NOTES TO CONSOLIDATED FINANCIAL STATEMENTS—(Continued)
(amounts in thousands except for share and per share data)
As a result of the Merger, the Company recognized assets acquired and liabilities assumed at their acquisition date fair value as presented below.
| Total Purchase Price |
$ | 57,855 | |||||
| Net Assets Acquired: |
|||||||
| Cash |
$ | 9,017 | |||||
| Securities available for sale |
58,256 | ||||||
| Restricted Investments |
5,210 | ||||||
| Loans |
418,747 | ||||||
| Accrued interest receivable |
1,786 | ||||||
| Premises and Equipment |
22,644 | ||||||
| Core deposit intangible |
3,899 | ||||||
| Deferred tax asset |
143 | ||||||
| Other assets |
12,457 | ||||||
| Time deposits |
(160,806 | ) | |||||
| Deposits other than time deposits |
(249,397 | ) | |||||
| Borrowings |
(69,601 | ) | |||||
| Accrued interest payable |
(698 | ) | |||||
| Other liabilities |
(5,737 | ) | |||||
| 45,920 | |||||||
| Goodwill resulting from merger |
$ | 11,935 | |||||
The following table explains the changes in fair value of the net assets acquired and goodwill recognized from the original reported amounts in the Form 10-Q for the period ended March 31, 2009.
| Goodwill balance at March 31, 2009 |
$ | 8,689 | ||
| Effect of adjustments to: |
||||
| Loans |
(120 | ) | ||
| Premises and equipment |
2,191 | |||
| Deferred tax asset |
247 | |||
| Other asset |
737 | |||
| Other liabilities |
191 | |||
| Goodwill balance at December 31, 2009 |
$ | 11,935 | ||
The goodwill generated by the Merger consists of synergies and increased economies of scale such as the ability to offer more diverse and more profitable products, added diversity to the branch system to achieve lower cost deposits, an increased legal lending limit, etc. Management expects that no goodwill recognized as a result of the Merger will be deductible for income tax purposes. Since the combined entity will operate as a single business unit, there is no segment impact of the Merger.
74
Table of Contents
NOTES TO CONSOLIDATED FINANCIAL STATEMENTS—(Continued)
(amounts in thousands except for share and per share data)
The fair value of the financial assets acquired included loans receivable with a gross amortized cost basis of $426,177. The table below illustrates the fair value adjustments made to the amortized costs basis in order to present a fair value of the loans acquired.
| Gross amortized costs basis at March 30, 2009 |
$ | 426,177 | ||
| Market rate adjustment |
1,323 | |||
| Credit fair value adjustment on pools of homogeneous loans |
(4,044 | ) | ||
| Credit fair value adjustment on distressed loans |
(4,709 | ) | ||
| Fair value of purchased loans at March 30, 2009 |
$ | 418,747 | ||
The market rate adjustment represents the movement in market interest rates, irrespective of credit adjustments, compared to the stated rates of the acquired loans. The credit adjustment made on pools of homogeneous loans represents the changes in credit quality of the underlying borrowers from the loan inception to the acquisition date. The credit adjustment on distressed loans is derived in accordance with Accounting Standard Codification 310-30-30, previously known as Statement of Position (SOP) 03-3, “Accounting for Certain Loans Acquired in a Transfer,” and represents the portion of the loan balance that has been deemed uncollectible based on the management’s expectations of future cash flows for each respective loan.
The following table shows the pro forma financial results for the Company and Graystone for the year ended December 31, 2009 and 2008, assuming that the Merger occurred on January 1, 2009 and 2008, respectively:
| Pro-forma | Pro-forma | |||||
| December 31, 2009 | December 31, 2008 | |||||
| (unaudited) | (unaudited) | |||||
| Net interest income |
$ | 41,268 | $ | 37,448 | ||
| Pre-tax net income |
5,131 | 4,503 | ||||
| Income tax expense |
1,615 | 307 | ||||
| Net income |
3,516 | 4,195 | ||||
| Pro-forma earnings per share: |
||||||
| Basic |
$ | 0.68 | $ | 1.21 | ||
| Diluted |
$ | 0.68 | $ | 1.21 | ||
75
Table of Contents
NOTES TO CONSOLIDATED FINANCIAL STATEMENTS—(Continued)
(amounts in thousands except for share and per share data)
Note 3 – Securities Available for Sale
The amortized cost of securities and their approximate fair values at December 31, 2009 and 2008 are as follows:
| December 31, 2009 | |||||||||||||
| Amortized Cost |
Gross Unrealized Gains |
Gross Unrealized Losses |
Fair Value | ||||||||||
| Equity securities |
$ | 1,156 | $ | 20 | $ | (44 | ) | $ | 1,132 | ||||
| U.S. Government sponsored agency securities |
56,437 | 12 | (65 | ) | 56,384 | ||||||||
| U.S. Government sponsored agency mortgage- backed securities |
9,109 | 37 | (30 | ) | 9,116 | ||||||||
| Collateralized mortgage obligations |
93,058 | 81 | (654 | ) | 92,485 | ||||||||
| Municipal bonds |
7,093 | 95 | — | 7,188 | |||||||||
| Municipal bonds – taxable |
12,917 | 64 | (71 | ) | 12,910 | ||||||||
| SBA Pool Loan Investments |
10,710 | — | (72 | ) | 10,638 | ||||||||
| $ | 190,480 | $ | 309 | $ | (936 | ) | $ | 189,853 | |||||
| December 31, 2008 | |||||||||||||
| Municipal bonds |
$ | 1,279 | $ | 20 | $ | — | $ | 1,299 | |||||
| U.S. Government sponsored agency securities |
18,402 | 203 | — | 18,605 | |||||||||
| $ | 19,681 | $ | 223 | $ | — | $ | 19,904 | ||||||
Included with the Company’s securities available for sale are pledged securities with a fair market value of $130,614 and $19,904 at December 31, 2009 and December 31, 2008, respectively. The securities were pledged to secure public deposits and securities sold under agreements to repurchase.
The amortized cost and fair value of available for sale securities as of December 31, 2009 and 2008 by contractual maturity are shown below. Expected maturities may differ from contractual maturities due to the issuer’s rights to call or prepay the obligation without penalty.
| December 31, 2009 | ||||||
| Amortized Cost | Fair Value | |||||
| Due in one year or less |
$ | 20,715 | $ | 20,719 | ||
| Due after one year through five years |
34,290 | 34,333 | ||||
| Due after five years through ten years |
15,996 | 15,946 | ||||
| Due after ten years |
5,446 | 5,484 | ||||
| 76,447 | 76,482 | |||||
| Mortgage-backed securities (1) |
112,877 | 112,239 | ||||
| Equity securities |
1,156 | 1,132 | ||||
| $ | 190,480 | $ | 189,853 | |||
(1) Mortgage-backed securities include agency mortgage-backed securities, Government National Mortgage Association collateralized mortgage and Small Business Agency Loan Pools obligations.
76
Table of Contents
NOTES TO CONSOLIDATED FINANCIAL STATEMENTS—(Continued)
(amounts in thousands except for share and per share data)
The following table presents information related to the Company’s gains and losses on the sales of equity and debt securities, and losses recognized for other-than-temporary impairment of investments.
| Year Ended December 31, | |||||||||||||
| Gross Realized Gains |
Gross Realized Losses |
Other-than- temporary Impairment Losses |
Net (Losses) Gains |
||||||||||
| 2009 |
|||||||||||||
| Equity securities |
$ | 814 | $ | 726 | $ | 156 | $ | (68 | ) | ||||
| Debt securities |
254 | 8 | — | 246 | |||||||||
| Total |
$ | 1,068 | $ | 734 | $ | 156 | $ | 178 | |||||
| 2008 |
|||||||||||||
| Equity securities |
$ | — | $ | — | $ | — | $ | — | |||||
| Debt securities |
— | 15 | — | (15 | ) | ||||||||
| Total |
$ | — | $ | 15 | $ | — | $ | (15 | ) | ||||
During the year ending 2009, the Company recognized other than temporary impairment charge of $156, representing 7 equity securities. Equity securities, obtained during the merger at March 31, 2009, were valued based on current market factors. Due to the increasing severity and continuing decline in the fair value of the securities during the year and the near term prospects of the issuers, the Company determined than the other than temporary impairment was necessary.
The following table shows gross unrealized losses and fair value, aggregated by investment category and length of time that individual securities have been in a continuous unrealized loss position, at December 31 2009:
| Less Than 12 Months | 12 Months or More | Total | |||||||||||||||||
| Fair Value |
Unrealized Losses |
Fair Value |
Unrealized Losses |
Fair Value |
Unrealized Losses | ||||||||||||||
| Equity securities |
$ | 417 | $ | 44 | $ | — | $ | — | $ | 417 | $ | 44 | |||||||
| U.S. Government sponsored agency securities |
47,101 | 65 | — | — | 47,101 | 65 | |||||||||||||
| U.S. Government sponsored agency mortgage-backed securities |
7,275 | 30 | — | — | 7,275 | 30 | |||||||||||||
| Collateralized mortgage obligations |
70,991 | 654 | — | — | 70,991 | 654 | |||||||||||||
| Municipal bonds |
— | — | — | — | — | — | |||||||||||||
| Municipal bonds – taxable |
6,955 | 71 | — | — | 6,955 | 71 | |||||||||||||
| SBA Pool Loan Investments |
10,710 | 72 | — | — | 10,710 | 72 | |||||||||||||
| $ | 143,449 | $ | (936 | ) | $ | — | $ | — | $ | 143,449 | $ | 936 | |||||||
The previous table represents 36 investment securities at December 31, 2009 where the current fair value is less than the related amortized cost. No investment securities at December 31, 2008 had current fair value less than the related amortized cost. Management believes the impairments to be temporary in all cases. Management evaluates securities for other-than-temporary impairment at least on a monthly basis, but management’s intent is to hold all investments until maturity unless market, economic or specific investment concerns warrant a sale of securities. Consideration is given to (1) the length of time and the extent to which the fair value has been less than cost, (2) the financial condition and near-term prospects of the issuer, and (3) the intent and ability of the Company to retain its investment in the issuer for a period of time sufficient to allow for any anticipated recovery in fair value.
77
Table of Contents
NOTES TO CONSOLIDATED FINANCIAL STATEMENTS—(Continued)
(amounts in thousands except for share and per share data)
Note 4 – Loans
The following table presents a summary of the loan portfolio at December 31, 2009 and 2008:
| December 31, 2009 |
December 31, 2008 |
|||||||
| Commercial |
$ | 861,673 | $ | 508,744 | ||||
| Consumer & other |
85,510 | 54,084 | ||||||
| Residential mortgage |
191,277 | 5,123 | ||||||
| Total Loans |
1,138,460 | 567,951 | ||||||
| Deferred fees, net |
(189 | ) | (229 | ) | ||||
| Allowance for loan losses |
(9,695 | ) | (6,017 | ) | ||||
| Net Loans |
$ | 1,128,576 | $ | 561,705 | ||||
The Bank grants the majority of its loans to borrowers throughout central Pennsylvania and northern Maryland. Although the Bank has a diversified loan portfolio, a significant portion of its borrowers’ ability to honor their contracts is influenced by the region’s economy.
Overdraft deposits are reclassified as loans and are included in the total loans on the Consolidated Balance Sheets. For the year ended December 31, 2009 and 2008, total overdraft deposits were $397 and $399, respectively.
The Company had total net purchased loans from unaffiliated banks of $59,268 and $4,237 at December 31, 2009 and 2008, respectively. The net increase in purchased loans is primarily due to the purchase of 16 loans from First National Bank of Chester County as part of the FCEC Merger Agreement. The net purchase price of these loan participations was $51,713.
The Company serviced $111,649 and $112,871 of participation loans for unrelated parties at December 31, 2009 and 2008, respectively.
The Company sold $133,521 and $42,283 of residential mortgage loans into the secondary market during the years ended December 31, 2009 and 2008, respectively. A gain of $1,521, $528, and 358 was recognized on the sale of these loans for the years ended December 31, 2009, 2008 and 2007, respectively.
Note 5 – Allowance for Loan Losses
The following table presents the components of the allowance for credit losses as of December 31, 2009, 2008 and 2007:
| December 31, 2009 |
December 31, 2008 |
December 31, 2007 | |||||||
| Allowance for loan losses |
$ | 9,695 | $ | 6,017 | $ | 4,148 | |||
| Credit quality adjustment on loans purchased |
2,942 | — | — | ||||||
| Allowance for credit losses |
$ | 12,637 | $ | 6,017 | $ | 4,148 | |||
78
Table of Contents
NOTES TO CONSOLIDATED FINANCIAL STATEMENTS—(Continued)
(amounts in thousands except for share and per share data)
Changes in the allowance for loan losses were as follows for the years ended December 31, 2009, 2008 and 2007:
| 2009 | 2008 | 2007 | ||||||||||
| Balance at beginning of period |
$ | 6,017 | $ | 4,148 | $ | 2,156 | ||||||
| Provision for loan losses |
5,216 | 2,550 | 1,997 | |||||||||
| Charge-offs |
||||||||||||
| Commercial |
(1,398 | ) | (633 | ) | — | |||||||
| Consumer |
(193 | ) | (1 | ) | (5 | ) | ||||||
| Residential mortgages |
(7 | ) | (47 | ) | — | |||||||
| Total Charge-offs |
(1,598 | ) | (681 | ) | (5 | ) | ||||||
| Recoveries |
||||||||||||
| Commercial |
47 | — | — | |||||||||
| Consumer |
13 | — | — | |||||||||
| Residential mortgages |
— | — | — | |||||||||
| Total Recoveries |
60 | — | — | |||||||||
| Net charge-offs |
(1,538 | ) | (681 | ) | (5 | ) | ||||||
| Balance at end of period |
$ | 9,695 | $ | 6,017 | $ | 4,148 | ||||||
Changes in the credit quality adjustment on loans purchased were as follows for the year ended December 31, 2009:
| 2009 | ||||
| Balance at beginning of period |
$ | 4,044 | ||
| Amortization |
(756 | ) | ||
| Charge-offs |
||||
| Commercial |
(61 | ) | ||
| Consumer |
(259 | ) | ||
| Residential mortgages |
(236 | ) | ||
| Total Charge-offs |
(556 | ) | ||
| Recoveries |
||||
| Commercial |
86 | |||
| Consumer |
123 | |||
| Residential mortgages |
1 | |||
| Total Recoveries |
210 | |||
| Net charge-offs |
(346 | ) | ||
| Balance at end of period |
$ | 2,942 | ||
As a part of the Merger, an adjustment was made to reflect the elimination of the allowance for loan losses related to the Tower Bank loan portfolio, as required by purchase accounting standards. As a result, the acquired loan portfolio was evaluated based on risk characteristics and other credit and market criteria to determine a credit quality adjustment to the fair value of the loan acquired. The acquired loan balance was reduced by the aggregate amount of the credit quality adjustment in determining the fair value of the loans. The credit quality adjustment does not account for acquired loans deemed to be impaired accordance with Accounting Standard Codification 310-30-30, previously known as Statement of Position (SOP) 03-3, “Accounting for Certain Loans Acquired in a Transfer.” These impaired loans are accounted for in the credit adjustment on distressed loans, which represents the portion of the loan balance that has been deemed uncollectible based on the management’s expectations of future cash flows for each respective loan. Based on management’s evaluation of the acquired
79
Table of Contents
NOTES TO CONSOLIDATED FINANCIAL STATEMENTS—(Continued)
(amounts in thousands except for share and per share data)
loan portfolio, 39 loans were deemed impaired resulting in a credit adjustment on distressed loans of $4,709. As of December 31, 2009, there were a total of 20 loans remaining with a credit adjustment of distressed loans of $3,407.
The following table presents non-performing assets as of December 31, 2009 and 2008:
| December 31, 2009 | December 31, 2008 | |||||
| Non-accrual loans |
||||||
| Commercial |
$ | 3,408 | $ | 1,127 | ||
| Consumer |
320 | 236 | ||||
| Residential mortgages |
990 | 3 | ||||
| Total non-accrual loans |
4,718 | 1,366 | ||||
| Accruing loans greater than 90 days past due |
||||||
| Commercial |
634 | — | ||||
| Consumer |
48 | 104 | ||||
| Residential mortgages |
1,424 | — | ||||
| Total accruing loans greater than 90 days past due |
2,106 | 104 | ||||
| Non-performing loans |
6,824 | 1,470 | ||||
| Other real estate owned |
927 | — | ||||
| Non-performing assets |
$ | 7,751 | $ | 1,470 | ||
As of December 31, 2009, the Company had total impaired loans of $10,917. The impaired loan balance includes $6,199 of impaired loans acquired as part of the merger, which includes a remaining fair value adjustment of $3,407. Management performed an evaluation of expected future cash flows, including the anticipated cash flow from the sale of collateral, and compared that to the carrying amount of the impaired loans. Based on these evaluations, the Company has determined that a reserve of $451 is required against the impaired loans at December 31, 2009.
Note 6 – Premises and Equipment
| December 31, 2009 | December 31, 2008 | |||||||
| Land |
$ | 5,394 | $ | — | ||||
| Building |
13,684 | — | ||||||
| Leasehold improvements |
3,703 | 3,028 | ||||||
| Furniture, fixtures and equipment |
6,918 | 2,493 | ||||||
| Other |
3,435 | 496 | ||||||
| 33,134 | 6,017 | |||||||
| Accumulated depreciation |
(3,324 | ) | (1,471 | ) | ||||
| $ | 29,810 | $ | 4,546 | |||||
As of December 31, 2009, the Company leases 2 branch offices that qualify for capital leases and, as such, have a net carrying amount of $2,734, which is included in the balance of premise and equipment.
Depreciation expenses amounted to $1,751 during 2009, $761 during 2008 and $507 during 2007.
80
Table of Contents
NOTES TO CONSOLIDATED FINANCIAL STATEMENTS—(Continued)
(amounts in thousands except for share and per share data)
Note 7 – Other Intangibles
Information concerning total amortizable other intangible assets at December 31, 2009 is as follows:
| Gross Carrying Amount |
Accumulated Amortization | |||||
| Balance at December 31, 2008 |
$ | — | $ | — | ||
| 2009 Activity: |
||||||
| Core deposit intangibles |
3,899 | 532 | ||||
| Balance at December 31, 2009 |
$ | 3,899 | $ | 532 | ||
The other intangible asset amortization expense has been recorded as “Other operating expenses” within the Consolidated Statement of Operations. The Company did not recognize any amortization expense related to intangible assets during 2008.
The estimated amortization for the next five years and thereafter is as follows:
| 2010 |
$ | 656 | |
| 2011 |
585 | ||
| 2012 |
513 | ||
| 2013 |
444 | ||
| 2014 |
372 | ||
| Thereafter |
797 | ||
| $ | 3,367 | ||
Note 8 – Other Assets
The following is a detail of items that comprise other assets at December 31, 2009 and 2008:
| December 31, 2009 |
December 31, 2008 | |||||
| Other real estate owned |
$ | 927 | $ | — | ||
| Investment in subsidiary |
790 | 593 | ||||
| Income tax receivable |
760 | — | ||||
| Prepaid FDIC insurance assessment |
6,290 | — | ||||
| Other prepaid expenses |
908 | 368 | ||||
| Mortgage servicing rights |
637 | — | ||||
| Other |
520 | 317 | ||||
| Total |
$ | 10,832 | $ | 1,278 | ||
81
Table of Contents
NOTES TO CONSOLIDATED FINANCIAL STATEMENTS—(Continued)
(amounts in thousands except for share and per share data)
Note 9 – Deposits
The following is a summary of deposits at December 31, 2009 and 2008:
| December 31, 2009 |
December 31, 2008 | |||||
| Non-interest bearing transaction accounts |
$ | 119,116 | $ | 42,466 | ||
| Interest checking accounts |
110,356 | 19,060 | ||||
| Money market accounts |
477,292 | 120,625 | ||||
| Savings accounts |
87,117 | 49,310 | ||||
| Time deposits of $100,000 or greater |
130,938 | 207,935 | ||||
| Time deposits, other |
291,650 | 86,074 | ||||
| Total |
$ | 1,216,469 | $ | 525,470 | ||
Brokered deposits totaled $61,114 and $63,603 at December 31, 2009 and 2008, respectively. Brokered deposits, exclusive of in-market reciprocal brokered deposits, totaled $46,018 and $44,587 at December 31, 2009 and 2008, respectively.
At December 31, 2009, the scheduled maturities of time deposits are as follows:
| 2010 |
$ | 210,308 | |
| 2011 |
47,623 | ||
| 2012 |
62,245 | ||
| 2013 |
8,276 | ||
| 2014 |
94,058 | ||
| thereafter |
78 | ||
| $ | 422,588 | ||
Note 10 – Securities Sold Under Agreements to Repurchase
Securities sold under agreements to repurchase generally mature within one to four days from the transition date. Securities sold under agreements to repurchase are reflected at the amount of cash received in connection with the transaction. The Company may be required to provide additional collateral based on the fair value of the underlying securities. The Company had securities sold under agreements to repurchase of $6,892 and $8,384 at December 31, 2009 and 2008, respectively. The blended rate on these borrowings was 0.52% and 1.70% at December 31, 2009 and 2008, respectively, and the borrowings mature in one-day periods. The borrowings are secured by U.S. Government securities and municipal bonds.
Note 11 – Borrowings
Federal Home Loan Bank
The Bank has a maximum borrowing capacity under an agreement with the Federal Home Loan Bank (“FHLB”) of approximately $482,024 and 72,093 at December 31, 2009 and 2008, respectively. The available amount of borrowing capacity for December 31, 2009 and 2008 was approximately $422,679 and $33,093, respectively. The total outstanding borrowings at December 31, 2009 equaled $59,346, of which $5,250 has a maturity of less than one year and is classified as short-term borrowing. The remaining borrowings of $54,096 have a maturity greater than one year and are, therefore, classified as long-term debt at December 31, 2009. The average interest
82
Table of Contents
NOTES TO CONSOLIDATED FINANCIAL STATEMENTS—(Continued)
(amounts in thousands except for share and per share data)
rate on FHLB borrowings at December 31, 2009 equaled 3.94%. At December 31, 2009, the unamortized fair value adjustment to FHLB borrowings assumed in the merger totaled $(94). The total outstanding borrowings at December 31, 2008 equaled $39,000, of which, $29,000 have a stated maturity greater than one year and are, therefore, classified as long-term debt at December 31, 2008. The remaining $10,000 in FHLB borrowings are classified as short-term borrowings at December 31, 2008 as they matured within one year.
The following table summarizes the scheduled maturities of Federal Home Loan Bank borrowings as of December 31, 2009:
| 2010 |
$ | 5,250 | |
| 2011 |
5,000 | ||
| 2012 |
5,000 | ||
| 2013 |
— | ||
| 2014 |
— | ||
| Thereafter |
44,096 | ||
| Total |
$ | 59,346 | |
Lines of Credit
The Company has lines of credit with other financial institutions with the following terms:
| Balance at |
Balance at December 31, 2008 |
Maximum Capacity |
Interest Rate |
Maturity | ||||||||
| $ | — | $ | 4,614 | $ | — | * | LIBOR plus 275bps | On Demand | ||||
| — | — | 1,900 | Prime minus 100bps; Floor of 4% |
On Demand | ||||||||
| — | — | 3,000 | Prime minus 50bps | On Demand | ||||||||
| $ | — | $ | 4,614 | $ | 4,900 | |||||||
* This line of credit was closed during the third quarter of 2009 by the lending financial institution upon full repayment of the outstanding balance.
Other Borrowings
On June 12, 2009, the Company issued, to private investors, $9,000 of subordinated notes bearing an annual interest rate of 9.00%. Each note may be redeemed at the Company’s discretion and contains a maturity date of July 1, 2014. Interest only payments are due on a quarterly basis with the unpaid principal balance due at maturity.
Federal funds are reported on a gross basis. Federal funds sold are stated as assets and federal funds purchased are stated as liabilities. Federal funds purchased are considered short-term borrowings and are subject to restrictions limiting the frequency and terms of advances. Generally, federal funds are purchased or sold for one day periods and bear interest based upon the daily federal funds rate. The Company did not have any federal funds purchased at December 31, 2009 or 2008.
83
Table of Contents
NOTES TO CONSOLIDATED FINANCIAL STATEMENTS—(Continued)
(amounts in thousands except for share and per share data)
Capital Lease Obligations
Included in short-term borrowings and long-term debt are two capital lease agreements, which relate to the Lebanon and York branches. The following is a schedule by years of future minimum lease payments under capital leases together with the present value of the net minimum lease payments as of December 31, 2009.
| 2010 |
$ | 276 | |
| 2011 |
279 | ||
| 2012 |
284 | ||
| 2013 |
301 | ||
| 2014 |
306 | ||
| Thereafter |
4,137 | ||
| Total minimum lease payment |
$ | 5,583 | |
| Less: Amount representing interest |
2,854 | ||
| Present value of net minimum lease payment |
$ | 2,729 | |
Note 12 – Related Party Transactions
The Company has had, and may be expected to have in the future, transactions in the ordinary course of business with executive officers and directors and their immediate families and affiliated companies (commonly referred to as related parties), on the same terms, including interest rates and collateral, as those prevailing at the time for comparable transactions with others. All loans to executive officers and directors or their related interests are submitted to the Bank’s Board of Directors for approval. The aggregate dollar amount of these loans was $51,946 at December 31, 2009 and $37,129 at December 31, 2008.
Deposits from related parties held at the Bank as of December 31, 2009 and 2008 amounted to $9,948 and $11,045, respectively.
In December 2007, the Bank entered into a lease agreement with a related party consisting of a branch and regional administrative office under a fifteen-year renewable lease. The lease was negotiated on an “arms-length basis” and an independent valuation was performed confirming that the terms in the lease are reflective of market terms. As of December 31, 2009, total cash payments to date made to the related party under this lease agreement totaled $396.
On June 12, 2009, the Company issued, to private investors, $9,000 of subordinated notes bearing an annual interest rate of 9.00%. The investors included a director of the Company who invested $500 in principal amount of the notes. This transaction has been reviewed and approved by the Audit Committee of the Company.
The Company has entered into employment or change of control agreements with several executive officers. The agreements include minimum annual salary commitments and/or change of control provisions. Upon termination, resignation or change in control of the Company, these individuals may receive monetary compensation as set forth in the agreements.
84
Table of Contents
NOTES TO CONSOLIDATED FINANCIAL STATEMENTS—(Continued)
(amounts in thousands except for share and per share data)
Note 13 – Income Taxes
The provision for income tax expense (benefit) for the year ended December 31, 2009 and 2008, and the period from June 1, 2007 to December 31, 2007 consisted of the following components:
| 2009 | 2008 | 2007 | |||||||||
| Federal |
|||||||||||
| Current |
$ | 1,390 | $ | 1,353 | $ | 782 | |||||
| Deferred |
417 | (1,040 | ) | (800 | ) | ||||||
| 1,807 | 313 | (18 | ) | ||||||||
| State |
|||||||||||
| Current |
22 | 20 | 12 | ||||||||
| Deferred |
— | — | — | ||||||||
| 22 | 20 | 12 | |||||||||
| Totals |
$ | 1,829 | $ | 333 | $ | (6 | ) | ||||
A reconciliation of the statutory income tax at a rate of 34% to the income tax expense (benefit) included in the statements of operations is as follows for the year ended December 31, 2009 and 2008, and the period from June 1, 2007 to December 31, 2007. There was no provision for income taxes for the period from January 1, 2007 to May 31, 2007 since the Company operated as an S corporation
| 2009 | 2008 | 2007 | |||||||
| Federal income tax at statutory rate |
34.0 | % | 34.0 | % | 34.0 | % | |||
| Incentive Stock Options |
0.5 | 1.7 | 2.0 | ||||||
| Bank Owned Life Insurance |
(4.9 | ) | (4.6 | ) | — | ||||
| State tax expense, net of federal benefit |
0.3 | 0.5 | 0.9 | ||||||
| Valuation allowance |
0.4 | (18.0 | ) | (39.9 | ) | ||||
| Tax exempt interest |
(1.1 | ) | — | — | |||||
| Merger expenses |
2.7 | — | — | ||||||
| Other |
1.1 | 0.2 | 1.3 | ||||||
| Effective income tax rate |
33.0 | % | 13.8 | % | (1.7 | )% | |||
85
Table of Contents
NOTES TO CONSOLIDATED FINANCIAL STATEMENTS—(Continued)
(amounts in thousands except for share and per share data)
The components of the net deferred tax asset at December 31, 2009 and 2008 are as follows:
| December 31, 2009 |
December 31, 2008 |
|||||||
| Deferred tax assets: |
||||||||
| Allowance for loan losses |
$ | 3,296 | $ | 2,046 | ||||
| Organization and start-up costs |
142 | 155 | ||||||
| Restricted stock plan |
— | 144 | ||||||
| Nonqualified stock options |
231 | 20 | ||||||
| Other than temporary impairments |
53 | — | ||||||
| Capital loss carryover |
3,166 | — | ||||||
| Deferred compensation |
806 | — | ||||||
| Nonaccrual interest |
212 | — | ||||||
| Straight-line rents |
145 | — | ||||||
| Unrealized loss on available for sale securities |
213 | — | ||||||
| Other |
431 | 143 | ||||||
| 8,695 | 2,508 | |||||||
| Valuation Allowance |
(3,644 | ) | — | |||||
| Total Deferred Tax Assets, Net of Valuation Allowance |
5,051 | 2,508 | ||||||
| Deferred tax liabilities: |
||||||||
| Premises and equipment |
(1,016 | ) | (121 | ) | ||||
| Deferred loan costs |
(404 | ) | (289 | ) | ||||
| Cash basis conversion |
(51 | ) | (87 | ) | ||||
| Prepaid expenses |
(283 | ) | (117 | ) | ||||
| Partnership income |
(42 | ) | (54 | ) | ||||
| Unrealized gain on available for sale securities |
— | (76 | ) | |||||
| Purchase accounting fair value adjustments |
(1,513 | ) | — | |||||
| Total Deferred Tax Liabilities |
(3,309 | ) | (744 | ) | ||||
| Net Deferred Tax Asset |
$ | 1,742 | $ | 1,764 | ||||
A tax expense of $23 and a tax benefit of $434 were recognized in the Statement of Operations in 2009 and 2008, respectively, related to changes in the valuation allowance.
The valuation allowance as of December 31, 2009 relates to capital loss carryforwards and other than temporary impairments for which it is more likely than not that the Company will not be able to realize the tax benefit of these items prior to legal expiration. The Company has capital loss carryovers of $9,310 which will expire in 2014. In assessing the realizability of deferred tax assets, management considers whether it is more likely than not that some portion or all of the deferred tax assets will not be realized. The ultimate realization of deferred tax assets is dependent upon the generation of future taxable income during periods in which those temporary differences become deductible. Management considers the scheduled reversal of deferred tax liabilities, projected future taxable income and tax planning strategies in making this assessment. Based on the level of historical taxable income and projections for future taxable income over the periods in which the deferred tax assets are deductible, management believes it is more likely than not that the Company will realize the benefits of these deferred tax assets, net of the valuation allowance at December 31, 2009.
As of December 31, 2009, the Company had no material unrecognized tax benefits or accrued interest and penalties. It is the Company’s policy to account for interest and penalties accrued relative to unrecognized tax
86
Table of Contents
NOTES TO CONSOLIDATED FINANCIAL STATEMENTS—(Continued)
(amounts in thousands except for share and per share data)
benefits as a component of income tax expense. Federal and state tax returns for the years 2006 through 2009 were open for examination as of December 31, 2009.
Note 14 – Financial Instruments with Off-Balance Sheet Risk
The Company is a party to financial instruments with off-balance sheet risk in the normal course of business to meet the financing needs of its customers. These financial instruments include commitments to extend credit and letters of credit. Such commitments involve, to varying degrees, elements of credit and interest rate risk in excess of the amount recognized in the consolidated balance sheet.
The Company’s exposure to credit loss in the event of nonperformance by the other party to the financial instrument for commitments to extend credit is represented by the contractual amount of those instruments. The Company uses the same credit policies in making commitments and conditional obligations as it does for on-balance sheet instruments.
The outstanding financial instruments represent credit risk in the following amounts at December 31, 2009 and 2008:
| December 31, 2009 |
December 31, 2008 | |||||
| Commitments to grant loans |
$ | 12,350 | $ | 13,274 | ||
| Unfunded commitments under lines of credit |
267,683 | 163,288 | ||||
| Letters of credit |
25,524 | 17,577 | ||||
Commitments to extend credit are agreements to lend to a customer as long as there is no violation of any condition established in the contract. Since many of the commitments are expected to expire without being drawn upon, the total commitment amounts do not necessarily represent future cash requirements. Commitments generally have fixed expiration dates or other termination clauses and may require payment of a fee. The Company evaluates each customer’s credit worthiness on a case-by-case basis. The amount of collateral obtained, if deemed necessary by the Company upon extension of credit, is based on management’s credit evaluation. Collateral held varies but may include personal or commercial real estate, accounts receivable, inventory and equipment.
Outstanding letters of credit are conditional commitments issued by the Bank to guarantee the performance of a customer to a third party. The credit risk involved in issuing letters of credit is essentially the same as that involved in extending loan facilities to customers. The Bank typically requires collateral supporting these letters of credit. Management believes that the proceeds obtained through a liquidation of such collateral would be sufficient to cover the maximum potential amount of future payments required under the corresponding guarantees. The amount of the liability as of December 31, 2009 and 2008 for guarantees under standby letters of credit issued is not material to the consolidated financial statements.
Note 15 – Employee Benefit Plans
The Company has purchased bank owned life insurance (“BOLI”) policies on certain employees as a means to generate tax-free income which is used to offset a portion of current and future employee benefit costs. Additionally, the Company acquired BOLI policies as a result of the Merger. The BOLI profits from the appreciation of the cash surrender value of the pool of insurance and is recorded as part of “Non-interest Income.” For the years ended 2009 and 2008, the Company recorded income of $1,034 and $305, respectively, related to the appreciation in the cash surrender value of the insurance policies. The service costs associated with
87
Table of Contents
NOTES TO CONSOLIDATED FINANCIAL STATEMENTS—(Continued)
(amounts in thousands except for share and per share data)
post retirement benefits of the insurance policies vested at the time of the Merger with the ongoing costs relating to interest expense incurred. The Company recorded expenses related to the cost of maintaining post retirement insurance of $368 and $29 for the years ended December 31, 2009 and 2008, respectively. As of December 31, 2009 and 2008, the estimated present value of the cost of post retirement insurance totaled $1,623 and $9, respectively.
As part of the Merger, the Company acquired the Supplemental Executive Retirement Plan implemented during 2002 by Tower, which calls for a defined annual benefit to be paid to the former Chief Executive Officer of Tower. In connection with the Merger all service related vesting was accelerated with the ongoing costs relating to interest expense. During 2009, the Company recorded $18 of expense resulting in a post retirement benefit liability of $452 at December 31, 2009.
As part of the Merger, the Company acquired a Supplemental Insurance Plan which provides certain current and former executives and directors of the Company with a post retirement benefit equal to annual deferred compensation amounts including annual interest earned on these amounts compounded monthly at a 10% annual interest rate. The Company holds life insurance contracts on the participating individuals as a means to offset the cost of the post retirement benefit. During the year ended December 31, 2009, the Company recorded $51 in expense related to the cost of the post retirement benefit, which had a balance of $674 at December 31, 2009.
Note 16 – Stock-Based Compensation
At December 31, 2009, the Company had four equity compensation plans, the 2006 Restricted Stock Plan (the “2006 Plan”), the 2007 Stock Incentive Plan (the “2007 Plan”), the 1995 Non-Qualified Stock Option Plan (the “1995 Plan”) and the Stock Option Plan for Outside Directors (the “Director Plan”).
During 2006, the shareholders of Graystone approved the 2006 Restricted Stock Plan (the “2006 Plan”), as amended, that provides for the issuance of up to 375,000 shares of restricted stock awards subject to a three year vesting period to key employees and directors. The recipient shall receive all dividends or other distributions and shall have the right to vote with respect to issued but unvested shares. On March 31, 2009, as a result of the Merger, the Company has adopted the provisions of this plan. As of March 31, 2009, the Company had issued all of the available awards under the plan and all of the awards are completely vested as a result of the vesting acceleration in association with the Merger. The Company recognized $295, $333, and $1,021 of compensation expense during the year ending December 31, 2009, 2008 and 2007, respectively, related to the vesting of the restricted stock awards.
In May 2007, the shareholders of the Graystone approved the 2007 Stock Incentive Plan (the “2007 Plan”). Under the Plan, Graystone may grant incentive stock options, nonqualified stock options, stock appreciation rights, restricted stock, and deferred stock for up to 600,000 shares (shares reflect the 3-for-2 stock split paid September 30, 2007) of Graystone’s common stock to key employees and directors. On March 31, 2009, as a result of the Merger, the Company has adopted the provisions of this plan. Subsequent to the Merger and as a result of the conversion factor, the total options authorized to be issued under the 2007 Plan equaled 252,000. At December 31, 2009, the Company had 77,705 options available to grant.
88
Table of Contents
NOTES TO CONSOLIDATED FINANCIAL STATEMENTS—(Continued)
(amounts in thousands except for share and per share data)
The following table summarizes the outstanding stock options under the Company’s 2007 Plan at December 31, 2009 and 2008:
| Date of Issuance |
Options Issued |
Exercise Price |
Expiration Date |
Options Vested | Unearned Compensation (in 000’s) | ||||||||||||
| December 31, 2009 |
December 31, 2008 |
December 31, 2009 |
December 31, 2008 | ||||||||||||||
| June 26, 2007 |
26,145 | $ | 22.22 | June 26, 2017 | 26,145 | 8,715 | $ | — | $ | 42 | |||||||
| January 22, 2008 |
1,050 | $ | 30.96 | January 22, 2018 |
1,050 | 350 | — | 3 | |||||||||
| July 17, 2008 |
56,700 | $ | 30.96 | July 17, 2018 | 56,700 | — | — | 416 | |||||||||
| September 22, 2009 |
52,400 | $ | 26.77 | September 22, 2019 |
— | — | 318 | — | |||||||||
| November 24, 2009 |
38,000 | $ | 19.80 | November 24, 2019 |
— | — | 182 | — | |||||||||
| 174,295 | 83,895 | 9,065 | $ | 500 | $ | 461 | |||||||||||
The stock options normally vest over a three to five year vesting period and are expensed over the vesting period. As a result of the Merger, all of the outstanding options at March 30, 2009 became fully vested and exercisable. No options issued under this plan have been exercised during 2009. The aggregate intrinsic value of outstanding unvested stock options at December 31, 2009 and 2008 was $116 and $0, respectively. Options granted resulted in compensation expense of $22, $177 and $51 during 2009, 2008 and 2007, respectively. As of December 31, 2009 and in conjunction with the vesting acceleration due to the Merger, a total of 83,895 options have vested with an intrinsic value of $16. These vested options can be exercised at an average price of $28.24 and have an average remaining life of approximately 8.2 years. The fair values of the options awarded under the Plan are estimated on the date of grant using the Black-Scholes valuation methodology.
Upon the closing of the Merger, all of the issued and outstanding stock options originally issued by Graystone converted to options exercisable for Tower common stock. Additionally, all options became fully vested at the time of conversion. As a result and in accordance with U.S. GAAP, the Company revalued the converted options as of the conversion date. The re-valuation of the converted options did not result in any incremental costs to the Company. The table below shows the assumptions utilized by Management to value all stock options:
| Date of Issuance |
Dividend Yield |
Expected Volatility |
Risk Free Interest Rate |
Estimated Forfeitures |
Expected Life |
Issue-Date Fair Value | ||||||||||||
| June 26, 2007 |
4.49 | % | 32.17 | % | 2.31 | % | 0.00 | % | 6 years | $ | 5.75 | |||||||
| January 22, 2008 |
4.49 | % | 32.17 | % | 2.31 | % | 0.00 | % | 6 years | $ | 3.70 | |||||||
| July 17, 2008 |
4.49 | % | 32.17 | % | 2.31 | % | 1% – 3 | % | 6.5 years | $ | 3.80 | |||||||
| September 22, 2009 |
4.00 | % | 31.84 | % | 3.50 | % | (1 | ) | (2 | ) | $ | 6.63 | ||||||
| November 24, 2009 |
4.00 | % | 32.63 | % | 3.39 | % | 2 | % | 9 years | $ | 5.00 | |||||||
(1) Estimated forfeitures for stock options issued to executives are 2.00% while the estimated forfeiture for stock options issued to employees is 5.00%.
89
Table of Contents
NOTES TO CONSOLIDATED FINANCIAL STATEMENTS—(Continued)
(amounts in thousands except for share and per share data)
(2) Expected life for stock options issued to executives is 9 years while estimated expected life for stock options issued to employees is 7 years.
The dividend yield assumption is based on dividend history and the expectation of future dividend yields. The expected volatility is based on historical volatility using the Company’s own stock price. The risk-free rate is the U.S. Treasury zero-coupon rate commensurate with the expected life of the options on the date of the grant.
At December 31, 2009, there were 5,700 options outstanding under the 1995 Plan and the Company recognized $2 in compensation expense related to the 1995 Plan during 2009. There are a total of 27,719 options available to be issued under this plan at December 31, 2009.
The following table summarizes the outstanding non-qualified stock options under the Company’s 1995 Plan at December 31, 2009 and 2008:
| Date of Issuance |
Options Issued |
Exercise Price |
Expiration Date |
Options Vested | Unearned Compensation (in 000’s) | ||||||||||||
| December 31, 2009 |
December 31, 2008 |
December 31, 2009 |
December 31, 2008 | ||||||||||||||
| September 22, 2009 |
5,700 | $ | 26.77 | September 22, 2019 |
— | — | $ | 34 | — | ||||||||
| 5,700 | — | — | $ | 34 | $ | — | |||||||||||
The assumptions utilized by management to calculate the issue date fair value of $6.63 are the same as the assumptions used for shares issued under the 2007 Plan.
At December 31, 2009, there were a total of 32,908 options outstanding under the Director Plan. The options outstanding are all fully vested, have a weighted average exercise price of $35.12 per share, and have a weighted average life to maturity of 5.3 years. The Company recognized $0 in compensation expense related to the Director Plan during 2009. There are a total of 50,170 options available to be issued under this plan at December 31, 2009.
During the second quarter of 2009, the Company’s Board of Directors and shareholders approved an Employee Stock Purchase Plan (“Employee Plan”) to provide our employees with the opportunity to purchase shares of Company common stock directly from the Company. The purchase price for shares purchased under the Employee Plan is 95% of the fair market value of the Company’s common stock on the purchase date. During 2009, approximately $65 thousand in capital has been raised under the Employee Plan. The structure of the Employee Plan meets all of the criteria to be considered a non-compensatory employee stock purchase plan and as a result, the Company recognized no expense related to the shares purchased at a discount through the Employee Plan.
Note 17 – Fair Value Measurements
Fair value is the price that would be received to sell an asset or paid to transfer a liability (an exit price) in an orderly transaction between market participants on the measurement date. The Company determines the fair value of its financial instruments based on the fair value hierarchy. The Company maximizes the use of observable inputs and minimizes the use of unobservable inputs when measuring fair value. Observable inputs are inputs that market participants would use in pricing the asset or liability developed based on market data obtained from sources independent of the Company. Unobservable inputs are inputs that reflect the Company’s
90
Table of Contents
NOTES TO CONSOLIDATED FINANCIAL STATEMENTS—(Continued)
(amounts in thousands except for share and per share data)
assumptions that the market participants would use in pricing the asset or liability based on the best information available in the circumstances. Three levels of inputs are used to measure fair value. A financial instrument’s level within the fair value hierarchy is based on the lowest level of input significant to the fair value measurement.
| Level 1: | Unadjusted quoted prices in active markets that are accessible at the measurement date for identical, unrestricted assets or liabilities. | |
| Level 2: | Quoted prices in markets that are not active, or inputs that are observable either directly or indirectly, for substantially the full term of the asset or liability. | |
| Level 3: | Prices or valuation techniques that require inputs that are both significant to the fair value measurement and unobservable (i.e., supported with little or no market activity). | |
An asset’s or liability’s level within the fair value hierarchy is based on the lowest level of input that is significant to the fair value measurement.
For financial assets measured at fair value on a recurring basis, the fair value measurements by level within the fair value hierarchy used at December 31, 2009 are as follows:
| December 31, 2009 |
Quoted Prices (Level 1) |
Significant Other Observable Inputs (Level 2) |
Significant Unobservable Inputs (Level 3) | |||||||||
| Securities available for sale |
$ | 189,853 | $ | 300 | $ | 189,504 | $ | 49 | ||||
| Commercial mortgage servicing rights |
473 | — | 473 | — | ||||||||
| Total |
$ | 190,326 | $ | 300 | $ | 189,977 | $ | 49 | ||||
Securities available for sale (carried at fair value)
As quoted market prices for the investments in securities available for sale held at the Bank, such as government agency bonds, corporate bonds, municipal bonds, etc, are not readily available, a matrix pricing model is used to value these investments. The matrix pricing model takes into consideration yields/prices of securities with similar characteristics, including credit quality, industry, and maturity to determine a fair value measure.
For equity securities held by the Company, management has determined which securities are traded in active markets versus inactive markets. For those securities traded in active markets, management has recorded the securities at quoted market prices. In cases where the securities are deemed to trade in inactive markets, management has adjusted quoted market prices for factors such as indicative bids received from brokers.
The following table presents reconciliations of the Company’s assets measured at fair value on a recurring basis using unobservable inputs (Level 3) for the year ended December 31, 2009:
| Equity Securities | ||||
| Balance, December 31, 2008 |
$ | — | ||
| Purchased through the Merger |
230 | |||
| Transfers In from Level 2 |
44 | |||
| Transfers Out to Level 2 |
(3 | ) | ||
| Sale of Securities in Level 3 |
(177 | ) | ||
| Other-than-temporary Impairment Adjustment |
(45 | ) | ||
| Balance, December 31, 2009 |
$ | 49 | ||
91
Table of Contents
NOTES TO CONSOLIDATED FINANCIAL STATEMENTS—(Continued)
(amounts in thousands except for share and per share data)
For financial assets and liabilities measured at fair value on a nonrecurring basis, the fair value measurements by level within the fair value hierarchy used at December 31, 2009 are as follows:
| December 31, 2009 |
Quoted Prices (Level 1) |
Significant Other Observable Inputs (Level 2) |
Significant Unobservable Inputs (Level 3) | |||||||||
| Loans held for sale |
$ | 8,034 | $ | — | $ | — | $ | 8,034 | ||||
| Impaired loans |
10,917 | — | — | 10,917 | ||||||||
| Loans purchased (1) |
418,747 | — | — | 418,747 | ||||||||
| Core deposit intangible asset (1) |
3,899 | — | — | 3,899 | ||||||||
| Premises and equipment (1) |
22,644 | — | — | 22,644 | ||||||||
| Total assets |
$ | 464,241 | $ | — | $ | — | $ | 464,241 | ||||
| Time deposits (1) |
$ | 160,806 | $ | — | $ | 160,806 | $ | — | ||||
| Borrowings (1) |
69,601 | — | 69,601 | — | ||||||||
| Total Liabilities |
$ | 230,407 | $ | — | $ | 230,407 | $ | — | ||||
(1) - Assets and liabilities are presented at fair value as of the date of the Merger.
Loans held for sale
Loan held for sale include residential mortgage loans which are measured at the lower of aggregate cost or fair value. The fair value is measured as the price that secondary market investors were offering for loans with similar characteristics.
Impaired loans
Impaired loans included in the preceding table are those for which the Company has measured impairment generally based on the fair value of the loan’s collateral. Fair value is generally determined based upon independent third party appraisals of the properties. The fair value consists of loan balances less valuation allowances. The Company has 57 impaired loans valued at $10,917 at December 31, 2009. During 2009, the Company charged off $2,741 of loans.
Loans purchased
In conjunction with the Merger, the loans purchased were recorded at their acquisition date fair value. In order to record the loans at fair value, management made three different types of fair value adjustments. A market rate adjustment was made to adjust for the movement in market interest rates, irrespective of credit adjustments, compared to the stated rates of the acquired loans. A credit adjustment was made on pools of homogeneous loans representing the changes in credit quality of the underlying borrowers from the loan inception to the acquisition date. The credit adjustment on distressed loans represents the portion of the loan balance that has been deemed uncollectible based on the management’s expectations of future cash flows for each respective loan.
92
Table of Contents
NOTES TO CONSOLIDATED FINANCIAL STATEMENTS—(Continued)
(amounts in thousands except for share and per share data)
Core deposit intangible assets
The fair value assigned to the core deposit intangible asset represents the future economic benefit of the potential cost savings from acquiring core deposits in the Merger compared to the cost of obtaining alternative funding such as brokered deposits from market sources. Management utilized an income valuation approach to present value the estimated future cash savings in order to determine the fair value of the intangible asset.
Premises and equipment
Premises and equipment acquired through the Merger has been assigned an acquisition date fair value through the use of independent appraisals and internal discounted cash flow models. Both approaches utilized an income based valuation approach to determine the fair value for the premises and equipment based on the highest and best use concept.
Time deposits
Time deposits acquired through the Merger have been recorded at their acquisition date fair value. In order to derive the fair value, management adjusted the amortized cost basis of the deposits to reflect the current interest rates paid on time deposits at the time of acquisition. The fair value adjustment reflects the movement in interest rates from inception of the deposit to the acquisition date.
Borrowings
Borrowings assumed through the Merger have been recorded at their acquisition date fair value. The fair value adjustment to the carrying value of the borrowings represents the movement in interest rates from the inception of the individual borrowings to the acquisition date.
The following information should not be interpreted as an estimate of the fair value of the entire Company since a fair value calculation is only provided for a limited portion of the Company’s assets and liabilities. Due to a wide range of valuation techniques and the degree of subjectivity used in making the estimates, comparisons between the Company’s disclosures and those of other companies may not be meaningful.
93
Table of Contents
NOTES TO CONSOLIDATED FINANCIAL STATEMENTS—(Continued)
(amounts in thousands except for share and per share data)
The estimated fair values of the Company’s financial instruments were as follows as of December 31, 2009 and 2008:
| December 31, 2009 | December 31, 2008 | |||||||||||
| Carrying Amount |
Fair Value | Carrying Amount |
Fair Value | |||||||||
| Financial assets: |
||||||||||||
| Cash, due from banks, and federal funds sold |
$ | 50,600 | $ | 50,600 | $ | 32,022 | $ | 32,022 | ||||
| Securities available for sale |
189,853 | 189,853 | 19,904 | 19,904 | ||||||||
| Restricted investment in bank stock |
6,254 | 6,254 | 2,068 | 2,068 | ||||||||
| Loans held for sale |
8,034 | 8,034 | 3,324 | 3,324 | ||||||||
| Loans |
1,128,576 | 1,151,368 | 561,705 | 551,987 | ||||||||
| Accrued interest receivable |
4,974 | 4,974 | 2,402 | 2,402 | ||||||||
| Financial liabilities: |
||||||||||||
| Deposits |
1,216,469 | 1,191,126 | 525,470 | 527,571 | ||||||||
| Securities sold under agreements to repurchase |
6,892 | 6,892 | 8,384 | 8,384 | ||||||||
| Short-term borrowings |
5,292 | 5,292 | 14,614 | 14,614 | ||||||||
| Long-term debt |
65,689 | 69,184 | 29,000 | 29,013 | ||||||||
| Accrued interest payable |
1,090 | 1,090 | 888 | 888 | ||||||||
| Nominal Amount |
Fair Value | Nominal Amount |
Fair Value | |||||||||
| Off-balance sheet financial instruments: |
||||||||||||
| Commitments to grant loans |
12,350 | — | 13,274 | — | ||||||||
| Unfunded commitments under lines of credit |
267,683 | — | 163,288 | — | ||||||||
| Letters of credit |
25,524 | — | 17,577 | — | ||||||||
The following methods and assumptions were used to estimate the fair values of the Company’s financial instruments at December 31, 2009 and 2008.
Cash and cash equivalents (carried at cost)
The carrying amounts reported in the balance sheet for cash and short-term instruments approximate those assets’ fair values.
Restricted investment in bank stock (carried at cost)
The carrying amount of restricted investment in bank stock approximates fair value, and considers the limited marketability of such securities.
Loans held for sale (carried at lower of cost or fair value)
The carrying amounts of loans held for sale approximate their fair value.
Loans (carried at cost)
The fair values of loans are estimated using discounted cash flow analyses, using market rates at the balance sheet date that reflect the credit and interest rate-risk inherent in the loans. Projected future cash flows are calculated based upon contractual maturity or call dates, projected repayments and prepayments of principal. Generally, for variable rate loans that reprice frequently and with no significant change in credit
94
Table of Contents
NOTES TO CONSOLIDATED FINANCIAL STATEMENTS—(Continued)
(amounts in thousands except for share and per share data)
risk, fair values are based on carrying values. This method of estimating fair value does not incorporate the exit price concept of fair value but is a permitted methodology for purposes of this disclosure.
Accrued interest receivable and payable (carried at cost)
The carrying amount of accrued interest receivable and accrued interest payable approximates its fair value.
Deposits (carried at cost)
The fair values disclosed for demand deposits (e.g., interest and noninterest checking, passbook savings and money market accounts) are, by definition, equal to the amount payable on demand at the reporting date (i.e., their carrying amounts). Fair values for fixed-rate certificates of deposit are estimated using a discounted cash flow calculation that applies interest rates currently being offered in the market on certificates to a schedule of aggregated expected monthly maturities on time deposits.
Short-term borrowings (carried at cost)
The carrying amounts of short-term borrowings approximate their fair values.
Long-term debt (carried at cost)
Fair values of FHLB advances are estimated using discounted cash flow analysis, based on quoted prices for new FHLB advances with similar credit risk characteristics, terms and remaining maturity. These prices obtained from this active market represent a market value that is deemed to represent the transfer price if the liability were assumed by a third party.
Off-balance sheet financial instruments (disclosed at cost)
Fair values for the Bank’s off-balance sheet financial instruments (lending commitments and letters of credit) are based on fees currently charged in the market to enter into similar agreements, taking into account, the remaining terms of the agreements and the counterparties’ credit standing.
Note 18 – Commitments and Contingent Liabilities
Operating Leases
The Company is obligated under operating leases for most of its banking offices as well as its administrative office space. For the years ended December 31, 2009, 2008 and 2007, rental expense under operating leases was $1,858, $1,016 and $633, respectively, which is included in the occupancy and equipment expenses. The Company’s office leases generally include renewal options for various additional terms after the expiration of the initial term of each lease, which are not included in the future minimum lease payments below. At December 31, 2009, future minimum lease payments for the fixed, non-cancelable terms of operating leases are as follows:
| 2010 |
$ | 1,690 | |
| 2011 |
1,729 | ||
| 2012 |
1,720 | ||
| 2013 |
1,738 | ||
| 2014 |
1,578 | ||
| Thereafter |
15,788 | ||
| $ | 24,243 | ||
95
Table of Contents
NOTES TO CONSOLIDATED FINANCIAL STATEMENTS—(Continued)
(amounts in thousands except for share and per share data)
Contingent Liabilities
The Company, from time to time, may be involved in legal proceedings relating to the conduct of its banking business. Such legal proceedings are a normal part of the banking business and in management’s opinion, the consolidated financial condition and results of operations of the Company would not be materially affected by the outcome of such legal proceedings.
Note 19 – Regulatory Matters
Dividends paid by the Company are generally provided from the subsidiary bank’s dividends. The Federal Reserve Board, which regulates bank holding companies, establishes guidelines which indicate that cash dividends should be covered by current year earnings and the debt to equity ratio of the holding company must be below thirty percent. The Bank is subject to the dividend restrictions set forth by the Pennsylvania Banking Code. Dividends that the Bank could declare without approval of the Pennsylvania Department of Banking amounted to approximately $19,577 and $0 at December 31, 2009 and 2008, respectively.
The Company and the Bank is subject to various regulatory capital requirements administered by federal banking agencies. Failure to meet minimum capital requirements can initiate certain mandatory and possibly additional discretionary actions by regulators that, if undertaken, could have a direct material effect on the Bank’s financial statements. Under capital adequacy guidelines and the regulatory framework for prompt corrective action, the Bank must meet specific capital guidelines that involve quantitative measures of their assets, liabilities and certain off-balance sheet items as calculated under regulatory accounting practices. The capital amounts and classification are also subject to qualitative judgments by the regulators about components, risk weightings, and other factors.
Quantitative measures established by regulation to ensure capital adequacy require the Bank to maintain minimum amounts and ratios (set forth below) of total and Tier 1 capital (as defined in the regulations) to risk-weighted assets and of Tier 1 capital to average assets. Management believes, as of December 31, 2009 and 2008, that the Bank met all capital adequacy requirements to which it is subject. A comparison of the Company’s and the Bank’s capital ratios to regulatory minimums at December 31 is as follows:
| Actual | For Capital Adequacy Purposes |
To be Well Capitalized under Prompt Corrective Action Provisions |
||||||||||||||
| Amount | Ratio | Amount | Ratio | Amount | Ratio | |||||||||||
| As of December 31, 2009 |
||||||||||||||||
| Total capital (to risk-weighted assets): |
||||||||||||||||
| Tower Bancorp, Inc. |
$ | 165,860 | 14.5 | % | 91,305 | 8.0 | % | N/A | N/A | |||||||
| Graystone Tower Bank |
164,506 | 14.4 | 91,212 | 8.0 | 114,014 | 10.0 | % | |||||||||
| Tier 1 capital (to risk-weighted assets): |
||||||||||||||||
| Tower Bancorp, Inc. |
148,965 | 13.1 | 45,653 | 4.0 | N/A | N/A | ||||||||||
| Graystone Tower Bank |
154,811 | 13.6 | 45,606 | 4.0 | 68,409 | 6.0 | % | |||||||||
| Tier 1 capital (to total assets): |
||||||||||||||||
| Tower Bancorp, Inc. |
148,965 | 10.7 | 55,702 | 4.0 | N/A | N/A | ||||||||||
| Graystone Tower Bank |
154,811 | 11.1 | 55,613 | 4.0 | 69,502 | 5.0 | % | |||||||||
96
Table of Contents
NOTES TO CONSOLIDATED FINANCIAL STATEMENTS—(Continued)
(amounts in thousands except for share and per share data)
| Actual | For Capital Adequacy Purposes |
To be Well Capitalized under Prompt Corrective Action Provisions |
||||||||||||||
| Amount | Ratio | Amount | Ratio | Amount | Ratio | |||||||||||
| As of December 31, 2008 |
||||||||||||||||
| Total capital (to risk-weighted assets): |
||||||||||||||||
| Tower Bancorp, Inc. |
$ | 60,655 | 10.1 | % | 48,091 | 8.0 | % | N/A | N/A | |||||||
| Graystone Tower Bank |
65,040 | 10.8 | 48,091 | 8.0 | 60,113 | 10.0 | % | |||||||||
| Tier 1 capital (to risk-weighted assets): |
||||||||||||||||
| Tower Bancorp, Inc. |
54,638 | 9.1 | 24,045 | 4.0 | N/A | N/A | ||||||||||
| Graystone Tower Bank |
59,023 | 9.8 | 24,045 | 4.0 | 36,068 | 6.0 | % | |||||||||
| Tier 1 capital (to total assets): |
||||||||||||||||
| Tower Bancorp, Inc. |
54,638 | 8.5 | 25,653 | 4.0 | N/A | N/A | ||||||||||
| Graystone Tower Bank |
59,023 | 9.2 | 25,652 | 4.0 | 32,064 | 5.0 | % | |||||||||
Note 20 – Tower Bancorp, Inc. (Parent Company Only) Financial Information
Condensed Balance Sheet (Parent Only)
| December 31 | ||||||
| 2009 | 2008 | |||||
| ASSETS |
||||||
| Cash and due from banks |
$ | 637 | $ | 30 | ||
| Securities available for sale |
1,132 | |||||
| Investment in subsidiary |
169,715 | 59,170 | ||||
| Other assets |
1,660 | 199 | ||||
| Total Assets |
$ | 173,144 | $ | 59,399 | ||
| LIABILITIES |
||||||
| Borrowings |
$ | 9,000 | $ | 4,614 | ||
| Other Liabilities |
267 | — | ||||
| Total Liabilities |
9,267 | 4,614 | ||||
| Stockholders’ equity |
163,877 | 54,785 | ||||
| Total Liabilities and Stockholders’ Equity |
$ | 173,144 | $ | 59,399 | ||
97
Table of Contents
NOTES TO CONSOLIDATED FINANCIAL STATEMENTS—(Continued)
(amounts in thousands except for share and per share data)
Condensed Income Statement (Parent Only)
| Years Ended December 31 | ||||||||||
| 2009 | 2008 | 2007 | ||||||||
| Income: |
||||||||||
| Equity in undistributed earnings (loss) of subsidiary |
$ | 4,356 | $ | 2,204 | $ | 38 | ||||
| Gain on sale of securities |
88 | — | — | |||||||
| Expenses: |
||||||||||
| Interest expense |
683 | 208 | (455 | ) | ||||||
| Other noninterest expenses |
385 | 19 | (20 | ) | ||||||
| Income before taxes |
3,376 | 1,977 | (437 | ) | ||||||
| Income tax benefit |
333 | 105 | 91 | |||||||
| Net Income |
$ | 3,709 | $ | 2,082 | $ | (346 | ) | |||
Condensed Statement of Cash Flows (Parent Only)
| Years Ended December 31 | ||||||||||||
| 2009 | 2008 | 2007 | ||||||||||
| Cash Flows From Operating Activities: |
||||||||||||
| Net Income (Loss) |
$ | 3,709 | $ | 2,082 | $ | (346 | ) | |||||
| Adjustments to Reconcile Net Income (Loss) to Cash Used in Operating Activities: |
||||||||||||
| Equity in undistributed (earnings) loss of subsidiary |
(4,356 | ) | (2,204 | ) | (38 | ) | ||||||
| Net gain on sale of equity securities |
(88 | ) | — | — | ||||||||
| Other than temporary impairment losses |
(156 | ) | — | — | ||||||||
| Stock Option expense |
569 | — | — | |||||||||
| Restricted Stock expense |
295 | — | — | |||||||||
| Other, net |
899 | (211 | ) | 13 | ||||||||
| Cash used in operating activities |
872 | (333 | ) | (371 | ) | |||||||
| Cash Flows From Investing Activities: |
||||||||||||
| Investment in subsidiary |
(48,680 | ) | — | (35,004 | ) | |||||||
| Sale of equity investment |
10,338 | — | — | |||||||||
| Cash Received from merger |
214 | — | — | |||||||||
| Cash used in investing activities |
(38,128 | ) | — | (35,004 | ) | |||||||
| Cash Flows From Financing Activities: |
||||||||||||
| Proceeds from sale of common stock, net |
52,052 | — | 37,315 | |||||||||
| Net increase (decrease) in borrowings |
(9,364 | ) | 184 | (1,770 | ) | |||||||
| Dividends Paid |
(4,825 | ) | — | — | ||||||||
| Cash provided by financing activities |
37,863 | 184 | 35,545 | |||||||||
| Net Increase in Cash |
607 | (149 | ) | 170 | ||||||||
| Cash and Cash Equivalents at the Beginning of the Year |
30 | 179 | 9 | |||||||||
| Cash and Cash Equivalents at the End of the Year |
$ | 637 | $ | 30 | $ | 179 | ||||||
| Cash paid during the year for interest |
$ | 683 | $ | 208 | $ | 436 | ||||||
98
Table of Contents
NOTES TO CONSOLIDATED FINANCIAL STATEMENTS—(Continued)
(amounts in thousands except for share and per share data)
Note 21 – Subsequent Events
On February 5, 2010, the Company accepted subscriptions for and sold, at 100% of their principal amount, an aggregate of $12,000 of subordinated notes (the “Notes”), on a private placement basis, to accredited investors. The investors included a director of the Company and his spouse, who purchased an aggregate of $1,000 in principal amount of the Notes. This transaction has been reviewed and approved by the Audit Committee of the Company. The Notes bear interest, payable on the 15th of January, April, July and October of each year, at a fixed interest rate of 9.0% per year. The Notes have a maturity date of July 1, 2015. The Notes may be redeemed at the option of the Company, in whole or in part, at any time, without penalty or premium, subject to any required regulatory approvals.
The Notes are intended to qualify as Tier 2 capital for regulatory purposes, to the extent permitted. It is expected that in accordance with applicable regulatory treatment one-fifth of the original principal amount of the Notes will be excluded each year from Tier 2 capital during the last five years prior to maturity.
The Company expects to use the net proceeds from the sale of the Notes for general corporate purposes, including, without limitation, contribution as equity capital to the Company’s wholly-owned subsidiary, Graystone Tower Bank, to support the Bank’s continued growth.
99
Table of Contents
Management’s Report on Internal Control Over Financial Reporting
The management of Tower Bancorp, Inc. and its wholly-owned subsidiary (the “Company”) has the responsibility for establishing and maintaining an adequate internal control structure and procedures for financial reporting. The Company’s internal control system is designed to provide reasonable assurance regarding the reliability of financial reporting and the preparation of financial statements for external purposes in accordance with U.S. generally accepted accounting principles.
Because of its inherent limitations, internal control over financial reporting may not prevent or detect misstatements. Also, projections of any evaluation of effectiveness to future periods are subject to the risk that controls may become inadequate because of changes in conditions, or that the degree of compliance with the policies or procedures may deteriorate.
This annual report does not include a report of management’s assessment regarding the effectiveness of internal control over financial reporting or an attestation report of the Company’s registered public accounting firm due to the nature and timing of changes to the internal control structure as a result of the reverse merger with Graystone Financial Corp. As a result of the reverse merger with Graystone Financial Corp., the Company’s internal control structure was converted to the former control structure of Graystone Financial Corp. during the year. During June of 2009 the Company converted the information technology system of the former operations of The First National Bank of Greencastle, operating as the Tower Bank Division of Graystone Tower Bank, to that of the Graystone Bank Division and implemented a complete change in the control structure at the Tower Bank Division, implemented over the remainder of 2009. The Company engaged a service provider to complete an internal audit program under the direction of the Audit Committee of the Board of Directors; (the “Audit Committee”) however, because of the timing of the new internal control implementation, it was not practical for management to assess internal control over financial reporting in a manner that would prove useful to the readers of this annual report. The Company is continuing to execute its internal audit program under the direction of the Audit Committee of the Board of Directors and will be in a position to report on the effectiveness of internal control over financial reporting within the annual report for 2010. Management will assess the effectiveness of internal control over financial reporting using the Internal Control — Integrated Framework issued by the Committee of Sponsoring Organizations of the Treadway Commission (COSO) as of December 31, 2010.
As stated above, management and the Audit Committee engaged a third party service provider to complete an internal audit program. During the second quarter of 2009 the Company’s service provider completed a comprehensive risk assessment and a proposed internal audit testing schedule that was formally approved by the Audit Committee. The internal audit plan and schedule were designed to meet the safety and soundness standards of our banking regulators focusing mostly on process level operating, compliance, and reputational risks to Graystone Tower Bank. As such, the results of the internal audit testing completed throughout 2009 did not provide sufficient support for management to properly assess the effectiveness of internal controls over financial reporting in accordance with Section 404 of the Sarbanes-Oxley Act of 2002.
As of December 31, 2008, the Company had reported a material weakness related improper risk identification and monitoring of loans resulting in management’s ability to administer the loan portfolio and determine the adequacy of the allowance for loan losses. As a result of the merger with Graystone Financial Corp. and Graystone Bank, the internal controls surrounding the loan administration, loan documentation, and credit administration functions became the internal controls historically utilized by Graystone Financial Corp. and Graystone Bank. Historically, due to the fact that Graystone Financial Corp. was a privately held corporation, its internal controls were not subject to an annual audit or annual evaluation by management in accordance with Section 404 of the Sarbanes-Oxley Act of 2002. However, based on the results of historic bank regulatory examinations and the internal audit testing performed during 2009, nothing has come to the attention of the Company’s management that would indicate that there is a material weakness related in internal controls surrounding the loan administration, loan documentation, and credit administration functions at December 31, 2009.
| /S/ ANDREW S. SAMUEL |
| Andrew S. Samuel |
| President and Chief Executive Officer (Principal Executive Officer) |
| /S/ MARK S. MERRILL |
| Mark S. Merrill |
| Executive Vice President and Chief Financial Officer (Principal Financial Officer) |
100
Table of Contents
| Item 9. | Changes in and Disagreements with Accountants on Accounting and Financial Disclosure |
None.
| Item 9A. | Controls and Procedures |
Disclosure Controls and Procedures
The Company carried out an evaluation, under the supervision and with the participation of the Company’s management, including the Company’s Chief Executive Officer and Chief Financial Officer, of the effectiveness of its disclosure controls and procedures, as defined in Exchange Act Rules 13a-15(e) and 15d-15(e). Based upon the evaluation, the Company’s Chief Executive Officer and Chief Financial Officer concluded that as of December 31, 2009, the Company’s disclosure controls and procedures are effective. Disclosure controls and procedures are controls and procedures that are designed to ensure that information required to be disclosed in the Company’s reports filed or submitted under the Exchange Act is recorded, processed, summarized and reported within the time periods specified in the Securities and Exchange Commission’s rules and forms.
Internal Controls Over Financial Reporting
Management’s report on internal control over financial reporting is included in Item 8 of this Report on Form 10-K and incorporated herein by reference.
Changes in Internal Controls
For an explanation of changes in internal controls during 2009, please see “Management’s Report on Internal Control Over Financial Reporting” included in Item 8 of this Report on Form 10-K, and incorporated herein by reference.
| Item 9B. | Other Information |
The Company had no other events that should have been disclosed on Form 8-K that were not already disclosed on such form.
101
Table of Contents
PART III
| Item 10. | Directors, Executive Officers and Corporate Governance |
The Company has adopted a Code of Ethics Policy that applies to all directors and senior managers (including its Chief Executive Officer and Chief Financial Officer). The Company’s Code of Ethics Policy is available on Tower Bancorp, Inc. website at http://www.towerbancorp.com under the “Governance Documents” tab.
All other information required by Item 10 is incorporated by reference to the sections captioned “Election of Directors of Tower Bancorp, Inc.,” “Executive Officers,” “Section 16(a) Beneficial Ownership Reporting Compliance,” “Code of Ethics Policy,” “Consideration of Director Nominees,” and “Meetings and Committees of the Board of Directors” of Tower’s definitive proxy statement for the 2010 Annual Meeting of Shareholders to be filed pursuant to Regulation 14A.
| Item 11. | Executive Compensation |
The information required by Item 11 is incorporated by reference to the sections captioned “Executive Compensation,” “Compensation of Directors,” and “Compensation Committee Interlocks and Insider Participation” of Tower’s definitive proxy statement for the 2010 Annual Meeting of Shareholders to be filed pursuant to Regulation 14A.
| Item 12. | Security Ownership of Certain Beneficial Owners and Management and Related Stockholder Matters |
Information required by Item 12 is incorporated by reference to the sections captioned “Beneficial Ownership” of Tower’s definitive proxy statement for the 2010 Annual Meeting of Shareholders to be filed pursuant to Regulation 14A and the information appearing under the heading “Securities Authorized for Issuance under Equity Compensation Plans” within Item 5 of this Report.
| Item 13. | Certain Relationships and Related Transactions, and Director Independence |
The information required by Item 13 is incorporated by reference to the sections captioned “Related Person Transactions and Policies” and “Director Independence” of Tower’s definitive proxy statement for the 2009 Annual Meeting of Shareholders to be filed pursuant to Regulation 14A.
| Item 14. | Principal Accounting Fees and Services |
The information required by Item 14 is incorporated by reference to the section captioned “Audit Committee Report” of Tower’s definitive proxy statement for the 2010 Annual Meeting of Shareholders filed pursuant to Regulation 14A.
102
Table of Contents
PART IV
| Item 15. | Exhibits and Financial Statement Schedules |
| (a) | The following documents are filed as part of this report: |
| 1. | Financial Statements — The following consolidated financial statements of Tower Bancorp, Inc. and subsidiaries are incorporated herein by reference in response to Item 8 above: |
| (i) | Consolidated Balance Sheets—December 31, 2009 and 2008. |
| (ii) | Consolidated Statements of Operations—Years ended December 31, 2009, 2008 and 2007. |
| (iii) | Consolidated Statements of Shareholders’ Equity and Comprehensive Income (Loss)—Years ended December 31, 2009, 2008 and 2007. |
| (iv) | Consolidated Statements of Cash Flows—Years ended December 31, 2009, 2008 and 2007. |
| (v) | Notes to Consolidated Financial Statements |
| (vi) | Report of Independent Registered Public Accounting Firm |
| 2. | Financial Statement Schedules — All financial statement schedules for which provision is made in the applicable accounting regulations of the Securities and Exchange Commission are not required under the related instructions or are inapplicable and have therefore been omitted. |
| 3. | Exhibits — A list of the Exhibits required by Item 601 of Regulation S-K and filed as part of this report is provided in subsection (b) below: |
| (b) |
| Exhibit |
Description | |
| 2.1 | Agreement and Plan of Merger by and between First Chester County Corporation and Tower Bancorp, Inc., dated as of December 27, 2009 (Incorporated by reference to Exhibit 2.1 to Registrant’s Current Report on Form 8-K filed December 28, 2009). | |
| 2.2 | First Amendment to Agreement and Plan of Merger by and between Tower Bancorp, Inc. and First Chester County Corporation, dated March 4, 2010 (Incorporated by reference to Exhibit 10.1 to Registrant’s Current Report on Form 8-K filed March 9, 2010) | |
| 2.3 | Form of Bank Plan of Merger by and between Graystone Tower Bank and First National Bank of Chester County (Incorporated by reference to Exhibit F to the First Amendment to Agreement and Plan of Merger filed as Exhibit 10.1 of Registrant’s Current Report on Form 8-K filed March 9, 2010) | |
| 3.1 | Amended and Restated Articles of Incorporation (Incorporated by reference to Exhibit 3.1 to Registrant’s Current Report on Form 8-K filed on September 24, 2009) | |
| 3.2 | Bylaws of Tower Bancorp, Inc. (Incorporated by reference to Exhibit 3.1 to Registrant’s Current Report on Form 8-K filed on March 31, 2009) | |
| 4.1 | Form of Subordinated Note due July 1, 2014 (Incorporated by reference to Exhibit 4.1 to Registrant’s Current Report on Form 8-K filed on June 12, 2009) | |
| 4.2 | Form of Form of Subordinated Note Due July 1, 2015 (Incorporated by reference to Exhibit 4.1 to Registrant’s Current Report on Form 8-K filed on February 8, 2010) | |
| 10.1 | Tower Bancorp, Inc. Non-Qualified Stock Option Plan (Incorporated by reference to Exhibit 99.1 to Registrant’s Registration Statement on Form S-8 (File No. 333-40661))* | |
| 10.2 | Tower Bancorp, Inc.’s Stock Option Plan for Outside Directors (Incorporated by reference to Exhibit 99.2 to Registrant’s Registration Statement on Form S-8 (File No. 333-40661))* | |
103
Table of Contents
| 10.3 | Change of Control Agreement of Franklin T. Klink, III dated as of November 26, 2001 (Incorporated by reference to Exhibit 10.1 of Registrant’s Form 10-K for the year ended December 31, 2001)* | |
| 10.4 | Change of Control Agreement of John H. McDowell, Sr. dated as of December 23, 1998 (Incorporated by reference to Exhibit 10.2 of Registrant’s Form 10-K for the year ended December 31, 1998)* | |
| 10.5 | Supplemental Executive Retirement Agreement of Jeffrey B. Shank dated as of September 25, 2002 (Incorporated by reference to Exhibit 99.3 of Registrant’s Form 10-Q for the quarter ended September 30, 2002)* | |
| 10.6 | Form of Amendment and Restatement of the First National Bank of Greencastle Group Term Replacement Plan A (Incorporated by reference to Exhibit 10.8 of Registrant’s Registration Statement on Form S-4 (File No. 333-130485))* | |
| 10.7 | Form of Amendment and Restatement of the First National Bank of Greencastle Group Term Replacement Plan (Incorporated by reference to Exhibit 10.8 of Registrant’s Registration Statement on Form S-4 (File No. 333-130485))* | |
| 10.8 | Form of Amendment and Restatement of the First National Bank of Greencastle Executive Bonus Agreement (Incorporated by reference to Exhibit 10.8 of Registrant’s Registration Statement on Form S-4 (File No. 333-130485))* | |
| 10.9 | First National Bank of Greencastle Employees’ Stock Ownership Plan (Incorporated by reference to Exhibit 99.3 to Registrant’s Registration Statement on Form S-8 (File No. 333-40661))* | |
| 10.10 | Amendment Number Seven to First National Bank of Greencastle Employees Stock Ownership Plan and Trust, effective August 1, 2009 (Incorporated by reference to Exhibit 10.5 to Registrant’s Quarterly Report on Form 10-Q for the quarter ended September 30, 2009)* | |
| 10.11 | Graystone Financial Corp. 401(k)/Employee Stock Ownership Plan (Incorporated by reference to Exhibit 10.9 to Registrant’s Quarterly Report on Form 10-Q for the quarter ended March 31, 2009)* | |
| 10.12 | Employment Agreement and amendment with Andrew Samuel (Incorporated by reference to Exhibit 3.1 to Registrant’s Current Report on Form 8-K dated March 31, 2009, filed on March 31, 2009)* | |
| 10.13 | Employment Agreement and amendment with Jeffrey Renninger (Incorporated by reference to Exhibit 3.1 to Registrant’s Current Report on Form 8-K dated March 31, 2009, filed on March 31, 2009)* | |
| 10.14 | Employment Agreement with Jeffrey B. Shank (Incorporated by reference to Exhibit 3 to Annex A of Registrant’s Registration Statement on Form S-4 (No. 333-156535)))* | |
| 10.15 | Employment Agreement and amendment with Janak Amin (Incorporated by reference to Exhibit 10.4 of Registrant’s Quarterly Report on Form 10-Q for the quarter ended March 31, 2009)* | |
| 10.16 | Employment Agreement with Mark Merrill (Incorporated by reference to Exhibit 4 to Annex A of Registrant’s Registration Statement on Form S-4 (File No. 333-156535))* | |
| 10.17 | Employment Agreement with Carl Lundblad (Incorporated by reference to Exhibit 6 to Annex A of Registrant’s Registration Statement on Form S-4 (File No. 333-156535))* | |
| 10.18 | Employment Agreement with Jane Tompkins (Incorporated by reference to Exhibit 5 to Annex A of Registrant’s Registration Statement on Form S-4 (File No. 333-156535))* | |
| 10.19 | Graystone Financial Corp. 2007 Stock Incentive Plan (Incorporated by reference to Exhibit 10.3 to Registrant’s Current Report on Form 8-K dated March 31, 2009, filed on March 31, 2009)* | |
| 10.20 | Form of Non-Qualified Stock Option Agreement under the 1995 Non-Qualified Stock Option Plan (Incorporated by reference to Exhibit 10.1 to Registrant’s Current Report on Form 8-K filed on September 24, 2009)* | |
| 10.21 | Form of Nonqualified Stock Option Agreement under the 2007 Stock Incentive Plan (Incorporated by reference to Exhibit 10.2 to Registrant’s Current Report on Form 8-K filed on September 24, 2009)* | |
104
Table of Contents
| 10.22 | Tower Bancorp, Inc. Dividend Reinvestment and Stock Purchase Plan (Incorporated by reference to Exhibit 99.1 to Registrant’s Registration Statement on Form S-3 (File No. 333-159647)) | |
| 10.23 | Tower Bancorp, Inc. Employee Stock Purchase Plan (Incorporated by reference to Appendix A of Registrant’s definitive proxy statement filed on April 22, 2009)* | |
| 10.24 | Schedule of Tower Bancorp, Inc./Graystone Tower Bank 2009 Director Fees (Incorporated by reference to Exhibit 10.3 to Registrant’s Quarterly Report on Form 10-Q for the quarter ended June 30, 2009)* | |
| 10.25 | Tower Bancorp, Inc. 2009 Executive Incentive Plan (Incorporated by reference to Exhibit 10.4 to Registrant’s Quarterly Report on Form 10-Q for the quarter ended September 30, 2009)* | |
| 10.26 | Form of Loan Modification Agreement by and between First Chester County Corporation and Graystone Tower Bank (Incorporated by reference to Exhibit B to the Agreement and Plan of Merger filed as Exhibit 2.1 of Registrant’s Current Report on Form 8-K filed December 28, 2009) | |
| 10.27 | Loan Agreement, dated as of November 20, 2009, by and between First Chester County Corporation and Graystone Tower Bank (Incorporated by reference to Exhibit 10.1 of the Current Report on Form 8-K filed by First Chester County Corporation on November 25, 2009) | |
| 10.28 | Promissory Note, dated as of November 20, 2009, by First Chester County Corporation in favor of Graystone Tower Bank (Incorporated by reference to Exhibit 10.2 of the Current Report on Form 8-K filed by First Chester County Corporation on November 25, 2009) | |
| 10.29 | Stock Pledge Agreement, dated as of November 20, 2009, by and between First Chester County Corporation and Graystone Tower Bank (Incorporated by reference to Exhibit 10.3 of the Current Report on Form 8-K filed by First Chester County Corporation on November 25, 2009) | |
| 10.30 | Form of Loan Participation Agreement by and between First National Bank of Chester County and Graystone Tower Bank (Incorporated by reference to Exhibit C to the Agreement and Plan of Merger filed as Exhibit 2.1 of Registrant’s Current Report on Form 8-K filed December 28, 2009). | |
| 10.31 | Form of Loan Agreement by and between Tower Bancorp, Inc. and First Chester County Corporation (Incorporated by reference to Exhibit G to the First Amendment to Agreement and Plan of Merger filed as Exhibit 10.1 of Registrant’s Current Report on Form 8-K filed March 9, 2010) | |
| 21 | Subsidiaries of the Registrant | |
| 23.1 | Consent of KPMG LLP | |
| 23.2 | Consent of ParenteBeard, LLC | |
| 31.1 | Certification of President and Chief Executive Officer of Tower Bancorp, Inc. Pursuant to Securities and Exchange Commission Rule 13a-14(a) / 15d-14(a). | |
| 31.2 | Certification of Chief Financial Officer of Tower Bancorp, Inc. Pursuant to Securities and Exchange Commission Rule 13a-14(a) / 15d-14(a) | |
| 32.1 | Certification of President and Chief Executive Officer of Tower Bancorp, Inc. Pursuant to Section 906 of the Sarbanes-Oxley Act of 2002 (Furnished, not filed) | |
| 32.2 | Certification of Chief Financial Officer of Tower Bancorp, Inc. Pursuant to Section 906 of the Sarbanes-Oxley Act of 2002 (Furnished, not filed) | |
* Denotes compensatory plan or arrangement.
105
Table of Contents
Pursuant to the requirements of Section 13 or 15(d) of the Securities Exchange Act of 1934, the Registrant has duly caused this Report to be signed on its behalf by the undersigned, thereunto duly authorized.
| TOWER BANCORP, INC. | ||||||
| (Registrant) | ||||||
| Date: | March 16, 2010 |
/S/ ANDREW S. SAMUEL | ||||
| Andrew S. Samuel | ||||||
| President and Chief Executive Officer | ||||||
| (Principal Executive Officer) | ||||||
| Date: | March 16, 2010 |
/S/ MARK S. MERRILL | ||||
| Mark S. Merrill | ||||||
| Executive Vice President and Chief Financial Officer | ||||||
| (Principal Financial Officer) | ||||||
| Date: | March 16, 2010 |
/S/ KRISTOFER A. PAUL | ||||
| Kristofer A. Paul | ||||||
| Vice President and Chief Accounting Officer | ||||||
| (Principal Accounting Officer) | ||||||
Pursuant to the requirements of the Securities Exchange Act of 1934, this Report has been executed below by the following persons on behalf of the Registrant and in the capacities and on the dates indicated.
| Signature |
Title |
Date | ||
| /S/ ANDREW S. SAMUEL |
President, Chief Executive Officer, and Chairman of the Board of Directors |
March 16, 2010 | ||
| Andrew S. Samuel | ||||
| /S/ STEPHEN E. BECK |
Director |
March 16, 2010 | ||
| Stephen E. Beck | ||||
| /S/ PATRICIA A. CARBAUGH |
Director |
March 16, 2010 | ||
| Patricia A. Carbaugh | ||||
| /S/ JOHN M. DISANTO |
Director |
March 16, 2010 | ||
| John M. DiSanto | ||||
| /S/ MARCUS FAUST |
Director |
March 16, 2010 | ||
| Marcus Faust | ||||
| /S/ FREDERIC M. FREDERICK |
Director |
March 16, 2010 | ||
| Frederic M. Frederick | ||||
| /S/ MARK E. GAYMAN |
Director |
March 16, 2010 | ||
| Mark E. Gayman | ||||
|
|
Director |
March 16, 2010 | ||
| Harry D. Johnston | ||||
106
Table of Contents
| /S/ JEFFREY F. LEHMAN |
Director |
March 16, 2010 | ||
| Jeffrey F. Lehman | ||||
| /S/ KENNETH R. LEHMAN |
Director |
March 16, 2010 | ||
| Kenneth R. Lehman | ||||
| /S/ CHARLES C. PEARSON JR. |
Director |
March 16, 2010 | ||
| Charles C. Pearson Jr. | ||||
| /S/ MICHAEL A. PECK |
Director |
March 16, 2009 | ||
| Michael A. Peck | ||||
| /S/ ROBERT E. POOLE JR. |
Director |
March 16, 2010 | ||
| Robert E. Poole Jr. | ||||
| /S/ TERRY L. RANDALL |
Director |
March 16, 2010 | ||
| Terry L. Randall | ||||
| /S/ HASU P. SHAH |
Director |
March 16, 2010 | ||
| Hasu P. Shah | ||||
| /S/ JEFFREY B. SHANK |
Director |
March 16, 2010 | ||
| Jeffrey B. Shank | ||||
| /S/ KLARE S. SUNDERLAND |
Director |
March 16, 2010 | ||
| Klare S. Sunderland | ||||
107
Table of Contents
| Exhibits |
Exhibits Title | |
| 2.1 | Agreement and Plan of Merger by and between First Chester County Corporation and Tower Bancorp, Inc., dated as of December 27, 2009 (Incorporated by reference to Exhibit 2.1 to Registrant’s Current Report on Form 8-K filed December 28, 2009). | |
| 2.2 | First Amendment to Agreement and Plan of Merger by and between Tower Bancorp, Inc. and First Chester County Corporation, dated March 4, 2010 (Incorporated by reference to Exhibit 10.1 to Registrant’s Current Report on Form 8-K filed March 9, 2010) | |
| 2.3 | Form of Bank Plan of Merger by and between Graystone Tower Bank and First National Bank of Chester County (Incorporated by reference to Exhibit F to the First Amendment to Agreement and Plan of Merger filed as Exhibit 10.1 of Registrant’s Current Report on Form 8-K filed March 9, 2010) | |
| 3.1 | Amended and Restated Articles of Incorporation (Incorporated by reference to Exhibit 3.1 to Registrant’s Current Report on Form 8-K filed on September 24, 2009) | |
| 3.2 | Bylaws of Tower Bancorp, Inc. (Incorporated by reference to Exhibit 3.1 to Registrant’s Current Report on Form 8-K filed on March 31, 2009) | |
| 4.1 | Form of Subordinated Note due July 1, 2014 (Incorporated by reference to Exhibit 4.1 to Registrant’s Current Report on Form 8-K filed on June 12, 2009) | |
| 4.2 | Form of Form of Subordinated Note Due July 1, 2015 (Incorporated by reference to Exhibit 4.1 to Registrant’s Current Report on Form 8-K filed on February 8, 2010) | |
| 10.1 | Tower Bancorp, Inc. Non-Qualified Stock Option Plan (Incorporated by reference to Exhibit 99.1 to Registrant’s Registration Statement on Form S-8 (File No. 333-40661))* | |
| 10.2 | Tower Bancorp, Inc.’s Stock Option Plan for Outside Directors (Incorporated by reference to Exhibit 99.2 to Registrant’s Registration Statement on Form S-8 (File No. 333-40661))* | |
| 10.3 | Change of Control Agreement of Franklin T. Klink, III dated as of November 26, 2001 (Incorporated by reference to Exhibit 10.1 of Registrant’s Form 10-K for the year ended December 31, 2001)* | |
| 10.4 | Change of Control Agreement of John H. McDowell, Sr. dated as of December 23, 1998 (Incorporated by reference to Exhibit 10.2 of Registrant’s Form 10-K for the year ended December 31, 1998)* | |
| 10.5 | Supplemental Executive Retirement Agreement of Jeffrey B. Shank dated as of September 25, 2002 (Incorporated by reference to Exhibit 99.3 of Registrant’s Form 10-Q for the quarter ended September 30, 2002)* | |
| 10.6 | Form of Amendment and Restatement of the First National Bank of Greencastle Group Term Replacement Plan A (Incorporated by reference to Exhibit 10.8 of Registrant’s Registration Statement on Form S-4 (File No. 333-130485))* | |
| 10.7 | Form of Amendment and Restatement of the First National Bank of Greencastle Group Term Replacement Plan (Incorporated by reference to Exhibit 10.8 of Registrant’s Registration Statement on Form S-4 (File No. 333-130485))* | |
| 10.8 | Form of Amendment and Restatement of the First National Bank of Greencastle Executive Bonus Agreement (Incorporated by reference to Exhibit 10.8 of Registrant’s Registration Statement on Form S-4 (File No. 333-130485))* | |
| 10.9 | First National Bank of Greencastle Employees’ Stock Ownership Plan (Incorporated by reference to Exhibit 99.3 to Registrant’s Registration Statement on Form S-8 (File No. 333-40661))* | |
108
Table of Contents
| 10.10 | Amendment Number Seven to First National Bank of Greencastle Employees Stock Ownership Plan and Trust, effective August 1, 2009 (Incorporated by reference to Exhibit 10.5 to Registrant’s Quarterly Report on Form 10-Q for the quarter ended September 30, 2009)* | |
| 10.11 | Graystone Financial Corp. 401(k)/Employee Stock Ownership Plan (Incorporated by reference to Exhibit 10.9 to Registrant’s Quarterly Report on Form 10-Q for the quarter ended March 31, 2009)* | |
| 10.12 | Employment Agreement and amendment with Andrew Samuel (Incorporated by reference to Exhibit 3.1 to Registrant’s Current Report on Form 8-K dated March 31, 2009, filed on March 31, 2009)* | |
| 10.13 | Employment Agreement and amendment with Jeffrey Renninger (Incorporated by reference to Exhibit 3.1 to Registrant’s Current Report on Form 8-K dated March 31, 2009, filed on March 31, 2009)* | |
| 10.14 | Employment Agreement with Jeffrey B. Shank (Incorporated by reference to Exhibit 3 to Annex A of Registrant’s Registration Statement on Form S-4 (No. 333-156535)))* | |
| 10.15 | Employment Agreement and amendment with Janak Amin (Incorporated by reference to Exhibit 10.4 of Registrant’s Quarterly Report on Form 10-Q for the quarter ended March 31, 2009)* | |
| 10.16 | Employment Agreement with Mark Merrill (Incorporated by reference to Exhibit 4 to Annex A of Registrant’s Registration Statement on Form S-4 (File No. 333-156535))* | |
| 10.17 | Employment Agreement with Carl Lundblad (Incorporated by reference to Exhibit 6 to Annex A of Registrant’s Registration Statement on Form S-4 (File No. 333-156535))* | |
| 10.18 | Employment Agreement with Jane Tompkins (Incorporated by reference to Exhibit 5 to Annex A of Registrant’s Registration Statement on Form S-4 (File No. 333-156535))* | |
| 10.19 | Graystone Financial Corp. 2007 Stock Incentive Plan (Incorporated by reference to Exhibit 10.3 to Registrant’s Current Report on Form 8-K dated March 31, 2009, filed on March 31, 2009)* | |
| 10.20 | Form of Non-Qualified Stock Option Agreement under the 1995 Non-Qualified Stock Option Plan (Incorporated by reference to Exhibit 10.1 to Registrant’s Current Report on Form 8-K filed on September 24, 2009)* | |
| 10.21 | Form of Nonqualified Stock Option Agreement under the 2007 Stock Incentive Plan (Incorporated by reference to Exhibit 10.2 to Registrant’s Current Report on Form 8-K filed on September 24, 2009)* | |
| 10.22 | Tower Bancorp, Inc. Dividend Reinvestment and Stock Purchase Plan (Incorporated by reference to Exhibit 99.1 to Registrant’s Registration Statement on Form S-3 (File No. 333-159647)) | |
| 10.23 | Tower Bancorp, Inc. Employee Stock Purchase Plan (Incorporated by reference to Appendix A of Registrant’s definitive proxy statement filed on April 22, 2009)* | |
| 10.24 | Schedule of Tower Bancorp, Inc./Graystone Tower Bank 2009 Director Fees (Incorporated by reference to Exhibit 10.3 to Registrant’s Quarterly Report on Form 10-Q for the quarter ended June 30, 2009)* | |
| 10.25 | Tower Bancorp, Inc. 2009 Executive Incentive Plan (Incorporated by reference to Exhibit 10.4 to Registrant’s Quarterly Report on Form 10-Q for the quarter ended September 30, 2009)* | |
| 10.26 | Form of Loan Modification Agreement by and between First Chester County Corporation and Graystone Tower Bank (Incorporated by reference to Exhibit B to the Agreement and Plan of Merger filed as Exhibit 2.1 of Registrant’s Current Report on Form 8-K filed December 28, 2009) | |
| 10.27 | Loan Agreement, dated as of November 20, 2009, by and between First Chester County Corporation and Graystone Tower Bank (Incorporated by reference to Exhibit 10.1 of the Current Report on Form 8-K filed by First Chester County Corporation on November 25, 2009) | |
| 10.28 | Promissory Note, dated as of November 20, 2009, by First Chester County Corporation in favor of Graystone Tower Bank (Incorporated by reference to Exhibit 10.2 of the Current Report on Form 8-K filed by First Chester County Corporation on November 25, 2009) | |
109
Table of Contents
| 10.29 | Stock Pledge Agreement, dated as of November 20, 2009, by and between First Chester County Corporation and Graystone Tower Bank (Incorporated by reference to Exhibit 10.3 of the Current Report on Form 8-K filed by First Chester County Corporation on November 25, 2009) | |
| 10.30 | Form of Loan Participation Agreement by and between First National Bank of Chester County and Graystone Tower Bank (Incorporated by reference to Exhibit C to the Agreement and Plan of Merger filed as Exhibit 2.1 of Registrant’s Current Report on Form 8-K filed December 28, 2009) | |
| 10.31 | Form of Loan Agreement by and between Tower Bancorp, Inc. and First Chester County Corporation (Incorporated by reference to Exhibit G to the First Amendment to Agreement and Plan of Merger filed as Exhibit 10.1 of Registrant’s Current Report on Form 8-K filed March 9, 2010) | |
| 21 | Subsidiaries of the Registrant | |
| 23.1 | Consent of KPMG LLP | |
| 23.2 | Consent of ParenteBeard, LLC | |
| 31.1 | Certification of President and Chief Executive Officer of Tower Bancorp, Inc. Pursuant to Securities and Exchange Commission Rule 13a-14(a) / 15d-14(a). | |
| 31.2 | Certification of Chief Financial Officer of Tower Bancorp, Inc. Pursuant to Securities and Exchange Commission Rule 13a-14(a) / 15d-14(a) | |
| 32.1 | Certification of President and Chief Executive Officer of Tower Bancorp, Inc. Pursuant to Section 906 of the Sarbanes-Oxley Act of 2002 (Furnished, not filed) | |
| 32.2 | Certification of Chief Financial Officer of Tower Bancorp, Inc. Pursuant to Section 906 of the Sarbanes-Oxley Act of 2002 (Furnished, not filed) | |
* Denotes compensatory plan or arrangement.
110