Attached files
| file | filename |
|---|---|
| EX-32.2 - EX-32.2 - DAWSON GEOPHYSICAL CO | a09-35892_1ex32d2.htm |
| EX-31.2 - EX-31.2 - DAWSON GEOPHYSICAL CO | a09-35892_1ex31d2.htm |
| EX-32.1 - EX-32.1 - DAWSON GEOPHYSICAL CO | a09-35892_1ex32d1.htm |
| EX-31.1 - EX-31.1 - DAWSON GEOPHYSICAL CO | a09-35892_1ex31d1.htm |
UNITED STATES
SECURITIES AND EXCHANGE COMMISSION
Washington, D.C. 20549
FORM 10-K
|
x |
ANNUAL REPORT PURSUANT TO SECTION 13 OR 15(d) OF THE SECURITIES EXCHANGE ACT OF 1934 |
|
|
|
|
For the fiscal year ended December 31, 2009 |
|
|
|
|
|
o |
TRANSITION REPORT PURSUANT TO SECTION 13 OR 15(d) OF THE SECURITIES EXCHANGE ACT OF 1934 |
For the transition period from to .
Commission File Number 01-14908
TGC INDUSTRIES, INC.
(Exact name of registrant as specified in its charter)
|
Texas |
|
74-2095844 |
|
(State or other jurisdiction of incorporation or organization) |
|
(I.R.S. Employer Identification No.) |
|
|
|
|
|
101 East Park Blvd., Suite 955, Plano, Texas |
|
75074 |
|
(Address of principal executive offices) |
|
(Zip Code) |
Registrant’s telephone number, including area code: (972) 881-1099
Securities registered pursuant to Section 12(b) of the Act:
|
Common Stock, par value $.01 per share |
|
The NASDAQ Stock Market LLC |
|
(Title of Class) |
|
(Name of exchange on which registered) |
Securities registered pursuant to Section 12(g) of the Act: None
Indicate by check mark if the registrant is a well-known seasoned issuer, as defined in Rule 405 of the Securities Act.
Yes o No x
Indicate by check mark if the registrant is not required to file reports pursuant to Section 13 or Section 15(d) of the Act.
Yes o No x
Indicate by check mark whether the registrant (1) has filed all reports required to be filed by Section 13 or 15 (d) of the Securities Exchange Act of 1934 during the preceding 12 months (or for such shorter period that the registrant was required to file such reports), and (2) has been subject to such filing requirements for the past 90 days. Yes x No o
Indicate by check mark whether the registrant has submitted electronically and posted on its corporate Website, if any, every Interactive Data File required to be submitted and posted pursuant to Rule 405 of Regulation S-T (Section 232.405 of this chapter) during the preceding 12 months (or for such shorter period that the registrant was required to submit and post such files).
Yes o No o
Indicate by check mark if disclosure of delinquent filers pursuant to Item 405 of Regulation S-K (229.405) is not contained herein, and will not be contained, to the best of Registrant’s knowledge, in definitive proxy or information statements incorporated by reference in Part III of this Form 10-K or any amendment to this Form 10-K. x
Indicate by check mark whether the registrant is a large accelerated filer, an accelerated filer, a non-accelerated filer, or a smaller reporting company. See the definitions of “large accelerated filer,” “accelerated filer” and “smaller reporting company” in Rule 12b-2 of the Exchange Act.
|
Large accelerated filer o |
|
Accelerated filer x |
|
Non-accelerated filer o |
|
Smaller reporting company o |
Indicate by check mark whether the registrant is a shell company (as defined in Rule 12b-2 of the Exchange Act).
Yes o No x
The aggregate market value of the voting and non-voting common equity held by non-affiliates computed by reference to the price at which the common equity was last sold as of the last business day of the Registrant’s most recently completed second fiscal quarter was $64,577,846.
Number of shares of Common Stock outstanding as of February 26, 2010: 18,285,288
Documents incorporated by reference
Listed below are documents, parts of which are incorporated herein by reference, and the part of this report into which the document is incorporated:
Proxy statement for the 2010 annual meeting of shareholders — Part III
Part I
ITEM 1. BUSINESS.
General
TGC Industries, Inc. is a Texas corporation, and with its wholly-owned subsidiary, Eagle Canada, Inc., a Delaware corporation, (collectively “TGC” or the “Company”) are primarily engaged in the geophysical service business of conducting Three-D (“3-D”) surveys for clients in the oil and gas business. TGC’s principal business office is located at 101 E. Park Blvd., Suite 955, Plano, Texas 75074 (Telephone: 972-881-1099). TGC’s internet address is www.tgcseismic.com. TGC makes available free of charge on its website its annual reports on Form 10-K, quarterly reports on Form 10-Q, and current reports on Form 8-K as soon as reasonably practicable after filing or furnishing such information with the Securities and Exchange Commission.
History
In April of 1980, Supreme Industries, Inc. (“Supreme”), formerly ESI Industries, Inc., formed a wholly-owned subsidiary, Tidelands Geophysical Co., Inc. (“Tidelands”), that acquired certain equipment, instruments, and related supplies from a Houston-based corporation that was engaged in the business of conducting seismic, gravity, and magnetic surveys under contracts for oil and natural gas companies. On June 30, 1986, the Boards of Directors of Supreme and Tidelands approved a spin-off of substantially all of the shares of Tidelands owned by Supreme which were distributed as a stock dividend to Supreme’s security holders. In July of 1986, our name was changed from “Tidelands Geophysical Co., Inc.” to “TGC Industries, Inc.” (“TGC”). On October 19, 2009, we disclosed our entry into a Material Definitive Agreement regarding the acquisition of the stock of Eagle Canada, Inc. (“Eagle Canada”), a Delaware corporation. Eagle Canada was a wholly-owned subsidiary of Eagle Geophysical, Inc. and Eagle Geophysical Onshore, Inc. (the “Debtors”) which were debtors in a Chapter 11 bankruptcy proceeding in Houston, Texas. Eagle Canada is in the business of providing seismic data and surveying services to the Canadian energy industry and has its principal place of business located in Calgary, Alberta, Canada. By Order dated October 14, 2009, the Bankruptcy Court approved the sale of the Eagle Canada stock by the Debtors to TGC and authorized the Debtors to enter into a Stock Purchase Agreement with TGC. In accordance with the terms of the Stock Purchase Agreement, the sale transaction closed on October 16, 2009, with TGC acquiring the Eagle Canada stock for a total purchase price of approximately $10.3 million paid from existing cash.
We are a leading provider of seismic data acquisition services throughout the continental United States and Canada. As of December 31, 2009, we operated six seismic crews, four in the U.S. and two in Canada. These seismic crews supply seismic data primarily to companies engaged in the exploration and development of oil and natural gas on land and in land-to-water transition areas. Eagle Canada’s seismic acquisition services are also used by the potash mining industry in Canada, and Eagle has particular expertise through their heliportable capabilities. Our customers rely on seismic data to identify areas where subsurface conditions are favorable for the accumulation of existing hydrocarbons, to optimize the development and production of hydrocarbon reservoirs, to better delineate existing oil and natural gas fields, and to augment reservoir management techniques.
We acquire geophysical data using the latest in 3-D survey techniques. We introduce acoustic energy into the ground by using vibration equipment or dynamite detonation, depending on the surface terrain and subsurface requirements. The reflected energy, or echoes, is received through geophones, converted into a digital signal at a multi-channel recording unit, and then transmitted to a central recording vehicle. Subsurface requirements dictate the number of channels necessary to perform our services. With our state-of-the-art seismic equipment, including computer technology and multiple channels, we acquire, on a cost effective basis, immense volumes of seismic data that when processed and interpreted produce more precise images of the earth’s subsurface. Our customers then use our seismic data to generate 3-D geologic models that help reduce finding costs and improve recovery rates from existing wells.
The Industry
Technological advances in seismic equipment and computing allow the seismic industry to acquire and process, on a cost-effective basis, immense volumes of seismic data which produce precise images of the earth’s subsurface. The latest accepted method of seismic data acquisition, processing, and the subsequent interpretation of the processed data is the 3-D seismic method. Geophysicists use computer workstations to interpret 3-D data volumes, identify subsurface anomalies, and generate a geologic model of subsurface features.
3-D seismic data are used in the exploration and development of new reserves and enable oil and natural gas companies to better delineate existing fields and to augment their reservoir management techniques. Benefits of incorporating high resolution 3-D seismic surveys into exploration and development programs include reducing drilling risk, decreasing oil and natural gas finding costs, and increasing the efficiencies of reservoir location, delineation, and management. In order to meet the requirements necessary to fully realize the benefits of 3-D seismic data, there is an increasing demand for improved data quality with greater subsurface resolution.
Currently, the seismic data acquisition industry is made up of a number of companies divided into two groups. The first group is made up of four publicly-traded companies with long operating histories who field numerous crews and work in a number of different regions and terrain. This group includes us, Dawson Geophysical Company, Geokinetics, Inc., and CGG-Veritas. These companies field approximately 50% of the estimated 65 seismic crews currently operating in the continental U.S. and Canada. The second group is made up of smaller companies who generally run one or two seismic crews and often specialize in specific regions or types of operations.
We provide our seismic data acquisition services primarily to onshore oil and natural gas exploration and development companies for use in the onshore drilling and production of oil and natural gas in the continental U.S. and Canada. The main factors influencing demand for seismic data acquisition services in our industry are the levels of drilling activity by oil and natural gas companies and the sizes of such companies’ exploration and development budgets, which, in turn, depend largely on current and anticipated future crude oil and natural gas prices and depletion rates.
Equipment and Crews
In the fourth quarter of 2004, we acquired, and placed into service, our first new ARAM ARIES recording system. In July of 2005, we deployed our fourth seismic data acquisition crew along with our second new ARAM ARIES recording system. In November of 2005, we deployed our fifth seismic data acquisition crew along with our third new ARAM ARIES recording system. In December of 2005, we completed a loan transaction with a commercial lender for the purpose of providing funds for the purchase of our fourth new ARAM ARIES recording system. In January of 2006, we deployed a sixth crew to operate this fourth new ARAM ARIES recording system. In May of 2006, we deployed our seventh seismic data acquisition crew along with our fifth new ARAM ARIES recording system. In October of 2006, we deployed our eighth seismic data acquisition crew along with our sixth new ARAM ARIES recording system. In December of 2007, we completed a loan transaction with a commercial lender for the purpose of providing funds for the purchase of our seventh new ARAM ARIES recording system. In January of 2008, the Company entered into an agreement with a bank to provide financing for the purchase of new vibration vehicles. In February of 2008, the Company exercised its purchase option for seismic recording equipment it had been renting. In March of 2008, the Company entered into a loan agreement with a commercial lender to provide financing for the purchase of this rented equipment and to replace an existing loan the Company had with the lender. In July of 2008, the Company entered into a loan agreement with a bank to provide financing for the purchase of additional seismic recording equipment. In August of 2008, the Company entered into a loan agreement with a bank to provide financing for the purchase of new vibration vehicles. In September of 2008, the Company entered into a loan agreement with a commercial lender to provide financing for the purchase of a new seismic recording system and equipment. In December of 2008, we deployed our ninth seismic data acquisition crew along with our eighth new ARAM ARIES recording system. During the second quarter of 2009, demand weakened and seismic market activity declined significantly in North America. We responded to the weakening demand for seismic services by aggressively managing our costs, including our crew count, dropping TGC’s from a peak of nine crews in the first quarter of 2009 to four crews in the second half of the year in the U.S. During October of 2009, we purchased Eagle Canada, Inc. a provider of seismic data services to the Canadian energy industry. Subsequent to the acquisition in October of 2009, Eagle Canada operated two seismic crews. Eagle Canada utilizes the latest in ARAM ARIES recording equipment which is interchangeable with that of TGC.
Our crews utilize the new state-of-the-art ARAM ARIES recording systems. These systems employ cable telemetry technology enhanced by multiple baseline and redundant cable connections that provide seismic data acquisition services with increased reliability. During most of the year, one crew utilized the Opseis Eagle data gathering system. This system employs radio-frequency telemetry technology providing seismic data-gathering services to land-to-water transition areas, rivers, lakes, inaccessible terrain, deserts, and man-made barriers such as highways and cities. The Opseis system was retired in December of 2009.
We currently own equipment for 13 land-based seismic data acquisition crews and 69 vibration vehicles. Each crew consists of approximately 35 to 45 technicians with associated vehicles, geophones, a seismic recording system, energy sources, cables, and a variety of other equipment. Each crew has one central recording vehicle which captures seismic data. This data is recorded on a CD ROM or data tape which is delivered to a data processing center selected by the customer.
Capital Expenditures
We believe that it is essential to take advantage of advances in seismic technology and to commit capital to purchase and update our equipment cost-effectively. Purchasing and updating seismic equipment and technology involves a commitment to capital spending. Because of the market downturn in 2009, we reduced capital expenditures to approximately $1,960,000, primarily for equipment and vehicle maintenance and replacement. For fiscal year 2008, capital expenditures were approximately $21,686,000 compared with approximately $18,238,000 for 2007.
Customers and Consultants
Our customers are major and independent oil and natural gas exploration and development companies. The services we provide to our customers vary according to the size and needs of each customer. Our services are marketed by supervisory and executive personnel who contact customers to determine their needs and respond to customer inquiries regarding the availability of crews. Contacts are based principally upon professional relationships developed over a number of years. There are many consultants in the oil and natural gas industry who process and interpret seismic data for oil and natural gas companies. These consultants can have an influence in determining which company their customers use to acquire seismic data.
In order to avoid potential conflicts of interest with our customers, we do not participate in oil and natural gas ventures. The results of a seismic survey conducted for a customer belong to that customer. All of our customers’ information is maintained in strictest confidence.
Contracts
Our contracts are obtained either through competitive bidding or as a result of customer negotiations. Our services are conducted under general service agreements for seismic data acquisition services which define certain obligations for us and for our customers. A supplemental agreement setting forth the terms of a specific project, which may be cancelled by either party upon 30 days’ advance written notice, is entered into for every project. We currently operate under supplemental agreements that are either “turnkey” agreements providing for a fixed fee to be paid to us for each unit of data acquired or “term” agreements providing for a fixed hourly, daily, or monthly fee during the term of the project or projects.
Competition
The acquisition of seismic data for the oil and natural gas industry is a highly competitive business. There are approximately 65 seismic crews currently operating in the continental United States and Canada. Contracts for such services generally are awarded on the basis of price quotations, crew experience, and the availability of crews to perform in a timely manner, although factors other than price, such as crew safety performance history and technological and operational expertise, are often determinative. Our competitors include companies with financial resources that are significantly greater than our own as well as companies of comparable and smaller size. Our primary competitors are Dawson Geophysical Company, Geokinetics, Inc. and CGG-Veritas. In addition to the previously named companies, we also compete for projects from time to time with smaller seismic companies which operate in local markets with only one or two crews.
Employees
As of December 31, 2009, we employed a total of 574 full-time (non-union) employees, of which 27 consisted of management, sales, and administrative personnel with the remainder being crew and crew support personnel. We believe our relationship with our employees to be satisfactory.
Data Bank
We own a data bank which contains gravity data, and to a lesser extent magnetic data, from many of the major oil and natural gas producing areas located within the United States. We do not have a seismic data bank. Our data bank information has been amassed through participatory surveys as well as speculative surveys historically funded by us alone. All data and interpretations may be licensed to customers at a fraction of the cost of newly acquired data. However, the licensing of this data is not a significant portion of our revenues.
Operating Risks and Insurance
Our business is subject to the hazards inherent in conducting seismic data acquisition activities in hostile environments with dangerous machinery, and in some instances explosives. These activities can cause personal injury or loss of life, damage to or destruction of property, equipment, the environment, and marine life, and suspension of operations.
In addition, we could be subject to personal injury or real property damage claims in the normal operation of our business. Such claims may not be covered by the indemnification provisions in our general service agreements to the extent that the damage is due to our negligence or intentional misconduct.
We do not carry insurance against certain risks that we could experience such as business interruption resulting from equipment maintenance or weather delays. We obtain insurance against certain property and personal casualty risks and other risks when such insurance is available and when our management considers it advisable to do so. Currently, our insurance coverage consists of employers liability with limits of $1,000,000 per accident and $2,000,000 in the aggregate, commercial general liability of $1,000,000 per accident and $2,000,000 in the aggregate, pollution liability of $1,000,000 per accident and $2,000,000 in the aggregate, and automobile liability with a $1,000,000 combined single limit, and a $10,000,000 umbrella policy. Our general service agreements require us to have specific amounts of insurance. There can be no assurance, however, that any insurance obtained by us will be adequate to cover any losses or liabilities, or that this insurance will continue to be available or available on terms which are acceptable to us. Liabilities for which we are not insured, or which exceed the policy limits of our applicable insurance, could have a material adverse effect on us.
ITEM 1A. RISK FACTORS
Any investment in our common stock involves a high degree of risk. You should carefully consider the risks and uncertainties described below and the other information included in this Form 10-K before purchasing our common stock. Although the risks described below are the risks that we believe are material, they are not the only risks relating to our business and our common stock. Additional risks and uncertainties, including those that are not yet identified or that we currently believe are immaterial, may also adversely affect our business, financial condition, or results of operations. If any of the events described below occur, our business and financial results could be materially and adversely affected. The market price of our common stock could decline due to any of these risks, perhaps significantly, and you could lose part or all of your investment.
Company Risks
We have a history of losses, and we may incur losses again.
Although we reported net income of approximately $1,880,000, $6,898,000, and $7,607,000 for the years ended December 31, 2009, 2008, and 2007, respectively, we have a history of losses with only seven profitable years since 1999. In 2006, we had net income of approximately $8,111,000; in 2005, we had net income (before dividend requirements on preferred stock) of approximately $6,201,000; in 2004, we had net income (before dividend requirements on preferred stock) of approximately $2,868,000; and in 2003 we had net income (before dividend requirements on preferred stock) of approximately $555,000. Our ability to be profitable in the future will depend on many factors beyond our control, but primarily on the level of demand for land-based seismic data acquisition services by oil and natural gas exploration and development companies. Even if we do achieve profitability, we may not be able to sustain or increase profitability on a quarterly or annual basis.
The current economic downturn could adversely affect our revenues and cash flows.
The continuing current economic downturn could adversely affect our revenues and cash flows if our customers, and/or potential customers, become unable to pay or must delay payment of, amounts owing to the Company because such customers are not successful in generating revenues or are precluded from securing necessary financing.
Our revenues and operating results can be expected to fluctuate from period to period.
Our revenues, operating results, and profitability may fluctuate from period to period. These fluctuations are attributable to the level of new business in a particular period, the timing of the initiation, progress, or cancellation of significant projects, higher revenues and expenses on our dynamite contracts, and costs we incur to train new crews we may add in the future to meet increased customer demand. Fluctuations in our operating results may also be affected by other factors that are outside of our control such as permit delays, weather delays, and crew productivity. Oil and natural gas prices were highly volatile during the year ended December 31, 2009, and have resulted in demand fluctuations for our services. There can be no assurance of future oil and gas price levels or stability. The demand for our services will be adversely affected by a significant reduction in oil and natural gas prices and by climate change legislation or material changes to U.S. energy policy. Since our business has high fixed costs, the negative effect of one or more of these factors could trigger wide variations in our operating revenues, EBITDA margin, and profitability from quarter to quarter, which factors render quarter-to-quarter comparisons unreliable as an indicator of performance. Due to the factors discussed above, you should not expect sequential growth in our quarterly revenues and profitability.
We are dependent upon significant customers.
During 2009, our largest customer accounted for approximately 31% of revenues. During 2008, our two largest customer accounted for approximately 27% of revenues. During 2007 our largest customer accounted for approximately 12% of revenues. In the past we have derived a significant amount of our revenues from a small number of oil and natural gas exploration and development companies. While our revenues are derived from a concentrated customer base, our significant customers vary between years. If we lose one or more major customers in the future, or if one or more customers encounter financial difficulties, our business, financial condition, and results of operations could be materially and adversely affected.
We are dependent upon significant suppliers.
During 2009, our two largest vendors accounted for approximately 22% and 10% of our purchases, respectively. During 2008 and 2007, no vendor accounted for more that 10% of our purchases. If we lose one or more major vendors in the future, or if one or more vendors encounter financial difficulties, our business, financial condition, and results of operations could be materially and adversely affected.
We receive revenues from customers who engage consultants for processing and interpreting the seismic data we provide.
We receive revenues from customers who have engaged consultants to process and interpret the seismic data provided by us. Consultants can have an influence in determining which company its customers use to acquire seismic data. A consultant could recommend that its customers consider using other seismic companies.
We face intense competition in our business from companies with greater financial resources.
The seismic data acquisition services industry is a highly competitive business in the continental U.S. and Canada. Our competitors include companies with financial resources that are significantly greater than our own as well as companies of comparable and smaller size.
We are subject to Canadian foreign currency exchange rate risk.
During the fourth quarter we began to conduct business in Canada which subjects us to foreign currency exchange rate risk. Our results of operations and our cash flows could be impacted by changes in foreign currency exchange rates.
Technological change in our business creates risks of technological obsolescence and requirements for future capital expenditures. If we are unable to keep up with these technological advances, we may not be able to compete effectively.
Seismic data acquisition technologies historically have steadily improved and progressed, and we expect this progression to continue. Our strategy is to upgrade our seismic data acquisition equipment on a regular basis to maintain our competitive position. However, since we are in a capital intensive industry and have limitations on our ability to obtain the financing necessary to enable us to purchase state-of-the-art equipment, some of our competitors may be able to purchase newer equipment when we may not be able to do so.
We are dependent on our management team and key employees, and the loss of any of them could harm our business.
We have limited management depth with the result that the loss, whether by death, departure, or illness, of Wayne A. Whitener, our President and Chief Executive Officer, or other senior executives, could have a material adverse effect on the ability of management to continue operations at the same level of efficiency. We have key man insurance on the life of our President and Chief Executive Officer so that, in the event of his untimely death, we would receive insurance proceeds of $1,000,000 under this policy.
Certain members of our management team are not subject to employment or non-competition agreements and may leave our employment at any time.
Our President and Chief Executive Officer, and the President, the Vice President of Operations, and the Operations Manager of Eagle Canada, are subject to employment agreements and non-competition agreements. Members of our management team that are not subject to employment or non-competition agreements could leave upon little or no notice which could have a material adverse effect on our management’s ability to continue operations at the same level of effectiveness. Additionally, the lack of non-competition agreements would allow these members of our management team to immediately begin working for one of our competitors upon the termination of their relationship with us. This could have a negative impact on our strategic plan and our relationships with customers.
We extend credit to our customers without requiring collateral, and a default by a customer could have a material adverse effect on our operating revenues.
We perform ongoing credit evaluations of our customers’ financial conditions and, generally, require no collateral from our customers. A default in payment from one of these large customers could have a material adverse effect on our operating revenues for the period involved.
Certain of our core assets are pledged as collateral for short term notes that require large monthly payments.
Certain assets that are critical to our operations, including three of our ARAM ARIES recording systems and 13 vibration vehicles are pledged as collateral to our equipment lenders and commercial banks and could be subject to foreclosure in the event that we default on our indebtedness having 36 to 57 month terms. We currently have debt obligations covering the purchase of three of our ARAM ARIES recording systems that require monthly payments between approximately $86,000 and $103,000 for one ARAM ARIES recording system, between approximately $80,000 and $97,000 for another ARAM ARIES recording system, and between $90,000 and $102,000 for a third ARAM ARIES recording system. These debt obligations mature in December of 2011, October of 2012 and January of 2011, respectively. The Company has debt obligations covering the purchase of five vibration vehicles requiring monthly payments between approximately $56,000 and $61,000, and the purchase of eight vibration vehicles, requiring monthly payments of approximately $50,000. These debt obligations mature in
August of 2011 and February of 2013, respectively. Any decline in our operations could inhibit our ability to make these substantial monthly payments. In view of the short terms of these notes, a failure to make the monthly payments on these notes could cause our lenders to promptly foreclose on the assets securing these notes. The foreclosure on certain of our core assets securing these notes could severely limit our ability to continue operations.
We may be subject to liability claims that are not covered by our insurance.
Our business is subject to the general risks inherent in land-based seismic data acquisition activities. Our activities are often conducted in remote areas under dangerous conditions including the detonation of dynamite. These operations are subject to risks of injury to personnel and equipment. Our crews are mobile, and equipment and personnel are subject to vehicular accidents. These risks could cause us to experience equipment losses, injuries to our personnel, and interruptions in our business.
In addition, we could be subject to personal injury or real property damage claims in the normal operation of our business. Such claims may not be covered under the indemnification provisions contained in our general service agreements to the extent that the damage is due to our negligence or intentional misconduct.
We do not carry insurance against certain risks that could cause losses, including business interruption resulting from equipment maintenance or weather delays (see “Operating Risks and Insurance”).
Our general service agreements require us to have specific amounts of insurance. There can be no assurance, however, that any insurance obtained by us will be adequate to cover all losses or liabilities or that this insurance will continue to be available or available on terms which are acceptable to us. Liabilities for which we are not insured, or which exceed the policy limits of our applicable insurance, could have a materially adverse effect on us.
We are subject to the requirements of Section 404 of the Sarbanes-Oxley Act. If we are unable to maintain compliance with Section 404 or if the costs related to maintaining compliance are significant, our profitability, stock price, and results of operations and financial condition could be materially adversely affected.
If we are unable to maintain adequate internal controls in accordance with Section 404, as such standards are amended, supplemented, or modified from time to time, we may not be able to insure that we have effective internal controls over financial reporting on an ongoing basis in accordance with Section 404. Failure to achieve and maintain effective internal controls could have a material adverse effect on our stock price. In addition, a material weakness in the effectiveness of our internal control over financial reporting could result in an increased chance of fraud and the loss of customers, reduce our ability to obtain financing, and/or require additional expenditures to comply with these requirements, each of which could negatively impact our business, profitability, and financial condition.
Industry Risks
We and our customers may be adversely affected by the current recession.
The current recession could have a material adverse effect on our financial results and proposed plan of operations and could lead to further significant fluctuations in the demand for and pricing of oil and gas. Reduced demand and pricing pressures could adversely affect the financial condition and results of operations of our customers and their ability to purchase our services. We are not able to predict the timing, extent, and duration of the economic cycles in the markets in which we operate.
We derive nearly all of our revenues from companies in the oil and natural gas exploration and development industry, a historically cyclical industry, with levels of activity that are significantly affected by the levels and volatility of oil and natural gas prices.
Any prolonged reduction in the overall level of exploration and development activities, whether resulting from changes in oil and natural gas prices or otherwise, could adversely impact us in many ways by negatively affecting:
· our revenues, cash flows, and profitability;
· our ability to maintain or increase our borrowing capacity;
· our ability to obtain additional capital to finance our business and the cost of that capital; and
· our ability to attract and retain skilled personnel whom we would need in the event of an upturn in the demand for our services.
Worldwide political, economic, and military events have contributed to oil and natural gas price volatility and are likely to continue to do so in the future. Depending on the market prices of oil and natural gas, oil and natural gas exploration and development companies may cancel or curtail their drilling programs, thereby reducing demand for our services. Oil and natural gas prices have been highly volatile historically and, we believe, will continue to be so in the future. Many factors beyond our control affect oil and natural gas prices including:
· the cost of exploring for, producing, and delivering oil and natural gas;
· the discovery rate of new oil and natural gas reserves;
· the rate of decline of existing and new oil and natural gas reserves;
· available pipeline and other oil and natural gas transportation capacity;
· the ability of oil and natural gas companies to raise capital;
· actions by OPEC (the Organization of Petroleum Exporting Countries);
· political instability in the Middle East and other major oil and natural gas producing regions;
· economic conditions in the U.S. and elsewhere;
· domestic and foreign tax policy;
· domestic and foreign energy policy including the ever increasing emphasis on alternative sources of energy;
· weather conditions in the U.S. and elsewhere;
· the pace adopted by foreign governments for the exploration, development, and production of their national reserves;
· the price of foreign imports of oil and natural gas; and
· the overall supply and demand for oil and natural gas.
The high fixed costs of our operations could result in operating losses.
Companies within our industry are typically subject to high fixed costs which consist primarily of depreciation (a non-cash item) and maintenance expenses associated with seismic data acquisition and equipment and crew costs. In addition, ongoing maintenance capital expenditures, as well as new equipment investment, can be significant. As a result, any extended periods of significant downtime or low productivity caused by reduced demand, weather interruptions, equipment failures, permit delays, or other causes could adversely affect the results of our operations.
Our operations are subject to delays related to obtaining land access rights of way from third parties which could affect our results of operations.
Our seismic data acquisition operations could be adversely affected by our inability to obtain timely right of way usage from both public and private land and/or mineral owners. Delays associated with obtaining such rights of way could negatively affect our results of operations.
Our business is subject to government regulation which may adversely affect our future operations.
Our operations are subject to a variety of federal, state, and provincial and local laws and regulations, including laws and regulations relating to the protection of the environment and archeological sites and those that may result from climate change legislation. Canadian operations have been historically cyclical due to governmental restrictions on seismic acquisition during certain periods. As a result, there is a risk that there will be a significant amount of unused equipment during those periods. We are required to expend financial and managerial resources to comply with such laws and related permit requirements in our operations, and we anticipate` that we will continue to be required to do so in the future. Although such expenditures historically have not been material to us, the fact that such laws or regulations change frequently makes it impossible for us to predict the cost or impact of such laws and regulations on our future operations. The adoption of laws and regulations that have the effect of reducing or curtailing exploration and development activities by energy companies could also adversely affect our operations by reducing the demand for our services.
Risks Related To Our Common Stock
Our common stock has experienced, and may continue to experience, price volatility and low trading volume.
Our stock price is subject to significant volatility. Overall market conditions including a decline in oil and natural gas prices, in addition to other risks and uncertainties described in this “Risk Factors” section and elsewhere in this Form 10-K, could cause the market price of our common stock to fall. The high and low sales prices of our common stock for the year ended December 31, 2009, were $5.47 and $1.64, respectively.
Our common stock is listed on the NASDAQ Stock Market LLC under the symbol “TGE.” However, daily trading volumes for our common stock are, and may continue to be, relatively small compared to many other publicly traded securities. For example, during 2009, our daily trading volume was as low as 5,000 shares. Since November 6, 2007, when we began trading on the NASDAQ Stock Market LLC, our daily trading volume has been as low as 2,800 shares. In addition, our common stock traded on the NYSE Amex (formerly the American Stock Exchange) under the symbol “TGE” from April 18, 2005 until November 5, 2007. During this period of time our daily trading volume was as low as 1,600 shares. It may be difficult for you to sell your shares in the public market at any given time at prevailing prices, and the price of our common stock may, therefore, be volatile.
Our officers and directors own a large percentage of our common stock, and they may exercise control over our business and affairs.
Our officers and directors as a group beneficially own approximately 29.3% of our common stock. As a result, they will continue to be able to exercise significant influence, and in most cases control, over matters requiring shareholder approval, including the election of directors, changes to our charter documents, and significant corporate transactions. This concentration of ownership makes it unlikely that any other holder or group of holders of our common stock will be able to affect the way we are managed or the direction of our business. The continued concentrated ownership of our common stock will make it difficult for another company to acquire us and for you to receive any related takeover premium for your shares (unless the controlling group approves the acquisition).
Certain provisions of our Restated Articles of Incorporation may make it difficult for a third party to acquire us or may adversely impact your rights as a common shareholder.
Our Restated Articles of Incorporation contain provisions that require the approval of holders of 80% of our issued and outstanding shares before we can enter into a merger or other business combination or sell all or substantially all of our assets. Additionally, if we increase the size of our board from the current six to nine directors,
we could be required to stagger our directors’ terms, and our directors could not be removed without approval of holders of 80% of our issued and outstanding shares. These provisions could discourage or impede a tender offer, proxy contest, or other similar transaction involving control of us.
In addition, our board of directors has the right to issue preferred stock upon such terms and conditions as it deems to be in the best interest of the Company. The terms of such preferred stock may adversely impact the dividend and liquidation rights of the common shareholders without the approval of the common shareholders.
We do not intend to pay cash dividends on our common stock in the foreseeable future, and therefore only appreciation of the price of our common stock will provide a return to our shareholders.
While there are currently no restrictions prohibiting us from paying dividends to our shareholders, we have not paid any cash dividends on our common stock in the past, and we do not anticipate paying any dividends in the foreseeable future. Payment of any cash dividends in the future, however, is in the discretion of our board of directors and will depend on our financial condition, results of operations, capital and legal requirements, and other factors deemed relevant by our board of directors. Earnings, if any, are expected to be retained to fund our future operations.
ITEM 1B. UNRESOLVED STAFF COMMENTS.
None
ITEM 2. DESCRIPTION OF PROPERTY.
In April of 2004, we executed an addendum to our lease of a facility in Plano, Texas, that included approximately 10,500 square feet of office and warehouse space and an outdoor storage area of approximately 20,000 square feet. This facility was used to repair geophysical equipment and housed our corporate offices until September of 2006. In September of 2005, we leased an additional facility, in Plano, Texas, with approximately 10,000 square feet of office and warehouse space and an additional 10,000 square feet of outdoor storage. This facility was used primarily to repair geophysical equipment. In January of 2006, we leased a 600 square foot facility in Houston, Texas, to be used as a sales office. The monthly rent is $553. In July of 2006, we entered into a lease for 7,269 square feet of office space located in Plano, Texas. In September of 2006, we relocated our corporate offices to this facility, and in September of 2008 increased the size of this lease to 8,523 square feet of office space. The monthly rent is $12,482. In October of 2006, we leased an 800 square foot facility in Oklahoma City, Oklahoma, to be used as a sales office. The monthly rent is $665. In September of 2007, we leased a 1,130 square foot facility in Denver, Colorado, to be used as a sales office. We did not renew the lease on the Denver office upon its expiration on August 31, 2009. In September of 2008, we leased a 400 square foot facility is Pratt, Kansas, to be used as a permit office. The monthly rent is $500. In November of 2008, we vacated our two Plano repair, warehouse, and outdoor storage facilities and moved to a leased repair, warehouse, and outdoor storage facility in Denison, Texas. The Denison, Texas, facility consists of one 5,000 square foot building, two 10,000 square foot adjacent buildings, and an outdoor storage area of approximately 60,500 square feet. The monthly rent is $15,068. Upon the acquisition of Eagle Canada, we assumed a lease entered into in August of 2008 for 3,030 square feet of office space located in Calgary, Alberta. The monthly rent is $11,171. In addition, Eagle Canada leases a 10,088 square foot facility, also located in Calgary, Alberta, that is used as a shop and warehouse which is currently leased on a month-to-month basis. The monthly rent is $6,103. Effective April 1, 2010, we will enter into a lease for this facility at a rate of $7,644 per month. The Company is not responsible for insuring these facilities. The conditions of these facilities are good, and we believe that these properties are suitable and adequate for our foreseeable needs.
ITEM 3. LEGAL PROCEEDINGS.
The Company is a defendant in various legal actions that arose or may arise out of the normal course of business. In our opinion, none of these actions have or will result in any significant loss to us.
ITEM 4. RESERVED.
PART II
ITEM 5. MARKET FOR REGISTRANT’S COMMON EQUITY, RELATED STOCKHOLDER MATTERS AND ISSUER PURCHASES OF EQUITY SECURITIES.
Market Prices
On April 18, 2005, we began trading on the NYSE Amex (formerly the American Stock Exchange) (“AMEX”) under our current trading symbol “TGE.” On October 26, 2007, we announced that our board of directors approved the decision to switch the listing of our common stock from AMEX to the NASDAQ Global Select Market (“NASDAQ.”) As a result, on November 6, 2007, our stock began trading on NASDAQ under the symbol “TGE.”
The following table shows the high and low sales prices reported for our common stock on NASDAQ. On May 12, 2009 and April 28, 2008, the Company paid 5% stock dividends to shareholders of record at the close of business on April 28, 2009, and April 14, 2008, respectively. All prior share and per share amounts have been restated to reflect the stock dividends.
|
|
|
2009 |
|
2008 |
|
||||||||
|
|
|
High |
|
Low |
|
High |
|
Low |
|
||||
|
|
|
|
|
|
|
|
|
|
|
||||
|
1st quarter |
|
$ |
2.93 |
|
$ |
1.69 |
|
$ |
10.17 |
|
$ |
6.71 |
|
|
2nd quarter |
|
5.75 |
|
2.13 |
|
9.25 |
|
6.60 |
|
||||
|
3rd quarter |
|
5.17 |
|
3.30 |
|
8.93 |
|
4.70 |
|
||||
|
4th quarter |
|
5.03 |
|
3.61 |
|
6.00 |
|
1.05 |
|
||||
The number of shareholders of record of TGE’s common stock as of February 26, 2010, was 149. Due to the number of shares held in nominee or street name, we believe that there are a significantly greater number of beneficial owners of our common stock. As of such date, CEDE & CO. held 14,859,740 shares in street name. On February 26, 2010, our common stock was quoted at a closing sales price of $4.12.
The following table summarizes certain information regarding securities authorized for issuance under our equity compensation plans as of December 31, 2009. See information regarding material features of the plans in Note H, ‘Shareholders’ Equity-Stock-Based Compensation Plans” to the Financial Statements included herein.
Equity Compensation Plan Information
|
|
|
|
|
|
|
Number of Securities |
|
|
|
|
|
|
|
|
|
Remaining Available for |
|
|
|
|
|
Number of Securities |
|
|
|
Future Issuance Under |
|
|
|
|
|
to be Issued |
|
Weighted-Average |
|
Equity Compensation Plans |
|
|
|
|
|
Upon Exercise of |
|
Exercise Price of |
|
(excluding securities Reflected |
|
|
|
Plan Category |
|
Outstanding Options |
|
Outstanding Options |
|
in Column (a) |
|
|
|
|
|
(a) |
|
(b) |
|
(c) |
|
|
|
|
|
|
|
|
|
|
|
|
|
Equity compensation plans approved by security holders |
|
808,879 |
|
$ |
3.99 |
|
173,835 |
(1) |
|
|
|
|
|
|
|
|
|
|
|
Equity compensation plans not approved by security holders |
|
— |
|
— |
|
— |
|
|
|
|
|
|
|
|
|
|
|
|
|
Total |
|
808,879 |
|
$ |
3.99 |
|
173,835 |
(1) |
(1) No shares remain available to be issued under the 1999 Stock Option Plan. There are 173,835 shares available to be issued under the 2006 Stock Award Plan.
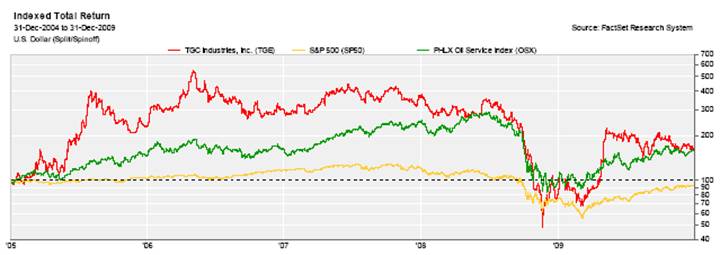
Performance Graph
The following graph is not “soliciting material,” is not deemed filed with the Securities and Exchange Commission, and is not to be incorporated by reference into any of the Company’s filings under the Securities Act of 1933, as amended, or the Securities Exchange Act of 1934, as amended, respectively.
The following graph sets forth the five-year cumulative total shareholder return, which assumes reinvestment of dividends, of a $100 investment beginning in the Company’s common stock, a peer group made up of companies in the Philadelphia Oil Service Sector Index, and the S&P 500 Stock Index. The Philadelphia Oil Service Sector Index consists of far larger companies that provide a variety of services as compared to the land-based geophysical services provided by the Company.
ITEM 6. SELECTED FINANCIAL DATA.
The following selected financial data should be read in conjunction with Item 7, “Management’s Discussion and Analysis of Financial Condition and Results of Operations,” and the Company’s financial statements and notes thereto included in Item 8, “Financial Statements and Supplementary Data.” No cash dividends were declared in any of the five years shown below:
|
|
|
Year Ended December, 31, |
|
|||||||||||||
|
|
|
2009 |
|
2008 |
|
2007 |
|
2006 |
|
2005 |
|
|||||
|
|
|
(In thousands, except per share amounts) |
|
|||||||||||||
|
Statement of Income Data: |
|
|
|
|
|
|
|
|
|
|
|
|||||
|
|
|
|
|
|
|
|
|
|
|
|
|
|||||
|
Revenues |
|
$ |
90,432 |
|
$ |
86,770 |
|
$ |
90,396 |
|
$ |
67,760 |
|
$ |
30,852 |
|
|
|
|
|
|
|
|
|
|
|
|
|
|
|||||
|
Net income |
|
$ |
1,880 |
|
$ |
6,898 |
|
$ |
7,607 |
|
$ |
8,111 |
|
$ |
6,201 |
|
|
|
|
|
|
|
|
|
|
|
|
|
|
|||||
|
Income allocable to common shareholders |
|
$ |
1,880 |
|
$ |
6,898 |
|
$ |
7,607 |
|
$ |
8,111 |
|
$ |
5,996 |
|
|
|
|
|
|
|
|
|
|
|
|
|
|
|||||
|
Net Income per common share - basic |
|
$ |
0.10 |
|
$ |
0.38 |
|
$ |
0.42 |
|
$ |
0.45 |
|
$ |
0.61 |
|
|
|
|
|
|
|
|
|
|
|
|
|
|
|||||
|
Net Income per common share - diluted |
|
$ |
0.10 |
|
$ |
0.38 |
|
$ |
0.42 |
|
$ |
0.44 |
|
$ |
0.39 |
|
|
|
|
|
|
|
|
|
|
|
|
|
|
|||||
|
Weighted average number of common Shares outstanding - basic |
|
18,280 |
|
18,260 |
|
18,237 |
|
18,134 |
|
9,876 |
|
|||||
|
|
|
|
|
|
|
|
|
|
|
|
|
|||||
|
Weighted average number of common Shares outstanding - diluted |
|
18,344 |
|
18,337 |
|
18,325 |
|
18,265 |
|
15,841 |
|
|||||
|
|
|
|
|
|
|
|
|
|
|
|
|
|||||
|
Total assets |
|
$ |
86,050 |
|
$ |
85,091 |
|
$ |
61,162 |
|
$ |
56,400 |
|
$ |
41,246 |
|
|
|
|
|
|
|
|
|
|
|
|
|
|
|||||
|
Long-term debt, less current maturities |
|
$ |
6,507 |
|
$ |
11,452 |
|
$ |
3,769 |
|
$ |
3,064 |
|
$ |
6,199 |
|
|
|
|
|
|
|
|
|
|
|
|
|
|
|||||
|
Shareholders’ equity |
|
$ |
52,695 |
|
$ |
50,427 |
|
$ |
42,922 |
|
$ |
35,043 |
|
$ |
26,605 |
|
In October of 2005, the Company completed a public offering of approximately 5,786,000 (not adjusted for the 5% stock dividends paid in 2009, 2008, 2007 and 2006) shares of common stock. The weighted average number of equivalent common shares outstanding in 2005 reflects these additional shares for a portion of the year.
ITEM 7. MANAGEMENT’S DISCUSSION AND ANALYSIS OF FINANCIAL CONDITION AND RESULTS OF OPERATION.
The following discussion and analysis should be read in conjunction with our financial statements and related notes thereto included elsewhere in this Form 10-K. Portions of this document that are not statements of historical or current fact are forward-looking statements that involve risk and uncertainties, such as statements of our plans, objectives, expectations, and intentions. The cautionary statements made in this Form 10-K should be read as applying to all related forward-looking statements wherever they appear in this Form 10-K. Our actual results could differ materially from those anticipated in the forward-looking statements. Factors that could cause our actual results to differ materially from those anticipated include those discussed in “Business,” “Information Regarding Forward-Looking Statements,” and “Risk Factors.”
Executive Overview
The Company is a leading provider of seismic data acquisition services throughout the continental United States and Canada. We currently operate eleven seismic crews. These seismic crews supply seismic data to companies engaged in the exploration and development of oil and natural gas on land and in land-to-water transition areas. Our customers rely on seismic data to identify areas where subsurface conditions are favorable for the accumulation of existing hydrocarbons, to optimize the development and production of hydrocarbon reservoirs, to better delineate existing oil and natural gas fields, and to augment reservoir management techniques.
We acquire geophysical data using the latest in 3-D survey techniques. We introduce acoustic energy into the ground by using vibration equipment or dynamite detonation, depending on the surface terrain and subsurface requirements. The reflected energy, or echoes, is received through geophones, converted into a digital signal at a multi-channel recording unit, and then transmitted to a central recording vehicle. Subsurface requirements dictate the number of channels necessary to perform our services. With our state-of-the-art seismic equipment, including computer technology and multiple channels, we acquire, on a cost effective basis, immense volumes of seismic data that when processed and interpreted produce more precise images of the earth’s subsurface. Our customers then use our seismic data to generate 3-D geologic models that help reduce finding costs and improve recovery rates from existing wells.
Currently, the seismic data acquisition industry is made up of a number of companies divided into two groups. The first group is made up of four publicly-traded companies with long operating histories which field numerous crews and work in a number of different regions and terrain. This group includes us, Dawson Geophysical Company, Geokinetics, Inc. and CGG-Veritas. These companies field approximately 50% of the estimated 65 seismic crews currently operating in the continental U.S. and Canada. The second group is made up of smaller companies who generally run one or two seismic crews and often specialize in specific regions or types of operation.
We provide our seismic data acquisition services primarily to onshore oil and natural gas exploration and development companies for use in the onshore drilling and production of oil and natural gas in the continental U.S. and Canada. The main factors influencing demand for seismic data acquisition services in our industry are the level of drilling activity by oil and natural gas companies and the sizes of such companies’ exploration and development budgets, which, in turn, depend largely on current and anticipated future crude oil and natural gas prices and depletion rates.
Our customers are major and independent oil and natural gas exploration and development companies. The services we provide to our customers vary according to the size and needs of each customer. Our services are marketed by sales, supervisory and executive personnel who contact customers to determine their needs and respond to customer inquiries regarding the availability of crews. Contacts are based principally upon professional relationships developed over a number of years. There are a number of consultants in the oil and natural gas industry who process and interpret seismic data for oil and natural gas companies. These consultants can have an influence in determining which company their customers use to acquire seismic data.
The acquisition of seismic data for the oil and natural gas industry is a highly competitive business. There are approximately 65 seismic crews currently operating in the continental United States and Canada. Contracts for such services generally are awarded on the basis of price quotations, crew experience, and the availability of crews to perform in a timely manner, although factors other than price, such as crew safety performance history, and technological and operational expertise, are often determinative. Our competitors include companies with financial resources that are significantly greater than our own as well as companies of comparable and smaller size. Our primary competitors are Dawson Geophysical Company, Geokinetics, Inc. and CGG-Veritas. In addition to the previously named companies, we also compete for projects from time to time with smaller seismic companies which operate in local markets with only one or two crews. We believe that our long-term industry expertise, the customer relationships developed over our history, and our financial stability give us an advantage over most of our competitors in the industry.
Results of Operations
Year Ended December 31, 2009 Compared to Year Ended December 31, 2008
Revenues. Our revenues were $90,431,899 for the year ended December 31, 2009 compared to $86,769,742 for the same period of 2008, an increase of 4.2%. This increase was attributable to several factors including strong revenue earnings during our first quarter of 2009, revenues earned by Eagle Canada during a portion of our fourth quarter, and the fact that approximately 41% of the revenues in the year ended December 31, 2009 were derived from shot-hole contracts compared with approximately 20% for the same period of 2008. This increase was partially offset by revenue decreases in the second half of the year. Shot-hole contracts typically generate higher revenues but lower gross margins than vibroseis contracts due to higher third party costs that are included in revenues and have little or no margin associated with them.
Cost of services. Our cost of services was $65,379,612 for the year ended December 31, 2009 compared to $55,935,068 for the same period of 2008, an increase of 16.9%. This increase was primarily attributable to the increase in revenues in the year ended December 31, 2009 compared to the same period of 2008, pricing pressures as a result of the industry wide slow-down, and higher third party costs associated with the additional shot-hole contracts in 2009 compared to 2008. As a percentage of revenues, cost of services was 72.3% for the year ended December 31, 2009 compared to 64.5% for the same period of 2008.
Selling, general, and administrative expenses. SG&A expenses were $5,522,939 for the year ended December 31, 2009 compared to $4,468,883 for the same period of 2008, an increase of 23.6%. This increase was primarily attributable to the recording of a reserve on an accounts receivable of a slow paying customer and the inclusion of fourth quarter general and administrative expenses of Eagle Canada. SG&A expense as a percentage of revenues was 6.1% for the year ended December 31, 2009 compared to 5.2% for the same period of 2008.
Depreciation and amortization expense. Depreciation and amortization expense was $14,621,237 for the year ended December 31, 2009 compared to $13,911,124 for the same period of 2008, an increase of 5.1%. This increase was primarily attributable to incremental fourth quarter depreciation and amortization expense attributable to Eagle Canada, depreciation and amortization expense associated with capital expenditures of approximately $1,960,000 since January 1, 2009, and additions of new seismic recording equipment and vibration vehicles during the second half of 2008. Depreciation and amortization expense as a percentage of revenues was 16.2% for the year ended December 31, 2009 compared to 16.0% for the same period of 2008.
Income from operations. Income from operations was $4,908,111 for the year ended December 31, 2009 compared to $12,454,667 for the same period of 2008, a decrease of 60.6%. This decrease was primarily attributable to strong market pricing pressure resulting from the current recession and increases in costs of services, SG&A and depreciation and amortization expenses. EBITDA decreased $6,836,443 to $19,529,348 for the year ended December 31, 2009 from $26,365,791 for the same period of 2008, a decrease of 25.9%. This decrease was primarily attributable to the decrease in net income and income tax expenses, partially offset by an increase in depreciation referred to immediately above. For a definition of EBITDA, a reconciliation of EBITDA to net income, and discussion of EBITDA, see the section entitled “Non-GAAP Financial Measure” which follows.
Interest expense. Interest expense was $1,020,681 for the year ended December 31, 2009 compared to $929,656 for the same period of 2008, an increase of 9.8%. This increase was primarily attributable to additional debt incurred during the second half of 2008 for the purchase of our eighth ARAM ARIES seismic recording system, 7,000 additional channels, and 13 new vibration vehicles.
Income tax expense. Income tax expense was $2,007,811 for the year ended December 31, 2009 compared to $4,626,569 for the same period of 2008, a decrease of 56.6%. This decrease was primarily attributable to the decrease in income from operations, partially offset by an increase in the effect of permanent tax differences. The effective tax rate for the year ended December 31, 2009 was 51.6% compared to 40.1% for the same period of 2008. See Note I of Notes to Financial Statements.
Year Ended December 31, 2008 Compared to Year Ended December 31, 2007
Revenues. Our revenues were $86,769,742 for the year ended December 31, 2008 compared to $90,395,872 for the same period of 2007, a decrease of 4%. This decrease in revenues was attributable to the fact that approximately 20% of the revenues in the year ended December 31, 2008 were derived from shot-hole contracts compared with approximately 34% for the same period of 2007. Shot-hole contracts typically generate higher revenues but lower gross margins than vibroseis contracts due to higher third party costs that are included in revenues and have little or no margin associated with them.
Cost of services. Our cost of services was $55,935,068 for the year ended December 31, 2008 compared to $60,445,783 for the same period of 2007, a decrease of 7.5%. This decrease was primarily attributable to the decrease in revenues in the year ended December 31, 2008 compared to the same period of 2007 and higher third party costs associated with the additional shot-hole contracts in 2007 compared to 2008. As a percentage of revenues, cost of services was 64.5% for the year ended December 31, 2008 compared to 66.9% for the same period of 2007.
Selling, general, and administrative expenses. SG&A expenses were $4,468,883 for the year ended December 31, 2008 compared to $3,864,810 for the same period of 2007, an increase of 15.6%. This increase was primarily attributable to additional expenses associated with additional selling and administrative personnel and additional compensation expense for deferred stock-based compensation. SG&A expense as a percentage of revenues was 5.2% for the year ended December 31, 2008 compared to 4.3% for the same period of 2007.
Depreciation and amortization expense. Depreciation and amortization expense was $13,911,124 for the year ended December 31, 2008 compared to $12,743,065 for the same period of 2007, an increase of 9.2%. This increase was primarily attributable to depreciation and amortization expense associated with capital expenditures of approximately $21,686,000 since January 1, 2008. This increase was partially offset by a decrease in depreciation expense in the third and fourth quarters of 2007 and the first and second quarters of 2008 as a result of an increase in the estimated useful life of certain seismic equipment. See “Change In Accounting Estimates” in Note B of Notes to Financial Statements in Item 8. Depreciation and amortization expense as a percentage of revenues was 16.0% for the year ended December 31, 2008 compared to 14.1% for the same period of 2007.
Income from operations. Income from operations was $12,454,667 for the year ended December 31, 2008 compared to $13,342,214 for the same period of 2007, a decrease of 6.7%. This decrease was primarily attributable to a decrease in revenues, an increase in SG&A, and depreciation and amortization expenses, partially offset by a decrease in costs of services. EBITDA increased $280,512 to $26,365,791 for the year ended December 31, 2008 from $26,085,279 for the same period of 2007, an increase of 1.1%. This increase was primarily attributable to the increase in depreciation referred to immediately above. For a definition of EBITDA, a reconciliation of EBITDA to net income, and discussion of EBITDA, see the section entitled “Non-GAAP Financial Measure” which follows.
Interest expense. Interest expense was $929,656 for the year ended December 31, 2008 compared to $604,616 for the same period of 2007, an increase of 53.8%. This increase was primarily attributable to the additional debt incurred in 2008 as a result of financing certain new seismic equipment purchased during 2008.
Income tax expense. Income tax expense was $4,626,569 for the year ended December 31, 2008 compared to $5,130,165 for the same period of 2007, a decrease of 9.8%. The effective tax rate for the year ended December 31, 2008 was 40.1% compared to 40.3% for the same period of 2007.
Non-GAAP Financial Measure
We define EBITDA as net income plus expenses of interest, income taxes, depreciation, and amortization. We use EBITDA as a supplemental financial measure to assess:
· the financial performance of our assets without regard to financing methods, capital structures, taxes, or historical cost basis;
· our liquidity and operating performance over time and in relation to other companies that own similar assets and that we believe calculate EBITDA in a manner similar to us; and
· the ability of our assets to generate cash sufficient for us to pay potential interest expenses.
We also understand that such data is used by investors to assess our performance. However, EBITDA is not a measure of operating income, operating performance, or liquidity presented in accordance with General Accepted Accounting Principles (GAAP). When assessing our operating performance or our liquidity, you should not consider this data in isolation or as a substitute for our net income, cash flow from operating activities, or other cash flow data calculated in accordance with GAAP. EBITDA excludes some, but not all, items that affect net income and operating income, and these measures may vary among other companies. Therefore, EBITDA as presented below may not be comparable to similarly titled measures of other companies. Further, the results presented by EBITDA cannot be achieved without incurring the costs that the measure excludes: interest, taxes, depreciation, and amortization.
The following table reconciles our EBITDA to our net income:
|
|
|
Year Ended |
|
|||||||
|
|
|
December 31, |
|
|||||||
|
|
|
2009 |
|
2008 |
|
2007 |
|
|||
|
|
|
|
|
|
|
|
|
|||
|
Net income |
|
$ |
1,879,619 |
|
$ |
6,898,442 |
|
$ |
7,607,433 |
|
|
Depreciation and amortization expense |
|
14,621,237 |
|
3,911,124 |
|
12,743,065 |
|
|||
|
Interest expense |
|
1,020,681 |
|
929,656 |
|
604,616 |
|
|||
|
Income tax expense |
|
2,007,811 |
|
4,626,569 |
|
5,130,165 |
|
|||
|
EBITDA |
|
$ |
19,529,348 |
|
$ |
26,365,791 |
|
$ |
26,085,279 |
|
Liquidity and Capital Resources
Liquidity
Cash flows from operating activities.
Net cash provided by operating activities was $20,698,122 for the year ended December 31, 2009, compared to $33,860,082 for the same period of 2008. The $13,161,960 decrease was principally attributable to a decrease in net income, the timing of accounts receivable collections, the timing of receipt and payment of invoices and taxes, the timing of billings and revenue recognition, and the mix of contracts.
Working capital increased $326,591 to $17,295,634 as of December 31, 2009, from the December 31, 2008, working capital of $16,969,043. This increase was due primarily to an increase in cash and cash equivalents of $1,389,798 and an increase in trade accounts receivable of $3,601,316, partially offset by an increase in billings in excess of costs, estimated earnings on uncompleted contracts of $1,301,497, and an increase in current maturities of notes payable of $1,236,020.
Cash flows used in investing activities.
Net cash used in investing activities was $10,942,164 for the year ended December 31, 2009, and $6,078,536 for the year ended December 31, 2008. The $4,863,628 increase was mainly due to $10,345,000 cash paid for our purchase of the stock of Eagle Canada, partially offset by a decrease in cash related capital expenditures during 2009 of $4,972,076.
Cash flows used in financing activities.
Net cash used in financing activities was $8,367,479 for the year ended December 31, 2009 and $8,171,021 for the year ended December 31, 2008. The $196,458 increase was due primarily to an increase in principal payments on notes payable of $502,842, partially offset by a decrease in principal payments on capital leases of $299,542.
Capital expenditures.
During the year ended December 31, 2009, capital expenditures of $1,959,706 were used to acquire seismic equipment and vehicles, primarily to replace similar equipment and vehicles. During the first two months of 2010, there have been no material capital expenditures. Although we do not budget for our capital expenditures, we may purchase additional equipment during 2010 as the demand for our services warrants.
Capital Resources
Historically, we have relied on cash generated from operations, short-term borrowings from commercial banks and equipment lenders, and loans from directors to fund our working capital requirements and capital expenditures.
In April of 2005, we entered into a revolving credit agreement with a commercial bank. Effective September 16, 2006, we renewed our revolving credit agreement and increased the borrowing limit from $3,500,000 to $5,000,000. The borrowing limit under the revolving line of credit agreement remains at $5,000,000 and was
renewed on September 16, 2007, September 16, 2008, and again on September 16, 2009. The revolving line of credit agreement does not expire until September 16, 2010. Our obligations under this agreement are secured by a security interest in our accounts receivable. Interest on the outstanding amount under the line of credit loan agreement is payable monthly at the greater of the prime rate of interest or five percent. The credit loan agreement provides for non-financial and financial covenants including a minimum debt service coverage ratio in excess of 2.0 to 1.0 and a ratio of debt to worth not in excess of 1.25 to 1.0. As of December 31, 2009, we had no borrowings outstanding under the line of credit loan agreement.
In December of 2007, we completed a $4,120,254 loan transaction with a commercial lender for the purpose of providing funds for the purchase of our seventh new ARAM ARIES recording system. This loan is repayable over a period of 48 months at a fixed per annum interest rate of 6.38%. This loan is collateralized by the new recording system equipment and the recording vehicles and two semi-trailers that transport the newly purchased equipment between jobs. In January of 2008, the Company entered into a $2,463,101 loan agreement with a bank to provide financing for the purchase of new vibration vehicles. The loan is repayable over a period of 57 months at a fixed per annum interest rate of 6.35% and is collateralized by the vibration vehicles. In February of 2008, the Company exercised its purchase option for seismic recording equipment it had been renting. In March of 2008, the Company entered into a $2,975,844 loan agreement with a commercial lender to provide financing for the purchase of this rented equipment and to replace an existing loan the Company had with the lender. This loan is repayable over a period of 48 months at a fixed per annum interest rate of 5.75% and is collateralized by the equipment. In July of 2008, the Company entered into a $3,200,000 loan agreement with a bank to provide financing for the purchase of seismic recording equipment. This loan is repayable over 36 months at a fixed per annum interest rate of 6.00% and is collateralized by the equipment. In August of 2008, the Company entered into a $2,003,700 loan agreement with a bank to provide financing for the purchase of new vibration vehicles. This loan is repayable over 36 months at a fixed per annum interest rate of 6.00% and is collateralized by the vibration vehicles. In September of 2008, the Company entered into a $2,690,402 loan agreement with a commercial lender to provide financing for our eighth new ARAM ARIES recording system. This loan is repayable over a period of 48 months at a fixed per annum interest rate of 6.00% and is collateralized by the recording system. Also in September of 2008, the Company entered into a $1,092,053 loan agreement with the same commercial lender to provide financing for recording equipment that goes with the eighth ARAM ARIES recording system. This loan is co-terminus with the loan for the recording system, carries a fixed per annum interest rate of 6.00%, and is collateralized by the recording equipment. In January of 2008, Eagle Canada entered into a $4,660,070 loan agreement with a bank to provide financing for the purchase of a new ARAM ARIES recording system. This loan is repayable over a period of 36 months at a fixed per annum interest rate of 6.14% and is collateralized by the recording system.
In April of 2004, we executed an addendum to our lease of a facility in Plano, Texas, that included approximately 10,500 square feet of office and warehouse space and an outdoor storage area of approximately 20,000 square feet. This facility was used to repair geophysical equipment and housed our corporate offices until September of 2006. In September of 2005, we leased an additional facility, in Plano, Texas, with approximately 10,000 square feet of office and warehouse space and an additional 10,000 square feet of outdoor storage to accommodate our growth. This facility was used primarily to repair geophysical equipment. In January of 2006, we leased a 600 square foot facility in Houston, Texas, to be used as a sales office. In July of 2006, we entered into a lease for 7,269 square feet of office space located in Plano, Texas. In September of 2006, we relocated our corporate offices to this facility, and in September of 2008 increased the size of the lease to 8,523 square feet of office space. In October of 2006, we leased an 800 square foot facility in Oklahoma City, Oklahoma, to be used as a sales office. In September of 2007, we leased a 1,130 square foot facility in Denver, Colorado, to be used as a sales office. We did not renew the lease on the Denver office upon its expiration on August 31, 2009. In September of 2008, we leased a 400 square foot facility is Pratt, Kansas, to be used as a permit office. In November of 2008, we vacated our two Plano repair, warehouse, and outdoor storage facilities, and moved to a leased repair, warehouse, and outdoor storage facility in Denison, Texas. The Denison, Texas, facility consists of one 5,000 square foot building, two 10,000 square foot adjacent buildings, and an outdoor storage area of approximately 60,500 square feet. Upon the acquisition of Eagle Canada, we assumed a lease entered into in August of 2008 for 3,030 square feet of office space located in Calgary, Alberta. In addition, Eagle Canada leases a 10,088 square foot facility located in Calgary, Alberta, that is used as a shop and warehouse. This facility is currently leased on a month-to-month basis, but we will enter into a lease for this facility on April 1, 2010.
Contractual Obligations
The following table summarizes payments due in specific periods related to our contractual obligations as of December 31, 2009:
|
|
|
Payments Due by Period (1) |
|
|||||||||||||
|
|
|
|
|
Within |
|
|
|
|
|
After |
|
|||||
|
Contractual Obligations |
|
Total |
|
1 Year |
|
1-2 Years |
|
3-5 Years |
|
5 Years |
|
|||||
|
|
|
(In thousands) |
|
|
|
|
|
|
|
|
|
|||||
|
Operating lease obligations |
|
$ |
2,219 |
|
$ |
550 |
|
$ |
1,009 |
|
$ |
575 |
|
$ |
85 |
|
|
Debt obligations |
|
$ |
12,283 |
|
$ |
6,408 |
|
$ |
5,825 |
|
$ |
50 |
|
$ |
— |
|
|
Capital lease obligations |
|
$ |
1,412 |
|
$ |
780 |
|
$ |
632 |
|
$ |
— |
|
$ |
— |
|
|
Total |
|
$ |
15,914 |
|
$ |
7,738 |
|
$ |
7,466 |
|
$ |
625 |
|
$ |
85 |
|
(1) See “Capital Resources” above for a discussion of the contractual obligations we have incurred since December 31, 2009.
We believe that our capital resources, including our short-term investments, funds available under our line of credit loan agreement, and cash flow from operations, are adequate to meet our current operational needs. We believe that we will be able to finance our 2010 capital expenditures through cash flow from operations, borrowings from commercial lenders, and the funds available under our line of credit loan agreement. However, our ability to satisfy working capital requirements, meet debt repayment obligations, and fund future capital requirements will depend principally upon our future operating performance which is subject to the risks inherent in our business.
Off-Balance Sheet Arrangements
As of December 31, 2009, we had no off-balance sheet arrangements.
Critical Accounting Policies
The preparation of our financial statements in conformity with GAAP requires us to make certain assumptions and estimates that affect the reported amounts of assets and liabilities at the date of our financial statements and the reported amounts of revenues and expenses during the reporting period. Because of the use of assumptions and estimates inherent in the reporting process, actual results could differ from those estimates.
Revenue Recognition
Seismic Surveys
The Company provides seismic data acquisition survey services to its customers under general service agreements which define certain obligations for the Company and for its customers. A supplemental agreement setting forth the terms of a specific project, which may be cancelled by either party upon 30 days advance written notice, is entered into for every project. These supplemental agreements are either “turnkey” agreements providing for a fixed fee to be paid for each unit of seismic data acquired or “term” agreements providing for a fixed hourly, daily, or monthly fee during the term of the project. The duration of these projects will vary from a few days to several months. The Company recognizes revenue when services are performed under both types of agreements. Services are defined as the commencement of data acquisition. Under turnkey agreements, the total number of units of seismic data to be gathered is set forth in the agreement, and revenue is recognized as services are performed on a per unit of seismic data acquired rate. Under term agreements, revenue is recognized as services are performed based on the time worked rate provided in the term agreement. Under both turnkey and term agreements, cost of earned revenue is recognized by multiplying total estimated agreement cost by the percentage-of-completion of the agreement. The excess of that amount over the cost of earned revenue reported in prior periods is recognized as cost of earned revenue for the period. Agreements are not segmented nor combined for purposes of calculating percentage of completion. The asset “Costs and estimated earnings in excess of billings on uncompleted contracts” represents cost incurred on turnkey agreements in excess of billings on those agreements. The liability “Billings in excess of costs and estimated earnings on uncompleted contracts” represents billings on turnkey agreements in excess of cost on those agreements. Claims have been negligible in the years ended December 31, 2009, 2008, and 2007.
Gravity Data
The Company owns a data bank which contains gravity data, and to a lesser extent magnetic data, from many of the major oil and natural gas producing areas located within the U.S. When an order for gravity data is received, the portion of gravity data requested by the customer is prepared in digital format for licensing and shipment to the customer. This process is performed by an employee in the Company’s headquarters office and normally takes no longer than a few days. The licensing of gravity data is not a material part of the Company’s revenue. Gravity data revenue during the years ended December 31, 2009, 2008, and 2007 was approximately $20,300, $46,100, and $187,300, respectively.
Business Combinations
We allocate the purchase price of acquired companies to the tangible assets acquired, liabilities assumed, and intangible assets acquired, based on their estimated fair values. The excess of the purchase price over these fair values is recorded as goodwill. We engage independent third-party appraisal firms to assist us in determining the fair values of assets acquired and liabilities assumed. Such valuations require management to make significant estimates and assumptions.
Allowance for Doubtful Accounts
We prepare our allowance for doubtful accounts receivable based on our past experience of historical write-offs, our current customer base, and our review of past due accounts. The inherent volatility of the energy industry’s business cycle can cause swift and unpredictable changes in the financial stability of our customers. In the fourth quarter of 2009, we recorded an allowance against the account of a slow paying customer.
Impairment of Long-lived Assets
We review long-lived assets for impairment when triggering events occur suggesting deterioration in the assets’ recoverability or fair value. Recognition of an impairment charge is required if future expected net cash flows are insufficient to recover the carrying value of the asset. Our forecast of future cash flows used to perform impairment analysis includes estimates of future revenues and profitability based on our historical results and analysis of future oil and natural gas prices which are fundamental to assessing demand for our services. If we are unable to achieve these cash flows, our estimates will be revised which could result in an impairment charge for the period of revision.
Depreciable Lives of Property, Plant, and Equipment
Our property, plant, and equipment are capitalized at historical cost and depreciated over the useful life of the asset. Our estimate of this useful life is based on circumstances that exist in the seismic industry and information available at the time of the purchase of the asset. The technology of the equipment used to gather data in the seismic industry has historically evolved such that obsolescence does not occur quickly. As circumstances change and new information becomes available, these estimates could change. We amortize these capitalized items using the straight-line method. Capital assets are depreciated over their useful lives ranging from one to seven years, depending on the classification of the asset.
Tax Accounting
We account for our income taxes in accordance with the recognition of amounts of taxes payable or refundable for the current year and an asset and liability approach in recognizing the amount of deferred tax liabilities and assets for the future tax consequences of events that have been recognized in our financial statements or tax returns. We determine deferred taxes by identifying the types and amounts of existing temporary differences, measuring the total deferred tax asset or liability using the applicable tax rate, and reducing the deferred tax asset by a valuation allowance if, based on available evidence, it is more likely than not that some portion or all of the deferred tax assets will not be realized. Our methodology for recording income taxes requires judgment regarding assumptions and the use of estimates, including determining our annual effective tax rate and the valuation of deferred tax assets, which can create a variance between actual results and estimates and could have a material impact on our provision or benefit for income taxes.
Stock Based Compensation
We recognize the fair value of the stock-based compensation awards, including stock options and restricted stock, as wages in the consolidated statements of earnings on a straight-line basis over the vesting period of the related stock options or restricted stock awards. This has resulted in the recognition of compensation expense, relative to stock-based awards, in wages in the consolidated statements of earnings of approximately $366,000, or approximately $0.02 per share, for the year ended December 31, 2009, and $455,000, or approximately $0.02 per share, for the year ended December 31, 2008.
In August of 2007, 18,900 shares of restricted stock were issued to employees of the Company under the 2006 Stock Award Plan. In June of 2008, 10,000 shares of restricted stock were issued to an employee of the Company under the 2006 Stock Award Plan. In July of 2009, 5,000 shares of restricted stock were issued to an employee of the Company under the 2006 Stock Award Plan. In October of 2008, 335,000 stock options were issued to employees of the Company under the 2006 Stock Award Plan. In November of 2009, 135,000 stock options were issued to employees of the Company under the 2006 Stock Award Plan. As of December 31, 2009, there was approximately $625,000 of unrecognized compensation expense related to our two share-based compensation plans.
Recently Issued Accounting Pronouncements
In September of 2006, the Financial Accounting Standards Board (FASB) issued Accounting Standards Codification (ASC) 820-10, “Fair Value Measurements and Disclosures.” ASC 820-10 defines fair value as the amount that would be exchanged to sell an asset or transfer a liability in an orderly transaction between market participants. The standard further establishes a framework for measuring fair value in generally accepted accounting principles and expands certain disclosures about fair value measurements. ASC 820-10 became effective for all financial assets and financial liabilities as of October 1, 2008, and, upon adoption, ASC 820-10 did not have a material impact on our financial statements. In February of 2008, the FASB issued ASC 820-10-15-1A, “Fair Value Measurements and Disclosures — Transition and Open Effective Date Information,” which delays the effective date of ASC 820-10 for all non-financial assets and non-financial liabilities, except for items that are recognized or disclosed at fair value in the financial statements on a recurring basis (at least annually). We do not expect the adoption of ASC 820-10-15-1A to have a material impact on our financial statements.
In February of 2007, the FASB issued ASC 825-10, “Financial Instruments.” ASC 825-10 provides companies with an option to report selected financial assets and liabilities at fair value. As of December 31, 2009, we have not elected the fair value option for any additional financial assets and liabilities beyond those already prescribed by accounting principles generally accepted in the United States.
In December of 2007, the FASB issued a new accounting standard relating to business combinations under ASC 805-10 “Business Combinations.” The new standard expands the definition of a business and a business combination; requires recognition of assets acquired, liabilities assumed, and contingent consideration at their fair value on the acquisition date with subsequent changes recognized in earnings; requires acquisition-related expenses and restructuring costs to be recognized separately from the business combination and expensed as incurred; and requires that changes in accounting for deferred tax asset valuation allowances and acquired income tax uncertainties after the measurement period be recognized as a component of provision for taxes. The new standard also establishes disclosure requirements to enable the evaluation of the nature and financial effects of the business combination. We adopted the provisions of ASC 805-10 for the quarter ended December 31, 2009. The adoption of ASC 805-10 did not have a material impact on our consolidated financial statements.
In April of 2009, the FASB issued ASC 825-10-65-1, “Financial Instruments — Transition and Open Effective Date Information.” ASC 825-10-65-1 requires fair value disclosures in both interim and annual financial statements in order to provide more timely information about the effects of current market conditions on financial instruments. ASC 825-10-65-1 became effective June 15, 2009. The adoption of this standard did not have a material impact on our financial statements.
In June of 2009, the FASB issued ASC 105-10, “Generally Accepted Accounting Principles.” ASC 105-10 provides for the FASB Accounting Standards Codification (the “Codification”) to become the single official source of authoritative, nongovernmental U.S. generally accepted accounting principles. The Codification did not change GAAP but reorganizes the literature. ASC 105-10 became effective for us for the year ended December 31, 2009. The adoption of this standard did not have an impact on our financial statements.
Effect of Inflation
We do not believe that inflation has had a material effect on our business, results of operations, or financial condition during the past three years.
Information Regarding Forward-Looking Statements
This Form 10-K includes “forward-looking statements” as defined in Section 27A of the Securities Act of 1933, as amended (the “Securities Act”), and Section 21E of the Securities Exchange Act of 1934, as amended (the “Exchange Act”), which reflect our view with respect to future events. We base these forward-looking statements on our current expectations and projections about future events. These forward looking statements are subject to risks, uncertainties, and assumptions about the Company, including:
· dependence upon energy industry spending for seismic data acquisition services;
· the unpredictable nature of forecasting weather;
· the potential for contract delay or cancellation;
· the potential for fluctuations in oil and natural gas prices; and
· the availability of capital resources.
We use the words “may,” “will,” “can,” “could,” “should,” “expect,” “anticipate,” “estimate,” “believe,” “target,” “continue,” “intend,” “plan,” “budget,” and other similar words to identify forward-looking statements. You should read statements that contain these words carefully because they discuss future expectations, contain projections of results of operations or of our financial condition, and/or state other “forward-looking” information. We do not undertake any obligation to update or revise publicly any forward-looking statements, except as required by law. These statements also involve risks and uncertainties that could cause our actual results or financial condition to differ materially from our expectations in this Form 10-K.
We believe that it is important to communicate our expectations of future performance to our investors. However, events may occur in the future that we are unable to accurately predict or over which we have no control. When considering our forward-looking statements, you should keep in mind the risk factors and other cautionary statements contained in this Form 10-K and other factors noted throughout this Form 10-K. There are many risks, uncertainties, and events that may cause our actual results to differ materially from those contained in any forward-looking statement. Please read the section entitled “Risk Factors” for a discussion of certain risks of our business and an investment in our common stock.
ITEM 7A. QUANTITATIVE AND QUALITATIVE DISCLOSURES ABOUT MARKET RISK
We have not entered into any hedging agreements or swap agreements. Our principal market risk is the risk related to the concentration of our customers in the oil and natural gas industry. Since our customers are involved in the oil and natural gas industry, there may be a positive or a negative effect on our exposure to credit risk in that our customers may be similarly affected by changes in economic and industry conditions. For the year ended December 31, 2009, our top customer accounted for approximately 30.8% of our revenues. For the year ended December 31, 2008, our top two customers accounted for approximately 14.4% and 12.3% of our revenues. For the year ended December 31, 2007, our top customer accounted for approximately 12.1% of our revenues. During the fourth quarter we began to conduct business in Canada which subjects us to a foreign currency exchange rate risk. Our results of operations and our cash flows could be impacted by changes in foreign currency exchange rates.
For further information see “Item 7. Management’s Discussion and Analysis of Financial Condition and Results of Operations,” and “Item 1A. Risk Factors.”
ITEM 8. FINANCIAL STATEMENTS AND SUPPLEMENTARY DATA.
Consolidated Financial Statements
December 31, 2009, 2008, and 2007
CONTENTS
|
25 |
|
|
|
|
|
|
|
|
|
|
|
26 |
|
|
|
|
|
28 |
|
|
|
|
|
29 |
|
|
|
|
|
30 |
|
|
|
|
|
32 |
Report of Independent Registered Public Accounting Firm
Board of Directors and Shareholders
TGC Industries, Inc. and Subsidiary
We have audited the accompanying consolidated balance sheets of TGC Industries, Inc. and Subsidiary (“the Company”) as of December 31, 2009 and 2008, and the related consolidated statements of income, shareholders’ equity, and cash flows for each of the three years in the period ended December 31, 2009. We also have audited the Company’s internal control over financial reporting as of December 31, 2009, based on criteria established in Internal Control—Integrated Framework issued by the Committee of Sponsoring Organizations of the Treadway Commission (COSO). The Company’s management is responsible for these consolidated financial statements, for maintaining effective internal control over financial reporting, and for its assessment of the effectiveness of internal control over financial reporting, included in the accompanying Management’s Report on Internal Control over Financial Reporting. Our responsibility is to express an opinion on these consolidated financial statements and an opinion on the Company’s internal control over financial reporting based on our audits.
We conducted our audits in accordance with the standards of the Public Company Accounting Oversight Board (United States). Those standards require that we plan and perform the audits to obtain reasonable assurance about whether the consolidated financial statements are free of material misstatement and whether effective internal control over financial reporting was maintained in all material respects. Our audits of the consolidated financial statements included examining, on a test basis, evidence supporting the amounts and disclosures in the consolidated financial statements, assessing the accounting principles used and significant estimates made by management, and evaluating the overall financial statement presentation. Our audit of internal control over financial reporting included obtaining an understanding of internal control over financial reporting, assessing the risk that a material weakness exists, and testing and evaluating the design and operating effectiveness of internal control based on the assessed risk. Our audits also included performing such other procedures as we considered necessary in the circumstances. We believe that our audits provide a reasonable basis for our opinions.
A Company’s internal control over financial reporting is a process designed to provide reasonable assurance regarding the reliability of financial reporting and the preparation of consolidated financial statements for external purposes in accordance with generally accepted accounting principles. A Company’s internal control over financial reporting includes those policies and procedures that (1) pertain to the maintenance of records that, in reasonable detail, accurately and fairly reflect the transactions and dispositions of the assets of the Company; (2) provide reasonable assurance that transactions are recorded as necessary to permit preparation of consolidated financial statements in accordance with generally accepted accounting principles, and that receipts and expenditures of the Company are being made only in accordance with authorizations of management and directors of the Company; and (3) provide reasonable assurance regarding prevention or timely detection of unauthorized acquisition, use, or disposition of the Company’s assets that could have a material effect on the consolidated financial statements.
Because of its inherent limitations, internal control over financial reporting may not prevent or detect misstatements. Also, projections of any evaluation of effectiveness to future periods are subject to the risk that controls may become inadequate because of changes in conditions, or that the degree of compliance with the policies or procedures may deteriorate.
In our opinion, the consolidated financial statements referred to above present fairly, in all material respects, the financial position of TGC Industries, Inc. and Subsidiary as of December 31, 2009 and 2008, and the results of its operations and its cash flows for each of the years in the three year period ended December 31, 2009 in conformity with accounting principles generally accepted in the United States of America. Also in our opinion, the Company maintained, in all material respects, effective internal control over financial reporting as of December 31, 2009, based on criteria established in Internal Control—Integrated Framework issued by the COSO.
Dallas, Texas
March 16, 2010
TGC Industries, Inc.
December 31,
|
|
|
2009 |
|
2008 |
|
||
|
ASSETS |
|
|
|
|
|
||
|
|
|
|
|
|
|
||
|
CURRENT ASSETS |
|
|
|
|
|
||
|
|
|
|
|
|
|
||
|
Cash and cash equivalents |
|
$ |
25,504,149 |
|
$ |
24,114,351 |
|
|
Trade accounts receivable, net of allowance for doubtful accounts of $623,109 in 2009 and $-0- in 2008 |
|
9,455,224 |
|
5,853,908 |
|
||
|
Cost and estimated earnings in excess of billings on uncompleted contracts |
|
474,059 |
|
2,300,985 |
|
||
|
Prepaid expenses and other |
|
648,872 |
|
718,301 |
|
||
|
Prepaid federal and state income tax |
|
943,600 |
|
1,220,154 |
|
||
|
|
|
|
|
|
|
||
|
Total current assets |
|
37,025,904 |
|
34,207,699 |
|
||
|
|
|
|
|
|
|
||
|
PROPERTY AND EQUIPMENT - at cost |
|
|
|
|
|
||
|
|
|
|
|
|
|
||
|
Machinery and equipment |
|
100,687,976 |
|
91,233,877 |
|
||
|
Automobiles and trucks |
|
8,914,434 |
|
8,792,645 |
|
||
|
Furniture and fixtures |
|
397,879 |
|
348,103 |
|
||
|
Leasehold improvements |
|
14,994 |
|
14,994 |
|
||
|
|
|
110,015,283 |
|
100,389,619 |
|
||
|
|
|
|
|
|
|
||
|
Less accumulated depreciation and amortization |
|
(62,431,950 |
) |
(49,757,056 |
) |
||
|
|
|
47,583,333 |
|
50,632,563 |
|
||
|
OTHER ASSETS |
|
|
|
|
|
||
|
Goodwill |
|
1,408,089 |
|
201,530 |
|
||
|
Other assets |
|
32,399 |
|
49,129 |
|
||
|
|
|
1,440,488 |
|
250,659 |
|
||
|
|
|
|
|
|
|
||
|
Total assets |
|
$ |
86,049,725 |
|
$ |
85,090,921 |
|
The accompanying notes are an integral part of these consolidated financial statements
TGC Industries, Inc.
CONSOLIDATED BALANCE SHEETS — Continued
December 31,
|
|
|
2009 |
|
2008 |
|
||
|
LIABILITIES AND SHAREHOLDERS’ EQUITY |
|
|
|
|
|
||
|
|
|
|
|
|
|
||
|
CURRENT LIABILITIES |
|
|
|
|
|
||
|
|
|
|
|
|
|
||
|
Trade accounts payable |
|
$ |
4,126,474 |
|
$ |
4,569,911 |
|
|
Accrued liabilities |
|
1,337,437 |
|
863,756 |
|
||
|
Billings in excess of costs and estimated earnings on uncompleted contracts |
|
7,077,941 |
|
5,776,444 |
|
||
|
Current maturities of notes payable |
|
6,407,892 |
|
5,171,872 |
|
||
|
Current portion of capital lease obligations |
|
780,526 |
|
856,673 |
|
||
|
|
|
|
|
|
|
||
|
Total current liabilities |
|
19,730,270 |
|
17,238,656 |
|
||
|
|
|
|
|
|
|
||
|
NOTES PAYABLE, less current maturities |
|
5,875,390 |
|
10,851,621 |
|
||
|
|
|
|
|
|
|
||
|
CAPITAL LEASE OBLIGATIONS, less current portion |
|
631,757 |
|
600,214 |
|
||
|
|
|
|
|
|
|
||
|
DEFERRED TAX LIABILITY |
|
7,117,030 |
|
5,973,000 |
|
||
|
|
|
|
|
|
|
||
|
COMMITMENTS AND CONTINGENCIES |
|
— |
|
— |
|
||
|
|
|
|
|
|
|
||
|
SHAREHOLDERS’ EQUITY |
|
|
|
|
|
||
|
|
|
|
|
|
|
||
|
Preferred stock, $1.00 par value; 4,000,000 shares authorized; issued - none |
|
— |
|
— |
|
||
|
|
|
|
|
|
|
||
|
Common stock, $.01 par value; 25,000,000 shares authorized; 18,323,091 and 17,435,319 in each period |
|
183,231 |
|
174,353 |
|
||
|
|
|
|
|
|
|
||
|
Additional paid-in capital |
|
27,014,078 |
|
26,501,011 |
|
||
|
|
|
|
|
|
|
||
|
Retained earnings |
|
25,889,008 |
|
24,009,389 |
|
||
|
|
|
|
|
|
|
||
|
Treasury stock, at cost, 37,803 shares |
|
(257,323 |
) |
(257,323 |
) |
||
|
|
|
|
|
|
|
||
|
Accumulated other comprehensive (loss) |
|
(133,716 |
) |
— |
|
||
|
|
|
|
|
|
|
||
|
|
|
52,695,278 |
|
50,427,430 |
|
||
|
|
|
|
|
|
|
||
|
Total liabilities and shareholders’ equity |
|
$ |
86,049,725 |
|
$ |
85,090,921 |
|
The accompanying notes are an integral part of these consolidated financial statements
TGC Industries, Inc.
CONSOLIDATED STATEMENTS OF EARNINGS
Years Ended December 31,
|
|
|
2009 |
|
2008 |
|
2007 |
|
|||
|
|
|
|
|
|
|
|
|
|||
|
Revenue |
|
$ |
90,431,899 |
|
$ |
86,769,742 |
|
$ |
90,395,872 |
|
|
|
|
|
|
|
|
|
|
|||
|
Cost and expenses |
|
|
|
|
|
|
|
|||
|
Cost of services |
|
65,379,612 |
|
55,935,068 |
|
60,445,783 |
|
|||
|
Selling, general and administrative |
|
5,522,939 |
|
4,468,883 |
|
3,864,810 |
|
|||
|
Depreciation and amortization expense |
|
14,621,237 |
|
13,911,124 |
|
12,743,065 |
|
|||
|
|
|
85,523,788 |
|
74,315,075 |
|
77,053,658 |
|
|||
|
|
|
|
|
|
|
|
|
|||
|
Income from operations |
|
4,908,111 |
|
12,454,667 |
|
13,342,214 |
|
|||
|
|
|
|
|
|
|
|
|
|||
|
Interest expense |
|
1,020,681 |
|
929,656 |
|
604,616 |
|
|||
|
|
|
|
|
|
|
|
|
|||
|
Income before income tax expense |
|
3,887,430 |
|
11,525,011 |
|
12,737,598 |
|
|||
|
|
|
|
|
|
|
|
|
|||
|
Income tax expense: |
|
|
|
|
|
|
|
|||
|
Current |
|
1,289,938 |
|
609,569 |
|
4,108,196 |
|
|||
|
Deferred |
|
717,873 |
|
4,017,000 |
|
1,021,969 |
|
|||
|
Income tax expense |
|
2,007,811 |
|
4,626,569 |
|
5,130,165 |
|
|||
|
|
|
|
|
|
|
|
|
|||
|
NET INCOME |
|
$ |
1,879,619 |
|
$ |
6,898,442 |
|
$ |
7,607,433 |
|
|
|
|
|
|
|
|
|
|
|||
|
Earnings per common share: |
|
|
|
|
|
|
|
|||
|
Basic |
|
$ |
0.10 |
|
$ |
0.38 |
|
$ |
0.42 |
|
|
Diluted |
|
$ |
0.10 |
|
$ |
0.38 |
|
$ |
0.42 |
|
|
|
|
|
|
|
|
|
|
|||
|
Weighted average number of Shares outstanding: |
|
|
|
|
|
|
|
|||
|
Basic |
|
18,280,318 |
|
18,260,110 |
|
18,236,718 |
|
|||
|
Diluted |
|
18,344,041 |
|
18,337,184 |
|
18,325,421 |
|
|||
The accompanying notes are an integral part of these consolidated financial statements
TGC Industries, Inc.
CONSOLIDATED STATEMENTS OF SHAREHOLDERS’ EQUITY
|
|
|
|
|
|
|
|
|
|
|
|
|
Accumulated |
|
|
|
||||||
|
|
|
|
|
|
|
Additional |
|
|
|
|
|
Other |
|
|
|
||||||
|
|
|
Common stock |
|
Paid-in |
|
Retained |
|
Treasury |
|
Comprehensive |
|
|
|
||||||||
|
|
|
Shares |
|
Amount |
|
Capital |
|
Earnings |
|
Stock |
|
Income (Loss) |
|
Total |
|
||||||
|
|
|
|
|
|
|
|
|
|
|
|
|
|
|
|
|
||||||
|
Balances at January 1, 2007 |
|
15,753,396 |
|
$ |
157,535 |
|
$ |
25,639,432 |
|
$ |
9,503,514 |
|
$ |
(257,323 |
) |
$ |
— |
|
$ |
35,043,158 |
|
|
|
|
|
|
|
|
|
|
|
|
|
|
|
|
|
|
||||||
|
5% common stock dividend |
|
787,387 |
|
7,873 |
|
(8,799 |
) |
— |
|
— |
|
— |
|
(926 |
) |
||||||
|
|
|
|
|
|
|
|
|
|
|
|
|
|
|
|
|
||||||
|
Options issued to outside Directors |
|
— |
|
— |
|
75,000 |
|
— |
|
— |
|
— |
|
75,000 |
|
||||||
|
|
|
|
|
|
|
|
|
|
|
|
|
|
|
|
|
||||||
|
Issuance of restricted common stock |
|
18,000 |
|
180 |
|
(180 |
) |
— |
|
— |
|
— |
|
— |
|
||||||
|
|
|
|
|
|
|
|
|
|
|
|
|
|
|
|
|
||||||
|
Repurchase of stock warrants |
|
— |
|
— |
|
(262,571 |
) |
— |
|
— |
|
— |
|
(262,571 |
) |
||||||
|
|
|
|
|
|
|
|
|
|
|
|
|
|
|
|
|
||||||
|
Cancellation of restricted stock |
|
(4,221 |
) |
(42 |
) |
42 |
|
— |
|
— |
|
— |
|
— |
|
||||||
|
|
|
|
|
|
|
|
|
|
|
|
|
|
|
|
|
||||||
|
Amortization of unearned compensation restricted stock awards |
|
— |
|
— |
|
380,261 |
|
— |
|
— |
|
— |
|
380,261 |
|
||||||
|
|
|
|
|
|
|
|
|
|
|
|
|
|
|
|
|
||||||
|
Amortization of compensation cost of unvested stock options |
|
— |
|
— |
|
49,854 |
|
— |
|
— |
|
— |
|
49,854 |
|
||||||
|
|
|
|
|
|
|
|
|
|
|
|
|
|
|
|
|
||||||
|
Exercise of stock options |
|
39,015 |
|
390 |
|
28,943 |
|
— |
|
— |
|
— |
|
29,333 |
|
||||||
|
|
|
|
|
|
|
|
|
|
|
|
|
|
|
|
|
||||||
|
Shares issued |
|
1,470 |
|
14 |
|
(14 |
) |
— |
|
— |
|
— |
|
— |
|
||||||
|
|
|
|
|
|
|
|
|
|
|
|
|
|
|
|
|
||||||
|
Net income |
|
— |
|
— |
|
— |
|
7,607,433 |
|
— |
|
— |
|
7,607,433 |
|
||||||
|
Balances at December 31, 2007 |
|
16,595,047 |
|
165,950 |
|
25,901,968 |
|
17,110,947 |
|
(257,323 |
) |
— |
|
42,921,542 |
|
||||||
|
|
|
|
|
|
|
|
|
|
|
|
|
|
|
|
|
||||||
|
5% common stock dividend |
|
827,751 |
|
8,278 |
|
(9,104 |
) |
— |
|
— |
|
— |
|
(826 |
) |
||||||
|
|
|
|
|
|
|
|
|
|
|
|
|
|
|
|
|
||||||
|
Options issued to outside Directors |
|
— |
|
— |
|
150,000 |
|
— |
|
— |
|
— |
|
150,000 |
|
||||||
|
|
|
|
|
|
|
|
|
|
|
|
|
|
|
|
|
||||||
|
Issuance of restricted common stock |
|
10,000 |
|
100 |
|
(100 |
) |
— |
|
— |
|
— |
|
— |
|
||||||
|
|
|
|
|
|
|
|
|
|
|
|
|
|
|
|
|
||||||
|
Cancellation of restricted stock |
|
(2,110 |
) |
(21 |
) |
21 |
|
— |
|
— |
|
— |
|
— |
|
||||||
|
|
|
|
|
|
|
|
|
|
|
|
|
|
|
|
|
||||||
|
Amortization of unearned compensation restricted stock awards |
|
— |
|
— |
|
411,113 |
|
— |
|
— |
|
— |
|
411,113 |
|
||||||
|
|
|
|
|
|
|
|
|
|
|
|
|
|
|
|
|
||||||
|
Amortization of compensation cost of unvested stock options |
|
— |
|
— |
|
43,959 |
|
— |
|
— |
|
— |
|
43,959 |
|
||||||
|
|
|
|
|
|
|
|
|
|
|
|
|
|
|
|
|
||||||
|
Exercise of stock options |
|
4,631 |
|
46 |
|
3,154 |
|
— |
|
— |
|
— |
|
3,200 |
|
||||||
|
|
|
|
|
|
|
|
|
|
|
|
|
|
|
|
|
||||||
|
Net income |
|
— |
|
— |
|
— |
|
6,898,442 |
|
— |
|
— |
|
6,898,442 |
|
||||||
|
Balances at December 31, 2008 |
|
17,435,319 |
|
174,353 |
|
26,501,011 |
|
24,009,389 |
|
(257,323 |
) |
— |
|
50,427,430 |
|
||||||
|
|
|
|
|
|
|
|
|
|
|
|
|
|
|
|
|
||||||
|
5% common stock dividend |
|
870,379 |
|
8,704 |
|
(9,089 |
) |
— |
|
— |
|
— |
|
(385 |
) |
||||||
|
|
|
|
|
|
|
|
|
|
|
|
|
|
|
|
|
||||||
|
Options issued to outside Directors |
|
— |
|
— |
|
150,000 |
|
— |
|
— |
|
— |
|
150,000 |
|
||||||
|
|
|
|
|
|
|
|
|
|
|
|
|
|
|
|
|
||||||
|
Issuance of restricted common stock |
|
5,000 |
|
50 |
|
(50 |
) |
— |
|
— |
|
— |
|
— |
|
||||||
|
|
|
|
|
|
|
|
|
|
|
|
|
|
|
|
|
||||||
|
Cancellation of restricted stock |
|
(1,499 |
) |
(15 |
) |
15 |
|
— |
|
— |
|
— |
|
— |
|
||||||
|
|
|
|
|
|
|
|
|
|
|
|
|
|
|
|
|
||||||
|
Exercise of stock options |
|
13,892 |
|
139 |
|
9,461 |
|
— |
|
— |
|
— |
|
9,600 |
|
||||||
|
|
|
|
|
|
|
|
|
|
|
|
|
|
|
|
|
||||||
|
Amortization of unearned compensation restricted stock awards |
|
— |
|
— |
|
182,812 |
|
— |
|
— |
|
— |
|
182,812 |
|
||||||
|
|
|
|
|
|
|
|
|
|
|
|
|
|
|
|
|
||||||
|
Amortization of compensation cost of unvested stock options |
|
— |
|
— |
|
179,918 |
|
— |
|
— |
|
— |
|
179,918 |
|
||||||
|
|
|
|
|
|
|
|
|
|
|
|
|
|
|
|
|
||||||
|
Foreign currency translation adjustments |
|
— |
|
— |
|
— |
|
— |
|
— |
|
(133,716 |
) |
(133,716 |
) |
||||||
|
|
|
|
|
|
|
|
|
|
|
|
|
|
|
|
|
||||||
|
Net income |
|
— |
|
— |
|
— |
|
1,879,619 |
|
— |
|
— |
|
1,879,619 |
|
||||||
|
|
|
18,323,091 |
|
$ |
183,231 |
|
$ |
27,014,078 |
|
$ |
25,889,008 |
|
$ |
(257,323 |
) |
$ |
(133,716 |
) |
$ |
52,695,278 |
|
The accompanying notes are an integral part of these consolidated financial statements
TGC Industries, Inc.
CONSOLIDATED STATEMENTS OF CASH FLOWS
Years Ended December 31,
|
|
|
2009 |
|
2008 |
|
2007 |
|
|||
|
Cash flows from operating activities |
|
|
|
|
|
|
|
|||
|
Net income |
|
$ |
1,879,619 |
|
$ |
6,898,442 |
|
$ |
7,607,433 |
|
|
Adjustments to reconcile net income to net cash provided by operating activities: |
|
|
|
|
|
|
|
|||
|
Depreciation and amortization |
|
14,621,237 |
|
13,911,124 |
|
12,743,065 |
|
|||
|
Gain on disposal of property and equipment |
|
(221,156 |
) |
(170,831 |
) |
(132,790 |
) |
|||
|
Non-cash compensation |
|
512,730 |
|
605,072 |
|
505,115 |
|
|||
|
Deferred income taxes |
|
717,873 |
|
4,017,000 |
|
1,021,969 |
|
|||
|
Changes in operating assets and liabilities |
|
|
|
|
|
|
|
|||
|
Trade accounts receivable |
|
(2,352,493 |
) |
6,299,590 |
|
(4,704,896 |
) |
|||
|
Cost and estimated earnings in excess of billings on uncompleted contracts |
|
1,875,709 |
|
(1,765,842 |
) |
454,308 |
|
|||
|
Prepaid expenses and other |
|
2,187,472 |
|
1,994,248 |
|
1,908,209 |
|
|||
|
Prepaid federal and state income tax |
|
1,044,631 |
|
(1,118,783 |
) |
83,287 |
|
|||
|
Other assets |
|
16,730 |
|
(24,487 |
) |
(3,825 |
) |
|||
|
Trade accounts payable |
|
(1,115,265 |
) |
1,638,647 |
|
(2,020,721 |
) |
|||
|
Accrued liabilities |
|
230,476 |
|
(860,322 |
) |
613,055 |
|
|||
|
Billings in excess of cost and estimated earnings on uncompleted contracts |
|
1,300,559 |
|
2,436,224 |
|
(2,819,294 |
) |
|||
|
Income taxes payable |
|
— |
|
— |
|
(415,501 |
) |
|||
|
|
|
|
|
|
|
|
|
|||
|
Net cash provided by operating activities |
|
20,698,122 |
|
33,860,082 |
|
14,839,414 |
|
|||
|
|
|
|
|
|
|
|
|
|||
|
Cash flows from investing activities |
|
|
|
|
|
|
|
|||
|
Capital expenditures |
|
(1,349,972 |
) |
(6,322,048 |
) |
(13,008,088 |
) |
|||
|
Purchase of stock of Eagle Canada, Inc. |
|
(10,345,000 |
) |
— |
|
— |
|
|||
|
Net cash inflow on acquisition of subsidiary |
|
370,822 |
|
— |
|
— |
|
|||
|
Proceeds from sale of property and equipment |
|
381,986 |
|
243,512 |
|
346,385 |
|
|||
|
|
|
|
|
|
|
|
|
|||
|
Net cash used in investing activities |
|
(10,942,164 |
) |
(6,078,536 |
) |
(12,661,703 |
) |
|||
|
|
|
|
|
|
|
|
|
|||
|
Cash flows from financing activities |
|
|
|
|
|
|
|
|||
|
Principal payments on notes payable |
|
(7,296,477 |
) |
(6,793,635 |
) |
(5,516,361 |
) |
|||
|
Principal payments on capital lease obligations |
|
(1,080,217 |
) |
(1,379,759 |
) |
(1,312,129 |
) |
|||
|
Proceeds from exercise of stock options |
|
9,600 |
|
3,200 |
|
29,333 |
|
|||
|
Redemption of stock purchase warrants |
|
— |
|
— |
|
(262,571 |
) |
|||
|
Payment of dividends |
|
(385 |
) |
(827 |
) |
(926 |
) |
|||
|
|
|
|
|
|
|
|
|
|||
|
Net cash used in financing activities |
|
(8,367,479 |
) |
(8,171,021 |
) |
(7,062,654 |
) |
|||
|
|
|
|
|
|
|
|
|
|||
|
Net increase (decrease) in cash and cash equivalents |
|
1,388,479 |
|
19,610,525 |
|
(4,884,943 |
) |
|||
|
|
|
|
|
|
|
|
|
|||
|
Effect of exchange rates on cash |
|
1,319 |
|
— |
|
— |
|
|||
|
|
|
|
|
|
|
|
|
|||
|
Cash and cash equivalents at beginning of year |
|
24,114,351 |
|
4,503,826 |
|
9,388,769 |
|
|||
|
|
|
|
|
|
|
|
|
|||
|
Cash and cash equivalents at end of year |
|
$ |
25,504,149 |
|
$ |
24,114,351 |
|
$ |
4,503,826 |
|
TGC Industries, Inc.
CONSOLIDATED STATEMENTS OF CASH FLOWS - CONTINUED
Years Ended December 31,
|
|
|
2009 |
|
2008 |
|
2007 |
|
|||
|
Supplemental cash flow information |
|
|
|
|
|
|
|
|||
|
Interest paid |
|
$ |
1,020,681 |
|
$ |
893,536 |
|
$ |
603,813 |
|
|
Income taxes paid |
|
$ |
1,722,914 |
|
$ |
1,692,057 |
|
$ |
4,448,135 |
|
|
|
|
|
|
|
|
|
|
|||
|
Noncash investing and financing activities |
|
|
|
|
|
|
|
|||
|
Capital lease obligations incurred |
|
$ |
609,734 |
|
$ |
938,835 |
|
$ |
1,110,057 |
|
|
Financed equipment purchase |
|
$ |
— |
|
$ |
14,425,099 |
|
$ |
4,120,254 |
|
|
Financed insurance premiums |
|
$ |
2,087,288 |
|
$ |
1,999,935 |
|
$ |
2,111,898 |
|
|
Restricted stock awards to employees net of cancellations |
|
$ |
24,350 |
|
$ |
67,258 |
|
$ |
159,243 |
|
|
|
|
|
|
|
|
|
|
|||
|
Cash used in the purchase of Eagle Canada consisted of the following: |
|
|
|
|
|
|
|
|||
|
|
|
|
|
|
|
|
|
|||
|
Cash and cash equivalents |
|
$ |
(370,822 |
) |
$ |
— |
|
$ |
— |
|
|
Trade accounts receivable |
|
(1,245,336 |
) |
— |
|
— |
|
|||
|
Other current assets |
|
(861,911 |
) |
— |
|
— |
|
|||
|
Deferred tax asset |
|
(1,097,088 |
) |
— |
|
— |
|
|||
|
Fixed assets |
|
(9,940,118 |
) |
— |
|
— |
|
|||
|
Goodwill |
|
(1,226,992 |
) |
— |
|
— |
|
|||
|
Current liabilities |
|
918,390 |
|
— |
|
— |
|
|||
|
Notes payable |
|
1,496,494 |
|
— |
|
— |
|
|||
|
Capital lease obligations |
|
433,517 |
|
— |
|
— |
|
|||
|
Long-term deferred tax liability |
|
1,548,866 |
|
— |
|
— |
|
|||
|
|
|
|
|
|
|
|
|
|||
|
Purchase of stock of Eagle Canada, Inc. |
|
$ |
(10,345,000 |
) |
$ |
— |
|
$ |
— |
|
The accompanying notes are an integral part of these consolidated financial statements
TGC Industries, Inc.
NOTES TO CONSOLIDATED FINANCIAL STATEMENTS
December 31, 2009, 2008, and 2007
NOTE A - NATURE OF OPERATIONS
TGC Industries, Inc. (TGC or the Company) is engaged in the geophysical services business and primarily conducts seismic surveys and sells gravity data to companies engaged in exploration in the oil and gas industry in the U.S. and Canada.
Management has evaluated subsequent events through March 16, 2010, which is the date of the consolidated financial statements were available to be issued.
NOTE B - SUMMARY OF SIGNIFICANT ACCOUNTING POLICIES
Principles of Consolidation
The Consolidated Financial Statements include the accounts of TGC Industries, Inc. and its wholly-owned subsidiary, Eagle Canada, Inc. We have eliminated all significant intercompany accounts and transactions.
Business Combinations
We record acquisitions using the purchase method of accounting and, accordingly, have included the results of operations of acquired businesses in our consolidated results from the date of each acquisition. We allocate the purchase price of our acquisitions to the tangible assets, liabilities, and intangible assets acquired based on their estimated fair values. The excess purchase price over those fair values is recorded as goodwill. The fair value assigned to assets acquired is based on valuations provided by independent consultants and using management’s estimates and assumptions.
Foreign Currency
The functional currency of the Company’s international subsidiary is the local currency. Local currency assets and liabilities are translated at the rates of exchange on the balance sheet date, and local currency revenues and expenses are translated at average rates of exchange during the period. The resulting translation adjustments are recorded directly into a separate component of stockholders’ equity and represents the only component of accumulated other comprehensive income.
Cash Equivalents
The Company considers all highly liquid investments with original maturity dates of three months or less to be cash equivalents. The Company maintains its accounts at financial institutions located in Texas and Alberta, Canada. The Texas bank accounts are insured by the Federal Deposit Insurance Corporation up to $250,000. The Alberta bank accounts are insured by the Canadian Depository Insurance Corporation up to $100,000 Canadian dollars.
Trade Accounts Receivable
Trade accounts receivable are recorded in accordance with terms and amounts as specified in the related contracts on an ongoing basis. The Company evaluates the collectibility of accounts receivable on a specific account basis using a combination of factors including the age of the outstanding balances, evaluation of the customer’s financial condition, and discussions with relevant Company personnel and with the customers directly. An allowance for doubtful accounts or direct write-off is recorded when it is determined that the receivable may not be collected, depending on the facts known and the probability of collection of the outstanding amount.
TGC Industries, Inc.
NOTES TO CONSOLIDATED FINANCIAL STATEMENTS
December 31, 2009, 2008, and 2007
NOTE B - SUMMARY OF SIGNIFICANT ACCOUNTING POLICIES - CONTINUED
Property and Equipment
Property and equipment are stated at cost. Depreciation and amortization are provided using the straight-line method over the estimated useful lives of the individual assets ranging from 1 to 7 years. The depreciation expense on assets acquired under capital leases is included with depreciation expense on owned assets. Expenditures for major renewals and betterments that extend the useful lives of property and equipment are capitalized. Expenditures for maintenance and repairs are charged to expense as incurred.
Long-Lived Assets
Long-lived assets held and used by the Company are reviewed for impairment whenever events or changes in circumstances indicate that the carrying amount of an asset may not be recoverable. For the purposes of evaluating the recoverability of long-lived assets, the recoverability test is performed using undiscounted cash flows estimated to be generated by those assets. No impairment charge was necessary at December 31, 2009, 2008, and 2007.
Income Taxes
The Company utilizes the liability method of accounting for income taxes. Under the liability method, deferred income tax assets and liabilities are provided based on the difference between the financial statement and tax bases of assets and liabilities measured by the currently enacted tax rates in effect for the years in which these differences are expected to reverse. Deferred tax expense or benefit is the result of changes in deferred tax assets and liabilities. An allowance against deferred tax assets is recorded in whole or in part when it is more likely than not that such tax benefits will not be realized.
Effective January 1, 2007, the Company adopted certain amendments of Topic No. 740 (“Topic 740”) which clarifies the accounting for income tax positions. Topic 740 prescribes a recognition threshold and measurement attribute for the financial statement recognition and measurement of a tax position taken or expected to be taken in a tax return. Under Topic 740, the Company recognizes in its financial statements the impact of a tax position if that position is “more likely than not” to be sustained on audit based on the technical merits of the position. Topic 740 also provides guidance on derecognition, classification, interest and penalties, accounting in interim periods, and disclosure. Interest and penalties related to unrecognized tax benefits are recorded as income tax expense. See Note I for further information.
Revenue Recognition
Seismic Surveys
The Company provides seismic data acquisition survey services to its customers under general service agreements which define certain obligations for the Company and for its customers. A supplemental agreement setting forth the terms of a specific project, which may be cancelled by either party upon 30 days advance written notice, is entered into for every project. These supplemental agreements are either “turnkey” agreements providing for a fixed fee to be paid for each unit of seismic data acquired or “term” agreements providing for a fixed hourly, daily, or monthly fee during the term of the project. The duration of these projects will vary from a few days to several months. The Company recognizes revenue when services are performed under both types of agreements. Services are defined as the commencement of data acquisition. Under turnkey agreements, the total number of units of seismic data to be gathered is set forth in the agreement and revenue is recognized as services are performed on a per unit of seismic data acquired rate. Under term agreements, revenue is recognized as services are performed based on the time worked rate provided in the term agreement. Under both turnkey and term agreements, cost of earned revenue is recognized by multiplying total estimated agreement cost by the percentage-of-completion of the agreement. The excess of that amount over the cost of earned revenue reported in prior periods is recognized as cost of earned revenue for the period. Agreements are not segmented nor combined for purposes of calculating percentage of
TGC Industries, Inc.
NOTES TO CONSOLIDATED FINANCIAL STATEMENTS
December 31, 2009, 2008, and 2007
NOTE B - SUMMARY OF SIGNIFICANT ACCOUNTING POLICIES — CONTINUED
completion. The asset “Costs and estimated earnings in excess of billings on uncompleted contracts” represents cost incurred on turnkey agreements in excess of billings on those agreements. The liability “Billings in excess of costs and estimated earnings on uncompleted contracts” represents billings on turnkey agreements in excess of cost on those agreements. Claims have been negligible in the years ended December 31, 2009, 2008, and 2007.
Gravity Data
The Company owns a data bank which contains gravity data, and to a lesser extent magnetic data, from many of the major oil and natural gas producing areas located within the U.S. When an order for gravity data is received, the portion of gravity data requested by the customer is prepared in digital format for licensing and shipment to the customer. This process is performed by an employee in the Company’s headquarters office and normally takes no longer than a few days. The licensing of gravity data is not a material part of the Company’s revenue. Gravity data revenue during the years ended December 31, 2009, 2008, and 2007 was approximately $20,300, $46,100, and $187,300, respectively.
Reclassifications
Certain reclassifications have been made to the 2008 financial statements to conform to the 2009 presentation.
Stock-Based Compensation
The Company has two stock-based compensation plans, which are described more fully in Note H. The Company recognizes the fair value of the stock-based compensation awards as wages in the Statements of Earnings on a straight-line basis over the vesting period. As a result, during the years ended December 31, 2009, 2008, and 2007, the Company recognized compensation expense for unvested stock options of $179,918 $43,959, and $49,854, respectively, and restricted stock of $182,812 $411,113, and $380,261, respectively.
For the year ended December 31, 2009, the fair value of each option grant was estimated on the date of the grant using the Binomial Lattice option pricing model with the following assumptions used for the outstanding grants: risk-free interest rate of 2.30%; expected dividend yields of 0.0%; expected lives of 5.0 years; and expected volatility of 95.0%. For the year ended December 31, 2008, the fair value of each option grant was estimated on the date of the grant using the Binomial Lattice option pricing model with the following assumptions used for the outstanding grants: risk-free interest rate of 2.90%; expected dividend yields of 0.0%; expected lives of 5.0 years; and expected volatility of 61.0%. In years ended December 31, 2007 and prior, the fair value of each option grant was estimated on the date of grant using the Black-Scholes option pricing model with the following assumptions used for outstanding grants: risk-free interest rate of 4.20%; expected dividend yields of 0.0%; expected lives of 5.0 years; and expected volatility of 92.72% to 96.54%.
Financial Instruments
The Company’s financial instruments recorded on the consolidated balance sheet include cash and cash equivalents, accounts receivable, accounts payable, and debt. The carrying amounts of cash and cash equivalents, accounts receivable, and accounts payable approximate fair value because of the short-term nature of these items. Fair value of long-term debt is based on rates available to the Company for debt with similar terms and maturities.
Earnings Per Share
Basic earnings per common share is based upon the weighted average number of shares of common stock outstanding. Diluted earnings per share is based upon the weighted average number of common shares outstanding and, when dilutive, common shares issuable for stock options, warrants, and convertible securities.
TGC Industries, Inc.
NOTES TO CONSOLIDATED FINANCIAL STATEMENTS
December 31, 2009, 2008, and 2007
NOTE B - SUMMARY OF SIGNIFICANT ACCOUNTING POLICIES — CONTINUED
All share and per share amounts for the years ended December 31, 2009, 2008, and 2007 have been adjusted to reflect 5% stock dividends paid May 12, 2009, April 28, 2008, and April 27, 2007 to shareholders of record as of April 28, 2009, April 14, 2008, and April 13, 2007, respectively.
Use of Estimates
The preparation of consolidated financial statements in accordance with accounting principles generally accepted in the United States of America requires management to make estimates and assumptions that affect the reported amounts of assets and liabilities and disclosure of contingent assets and liabilities at the date of the financial statements and the reported amounts of revenues and expenses during the reporting period. Actual results could differ from those estimates.
Change in Accounting Estimates
Management evaluates its estimates on a routine basis. Effective July 1, 2007, the Company revised the estimated useful lives of certain seismic equipment and related components. The Company purchased this new equipment, not previously used, from November 2004 through June 2007. Based on the information gained from operations, management believes that this equipment will benefit periods ranging from 5 to 7 years beginning at the time the assets were originally placed in service. The original estimated useful lives ranged from 3 to 5 years.
The net book value of this equipment at June 30, 2007, was not modified and is amortized over the revised estimated useful lives of the equipment. The Company does not believe that this equipment will become obsolete at the end of the original estimate and has revised the estimated life of these assets. The effect to depreciation expense, net income, and earnings per share for the years ended December 31, 2009, and 2008 are as follows:
|
|
|
Year Ended |
|
Year Ended |
|
||||||||
|
|
|
December 31, 2009 |
|
December 31, 2008 |
|
||||||||
|
|
|
As Reported |
|
Pro Forma |
|
As Reported |
|
Pro Forma |
|
||||
|
|
|
|
|
|
|
|
|
|
|
||||
|
Depreciation Expense |
|
$ |
14,621,237 |
|
$ |
17,275,886 |
|
$ |
13,911,124 |
|
$ |
16,901,410 |
|
|
|
|
|
|
|
|
|
|
|
|
||||
|
Net Income |
|
$ |
1,879,619 |
|
$ |
594,769 |
|
$ |
6,898,442 |
|
$ |
5,108,576 |
|
|
|
|
|
|
|
|
|
|
|
|
||||
|
Earnings per common share: |
|
|
|
|
|
|
|
|
|
||||
|
Basic |
|
$ |
0.10 |
|
$ |
0.03 |
|
$ |
0.38 |
|
$ |
0.28 |
|
|
|
|
|
|
|
|
|
|
|
|
||||
|
Diluted |
|
$ |
0.10 |
|
$ |
0.03 |
|
$ |
0.38 |
|
$ |
0.28 |
|
Recent Accounting Standards
In September of 2006, the Financial Accounting Standards Board (FASB) issued Accounting Standards Codification (ASC) 820-10, “Fair Value Measurements and Disclosures.” ASC 820-10 defines fair value as the amount that would be exchanged to sell an asset or transfer a liability in an orderly transaction between market participants. The standard further establishes a framework for measuring fair value in generally accepted accounting principles and expands certain disclosures about fair value measurements. ASC 820-10 became effective for all financial assets and financial liabilities as of October 1, 2008, and upon adoption, ASC 820-10 did not have a material impact on our financial statements. In February of 2008, the FASB issued ASC 820-10-15-1A, “Fair Value Measurements and Disclosures — Transition and Open Effective Date Information,” which delays the effective date of ASC 820-10 for all non-financial assets and non-financial liabilities, except for items that are recognized or disclosed at fair value in the financial statements on a recurring basis (at least annually). We do not expect the adoption of ASC 820-10-15-1A to have a material impact on our financial statements.
TGC Industries, Inc.
NOTES TO CONSOLIDATED FINANCIAL STATEMENTS
December 31, 2009, 2008, and 2007
NOTE B - SUMMARY OF SIGNIFICANT ACCOUNTING POLICIES — CONTINUED
In February of 2007, the FASB issued ASC 825-10, “Financial Instruments.” ASC 825-10 provides companies with an option to report selected financial assets and liabilities at fair value. As of December 31, 2009, we have not elected the fair value option for any additional financial assets and liabilities beyond those already prescribed by accounting principles generally accepted in the United States.
In December of 2007, the FASB issued a new accounting standard related to business combinations under ASC 805-10, “Business Combinations.” The new standard expands the definition of a business and a business combination; requires recognition of assets acquired, liabilities assumed, and contingent consideration at their fair value on the acquisition date with subsequent changes recognized in earnings; requires acquisition-related expenses and restructuring costs to be recognized separately from the business combination and expensed as incurred; and requires that changes in accounting for deferred tax asset valuation allowances and acquired income tax uncertainties after the measurement period be recognized as a component of provision for taxes. The new standard also establishes disclosure requirements to enable the evaluation of the nature and financial effects of the business combination.
In April of 2009, the FASB issued ASC 825-10-65-1, “Financial Instruments — Transition and Open Effective Date Information.” ASC 825-10-65-1 requires fair value disclosures in both interim and annual financial statements in order to provide more timely information about the effects of current market conditions on financial instruments. ASC 825-10-65-1 became effective June 15, 2009. The adoption of this standard did not have a material impact on our financial statements.
In June of 2009, the FASB issued ASC 105-10, “Generally Accepted Accounting Principles.” ASC 105-10 provides for the FASB Accounting Standards Codification (the “Codification”) to become the single official source of authoritative, nongovernmental U.S. generally accepted accounting principles. The Codification did not change GAAP but reorganizes the literature. ASC 105-10 became effective for us for the year ended December 31, 2009. The adoption of this standard did not have an impact on our financial statements.
NOTE C — COSTS, BILLINGS, AND ESTIMATED EARNINGS ON UNCOMPLETED CONTRACTS
The components of uncompleted contracts are as follows at December 31,:
|
|
|
2009 |
|
2008 |
|
||
|
Costs incurred on uncompleted contracts and estimated earnings |
|
$ |
4,831,326 |
|
$ |
8,984,322 |
|
|
Less billings to date |
|
(11,435,208 |
) |
(12,459,781 |
) |
||
|
|
|
$ |
(6,603,882 |
) |
$ |
(3,475,459 |
) |
The components of uncompleted contracts are reflected in the consolidated balance sheets at December 31, 2009 and 2008 as follows:
|
|
|
2009 |
|
2008 |
|
||
|
Costs and estimated earnings in excess of billings on uncompleted contracts |
|
$ |
474,059 |
|
$ |
2,300,985 |
|
|
Billings in excess of costs and estimated earnings on uncompleted contracts |
|
(7,077,941 |
) |
(5,776,444 |
) |
||
|
|
|
$ |
(6,603,882 |
) |
$ |
(3,475,459 |
) |
TGC Industries, Inc.
NOTES TO CONSOLIDATED FINANCIAL STATEMENTS
December 31, 2009, 2008, and 2007
NOTE D - ACCRUED LIABILITIES
Accrued liabilities consist of the following at December 31,:
|
|
|
2009 |
|
2008 |
|
||
|
Compensation and payroll taxes |
|
$ |
811,676 |
|
$ |
476,718 |
|
|
Accrued sales and use tax |
|
101,542 |
|
3,035 |
|
||
|
Insurance |
|
173,483 |
|
156,717 |
|
||
|
Accrued interest |
|
73,105 |
|
73,105 |
|
||
|
Other |
|
177,631 |
|
154,181 |
|
||
|
|
|
$ |
1,337,437 |
|
$ |
863,756 |
|
NOTE E - DEBT
Line of Credit
In September of 2008, and again in September of 2009, the Company renewed its revolving line of credit allowing the Company to borrow, repay, and re-borrow, from time to time, up to $5,000,000. Interest on the outstanding amount under the line of credit loan agreement is payable monthly at the greater of the prime rate of interest or five percent. The credit loan agreement provides for non-financial and financial covenants including a debt to worth ratio not in excess of 1.25 to 1.0 and a minimum debt service coverage ratio in excess of 2.0 to 1.0. At December 31, 2009 and 2008, the Company had no borrowings outstanding under the line of credit loan agreement.
Notes Payable
Notes payable consists of the following at December 31:
|
|
|
2009 |
|
2008 |
|
||
|
|
|
|
|
|
|
||
|
Note Payable to a finance company, Interest at 6.38%, due in fixed principal monthly installments of $85,839 plus interest; collateralized by equipment |
|
$ |
2,060,127 |
|
$ |
3,090,191 |
|
|
|
|
|
|
|
|
||
|
Note Payable to a finance company, Interest at 5.75%, due in fixed principal monthly installments of $61,997 plus interest; collateralized by equipment |
|
1,673,912 |
|
2,417,873 |
|
||
|
|
|
|
|
|
|
||
|
Note Payable to a finance company, Interest at 6.00%, due in fixed principal monthly installments of $56,050 plus interest; collateralized by equipment |
|
1,849,651 |
|
2,522,252 |
|
||
TGC Industries, Inc.
NOTES TO CONSOLIDATED FINANCIAL STATEMENTS
December 31, 2009, 2008, and 2007
NOTE E - DEBT — CONTINUED
|
Note Payable to a finance company, Interest at 5.33%, due in fixed principal monthly installments of $23,740 plus interest; collateralized by equipment |
|
783,429 |
|
1,068,312 |
|
||
|
|
|
|
|
|
|
||
|
Note Payable to a commercial bank, Interest at 6.00%, due in fixed principal monthly installments of $88,889 plus interest; collateralized by equipment |
|
1,688,887 |
|
2,755,555 |
|
||
|
|
|
|
|
|
|
||
|
Note Payable to a commercial bank, Interest at 6.00%, due in fixed principal monthly installments of $55,658 plus interest; collateralized by equipment |
|
1,113,172 |
|
1,781,068 |
|
||
|
|
|
|
|
|
|
||
|
Note Payable to a commercial bank, Interest at 6.35%, due in monthly installments of $50,170 including interest; collateralized by equipment |
|
1,682,254 |
|
2,161,061 |
|
||
|
|
|
|
|
|
|
||
|
Note payable to a finance company interest at 5.50% to 6.20%, due in monthly installments of $228,464 to $227,181 including interest |
|
158,567 |
|
227,181 |
|
||
|
|
|
|
|
|
|
||
|
Note Payable to a commercial bank, Interest at 6.14%, due in fixed principal monthly installments of $102,033 plus interest; collateralized by equipment |
|
1,186,578 |
|
— |
|
||
|
|
|
|
|
|
|
||
|
Note Payable to a finance company, Interest at 6.25%, due in fixed principal monthly installments of $8,921 plus interest |
|
86,705 |
|
— |
|
||
|
|
|
12,283,282 |
|
16,023,493 |
|
||
|
Less Current Maturities |
|
(6,407,892 |
) |
(5,171,872 |
) |
||
|
|
|
$ |
5,875,390 |
|
$ |
10,851,621 |
|
Aggregate annual maturities of notes payable at December 31, 2009 are as follows:
|
Year Ending |
|
|
|
|
|
December 31, |
|
|
|
|
|
|
|
|
|
|
|
2010 |
|
$ |
6,407,892 |
|
|
2011 |
|
4,342,315 |
|
|
|
2012 |
|
1,482,831 |
|
|
|
2013 |
|
50,244 |
|
|
|
|
|
$ |
12,283,282 |
|
TGC Industries, Inc.
NOTES TO CONSOLIDATED FINANCIAL STATEMENTS
December 31, 2009, 2008, and 2007
NOTE F — LEASES
Capital Lease Obligations
The Company leases vehicles and certain specialized seismic equipment under leases classified as capital leases. The following is a schedule showing the future minimum lease payments under capital leases by years and the present value of the minimum lease payments as of December 31, 2009.
|
Year Ending |
|
|
|
|
|
December 31, |
|
|
|
|
|
|
|
|
|
|
|
2010 |
|
$ |
872,772 |
|
|
2011 |
|
550,994 |
|
|
|
2012 |
|
119,412 |
|
|
|
Total minimum lease payments required |
|
1,543,178 |
|
|
|
Less: Amount representing interest |
|
(130,895 |
) |
|
|
Present value of minimum lease payments |
|
1,412,283 |
|
|
|
Less current maturities |
|
(780,526 |
) |
|
|
|
|
$ |
631,757 |
|
The net book value of the capital assets leased was approximately $1,928,000 and $2,265,000 as of December 31, 2009 and 2008, respectively. Total accumulated depreciation on these assets was approximately $5,435,000 and $5,286,000 as of December 31, 2009, and 2008, respectively. Interest rates on these leases range from 8.41% to 12.82%.
Operating Lease Obligations
The Company leases six offices and two warehouse facilities under operating leases that expire at various dates between January 2010 and July 2015 with three leases on a month to month basis. One of the office facilities, used by the Company as its corporate headquarters, is located in Plano, Texas. One of the office facilities, used by Eagle Canada, is located in Calgary, Alberta. The warehouse facilities, used as warehouse and equipment repair facilities, are located in Denison, Texas, and Calgary, Alberta. Two office facilities are used as sales offices and are located in Houston, Texas, and Oklahoma City, Oklahoma. The remaining office facilities are used as a permitting office, located in Pratt, Kansas, and as a crew office, located in Yazoo, Mississippi. Rent expense for these facilities for the years ended December 31, 2009, 2008, and 2007 were approximately $450,000, $350,000, and $279,000, respectively.
The following is a schedule by years of future minimum rental payments required under the operating leases as of December 31, 2009:
|
2010 |
|
$ |
550,378 |
|
|
2011 |
|
576,544 |
|
|
|
2012 |
|
432,310 |
|
|
|
2013 |
|
390,464 |
|
|
|
2014 and thereafter |
|
269,726 |
|
|
|
Total minimum payments required |
|
$ |
2,219,422 |
|
TGC Industries, Inc.
NOTES TO CONSOLIDATED FINANCIAL STATEMENTS
December 31, 2009, 2008, and 2007
NOTE G — FAIR VALUE OF DEBT OBLIGATIONS
The fair value of debt obligations is estimated using discounted cash flows based on the Company’s incremental borrowing rate for similar types of borrowings. A comparison of the carrying value and fair value of these instruments is as follows:
|
|
|
December 31, |
|
||||
|
|
|
2009 |
|
2008 |
|
||
|
|
|
|
|
|
|
||
|
Carrying value |
|
$ |
12,283,282 |
|
$ |
16,023,493 |
|
|
Fair value |
|
$ |
12,277,811 |
|
$ |
16,014,545 |
|
NOTE H — SHAREHOLDERS’ EQUITY
Earnings Per Share
The following is a reconciliation of net income and weighted average common shares outstanding for purposes of calculating basic and diluted net income per share:
|
|
|
December 31, |
|
|||||||
|
|
|
2009 |
|
2008 |
|
2007 |
|
|||
|
|
|
|
|
|
|
|
|
|||
|
Numerator: |
|
|
|
|
|
|
|
|||
|
Net income |
|
$ |
1,879,619 |
|
$ |
6,898,442 |
|
$ |
7,607,433 |
|
|
|
|
|
|
|
|
|
|
|||
|
Denominator: |
|
|
|
|
|
|
|
|||
|
Basic - weighted average common shares outstanding |
|
18,280,318 |
|
18,260,110 |
|
18,236,718 |
|
|||
|
Effect of Dilutive Securities: |
|
|
|
|
|
|
|
|||
|
Warrants |
|
— |
|
— |
|
23,765 |
|
|||
|
Stock options |
|
63,723 |
|
77,074 |
|
64,938 |
|
|||
|
|
|
18,344,041 |
|
18,337,184 |
|
18,325,421 |
|
|||
|
|
|
|
|
|
|
|
|
|||
|
Basic net income per share |
|
$ |
0.10 |
|
$ |
0.38 |
|
$ |
0.42 |
|
|
Diluted net income per share |
|
$ |
0.10 |
|
$ |
0.38 |
|
$ |
0.42 |
|
Outstanding options that were not included in the diluted calculation because their effect would be anti-dilutive total 282,265 and 52,330 for the years ended December 31, 2009 and 2008, respectively.
All share and per share amounts have been adjusted to reflect 5% stock dividends paid May 12, 2009, April 28, 2008, and April 27, 2007 to shareholders of record as of April 28, 2009, April 14, 2008, and April 13, 2007.
Stock-Based Compensation Plans
The Company currently has in effect a 1999 stock option plan (the “1999 Plan”). Options for up to 300,000 shares of the Company’s common stock may be granted. Options under the 1999 Plan must be granted at prices not less than the lesser of the par value per share of the stock or the fair market value per share of the Company’s stock on the date of the grant. The term cannot exceed five years from the date of the grant and are exercisable as follows: (i) one-third of the shares after the 12 month period following the date of the grant; (ii) two-thirds of the shares after the 24 month period following the date of the grant; and (iii) all of the shares of stock after the 36 month period following the date of the grant. During 2009, no options were granted or cancelled, and options covering 13,892 shares were exercised under the 1999 Plan. At December 31, 2009, options covering 80,050 shares were outstanding under the 1999 Plan, all of which are exercisable.
TGC Industries, Inc.
NOTES TO CONSOLIDATED FINANCIAL STATEMENTS
December 31, 2009, 2008, and 2007
NOTE H - SHAREHOLDERS’ EQUITY — CONTINUED
The Company currently has in effect a 2006 stock award plan (the “2006 Plan”). The 2006 Plan provides for the granting of stock options, common stock, and restricted stock. The Company can issue up to 1,000,000 shares of the Company’s common stock pursuant to awards under the 2006 Plan. The 2006 Plan will be administered by a committee of the Board of Directors (“the Committee”). Currently the Committee is comprised of three directors. Any stock options granted under the 2006 Plan will be exercisable as set forth in the option agreements pursuant to which they are issued, but in no event will stock options be exercisable after the expiration of five (5) years from the date of grant. During 2009, 229,935 options were granted and 20,000 options were cancelled or exercised under the 2006 Plan. During 2008, 466,560 options were granted and no options were cancelled or exercised under the 2006 Plan. Restricted stock consists of shares that are transferred by the Company to a participant, but are subject to substantial risk of forfeiture and to restrictions on their sale or other transfer by the participant. In April of 2006, the Committee granted 111,711 shares of restricted stock. In August of 2007, the Committee granted 19,845 shares of restricted stock. In June of 2008, the Committee granted 10,500 shares of restricted stock. In June of 2009, the Committee granted 5,000 shares of restricted stock. The shares of restricted stock were issued in the names of the grantees and have restrictive legends prohibiting their sales prior to vesting. One-third (1/3) of the granted restricted shares vest each year on the annual anniversary of the grant. Upon vesting, a new certificate will be issued for the vested portion without the restrictive legend. During the years ended December 31, 2009, 2008, and 2007, the Company recognized compensation expense associated with the restricted stock of $182,812, $411,113, and $380,261, respectively. As a result of employees who left the Company during the years ended December 31, 2009, 2008, and 2007, the Company reversed approximately $4,000, $19,400, and $29,800, respectively, of deferred stock-based compensation and approximately $4,000, $19,300, and $29,700, respectively, of additional paid-in capital, which represented the unamortized balance of deferred stock-based compensation relating to the employees who left the Company. The number of shares of restricted stock issued in April of 2006 has been adjusted to reflect the 5% stock dividends paid in May of 2009, April of 2008 and April of 2007. The number of shares of restricted stock issued in August of 2007, has been adjusted to reflect the 5% stock dividend paid in May of 2009 and April of 2008. The number of shares of restricted stock issued in June of 2008 has been adjusted to reflect the 5% stock dividend paid in May of 2009.
During the years ended December 31, 2009, 2008, and 2007, the Company recognized compensation expense associated with unvested options under the 1999 and 2006 Plans of $179,918, $43,959, and $49,854, respectively.
The following table summarizes activity under the Plans:
|
|
|
|
|
Weighted |
|
|
|
|
|
Shares under |
|
Average |
|
|
|
|
|
Option |
|
exercise price |
|
|
|
|
|
|
|
|
|
|
|
Balance at December 31, 2006 |
|
137,592 |
|
$ |
2.94 |
|
|
Granted |
|
52,330 |
|
$ |
8.80 |
|
|
Exercised |
|
(39,015 |
) |
$ |
.75 |
|
|
Canceled |
|
— |
|
$ |
— |
|
|
Balance at December 31, 2007 |
|
150,907 |
|
$ |
5.54 |
|
|
Granted |
|
466,560 |
|
3.23 |
|
|
|
Exercised |
|
(4,631 |
) |
$ |
.69 |
|
|
Canceled |
|
— |
|
— |
|
|
|
Balance at December 31, 2008 |
|
612,836 |
|
$ |
3.81 |
|
|
Granted |
|
229,935 |
|
$ |
4.21 |
|
|
Exercised |
|
(13,892 |
) |
$ |
.69 |
|
|
Canceled |
|
(20,000 |
) |
3.37 |
|
|
|
Balance at December 31, 2009 |
|
808,879 |
|
$ |
3.99 |
|
TGC Industries, Inc.
NOTES TO CONSOLIDATED FINANCIAL STATEMENTS
December 31, 2009, 2008, and 2007
NOTE H - SHAREHOLDERS’ EQUITY — CONTINUED
The following information applies to options outstanding and exercisable at December 31, 2009:
|
|
|
|
|
|
|
Weighted |
|
|
|
|
|
|
|
|
|
|
|
average |
|
|
|
|
|
|
|
|
|
|
|
remaining |
|
Weighted |
|
|
|
|
|
Range of |
|
Number |
|
contractual |
|
average |
|
|
|
|
|
Exercise prices |
|
outstanding |
|
life (in years) |
|
exercise price |
|
|
|
Outstanding options |
|
$3.21 – $8.80 |
|
808,879 |
|
3.72 |
|
$ |
3.99 |
|
|
Exercisable options |
|
$3.21 – $8.80 |
|
405,914 |
|
3.14 |
|
$ |
4.30 |
|
Stock Warrants
During 2004, the Company issued 28,665 warrants to a public relations firm as part of its fee for services provided the Company. The warrants have a strike price of $.91 per share and expired December 15, 2007. During January of 2005, the public relations firm sold the 28,655 warrants to a group of investors that included certain Directors of the Company. These warrants were redeemed by the Company in November of 2007. The number of warrants issued in 2004 have been adjusted to reflect the 5% stock dividends paid in April 2006 and 2007, respectively.
NOTE I - INCOME TAXES
The income tax provision charged to continuing operations for the years ended December 31, 2009, 2008, and 2007, was as follows:
|
|
|
2009 |
|
2008 |
|
2007 |
|
|||
|
|
|
|
|
|
|
|
|
|||
|
Current: |
|
|
|
|
|
|
|
|||
|
U.S. federal |
|
$ |
774,429 |
|
$ |
243,569 |
|
$ |
3,565,519 |
|
|
Foreign |
|
142,358 |
|
— |
|
— |
|
|||
|
State and local |
|
373,151 |
|
366,000 |
|
542,677 |
|
|||
|
|
|
1,289,938 |
|
609,569 |
|
4,108,196 |
|
|||
|
|
|
|
|
|
|
|
|
|||
|
Deferred expense |
|
717,873 |
|
4,017,000 |
|
1,021,969 |
|
|||
|
|
|
$ |
2,007,811 |
|
$ |
4,626,569 |
|
$ |
5,130,165 |
|
The income tax provision differs from the amount of income tax determined by applying the applicable U.S. and Canadian federal income tax rates to pretax income from continuing operations for the year ended December 31, 2009, and applying the U.S. federal income tax rates to pretax income from continuing operations for the years ended December 31, 2008, and 2007, due to the following:
|
|
|
2009 |
|
2008 |
|
2007 |
|
|||
|
Computed “expected” tax expense |
|
$ |
1,321,726 |
|
$ |
3,918,504 |
|
$ |
4,325,859 |
|
|
Increase in income taxes resulting from: |
|
|
|
|
|
|
|
|||
|
Nondeductible expenses and other |
|
407,168 |
|
470,165 |
|
451,566 |
|
|||
|
State and local taxes, net of federal benefit |
|
278,917 |
|
237,900 |
|
352,740 |
|
|||
|
|
|
$ |
2,007,811 |
|
$ |
4,626,569 |
|
$ |
5,130,165 |
|
TGC Industries, Inc.
NOTES TO CONSOLIDATED FINANCIAL STATEMENTS
December 31, 2009, 2008, and 2007
NOTE I - INCOME TAXES — CONTINUED
Net deferred tax liabilities consist of the following components as of December 31, 2009 and 2008:
|
|
|
2009 |
|
2008 |
|
||
|
Deferred tax assets |
|
|
|
|
|
||
|
Foreign tax credits |
|
$ |
144,626 |
|
$ |
— |
|
|
Foreign capital losses |
|
399,907 |
|
— |
|
||
|
Loss carry forwards (expire in 2028) |
|
— |
|
83,252 |
|
||
|
Deferred stock compensation |
|
11,491 |
|
173,511 |
|
||
|
Total gross deferred tax assets |
|
556,024 |
|
256,763 |
|
||
|
Less valuation allowance |
|
(399,907 |
) |
— |
|
||
|
Total deferred tax assets |
|
156,117 |
|
— |
|
||
|
|
|
|
|
|
|
||
|
Deferred tax liability |
|
|
|
|
|
||
|
Property and equipment |
|
(7,273,147 |
) |
(6,229,763 |
) |
||
|
Total deferred tax liabilities |
|
$ |
(7,117,030 |
) |
$ |
(5,973,000 |
) |
The components giving rise to the net deferred tax items described above have been included in the accompanying balance sheets as of December 31, 2009 and 2008, as follows:
|
|
|
2009 |
|
2008 |
|
||
|
|
|
|
|
|
|
||
|
Current assets |
|
$ |
— |
|
$ |
— |
|
|
Noncurrent (liabilities) |
|
7,117,030 |
|
5,973,000 |
) |
||
|
|
|
$ |
7,117,030 |
|
$ |
5,973,000 |
|
The Company adopted Topic 740 on January 1, 2007. The implementation of Topic 740 did not have a material impact on the Company’s consolidated financial statements, results of operations, or cash flows. At December 31, 2009 and 2008, the Company had no unrecognized tax benefits, interest or penalties within its provision for income taxes.
NOTE J - 401(k) PLAN
The Company has a 401(k) salary deferral plan which covers all employees who have reached the age of 20.5 years and have been employed by the Company for at least one year. The covered employees may elect to have an amount deducted from their wages for investment in the retirement plan. The Company makes contributions to the plan equal to 50% of each participant’s salary reduction contributions to the plan up to 6% of the participant’s compensation. The Company’s matching contribution to the plan was approximately $16,000, $78,000, and $64,000 for the years ended December 31, 2009, 2008, and 2007, respectively.
NOTE K - CONCENTRATION OF CREDIT RISK
The Company sells its geophysical services primarily to large independent oil and gas companies operating in the U.S. and Canada. The Company performs ongoing credit evaluations of its customer’s financial condition and, generally, requires no collateral from its customers.
During 2009 our largest customer accounted for approximately 30.8% of revenues. During 2008 our two largest customers accounted for approximately 26.7% of revenues. During 2007 our largest customer accounted for approximately 12.1% of revenues. As of December 31, 2009, three customers accounted for 19%, 19%, and 12% of outstanding accounts receivable, respectively. As of December 31, 2008, two customers accounted for 26% and 13% of outstanding accounts receivable, respectively. During 2009 our two largest vendors accounted for approximately 22% and 10% of our purchases. No vendor represented over 10% of purchases in 2008 or 2007.
TGC Industries, Inc.
NOTES TO CONSOLIDATED FINANCIAL STATEMENTS
December 31, 2009, 2008, and 2007
NOTE L - CONTINGENCIES
In conducting its activities, the Company from time to time is the subject of various claims arising from the ordinary course of business. In the opinion of management, the ultimate resolution of such claims is not expected to have a material adverse effect upon the financial position of the Company.
NOTE M — QUARTERLY FINANCIAL DATA — (UNAUDITED)
The following is a summary of the unaudited quarterly financial information for the two years ended December 31, 2009 and 2008 (in thousands, except per share amounts):
|
|
|
Three Months Ended |
|
||||||||||
|
2009 |
|
March 31 |
|
June 30 |
|
September 30 |
|
December 31 |
|
||||
|
|
|
|
|
|
|
|
|
|
|
||||
|
Revenues |
|
$ |
36,011 |
|
$ |
22,591 |
|
$ |
16,083 |
|
$ |
15,747 |
|
|
Income (loss) from operations |
|
8,793 |
|
2,424 |
|
(2,481 |
) |
(3,828 |
) |
||||
|
Net Income (loss) |
|
5,035 |
|
1,242 |
|
(1,734 |
) |
(2,663 |
) |
||||
|
Net income (loss) per share basic |
|
.27 |
|
.07 |
|
(.09 |
) |
(.15 |
) |
||||
|
Net income per share diluted |
|
.27 |
|
.07 |
|
(.09 |
) |
(.15 |
) |
||||
|
|
|
Three Months Ended |
|
||||||||||
|
2008 |
|
March 31 |
|
June 30 |
|
September 30 |
|
December 31 |
|
||||
|
|
|
|
|
|
|
|
|
|
|
||||
|
Revenues |
|
$ |
22,471 |
|
$ |
18,620 |
|
$ |
21,554 |
|
$ |
24,125 |
|
|
Income from operations |
|
3,384 |
|
1,679 |
|
3,603 |
|
3,788 |
|
||||
|
Net Income |
|
1,983 |
|
868 |
|
1,863 |
|
2,185 |
|
||||
|
Net income per share basic |
|
.11 |
|
.05 |
|
.10 |
|
.12 |
|
||||
|
Net income per share diluted |
|
.11 |
|
.05 |
|
.10 |
|
.12 |
|
||||
NOTE N — ACQUISITION OF EAGLE CANADA SUPPLEMENTARY DATA — (UNAUDITED)
On October 19, 2009, we disclosed our entry into a Material Definitive Agreement regarding the acquisition of the stock of Eagle Canada, Inc. (“Eagle Canada”), a Delaware corporation. Eagle Canada was a wholly-owned subsidiary of Eagle Geophysical, Inc. and Eagle Geophysical Onshore, Inc. (the “Debtors”) which were debtors in a Chapter 11 bankruptcy proceeding in Houston, Texas. Eagle Canada is in the business of providing seismic data and surveying services to the Canadian energy industry and has its principal place of business located in Calgary, Alberta, Canada. By Order dated October 14, 2009, the Bankruptcy Court approved the sale of the Eagle Canada stock by the Debtors to TGC and authorized the Debtors to enter into a Stock Purchase Agreement with TGC. In accordance with the terms of the Stock Purchase Agreement, the sale transaction closed on October 16, 2009, with TGC acquiring the Eagle Canada stock for a total purchase price of approximately $10.3 million paid from existing cash. The acquisition provides the Company with a new geographic region in which to operate. The seismic recording equipment used by Eagle Canada is interchangeable with that of TGC. The amounts of Eagle Canada’s revenue and earnings included in our consolidated statement of income for the year ended December 31, 2009, and the unaudited revenue and earnings of the combined entity had the acquisition date been January 1, 2009, or January 1, 2008, are as follows:
NOTE N - ACQUISITION OF EAGLE CANADA SUPPLEMENTARY DATA — (UNAUDITED) — CONTINUED
|
|
|
Revenue |
|
Earnings |
|
||
|
|
|
|
|
|
|
||
|
Actual from 10/15/09 to 12/31/09 |
|
$ |
4,783,892 |
|
$ |
381,366 |
|
|
|
|
|
|
|
|
||
|
Supplemental pro forma from 1/1/09 to 12/31/09 |
|
$ |
103,539,881 |
|
$ |
1,584,565 |
|
|
|
|
|
|
|
|
||
|
Supplemental pro forma from 1/1/08 to 12/31/08 |
|
$ |
113,762,636 |
|
$ |
8,270,624 |
|
NOTE O — COMMITMENTS AND CONTINGENCIES
In connection with our acquisition of Eagle Canada as discussed in Item 1 and Note N to the consolidated financial statements, TGC is seeking damages against Eagle Geophysical, Inc. and Eagle Geophysical Onshore, Inc. (the “Debtors”) arising out of their failure to disclose material information in connection with the sale of Eagle Canada. During the due diligence process, and in the purchase agreement, the Debtors made certain representations and warranties to TGC concerning Eagle Canada’s financial condition and debt obligations including guarantee obligations. Soon after the sale closing, TGC discovered that the Debtors did not disclose a material guarantee obligation purportedly incurred by Eagle Canada as part of a secured loan Eagle Geophysical obtained from SunTrust Equipment Finance and Leasing Corp. with an outstanding balance of approximately $731,000. TGC notified the Debtors that their failure to disclose the existence of the guarantee constitutes a breach of the purchase agreement and demanded, and Debtors complied, that the Debtors escrow $800,000 in a segregated account pending resolution of Eagle Canada’s liability, if any, under the guarantee and the determination and resolution of any other guarantee to which Eagle Canada is a party. The Company intends to vigorously pursue this matter.
ITEM 9. CHANGES IN AND DISAGREEMENTS WITH ACCOUNTANTS ON ACCOUNTING AND FINANCIAL DISCLOSURE.
Not Applicable.
ITEM 9A. CONTROLS AND PROCEDURES.
Disclosure Controls and Procedures
The Company maintains controls and procedures to ensure that it is able to collect the information it is required to disclose in the reports it files with the Securities and Exchange Commission, and to process, summarize, and disclose this information within the time periods specified in the rules of the SEC. Based on an evaluation of the Company’s disclosure controls and procedures (as such term is defined in Rules 13a-15(e) and 15d-15(e) under the Securities Exchange Act of 1934, as amended) as of the end of the period covered by this report conducted by the Company’s management, with the participation of the Chief Executive and Chief Financial Officers, the Chief Executive and Chief Financial Officers believe that these controls and procedures are effective to ensure that the Company is able to record, process, summarize, and report information required to be included in reports filed or submitted under the Exchange Act within the required time period. As discussed in Item 1 and in Note N to the consolidated financial statements above, during October 2009 the company acquired all of the stock of Eagle Canada. Because the acquisition occurred in 2009, management has elected to exclude Eagle Canada from management’s report on internal control over financial reporting. Revenue of $4,783,892 and earnings of $381,366 attributable to Eagle Canada for the period October 15, 2009 to December 31, 2009 are included in our consolidated statement of earnings for the year ended December 31, 2009. Other than the exclusion of Eagle Canada, there were no changes in the Company’s internal controls over financial reporting during the year ended December 31, 2009, that have materially affected, or are reasonably likely to materially affect, the Company’s internal control over financial reporting.
Management’s Report on Internal Control over Financial Reporting
Management of the Company is responsible for establishing and maintaining adequate internal control over financial reporting as defined in Rule 13a-15(f) under the Securities Exchange Act of 1934, as amended.
Because of its inherent limitations, internal control over financial reporting may not prevent or detect misstatements. Projections of any evaluation of effectiveness to future periods are subject to the risk that controls may become inadequate because of changes in conditions or that the degree of compliance with the policies or procedures may deteriorate. All internal control systems, no matter how well designed, have inherent limitations. Therefore, even those systems determined to be effective can provide only reasonable assurance with respect to financial statement preparation and presentation.
Management assessed the effectiveness of the Company’s internal control over financial reporting as of December 31, 2009. In making this assessment, management used the criteria set forth by the Committee of Sponsoring Organizations of the Treadway Commission (COSO) in Internal Control — Integrated Framework. Based on our assessment, we believe that, as of December 31, 2009, the Company’s internal control over financial reporting, excluding Eagle Canada as discussed above, is effective based on those criteria.
Management’s assessment of the effectiveness of internal control over financial reporting as of December 31, 2009, excluding Eagle Canada as discussed above, has been audited by Lane Gorman Trubitt, L.L.P., the independent registered public accounting firm which also audited the Company’s financial statements. Lane Gorman Trubitt, L.L.P.’s attestation report on management’s assessment of the Company’s internal control over financial reporting, excluding Eagle Canada, appears in their Report of Independent Registered Public Accounting Firm.
ITEM 9B. OTHER INFORMATION.
Not Applicable.
PART III
ITEM 10. DIRECTORS, EXECUTIVE OFFICERS AND CORPORATE GOVERNANCE.
The information required by Item 10 of Form 10-K is hereby incorporated by reference from the Company’s definitive proxy statement which will be filed pursuant to Regulation 14A within 120 days after the Company’s year end for the year covered by this report.
ITEM 11. EXECUTIVE COMPENSATION.
The information required by Item 11 of Form 10-K is hereby incorporated by reference from the Company’s definitive proxy statement which will be filed pursuant to Regulation 14A within 120 days after the Company’s year end for the year covered by this report.
ITEM 12. SECURITY OWNERSHIP OF CERTAIN BENEFICIAL OWNERS AND MANAGEMENT AND RELATED STOCKHOLDER MATTERS.
The information required by Item 12 of Form 10-K is hereby incorporated by reference from the Company’s definitive proxy statement which will be filed pursuant to Regulation 14A within 120 days after the Company’s year end for the year covered by this report.
ITEM 13. CERTAIN RELATIONSHIPS AND RELATED TRANSACTIONS, AND DIRECTOR INDEPENDENCE.
The information required by Item 13 of Form 10-K is hereby incorporated by reference from the Company’s definitive proxy statement which will be filed pursuant to Regulation 14A within 120 days after the Company’s year end for the year covered by this report.
ITEM 14. PRINCIPAL ACCOUNTING FEES AND SERVICES.
The information required by Item 14 of Form 10-K is hereby incorporated by reference from the Company’s definitive proxy statement, which will be filed pursuant to Regulation 14A within 120 days after the Company’s year end for the year covered by this report.
PART IV
ITEM 15. EXHIBITS AND FINANCIAL STATEMENT SCHEDULES.
(a) The following documents are filed as a part of this report:
(1) Financial Statements included in Item 8 above are filed as part of this annual report.
(2) Financial Statement Schedules included in Item 8 herein:
All schedules for which provision is made in the applicable accounting regulations of the Securities and Exchange Commission are not required under the related instructions or are inapplicable and therefore, have been omitted.
(3) Exhibits: The information required by this Item 15(a)(3) is set forth in the Index to Exhibits accompanying this Annual Report on Form 10-K.
SIGNATURES
Pursuant to the requirements of Section 13 or 15(d) of the Securities Exchange Act of 1934, the registrant has duly caused this report to be signed on its behalf by the undersigned, thereunto duly authorized.
|
|
TGC INDUSTRIES, INC. |
|||
|
|
|
|
|
|
|
Date: March 16, 2010 |
|
By: |
/s/ Wayne A. Whitener |
|
|
|
|
|
|
Wayne A. Whitener |
|
|
|
|
|
President and Chief Executive Officer |
|
|
|
|
|
(Principal Executive Officer) |
Pursuant to the requirements of the Securities Exchange Act of 1934, this report has been signed below by the following persons on behalf of the registrant and in the capacities and on the dates indicated.
|
Date: March 16, 2010 |
By: |
/s/ Wayne A. Whitener |
|
|
|
|
|
Wayne A. Whitener |
|
|
|
|
President, Chief Executive Officer, and Director |
|
|
|
|
(Principal Executive Officer) |
|
|
|
|
|
|
Date: March 16, 2010 |
By: |
/s/ James K. Brata |
|
|
|
|
|
James K. Brata |
|
|
|
|
Vice President, Secretary, Treasurer, and Chief |
|
|
|
|
Financial Officer |
|
|
|
|
(Principal Financial and Accounting Officer) |
|
|
|
|
|
|
Date: March 16, 2010 |
By: |
/s/ William J. Barrett |
|
|
|
|
|
William J. Barrett |
|
|
|
|
Director |
|
|
|
|
|
|
Date: March 16, 2010 |
By: |
/s/ Herbert M. Gardner |
|
|
|
|
|
Herbert M. Gardner |
|
|
|
|
Director |
|
|
|
|
|
|
Date: March 16, 2010 |
By: |
/s/ Allen T. McInnes |
|
|
|
|
|
Allen T. McInnes |
|
|
|
|
Director |
|
|
|
|
|
|
Date: March 16, 2010 |
By: |
/s/ Edward L. Flynn |
|
|
|
|
|
Edward L. Flynn |
|
|
|
|
Director |
|
|
|
|
|
|
Date: March 16, 2010 |
By: |
/s/ Stephanie P. Hurtt |
|
|
|
|
|
Stephanie P. Hurtt |
|
|
|
|
Director |
INDEX TO EXHIBITS
|
EXHIBIT |
|
DESCRIPTION |
|
|
2.1 |
|
|
Stock Purchase Agreement, dated as of October 16, 2009, by and among TGC Industries, Inc., Eagle Geophysical, Inc. and Eagle Geophysical Onshore, Inc., filed as Exhibit 2.1 to the Company’s Current Report on Form 8-K dated October 17, 2009, and incorporated herein by reference. |
|
|
|
|
|
|
3.1 |
|
|
Restated Articles of Incorporation (with amendment) as filed with the Secretary of State of Texas on June 20, 2003, filed as Exhibit 3.4 to the Company’s Annual Report on Form 10-KSB for the fiscal year ended December 31, 2003, and incorporated herein by reference. |
|
|
|
|
|
|
3.2 |
|
|
Amended and Restated Bylaws (as amended March 25, 2009), filed as Exhibit 3.1 to the Company’s Current Report on Form 8-K filed on March 31, 2009, and incorporated herein by reference. |
|
|
|
|
|
|
4.1 |
|
|
Form of Specimen Stock Certificate filed as Exhibit 4.1 to the Company’s Registration Statement on Form SB-2/A on September 20, 2005 (Registration No. 333-128018), and incorporated herein by reference. |
|
|
|
|
|
|
+10.1 |
|
|
Employment Contract (as Amended and Restated effective September 11, 2008) between TGC Industries, Inc. and Wayne A. Whitener, filed as Exhibit 10.1 to the Company’s Current Report on Form 8-K filed on September 17, 2008, and incorporated herein by reference. |
|
|
|
|
|
|
10.2 |
|
|
Form of TGC Industries, Inc. Director and Officer Indemnification Agreement, filed as Exhibit 10.1 to the Company’s Current Report on Form 8-K filed on October 22, 2008, and incorporated herein by reference. |
|
|
|
|
|
|
10.3 |
|
|
Commercial Lease Agreement dated August 25, 2005, by and among TGC Industries, Inc. and JSS/Capital Avenue, L.P., filed as Exhibit 10.3 to the Company’s Current Report on Form 8-K dated August 31, 2005, and incorporated herein by reference. |
|
|
|
|
|
|
10.4 |
|
|
Amended and Restated Loan and Security Agreement by and between TGC Industries, Inc. and Sovereign Bank, dated September 16, 2009, filed as Exhibit 10.1 to the Company’s Current Report on Form 8-K filed on September 22, 2009, and incorporated herein by reference. |
|
|
|
|
|
|
10.5 |
|
|
Amended and Restated Promissory Note by and between TGC Industries, Inc. and Sovereign Bank, dated September 16, 2009, filed as Exhibit 10.2 to the Company’s Current Report on Form 8-K filed on September 22, 2009, and incorporated herein by reference. |
|
|
|
|
|
|
10.6 |
|
|
Promissory Note by and among TGC Industries, Inc. and General Electric Capital Corporation, dated September 2, 2005, filed as Exhibit 10.3 to the Company’s Current Report on Form 8-K dated September 20, 2005, and incorporated herein by reference. |
|
|
|
|
|
|
10.7 |
|
|
Amendment, dated September 9, 2005, to the Promissory Note by and among TGC Industries, Inc. and General Electric Capital Corporation, dated September 2, 2005, filed as Exhibit 10.4 to the Company’s Current Report on Form 8-K dated September 20, 2005, and incorporated herein by reference. |
|
|
|
|
|
|
10.8 |
|
|
Promissory Note by and among TGC Industries, Inc. and General Electric Capital Corporation, dated September 12, 2005, filed as Exhibit 10.5 to the Company’s Current Report on Form 8-K dated September 20, 2005, and incorporated herein by reference. |
|
10.9 |
|
|
Amendment, dated September 9, 2005, to the Promissory Note by and among TGC Industries, Inc. and General Electric Capital Corporation, dated September 12, 2005, filed as Exhibit 10.6 to the Company’s Current Report on Form 8-K dated September 20, 2005, and incorporated herein by reference. |
|
|
|
|
|
|
10.10 |
|
|
Amendment, dated September 12, 2005, to the Promissory Note by and among TGC Industries, Inc. and General Electric Capital Corporation, dated September 12, 2005, filed as Exhibit 10.7 to the Company’s Current Report on Form 8-K dated September 20, 2005, and incorporated herein by reference. |
|
|
|
|
|
|
10.11 |
|
|
Promissory Note by and among TGC Industries, Inc. and General Electric Capital Corporation, dated September 19, 2005, Filed as Exhibit 10.1 to the Company’s Current Report on Form 8-K filed on September 30, 2005, and incorporated herein by reference. |
|
|
|
|
|
|
+10.12 |
|
|
1999 Stock Option Plan as adopted by the Board of Directors on December 14, 1999, filed as Exhibit 10.13 to the Company’s Annual Report on Form 10-KSB for the fiscal year ended December 31, 1999, and incorporated herein by reference. |
|
|
|
|
|
|
+10.13 |
|
|
2006 Stock Awards Plan, dated March 30, 2006, filed as Exhibit A to the Company’s definitive proxy statement on Form DEFR 14A dated April 25, 2006, and incorporated herein by reference. |
|
|
|
|
|
|
*31.1 |
|
|
Certification of Chief Executive Officer pursuant to 18 U.S.C. Section 1350, as adopted pursuant to Section 302 of the Sarbanes-Oxley Act of 2002. |
|
|
|
|
|
|
*31.2 |
|
|
Certification of Chief Financial Officer pursuant to 18 U.S.C. Section 1350, as adopted pursuant to Section 302 of the Sarbanes-Oxley Act of 2002. |
|
|
|
|
|
|
*32.1 |
|
|
Certification of Chief Executive Officer pursuant to 18 U.S.C. Section 1350, as adopted pursuant to Section 906 of the Sarbanes-Oxley Act of 2002. |
|
|
|
|
|
|
*32.2 |
|
|
Certification of Chief Financial Officer pursuant to 18 U.S.C. Section 1350, as adopted pursuant to Section 906 of the Sarbanes-Oxley Act of 2002. |
* Filed herewith.
+ Management contract on compensatory plan, contract, or arrangement.