Attached files
UNITED
STATES
SECURITIES
AND EXCHANGE COMMISSION
Washington,
D.C. 20549
FORM
10-K
(Mark
One)
x ANNUAL
REPORT PURSUANT TO SECTION 13 OR 15(d) OF THE SECURITIES EXCHANGE ACT
OF 1934
For the
fiscal year ended December 31, 2009
OR
¨ TRANSITION
REPORT PURSUANT TO SECTION 13 OR 15(d) OF THE SECURITIES EXCHANGE ACT
OF 1934
For the
transition period from _________ to __________
Commission
file number: 1-32733

RESOURCE
CAPITAL CORP.
(Exact
name of registrant as specified in its charter)
|
Maryland
(State
or other jurisdiction
of
incorporation or organization)
|
_____20-2287134
(I.R.S.
Employer
Identification
No.)
|
|
712
5th
Avenue, 10th
Floor, New York, NY 10019
|
|
|
(Address
of principal executive offices) (Zip code)
|
|
|
(212)
506-3870
|
|
|
(Registrant’s
telephone number, including area code)
|
|
|
Securities
registered pursuant to Section 12(b) of the Act:
|
|
|
Common
Stock, $.001 par value
|
New
York Stock Exchange (NYSE)
|
|
Title of each class
|
Name of each exchange on which
registered
|
|
Securities
registered pursuant to Section 12(g) of the Act:
|
|
|
None
|
|
Indicate
by check mark if the registrant is a well-known seasoned issuer, as defined in
Rule 405 of the Securities Act. Yes o No R
Indicate
by check mark if the registrant is not required to file reports pursuant to
Section 13 or Section 15(a) of the Act. Yes o No R
Indicate
by check mark whether the registrant (1) has filed all reports required to be
filed by Section 13 or 15(d) of the Securities Exchange Act of 1934 during the
preceding 12 months (or for such shorter period that the registrant was required
to file such reports), and (2) has been subject to such filing requirements for
the past 90 days. Yes R No o
Indicate
by check mark whether the registrant has submitted electronically and posted on
its corporate Web site, if any, every Interactive Data File required to be
submitted and posted pursuant to Rule 405 of Regulation S-T during the preceding
12 months (or for such shorter period that the registrant was required to submit
and post such files). Yes ¨ No ¨
Indicate
by check mark if disclosure of delinquent filers pursuant to Item 405 of
Regulation S-K is not contained herein, and will not be contained, to the best
of registrant's knowledge, in definitive proxy or information statements
incorporated by reference in Part III of this Form 10-K or any amendment to this
Form 10-K. R
Indicate
by check mark whether the registrant is a large accelerated filer, an
accelerated filer, a non-accelerated filer, or a smaller reporting
company. See definition of “large accelerated filer,” “accelerated
filer” and “smaller reporting company” in Rule 12b-2 of the Exchange
Act.
|
Large
accelerated
filer
|
o |
Accelerated
filer
|
R | |
|
Non-accelerated
filer
|
o |
(Do
not check if a smaller reporting company)
|
Smaller
reporting company
|
o |
Indicate
by check mark whether the registrant is a shell company (as defined in Rule
12b-2 of the Act). Yes o No R
The
aggregate market value of the voting common equity held by non-affiliates of the
registrant, based on the closing price of such stock on the last business day of
the registrant’s most recently completed second fiscal quarter (June 30, 2009)
was approximately $63,790,874.
The
number of outstanding shares of the registrant’s common stock on March 8, 2010
was 38,938,950 shares.
DOCUMENTS
INCORPORATED BY REFERENCE
[None]
RESOURCE
CAPITAL CORP. AND SUBSIDIARIES
ON
FORM 10-K
|
Page
|
|||
| Forward-Looking Statements | |||
|
PART
I
|
|||
|
PART
II
|
|||
|
PART
III
|
|||
|
PART
IV
|
|||
FORWARD-LOOKING
STATEMENTS
This
report contains certain forward-looking statements. Forward-looking statements
relate to expectations, beliefs, projections, future plans and strategies,
anticipated events or trends and similar expressions concerning matters that are
not historical facts. In some cases, you can identify forward-looking
statements by terms such as “anticipate,” “believe,” “could,” “estimate,”
“expects,” “intend,” “may,” “plan,” “potential,” “project,” “should,” “will” and
“would” or the negative of these terms or other comparable
terminology.
Forward-looking statements contained in
this report are based on our beliefs, assumptions and expectations of our future
performance, taking into account all information currently available to
us. These beliefs, assumptions and expectations can change as a
result of many possible events or factors, not all of which are known to us or
are within our control. If a change occurs, our business, financial
condition, liquidity and results of operations may vary materially from those
expressed in our forward-looking statements. Forward-looking
statements we make in this report are subject to various risks and uncertainties
that could cause actual results to vary from our forward-looking statements,
including:
|
|
·
|
the
factors described in this report, including those set forth under the
sections captioned “Risk Factors” and
“Business;”
|
|
|
·
|
changes
in our industry, interest rates, the debt securities markets, real estate
markets or the general economy;
|
|
|
·
|
increased
rates of default and/or decreased recovery rates on our
investments;
|
|
|
·
|
availability,
terms and deployment of capital;
|
|
|
·
|
availability
of qualified personnel;
|
|
|
·
|
changes
in governmental regulations, tax rates and similar
matters;
|
|
|
·
|
changes
in our business strategy;
|
|
|
·
|
availability
of investment opportunities in commercial real estate-related and
commercial finance assets;
|
|
|
·
|
the
degree and nature of our
competition;
|
|
|
·
|
the
adequacy of our cash reserves and working capital;
and
|
|
|
·
|
the
timing of cash flows, if any, from our
investments.
|
We caution you not to place undue
reliance on these forward-looking statements which speak only as of the date of
this report. All subsequent written and oral forward-looking
statements attributable to us or any person acting on our behalf are expressly
qualified in their entirety by the cautionary statements contained or referred
to in this section. Except to the extent required by applicable law
or regulation, we undertake no obligation to update these forward-looking
statements to reflect events or circumstances after the date of this filing or
to reflect the occurrence of unanticipated events.
PART
I
|
BUSINESS
|
General
We are a specialty finance company that
focuses primarily on commercial real estate and commercial
finance. We are organized and conduct our operations to qualify as a
real estate investment trust, or REIT, for federal income tax
purposes. Our objective is to provide our stockholders with total
returns over time, including quarterly distributions and capital appreciation,
while seeking to manage the risks associated with our investment
strategy. We invest in a combination of commercial real estate debt
and other real estate-related assets and, to a lesser extent, higher-yielding
commercial finance assets. We have financed virtually all of our
portfolio investments through borrowing strategies seeking to match the
maturities and repricing dates of our financings with the maturities and
repricing dates of those investments, and to mitigate interest rate risk through
derivative instruments.
We are externally managed by Resource
Capital Manager, Inc., which we refer to as the Manager, a wholly-owned indirect
subsidiary of Resource America, Inc. (NASDAQ-GS: REXI), a specialized asset
management company that uses industry specific expertise to generate and
administer investment opportunities for its own account and for outside
investors in the commercial finance, real estate, and financial fund management
sectors. As of December 31, 2009, Resource America managed
approximately $13.3 billion of assets in these sectors. To provide
its services, the Manager draws upon Resource America, its management team and
their collective investment experience.
Our investments targeted asset
classes as follows:
|
Asset
Class
|
Principal
Investments
|
|
|
Commercial
real estate-related assets
|
· First
mortgage loans, which we refer to as whole loans
·
First priority interests in first mortgage real estate loans, which
we refer to as A notes
·
Subordinated interests in first mortgage real estate loans, which
we refer to as B notes
·
Mezzanine debt related to commercial real estate that is senior to
the borrower’s equity position but subordinated to other third-party
financing
·
Commercial mortgage-backed securities, which we refer to as
CMBS
|
|
|
Commercial
finance assets
|
· Senior
secured corporate loans, which we refer to as bank loans
·
Other asset-backed securities, which we refer to as other
ABS,
· Equipment
leases and notes, principally small- and middle-ticket commercial direct
financing leases and notes
· Debt
tranches of collateralized debt obligations and collateralized loan
obligations, which we refer to as CDOs and CLOs, respectively
|
Beginning in the second half of 2007,
there have been unprecedented disruptions in the credit markets, abrupt and
significant devaluations of assets directly or indirectly linked to the U.S.
real estate finance markets, and the attendant removal of liquidity, both long
and short term, from the capital markets. These conditions have had, and
we expect will continue to have, an adverse effect on us and companies we
finance. During the years ended December 31, 2009 and 2008, we recorded
provisions for loan and lease losses of $61.4 million and $46.2 million,
respectively. We also recorded net impairment losses during the year
ended December 31, 2009 of $13.5 million on our available-for-sale and
held-to-maturity securities. In addition, we recorded losses through
other comprehensive income of $47.6 million and $46.9 million on our
available-for-sale portfolio as of December 31, 2009 and 2008,
respectively.
The events occurring in the credit
markets have impacted our financing strategies. Historically, we have
used CDOs as a principal source of long-term match-funded financing; however,
the market for securities issued by new securitizations collateralized by assets
similar to those in our investment portfolio has largely disappeared, and we do
not expect to be able to sponsor new securitizations for the foreseeable
future. The availability of short-term financing through warehouse
lines of credit and repurchase agreements has contracted severely as a result of
the increased volatility in the valuation of assets similar to those we
originate. These events have impacted (and we expect will continue to
impact) our ability to grow and finance our business on a long-term,
match-funded basis and our ability to build our investment portfolio
securities.
We calculate our distributions to our
shareholders based on our estimate of our REIT taxable income, which may vary
greatly from our net income calculated in accordance with U.S. generally
accepted accounting principles, or GAAP. We expect that our REIT taxable income
will be comprised primarily of our net investment income and our fee
income. We expect that our REIT taxable income will be greater than
our GAAP net income primarily because asset impairments and provisions for loan
and lease losses are not deductible until realized for tax purposes as well as
net book to tax adjustments for our taxable foreign REIT subsidiaries and fee
income received by our taxable REIT subsidiaries, or TRSs, that is dividended to
us and included in our REIT taxable income but deferred or eliminated for GAAP
purposes. For further discussion, see “Management’s Discussion and
Analysis of Financial Condition and Results of Operations.”
Our
Business Strategy
The core components of our business
strategy are:
Managing our
investment portfolio. As of December
31, 2009, we managed $1.8 billion of assets, including $1.6 billion of assets
financed and held in CDOs. The core of our management process is
credit analysis which we use to actively monitor our existing investments and as
a basis for evaluating new investments. Senior management of our
Manager and Resource America has extensive experience in underwriting the credit
risk associated with our targeted asset classes, and conducts detailed due
diligence on all credit-sensitive investments, including the use of proprietary
credit stratifications and collateral stresses. After making an
investment, the Manager and Resource America engage in active monitoring of our
investments for early detection of troubled and deteriorating
securities. If a default occurs, we will use our senior management
team’s asset management skills to mitigate the severity of any losses, and we
will seek to optimize the recovery from assets if we foreclose upon
them.
Managing our
interest rate and liquidity risk. We generally seek to manage
interest rate and liquidity risk so as to reduce the effects of interest rate
changes on us. On our long-term financing we seek to match the
maturity and repricing dates of our investments with the maturities and
repricing dates of our financing. Historically, we have used CDO
vehicles structured for us by our Manager to achieve this
goal. Currently, we finance new investments through existing capacity
in our CDOs or through cash available from principal repayments on or payoffs of
existing investments. We also seek to mitigate interest rate risk
through derivative instruments.
Historically, we managed our interest
rate and liquidity risk on our short-term financing, principally repurchase
agreements, by limiting the amount of our financial exposure under the
facilities to either a stated investment amount or a fixed guaranty
amount. As a result of current market conditions, as of December 31,
2009 we had paid off our short term repurchase agreements.
Investment in
real estate and commercial finance assets. We expect to
continue to invest in commercial real estate whole loans, B notes, mezzanine
debt, CMBS rated below AAA by Standard & Poors, or S&P, commercial
finance assets, including bank loans, and to a lesser extent, direct financing
leases and notes, subject to the availability of investment funds and
financing. Our equity at December 31, 2009 was invested 76.4% in
commercial real estate loans, 23.2% in commercial bank loans and 0.4% in direct
financing lease and notes. In 2010, we expect to recycle capital
within our CDO structures to make a limited amount of new investments to replace
loans that have been paid down or paid off and to replace loans that may be
sold.
Debt
repurchase. We have been able to take advantage of market
illiquidity that resulted in limited trading of our CRE CDO notes by buying
these debt securities at substantial discounts to par. This strategy,
which has generated significant gains on the extinguishment of the debt, has
allowed us to offset credit losses in the loan and lease portfolio and
impairment losses in the investment securities portfolio. In 2009, we
bought $55.5 million par value of our CRE CDO debt at a discount to par of
80.23% for approximately $11.0 million (or approximately $0.20 on the
dollar). As a result, our gain on the extinguishment of debt for 2009
was $44.5 million which offset in part the credit and impairment losses we
realized in 2009.
Diversification
of investments. We seek to manage our investment risk by
maintaining a diversified portfolio of real estate-related and commercial
finance assets. As funds become available for investment or
reinvestment, we seek to maintain that diversification while allocating our
capital to those sectors that we believe are the most economically
attractive. The percentage of assets that we may invest in certain of
our targeted asset classes is subject to the federal income tax requirements for
REIT qualification and the requirements for exclusion from Investment Company
Act regulation.
Our
Operating Policies and Strategies
Investment
guidelines. We have established investment policies,
procedures and guidelines that are reviewed and approved by our investment
committee and board of directors. The investment committee meets
regularly to monitor the execution of our investment strategies and our progress
in achieving our investment objectives. As a result of our investment
strategies and targeted asset classes, we acquire our investments primarily for
income. We do not have a policy that requires us to focus our
investments in one or more particular geographic areas.
Financing
policies. We have used leverage in order to increase potential
returns to our stockholders and for financing our portfolio. We do
not speculate on changes in interest rates. While we have identified
our leverage targets for each of our targeted asset classes, our investment
policies require no minimum or maximum leverage and our investment committee has
the discretion, without the need for further approval by our board of directors,
to increase the amount of leverage we incur above our targeted range for
individual asset classes.
We have historically used borrowing and
securitization strategies, substantially through CDOs, to accomplish our
long-term match funding, financing strategy. However, the
developments in the credit markets, particularly since the second half of 2007,
have significantly limited our ability to execute our long term financing
strategy. In the foreseeable future, we will seek to finance our
investments through investing restricted cash and reinvesting loan repayments
received under our current securitized financings, and to the extent available,
bank lines of credit and other methods that preserve our capital.
Hedging and
interest rate management strategy. We use derivative financial
instruments to hedge a portion of the interest rate risk associated with our
borrowings. Under the federal income tax laws applicable to REITs, we
generally will be able to enter into transactions to hedge indebtedness that we
may incur, or plan to incur, to acquire or carry real estate assets, provided
that our total gross income from such hedges and other non-qualifying sources
must not exceed 25% of our total gross income. These hedging
transactions may include interest rate swaps, collars, caps or floors, puts and
calls and options.
Credit and risk
management policies. Our Manager focuses its attention on
credit and risk assessment from the earliest stage of the investment selection
process. In addition, the Manager screens and monitors all potential
investments to determine their impact on maintaining our REIT qualification
under federal income tax laws and our exclusion from investment company status
under the Investment Company Act of 1940. Risks related to portfolio
management, including the management of risks related to credit losses, interest
rate volatility, liquidity and counterparty credit are generally managed on a
portfolio-by-portfolio basis by each of Resource America’s asset management
divisions, although there is often interaction and cooperation between divisions
in this process.
Our
Investment Strategy
General
The following table describes our
investment-class allocations and certain characteristics of each class as of
December 31, 2009 (dollars in thousands):
|
Amortized
cost
|
Estimated
fair
value
(1)
|
Percent
of
portfolio
|
Weighted
average coupon
|
|||||||||||||
|
Loans
Held for Investment:
|
||||||||||||||||
|
Commercial real estate
loans:
|
||||||||||||||||
|
Mezzanine loans
|
$ | 182,686 | $ | 176,117 | 11.1% | 4.82% | ||||||||||
|
B notes
|
81,477 | 80,283 | 5.0% | 6.07% | ||||||||||||
|
Whole loans
|
484,195 | 460,612 | 29.0% | 5.50% | ||||||||||||
|
Bank loans
|
865,501 | 827,951 | 52.1% | 2.91% | ||||||||||||
| 1,613,859 | 1,544,963 | 97.2% | ||||||||||||||
|
Investments
in Available-for-Sale Securities:
|
||||||||||||||||
|
CMBS
|
92,110 | 44,518 | 2.8% | 4.69% | ||||||||||||
|
Other ABS
|
24 | 24 | −% | 2.74% | ||||||||||||
| 92,134 | 44,542 | 2.8% | ||||||||||||||
|
Investments
in direct financing leases and notes
|
2,067 | 927 | −% | 9.30% | ||||||||||||
|
Total portfolio/weighted
average
|
$ | 1,708,060 | $ | 1,590,432 | 100.0% | 4.08% | ||||||||||
|
(1)
|
The
fair value of our investments represents our management’s estimate of the
price that a market participant would pay for such
assets. Management bases this estimate on the underlying
interest rates and credit spreads for fixed-rate securities and, to the
extent available, quoted market
prices.
|
Commercial
Real Estate-Related Investments
Whole
loans. We originate first
mortgage loans, or whole loans, directly to borrowers. The direct
origination of whole loans enables us to better control the structure of the
loans and to maintain direct lending relationships with the
borrowers. We may create senior tranches of a loan, consisting of an
A note (described below), B notes (described below), mezzanine loans or other
participations, which we may hold or sell to third parties. We do not
obtain ratings on these investments. At origination, our whole loan
investments had loan to value, or LTV, ratios of up to 80%. We expect
to hold our whole loans to their maturity. In 2008 and 2009, we
modified 28 commercial real estate loans which in many cases involved adjusting
LIBOR floors to bring the interest rates on these loans closer to
market.
Senior interests
in whole loans (A notes). We invest in
senior interests in whole loans, referred to as A notes, either directly
originated or purchased from third parties. A notes are loans that,
generally, consist of senior participations in, or a senior tranche within a
first mortgage. We do not obtain ratings on these
investments. At the date of investment, our A note investments had
LTV ratios of up to 70%. We expect to hold our A note investments to
their maturity.
Subordinate
interests in whole loans (B notes). We invest in
subordinate interests in whole loans, referred to as B notes, which we either
directly originate or purchase from third parties. B notes are loans
secured by a first mortgage and subordinated to an A note. The
subordination of a B note is generally evidenced by an intercreditor or
participation agreement between the holders of the A note and the B
note. In some instances, the B note lender may require a security
interest in the stock or partnership interests of the borrower as part of the
transaction. B note lenders have the same obligations, collateral and
borrower as the A note lender, but typically are subordinated in recovery upon a
default to the A note lender. B notes share certain credit
characteristics with second mortgages in that both are subject to greater credit
risk with respect to the underlying mortgage collateral than the corresponding
first mortgage or A note. We do not obtain ratings on these
investments. At the date of investment, our B note investments had
LTV ratios of between 55% and 80%. Typical B note investments will
have terms of three years to five years, and are generally structured with an
original term of up to three years, with one-year extensions that bring the loan
to a maximum term of five years. We expect to hold our B note
investments to their maturity.
In addition to the interest payable on
the B note, we may earn fees charged to the borrower under the note or
additional income by receiving principal payments in excess of the discounted
price (below par value) we paid to acquire the note. Our ownership of
a B note with controlling class rights may, in the event the financing fails to
perform according to its terms, cause us to elect to pursue our remedies as
owner of the B note, which may include foreclosure on, or modification of, the
note. In some cases, the owner of the A note may be able to foreclose
or modify the note against our wishes as owner of the B note. As a
result, our economic and business interests may diverge from the interests of
the owner of the A note.
Mezzanine
financing. We invest in
mezzanine loans that are senior to the borrower’s equity in, and subordinate to
a first mortgage loan on, a property. These loans are secured by
pledges of ownership interests, in whole or in part, in entities that directly
own the real property. In addition, we may require other collateral
to secure mezzanine loans, including letters of credit, personal guarantees of
the principals of the borrower, or collateral unrelated to the
property. We may structure our mezzanine loans so that we receive a
stated fixed or variable interest rate on the loan as well as a percentage of
gross revenues and a percentage of the increase in the fair market value of the
property securing the loan, payable upon maturity, refinancing or sale of the
property. Our mezzanine loans may also have prepayment lockouts,
penalties, minimum profit hurdles and other mechanisms to protect and enhance
returns in the event of premature repayment. At the date of
investment, our mezzanine investments had LTV ratios between 65% and
90%. We expect the stated maturity of our mezzanine financings to
range from three to five years. Mezzanine loans may have maturities
that match the maturity of the related mortgage loans but may have shorter or
longer terms. We expect to hold these investments to
maturity.
The
following charts describe the loan type, property type and the geographic
breakdown of our commercial real estate loan portfolio as of December 31, 2009
(based on par value):
Loan
Type

Property
Type
Geographic
by State
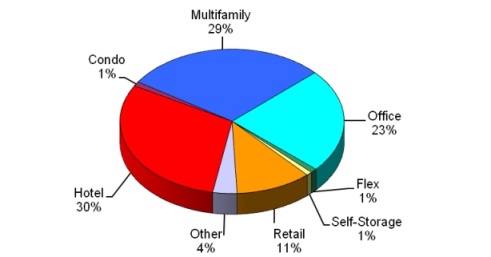
As these charts demonstrate, our
portfolio contains a diversified mix of property types with approximately 93% of
the portfolio focus on four types, Multifamily 29%, Office 23%, Hotel 30% and
Retail 11%.
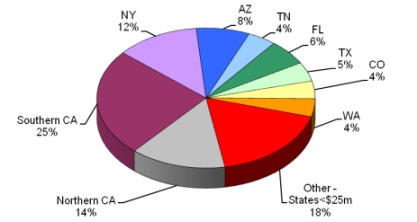
Our geographic mix includes
approximately 39% in California, or CA, which we split into Southern (25%) and
Northern (14%) regions. Within the Southern CA region, we have 86% of
our portfolio in whole loans and 82% in four property types, Hotel 48%, Office
15%, Retail 12% and Multifamily 7%. Within the Northern CA region, we
have 86% of our portfolio in whole loans and 86% in two property types,
Multifamily 63% and Retail 23%. As noted in these statistics, this
portfolio is made up primarily of whole loans where we are able to better
control the structure of the loan and maintain a direct lending relationship
with the borrower. We view the investment and credit strategy as
being adequately diversified across property type and loan type across both the
Southern and Northern CA regions.
CMBS. We invest in
CMBS, which are securities that are secured by or evidence interests in a pool
of mortgage loans secured by commercial properties. These securities
may be senior or subordinate and may be either investment grade or
non-investment grade. The majority of our CMBS investments have been
rated by at least one nationally recognized rating agency.
The yields on CMBS depend on the timely
payment of interest and principal due on the underlying mortgage loans and
defaults by the borrowers on such loans may ultimately result in deficiencies
and defaults on the CMBS. In the event of a default, the trustee for
the benefit of the holders of CMBS has recourse only to the underlying pool of
mortgage loans and, if a loan is in default, to the mortgaged property securing
such mortgage loan. After the trustee has exercised all of the rights
of a lender under a defaulted mortgage loan and the related mortgaged property
has been liquidated, no further remedy will be available. However,
holders of relatively senior classes of CMBS will be protected to a certain
degree by the structural features of the securitization transaction within which
such CMBS were issued, such as the subordination of the relatively more junior
classes of the CMBS.
Other
Real Estate Investments
We invest in joint ventures and other
interests that finance the acquisition
of distressed commercial properties and mortgage loans on distressed commercial properties. These
interests have the objective of repositioning the directly owned properties and
the collateral underlying the mortgages, where applicable, to enhance their
value and realize capital appreciation. During 2009, these
investments did not constitute a material portion of our assets. During
2010, depending upon our capital position, credit market conditions and the
availability of investment opportunities, we may seek to expand our investments
in this area. Our investment is included in investments in
unconsolidated subsidiaries at December 31, 2009 on our consolidated balance
sheet.
Residential
Real Estate-Related Investments
Historically, we had invested in agency
RMBS and non-agency ABS-RMBS portfolios. We sold our agency RMBS
portfolio in September 2006. We sold 10% of the equity invested in
Ischus CDO II in November 2007 and as a result, impaired the investment by $26.3
million in 2007. As a result of the sale, we deconsolidated the
variable interest entity that owned the portfolio in the quarter ended December
31, 2007 and recovered the balance of our remaining investment in
2008. We do not anticipate investing in agency RMBS or non-agency
RMBS for the foreseeable future.
Commercial
Finance Investments
Subject to limitations imposed by REIT
qualification standards and requirements for exclusion from regulation under the
Investment Company Act of 1940, which we refer to as the Investment Company Act,
we may invest in the following commercial finance assets:
Bank
loans. We acquire senior
and subordinated, secured and unsecured loans made by banks or other financial
entities. Bank loans may also include revolving credit facilities,
under which the lender is obligated to advance funds to the borrower under the
credit facility as requested by the borrower from time to time. We
expect that some amount of these loans will be secured by mortgages and liens on
the assets of the borrowers. Certain of these loans may have an
interest-only payment schedule, with the principal amount remaining outstanding
and at risk until the maturity of the loan. These loans may include
restrictive financial and operating covenants. We also have invested,
to a lesser extent, in bonds which pay holders a coupon periodically until
maturity of the bonds, when the face value is due.
The following chart describes the
industry breakdown of our bank loans as of December 31, 2009 (based on par
value):
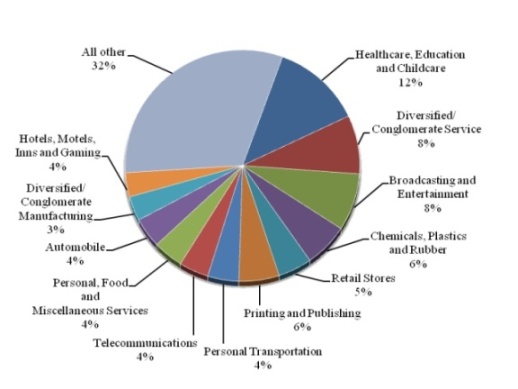
(1) All
other is made up of the following industries (by percentage):
|
CLO
securities
|
3.8%
|
||
|
Aerospace
and defense
|
2.8%
|
||
|
Leisure,
Amusement, Motion Pictures, Entertainment
|
2.8%
|
||
|
Buildings
and real estate
|
2.2%
|
||
|
Beverage,
food and tobacco
|
2.1%
|
||
|
Ecological
|
2.1%
|
||
|
Utilities
|
2.1%
|
||
|
Electronics
|
2.1%
|
||
|
Finance
|
2.1%
|
||
|
Containers,
packaging and glass
|
1.8%
|
||
|
Oil
and gas
|
1.8%
|
||
|
Personal
and nondurable consumer products
|
1.7%
|
||
|
Machinery
(non-agriculture, non-construction, non-electronic)
|
1.2%
|
||
|
Cargo
transport
|
0.9%
|
||
|
Mining,
steel, iron and non-precious metals
|
0.7%
|
||
|
Textiles
and leather
|
0.6%
|
||
|
Insurance
|
0.5%
|
||
|
Home
and office furnishings, housewares and durable consumer
products
|
0.4%
|
||
|
Farming
and agriculture
|
0.3%
|
Equipment leases
and notes. We invest in
small- and middle-ticket full payout equipment leases and
notes. Under full payout leases and notes, the payments we receive
over the term of the financing will return our invested capital plus an
appropriate return without consideration of the value of the leased equipment at
the end of the lease or note term, known as the residual, and the obligor will
acquire the equipment at the end of the payment term. We focus on
equipment and other assets that are essential for businesses to conduct their
operations so that end users will be highly motivated to make required monthly
payments. We focus on equipment in the following areas:
|
|
·
|
general
office equipment, such as office machinery, furniture and telephone and
computer systems;
|
|
|
·
|
medical
and dental practices and equipment for diagnostic and treatment
use;
|
|
|
·
|
energy
and climate control systems;
|
|
|
·
|
industrial
equipment, including manufacturing, material handling and electronic
diagnostic systems; and
|
|
|
·
|
agricultural
equipment and facilities.
|
The following charts describe the
industry and the geographic breakdown of our equipment leases and notes as of
December 31, 2009 (based on par value):
Equipment Lease and
Notes by Industry
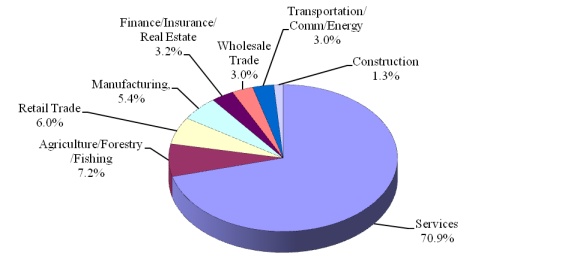
Geographic
by State
Trust preferred
securities and other ABS. We have one
investment (less than 0.1% of our total assets) in trust preferred
securities. Trust preferred securities are issued by a special
purpose trust that holds a subordinated debenture or other debt obligation
issued by a company to the trust. The sponsoring company holds the
equity interest in the trust, with the preferred securities of the trust being
sold to investors. The trust invests the proceeds of the preferred
securities in the sponsoring company through the purchase of a debenture issued
by it that tracks the terms of the trust preferred
securities. Issuers of trust preferred securities are generally
affiliated with financial institutions because, under current regulatory and tax
structures, unlike the proceeds from debt securities the proceeds from trust
preferred securities may be treated as primary regulatory capital by the
financial institution, while it may deduct the interest it pays on the debt
obligation held by the trust from its income for federal income tax
purposes.
Competition
See “Risk Factors” - “Risks Relating to
Our Business”
Management
Agreement
We have a management agreement with the
Manager and Resource America under which the Manager provides the day-to-day
management of our operations. The management
agreement requires the Manager to manage our business affairs in conformity with
the policies and the investment guidelines established by our board of
directors. The Manager’s role as manager is under the supervision and
direction of our board of directors. The Manager is responsible for
the selection, purchase and sale of our portfolio investments, our financing
activities, and providing us with investment advisory services. The
Manager also must provide us with a Chief Financial Officer. The
Manager receives fees and is reimbursed for its expenses as
follows:
|
|
·
|
A
monthly base management fee equal to 1/12th of the amount of our equity
multiplied by 1.50%. Under the management agreement, ‘‘equity’’
is equal to the net proceeds from any issuance of shares of common stock
less offering related costs, plus or minus our retained earnings
(excluding non-cash equity compensation incurred in current or prior
periods) less any amounts we have paid for common stock
repurchases. The calculation is adjusted for one-time events
due to changes in accounting principles generally accepted in the United
States, which we refer to as GAAP, as well as other non-cash charges, upon
approval of our independent
directors.
|
|
|
·
|
Incentive
compensation calculated as follows: (i) twenty-five percent
(25%) of the dollar amount by which (A) our Adjusted Operating
Earnings (before Incentive Compensation but after the Base Management Fee)
for such quarter per Common Share (based on the weighted average number of
Common Shares outstanding for such quarter) exceeds (B) an
amount equal to (1) the weighted average of the price per share of
the Common Shares in the initial offering by us and the prices per share
of the Common Shares in any subsequent offerings by us, in each case at
the time of issuance thereof, multiplied by (2) the greater of
(a) 2.00% and (b) 0.50% plus one-fourth of the Ten Year Treasury
Rate for such quarter, multiplied by (ii) the weighted average number
of Common Shares outstanding during such quarter subject to adjustment; to
exclude events pursuant to changes in GAAP or the application of GAAP, as
well as non-recurring or unusual transactions or events, after discussion
between the Manager and the Independent Directors and approval by a
majority of the Independent Directors in the case of non-recurring or
unusual transactions or
events.
|
|
|
·
|
Reimbursement
of out-of-pocket expenses and certain other costs incurred by the Manager
that relate directly to us and our
operations.
|
|
|
·
|
Pursuant
to an amendment on October 16, 2009, the Manager will, in addition to a
Chief Financial Officer, provide us with three accounting professionals,
each of whom will be exclusively dedicated to our operations, and a
director of investor relations who will be 50% dedicated to our
operations. The amendment also provides that we will reimburse
the Manager for the expense of the wages, salaries and benefits of the
Chief Financial Officer and three accounting professionals and 50% of the
salary and benefits of the director of investor
relations.
|
Incentive compensation is paid
quarterly to the extent any is earned. Up to seventy-five percent
(75%) of the incentive compensation will be paid in cash and at least
twenty-five percent (25%) will be paid in the form of a stock
award. The Manager may elect to receive more than 25% of its
incentive compensation in stock. All shares are fully vested upon
issuance. However, the Manager may not sell such shares for one year
after the incentive compensation becomes due and payable unless the management
agreement is terminated. Shares payable as incentive compensation are
valued as follows:
|
|
·
|
if
such shares are traded on a securities exchange, at the average of the
closing prices of the shares on such exchange over the thirty day period
ending three days prior to the issuance of such
shares;
|
|
|
·
|
if
such shares are actively traded over-the-counter, at the average of the
closing bid or sales price as applicable over the thirty day period ending
three days prior to the issuance of such shares;
and
|
|
|
·
|
if
there is no active market for such shares, at the fair market value as
reasonably determined in good faith by our board of
directors.
|
In conjunction with the December 2009
common stock offering, we and Resource America agreed that for the quarters
ending on December 31, 2009 and March 31, 2010, the total incentive management
fee payable to the Manager pursuant to the Amended and Restated Management
Agreement dated as of June 30, 2008, shall not exceed $1.5 million per
quarter.
The initial term of the management
agreement expired on March 31, 2009 with automatic one year renewals on that
date and each anniversary thereafter. Our board of directors reviews
the Manager’s performance annually. The management agreement may be
terminated annually upon the affirmative vote of at least two-thirds of our
independent directors, or by the affirmative vote of the holders of at least a
majority of the outstanding shares of our common stock, based upon
unsatisfactory performance that is materially detrimental to us or a
determination by our independent directors that the management fees payable to
the Manager are not fair, subject to the Manager’s right to prevent such a
compensation termination by accepting a mutually acceptable reduction of
management fees. Our board of directors must provide 180 days’ prior notice of
any such termination. If we terminate the management agreement, the
Manager is entitled to a termination fee equal to four times the sum of the
average annual base management fee and the average annual incentive compensation
earned by the Manager during the two 12-month periods immediately preceding the
date of termination, calculated as of the end of the most recently completed
fiscal quarter before the date of termination.
We may also terminate the management
agreement for cause with 30 days’ prior written notice from our board of
directors. No termination fee is payable with respect to a
termination for cause. The management agreement defines cause
as:
|
|
·
|
the
Manager’s continued material breach of any provision of the management
agreement following a period of 30 days after written notice
thereof;
|
|
|
·
|
the
Manager’s fraud, misappropriation of funds, or embezzlement against
us;
|
|
|
·
|
the
Manager’s gross negligence in the performance of its duties under the
management agreement;
|
|
|
·
|
the
bankruptcy or insolvency of the Manager, or the filing of a voluntary
bankruptcy petition by the Manager;
|
|
|
·
|
the
dissolution of the Manager; and
|
|
|
·
|
a
change of control (as defined in the management agreement) of the Manager
if a majority of our independent directors determines, at any point during
the 18 months following the change of control, that the change of control
was detrimental to the ability of the Manager to perform its duties in
substantially the same manner conducted before the change of
control.
|
Cause does not include unsatisfactory
performance that is materially detrimental to our business.
The management agreement will terminate
at the Manager’s option, without payment of the termination fee, in the event we
become regulated as an investment company under the Investment Company Act, with
such termination deemed to occur immediately before such event.
Regulatory
Aspects of Our Investment Strategy: Exclusion from Regulation Under
the Investment Company Act.
We operate our business so as to be
excluded from regulation under the Investment Company Act. Because we
conduct our business through wholly-owned subsidiaries, we must ensure not only
that we qualify for an exclusion from regulation under the Investment Company
Act, but also that each of our subsidiaries so qualifies.
We believe that RCC Real Estate, Inc.,
the subsidiary that as of December 31, 2009 held all of our commercial real
estate loan assets, is excluded from Investment Company Act regulation under
Sections 3(c)(5)(C) and 3(c)(6), provisions designed for companies that do
not issue redeemable securities and are primarily engaged in the business of
purchasing or otherwise acquiring mortgages and other liens on and interests in
real estate. To qualify for this exclusion, at least 55% of RCC Real
Estate’s assets must consist of mortgage loans and other assets that are
considered the functional equivalent of mortgage loans for purposes of the
Investment Company Act, which we refer to as “qualifying real estate
assets.” Moreover, 80% of RCC Real Estate’s assets must consist of
qualifying real estate assets and other real estate-related
assets. RCC Real Estate has not issued, and does not intend to issue,
redeemable securities.
We treat our investments in whole
mortgage loans, specific types of B notes and specific types of mezzanine loans
as qualifying real estate assets for purposes of determining our eligibility for
the exclusion provided by Section 3(c)(5)(C) to the extent such treatment
is consistent with guidance provided by the SEC or its staff. We believe that
SEC staff guidance allows us to treat B notes as qualifying real estate assets
where we have unilateral rights to instruct the servicer to foreclose upon a
defaulted mortgage loan, replace the servicer in the event the servicer, in its
discretion, elects not to foreclose on such a loan, and purchase the A note in
the event of a default on the mortgage loan. We believe, based upon
an analysis of existing SEC staff guidance, that we may treat mezzanine loans as
qualifying real estate assets where (i) the borrower is a special purpose
bankruptcy-remote entity whose sole purpose is to hold all of the ownership
interests in another special purpose entity that owns commercial real property,
(ii) both entities are organized as limited liability companies or limited
partnerships, (iii) under their organizational documents and the loan
documents, neither entity may engage in any other business, (iv) the
ownership interests of either entity have no value apart from the underlying
real property which is essentially the only asset held by the property-owning
entity, (v) the value of the underlying property in excess of the amount of
senior obligations is in excess of the amount of the mezzanine loan,
(vi) the borrower pledges its entire interest in the property-owning entity
to the lender which obtains a perfected security interest in the collateral, and
(vii) the relative rights and priorities between the mezzanine lender and
the senior lenders with respect to claims on the underlying property is set
forth
in an
intercreditor agreement between the parties which gives the mezzanine lender
certain cure and purchase rights in case there is a default on the senior
loan. If the SEC staff provides future guidance that these
investments are not qualifying real estate assets, we will treat them, for
purposes of determining our eligibility for the exclusion provided by
Section 3(c)(5)(C), as real estate-related assets or miscellaneous assets,
as appropriate. Historically, we have held “whole pool certificates”
in mortgage loans, although, at December 31, 2009, we had no whole pool
certificates in our portfolios. Pursuant to existing SEC staff
guidance, we consider whole pool certificates to be qualifying real estate
assets. A whole pool certificate is a certificate that represents the
entire beneficial interest in an underlying pool of mortgage
loans. By contrast, a certificate that represents less than the
entire beneficial interest in the underlying mortgage loans is not considered to
be a qualifying real estate asset for purposes of the 55% test, but constitutes
a real estate-related asset for purposes of the 80% test. We do not
expect that investments in CDOs, other ABS, bank loans, equipment leases and
notes, trust preferred securities and private equity will constitute qualifying
real estate assets. Moreover, to the extent that these investments
are not backed by mortgage loans or other interests in real estate, they will
not constitute real estate-related assets. Instead, they will
constitute miscellaneous assets, which can constitute no more than 20% of RCC
Real Estate’s assets.
To the extent RCC Real Estate holds its
commercial real estate loan assets through wholly-owned CDO subsidiaries, RCC
Real Estate also intends to conduct its operations so that it will not come
within the definition of an investment company set forth in Section 3(a)(1)(C)
of the Investment Company Act because less than 40% of the value of its total
assets on an unconsolidated basis will consist of “investment securities,” which
we refer to as the 40% test. “Investment securities” exclude U.S.
government securities and securities of majority-owned subsidiaries that are not
themselves investment companies and are not relying on the exception from the
definition of investment company under Section 3(c)(1) or
Section 3(c)(7) of the Investment Company Act. Certain of the
wholly-owned CDO subsidiaries of RCC Real Estate rely on Section 3(c)(5)(C)
for their Investment Company Act exemption, with the result that RCC Real
Estate’s interests in the CDO subsidiaries do not constitute “investment
securities” for the purpose of the 40% test.
Our other subsidiaries, RCC Commercial,
Inc. and Resource TRS, Inc. do not qualify for the Section 3(c)(5)(C)
exclusion. However, we believe they qualify for exclusion under
either Section 3(c)(1) or 3(c)(7). As required by these
exclusions, we will not allow either entity to make, or propose to make, a
public offering of its securities. In addition, with respect to those
subsidiaries for which we rely upon the Section 3(c)(1) exclusion, and as
required thereby, we limit the number of holders of their securities to not more
than 100 persons calculated in accordance with the attribution rules of Section
3(c)(1) and, with respect to those subsidiaries for which we rely on the Section
3(c)(7) exclusion, and as required thereby, we limit ownership of their
securities to “qualified purchasers.” If we form other subsidiaries,
we must ensure that they qualify for an exemption or exclusion from regulation
under the Investment Company Act.
Moreover, we must ensure that Resource
Capital Corp. itself qualifies for an exclusion from regulation under the
Investment Company Act. We will do so by monitoring the value of our interests
in our subsidiaries. At all times, we must ensure that Resource
Capital Corp. meets the 40% test. Our interest in RCC Real Estate
does not constitute an “investment security” for purposes of the 40% test, but
our interest in RCC Commercial does, and our interest in Resource TRS may in the
future, constitute “investment securities.” Accordingly, we must
monitor the value of our interest in these two subsidiaries to ensure that the
value of our interests in them never exceeds 40% of the value of our total
assets.
We have not received, nor have we
sought, a no-action letter from the SEC regarding how our investment strategy
fits within the exclusions from regulation under the Investment Company
Act. To the extent that the SEC provides more specific or different
guidance regarding the treatment of assets as qualifying real estate assets or
real estate-related assets, we may have to adjust our investment
strategy. Any additional guidance from the SEC could further inhibit
our ability to pursue our investment strategy.
Employees
We have no direct
employees. Under our management agreement, the Manager provides us
with all management and support personnel, including a Chief Financial Officer,
and services necessary for our day-to-day operations. Pursuant to an
amendment on October 16, 2009, the Manager will provide us with three accounting
professionals, each of whom will be exclusively dedicated to our operations, and
a director of investor relations who will be 50% dedicated to our
operations. The amendment also provides we will bear the expense of
the wages, salaries and benefits of the Chief Financial Officer and three
accounting professionals, and 50% of the salary and benefits of the director of
investor relations. We depend upon the Manager and Resource America
for personnel and administrative infrastructure. To provide its
services, the Manager draws upon the expertise and experience of Resource
America. As of December 31, 2009, Resource America had 721 employees
involved in asset management, including 118 asset management professionals and
603 asset management support personnel, respectively.
Corporate Governance and Internet
Address
We emphasize the importance of
professional business conduct and ethics through our corporate governance
initiatives. Our board of directors consists of a majority of
independent directors, as defined in the Securities Exchange Act of 1934, as
amended, and relevant New York Stock Exchange, or NYSE, rules. The
audit, compensation and nominating/corporate governance committees of our board
of directors are composed exclusively of independent directors. We
have adopted corporate governance guidelines and a code of business conduct and
ethics, which delineate our standards for our officers and directors, and
employees of our manager.
Our internet address is
www.resourcecapitalcorp.com. We make available, free of charge
through a link on our site, all reports filed with the SEC as soon as reasonably
practicable after such filing. Our site also contains our code of
business conduct and ethics, corporate governance guidelines and the charters of
the audit committee, nominating and governance committee and compensation
committee of our board of directors. A complete list of our filings
is available on the Securities and Exchange Commission’s website at www.sec.gov. Any
of our filings are also available at the Securities and Exchange Commission’s
Public Reference Room at 100 F Street, N.E., Room 1580, Washington, D.C.
20549. The Public Reference Room may be contacted at telephone number
(800) 732-0330 for further information.
|
RISK
FACTORS
|
This section describes material risks
affecting our business. In connection with the forward-looking statements that
appear in this annual report, you should carefully review the factors discussed
below and the cautionary statements referred to in “Forward-Looking
Statements.”
Impact
of Current Economic Conditions
Continuance
of current economic conditions could further harm our financial condition,
income and ability to make distributions to our stockholders.
Beginning in mid-2007 and continuing
through the date of this report, the financial system in the United States,
including credit markets and markets for real estate and real estate-related
assets, has been subject to unprecedented turmoil. This turmoil has
resulted in severe limitations on the availability of credit, significant
declines in the value of real estate and real estate related assets, impairment
of the ability of many borrowers to repay their obligations and illiquidity in
the markets for real estate and real estate-related assets. These
events have had significant adverse effects on us including incurrence of
impairment charges with respect to investments we hold, significant increases in
our provision for loan losses and the unavailability of financing to support new
investments. As a result, our income, our ability to make
distributions and the price of our common stock have declined
significantly. Continuation of current economic conditions could
further harm our financial condition, income, ability to make distributions to
our stockholders and the price of our common stock.
Actions
taken by the U.S. government and governmental agencies may not reverse, or even
stabilize, current economic conditions.
In response to current economic and
market conditions, the U.S. government and a number of governmental agencies
have established or proposed a series of programs designed to stabilize the
financial system and credit markets, including programs established pursuant to
the Emergency Economic Stabilization Act of 2008 and the American Recovery and
Reinvestment Tax Act of 2009. We are unable to evaluate whether these
programs have had or will have in the future their intended effect, or, if they
have effects in the future, whether they will have a beneficial impact upon our
financial condition, income or ability to make distributions to our stockholders
or if the proposed programs will be instituted in their current
form.
Risks
Related to Our Financing
Our
portfolio has been financed in material part through the use of leverage, which
may reduce the return on our investments and cash available for
distribution.
Our portfolio has been financed in
material part through the use of leverage. Using leverage subjects us
to risks associated with debt financing, including the risks that:
|
|
·
|
the
cash provided by our operating activities will not be sufficient to meet
required payments of principal and
interest,
|
|
|
·
|
the
cost of financing may increase relative to the income from the assets
financed, reducing the income we have available to pay distributions,
and
|
|
|
·
|
our
investments may have maturities that differ from the maturities of the
related financing and, consequently, the risk that the terms of any
refinancing we obtain will not be as favorable as the terms of existing
financing.
|
If
we are unable to secure refinancing of our currently outstanding financing, when
due, on acceptable terms, we may be forced to dispose of some of our assets at
disadvantageous terms or to obtain financing at unfavorable terms, either of
which may result in losses to us or reduce the cash flow available to meet our
debt service obligations or to pay distributions.
Financing that we may obtain and
financing we have obtained through CDOs, does require us to maintain a specified
ratio of the amount of the financing to the value of the assets
financed. A decrease in the value of these assets may lead to margin
calls or calls for the pledge of additional assets which we will have to
satisfy. We may not have sufficient funds or unpledged assets to
satisfy any such calls.
Under
current economic and market conditions we are significantly constrained in our
ability to obtain the capital and financing necessary for growth. As
a result, our profitability, ability to make distributions and the market price
of our common stock have been harmed. Continuation or further
deterioration of current conditions could further harm our profitability,
ability to make distributions and the market price of our common
stock.
We depend upon the availability of
adequate funding and capital for our operations. Although we
successfully completed an offering of common stock in December 2009, in general,
our ability to obtain debt financing and, to a lesser extent, equity capital has
been significantly constrained as a result of current economic and market
conditions, which has impaired our profitability, our ability to make
distributions and the market price of our common stock. Moreover, as
a REIT, we must distribute annually at least 90% of our REIT taxable income,
determined without regard to the deduction for dividends paid and excluding net
capital gain, to our stockholders and are therefore not able to retain
significant amounts of our earnings for new investments. While the
newly-promulgated Rev. Proc. 2010-12, allows us to satisfy this requirement by
distributing common shares for up to 90% of the amount of a required
distribution, such regulatory relief is currently only available through
December 2011. Moreover, although Resource TRS, our TRS, may retain
earnings as new capital, we are subject to REIT qualification requirements which
limit the relative value of TRS stock and securities to the other assets owned
by a REIT. Consequently, we depend upon the availability of financing
and additional capital to provide us with the funding necessary to permit
growth. Continuation or further deterioration of current economic and
market conditions could further impair our ability to acquire and finance
assets, thereby reducing or eliminating our profitability and ability to make
distributions, impairing the market price of our common
stock. Moreover, even if funding or capital were available, we cannot
assure you that it would be on terms that would enable us to strengthen our
profitability or ability to make distributions.
Historically,
we have financed most of our investments through CDOs and have retained the
equity. CDO equity receives distributions from the CDO only if the CDO generates
enough income to first pay the holders of its debt securities and its
expenses.
We have financed most of our
investments through CDOs in which we retained the equity
interest. Depending on market conditions, credit availability, and
resolution of current credit market conditions, we may seek to use CDOs to
finance our investments in the future. The equity interests of a CDO
are subordinate in right of payment to all other securities issued by the
CDO. The equity is usually entitled to all of the income generated by
the CDO after the CDO pays all of the interest due on the debt securities and
other expenses. However, there will be little or no income available
to the CDO equity if there are excessive defaults by the issuers of the
underlying collateral which would significantly reduce the value of that
interest. Reductions in the value of the equity interests we have in
a CDO, if we determine that they are other than temporary, will reduce our
earnings. In addition, the equity securities of CDOs are generally
illiquid, and because they represent a leveraged investment in the CDO’s assets,
the value of the equity securities will generally have greater fluctuations than
the value of the underlying collateral.
If
our CDO financings fail to meet their performance tests, including
over-collaterization requirements, our net income and cash flow from these CDOs
will be eliminated.
Our CDOs generally provide that the
principal amount of their assets must exceed the principal balance of the
related securities issued by them by a certain amount, commonly referred to as
“over-collateralization.” The CDO terms provide that, if
delinquencies and/or losses exceed specified levels based on the analysis by the
rating agencies (or any financial guaranty insurer) of the characteristics of
the assets collateralizing the securities issued by the CDO issuer, the required
level of over-collateralization may be increased or may be prevented from
decreasing as would otherwise be permitted if losses or delinquencies did not
exceed those levels. In addition, a failure by a CDO to satisfy an
over-collateralization test typically results in accelerated distributions to
the holders of the senior debt securities issued by the CDO entity. Our equity
holdings and, when we acquire debt interests in CDOs, our debt interests, if
any, are subordinate in right of payment to the other classes of debt securities
issued by the CDO entity. Accordingly, if overcollateralization tests
are not met, distributions on the subordinated debt and equity we hold in these
CDOs will cease, resulting in a substantial reduction in our cash
flow. Other tests (based on delinquency levels or other criteria) may
restrict our ability to receive cash distributions from assets collateralizing
the securities issued by the CDO entity. Although at December 31,
2009, all of our CDOs met their performance tests, we cannot assure you that our
CDOs will satisfy the performance tests in the future.
If any of our CDOs fails to meet
collateralization or other tests relevant to the most senior debt issued and
outstanding by the CDO issuer, an event of default may occur under that
CDO. If that occurs, our Manager’s ability to manage the CDO likely
would be terminated and our ability to attempt to cure any defaults in the CDO
would be limited, which would increase the likelihood of a reduction or
elimination of cash flow and returns to us in those CDOs for an indefinite
time.
If
we issue debt securities, the terms may restrict our ability to make cash
distributions, require us to obtain approval to sell our assets or otherwise
restrict our operations in ways which could make it difficult to execute our
investment strategy and achieve our investment objectives.
Any debt securities we may issue in the
future will likely be governed by an indenture or other instrument containing
covenants restricting our operating flexibility. Holders of senior
securities may be granted the right to hold a perfected security interest in
certain of our assets, to accelerate payments due under the indenture if we
breach financial or other covenants, to restrict distributions, and to require
approval to sell assets. These covenants could limit our ability to
operate our business or manage our assets effectively. Additionally,
any convertible or exchangeable securities that we issue may have rights,
preferences and privileges more favorable than those of our common
stock. We, and indirectly our stockholders, will bear the cost of
issuing and servicing such securities.
Depending
upon market conditions, we may in the future seek financing through CDOs, which
would expose us to risks relating to the accumulation of assets for use in the
CDOs.
Historically, we have financed a
significant portion of our assets through the use of CDOs, and have accumulated
assets for these financings through short-term credit facilities, typically
repurchase agreement facilities. Depending upon market conditions, we
may seek similar financing arrangements in the future. These
arrangements could expose us to a number of credit risks, including the
following:
|
|
·
|
If
we accumulate assets for a CDO on a short-term credit facility and do not
complete the CDO financing, or if a default occurs under the facility, the
short-term lender will sell the assets and we would be responsible for the
amount by which the original purchase price of the assets exceeds their
sale price, up to the amount of our investment or
guaranty.
|
|
|
·
|
An
event of default under one short-term facility may constitute a default
under other credit facilities we may have, potentially resulting in asset
sales and losses to us, as well as increasing our financing costs or
reducing the amount of investable funds available to
us.
|
|
|
·
|
We
may be unable to acquire a sufficient amount of eligible assets to
maximize the efficiency of a CDO issuance, which would require us to seek
other forms of term financing or liquidate the assets. We may
not be able to obtain term financing on acceptable terms, or at all, and
liquidation of the assets may be at prices less than those we paid,
resulting in losses to us.
|
|
|
·
|
Using
short-term financing to accumulate assets for a CDO issuance may require
us to obtain new financing as the short-term financing
matures. Residual financing may not be available on acceptable
terms, or at all. Moreover, an increase in short-term interest
rates at the time that we seek to enter into new borrowings would reduce
the spread between the income on our assets and the cost of our
borrowings. This would reduce returns on our assets, which
would reduce earnings and, in turn, cash available for distribution to our
stockholders.
|
|
|
·
|
We
will lose money on our repurchase transactions if the counterparty to the
transaction defaults on its obligation to resell the underlying security
back to us at the end of the transaction term, or if the value of the
underlying security has declined as of the end of the term or if we
default on our obligations under the repurchase
agreements.
|
Our
hedging transactions may not completely insulate us from interest rate risk and
may result in poorer overall investment performance than if we had not engaged
in any hedging transactions.
Subject to maintaining our
qualification as a REIT, we pursue various hedging strategies to seek to reduce
our exposure to losses from adverse changes in interest rates. Our interest rate
hedging activity varies in scope depending upon market conditions relating to,
among other factors, the level and volatility of interest rates and the type of
assets we hold. There are practical limitations on our ability to
insulate our portfolio from all of the negative consequences associated with
changes in short-term interest rates, including:
|
|
·
|
Available
interest rate hedges may not correspond directly with the interest rate
risk against which we seek
protection.
|
|
|
·
|
The
duration of the hedge may not match the duration of the related
liability.
|
|
|
·
|
Interest
rate hedging can be expensive, particularly during periods of rising and
volatile interest rates. Hedging costs may include structuring
and legal fees and fees payable to hedge counterparties to execute the
hedge transaction.
|
|
|
·
|
Losses
on a hedge position may reduce the cash available to make distributions to
stockholders, and may exceed the amounts invested in the hedge
position.
|
|
|
·
|
The
amount of income that a REIT may earn from hedging transactions, other
than through a TRS, is limited by federal tax provisions governing
REITs.
|
|
|
·
|
The
credit quality of the party owing money on the hedge may be downgraded to
such an extent that it impairs our ability to sell or assign our side of
the hedging transaction.
|
|
|
·
|
The
party owing money in the hedging transaction may default on its obligation
to pay.
|
We have adopted written policies and
procedures governing our hedging activities. Under these policies and
procedures, our board of directors is responsible for approving the types of
hedging instruments we may use, absolute limits on the notional amount and term
of a hedging instrument and parameters for the credit-worthiness of hedge
counterparties. The senior managers responsible for each of our
targeted asset classes are responsible for executing transactions using the
services of independent interest rate risk management consultants, documenting
the transactions, monitoring the valuation and effectiveness of the hedges, and
providing reports concerning our hedging activities and the valuation and
effectiveness of our hedges, to the audit committee of our board of directors no
less often than quarterly. Our guidelines also require us to engage
one or more experienced third party advisors to provide us with assistance in
the identification of interest rate risks, the analysis, selection and timing of
risk protection strategies, the administration and negotiation of hedge
documentation, settlement or disposition of hedges, compliance with hedge
accounting requirements and measurement of hedge effectiveness and
valuation.
Hedging against a decline in the values
of our portfolio positions does not eliminate the possibility of fluctuations in
the values of the positions or prevent losses if the values of the positions
decline. Hedging transactions may also limit the opportunity for gain
if the values of the portfolio positions should increase. Moreover,
we may not be able to hedge against an interest rate fluctuation that is
generally anticipated by the market.
The success of our hedging transactions
will depend on the Manager’s ability to correctly predict movements of interest
rates. Therefore, unanticipated changes in interest rates may result
in poorer overall investment performance than if we had not engaged in any such
hedging transactions. In addition, the degree of correlation between
price movements of the instruments used in a hedging strategy and price
movements in the portfolio positions being hedged may vary. Moreover,
for a variety of reasons, we may not seek to establish a perfect correlation
between such hedging instruments and the portfolio holdings being hedged. Any
such imperfect correlation may prevent us from achieving the intended hedge and
expose us to risk of loss.
Hedging
instruments often are not traded on regulated exchanges, guaranteed by an
exchange or its clearing house, or regulated by any U.S. or foreign governmental
authorities and involve risks of default by the hedging counterparty and
illiquidity.
Subject to maintaining our
qualification as a REIT, part of our investment strategy involves entering into
puts and calls on securities or indices of securities, interest rate swaps, caps
and collars, including options and forward contracts, and interest rate lock
agreements, principally Treasury lock agreements, to seek to hedge against
mismatches between the cash flows from our assets and the interest payments on
our liabilities. Hedging instruments often are not traded on
regulated exchanges, guaranteed by an exchange or its clearing house, or
regulated by any U.S. or foreign governmental
authorities. Consequently, there are no requirements with respect to
record keeping, financial responsibility or segregation of customer funds and
positions. Furthermore, the enforceability of agreements underlying
derivative transactions may depend on compliance with applicable statutory and
commodity and other regulatory requirements and, depending on the identity of
the counterparty, applicable international requirements. The business
failure of a counterparty with whom we enter into a hedging transaction will
most likely result in a default. Default by a party with whom we entered into a
hedging transaction may result in the loss of unrealized profits and force us to
cover our resale commitments, if any, at the then current market
price. Although generally we seek to reserve the right to terminate
our hedging positions, we may not always be able to dispose of or close out a
hedging position without the consent of the hedging counterparty, and we may not
be able to enter into an offsetting contract in order to cover our
risk. A liquid secondary market may not exist for hedging instruments
purchased or sold, and we may have to maintain a position until exercise or
expiration, which could result in losses.
We
may enter into hedging instruments that could expose us to unexpected losses in
the future.
We have entered and may in the future
enter into hedging instruments that require us to fund cash payments under
certain circumstances, for example, upon the early termination of the instrument
caused by an event of default or other early termination event, or the decision
by a counterparty to request additional collateral for margin it is
contractually owed under the terms of the instrument. The amount due
would be equal to the unrealized loss of the open positions with the
counterparty and could also include other fees and charges. These
liabilities will be reflected in our consolidated balance sheet, and our ability
to fund these obligations will depend on the liquidity of our assets and access
to capital at the time, and the need to fund these obligations could adversely
impact our financial condition.
Approximately
94% of our hedging arrangements are with a single counterparty and, as a
consequence, our hedging strategy may fail if that counterparty defaults in its
obligations.
As of December 31, 2009, approximately
94% of our outstanding hedges, with a notional amount of $217.9 million, were
with Credit Suisse International, or CS. Were CS to default in its
obligations under these hedging arrangements, we would lose the hedge protection
for which we had contracted which, depending upon market conditions, could
result in significant losses to us. We cannot assure you that we
could replace the defaulted hedges or that the terms of any replacement hedges
we could obtain would be on similar terms, or as to the cost to us of obtaining
replacement hedges.
Risks
Related to Our Operations
We
may change our investment strategy without stockholder consent, which may result
in riskier investments than those currently targeted.
Subject to maintaining our
qualification as a REIT and our exclusion from regulation under the Investment
Company Act, we may change our investment strategy, including the percentage of
assets that may be invested in each class, or in the case of securities, in a
single issuer, at any time without the consent of our stockholders, which could
result in our making investments that are different from, and possibly riskier
than, the investments described in this report. A change in our
investment strategy may increase our exposure to interest rate and real estate
market fluctuations, all of which may reduce the market price of our common
stock and impair our ability to make distributions to
stockholders. Furthermore, a change in our asset allocation could
result in our making investments in asset categories different from those
described in this report.
Terrorist
attacks and other acts of violence or war may affect the market for our common
stock, the industry in which we conduct our operations and our
profitability.
Terrorist attacks may harm our results
of operations and your investment. We cannot assure you that there
will not be further terrorist attacks against the United States or U.S.
businesses. These attacks or armed conflicts may directly impact the
property underlying our ABS or the securities markets in
general. Losses resulting from these types of events are
uninsurable.
More generally, any of these events
could cause consumer confidence and spending to decrease or result in increased
volatility in the United States and worldwide financial markets and
economy. Adverse economic conditions could harm the value of some or
all of the investments in our portfolio or the securities markets in general
which could harm our operating results and revenues and may result in the
volatility of the value of our securities.
If
we fail to maintain an effective system of internal controls, we may not be able
to accurately report our financial results or prevent fraud.
If we fail to maintain an effective
system of internal control, fail to correct any matters in the design or
operating effectiveness of internal control over financial reporting, or fail to
prevent fraud, our stockholders could lose confidence in our financial
reporting, which could harm our business and the trading price of our common
stock.
Some
of our investments may be illiquid, which may result in our realizing less than
their recorded value should we need to sell such investments
quickly.
We have made investments, and expect to
make additional investments, in securities that are not publicly
traded. A portion of these securities may be subject to legal and
other restrictions on resale or will otherwise be less liquid than publicly
traded securities. If we are required to liquidate all or a portion
of our portfolio quickly, we may realize significantly less than the value at
which we have previously recorded our investments. In addition, we
may face other restrictions on our ability to liquidate an investment in a
business entity to the extent that we, the Manager or Resource America has or
could be attributed with material non-public information regarding such business
entity.
We
may have to repurchase assets that we have sold in connection with CDOs and
other securitizations.
If any of the assets that we originate
or acquire and sell or securitize do not comply with representations and
warranties that we make about their characteristics, the borrowers and the
underlying assets, we may have to purchase these assets from the CDO or
securitization vehicle, or replace them with substitute loans or
securities. In addition, in the case of loans or securities that we
have sold instead of retained, we may have to indemnify purchasers for losses or
expenses incurred as a result of a breach of a representation or
warranty. Any significant repurchases or indemnification payments
could materially reduce our liquidity, earnings and ability to make
distributions.
We
may be exposed to environmental liabilities with respect to properties to which
we take title.
In the course of our business, we may
take title to real estate through foreclosure on collateral underlying real
estate investments. If we do take title to any property, we could be
subject to environmental liabilities with respect to it. In such a
circumstance, we may be held liable to a governmental entity or to third parties
for property damage, personal injury, investigation, and clean-up costs they
incur as a result of environmental contamination, or may have to investigate or
clean up hazardous or toxic substances, or chemical releases at a
property. The costs associated with investigation or remediation
activities could be substantial and could reduce our income and ability to make
distributions.
If
our allowance for loan and lease losses is not adequate to cover actual or
estimated future loan and lease losses, our earnings may decline.
We maintain an allowance for loan and
lease losses to provide for loan defaults and non-performance by borrowers of
their obligations. Our allowance for loan and lease losses may not be
adequate to cover actual or estimated future loan and lease losses and future
provisions for loan and lease losses could materially and adversely affect our
operating results. Our allowance for loan and lease losses is based on
prior experience, as well as an evaluation of risks in the current portfolio.
However, losses may exceed our current estimates. The amount of
future losses is susceptible to changes in economic, operating and other
conditions that may be beyond our control, including changes in interest rates,
changes in borrowers’ creditworthiness and the value of collateral securing
loans and leases. Additionally, if we seek to expand our loan and lease
portfolios, we may need to make provisions for loan and lease losses to ensure
that the allowance remains at levels deemed appropriate by our management for
the size and quality of portfolio. While we believe that our allowance for loan
and lease losses is adequate to cover our anticipated losses, we cannot assure
you that will continue to be the case or that we will not further increase the
allowance for loan and lease losses. This occurrence could materially
affect our earnings.
Our
due diligence may not reveal all of an entity’s liabilities and other weaknesses
in its business.
Before investing in the securities of
any issuer, we will assess the strength and skills of the issuer’s management,
the value of any collateral securing debt securities, the ability of the issuer
and the collateral to service the debt and other factors that we believe are
material to the performance of the investment. In making the
assessment and otherwise conducting customary due diligence, we will rely on the
resources available to us and, in some cases, an investigation by third
parties. This process is particularly important and subjective with
respect to newly-organized entities because there may be little or no
information publicly available about the entities or, with respect to debt
securities, any underlying collateral. Our due diligence processes,
however, may not uncover all facts that may be relevant to an investment
decision.
Risks
Related to Our Investments
Declines
in the market values of our investments may reduce periodic reported results,
credit availability and our ability to make distributions.
We classify a substantial portion of
our assets for accounting purposes as “available-for-sale.” As a
result, changes in the market values of those assets are directly charged or
credited to accumulated other comprehensive loss and could reduce our
stockholders’ equity. A decline in these values will reduce the book
value of our assets. Moreover, if the decline in value of an
available-for-sale asset is other than temporary, we are required by GAAP to
record the decline as an asset impairment which will reduce our
earnings. As a result of market conditions for our
“available-for-sale” investments, we recognized $12.6 million of
other-than-temporary impairment through our consolidated statements of
operations during the year ended December 31, 2009.
A decline in the market value of our
assets may also adversely affect us in instances where we have borrowed money
based on the market value of those assets. If the market value of
those assets declines, the lender may require us to post additional collateral
to support the loan. If we were unable to post the additional
collateral, we would have to repay some portion or all of the loan, which would
require us to sell assets, which could potentially be under adverse market
conditions. As a result, our earnings would be reduced or we could
sustain losses, and cash available to make distributions could be reduced or
eliminated.
Increases
in interest rates and other factors could reduce the value of our investments,
result in reduced earnings or losses and reduce our ability to pay
distributions.
A significant risk associated with our
investment in commercial real estate-related loans, CMBS and other debt
instruments is the risk that either or both of long-term and short-term interest
rates increase significantly. If long-term rates increase, the market
value of our assets would decline. Even if assets underlying
investments we may own in the future are guaranteed by one or more persons,
including government or government-sponsored agencies, those guarantees do not
protect against declines in market value of the related assets caused by
interest rate changes. At the same time, because of the short-term
nature of the financing we have historically used to acquire our investments, an
increase in short-term interest rates would increase our interest expense,
reducing our net interest spread. This could result in reduced
profitability and distributions.
Investing
in mezzanine debt and mezzanine or other subordinated tranches of CMBS, bank
loans and other ABS involves greater risks of loss than senior secured debt
investments.
Subject to maintaining our
qualification as a REIT and exclusion from regulation under the Investment
Company Act, we invest in mezzanine debt and expect to invest in mezzanine or
other subordinated tranches of CMBS, bank loans and other ABS. These
types of investments carry a higher degree of risk of loss than senior secured
debt investments such as our whole loan investments because, in the event of
default and foreclosure, holders of senior liens will be paid in full before
mezzanine investors and, depending on the value of the underlying collateral at
the time of foreclosure, there may not be sufficient assets to pay all or any
part of amounts owed to mezzanine investors. Moreover, our mezzanine
and other subordinate debt investments may have higher LTV ratios than
conventional senior lien financing, resulting in less equity in the collateral
and increasing the risk of loss of principal. If a borrower defaults
or declares bankruptcy, we may be subject to agreements restricting or
eliminating our rights as a creditor, including rights to call a default,
foreclose on collateral, accelerate maturity or control decisions made in
bankruptcy proceedings. In addition, the prices of lower credit
quality securities are generally less sensitive to interest rate changes than
more highly rated investments, but more sensitive to economic downturns or
individual issuer developments because the ability of obligors of instruments
underlying the securities to make principal and interest payments may be
impaired. In such event, existing credit support relating to the
securities’ structure may not be sufficient to protect us against loss of our
principal.
We
have historically invested in small- and middle-ticket equipment leases and
notes to small- and mid-size businesses which may have greater risks of default
than leases or loans to larger businesses.
We have historically invested in small-
and middle-ticket equipment leases and notes. Many of the obligors
are small- to mid-size businesses. As a result, we may be subject to
higher risks of lease default than if our obligors were larger
businesses. While we will seek to repossess and re-lease or sell the
equipment subject to a defaulted lease or note, we may not be able to do so on
advantageous terms. If an obligor files for protection under the
bankruptcy laws, we may experience difficulties and delays in recovering the
equipment. Moreover, the equipment may be returned in poor condition
and we may be unable to enforce important lease provisions against an insolvent
obligor, including the contract provisions that require the obligor to return
the equipment in good condition. In some cases, an obligor’s
deteriorating financial condition may make trying to recover what the obligor
owes impractical. The costs of recovering equipment upon an obligor’s
default, enforcing the obligor’s obligations under the lease, and transporting,
storing, repairing and finding a new obligor or purchaser for the equipment may
be high. Higher than expected lease defaults will result in a loss of
anticipated revenues. These losses may impair our ability to make
distributions and reduce the market price of our common stock.
Private
equity investments involve a greater risk of loss than traditional debt
financing.
On occasion, we have made private
equity investments. Typically, these investments are subordinate to
debt financing and are not secured. Should the issuer default on our
investment, we would only be able to proceed against the entity that issued the
private equity in accordance with the terms of the security, and not any
property owned by the entity. In the event of bankruptcy or
foreclosure, we would only be able to recoup our investment after any lenders to
the entity are paid. As a result, we may not recover some or all of
our investment, which could result in losses. Moreover, depending
upon the existence of a market for the issuer’s securities, the length of time
we have held the investment and any rights we may have to require registration
under the Securities Act, these investments may be highly illiquid so that we
may not be able to sell these investments at times we would like to do so or at
prices that reflect our cost or the value of the investment on our financial
statements.
We
record some of our portfolio investments at fair value as estimated by our
management and, as a result, there will be uncertainty as to the value of these
investments.
We currently hold, and expect that we
will hold in the future, portfolio investments that are not publicly traded,
including the securities of Resource TRS. The fair value of
securities and other investments that are not publicly traded may not be readily
determinable. We value these investments quarterly at fair value as
determined under policies approved by our board of directors. Because
such valuations are inherently uncertain, may fluctuate over short periods of
time and may be based on estimates, our determinations of fair value may differ
materially from the values that would have obtained if a ready market for them
existed. The value of our common stock will likely decrease if our
determinations regarding the fair value of these investments are materially
higher than the values that we ultimately realize upon their
disposal.
Our
assets include bank loans and other ABS which will carry higher risks of loss
than our real estate-related portfolio.
Subject to maintaining our
qualification as a REIT and exclusion from regulation under the Investment
Company Act, we invest in bank loans and other ABS. Our bank loan
investments or our other ABS investments, which are principally backed by small
business and bank loans, may not be secured by mortgages or other liens on
assets or may involve higher LTV ratios than our real estate-related
investments. Our bank loan investments, and our ABS backed by loans,
involve loans with a par amount of $178.1 million at December 31, 2009 that have
an interest-only payment schedule or a schedule that does not fully amortize
principal over the term of the loan, which will make repayment of the loan
depend upon the borrower’s liquidity or ability to refinance the loan at
maturity. Numerous factors affect a borrower’s ability to repay or
refinance loans at maturity, including national and local economic conditions, a
downturn in a borrower’s industry, loss of one or more principal customers and
conditions in the credit markets. A deterioration in a company’s
financial condition or prospects may be accompanied by a deterioration in the
collateral for the bank loan or any ABS backed by such company’s
loans.
Risks
Related to Our Manager
We
depend on the Manager and Resource America and may not find suitable
replacements if the management agreement terminates.
We have no employees. Our
officers, portfolio managers, administrative personnel and support personnel are
employees of Resource America. We have no separate facilities and
completely rely on the Manager and, because the Manager has no direct employees,
Resource America, which has significant discretion as to the implementation of
our operating policies and investment strategies. If our management
agreement terminates, we may be unable to find a suitable replacement for
them. Moreover, we believe that our success depends to a significant
extent upon the experience of the Manager’s and Resource America’s executive
officers and senior portfolio managers, and in particular Jonathan Z. Cohen,
Thomas C. Elliott, Jeffrey F. Brotman, Steven J. Kessler, Jeffrey
D. Blomstrom, David J. Bryant, Christopher D. Allen, Gretchen Bergstresser,
David Bloom, Crit DeMent, Joan Sapinsley and Alan F. Feldman, whose continued
service is not guaranteed. The departure of any of the executive
officers or senior portfolio managers could harm our investment
performance.
We
must pay the Manager the base management fee regardless of the performance of
our portfolio.
The Manager is entitled to receive a
monthly base management fee equal to 1/12 of our equity, as defined in the
management agreement, times 1.50%, regardless of the performance of our
portfolio. The Manager’s entitlement to substantial non-performance
based compensation might reduce its incentive to devote its time and effort to
seeking profitable opportunities for our portfolio. This in turn
could hurt our ability to make distributions to our stockholders.
The
incentive fee we pay the Manager may induce it to make riskier
investments.
In addition to its base management fee,
the Manager will receive incentive compensation, payable quarterly, equal to 25%
of the amount by which our net income, as defined in the management agreement,
exceeds the weighted average prices for our common stock in all of our offerings
multiplied by the greater of 2.00% or 0.50% plus one-fourth of the average
10-year treasury rate for such quarter, multiplied by the weighted average
number of common shares outstanding during the quarter. In evaluating
investments and other management strategies, the opportunity to earn incentive
compensation based on net income may lead the Manager to place undue emphasis on
the maximization of net income at the expense of other criteria, such as
preservation of capital, in order to achieve higher incentive
compensation. Investments with higher yields generally have higher
risk of loss than investments with lower yields.
The
Manager manages our portfolio pursuant to very broad investment guidelines and
our board does not approve each investment decision, which may result in our
making riskier investments.
The Manager is authorized to follow
very broad investment guidelines. While our directors periodically
review our investment guidelines and our investment portfolio, they do not
review all of our proposed investments. In addition, in conducting
periodic reviews, the directors may rely primarily on information provided to
them by the Manager. Furthermore, the Manager may use complex
strategies, and transactions entered into by the Manager may be difficult or
impossible to unwind by the time they are reviewed by the
directors. The Manager has great latitude within the broad investment
guidelines in determining the types of investments it makes for
us. Poor investment decisions could impair our ability to make
distributions to our stockholders.
Our
management agreement was not negotiated at arm’s-length and, as a result, may
not be as favorable to us as if it had been negotiated with a third
party.
Our officers and two of our directors,
Edward E. Cohen and Jonathan Z. Cohen, were officers or directors of the Manager
and Resource America at the time the management agreement was
negotiated. As a consequence, our management agreement was not the
result of arm’s-length negotiations and its terms, including fees payable, may
not be as favorable to us as if it had been negotiated with an unaffiliated
third party.
Termination
of the management agreement by us without cause is difficult and could be
costly.
Termination of our management agreement
without cause is difficult and could be costly. We may terminate the
management agreement without cause only annually following its initial term upon
the affirmative vote of at least two-thirds of our independent directors or by a
vote of the holders of at least a majority of our outstanding common stock,
based upon unsatisfactory performance by the Manager that is materially
detrimental to us or a determination that the management fee payable to the
Manager is not fair. Moreover, with respect to a determination that
the management fee is not fair, the Manager may prevent termination by accepting
a mutually acceptable reduction of management fees. We must give not
less than 180 days’ prior notice of any termination. Upon any
termination without cause, the Manager will be paid a termination fee equal to
four times the sum of the average annual base management fee and the average
annual incentive compensation earned by it during the two 12-month periods
immediately preceding the date of termination, calculated as of the end of the
most recently completed fiscal quarter before the date of
termination.
The
Manager and Resource America may engage in activities that compete with
us.
Our management agreement does not
prohibit the Manager or Resource America from investing in or managing entities
that invest in asset classes that are the same as or similar to our targeted
asset classes, except that they may not raise funds for, sponsor or advise any
new publicly-traded REIT that invests primarily in mortgage-backed securities,
or MBS, in the United States. The Manager’s policies regarding
resolution of conflicts of interest may be varied by it if economic, market,
regulatory or other conditions make their application economically inefficient
or otherwise impractical. Moreover, our officers, other than our
Chief Financial Officer and three accounting professionals on his staff, and the
officers, directors and employees of Resource America who provide services to us
are not required to work full time on our affairs, and devote significant time
to the affairs of Resource America. As a result, there may be
significant conflicts between us, on the one hand, and the Manager and Resource
America on the other, regarding allocation of the Manager’s and Resource
America’s resources to the management of our investment portfolio.
Our
Manager’s liability is limited under the management agreement, and we have
agreed to indemnify our Manager against certain liabilities.
Our Manager does not assume any
responsibility under the management agreement other than to render the services
called for under it, and will not be responsible for any action of our board of
directors in following or declining to follow its advice or
recommendations. Resource America, the Manager, their directors,
managers, officers, employees and affiliates will not be liable to us, any
subsidiary of ours, our directors, our stockholders or any subsidiary’s
stockholders for acts performed in accordance with and pursuant to the
management agreement, except by reason of acts constituting bad faith, willful
misconduct, gross negligence, or reckless disregard of their duties under the
management agreement. We have agreed to indemnify the parties for all
damages and claims arising from acts not constituting bad faith, willful
misconduct, gross negligence, or reckless disregard of duties, performed in good
faith in accordance with and pursuant to the management agreement.
We
depend upon information systems of our manager to conduct our
operations. Systems failures could significantly disrupt our
business.
Our business depends on communications
and information systems of our manager. Any failure or interruption of their
systems could cause delays or other problems in our activities which could harm
our operating results, cause the market price of our common stock to decline and
reduce our ability to make distributions.
Risks
Related to Real Estate Investments
The B notes in which we invest may
be subject to additional risks relating to the privately negotiated structure
and terms of the transaction, which may result in losses to
us.
A B note is a loan typically secured by
a first mortgage on a single large commercial property or group of related
properties and subordinated to a senior note secured by the same first mortgage
on the same collateral. As a result, if a borrower defaults, there
may not be sufficient funds remaining for B note owners after payment to the
senior note owners. Since each transaction is privately negotiated, B
notes can vary in their structural characteristics and risks. For
example, the rights of holders of B notes to control the process following a
borrower default may be limited in certain investments. We cannot
predict the terms of each B note investment we will make. Further, B
notes typically are secured by a single property, and so reflect the increased
risks associated with a single property compared to a pool of
properties. B notes also are less liquid than other forms of
commercial real estate debt investments, such as CMBS, and, as a result we may
be unable to dispose of underperforming or non-performing
investments. The higher risks associated with the subordinate
position of our B note investments could subject us to increased risk of
loss.
Our
real estate debt investments will be subject to the risks inherent in the real
estate securing or underlying those investments which could result in losses to
us.
Commercial mortgage loans are secured
by, and mezzanine loans depend on, the performance of the underlying,
multifamily or commercial property and are subject to risks of delinquency and
foreclosure, and risks of loss, that are greater than similar risks associated
with loans made on the security of single-family residential
property. The ability of a borrower to repay a loan secured by or
dependent upon an income-producing property typically depends primarily upon the
successful operation of the property rather than upon the existence of
independent income or assets of the borrower. If the net operating
income of the property is reduced, the borrower’s ability to repay the loan may
be impaired. Net operating income of an income producing property can
be affected by, among other things:
|
|
·
|
tenant
mix, success of tenant businesses and property management
decisions,
|
|
|
·
|
property
location and condition,
|
|
|
·
|
competition
from comparable types of
properties,
|
|
|
·
|
changes
in laws that increase operating expense or limit rents that may be
charged,
|
|
|
·
|
any
need to address environmental contamination at the
property,
|
|
|
·
|
the
occurrence of any uninsured casualty at the
property,
|
|
|
·
|
changes
in national, regional or local economic conditions and/or the conditions
of specific industry segments in which our lessees may
operate,
|
|
|
·
|
declines
in regional or local real estate
values,
|
|
|
·
|
declines
in regional or local rental or occupancy
rates,
|
|
|
·
|
increases
in interest rates, real estate tax rates and other operating
expenses,
|
|
|
·
|
increases
in costs of construction material;
|
|
|
·
|
changes
in governmental rules, regulations and fiscal policies, including
environmental legislation, and
|
|
|
·
|
acts
of God, terrorism, social unrest and civil
disturbances.
|
Although we currently hold no
residential mortgage loans in our portfolio, in the past our portfolio has
included substantial residential mortgage investments. Residential
mortgage loans are subject to risks of delinquency and foreclosure, and risks of
loss. The ability of a borrower to repay these loans depends upon the
borrower’s income or assets. A number of factors, including national,
regional or local economic downturns, acts of God, terrorism, social unrest and
civil disturbances, may impair borrowers’ abilities to repay their
loans. Economic problems specific to a borrower, such as loss of a
job or medical problems, may also impair a borrower’s ability to repay his or
her loan.
We risk loss of principal on defaulted
mortgage loans we hold to the extent of any deficiency between the value of the
collateral we can realize and the principal and accrued interest of the mortgage
loan. Moreover, foreclosure of a mortgage loan can be an expensive
and lengthy process which could reduce the net amount we can realize on the
foreclosed mortgage loan. In a bankruptcy of a mortgage loan
borrower, the mortgage loan will be deemed to be secured only to the extent of
the value of the underlying collateral at the time of bankruptcy as determined
by the bankruptcy court, and the lien securing the mortgage loan will be subject
to the avoidance powers of the bankruptcy trustee or debtor-in-possession to the
extent the lien is unenforceable under state law.
For a discussion of other risks
associated with mezzanine loans, see “-Investing in mezzanine debt or mezzanine
or other subordinated tranches of CMBS, bank loans and other ABS involves
greater risks of loss than senior secured debt instruments.”
Risks
Related to Our Organization and Structure
Our
charter and bylaws contain provisions that may inhibit potential acquisition
bids that you and other stockholders may consider favorable, and the market
price of our common stock may be lower as a result.
Our charter and bylaws contain
provisions that may have an anti-takeover effect and inhibit a change in our
board of directors. These provisions include the
following:
|
|
·
|
There are ownership limits and
restrictions on transferability and ownership in our
charter. For purposes of assisting us in maintaining our
REIT qualification under the Internal Revenue Code, our charter generally
prohibits any person from beneficially or constructively owning more than
9.8% in value or number of shares, whichever is more restrictive, of any
class or series of our outstanding capital stock. This
restriction may:
|
|
|
-
|
discourage
a tender offer or other transactions or a change in the composition of our
board of directors or control that might involve a premium price for our
shares or otherwise be in the best interests of our stockholders;
or
|
|
|
-
|
result
in shares issued or transferred in violation of such restrictions being
automatically transferred to a trust for a charitable beneficiary,
resulting in the forfeiture of those
shares.
|
|
|
·
|
Our charter permits our board
of directors to issue stock with terms that may discourage a third party
from acquiring us. Our board of directors may amend our
charter without stockholder approval to increase the total number of
authorized shares of stock or the number of shares of any class or series
and issue common or preferred stock having preferences, conversion or
other rights, voting powers, restrictions, limitations as to
distributions, qualifications, or terms or conditions of redemption as
determined by our board. Thus, our board could authorize the
issuance of stock with terms and conditions that could have the effect of
discouraging a takeover or other transaction in which holders of some or a
majority of our shares might receive a premium for their shares over the
then-prevailing market price.
|
|
|
·
|
Our charter and bylaws contain
other possible anti-takeover provisions. Our charter and
bylaws contain other provisions that may have the effect of delaying or
preventing a change in control of us or the removal of existing directors
and, as a result, could prevent our stockholders from being paid a premium
for their common stock over the then-prevailing market
price.
|
Maryland
takeover statutes may prevent a change in control of us, and the market price of
our common stock may be lower as a result.
Maryland Control Share Acquisition
Act. Maryland law provides that “control shares” of a
corporation acquired in a “control share acquisition” will have no voting rights
except to the extent approved by a vote of two-thirds of the votes eligible to
be cast on the matter under the Maryland Control Share Acquisition
Act. The act defines “control shares” as voting shares of stock that,
if aggregated with all other shares of stock owned by the acquiror or in respect
of which the acquiror is able to exercise or direct the exercise of voting power
(except solely by virtue of a revocable proxy), would entitle the acquiror to
exercise voting power in electing directors within one of the following ranges
of voting power: one-tenth or more but less than one-third, one-third or more
but less than a majority, or a majority or more of all voting power. A “control
share acquisition” means the acquisition of control shares, subject to specific
exceptions.
If voting rights or control shares
acquired in a control share acquisition are not approved at a stockholders’
meeting or if the acquiring person does not deliver an acquiring person
statement as required by the Maryland Control Share Acquisition Act then,
subject to specific conditions and limitations, the issuer may redeem any or all
of the control shares for fair value. If voting rights of such
control shares are approved at a stockholders’ meeting and the acquiror becomes
entitled to vote a majority of the shares entitled to vote, all other
stockholders may exercise appraisal rights. Our bylaws contain a
provision exempting acquisitions of our shares from the Maryland Control Share
Acquisition Act. However, our board of directors may amend our bylaws
in the future to repeal this exemption.
Business
combinations. Under Maryland law, “business combinations”
between a Maryland corporation and an interested stockholder or an affiliate of
an interested stockholder are prohibited for five years after the most recent
date on which the interested stockholder becomes an interested
stockholder. These business combinations include a merger,
consolidation, share exchange or, in circumstances specified in the statute, an
asset transferor issuance or reclassification of equity
securities. An interested stockholder is defined as:
|
|
·
|
any
person who beneficially owns ten percent or more of the voting power of
the corporation’s shares; or
|
|
|
·
|
an
affiliate or associate of the corporation who, at any time within the
two-year period before the date in question, was the beneficial owner of
ten percent or more of the voting power of the then outstanding voting
stock of the corporation.
|
A person is not an interested
stockholder under the statute if the board of directors approved in advance the
transaction by which such person otherwise would have become an interested
stockholder. However, in approving a transaction, the board of
directors may provide that its approval is subject to compliance, at or after
the time of approval, with any terms and conditions determined by the
board.
After the five-year prohibition, any
business combination between the Maryland corporation and an interested
stockholder generally must be recommended by the board of directors of the
corporation and approved by the affirmative vote of at least:
|
|
·
|
80%
of the votes entitled to be cast by holders of outstanding shares of
voting stock of the corporation;
and
|
|
|
·
|
two-thirds
of the votes entitled to be cast by holders of voting stock of the
corporation other than shares held by the interested stockholder with whom
or with whose affiliate the business combination is to be effected or held
by an affiliate or associate of the interested
stockholder.
|
These super-majority vote requirements
do not apply if the corporation’s common stockholders receive a minimum price,
as defined under Maryland law, for their shares in the form of cash or other
consideration in the same form as previously paid by the interested stockholder
for its shares.
The statute permits exemptions from its
provisions, including business combinations that are exempted by the board of
directors before the time that the interested stockholder becomes an interested
stockholder.
Our
rights and the rights of our stockholders to take action against our directors
and officers are limited, which could limit your recourse in the event of
actions not in your best interests.
Our charter limits the liability of our
directors and officers to us and our stockholders for money damages, except for
liability resulting from:
|
|
·
|
actual
receipt of an improper benefit or profit in money, property or services;
or
|
|
|
·
|
a
final judgment based upon a finding of active and deliberate dishonesty by
the director or officer that was material to the cause of action
adjudicated.
|
In addition, our charter authorizes us
to indemnify our present and former directors and officers for actions taken by
them in those capacities to the maximum extent permitted by Maryland
law. Our bylaws require us to indemnify each present or former
director or officer, to the maximum extent permitted by Maryland law, in the
defense of any proceeding to which he or she is made, or threatened to be made,
a party by reason of his or her service to us. In addition, we may be
obligated to fund the defense costs incurred by our directors and
officers.
Our
right to take action against the Manager is limited.
The obligation of the Manager under the
management agreement is to render its services in good faith. It will
not be responsible for any action taken by our board of directors or investment
committee in following or declining to follow its advice and
recommendations. Furthermore, as discussed above under “− Risks
Related to Our Manager,” it will be difficult and costly for us to terminate the
management agreement without cause. In addition, we will indemnify
the Manager, Resource America and their officers and affiliates for any actions
taken by them in good faith.
We
have not established a minimum distribution payment level and we cannot assure
you of our ability to make distributions in the future. We may in the
future use uninvested offering proceeds or borrowed funds to make
distributions.
We expect to make quarterly
distributions to our stockholders in amounts such that we distribute all or
substantially all of our taxable income in each year, subject to certain
adjustments. We have not established a minimum distribution payment
level, and our ability to make distributions may be impaired by the risk factors
described in this report. All distributions will be made at the
discretion of our board of directors and will depend on our earnings, our
financial condition, maintenance of our REIT qualification and other factors as
our board of directors may deem relevant from time to time. We may
not be able to make distributions in the future. In addition, some of
our distributions may include a return of capital. To the extent that
we decide to make distributions in excess of our current and accumulated taxable
earnings and profits, such distributions would generally be considered a return
of capital for federal income tax purposes. A return of capital is
not taxable, but it has the effect of reducing the holder’s tax basis in its
investment. Although we currently do not expect that we will do so,
we have in the past and may in the future also use proceeds from any offering of
our securities that we have not invested or borrowed funds to make
distributions. If we use uninvested offering proceeds to pay
distributions in the future, we will have less funds available for investment
and, as a result, our earnings and cash available for distribution would be less
than we might otherwise have realized had such funds been
invested. Similarly, if we borrow to fund distributions, our future
interest costs would increase, thereby reducing our future earnings and cash
available for distribution from what they otherwise would have
been.
Loss
of our exclusion from regulation under the Investment Company Act would require
significant changes in our operations and could reduce the market price of our
common stock and our ability to make distributions.
In order to be excluded from regulation
under the Investment Company Act, we must comply with the requirements of one or
more of the exclusions from the definition of investment
company. Because we conduct our business through wholly-owned
subsidiaries, we must ensure not only that we qualify for an exclusion from
regulation under the Investment Company Act, but also that each of our
subsidiaries so qualifies. If we fail to qualify for an exclusion, we
could be required to restructure our activities or register as an investment
company. Either alternative would require significant changes in our
operations and could reduce the market price of our common stock. For
example, if the market value of our investments in assets other than qualifying
real estate assets or real estate-related assets were to increase beyond the
levels permitted under the Investment Company Act exclusion upon which we rely
or if assets in our portfolio were deemed not to be qualifying real estate
assets as a result of SEC staff guidance, we might have to sell those assets or
acquire additional qualifying real estate assets in order to maintain our
exclusion. Any such sale or acquisition could occur under adverse
market conditions. If we were required to register as an investment
company, our use of leverage to fund our investment strategies would be
significantly limited, which would limit our profitability and ability to make
distributions, and we would become subject to substantial regulation concerning
management, operations, transactions with affiliated persons, portfolio
composition, including restrictions with respect to diversification and industry
concentration, and other matters.
Rapid
changes in the values of our real-estate related investments may make it more
difficult for us to maintain our qualification as a REIT or exclusion from
regulation under the Investment Company Act.
If the market value or income potential
of our real estate-related investments declines as a result of current economic
conditions, increased interest rates, prepayment rates or other factors, we may
need to increase our real estate-related investments and income and/or liquidate
our non-qualifying assets in order to maintain our REIT qualification or
exclusion from the Investment Company Act. If the decline in real
estate asset values and/or income occurs quickly, this may be especially
difficult to accomplish. This difficulty may be exacerbated by the
illiquid nature of many of our non-real estate assets. We may have to
make investment decisions that we otherwise would not make absent REIT
qualification and Investment Company Act considerations.
Tax
Risks
Complying
with REIT requirements may cause us to forego otherwise attractive
opportunities.
To qualify as a REIT for federal income
tax purposes, we must continually satisfy various tests regarding the sources of
our income, the nature and diversification of our assets, the amounts we
distribute to our stockholders and the ownership of our common
stock. In order to meet these tests, we may be required to forego
investments we might otherwise make. Thus, compliance with the REIT
requirements may hinder our investment performance.
In particular, at least 75% of our
assets at the end of each calendar quarter must consist of real estate assets,
government securities, cash and cash items. For this purpose, “real
estate assets” generally include interests in real property, such as land,
buildings, leasehold interests in real property, stock of other entities that
qualify as REITs, interests in mortgage loans secured by real property,
investments in stock or debt instruments during the one-year period following
the receipt of new capital and regular or residual interests in a real estate
mortgage investment conduit, or REMIC. In addition, the amount of
securities of a single issuer, other than a TRS, that we hold must generally not
exceed either 5% of the value of our gross assets or 10% of the vote or value of
such issuer’s outstanding securities.
Certain of the assets that we hold or
intend to hold, including interests in CDOs or corporate leveraged loans, are
not qualified and will not be qualified real estate assets for purposes of the
REIT asset tests. ABS-RMBS and CMBS securities should generally
qualify as real estate assets. However, to the extent that we own
non-REMIC collateralized mortgage obligations or other debt instruments secured
by mortgage loans (rather than by real property) or secured by non-real estate
assets, or debt securities that are not secured by mortgages on real property,
those securities are likely not qualifying real estate assets for purposes of
the REIT asset test, and will not produce qualifying real estate
income. Further, whether securities held by warehouse lenders or
financed using repurchase agreements are treated as qualifying assets or as
generating qualifying real estate income for purposes of the REIT asset and
income tests depends on the terms of the warehouse or repurchase financing
arrangement.
We generally will be treated as the
owner of any assets that collateralize CDO transactions to the extent that we
retain all of the equity of the securitization vehicle and do not make an
election to treat such securitization vehicle as a TRS, as described in further
detail below. It may be possible to reduce the impact of the REIT
asset and gross income requirements by holding certain assets through our TRSs,
subject to certain limitations as described below.
Our
qualification as a REIT and exemption from U.S. federal income tax with respect
to certain assets may depend on the accuracy of legal opinions or advice
rendered or given or statements by the issuers of securities in which we invest,
and the inaccuracy of any such opinions, advice or statements may adversely
affect our REIT qualification and result in significant corporate level
tax.
When purchasing securities, we have
relied and may rely on opinions or advice of counsel for the issuer of such
securities, or statements, made in related offering documents, for purposes of
determining whether such securities represent debt or equity securities for U.S.
federal income tax purposes, and also to what extent those securities constitute
REIT real estate assets for purposes of the REIT asset tests and produce income
which qualifies under the 75% REIT gross income test. In addition,
when purchasing CDO equity, we have relied and may rely on opinions or advice of
counsel regarding the qualification of interests in the debt of such CDOs for
U.S. federal income tax purposes. The inaccuracy of any such
opinions, advice or statements may adversely affect our REIT qualification and
result in significant corporate-level tax.
We
may realize excess inclusion income that would increase our tax liability and
that of our stockholders.
If we realize excess inclusion income
and allocate it to stockholders, this income cannot be offset by net operating
losses of the stockholders. If the stockholder is a tax-exempt
entity, then this income would be fully taxable as unrelated business taxable
income under Section 512 of the Internal Revenue Code. If the stockholder
is a foreign person, it would be subject to federal income tax withholding on
this income without reduction or exemption pursuant to any otherwise applicable
income tax treaty.
Excess inclusion income could result if
we hold a residual interest in a REMIC. Excess inclusion income also
could be generated if we issue debt obligations, such as certain CDOs, with two
or more maturities and the terms of the payments on these obligations bore a
relationship to the payments that we received on our mortgage related securities
securing those debt obligations, i.e., if we were to own an interest in a
taxable mortgage pool. While we do not expect to acquire significant
amounts of residual interests in REMICs, we do own residual interests in taxable
mortgage pools, which means that we will likely generate significant amounts of
excess inclusion income.
If we realize excess inclusion income,
we will be taxed at the highest corporate income tax rate on a portion of such
income that is allocable to the percentage of our stock held in record name by
“disqualified organizations,” which are generally cooperatives, governmental
entities and tax-exempt organizations that are exempt from unrelated business
taxable income. To the extent that our stock owned by “disqualified
organizations” is held in record name by a broker/dealer or other nominee, the
broker/dealer or other nominee would be liable for the corporate level tax on
the portion of our excess inclusion income allocable to the stock held by the
broker/dealer or other nominee on behalf of “disqualified
organizations.” We expect that disqualified organizations will own
our stock. Because this tax would be imposed on us, all of our
investors, including investors that are not disqualified organizations, would
bear a portion of the tax cost associated with the classification of us or a
portion of our assets as a taxable mortgage pool. A regulated
investment company or other pass through entity owning stock in record name will
be subject to tax at the highest corporate rate on any excess inclusion income
allocated to its owners that are disqualified organizations. Finally,
if we fail to qualify as a REIT, our taxable mortgage pool securitizations will
be treated as separate corporations, for federal income tax purposes that cannot
be included in any consolidated corporate tax return.
Failure
to qualify as a REIT would subject us to federal income tax, which would reduce
the cash available for distribution to our stockholders.
We believe that we have been organized
and operated in a manner that has enabled us to qualify as a REIT for federal
income tax purposes commencing with our taxable year ended on December 31,
2005. However, the federal income tax laws governing REITs are
extremely complex, and interpretations of the federal income tax laws governing
qualification as a REIT are limited. Qualifying as a REIT requires us
to meet various tests regarding the nature of our assets and our income, the
ownership of our outstanding stock, and the amount of our distributions on an
ongoing basis.
If we fail to qualify as a REIT in any
calendar year and we do not qualify for certain statutory relief provisions, we
will be subject to federal income tax, including any applicable alternative
minimum tax on our taxable income, at regular corporate
rates. Distributions to stockholders would not be deductible in
computing our taxable income. Corporate tax liability would reduce
the amount of cash available for distribution to our
stockholders. Under some circumstances, we might need to borrow money
or sell assets in order to pay that tax. Furthermore, if we fail to maintain our
qualification as a REIT and we do not qualify for the statutory relief
provisions, we no longer would be required to distribute substantially all of
our REIT taxable income, determined without regard to the dividends paid
deduction and not including net capital gains, to our
stockholders. Unless our failure to qualify as a REIT were excused
under federal tax laws, we could not re-elect to qualify as a REIT until the
fifth calendar year following the year in which we failed to qualify. In
addition, if we fail to qualify as a REIT, our taxable mortgage pool
securitizations will be treated as separate corporations for U.S. federal income
tax purposes.
Failure
to make required distributions would subject us to tax, which would reduce the
cash available for distribution to our stockholders.
In order to qualify as a REIT, in each
calendar year we must distribute to our stockholders at least 90% of our REIT
taxable income, determined without regard to the deduction for dividends paid
and excluding net capital gain. To the extent that we satisfy the 90%
distribution requirement, but distribute less than 100% of our taxable income,
we will be subject to federal corporate income tax on our undistributed
income. In addition, we will incur a 4% nondeductible excise tax on
the amount, if any, by which our distributions in any calendar year are less
than the sum of:
|
|
·
|
85%
of our ordinary income for that
year;
|
|
|
·
|
95%
of our capital gain net income for that year;
and
|
|
|
·
|
100%
our undistributed taxable income from prior
years.
|
We intend to make distributions to our
stockholders in a manner intended to satisfy the 90% distribution requirement
and to distribute all or substantially all of our net taxable income to avoid
both corporate income tax and the 4% nondeductible excise tax. There
is no requirement that a domestic TRS distribute its after-tax net income to its
parent REIT or their stockholders and Resource TRS may determine not to make any
distributions to us. However, non-U.S. TRSs, such as Apidos CDO I,
Apidos CDO III and Apidos Cinco CDO, which we discuss in “Management’s
Discussion and Analysis of Financial Conditions and Results of Operations,” will
generally be deemed to distribute their earnings to us on an annual basis for
federal income tax purposes, regardless of whether such TRSs actually distribute
their earnings.
Generally, dividends payable in stock
are not treated as dividends for purposes of the deduction for dividends, or as
taxable dividends to the recipient. A complex set of rules applies
when a distribution is made partially in stock and partially in cash and
different shareholders receive different proportions of each. The
Internal Revenue Service, in Revenue Procedure 2010-12, has given guidance with
respect to certain stock distributions by publicly traded REITS (and
RICs). That Revenue Procedure applies to distributions made on or
after January 1, 2008 and declared with respect to a taxable year ending on
or before December 31, 2011. It provides that publicly-traded
REITS can distribute stock (common shares in our case) to satisfy their REIT
distribution requirements if stated conditions are met. These
conditions include that at least 10% of the aggregate declared distributions be
paid in cash and the shareholders be permitted to elect whether to receive cash
or stock, subject to the limit set by the REIT on the cash to be distributed in
the aggregate to all shareholders. We did not use this Revenue
Procedure with respect to any distributions for our 2008 and 2009 taxable years,
but may do so for distributions with respect to 2010 or 2011.
Our taxable income may substantially
exceed our net income as determined by GAAP because, for example, realized
capital losses will be deducted in determining our GAAP net income but may not
be deductible in computing our taxable income. In addition, we may
invest in assets that generate taxable income in excess of economic income or in
advance of the corresponding cash flow from the assets, referred to as phantom
income. Although some types of phantom income are excluded to the
extent they exceed 5% of our REIT taxable income in determining the 90%
distribution requirement, we will incur corporate income tax and the 4%
nondeductible excise tax with respect to any phantom income items if we do not
distribute those items on an annual basis. As a result, we may
generate less cash flow than taxable income in a particular year. In
that event, we may be required to use cash reserves, incur debt, or liquidate
non-cash assets at rates or times that we regard as unfavorable in order to
satisfy the distribution requirement and to avoid corporate income tax and the
4% nondeductible excise tax in that year.
If
we make distributions in excess of our current and accumulated earnings and
profits, they will be treated as a return of capital, which will reduce the
adjusted basis of your stock. To the extent such distributions exceed
your adjusted basis, you may recognize a capital gain.
Unless you are a tax-exempt entity,
distributions that we make to you generally will be subject to tax as ordinary
income to the extent of our current and accumulated earnings and profits as
determined for federal income tax purposes. If the amount we
distribute to you exceeds your allocable share of our current and accumulated
earnings and profits, the excess will be treated as a return of capital to the
extent of your adjusted basis in your stock, which will reduce your basis in
your stock but will not be subject to tax. To the extent the amount
we distribute to you exceeds both your allocable share of our current and
accumulated earnings and profits and your adjusted basis, this excess amount
will be treated as a gain from the sale or exchange of a capital
asset. For risks related to the use of uninvested offering proceeds
or borrowings to fund distributions to stockholders, see “ − Risks Related to
Our Organization and Structure − We have not established a minimum distribution
payment level and we cannot assure you of our ability to make distributions in
the future.”
Our
ownership of and relationship with our TRSs will be limited and a failure to
comply with the limits would jeopardize our REIT qualification and may result in
the application of a 100% excise tax.
A REIT may own up to 100% of the
securities of one or more TRSs. A TRS may earn specified types of
income or hold specified assets that would not be qualifying income or assets if
earned or held directly by the parent REIT. Both the subsidiary and
the REIT must jointly elect to treat the subsidiary as a TRS. A
corporation of which a TRS directly or indirectly owns more than 35% of the
voting power or value of the stock will automatically be treated as a
TRS. Overall, no more than 25% (20% for our 2009 and prior taxable
years) of the value of a REIT’s assets may consist of stock or securities of one
or more TRSs. A TRS will pay federal, state and local income tax at
regular corporate rates on any income that it earns, whether or not it
distributes that income to us. In addition, the TRS rules limit the
deductibility of interest paid or accrued by a TRS to its parent REIT to assure
that the TRS is subject to an appropriate level of corporate
taxation. The rules also impose a 100% excise tax on certain
transactions between a TRS and its parent REIT that are not conducted on an
arm’s-length basis.
Resource TRS will pay federal, state
and local income tax on its taxable income, and its after-tax net income is
available for distribution to us but is not required to be distributed to
us. Income that is not distributed to us by Resource TRS will not be
subject to the REIT 90% distribution requirement and therefore will not be
available for distributions to our stockholders. We anticipate that
the aggregate value of the securities of Resource TRS, together with the
securities we hold in our other TRSs, including Apidos CDO I, Apidos CDO III and
Apidos Cinco CDO, will be less than 25% of the value of our total assets,
including our TRS securities. We will monitor the compliance of our
investments in TRSs with the rules relating to value of assets and transactions
not on an arm’s-length basis. We cannot assure you, however, that we
will be able to comply with such rules.
Complying
with REIT requirements may limit our ability to hedge effectively.
The REIT provisions of the Internal
Revenue Code substantially limit our ability to hedge mortgage-backed securities
and related borrowings. Under these provisions, our annual gross
income from qualifying and non-qualifying hedges of our borrowings, together
with any other income not generated from qualifying real estate assets, cannot
exceed 25% of our gross income. In addition, our aggregate gross
income from non-qualifying hedges, fees and certain other non-qualifying sources
cannot exceed 5% of our annual gross income determined without regard to income
from qualifying hedges. As a result, we might have to limit our use
of advantageous hedging techniques or implement those hedges through Resource
TRS. This could increase the cost of our hedging activities or expose
us to greater risks associated with changes in interest rates than we would
otherwise want to bear.
The
tax on prohibited transactions will limit our ability to engage in transactions,
including certain methods of securitizing mortgage loans, that would be treated
as sales for federal income tax purposes.
A REIT’s net income from prohibited
transactions is subject to a 100% tax. In general, prohibited
transactions are sales or other dispositions of property, other than foreclosure
property, but including mortgage loans, held primarily for sale to customers in
the ordinary course of business. We might be subject to this tax if
we were able to sell or securitize loans in a manner that was treated as a sale
of the loans for federal income tax purposes. Therefore, in order to
avoid the prohibited transactions tax, we may choose not to engage in certain
sales of loans and may limit the structures we utilize for our securitization
transactions even though such sales or structures might otherwise be beneficial
to us.
Tax
law changes could depress the market price of our common stock.
The federal income tax laws governing
REITs or the administrative interpretations of those laws may be amended at any
time. We cannot predict when or if any new federal income tax law or
administrative interpretation, or any amendment to any existing federal income
tax law or administrative interpretation, will become effective and any such law
or interpretation may take effect retroactively. Tax law changes
could depress our stock price or restrict our operations.
Dividends
paid by REITs do not qualify for the reduced tax rates provided for under
current law.
Dividends paid by REITs are generally
not eligible for the reduced 15% maximum tax rate for dividends paid to
individuals under recently enacted tax legislation. The more
favorable rates applicable to regular corporate dividends could cause
stockholders who are individuals to perceive investments in REITs to be
relatively less attractive than investments in the stock of non-REIT
corporations that pay dividends to which more favorable rates apply, which could
reduce the value of the stocks of REITs.
We
may lose our REIT qualification or be subject to a penalty tax if the Internal
Revenue Service successfully challenges our characterization of income
inclusions from our foreign TRSs.
We likely will be required to include
in our income, even without the receipt of actual distributions, earnings from
our foreign TRSs, including from our current and contemplated equity investments
in CDOs, such as our investment in Apidos CDO I, Apidos CDO III and Apidos Cinco
CDO. We intend to treat certain of these income inclusions as
qualifying income for purposes of the 95% gross income test applicable to REITs
but not for purposes of the REIT 75% gross income test. The
provisions that set forth what income is qualifying income for purposes of the
95% gross income test provide that gross income derived from dividends, interest
and other enumerated classes of passive income qualify for purposes of the 95%
gross income test. Income inclusions from equity investments in our foreign TRSs
are technically neither dividends nor any of the other enumerated categories of
income specified in the 95% gross income test for U.S. federal income tax
purposes, and there is no clear precedent with respect to the qualification of
such income for purposes of the REIT gross income tests. However, based on
advice of counsel, we intend to treat such income inclusions, to the extent
distributed by a foreign TRS in the year accrued, as qualifying income for
purposes of the 95% gross income test. Nevertheless, because this income does
not meet the literal requirements of the REIT provisions, it is possible that
the IRS could successfully take the position that it is not qualifying income.
In the event that it was determined not to qualify for the 95% gross income
test, we would be subject to a penalty tax with respect to the income to the
extent it and other nonqualifying income exceeds 5% of our gross income and/or
we could fail to qualify as a REIT. See “Federal Income Tax
Consequences of Our Qualification as a REIT.” In addition, if such
income was determined not to qualify for the 95% gross income test, we would
need to invest in sufficient qualifying assets, or sell some of our interests in
our foreign TRSs to ensure that the income recognized by us from our foreign
TRSs or such other corporations does not exceed 5% of our gross income, or cease
to qualify as a REIT.
The
failure of a loan subject to a repurchase agreement or a mezzanine loan to
qualify as a real estate asset would adversely affect our ability to qualify as
a REIT.
We have entered into and we intend to
continue to enter into sale and repurchase agreements under which we nominally
sell certain of our loan assets to a counterparty and simultaneously enter into
an agreement to repurchase the sold assets. We believe that we have
been and will be treated for U.S. federal income tax purposes as the owner of
the loan assets that are the subject of any such agreement notwithstanding that
the agreement may transfer record ownership of the assets to the counterparty
during the term of the agreement. It is possible, however, that the IRS could
assert that we did not own the loan assets during the term of the sale and
repurchase agreement, in which case we could fail to qualify as a
REIT.
In addition, we have acquired and will
continue to acquire mezzanine loans, which are loans secured by equity interest
in a partnership or limited liability company that directly or indirectly owns
real property. In Revenue Procedure 2003-65, the IRS provided a safe harbor
pursuant to which a mezzanine loan, if it meets each of the requirements
contained in the Revenue Procedure, will be treated by the IRS as a real estate
asset for purposes of the REIT asset tests, and interest derived from the
mezzanine loan will be treated as qualifying mortgage interest for purposes of
the REIT 75% income test. Although the Revenue Procedure provides a
safe harbor on which taxpayers may rely, it does not prescribe rules of
substantive tax law. We have acquired and will continue to acquire
mezzanine loans that may not meet all of the requirements for reliance on this
safe harbor. In the event we own a mezzanine loan that does not meet
the safe harbor, the IRS could challenge the loan’s treatment as a real estate
asset for purposes of the REIT asset and income tests, and if the challenge were
sustained, we could fail to qualify as a REIT.
|
UNRESOLVED
STAFF COMMENTS
|
None.
|
PROPERTIES
|
Philadelphia,
Pennsylvania:
We maintain offices through our
Manager. Our Manager maintains executive and corporate offices at One
Crescent Drive in the Philadelphia Navy Yard under a lease for 13,484 square
feet that expires in May 2019. Certain of its financial fund
management and real estate operations are also located in these
offices. Our Manager also leases 21,554 square feet for additional
executive office space and for certain of our real estate operations at 1845
Walnut Street, Philadelphia, Pennsylvania. This lease expires in May
2013.
|
LEGAL
PROCEEDINGS
|
We are not a party to any material
legal proceedings.
|
[OMITTED
AND RESERVED]
|
Omitted and Reserved pursuant to SEC
Release 33-9089A.
PART
II
|
MARKET
FOR REGISTRANT’S COMMON EQUITY, RELATED STOCKHOLDER
MATTERS
AND ISSUER PURCHASES OF EQUITY
SECURITIES
|
Market
Information
Our common stock has been listed on the
New York Stock Exchange under the symbol “RSO” since our initial public offering
in February 2006. The following table sets forth for the indicated
periods the high and low prices for our common stock, as reported on the New
York Stock Exchange, and the dividends declared and paid during our past two
fiscal years:
|
High
|
Low
|
Dividends
Declared
|
||||||||||
|
Fiscal 2009
|
||||||||||||
|
Fourth
Quarter
|
$ | 5.40 | $ | 4.33 | $ | 0.25 | (1) | |||||
|
Third
Quarter
|
$ | 6.21 | $ | 2.76 | $ | 0.30 | ||||||
|
Second
Quarter
|
$ | 3.89 | $ | 2.96 | $ | 0.30 | ||||||
|
First
Quarter
|
$ | 3.83 | $ | 1.50 | $ | 0.30 | ||||||
|
Fiscal 2008
|
||||||||||||
|
Fourth
Quarter
|
$ | 6.09 | $ | 1.74 | $ | 0.39 | ||||||
|
Third
Quarter
|
$ | 7.63 | $ | 4.84 | $ | 0.39 | ||||||
|
Second
Quarter
|
$ | 9.78 | $ | 7.21 | $ | 0.41 | ||||||
|
First
Quarter
|
$ | 10.28 | $ | 6.00 | $ | 0.41 | ||||||
|
(1)
|
We
distributed a regular dividend of $0.25 paid on January 26, 2010, to
stockholders of record as of December 31,
2009.
|
We are organized and conduct our
operations to qualify as a real estate investment trust, or a REIT, which
requires that we distribute at least 90% of our REIT taxable
income. Therefore, we intend to continue to declare quarterly
distributions on our common stock. No assurance, however, can be
given as to the amounts or timing of future distributions as such distributions
are subject to our earnings, financial condition, capital requirements and such
other factors as our board of directors seems relevant.
As of March 8, 2010, there were
38,938,950 common shares outstanding held by 168 persons of record.
See Item 12 – “Security Ownerships of
Certain Beneficial Owners and Management and Related Stockholder Matters” for
information relating to securities authorized for issuance under our equity
compensation plans.
Recent
Sales of Unregistered Securities; Use of Proceeds from Registered
Securities
In accordance with the provisions of
the management agreement, on January 31, 2009 and October 31, 2009 we issued
26,097 and 143,334 shares of common stock, respectively, to our
Manager. These shares represented 25% of the Manager’s quarterly
incentive compensation fee that accrued for the three months ended December 31,
2008 and for the three months ended September 30, 2008,
respectively. The issuance of these shares was exempt from the
registration requirements of the Securities Act pursuant to Section 4(2)
thereof.
Performance
Graph
The following line graph presentation
compares cumulative total shareholder returns of our common stock with the
Russell 2000 Index and the NAREIT All REIT Index for the period from February
10, 2006 to December 31, 2009. The graph and table assume that $100
was invested in each of our common stock, the Russell 2000 Index and the NAREIT
All REIT Index on February 10, 2006, and that all dividends were
reinvested. This data was furnished by the Research Data
Group.
|
SELECTED
FINANCIAL DATA
|
SELECTED
CONSOLIDATED FINANCIAL INFORMATION OF
RESOURCE
CAPITAL CORP AND SUBSIDIARIES
The following selected financial and
operating information should be read in conjunction with Item 7 – “Management’s
Discussion and Analysis of Financial Condition and Results of Operations” and
our financial statements, including the notes, included elsewhere herein (in
thousands, except share data).
|
As
of and for the years ended
|
As
of and for the Period from
March
8, 2005 (Date Operations Commended) to
|
|||||||||||||||||||
|
December
31,
|
December
31,
|
|||||||||||||||||||
|
2009
|
2008
|
2007
|
2006
|
2005
|
||||||||||||||||
|
Consolidated
Statement of Operations Data:
|
||||||||||||||||||||
|
REVENUES
|
||||||||||||||||||||
|
Interest income
|
$ | 97,593 | $ | 134,341 | $ | 176,995 | $ | 137,075 | $ | 61,387 | ||||||||||
|
Interest expense
|
45,427 | 79,619 | 121,564 | 101,851 | 43,062 | |||||||||||||||
|
Net interest income
|
52,166 | 54,722 | 55,431 | 35,224 | 18,325 | |||||||||||||||
|
OPERATING
EXPENSES
|
16,059 | 12,438 | 13,415 | 11,144 | 7,728 | |||||||||||||||
|
NET
OPERATING INCOME
|
36,107 | 42,284 | 42,016 | 24,080 | 10,597 | |||||||||||||||
|
OTHER
(EXPENSES) REVENUES
|
||||||||||||||||||||
|
Impairment losses on
investment securities
|
(27,490 | ) | (26,611 | ) | (48,853 | ) | (2,612 | ) | − | |||||||||||
|
Recognized in other
comprehensive loss
|
(14,019 | ) | (26,611 | ) | (22,576 | ) | (2,612 | ) | − | |||||||||||
|
Net impairment losses
recognized in earnings
|
(13,471 | ) | − | (26,277 | ) | − | − | |||||||||||||
|
Net realized gains/(losses) on
investments
|
1,890 | (1,637 | ) | (15,098 | ) | (8,627 | ) | 311 | ||||||||||||
|
Gain on deconsolidation
|
− | − | 14,259 | − | − | |||||||||||||||
|
Provision for loan and lease
losses
|
(61,383 | ) | (46,160 | ) | (6,211 | ) | − | − | ||||||||||||
|
Gain on the extinguishment of
debt
|
44,546 | 1,750 | − | − | − | |||||||||||||||
|
Gain on the settlement of
loan
|
− | 574 | − | − | − | |||||||||||||||
|
Other (expense) income
|
(1,350 | ) | 115 | 201 | 153 | − | ||||||||||||||
|
Total other (expenses)
revenues
|
(29,768 | ) | (45,358 | ) | (33,126 | ) | (8,474 | ) | 311 | |||||||||||
|
NET
INCOME (LOSS)
|
$ | 6,339 | $ | (3,074 | ) | $ | 8,890 | $ | 15,606 | $ | 10,908 | |||||||||
|
Consolidated
Balance Sheet Data:
|
||||||||||||||||||||
|
Cash
and cash equivalents
|
$ | 51,991 | $ | 14,583 | $ | 6,029 | $ | 5,354 | $ | 17,729 | ||||||||||
|
Restricted
cash
|
85,125 | 60,394 | 119,482 | 30,721 | 23,592 | |||||||||||||||
|
Investment
securities available-for-sale, pledged as
collateral, at fair value
|
39,304 | 22,466 | 65,464 | 420,997 | 1,362,392 | |||||||||||||||
|
Investment
securities available-for-sale, at fair value
|
5,238 | 6,794 | − | − | 28,285 | |||||||||||||||
|
Investment
securities held-to-maturity, pledged
as collateral
|
31,401 | 28,157 | 18,517 | 3,978 | − | |||||||||||||||
|
Loans,
net of allowances of $47.1 million, $43.9 million,
$0, $0 and $0
|
1,558,687 | 1,684,622 | 1,748,122 | 1,236,310 | 569,873 | |||||||||||||||
|
Loans
held for sale
|
8,050 | − | − | − | − | |||||||||||||||
|
Direct
financing leases and notes, net of allowances of
$1.1 million, $450,000, $293,000,
$0 and $0 and net of
unearned income
|
927 | 104,015 | 95,030 | 88,970 | 23,317 | |||||||||||||||
|
Total
assets
|
1,795,184 | 1,936,031 | 2,072,148 | 1,802,829 | 2,045,547 | |||||||||||||||
|
Borrowings
|
1,536,500 | 1,699,763 | 1,760,969 | 1,463,853 | 1,833,645 | |||||||||||||||
|
Total
liabilities
|
1,566,354 | 1,749,726 | 1,800,542 | 1,485,278 | 1,850,214 | |||||||||||||||
|
Total
stockholders’ equity
|
228,830 | 186,305 | 271,606 | 317,551 | 195,333 | |||||||||||||||
|
Per
Share Data:
|
||||||||||||||||||||
|
Dividends
declared per common share
|
$ | 1.15 | $ | 1.60 | $ | 1.62 | $ | 1.49 | $ | 0.86 | ||||||||||
|
Net
income (loss) per share − basic
|
$ | 0.25 | $ | (0.12 | ) | $ | 0.36 | $ | 0.89 | $ | 0.71 | |||||||||
|
Net
income (loss) per share − diluted
|
$ | 0.25 | $ | (0.12 | ) | $ | 0.36 | $ | 0.87 | $ | 0.71 | |||||||||
|
Weighted
average number of shares outstanding − basic
|
25,205,403 | 24,757,386 | 24,610,468 | 17,538,273 | 15,333,334 | |||||||||||||||
|
Weighted
average number of shares outstanding – diluted
|
25,355,821 | 24,757,386 | 24,860,184 | 17,881,355 | 15,405,714 | |||||||||||||||
|
MANAGEMENT’S
DISCUSSION AND ANALYSIS OF FINANCIAL CONDITION AND RESULTS OF
OPERATIONS
|
The following discussion provides
information to assist you in understanding our financial condition and results
of operations. This discussion should be read in conjunction with our
consolidated financial statements and related notes appearing elsewhere in this
report. This discussion contains forward-looking
statements. Actual results could differ materially from those
expressed in or implied by those forward looking statements. Please
see “Forward-Looking Statements” and “Risk Factors” for a discussion of certain
risks, uncertainties and assumptions associated with those
statements.
Overview
We are a specialty finance company that
focuses primarily on commercial real estate and commercial
finance. We are organized and conduct our operations to qualify as a
REIT under Subchapter M of the Internal Revenue Code of 1986, as
amended. Our objective is to provide our stockholders with total
returns over time, including quarterly distributions and capital appreciation,
while seeking to manage the risks associated with our investment
strategy. We invest in a combination of real estate-related assets
and, to a lesser extent, higher-yielding commercial finance
assets. We have financed a substantial portion of our portfolio
investments through borrowing strategies seeking to match the maturities and
repricing dates of our financings with the maturities and repricing dates of
those investments, and have sought to mitigate interest rate risk through
derivative instruments.
We are externally managed by Resource
Capital Manager, Inc., a wholly-owned indirect subsidiary of Resource America,
Inc. (NASDAQ-GS: REXI), or Resource America, a specialized asset management
company that uses industry specific expertise to generate and administer
investment opportunities for its own account and for outside investors in the
commercial finance, real estate, and financial fund management
sectors. As of December 31, 2009, Resource America managed
approximately $13.3 billion of assets in these sectors. To provide
its services, the Manager draws upon Resource America, its management team and
their collective investment experience.
We generate our income primarily from
the spread between the revenues we receive from our assets and the cost to
finance the purchase of those assets and hedge interest rate
risks. We generate revenues from the interest and fees we earn on our
whole loans, A notes, B notes, mezzanine debt, commercial mortgage-backed
securities, or CMBS, bank loans, payments on equipment leases and notes and
other asset-backed securities, or ABS. Historically, we have used a
substantial amount of leverage to enhance our returns and we have financed each
of our different asset classes with different degrees of
leverage. The cost of borrowings to finance our investments comprises
a significant part of our expenses. Our net income depends on our
ability to control these expenses relative to our revenue. In our
bank loans, CMBS, equipment leases and notes and other ABS, we historically have
used warehouse facilities as a short-term financing source and collateralized
debt obligations, or CDOs, and, to a lesser extent, other term financing as a
long-term financing source. In our commercial real estate loan
portfolio, we historically have used repurchase agreements as a short-term
financing source, and CDOs and, to a lesser extent, other term financing as a
long-term financing source. Our other term financing has consisted of
long-term match-funded financing provided through long-term bank financing and
asset-backed financing programs, depending upon market conditions and credit
availability.
Ongoing problems in real estate and
credit markets continue to impact our operations, particularly our ability to
generate capital and financing to execute our investment strategies. These
problems have also affected a number of our commercial real estate borrowers
and, with respect to 28 of our commercial real estate loans, caused us to enter
into loan modifications. We have increased our provision for loan and
lease losses to reflect the effect of these conditions on our borrowers and have
recorded both temporary and other than temporary impairments in the market
valuation of the CMBS and other ABS in our investment portfolio. While we
believe we have appropriately valued the assets in our investment portfolio at
December 31, 2009, we cannot assure you that further impairments will not occur
or that our assets will otherwise not be adversely effected by market
conditions.
The events occurring in the credit
markets have impacted our financing and investing strategies and, as a result,
our ability to originate new investments and to grow. The market for
securities issued by new securitizations collateralized by assets similar to
those in our investment portfolio has largely disappeared. Since our
sponsorship in June 2007 of Resource Real Estate Funding CDO 2007-1, or RREF CDO
2007-1, we have not sponsored any new securitizations and we do not expect to be
able to sponsor new securitizations for the foreseeable
future. Short-term financing through warehouse lines of credit and
repurchase agreements has become largely unavailable and unreliable as
increasing volatility in the valuation of assets similar to those we originate
has increased the risk of margin calls. To reduce our exposure to
margin calls or facility terminations, we have fully paid down repurchase
agreement borrowings, by $17.1 million during the year ended December 31, 2009,
which finance commercial real estate loans and other securities that we
hold. We no longer have any outstanding short-term
borrowings. Because of rising U.S. treasury rates and hedge
contracts that matured, we received proceeds from margin calls related to
our interest rate derivatives of $3.1 million during the year ended December 31,
2009.
Credit market conditions and the
recessionary economy have also resulted in an increasing number of loan
modifications, particularly in our commercial real estate
loans. Borrowers have experienced deterioration in the performance of
the properties we have financed or delays in implementing their business
plans. In order to assist our borrowers in effectuating their
business plans, including the leasing and repositioning of the underlying
assets, we have been willing to enter into loan modifications that would adapt
our financing to their particular situations. The most common loan
modifications have included term extensions and modest interest rate reductions
through the lowering of London Interbank Offered Rate, or LIBOR, floors, offset
by increased interest rate spreads over LIBOR. In exchange for the
loan modifications, we have received partial principal pay-downs, new equity
investment commitments in the properties from the borrowers or their principals,
additional fees and other structural improvements and enhancements to the
loans. Since the beginning of 2008 through December 31, 2009, we have
modified 28 commercial real estate, or CRE, loans. Management
determined that one of these modifications was due to financial distress of the
borrower and accordingly, qualified as a troubled debt
restructuring. We expect that we may have more CRE loan modifications
in the future. Subsequent to year end, management modified an
additional loan due to financial stress of the borrower.
Currently, we seek to manage our
liquidity and originate new assets primarily through capital recycling as loan
payoffs and paydowns occur and through existing capacities within our completed
securitizations. The following is a summary of repayments we received
during the year ended December 31, 2009:
|
|
·
|
$22.0
million of commercial real estate loans paid
off;
|
|
|
·
|
$46.4
million of commercial real estate loan principal
repayments;
|
|
|
·
|
$109.0
million of bank loan principal repayments;
and
|
|
|
·
|
$128.8
million of bank loan sale proceeds.
|
We have used recycled capital in our
CRE CDO and bank loan CLO structures to make new investments at discounts to
par. This reinvested capital and the related discount will produce
additional income as the discount is accreted through interest
income. In addition, the purchase of these investments at discounts
allows us to build collateral in the CDO and CLO structures since we receive
credit in these structures for these investments at par. During 2009,
we purchased CMBS with $51.7 million par value at a discount to par of 47.4% and
bank loans with $285.5 million par value at a discount to par of
12.2%. From the net discounts of approximately $24.5 million and
$34.8 million, we expect to recognize income from accretion of these discounts
of approximately $3.8 million and $7.2 million in our CMBS and bank loan
portfolio, respectively, in 2010.
As of December 31, 2009, we had fully
repaid all of our outstanding repurchase agreements with an aggregate balance of
$17.1 million (including accrued interest) at December 31, 2008.
As of December 31, 2009, we had
invested 76.4% of our portfolio in CRE assets, 23.2% in commercial bank loans
and 0.4% in direct financing leases and notes. As of December 31,
2008, we had invested 72.2% of our portfolio in CRE assets, 24.8% in commercial
bank loans and 3.0% in direct financing leases and notes.
Results
of Operations
Our net income for the year ended
December 31, 2009 was $6.3 million, or $0.25 per share (basic and diluted), as
compared to a net loss of $3.1 million, or ($0.12) per share (basic and
diluted), for the year ended December 31, 2008, and compared to net income of
$8.9 million, or $0.36 per share (basic and diluted), for the year ended
December 31, 2007.
Interest
Income
The following tables set forth
information relating to our interest income recognized for the periods presented
(in thousands, except percentages):
|
Years
Ended
|
||||||||||||
|
December
31,
|
||||||||||||
|
2009
|
2008
|
2007
|
||||||||||
|
Interest
income:
|
||||||||||||
|
Interest income from
loans:
|
||||||||||||
|
Bank loans
|
$ | 35,770 | $ | 53,172 | $ | 68,978 | ||||||
|
Commercial real estate loans
|
48,793 | 63,936 | 67,895 | |||||||||
|
Total interest income from
loans
|
84,563 | 117,108 | 136,873 | |||||||||
|
Interest income from
securities:
|
||||||||||||
|
Non-agency RMBS
|
− | − | 21,837 | |||||||||
|
CMBS
|
− | − | 1,394 | |||||||||
|
CMBS-private placement
|
5,404 | 4,425 | 4,082 | |||||||||
|
Securities held-to-maturity
|
1,807 | 1,934 | 1,205 | |||||||||
|
Other ABS
|
14 | 19 | 1,496 | |||||||||
|
Total interest income from
securities
available-for-sale
|
7,225 | 6,378 | 30,014 | |||||||||
|
Leasing
|
4,336 | 8,180 | 7,553 | |||||||||
|
Interest income –
other:
|
||||||||||||
|
Interest income – other (1)
|
− | 997 | − | |||||||||
|
Temporary investment in
over-night
repurchase agreements
|
1,469 | 1,678 | 2,555 | |||||||||
|
Total interest income –
other
|
1,469 | 2,675 | 2,555 | |||||||||
|
Total
interest income
|
$ | 97,593 | $ | 134,341 | $ | 176,995 | ||||||
|
(1)
|
Represents
cash received on our 90% equity investment in Ischus CDO II in excess of
our investment. Income on this investment was recognized using
the cost recovery method.
|
|
Year
Ended
December
31, 2009
|
Year
Ended
December
31, 2008
|
Year
Ended
December
31, 2007
|
||||||||||||||||||||||
|
Weighted
Average
|
Weighted
Average
|
Weighted
Average
|
||||||||||||||||||||||
|
Yield
|
Balance
|
Yield
|
Balance
|
Yield
|
Balance
|
|||||||||||||||||||
|
Interest
income:
|
||||||||||||||||||||||||
|
Interest income from
loans:
|
||||||||||||||||||||||||
|
Bank loans
|
3.87% | $ | 943,854 | 5.62% | $ | 947,753 | 7.42% | $ | 911,514 | |||||||||||||||
|
Commercial real estate loans
|
6.12% | $ | 785,380 | 7.48% | $ | 840,874 | 8.58% | $ | 781,954 | |||||||||||||||
|
Interest income from
securities:
|
||||||||||||||||||||||||
|
Non-agency RMBS
|
−% | $ | − | −% | $ | − | 7.09% | $ | 303,960 | |||||||||||||||
|
CMBS
|
−% | $ | − | −% | $ | − | 5.67% | $ | 24,549 | |||||||||||||||
|
CMBS-private placement
|
5.90% | $ | 90,784 | 5.76% | $ | 76,216 | 6.45% | $ | 61,952 | |||||||||||||||
|
Securities held-to-maturity
|
5.28% | $ | 33,249 | 7.72% | $ | 25,782 | 9.48% | $ | 13,236 | |||||||||||||||
|
Other ABS
|
4.98% | $ | 281 | 0.32% | $ | 6,000 | 6.96% | $ | 21,094 | |||||||||||||||
|
Leasing
|
6.88% | $ | 65,300 | 8.68% | $ | 94,864 | 8.71% | $ | 85,092 | |||||||||||||||
Year
Ended December 31, 2009 as compared to Year Ended December 31, 2008
Aggregate interest income decreased
$36.7 million (27%) to $97.6 million for the year ended December 31, 2009, from
$134.3 million for the year ended December 31, 2008. We attribute
this decrease to the following:
Interest
Income from Loans
Aggregate interest income from loans
decreased $32.5 million (28%) to $84.6 million for the year ended December 31,
2009 from $117.1 million for the year ended December 31, 2008.
Bank loans generated $35.8 million of
interest income for the year ended December 31, 2009 as compared to $53.2
million for the year ended December 31, 2008, a decrease of $17.4 million
(33%). This decrease resulted primarily from a decrease in the
weighted average yield earned by our bank loans to 3.87% for the year ended
December 31, 2009 from 5.62% for the year ended December 31,
2008. This was principally a result of the decrease in LIBOR which is
a reference index for the rates payable on these loans. The effects
of the decrease in the weighted average rate were partially offset by an
increase of $6.0 million in accretion income as a result of the purchase of
assets at discounts during the year ended December 31, 2009.
Commercial real estate loans produced
$48.8 million of interest income for the year ended December 31, 2009 as
compared to $63.9 million for the year ended December 31, 2008, a decrease of
$15.1 million (24%). This decrease resulted from the
following:
|
|
·
|
a
decrease in the weighted average balance of assets of $55.5 million to
$785.4 million for the year ended December 31, 2009 from $840.9 million
for the year ended December 31, 2008 primarily as a result of payoffs and
paydowns and to a lesser extent as a result of interest adjustments taken
on several loans; and
|
|
|
·
|
a
decrease in the weighted average yield on our assets to 6.12% for the year
ended December 31, 2009 from 7.48% for the year ended December 31, 2008
primarily due to decreases in LIBOR floors, which is a reference index for
the rates payable on these loans from loan modifications during
2009. Management
determined that five of these modifications was due to financial distress
of the borrower and accordingly, qualified as a troubled debt
restructuring. There were $401.3 million of loans with a
weighted average LIBOR floor of 4.71% as of December 31, 2008 and that
decreased to $310.9 million of loans with a weighted average LIBOR floor
of 2.37% as of December 31, 2009.
|
Interest
Income from Securities
Aggregate interest income from
securities increased $847,000 (13%) to $7.2 million for the year ended December
31, 2009 from $6.4 million for the year ended December 31, 2008. The
increase in interest income from securities available-for-sale resulted
principally from the following:
CMBS-private placement increased
$993,000 (22%) to $5.4 million for the year ended December 31, 2009 from $4.4
million for the year ended December 31, 2008. The increase is
primarily attributed to the following:
|
|
·
|
an
increase in the weighted average balance of assets of $14.6 million to
$90.8 million for the year ended December 31, 2009 from $76.2 million for
the year ended December 31, 2008 primarily as a result of the purchase of
$54.8 million par value of assets during the year ended December 31, 2009,
principally during the last half of the year;
and
|
|
|
·
|
an
increase in the weighted average yield to 5.90% for the year ended
December 31, 2009 from 5.76% for the year ended December 31, 2008
primarily as a result of an increase of $1.0 million in accretion income
from assets purchased at discounts during the year ended December 31,
2009.
|
Interest
Income - Leasing
Our equipment leasing portfolio
generated $4.3 million of interest income for the year ended December 31, 2009
as compared to $8.2 million for the year ended December 31, 2008, a decrease of
$3.8 million (47%). This decrease is primarily the result of our sale
of the majority of the leasing portfolio, at par, as of June 30,
2009.
Interest
Income - Other
Aggregate interest income-other
decreased $1.2 million (45%) to $1.5 million for the year ended December 31,
2009, as compared to $2.7 million for the year ended December 31,
2008. The decrease in interest income-other resulted principally from
the following:
|
|
·
|
A
decrease in interest income-other to $0 for the year ended December 31,
2009, as compared to $997,000 for the year ended December 31,
2008. The decrease is the result of our having disposed of the
equity investment in Ischus CDO II in December 2008. Prior to
that disposition, we used the cost recovery method to recognize the income
on this investment. We sold our interest in Ischus CDO II in
November 2007 and, as a result, deconsolidated it at that
time. For the three months ended March 31, 2008, $997,000 of
interest income was recognized on this investment. No such
income has been recognized since March
2008.
|
|
|
·
|
A
decrease in interest from temporary investments in over-night repurchase
agreements of $209,000 (12%) to $1.5 million for the year ended December
31, 2009, as compared to $1.7 million for the year ended December 31, 2008
primarily as a result of lower rates earned on our over-night
repurchase agreements.
|
Year
Ended December 31, 2008 as compared to Year Ended December 31, 2007
Aggregate interest income decreased
$42.7 million (24%) to $134.3 million for the year ended December 31, 2008, from
$177.0 million for the year ended December 31, 2007. We attribute
this decrease to the following:
Interest
Income from Loans
Aggregate interest income from loans
decreased $19.8 million (14%) to $117.1 million for the year ended December 31,
2008 from $136.9 million for the year ended December 31, 2007.
Bank loans generated $53.2 million of
interest income for the year ended December 31, 2008 as compared to $69.0
million for the year ended December 31, 2007, a decrease of $15.8 million
(23%). This decrease resulted primarily from a decrease in the
weighted average yield earned by our bank loans to 5.62% for the year ended
December 31, 2008 from 7.42% for the year ended December 31,
2007. This was principally a result of the decrease in LIBOR which is
a reference index for the rates payable on these loans. The effects
of the decrease in the weighted average rate were partially offset by an
increase of $36.3 million in the weighted average balance of assets to $947.8
million for the year ended December 31, 2008 from $911.5 million for the year
ended December 31, 2007 as a result of the acquisition of investments for our
third bank loan CDO, Apidos Cinco CDO, which closed in May 2007. The
year ended December 31, 2008 includes a full year of income on the increased
asset base.
Commercial real estate loans produced
$63.9 million of interest income for the year ended December 31, 2008 as
compared to $67.9 million for the year ended December 31, 2007, a decrease of
$4.0 million (6%). This decrease resulted primarily from a decrease
in the yield on these loans to 7.48% for the year ended December 31, 2008 from
8.58% for the year ended December 31, 2007, primarily due to the decrease in
LIBOR which is a reference index for the rates payable on some of these
loans. The effects of the decrease in the weighted average rate were
partially offset by an increase of $58.9 million in the weighted average balance
of loans to $840.9 million for the year ended December 31, 2008 from $782.0
million for the year ended December 31, 2007 as a result of the accumulation of
investments by our second commercial real estate CDO, RREF CDO 2007-1 which
closed on June 26, 2007 and had $463.0 million of assets at December 31,
2007. The year ended December 31, 2008 includes a full year of income
on the increased asset base.
Interest
Income from Securities
Aggregate interest income from
securities decreased $23.6 million (79%) to $6.4 million for the year ended
December 31, 2008 from $30.0 million for the year ended December 31,
2007. The decrease in interest income from securities resulted
principally from the following:
Interest income from our asset-backed
securities-residential mortgage-backed securities, or ABS-RMBS, CMBS and other
ABS portfolio generated $21.8 million, $1.4 million and $1.5 million,
respectively for the year ended December 31, 2007. No interest income
from ABS-RMBS and CMBS was generated during the year ended December 31,
2008. The other ABS portfolio generated $19,000 for the year ended
December 31, 2008. These decreases are primarily a result of the
deconsolidation of Ischus CDO II on November 13, 2007.
The decrease in interest income from
securities available-for-sale was partially offset by interest income on our
CMBS-private placement portfolio which increased $343,000 (8%) to $4.4 million
for the year ended December 31, 2008 from $4.1 million for the year ended
December 31, 2007. The increase is primarily attributed to an
increase of $14.3 million in the weighted average balance of these assets to
$76.2 million for the year ended December 31, 2008 as compared to $62.0 million
for the year ended December 31, 2007 as a result of the accumulation of assets
by RREF CDO 2007-1, which closed on June 26, 2007 and had $463.0 million of
assets at December 31, 2007. The year ended December 31, 2008
includes a whole year of income for these assets. The effects of the
increase in the weighted average balance were partially offset by a decrease in
the yield on these securities to 5.76% for the year ended December 31, 2008 from
6.45% for the year ended December 31, 2007, primarily due to the decrease in
LIBOR which is a reference index for the rates payable on some of these
securities.
The decrease in interest income from
securities available-for-sale was also partially offset by interest income on
our securities held-to-maturity which increased $729,000 (61%) to $1.9 million
for the year ended December 31, 2008 from $1.2 million for the year ended
December 31, 2007. The increase is primarily attributed to an
increase of $12.5 million in the weighted average balance of these assets to
$25.8 million for the year ended December 31, 2008 as compared to $13.2 million
for the year ended December 31, 2007 as a result of the accumulation of assets
by Apidos Cinco CDO, which closed in May 2007. The year ended
December 31, 2008 includes a whole year of income for these
assets. The effects of the increase in the weighted average balance
were partially offset by an decrease in the yield on these securities to 7.72%
for the year ended December 31, 2008 from 9.48% for the year ended December 31,
2007, primarily due to the decrease in LIBOR which is a reference index for the
rates payable on most of these securities.
Interest
Income - Leasing
Our equipment leasing portfolio
generated $8.2 million of interest income for the year ended December 31, 2008
as compared to $7.6 million for the year ended December 31, 2007, an increase of
$627,000 (8%). This increase resulted from the increase of $9.8
million in the weighted average balance of leases to $94.9 million at December
31, 2008 from $85.1 million for the year ended December 31, 2007, primarily from
the addition of leases to our portfolio in 2008.
Interest
Income - Other
Aggregate interest income-other
increased $120,000 (5%) to $2.7 million for the year ended December 31, 2008, as
compared to $2.6 million for the year ended December 31, 2007. The
increase in interest income from interest income – other resulted principally
from the following:
|
|
·
|
Interest
income – other was $997,000 for the year ended December 31, 2008 as
compared to $0 for the year ended December 31, 2007. The income
for 2008 was the result of income from our equity method investment in
Ischus CDO II. We used the cost recovery method to recognize
the income on this investment. We sold our interest in Ischus
CDO II in November 2007 and, as a result, deconsolidated it at that
time. For the three months ended March 31, 2008, $997,000 of
interest income was recognized on this investment. No such
income has been recognized since March 31,
2008.
|
|
|
·
|
The
increase in interest income – other was partially offset by interest
earned on temporary investments in over-night repurchase agreements which
decreased $877,000 (34%) to $1.7 million for the year ended December 31,
2008 as compared to $2.6 million for the year ended December 31, 2007
primarily due to lower rates.
|
Interest
Expense
Year
Ended December 31, 2009 as compared to Year Ended December 31, 2008
The following tables set forth
information relating to our interest expense incurred for the periods presented
by asset class (in thousands, except percentages):
|
Years
Ended
|
||||||||||||
|
December
31,
|
||||||||||||
|
2009
|
2008
|
2007
|
||||||||||
|
Interest
expense:
|
||||||||||||
|
Bank loans
|
$ | 15,394 | $ | 35,165 | $ | 52,466 | ||||||
|
Commercial real estate loans
|
11,072 | 27,924 | 37,184 | |||||||||
|
Non-agency / CMBS / ABS
|
− | − | 19,794 | |||||||||
|
CMBS-private placement
|
− | 163 | 1,223 | |||||||||
|
Leasing
|
2,143 | 4,357 | 5,595 | |||||||||
|
General
|
16,818 | 12,010 | 5,302 | |||||||||
|
Total
interest expense
|
$ | 45,427 | $ | 79,619 | $ | 121,564 | ||||||
|
Year
Ended
December
31, 2009
|
Year
Ended
December
31, 2008
|
Year
Ended
December
31, 2007
|
||||||||||||||||||||||
|
Weighted
Average
|
Weighted
Average
|
Weighted
Average
|
||||||||||||||||||||||
|
Yield
|
Balance
|
Yield
|
Balance
|
Yield
|
Balance
|
|||||||||||||||||||
|
Interest
expense:
|
||||||||||||||||||||||||
|
Bank loans
|
1.68% | $ | 906,000 | 3.82% | $ | 906,000 | 5.96% | $ | 868,345 | |||||||||||||||
|
Commercial real estate
loans
|
1.70% | $ | 649,258 | 3.91% | $ | 696,492 | 6.29% | $ | 582,173 | |||||||||||||||
|
Non-agency / CMBS / ABS
|
−% | $ | − | −% | $ | − | 5.93% | $ | 326,458 | |||||||||||||||
|
CMBS-private placement
|
−% | $ | − | 4.34% | $ | 3,597 | 5.84% | $ | 20,571 | |||||||||||||||
|
Leasing
|
4.42% | $ | 44,388 | 4.67% | $ | 89,778 | 6.68% | $ | 83,405 | |||||||||||||||
|
General
|
5.01% | $ | 322,720 | 3.00% | $ | 383,860 | 9.91% | $ | 51,981 | |||||||||||||||
Year
Ended December 31, 2009 as compared to Year Ended December 31, 2008
Aggregate interest expense decreased
$34.2 million (43%) to $45.4 million for the year ended December 31, 2009, from
$79.6 million for the year ended December 31, 2008. We attribute this
decrease to the following:
Interest expense on bank loans was
$15.4 million for the year ended December 31, 2009, as compared to $35.2 million
for the year ended December 31, 2008, a decrease of $19.8 million
(56%). This decrease resulted primarily from a decrease in the
weighted average yield on this debt to 1.68% for the year ended December 31,
2009 from 3.82% for the year ended December 31, 2008 as a result of the decrease
in LIBOR which is a reference index for the rates payable on most of these
notes.
Interest expense on commercial real
estate loans was $11.1 million for the year ended December 31, 2009, as compared
to $27.9 million for the year ended December 31, 2008, a decrease of $16.9
million (60%). This decrease resulted from the
following:
|
|
·
|
a
decrease in the weighted average yield on our financings to 1.70% for the
year ended December 31, 2009 from 3.91% for the year ended December 31,
2008 primarily due to the decrease in LIBOR which is a reference index for
the rates payable on a vast majority of these borrowings;
and
|
|
|
·
|
a
decrease in the weighted average balance of $47.2 million to $649.3
million for the year ended December 31, 2009 from $696.5 million for the
year ended December 31, 2008 as a result of our buyback of $55.5 million
in notes and the payoff of $17.1 million in repurchase agreement debt
during the year.
|
Interest expense on CMBS-private
placement was $0 for the year ended December 31, 2009, as compared to $163,000
for the year ended December 31, 2008 due to the elimination of advance rates on
our pledged CMBS-private placement collateral in November 2008 as a result of
policy changes surrounding advance rates by our lender.
Interest expense on our equipment
leasing portfolio was $2.1 million for the year ended December 31, 2009, as
compared to $4.4 million for the year ended December 31, 2008, a decrease of
$2.2 million (51%). The decrease for the year ended December 31, 2009
is primarily the result of the sale of most of the leasing portfolio and the
simultaneous transfer of all of the related debt to Resource America who
purchased the leases, at par, as of June 30, 2009.
The decrease in interest expense was
partially offset by an increase in general interest expense. General
interest expense was $16.8 million for the year ended December 31, 2009, as
compared to $12.0 million for the year ended December 31, 2008, an increase of
$4.8 million (40%). This increase resulted primarily from an increase
of $5.6 million on our interest rate derivatives that fix the rate we pay under
these agreements. During the year ended December 31, 2009 and 2008,
the fixed rate we paid exceeded the floating rate we received due to the
decrease in LIBOR. The increase in derivative expense was partially
offset by a decrease in interest expense related to our unsecured junior
subordinated debentures held by unconsolidated trusts that issued trust
preferred securities as a result of a decrease in the LIBOR rate which is a
reference index for the rates payable by these debentures. This
decrease in LIBOR was partially offset by an increase in the spread on this debt
as a result of an amendment to the indentures for this debt in September
2009.
Year
Ended December 31, 2008 as compared to Year Ended December 31, 2007
Aggregate interest expense decreased
$41.9 million (35%) to $79.6 million for the year ended December 31, 2008, from
$121.6 million for the year ended December 31, 2007. We attribute
this decrease to the following:
Interest expense on bank loans was
$35.2 million for the year ended December 31, 2008, as compared to $52.5 million
for the year ended December 31, 2007, a decrease of $17.3 million
(33%). This decrease resulted primarily from a decrease in the
weighted average yield on this debt to 3.82% for the year ended December 31,
2008 from 5.96% for the year ended December 31, 2007 as a result of the decrease
in LIBOR which is a reference index for the rates payable on most of these
notes. The effects of the decrease in the weighted average rate were
partially offset by an increase of $37.7 million in the weighted average balance
of debt to $906.0 million for the year ended December 31, 2008 from $868.3
million for the year ended December 31, 2007 as a result of the closing of
Apidos Cinco CDO. The year ended December 31, 2008 reflects a full
year of expense on this portfolio.
Interest expense on commercial real
estate loans was $27.9 million for the year ended December 31, 2008, as compared
to $37.2 million for the year ended December 31, 2007, a decrease of $9.3
million (25%). This decrease resulted primarily from a decrease in
the weighted average yield on our financings to 3.91% for the year ended
December 31, 2008 from 6.29% for the year ended December 31, 2007 primarily due
to the decrease in LIBOR which is a reference index for the rates payable on a
majority of these borrowings. The effects of the decrease in the
weighted average rate were partially offset by an increase of $114.3 million in
the weighted average balance of debt to $696.5 million for the year ended
December 31, 2008 from $582.2 million for the year ended December 31, 2007
primarily from the accumulation of investments of our second CRE CDO, RREF CDO
2007-1 which closed on June 26, 2007 and issued $348.9 million of debt at that
time. The year ended December 31, 2008 reflects a full year of
expense on this debt.
Non-agency RMBS, CMBS and other ABS,
which we refer to collectively as ABS, were pooled and financed by Ischus CDO
II. Interest expense related to these obligations was $19.8 million
for the year ended December 31, 2007. There was no such interest
expense for the year ended December 31, 2008 due to the deconsolidation of
Ischus CDO II on November 13, 2007.
Interest expense on CMBS-private
placement was $163,000 for the year ended December 31, 2008, as compared to $1.2
million for the year ended December 31, 2007, a decrease of $1.1 (87%) million
due the following:
|
|
·
|
a
decrease in the weighted average balance of debt of $17.0 million to $3.6
million for the year ended December 31, 2008 from $20.6 for the year ended
December 31, 2007 primarily from the reduction in advance rates on our
pledged CMBS-private placement collateral, which resulted in $15.8 million
in pay-downs on the related repurchase agreement debt;
and
|
|
|
·
|
a
decrease in the weighted average rate on our financings to 4.34% for the
year ended December 31, 2008 from 5.84% for the year ended December 31,
2007 primarily due to the decrease in LIBOR, which is a reference index
for the rates payable on a majority of these
borrowings.
|
Interest expense on our equipment
leasing portfolio was $4.4 million for the year ended December 31, 2008, as
compared to $5.6 million for the year ended December 31, 2007, a decrease of
$1.2 million (22%). The decrease for the year ended December 31, 2008
resulted primarily from a decrease in the weighted average rate on this debt to
4.67% for the year ended December 31, 2008 from 6.68% for the year ended
December 31, 2007. The decrease in rate was the result of the
decrease in the commercial paper index, which is a reference index for the rate
payable on the facility we used to finance this portfolio.
The decrease in interest expense was
partially offset by an increase in general interest expense. General
interest expense was $12.0 million for the year ended December 31, 2008, as
compared to $5.3 million for the year ended December 31, 2007, an increase of
$6.7 million (127%). This increase resulted primarily from an
increase of $7.8 million on our interest rate derivatives that fix the rate we
pay under these agreements. During the year ended December 31, 2008,
the fixed rate we paid exceeded the floating rate we received due to the
decrease in LIBOR. The increase in derivative expense was partially offset by a
decrease in interest expense related to our unsecured junior subordinated
debentures held by unconsolidated trusts that issued trust preferred securities
as a result of a decrease in the LIBOR rate which is a reference index for the
rates payable by these debentures.
Non-Investment
Expenses
The following table sets forth
information relating to our non-investment expenses incurred for the periods
presented (in thousands):
|
Years
Ended
|
||||||||||||
|
December
31,
|
||||||||||||
|
2009
|
2008
|
2007
|
||||||||||
|
Non-investment
expenses:
|
||||||||||||
|
Management fees-related
party
|
$ | 8,363 | $ | 6,301 | $ | 6,554 | ||||||
|
Equity compensation-related
party
|
1,240 | 540 | 1,565 | |||||||||
|
Professional services
|
3,866 | 3,349 | 2,911 | |||||||||
|
Insurance
|
828 | 641 | 466 | |||||||||
|
General and administrative
|
1,764 | 1,848 | 1,581 | |||||||||
|
Income tax (benefit)
expense
|
(2 | ) | (241 | ) | 338 | |||||||
|
Total
non-investment expenses
|
$ | 16,059 | $ | 12,438 | $ | 13,415 | ||||||
Year
Ended December 31, 2009 as compared to the Year Ended December 31,
2008
Management fees – related party
increased $2.1 million (33%) to $8.4 million for the year ended December 31,
2009 as compared to $6.3 million for the year ended December 31,
2008. These amounts represent compensation in the form of base
management fees and incentive management fees pursuant to our management
agreement. The base management fees decreased by $750,000 (17%) to
$3.8 million for the year ended December 31, 2009 as compared to $4.5 million
for the year ended December 31, 2008. This decline was due to
decreased stockholders’ equity, a component in the formula by which base
management fees are calculated, primarily as a result of significant additional
provisions for loan and lease losses and asset impairments during
2009. Incentive management fees increased by $2.8 million (160%) to
$4.6 million for the year ended December 31, 2009 from $1.8 million for the year
ended December 31, 2008. The incentive fee is calculated for each
quarter and the calculation in any quarter is not affected by the results of any
other quarter. The increase is the result of fees of $3.1 million and
$1.5 million for the three months ended September 30, 2009 and December 31,
2009, respectively, primarily as a result of the gains on extinguishment of debt
we realized during the six months ended December 31,
2009.
Equity compensation – related party
increased $700,000 (130%) to $1.2 million for the year ended December 31, 2009
as compared to $540,000 for the year ended December 31, 2008. These
expenses relate to the amortization of annual grants of restricted common stock
to our non-employee independent directors, and annual and discretionary grants
of restricted stock to several employees of Resource America who provide
investment management services to us through our Manager. The
increase in expense was primarily the result of an increase in our stock price
and its impact on our quarterly remeasurement of unvested stock and options as
well as issuances of new grants during the year.
Professional services increased
$517,000 (15%) to $3.9 million for the year ended December 31, 2009 as compared
to $3.3 million for the year ended December 31, 2008 due to an increase of
$864,000 in legal fees due to restructurings of our CRE loans as well as
compliance work performed. This increase was partially offset by a
decrease in lease servicing expense of $455,000 as a result of the sale of the
majority of the leasing portfolio on June 30, 2009.
Income tax benefit decreased $239,000
(99%) to a benefit of $2,000 for the year ended December 31, 2009 as compared to
a benefit of $241,000 for the year ended December 31, 2008 due to an
establishment of a valuation allowance against deferred tax assets related to
Resource TRS, our domestic taxable REIT subsidiary.
Year
Ended December 31, 2008 as compared to the Year Ended December 31,
2007
Management fees – related party
decreased $253,000 (4%) to $6.3 million for the year ended December 31, 2008 as
compared to $6.6 million for the year ended December 31, 2007. These
amounts represent compensation in the form of base management fees and incentive
management fees pursuant to our management agreement. The base
management fees decreased by $537,000 (11%) to $4.5 million for the year ended
December 31, 2008 as compared to $5.1 million for the year ended December 31,
2007. This decrease was due to decreased equity, a component in the
formula by which base management fees are calculated, as a result of asset
impairments and the eventual deconsolidation of Ischus CDO II and as a result of
provisions for loan and lease losses during 2008. Incentive
management fees increased by $284,000 (19%) to $1.8 million for the year ended
December 31, 2008 from $1.5 million for the year ended December 31,
2007. The incentive fee is calculated for each quarter and the
calculation in any quarter is not affected by the results of any other
quarter. The increase for the year ended December 31, 2008 is
primarily due to the fact that an incentive was paid for three quarters during
the year ended December 31, 2008 and only for two quarters during the year ended
December 31, 2007. No incentive management fee was paid for the
quarters ended June 30, 2008, September 30, 2007 and December 31, 2007 because
adjusted net income thresholds, as defined in the management agreement were not
met.
Equity compensation – related party
decreased $1.0 million (66%) to $540,000 for the year ended December 31, 2008 as
compared to $1.6 million for the year ended December 31, 2007. These
expenses relate to the amortization of annual grants of restricted common stock
to our non-employee independent directors, and annual and discretionary grants
of restricted stock to several employees of Resource America who provide
investment management services to us through our Manager. The
decrease in expense was primarily the result of an adjustment related to our
quarterly remeasurement of unvested stock and options granted to the Manager to
reflect changes in the fair value of our common stock as well as the vesting of
the remaining grant of stock and options to the Manager on March 8,
2005. These decreases were partially offset by the issuance of new
grants.
Professional services increased
$438,000 (15%) to $3.3 million for the year ended December 31, 2008 as compared
to $2.9 million for the year ended December 31, 2007 primarily due to the
following:
|
|
·
|
Increase
of $151,000 in lease servicing expense for the year ended December 31,
2008 due to the increase in managed assets in the year ended December 31,
2008.
|
|
|
·
|
Increase
of $394,000 in legal fees due to compliance work
performed.
|
These increases were offset by a
decrease of $64,000 in audit and tax fees for the year ended December 31, 2008
due to the timing of when the services were performed and billed.
Income tax expense decreased $579,000
(171%) to a benefit of $241,000 for the year ended December 31, 2008 as compared
to expense of $338,000 for the year ended December 31, 2007 due to a decrease in
taxable income related to Resource TRS, our domestic taxable REIT
subsidiary.
Other
(Expense)/Income
The following table sets forth
information relating to our other income (expense) incurred for the periods
presented (in thousands):
|
Years
Ended
|
||||||||||||
|
December
31,
|
||||||||||||
|
2009
|
2008
|
2007
|
||||||||||
|
Impairment
losses on investment securities
|
$ | (27,490 | ) | $ | (26,611 | ) | $ | (48,853 | ) | |||
|
Recognized
in other comprehensive loss
|
(14,019 | ) | (26,611 | ) | (22,576 | ) | ||||||
|
Net
impairment losses recognized in earnings
|
(13,471 | ) | − | (26,277 | ) | |||||||
|
Net
realized gains (losses) on loans and investments
|
1,890 | (1,637 | ) | (15,098 | ) | |||||||
|
Gain
on deconsolidation of VIE
|
− | − | 14,259 | |||||||||
|
Provision
for loan and lease losses
|
(61,383 | ) | (46,160 | ) | (6,211 | ) | ||||||
|
Gain
on the extinguishment of debt
|
44,546 | 1,750 | − | |||||||||
|
Gain
on the settlement of a loan
|
− | 574 | − | |||||||||
|
Other
(expense) income
|
(1,350 | ) | 115 | 201 | ||||||||
|
Total
|
$ | (29,768 | ) | $ | (45,358 | ) | $ | (33,126 | ) | |||
Year
Ended December 31, 2009 as compared to Year Ended December 31, 2008
Net
impairment losses recognized in earnings were $13.5 million during the year
ended December 31, 2009 and consisted of other-than-temporary impairment losses
of $6.9 million on two CMBS-private placement positions, $5.7 million on our
other ABS position, and $895,000 on one of our investment securities held to
maturity.
Net realized gains (losses) on loans
and investments increased $3.5 million to a gain of $1.9 million for the
year ended December 31, 2009 from a loss of $1.6 million for the year ended
December 31, 2008. The primary component of the increased gain during
the year ended December 31, 2009 was an increase of $1.4 million in net gains
from the sale of loans and held-to-maturity securities in our Apidos
portfolio. In addition, the year ended December 31, 2008 contains net
losses of $2.0 million from the sale of CMBS – private placement securities as
compared to $190,000 of gains during the year ended December 31, 2009, a net
increase in gains of $2.2 million for the year ended December 31,
2009.
Other
(expense) income increased $1.5 million to an expense of $1.4 million for
the year ended December 31, 2009 as compared to income of $115,000 for the year
ended December 31, 2008. The increase in expense was due to a charge
of $1.4 million that was the result of an accrual for a liability related to a
settlement on our equity position in the Ischus CDO II portfolio.
Our provision for loan and lease losses
increased $15.2 million (33%) to $61.4 million for the year ended December 31,
2009 as compared to $46.2 million for the year ended December 31,
2008. The provision for the year ended December 31, 2009 consisted of
a $31.9 million provision on our commercial real estate portfolio, a $26.8
million provision on our bank loan portfolio and a $2.7 million provision on our
direct financing leases and notes. The provision for the year ended
December 31, 2008 consisted of a $30.5 million provision for loan loss on our
bank loan portfolio, a $14.8 million provision on our commercial real estate
portfolio and a $900,000 provision on our direct financing leases and
notes. The principal reason for the increased provisions is overall
worsening credit markets in 2009. We have increased our general
allowance for loan and lease losses in 2009 by $8.0 million for bank loans, $8.1
million for CRE loans and $0.7 million on our leasing
portfolio. Also, due to payment defaults, we took an $18.8 million
provision on specifically impaired bank loans and a $2.0 million provision on
our leasing portfolio during 2009. Lastly, because of a decision to
liquidate a substantial portion of collateral in our largest CRE position, we
took a $23.8 million provision on that portfolio of loans in
2009.
Gain on the extinguishment of debt
increased $42.8 million during the year ended December 31, 2009 to $44.5 million
for the year ended December 31, 2009 from $1.8 million for the year ended
December 31, 2008. During the year ended December 31, 2009, we bought
back $55.5 million of debt issued by RREF CDO 2006-1 and RREF CDO
2007-1. The notes, issued at par, were bought back as an investment
by us at a weighted average price of 19.8% of par resulting in a gain of $44.5
million. During the year ended December 31, 2008, we bought back $5.0
million of debt issued by RREF CDO 2007-1. The notes, issued at par,
were bought back as an investment by us at a price of 65% of par resulting in a
gain of $1.8 million. The related deferred debt issuance costs were
immaterial in all transactions.
Gain on the settlement of a loan during
the year ended December 31, 2008 is due to the reimbursement of a loss related
to the termination of a hedge after the paydown of a commercial real estate
loan. Per the terms of the agreement, we were to be reimbursed for
any such termination costs. There was no such transaction during the
year ended December 31, 2009.
Year
Ended December 31, 2008 as compared to Year Ended December 31, 2007
Net impairment losses on investment
securities of $26.3 million during the year ended December 31, 2007 consisted
entirely of other-than-temporary impairment on assets in our residential
mortgage loan, or ABS-RMBS, portfolio held by Ischus CDO II. During
the second and third quarters of 2007, we experienced illiquidity in the
sub-prime market and deteriorating delinquency characteristics of the mortgages
underlying Ischus CDO II’s investments. These trends together with
significant rating agency actions supported the need to further reevaluate the
level of asset impairments in Ischus CDO II’s ABS-RMBS portfolio. The
asset impairments recorded reflected these declining market
conditions. There was no such impairment for the year ended December
31, 2008. These impairments were partially recaptured as part of our
gain on the deconsolidation of Ischus CDO II.
Net
realized gains (losses) on loans and investments decreased $13.5 million (89%)
to a loss of $1.6 million for the year ended December 31, 2008 from a loss of
$15.1 million for the year ended December 31, 2007. Realized losses
during the year ended December 31, 2008 consisted primarily of a loss of $2.0
million on the sale of one of our CMBS – private placement positions during the
year. This loss was partially offset by gains of $252,000 and
$112,000 on the sale of assets in our leasing and bank loan portfolio,
respectively. Realized losses during the year ended December 31, 2007
consisted primarily of a $15.6 million realized gross loss on deconsolidation of
Ischus CDO II.
Gain on deconsolidation of VIE of $14.3
million during the year ended December 31, 2007 is due to the deconsolidation of
Ischus CDO II in November 2007. Ischus CDO II had previously been a
consolidated entity.
Our provision for loan and lease losses
increased $39.9 million (643%) to $46.2 for the year ended December 31, 2008 as
compared to $6.2 million for the year ended December 31, 2007. The
provision for the year ended December 31, 2008 consisted of a $30.5 million
provision for loan loss on our bank loan portfolio, a $14.8 million provision on
our commercial real estate portfolio and a $900,000 provision on our direct
financing leases and notes. The provision for the year ended December
31, 2007 consisted of a $2.8 million provision for loan loss on our bank loan
portfolio, a $3.2 million provision on our commercial real estate portfolio and
a $293,000 provision for lease loss on our direct financing leases and
notes. The principal reason for the increase in the provision for
loan and lease losses was our increase of reserves on seven defaulted bank
loans, one defaulted CRE loan and one CRE loan sold at a discount. We
also increased our general reserves due to deteriorating credit market
conditions.
Gain on the extinguishment of debt
during the year ended December 31, 2008 is due to the buyback of $5.0 million of
debt issued by RREF CDO 2007-1 in February 2008. The notes, issued at
par, were bought back as an investment by us at a price of 65% of par resulting
in a gain of $1.8 million. The related deferred debt issuance costs
were immaterial. There was no such transaction during the year ended
December 31, 2007.
Gain on
the settlement of loan during the year ended December 31, 2008 is due to the
reimbursement of a loss related to the termination of a hedge after the paydown
of a commercial real estate loan. Under the terms of the agreement,
we were to be reimbursed for any such termination costs. There was no
such transaction during the year ended December 31,
2007.
Financial
Condition
Summary
Our total assets at December 31, 2009
were $1.8 billion as compared to $1.9 billion at December 31,
2008. The decrease in total assets was principally due to allowances
with respect to our loans and loan repayments in our investment
portfolio. The decrease in total assets from these loan repayments
also resulted in a reduction of our borrowings as we repaid related
debt. To a lesser extent, the decrease in our total assets was due to
a reduction in the fair market value of our available-for-sale
securities.
Investment
Portfolio
The following tables summarize the
amortized cost and net carrying amount of our investment portfolio as of
December 31, 2009 and 2008, classified by interest rate type. The
following table includes both (i) the amortized cost of our investment portfolio
and the related dollar price, which is computed by dividing amortized cost by
par amount, and (ii) the net carrying amount of our investment portfolio and the
related dollar price, which is computed by dividing the net carrying amount by
par amount (in thousands, except percentages):
|
Amortized
cost
(3)
|
Dollar
price
|
Net
carrying
amount
|
Dollar
price
|
Net
carrying
amount
less amortized cost
|
Dollar
price
|
|||||||||||||||||||
|
December
31, 2009
|
||||||||||||||||||||||||
|
Floating rate
|
||||||||||||||||||||||||
|
CMBS-private
placement
|
$ | 32,043 | 100.00% | $ | 11,185 | 34.91% | $ | (20,858 | ) | -65.09% | ||||||||||||||
|
Other
ABS
|
24 | 0.29% | 24 | 0.29% | − | −% | ||||||||||||||||||
|
B
notes (1)
|
26,500 | 100.00% | 26,283 | 99.18% | (217 | ) | -0.82% | |||||||||||||||||
|
Mezzanine
loans (1)
|
124,048 | 100.00% | 123,033 | 99.18% | (1,015 | ) | -0.82% | |||||||||||||||||
|
Whole
loans (1)
|
403,890 | 99.98% | 382,371 | 94.65% | (21,519 | ) | -5.33% | |||||||||||||||||
|
Bank
loans (2)
|
857,451 | 96.87% | 798,614 | 90.23% | (58,837 | ) | -6.65% | |||||||||||||||||
|
Bank
loans held for sale (3)
|
8,050 | 78.88% | 8,050 | 78.88% | − | −% | ||||||||||||||||||
|
ABS
held-to-maturity (4)
|
31,401 | 88.77% | 21,287 | 60.18% | (10,114 | ) | -28.59% | |||||||||||||||||
|
Total floating rate
|
1,483,407 | 97.23% | 1,370,847 | 89.85% | (112,560 | ) | -7.38% | |||||||||||||||||
|
Fixed rate
|
||||||||||||||||||||||||
|
CMBS
– private placement
|
60,067 | 64.08% | 33,333 | 35.56% | (26,734 | ) | -28.52% | |||||||||||||||||
|
B
notes (1)
|
54,977 | 100.05% | 54,527 | 99.23% | (450 | ) | -0.82% | |||||||||||||||||
|
Mezzanine
loans (1)
|
58,638 | 100.28% | 53,200 | 90.98% | (5,438 | ) | -9.30% | |||||||||||||||||
|
Whole
loans (1)
|
80,305 | 99.78% | 79,647 | 98.96% | (658 | ) | -0.82% | |||||||||||||||||
|
Equipment
leases and loans (5)
|
2,067 | 100.05% | 927 | 44.87% | (1,140 | ) | -55.18% | |||||||||||||||||
|
Total fixed rate
|
256,054 | 88.38% | 221,634 | 76.50% | (34,420 | ) | -11.88% | |||||||||||||||||
|
Grand total
|
$ | 1,739,461 | 95.82% | $ | 1,592,481 | 87.72% | $ | (146,980 | ) | -8.10% | ||||||||||||||
|
December
31, 2008
|
||||||||||||||||||||||||
|
Floating rate
|
||||||||||||||||||||||||
|
CMBS-private
placement
|
$ | 32,061 | 99.99% | $ | 15,042 | 46.91% | $ | (17,019 | ) | -53.08% | ||||||||||||||
|
Other
ABS
|
5,665 | 94.42% | 45 | 0.75% | (5,620 | ) | -93.67% | |||||||||||||||||
|
B
notes (1)
|
33,535 | 100.00% | 33,434 | 99.70% | (101 | ) | -0.30% | |||||||||||||||||
|
Mezzanine
loans (1)
|
129,459 | 100.01% | 129,071 | 99.71% | (388 | ) | -0.30% | |||||||||||||||||
|
Whole
loans (1)
|
431,985 | 99.71% | 430,690 | 99.41% | (1,295 | ) | -0.30% | |||||||||||||||||
|
Bank
loans (2)
|
909,350 | 99.17% | 577,598 | 62.99% | (331,752 | ) | -36.18% | |||||||||||||||||
|
ABS
held-to-maturity (4)
|
28,157 | 97.09% | 4,818 | 16.61% | (23,339 | ) | -80.48% | |||||||||||||||||
|
Total floating rate
|
1,570,212 | 99.36% | 1,190,698 | 75.35% | (379,514 | ) | -24.01% | |||||||||||||||||
|
Fixed rate
|
||||||||||||||||||||||||
|
CMBS
– private placement
|
38,397 | 91.26% | 14,173 | 33.69% | (24,224 | ) | -57.57% | |||||||||||||||||
|
B
notes (1)
|
55,534 | 100.11% | 55,367 | 99.81% | (167 | ) | -0.30% | |||||||||||||||||
|
Mezzanine
loans (1)
|
81,274 | 94.72% | 68,378 | 79.69% | (12,896 | ) | -15.03% | |||||||||||||||||
|
Whole
loans (1)
|
87,352 | 99.52% | 87,090 | 99.23% | (262 | ) | -0.29% | |||||||||||||||||
|
Equipment
leases and notes (4)
|
104,465 | 99.38% | 104,015 | 98.95% | (450 | ) | -0.43% | |||||||||||||||||
|
Total fixed rate
|
367,022 | 97.55% | 329,023 | 87.45% | (37,999 | ) | -10.10% | |||||||||||||||||
|
Grand total
|
$ | 1,937,234 | 99.02% | $ | 1,519,721 | 77.68% | $ | (417,513 | ) | -21.34% | ||||||||||||||
|
(1)
|
Net
carrying amount includes an allowance for loan losses of $29.3 million at
December 31, 2009, allocated as follows: B notes ($0.7
million), mezzanine loans ($6.4 million) and whole loans ($22.2
million). Net carrying amount includes an allowance for loan
losses of $15.1 million at December 31, 2008, allocated as follows: B
notes ($0.3 million), mezzanine loans ($13.3 million) and whole loans
($1.5 million).
|
|
(2)
|
The
bank loan portfolio is carried at amortized cost less allowance for loan
loss and was $839.6 million at December 31, 2009. The amount
disclosed represents net realizable value at December 31, 2009, which
includes $17.8 million allowance for loan losses at December 31,
2009. The bank loan portfolio was $908.7 million (net of
allowance of $28.8 million) at December 31,
2008.
|
|
(3)
|
Bank
loans held for sale are carried at the lower of cost or
market. Amortized cost is equal to fair
value.
|
|
(4)
|
ABS
held to maturity are carried at amortized cost less other-than-temporary
impairment.
|
|
(5)
|
Net
carrying amount includes a $1.1 million allowance for equipment leases and
loans losses at December 31, 2009.
|
Commercial Mortgage-Backed
Securities-Private Placement. The determination of
other-than-temporary impairment is a subjective process, and different judgments
and assumptions could affect the timing of loss realization. We
review our portfolios monthly and the determination of other-than-temporary
impairment is made at least quarterly. We consider the following
factors when determining if there is an other-than-temporary impairment on a
security:
|
|
·
|
the
length of time the market value has been less than amortized
cost;
|
|
|
·
|
the
severity of the impairment;
|
|
|
·
|
the
expected loss of the security as generated by third party
software;
|
|
|
·
|
credit
ratings from the rating agencies;
|
|
|
·
|
underlying
credit fundamentals of the collateral backing the security;
and
|
|
|
·
|
our
intent to sell as well as the likelihood that we will be required to sell
the security before the recovery of the amortized cost
basis.
|
At December 31, 2009 and 2008, we held
$44.5 million and $29.2 million, respectively, net of unrealized gains of $2.6
million and $0, respectively, and net of unrealized losses of $50.2 million and
$41.2 million at December 31, 2009 and 2008, respectively, of CMBS-private
placement at fair value which for our positions purchased in 2009 is based on
dealer quotes due to their higher ratings and more active markets and for our
positions purchased prior to 2009 is based on taking a weighted average of the
following three measures:
|
|
·
|
an
income approach utilizing an appropriate current risk-adjusted yield, time
value and projected estimated losses from default assumptions based on
analysis of underlying loan
performance;
|
|
|
·
|
quotes
on similar-vintage, higher rate, more actively traded CMBS adjusted as
appropriate for the lower subordination level of our securities;
and
|
|
|
·
|
dealer
quotes on our securities for which there is not an active
market.
|
In the aggregate, we purchased our
CMBS-private placement portfolio at a discount. At December 31, 2009
and 2008, the remaining discount to be accreted into income over the remaining
lives of the securities was $29.1 million and $3.7 million,
respectively. These securities are classified as available-for-sale
and, as a result, are carried at their fair value.
During
the three months ended December 31, 2009, two collateral positions that
supported the CMBS portfolio weakened to the point that default of these
positions became probable. The assumed default of these collateral
positions in our cash flow model yielded a value that would result in less than
a full recovery of our cost basis. Accordingly, we recognized a $6.9
million other-than-temporary impairment on two of our CMBS investments during
the three months ended December 31, 2009 bringing the combined fair value to
$206,000. We recognized these impairments through the consolidated
statements of operations.
While the remaining CMBS investments
have continued to decline in fair value, their change continues to be
temporary. We perform an on-going review of third-party reports and
updated financial data with respect to the financial information on the
underlying properties to analyze current and projected loan
performance. Rating agency downgrades are considered with respect to
our income approach when determining other-than-temporary impairment and when
inputs are stressed projected cash flows are adequate to recover
principal.
The following table summarizes our
CMBS-private placement as of December 31, 2009 and 2008 (in thousands, except
percentages). Dollar price is computed by dividing amortized cost by
par amount.
|
December
31, 2009
|
December
31, 2008
|
|||||||||||||||
|
Amortized
Cost
|
Dollar
Price
|
Amortized
Cost
|
Dollar
Price
|
|||||||||||||
|
Moody’s
Ratings Category:
|
||||||||||||||||
|
Aaa
|
$ | 11,690 | 64.70% | $ | − | − % | ||||||||||
|
Aa1
through Aa3
|
9,639 | 50.73% | − | − % | ||||||||||||
|
A1
through A3
|
4,826 | 56.14% | − | − % | ||||||||||||
|
Baa1
through Baa3
|
2,021 | 33.68% | 63,459 | 94.52% | ||||||||||||
|
Ba1
through Ba3
|
10,443 | 100.00% | − | − % | ||||||||||||
|
B1
through B3
|
24,449 | 85.27% | 6,999 | 99.99% | ||||||||||||
|
Caa1
through Caa3
|
12,832 | 98.71% | − | − % | ||||||||||||
|
Ca
through C
|
16,210 | 73.68% | − | − % | ||||||||||||
|
Total
|
$ | 92,110 | 73.23% | $ | 70,458 | 95.04% | ||||||||||
|
S&P
Ratings Category:
|
||||||||||||||||
|
AAA
|
$ | 5,997 | 59.97% | $ | − | − % | ||||||||||
|
AA+
through AA-
|
3,659 | 40.65% | − | − % | ||||||||||||
|
A+
through A-
|
6,544 | 62.75% | − | − % | ||||||||||||
|
BBB+
through BBB-
|
11,955 | 59.49% | 51,378 | 94.24% | ||||||||||||
|
BB+
through BB-
|
7,847 | 78.76% | 19,080 | 97.26% | ||||||||||||
|
B+
through B-
|
9,081 | 90.81% | − | − % | ||||||||||||
|
CCC+
through CCC-
|
47,027 | 83.54% | − | − % | ||||||||||||
|
Total
|
$ | 92,110 | 73.23% | $ | 70,458 | 95.04% | ||||||||||
|
Weighted
average rating factor
|
2,971 | 830 | ||||||||||||||
Other Asset-Backed
Securities. At December 31, 2009, we held two other ABS
positions with a fair value of $24,000 that is the result of
other-than-temporary impairment of $5.7 million recognized during the year ended
December 31, 2009. At December 31, 2008, we held one other ABS
position with a fair value of $45,000, which was net of unrealized losses of
$5.6 million. This security is classified as available-for-sale and
carried at fair value.
Real Estate
Loans. The following table is a summary of the loans in our
commercial real estate loan portfolio at the dates indicated (in
thousands):
|
Description
|
Number
of
Loans
|
Amortized
Cost
|
Contracted
Interest
Rates
|
Maturity Dates (3)
|
|||||||
|
December 31, 2009:
|
|||||||||||
|
Whole
loans, floating rate (1)
|
32 | $ | 403,890 |
LIBOR
plus 1.50% to
LIBOR
plus 4.40%
|
May
2010 to
February
2017
|
||||||
|
Whole
loans, fixed rate (1)
|
6 | 80,305 |
6.98%
to 10.00%
|
May
2010 to
August
2012
|
|||||||
|
B
notes, floating rate
|
3 | 26,500 |
LIBOR
plus 2.50% to
LIBOR
plus 3.01%
|
July
2010 to
October
2010
|
|||||||
|
B
notes, fixed rate
|
3 | 54,977 |
7.00%
to 8.68%
|
July
2011 to
July
2016
|
|||||||
|
Mezzanine
loans, floating rate
|
10 | 124,048 |
LIBOR
plus 2.15% to
LIBOR
plus 3.45%
|
May
2010 to
January
2013
|
|||||||
|
Mezzanine
loans, fixed rate
|
5 | 58,638 |
8.14%
to 11.00%
|
May
2010 to
September
2016
|
|||||||
|
Total (2)
|
59 | $ | 748,358 | ||||||||
|
December 31, 2008:
|
|||||||||||
|
Whole
loans, floating rate (1)
|
29 | $ | 431,985 |
LIBOR
plus 1.50% to
LIBOR
plus 4.40%
|
April
2009 to
August
2011
|
||||||
|
Whole
loans, fixed rate (1)
|
7 | 87,352 |
6.98%
to 10.00%
|
May
2009 to
August
2012
|
|||||||
|
B
notes, floating rate
|
4 | 33,535 |
LIBOR
plus 2.50% to
LIBOR
plus 3.01%
|
March
2009 to
October
2009
|
|||||||
|
B
notes, fixed rate
|
3 | 55,534 |
7.00%
to 8.68%
|
July
2011 to
July
2016
|
|||||||
|
Mezzanine
loans, floating rate
|
10 | 129,459 |
LIBOR
plus 2.15% to
LIBOR
plus 3.45%
|
May
2009 to
February
2010
|
|||||||
|
Mezzanine
loans, fixed rate
|
7 | 81,274 |
5.78%
to 11.00%
|
November
2009 to
September
2016
|
|||||||
|
Total (2)
|
60 | $ | 819,139 | ||||||||
|
(1)
|
Whole
loans had $5.6 million and $26.6 million in unfunded loan commitments as
of December 31, 2009 and 2008, respectively, that are funded as the loans
require additional funding and the related borrowers have satisfied the
requirements to obtain this additional
funding.
|
|
(2)
|
The
total does not include an allowance for loan losses of $29.3 million and
$15.1 million recorded as of December 31, 2009 and 2008,
respectively.
|
|
(3)
|
Excludes
two floating rate whole loans. One whole loan matured in July
2009 and is in foreclosure. The other whole loan that matured
is on a month-to-month extension. This loan is current with
respect to interest.
|
We had one mezzanine loan, with a
balance of $11.6 million secured by equity interests in two enclosed regional
malls that went into default in February 2008. During the three
months ended June 30, 2008, we recorded a provision for loan loss on the full
balance. We do not expect to recover any of this loan
balance.
We have a portfolio of whole loans,
with a cost balance of $66.8 million secured by multifamily properties in
Northern California. We decided to liquidate a substantial portion of
the underlying collateral securing these loans and, as a result, we took an
$18.8 million provision for loan loss during 2009. This portfolio of
loans was restructured and modified in 2010 after the final sale of certain of
the collateral properties. The modified loan balance after
application of the 2010 sales proceeds of $8.3 million and the 2009 provisions
taken was $39.7 million and is supported under its modified terms by the current
cash flow from the remaining collateral properties. Management has
determined that this was a troubled debt restructuring.
Bank Loans. At
December 31, 2009, we held a total of $798.6 million of bank loans at fair value
through Apidos CDO I, Apidos CDO III and Apidos Cinco CDO, all of which secure
the debt issued by these entities. This is an increase of $216.2
million over our holdings at December 31, 2008. The increase in total
bank loans was principally due to improved market prices for bank loans during
the year 2009. We own 100% of the equity issued by Apidos CDO I,
Apidos CDO III and Apidos Cinco CDO which we have determined are variable
interest entities, or VIEs, of which we are the primary
beneficiary. See “-Variable Interest Entities.” As a
result, we consolidated Apidos CDO I, Apidos CDO III and Apidos Cinco CDO as of
December 31, 2008.
The following table summarizes our bank
loan investments as of December 31, 2009 and 2008 (in thousands, except
percentages). Dollar price is computed by dividing amortized cost by
par amount.
|
December
31, 2009
|
December
31, 2008
|
||||||||||||||||
|
Amortized
cost
|
Dollar
price
|
Amortized
cost
|
Dollar
price
|
||||||||||||||
|
Moody’s
ratings category:
|
|||||||||||||||||
|
Baa1
through Baa3
|
$ | 38,419 | 98.09% | $ | 16,732 | 97.71% | |||||||||||
|
Ba1
through Ba3
|
404,609 | 96.91% | 456,594 | 99.21% | |||||||||||||
|
B1
through B3
|
355,441 | 96.33% | 397,157 | 99.10% | |||||||||||||
|
Caa1
through Caa3
|
44,265 | 99.79% | 34,617 | 100.09% | |||||||||||||
|
Ca
|
13,697 | 88.68% | − | − % | |||||||||||||
|
No
rating provided
|
9,070 | 91.64% | 4,250 | 100.00% | |||||||||||||
|
Total
|
$ | 865,501 | 96.67% | $ | 909,350 | 99.17% | |||||||||||
|
S&P
ratings category:
|
|||||||||||||||||
|
BBB+
through BBB-
|
$ | 73,629 | 98.23% | $ | 41,495 | 99.44% | |||||||||||
|
BB+
through BB-
|
353,725 | 97.11% | 473,354 | 99.03% | |||||||||||||
|
B+
through B-
|
337,193 | 96.12% | 317,601 | 99.46% | |||||||||||||
|
CCC+
through CCC-
|
42,198 | 96.65% | 26,886 | 100.02% | |||||||||||||
|
CC+
through CC-
|
3,104 | 100.13% | − | 100.00% | |||||||||||||
|
C+
through C-
|
− | − % | 1,075 | 100.00% | |||||||||||||
| D | 8,602 | 95.91% | 1,480 | 100.00% | |||||||||||||
|
No
rating provided
|
47,050 | 94.85% | 47,459 | 97.85% | |||||||||||||
|
Total
|
$ | 865,501 | 96.67% | $ | 909,350 | 99.17% | |||||||||||
|
Weighted
average rating factor
|
2,131 | 1,982 | |||||||||||||||
Asset-backed securities
held-to-maturity. At December 31, 2009, we held a total of
$21.3 million of ABS held-to-maturity at amortized cost through Apidos CDO I,
Apidos CDO III and Apidos Cinco CDO, all of which secure the debt issued by
these entities. This is an increase of $16.5 million over our
holdings at December 31, 2008. The increase in total ABS
held-to-maturity was principally due to the purchase of $11.8 million par value
of ABS held-to-maturity during the year ended December 31, 2009.
During
the three months ended September 30, 2009, one collateral position that
supported the ABS held-to-maturity weakened to the point that default of this
position became probable. The assumed default of this collateral
position in our cash flow model yielded a value that would result in less than a
full recovery of our cost basis. Accordingly, we recognized an
$895,000 other-than-temporary impairment on our ABS held-to-maturity investment
during the three months ended September 30, 2009 bringing the combined fair
value to $925,000. We recognized this impairment through the
consolidated statements of operations.
The following table summarizes our ABS
held-to-maturity, at cost as of December 31, 2009 and 2008 (in thousands, except
percentages). Dollar price is computed by dividing amortized cost by
par amount.
|
December
31, 2009
|
December
31, 2008
|
|||||||||||||||
|
Amortized
cost
|
Dollar
price
|
Amortized
cost
|
Dollar
price
|
|||||||||||||
|
Moody’s
ratings category:
|
||||||||||||||||
|
Aa1
through Aa3
|
$ | 2,854 | 82.89% | $ | 1,136 | 75.73% | ||||||||||
|
A1
through A3
|
303 | 75.75% | 6,351 | 97.71% | ||||||||||||
|
Baa1
through Baa3
|
− | − % | 3,050 | 97.60% | ||||||||||||
|
Ba1
through Ba3
|
4,427 | 95.72% | 15,187 | 98.78% | ||||||||||||
|
B1
through B3
|
4,240 | 97.58% | − | − % | ||||||||||||
|
Caa1
through Caa3
|
9,913 | 99.14% | − | − % | ||||||||||||
|
Ca
|
3,629 | 79.57% | − | − % | ||||||||||||
|
No
rating provided
|
6,035 | 75.44% | 2,433 | 97.32% | ||||||||||||
|
Total
|
$ | 31,401 | 88.77% | $ | 28,157 | 97.09% | ||||||||||
|
S&P
ratings category:
|
||||||||||||||||
|
No
rating provided
|
$ | 31,401 | 88.77% | $ | 28,157 | 97.09% | ||||||||||
|
Total
|
$ | 31,401 | 88.77% | $ | 28,157 | 97.09% | ||||||||||
|
Weighted
average rating factor
|
4,028 | 795 | ||||||||||||||
Equipment Leases and
Notes. On June 30, 2009, we sold our sole membership interest
in one of our subsidiaries that held a pool of leases valued at $89.8 million
and transferred the $82.3 million balance of the related secured term facility
to Resource America. No gain or loss was recognized on the sale of
this membership interest. We received a note of $7.5 million from
Resource America for the equity in the portfolio on June 30,
2009. The promissory note bore interest at LIBOR plus 3% and matured
on September 30, 2009. On July 1, 2009, $4.5 million of the
promissory note was repaid. The remaining outstanding principal
balance of the note of $3.0 million was paid in full on August 3,
2009. The balance of equipment leases and notes was $927,000 and
$104.0 million as of December 31, 2009 and 2008, respectively.
Interest
Receivable. At December 31, 2009, we had interest receivable
of $5.8 million, which consisted of $5.7 million of interest on our securities,
loans and equipment leases and notes and $9,000 of interest earned on escrow and
sweep accounts. At December 31, 2008, we had interest receivable of
$8.4 million, which consisted of $8.4 million of interest on our securities,
loans and equipment leases and notes and $49,000 of interest earned on escrow
and sweep accounts. The decrease in interest receivable resulted
primarily from a $2.3 million decrease in interest on our Apidos portfolio as a
result of the decrease in LIBOR, a reference index for the rates payable on
these assets, $317,000 decrease in interest on our commercial real estate
portfolio and $41,000 decrease in escrow and sweep interest.
Other Assets. Other
assets at December 31, 2009 of $5.1 million consisted primarily of $1.6 million
of loan origination costs associated with our commercial real estate loan
portfolio and trust preferred securities issuances, $1.1 million of principal
paydown receivables on our bank loan and commercial real estate loan portfolios,
$196,000 of prepaid directors’ and officers’ liability insurance, $273,000 of
prepaid expenses, $1.7 million of deferred tax assets, $19,000 of lease payment
receivable and $212,000 of other receivables. Other assets at December 31,
2008 of $5.0 million consisted primarily of $2.7 million of loan origination
costs associated with our trust preferred securities issuances, commercial real
estate loan portfolio and secured term facility, $125,000 of prepaid directors’
and officers’ liability insurance, $764,000 of prepaid expenses, $424,000 of
lease payment receivables, $950,000 of principal paydown receivables on our bank
loan portfolio and $60,000 of other receivables. The increase of $89,000
in other assets was primarily due to an increase in deferred tax assets of $1.7
million due to loss on our leasing portfolio, an increase of $152,000 of other
receivables, $134,000 of principal paydown and $71,000 of prepaid directors’ and
officers’ liability insurance. This increase is partially offset by a
decrease of $1.1 million in loan origination cost, $492,000 of prepaid assets
and $405,000 of lease payment receivables due to the sale of a majority of our
leasing portfolio on June 30, 2009.
Hedging
Instruments. Our hedges at December 31, 2009 and 2008 were
fixed-for-floating interest rate swap agreements whereby we swapped the floating
rate of interest on the liabilities we hedged for a fixed rate of
interest. With interest rates at historically low levels and the
pending maturity of several agreements, we expect that the fair value of our
hedges will modestly improve in 2010. We intend to continue to seek
such hedges for our floating rate debt in the future. Our hedges at
December 31, 2009 were as follows (in thousands):
|
Benchmark
rate
|
Notional
value
|
Strike
rate
|
Effective
date
|
Maturity
date
|
Fair
value
|
||||||||||||
|
Interest
rate swap
|
1
month LIBOR
|
$ | 15,235 | 5.34% |
06/08/07
|
02/25/10
|
$ | (119 | ) | ||||||||
|
Interest
rate swap
|
1
month LIBOR
|
7,000 | 5.34% |
06/08/07
|
02/25/10
|
(55 | ) | ||||||||||
|
Interest
rate swap
|
1
month LIBOR
|
28,000 | 5.10% |
05/24/07
|
06/05/10
|
(579 | ) | ||||||||||
|
Interest
rate swap
|
1
month LIBOR
|
12,965 | 4.63% |
12/04/06
|
07/01/11
|
(721 | ) | ||||||||||
|
Interest
rate swap
|
1
month LIBOR
|
12,150 | 5.44% |
06/08/07
|
03/25/12
|
(1,082 | ) | ||||||||||
|
Interest
rate swap
|
1
month LIBOR
|
12,750 | 5.27% |
07/25/07
|
08/06/12
|
(1,186 | ) | ||||||||||
|
Interest
rate swap
|
1
month LIBOR
|
34,530 | 4.13% |
01/10/08
|
05/25/16
|
(1,266 | ) | ||||||||||
|
Interest
rate swap
|
1
month LIBOR
|
1,681 | 5.72% |
07/09/07
|
10/01/16
|
(141 | ) | ||||||||||
|
Interest
rate swap
|
1
month LIBOR
|
1,880 | 5.68% |
07/13/07
|
03/12/17
|
(274 | ) | ||||||||||
|
Interest
rate swap
|
1
month LIBOR
|
82,117 | 5.58% |
06/08/07
|
04/25/17
|
(6,677 | ) | ||||||||||
|
Interest
rate swap
|
1
month LIBOR
|
1,726 | 5.65% |
06/28/07
|
07/15/17
|
(135 | ) | ||||||||||
|
Interest
rate swap
|
1
month LIBOR
|
3,850 | 5.65% |
07/19/07
|
07/15/17
|
(301 | ) | ||||||||||
|
Interest
rate swap
|
1
month LIBOR
|
4,023 | 5.41% |
08/07/07
|
07/25/17
|
(276 | ) | ||||||||||
|
Total
|
$ | 217,907 | 5.18% | $ | (12,812 | ) | |||||||||||
In addition, we had one interest rate
cap agreement with a fair value of $45,000 and notional amount of $14.8 million
outstanding as of December 31, 2009 which reduced our exposure to variability in
future cash flows attributable to LIBOR. The interest rate cap is a
non-designated cash flow hedge and, as a result, the change in fair value is
recorded through interest expense on our consolidated statements of
operations. The interest rate cap had an effective date of January 8,
2009, has a maturity date of August 5, 2011 and has a cap rate of
2.00%. We did not have any interest rate caps as of December 31,
2008.
As of December 31, 2008, we had entered
into hedges with a notional amount of $325.0 million and maturities ranging from
May 2009 to December 2017. At December 31, 2008, the fair value
on our interest rate swap agreements was ($31.6) million.
Repurchase
Agreements. Historically, we have used repurchase agreements
to finance our commercial real estate loans and CMBS-private placement
portfolio. We discuss these repurchase agreements in “−Repurchase
Agreements,” below. When used, these agreements are secured by the
financed assets and bear interest rates that have historically moved in close
relationship to LIBOR. At December 31, 2009 and 2008, we had
established nine borrowing arrangements with various financial institutions and
for the years ended December 31, 2009 and 2008, had utilized two of these
arrangements, principally our arrangement with Natixis; however, at December 31,
2009 we had repaid all outstanding borrowings on these
facilities. Because any repurchase transaction must be approved by
the lender, and as a result of current market conditions, we do not anticipate
using these facilities for the foreseeable future although, the facilities
remain available for use if market conditions improve.
Collateralized Debt
Obligations. As of December 31, 2009, we had executed and
retained equity in five CDO transactions as follows:
|
|
·
|
In
June 2007, we closed RREF CDO 2007-1, a $500.0 million CDO transaction
that provided financing for commercial real estate loans. The
investments held by RREF CDO 2007-1 collateralized $390.0 million of
senior notes issued by the CDO vehicle, of which RCC Real Estate, Inc., or
RCC Real Estate, a subsidiary of ours, purchased 100% of the class H
senior notes, class K senior notes, class L senior notes and class M
senior notes for $68.0 million at closing, $5.0 million of the Class J
senior notes purchased in February 2008 an additional $2.5 million of the
Class J senior notes in November 2009, and $11.9 million of the Class E
senior notes, $11.9 million of the Class F senior notes and $7.3 million
of the Class G senior notes in December 2009. In addition, RREF
2007-1 CDO Investor, LLC, a subsidiary of RCC Real Estate, purchased a
$41.3 million equity interest representing 100% of the outstanding
preference shares. At December 31, 2009, the notes issued to
outside investors, net of repurchased notes had a weighted average
borrowing rate of 0.81%.
|
|
|
·
|
In
May 2007, we closed Apidos Cinco CDO, a $350.0 million CDO transaction
that provided financing for bank loans. The investments held by
Apidos Cinco CDO collateralized $322.0 million of senior notes issued by
the CDO vehicle, of which RCC Commercial Inc., or RCC Commercial, a
subsidiary of ours, purchased a $28.0 million equity interest representing
100% of the outstanding preference shares. At December 31,
2009, the notes issued to outside investors had a weighted average
borrowing rate of 0.78%.
|
|
|
·
|
In
August 2006, we closed RREF CDO 2006-1, a $345.0 million CDO transaction
that provided financing for commercial real estate loans. The
investments held by RREF CDO 2006-1 collateralized $308.7 million of
senior notes issued by the CDO vehicle, of which RCC Real Estate purchased
100% of the class J senior notes and class K senior notes for $43.1
million at closing and $7.5 million of the Class F senior notes in June
2009, $3.5 million of the Class E senior note and $4.0 million of the
Class F senior notes in September 2009. In addition, RREF
2006-1 CDO Investor, LLC, a subsidiary of RCC Real Estate, purchased a
$36.3 million equity interest representing 100% of the outstanding
preference shares. At December 31, 2009, the notes issued to
outside investors, net of repurchased notes had a weighted average
borrowing rate of 1.11%.
|
|
|
·
|
In
May 2006, we closed Apidos CDO III, a $285.5 million CDO transaction that
provided financing for bank loans. The investments held by
Apidos CDO III collateralized $262.5 million of senior notes issued by the
CDO vehicle, of which RCC Commercial purchased $23.0 million equity
interest representing 100% of the outstanding preference
shares. At December 31, 2009, the notes issued to outside
investors had a weighted average borrowing rate of
0.71%.
|
|
|
·
|
In
August 2005, we closed Apidos CDO I, a $350.0 million CDO transaction that
provided financing for bank loans. The investments held by
Apidos CDO I collateralize $321.5 million of senior notes issued by the
CDO vehicle, of which RCC Commercial purchased $28.5 million equity
interest representing 100% of the outstanding preference
shares. At December 31, 2009, the notes issued to outside
investors had a weighted average borrowing rate of
0.86%.
|
Trust Preferred
Securities. In May and September 2006, we formed Resource
Capital Trust I and RCC Trust II, respectively, for the sole purpose of issuing
and selling trust preferred securities. Resource Capital Trust I and
RCC Trust II are not consolidated into our consolidated financial statements
because we are not deemed to be the primary beneficiary of either
trust. We own 100% of the common shares of each trust, each of which
issued $25.0 million of preferred shares to unaffiliated
investors. Our rights as the holder of the common shares of each
trust are subordinate to the rights of the holders of preferred shares only in
the event of a default; otherwise, our economic and voting rights are pari passu
with the preferred shareholders. We record each of our investments in
the trusts’ common shares of $774,000 as an investment in unconsolidated trusts
and record dividend income upon declaration by each trust.
In October 2009, we amended our
unsecured junior subordinated debentures held by RCT I and RCT II with a total
value outstanding of $51.5 million. The amendment provides for an
interest rate increase of 2% (from LIBOR plus 3.95% to LIBOR plus 5.95%) on both
issuances for a period of two years and a one-time restructuring fee of $250,000
in exchange for the waiver of financial covenants under our
guarantee. The covenant waiver expires on January 1,
2012. The debt issuance costs associated with the junior subordinated
debentures for RCT I and RCT II at December 31, 2009 were $742,000 and $754,000,
respectively. The interest rate adjustment took effect as of October
1, 2009 and expires on September 30, 2011. The rates for RCT I and
RCT II at December 31, 2009, were 6.18% and 6.19%, respectively. The
rates for RCT I and RCT II at December 31, 2008, were 5.42% and 7.42%,
respectively. The additional cost is approximately $280,000 per
quarter.
In connection with the issuance and
sale of the trust preferred securities, we issued $25.8 million principal amount
of junior subordinated debentures to each of Resource Capital Trust I and RCC
Trust II. The junior subordinated debentures debt issuance costs are
deferred in other assets in the consolidated balance sheets. We
record interest expense on the junior subordinated debentures and amortization
of debt issuance costs in our consolidated statements of
operations. At December 31, 2009, Resource Capital Trust I and RCC
Trust II had weighted average borrowing rates of 6.18% and 6.19%,
respectively.
Stockholders’
Equity
Stockholders’ equity at December 31,
2009 was $228.8 million and gave effect to $12.8 million of unrealized losses on
cash flow hedges and $47.6 million of unrealized losses on our
available-for-sale portfolio, shown as a component of accumulated other
comprehensive loss. Stockholders’ equity at December 31, 2008 was $186.3
million and gave effect to $31.6 million of unrealized losses on cash flow
hedges and $46.9 million of unrealized losses on our available-for-sale
portfolio, shown as a component of accumulated other comprehensive loss.
The increase in stockholders’ equity during the year ended December 31, 2009 was
principally due to our most recent offering completed in December 2009 and the
increase in the market value of our available-for-sale securities and on our
cash flow hedges offset by an increase in provision for loan losses and other
than temporary impairment on our available-for-sale
portfolio.
As a result of “available-for-sale”
accounting treatment, unrealized fluctuations in market values of certain assets
do not impact our income determined in accordance with accounting principles
generally accepted in the United States of America, or GAAP, or our taxable
income, but rather are reflected on our consolidated balance sheets by changing
the carrying value of the asset and stockholders’ equity under “Accumulated
Other Comprehensive Loss.” By accounting for our assets in this
manner, we hope to provide useful information to stockholders and creditors and
to preserve flexibility to sell assets in the future without having to change
accounting methods.
The following is a reconciliation of
GAAP stockholders’ equity to economic book value:
|
As
of December 31,
|
||||||||
|
2009
|
2008
|
|||||||
|
(in
thousands, except per share data)
|
||||||||
|
Stockholders’
equity - GAAP
|
$ | 228,830 | $ | 186,305 | ||||
|
Add:
(1)
|
||||||||
|
Unrealized losses – CMBS
portfolio
|
47,592 | 41,243 | ||||||
|
Unrealized losses recognized in
excess of value at risk – interest rate swaps
|
12,812 | 31,589 | ||||||
|
Economic
book value (2)
|
$ | 289,234 | $ | 259,137 | ||||
|
Shares
outstanding
|
36,546 | 25,345 | ||||||
|
Economic
book value per share
|
$ | 7.91 | $ | 10.22 | ||||
|
(1)
|
RCC
adds back unrealized losses on interest rate swaps (cash flow hedges) that
are associated with fixed-rate loans that have not been fair-valued
through stockholders’ equity.
|
|
(2)
|
Management
views economic book value, a non-GAAP measure, as a useful and appropriate
supplement to GAAP stockholders' equity and book value per
share. The measure serves as an additional measure of RCC’s
value because it facilitates evaluation of us without the effects of
unrealized losses on investments for which we expect to recover full par
value at maturity and on interest rate swaps, which we intend to hold to
maturity, in excess of RCC’s value at risk. Unrealized losses
recognized in RCC’s financial statements, prepared in accordance with GAAP
that are in excess of RCC’s maximum value at risk are added back to
stockholders' equity in arriving at economic book
value. Economic book value should be reviewed in connection
with GAAP stockholders' equity as set forth in RCC’s consolidated balance
sheets, to help analyze RCC’s value to investors. Economic book
value is defined in various ways throughout the REIT
industry. Investors should consider these differences when
comparing RCC’s economic book value to that of other
REITs.
|
REIT
Taxable Income
We calculate estimated REIT taxable
income, which is a non-GAAP financial measure, according to the requirements of
the Internal Revenue Code. The following table reconciles GAAP net
income to estimated REIT taxable income for the periods presented (in
thousands):
|
Years
Ended
|
||||||||||||
|
December
31,
|
||||||||||||
|
2009
|
2008
|
2007
|
||||||||||
|
Net
income (loss) – GAAP
|
$ | 6,339 | $ | (3,074 | ) | $ | 8,890 | |||||
|
Taxable REIT subsidiary’s
loss
|
3,138 | − | − | |||||||||
|
Adjusted net income (loss)
|
9,477 | (3,074 | ) | 8,890 | ||||||||
|
Adjustments:
|
||||||||||||
|
Share-based compensation to
related parties
|
543 | (1,620 | ) | (500 | ) | |||||||
|
Capital carryover
(utilization)/losses from the sale of
securities
|
4,818 | 2,000 | (49 | ) | ||||||||
|
Provision for loan and lease
losses unrealized
|
26,877 | 14,817 | 3,153 | |||||||||
|
Asset impairments
|
13,471 | − | 26,277 | |||||||||
|
Deferral of extinguishment of debt
income
|
(28,530 | ) | − | − | ||||||||
|
Net book to tax adjustment for the
inclusion of our
taxable foreign REIT
subsidiaries
|
(6,277 | ) | 27,115 | 3,432 | ||||||||
|
Subpart F income limitation
|
9,872 | − | − | |||||||||
|
Net unrealized loss on the
deconsolidation of
ABS-RMBS portfolio
|
− | − | 1,317 | |||||||||
|
Other net book to tax
adjustments
|
1,212 | 16 | (110 | ) | ||||||||
|
Estimated
REIT taxable income
|
$ | 31,463 | $ | 39,254 | $ | 42,410 | ||||||
We believe that a presentation of
estimated REIT taxable income provides useful information to investors regarding
our financial condition and results of operations as we use this measurement to
determine the amount of dividends that we are required to declare to our
stockholders in order to maintain our status as a REIT for federal income tax
purposes. Since we, as a REIT, expect to make distributions based on
taxable earnings, we expect that our distributions may at times be more or less
than our reported GAAP earnings. Total taxable income is the
aggregate amount of taxable income generated by us and by our domestic and
foreign taxable REIT subsidiaries. Estimated REIT taxable income
excludes the undistributed taxable income of our domestic TRS, if any such
income exists, which is not included in REIT taxable income until distributed to
us. There is no requirement that our domestic TRS distribute its
earning to us. Estimated REIT taxable income, however, includes the
taxable income of our foreign TRSs because we are generally required to
recognize and report their taxable income on a current basis. Because
not all companies use identical calculations, this presentation of estimated
REIT taxable income may not be comparable to other similarly-titled measures of
other companies.
In order to maintain our qualification
as a REIT and to avoid corporate-level income tax on the income we distribute to
our stockholders, we intend to make regular quarterly distributions of all or
substantially all of our net REIT taxable income to holders of our common
stock. This requirement can impact our liquidity and capital
resources.
Liquidity
and Capital Resources
As of December 31, 2009, our principal
sources of current liquidity were $43.4 million of net proceeds from our
December 2009 offering and $8.9 million of proceeds from sales of common stock
through our Dividend Reinvestment Plan, or DRIP, and funds available in existing
CDO financings of $80.5 million. As of December 31, 2008, our
principal sources of current liquidity were funds available in existing CDO
financings of $35.9 million, $4.0 million from secured term financings, and
$33.1 million of net proceeds from the transfer of commercial real estate loans,
available-for-sale securities and commercial real estate CDO notes from our
commercial real estate term facility and short term repurchase agreements into
our CDO structures.
Our
on-going liquidity needs consist principally of funds to make investments, make
debt repurchases, make distributions to our stockholders and pay our operating
expenses, including our management fees. Our ability to meet our on-going
liquidity needs will be subject to our ability to generate cash from operations
and, with respect to our investments, our ability to maintain and/or obtain
additional debt financing and equity capital together with the funds referred to
above. Historically, we have financed a substantial portion of our
portfolio investments through CDOs that essentially match the maturity and
repricing dates of these financing vehicles with the maturities and repricing
dates of our investments. We derive substantial operating cash from
our equity investments in our CDOs, which if they fail to meet certain tests,
will cease. Through December 31, 2009, we have not experienced
difficulty in maintaining our existing CDO financing and have passed all of the
critical tests required by these financings. However, we cannot
assure you that we will continue to meet all such critical tests in the future.
If we are unable to renew, replace or expand our sources of existing
financing on substantially similar terms, we may be unable to implement our
investment strategies successfully and may be required to liquidate portfolio
investments. If required, a sale of portfolio investments could be at
prices lower than the carrying value of such assets, which would result in
losses and reduced income.
At February 28, 2010, after paying the
fourth quarter dividend, RCC’s liquidity of $116.7 million consists of two
primary sources:
|
|
·
|
unrestricted
cash and cash equivalents of $29.1 million and restricted cash of $4.0
million in margin call accounts;
and
|
|
|
·
|
capital
available for reinvestment in its five CDO entities of $83.6 million, of
which $1.7 million is designated to finance future funding commitments on
CRE loans.
|
Our leverage ratio may vary as a result
of the various funding strategies we use. As of December 31, 2009 and
2008, our leverage ratio was 6.7 times and 9.1 times,
respectively. The decrease in leverage ratio was primarily due to the
offering proceeds received during our December 2009 offering, the repurchase of
our CDO debt, at substantial discounts, and the repayment of our short-term
borrowing obligations in full during the year ended December 31,
2009.
Repurchase
Agreements
In April 2007, our indirect
wholly-owned subsidiary, RCC Real Estate SPE 3, LLC, entered into a master
repurchase agreement with Natixis Real Estate Capital, Inc. to be used as a
warehouse facility to finance the purchase of commercial real estate loans and
commercial mortgage-backed securities. The maximum amount of our
borrowing capacity under the repurchase agreement was $150.0
million. The financing provided by the agreement matures April 18,
2010 subject to a one-year extension at the option of RCC Real Estate SPE 3 and
subject further to the right of RCC Real Estate SPE 3 to repurchase the assets
held in the facility earlier. We paid a facility fee of 0.75% of the
maximum facility amount, or $1.2 million, at closing. In addition,
once the borrowings exceed a weighted average undrawn balance of $75.0 million
for the prior 90 day period, we must pay a non-usage fee on the unused portion
equal to the product of (i) 0.15% per annum multiplied by, (ii) the weighted
average undrawn balance during the prior 90 day period. The
repurchase agreement is with recourse only to the assets financed, subject to
standardized exceptions relating to breaches of representations, fraud and
similar matters. We have guaranteed RCC Real Estate SPE 3, LLC’s
performance of our obligations under the repurchase agreement.
Through a series of amendments entered
into in 2008 and 2009 between RCC Real Estate SPE 3 and Natixis, the term
repurchase facility and the related Guaranty have been amended as
follows:
|
|
·
|
The
amount of the facility was reduced from $150,000,000 to
$100,000,000.
|
|
|
·
|
The
amount of the facility will further be reduced to the amount outstanding
on October 18, 2009.
|
|
|
·
|
Beginning
on November 25, 2008, any further repurchase agreement transactions may be
made in Natixis’ sole discretion. In addition, premiums over
new repurchase prices are required for early repurchase by RCC Real Estate
SPE 3 of the Existing Assets that represent collateral under the facility;
however, the premiums will reduce the repurchase price of the remaining
Existing Assets.
|
|
|
·
|
RCC
Real Estate SPE 3’s obligation to pay non-usage fees was
terminated.
|
|
|
·
|
The
weighted average undrawn balance (as defined in the agreement) threshold
exempting payment of the non-usage fee was reduced from $75,000,000 to
$56,250,000.
|
|
|
·
|
The
minimum net worth covenant amount was reduced from $250,000,000 to
$125,000,000.
|
At December 31, 2009, RCC Real Estate
SPE 3 had repaid all outstanding borrowings. At December 31, 2008,
RCC Real Estate SPE 3 had borrowed $17.1 million. At December 31,
2008, borrowings under the repurchase agreement were secured by commercial real
estate loans with an estimated fair value of $35.8 million and had a weighted
average interest rate of one-month LIBOR plus 2.30%, which was 3.50% at December
31, 2008.
We
repaid all borrowings to Credit Suisse Securities (USA) LLC as of December 31,
2009. As of December 31, 2008, we had $90,000 outstanding under our
agreement with Credit Suisse Securities (USA) LLC to finance our commercial real
estate CDO Notes which was secured by commercial real estate CDO Notes with a
carrying value of $3.9 million. These are one-month
contracts.
Credit Facilities
In March 2006, Resource Capital
Funding, LLC, a special purpose entity whose sole member is Resource TRS, Inc.,
our wholly-owned subsidiary, entered into a Receivables Loan and Security
Agreement as the borrower, with LEAF Financial Corporation as the servicer,
Black Forest Funding Corporation as the lender, Bayerische Hypo-Und Vereinsbank
AG, or HUB, New York Branch, as the agent, U.S. Bank National Association, as
the custodian and the agent’s bank, and Lyon Financial Services, Inc. (d/b/a
U.S. Bank Portfolio Services), as the backup servicer. This agreement
is a $100.0 million secured term credit facility used to finance the purchase of
equipment leases and notes. In connection with the sale on June 30,
2009 of Resource Capital Funding, LLC to Resource America, the borrowings under
the secured term facility with HUB were transferred to Resource America and our
obligations were terminated. At December 31, 2008, there had been
$95.7 million outstanding under the facility. See “ – Financial
Condition – Credit Facility.”
Contractual
Obligations and Commitments
The table below summarizes our
contractual obligations as of December 31, 2009. The table below
excludes contractual commitments related to our derivatives, which we discuss in
Item 7A − “Quantitative and Qualitative Disclosures about Market Risk,” because
those contracts do not have fixed and determinable payments.
|
Contractual
Commitments
(dollars
in thousands)
|
||||||||||||||||||||
|
Payments
due by period
|
||||||||||||||||||||
|
Total
|
Less
than
1
year
|
1 –
3 years
|
3 –
5 years
|
More
than
5
years
|
||||||||||||||||
|
CDOs
|
$ | 1,484,952 | $ | − | $ | − | $ | − | $ | 1,484,952 | (1) | |||||||||
|
Unsecured
junior subordinated
debentures
|
51,548 | − | − | − | 51,548 | (2) | ||||||||||||||
|
Base
management fees(3)
|
4,456 | 4,456 | − | − | − | |||||||||||||||
|
Total
|
$ | 1,540,956 | $ | 4,456 | $ | − | $ | − | $ | 1,536,500 | ||||||||||
|
(1)
|
Contractual
commitment does not include $2.2 million, $6.4 million, $5.2 million, $7.5
million and $16.4 million of interest expense payable through the non-call
dates of July 2010, May 2011, June 2011, August 2011 and June 2012,
respectively, on Apidos CDO I, Apidos Cinco CDO, Apidos CDO III, RREF
2006-1 and RREF 2007-1. The non-call date represents the
earliest period under which the CDO assets can be sold, resulting in
repayment of the CDO notes.
|
|
(2)
|
Contractual
commitment does not include $3.7 million and $5.0 million of interest
expense payable through the non-call dates of June 2011 and October 2011,
respectively, on our trust preferred
securities.
|
|
(3)
|
Calculated
only for the next 12 months based on our current equity, as defined in our
management agreement.
|
At December 31, 2009, we had 13
interest rate swap contracts with a notional value of $217.9
million. These contracts are fixed-for-floating interest rate swap
agreements under which we contracted to pay a fixed rate of interest for the
term of the hedge and will receive a floating rate of interest. See
“– Financial Condition – Hedging Instruments.” As of December 31,
2009, the average fixed pay rate of our interest rate hedges was 5.18% and our
receive rate was one-month LIBOR, or 0.23%. In addition, we also had
an interest rate cap agreement with a notional amount of $14.8 million
outstanding which reduced our exposure to variability in future cash flows
attributable to LIBOR. The interest rate cap is a non-designated cash
flow hedge and, as a result, the change in fair value is recorded through our
consolidated statements of operations.
Off-Balance
Sheet Arrangements
As of December 31, 2009, we did not
maintain any relationships with unconsolidated entities or financial
partnerships, such as entities often referred to as structured finance, special
purpose or variable interest entities, established for the purpose of
facilitating off-balance sheet arrangements or contractually narrow or limited
purposes. Further, as of December 31, 2009, we had not guaranteed any
obligations of unconsolidated entities or entered into any commitment or letter
of intent to provide additional funding to any such entities.
We have certain unfunded commitments
related to our commercial real estate loan portfolio that we may be required to
fund in the future. Our unfunded commitments generally fall into two
categories: (1) pre-approved capital improvement projects; and (2) new
or additional construction costs subject, in each case, to the borrower meeting
specified criteria. Upon completion of the improvements or
construction, we would receive additional loan interest income on the advanced
amount. As of December 31, 2009, we had four loans with unfunded
commitments totaling $5.6 million, of which $1.7 million will be
funded by restricted cash in RREF CDO 2007-1.
Critical
Accounting Policies and Estimates
Our consolidated financial statements
are prepared by management in accordance with GAAP. The preparation
of financial statements in conformity with GAAP requires that we make estimates
and assumptions that may affect the value of our assets or liabilities and our
financial results. We believe that certain of our policies are
critical because they require us to make difficult, subjective and complex
judgments about matters that are inherently uncertain. The critical
policies summarized below relate to classifications of investment securities,
revenue recognition, accounting for derivative financial instruments and hedging
activities, and stock-based compensation. We have reviewed these
accounting policies with our board of directors and believe that all of the
decisions and assessments upon which our financial statements are based were
reasonable at the time made based upon information available to us at the
time. We rely on the Manager’s experience and analysis of historical
and current market data in order to arrive at what we believe to be reasonable
estimates.
Valuation
of Investment Securities
We classify our investment portfolio as
either trading investments, available-for-sale investments or held-to-maturity
investments. Although we generally plan to hold most of our
investments to maturity, we may, from time to time, sell any of our investments
due to changes in market conditions or in accordance with our investment
strategy. Our securities available-for-sale are reported at fair
value, with unrealized gains and losses reported as a component of accumulated
other comprehensive income (loss) in stockholders’ equity. As of
December 31, 2009 and 2008, we had aggregate unrealized losses on our
available-for-sale securities of $47.6 million and $46.9 million, respectively,
which, if not recovered, may result in the recognition of future
losses. Fair value is determined for securities purchased in 2009
based on dealer quotes due to their higher ratings and more active markets and,
for securities purchased prior to 2009, based on taking a weighted average of
the following three measures:
|
|
·
|
an
income approach utilizing an appropriate current risk-adjusted yield, time
value and projected estimated losses from default assumptions based on
historical analysis of underlying loan
performance;
|
|
|
·
|
quotes
on similar-vintage, higher rated, more actively traded CMBS securities
adjusted for the lower subordination level of our securities;
and
|
|
|
·
|
dealer
quotes on our securities for which there is not an active
market.
|
We are required to determine when an
investment is considered impaired (i.e., decline in fair value below its
amortized cost), evaluate whether the impairment is other than temporary (i.e.,
the investment value will not be recovered over its remaining life), and, if the
impairment is other than temporary, recognize an impairment loss equal to the
difference between the investment’s cost and its fair value.
We record investment securities
transactions on the trade date. We record purchases of newly issued
securities when all significant uncertainties regarding the characteristics of
the securities are removed, generally shortly before settlement
date. We determine realized gains and losses on investment securities
on the specific identification method.
Accounting
for Derivative Financial Instruments and Hedging Activities
Our policies permit us to enter into
derivative contracts, including interest rate swaps and interest rate caps, as a
means of mitigating our interest rate risk on forecasted interest expense
associated with the benchmark rate on forecasted rollover/reissuance of
repurchase agreements or the interest rate repricing of repurchase agreements,
or other similar hedged items, for a specified future time period.
As of December 31, 2009, we had engaged
in 13 interest rate swaps with a notional value of $217.9 million and a fair
value of ($12.8) million to seek to mitigate our interest rate risk for
specified future time periods as defined in the terms of the hedge
contracts. As of December 31, 2008, we had engaged in 31 interest
rate swaps with a notional value of $325.0 million and a fair value of ($31.6)
million to seek to mitigate our interest rate risk for specified future time
periods as defined in the terms of the hedge contracts. The contracts
we have entered into have been designated as cash flow hedges and are evaluated
at inception and on an ongoing basis in order to determine whether they qualify
for hedge accounting. The hedge instrument must be highly effective
in achieving offsetting changes in the hedged item attributable to the risk
being hedged in order to qualify for hedge accounting. A hedge
instrument is highly effective if changes in the fair value of the derivative
provide an offset to at least 80% and not more than 125% of the changes in fair
value or cash flows of the hedged item attributable to the risk being
hedged. The futures and interest rate swap contracts are carried on
our consolidated balance sheets at fair value. Any ineffectiveness
which arises during the hedging relationship must be recognized in interest
expense during the period in which it arises. Before the end of the
specified hedge time period, the effective portion of all contract gain and
losses (whether realized or unrealized) is recorded in other comprehensive
income or loss. Realized gains and losses on futures contracts
are reclassified into earnings as an adjustment to interest expense during the
specified hedge time period. Realized gains and losses on the
interest rate hedges are reclassified into earnings as an adjustment to interest
expense during the period after the swap repricing date through the remaining
maturity of the swap. For taxable income purposes, realized gains and
losses on futures and interest rate cap and swap contracts are reclassified into
earnings over the term of the hedged transactions as designated for
tax.
We are not required to account for
derivative contracts using hedge accounting as described above. If we
decided not to designate the derivative contracts as hedges and to monitor their
effectiveness as hedges, or if we entered into other types of financial
instruments that did not meet the criteria to be designated as hedges, changes
in the fair values of these instruments would be recorded in the statement of
operations, potentially resulting in increased volatility in our
earnings. We had one non-designated interest rate cap agreement with
a fair value of $45,000 and a notional amount of $14.8 million outstanding at
December 31, 2009 which reduced our exposure to variability in future cash flows
attributable to LIBOR. We recorded interest expense of $89,000 for
the year ended December 31, 2009. We did not have any non-designated cash
flow hedges as of December 31, 2008.
Income
Taxes
We expect to operate in a manner that
will allow us to qualify and be taxed as a REIT and to comply with the
provisions of the Internal Revenue Code with respect thereto. A REIT
is generally not subject to federal income tax on that portion of its REIT
taxable income which is distributed to its stockholders, provided, that at least
90% of REIT taxable income is distributed and certain other requirements are
met. If we fail to meet these requirements and do not qualify for
certain statutory relief provisions, we would be subject to federal income
tax. We have a wholly-owned domestic subsidiary, Resource TRS, that
we and Resource TRS have elected to be treated as a taxable REIT
subsidiary. For financial reporting purposes, current and deferred
taxes are provided for on the portion of earnings recognized by us with respect
to our interest in Resource TRS, because it is taxed as a regular subchapter C
corporation under the Internal Revenue Code. During the years ended
December 31, 2009 and 2008, we recorded benefits of $2,000 and $241,000,
respectively, for income taxes related to earnings of Resource TRS.
Apidos CDO I, Apidos CDO III, Apidos
Cinco CDO and Ischus CDO II, our foreign TRSs, are organized as exempted
companies incorporated with limited liability under the laws of the Cayman
Islands, and are generally exempt from federal and state income tax at the
corporate level because their activities in the United States are limited to
trading in stock and securities for their own account. Therefore, despite their
status as TRSs, they generally will not be subject to corporate tax on their
earnings and no provision from income taxes is required; however because they
are “controlled foreign corporations,” we will generally be required to include
their current taxable income in our calculation of REIT taxable
income.
Allowance
for Loan and Lease Losses
We maintain an allowance for loan and
lease losses. Loans and leases held for investment are first
individually evaluated for impairment, and then evaluated as a homogeneous pool
as loans with substantially similar characteristics for
impairment. The reviews are performed at least
quarterly.
We consider an individual loan to be
impaired when, based on current information and events, management believes it
is probable that we will be unable to collect all amounts due according to the
contractual terms of the loan agreement. When a loan is impaired, the
allowance for loan losses is increased by the amount of the excess of the
amortized cost basis of the loan over its fair value. Fair value may
be determined based the present value of estimated cash flows; on market price,
if available; or the fair value of the collateral less estimated disposition
costs. When a loan, or a portion thereof, is considered uncollectible
and pursuit of the collection is not warranted, then we will record a charge-off
or write-down of the loan against the allowance for credit
losses. The balance of impaired loans and leases was $100.1 million
and $23.9 million at December 31, 2009 and 2008, respectively. The
total balance of impaired loans and leases with a valuation allowance at
December 31, 2009 and 2008 was $82.2 million and $23.9 million,
respectively. The total balance of impaired loans and leases with a
specific valuation allowance was $17.9 million at December 31,
2009. All of the loans and leases deemed impaired at December 31,
2008 have an associated valuation allowance. The specific valuation
allowance related to these impaired loans and leases was $31.0 million and $19.6
million at December 31, 2009 and 2008, respectively. The average
balance of impaired loans and leases was $112.6 million and $24.9 million during
2009 and 2008, respectively. We did not recognize any income on
impaired loans and leases during 2009 and 2008 once each individual loan or
lease became impaired unless cash was received.
An impaired loan or lease may remain on
accrual status during the period in which we are pursuing repayment of the loan
or lease; however, the loan or lease would be placed on non-accrual status at
such time as either (i) management believes that scheduled debt service payments
will not be met within the coming 12 months; (ii) the loan or lease becomes 90
days delinquent; (iii) management determines the borrower is incapable of, or
has ceased efforts toward, curing the cause of the impairment; or (iv) the net
realizable value of the loan’s underlying collateral approximates our carrying
value of such loan. While on non-accrual status, we recognize
interest income only when an actual payment is received.
The following table shows the changes
in the allowance for loan loss (in thousands):
|
Allowance
for loan loss at January 1, 2008
|
$ | 5,918 | ||
|
Reserve charged to expense
|
45,259 | |||
|
Loans charged-off
|
(7,310 | ) | ||
|
Recoveries
|
− | |||
|
Allowance
for loan loss at January 1, 2009
|
43,867 | |||
|
Reserve charged to expense
|
58,711 | |||
|
Loans charged-off
|
(55,456 | ) | ||
|
Recoveries
|
− | |||
|
Allowance
for loan loss at December 31, 2009
|
$ | 47,122 |
The following table shows the changes
in the allowance for lease loss (in thousands):
|
Allowance
for lease loss at January 1, 2008
|
$ | − | ||
|
Reserve charged to expense
|
901 | |||
|
Lease charged-off
|
(451 | ) | ||
|
Recoveries
|
− | |||
|
Allowance
for lease loss at December 31, 2008
|
450 | |||
|
Reserve charged to expense
|
2,672 | |||
|
Lease charged-off
|
(1,994 | ) | ||
|
Recoveries
|
12 | |||
|
Allowance
for lease loss at December 31, 2009
|
$ | 1,140 |
Variable
Interest Entities
In December 2003, the Financial
Accounting Standards Board, or FASB, issued guidance which requires that the
assets, liabilities and results of operations of a VIE be consolidated into the
financial statements of the enterprise that has a controlling financial interest
in it. The interpretation provides a framework for determining whether an entity
should be evaluated for consolidation based on voting interests or significant
financial support provided to the entity which we refer to as variable
interests. We consider all counterparties to a transaction to
determine whether a counterparty is a VIE and, if so, whether our involvement
with the entity results in a variable interest in the entity. We
perform analyses to determine whether we are the primary
beneficiary. As of December 31, 2009, we determined that RREF CDO
2007-1, RREF CDO 2006-1, Apidos CDO I, Apidos CDO III and Apidos Cinco CDO were
VIEs and that we were the primary beneficiary of RREF CDO 2007-1, RREF CDO
2006-1, Apidos CDO I, Apidos CDO III and Apidos Cinco CDO.
Recent
Accounting Pronouncements
In January 2010, the FASB issued new
guidance for fair value measurements and disclosures. The guidance
requires new disclosures for transferring in and out of Level 1 and Level 2
amounts and clarifies existing disclosures regarding levels of disaggregation
and inputs surrounding valuation techniques. This guidance will be
effective for interim and annual periods beginning after December 15,
2009. We do not expect adoption will have a material impact on its
consolidated financial statements. In addition, this guidance
requires new disclosure surrounding activity in Level 3 fair value measurements,
to present separately information about purchases, sales, issuances and
settlements. This guidance will be effective for interim and annual
periods beginning after December 15, 2010. Adoption will require
additional disclosure to break out such categories in the notes to our
consolidated financial statements.
In December 2009, the FASB issued new
guidance for improving financial reporting for enterprises involved with
variable interest entities, or VIEs, regarding power to direct the activities of
a VIE as well as obligations to absorb the losses. This guidance is
effective for interim and annual periods beginning after November 15,
2009. We have evaluated the potential impact of adopting this
statement and do not believe it will have an impact on our consolidated
financial statements.
In August 2009, the FASB issued new
guidance for evaluating the fair value of liabilities. The guidance
clarifies techniques for valuing liabilities in circumstances where a quoted
price or a quoted price for an identical liability is not
available. The provisions of this guidance were effective in the
third quarter of 2009 and did not have a material impact on our consolidated
financial statements.
In June 2009, the FASB issued guidance
that establishes the FASB Accounting Standards Codification, the single source
of authoritative GAAP, other than guidance put forth by the Securities and
Exchange Commission (“SEC”). All other accounting literature not
included in the codification will be considered non-authoritative. We
adopted this guidance in the third quarter of 2009. Adoption impacted
the disclosures for references to accounting guidance by putting such
disclosures into plain English.
In June 2009, the FASB issued new
guidance for consolidation of variable interest entities which changes the
consolidation guidance applicable to a VIE and amends the guidance governing the
determination of whether an enterprise is the primary beneficiary of a VIE and
therefore, required to consolidate an entity, by requiring a qualitative
analysis rather than a quantitative analysis. This standard also
requires continuous reassessment of whether an enterprise is the primary
beneficiary of a VIE as well as enhanced disclosures about an enterprise’s
involvement with a VIE. This statement is effective for interim and
annual periods beginning after November 15, 2009. We have evaluated
the potential impact of adopting this statement and concluded that we will
continue to consolidate our VIEs mentioned above under “Variable Interest
Entities” as well as identified in Note 1 to the consolidated financial
statements. Upon adoption, we will do a continuous reassessment of
our conclusion as stipulated in this statement.
In June 2009, the FASB issued guidance
for accounting for transfers of financial assets. The guidance
eliminates the concept of a “qualifying special-purpose entity,” changes the
requirements for derecognizing financial assets and requires greater
transparency of related disclosures. This statement is effective for
fiscal years beginning after November 15, 2009. We have
evaluated the potential impact of adopting this statement and do not expect
adoption will have an impact on our consolidated financial
statements.
In May 2009, the FASB issued guidance
which establishes general standards of accounting for and disclosure of events
that occur after the balance sheet date but before the issuance of the financial
statements. We adopted this guidance in the second quarter of
2009. Adoption did not have a material impact on our consolidated
financial statements. We provided disclosures required by this
guidance.
On April 9, 2009, the FASB issued
guidance intended to provide additional application guidance and enhance
disclosures regarding fair value measurements and impairments of
securities. It provides guidelines for making fair value measurements
more consistent with the fair value measurement principles when the volume and
level of activity for the asset or liability have decreased
significantly. It also enhances consistency in financial reporting by
increasing the frequency of fair value disclosures. Finally, it
provides additional guidance designed to create greater clarity and consistency
in accounting for and presenting impairment losses on
securities. Provisions for this guidance were effective for interim
periods ending after June 15, 2009, with early adoption permitted in the first
quarter of 2009. Adoption did not have a significant impact on our
consolidated financial statements; however, we provided the required additional
disclosures in Note 16 to the consolidated financial statements.
In March 2008, the FASB issued guidance
that requires enhanced disclosures for derivative instruments, including those
used in hedging activities. It is effective for fiscal years and
interim periods beginning after November 15, 2008 and was applicable to us in
the first quarter of fiscal 2009. Adoption did not have a significant
impact on our financial statements; however, we provided the required additional
disclosures in Note 17 to the consolidated financial statements.
Inflation
Virtually all of our assets and
liabilities are interest rate sensitive in nature. As a result,
interest rates and other factors influence our performance far more so than does
inflation. Changes in interest rates do not necessarily correlate
with inflation rates or changes in inflation rates. Our financial
statements are prepared in accordance with GAAP and our distributions are
determined by our board of directors based primarily by our net income as
calculated for tax purposes; in each case, our activities and balance sheet are
measured with reference to historical cost and/or fair market value without
considering inflation.
|
ITEM 7A.
|
QUANTITATIVE
AND QUALITATIVE DISCLOSURES ABOUT MARKET
RISK
|
As of December 31, 2009 and 2008, the
primary component of our market risk was interest rate risk, as described
below. While we do not seek to avoid risk completely, we do seek to
assume risk that can be quantified from historical experience, to actively
manage that risk, to earn sufficient compensation to justify assuming that risk
and to maintain capital levels consistent with the risk we undertake or to which
we are exposed.
Effect
on Fair Value
A component of interest rate risk is
the effect changes in interest rates will have on the market value of our
assets. We face the risk that the market value of our assets will
increase or decrease at different rates than that of our liabilities, including
our hedging instruments.
We primarily assess our interest rate
risk by estimating the duration of our assets and the duration of our
liabilities. Duration essentially measures the market price
volatility of financial instruments as interest rates change. We
generally calculate duration using various financial models and empirical
data. Different models and methodologies can produce different
duration numbers for the same securities.
The following sensitivity analysis
tables show, at December 31, 2009, the estimated impact on the fair value of our
interest rate-sensitive investments and liabilities of changes in interest
rates, assuming rates instantaneously fall 100 basis points and rise 100 basis
points (dollars in thousands):
|
December
31, 2009
|
||||||||||||
|
Interest
rates
fall
100
basis
points
|
Unchanged
|
Interest
rates rise 100
basis
points
|
||||||||||
|
CMBS
– private placement (1)
|
||||||||||||
|
Fair value
|
$ | 34,815 | $ | 33,333 | $ | 31,914 | ||||||
|
Change in fair value
|
$ | 1,482 | $ | − | $ | (1,419 | ) | |||||
|
Change as a percent of fair
value
|
4.45 | % | − | % | 4.26 | % | ||||||
|
Hedging
instruments
|
||||||||||||
|
Fair value
|
$ | (27,870 | ) | $ | (12,812 | ) | $ | (10,559 | ) | |||
|
Change in fair value
|
$ | (15,058 | ) | $ | − | $ | 2,253 | |||||
|
Change as a percent of fair
value
|
117.53 | % | − | % | 17.59 | % | ||||||
|
(1)
|
Includes
the fair value of available-for-sale investments that are sensitive to
interest rate change.
|
For purposes of the table, we have
excluded our investments with variable interest rates that are indexed to
LIBOR. Because the variable rates on these instruments are short-term
in nature, we are not subject to material exposure to movements in fair value as
a result of changes in interest rates.
It is important to note that the impact
of changing interest rates on fair value can change significantly when interest
rates change beyond 100 basis points from current levels. Therefore,
the volatility in the fair value of our assets could increase significantly when
interest rates change beyond 100 basis points from current levels. In
addition, other factors impact the fair value of our interest rate-sensitive
investments and hedging instruments, such as the shape of the yield curve,
market expectations as to future interest rate changes and other market
conditions. Accordingly, in the event of changes in actual interest
rates, the change in the fair value of our assets would likely differ from that
shown above and such difference might be material and adverse to our
stockholders.
Risk
Management
To the extent consistent with
maintaining our status as a REIT, we seek to manage our interest rate risk
exposure to protect our portfolio of fixed-rate commercial real estate mortgages
and CMBS and related debt against the effects of major interest rate
changes. We generally seek to manage our interest rate risk
by:
|
|
·
|
monitoring
and adjusting, if necessary, the reset index and interest rate related to
our mortgage-backed securities and our
borrowings;
|
|
|
·
|
attempting
to structure our borrowing agreements for our CMBS to have a range of
different maturities, terms, amortizations and interest rate adjustment
periods; and
|
|
|
·
|
using
derivatives, financial futures, swaps, options, caps, floors and forward
sales, to adjust the interest rate sensitivity of our fixed-rate
commercial real estate mortgages and CMBS and our
borrowing.
|
|
FINANCIAL
STATEMENTS AND SUPPLEMENTARY DATA
|
REPORT
OF INDEPENDENT REGISTERED PUBLIC ACCOUNTING FIRM
Board of
Directors and Stockholders
Resource
Capital Corp.
We have
audited the accompanying consolidated balance sheets of Resource Capital Corp.
(a Maryland corporation) and its subsidiaries as of December 31, 2009 and 2008,
and the related consolidated statements of operations, changes in stockholders’
equity, and cash flows for each of the three years in the period ended December
31, 2009. Our audits of the basic financial statements included the
financial statement schedules listed in the index appearing under item 15 (a) 2.
These
consolidated financial statements and financial statement schedules are the
responsibility of the Company’s management. Our responsibility is
to express an opinion on these consolidated financial statements and financial
statement schedules based on our audits.
We
conducted our audits in accordance with the standards of the Public Company
Accounting Oversight Board (United States). Those standards require
that we plan and perform the audit to obtain reasonable assurance about whether
the financial statements are free of material misstatement. An audit includes
examining, on a test basis, evidence supporting the amounts and disclosures in
the financial statements. An audit also includes
assessing the accounting principles used and significant estimates made by
management, as well as evaluating the overall financial statement
presentation. We
believe that our audits provide a reasonable basis for our opinion.
In our
opinion, the consolidated financial statements referred to above present fairly,
in all material respects, the financial position of Resource Capital Corp. and
its subsidiaries as of December 31, 2009 and 2008, and the results of their
consolidated operations and their consolidated cash flows for each of the three
years in the period ended December 31, 2009 in conformity with accounting
principles generally accepted in the United States of America. Also,
in our opinion, the related financial statement schedules, when considered in
relation to the basic consolidated financial statements taken as a whole,
present fairly, in all material respects, the information set forth
therein.
We also
have audited, in accordance with the standards of the Public Company Accounting
Oversight Board (United States), Resource Capital Corp. and its subsidiaries’
internal control over financial reporting as of December 31, 2009, based on
criteria established in Internal Control—Integrated
Framework issued by the Committee of Sponsoring Organizations of the
Treadway Commission (COSO)
and our report dated March 15, 2010 expressed an unqualified opinion on
internal control over financial reporting.
/s/ Grant
Thornton LLP
Philadelphia,
Pennsylvania
March 15,
2010
RESOURCE
CAPITAL CORP. AND SUBSIDIARIES
CONSOLIDATED
BALANCE SHEETS
(in
thousands, except share and per share data)
|
December
31,
|
||||||||
|
2009
|
2008
|
|||||||
|
ASSETS
|
||||||||
|
Cash and cash equivalents
|
$ | 51,991 | $ | 14,583 | ||||
|
Restricted cash
|
85,125 | 60,394 | ||||||
|
Investment securities
available-for-sale, pledged as collateral, at fair value
|
39,304 | 22,466 | ||||||
|
Investment securities
available-for-sale, at fair value
|
5,238 | 6,794 | ||||||
|
Investment securities
held-to-maturity, pledged as collateral
|
31,401 | 28,157 | ||||||
|
Loans, pledged as collateral and
net of allowances of $47.1 million and
$43.9 million
|
1,558,687 | 1,684,622 | ||||||
|
Loans held for sale
|
8,050 | − | ||||||
|
Direct financing leases and
notes, net of allowances of
$1.1 million and $450,000 and
net of unearned income
|
927 | 104,015 | ||||||
|
Investments in unconsolidated
entities
|
3,605 | 1,548 | ||||||
|
Interest receivable
|
5,754 | 8,440 | ||||||
|
Other assets
|
5,102 | 5,012 | ||||||
|
Total assets
|
$ | 1,795,184 | $ | 1,936,031 | ||||
|
LIABILITIES
|
||||||||
|
Borrowings
|
$ | 1,536,500 | $ | 1,699,763 | ||||
|
Distribution payable
|
9,170 | 9,942 | ||||||
|
Accrued interest expense
|
1,516 | 4,712 | ||||||
|
Derivatives, at fair value
|
12,767 | 31,589 | ||||||
|
Accounts payable and other
liabilities
|
6,401 | 3,720 | ||||||
|
Total liabilities
|
1,566,354 | 1,749,726 | ||||||
|
STOCKHOLDERS’
EQUITY
|
||||||||
|
Preferred stock, par value
$0.001: 100,000,000 shares authorized;
no shares issued and
outstanding
|
− | − | ||||||
|
Common stock, par value
$0.001: 500,000,000 shares authorized;
36,545,737 and 25,344,867
shares issued and outstanding
(including 437,319 and 452,310
unvested restricted shares)
|
36 | 26 | ||||||
|
Additional paid-in capital
|
405,517 | 356,103 | ||||||
|
Accumulated other comprehensive
loss
|
(62,154 | ) | (80,707 | ) | ||||
|
Distributions in excess of
earnings
|
(114,569 | ) | (89,117 | ) | ||||
|
Total stockholders’ equity
|
228,830 | 186,305 | ||||||
|
TOTAL
LIABILITIES AND STOCKHOLDERS’ EQUITY
|
$ | 1,795,184 | $ | 1,936,031 | ||||
The
accompanying notes are an integral part of these consolidated financial
statements
RESOURCE
CAPITAL CORP. AND SUBSIDIARIES
CONSOLIDATED
STATEMENTS OF OPERATIONS
(in
thousands, except share and per share data)
|
December
31,
|
||||||||||||
|
2009
|
2008
|
2007
|
||||||||||
|
REVENUES
|
||||||||||||
|
Net interest
income:
|
||||||||||||
|
Loans
|
$ | 84,563 | $ | 117,108 | $ | 136,873 | ||||||
|
Securities
|
7,225 | 6,378 | 30,014 | |||||||||
|
Leases
|
4,336 | 8,180 | 7,553 | |||||||||
|
Interest income – other
|
1,469 | 2,675 | 2,555 | |||||||||
|
Total interest income
|
97,593 | 134,341 | 176,995 | |||||||||
|
Interest expense
|
45,427 | 79,619 | 121,564 | |||||||||
|
Net interest income
|
52,166 | 54,722 | 55,431 | |||||||||
|
OPERATING
EXPENSES
|
||||||||||||
|
Management fees − related
party
|
8,363 | 6,301 | 6,554 | |||||||||
|
Equity compensation – related
party
|
1,240 | 540 | 1,565 | |||||||||
|
Professional services
|
3,866 | 3,349 | 2,911 | |||||||||
|
Insurance expense
|
828 | 641 | 466 | |||||||||
|
General and administrative
|
1,764 | 1,848 | 1,581 | |||||||||
|
Income tax (benefit)
expense
|
(2 | ) | (241 | ) | 338 | |||||||
|
Total expenses
|
16,059 | 12,438 | 13,415 | |||||||||
|
NET
OPERATING INCOME
|
36,107 | 42,284 | 42,016 | |||||||||
|
OTHER
INCOME (EXPENSES)
|
||||||||||||
|
Impairment losses on investment
securities
|
(27,490 | ) | (26,611 | ) | (48,853 | ) | ||||||
|
Recognized in other
comprehensive loss
|
(14,019 | ) | (26,611 | ) | (22,576 | ) | ||||||
|
Net impairment losses
recognized in earnings
|
(13,471 | ) | − | (26,277 | ) | |||||||
|
Net realized losses on loans
and
investments
|
1,890 | (1,637 | ) | (15,098 | ) | |||||||
|
Gain on deconsolidation of
VIE
|
− | − | 14,259 | |||||||||
|
Provision for loan and lease
losses
|
(61,383 | ) | (46,160 | ) | (6,211 | ) | ||||||
|
Gain on the extinguishment of
debt
|
44,546 | 1,750 | − | |||||||||
|
Gain on the settlement of
loan
|
− | 574 | − | |||||||||
|
Other (expense) income
|
(1,350 | ) | 115 | 201 | ||||||||
|
Total expenses
|
(29,768 | ) | (45,358 | ) | (33,126 | ) | ||||||
|
NET
INCOME (LOSS)
|
$ | 6,339 | $ | (3,074 | ) | $ | 8,890 | |||||
|
NET
INCOME (LOSS) PER SHARE – BASIC
|
$ | 0.25 | $ | (0.12 | ) | $ | 0.36 | |||||
|
NET
INCOME (LOSS) PER SHARE – DILUTED
|
$ | 0.25 | $ | (0.12 | ) | $ | 0.36 | |||||
|
WEIGHTED
AVERAGE NUMBER OF SHARES
OUTSTANDING – BASIC
|
25,205,403 | 24,757,386 | 24,610,468 | |||||||||
|
WEIGHTED
AVERAGE NUMBER OF SHARES
OUTSTANDING – DILUTED
|
25,355,821 | 24,757,386 | 24,860,184 | |||||||||
|
DIVIDENDS
DECLARED PER SHARE
|
$ | 1.15 | $ | 1.60 | $ | 1.62 | ||||||
The
accompanying notes are an integral part of these consolidated financial
statements
RESOURCE
CAPITAL CORP. AND SUBSIDIARIES
CONSOLIDATED
STATEMENTS OF CHANGES IN STOCKHOLDERS’ EQUITY
Years
Ended December 31, 2009, 2008 and 2007
(in
thousands, except share and per share data)
|
Shares
|
Amount
|
Additional
Paid-In Capital
|
Deferred
Equity
Compensation
|
Accumulated
Other
Comprehensive Loss
|
Retained
Earnings
|
Distributions
in Excess of Earnings
|
Treasury
Shares
|
Total
Stockholders’ Equity
|
Comprehensive
(Loss)/Income
|
|||||||||||||||||||||||||||||||
|
Balance, December 31,
2006
|
23,821,434 | $ | 24 | $ | 341,400 | $ | (1,072 | ) | $ | (9,279 | ) | $ | − | $ | (13,522 | ) | − | $ | 317,551 | |||||||||||||||||||||
|
Net
proceeds from common
stock offerings
|
650,000 | 1 | 10,134 | − | − | − | − | − | 10,135 | − | ||||||||||||||||||||||||||||||
|
Offering costs
|
− | − | (406 | ) | − | − | − | − | − | (406 | ) | − | ||||||||||||||||||||||||||||
|
Reclassification
of deferred
equity compensation
|
− | − | (1,072 | ) | 1,072 | − | − | − | − | − | − | |||||||||||||||||||||||||||||
|
Stock based
compensation
|
526,448 | − | 723 | − | − | − | − | − | 723 | − | ||||||||||||||||||||||||||||||
|
Stock
based compensation,
fair value adjustment
|
− | − | − | − | − | − | − | − | − | − | ||||||||||||||||||||||||||||||
|
Exercise
of common stock warrants
|
375,547 | − | 5,632 | − | − | − | − | − | 5,632 | − | ||||||||||||||||||||||||||||||
|
Amortization
of stock based
compensation
|
− | − | 1,565 | − | − | − | − | − | 1,565 | − | ||||||||||||||||||||||||||||||
|
Repurchase
and retirement of
treasury shares
|
(263,000 | ) | − | − | − | − | − | − | (2,771 | ) | (2,771 | ) | ||||||||||||||||||||||||||||
|
Forfeiture of
unvested stock
|
(6,897 | ) | − | − | − | − | − | − | − | − | ||||||||||||||||||||||||||||||
|
Net income
|
− | − | − | − | − | 8,890 | − | − | 8,890 | $ | 8,890 | |||||||||||||||||||||||||||||
|
Available-for-sale
securities,
fair value adjustment
|
− | − | − | − | (16,544 | ) | − | − | − | (16,544 | ) | (16,544 | ) | |||||||||||||||||||||||||||
|
Designated
derivatives,
fair value adjustment
|
− | − | − | − | (12,500 | ) | − | − | − | (12,500 | ) | (12,500 | ) | |||||||||||||||||||||||||||
|
Distributions on
common stock
|
− | − | − | − | − | (8,890 | ) | (31,779 | ) | − | (40,669 | ) | ||||||||||||||||||||||||||||
|
Comprehensive
loss
|
− | − | − | − | − | − | − | − | − | $ | (20,154 | ) | ||||||||||||||||||||||||||||
|
Balance, December 31,
2007
|
25,103,532 | 25 | 357,976 | − | (38,323 | ) | −− | (45,301 | ) | (2,771 | ) | 271,606 | ||||||||||||||||||||||||||||
|
Net
proceeds from dividend
reinvestment and
stock
purchase
plan
|
10,831 | − | 40 | − | − | − | − | − | 40 | − | ||||||||||||||||||||||||||||||
|
Offering costs
|
− | − | (22 | ) | − | − | − | − | − | (22 | ) | − | ||||||||||||||||||||||||||||
|
Retirement of
treasury shares
|
− | − | (2,771 | ) | − | − | − | − | 2,771 | − | − | |||||||||||||||||||||||||||||
|
Stock based
compensation
|
234,871 | 1 | 340 | − | − | − | − | − | 341 | − | ||||||||||||||||||||||||||||||
|
Amortization
of stock based
compensation
|
− | − | 540 | − | − | − | − | − | 540 | − | ||||||||||||||||||||||||||||||
|
Forfeiture of
unvested stock
|
(4,367 | ) | − | − | − | − | − | − | − | − | ||||||||||||||||||||||||||||||
|
Net income
|
− | − | − | − | − | (3,074 | ) | − | − | (3,074 | ) | (3,074 | ) | |||||||||||||||||||||||||||
|
Available-for-sale
securities,
fair value adjustment
|
− | − | − | − | (24,288 | ) | − | − | − | (24,288 | ) | (24,288 | ) | |||||||||||||||||||||||||||
|
Designated
derivatives,
fair value adjustment
|
− | − | − | − | (18,096 | ) | − | − | − | (18,096 | ) | (18,096 | ) | |||||||||||||||||||||||||||
|
Distributions on
common stock
|
− | − | − | − | − | 3,074 | (43,816 | ) | − | (40,742 | ) | |||||||||||||||||||||||||||||
|
Comprehensive
loss
|
− | − | − | − | − | − | − | − | − | $ | (45,458 | ) | ||||||||||||||||||||||||||||
|
Balance, December 31,
2008
|
25,344,867 | 26 | 356,103 | − | (80,707 | ) | −− | (89,117 | ) | − | 186,305 | |||||||||||||||||||||||||||||
|
Proceeds
from common
stock offering
|
10,294,455 | 10 | 46,316 | − | − | − | − | − | 46,326 | − | ||||||||||||||||||||||||||||||
|
Proceeds
from dividend
reinvestment and
stock
purchase
plan
|
1,895,043 | 1 | 8,994 | − | − | − | − | − | 8,995 | − | ||||||||||||||||||||||||||||||
|
Offering costs
|
− | − | (2,964 | ) | − | − | − | − | − | (2,964 | ) | − | ||||||||||||||||||||||||||||
|
Repurchase
and retirement
of treasury shares
|
(1,400,000 | ) | (1 | ) | (5,039 | ) | − | − | − | − | (5,040 | ) | − | |||||||||||||||||||||||||||
|
Stock based
compensation
|
419,563 | 867 | − | − | − | − | − | 867 | − | |||||||||||||||||||||||||||||||
|
Amortization
of stock based
compensation
|
− | − | 1,240 | − | − | − | − | − | 1,240 | − | ||||||||||||||||||||||||||||||
|
Forfeiture of
unvested stock
|
(8,191 | ) | − | − | − | − | − | − | − | − | − | |||||||||||||||||||||||||||||
|
Net income
|
− | − | − | − | − | 6,339 | − | − | 6,339 | 6,339 | ||||||||||||||||||||||||||||||
|
Securities
available-for-sale,
fair value adjustment, net
|
− | − | − | − | (729 | ) | − | − | − | (729 | ) | (729 | ) | |||||||||||||||||||||||||||
|
Designated
derivatives,
fair value adjustment
|
− | − | − | − | 19,282 | − | − | − | 19,282 | 19,282 | ||||||||||||||||||||||||||||||
|
Distributions on
common stock
|
− | − | − | − | − | (6,339 | ) | (25,452 | ) | − | (31,791 | ) | ||||||||||||||||||||||||||||
|
Comprehensive
loss
|
− | − | − | − | − | − | − | − | − | $ | 24,892 | |||||||||||||||||||||||||||||
|
Balance, December 31,
2009
|
36,545,737 | $ | 36 | $ | 405,517 | $ | − | $ | (62,154 | ) | $ | − | $ | (114,569 | ) | $ | − | $ | 228,830 | |||||||||||||||||||||
The
accompanying notes are an integral part of these consolidated financial
statements
RESOURCE
CAPITAL CORP. AND SUBSIDIARIES
CONSOLIDATED
STATEMENTS OF CASH FLOWS
(in
thousands)
|
Years
Ended
|
||||||||||||
|
December
31,
|
||||||||||||
|
2009
|
2008
|
2007
|
||||||||||
|
CASH
FLOWS FROM OPERATING ACTIVITIES:
|
||||||||||||
|
Net income (loss)
|
$ | 6,339 | $ | (3,074 | ) | $ | 8,890 | |||||
|
Adjustments to reconcile net
income to net cash
provided by operating
activities:
|
||||||||||||
|
Provision for loan and lease
losses
|
61,383 | 46,160 | 6,211 | |||||||||
|
Depreciation and amortization of
term facilities
|
1,355 | 1,019 | 793 | |||||||||
|
Accretion of net discounts on
investments
|
(8,719 | ) | (1,478 | ) | (1,034 | ) | ||||||
|
Amortization of discount on
notes of CDOs
|
1,032 | 173 | 83 | |||||||||
|
Amortization of debt issuance
costs on notes of CDOs
|
4,058 | 3,129 | 2,681 | |||||||||
|
Amortization of stock-based
compensation
|
1,240 | 540 | 1,565 | |||||||||
|
Amortization of terminated
derivative instruments
|
499 | 205 | (174 | ) | ||||||||
|
Non-cash incentive compensation
to the Manager
|
1,143 | 440 | 774 | |||||||||
|
Unrealized losses on
non-designated derivative
instruments
|
95 | − | − | |||||||||
|
Net realized (gains) losses on
investments
|
(1,890 | ) | 1,637 | 15,098 | ||||||||
|
Net impairment losses recognized
in earnings
|
13,471 | − | 26,277 | |||||||||
|
Gain on the extinguishment of
debt
|
(44,546 | ) | (1,750 | ) | − | |||||||
|
Gain on deconsolidation of
VIEs
|
− | − | (14,259 | ) | ||||||||
|
Gain on the settlement of
loan
|
− | (574 | ) | − | ||||||||
|
Changes in operating assets and
liabilities:
|
||||||||||||
|
Decrease (increase) in restricted
cash
|
10,596 | 4,113 | (16,775 | ) | ||||||||
|
Decrease (increase) in interest
receivable, net of purchased
interest
|
2,697 | 3,526 | (4,881 | ) | ||||||||
|
Decrease (increase) in accounts
receivable
|
424 | 574 | (511 | ) | ||||||||
|
Increase (decrease) in management
and incentive fee payable
|
474 | 221 | (647 | ) | ||||||||
|
(Decrease) increase in security
deposits
|
(791 | ) | 353 | 134 | ||||||||
|
Increase (decrease) in accounts
payable and accrued liabilities
|
2,714 | (962 | ) | 55 | ||||||||
|
(Decrease) increase in accrued
interest expense
|
(3,168 | ) | (2,729 | ) | 993 | |||||||
|
Increase in other assets
|
(1,784 | ) | (573 | ) | (1,895 | ) | ||||||
|
Net cash provided by operating
activities
|
46,622 | 50,950 | 23,378 | |||||||||
|
CASH
FLOWS FROM INVESTING ACTIVITIES:
|
||||||||||||
|
(Increase) decrease in
restricted cash
|
(35,327 | ) | 54,976 | (71,930 | ) | |||||||
|
Purchase of securities
available-for-sale
|
(28,958 | ) | − | (87,378 | ) | |||||||
|
Principal payments received on
securities available-for-sale
|
21 | 2,359 | 11,333 | |||||||||
|
Proceeds from sale of securities
available-for-sale
|
1,909 | 8,000 | 29,867 | |||||||||
|
Investment in unconsolidated
entity
|
(2,066 | ) | − | − | ||||||||
|
Distribution from unconsolidated
entities
|
− | 257 | 517 | |||||||||
|
Purchase of loans
|
(243,786 | ) | (186,759 | ) | (1,296,938 | ) | ||||||
|
Principal payments received on
loans
|
177,589 | 161,653 | 572,046 | |||||||||
|
Proceeds from sale of loans
|
130,078 | 34,853 | 183,455 | |||||||||
|
Purchase of direct financing
leases and notes
|
− | (42,490 | ) | (38,735 | ) | |||||||
|
Principal payments received on
direct financing leases and notes
|
8,655 | 27,823 | 26,366 | |||||||||
|
Proceeds from sale of direct
financing leases and notes
|
2,125 | 5,034 | 6,378 | |||||||||
| Proceeds from sale of interest in subsidiary | 7,545 | − | − | |||||||||
|
Net cash provided by (used in)
investing activities
|
17,785 | 65,706 | (665,019 | ) | ||||||||
RESOURCE
CAPITAL CORP. AND SUBSIDIARIES
CONSOLIDATED
STATEMENTS OF CASH FLOWS − (Continued)
(in
thousands)
|
Years
Ended
|
||||||||||||
|
December
31,
|
||||||||||||
|
2009
|
2008
|
2007
|
||||||||||
|
CASH
FLOWS FROM FINANCING ACTIVITIES:
|
||||||||||||
|
Net proceeds from issuances of
common stock
(net of offering costs of
$2,964, $0 and $406)
|
43,362 | − | 15,362 | |||||||||
|
Net proceeds from dividend
reinvestment and stock purchase
plan (net of offering costs of
$0, $22 and $0)
|
8,995 | 18 | − | |||||||||
|
Repurchase of common stock
|
(5,040 | ) | − | (2,771 | ) | |||||||
|
Proceeds from
borrowings:
|
||||||||||||
|
Repurchase agreements
|
18 | 239 | 464,137 | |||||||||
|
Collateralized debt
obligations
|
− | 35,912 | 674,653 | |||||||||
|
Unsecured revolving credit
facility
|
− | − | 10,000 | |||||||||
|
Secured term facility
|
− | 26,342 | 30,077 | |||||||||
|
Payments on
borrowings:
|
||||||||||||
|
Repurchase agreements
|
(17,108 | ) | (99,319 | ) | (468,102 | ) | ||||||
|
Collateralized debt
obligations
|
− | − | (993 | ) | ||||||||
|
Unsecured revolving credit
facility
|
− | − | (10,000 | ) | ||||||||
|
Secured term facility
|
(13,395 | ) | (22,367 | ) | (23,011 | ) | ||||||
|
Repurchase of debt
|
(10,974 | ) | (3,250 | ) | − | |||||||
|
Settlement of derivative
instruments
|
− | (4,178 | ) | 2,581 | ||||||||
|
Payment of debt issuance
costs
|
(293 | ) | (333 | ) | (11,651 | ) | ||||||
|
Distributions paid on common
stock
|
(32,564 | ) | (41,166 | ) | (37,966 | ) | ||||||
|
Net cash (used in) provided by
financing activities
|
(26,999 | ) | (108,102 | ) | 642,316 | |||||||
|
NET
INCREASE IN CASH AND CASH EQUIVALENTS
|
37,408 | 8,554 | 675 | |||||||||
|
CASH
AND CASH EQUIVALENTS AT BEGINNING OF
PERIOD
|
14,583 | 6,029 | 5,354 | |||||||||
|
CASH
AND CASH EQUIVALENTS AT END OF PERIOD
|
$ | 51,991 | $ | 14,583 | $ | 6,029 | ||||||
|
NON-CASH
INVESTING AND FINANCING ACTIVITIES:
|
||||||||||||
|
Distributions on common stock
declared but not paid
|
$ | 9,170 | $ | 9,942 | $ | 10,366 | ||||||
|
Issuance of restricted stock
|
$ | 242 | $ | 1,435 | $ | 6,650 | ||||||
|
Purchase of loans on warehouse
line
|
$ | − | $ | − | $ | (311,069 | ) | |||||
|
Proceeds from warehouse line
|
$ | − | $ | − | $ | 311,069 | ||||||
|
Transfer of direct financing
leases and notes
|
$ | 89,763 | $ | − | $ | − | ||||||
|
Transfer of secured term
facility
|
$ | (82,319 | ) | $ | − | $ | − | |||||
|
Increase in bank loan
investments
|
$ | 1,148 | $ | − | $ | − | ||||||
|
Decrease in bank loan
investments
|
$ | (1,148 | ) | $ | − | $ | − | |||||
|
SUPPLEMENTAL
DISCLOSURE:
|
||||||||||||
|
Interest expense paid in
cash
|
$ | 48,138 | $ | 94,879 | $ | 136,683 | ||||||
|
Income taxes paid in cash
|
$ | − | $ | 627 | $ | 90 | ||||||
The
accompanying notes are an integral part of these consolidated financial
statements
RESOURCE
CAPITAL CORP. AND SUBSIDIARIES
NOTES
TO CONSOLIDATED FINANCIAL STATEMENTS
DECEMBER
31, 2009
NOTE
1 − ORGANIZATION AND BASIS OF QUARTERLY PRESENTATION
Resource Capital Corp. and
subsidiaries’ (collectively the ‘‘Company’’) principal business activity is to
purchase and manage a diversified portfolio of commercial real estate-related
assets and commercial finance assets. The Company’s investment
activities are managed by Resource Capital Manager, Inc. (‘‘Manager’’) pursuant
to a management agreement (the ‘‘Management Agreement’’). The Manager
is a wholly-owned indirect subsidiary of Resource America, Inc. (“Resource
America”) (NASDAQ: REXI-GS). The following subsidiaries are
consolidated on the Company’s financial statements:
|
|
·
|
RCC
Real Estate, Inc. (“RCC Real Estate”) holds real estate investments,
including commercial real estate loans and commercial real estate-related
securities. RCC Real Estate owns 100% of the equity of the
following variable interest entities
("VIEs"):
|
|
|
-
|
Resource
Real Estate Funding CDO 2006-1 (“RREF CDO 2006-1”), a Cayman Islands
limited liability company and qualified real estate investment trust
(“REIT”) subsidiary (“QRS”). RREF CDO 2006-1 was established to
complete a collateralized debt obligation (“CDO”) issuance secured by a
portfolio of commercial real estate loans and commercial mortgage-backed
securities.
|
|
|
-
|
Resource
Real Estate Funding CDO 2007-1 (“RREF CDO 2007-1”), a Cayman Islands
limited liability company and QRS. RREF CDO 2007-1 was
established to complete a CDO issuance secured by a portfolio of
commercial real estate loans and commercial
mortgage-backed securities.
|
|
|
·
|
RCC
Commercial, Inc. (“RCC Commercial”) holds bank loan investments and
commercial real estate-related securities. RCC Commercial owns
100% of the equity of the following
VIEs:
|
|
|
-
|
Apidos
CDO I, Ltd. (“Apidos CDO I”), a Cayman Islands limited liability company
and taxable REIT subsidiary (“TRS”). Apidos CDO I was
established to complete a CDO secured by a portfolio of bank
loans.
|
|
|
-
|
Apidos
CDO III, Ltd. (“Apidos CDO III”), a Cayman Islands limited liability
company and TRS. Apidos CDO III was established to complete a
CDO secured by a portfolio of bank
loans.
|
|
|
-
|
Apidos
Cinco CDO, Ltd. (“Apidos Cinco CDO”), a Cayman Islands limited liability
company and TRS. Apidos Cinco CDO was established to complete a
CDO secured by a portfolio of bank
loans.
|
|
|
·
|
Resource
TRS, Inc. (“Resource TRS”), the Company’s directly-owned TRS, holds all
the Company’s direct financing leases and
notes.
|
NOTE
2 − SUMMARY OF SIGNIFICANT ACCOUNTING POLICIES
Principles
of Consolidation
The accompanying consolidated financial
statements have been prepared in conformity with accounting principles generally
accepted in the United States of America (“GAAP”). The consolidated
financial statements include the accounts of the Company.
When the Company obtains an explicit or
implicit interest in an entity, the Company evaluates the entity to determine if
the entity is a VIE, and, if so, whether or not the Company is deemed to be the
primary beneficiary of the VIE. Generally, the Company consolidates VIEs
for which the Company is deemed to be the primary beneficiary or for non-VIEs
which the Company controls. The primary beneficiary of a VIE is the variable
interest holder that absorbs the majority of the variability in the expected
losses or the residual returns of the VIE. When determining the primary
beneficiary of a VIE, the Company considers its aggregate explicit and implicit
variable interests as a single variable interest. If the Company’s single
variable interest absorbs the majority of the variability in the expected losses
or the residual returns of the VIE, the Company is considered the primary
beneficiary of the VIE. The Company reconsiders its determination of
whether an entity is a VIE and whether the Company is the primary beneficiary of
such VIE if certain events occur.
RESOURCE
CAPITAL CORP. AND SUBSIDIARIES
NOTES
TO CONSOLIDATED FINANCIAL STATEMENTS – (continued)
DECEMBER
31, 2009
NOTE
2 − SUMMARY OF SIGNIFICANT ACCOUNTING POLICIES − (continued)
Principles
of Consolidation − (continued)
The Company has a 100% interest valued
at $1.5 million in the common shares (three percent of the total equity) in two
trusts, Resource Capital Trust I (“RCT I”) and RCC Trust II (“RCT II”).
Accordingly, the Company does not have the right to the majority of RCTs’
expected residual returns. Therefore, the Company is not deemed to be
the primary beneficiary of either trust and they are not consolidated into the
Company’s consolidated financial statements. The Company records its
investments in RCT I and RCT II’s common shares of $774,000 each as investments
in unconsolidated trusts using the cost method and records dividend income upon
declaration by RCT I and RCT II. For the years ended December 31,
2009 and 2008, the Company recognized $3.0 million and $4.0 million,
respectively, of interest expense with respect to the subordinated debentures it
issued to RCT I and RCT II which included $189,000 and $134,000, respectively,
of amortization of deferred debt issuance costs.
All inter-company transactions and
balances have been eliminated.
Use
of Estimates
The preparation of financial statements
in conformity with GAAP requires management to make estimates and assumptions
that affect the reported amounts of assets and liabilities and disclosure of
contingent assets and liabilities at the date of the financial statements, and
the reported amounts of revenues and expenses during the reporting
period. Actual results could differ from those
estimates. Estimates affecting the accompanying consolidated
financial statements include the net realizable and fair values of the Company’s
investments and derivatives, the estimated life used to calculate amortization
and accretion of premiums and discounts, respectively, on investments and
provisions for loan and lease losses.
Cash
and Cash Equivalents
Cash and cash equivalents include cash
on hand and all highly liquid investments with original maturities of three
months or less at the time of purchase. At December 31, 2009 and
2008, this includes $0 and $8.0 million, respectively, in overnight deposits in
the form of reverse repurchase agreements that are held at financial
institutions, $5.7 million and $1.6 million, respectively, held in a prime
brokerage account, $43.4 million and $5.0 million, respectively, held in a money
market account and $2.9 million and $0 held in checking accounts,
respectively.
Investment
Securities Available-for-Sale
The Company classifies its investment
portfolio as either trading investments, available-for-sale or
held-to-maturity. Although the Company generally plans to hold most
of its investments to maturity, it may, from time to time, sell any of its
investments due to changes in market conditions or in accordance with its
investment strategy. The Company’s available-for-sale securities are
reported at fair value which for the Company’s securities purchased in 2009 is
based on dealer quotes due to their higher ratings and more active markets and
for the Company’s securities purchased prior to 2009 is based on taking a
weighted average of the following three measures:
|
|
·
|
an
income approach utilizing an appropriate current risk-adjusted yield, time
value and projected estimated losses from default assumptions based on
analysis of underlying loan
performance;
|
|
|
·
|
quotes
on similar-vintage, higher rate, more actively traded commercial
mortgage-backed securities (“CMBS”) adjusted as appropriate for the lower
subordination level of the Company’s securities;
and
|
|
|
·
|
dealer
quotes on the Company’s securities for which there is not an active
market.
|
On a quarterly basis, the Company
evaluates its investments for other-than-temporary impairment. An
investment is impaired when its fair value has declined below its amortized cost
basis. An impairment is considered other-than-temporary when the
amortized cost basis of the investment value will not be recovered over its
remaining life. In addition, the Company’s intent to sell as well as
the likelihood that the Company will be required to sell the security before the
recovery of the amortized cost basis is considered. Where credit
quality is believed to be the cause of the other-than-temporary impairment, that
component of the impairment is recognized as an impairment loss in the statement
of operations. Where other market components are believed to be the
cause of the impairment, that component of the impairment is recognized on the
balance sheet as other comprehensive loss.
RESOURCE CAPITAL CORP. AND
SUBSIDIARIES
NOTES
TO CONSOLIDATED FINANCIAL STATEMENTS – (continued)
DECEMBER
31, 2009
NOTE
2 − SUMMARY OF SIGNIFICANT ACCOUNTING POLICIES − (continued)
Investment
Securities Available-for-Sale – (continued)
Investment securities transactions are
recorded on the trade date. Purchases of newly issued securities are
recorded when all significant uncertainties regarding the characteristics of the
securities are removed, generally shortly before settlement
date. Realized gains and losses on investment securities are
determined on the specific identification method.
Investment
Interest Income Recognition
Interest income on the Company’s
mortgage-backed and other asset-backed securities is accrued using the effective
yield method based on the actual coupon rate and the outstanding principal
amount of the underlying mortgages or other assets. Premiums and
discounts are amortized or accreted into interest income over the lives of the
securities also using the effective yield method, adjusted for the effects of
estimated prepayments. For an investment purchased at par, the
effective yield is the contractual interest rate on the
investment. If the investment is purchased at a discount or at a
premium, the effective yield is computed based on the contractual interest rate
increased for the accretion of a purchase discount or decreased for the
amortization of a purchase premium. The effective yield method
requires the Company to make estimates of future prepayment rates for its
investments that can be contractually prepaid before their contractual maturity
date so that the purchase discount can be accreted, or the purchase premium can
be amortized, over the estimated remaining life of the
investment. The prepayment estimates that the Company uses directly
impact the estimated remaining lives of its investments. Actual
prepayment estimates are reviewed as of each quarter end or more frequently if
the Company becomes aware of any material information that would lead it to
believe that an adjustment is necessary. If prepayment estimates are
incorrect, the amortization or accretion of premiums and discounts may have to
be adjusted, which would have an impact on future income.
Loans
The
Company acquires whole loans through direct origination, through the acquisition
of participations in commercial real estate loans and corporate leveraged loans
in the secondary market and through syndications of newly originated
loans. Loans are held for investment; therefore, the Company
initially records them at their acquisition price, and subsequently, accounts
for them based on their outstanding principal plus or minus unamortized premiums
or discounts. The Company may sell a loan held for investment in
certain instances, where the credit fundamentals underlying a particular loan
have changed in such a manner that the Company’s expected return on investment
may decrease. Once the determination has been made by the
Company that it no longer will hold the loan for investment, the Company
identifies these loans as “Loans held for sale” and will account for them at the
lower of amortized cost or fair value.
Loan
Interest Income Recognition
Interest income on loans includes interest at stated
rates adjusted for amortization or accretion of premiums and
discounts. Premiums and discounts are amortized or accreted into
income using the effective yield method. If a loan with a premium or
discount is prepaid, the Company immediately recognizes the unamortized portion
as a decrease or increase to interest income. In addition, the
Company defers loan origination fees and loan origination costs and recognizes
them over the life of the related loan against interest income using the
effective yield method.
Allowance
for Loan and Lease Losses
The
Company maintains an allowance for loan and lease losses. Loans and
leases held for investment are first individually evaluated for impairment so
specific reserves can be applied. Loans for which a specific reserve
was not applicable are then evaluated for impairment as a homogeneous pool of
loans with substantially similar characteristics so that a general reserve can
be established, if needed. The reviews are performed at least
quarterly.
The
Company considers a loan to be impaired when, based on current information and
events, management believes it is probable that the Company will be unable to
collect all amounts due according to the contractual terms of the loan
agreement. When a loan is impaired, the allowance for loan losses is
increased by the amount of the excess of the amortized cost basis of the loan
over its fair value. Fair value may be determined based on the
present value of estimated cash flows; on market price, if available; or on the
fair value of the collateral less estimated disposition costs. When a
loan, or a portion thereof, is considered uncollectible and pursuit of
collection is not warranted, the Company will record a charge-off or write-down
of the loan against the allowance for loan and lease losses.
RESOURCE
CAPITAL CORP. AND SUBSIDIARIES
NOTES
TO CONSOLIDATED FINANCIAL STATEMENTS – (continued)
DECEMBER
31, 2009
NOTE
2 − SUMMARY OF SIGNIFICANT ACCOUNTING POLICIES − (continued)
Allowance
for Loan and Lease Losses − (continued)
The balance of impaired loans and
leases was $100.1 million and $23.9 million at December 31, 2009 and 2008,
respectively. The total balance of impaired loans and leases with a
valuation allowance at December 31, 2009 and 2008 was $82.2 million and $23.9
million, respectively. The total balance of impaired loans and leases
without a specific valuation allowance was $17.9 million at December 31,
2009. All of the loans and leases deemed impaired at December 31,
2008 have an associated valuation allowance. The specific valuation
allowance related to these impaired loans and leases was $31.0 million and $19.6
million at December 31, 2009 and 2008, respectively. The average
balance of impaired loans and leases was $112.6 million and $24.9 million during
2009 and 2008, respectively. The Company did not recognize any income
on impaired loans and leases during 2009 and 2008 once each individual loan or
lease became impaired unless cash was received.
An impaired loan or lease may remain on
accrual status during the period in which the Company is pursuing repayment of
the loan or lease; however, the loan or lease would be placed on non-accrual
status at such time as (i) management believes that scheduled debt service
payments will not be met within the coming 12 months; (ii) the loan or lease
becomes 90 days delinquent; (iii) management determines the borrower is
incapable of, or has ceased efforts toward, curing the cause of the impairment;
or (iv) the net realizable value of the loan’s underlying collateral
approximates the Company’s carrying value of such loan. While on
non-accrual status, the Company recognizes interest income only when an actual
payment is received.
Comprehensive
Gain/(Loss)
Comprehensive loss for the Company
includes net income and the change in net unrealized gains/ (losses) on
available-for-sale securities and derivative instruments used to hedge exposure
to interest rate fluctuations and protect against declines in the market-value
of assets resulting from general trends in debt markets.
Income
Taxes
The Company operates in such a manner
as to qualify as a REIT under the provisions of the Internal Revenue Code of
1986, as amended (the "Code"); therefore, applicable REIT taxable income is
included in the taxable income of its shareholders, to the extent distributed by
the Company. To maintain REIT status for federal income tax purposes, the
Company is generally required to distribute at least 90% of its REIT taxable
income to its shareholders as well as comply with certain other qualification
requirements as defined under the Code. As a REIT, the Company is not
subject to federal corporate income tax to the extent that it distributes 100%
of its REIT taxable income each year.
Taxable income from non-REIT activities
managed through Resource TRS are subject to federal, state and local income
taxes. Resource TRS income taxes are accounted for under the asset
and liability method. Under the asset and liability method, deferred
income taxes are recognized for the temporary differences between the financial
reporting basis and tax basis of Resource TRS' assets and
liabilities.
Apidos CDO I, Apidos CDO III and Apidos
Cinco CDO, the Company’s foreign TRSs, are organized as exempted companies
incorporated with limited liability under the laws of the Cayman Islands, and
are generally exempt from federal and state income tax at the corporate level
because their activities in the United States are limited to trading in stock
and securities for their own account. Therefore, despite their status
as TRSs, they generally will not be subject to corporate tax on their earnings
and no provision for income taxes is required; however, because they are
“controlled foreign corporations,” the Company will generally be required to
include Apidos CDO I’s, Apidos CDO III’s and Apidos Cinco CDO’s current taxable
income in its calculation of REIT taxable income.
Stock
Based Compensation
Issuances
of restricted stock and options are accounted for using the fair value based
methodology whereby the fair value of the award is measured on the grant date
and expensed monthly to equity compensation expense-related party on the
consolidated statements of operations with a corresponding entry to additional
paid-in capital. For issuances to the Company’s Manager and to
non-employees, the unvested stock and options are adjusted quarterly to reflect
changes in fair value as performance under the agreement is
completed. For issuances to the Company’s five non-employee
directors, the amount is not remeasured under the fair value-based
method. The compensation for each of these issuances is amortized
over the service period and included in equity compensation
expense.
RESOURCE
CAPITAL CORP. AND SUBSIDIARIES
NOTES
TO CONSOLIDATED FINANCIAL STATEMENTS – (continued)
DECEMBER
31, 2009
NOTE
2 − SUMMARY OF SIGNIFICANT ACCOUNTING POLICIES − (continued)
Net
Income Per Share
The Company calculates basic income per
share by dividing net income for the period by weighted-average shares of its
common stock, including vested restricted stock, outstanding for that
period. Diluted income per share takes into account the effect of
dilutive instruments, such as stock options and unvested restricted stock, but
uses the average share price for the period in determining the number of
incremental shares that are to be added to the weighted-average number of shares
outstanding.
Derivative
Instruments
The Company’s policies permit it to
enter into derivative contracts, including interest rate swaps and interest rate
caps to add stability to its interest expense and to manage its exposure to
interest rate movements or other identified risks. The Company has
designated these transactions as cash flow hedges. The contracts or
hedge instruments are evaluated at inception and at subsequent balance sheet
dates to determine if they qualify for hedge which requires the Company
recognize all derivatives on the balance sheet at fair value. The
Company records changes in the estimated fair value of the derivative in other
comprehensive income to the extent that it is effective. Any
ineffective portion of a derivative’s change in fair value is immediately
recognized in earnings.
Recent
Accounting Standards
In January 2010, the Financial
Accounting Standards Board (“FASB”) issued new guidance for fair value
measurements and disclosures. The guidance requires new disclosures
for transferring in and out of Level 1 and Level 2 amounts and clarifies
existing disclosures regarding levels of disaggregation and inputs surrounding
valuation techniques. This guidance will be effective for interim and
annual periods beginning after December 15, 2009. The Company does
not expect adoption will have a material impact on its consolidated financial
statements. In addition this guidance requires new disclosure
surrounding activity in Level 3 fair value measurements, to present separately
information about purchases, sales, issuances and settlements. This
guidance will be effective for interim and annual periods beginning after
December 15, 2010. Adoption will require additional disclosure to
delineate such categories in the notes to the Company’s consolidated financial
statements.
In December 2009, the FASB issued new
guidance for improving financial reporting for enterprises involved with VIEs
regarding power to direct the activities of a VIE as well as obligations to
absorb the losses. This guidance is effective for interim and annual
periods beginning after November 15, 2009. The Company has evaluated
the potential impact of adopting this statement and does not believe it will
have an impact on its consolidated financial statements.
In August 2009, the FASB issued new
guidance for evaluating the fair value of liabilities. The guidance
clarifies techniques for valuing liabilities in circumstances where a quoted
price or a quoted price for an identical liability is not
available. The provisions of this guidance were effective in the
third quarter of 2009 and did not have a material impact on the Company’s
consolidated financial statements.
In June 2009, the FASB issued guidance
that establishes the FASB Accounting Standards Codification, the single source
of authoritative GAAP, other than guidance put forth by the Securities and
Exchange Commission (“SEC”). All other accounting literature not
included in the codification will be considered
non-authoritative. The Company adopted this guidance in the third
quarter of 2009. Adoption impacted the disclosures for references to
accounting guidance by putting such disclosures into plain English.
In June 2009, the FASB issued new
guidance for consolidation of VIEs which changes the consolidation guidance
applicable to a VIE and amends the guidance governing the determination of
whether an enterprise is the primary beneficiary of a VIE and therefore,
required to consolidate an entity, by requiring a qualitative analysis rather
than a quantitative analysis. This standard also requires continuous
reassessment of whether an enterprise is the primary beneficiary of a VIE as
well as enhanced disclosures about an enterprise’s involvement with a
VIE. This guidance is effective for interim and annual periods
beginning after November 15, 2009. The Company has evaluated the
potential impact of adopting this statement and concluded that it will continue
to consolidate its VIEs that it identified in Note 1 to the consolidated
financial statements. The Company will do a continuous reassessment
of its conclusion as stipulated in this statement.
RESOURCE
CAPITAL CORP. AND SUBSIDIARIES
NOTES
TO CONSOLIDATED FINANCIAL STATEMENTS – (continued)
DECEMBER
31, 2009
NOTE
2 − SUMMARY OF SIGNIFICANT ACCOUNTING POLICIES − (continued)
Recent
Accounting Standards – (continued)
In June 2009, the FASB issued guidance
for accounting for transfers of financial assets. The guidance
eliminates the concept of a “qualifying special-purpose entity,” changes the
requirements for derecognizing financial assets and requires greater
transparency of related disclosures. This statement is effective for
fiscal years beginning after November 15, 2009. The Company has
evaluated the potential impact of adopting this statement and does not expect
adoption will have an impact on its consolidated financial
statements.
In May 2009, the FASB issued guidance
which establishes general standards of accounting for and disclosure of events
that occur after the balance sheet date but before the issuance of the financial
statements. The Company adopted this guidance in the second quarter
of 2009. Adoption did not have a material impact on the Company’s
consolidated financial statements. The Company provided disclosures
required by this guidance.
On April 9, 2009, the FASB issued
guidance intended to provide additional application guidance and enhance
disclosures regarding fair value measurements and impairments of
securities. It provides guidelines for making fair value measurements
more consistent with the fair value measurement principles when the volume and
level of activity for the asset or liability have decreased
significantly. It also enhances consistency in financial reporting by
increasing the frequency of fair value disclosures. Finally, it
provides additional guidance designed to create greater clarity and consistency
in accounting for and presenting impairment losses on
securities. Provisions for this guidance are effective for interim
periods ending after June 15, 2009, with early adoption permitted in the first
quarter of 2009. Although adoption did not have a significant impact
on the Company’s consolidated financial statements; however, the Company
provided the required additional disclosures in Note 16 to the consolidated
financial statements.
In March 2008, the FASB issued guidance
that requires enhanced disclosures for derivative instruments, including those
used in hedging activities. It is effective for fiscal years and
interim periods beginning after November 15, 2008 and was applicable to the
Company in the first quarter of fiscal 2009. Although the adoption
did not have a significant impact on the Company’s consolidated financial
statements; however, the Company provided the required additional disclosures in
Note 17 to the consolidated financial statements.
Reclassifications
Certain reclassifications, as a result
of adoption of new accounting standards, have been made to the 2008 and 2007
consolidated financial statements to conform to the 2009
presentation.
NOTE
3 − RESTRICTED CASH
Restricted cash as of December 31, 2009
consists of $80.5 million held in five consolidated CDO trusts and $4.6 million
in cash collateralizing outstanding margin calls on the cash flow
hedges.
NOTE
4 – DECONSOLIDATION OF VARIABLE INTEREST ENTITY
The Company consolidates VIEs if the
Company determines it is the primary beneficiary. During the year
ended December 31, 2007, the Company sold a portion of its preferred shares in
Ischus CDO II Ltd. (“Ischus CDO II’) to an independent third
party. The sale was deemed to be a reconsideration event and the
Company determined it was no longer the primary
beneficiary. Therefore, as of the date of the sale, the Company
deconsolidated Ischus CDO II and wrote down its investment in this CDO by $15.6
million which was recorded in net realized (losses) gains on sales of
investments on the Company’s consolidated statements of operations.
Additionally, the losses the Company recorded on the sales of the net assets
were in excess of its cost basis and, as a result, the Company recorded a gain
on the deconsolidation of Ischus CDO II of $14.3 million.
RESOURCE
CAPITAL CORP. AND SUBSIDIARIES
NOTES
TO CONSOLIDATED FINANCIAL STATEMENTS – (continued)
DECEMBER
31, 2009
NOTE
4 – DECONSOLIDATION OF VARIABLE INTEREST ENTITIES − (continued)
The value of the preferred shares at
deconsolidation was $722,000. The Company recognized income on these
preferred shares using the cost recovery method. At December 31,
2007, the remaining value of the Company’s preferred shares in Ischus CDO II was
$257,000 after collecting $465,000 of cash distributions from the date of
deconsolidation through December 31, 2007 and applying it as a reduction of the
Company’s investment. No income was recognized on this investment
from the period of deconsolidation through December 31, 2007. During
the year ended December 31, 2008 $1.3 million of cash was collected from this
investment and $997,000 of income was recognized (after reducing the Company’s
investment from $257,000 to zero) which is included in Interest Income – other
on the Company’s consolidated statement of operations.
The following table summarizes the
Company’s calculation of its loss on its investment in Ischus CDO II at December
31, 2007 (in thousands):
|
Write-down
of Investment in Ischus CDO II:
|
||||
|
Original investment
|
$ | 27,000 | ||
|
Cumulative cash
distributions
|
(10,697 | ) | ||
|
Net basis
|
16,303 | |||
|
Investment valuation at time of
sale
|
(722 | ) | ||
|
Realized loss on
investment
|
$ | 15,581 | ||
The following tables summarize the
balance sheet and statement of operations of Ischus CDO II as of the date of
deconsolidation during 2007 and its income statements for historical
periods. The statement of operations for Ischus CDO II is included in
the Company’s consolidated statement of income during 2007 whereas the assets of
the consolidated balance sheet below have been removed from the Company’s
consolidated balance sheet as of December 31, 2007. The
following table also describes the non-cash changes in the Company’s assets and
liabilities during 2007 caused by the deconsolidation of Ischus CDO II (in
thousands):
|
November
13, 2007
|
||||
|
ASSETS:
|
||||
|
Available-for-sale securities,
pledged
|
$ | 214,769 | ||
|
Restricted cash
|
1,954 | |||
|
Interest receivable
|
1,747 | |||
|
Other assets
|
191 | |||
|
Total assets
|
$ | 218,661 | ||
|
LIABILITIES
AND STOCKHOLDERS’ EQUITY:
|
||||
|
Borrowings
|
$ | 370,688 | ||
|
Accrued interest and other
payables
|
414 | |||
|
Other comprehensive loss
|
(154,486 | ) | ||
|
RCC investment at date of
deconsolidation
|
16,304 | |||
| 232,920 | ||||
|
Gain on deconsolidation of
VIE
|
(14,259 | ) | ||
|
TOTAL
LIABILITIES AND STOCKHOLDERS’ EQUITY
|
$ | 218,661 | ||
RESOURCE
CAPITAL CORP. AND SUBSIDIARIES
NOTES
TO CONSOLIDATED FINANCIAL STATEMENTS – (continued)
DECEMBER
31, 2009
NOTE
4 – DECONSOLIDATION OF VARIABLE INTEREST ENTITIES − (continued)
|
Period
from
January
1, 2007 through
November
13,
|
Year
ended
December
31,
|
Period
from March 8, 2005 (Date Operations Commenced) to December
31,
|
||||||||||
|
2007
|
2006
|
2005
|
||||||||||
|
REVENUES:
|
||||||||||||
|
Securities
|
$ | 24,463 | $ | 27,189 | $ | 9,252 | ||||||
|
Interest income – other
|
134 | 86 | 100 | |||||||||
|
Total interest income
|
24,597 | 27,275 | 9,352 | |||||||||
|
Interest expense
|
19,688 | 21,666 | 7,161 | |||||||||
|
Net interest income
|
4,909 | 5,609 | 2,191 | |||||||||
|
OPERATING
EXPENSES:
|
||||||||||||
|
Professional services
|
138 | 228 | 97 | |||||||||
|
General and administrative
|
83 | 99 | 45 | |||||||||
|
Total operating expenses
|
221 | 327 | 142 | |||||||||
|
NET
OPERATING INCOME
|
4,688 | 5,282 | 2,049 | |||||||||
|
OTHER
(EXPENSES) REVENUES:
|
||||||||||||
|
Net realized gain (loss) on
investments
|
47 | (47 | ) | − | ||||||||
|
Asset impairments
|
(26,277 | ) | − | − | ||||||||
|
Total expenses
|
(26,230 | ) | (47 | ) | − | |||||||
|
NET
(LOSS) INCOME
|
$ | (21,542 | ) | $ | 5,235 | $ | 2,049 | |||||
NOTE
5 – INVESTMENT SECURITIES AVAILABLE-FOR-SALE
The following table summarizes the
Company's mortgage-backed securities and other asset-backed securities,
including those pledged as collateral and classified as available-for-sale,
which are carried at fair value (in thousands):
|
Amortized
Cost
(1)
|
Unrealized
Gains
|
Unrealized
Losses
|
Fair
Value (1)
|
|||||||||||||
|
December 31, 2009:
|
||||||||||||||||
|
Commercial mortgage-backed
private placement
|
$ | 92,110 | $ | 2,622 | $ | (50,214 | ) | $ | 44,518 | |||||||
|
Other asset-backed
|
24 | − | − | 24 | ||||||||||||
|
Total
|
$ | 92,134 | $ | 2,622 | $ | (50,214 | ) | $ | 44,542 | |||||||
|
December 31, 2008:
|
||||||||||||||||
|
Commercial mortgage-backed
private placement
|
$ | 70,458 | $ | − | $ | (41,243 | ) | $ | 29,215 | |||||||
|
Other asset-backed
|
5,665 | − | (5,620 | ) | 45 | |||||||||||
|
Total
|
$ | 76,123 | $ | − | $ | (46,863 | ) | $ | 29,260 | |||||||
|
(1)
|
As
of December 31, 2009 and 2008, $39.3 million and $22.5 million,
respectively, of securities were pledged as collateral security under
related financings.
|
RESOURCE
CAPITAL CORP. AND SUBSIDIARIES
NOTES
TO CONSOLIDATED FINANCIAL STATEMENTS – (continued)
DECEMBER
31, 2009
NOTE
5 – INVESTMENT SECURITIES AVAILABLE-FOR-SALE − (continued)
The following table summarizes the
estimated maturities of the Company’s mortgage-backed securities and other
asset-backed securities according to their estimated weighted average life
classifications (in thousands, except percentages):
|
Weighted
Average Life
|
Fair
Value
|
Amortized
Cost
|
Weighted
Average Coupon
|
|||||||||
|
December 31, 2009:
|
||||||||||||
|
Less than one year
|
$ | 7,503 | $ | 20,043 | 1.50% | |||||||
|
Greater than one year and less
than five years
|
4,346 | 12,728 | 2.24% | |||||||||
|
Greater than five years
|
32,693 | 59,363 | 5.76% | |||||||||
|
Total
|
$ | 44,542 | $ | 92,134 | 4.35% | |||||||
|
December 31, 2008:
|
||||||||||||
|
Less than one year
|
$ | 5,088 | $ | 10,465 | 3.17% | |||||||
|
Greater than one year and less
than five years
|
9,954 | 21,596 | 3.75% | |||||||||
|
Greater than five years
|
14,218 | 44,062 | 5.05% | |||||||||
|
Total
|
$ | 29,260 | $ | 76,123 | 4.36% | |||||||
The contractual maturities of the
investment securities available-for-sale range from January 2011 to October
2017.
The following table shows the fair
value and gross unrealized losses, aggregated by investment category and length
of time, of those individual investment securities that have been in a
continuous unrealized loss position (in thousands):
|
Less
than 12 Months
|
More
than 12 Months
|
Total
|
||||||||||||||||||||||
|
Fair
Value
|
Gross
Unrealized Losses
|
Fair
Value
|
Gross
Unrealized Losses
|
Fair
Value
|
Gross
Unrealized Losses
|
|||||||||||||||||||
|
December 31, 2009:
|
||||||||||||||||||||||||
|
Commercial
mortgage-
backed private
placement
|
$ | 11,193 | $ | (1,073 | ) | $ | 14,588 | $ | (49,141 | ) | $ | 25,781 | $ | (50,214 | ) | |||||||||
|
Total temporarily
impaired securities
|
$ | 11,193 | $ | (1,073 | ) | $ | 14,588 | $ | (49,141 | ) | $ | 25,781 | $ | (50,214 | ) | |||||||||
|
December 31, 2008:
|
||||||||||||||||||||||||
|
Commercial
mortgage-
backed private
placement
|
$ | − | $ | − | $ | 29,215 | $ | (41,243 | ) | $ | 29,215 | $ | (41,243 | ) | ||||||||||
|
Other asset-backed
|
− | − | 45 | (5,620 | ) | 45 | (5,620 | ) | ||||||||||||||||
|
Total temporarily
impaired securities
|
$ | − | $ | − | $ | 29,260 | $ | (46,863 | ) | $ | 29,260 | $ | (46,863 | ) | ||||||||||
The Company holds 13 investment
securities available-for-sale that have been in a loss position for more than 12
months. The unrealized losses in the above table are considered to be
temporary impairments due to market factors and are not reflective of credit
deterioration.
The determination of
other-than-temporary impairment is a subjective process, and different judgments
and assumptions could affect the timing of loss realization. The
Company reviews its portfolios monthly and the determination of
other-than-temporary impairment is made at least quarterly. The
Company considers the following factors when determining if there is an
other-than-temporary impairment on a security:
|
|
·
|
the
length of time the market value has been less than amortized
cost;
|
|
|
·
|
the
severity of the impairment;
|
|
|
·
|
the
expected loss of the security as generated by third party
software;
|
|
|
·
|
credit
ratings from the rating agencies;
|
|
|
·
|
underlying
credit fundamentals of the collateral backing the securities;
and
|
|
|
·
|
the
Company’s intent to sell as well as the likelihood that the Company will
be required to sell the security before the recovery of the amortized cost
basis.
|
RESOURCE
CAPITAL CORP. AND SUBSIDIARIES
NOTES
TO CONSOLIDATED FINANCIAL STATEMENTS – (continued)
DECEMBER
31, 2009
NOTE
5 – INVESTMENT SECURITIES AVAILABLE-FOR-SALE − (continued)
At December 31, 2009 and 2008, the
Company held $44.5 million and $29.2 million, respectively, net of net
unrealized losses of $47.6 million and $41.2 million, respectively, of CMBS at
fair value which for the Company’s positions purchased in 2009 is based on
dealer quotes due to their higher ratings and more active markets and for the
Company’s positions purchased prior to 2009 is based on taking a weighted
average of the following three measures:
|
|
·
|
an
income approach utilizing an appropriate current risk-adjusted yield, time
value and projected estimated losses from default assumptions based on
historical analysis of underlying loan
performance;
|
|
|
·
|
quotes
on similar-vintage, higher rated, more actively traded CMBS adjusted for
the lower subordination level of the Company’s securities;
and
|
|
|
·
|
dealer
quotes on the Company’s securities for which there is not an active
market.
|
During the three months ended March 31,
2009, a collateral position that supported the Company’s other-ABS investment
weakened to the point that default of that position became
probable. As a result, the Company recognized a $5.6 million
other-than-temporary impairment on its other-ABS investment as of March 31, 2009
and an additional $45,000 of other-than-temporary impairment on this investment
during the three months ended June 30, 2009 bringing the fair value to
$0. During the three months ended December 31, 2009, two collateral
positions that supported the Company’s CMBS portfolio weakened to the point that
default of these positions became probable. The assumed default of
these collateral positions in the Company’s cash flow model yielded a value of
less than full recovery of the Company’s cost basis. The Company
recognized a $6.9 million other-than-temporary impairment on its CMBS
investments as of December 31, 2009 bringing the combined fair value to
$206,000. The net impairment losses were recognized in earnings in
the consolidated statements of operations.
While the Company’s remaining
securities classified as available-for-sale have continued to decline in fair
value, the decline continues to be temporary. The Company performs an
on-going review of third-party reports and updated financial data on the
underlying property financial information to analyze current and projected loan
performance. All securities but the ones described above are current
with respect to interest and principal payments. Rating agency
downgrades are considered with respect to the Company’s income approach when
determining other-than-temporary impairment and when inputs are stressed, the
resulting projected cash flows reflect a full recovery of
principal. The Company does not believe that any other of its
securities classified as available-for-sale were other-than-temporarily impaired
as of December 31, 2009.
During the years ended December 31,
2009, 2008 and 2007, the Company recognized a gain of $160,000, a loss of $2.0
million and $0, respectively, into earnings related to the sale of several CMBS
private placement positions.
Changes in interest rates may also have
an effect on the rate of mortgage principal prepayments and, as a result,
prepayments on mortgage-backed securities in the Company’s investment
portfolio. The Company seeks to mitigate the effect of changes in the
mortgage principal repayment rate by balancing assets purchased at a premium
with assets purchased at a discount. At December 31, 2009, the
aggregate discount exceeded the aggregate premium on the Company’s
mortgage-backed securities by approximately $29.1 million. At
December 31, 2008, the aggregate discount exceeded the aggregate premium on the
Company’s mortgage-backed securities by approximately $3.7 million.
|
NOTE
6 – INVESTMENT SECURITIES
HELD-TO-MATURITY
|
The following table summarizes the
Company's securities held-to-maturity which are carried at amortized cost (in
thousands):
|
Amortized
Cost
|
Unrealized
Gains
|
Unrealized
Losses
|
Fair
Value
|
|||||||||||||
|
December 31, 2009:
|
||||||||||||||||
|
Collateralized loan
obligations
|
$ | 31,401 | $ | 267 | $ | (10,348 | ) | $ | 21,320 | |||||||
|
Total
|
$ | 31,401 | $ | 267 | $ | (10,348 | ) | $ | 21,320 | |||||||
|
December 31, 2008:
|
||||||||||||||||
|
Collateralized loan
obligations
|
$ | 28,157 | $ | − | $ | (23,339 | ) | $ | 4,818 | |||||||
|
Total
|
$ | 28,157 | $ | − | $ | (23,339 | ) | $ | 4,818 | |||||||
RESOURCE
CAPITAL CORP. AND SUBSIDIARIES
NOTES
TO CONSOLIDATED FINANCIAL STATEMENTS – (continued)
DECEMBER
31, 2009
|
NOTE
6 – INVESTMENT SECURITIES HELD-TO-MATURITY –
(continued)
|
The following table summarizes the
estimated maturities of the Company’s securities held-to-maturity according to
their contractual lives (in thousands):
|
Contractual
Life
|
Fair
Value
|
Amortized
Cost
|
||||||
|
December 31, 2009:
|
||||||||
|
Greater than five years and less
than ten years
|
$ | 15,628 | $ | 19,667 | ||||
|
Greater than ten years
|
5,692 | 11,734 | ||||||
|
Total
|
$ | 21,320 | $ | 31,401 | ||||
|
December 31, 2008:
|
||||||||
|
Greater than five years and less
than ten years
|
$ | 3,093 | $ | 12,487 | ||||
|
Greater than ten years
|
1,725 | 15,670 | ||||||
|
Total
|
$ | 4,818 | $ | 28,157 | ||||
The following table shows the fair
value and gross unrealized losses, aggregated by investment category and length
of time, of those individual investment securities that have been in a
continuous unrealized loss position (in thousands):
|
Less
than 12 Months
|
More
than 12 Months
|
Total
|
||||||||||||||||||||||
|
Fair
Value
|
Gross
Unrealized Losses
|
Fair
Value
|
Gross
Unrealized Losses
|
Fair
Value
|
Gross
Unrealized Losses
|
|||||||||||||||||||
|
December 31, 2009:
|
||||||||||||||||||||||||
|
Collateralized
loan
obligations
|
$ | 2,530 | $ | (44 | ) | $ | 10,980 | $ | (10,304 | ) | $ | 13,510 | $ | (10,348 | ) | |||||||||
|
Total temporarily
impaired securities
|
$ | 2,530 | $ | (44 | ) | $ | 10,980 | $ | (10,304 | ) | $ | 13,510 | $ | (10,348 | ) | |||||||||
|
December 31, 2008:
|
||||||||||||||||||||||||
|
Collateralized
loan
obligations
|
$ | 2,688 | $ | (6,924 | ) | $ | 2,130 | $ | (16,415 | ) | $ | 4,818 | $ | (23,339 | ) | |||||||||
|
Total temporarily
impaired securities
|
$ | 2,688 | $ | (6,924 | ) | $ | 2,130 | $ | (16,415 | ) | $ | 4,818 | $ | (23,339 | ) | |||||||||
The Company holds 14 investment
securities held-to-maturity that have been in a loss position for more than 12
months. The unrealized losses in the above table are considered to be
temporary impairments due to market factors and are not reflective of credit
deterioration.
During the year ended December 31,
2009, based on a credit rating downgrade and the cash flow analysis performed, a
collateral position that supported the investments held-to-maturity became
impaired as the Company’s cash flow model yielded a value of less than full
recovery of the Company’s cost basis. As a result, the Company recognized
an $895,000 other-than-temporary impairment on one of its investments
held-to-maturity as of December 31, 2009. As a result of the impairment
charges, the cost of this security was written down to fair value through net
impairment losses recognized in earnings in the consolidated statements of
operations.
The Company does not believe that any
other of its investments classified as held-to-maturity were
other-than-temporarily impaired as of December 31, 2009.
During the year ended December 31,
2009, based on the downgrading of the issuers' published credit rating, the
Company sold three securities held-for-maturity. The Company has the
intent and ability to hold its remaining securities until maturity.
RESOURCE
CAPITAL CORP. AND SUBSIDIARIES
NOTES
TO CONSOLIDATED FINANCIAL STATEMENTS – (continued)
DECEMBER
31, 2009
NOTE
7 – LOANS HELD FOR INVESTMENT
The following is a summary of the
Company’s loans (in thousands):
|
Loan
Description
|
Principal
|
Unamortized
(Discount)
Premium
|
Carrying
Value
(1)
|
|||||||||
|
December 31, 2009:
|
||||||||||||
|
Bank loans (2)
|
$ | 893,183 | $ | (27,682 | ) | $ | 865,501 | |||||
|
Commercial real estate
loans:
|
||||||||||||
|
Whole loans
|
484,464 | (269 | ) | 484,195 | ||||||||
|
B notes
|
81,450 | 27 | 81,477 | |||||||||
|
Mezzanine loans
|
182,523 | 163 | 182,686 | |||||||||
|
Total commercial real estate
loans
|
748,437 | (79 | ) | 748,358 | ||||||||
|
Subtotal loans before
allowances
|
1,641,620 | (27,761 | ) | 1,613,859 | ||||||||
|
Allowance for loan loss
|
(47,122 | ) | − | (47,122 | ) | |||||||
|
Total
|
$ | 1,594,498 | $ | (27,761 | ) | $ | 1,566,737 | |||||
|
December 31, 2008:
|
||||||||||||
|
Bank loans (2)
|
$ | 916,966 | $ | (7,616 | ) | $ | 909,350 | |||||
|
Commercial real estate
loans:
|
||||||||||||
|
Whole loans
|
521,015 | (1,678 | ) | 519,337 | ||||||||
|
B notes
|
89,005 | 64 | 89,069 | |||||||||
|
Mezzanine loans
|
215,255 | (4,522 | ) | 210,733 | ||||||||
|
Total commercial real estate
loans
|
825,275 | (6,136 | ) | 819,139 | ||||||||
|
Subtotal loans before
allowances
|
1,742,241 | (13,752 | ) | 1,728,489 | ||||||||
|
Allowance for loan loss
|
(43,867 | ) | − | (43,867 | ) | |||||||
|
Total
|
$ | 1,698,374 | $ | (13,752 | ) | $ | 1,684,622 | |||||
|
(1)
|
Substantially
all loans are pledged as collateral under various borrowings at December
31, 2009 and December 31, 2008.
|
|
(2)
|
Amounts
include $8.1 million and $9.0 million of loans held for sale as of
December 31, 2009 and 2008,
respectively.
|
As of December 31, 2009 and 2008,
approximately 39.0% and 39.2%, respectively of the Company’s commercial real
estate loan portfolio was concentrated in commercial real estate loans located
in California and 12.4% and 11.4%, respectively were concentrated in New
York. As of December 31, 2009 and 2008, approximately 12.4% and
11.1%, respectively, of the Company’s bank loan portfolio was concentrated in
the collective industry grouping of healthcare, education and
childcare.
At December 31, 2009, the Company’s
bank loan portfolio consisted of $847.7 million (net of allowance of $17.8
million) of floating rate loans, which bear interest ranging between the London
Interbank Offered Rate (“LIBOR”) plus 18.25% and LIBOR plus 0.50% with maturity
dates ranging from June 2011 to August 2022.
At December 31, 2008, the Company’s
bank loan portfolio consisted of $880.6 million (net of allowance of $28.8
million) of floating rate loans, which bore interest ranging between LIBOR plus
0.97% and LIBOR plus 10.0% with maturity dates ranging from March 2009 to August
2022.
The following table shows the changes
in the allowance for loan loss (in thousands):
|
Allowance
for loan loss at January 1, 2008
|
$ | 5,918 | ||
|
Reserve charged to
expense
|
45,259 | |||
|
Loans charged-off
|
(7,310 | ) | ||
|
Recoveries
|
− | |||
|
Allowance
for loan loss at January 1, 2009
|
43,867 | |||
|
Reserve charged to expense
|
58,711 | |||
|
Loans charged-off
|
(55,456 | ) | ||
|
Recoveries
|
− | |||
|
Allowance
for loan loss at December 31, 2009
|
$ | 47,122 |
RESOURCE
CAPITAL CORP. AND SUBSIDIARIES
NOTES
TO CONSOLIDATED FINANCIAL STATEMENTS – (continued)
DECEMBER
31, 2009
NOTE
7 – LOANS HELD FOR INVESTMENT − (continued)
The following is a summary of the
Company’s commercial real estate loans (in thousands):
|
Description
|
Quantity
|
Amortized
Cost
|
Contracted
Interest
Rates
|
Maturity Dates (3)
|
|||||||
|
December 31, 2009:
|
|||||||||||
|
Whole loans, floating
rate (1)
|
32 | $ | 403,890 |
LIBOR
plus 1.50% to
LIBOR
plus 4.40%
|
May
2010 to
February
2017
|
||||||
|
Whole loans, fixed
rate (1)
|
6 | 80,305 |
6.98%
to 10.00%
|
May
2010 to
August
2012
|
|||||||
|
B notes, floating rate
|
3 | 26,500 |
LIBOR
plus 2.50% to
LIBOR
plus 3.01%
|
July
2010 to
October
2010
|
|||||||
|
B notes, fixed rate
|
3 | 54,977 |
7.00%
to 8.68%
|
July
2011 to
July
2016
|
|||||||
|
Mezzanine loans, floating
rate
|
10 | 124,048 |
LIBOR
plus 2.15% to
LIBOR
plus 3.45%
|
May
2010 to
January
2013
|
|||||||
|
Mezzanine loans, fixed
rate
|
5 | 58,638 |
8.14%
to 11.00%
|
May
2010 to
September
2016
|
|||||||
|
Total (2)
|
59 | $ | 748,358 | ||||||||
|
December 31, 2008:
|
|||||||||||
|
Whole loans, floating
rate (1)
|
29 | $ | 431,985 |
LIBOR
plus 1.50% to
LIBOR
plus 4.40%
|
April
2009 to
August
2011
|
||||||
|
Whole loans, fixed
rate (1)
|
7 | 87,352 |
6.98%
to 10.00%
|
May
2009 to
August
2012
|
|||||||
|
B notes, floating rate
|
4 | 33,535 |
LIBOR
plus 2.50% to
LIBOR
plus 3.01%
|
March
2009 to
October
2009
|
|||||||
|
B notes, fixed rate
|
3 | 55,534 |
7.00%
to 8.68%
|
July
2011 to
July
2016
|
|||||||
|
Mezzanine loans, floating
rate
|
10 | 129,459 |
LIBOR
plus 2.15% to
LIBOR
plus 3.45%
|
May
2009 to
February
2010
|
|||||||
|
Mezzanine loans, fixed
rate
|
7 | 81,274 |
5.78%
to 11.00%
|
November
2009 to
September
2016
|
|||||||
|
Total (2)
|
60 | $ | 819,139 | ||||||||
|
(1)
|
Whole
loans had $5.6 million and $26.6 million in unfunded loan commitments as
of December 31, 2009 and 2008, respectively, that are funded as the loans
require additional funding and the related borrowers have satisfied the
requirements to obtain this additional
funding.
|
|
(2)
|
The
total does not include an allowance for loan losses of $29.3 million and
$15.1 million recorded as of December 31, 2009 and 2008,
respectively.
|
|
(3)
|
Excludes
two floating rate whole loans. One whole loan matured in July
2009 and is in foreclosure. The other whole loan that
matured is on a month-to-month extension and is current with respect
to interest.
|
RESOURCE
CAPITAL CORP. AND SUBSIDIARIES
NOTES
TO CONSOLIDATED FINANCIAL STATEMENTS – (continued)
DECEMBER
31, 2009
NOTE
7 – LOANS HELD FOR INVESTMENT − (continued)
As of December 31, 2009, the Company
had recorded an allowance for loan loss of $47.1 million consisting of a $17.8
million allowance on the Company’s bank loan portfolio and a $29.3 million
allowance on the Company’s commercial real estate portfolio as a result of the
Company having seven bank loans and three commercial real estate loan that were
deemed impaired as well as the establishment of a general reserve on these
portfolios. As of December 31, 2008, the Company had recorded an
allowance for loan loss of $43.9 million consisting of a $28.8 million allowance
on the Company’s bank loan portfolio and a $15.1 million allowance on the
Company’s commercial real estate portfolio as a result of the Company having ten
bank loans and one commercial real estate loan that were deemed impaired as well
as the establishment of a general reserve on these portfolios.
The Company had one mezzanine loan,
with a balance of $11.6 million secured by equity interests in two enclosed
regional malls that went into default in February 2008. During the
three months ended June 30, 2008, the Company recorded a provision for loan loss
on the full balance. The Company does not expect to recover any of
this loan balance.
The Company has a portfolio of whole
loans, with a cost balance of $66.8 million secured by multifamily properties in
Northern California. The Company decided to liquidate a substantial
portion of the underlying collateral securing these loans and, as a result, the
Company took an $18.8 million provision for loan loss during
2009. This portfolio of loans was restructured and modified in 2010
after the final sale of certain of the collateral properties. The
modified loan balance after application of the 2010 sales proceeds of $8.3
million and the 2009 provisions taken was $39.7 million and is supported under
its modified terms by the current cash flow from the remaining collateral
properties. The Company has determined that this was a troubled debt
restructuring.
NOTE
8 –DIRECT FINANCING LEASES AND NOTES
On June 30, 2009, the Company sold its
sole membership interest in one of its subsidiaries that held a pool of leases
valued at $89.8 million and transferred the $82.3 million balance of the related
secured term facility to Resource America. No gain or loss was
recognized on the sale of this membership interest. The Company
received a note of $7.5 million from Resource America for the equity in the
portfolio on June 30, 2009. The promissory note bore interest at
LIBOR plus 3% and matured on September 30, 2009. On July 1, 2009,
$4.5 million of the promissory note was repaid. The remaining
principal balance of the note of $3.0 million was paid in full on August 3,
2009. The balance of direct financing leases and notes was $927,000
and $104.0 million as of December 31, 2009 and 2008, respectively.
At December 31, 2009, the Company had
18 leases that were sufficiently delinquent with respect to scheduled payments
of interest that the Company determined that an allowance for lease loss was
necessary. As a result, the Company recorded a provision for lease
losses of $2.0 million. The Company increased the general reserve by
$240,000 during the three months ended December 31, 2009 to bring the total
general reserve to $1.1 million at December 31, 2009. At December 31,
2008, the Company had seven leases that were sufficiently delinquent with
respect to scheduled payments of interest that the Company determined that an
allowance for lease losses was necessary. As a result, the Company
recorded a provision for lease losses of $451,000. The Company also
recorded a general reserve of $300,000 during the three months ended December
31, 2008 to bring the general reserve to $450,000 at December 31,
2008.
The following table shows the changes
in the allowance for lease loss (in thousands):
|
Allowance
for lease loss at January 1, 2008
|
$ | − | ||
|
Provision for lease loss
|
901 | |||
|
Leases charged-off
|
(451 | ) | ||
|
Recoveries
|
− | |||
|
Allowance
for lease loss at December 31, 2008
|
450 | |||
|
Provision for lease loss
|
2,672 | |||
|
Leases charged off
|
(1,994 | ) | ||
|
Recoveries
|
12 | |||
|
Allowance
for lease loss at December 31, 2009
|
$ | 1,140 |
RESOURCE
CAPITAL CORP. AND SUBSIDIARIES
NOTES
TO CONSOLIDATED FINANCIAL STATEMENTS – (continued)
DECEMBER
31, 2009
NOTE
9 – BORROWINGS
The Company has financed the
acquisition of its investments, including securities available-for-sale, loans
and equipment leases and notes, primarily through the use of secured and
unsecured borrowings in the form of CDOs, repurchase agreements, a secured term
facility, warehouse facilities, trust preferred securities issuances and other
secured and unsecured borrowings.
Certain information with respect to the
Company’s borrowings at December 31, 2009 and 2008 is summarized in the
following table (dollars in thousands):
|
Outstanding
Borrowings
|
Weighted
Average Borrowing Rate
|
Weighted
Average
Remaining
Maturity
|
Value
of Collateral
|
|||||||||||
|
December 31, 2009:
|
||||||||||||||
|
RREF CDO 2006-1 Senior Notes
(2)
|
$ | 240,227 | 1.11% |
36.6
years
|
$ | 267,153 | ||||||||
|
RREF CDO 2007-1 Senior Notes
(3)
|
346,673 | 0.81% |
36.8
years
|
435,225 | ||||||||||
|
Apidos CDO I Senior Notes (4)
|
319,103 | 0.86% |
7.6 years
|
290,578 | ||||||||||
|
Apidos CDO III Senior Notes
(5)
|
260,158 | 0.71% |
10.5
years
|
237,499 | ||||||||||
|
Apidos Cinco CDO Senior Notes
(6)
|
318,791 | 0.78% |
10.4
years
|
299,874 | ||||||||||
|
Unsecured Junior Subordinated
Debentures (7)
|
51,548 | 6.19% |
26.7 years
|
− | ||||||||||
|
Total
|
$ | 1,536,500 | 1.02% |
20.4 years
|
$ | 1,530,329 | ||||||||
|
December 31, 2008:
|
||||||||||||||
|
Repurchase Agreements (1)
|
$ | 17,112 | 3.50% |
18.0
days
|
$ | 39,703 | ||||||||
|
RREF CDO 2006-1 Senior Notes
(2)
|
261,198 | 1.38% |
37.6
years
|
322,269 | ||||||||||
|
RREF CDO 2007-1 Senior Notes
(3)
|
377,851 | 1.15% |
37.8
years
|
467,310 | ||||||||||
|
Apidos CDO I Senior Notes (4)
|
318,469 | 4.03% |
8.6 years
|
206,799 | ||||||||||
|
Apidos CDO III Senior Notes
(5)
|
259,648 | 2.55% |
11.5
years
|
167,933 | ||||||||||
|
Apidos Cinco CDO Senior Notes
(6)
|
318,223 | 2.64% |
11.4
years
|
207,684 | ||||||||||
|
Secured Term Facility
|
95,714 | 4.14% |
1.3 years
|
104,015 | ||||||||||
|
Unsecured Junior Subordinated
Debentures (7)
|
51,548 | 6.42% |
27.7 years
|
− | ||||||||||
|
Total
|
$ | 1,699,763 | 2.57% |
20.6 years
|
$ | 1,515,713 | ||||||||
|
(1)
|
At
December 31, 2008, collateral consisted of a RREF CDO 2007-1 Class H bond
that was retained at closing with a carrying value of $3.9 million and
loans with a carrying value of $35.8
million.
|
|
(2)
|
Amount
represents principal outstanding of $243.5 million and $265.5 million less
unamortized issuance costs of $3.3 million and $4.3 million as of December
31, 2009 and December 31, 2008, respectively. This CDO
transaction closed in August 2006.
|
|
(3)
|
Amount
represents principal outstanding of $351.2 million less unamortized
issuance costs of $4.6 million as of December 31, 2009 and principal
outstanding of $383.8 million less unamortized issuance costs of $5.9
million as of December 31, 2008. This CDO transaction closed in
June 2007.
|
|
(4)
|
Amount
represents principal outstanding of $321.5 million less unamortized
issuance costs of $2.4 million as of December 31, 2009 and $3.0 million as
of December 31, 2008. The CDO transaction closed in August
2005.
|
|
(5)
|
Amount
represents principal outstanding of $262.5 million less unamortized
issuance costs of $2.3 million as of December 31, 2009 and $2.9 million as
of December 31, 2008. This CDO transaction closed in May
2006.
|
|
(6)
|
Amount
represents principal outstanding of $322.0 million less unamortized
issuance costs of $3.3 million as of December 31, 2009 and $3.8 million as
of December 31, 2008. This CDO transaction closed in May
2007.
|
|
(7)
|
Amount
represents junior subordinated debentures issued to Resource Capital Trust
I and RCC Trust II in May 2006 and September 2006,
respectively.
|
RESOURCE
CAPITAL CORP. AND SUBSIDIARIES
NOTES
TO CONSOLIDATED FINANCIAL STATEMENTS – (continued)
DECEMBER
31, 2009
NOTE
9 – BORROWINGS − (continued)
The Company had no repurchase
agreements at December 31, 2009. At December 31, 2008, the Company
had repurchase agreements with the following counterparties (dollars in
thousands):
|
Amount
at
Risk
(1)
|
Weighted
Average Maturity in Days
|
Weighted
Average Interest Rate
|
||||||||||
|
December 31, 2008:
|
||||||||||||
|
Natixis Real Estate Capital
Inc.
|
$ | 18,992 | 18 | 3.50% | ||||||||
|
Credit Suisse Securities (USA)
LLC
|
$ | 3,793 | 23 | 4.50% | ||||||||
|
(1)
|
Equal
to the estimated fair value of securities or loans sold, plus accrued
interest income, minus the sum of repurchase agreement liabilities plus
accrued interest expense.
|
Repurchase
and Credit Facilities
Commercial
Real Estate Loan – Term Repurchase Facility
In April 2007, the Company’s indirect
wholly-owned subsidiary, RCC Real Estate SPE 3, LLC, entered into a master
repurchase agreement with Natixis Real Estate Capital, Inc. to be used as a
warehouse facility to finance the purchase of commercial real estate loans and
commercial mortgage-backed securities. The Company guaranteed RCC
Real Estate SPE 3, LLC’s performance of its obligations under the repurchase
agreement. At December 31, 2009, all borrowings under the repurchase
agreement were repaid. At December 31, 2008, RCC Real Estate SPE 3
had borrowed $17.0 million, all of which the Company had
guaranteed. At December 31, 2008, borrowings under the repurchase
agreement were secured by commercial real estate loans with an estimated fair
value of $35.8 million and had a weighted average interest rate of one-month
LIBOR plus 2.30%, which was 3.50% at December 31, 2008.
Through a series of amendments entered
into in 2008 and 2009 between RCC Real Estate SPE 3 and Natixis, the term
repurchase facility and the related guaranty have been amended as
follows:
|
|
·
|
The
amount of the facility was reduced from $150,000,000 to
$100,000,000.
|
|
|
·
|
The
amount of the facility will further be reduced to the amount outstanding
on October 18, 2009.
|
|
|
·
|
Beginning
on November 25, 2008, any further repurchase agreement transactions may be
made in Natixis’ sole discretion. In addition, premiums over
new repurchase prices are required for early repurchase by RCC Real Estate
SPE 3 of the existing assets that represent collateral under the facility;
however, the premiums will reduce the repurchase price of the remaining
existing assets.
|
|
|
·
|
RCC
Real Estate SPE 3’s obligation to pay non-usage fees was
terminated.
|
|
|
·
|
The
weighted average undrawn balance (as defined in the agreement) threshold
exempting payment of the non-usage fee was reduced from $75,000,000 to
$56,250,000.
|
|
|
·
|
The
minimum net worth covenant amount was reduced from $250,000,000 to
$125,000,000.
|
Commercial
Real Estate Loans – Non-term Repurchase Facilities
In March 2005, the Company entered into
a master repurchase agreement with Credit Suisse Securities (USA) LLC to finance
the purchase of agency residential MBS (“RMBS”) securities. Each
repurchase transaction specifies its own terms, such as identification of the
assets subject to the transaction, sales price, repurchase price, rate and
term. These are one-month contracts. At December 31, 2009,
all borrowings under the repurchase agreement had been repaid. At
December 31, 2008, the Company had borrowed $90,000 with a weighted average
interest rate of 4.50% and borrowings under the repurchase agreement were
secured by a RREF CDO 2007-1 Class H bond that was retained at closing with a
carrying value of $3.9 million.
RESOURCE
CAPITAL CORP. AND SUBSIDIARIES
NOTES
TO CONSOLIDATED FINANCIAL STATEMENTS – (continued)
DECEMBER
31, 2009
NOTE
9 – BORROWINGS − (continued)
Repurchase
and Credit Facilities − (continued)
Secured
Term Facility
In March 2006, the Company entered into
a secured term credit facility with Bayerische Hypo-Und Vereinsbank AG (“HVB”)
to finance the purchase of equipment leases and notes. On June 30,
2009, in connection with the sale of the Company’s leasing subsidiary to
Resource America, the Company transferred its remaining balance to Resource
America. As of December 31, 2008, the Company had borrowed $95.7
million at a weighted average interest rate of 4.14%.
Collateralized
Debt Obligations
Resource
Real Estate Funding CDO 2007-1
In June 2007, the Company closed RREF
CDO 2007-1, a $500.0 million CDO transaction that provides financing for
commercial real estate loans and commercial mortgage-backed
securities. The investments held by RREF CDO 2007-1 collateralize the
debt it issued and, as a result, the investments are not available to the
Company, its creditors or stockholders. RREF CDO 2007-1 issued a
total of $265.6 million of senior notes at par to unrelated
investors. RCC Real Estate purchased 100% of the class H senior notes
(rated BBB+:Fitch), class K senior notes (rated BBB-:Fitch), class L
senior notes (rated BB:Fitch) and class M senior notes (rated B: Fitch) for
$68.0 million. In addition, Resource Real Estate Funding 2007-1 CDO
Investor, LLC, a subsidiary of RCC Real Estate, purchased a $41.3 million equity
interest representing 100% of the outstanding preference shares. The
senior notes purchased by RCC Real Estate are subordinated in right of payment
to all other senior notes issued by RREF CDO 2007-1 but are senior in right of
payment to the preference shares. The equity interest is subordinated
in right of payment to all other securities issued by RREF CDO
2007-1.
The senior notes issued to investors by
RREF CDO 2007-1 consist of the following classes: (i) $180.0 million of class
A-1 notes bearing interest at one-month LIBOR plus 0.28%; (ii) $50.0 million of
unissued class A-1R notes, which allow the CDO to fund future funding
obligations under the existing whole loan participations that have future
funding commitments; the undrawn balance of the class A-1R notes will accrue a
commitment fee at a rate per annum equal to 0.18%, the drawn balance will bear
interest at one-month LIBOR plus 0.32%; (iii) $57.5 million of class A-2 notes
bearing interest at one-month LIBOR plus 0.46%; (iv) $22.5 million of class B
notes bearing interest at one-month LIBOR plus 0.80%; (v) $7.0 million of class
C notes bearing interest at a fixed rate of 6.423%; (vi) $26.8 million of class
D notes bearing interest at one-month LIBOR plus 0.95%; (vii) $11.9 million of
class E notes bearing interest at one-month LIBOR plus 1.15%; (viii) $11.9
million of class F notes bearing interest at one-month LIBOR plus 1.30%; (ix)
$11.3 million of class G notes bearing interest at one-month LIBOR plus 1.55%;
(x) $11.3 million of class H notes bearing interest at one-month LIBOR plus
2.30%; (xi) $11.3 million of class J notes bearing interest at one-month LIBOR
plus 2.95%; (xii) $10.0 million of class K notes bearing interest at one-month
LIBOR plus 3.25%; (xiii) $18.8 million of class L notes bearing interest at a
fixed rate of 7.50% and (xiv) $28.8 million of class M notes bearing interest at
a fixed rate of 8.50%. All of the notes issued mature in September
2046, although the Company has the right to call the notes anytime after July
2017 until maturity. The weighted average interest rate on all notes
issued to outside investors and net of repurchased notes was 0.81% and 1.15% at
December 31, 2009 and 2008, respectively.
During the year ended December 31,
2009, the Company repurchased $33.5 million of the Class E, F, G and J notes in
RREF CDO 2007-1 at a weighted average price of 25.66% to par which resulted in a
$24.9 million gain, reported as a gain on the extinguishment of debt in the
consolidated statements of operations. During the year ended December
31, 2008, the Company repurchased $5.0 million of the Class J notes in RREF CDO
2007-1 at a price of 65.0% to par which resulted in a $1.75 million gain,
reported as a gain on the extinguishment of debt in its consolidated statements
of operations.
As a result of the Company’s ownership
of Class E, F, G, H, J, K, L and M senior notes, both the notes repurchased
subsequent to closing and those retained at the CDO’s closing eliminate in
consolidation.
RESOURCE
CAPITAL CORP. AND SUBSIDIARIES
NOTES
TO CONSOLIDATED FINANCIAL STATEMENTS – (continued)
DECEMBER
31, 2009
NOTE
9 – BORROWINGS − (continued)
Collateralized
Debt Obligations – (continued)
Resource
Real Estate Funding CDO 2006-1
In August 2006, the Company closed RREF
CDO 2006-1, a $345.0 million CDO transaction that provides financing for
commercial real estate loans. The investments held by RREF CDO 2006-1
collateralize the debt it issued and, as a result, the investments are not
available to the Company, its creditors or stockholders. RREF CDO
2006-1 issued a total of $308.7 million of senior notes at par to investors of
which RCC Real Estate purchased 100% of the class J senior notes (rated BB:
Fitch) and class K senior notes (rated B:Fitch) for $43.1 million. In
addition, Resource Real Estate Funding 2006-1 CDO Investor, LLC, a subsidiary of
RCC Real Estate, purchased a $36.3 million equity interest representing 100% of
the outstanding preference shares. The senior notes purchased by RCC
Real Estate are subordinated in right of payment to all other senior notes
issued by RREF CDO 2006-1 but are senior in right of payment to the preference
shares. The equity interest is subordinated in right of payment to
all other securities issued by RREF CDO 2006-1.
The senior notes issued to investors by
RREF CDO 2006-1 consist of the following classes: (i) $129.4 million
of class A-1 notes bearing interest at one-month LIBOR plus 0.32%; (ii) $17.4
million of class A-2 notes bearing interest at one-month LIBOR plus 0.35%; (iii)
$5.0 million of class A-2 notes bearing interest at a fixed rate of 5.842%; (iv)
$6.9 million of class B notes bearing interest at one-month LIBOR plus 0.40%;
(v) $20.7 million of class C notes bearing interest at one-month LIBOR plus
0.62%; (vi) $15.5 million of class D notes bearing interest at one-month LIBOR
plus 0.80%; (vii) $20.7 million of class E notes bearing interest at one-month
LIBOR plus 1.30%; (viii) $19.8 million of class F notes bearing interest at
one-month LIBOR plus 1.60%; (ix) $17.3 million of class G notes bearing interest
at one-month LIBOR plus 1.90%; (x) $12.9 million of class H notes bearing
interest at one-month LIBOR plus 3.75%, (xi) $14.7 million of Class J notes
bearing interest at a fixed rate of 6.00% and (xii) $28.4 million of Class K
notes bearing interest at a fixed rate of 6.00%. As a result of the
Company’s ownership of the Class J and K senior notes, these notes eliminate in
consolidation. All of the notes issued mature in August 2046,
although the Company has the right to call the notes anytime after August 2016
until maturity. The weighted average interest rate on all notes
issued to outside investors and net of repurchased notes was 1.11% and 1.38% at
December 31, 2009 and 2008, respectively.
During the year ended December 31,
2009, the Company repurchased $33.5 million of the Class E, F, G and J notes in
RREF CDO 2007-1 at a weighted average price of 25.66% to par which resulted in a
$24.9 million gain, reported as a gain on the extinguishment of debt in the
consolidated statements of operations. During the year ended December
31, 2008, the Company repurchased $5.0 million of the Class J notes in RREF CDO
2007-1 at a price of 65.0% to par which resulted in a $1.75 million gain,
reported as a gain on the extinguishment of debt in its consolidated statements
of operations.
As a result of the Company’s ownership
of Class D, E, F, J and K senior notes, both the notes repurchased subsequent to
closing and those retained at the CDO’s closing eliminate in
consolidation.
Apidos
Cinco CDO
In May 2007, the Company closed Apidos
Cinco CDO, a $350.0 million CDO transaction that provides financing for bank
loans. The investments held by Apidos Cinco CDO collateralize the
debt it issued and, as a result, the investments are not available to the
Company, its creditors or stockholders. Apidos Cinco CDO issued a
total of $322.0 million of senior notes at par to investors and RCC commercial
purchased a $28.0 million equity interest representing 100% of the outstanding
preference shares. The equity interest is subordinated in right of
payment to all other securities issued by Apidos Cinco CDO.
The senior notes issued to investors by
Apidos Cinco CDO consist of the following classes: (i) $37.5 million of class
A-1 notes bearing interest at LIBOR plus 0.24%; (ii) $200.0 million of class
A-2a notes bearing interest at LIBOR plus 0.23%; (iii) $22.5 million of class
A-2b notes bearing interest at LIBOR plus 0.32%; (iv) $19.0 million of class A-3
notes bearing interest at LIBOR plus 0.42%; (v) $18.0 million of class B notes
bearing interest at LIBOR plus 0.80%; (vi) $14.0 million of class C notes
bearing interest at LIBOR plus 2.25% and (vii) $11.0 million of class D notes
bearing interest at LIBOR plus 4.25%. All of the notes issued mature on May 14,
2020, although the Company has the right to call the notes anytime after May 14,
2011 until maturity. The weighted average interest rate on all notes
was 0.78% and 2.64% at December 31, 2009 and 2008, respectively.
RESOURCE
CAPITAL CORP. AND SUBSIDIARIES
NOTES
TO CONSOLIDATED FINANCIAL STATEMENTS – (continued)
DECEMBER
31, 2009
NOTE
9 – BORROWINGS − (continued)
Collateralized
Debt Obligations – (continued)
Apidos
CDO III
In May 2006, the Company closed Apidos
CDO III, a $285.5 million CDO transaction that provides financing for bank
loans. The investments held by Apidos CDO III collateralize the debt
it issued and, as a result, the investments are not available to the Company,
its creditors or stockholders. Apidos CDO III issued a total of
$262.5 million of senior notes at par to investors and RCC Commercial purchased
a $23.0 million equity interest representing 100% of the outstanding preference
shares. The equity interest is subordinated in right of payment to
all other securities issued by Apidos CDO III.
The senior notes issued to investors by
Apidos CDO III consist of the following classes: (i) $212.0 million
of class A-1 notes bearing interest at 3-month LIBOR plus 0.26%; (ii) $19.0
million of class A-2 notes bearing interest at 3-month LIBOR plus 0.45%; (iii)
$15.0 million of class B notes bearing interest at 3-month LIBOR plus 0.75%;
(iv) $10.5 million of class C notes bearing interest at 3-month LIBOR plus
1.75%; and (v) $6.0 million of class D notes bearing interest at 3-month LIBOR
plus 4.25%. All of the notes issued mature on June 12, 2020, although
the Company has the right to call the notes anytime after June 12, 2011 until
maturity. The weighted average interest rate on all notes was 0.71%
and 2.55% at December 31, 2009 and 2008, respectively.
Apidos
CDO I
In August 2005, the Company closed
Apidos CDO I, a $350.0 million CDO transaction that provides financing for bank
loans. The investments held by Apidos CDO I collateralize the debt it
issued and, as a result, the investments are not available to the Company, its
creditors or stockholders. Apidos CDO I issued a total of $321.5
million of senior notes at par to investors and RCC Commercial purchased a $28.5
million equity interest representing 100% of the outstanding preference
shares. The equity interest is subordinated in right of payment to
all other securities issued by Apidos CDO I.
The senior notes issued to investors by
Apidos CDO I consist of the following classes: (i) $265.0 million of
class A-1 notes bearing interest at 3-month LIBOR plus 0.26%; (ii) $15.0 million
of class A-2 notes bearing interest at 3-month LIBOR plus 0.42%; (iii) $20.5
million of class B notes bearing interest at 3-month LIBOR plus 0.75%; (iv)
$13.0 million of class C notes bearing interest at 3-month LIBOR plus 1.85%; and
(v) $8.0 million of class D notes bearing interest at a fixed rate of
9.251%. All of the notes issued mature on July 27, 2017, although the
Company has the right to call the notes anytime after July 27, 2010 until
maturity. The weighted average interest rate on all notes was 0.86%
and 4.03% at December 31, 2009 and 2008, respectively.
Unsecured
Junior Subordinated Debentures
In May 2006 and September 2006, the
Company formed RCT I and RCT II, respectively, for the sole purpose of issuing
and selling capital securities representing preferred beneficial
interests. Although the Company owns 100% of the common securities of
RCT I and RCT II, RCT I and RCT II are not consolidated into the Company’s
consolidated financial statements because the Company is not deemed to be the
primary beneficiary of these entities. In connection with the
issuance and sale of the capital securities, the Company issued junior
subordinated debentures to RCT I and RCT II of $25.8 million each, representing
the Company’s maximum exposure to loss. The debt issuance costs
associated with the junior subordinated debentures for RCT I and RCT II at
December 31, 2008 were $691,000 and $701,000, respectively. These
costs which are included in other assets are being amortized into interest
expense in the consolidated statements of operations using the effective yield
method over a ten year period.
In October 2009, the Company amended
the trust agreements and unsecured junior subordinated debentures held by RCT I
and RCT II with a total value outstanding of $51.5 million. The
amendment provides for an interest rate increase of 2% (from LIBOR plus 3.95% to
LIBOR plus 5.95%) on both issuances for a period of two years and a one-time
restructuring fee of $250,000 in exchange for the waiver of financial covenants
under the Company’s guarantee. The debt issuance costs associated
with the junior subordinated debentures for RCT I and RCT II at December 31,
2009 were $742,000 and $754,000, respectively. The interest rate
adjustment took effect as of October 1, 2009 and expires on September 30,
2011. The rates for RCT I and RCT II, at December 31, 2009, were
6.18% and 6.19%, respectively. The rates for RCT I and RCT II, at
December 31, 2008, were 5.42% and 7.42%, respectively. The covenant
waiver expires on January 1, 2012.
RESOURCE
CAPITAL CORP. AND SUBSIDIARIES
NOTES
TO CONSOLIDATED FINANCIAL STATEMENTS – (continued)
DECEMBER
31, 2009
NOTE
9 – BORROWINGS − (continued)
Unsecured
Junior Subordinated Debentures – (continued)
The rights of holders of common
securities of RCT I and RCT II are subordinate to the rights of the holders of
capital securities only in the event of a default; otherwise, the common
securities’ economic and voting rights are pari passu with the capital
securities. The capital and common securities of RCT I and RCT II are
subject to mandatory redemption upon the maturity or call of the junior
subordinated debentures held by each. Unless earlier dissolved, RCT I
will dissolve on May 25, 2041 and RCT II will dissolve on September 29,
2041. The junior subordinated debentures are the sole assets of RCT I
and RCT II and mature on June 30, 2036 and October 30, 2036, respectively, and
may be called at par by the Company any time after June 30, 2011 and October 30,
2011, respectively. The Company records its investments in RCT I and
RCT II’s common securities of $774,000 each as investments in unconsolidated
trusts and records dividend income upon declaration by RCT I and RCT
II.
NOTE
10 – SHARE ISSUANCE AND REPURCHASE
On December 11, 2009, the Company sold
10,294,455 shares of common stock (including 294,455 shares of common stock in
connection with the partial exercise by the underwriters of their over-allotment
option), at a price of $4.50 per share, in a public offering. The Company
received net proceeds of approximately $43.4 million after payment of
underwriting discounts and commissions of approximately $2.5 million and other
offering expenses of approximately $539,000.
Under a dividend reinvestment plan
authorized by the board of directors on June 12, 2008, the Company was
authorized to issue up to 5.5 million shares of common stock. During
the year ended December 31, 2009, the Company issued 1.9 million shares of
common stock through this plan at a weighted average price of $4.87 per share
and received proceeds of $9.0 million (net of costs).
Under a share repurchase plan
authorized by the board of directors on July 26, 2007, the Company is authorized
to repurchase up to 2.5 million of its outstanding common
shares. During the year ended December 31, 2009, the Company bought
back 1.4 million shares, at a weighted average price of $3.60 per
share. The Company has repurchased a total of 1,663,000 shares under
this program as of December 31, 2009.
NOTE
11 – SHARE-BASED COMPENSATION
The following table summarizes
restricted common stock transactions:
|
Non-Employee
Directors
|
Non-Employees
|
Total
|
||||||||||
|
Unvested
shares as of January 1, 2009
|
17,261 | 435,049 | 452,310 | |||||||||
|
Issued
|
52,632 | 197,500 | 250,132 | |||||||||
|
Vested
|
(17,261 | ) | (239,671 | ) | (256,932 | ) | ||||||
|
Forfeited
|
− | (8,191 | ) | (8,191 | ) | |||||||
|
Unvested
shares as of December 31, 2009
|
52,632 | 384,687 | 437,319 | |||||||||
The Company is required to value any
unvested shares of restricted common stock granted to non-employees at the
current market price. The estimated fair value of the unvested shares
of restricted stock granted during the years ended December 31, 2009 and 2008,
including shares issued to the five non-employee directors, was $709,000 and
$1.5 million, respectively.
On January 26, 2009, the Company issued
40,452 shares of restricted common stock under its 2007 Omnibus Equity
Compensation Plan. These restricted shares vested in full on January
26, 2010.
On January 29, 2009, the Company issued
37,500 shares of restricted common stock under its 2007 Omnibus Equity
Compensation Plan. These restricted shares vested 33.3% on January
29, 2010. The balance will vest annually thereafter through January
29, 2012.
RESOURCE
CAPITAL CORP. AND SUBSIDIARIES
NOTES
TO CONSOLIDATED FINANCIAL STATEMENTS – (continued)
DECEMBER
31, 2009
NOTE
11 – SHARE-BASED COMPENSATION – (continued)
On February 1, 2009 and March 9 2009,
the Company granted 6,716 and 45,916 shares of restricted stock, respectively,
under its 2005 Stock Incentive Plan and 2007 Omnibus Equity Compensation Plan,
respectively, to the Company’s non-employee directors as part of their annual
compensation. These shares vested in full on the first anniversary of
the date of grant.
On February 2, 2009, the Company
granted 60,000 shares of restricted stock under its 2007 Omnibus Equity
Compensation Plan. These restricted shares vested 25% on issuance and
12.5% on March 31, 2009, June 30, 2009, September 30, 2009 and December 31,
2009. The balance will vest quarterly thereafter through June 30,
2010.
On February 20, 2009, the Company
granted 35,046 shares of restricted stock under its 2007 Omnibus Equity
Compensation Plan. These restricted shares vested in full on February
20, 2010.
On July 30, 2009, the Company granted
24,502 shares of restricted stock under its 2007 Omnibus Equity Compensation
Plan. These restricted shares will vest in full on July 30,
2010.
The following table summarizes stock
option transactions:
|
Number
of
Options
|
Weighted
Average Exercise Price
|
Weighted
Average Remaining Contractual Term
(in
years)
|
Aggregate
Intrinsic
Value
(in
thousands)
|
|||||||||||||
|
Outstanding
as of January 1, 2009
|
624,166 | $ | 14.99 | |||||||||||||
|
Granted
|
− | − | ||||||||||||||
|
Exercised
|
− | − | ||||||||||||||
|
Forfeited
|
(16,500 | ) | 15.00 | |||||||||||||
|
Outstanding
as of December 31, 2009
|
607,666 | $ | 14.99 | 5 | $ | 545 | ||||||||||
|
Exercisable
at December 31, 2009
|
586,000 | $ | 14.99 | 5 | $ | 526 | ||||||||||
The stock options have a remaining
contractual term of five years. Upon exercise of options, new shares
are issued.
The following table summarizes the
status of the Company’s unvested stock options as of December 31,
2009:
|
Unvested Options
|
Options
|
Weighted
Average
Grant
Date
Fair
Value
|
||||||
|
Unvested
at January 1, 2009
|
43,333 | $ | 14.88 | |||||
|
Granted
|
− | − | ||||||
|
Vested
|
(21,667 | ) | $ | 14.88 | ||||
|
Forfeited
|
− | − | ||||||
|
Unvested
at December 31, 2009
|
21,666 | $ | 14.88 | |||||
The weighted average period the Company
expects to recognize the remaining expense on the unvested stock options is less
than one year.
RESOURCE
CAPITAL CORP. AND SUBSIDIARIES
NOTES
TO CONSOLIDATED FINANCIAL STATEMENTS – (continued)
DECEMBER
31, 2009
NOTE
11 – SHARE-BASED COMPENSATION – (continued)
The following table summarizes the
status of the Company’s vested stock options as of December 31,
2009:
|
Vested Options
|
Number
of
Options
|
Weighted
Average Exercise Price
|
Weighted
Average Remaining Contractual Term (in years)
|
Aggregate
Intrinsic
Value
(in
thousands)
|
|||||||
|
Vested
as of January 1, 2009
|
580,833 | $ | 15.00 | ||||||||
|
Vested
|
21,667 | $ | 14.88 | ||||||||
|
Exercised
|
− | $ | − | ||||||||
|
Forfeited
|
(16,500 | ) | $ | 15.00 | |||||||
|
Vested
as of December 31, 2009
|
586,000 | $ | 14.99 |
5
|
$ 539
|
||||||
The stock option transactions are
valued using the Black-Scholes model with the following
assumptions:
|
As
of December 31,
|
||||||||||||
|
2009
|
2008
|
2007
|
||||||||||
|
Expected
life
|
7
years
|
8
years
|
7
years
|
|||||||||
|
Discount
rate
|
3.53% | 2.94% | 3.97% | |||||||||
|
Volatility
|
137.86% | 127.20% | 42.84% | |||||||||
|
Dividend
yield
|
20.33% | 33.94% | 17.62% | |||||||||
The estimated fair value of each option
granted at December 31, 2009 and 2008 was $.897 and $0.149,
respectively. For the years ended December 31, 2009, 2008 and 2007,
the components of equity compensation expense were as follows (in
thousands):
|
December
31,
|
||||||||||||
|
2009
|
2008
|
2007
|
||||||||||
|
Options
granted to Manager and non-employees
|
$ | 15 | $ | (52 | ) | $ | (91 | ) | ||||
|
Restricted
shares granted to Manager and non-employees
|
1,113 | 486 | 1,582 | |||||||||
|
Restricted
shares granted to non-employee directors
|
112 | 106 | 74 | |||||||||
|
Total
equity compensation expense
|
$ | 1,240 | $ | 540 | $ | 1,565 | ||||||
During the year ended December 31, 2009
and 2008, the Manager received 169,431 and 60,078 shares as incentive
compensation valued $867,000 and $341,000 pursuant to the Management
Agreement. The incentive management fee is paid one quarter in
arrears.
Apart from incentive compensation
payable under the Management Agreement, the Company has established no formal
criteria for equity awards as of December 31, 2009. All awards are
discretionary in nature and subject to approval by the compensation committee of
the board of directors.
RESOURCE
CAPITAL CORP. AND SUBSIDIARIES
NOTES
TO CONSOLIDATED FINANCIAL STATEMENTS – (continued)
DECEMBER
31, 2009
NOTE
12 –EARNINGS PER SHARE
The following table presents a
reconciliation of basic and diluted earnings per share for the periods presented
as follows (in thousands, except share and per share amounts):
|
December
31,
|
||||||||||||
|
2009
|
2008
|
2007
|
||||||||||
|
Basic:
|
||||||||||||
|
Net Income (loss)
|
$ | 6,339 | $ | (3,074 | ) | $ | 8,890 | |||||
|
Weighted average number of shares
outstanding
|
25,205,403 | 24,757,386 | 24,610,468 | |||||||||
|
Basic net income (loss) per
share
|
$ | 0.25 | $ | (0.12 | ) | $ | 0.36 | |||||
|
Diluted:
|
||||||||||||
|
Net Income (loss)
|
$ | 6,339 | $ | (3,074 | ) | $ | 8,890 | |||||
|
Weighted average number of shares
outstanding
|
25,205,403 | 24,757,386 | 24,610,468 | |||||||||
|
Additional shares due to assumed
conversion of dilutive
instruments
|
150,418 | − | 249,716 | |||||||||
|
Adjusted weighted-average number
of common shares
outstanding
|
25,355,821 | 24,757,386 | 24,860,184 | |||||||||
|
Diluted net income (loss) per
share
|
$ | 0.25 | $ | (0.12 | ) | $ | 0.36 | |||||
Potentially dilutive shares relating to
253,975 shares of restricted stock are not included in the calculation of
diluted net (loss) per share for the year ended December 31, 2008 because the
effect was anti-dilutive.
NOTE
13 – THE MANAGEMENT AGREEMENT
On March 8, 2005, the Company entered
into a Management Agreement pursuant to which the Manager provides the Company
investment management, administrative and related services. The
agreement was amended June 30, 2008 and further amended on October 16,
2009. Under the agreement, the Manager receives fees and is
reimbursed for its expenses as follows:
|
|
·
|
A
monthly base management fee equal to 1/12th of the amount of The Company’s
equity multiplied by 1.50%. Under the management agreement,
‘‘equity’’ is equal to the net proceeds from any issuance of shares of
common stock less offering related costs, plus or minus the Company’s
retained earnings (excluding non-cash equity compensation incurred in
current or prior periods) less any amounts we have paid for common stock
repurchases. The calculation is adjusted for one-time events
due to changes in GAAP, as well as other non-cash charges, upon approval
of independent directors of the
Company.
|
|
|
·
|
Incentive
compensation calculated as follows: (i) twenty-five percent
(25%) of the dollar amount by which (A) the Company’s Adjusted
Operating Earnings (before Incentive Compensation but after the Base
Management Fee) for such quarter per Common Share (based on the weighted
average number of Common Shares outstanding for such quarter) exceeds
(B) an amount equal to (1) the weighted average of the price per
share of the Common Shares in the initial offering by the Company and the
prices per share of the Common Shares in any subsequent offerings by the
Company, in each case at the time of issuance thereof, multiplied by
(2) the greater of (a) 2.00% and (b) 0.50% plus one-fourth
of the Ten Year Treasury Rate for such quarter, multiplied by
(ii) the weighted average number of Common Shares outstanding during
such quarter subject to adjustment; to exclude events pursuant to changes
in GAAP or the application of GAAP, as well as non-recurring or unusual
transactions or events, after discussion between the Manager and the
Independent Directors and approval by a majority of the Independent
Directors in the case of non-recurring or unusual transactions or
events.
|
|
|
·
|
Reimbursement
of out-of-pocket expenses and certain other costs incurred by the Manager
that relate directly to the Company and its
operations.
|
|
|
·
|
The
Manager provides the Company with a Chief Financial Officer and three
accounting professionals, each of whom is exclusively dedicated to the
Company’s operations. The Manager also provides the Company with a
director of investor relations who is 50% dedicated to the Company’s
operations. The Company bears the expense of the wages, salaries and
benefits of the Chief Financial Officer and three accounting
professionals, and bears 50% of the salary and benefits of the director of
investor relations.
|
RESOURCE
CAPITAL CORP. AND SUBSIDIARIES
NOTES
TO CONSOLIDATED FINANCIAL STATEMENTS – (continued)
DECEMBER
31, 2009
NOTE
13 – THE MANAGEMENT AGREEMENT – (continued)
Incentive compensation is paid
quarterly. Up to 75% of the incentive compensation is paid in cash
and at least 25% is paid in the form of an award of common stock. The
Manager may elect to receive more than 25% of its incentive compensation in
common stock. All shares are fully vested upon
issuance. However, the Manager may not sell such shares for one year
after the incentive compensation becomes due and payable. Shares
payable as incentive compensation are valued as follows:
|
|
·
|
if
such shares are traded on a securities exchange, at the average of the
closing prices of the shares on such exchange over the thirty day period
ending three days prior to the issuance of such
shares;
|
|
|
·
|
if
such shares are actively traded over-the-counter, at the average of the
closing bid or sales price as applicable over the thirty day period ending
three days prior to the issuance of such shares;
and
|
|
|
·
|
if
there is no active market for such shares, the value shall be the fair
market value thereof, as reasonably determined in good faith by the board
of directors of the Company.
|
As amended, the Management Agreement
had an initial term ended March 31, 2009 and automatically renewed for a
one-year term annually unless at least two-thirds of the independent directors
or a majority of the outstanding common shares agreed to not automatically renew
such Management Agreement. The current term of the Management Agreement
ends on March 31, 2010. With a two-thirds vote of the independent
directors, the independent directors may elect to terminate the Management
Agreement because of the following:
|
|
·
|
unsatisfactory
performance; and/or
|
|
|
·
|
unfair
compensation payable to the Manager where fair compensation cannot be
agreed upon by the Company (pursuant to a vote of two-thirds of the
independent directors) and the
Manager.
|
In the event that the Management
Agreement is terminated based on the above provisions, the Company must pay the
Manager a termination fee equal to four times the sum of the average annual base
management fee and the average annual incentive during the two 12-month periods
immediately preceding the date of such termination. The Company is
also entitled to terminate the Management Agreement for cause (as defined
therein) without payment of any termination fee.
In conjunction with the December 2009
common stock offering, it was determined that for the quarters ending on
December 31, 2009 and March 31, 2010, the total incentive management fee payable
to the Manager pursuant to the Amended and Restated Management Agreement dated
as of June 30, 2008, shall not exceed $1.5 million per quarter.
The base management fee for the years
ended December 31, 2009, 2008 and 2007 was $3.8 million, $4.5 million and $5.1
million, respectively. The manager earned an incentive management fee
of $4.6 million of which $3.4 million was paid in cash and $1.2 million was paid
in stock (217,149 shares) for the period from January 1, 2009 to December 31,
2009. The manager earned an incentive management fee of $1.8 million
of which $1.3 million was paid in cash and $440,000 was paid in stock (86,489
shares) for the period from January 1, 2008 to December 31, 2008. The
manager earned an incentive management fee of $1.5 million of which $924,000 was
paid in cash and $551,000 was paid in stock (37,543 shares) for the period from
January 1, 2007 to December 31, 2007.
At December 31, 2009, the Company was
indebted to the Manager for base management fees of $371,000 incentive
management fees of $1.5 million and expense reimbursements of
$129,000. At December 31, 2008, the Company was indebted to the
Manager for base management fees of $725,000, incentive management fees of
$397,000 and expense reimbursements of $73,000. These amounts are
included in accounts payable and other liabilities.
NOTE
14 – RELATED-PARTY TRANSACTIONS
Relationship
with Resource America and Certain of its Subsidiaries
At December 31, 2009, Resource America,
owned 2,192,009 shares, or 6.0%, of the Company’s outstanding common
stock. In addition, Resource America holds 2,166 options to purchase
common stock.
RESOURCE
CAPITAL CORP. AND SUBSIDIARIES
NOTES
TO CONSOLIDATED FINANCIAL STATEMENTS – (continued)
DECEMBER
31, 2009
NOTE
14 – RELATED-PARTY TRANSACTIONS – (continued)
Relationship
with Resource America and Certain of its Subsidiaries – (continued)
The Company is managed by the Manager
pursuant to the management agreement that provides for both base and incentive
management fees. For the years ended December 31, 2009, 2008 and
2007, the Manager earned base management fees of approximately $3.8 million $4.5
million and $5.1 million, respectively, and earned $4.6 million, $1.8 million
and $1.5 million, respectively, of incentive management fees. The
Company also reimburses the Manager and Resource America for expenses and
employees of Resource America who perform legal, accounting, due diligence and
other services that outside professionals or consultants would otherwise
perform. On October 16, 2009, the Company entered into an amendment
to the management agreement. Pursuant to the amendment, the Manager
must provide the Company with a Chief Financial Officer and three accounting
professionals, each of whom will be exclusively dedicated to the operations of
the Company. The Manager must also provide the Company with a
director of investor relations who will be 50% dedicated to the Company’s
operations. The Company will bear the expense of the wages, salaries
and benefits of the Chief Financial Officer and three accounting professionals
and 50% of the salary and benefits of the director of investor
relations. For the years ended December 31, 2009, 2008 and 2007, the
Company paid the Manager $664,000, $392,000 and $507,000, respectively, as
expense reimbursements. For a description of the management agreement
and fees paid and payable to the Manager (see Note 13).
At December 31, 2009, the Company was
indebted to the Manager for base management fees of $371,000, incentive
management fees of $1.5 million and expense reimbursements of
$129,000. At December 31, 2008, the Company was indebted to the
Manager for base management fees of $725,000, incentive management fees of
$397,000 and expense reimbursements of $73,000.
As of each of December 31, 2009 and
2008, the Company had executed six CDO transactions. These CDO
transactions were structured for the Company by the Manager, but, under the
management agreement the Manager was not separately compensated by the Company
for these transactions.
On May
14, 2009, the Company borrowed $4.5 million from Resource
America. The Company repaid the promissory note the same day and paid
Resource America a commitment fee of $180,000.
On
December 1, 2009, The Company purchased a membership interest in RRE VIP
Borrower, LLC (an unconsolidated VIE that holds the Company’s interests in a
real estate joint venture) from Resource America at book value. This joint
venture, which is structured as a credit facility with Varde Investment
Partners, LP acting as lender, finances the acquisition of distressed properties
and mortgage loans and has the objective of repositioning both the directly
owned properties and the properties underlying the mortgage loans to
enhance their value. The Company acquired the membership interests for
$2.1 million. The agreement requires the Company to contribute 3% of
the total funding required for each asset acquisition on a monthly
basis. The investment balance of $2.1 million at December 31, 2009 is
recorded as an investment in unconsolidated entities on our consolidated balance
sheet.
On June
30, 2009, the Company sold its sole membership interest in one of its
subsidiaries that held a pool of leases valued at $89.8 million and transferred
the $82.3 million balance of the related secured term facility to Resource
America. No gain or loss was recognized on the sale of this
membership interest. The Company received a note of $7.5 million from
Resource America for the equity in the portfolio on June 30,
2009. The promissory note bore interest at LIBOR plus
3%. On July 1, 2009, $4.5 million of the promissory note was
repaid. The remaining outstanding principal balance of the note of
$3.0 million was paid in full on August 3, 2009.
Relationship
with LEAF
LEAF Financial Corp. (“LEAF”), a
majority-owned subsidiary of Resource America, originates and manages equipment
leases and notes on the Company’s behalf. The Company purchases its
equipment leases and notes from LEAF at a price equal to their book value plus a
reimbursable origination cost not to exceed 1% to compensate LEAF for its
origination costs. During the year ended December 31, 2009, the
Company did not acquire any equipment lease and note investments from
LEAF. During the year ended December 31, 2008, the Company acquired
$42.5 million of equipment lease and note investments from LEAF, including
$425,000 of origination cost reimbursements. In addition, the Company
pays LEAF an annual servicing fee, equal to 1% of the book value of managed
assets, for servicing the Company’s equipment leases and notes. At
December 31, 2009 and 2008, the Company was indebted to LEAF for servicing fees
in connection with the Company’s equipment finance portfolio of $8,000 and
$172,000, respectively. LEAF servicing fees for the years ended
December 31, 2009, 2008 and 2007 were $505,000, $953,000 and $810,000,
respectively.
RESOURCE
CAPITAL CORP. AND SUBSIDIARIES
NOTES
TO CONSOLIDATED FINANCIAL STATEMENTS – (continued)
DECEMBER
31, 2009
NOTE
14 – RELATED-PARTY TRANSACTIONS – (continued)
Relationship
with Resource Real Estate
Resource Real Estate, a subsidiary of
Resource America, originates, finances and manages the Company’s commercial real
estate loan portfolio, including whole loans, A notes, B notes and mezzanine
loans. The Company reimburses Resource Real Estate for loan
origination costs associated with all loans originated. At December
31, 2009, the Company had no indebtedness to Resource Real Estate for loan
origination costs in connection with the Company’s commercial real estate loan
portfolio. At December 31, 2008, the Company was indebted to Resource
Real Estate for loan origination costs in connection with the Company’s
commercial real estate loan portfolio for $24,000.
Relationship
with Law Firm
Until 1996, director Edward E. Cohen, a
director who was the Company’s Chairman from its inception until November 2009,
was of counsel to Ledgewood, P.C., a law firm. In addition, one of the
Company’s executive officers, Jeffrey F. Brotman, was employed by Ledgewood
until 2007. For the years ended December 31, 2009, 2008 and 2007, the
Company paid Ledgewood $660,000, $164,000 and $361,000,
respectively. Mr. Cohen receives certain debt service payments from
Ledgewood related to the termination of his affiliation with Ledgewood and its
redemption of his interest in the firm. Mr. Brotman also receives certain
debt service payments from Ledgewood related to the termination of his
affiliation with Ledgewood.
NOTE
15 – DISTRIBUTIONS
In order to qualify as a REIT, the
Company must currently distribute at least 90% of its taxable
income. In addition, the Company must distribute 100% of its taxable
income in order not to be subject to corporate federal income taxes on retained
income. The Company anticipates it will distribute substantially all
of its taxable income to its stockholders. Because taxable income
differs from cash flow from operations due to non-cash revenues or expenses
(such as depreciation and provisions for loan and lease losses), in certain
circumstances, the Company may generate operating cash flow in excess of its
distributions or, alternatively, may be required to borrow to make sufficient
distribution payments.
The Company’s 2010 dividends will be
determined by the Company’s board which will also consider the composition of
any dividends declared, including the option of paying a portion in cash and the
balance in additional common shares. Generally, dividends payable in
stock are not treated as dividends for purposes of the deduction for dividends,
or as taxable dividends to the recipient. The Internal Revenue
Service, in Revenue Procedures 2009-15 and 2010-12, has given guidance with
respect to certain stock distributions by publicly traded
REITs. These Revenue Procedures apply to distributions made on or
after January 1, 2008 and declared with respect to a taxable year ending on or
before December 31, 2011. They provide that publicly-traded REITs can
distribute stock (common shares in the Company’s case) to satisfy their REIT
distribution requirements if stated conditions are met. These
conditions include that at least 10% of the aggregate declared distributions be
paid in cash and the shareholders be permitted to elect whether to receive cash
or stock, subject to the limit set by the REIT on the cash to be distributed in
the aggregate to all shareholders. The Company did not use these
Revenue Procedures with respect to any distributions for its 2008 and 2009
taxable years, but may do so for distributions with respect to 2010 and
2011.
During the year ended December 31,
2009, the Company declared and paid distributions totaling $31.8 million, or
$1.15 per share. This includes $9.2 million, in the aggregate,
declared on December 14, 2009 and paid on January 26, 2010 to stockholders of
record as of December 31, 2009. During the year ended December 31,
2008, the Company declared and paid distributions totaling $40.7 million, or
$1.60 per share. During the year ended December 31, 2007, the Company
declared and paid distributions totaling $40.7 million, or $1.62 per
share. For tax purposes, 100% of the distributions declared in 2009,
2008 and 2007 have been classified as ordinary income.
RESOURCE
CAPITAL CORP. AND SUBSIDIARIES
NOTES
TO CONSOLIDATED FINANCIAL STATEMENTS – (continued)
DECEMBER
31, 2009
NOTE
16 – FAIR VALUE OF FINANCIAL INSTRUMENTS
The Company follows the fair value
hierarchy which requires an entity to maximize the use of observable inputs and
minimize the use of unobservable inputs when measuring fair
value. The Company determines fair value based on quoted prices when
available or, if quoted prices are not available, through the use of alternative
approaches, such as discounting the expected cash flows using market interest
rates commensurate with the credit quality and duration of the
investment. The hierarchy followed defines three levels of inputs
that may be used to measure fair value:
Level 1 - Quoted prices in
active markets for identical assets and liabilities that the reporting entity
has the ability to access at the measurement date.
Level 2 - Inputs other than
quoted prices included within Level 1 that are observable for the asset and
liability or can be corroborated with observable market data for substantially
the entire contractual term of the asset or liability.
Level 3 - Unobservable inputs
that reflect the entity’s own assumptions about the assumptions that market
participants would use in the pricing of the asset or liability and are
consequently not based on market activity, but rather through particular
valuation techniques.
The determination of where an asset or
liability falls in the hierarchy requires significant judgment. The
Company evaluates its hierarchy disclosures each quarter; depending on various
factors, it is possible that an asset or liability may be classified differently
from quarter to quarter. However, the Company expects that changes in
classifications between levels will be rare.
Certain assets and liabilities are
measured at fair value on a recurring basis. The following is a
discussion of these assets and liabilities as well as the valuation techniques
applied to each for fair value measurement.
The Company classifies all of its
investment securities as available-for-sale and reports them at fair value which
for the Company’s positions purchased in 2009 is based on dealer quotes due to
their higher ratings and more active markets and for the Company’s positions
purchased prior to 2009 is based on taking a weighted average of the following
three measures:
|
|
·
|
an
income approach utilizing an appropriate current risk-adjusted yield, time
value and projected estimated losses from default assumptions based on
analysis of underlying loan
performance;
|
|
|
·
|
quotes
on similar-vintage, higher rate, more actively traded commercial
mortgage-backed securities (“CMBS”) adjusted as appropriate for the lower
subordination level of the Company’s securities;
and
|
|
|
·
|
dealer
quotes on the Company’s securities for which there is not an active
market.
|
Derivatives (interest rate swap
contracts), both assets and liabilities, are valued by a third-party pricing
agent using an income approach and utilizing models that use as their primary
basis readily observable market parameters. This valuation process
considers factors including interest rate yield curves, time value, credit
factors and volatility factors. Although the Company has determined
that the majority of the inputs used to value its derivatives fall within
Level 2 of the fair value hierarchy, the credit valuation adjustments
associated with its derivatives utilize Level 3 inputs, such as estimates
of current credit spreads, to evaluate the likelihood of default by the Company
and its counterparties. The Company has assessed the significance of
the impact of the credit valuation adjustments on the overall valuation of its
derivative positions and has determined that the credit valuation adjustments
are not significant to the overall valuation of its derivatives. As a
result, the Company has determined that its derivative valuations in their
entirety are classified in Level 2 of the fair value
hierarchy.
The following table presents
information about the Company’s assets (including derivatives that are presented
net) measured at fair value on a recurring basis as of December 31, 2009 and
indicates the fair value hierarchy of the valuation techniques utilized by the
Company to determine such fair value.
|
Level
1
|
Level
2
|
Level
3
|
Total
|
|||||||||||||
|
Assets:
|
||||||||||||||||
|
Investment securities
available-for-sale
|
$ | − | $ | − | $ | 44,542 | $ | 44,542 | ||||||||
|
Total assets at fair value
|
$ | − | $ | − | $ | 44,542 | $ | 44,542 | ||||||||
|
Liabilities:
|
||||||||||||||||
|
Derivatives (net)
|
$ | − | $ | 12,767 | $ | − | $ | 12,767 | ||||||||
|
Total liabilities at fair
value
|
$ | − | $ | 12,767 | $ | − | $ | 12,767 | ||||||||
RESOURCE
CAPITAL CORP. AND SUBSIDIARIES
NOTES
TO CONSOLIDATED FINANCIAL STATEMENTS – (continued)
DECEMBER
31, 2009
NOTE
16 – FAIR VALUE OF FINANCIAL INSTRUMENTS − (continued)
The following table presents additional
information about assets which are measured at fair value on a recurring basis
for which the Company has utilized Level 3 inputs.
|
Level
3
|
||||
|
Beginning
balance, January 1, 2009
|
$ | 29,260 | ||
|
Total
gains or losses (realized/unrealized):
|
||||
|
Included in earnings
|
(10,956 | ) | ||
|
Purchases
|
26,967 | |||
|
Unrealized losses – included in
accumulated other comprehensive income
|
(729 | ) | ||
|
Ending
balance, December 31, 2009
|
$ | 44,542 | ||
The Company had $12.6 million of losses
included in earnings due to the other-than-temporary impairment charges of three
assets during the year ended December 31, 2009. These losses are
included in the consolidated statement of operations as net impairment losses
recognized in earnings.
Loans held for sale consist of bank
loans identified for sale due to credit issues. Interest on loans held for
sale is recognized according to the contractual terms of the loan and included
in interest income on loans. The fair value of loans held for sale and
impaired loans is based on what secondary markets are currently offering for
these loans. As such, the Company classifies loans held for sale and
impaired loans as recurring Level 2. The amount of the adjustment for fair
value for loans held for sale for the year ended December 31, 2009 was $15.2
million and is included in the consolidated statement of operations as provision
for loan and lease loss. For loans where there is no market, the
loans are measured using cash flows and other valuation techniques and these loans are
classified as nonrecurring Level 3. The amount of nonrecurring fair value
losses for impaired loans for the year ended December 31, 2009 was $45.7 million
and is included in the consolidated statement of operations as provision for
loan and lease loss.
The
following table summarizes the financial assets and liabilities measured at fair
value on a nonrecurring basis as of December 31, 2009 and indicates the fair
value hierarchy of the valuation techniques utilized by the Company to determine
such fair value.
|
Level
1
|
Level
2
|
Level
3
|
Total
|
|||||||||||||
|
Assets:
|
||||||||||||||||
|
Loans held for sale
|
$ | − | $ | 8,050 | $ | − | $ | 8,050 | ||||||||
|
Securities
held-to-maturity
|
− | 925 | − | 925 | ||||||||||||
|
Impaired loans
|
− | 3,195 | 102,793 | 105,988 | ||||||||||||
|
Total assets at fair value
|
$ | − | $ | 12,170 | $ | 102,793 | $ | 114,963 | ||||||||
The Company is required to disclose the
fair value of financial instruments for which it is practicable to estimate that
value. The fair value of short-term financial instruments such as
cash and cash equivalents, restricted cash, interest receivable, other assets,
repurchase agreements, warehouse lending facilities and accrued interest expense
approximates their carrying value on the consolidated balance
sheet. The fair value of the Company’s investment securities
available-for-sale is reported in Note 5. The fair value of
the Company’s derivative instruments is reported in Note 17.
The fair values of the Company’s
remaining financial instruments that are not reported at fair value on the
consolidated statement of financial position are reported below.
|
Fair Value of Financial
Instruments
|
||||||||||||||||
|
(in
thousands)
|
||||||||||||||||
|
December
31, 2009
|
December
31, 2008
|
|||||||||||||||
|
Carrying
value
|
Fair
value
|
Carrying
value
|
Fair
value
|
|||||||||||||
|
Investment
securities held-to-maturity
|
$ | 31,401 | $ | 21,320 | $ | 28,157 | $ | 4,818 | ||||||||
|
Loans
held-for-investment
|
$ | 1,558,687 | $ | 1,515,626 | $ | 1,684,622 | $ | 1,033,109 | ||||||||
|
CDOs
|
$ | 1,484,952 | $ | 857,262 | $ | 1,535,389 | $ | 690,926 | ||||||||
|
Junior
subordinated notes
|
$ | 51,548 | $ | 18,042 | $ | 51,548 | $ | 10,310 | ||||||||
RESOURCE
CAPITAL CORP. AND SUBSIDIARIES
NOTES
TO CONSOLIDATED FINANCIAL STATEMENTS – (continued)
DECEMBER
31, 2009
NOTE
17 – INTEREST RATE RISK AND DERIVATIVE INSTRUMENTS
A significant market risk to the
Company is interest rate risk. Interest rates are highly sensitive to
many factors, including governmental monetary and tax policies, domestic and
international economic and political considerations and other factors beyond the
Company’s control. Changes in the general level of interest rates can
affect net interest income, which is the difference between the interest income
earned on interest-earning assets and the interest expense incurred in
connection with the interest-bearing liabilities, by affecting the spread
between the interest-earning assets and interest-bearing
liabilities. Changes in the level of interest rates also can affect
the value of the Company’s interest-earning assets and the Company’s ability to
realize gains from the sale of these assets. A decline in the value
of the Company’s interest-earning assets pledged as collateral for borrowings
could result in the counterparties demanding additional collateral pledges or
liquidation of some of the existing collateral to reduce borrowing
levels.
The Company seeks to manage the extent
to which net income changes as a function of changes in interest rates by
matching adjustable-rate assets with variable-rate borrowings. During
periods of changing interest rates, interest rate mismatches could negatively
impact the Company’s consolidated financial condition, consolidated results of
operations and consolidated cash flows. In addition, the Company
mitigates the potential impact on net income of periodic and lifetime coupon
adjustment restrictions in its investment portfolio by entering into interest
rate hedging agreements such as interest rate caps and interest rate
swaps.
In the next twelve months, the Company
expects to reclassify $387,000 from accumulated other comprehensive loss to
earnings. The amount relates to the termination of 18 hedges during
the years ended December 31, 2006, 2007 and 2008 and the requirement for the
remaining gains and losses to be amortized over the life of the remaining
debt. In addition, in the next twelve months, the Company expects to
pay $8.4 million in net interest expense for its hedges.
During the years ended December 31,
2009, 2008 and 2007, the Company recognized expense of $499,000, expense of
$211,000 and income of $169,000, respectively, into earnings related to the
amortization of gains and losses on 18 terminated hedges.
At December 31, 2009, the Company had
13 interest rate swap contracts outstanding whereby the Company paid an average
fixed rate of 5.18% and received a variable rate equal to one-month
LIBOR. The aggregate notional amount of these contracts was $217.9
million at December 31, 2009. In addition, the Company also has one
interest rate cap agreement with an aggregate notional amount of $14.8 million
outstanding whereby it reduced its exposure to variability in future cash flows
attributable to LIBOR. The interest rate cap is a non-designated cash
flow hedge and, as a result, the change in fair value is recorded through the
consolidated statements of operations. The counterparty for all the
Company’s designated interest rate hedge contracts are with Credit Suisse
International for which we have a master netting agreement.
At December 31, 2008, the Company had
31 interest rate swap contracts outstanding whereby the Company will paid an
average fixed rate of 5.07% and received a variable rate equal to one-month
LIBOR. The aggregate notional amount of these contracts was $325.0
million at December 31, 2008.
The estimated fair value of the
Company’s interest rate swaps was ($12.8) million and ($31.6) million as of
December 31, 2009 and 2008, respectively. The Company had aggregate
unrealized losses of $14.6 million and $33.8 million on the interest rate swap
agreements, as of December 31, 2009 and 2008, respectively, which is recorded in
accumulated other comprehensive loss. In connection with the August
2006 close of RREF CDO 2006-1, the Company realized a swap termination loss of
$119,000, which is being amortized over the maturity of RREF CDO
2006-1. The amortization is reflected in interest expense in the
Company’s consolidated statements of operations. In connection with
the June 2007 close of RREF CDO 2007-1, the Company realized a swap termination
gain of $2.6 million, which is being amortized over the maturity of RREF CDO
2007-1. The accretion is reflected in interest expense in the
Company’s consolidated statements of operations. In connection with
the termination of a $53.6 million swap related to RREF CDO 2006-1 during the
nine months ended September 30, 2008, the Company realized a swap termination
loss of $4.2 million, which is being amortized over the maturity of a new $45.0
million swap. The amortization is reflected in interest expense in
the Company’s consolidated statements of operations. In connection
with the payoff of a fixed-rate commercial real estate loan during the three
months ended September 30, 2008, the Company terminated a $12.7 million swap and
realized a $574,000 swap termination loss, which is being amortized over the
maturity of the terminated swap. The amortization is reflected in
interest expense in the Company’s consolidated statements of
operations.
RESOURCE
CAPITAL CORP. AND SUBSIDIARIES
NOTES
TO CONSOLIDATED FINANCIAL STATEMENTS – (continued)
DECEMBER
31, 2009
NOTE
17 – INTEREST RATE RISK AND DERIVATIVE INSTRUMENTS – (continued)
The following tables present the fair
value of the Company’s derivative financial instruments as well as their
classification on the balance sheet as of December 31, 2009 and on the
consolidated statement of operations for the year ended December 31,
2009:
|
Fair
Value of Derivative Instruments as of December 31, 2009
(in
thousands)
|
|||||||||
|
Liability
Derivatives
|
|||||||||
|
Notional
Amount
|
Balance
Sheet Location
|
Fair
Value
|
|||||||
|
Derivatives
not designated as hedging instruments
under SFAS 133
|
|||||||||
|
Interest
rate cap agreement
|
$ | 14,841 |
Derivatives,
at fair value
|
$ | 45 | ||||
|
Derivatives
designated as hedging instruments
under SFAS 133
|
|||||||||
|
Interest
rate swap contracts
|
$ | 217,907 |
Derivatives,
at fair value
|
$ | (12,812 | ) | |||
|
Accumulated
other comprehensive loss
|
$ | 12,812 | |||||||
|
The
Effect of Derivative Instruments on the Statement of Operations for
the
Year
Ended December 31, 2009
(in
thousands)
|
|||||||||
|
Liability
Derivatives
|
|||||||||
|
Notional
Amount
|
Statement
of Operations Location
|
Unrealized
Loss
(1)
|
|||||||
|
Derivatives
not designated as hedging instruments
under SFAS 133
|
|||||||||
|
Interest
rate cap agreement
|
$ | 14,841 |
Interest
expense
|
$ | 89 | ||||
(1) Negative values indicate a decrease to the associated balance sheet or consolidated statement of operations line items.
NOTE
18 – STOCK INCENTIVE PLANS
Upon formation of the Company, the 2005
Stock Incentive Plan (the “2005 Plan”) was adopted for the purpose of attracting
and retaining executive officers, employees, directors and other persons and
entities that provide services to the Company. The 2005 Plan
authorizes the issuance of up to 1,533,333 shares of common stock in the form of
options to purchase common stock, stock awards, performance shares and stock
appreciation rights.
In July 2007, the Company’s
shareholders approved the 2007 Omnibus Equity Compensation Plan (the “2007
Plan”). The 2007 Plan authorizes the issuance of up to 2,000,000
shares of common stock in the form of options to purchase common stock, stock
awards, performance shares and stock appreciation rights.
NOTE
19 – INCOME TAXES
The Company has made an election to be
taxed, and believes it qualifies, as a REIT under Sections 856 through 860 of
the Code. To maintain REIT status for federal income tax purposes,
the Company is generally required to distribute at least 90% of its REIT taxable
income to its shareholders as well as comply with certain other qualification
requirements as defined under the Code. Accordingly, the Company is
not subject to federal corporate income tax to extent that it distributes 100%
of its REIT taxable income each year. Taxable income from non-REIT
activities managed through Resource TRS, the Company's taxable REIT subsidiary,
is subject to federal, state and local income taxes.
RESOURCE
CAPITAL CORP. AND SUBSIDIARIES
NOTES
TO CONSOLIDATED FINANCIAL STATEMENTS – (continued)
DECEMBER
31, 2009
NOTE
19 – INCOME TAXES – (continued)
Resource TRS' income taxes are
accounted for under the asset and liability method. Under this
method, deferred income taxes are recognized for the temporary differences
between the financial reporting basis and tax basis of Resource TRS' assets and
liabilities.
The following table details the
components of Resource TRS’ income taxes (in thousands):
|
Years
Ended December 31,
|
||||||||||||
|
2009
|
2008
|
2007
|
||||||||||
|
(Benefit)
provision for income taxes:
|
||||||||||||
|
Current:
|
||||||||||||
|
Federal
|
$ | (325 | ) | $ | (331 | ) | $ | 354 | ||||
|
State
|
− | (25 | ) | 119 | ||||||||
|
Deferred
|
323 | 115 | (135 | ) | ||||||||
|
Income
tax (benefit) provision
|
$ | (2 | ) | $ | (241 | ) | $ | 338 | ||||
The components of Resource TRS’
deferred tax assets and liabilities are as follows (in thousands):
|
December
31,
|
|||||||||
|
2009
|
2008
|
||||||||
|
Deferred
tax assets related to:
|
|||||||||
|
Foreign, state and local loss
carryforwards
|
$ | 703 | $ | 303 | |||||
|
Provision for loan and lease
losses
|
521 | 206 | |||||||
|
Total deferred tax assets
|
1,224 | 509 | |||||||
|
Valuation allowance
|
(1,224 | ) | − | ||||||
|
Total deferred tax assets
|
$ | − | $ | 509 | |||||
|
Deferred
tax liabilities related to:
|
|||||||||
|
Property and equipment basis
differences
|
$ | − | $ | (186 | ) | ||||
|
Total deferred tax
liabilities
|
$ | − | $ | (186 | ) | ||||
Apidos CDO I, Apidos CDO III and Apidos
Cinco CDO, the Company’s foreign TRSs, are organized as exempted companies
incorporated with limited liability under the laws of the Cayman Islands, and
are generally exempt from federal and state income tax at the corporate level
because their activities in the United States are limited to trading in stock
and securities for their own account. Therefore, despite their status
as taxable REIT subsidiaries, they generally will not be subject to corporate
tax on their earnings and no provision for income taxes is required; however,
because they are “controlled foreign corporations,” the Company will generally
be required to include Apidos CDO I’s, Apidos CDO III’s and Apidos Cinco CDO’s
current taxable income in its calculation of REIT taxable income.
Effective January 1, 2007, the Company
adopted the provisions of FASB’s guidance for uncertain tax
positions. This implementation did not have an impact on the
Company’s balance sheet or results of operations. The guidance
prescribes that a tax position should only be recognized if it is more likely
than not that the position will be sustained upon examination by the appropriate
taxing authority. A tax position that meets this threshold is
measured as the largest amount of benefit that is greater than 50 percent likely
of being realized upon ultimate settlement. The Company is required
to disclose its accounting policy for classifying interest and penalties, the
amount of interest and penalties charged to expense each period as well as the
cumulative amounts recorded in the consolidated balance sheets. The
Company will continue to classify any tax penalties as other operating expenses
and any interest as interest expense. The Company does not have any
unrecognized tax benefits that would affect the Company’s financial
position.
As of December 31, 2009, income tax
returns for the calendar years 2006 - 2009 remain subject to examination by
Internal Revenue Service ("IRS") and/or any state or local taxing
jurisdiction. The Company has not executed any agreements with the
IRS or any state and/or local taxing jurisdiction to extend a statue of
limitations in relation to any previous year.
RESOURCE
CAPITAL CORP. AND SUBSIDIARIES
NOTES
TO CONSOLIDATED FINANCIAL STATEMENTS – (continued)
DECEMBER
31, 2009
NOTE
20 – QUARTERLY RESULTS
The following is a presentation of the
quarterly results of operations for the years ended December 31, 2009 and
2008:
|
March
31
|
June
30
|
September
30
|
December
31
|
|||||||||||||
|
(unaudited)
|
(unaudited)
|
(unaudited)
|
(unaudited)
|
|||||||||||||
|
(in
thousands, except per share data)
|
||||||||||||||||
|
Year ended December 31,
2009
|
||||||||||||||||
|
Interest
income
|
$ | 26,622 | $ | 25,274 | $ | 22,501 | $ | 23,196 | ||||||||
|
Interest
expense
|
13,877 | 12,748 | 9,203 | 9,599 | ||||||||||||
|
Net
interest income
|
$ | 12,745 | $ | 12,526 | $ | 13,298 | $ | 13,597 | ||||||||
|
Net
income (loss)
|
$ | (12,152 | ) | $ | (5,127 | ) | $ | 11,528 | $ | 12,090 | ||||||
|
Net
income (loss) per share − basic
|
$ | (0.50 | ) | $ | (0.21 | ) | $ | 0.48 | $ | 0.43 | ||||||
|
Net
income (loss) per share − diluted
|
$ | (0.50 | ) | $ | (0.21 | ) | $ | 0.47 | $ | 0.43 | ||||||
|
Year ended December 31,
2008
|
||||||||||||||||
|
Interest
income
|
$ | 36,983 | $ | 32,258 | $ | 32,312 | $ | 32,788 | ||||||||
|
Interest
expense
|
23,148 | 18,924 | 18,664 | 18,883 | ||||||||||||
|
Net
interest income
|
$ | 13,835 | $ | 13,334 | $ | 13,648 | $ | 13,905 | ||||||||
|
Net
income (loss)
|
$ | 9,363 | $ | (5,257 | ) | $ | 88 | $ | (7,268 | ) | ||||||
|
Net
income (loss) per share − basic
|
$ | 0.38 | $ | (0.21 | ) | $ | 0.00 | $ | (0.29 | ) | ||||||
|
Net
income (loss) per share − diluted
|
$ | 0.38 | $ | (0.21 | ) | $ | 0.00 | $ | (0.29 | ) | ||||||
NOTE
21 – SUBSEQUENT EVENTS
On March 5, 2010, the Company entered
into a Promissory Note with LEASE Equity Appreciation Fund II LP (“LEAF II”),
that allows for an $8.0 million facility, of which $3.0 million was funded on
March 5, 2010, for a one year term at 12% payable quarterly, with a 1% loan fee
and 20% amortization, which is secured by the all encumbered assets of LEAF II
and to be fully repaid by March 3, 2011.
The Company received $10.5 million in
proceeds related to the issuance of 1,986,554 shares of common stock under the
Company’s dividend reinvestment plan during January 2010 and February
2010.
On January 15, 2010, the Company loaned
$2.0 million to Resource Capital Partners, Inc. so that it could acquire a 5.0%
limited partnership interest in Resource Real Estate Opportunity Fund,
L.P. The loan is secured by Resource Capital Partner’s partnership
interest in the Resource Real Estate Opportunity Fund, L.P. The
promissory note bears interest at a fixed rate of 8.0% per annum on the unpaid
principal balance. In the event of default, interest will accrue and be
payable at a rate of 5.0% in excess of the fixed rate. Interest payments
are due quarterly commencing on April 15, 2010. Mandatory principal
payments must also be made to the extent distributable cash or other proceeds
from the partnership represents a return of Resource Capital Partners, Inc.’s
capital. The term of the loan ends on January 14, 2015, with an option to
extend for two additional 12-month periods each.
In January and February 2010, the
Company bought back at total of $20.3 million of debt issued by RREF CDO 2006-1
and RREF CDO 2007-1.
|
CHANGES
AND DISAGREEMENTS WITH ACCOUNTANTS ON ACCOUNTING
AND
FINANCIAL DISCLOSURE
|
None.
|
CONTROLS
AND PROCEDURES
|
Disclosure
Controls
We are
responsible for establishing and maintaining effective disclosure
controls. Disclosure controls and procedures that are designed to
ensure that information required to be disclosed in our Securities Exchange Act
of 1934, or Exchange Act, reports is recorded, processed, summarized and
reported within the time periods required by the Securities and Exchange
Commission’s rules and forms. Disclosure controls and procedures
include controls and procedures designed to ensure that information required to
be disclosed by us is accumulated and communicated to our management, including
our Chief Executive Officer and our Chief Financial Officer, as appropriate, to
allow timely decisions regarding required disclosure. In designing
and evaluating the disclosure controls and procedures, our management recognized
that any controls and procedures, no matter how well designed and operated, can
provide only reasonable assurance of achieving the desired control objectives,
and our management necessarily was required to apply its judgment in evaluating
the cost-benefit relationship of possible controls and procedures.
Under the supervision of our Chief
Executive Officer and Chief Financial Officer, we have carried out an evaluation
of the effectiveness of our disclosure controls and procedures as of the end of
the period covered by this report. Based on that evaluation, our
Chief Executive Officer and Chief Financial Officer concluded that our
disclosure controls and procedures are effective.
Management’s
Report on Internal Control Over Financial Reporting
Our management is responsible for
establishing and maintaining adequate internal control over financial reporting
as defined in Rules 13a-15(f) and 15d-15(f) under the Exchange
Act. Because of its inherent limitations, internal control over
financial reporting may not prevent or detect
misstatements. Projections of any evaluation of effectiveness to
future periods are subject to the risks that controls may become inadequate
because of changes in conditions, or that the degree of compliance with the
policies or procedures may deteriorate.
Management assessed the effectiveness
of our internal control over financial reporting as of December 31,
2008. In making this assessment, management used the criteria set
forth by the Committee of Sponsoring Organizations of the Treadway Commission in
Internal Control-Integrated Framework Based on this assessment
management believes that, as of December 31, 2009, our internal control over
financial reporting is effective.
Our independent registered public
accounting firm, Grant Thornton LLP, audited our internal control over financial
reporting as of December 31, 2009. Their report dated March 15, 2010,
expressed an unqualified opinion on our internal control over financial
reporting. This report is included in this Item 9A.
Changes
in Controls Over Financial Reporting
There have been no significant changes
in our internal control over financial reporting during the three month period
ended December 31, 2009 that have materially affected, or are reasonably likely
to materially affect, our internal control over financial
reporting.
REPORT
OF INDEPENDENT REGISTERED PUBLIC ACCOUNTING FIRM
Board of
Directors and Stockholders
Resource
Capital Corp.
We have
audited Resource Capital Corp. and its subsidiaries’ (a Maryland
Corporation) internal control over financial reporting as of December
31, 2009, based on criteria established in Internal Control—Integrated
Framework issued by the Committee of Sponsoring Organizations of the
Treadway Commission (COSO). Resource Capital Corp. and its subsidiaries’
management is responsible for maintaining effective internal control over
financial reporting and for its assessment of the effectiveness of internal
control over financial reporting, included in the accompanying Management Report on Internal
Control over Financial Reporting. Our responsibility is to express an
opinion on Resource Capital Corp. and its subsidiaries’ internal control over
financial reporting based on our audit.
We
conducted our audit in accordance with the standards of the Public Company
Accounting Oversight Board (United States). Those standards require that we plan
and perform the audit to obtain reasonable assurance about whether effective
internal control over financial reporting was maintained in all material
respects. Our audit included obtaining an understanding of internal control over
financial reporting, assessing the risk that a material weakness exists, testing
and evaluating the design and operating effectiveness of internal control based
on the assessed risk, and performing such other procedures as we considered
necessary in the circumstances. We believe that our audit provides a reasonable
basis for our opinion.
A
company’s internal control over financial reporting is a process designed to
provide reasonable assurance regarding the reliability of financial reporting
and the preparation of financial statements for external purposes in accordance
with generally accepted accounting principles. A company’s internal control over
financial reporting includes those policies and procedures that (1) pertain to
the maintenance of records that, in reasonable detail, accurately and fairly
reflect the transactions and dispositions of the assets of the company; (2)
provide reasonable assurance that transactions are recorded as necessary to
permit preparation of financial statements in accordance with generally accepted
accounting principles, and that receipts and expenditures of the company are
being made only in accordance with authorizations of management and directors of
the company; and (3) provide reasonable assurance regarding prevention or timely
detection of unauthorized acquisition, use, or disposition of the company’s
assets that could have a material effect on the financial
statements.
Because
of its inherent limitations, internal control over financial reporting may not
prevent or detect misstatements. Also, projections of any evaluation of
effectiveness to future periods are subject to the risk that controls may become
inadequate because of changes in conditions, or that the degree of compliance
with the policies or procedures may deteriorate.
In our
opinion, Resource Capital Corp. and its subsidiaries maintained, in all material
respects, effective internal control over financial reporting as of December 31,
2009, based on criteria established in Internal Control—Integrated
Framework issued by COSO.
We also
have audited, in accordance with the standards of the Public Company Accounting
Oversight Board (United States), the consolidated balance sheets of Resource
Capital Corp. and its subsidiaries as of December 31, 2009 and 2008, and the
related consolidated statements of operations, changes in stockholders’ equity,
and cash flows for each of the three years in the period ended December 31,
2009 and our
report dated March 15, 2010 expressed an
unqualified opinion.
/s/ Grant
Thornton LLP
Philadelphia,
Pennsylvania
March 15,
2010
|
OTHER
INFORMATION
|
None.
PART
III
|
DIRECTORS,
EXECUTIVE OFFICERS AND CORPORATE
GOVERNANCE
|
All members of the board of directors
are elected for a term of one year or until their successors are elected and
qualified. Information is set forth below regarding the principal
occupation of each of our directors. There are no family
relationships among the directors and executive officers except that Jonathan Z.
Cohen, our Chief Executive Officer, President and a director, is a son of Edward
E. Cohen, a director and, until November 2009, our Chairman of the
Board.
Names
of Directors, Principal Occupation and Other Information
Walter T.
Beach, age 43, has been a director since March 2005. Mr. Beach
has been Managing Director of Beach Investment Counsel, Inc., an investment
management firm, since 1997. From 1993 to 1997, Mr. Beach was a
Senior Analyst and Director of Research at Widmann, Siff and Co., Inc., an
investment management firm where, beginning in 1994, he was responsible for the
firm’s investment decisions for its principal equity product. Before
that he was an associate and financial analyst at Essex Financial Group, a
consulting and merchant banking firm, and an analyst at Industry Analysis Group,
an industry and economic consulting firm. Mr. Beach has served as a
director of The Bancorp, Inc., a publicly-traded (NASDAQ: TBBK) bank
holding company, and its subsidiary bank, The Bancorp Bank, since
1999. Mr. Beach has also served as a director of Cohen & Company,
a publicly-traded (AMEX: COHN) investment firm specializing in credit
related fixed income products and investments, since December 2009.
Edward E.
Cohen, age 71, has been a director since March 2005 and was our chairman
from March 2005 to November 2009. Mr. Cohen is Chairman of
Resource America, the corporate parent of our manager, a position he has held
since 1990. He was Resource America’s Chief Executive Officer from
1988 to 2004 and its President from 2000 to 2003. He is Chairman and
Chief Executive Officer of Atlas Energy, Inc. (f/k/a/ Atlas America, Inc.), a
publicly-traded (NASDAQ: ATLS) energy company, a position he has held since
2000; Chairman of Atlas Pipeline Holdings GP, LLC, a wholly-owned subsidiary of
Atlas Energy that is the general partner of Atlas Pipeline Holdings, L.P., a
publicly-traded (NYSE: AHD) holding company, a position he has held since 2006;
and Chairman of the Managing Board of Atlas Pipeline Partners GP, LLC, a
wholly-owned subsidiary of Atlas Energy that is the general partner of Atlas
Pipeline Partners, L.P., a publicly-traded (NYSE: APL) natural gas pipeline
company, since its formation in 1999. He is also Chairman of
Brandywine Construction & Management, Inc., a privately-held real
estate management company. From 1981 to 1999 he was Chairman of the
Executive Committee of JeffBanks, Inc., a bank holding company acquired by
Hudson United Bancorporation. From 1969 to 1989 he was Chairman of
the Executive Committee of State National Bank of Maryland (now a part of
Wachovia Bank).
Jonathan Z.
Cohen, age 39, has been our Chief Executive Officer, President and a
director since March 2005. Mr. Cohen has been President since
2003, Chief Executive Officer since 2004 and a Director since 2002 of Resource
America. He was Executive Vice President of Resource America from
2001 to 2003, and a Senior Vice President from 1999 to 2001. He has
been Vice Chairman of the Managing Board of Atlas Pipeline Partners GP since its
formation in 1999, Vice Chairman of Atlas Energy since 2000 and Vice Chairman of
Atlas Pipeline Holdings GP since 2006. He was the Vice Chairman of
RAIT Investment Trust, (now RAIT Financial Trust) a publicly-traded (NYSE: RAS)
REIT, from 2003 to 2006, and Secretary, trustee and a member of RAIT’s
investment committee from 1997 to 2006.
William B.
Hart, age 66, has been a director since March
2005. Mr. Hart was Chairman of the Board of Trustees of the
National Trust for Historic Preservation from 1999 to 2004. He was
also a director of Anthem, Inc. (now Wellpoint, Inc.), a publicly-traded (NYSE:
WLP) health insurance company, from 2000 to 2004. Mr. Hart was
Director of SIS Bancorp from 1995 to 2000. From 1988 to 1999,
Mr. Hart served in various positions with Blue Cross/Blue Shield of New
Hampshire, ending as Chairman of the Audit Committee and Chairman of the Board
of Directors from 1996 to 1999. He also served as President of the
Foundation for the National Capital Region, Washington, DC, from 1993 to 1996
and President of The Dunfey Group, a private investment firm, from 1986 to
1998. From 1986 to 1994 he was also director of First NH Banks where
he was Chairman of the Audit Committee from 1992 to 1994.
Gary
Ickowicz, age 54, has been a director since February 2007. Mr.
Ickowicz has been a Principal of Lazard Freres Real Estate Investors, a manager
of funds invested in debt and equity securities of North American real estate
assets and enterprises, since 2001. In addition, he was a director of
Lazard Freres’s real estate investment banking unit from 1989 through
2001. Since 2000 he has been a director of Grant Street Settlement,
and since 2002 he has been a director of NCC/Neumann, both not-for-profit
developers of senior housing. Since 2001 he has been a director of
Commonwealth Atlantic Properties, Inc., a privately-held REIT. From
2001 to 2006 he was a director of Kimsouth, Inc., a joint venture with Kimco
Realty Corporation, a publicly-traded (NYSE: KIM) REIT.
Steven J.
Kessler, age 67, has been our chairman since November 2009 and was our
Senior Vice President - Finance from September 2005 to November 2009 and, before
that, served as our Chief Financial Officer, Chief Accounting Officer and
Treasurer from March 2005 to September 2005. Mr. Kessler has
been Executive Vice President of Resource America since 2005 and was Chief
Financial Officer from 1997 to December 2009 and Senior Vice President from 1997
to 2005. He was a Trustee of GMH Communities Trust, a previously
publicly traded (NYSE: GCT) specialty housing REIT, from 2004 to 2008 when GCT
was sold. He was Vice President - Finance and Acquisitions at Kravco
Company, a then national shopping center developer and operator, from 1994 to
1997. From 1983 to 1993 he was employed by Strouse
Greenberg & Co., a regional full service real estate company, ending as
Chief Financial Officer and Chief Operating Officer. Before that, he
was a partner at Touche Ross & Co. (now Deloitte & Touche
LLP), independent public accountants.
Murray S.
Levin, age 67, has been a director since March
2005. Mr. Levin is a senior litigation partner at Pepper
Hamilton LLP, a law firm with which he has been associated since
1970. Mr. Levin served as the first American president of the
Association Internationale des Jeunes Avocats (Young Lawyers International
Association), headquartered in Western Europe. He is a past president
of the American Chapter and a member of the board of directors of the Union
Internationale des Avocats (International Association of Lawyers), a Paris-based
organization that is the world’s oldest international lawyers
association. Mr. Levin was a member of the managing board of
Atlas Pipeline Partners GP from 2001 to March 2005.
P. Sherrill
Neff, age 58, has been a director since March 2005. Mr. Neff
is a founder of Quaker BioVentures, Inc., a life sciences venture fund, and has
been a Partner since 2002. He was a director of Resource America from 1998
to March 2005. From 1994 to 2002 he was President and Chief Financial
Officer, and from 1994 to 2003, a director of Neose Technologies, Inc., a
then-publicly-traded (NASDAQ: NTEC) life sciences company. Mr. Neff
was also a director of The Bancorp, Inc. (NASDAQ: TBBK) from its formation in
1999 until 2002. Mr. Neff is on the boards of directors of five privately
held Quaker BioVentures portfolio companies. He is a member of the board
of directors of the National Venture Capital Association.
The board of directors has not adopted
specific minimum qualifications for service on our board, but rather seeks a
mixture of skills that are relevant to our business as an externally-managed
REIT that focuses primarily upon investments in commercial real estate and
commercial finance assets, principally loans and interests in
loans. The following presents a brief summary of the attributes of
each director that led to the conclusion that he should serve as
such:
Mr. Beach has extensive experience in
finance and investment management and a strong financial
background.
Mr. E. Cohen has lengthy experience in
real estate and real estate finance (a principal business of Resource America),
corporate finance (through the formation and funding of public companies such as
Atlas Energy, Atlas America, Atlas Pipeline, and Resource America, and his
banking experience) and operations of both public and private companies, and is
affiliated with the Manager.
Mr. J. Cohen has significant real
estate, real estate finance and operational experience as an officer (currently
Chief Executive Officer and President) and director of Resource America, and is
affiliated with the Manager.
Mr. Hart has extensive experience in
finance, investment management and real estate, both as an officer and director
of banks and insurance companies, as well as an officer of a private investment
firm.
Mr. Ickowicz has broad real estate and
real estate finance experience as a principal in the real estate operations of
an international investment bank, as a director of a REIT and as a director
three real estate ventures.
Mr. Kessler has a significant financial
and accounting background in real estate as the former Chief Financial Officer
of Resource America and, previously, as a principal financial officer for a
major operator of commercial real estate.
Mr. Levin has a lengthy and diverse
legal background and has practiced complex litigation for over forty
years.
Mr. Neff has significant experience in
investments, operations and finance as a principal or officer of a venture fund,
a public company and, prior thereto, as an investment banker.
Non-Director
Executive Officers
Jeffrey D.
Blomstrom, age 41, has been our Senior Vice President-CDO structuring
since March 2005. Mr. Blomstrom has been President and Managing
Director of Resource Financial Fund Management, Inc., an asset management
subsidiary of Resource America, since 2003. Mr. Blomstrom serves
as the head of collateral origination and as a member of the credit committee
for Trapeza Capital, Resource America’s trust preferred security collateral
manager. From 2001 to 2003 Mr. Blomstrom was a Managing Director
at Cohen and Company, an investment bank specializing in the financial services
sector. From 2000 to 2001 he was Senior Vice President of
iATMglobal.net, Inc., an ATM software development
company. Mr. Blomstrom was, from 1999 to 2000, an associate at
Covington & Burling, a law firm, where he focused on mergers and
acquisitions and corporate governance.
David E.
Bloom, age 45, has been our Senior Vice President-Real Estate Investments
since March 2005. Mr. Bloom has been Senior Vice President of
Resource America since 2001. He has also been President of Resource
Real Estate, Inc., a wholly-owned real estate subsidiary of Resource America,
since 2004 and President of Resource Capital Partners, a subsidiary of Resource
Real Estate, from 2002 to 2006. From 2001 to 2002 he was President of
Resource Properties, a former real estate subsidiary of Resource
America. Before that he was Senior Vice President at Colony Capital,
LLC, an international real estate opportunity fund, from 1999 to
2001. From 1998 to 1999 he was Director at Sonnenblick-Goldman
Company, a real estate investment bank. From 1995 to 1998 he was an
attorney at the law firm of Willkie Farr & Gallagher, LLP.
Jeffrey
F. Brotman,
46, Executive Vice President since June 2009. Executive Vice
President of Resource America since June 2007. Co-founder of Ledgewood,
P.C. (a Philadelphia-based law firm) and affiliated with the firm from 1992
until June 2007, serving as managing partner from 1995 until March 2006.
Mr. Brotman is also a non-active certified public accountant and an Adjunct
Professor at the University of Pennsylvania Law School. Mr. Brotman was
Chairman of the Board of Directors of TRM Corporation (a publicly-traded
consumer services company) from September 2006 until September 2008 and was
its President and Chief Executive Officer from March 2006 through June
2007.
David J.
Bryant, age 52, has been our Senior Vice President, Chief Financial
Officer, Chief Accounting Officer and Treasurer since June 2006. From
2005 to 2006 Mr. Bryant served as Senior Vice-President, Real Estate
Services, at Pennsylvania Real Estate Investment Trust, a publicly-traded (NYSE:
PEI) REIT principally engaged in owning, managing, developing and leasing malls
and strip centers in the eastern United States. From 2000 to 2005,
Mr. Bryant served as PEI’s Senior Vice President - Finance and Treasurer,
and was its principal accounting officer.
Other
Significant Employees
The following sets forth certain
information regarding other significant employees of the Manager and Resource
America who provide services to us:
Christopher D.
Allen, age 40, has been our Senior Vice President-Commercial Lending
since March 2005. Mr. Allen has been a Managing Director of
Resource Financial Fund Management since 2003. At Resource Financial
Fund Management, Mr. Allen is in charge of identifying, implementing and
overseeing new leveraged loan and CDO products. He is a member of the
investment committee of Apidos Capital Management, LLC, a wholly-owned asset
management subsidiary of Resource America, where he serves as the Chief
Operating Officer. Before joining Resource Financial Fund Management,
from 2002 to 2003 he was a Vice President at Trenwith Securities, the investment
banking arm of BDO Seidman, LLP, where he was in charge of corporate finance,
mergers and acquisitions and restructuring transactions. From 1994 to
1997 he was an Associate with Citicorp Venture Capital working on leveraged
buyout and recapitalization transactions.
Gretchen L.
Bergstresser, age 47, has been our Senior Vice President-Bank Loans since
March 2005. Ms. Bergstresser has been the President and Senior
Portfolio Manager of Apidos Capital Management since 2005. Before
joining Apidos Capital Management, from 2003 to 2005 she was the Managing
Director and Portfolio Manager of MJX Asset Management, a multi-billion dollar
boutique asset management firm managing leveraged loans across five structured
vehicles. From 1996 to 2003 Ms. Bergstresser was CDO Portfolio
Manager and Head Par Loan Trader at Eaton Vance Management, an investment
management company. From 1995 to 1996 she was a Vice President in the
Diversified Finance Division of Bank of Boston. From 1991 to 1995 she
was a Vice President at ING (U.S.), Capital Markets, an investment banking
firm.
Crit
DeMent, age 57, has been our Senior Vice President-Equipment Leasing
since March 2005. Mr. DeMent has been Chairman and Chief
Executive Officer of LEAF Financial Corporation, a majority-owned commercial
finance subsidiary of Resource America, since 2001. Mr. DeMent
was Chairman and Chief Executive Officer of its subsidiary, LEAF Asset
Management, Inc., from 2002 until 2004. From 2000 to 2001 he was
President of the Small Ticket Group, an equipment leasing division of European
American Bank. Before that, he was President and Chief Operating
Officer of Fidelity Leasing, Inc., then the equipment leasing subsidiary of
Resource America, and its successor, the Technology Finance Group of CitiCapital
Vendor Finance, from 1996 to 2000. From 1987 to 1996 he was Vice
President of Marketing for Tokai Financial Services, an equipment leasing
firm.
Thomas C.
Elliott, age 36, has been our Senior Vice President-Finance and
Operations since September 2006 and, prior to that, was our Chief Financial
Officer, Chief Accounting Officer and Treasurer from September 2005 to June
2006. He was our Senior Vice President - Assets and Liabilities
Management from June 2005 until September 2005 and, before that, served as our
Vice President - Finance from March 2005. Mr. Elliott has been
Chief Financial Officer of Resource America since December 2009 and Senior Vice
President since 2005. He was Senior Vice President - Finance and
Operations of Resource America from 2006 to December 2009; Senior Vice President
– Finance from 2005 to 2006 and Vice President - Finance from 2001 to
2005. From 1997 to 2001 Mr. Elliott was a Vice President at
Fidelity Leasing, where he managed all capital market functions, including the
negotiation of all securitizations and credit and banking facilities in the U.S.
and Canada. Mr. Elliott also oversaw the financial controls and
budgeting departments.
Alan F.
Feldman, age 46, has been our Senior Vice President-Real Estate
Investments since March 2005. Mr. Feldman has been Chief
Executive Officer of Resource Real Estate since 2004 and Senior Vice President
of Resource America since 2002. Mr. Feldman was President of
Resource Properties from 2002 to 2005. From 1998 to 2002,
Mr. Feldman was Vice President at Lazard Freres & Co., an
investment banking firm, specializing in real estate mergers and acquisitions,
asset and portfolio sales and recapitalization. From 1992 through
1998, Mr. Feldman was Executive Vice President of PREIT-RUBIN, Inc. the
management subsidiary of Pennsylvania Real Estate Investment Trust and its
predecessor, The Rubin Organization. Before that, from 1990 to 1992,
he was a Director at Strouse, Greenberg & Co., a regional full service
real estate company.
Kevin M.
Finkel, age 38, has been our Vice President-Real Estate Investments since
January 2006. He has also been employed by Resource Capital Partners
since 2002, having been its Vice President and Director of Acquisitions from
2003 to 2006 and President since 2006. Mr. Finkel has also been
an officer of Resource Real Estate since 2004, and is currently its Executive
Vice President and Director of Acquisitions. In 2000, Mr. Finkel
was an investment banking Associate at Lehman Brothers. From 1998 to
1999, Mr. Finkel was an Associate at Barclays Capital, the investment
banking division of Barclays Bank PLC. From 1994 to 1998,
Mr. Finkel was an investment banker at Deutsche Bank Securities, the
investment banking division of Deutsche Bank AG.
Kyle
Geoghegan, age 41, has been our Senior Vice President – Loan Originations
since 2007. Mr. Geoghegan has been a Managing Director of Resource
Real Estate Funding, Inc., a real estate subsidiary of Resource America, since
July 2006. Mr. Geoghegan co-manages the whole loan origination
platform for Resource Real Estate Funding and is based in Los
Angeles. Mr. Geoghegan worked at Bear Stearns from January 1998 to
May 2006, serving as a Managing Director who co-managed the Bear Stearns
Commercial Mortgage office in Los Angeles which originated over $1.0 billion of
loans annually. Prior to joining Bear Stearns, Mr. Geoghegan spent
four years as a real estate loan officer at PNC Bank in Philadelphia, PA,
primarily originating construction and bridge loans.
Yvana
Melini, age
34, has been our Vice President and Director of Asset Management since
2008. Ms. Melini has served as Vice President of Debt Asset
Management for Resource Real Estate since 2006. Prior to joining
Resource Real Estate, Ms. Melini served for over six years as a Vice President
of both the Structured Asset Management and CMBS Credit Administration groups
for Capmark Finance, Inc. (formerly GMAC Commercial Mortgage
Corporation). Prior to her employment with Capmark, Ms. Melini served
as Senior Underwriter for the Northeast Commercial Real Estate Lending division
of Washington Mutual Bank. Ms. Melini has also privately consulted on
various due diligence projects for large institutional investors and B-Piece
buyers within the CMBS marketplace.
Darryl
Myrose, age 36, has been our Senior Vice President – Loan Originations
since 2007. Mr. Myrose has been a Managing Director of Resource Real
Estate Funding since July 2006. Mr. Myrose co-manages the whole
loan origination platform for Resource Real Estate Funding and is based in Los
Angeles. Mr. Myrose worked at Bear Stearns from April 1996 to
May 2006, serving as a Managing Director who co-managed the Bear Stearns
Commercial Mortgage office in Los Angeles which originated over $1.0 billion of
loans annually. Prior to joining Bear Stearns, Mr. Myrose was
employed with Clarion Advisors (formerly Jones Lang Wootton Realty Advisors)
where he was an asset management analyst.
Thomas C.
Powers, age 45, has been our Vice President – Loan Originations since
2007. Mr. Powers has been Senior Vice President of Resource Real
Estate Funding since January 2008 and was Vice President from 2006 to
2008. Mr. Powers is responsible for all real estate asset management
including investment origination and all aspects of transaction
management. Mr. Powers has over 20 years of commercial real estate,
workout and risk management experience. Prior to joining Resource
Real Estate Funding, Mr. Powers was a senior member of the real estate credit
risk management and workout group at Merrill Lynch. Prior to his
employment with Merrill Lynch, Mr. Powers worked in the project finance group at
UBS Investment Bank.
Joan M.
Sapinsley, age 57, has been our Senior Vice President – CMBS since
2007. Ms. Sapinsley joined Resource Financial Fund Management, Inc.
in February 2007 as Managing Director and manages our CMBS portfolio. Prior to
joining Resource Financial Fund Management, Ms. Sapinsley was a Managing
Director at TIAA, where she worked from 1992 through 2006 purchasing CMBS. She
was responsible for all single borrower and single asset CMBS, as well as
subordinate CMBS and B-notes. She also directed TIAA’s conduit
origination and securitization activities. Before TIAA, Ms. Sapinsley was a
Director in the Financial Services Group of Cushman & Wakefield and a real
estate consultant at Laventhol & Horwath.
Michael S.
Yecies, age 42, has been our Chief Legal Officer and Secretary since
March 2005 and our Senior Vice President since July
2007. Mr. Yecies has been Senior Vice President of Resource
America since 2005, Chief Legal Officer and Secretary since 1998 and was Vice
President from 1998 to 2005. From 1994 to 1998 he was an attorney at
the law firm of Duane Morris LLP.
Section
16(a) Beneficial Ownership Reporting Compliance
Section 16(a) of the Exchange Act
requires our officers, directors and persons who own more than ten percent of a
registered class of our equity securities to file reports of ownership and
changes in ownership with the Securities and Exchange Commission and to furnish
us with copies of all such reports.
Based solely on our review of the
reports received by us, we believe that, during fiscal 2009, our officers,
directors and greater than ten percent shareholders complied with all applicable
filings requirements, except Mr. Bloom inadvertently filed two late Form 4s
relating to restricted stock grants.
Code
of Ethics
We have adopted a code of business
conduct and ethics applicable to all directors, officers and
employees. Our code of conduct is available on our website:
www.resourcecapitalcorp.com. We intend to satisfy the
disclosure requirement under Item 5.05 of Form 8-K regarding an amendment to, or
waiver from, a provision of this code of conduct by posting such information on
our website, unless otherwise required by applicable law or
regulation.
Information
Concerning the Audit Committee
Our Board of Directors has a standing
audit committee. The audit committee reviews the scope and
effectiveness of audits by the independent accountants, is responsible for the
engagement of independent accountants, and reviews the adequacy of our internal
financial controls. Members of the committee are Messrs. Neff
(Chairman), Beach and Hart. The board of directors has determined
that each member of the audit committee meets the independence standards for
audit committee members set forth in the listing standards of the New York Stock
Exchange, or NYSE, including those set forth in Rule 10A-3(b)(1) of the
Securities Exchange Act of 1934, and that Messrs. Beach and Neff each qualifies
as an “audit committee financial expert” as that term is defined in the rules
and regulations thereunder.
|
EXECUTIVE
COMPENSATION
|
Compensation
Discussion and Analysis
We are required to provide information
regarding the compensation program in place for our CEO, CFO and the three other
most highly-compensated executive officers. In the following discussion, we
refer to our CEO, CFO and the other most highly-compensated executive officer
whose compensation in fiscal 2009 exceeded $100,000 as our “Named Executive
Officers” or “NEOs.”
Objectives
of Our Compensation Program
We have no employees. We are
managed by our Manager pursuant to a management agreement, between our Manager
and us. All of our NEOs are employees of our Manager or one of its
affiliates. We have not paid, and do not intend to pay, any cash
compensation to our NEOs although we reimburse the Manager for the wages, salary
and benefits established and paid by the Manager to our Chief Financial
Officer. However, our Compensation Committee may, from time to time,
grant equity awards in the form of restricted stock, stock options or
performance awards to our NEOs pursuant to our 2005 Stock Incentive Plan and/or
the 2007 Omnibus Equity Compensation Plan. These awards are designed
to align the interests of our NEOs with those of our stockholders, by allowing
our NEOs to share in the creation of value for our stockholders through stock
appreciation and dividends. These equity awards are generally subject
to time-based vesting requirements designed to promote the retention of
management and to achieve strong performance for our company. These awards
further provide us flexibility in our ability to enable our Manager to attract,
motivate and retain talented individuals at our Manager.
Our NEOs are employees of Resource
America, which determines the base salary, cash incentive compensation and, for
grants of Resource America equity securities, equity incentive compensation that
is paid to our NEOs. A portion of the base salary and cash incentive
compensation paid to them is derived from the fees paid by us under the
management agreement. We do not control how such fees are allocated
by Resource America to its employees. For a description of our
management agreement, see Item 1: “Business-Management Agreement.” We
disclose the cash amounts paid by Resource America to our Chief Financial
Officer (for which we reimburse Resource America), our only NEO who devotes his
full business time to our affairs, in the Summary Compensation Table
below.
When Resource America makes its
determination of the amount of compensation it will award to one of our NEOs,
including in particular the amount of Resource America securities that Resource
America will grant as equity incentive compensation, Resource America also
considers, but does not determine, the amount of our securities we propose to
grant as equity incentive compensation to that NEO. Similarly, in
determining the amount of equity incentive compensation we grant to one of our
NEOs, our compensation committee considers, but does not determine, the
compensation that Resource America proposes to grant to that NEO, including
Resource America’s grant of Resource America securities as equity incentive
compensation. Our respective compensation committees base their
analyses and determinations upon recommendations submitted by Jonathan Z. Cohen,
who is chief executive officer of both companies, for all of our NEOs other than
himself. Resource America’s compensation committee determines the
amount of compensation Resource America will award Mr. J. Cohen, while our
compensation committee determines the amount of any Resource Capital equity
incentive compensation we award to Mr. J. Cohen. These analyses and
determinations are not based upon any particular compensation matrix or formula,
but instead are based upon qualitative evaluations by Mr. J. Cohen and the
compensation committees. Our compensation committee does not make
recommendations to Resource America as to the amount of compensation Resource
America grants to our NEOs, nor does Resource America’s compensation committee
make recommendations to us regarding the amount of equity incentive compensation
awarded by us to our NEOs.
Our compensation committee operates
under a written charter adopted by our Board of Directors, a copy of which is
available on our website at www.resourcecapitalcorp.com. Our
compensation committee determines compensation amounts after the end of Resource
America’s fiscal year and makes equity awards after our fiscal year
end. Therefore, awards made after our fiscal year end are not
reflected in our Summary Compensation Table or Grants of Plan-Based Awards table
until our following fiscal year. Our compensation committee has the
discretion to issue equity awards at other times during our fiscal
year.
Elements
of Our Compensation Program
As described above, our NEOs do not
receive cash compensation from us, although beginning in October 2009, we agreed
to reimburse Resource America for the wages, salary and benefits of our Chief
Financial Officer. However, our compensation committee may, from time
to time, grant equity awards in the form of restricted stock, stock options or
performance awards to our NEOs pursuant to our 2005 Stock Incentive Plan and/or
the 2007 Omnibus Equity Compensation Plan as follows:
Stock
Options. Stock options provide value to the executive only if
our stock price increases after the grants are made. Stock options
typically vest 33.3% per year.
Restricted
Stock. Restricted stock units reward stockholder value
creation slightly differently than stock options: restricted stock
units are impacted by all stock price changes, both increases and
decreases. Restricted stock units generally vest 33.3% per year and
include a right to receive dividends on unvested shares.
Resource America Restricted
Stock. As described above, Resource America’s compensation
committee approves awards of Resource America restricted stock to
NEOs. These awards generally vest 25% per year, and may include a
right to receive dividends on unvested shares.
Resource America Stock
Options. As described above, Resource America’s compensation
committee approves awards of Resource America options to receive restricted
stock to NEOs. These awards generally vest 25% per year.
Supplemental Incentive
Arrangements with David Bloom. In October 2007, we entered
into an agreement with David Bloom, our Senior Vice President−Real Estate
Investments, which awarded him 50,000 shares of our restricted stock under our
2005 Stock Incentive Plan. These shares vested were fully vested at
December 31, 2009.
In December 2007, Resource America
entered into another agreement with Mr. Bloom which provides for awards to him
of our restricted stock and Resource America restricted stock. With
respect to our restricted stock, Mr. Bloom was awarded 120,000 shares, 60,000 of
which are subject to vesting over time and 60,000 of which are earned based on
the achievement of predetermined, objective performance goals over a multi-year
performance period. We pay dividends on unvested
awards. With respect to the shares that vest over time, 15% vested on
June 30, 2008, 15% vested on June 30, 2009 and 70% vest on December 31, 2010,
provided that Mr. Bloom is employed by Resource America at that
date. The award opportunities, presented in number of potential
shares earned, are included in the Grant of Plan-Based Awards table
below. Performance-based shares are earned on achievement of
performance goals over the performance period beginning July 1, 2007 and ending
June 30, 2010, with one-third of the shares potentially being earned at the end
of each 12-month measurement period. As of December 31, 2009,
one-third of such shares were earned, one-third of such shares were forfeited
and one-third of such shares remain available to be earned. The
performance measures are as follows:
|
|
·
|
Loan
Origination. For each measurement period, the loan
origination volume generated by Mr. Bloom and his colleagues in Resource
America’s Los Angeles office, which we refer to as Mr. Bloom’s team, must
be equal to or greater than 90% of the loan origination volume generated
by Mr. Bloom’s team for the previous 12-month period. Resource
America may waive the loan origination performance criteria, if in its
reasonable discretion, reaching such levels could not be reasonably
achieved notwithstanding Mr. Bloom’s team’s best efforts. Our
compensation committee along with Resource America’s compensation
committee determine whether to exercise this
discretion.
|
|
|
·
|
Portfolio
Diversity. The loans generated by Mr. Bloom’s team
during the measurement period must conform to the diversity and loan type
standards set forth in the investment parameters of the commercial real
estate CDOs managed on our behalf.
|
|
|
·
|
Pricing. The
gross weighted average spread on loans generated by Mr. Bloom’s team
during the measurement period must be not less than 250 basis points over
the applicable index. Resource America may exclude certain
loans from this calculation and/or may waive the pricing provision for the
measurement period in its entirety.
|
|
|
·
|
Credit
Quality. There shall have been no principal losses
during the measurement period on any loan originated by Mr. Bloom’s team
and no greater than 10% of the loans originated by Mr. Bloom’s team
(measured by principal balance) shall have been in default during such
measurement period.
|
If the performance criteria for a given
measurement period are largely, but not entirely, met, the compensation
committee will
reasonably take such substantial performance into account in determining whether
there should be an equitable partial earning of the award for such measurement
period. Once earned, the shares of restricted stock vest over the
following two years, at the rate of one-eighth (1/8) per quarter, as long as Mr.
Bloom is employed by Resource America on the last day of such quarter. The
performance-based stock awards are disclosed under the Grants of Plan-Based
Awards table under the heading “Estimated future payouts under equity incentive
plan awards” and in the Outstanding Equity Awards at Fiscal Year-End table under
the heading “Equity incentive plan awards.”
How
We Determined 2009 Compensation
In light of the general adverse
economic conditions in the market, and the effects of the market on our
performance, the compensation committee decided to significantly reduce the
value of the bonus awards to our NEOs. However, the Committee recognized
our NEOs’ prudent management efforts in a challenging environment, and believed
that, for Mr. Bryant and Mr. Bloom, restricted stock awards were
appropriate to recognize those efforts and retain their services.
Upon our CEO’s recommendation, our
Compensation Committee made the following awards for fiscal 2009:
|
|
·
|
Mr.
Bryant was awarded 23,364 shares of restricted stock for fiscal 2009, as
compared to 13,484 shares of restricted stock for fiscal
2008. Mr. Bryant was also awarded 5,000 Resource America
options for fiscal 2008.
|
|
|
·
|
Mr.
Bloom was awarded 44,502 shares of restricted stock for fiscal 2009, as
compared to 18,878 shares of restricted stock for fiscal
2008. See “− Elements of Our Compensation Program−Supplemental
Incentive Arrangements with David
Bloom.”
|
Report
of the Compensation Committee
The compensation committee has reviewed
and discussed the Compensation Discussion and Analysis with management and based
on its review and discussions, the compensation committee recommended to the
Board of Directors that the Compensation Discussion and Analysis be included in
this filing.
This report has been provided by the
compensation committee of the Board of Directors of Resource Capital
Corp.
Murray S.
Levin
P.
Sherrill Neff
Walter T.
Beach
The following table sets forth certain
information concerning the compensation earned in fiscal 2009, 2008 and 2007 for
our NEOs:
SUMMARY
COMPENSATION
|
Name
and Principal Position
|
Year
|
Salary ($)
|
Bonus ($)
|
Stock
Awards ($)(2)
|
Option
Awards ($)(2)
|
All Other
Compen-
sation ($)(3)
|
Total
($)
|
|||||||||||||||||||
|
Jonathan
Z. Cohen
|
2009
|
− | − | − | − | − | − | |||||||||||||||||||
|
Chief
Executive Officer,
|
2008
|
− | − | − | − | − | − | |||||||||||||||||||
|
President and
Director
|
2007
|
− | − | 1,499,989 | − | − | 1,499,989 | |||||||||||||||||||
|
David
J. Bryant
|
2009
|
240,000 | (1) | 120,000 | (1) | 49,999 | − | − | 409,999 | |||||||||||||||||
|
Senior
Vice President,
|
2008
|
240,000 | (1) | 185,000 | (1) | 124,997 | − | 15,425 | 565,422 | |||||||||||||||||
|
Chief Financial
Officer,
Chief Accounting
Officer
and Treasurer
|
2007
|
240,000 | (1) | 120,000 | (1) | 71,989 | − | 47,978 | 479,967 | |||||||||||||||||
|
David
E. Bloom
|
2009
|
− | − | 151,777 | − | − | 151,777 | |||||||||||||||||||
|
Senior
Vice President−
|
2008
|
− | − | 174,999 | − | − | 174,999 | |||||||||||||||||||
|
Real Estate
Investments
|
2007
|
− | − | 1,385,597 | − | − | 1,385,597 | |||||||||||||||||||
|
(1)
|
Mr.
Bryant’s salary and bonus were paid by Resource America. We
began to reimburse Resource America for Mr. Bryant’s salary and bonus in
October 2009. Amounts represent salary and bonus earned for the
years indicated, but may not have been paid in full in the respective
years.
|
|
(2)
|
Grant
date fair value, valued in accordance with FASB Accounting Standards
Codification Topic 718 as the closing price of our common stock on the
grant date. In valuing options awarded to Messrs. J. Cohen,
Bryant, and Bloom at $0.04 per option, we used the Black-Scholes option
pricing model to estimate the weighted average fair value of each option
granted with weighted average assumptions for (a) expected dividend yield
of 27.3%, (b) risk-free interest rate of 3.3%, (c) expected volatility of
51.0%, and (d) an expected life of 7.0
years.
|
|
(3)
|
2008
amount represents award of options to purchase Resource America restricted
common stock. The grant date fair value is $3.09 per option,
using the Black-Scholes option pricing model to estimate the fair value of
each option granted with assumptions for (a) expected dividend yield of
3.4%, (b) risk-free interest rate of 3.8%, (c) expected volatility of
49.5%, and (d) an expected life of 6.3 years. 2007 represents
award of Resource America restricted stock earned during 2007, valued at
the closing price of Resource America common stock on the date of the
grant in January 2007.
|
GRANTS
OF PLAN-BASED AWARDS TABLE
During 2009, we made restricted stock
awards to our NEOs. The following table sets forth information with
respect to each of these awards on a grant-by-grant basis.
|
Name
|
Grant
date
|
All
other
stock
awards:
number
of
shares
of
stock
(#)
|
All
other option awards: number
of
securities underlying
options
(#)
|
Exercise
or base price of option awards ($/Sh)
|
Grant
date fair value of stock and option awards ($) (1)
|
||||||||
|
David
J. Bryant
|
|||||||||||||
|
Our restricted
stock
|
02/20/09
|
23,364 | 49,999 | ||||||||||
|
David
E. Bloom
|
|||||||||||||
|
Our restricted stock
|
02/03/09
|
20,000 | 67,000 | ||||||||||
|
Our restricted stock
|
07/30/09
|
24,502 | 84,777 | ||||||||||
|
(1)
|
Based
on the closing price of our stock on the respective grant
dates.
|
OUTSTANDING
EQUITY AWARDS AT FISCAL YEAR-END
|
Option
Awards
|
Stock
Awards
|
||||||||||||||||||||||||||||||||
|
Name
|
Number
of Securities Underlying Unexercised Options (#) Exercisable
|
Number
of Securities Underlying Unexercised Options (#) Unexercisable
|
Equity
Incentive Plan Awards: Number of Securities Underlying Unexercised
Unearned
Options (#)
|
Option
Exercise Price($)
|
Option
Expiration
Date
|
Number of
Shares or Units of Stock That Have Not Vested (#)
|
Market
Value of Shares or Units of Stock That Have Not Vested ($) (1)
|
Equity
Incentive Plan Awards: Number of Unearned Shares, Units or Other Rights
That Have Not Vested
(#)
|
Equity
Incentive Plan Awards: Market or Payout Value of Unearned Shares,
Units or Other Rights That Have Not Vested
($)
(1)
|
||||||||||||||||||||||||
|
Jonathan
Z. Cohen
|
100,000 | − | − | 15.00 |
03/07/15
|
7,265 | 35,744 | − | − | ||||||||||||||||||||||||
|
David
J. Bryant
|
10,000 | − | − | 15.00 |
03/07/15
|
32,707 | 160,918 | − | − | ||||||||||||||||||||||||
| − | 5,000 | (3) | 8.14 |
05/21/18
|
580 | (4) | 2,343 | (4) | − | − | |||||||||||||||||||||||
|
David
E. Bloom
|
100,000 | − | − | 15.00 |
03/07/15
|
85,060 | 418,495 | 20,000 | (2) | 98,400 | |||||||||||||||||||||||
|
(1)
|
Based
on the closing price of our common stock $4.92 on December 31,
2009.
|
|
(2)
|
Represents
performance-based restricted stock awards under our 2007 Omnibus Equity
Compensation Plan that vest based on the achievement of pre-determined
objective performance goals over a multi-year performance
period. See “Compensation Discussion and
Analysis.”
|
|
(3)
|
Represents
options to purchase shares of Resource America common stock that vest ¼ on
each anniversary date through May 21,
2012.
|
|
(4)
|
Represents
shares of Resource America common stock. Based upon a price of
$4.04, the price of Resource America’s common stock on December 31,
2009.
|
2009
OPTION EXERCISES AND STOCK VESTED
|
Stock
Awards
|
||||||||
|
Name
|
Number
of Shares Acquired on
Vesting
(#)
|
Value
Realized on Vesting ($) (1)
|
||||||
|
Jonathan
Z. Cohen
|
40,163 | 150,581 | ||||||
|
David
J. Bryant (our stock)
|
5,886 | 18,730 | ||||||
|
(Resource America
stock)
|
460 | 1,987 | ||||||
|
David
E. Bloom
|
56,945 | 214,831 | ||||||
(1) Represents market value of our common stock on vesting date.
Director
Compensation
For 2009, the board of directors
approved compensation for each independent director consisting of an annual cash
retainer of $52,500 and an annual stock award valued at $22,500 on the date of
grant on the anniversary of the date each of them became a
director. The following table sets forth director compensation for
2009:
|
Name
(1)
|
Fees
Earned or Paid in Cash ($)
|
Stock
Awards
($) (2)
|
Total
($)
|
|||||||||
|
Walter
T. Beach
|
52,500 | 22,499 | 74,999 | |||||||||
|
William
B. Hart
|
52,500 | 22,499 | 74,999 | |||||||||
|
Murray
S. Levin
|
52,500 | 22,499 | 74,999 | |||||||||
|
P
Sherrill Neff
|
52,500 | 22,499 | 74,999 | |||||||||
|
Gary
Ickowicz
|
52,500 | 22,499 | 74,999 | |||||||||
|
Edward
E. Cohen
|
− | − | − | |||||||||
|
Steven
J. Kessler
|
− | − | − | |||||||||
|
(1)
|
Table
excludes Mr. J. Cohen, an NEO, whose compensation is set forth in the
Summary Compensation Table.
|
|
(2)
|
On
March 9, 2009, Messrs. Beach, Hart, Levin and Neff, were each granted
11,479 shares based upon a price of $1.96, the closing price on that
day. On February 1, 2009, Mr. Ickowicz, was granted 6,716
shares based upon a price of $3.35, the closing price on that
day.
|
Compensation
Committee Interlocks and Insider Participation
The compensation committee of the board
during 2009 consisted of Messrs. Beach, Levin and Neff. None of such
persons was an officer or employee, or former officer or employee, of our
company or any of its subsidiaries during 2009. None of our executive
officers was a director or executive officer of any entity of which any member
of the compensation committee was a director or executive officer during
2009.
|
SECURITY
OWNERSHIP OF CERTAIN BENEFICIAL OWNERS AND
|
|
|
MANAGEMENT AND RELATED STOCKHOLDERS
MATTERS
|
The
following table sets forth the number and percentage of shares of common stock
owned, as of March 8, 2010, by (a) each person who, to our knowledge, is the
beneficial owner of more than 5% of the outstanding shares of common stock, (b)
each of our present directors, (c) each of our executive officers and (d) all of
our named executive officers and directors as a group. This
information is reported in accordance with the beneficial ownership rules of the
Securities and Exchange Commission under which a person is deemed to be the
beneficial owner of a security if that person has or shares voting power or
investment power with respect to such security or has the right to acquire such
ownership within 60 days. Shares of common stock issuable pursuant to
options or warrants are deemed to be outstanding for purposes of computing the
percentage of the person or group holding such options or warrants but are not
deemed to be outstanding for purposes of computing the percentage of any other
person.
|
Shares owned
|
Percentage(1)
|
|||||||
|
Executive
officers and directors: (2)
|
||||||||
|
Walter
T. Beach (4)
(5)
|
1,058,911 | 2.72 | % | |||||
|
Edward
E. Cohen (3)
|
474,120 | 1.22 | % | |||||
|
Jonathan
Z. Cohen (3)
|
694,659 | 1.78 | % | |||||
|
William
B. Hart (5)
|
31,396 | * | ||||||
|
Gary
Ickowicz (5)
|
13,876 | * | ||||||
|
Steven
J. Kessler (3)
|
73,069 | * | ||||||
|
Murray
S. Levin (5)
|
25,396 | * | ||||||
|
P.
Sherrill Neff (5)
|
31,396 | * | ||||||
|
Jeffrey
D. Blomstrom (3)
|
36,276 | * | ||||||
|
David
E. Bloom (3)
|
247,364 | * | ||||||
|
Jeffrey
F. Brotman (3)
|
19,267 | * | ||||||
|
David
J. Bryant (3)
|
76,798 | * | ||||||
|
All
executive officers and directors as a group
(12 persons)
|
2,782,528 | 7.10 | % | |||||
|
Owners
of 5% or more of outstanding shares:
|
||||||||
|
Resource
America, Inc. (6)
|
2,192,009 | 5.63 | % | |||||
* Less
than 1%.
|
(1)
|
Includes
255,000 shares of common stock issuable upon exercise of stock
options.
|
|
(2)
|
The
address for all of our executive officers and directors is c/o Resource
Capital Corp., 712 Fifth Avenue, 10th Floor, New York, New York
10019.
|
|
(3)
|
Includes
restricted stock awards granted to certain officers and directors as
follows: (i) on December 26, 2007: 60,000 shares to Mr. Bloom;
15% of these shares vested on each of June 30, 2008 and June 30, 2009 and
70% will vest on December 31, 2010; (ii) on January 14, 2008: Mr.
Blomstrom – 10,787 shares; Mr. Bloom – 18,878 shares; Mr. Bryant – 13,484
shares; Mr. E. Cohen – 10,787 shares; and Mr. Kessler – 5,393 shares; all
these shares vest 33.33% per year; (iii) on July 30, 2009; Mr. Bloom –
24,502 shares; these shares vest in full on July 30, 2010; and (iv) on
January 22, 2010; Mr. Blomstrom – 14,450 shares, Mr. Bloom – 19,267
shares; Mr. Brotman – 19,267 shares; Mr. Bryant – 19,267 shares; Mr. J.
Cohen – 57,803 shares; and Mr. Kessler – 19,267 shares; all these shares
vest 33.33% per year. Each such person has the right to receive
distributions on and vote, but not to transfer, such
shares.
|
|
(4)
|
Includes
(i) 1,037,515 shares purchased by Beach Asset Management, LLC, Beach
Investment Counsel, Inc. and/or Beach Investment Management, LLC,
investment management firms for which Mr. Beach is a principal and
possesses investment and/or voting power over the shares. The
address for these investment management firms is Five Tower Bridge, 300
Barr Harbor Drive, Suite 220, West Conshohocken, Pennsylvania
19428.
|
|
(5)
|
Includes
(i) 3,214 shares of restricted stock issued to each of Messrs. Beach,
Hart, Levin and Neff on March 8, 2010 which vest on March 8, 2011, and
(ii) 4,083 shares of restricted stock issued to Mr. Ickowicz on February
1, 2010 which vest on February 1, 2011. Each non-employee
director has the right to receive distributions on and vote, but not to
transfer, such shares.
|
|
(6)
|
Includes
(i) 921 shares of restricted stock granted to the Manager in connection
with our March 2005 private placement that the Manager has not allocated
to its employees, (ii) 100,000 shares purchased by the Manager in our
initial public offering, (iii) 900,000 shares purchased by Resource
Capital Investor in our March 2005 private placement, (iv) 900,000
shares purchased by Resource Capital Investor in our initial public
offering, and (v) 291,088 shares transferred to the Manager as incentive
compensation pursuant to the terms of its management agreement with
us. The address for Resource America, Inc. is 1845 Walnut
Street, Suite 1000, Philadelphia, Pennsylvania
19103.
|
Equity
Compensation Plan Information
The following table summarizes certain
information about our 2005 Stock Incentive Plan and 2007 Omnibus Equity
Compensation Plan as of December 31, 2009:
|
(a)
|
(b)
|
(c)
|
||||
|
Plan
category
|
Number
of securities to be issued upon exercise of
outstanding
options,
warrants
and rights
|
Weighted-average
exercise price of outstanding options,
warrants
and rights
|
Number
of securities remaining available for future issuance under equity
compensation plans excluding securities reflected in column
(a)
|
|||
|
Equity
compensation plans
approved by security holders:
|
||||||
|
Options
|
607,666
|
$ 14.99
|
||||
|
Restricted
shares
|
437,319
|
N/A
|
||||
|
Total
|
1,044,985
|
1,473,345
(1)
(2)
|
|
(1)
|
Upon
the July 2006 hiring of certain significant employees of the Manager, we
agreed to pay up to 100,000 shares of restricted stock and 100,000 options
to purchase restricted stock upon the achievement of certain performance
thresholds, the first of which was met in June 2007 and, as a result,
60,000 shares of restricted stock and 60,000 options to purchase
restricted stock were issued at that time. As of December 31,
2009, 40,000 shares of restricted stock and 40,000 options to purchase
restricted stock are unissued. These shares and options to
purchase restricted stock, which have been reserved for future issuance
under the plans, have been deducted from the number of securities
remaining available for future issuance. See Item 8, “Financial
Statements and Supplementary Data” at Note 12 for a more detailed
discussion.
|
|
(2)
|
We
agreed to award certain personnel up to 195,389 shares of restricted stock
upon the achievement of certain performance thresholds. During
the year ended December 31, 2009, 62,706 of those shares were
forfeited. The remaining 132,683 shares, which have been
reserved for future issuance under the plans, have been deducted from the
number of securities remaining available for future
issuance.
|
|
CERTAIN
RELATIONSHIPS AND RELATED TRANSACTIONS
|
|
|
AND
DIRECTOR INDEPENDENCE
|
Relationships
and Related Transactions
We have entered into a management
agreement under which the Manager receives substantial fees. We
describe these fees in Item 1 − “Business − Management
Agreement.” For the year ended December 31, 2009, Resource Capital
Manager, or the Manager, earned base management fees of approximately $3.8
million and incentive compensation fees of $4.6 million (including $1.2 million
paid in the form of 217,149 shares of common stock). We also
reimburse the Manager for financial services expense, rent and other expenses
incurred in the performance of its duties under the management
agreement. Pursuant to an amendment to the management agreement on
October 16, 2009, the Manager must provide us with a Chief Financial Officer and
three accounting professionals, each of whom will be exclusively dedicated to
our operations. The Manager will also provide us with a director of
investor relations who will be 50% dedicated to our operations. The
amendment provides that we will bear 100% of the expense of the wages, salaries
and benefits of the Chief Financial Officer and three accounting professionals
and 50% of the salary and benefits of the director of investor
relations. For the year ended December 31, 2009, we paid aggregate
reimbursements to the Manager of $664,000. In addition, we are
required to reimburse the Manager and Resource America for expenses for
employees of Resource America who perform legal, accounting, due diligence and
other services that outside professionals or consultants would otherwise
perform. No such expense reimbursements were made in the year ended
December 31, 2009. As of December 31, 2009, we had executed six CDO
transactions. These CDO transactions were structured for us by the
Manager; however, the Manager was not separately compensated by us for executing
these transactions and is not separately compensated by us for managing the CDO
entities and their assets.
Resource America, entities affiliated with it and our executive officers and
directors collectively beneficially own 4,974,537 shares of common stock,
representing approximately 13% of our common stock on a fully-diluted
basis. Our executive officers are also officers of our Manager and/or of
Resource America or its subsidiaries.
On May
14, 2009, we borrowed $4.5 million from Resource America. We repaid
the promissory note the same day and paid Resource America a commitment fee of
$180,000.
On
December 1, 2009, we purchased a membership interest in VIP Borrower, LLC (an
unconsolidated RRE VIE that holds our interests in a real estate joint venture)
from Resource America at book value. This joint venture, which is
structured as a credit facility with Varde Investment Partners, LP acting as
lender, finances the acquisition of distressed properties and mortgage loans and
has the objective of repositioning both the directly owned properties and the
properties underlying the mortgage loans to enhance their value. We
acquired the membership interests for $2.1 million. The agreement
requires us to contribute 3% of the total funding required for each asset
acquisition on a monthly basis. The investment balance of $2.1
million at December 31, 2009 is recorded as an investment in unconsolidated
entities on our consolidated balance sheet.
LEAF Financial Corp. a majority-owned
subsidiary of Resource America, originates and manages our equipment lease and
note investments. We purchase these investments from LEAF Financial
at a price equal to their book value plus a reimbursable origination cost not to
exceed 1% to compensate LEAF Financial for its origination costs. In
addition, we pay LEAF Financial an annual servicing fee, equal to 1% of the book
value of managed assets, for servicing our equipment lease
investments. During the year ended December 31, 2009, we paid LEAF
Financial $505,000 in annual servicing fees.
On June 30, 2009, we sold our sole
membership interest in one of our subsidiaries that held a pool of leases valued
at $89.8 million and transferred the $82.3 million balance of the related
secured term facility to Resource America. No gain or loss was
recognized on the sale of this membership interest. We received a
note of $7.5 million from Resource America for the equity in the portfolio on
June 30, 2009. The promissory note bore interest at LIBOR plus
3%. On July 1, 2009, $4.5 million of the promissory note was
repaid. The remaining outstanding principal balance of the note of
$3.0 million was paid in full on August 3, 2009.
Until 1996, director Edward E. Cohen, a
director who was our Chairman from our inception until November 2009, was of
counsel to Ledgewood, P.C., a law firm. In addition, one of our executive
officers, Jeffrey F. Brotman, was employed by Ledgewood until 2007. For
the year ended December 31, 2009, we paid Ledgewood $660,000 for legal
services. Mr. Cohen receives certain debt service payments from Ledgewood
related to the termination of his affiliation with Ledgewood and its redemption
of his interest in the firm. For the year ended December 31, 2009, those
payments were $120,000. Mr. Brotman also receives certain debt service
payments from Ledgewood related to the termination of his affiliation with
Ledgewood. For the year ended December 31, 2009, those payments were
$40,000.
On March 5, 2010, we entered into a
Promissory Note with LEASE Equity Appreciation Fund II LP (“LEAF II”), that
allows for an $8.0 million facility, of which $3.0 million was funded on March
5, 2010, for a one year term at 12% payable quarterly, with a 1% loan fee and
20% amortization, which is secured by the all encumbered assets of LEAF II and
to be fully repaid by March 3, 2011.
On January 15, 2010, we loaned $2.0
million to Resource Capital Partners, Inc. so that it could acquire a 5.0%
limited partnership interest in Resource Real Estate Opportunity Fund,
L.P. The loan is secured by Resource Capital Partner’s partnership
interest in the Resource Real Estate Opportunity Fund, L.P. The
promissory note bears interest at a fixed rate of 8.0% per annum on the unpaid
principal balance. In the event of default, interest will accrue and be
payable at a rate of 5.0% in excess of the fixed rate. Interest payments
are due quarterly commencing on April 15, 2010. Mandatory principal
payments must also be made to the extent distributable cash or other proceeds
from the partnership represents a return of Resource Capital Partners, Inc.’s
capital. The term of the loan ends on January 14, 2015, with an option to
extend for two additional 12-month periods each.
Policies
and Procedures Regarding Related Transactions
Under our Management Agreement with the
Manager and Resource America, we have established policies regarding the offer
of potential investments to us, our acquisition of those investments and the
allocation of those investments among other programs managed by the Manager or
Resource America. We have also established policies regarding
investing in investment opportunities in which the Manager or Resource America
has an interest and regarding investing in any investment fund or CDO
structured, co-structured or managed by the Manager or Resource
America.
Policies and Procedures Regarding Related Transactions
Under our Management Agreement with the
Manager and Resource America, we have established policies regarding the offer
of potential investments to us, our acquisition of those investments and the
allocation of those investments among other programs managed by the Manager or
Resource America. We have also established policies regarding
investing in investment opportunities in which the Manager or Resource America
has an interest and regarding investing in any investment fund or CDO
structured, co-structured or managed by the Manager or Resource
America.
The Manager and Resource America must
offer us the right to consider all investments they identify that are within the
parameters of our investment strategies and policies. For all
potential investments other than in equipment leases and notes, if the Manager
and Resource America identify an investment that is appropriate both for us and
for one or more other investment programs managed by them, but the amount
available is less than the amount sought by all of their investment programs,
they will allocate the investment among us and such other investment programs in
proportion to the relative amounts of the investment sought by
each. If the portion of the investment allocable to a particular
investment program would be too small for it to be appropriate for that
investment program, either because of economic or market inefficiency,
regulatory constraints (such as REIT qualification or exclusion from regulation
under the Investment Company Act) or otherwise, that portion will be reallocated
among the other investment programs. Investment programs that do not
receive an allocation will have preference in future investments where
investment programs are seeking more of the investment than is available so
that, on an overall basis, each investment program is treated
equitably.
To equitably allocate investments that
the Manager or Resource America has acquired at varying prices, the Manager and
Resource America will allocate the investment so that each investment program
will pay approximately the same average price.
With respect to equipment leases and
notes, if an investment is appropriate for more than one investment program,
including us, the Manager and Resource America will allocate the investment
based on the following factors:
|
|
·
|
which
investment program has been seeking investments for the longest period of
time;
|
|
|
·
|
whether
the investment program has the cash required for the
investment;
|
|
|
·
|
whether
the amount of debt to be incurred with respect to the investment is
acceptable for the investment
program;
|
|
|
·
|
the
effect the investment will have on the investment program’s cash
flow;
|
|
|
·
|
whether
the investment would further diversify, or unduly concentrate, the
investment program’s investments in a particular lessee, class or type of
equipment, location or industry;
and
|
|
|
·
|
whether
the term of the investment is within the term of the investment
program.
|
The Manager and Resource America may
make exceptions to these general policies when other circumstances make
application of the policies inequitable or uneconomic.
The Manager has also instituted
policies designed to mitigate potential conflicts of interest between it and us,
including:
|
|
·
|
We
will not be permitted to invest in any investment fund or CDO structured,
co-structured or managed by the Manager or Resource America other than
those structured, co-structured or managed on our behalf. The
Manager and Resource America will not receive duplicate management fees
from any such investment fund or CDO to the extent we invest in
it.
|
|
|
·
|
We
will not be permitted to purchase investments from, or sell investments
to, the Manager or Resource America, except that we may purchase
investments originated by those entities within 60 days before our
investment.
|
Except as described above or provided
for in our management agreement with the Manager and Resource America, we have
not adopted a policy that expressly prohibits transactions between us or any of
our directors, officers, employees, security-holders or
affiliates. However, our code of business conduct and ethics
prohibits any transaction that involves an actual or potential conflict except
for transactions permitted under guidelines which may be adopted by our Board of
Directors. No such guidelines have been adopted as of the date of
this report. In addition, our Board of Directors may approve a waiver
of the code of ethics and business conduct for a specific transaction, which
must be reported to our stockholders to the extent required by applicable law or
NYSE rule. No such waivers have been granted through the date
hereof.
Director
Independence
Our common stock is listed on the NYSE
and, as a result, we are subject to its listing standards. The board
of directors has determined that Messrs. Beach, Hart, Ickowicz, Levin and Neff
each satisfy the requirement for independence set out in Section 303A.02 of the
rules of the NYSE and that each of these directors has no material relationship
with us (other than being a director and/or a stockholder). In making
its independence determinations, the board of directors sought to identify and
analyze all of the facts and circumstances relating to any relationship between
a director, his immediate family or affiliates and our company and our
affiliates and did not rely on categorical standards other than those contained
in the NYSE rule referenced above.
|
PRINCIPAL
ACCOUNTING FEES AND SERVICES
|
Audit
Fees
The aggregate fees billed by our
independent auditors, Grant Thornton LLP, for professional services rendered for
the audit of our annual financial statements for the years ended December 31,
2009 and 2008 (including a review of internal controls for 2009 and 2008 as
required under Section 404 of the Sarbanes-Oxley Act of 2002) and for the
reviews of the consolidated financial statements included in our Quarterly
Reports on Form 10-Q during each of the years then ended were $572,000 and
$668,000, respectively.
The aggregate fees billed by Grant
Thornton LLP for audit services in connection with the filing of our
registration statements with the Securities and Exchange Commission were
approximately $117,000 and $42,000 for the years ended December 31, 2009 and
2008, respectively.
Audit-Related
Fees
The aggregate fees billed by Grant
Thornton LLP for audit-related services, including consulting on accounting
issues were $0 and $40,000 for the years ended December 31, 2009 and 2008,
respectively.
Tax
Fees
There were no fees paid to Grant
Thornton LLP for professional services related to tax compliance, tax advice or
tax planning for the years ended December 31, 2009 and 2008.
All
Other Fees
We did not incur fees in 2009 and 2008
for other services not included above.
Audit
Committee Pre-Approval Policies and Procedures
The audit committee will, on at least
an annual basis, review audit and non-audit services performed by Grant
Thornton, LLP as well as the fees charged by Grant Thornton, LLP for such
services. Our policy is that all audit and non-audit services must be
pre-approved by the audit committee. All of such services and fees
were pre-approved during the year ended December 31,
2009.
PART
IV
|
EXHIBITS
AND FINANCIAL STATEMENT SCHEDULES
|
(a) The
following documents are filed as part of this Annual Report on Form
10-K:
1. Financial
Statements
Report of
Independent Registered Public Accounting Firm
Consolidated
Balance Sheets at December 31, 2009 and 2008.
Consolidated
Statements of Operation for the years ended December 31, 2009, 2008 and
2007
Consolidated
Statements of Changes in Stockholders’ Equity for years ended
December 31, 2009, 2008 and
2007
Consolidated
Statements of Cash Flows for the years ended December 31, 2009, 2008
and
Notes to
Consolidated Financial Statements
2. Financial Statement
Schedules
Schedule
II –Valuation and Qualifying Accounts
Schedule
IV − Mortgage Loans on Real Estate
3. Exhibits
|
Exhibit
No.
|
Description
|
||
|
3.1
|
Restated
Certificate of Incorporation of Resource Capital Corp. (1)
|
||
|
3.2
|
Amended
and Restated Bylaws of Resource Capital Corp. (1)
|
||
|
4.1
|
Form
of Certificate for Common Stock for Resource Capital Corp. (1)
|
||
|
4.2(a)
|
Junior
Subordinated Indenture between Resource Capital Corp. and Wells Fargo
Bank, N.A., dated May 25, 2006. (2)
|
||
|
4.2(b)
|
Amendment
to Junior Subordinated Indenture and Junior Subordinated Note due 2036
between Resource Capital Corp. and Wells Fargo Bank, N.A., dated October
26, 2009 and effective September 30, 2009.
(11)
|
||
|
4.3(a)
|
Amended
and Restated Trust Agreement among Resource Capital Corp., Wells Fargo
Bank, N.A., Wells Fargo Delaware Trust Company and the Administrative
Trustees named therein, dated May 25, 2006. (2)
|
||
|
4.3(b)
|
Amendment
to Amended and Restated Trust Agreement and Preferred Securities
Certificate among Resource Capital Corp., Wells Fargo Bank, N.A. and the
Administrative Trustees named therein, dated October 26, 2009 and
effective September 30, 2009.
(11)
|
||
|
4.4
|
Amended
Junior Subordinated Note due 2036 in the principal amount of $25,774,000,
dated October 26, 2009.
(11)
|
||
|
4.5(a)
|
Junior
Subordinated Indenture between Resource Capital Corp. and Wells Fargo
Bank, N.A., dated September 29, 2006. (3)
|
||
|
4.5(b)
|
Amendment
to Junior Subordinated Indenture and Junior Subordinated Note due 2036
between Resource Capital Corp. and Wells Fargo Bank, N.A., dated October
26, 2009 and effective September 30, 2009.
(11)
|
||
|
4.6(a)
|
Amended
and Restated Trust Agreement among Resource Capital Corp., Wells Fargo
Bank, N.A., Wells Fargo Delaware Trust Company and the Administrative
Trustees named therein, dated September 29, 2006. (3)
|
||
|
4.6(b)
|
Amendment
to Amended and Restated Trust Agreement and Preferred Securities
Certificate among Resource Capital Corp., Wells Fargo Bank, N.A. and the
Administrative Trustees named therein, dated October 26, 2009 and
effective September 30, 2009.
(11)
|
||
|
4.7
|
Amended
Junior Subordinated Note due 2036 in the principal amount of $25,774,000,
dated October 26, 2009.
(11)
|
||
|
10.1(a)
|
Master
Repurchase Agreement between RCC Real Estate SPE 3, LLC and Natixis Real
Estate Capital.
(4)
|
||
|
10.1(b)
|
First
Amendment to Master Repurchase Agreement between RCC Real Estate SPE 3,
LLC and Natixis Real Estate Capital, dated September 25, 2008. (5)
|
||
|
10.1(c)
|
Second
Amendment to Master Repurchase Agreement between RCC Real Estate SPE 3,
LLC and Natixis Real Estate Capital, dated November 25, 2008. (6)
|
||
|
10.1(d)
|
Letter
Agreement with respect to master Repurchase Agreement between Natixis Real
Estate Capital, Inc. and RCC Real Estate SPE 3, LLC, dated as of March 13,
2009. (7)
|
|
10.1(e)
|
Letter
Agreement with respect to Master Repurchase Agreement between Natixis Real
Estate Capital and RCC Real Estate SPE 3, LLC, dated June 29, 2009. (8)
|
||
|
10.2(a)
|
Guaranty
made by Resource Capital Corp. as guarantor, in favor Natixis Real Estate
Capital, Inc., dated April 20, 2007. (4)
|
||
|
10.2(b)
|
Second
Amendment to Guaranty made by Resource Capital Corp. as guarantor, in
favor of Natixis Real Estate Capital, Inc., dated September 25, 2008.
(5)
|
||
|
10.3(a)
|
Amended
and Restated Management Agreement between Resource Capital Corp., Resource
Capital Manager, Inc. and Resource America, Inc. dated as of June 30,
2008. (9)
|
||
|
10.3(b)
|
First
Amendment to Amended and Restated Management Agreement between Resource
Capital Corp., Resource Capital Manager, Inc. and Resource America, Inc.
dated as of June 30, 2008. (10)
|
||
|
10.4
|
2005
Stock Incentive Plan. (1)
|
||
|
10.5
|
2007
Omnibus Equity Compensation Plan.
(12)
|
||
|
14.1
|
Code
of Ethics
|
||
|
21.1
|
List
of Subsidiaries of Resource Capital Corp.
|
||
|
23.1
|
Consent
of Grant Thornton LLP
|
||
|
31.1
|
Rule
13a-14(a)/Rule 15d-14(a) Certification of Chief Executive
Officer.
|
||
|
31.2
|
Rule
13a-14(a)/Rule 15d-14(a) Certification of Chief Financial
Officer.
|
||
|
32.1
|
Certification
Pursuant to 18 U.S.C. Section 1350.
|
||
|
32.2
|
Certification
Pursuant to 18 U.S.C. Section 1350.
|
|
(1)
|
Filed
previously as an exhibit to the Company’s registration statement on Form
S-11, Registration No. 333-126517.
|
|
(2)
|
Filed
previously as an exhibit to the Company’s Quarterly Report on Form 10-Q
for the quarter ended June 30,
2006.
|
|
(3)
|
Filed
previously as an exhibit to the Company’s Quarterly Report on Form 10-Q
for the quarter ended September 30,
2006.
|
|
(4)
|
Filed
previously as an exhibit to the Company’s Current Report on Form 8-K filed
on April 23, 2007.
|
|
(5)
|
Filed
previously as an exhibit to the Company’s Current Report on Form 8-K filed
on September 29, 2008.
|
|
(6)
|
Filed
previously as an exhibit to the Company’s Current Report on Form 8-K filed
on December 2, 2008.
|
|
(7)
|
Filed
previously as an exhibit to the Company’s Current Report on Form 8-K filed
on March 17, 2009.
|
|
(8)
|
Filed
previously as an exhibit to the Company’s Current Report on Form 8-K filed
on July 6, 2009.
|
|
(9)
|
Filed
previously as an exhibit to the Company’s Current Report on Form 8-K filed
on July 3, 2008.
|
|
(10)
|
Filed
previously as an exhibit to the Company’s Current Report on Form 8-K filed
on October 20, 2009.
|
|
(11)
|
Filed
previously as an exhibit to the Company’s Quarterly Report on Form 10-Q
for the quarter ended September 30,
2009.
|
|
(12)
|
Filed
previously as an exhibit to the Company’s Annual Report on Form 10-K for
the year ended December 31, 2008.
|
Pursuant to the requirements of Section
13 or 15(d) of the Securities Exchange Act of 1934, the registrant has duly
caused this report to be signed on its behalf by the undersigned, thereunto duly
authorized.
|
RESOURCE
CAPITAL CORP. (Registrant)
|
|||
|
March
15, 2010
|
By:
|
/s/ Jonathan Z. Cohen | |
| Jonathan Z. Cohen | |||
| Chief Executive Officer and President | |||
Pursuant to the requirements of the
Securities Exchange Act of 1934, this report has been signed below by the
following persons on behalf of the registrant and in the capacities and on the
dates indicated.
|
/s/
Steven J. Kessler
|
Chairman
of the Board
|
March
15, 2010
|
|
STEVEN
J. KESSLER
|
||
|
/s/
Jonathan Z. Cohen
|
Director,
President and Chief Executive Officer
|
March
15, 2010
|
|
JONATHAN
Z. COHEN
|
||
|
/s/
Walter T. Beach
|
Director
|
March
15, 2010
|
|
WALTER
T. BEACH
|
||
|
/s/
Edward E. Cohen
|
Director
|
March
15, 2010
|
|
EDWARD
E. COHEN
|
||
|
/s/
William B. Hart
|
Director
|
March
15, 2010
|
|
WILLIAM
B. HART
|
||
|
/s/
Gary Ickowicz
|
Director
|
March
15, 2010
|
|
GARY
ICKOWICZ
|
||
|
/s/
Murray S. Levin
|
Director
|
March
15, 2010
|
|
MURRAY
S. LEVIN
|
||
|
/s/
P. Sherrill Neff
|
Director
|
March
15, 2010
|
|
P.
SHERRILL NEFF
|
||
|
/s/
David J. Bryant
|
Senior
Vice President
|
March
15, 2010
|
|
DAVID
J. BRYANT
|
Chief
Financial Officer,
|
|
|
Chief
Accounting Officer and Treasurer
|
||
SCHEDULE
II
Resource
Capital Corp.
Valuation
and Qualifying Accounts
(dollars
in thousands)
|
Balance
at
beginning
of period
|
Charge
to expense
|
Write-offs
|
Recoveries
|
Balance
at
end
of period
|
||||||||||||||||
|
Allowance
for loans and lease losses:
|
||||||||||||||||||||
|
Year Ended December 31,
2009
|
$ | 44,317 | $ | 61,383 | $ | (57,450 | ) | $ | 12 | $ | 48,262 | |||||||||
|
Year Ended December 31,
2008
|
$ | 5,918 | $ | 46,160 | $ | (7,761 | ) | $ | − | $ | 44,317 | |||||||||
Schedule IV—Mortgage
Loans on Real Estate
As
of December 31, 2009
(Dollars
in thousands)
|
Net
|
||||||||||||||||||||||
|
Interest
|
Final
|
Periodic
|
Face
|
Carrying
|
||||||||||||||||||
|
Description/
|
Payment
|
Maturity
|
Payment
|
Prior
|
Amount
of
|
Amount
of
|
||||||||||||||||
|
Type
of Loan/ Borrower
|
Location
|
Rates
|
Date
|
Terms
(1)
|
Liens
(2)
|
Loans
(3)
|
Loans
|
|||||||||||||||
|
Whole
Loans:
|
||||||||||||||||||||||
|
Borrower A
|
Multi-Family/
San
Francisco, CA
|
LIBOR
+ 4.25%
|
04/8/2010
|
I/O | − | 33,719 | 24,172 | |||||||||||||||
|
Borrower B
|
Multi-Family/
Renton,
WA
|
LIBOR
+ 3.50%
|
01/10/2012
|
I/O | − | 31,100 | 30,846 | |||||||||||||||
|
Borrower C
|
Hotel/
Tucson,
AZ
|
LIBOR
+ 3.50%
|
12/01/2016
|
I/O | − | 31,500 | 31,243 | |||||||||||||||
|
Borrower D-1
|
Hotel/
Los
Angeles, CA
|
LIBOR
+ 8.235%
|
06/05/2010
|
I/O | (4) | − | 28,000 | 27,736 | ||||||||||||||
|
Borrower D-2
|
Hotel/
Los
Angeles, CA
|
LIBOR
+ 10.0%
|
06/05/2010
|
I/O | (4) | − | 5,350 | 5,306 | ||||||||||||||
|
Borrower E
|
Multi-Family/
Northglenn,
CO
|
LIBOR
+ 2.60%
|
03/05/2010
|
I/O | − | 28,000 | 27,746 | |||||||||||||||
|
Borrower F
|
Retail/
Hayward,
CA
|
LIBOR
+ 2.50%
|
01/05/2012
|
I/O | − | 24,145 | 23,948 | |||||||||||||||
|
Borrower G
|
Multi-Family/
San
Francisco, CA
|
LIBOR
+ 4.25%
|
04/08/2010
|
I/O | − | 33,078 | 23,861 | |||||||||||||||
|
Borrower H
|
Hotel/
Studio
City, CA
|
LIBOR
+ 3.20%
|
02/05/2010
|
I/O | − | 25,750 | 25,539 | |||||||||||||||
|
Borrower I
|
Land/
Studio
City, CA
|
LIBOR
+ 2.95%
|
02/05/2010
|
I/O | − | 26,150 | 25,936 | |||||||||||||||
|
All other Whole Loans
Individually less than
3%
|
217,672 | 215,685 | ||||||||||||||||||||
|
Total
Whole Loans
|
484,464 | 462,018 | ||||||||||||||||||||
|
Mezzanine
Loans:
|
||||||||||||||||||||||
|
Borrower J
|
Hotel/
Various
|
LIBOR
+ 2.85%
|
05/9/2010
|
I/O | − | 38,072 | 37,775 | |||||||||||||||
|
All other Whole Loans
Individually less than
3%
|
144,451 | 143,458 | ||||||||||||||||||||
|
Total
Mezzanine Loans
|
182,523 | 181,233 | ||||||||||||||||||||
|
B
Notes:
|
||||||||||||||||||||||
|
Borrow K
|
Office/
New
York, NY
|
FIXED
+ 7.19%
|
07/11/2016
|
I/O | − | 23,718 | 23,679 | |||||||||||||||
|
All other Whole Loans
Individually less than
3%
|
57,732 | 57,131 | ||||||||||||||||||||
|
Total
B Notes
|
81,450 | 80,810 | ||||||||||||||||||||
|
Total
Loans
|
748,437 | (5) | 724,061 | (6) | ||||||||||||||||||
|
(1)
|
IO
= interest only.
|
|
(2)
|
Represents
only Third Party Liens
|
|
(3)
|
Does
not include unfunded commitments.
|
|
(4)
|
Borrower
D is a whole loan and the participations above represent the Senior (D-1)
and Mezzanine (D-2) portions.
|
|
(5)
|
All
loans are current with respect to principal and interest payments
due.
|
|
(6)
|
The
net carrying amount of loans includes an allowance for loan loss of $29.3
million at December 31, 2009 allocated as follows: Whole Loans
($22.2 million); Mezzanine Loans ($6.4 million) and B Notes ($0.7
million).
|