Attached files
| file | filename |
|---|---|
| EX-23.1 - CONSENT OF MOSS ADAMS L.L.P. - PACIFIC CONTINENTAL CORP | consentomossadams.htm |
| EX-31.1 - 302 CERTIFICATION, CEO - PACIFIC CONTINENTAL CORP | certification302ceo.htm |
| EX-31.2 - 302 CERTIFICATION, CFO - PACIFIC CONTINENTAL CORP | certification302cfo.htm |
| EX-32 - SECTION 1350 CERTIFICATION - PACIFIC CONTINENTAL CORP | certificationsection1350.htm |
SECURITIES
& EXCHANGE COMMISSION
Washington
D.C. 20549
FORM
10-K
[ X
] ANNUAL REPORT PURSUANT TO SECTION 13 OR 15(d) OF THE SECURITIES
EXCHANGE ACT OF 1934.
[ ] TRANSITION
REPORT PURSUANT TO SECTION 13 OR 15(d) OF THE SECURITIES EXCHANGE ACT OF
1934
FOR THE
FISCAL YEAR ENDED DECEMBER 31, 2009
COMMISSION
FILE NUMBER 0-30106
PACIFIC
CONTINENTAL CORPORATION
(Exact
name of registrant as specified in its charter)
OREGON 93-1269184
(State of
Incorporation)
(IRS Employer Identification No)
111
West 7th Avenue
Eugene,
Oregon 97401
(Address
of principal executive offices)
(541)
686-8685
(Registrant’s
telephone number)
Securities
registered pursuant to section 12(b) of the Act:
Title of Each
Class Name
of Each Exchange on Which Registered
Common
Stock, No par value per
share Nasdaq
Global Select Market
Securities
registered pursuant to 12(g) of the Act:
None
Indicate
by check mark if the registrant is a well-known seasoned issuer, as defined in
Rule 405 of the Securities
Act Yes __No X
Indicate
by check mark if the registrant is not required to file report pursuant to
Section 13 or Section 15(d) of the
Act Yes __No X
Check
whether the registrant (1) has filed all reports required to be filed by Section
13 or 15(d) of the Securities Exchange Act of 1934 during the preceding 12
months (or for such shorter period that the registrant was required to file such
reports), and (2) has been subject to such filing requirements for the past 90
days. Yes X No
___
Indicate
by check mark whether the registrant has submitted electronically and posted on
its corporate Website, if any, every Interactive Data File required to be
submitted and posted pursuant to Rule 405 of Regulations S-T (232.405 of this
chapter) during the preceding 12 months (or for such shorter period that the
registrant was required to submit and post such files).
Yes
______ No
_____
Check if
there is no disclosure of delinquent filers in response to item 405 of
Regulation S-K contained in this form, and no disclosure will be contained, to
the best of the registrant’s knowledge, in definitive proxy or information
statements incorporated by reference in Part III of this form 10-K or any
amendment to this Form 10-K. ( X )
Indicate
by check mark whether the registrant is a large accelerated filer, an
accelerated filer, a non-accelerated filer, or a smaller reporting
company.
Large
accelerated
filer __ Accelerated
filer X Non-accelerated
filer __ Smaller Reporting
Company __
Indicate
by check mark whether the registrant is a shell company (as defined in Rule
12b-2 of the Exchange
Act. Yes __ No X
The
aggregate market value of the voting stock held by non-affiliates of the
registrant at June 30, 2009 (the last business day of the most recent second
quarter) was $143,056,040 based on the closing price as quoted on the NASDAQ
Global Market on that date.
The
number of shares outstanding of the registrant’s common stock, no par value, as
of March 5, 2010, was 18,393,773.
DOCUMENTS
INCORPORATED BY REFERENCE
Part III
incorporates by reference information from the registrant’s definitive proxy
statement for the 2010 annual meeting of shareholders.
PACIFIC
CONTINENTAL CORPORATION
FORM
10-K
ANNUAL
REPORT
TABLE OF
CONTENTS
| PART 1 | Page | |
|
PART II
|
||
|
PART III
|
(Items
10 through 14 are incorporated by reference from Pacific
Continental Corporation’s definitive proxy statement for the annual
meeting of shareholders scheduled for April 19,
2010)
|
|
|
77
|
||
|
PART IV
|
||
|
79
|
||
|
80
|
PART
I
Item
1. Business
General
Pacific
Continental Corporation (the “Company” or the “Registrant”) is an Oregon
corporation and registered bank holding company located in Eugene,
Oregon. The Company was organized on June 7, 1999, pursuant to a
holding company reorganization of Pacific Continental Bank, its wholly-owned
subsidiary (“the Bank”).
The
Company’s principal business activities are conducted through the Bank, an
Oregon state-chartered bank with deposits insured by the Federal Deposit
Insurance Corporation (“FDIC”). The Bank has two subsidiaries,
PCB Service Corporation (presently inactive), which formerly held and managed
Bank property, and PCB Loan Services (presently inactive), which formerly
managed certain other real estate owned.
The Bank
operates in three primary markets: Portland, Oregon / Southwest Washington;
Seattle, Washington; and Eugene, Oregon. At December 31, 2009, the
Bank operated fourteen full-service offices in six Oregon and three Washington
cities.
Results
For the
year ended December 31, 2009, the consolidated net loss of the Company was $4.9
million or $0.35 per diluted share. The net loss in 2009 was due to
the elevated $36.0 million provision for loan losses. At December 31,
2009, the consolidated shareholders’ equity of the Company was $165.7 million
with 18.4 million shares outstanding and a book value of $9.01 per
share. Total assets were $1,199.1 million. Loans net of
allowance for loan losses and unearned fees, were $931.0 million at December 31,
2009 and represented 77.6% of total assets. Deposits totaled $827.9
million at year-end 2009 with core deposits representing 93.2% or $772.0 million
of total deposits. Core deposits are defined as all deposits gathered
locally and include local time deposits over $100 thousand. During
the year 2009, the Company successfully raised $55.3 million in new capital
through a private offering and a public offering. On January 7, 2009,
the Company announced completion of a private placement of 750 thousand shares
of common stock at $13.50 per share. The net proceeds from the
offering, after underwriting discounts and transaction costs, were approximately
$9.6 million. Due to this successful capital raise in private equity markets, on
January 14, 2009, the Company announced that it had declined to participate in
the US Treasury Capital Purchase Program despite
receiving preliminary approval from the US Treasury to receive up to
$30 million in new capital through issuance of preferred stock. On
October 20, 2009, the Company announced that it had raised approximately $45.7
million of capital, net of underwriting discounts and transaction costs, through
an underwritten public offering by issuing 5.52 million shares of its common
stock at a price of $8.75 per share. At December 31, 2009, the
Company had a tier 1 leverage capital ratio, tier 1 risk-based capital ratio,
and total risk-based capital ratio, of 13.66%, 14.38%, and 15.63%, respectively,
all of which are significantly above the minimum “well-capitalized” level for
all capital ratios under FDIC guidelines of 5%, 6%, and 10%,
respectively. For more information regarding the Company’s financial
condition and results of operations, see “Management’s Discussion and Analysis
of Financial Condition and Results of Operations” and “Financial Statements and
Supplementary Data” in sections 6 and 7 of this Form 10-K.
THE
BANK
General
The Bank
commenced operations on August 15, 1972. At December 31, 2009, the
Bank operated fourteen banking offices in Oregon and Washington. The
primary business strategy of the Bank is to operate in large commercial markets
and to provide comprehensive banking and related services tailored to
community-based business, not-for-profits, professional service providers and
banking services for business owners and executives. The Bank
emphasizes the diversity of its product lines, high levels of personal service,
and through technology, offers convenient access typically associated with
larger financial institutions, while maintaining local decision-making authority
and market knowledge, typical of a local community bank. More
information on the Bank and its banking services can be found on its
Website. The Bank operates under the banking laws of the State of
Oregon, State of Washington and the rules and regulations of the FDIC and the
Federal Reserve Bank of San Francisco.
-3-
Primary
Market Area
The
Bank’s primary markets consist of metropolitan Portland, which includes
Southwest Washington, and metropolitan Eugene in the State of Oregon and
metropolitan Seattle in the State of Washington. The Bank has five
full-service banking offices in the metropolitan Portland and Southwest
Washington area, seven full-service banking offices in the metropolitan Eugene
area, and two full-service offices in the metropolitan Seattle
area. The Bank has its headquarters and administrative office in
Eugene, Oregon.
Competition
Commercial
banking in the states of Oregon and Washington is highly competitive with
respect to providing banking services, including making loans and attracting
deposits. The Bank competes with other banks, as well as with savings
and loan associations, savings banks, credit unions, mortgage companies,
investment banks, insurance companies, and other financial
institutions. Banking in Oregon and Washington is dominated by
several large banking institutions, including U.S. Bank, Wells Fargo Bank, Bank
of America, Key Bank and Chase, which together account for a majority of the
total commercial and savings bank deposits in Oregon and
Washington. These competitors have significantly greater financial
resources and offer a much greater number of branch locations. The
Bank has attempted to offset the advantage of the larger competitors by focusing
on certain market segments, providing high levels of customization and personal
service, and tailoring its technology, products, and services to the specific
market segments that the Bank serves.
In
addition to larger institutions, numerous “community” banks and credit unions
have been formed, expanded or moved into the Bank’s three primary areas and have
developed a similar focus to the Bank. These institutions have
further increased competition in all three of the Bank’s primary
markets. This number of similar financial institutions and an
increased focus by larger institutions in the Bank’s primary markets has led to
intensified competition in all aspects of the Bank’s business, particularly in
the area of loan and deposit pricing.
The
adoption of the Gramm-Leach-Bliley Act of 1999 (the “GLB Act”) has led to
further intensification of competition in the financial services industry.
The GLB Act has eliminated many of the barriers to affiliation among providers
of various types of financial services and has permitted business combinations
among financial service providers such as banks, insurance companies, securities
or brokerage firms, and other financial service providers. Additionally,
the rapid adoption of financial services through the Internet has reduced or
even eliminated many barriers to entry by financial services providers
physically located outside our market area. For example, remote deposit services
allow depository companies physically located in other geographical markets to
service local businesses with minimal cost of entry. Although the Bank has
been able to compete effectively in the financial services business in its
markets to date, there can be no assurance that it will be able to continue to
do so in the future.
The
financial services industry has experienced widespread consolidation over the
last decade and more recently this consolidation has accelerated due to closures
of banks by the FDIC. The Company anticipates that consolidation among
financial institutions in its market area will continue. In particular,
the current economic conditions suggest a number of bank failures are possible
in the Company’s market areas that will contribute to consolidation in the
industry. The Company seeks acquisition opportunities, including FDIC
assisted transactions, from time to time, in its existing markets and in new
markets of strategic importance. However, other financial institutions
aggressively compete against the Bank in the acquisition market.
Some of these institutions may have greater access to capital markets, larger
cash reserves, and stock for use in acquisitions that is more liquid and more
highly valued by the market.
Services
Provided
The Bank
offers a full array of financial service products to meet the banking needs of
its targeted segments in the market areas served. The Bank regularly
reviews the profitability and desirability of various product offerings,
particularly new product offerings, to assure on-going viability.
Deposit
Services
The Bank
offers a full range of deposit services that are typically available in most
banks and other financial institutions, including checking, savings, money
market accounts, and time deposits. The transaction accounts and time
deposits are tailored to the Bank’s primary markets and market segments at rates
competitive with those offered in the area. Additional deposits are
generated through national networks for institutional deposits All
deposit accounts are insured by the FDIC to the maximum amount permitted by
law.
-4-
The Bank
has invested continuously in image technology since 1994 for the processing of
checks. The Bank was the first financial institution in Lane,
Multnomah, Clackamas, and Washington Counties to offer this
service. Due to this investment in image technology, commencing in
July 2007, the Bank has been able to accelerate its funds availability by
presenting all items for clearing to its correspondent banks via an imaged file.
In addition, the Bank provides on-line cash management, remote deposit capture,
and banking services to businesses and consumers. The Bank also allows 24-hour
customer access to deposit and loan information via telephone and on-line cash
management products.
Lending
Activities
The Bank
emphasizes specific areas of lending within its primary market areas: loans to
community-based businesses, professional service providers, not-for-profit
organizations and banking services for business owners and
executives.
Commercial
loans, secured and unsecured, are made primarily to professionals,
community-based businesses, and not-for-profit organizations. These
loans are available for general operating purposes, acquisition of fixed assets,
purchases of equipment and machinery, financing of inventory and accounts
receivable, and other business purposes. The Bank also originates
Small Business Administration (“SBA”) loans and is a national preferred
lender.
Within
its primary markets, the Bank originates permanent and construction loans
financing commercial facilities and pre-sold, custom, and speculative home
construction. The major thrust of residential construction lending is
smaller in-fill construction projects consisting of single-family
residences. However, due to the rapid deterioration in the national
and regional housing market, the Bank severely restricted lending on speculative
home construction and significantly reduced its exposure to residential
construction lending. In addition, due to the economic recession and
softness in commercial real estate markets, the Bank has taken steps to reduce
its exposure to commercial real estate loans, both for construction of new
facilities and permanent loans for commercial facilities, particularly
investor-owned facilities. The focus of the Bank’s commercial real
estate lending activities is primarily on owner-occupied
facilities. The Bank also finances requests for multi-family
residences.
Inter-agency
guidelines adopted by federal bank regulators mandate that financial
institutions establish real estate lending policies with maximum allowable real
estate loan-to-value limits, subject to an allowable amount of non-conforming
loans as a percentage of capital. The Board of Directors has approved
specific lending policies and procedures for the Bank, and management is
responsible for implementation of the policies. The lending policies
and procedures include guidelines for loan term, loan-to-value ratios that are
within established federal banking guidelines, collateral appraisals, and cash
flow coverage. The loan policies also vest varying levels of loan
authority in management, the Bank’s Loan Committee, and the Board of
Directors. Bank management monitors lending activities through
management meetings, loan committee meetings, monthly reporting, and periodic
review of loans by third-party contractors.
Fixed-rate
and variable rate residential mortgage loans are offered through the Bank’s
mortgage loan department. Most residential mortgage loans originated
are sold in the secondary market along with the mortgage loan servicing
rights.
The Bank
makes secured and unsecured loans to individuals for various purposes including
purchases of automobiles, mobile homes, boats, and other recreational vehicles,
home improvements, education, and personal investment.
Merchant
and Card Services
The Bank
provides merchant card payment services, through an outside processor, for its
client base, including community-based businesses, not-for-profits,
and professional service providers. This includes processing of
credit card transactions and issuance of business credit cards. This
service is an integral part of the Bank’s strategy to focus on marketing to
community-based business, not-for-profits, and professional service
providers. During 2009, the Company processed approximately $190
million in credit card transactions for its merchant
clients. The Bank also offers credit card services to its
business customers and uses an outside vendor for credit card
processing. The Bank does not issue credit cards to
individuals.
-5-
Other
Services
The Bank
provides other traditional commercial and consumer banking services, including
cash management products for businesses, on-line banking, safe deposit services,
debit and ATM cards, ACH transactions, savings bonds, cashier’s checks,
travelers’ checks, notary services and others. The Bank is a member
of numerous ATM networks and utilizes an outside processor for the processing of
these automated transactions.
Subsequent
to the end of the year, the Bank entered into an agreement with Money Pass, an
ATM network provider. This agreement will permit all Bank customers
to use Money Pass ATM’s located throughout the country at no charge to the
customer.
Employees
At
December 31, 2009, the Bank employed 254 full-time equivalent (FTE)
employees with 26 FTE’s in the Seattle market, 53 FTE’s in the Portland market,
82 FTE’s in the Eugene market, and 93 FTE’s in administrative functions located
in Eugene, Oregon. None of these employees are represented by labor
unions, and management believes that the Company’s relationship with employees
is good. The Company emphasizes a positive work environment for its
employees, which is validated by recognition from independent third
parties. During 2009, the Bank was recognized for the eighth
consecutive year by Oregon
Business Magazine as one of Oregon’s Best 100 Companies
for which to work, and was the highest rated financial institution in the
state. In 2004, the Bank was named as the number one small company
(employees under 250) to work for in the State of Oregon by Oregon Business
Magazine. The Bank and its employees have also been recognized
for their involvement in the community. Management continually
strives to retain and attract top talent as well as provide career development
opportunities to enhance skill levels. A number of benefit programs
are available to eligible employees, including group medical plans, paid sick
leave, paid vacation, group life insurance, 401(k) plan, and equity compensation
plans.
Supervision
and Regulation
General
The
following discussion provides an overview of certain elements of the extensive
regulatory framework applicable to the Company and the Bank. This regulatory
framework is primarily designed for the protection of depositors, federal
deposit insurance funds and the banking system as a whole, rather than
specifically for the protection of shareholders. Due to the breadth and growth
of this regulatory framework, our costs of compliance continue to increase in
order to monitor and satisfy these requirements.
To the
extent that this section describes statutory and regulatory provisions, it is
qualified by reference to those provisions. These statutes and regulations, as
well as related policies, are subject to change by Congress, state legislatures
and federal and state regulators. Changes in statutes, regulations or regulatory
policies applicable to us, including the interpretation or implementation
thereof, could have a material effect on our business or operations. Recently,
in light of the recent financial crisis, numerous proposals to modify or expand
banking regulation have surfaced. Based on past history, if any are approved,
they will add to the complexity and cost of our business.
Federal
Bank Holding Company Regulation
General. The
Company is a bank holding company as defined in the Bank Holding Company Act of
1956, as amended (“BHCA”), and is therefore subject to regulation, supervision
and examination by the Federal Reserve. In general, the BHCA limits the business
of bank holding companies to owning or controlling banks and engaging in other
activities closely related to banking. The Company must file reports with and
provide the Federal Reserve such additional information as it may require. Under
the Financial Services Modernization Act of 1999, a bank holding company may
apply to the Federal Reserve to become a financial holding company, and thereby
engage (directly or through a subsidiary) in certain expanded activities deemed
financial in nature, such as securities brokerage and insurance
underwriting.
Holding Company Bank
Ownership. The BHCA requires every bank holding company to
obtain the prior approval of the Federal Reserve before (i) acquiring, directly
or indirectly, ownership or control of any voting shares of another bank or bank
holding company if, after such acquisition, it would own or control more than 5%
of such shares; (ii) acquiring all or substantially all of the assets of another
bank or bank holding company; or (iii) merging or consolidating with another
bank holding company.
-6-
Holding Company Control of
Nonbanks. With some exceptions, the BHCA also prohibits a bank
holding company from acquiring or retaining direct or indirect ownership or
control of more than 5% of the voting shares of any company which is not a bank
or bank holding company, or from engaging directly or indirectly in activities
other than those of banking, managing or controlling banks, or providing
services for its subsidiaries. The principal exceptions to these prohibitions
involve certain non-bank activities that, by statute or by Federal Reserve
regulation or order, have been identified as activities closely related to the
business of banking or of managing or controlling banks.
Transactions with
Affiliates. Subsidiary banks of a bank holding company are
subject to restrictions imposed by the Federal Reserve Act on extensions of
credit to the holding company or its subsidiaries, on investments in their
securities, and on the use of their securities as collateral for loans to any
borrower. These regulations and restrictions may limit the Company’s ability to
obtain funds from the Bank for its cash needs, including funds for payment of
dividends, interest and operational expenses.
Tying
Arrangements. We are prohibited from engaging in certain
tie-in arrangements in connection with any extension of credit, sale or lease of
property or furnishing of services. For example, with certain exceptions,
neither the Company nor its subsidiaries may condition an extension of credit to
a customer on either (i) a requirement that the customer obtain additional
services provided by us; or (ii) an agreement by the customer to refrain from
obtaining other services from a competitor.
Support of Subsidiary
Banks. Under Federal Reserve policy, the Company is expected
to act as a source of financial and managerial strength to the
Bank. This means that the Company is required to commit, as
necessary, resources to support the Bank. Any capital loans a bank holding
company makes to its subsidiary banks are subordinate to deposits and to certain
other indebtedness of those subsidiary banks.
State Law
Restrictions. As an Oregon corporation, the Company is subject
to certain limitations and restrictions under applicable Oregon corporate law.
For example, state law restrictions and limitations in Oregon include
indemnification of directors, distributions to shareholders, transactions
involving directors, officers or interested shareholders, maintenance of books,
records and minutes, and observance of certain corporate
formalities.
Federal
and State Regulation of Pacific Continental Bank
General. The
Bank is an Oregon commercial bank operating in Oregon and Washington with
deposits insured by the FDIC. As a result, the Bank is subject to
supervision and regulation by the Oregon Department of Consumer and Business
Services and the FDIC. These agencies have the authority to prohibit banks from
engaging in what they believe constitute unsafe or unsound banking practices.
Additionally, the Bank’s branches in Washington are subject to supervision and
regulation by the Washington Department of Financial Institutions and must
comply with applicable Washington laws regarding community reinvestment,
consumer protection, fair lending, and intrastate branching.
Community
Reinvestment. The Community Reinvestment Act of 1977 requires
that, in connection with examinations of financial institutions within their
jurisdiction, the FDIC evaluate the record of the financial institution in
meeting the credit needs of its local communities, including low and
moderate-income neighborhoods, consistent with the safe and sound operation of
the institution. A bank’s community reinvestment record is also considered by
the applicable banking agencies in evaluating mergers, acquisitions and
applications to open a branch or facility.
Insider Credit
Transactions. Banks are also subject to certain restrictions
imposed by the Federal Reserve Act on extensions of credit to executive
officers, directors, principal shareholders or any related interests of such
persons. Extensions of credit (i) must be made on substantially the same terms,
including interest rates and collateral, and follow credit underwriting
procedures that are at least as stringent as those prevailing at the time for
comparable transactions with persons not covered above and who are not
employees; and (ii) must not involve more than the normal risk of repayment or
present other unfavorable features. Banks are also subject to certain lending
limits and restrictions on overdrafts to insiders. A violation of these
restrictions may result in the assessment of substantial civil monetary
penalties, the imposition of a cease and desist order, and other regulatory
sanctions.
Regulation of
Management. Federal law (i) sets forth circumstances under
which officers or directors of a bank may be removed by the institution's
federal supervisory agency; (ii) places restraints on lending by a bank to its
executive officers, directors, principal shareholders and their related
interests; and (iii) prohibits management personnel of a bank from serving as a
director or in other management positions of another financial institution whose
assets exceed a specified amount or which has an office within a specified
geographic area.
-7-
Safety and Soundness
Standards. Federal law imposes certain non-capital safety and
soundness standards upon banks. These standards cover internal controls,
information systems and internal audit systems, loan documentation, credit
underwriting, interest rate exposure, asset growth, compensation, fees and
benefits, such other operational and managerial standards as the agency
determines to be appropriate, and standards for asset quality, earnings and
stock valuation. An institution that fails to meet these standards must develop
a plan acceptable to its regulators, specifying the steps that the institution
will take to meet the standards. Failure to submit or implement such a plan may
subject the institution to regulatory sanctions.
Interstate
Banking and Branching
The
Riegle-Neal Interstate Banking and Branching Efficiency Act of 1994 (“Interstate
Act”) relaxed prior interstate branching restrictions under federal law by
permitting nationwide interstate banking and branching under certain
circumstances. Generally, bank holding companies may purchase banks in any
state, and states may not prohibit these purchases. Additionally, banks are
permitted to merge with banks in other states, as long as the home state of
neither merging bank has opted out under the legislation. The Interstate Act
requires regulators to consult with community organizations before permitting an
interstate institution to close a branch in a low-income area. Federal banking
agency regulations prohibit banks from using their interstate branches primarily
for deposit production and the federal banking agencies have implemented a
loan-to-deposit ratio screen to ensure compliance with this
prohibition.
Oregon
and Washington have both enacted “opting in” legislation in accordance with the
Interstate Act, allowing banks to engage in interstate merger transactions,
subject to certain “aging” requirements. Oregon restricts an out-of-state bank
from opening de novo branches. However, once an out-of-state bank has acquired a
bank within Oregon, either through merger or acquisition of all or substantially
all of the bank’s assets or through authorized de novo branching, the
out-of-state bank may open additional branches within Oregon. Under Washington
law, an out-of-state bank may, subject to Department of Financial Institutions’
approval, open de novo branches in Washington or acquire an in-state branch so
long as the home state of the out-of-state bank has reciprocal laws with respect
to de novo branching or branch acquisitions.
Dividends
The
principal source of the Company’s cash is from dividends received from the Bank,
which are subject to government regulation and limitations. Regulatory
authorities may prohibit banks and bank holding companies from paying dividends
in a manner that would constitute an unsafe or unsound banking practice or would
reduce the amount of its capital below that necessary to meet minimum applicable
regulatory capital requirements. Oregon law also limits a bank’s ability to pay
dividends that are greater than retained earnings without approval of the
applicable state regulators. Current guidance from the Federal
Reserve provides, among other things, that dividends per share generally should
not exceed earnings per share, measured over the previous four fiscal
quarters. As a result, since the dividends paid to shareholders over
the last four fiscal quarters have exceeded the Company’s earnings, the Company
does not expect to continue paying dividends at historic levels over the medium
term, and future dividends will depend on sufficient earnings to support them
and approval of appropriate bank regulatory authorities.
Capital
Adequacy
Regulatory Capital
Guidelines. Federal bank regulatory agencies use capital
adequacy guidelines in the examination and regulation of bank holding companies
and banks. The guidelines are “risk-based,” meaning that they are designed to
make capital requirements more sensitive to differences in risk profiles among
banks and bank holding companies.
Tier I and Tier II
Capital. Under the guidelines, an institution’s capital is
divided into two broad categories, Tier I capital and Tier II
capital. Tier I capital generally consists of common stockholders’
equity, surplus and undivided profits. Tier II capital generally
consists of the allowance for loan losses, hybrid capital instruments, and
subordinated debt. The sum of Tier I capital and Tier II capital
represents an institution’s total capital. The guidelines require
that at least 50% of an institution’s total capital consist of Tier I
capital.
Risk-based Capital
Ratios. The adequacy of an institution’s capital is gauged
primarily with reference to the institution’s risk-weighted
assets. The guidelines assign risk weightings to an institution’s
assets in an effort to quantify the relative risk of each asset and to determine
the minimum capital required to support that risk. An institution’s
risk-weighted assets are then compared with its Tier I capital and total capital
to arrive at a Tier I risk-based ratio and a total risk-based
-8-
ratio,
respectively. The guidelines provide that an institution must have a
minimum Tier I risk-based ratio of 4% and a minimum total risk-based ratio of
8%.
Leverage
Ratio. The guidelines also employ a leverage ratio, which is
Tier I capital as a percentage of average total assets, less
intangibles. The principal objective of the leverage ratio is to
constrain the maximum degree to which a bank holding company may leverage its
equity capital base. The minimum leverage ratio is 3%; however, for all but the
most highly rated bank holding companies and for bank holding companies seeking
to expand, regulators expect an additional cushion of at least 1% to
2%.
Prompt Corrective
Action. Under the guidelines, an institution is assigned to
one of five capital categories depending on its total risk-based capital ratio,
Tier I risk-based capital ratio, and leverage ratio, together with certain
subjective factors. The categories range from “well capitalized” to “critically
undercapitalized.” Institutions that are “undercapitalized” or lower
are subject to certain mandatory supervisory corrective actions. During these
challenging economic times, the federal banking regulators have actively
enforced these provisions.
Regulatory
Oversight and Examination
The
Federal Reserve conducts periodic inspections of bank holding companies, which
are performed both onsite and offsite. The supervisory objectives of the
inspection program are to ascertain whether the financial strength of the bank
holding company is being maintained on an ongoing basis and to determine the
effects or consequences of transactions between a holding company or its
non-banking subsidiaries and its subsidiary banks. For holding companies under
$10 billion in assets, the inspection type and frequency varies depending on
asset size, complexity of the organization, and the holding company’s rating at
its last inspection.
Banks are
subject to periodic examinations by their primary regulators. Bank examinations
have evolved from reliance on transaction testing in assessing a bank’s
condition to a risk-focused approach. These examinations are extensive and cover
the entire breadth of operations of the bank. Generally, safety and soundness
examinations occur on an 18-month cycle for banks under $500 million in total
assets that are well capitalized and without regulatory issues, and 12-months
otherwise. Examinations alternate between the federal and state bank regulatory
agency or may occur on a combined schedule. The frequency of consumer compliance
and CRA examinations is linked to the size of the institution and its compliance
and CRA ratings at its most recent examinations. However, the examination
authority of the Federal Reserve and the FDIC allows them to examine supervised
banks as frequently as deemed necessary based on the condition of the bank or as
a result of certain triggering events. Subsequent to December 31,
2009, and based on its annual safety and soundness examination completed by the
FDIC in mid-September, the Bank entered into an informal agreement with the FDIC
and the Oregon Department of Consumer and Business Services, which outlined
specific areas of improvement primarily related to capital levels and levels of
classified assets. In addition, the agreement requires the Company
and the Bank to obtain permission for dividends from the Bank to the Company and
cash dividends to shareholders prior to declaration and payment. At
December 31, 2009, management believes it has achieved all objectives and
improvements requested in the agreement.
Corporate
Governance and Accounting Legislation
Sarbanes-Oxley Act of
2002. The Sarbanes-Oxley Act of 2002 (the “Act”) addresses, among other
things, corporate governance, auditing and accounting, enhanced and timely
disclosure of corporate information, and penalties for non-compliance.
Generally, the Act (i) requires chief executive officers and chief financial
officers to certify to the accuracy of periodic reports filed with the
Securities and Exchange Commission (the “SEC”); (ii) imposes specific and
enhanced corporate disclosure requirements; (iii) accelerates the time frame for
reporting of insider transactions and periodic disclosures by public companies;
(iv) requires companies to adopt and disclose information about corporate
governance practices, including whether or not they have adopted a code of
ethics for senior financial officers and whether the audit committee includes at
least one “audit committee financial expert;” and (v) requires the SEC, based on
certain enumerated factors, to regularly and systematically review corporate
filings.
To deter
wrongdoing, the Act (i) subjects bonuses issued to top executives to
disgorgement if a restatement of a company's financial statements was due to
corporate misconduct; (ii) prohibits an officer or director misleading or
coercing an auditor; (iii) prohibits insider trades during pension fund
“blackout periods”; (iv) imposes new criminal penalties for fraud and other
wrongful acts; and (v) extends the period during which certain securities fraud
lawsuits can be brought against a company or its officers.
As a
publicly reporting company, we are subject to the requirements of the Act and
related rules and regulations issued by the SEC and NASDAQ. After enactment, we
updated our policies and procedures to comply with the Act’s
-9-
requirements
and have found that such compliance, including compliance with Section 404 of
the Act relating to management control over financial reporting, has resulted in
significant additional expense for the Company. We anticipate that we will
continue to incur such additional expense in our ongoing
compliance.
Anti-terrorism
Legislation
USA Patriot Act of
2001. The Uniting and Strengthening America by Providing
Appropriate Tools Required to Intercept and Obstruct Terrorism Act of 2001,
intended to combat terrorism, was renewed with certain amendments in 2006 (the
“Patriot Act”). Certain provisions of the Patriot Act were made
permanent and other sections were made subject to extended “sunset” provisions.
The Patriot Act, in relevant part, (i) prohibits banks from providing
correspondent accounts directly to foreign shell banks; (ii) imposes due
diligence requirements on banks opening or holding accounts for foreign
financial institutions or wealthy foreign individuals; (iii) requires financial
institutions to establish an anti-money-laundering compliance program; and (iv)
eliminates civil liability for persons who file suspicious activity
reports. The Act also includes provisions providing the government
with power to investigate terrorism, including expanded government access to
bank account records. While the Patriot Act has had minimal effect on
our record keeping and reporting expenses, we do not believe that the renewal
and amendment will have a material adverse effect on our business or
operations.
Financial
Services Modernization
Gramm-Leach-Bliley Act of
1999. The Gramm-Leach-Bliley Financial Services Modernization
Act of 1999 brought about significant changes to the laws affecting banks and
bank holding companies. Generally, the Act (i) repeals historical
restrictions on preventing banks from affiliating with securities firms; (ii)
provides a uniform framework for the activities of banks, savings institutions
and their holding companies; (iii) broadens the activities that may be conducted
by national banks and banking subsidiaries of bank holding companies; (iv)
provides an enhanced framework for protecting the privacy of consumer
information and requires notification to consumers of bank privacy policies; and
(v) addresses a variety of other legal and regulatory issues affecting both
day-to-day operations and long-term activities of financial institutions. Bank
holding companies that qualify and elect to become financial holding companies
can engage in a wider variety of financial activities than permitted under
previous law, particularly with respect to insurance and securities underwriting
activities.
Recent
Legislation
Emergency Economic
Stabilization Act of 2008. In response to the recent financial
crisis, the United States government passed the Emergency Economic Stabilization
Act of 2008 (the “EESA”) on October 3, 2008, which provides the United
States Department of the Treasury (the “Treasury”) with broad authority to
implement certain actions intended to help restore stability and liquidity to
the U.S. financial markets.
Insurance of Deposit
Accounts. The EESA included a
provision for a temporary increase from $100,000 to $250,000 per depositor in
deposit insurance effective October 3, 2008 through December 31, 2013.
After December 31, 2013, deposit accounts are expected to again be insured by
the FDIC, generally up to a maximum of $100,000 per separately insured depositor
and up to a maximum of $250,000 for self-directed retirement
accounts.
Deposit Insurance
Assessments. The FDIC imposes an assessment against
institutions for deposit insurance. This assessment is based on the risk
category of the institution and ranges from 5 to 43 basis points of the
institution’s deposits. In December, 2008, the FDIC adopted a rule that raises
the current deposit insurance assessment rates uniformly for all institutions by
7 basis points (to a range from 12 to 50 basis points) effective for the first
quarter of 2009. In February 2009, the FDIC adopted a final rule
modifying the risk-based assessment system and setting initial base assessment
rates beginning April 1, 2009 at 12 to 45 basis points. The rule also
gives the FDIC the authority to, as necessary, implement emergency special
assessments to maintain the deposit insurance fund. On November 12,
2009, the FDIC approved a final rule requiring all FDIC-insured depository
institutions to prepay estimated quarterly assessments for the fourth quarter
2009 and for all of 2010, 2011, and 2012. The prepayment was
collected on December 30, 2009, along with the institutions’ regular quarterly
deposit insurance assessments for the third quarter 2009. For the
fourth quarter of 2009 and all of 2010, the prepaid assessments will be based on
an institution’s total base assessment rate in effect on September 30,
2009. That rate will be increased by 3 basis points for 2011 and 2012
prepayments. The prepaid assessments will be accounted for as prepaid
expense amortized over the three year period.
-10-
Troubled Asset Relief
Program. Pursuant to the EESA, the Treasury has the ability to purchase
or insure up to $700 billion in troubled assets held by financial
institutions under the Troubled Asset Relief Program (“TARP”). On
October 14, 2008, the Treasury announced it would initially purchase equity
stakes in financial institutions under a Capital Purchase Program (the “CPP”) of
up to $350 billion of the $700 billion authorized under the TARP
legislation. The CPP provides direct equity investment of perpetual preferred
stock by the Treasury in qualified financial institutions, as well as a warrant
to purchase common stock. The program is voluntary and requires an institution
to comply with a number of restrictions and provision, including limits on
executive compensation, stock redemptions, and declaration of
dividends. After receiving preliminary approval from the US Treasury
Department to participate in the CPP, the Company elected not to participate in
light of its capital position and due to its ability to raise capital
successfully in private equity markets.
Temporary Liquidity
Guarantee Program. In October 2008, the FDIC announced
the Temporary Liquidity Guarantee Program, which has two components--the Debt
Guarantee Program and the Transaction Account Guarantee Program. Under the
Transaction Account Guarantee Program any participating depository institution
is able to provide full deposit insurance coverage for non-interest bearing
transaction accounts, regardless of the dollar amount. Under the program,
effective November 14, 2008, insured depository institutions that have not opted
out of the FDIC Temporary Liquidity Guarantee Program will be subject to a 0.10%
surcharge applied to non-interest bearing transaction deposit account balances
in excess of $250,000, which surcharge will be added to the institution’s
existing risk-based deposit insurance assessments. Under the Debt Guarantee
Program, qualifying unsecured senior debt issued by a participating institution
can be guaranteed by the FDIC. The Bank chose to participate in both components
of the FDIC Temporary Liquidity Guaranty Program.
American Recovery and
Reinvestment Act of 2009. On February 17, 2009, the
American Recovery and Reinvestment Act of 2009 (“ARRA”) was signed into law.
ARRA is intended to help stimulate the economy and is a combination of tax cuts
and spending provisions applicable to a broad range of areas with an estimated
cost of $787 billion. The impact that ARRA may have on the US economy, the
Company and the Bank cannot be predicted with certainty.
Proposed
Legislation
Proposed
legislation that may affect the Company and the Bank is introduced in almost
every legislative session. Certain of such legislation could
dramatically affect the regulation of the banking industry. In light
of the 2008 financial crisis, legislation reshaping the regulatory landscape for
financial institutions has been proposed. A current proposal includes
measures aimed to prevent another financial crisis like the one in 2008 by
forming a federal regulatory body to protect the interests of consumers by
preventing abusive and risky lending practices, increasing supervision and
regulation on financial firms deemed too big to fail, giving shareholders an
advisory vote on executive pay, and regulating complex derivative
instruments. We cannot predict if any such legislation will be
adopted or if it is adopted how it would affect the business of the Bank or the
Company. Past history has demonstrated that new legislation or
changes to existing laws or regulations usually results in a greater compliance
burden and therefore generally increases the cost of doing
business.
Effects
of Government Monetary Policy
Our
earnings and growth are affected not only by general economic conditions, but
also by the fiscal and monetary policies of the federal government, particularly
the Federal Reserve. The Federal Reserve implements national monetary policy for
such purposes as curbing inflation and combating recession, and its open market
operations in U.S. government securities, control of the discount rate
applicable to borrowings from the Federal Reserve, and establishment of reserve
requirements against certain deposits, influence the growth of bank loans,
investments and deposits, and also affect interest rates charged on loans or
paid on deposits. The nature and impact of future changes in monetary policies,
and their impact on us cannot be predicted with certainty.
-11-
Statistical
Information
All
dollar amounts in the following sections are in thousands except where otherwise
indicated.
Selected
Quarterly Information
The
following chart contains data for the last eight quarters ended December 31,
2009. All data, except per share data, is in thousands of dollars.
|
YEAR
|
2009
|
2008
|
||||||||||||||||||||||||||||||
|
QUARTER
|
Fourth
|
Third
|
Second
|
First
|
Fourth
|
Third
|
Second
|
First
|
||||||||||||||||||||||||
|
Interest
income
|
$ | 17,079 | $ | 16,982 | $ | 16,555 | $ | 16,259 | $ | 16,544 | $ | 16,680 | $ | 16,215 | $ | 16,506 | ||||||||||||||||
|
Interest
expense
|
3,295 | 3,265 | 3,168 | 3,108 | 3,350 | 4,377 | 4,057 | 4,890 | ||||||||||||||||||||||||
|
Net
interest income
|
13,784 | 13,717 | 13,387 | 13,151 | 13,194 | 12,203 | 12,158 | 11,616 | ||||||||||||||||||||||||
|
Provision
for loan loss
|
7,000 | 8,300 | 19,200 | 1,500 | 1,050 | 1,050 | 925 | 575 | ||||||||||||||||||||||||
|
Noninterest
income
|
1,079 | 1,109 | 1,196 | 1,021 | 1,042 | 1,047 | 1,163 | 1,017 | ||||||||||||||||||||||||
|
Noninterest
expense
|
7,452 | 7,014 | 8,646 | 8,050 | 7,435 | 7,497 | 7,463 | 7,167 | ||||||||||||||||||||||||
|
Net
income (loss)
|
24 | 279 | (8,129 | ) | 2,947 | 3,833 | 3,020 | 3,007 | 3,079 | |||||||||||||||||||||||
|
PER
COMMON
|
||||||||||||||||||||||||||||||||
|
SHARE
DATA
|
||||||||||||||||||||||||||||||||
|
Net
income (loss) \(basic)
|
$ | - | $ | 0.02 | $ | (0.63 | ) | $ | 0.23 | $ | 0.32 | $ | 0.25 | $ | 0.25 | $ | 0.26 | |||||||||||||||
|
Net
income (loss) (diluted)
|
$ | - | $ | 0.02 | $ | (0.63 | ) | $ | 0.23 | $ | 0.32 | $ | 0.25 | $ | 0.25 | $ | 0.26 | |||||||||||||||
|
Cash
dividends
|
$ | 0.01 | $ | 0.04 | $ | 0.10 | $ | 0.10 | $ | 0.10 | $ | 0.10 | $ | 0.10 | $ | 0.10 | ||||||||||||||||
|
WEIGHTED
AVERAGE
SHARES
OUTSTANDING
|
||||||||||||||||||||||||||||||||
|
Basic
|
16,863 | 12,873 | 12,873 | 12,812 | 12,039 | 11,978 | 11,963 | 11,940 | ||||||||||||||||||||||||
|
Diluted
|
16,904 | 12,909 | 12,873 | 12,857 | 12,095 | 12,034 | 12,030 | 12,006 | ||||||||||||||||||||||||
Investment
Portfolio
The
following chart contains information regarding the Company’s investment
portfolio. All of the Company’s investment securities are accounted
for as available-for-sale and are reported at estimated fair
value. The difference between estimated fair value and amortized
cost, net of deferred taxes, is recorded as a separate component of
shareholders’ equity.
|
INVESTMENT
PORTFOLIO
|
||||||||||||
|
ESTIMATED
FAIR VALUE
|
||||||||||||
|
December
31,
|
||||||||||||
|
2009
|
2008
|
2007
|
||||||||||
|
(dollars
in thousands)
|
||||||||||||
|
U.S.
Treasury, U.S. Government agencies and corporations
|
$ | 5,000 | $ | 2,029 | $ | 10,541 | ||||||
|
Obligations
of states and political subdivisions
|
6,709 | 7,485 | 7,514 | |||||||||
|
Other
mortgage-backed securities
|
155,909 | 45,419 | 35,939 | |||||||||
|
Total
|
$ | 167,618 | $ | 54,933 | $ | 53,994 | ||||||
-12-
The
following chart presents the fair value of each investment category by maturity
date and includes a weighted average yield for each
period. Mortgage-backed securities have been classified based on
their December 31, 2009 projected average life.
|
SECURITIES
AVAILABLE-FOR-SALE
|
||||||||||||||||||||||||||||||||
|
After
One
|
After
Five
|
|||||||||||||||||||||||||||||||
|
Year
But
|
Years
But
|
|||||||||||||||||||||||||||||||
|
Within
One Year
|
Within
Five Years
|
Within
Ten Years
|
After
Ten
Years
|
|||||||||||||||||||||||||||||
|
Amount
|
Yield
|
Amount
|
Yield
|
Amount
|
Yield
|
Amount
|
Yield
|
|||||||||||||||||||||||||
|
(dollars
in thousands)
|
||||||||||||||||||||||||||||||||
|
US
Treasury, US Government
|
||||||||||||||||||||||||||||||||
|
agencies
and agency
|
|
|||||||||||||||||||||||||||||||
|
mortgage-backed
securities
|
$ | 33,110 | 3.10 | % | $ | 119,762 | 3.72 | % | $ | 6,944 | 5.03 | % | $ | 1,093 | 5.55 | % | ||||||||||||||||
|
Obligations
of states and
|
||||||||||||||||||||||||||||||||
|
political
subdivisions
|
- | - | 2,301 | 3.92 | % | 4,408 | 3.75 | % | - | - | ||||||||||||||||||||||
|
Total
|
$ | 33,110 | 3.10 | % | $ | 122,063 | 3.72 | % | $ | 11,352 | 4.54 | % | $ | 1,093 | 5.55 | % | ||||||||||||||||
Loan
Portfolio
Loans
represent a significant portion of the Company’s total
assets. Average balance and average rates paid by category of loan
for the fourth quarter and full year 2009 is included in the Company’s
“Management’s Discussion and Analysis of Financial Condition and Results of
Operations” included later in this report. The following table
contains information related to the Company’s loan portfolio for the five-year
periods ended December 31, 2009.
|
LOAN
PORTFOLIO
|
||||||||||||||||||||
|
December
31,
|
||||||||||||||||||||
|
2009
|
2008
|
2007
|
2006
|
2005
|
||||||||||||||||
|
(dollars
in thousands)
|
||||||||||||||||||||
|
Commercial
loans
|
$ | 239,450 | $ | 233,513 | $ | 188,940 | $ | 169,566 | $ | 160,988 | ||||||||||
|
Real
estate loans
|
699,539 | 717,119 | 627,140 | 590,855 | 507,479 | |||||||||||||||
|
Consumer
loans
|
6,763 | 7,455 | 8,226 | 9,168 | 12,463 | |||||||||||||||
| 945,752 | 958,087 | 824,306 | 769,589 | 680,930 | ||||||||||||||||
|
Deferred
loan origination fees, net
|
(1,388 | ) | (1,730 | ) | (1,984 | ) | (2,489 | ) | (2,609 | ) | ||||||||||
| 944,364 | 956,357 | 822,322 | 767,100 | 678,321 | ||||||||||||||||
|
Allowance
for loan losses
|
(13,367 | ) | (10,980 | ) | (8,675 | ) | (8,284 | ) | (7,792 | ) | ||||||||||
| $ | 930,997 | $ | 945,377 | $ | 813,647 | $ | 758,816 | $ | 670,529 | |||||||||||
The
following table presents loan portfolio information by loan category related to
maturity and repricing sensitivity. Variable rate loans are included
in the time frame in which the interest rate on the loan could be first
adjusted. At December 31, 2009, the Bank had approximately $280,000
of variable rate loans at their floors that are included in the analysis
below.
-13-
|
MATURITY
AND REPRICING DATA FOR LOANS
|
||||||||||||||||
|
Commercial
|
Real
Estate
|
Consumer
|
Total
|
|||||||||||||
|
(dollars
in thousands)
|
||||||||||||||||
|
Three
months or less
|
$ | 64,729 | $ | 220,262 | $ | 4,310 | $ | 289,301 | ||||||||
|
Over
three months through 12 months
|
9,461 | 41,458 | 547 | 51,466 | ||||||||||||
|
Over
1 year through 3 years
|
25,615 | 172,006 | 450 | 198,071 | ||||||||||||
|
Over
3 years through 5 years
|
55,569 | 208,820 | 774 | 265,163 | ||||||||||||
|
Over
5 years through 15 years
|
84,076 | 41,889 | 489 | 126,454 | ||||||||||||
|
Thereafter
|
- | 15,104 | 193 | 15,297 | ||||||||||||
|
Total
loans
|
$ | 239,450 | $ | 699,539 | $ | 6,763 | $ | 945,752 | ||||||||
Loan
Concentrations
At
December 31, 2009, loans to dental professionals totaled $158,433 and
represented 16.8% of outstanding loans. At December 31, 2009,
residential construction loans totaled $41,714 and represented 4.4% of
outstanding loans. In addition, at December 31, 2009, unfunded loan
commitments for residential construction totaled
$9,948. Approximately 75% of the Bank’s loans are secured by real
estate. Management believes the granular nature of the portfolio, from industry
mix, geographic location and loan size, continues to disperse risk concentration
to some degree.
Nonperforming
Assets
The
following table presents nonperforming loans and assets as of the date
shown.
|
NONPERFORMING ASSETS
|
||||||||||||||||||||
|
December
31,
|
||||||||||||||||||||
|
2009
|
2008
|
2007
|
2006
|
2005
|
||||||||||||||||
|
(dollars
in thousands)
|
||||||||||||||||||||
|
Nonaccrual
loans
|
$ | 32,792 | $ | 4,137 | $ | 4,122 | $ | - | $ | 180 | ||||||||||
|
90
or more days past due and still accruing
|
- | - | - | - | - | |||||||||||||||
|
Total
nonperforming loans
|
32,792 | 4,137 | 4,122 | - | 180 | |||||||||||||||
|
Government
guarantees
|
(446 | ) | (239 | ) | (451 | ) | - | (28 | ) | |||||||||||
|
Net
nonperforming loans
|
32,346 | 3,898 | 3,671 | - | 152 | |||||||||||||||
|
Other
Real Estate Owned
|
4,224 | 3,806 | 423 | - | 131 | |||||||||||||||
|
Total
nonperforming assets
|
$ | 36,570 | $ | 7,704 | $ | 4,094 | $ | - | $ | 283 | ||||||||||
|
Nonperforming
assets as a percentage of
|
||||||||||||||||||||
|
of
total assets
|
3.05 | % | 0.71 | % | 0.43 | % | 0.00 | % | 0.04 | % | ||||||||||
If
interest on nonaccrual loans had been accrued, such income would have been
approximately $2,611, $173, and $140, respectively, for years 2009, 2008 and
2007.
Allowance
for Loan Loss
The
following chart presents information about the Company’s allowance for loan
losses. Management and the Board of Directors evaluate the allowance
monthly and consider the amount to be adequate to absorb possible loan
losses.
-14-
|
ALLOWANCE
FOR LOAN LOSS
|
||||||||||||||||||||
|
December
31,
|
||||||||||||||||||||
|
2009
|
2008
|
2007
|
2006
|
2005
|
||||||||||||||||
|
(dollars
in thousands)
|
||||||||||||||||||||
|
Balance
at beginning of year
|
$ | 10,980 | $ | 8,675 | $ | 8,284 | $ | 7,792 | $ | 5,224 | ||||||||||
|
Charges
to the allowance
|
||||||||||||||||||||
|
Real
estate loans
|
(25,449 | ) | (1,235 | ) | - | - | (214 | ) | ||||||||||||
|
Consumer
loans
|
(198 | ) | (118 | ) | (46 | ) | (71 | ) | (106 | ) | ||||||||||
|
Commercial
|
(8,234 | ) | (124 | ) | (350 | ) | (152 | ) | (316 | ) | ||||||||||
|
Total
charges to the allowance
|
(33,881 | ) | (1,477 | ) | (396 | ) | (223 | ) | (636 | ) | ||||||||||
|
Recoveries
against the allowance
|
||||||||||||||||||||
|
Real
estate loans
|
203 | 128 | 15 | 4 | 37 | |||||||||||||||
|
Consumer
loans
|
9 | 23 | 27 | 20 | 56 | |||||||||||||||
|
Commercial
|
56 | 31 | 20 | 91 | 31 | |||||||||||||||
|
Total
recoveries against the allowance
|
268 | 182 | 62 | 115 | 124 | |||||||||||||||
|
Acquisition
|
- | - | - | - | 2,014 | |||||||||||||||
|
Provisions
|
36,000 | 3,600 | 725 | 600 | 1,100 | |||||||||||||||
|
Unfunded
commitments *
|
- | - | - | - | (34 | ) | ||||||||||||||
|
Balance
at end of the year
|
$ | 13,367 | $ | 10,980 | $ | 8,675 | $ | 8,284 | $ | 7,792 | ||||||||||
|
Net
charge offs as a percentage of total
|
||||||||||||||||||||
|
average
loans
|
3.50 | % | 0.15 | % | 0.04 | % | 0.01 | % | 0.10 | % | ||||||||||
* Allowance for unfunded commitments is presented as part of the other liabilities in the balance sheet and has been omitted from this table since implementation of this accounting practice in 2005.
The
following table sets forth the allowance for loan losses allocated by loan type
at December 31, 2009:
|
December
31,
|
|||||||
|
2009
|
%
of Total
|
2008
|
%
of Total
|
||||
|
Real
estate loans
|
$ 8,660
|
64.8%
|
$ 7,586
|
69.1%
|
|||
|
Consumer
loans
|
66
|
0.5%
|
63
|
0.6%
|
|||
|
Commercial
|
2,557
|
19.1%
|
2,253
|
20.5%
|
|||
|
Unallocated
|
2,084
|
15.6%
|
1,078
|
9.8%
|
|||
|
Allowance
for loan losses
|
$ 13,367
|
100.0%
|
$ 10,980
|
100.0%
|
|||
During
2009, the Bank recorded a provision for loan losses of $36,000 compared to
$3,600 for the year 2008. The increase in the loan loss provision was
related to charge offs and deterioration in the overall credit quality of the
loan portfolio, primarily in residential and commercial real estate
loans. At December 31, 2009, the recorded investment in certain loans
totaling $58,861, net of government guarantees, was considered
impaired. Of the total impaired loans at December 31, 2009, $32,346
were on nonaccrual status with a specific reserve of $1,048 provided for in the
ending allowance for loan losses.
While the
Bank saw some positive trends in fourth quarter 2009 with regard to the overall
credit quality of the loan portfolio, management cannot predict the level of the
provision for loan losses, the level of the allowance for loan losses, nor the
level of nonperforming assets in future quarters as a result of uncertain
economic conditions. At December 31, 2009, and as shown above, the
Bank’s unallocated reserves were $2,084 or 15.6% of the total allowance for loan
losses at year end. Management believes that the allowance for loan
losses at December 31, 2009 is adequate and this level of unallocated reserves
was prudent in light of the economic conditions and uncertainty that exists in
the Northwest markets that the Bank serves.
-15-
Deposits
Deposits
represent a significant portion of the Company’s liabilities. Average
balance and average rates paid by category of deposit is included in the
Company’s “Management’s Discussion and Analysis of Financial Condition and
Results of Operations” of this report. The chart below details the
Company’s time deposits at December 31, 2009. The Company does not
have any foreign deposits. Variable rate deposits are listed by first
repricing opportunity.
|
TIME
DEPOSITS
|
||||||||||||
|
Time
Deposits
|
Time
Deposits
|
|||||||||||
|
of
$100,000
Or
More
|
of
less than
$100,000
|
Total
Time
Deposits
|
||||||||||
|
(dollars
in thousands)
|
||||||||||||
|
2010
|
$ | 40,739 | $ | 58,592 | $ | 99,331 | ||||||
|
2011
|
21,950 | 20,872 | 42,822 | |||||||||
|
2012
|
1,949 | 463 | 2,412 | |||||||||
|
2013
|
3,191 | 1,720 | 4,911 | |||||||||
|
2014
|
100 | 283 | 383 | |||||||||
|
Thereafter
|
102 | - | 102 | |||||||||
| $ | 68,031 | $ | 81,930 | $ | 149,961 | |||||||
Borrowings
The
Company uses short-term borrowings to fund fluctuations in deposits and loan
demand. The Company’s subsidiary, Pacific Continental Bank, has
access to both secured and unsecured overnight borrowing lines. The
secured borrowing lines are collateralized by both loans and
securities. At December 31, 2009, the Bank had secured borrowing
lines totaling approximately $360,000 with the Federal Home Loan Bank of Seattle
(“FHLB”). The borrowing line at the FHLB is limited by the lesser of
the value of collateral pledged or amount of FHLB stock held. At
present, the borrowing line is limited by the amount of stock held, which limits
total borrowings at the FHLB to $239,089. The borrowing line with the
Federal Reserve Bank of San Francisco (“FRB”) is limited by the value of
collateral pledged, which at December 31, 2009 was $110,756. At
December 31, 2009, the Bank also had unsecured borrowing lines with various
correspondent banks totaling $75,000. At December 31, 2009, there was
$231,820 available on secured and unsecured borrowing lines with the FHLB, FRB,
and various correspondent banks.
|
SHORT-TERM
BORROWINGS
|
||||||||||||||||
|
2009
|
2008
|
2007
|
2006
|
|||||||||||||
|
(dollars
in thousands)
|
||||||||||||||||
|
Federal
Funds Purchased, FHLB CMA, Federal Reserve,
|
||||||||||||||||
|
&
Short Term Advances
|
||||||||||||||||
|
Average
interest rate
|
||||||||||||||||
|
At
year end
|
0.34 | % | 0.48 | % | 4.39 | % | 5.55 | % | ||||||||
|
For
the year
|
0.49 | % | 2.25 | % | 5.25 | % | 5.31 | % | ||||||||
|
Average
amount outstanding for the year
|
$ | 144,026 | $ | 182,301 | $ | 93,733 | $ | 73,171 | ||||||||
|
Maximum
amount outstanding at any month end
|
$ | 212,001 | $ | 213,225 | $ | 151,360 | $ | 99,410 | ||||||||
|
Amount
outstanding at year end
|
$ | 118,025 | $ | 193,000 | $ | 151,360 | $ | 99,410 | ||||||||
In addition to the short-term borrowings, at December 31, 2009, the Bank had other FHLB borrowings totaling $75,000 with a weighted average interest rate of 3.32% and a remaining average maturity of approximately 2.8 years. More information on long-term borrowings can be found in the Selected Financial Data in Item 5 and in Note 9 in the Consolidated Financial Statements in Item 7 below.
The
Company’s other long-term borrowings consist of $8,248 in junior subordinated
debentures originated on November 28, 2005 and due on January 7,
2036. The interest rate on the debentures is 6.265% until November
2010 after which it is converted to a floating rate of three-month LIBOR plus
135 basis points.
-16-
We
cannot accurately predict the effect of the current economic downturn on our
future results of operations or market price of our stock.
The
national economy, and the financial services sector in particular, are currently
facing challenges of a scope unprecedented in recent history. We
cannot accurately predict the severity or duration of the current economic
downturn, which has adversely impacted the markets we serve. Any
further deterioration in the economies of the nation as a whole or in our
markets would have an adverse effect, which could be material, on our business,
financial condition, results of operations and prospects, and could also cause
the market price of our stock to decline.
The
current economic downturn in the market areas we serve may continue to adversely
impact our earnings and could increase our credit risk associated with our loan
portfolio.
Substantially
all of our loans are to businesses and individuals in western Washington and
Oregon, and a continuing decline in the economies of these market areas could
have a material adverse effect on our business, financial condition, and results
of operations. A series of large Puget Sound-based businesses,
including Microsoft, Starbucks, and Boeing, have implemented substantial
employee layoffs and scaled back plans for future
growth. Additionally, the acquisition of Washington Mutual by
JPMorgan Chase & Co. has resulted in substantial employee layoffs, and has
resulted in a substantial increase in office space availability in downtown
Seattle. Oregon has also seen a similar pattern of large layoffs in
major metropolitan areas, a continued decline in housing prices, and a
significant increase in the state’s unemployment rate. A further
deterioration in economic conditions in the market areas we serve could result
in the following consequences, any of which could have an adverse impact, which
may be material, on our business, financial condition, and results of
operations:
|
·
|
economic
conditions may worsen, increasing the likelihood of credit defaults by
borrowers;
|
|
·
|
loan
collateral values, especially as they relate to commercial and residential
real estate, may decline further, thereby increasing the severity of loss
in the event of loan defaults;
|
|
·
|
demand
for banking products and services may decline, including services for low
cost and non-interest-bearing deposits;
and
|
|
·
|
changes
and volatility in interest rates may negatively impact the yields on
earning assets and the cost of interest-bearing
liabilities.
|
Our
allowance for loan losses may not be adequate to cover actual loan losses, which
could adversely affect our earnings.
We
maintain an allowance for loan losses in an amount that we believe is adequate
to provide for losses inherent in our loan portfolio. While we strive
to carefully manage and monitor credit quality and to identify loans that may be
deteriorating, at any time there are loans included in the portfolio that may
result in losses, but that have not yet been identified as potential problem
loans. Through established credit practices, we attempt to identify
deteriorating loans and adjust the loan loss reserve
accordingly. However, because future events are uncertain, there may
be loans that deteriorate in an accelerated time frame. As a result,
future additions to the allowance at elevated levels may be
necessary. Because the loan portfolio contains a number of commercial
real estate loans with relatively large balances, deterioration in the credit
quality of one or more of these loans may require a significant increase to the
allowance for loan losses. Future additions to the allowance may also
be required based on changes in the financial condition of borrowers, such as
have resulted due to the current, and potentially worsening, economic conditions
or as a result of incorrect assumptions by management in determining the
allowance for loan losses. Additionally, federal banking regulators,
as an integral part of their supervisory function, periodically review our
allowance for loan losses. These regulatory agencies may require us
to recognize further loan loss provisions or charge-offs based upon their
judgments, which may be different from ours. Any increase in the
allowance for loan losses would have an adverse effect, which may be material,
on our financial condition and results of operations.
-17-
Concentration
in real estate loans and the deterioration in the real estate markets we serve
could require material increases in our allowance for loan losses and adversely
affect our financial condition and results of operations.
The
economic downturn is significantly impacting our market area. We have
a high degree of concentration in loans secured by real estate (see Note 3 in
the Notes to Consolidated Financial Statements included in this
report). Further deterioration in the local economies we serve could
have a material adverse effect on our business, financial condition and results
of operations due to a weakening of our borrowers’ ability to repay these loans
and a decline in the value of the collateral securing them. Our
ability to recover on these loans by selling or disposing of the underlying real
estate collateral is adversely impacted by declining real estate values, which
increases the likelihood we will suffer losses on defaulted loans secured by
real estate beyond the amounts provided for in the allowance for loan
losses. This, in turn, could require material increases in our
allowance for loan losses and adversely affect our financial condition and
results of operations, perhaps materially.
Non-performing
assets take significant time to resolve and adversely affect our results of
operations and financial condition.
At
December 31, 2009, our non-performing loans (which include all non-accrual
loans, net of government guarantees) were 3.43% of the loan
portfolio. At December 31, 2009, our non-performing assets (which
include foreclosed real estate) were 3.05% of total assets. These
levels of non-performing loans and assets are at elevated levels compared to
historical norms. Non-performing loans and assets adversely affect
our net income in various ways. Until economic and market conditions
improve, we may expect to continue to incur losses relating to non-performing
assets. We generally do not record interest income on non-performing
loans or other real estate owned, thereby adversely affecting our income, and
increasing our loan administration costs. When we take collateral in
foreclosures and similar proceedings, we are required to mark the related asset
to the then fair market value of the collateral, which may ultimately result in
a loss. An increase in the level of non-performing assets increases
our risk profile and may impact the capital levels our regulators believe are
appropriate in light of the ensuing risk profile. While we reduce
problem assets through loan sales, workouts, and restructurings and otherwise,
decreases in the value of the underlying collateral, or in these borrowers’
performance or financial condition, whether or not due to economic and market
conditions beyond our control, could adversely affect our business, results of
operations and financial condition, perhaps materially. In addition,
the resolution of non-performing assets requires significant commitments of time
from management and our directors, which can be detrimental to the performance
of their other responsibilities. There can be no assurance that we
will not experience future increases in non-performing assets.
Tightening
of credit markets and liquidity risk could adversely affect our business,
financial condition and results of operations.
A
tightening of the credit markets or any inability to obtain adequate funds for
continued loan growth at an acceptable cost could adversely affect our asset
growth and liquidity position and, therefore, our earnings
capability. In addition to core deposit growth, maturity of
investment securities and loan payments, the Company also relies on wholesale
funding sources including unsecured borrowing lines with correspondent banks,
secured borrowing lines with the Federal Home Loan Bank of Seattle and the
Federal Reserve Bank of San Francisco, public time certificates of deposits and
out of area and brokered time certificates of deposit. Our ability to
access these sources could be impaired by deterioration in our financial
condition as well as factors that are not specific to us, such as a disruption
in the financial markets or negative views and expectations for the financial
services industry or serious dislocation in the general credit
markets. In the event such disruption should occur, our ability to
access these sources could be adversely affected, both as to price and
availability, which would limit, or potentially raise the cost of, the funds
available to the Company.
The
FDIC has increased insurance premiums to rebuild and maintain the federal
deposit insurance fund and there may be additional future premium increases and
special assessments.
The FDIC
adopted a final rule revising its risk-based assessment system, effective
April 1, 2009. The changes to the assessment system involve
adjustments to the risk-based calculation of an institution’s unsecured debt,
secured liabilities and brokered deposits. The revisions effectively
result in a range of possible assessments under the risk-based system of 7 to
77.5 basis points. The potential increase in FDIC insurance premiums
will add to our cost of operations and could have a significant impact on the
Company.
The FDIC
also has recently required insured institutions to prepay estimated quarterly
risk-based assessments for the fourth quarter of 2009 and for 2010, 2011 and
2012, and increased the regular assessment rate by three basis points effective
January 1, 2011, as a means of replenishing the deposit insurance
fund. The prepayment totaling $6.2 million
-18-
was
collected from the Bank on December 30, 2009, and was accounted for as a prepaid
expense amortized over the assessment periods.
The FDIC
also recently imposed a special Deposit Insurance assessment of five basis
points on all insured institutions. This emergency assessment was
calculated based on the insured institution’s assets at June 30, 2009, totaled
$510 for the Bank, and was collected on September 30, 2009.
The FDIC
deposit insurance fund may suffer additional losses in the future due to bank
failures. There can be no assurance that there will not be additional
significant deposit insurance premium increases, special assessments or
prepayments in order to restore the insurance fund’s reserve
ratio. Any significant premium increases or special assessments could
have a material adverse effect on our financial condition and results of
operations.
We
do not expect to continue paying dividends on our common stock at historic
levels over the medium term.
Our
ability to pay dividends on our common stock depends on a variety of
factors. On November 18, 2009, we announced a quarterly dividend of
$0.01 per share, payable December 15, 2009, which was a reduction from the prior
quarter’s dividend of $0.04 per share and quarterly dividends of $0.10 per share
declared each prior quarter since the first quarter of 2008. There
can be no assurance that we will be able to continue paying quarterly dividends
commensurate with recent levels, if at all. Current guidance from the
Federal Reserve provides, among other things, that dividends per share generally
should not exceed earnings per share, measured over the previous four fiscal
quarters. As a result, since our dividends over the last four fiscal
quarters have exceeded our earnings, we do not expect to continue paying
dividends at historic levels over the medium term, and future dividends will
depend on sufficient earnings to support them and approval of appropriate bank
regulatory authorities.
We
may be required, in the future, to recognize impairment with respect to
investment securities, including the FHLB stock we hold.
Our
securities portfolio contains whole loan private mortgage-backed securities and
currently includes securities with unrecognized losses. We may
continue to observe volatility in the fair market value of these
securities. We evaluate the securities portfolio for any other than
temporary impairment each reporting period, as required by generally accepted
accounting principles, and as of December 31, 2009, we did not recognize any
securities as other than temporarily impaired. There can be no
assurance, however, that future evaluations of the securities portfolio will not
require us to recognize an impairment charge with respect to these and other
holdings.
In
addition, as a condition to membership in the Federal Home Loan Bank of Seattle
(“FHLB”), we are required to purchase and hold a certain amount of FHLB
stock. Our stock purchase requirement is based, in part, upon the
outstanding principal balance of advances from the FHLB. At December
31, 2009, we had stock in the FHLB of Seattle totaling approximately $10.7
million. The FHLB stock held by us is carried at cost and is subject
to recoverability testing under applicable accounting standards. The
FHLB has discontinued the repurchase of their stock and discontinued the
distribution of dividends. As of December 31, 2009, we did not
recognize an impairment charge related to our FHLB stock
holdings. There can be no assurance, however, that future negative
changes to the financial condition of the FHLB may require us to recognize an
impairment charge with respect to such holdings.
If
the goodwill we have recorded in connection with acquisitions becomes impaired,
it could have an adverse impact on our earnings and capital.
At
December 31, 2009, we had approximately $22.0 million of goodwill on our balance
sheet. In accordance with generally accepted accounting principles,
our goodwill is not amortized but rather evaluated for impairment on an annual
basis or more frequently if events or circumstances indicate that a potential
impairment exists. Such evaluation is based on a variety of factors,
including the quoted price of our common stock, market prices of common stocks
of other banking organizations, common stock trading multiples, discounted cash
flows, and data from comparable acquisitions. There can be no
assurance that future evaluations of goodwill will not result in findings of
impairment and write-downs, which could be material. At December 31,
2009, we did not recognize an impairment charge related to our
goodwill.
-19-
We
may pursue additional capital in the future, which could dilute the holders of
our outstanding common stock and may adversely affect the market price of our
common stock.
On
October 20, 2009, we announced the consummation of a public offering of 5.52
million shares of our common stock at $8.75 per share for gross proceeds of
$48.3 million. Notwithstanding this recent capital raise, from time to
time, particularly in the current uncertain economic environment, we may
consider alternatives for raising capital when opportunities present themselves,
in order to further strengthen our capital and/or better position ourselves to
take advantage of identified or potential opportunities that may arise in the
future. Such alternatives may include issuance and sale of common or
preferred stock, trust preferred securities, or borrowings by the Company, with
proceeds contributed to the Bank. Any such capital raising
alternatives could dilute the holders of our outstanding common stock and may
adversely affect the market price of our common stock.
Our
ability to access markets for funding and acquire and retain customers could be
adversely affected by the deterioration of other financial institutions or if
the financial service industry’s reputation is damaged further.
The
financial services industry continues to be featured in negative headlines about
the global and national credit crisis and the resulting stabilization
legislation enacted by the U.S. federal government. These reports can
be damaging to the industry’s image and potentially erode consumer confidence in
insured financial institutions, such as our banking subsidiary. In
addition, our ability to engage in routine funding and other transactions could
be adversely affected by the actions and financial condition of other financial
institutions. Financial services institutions are interrelated as a
result of trading, clearing, correspondent, counterparty or other
relationships. As a result, defaults by, or even rumors or questions
about, one or more financial services institutions, or the financial services
industry in general, could lead to market-wide liquidity problems, losses of
depositor, creditor and counterparty confidence and could lead to losses or
defaults by us or by other institutions. We could experience material
changes in the level of deposits as a direct or indirect result of other banks’
difficulties or failure, which could affect the amount of capital we
need.
Recent
levels of market volatility were unprecedented and we cannot predict whether
they will return.
From time
to time over the last two of years, the capital and credit markets have
experienced volatility and disruption at unprecedented levels. In
some cases, the markets have produced downward pressure on stock prices and
credit availability for certain issuers without regard to those issuers’
underlying financial strength. If similar levels of market disruption
and volatility return, there can be no assurance that we will not experience an
adverse effect, which may be material, on our ability to access capital and on
our business, financial condition and results of operations.
We
operate in a highly regulated environment and we cannot predict the effect of
recent and pending federal legislation.
As
discussed more fully in the section entitled “Supervision and Regulation”, we
are subject to extensive regulation, supervision and examination by federal and
state banking authorities. In addition, as a publicly traded company,
we are subject to regulation by the Securities and Exchange
Commission. Any change in applicable regulations or federal, state or
local legislation could have a substantial impact on us and our
operations. Additional legislation and regulations that could
significantly affect our powers, authority and operations may be enacted or
adopted in the future, which could have a material adverse effect on our
financial condition and results of operations. In that regard,
proposals for legislation restructuring the regulation of the financial services
industry are currently under consideration. Adoption of such
proposals could, among other things, increase the overall costs of regulatory
compliance. Further, regulators have significant discretion and
authority to prevent or remedy unsafe or unsound practices or violations of laws
or regulations by financial institutions and holding companies in the
performance of their supervisory and enforcement duties. Recently,
these powers have been utilized more frequently due to the serious national,
regional and local economic conditions we are facing. The exercise of
regulatory authority may have a negative impact on our financial condition and
results of operations.
We cannot
accurately predict the actual effects of recent legislation or the proposed
regulatory reform measures and various governmental, regulatory, monetary and
fiscal initiatives which have been and may be enacted on the financial markets,
on the Company and on the Bank. The terms and costs of these activities, or the
failure of these actions to help stabilize the financial markets, asset prices,
market liquidity and a continuation or worsening of current financial market and
economic conditions could materially and adversely affect our business,
financial condition, results of operations, and the trading price of our common
stock.
-20-
Fluctuating
interest rates could adversely affect our profitability.
Our
profitability is dependent to a large extent upon our net interest income, which
is the difference between the interest earned on loans, securities and other
interest-earning assets and interest paid on deposits, borrowings, and other
interest-bearing liabilities. Because of the differences in
maturities and repricing characteristics of our interest-earning assets and
interest-bearing liabilities, changes in interest rates do not produce
equivalent changes in interest income earned on interest-earning assets and
interest paid on interest-bearing liabilities. Accordingly,
fluctuations in interest rates could adversely affect our net interest margin,
and, in turn, our profitability. We manage our interest rate risk
within established guidelines and generally seek an asset and liability
structure that insulates net interest income from large deviations attributable
to changes in market rates. However, our interest rate risk
management practices may not be effective in a highly volatile rate
environment.
We
face strong competition from financial services companies and other companies
that offer banking services.
Our three
major markets are in Oregon and Washington. The banking and financial
services businesses in our market area are highly competitive and increased
competition may adversely impact the level of our loans and
deposits. Ultimately, we may not be able to compete successfully
against current and future competitors. These competitors include
national banks, foreign banks, regional banks and other community
banks. We also face competition from many other types of financial
institutions, including savings and loan associations, finance companies,
brokerage firms, insurance companies, credit unions, mortgage banks and other
financial intermediaries. In particular, our competitors include
major financial companies whose greater resources may afford them a marketplace
advantage by enabling them to maintain numerous locations and mount extensive
promotional and advertising campaigns. Areas of competition include
interest rates for loans and deposits, efforts to obtain loan and deposit
customers and a range in quality of products and services provided, including
new technology driven products and services. If we are unable to
attract and retain banking customers, we may be unable to continue our loan
growth and level of deposits.
Future
acquisitions and expansion activities may disrupt our business and adversely
affect our operating results.
We
regularly evaluate potential acquisitions and expansion
opportunities. To the extent that we grow through acquisitions, we
cannot ensure that we will be able to adequately or profitably manage this
growth. Acquiring other banks, branches or other assets, as well as
other expansion activities, involve various risks including the risks of
incorrectly assessing the credit quality of acquired assets, encountering
greater than expected costs of incorporating acquired banks or branches into our
Company, and being unable to profitably deploy funds acquired in an
acquisition.
Anti-takeover
provisions in our amended and restated articles of incorporation and bylaws and
Oregon law could make a third party acquisition of us difficult.
Our
amended and restated articles of incorporation contain provisions that could
make it more difficult for a third party to acquire us (even if doing so would
be beneficial to our shareholders) and for holders of our common stock to
receive any related takeover premium for their common stock. We are
also subject to certain provisions of Oregon law that could delay, deter or
prevent a change in control of us. These provisions could limit the
price that investors might be willing to pay in the future for shares of our
common stock.
None
ITEM 2 Properties
The
principal properties of the registrant are comprised of the banking facilities
owned by the Bank. The Bank operates fourteen full service
facilities. The Bank owns a total of eight buildings and, with the
exception of two buildings, owns the land on which these buildings are
situated. Significant properties owned by the Bank are as
follows:
|
1)
|
Three-story
building and land with approximately 30,000 square feet located on Olive
Street in Eugene, Oregon.
|
|
2)
|
Building
with approximately 4,000 square feet located on West 11th
Avenue in Eugene, Oregon. The building is on leased
land.
|
|
3)
|
Building
and land with approximately 8,000 square feet located on High Street in
Eugene, Oregon.
|
-21-
|
4)
|
Three-story
building and land with approximately 31,000 square feet located in
Springfield, Oregon. The Bank occupies approximately 5,500
square feet of the first floor and approximately 5,900 square feet on the
second floor and leases out, or is seeking to lease out, the remaining
space.
|
|
5)
|
Building
and land with approximately 3,500 square feet located in Beaverton,
Oregon.
|
|
6)
|
Building
and land with approximately 2,000 square feet located in Junction City,
Oregon.
|
|
7)
|
Building
and land with approximately 5,000 square feet located near the Convention
Center in Portland, Oregon.
|
|
8)
|
Building
with approximately 6,800 square feet located at the Nyberg Shopping Center
in Tualatin, Oregon. The building is on leased
land.
|
The Bank
leases facilities for branch offices in Downtown Seattle, Washington, Downtown
Bellevue, Washington, Downtown Portland, Oregon, and Vancouver,
Washington. In addition, the Bank leases a portion of an adjoining
building to the High Street office for administrative and training
functions. Management considers all owned and leased facilities
adequate for current use.
ITEM
3 Legal
Proceedings
As of the
date of this report, neither the Company nor the Bank or any of its subsidiaries
is party to any material pending legal proceedings, including proceedings of
governmental authorities, other than ordinary routine litigation incidental to
the business of the Bank.
PART II
ITEM 4 Market for Company’s Common Equity, Related
Shareholder Matters and Purchases of Equity
Securities
Issuer
Purchases of Securities
The
Company did not repurchase any shares of its common stock during the fourth
quarter of 2009. During the fourth quarter 2009, the Company
announced it had raised approximately $45,700 of new capital, net of
underwriting discounts and commissions and transaction costs, through an
underwritten public offering by issuing 5,520 shares of its common stock at a
price of $8.75 per share.
Dividends
The
Company pays cash dividends on a quarterly basis, typically in March, June,
September and December of each year. The Board of Directors considers
the dividend amount quarterly and takes a broad perspective in its dividend
deliberations including a review of recent operating performance, capital
levels, and loan concentrations as a percentage of capital, and growth
projections. The Board also considers dividend payout ratios,
dividend yield, and other financial metrics in setting the quarterly
dividend. The Company declared and paid cash dividends of $0.25
per share for the year 2009. That compares to cash dividends of $0.40
per share paid for the year 2008. Regulatory authorities may prohibit the
Company from paying dividends in a manner that would constitute unsafe or
unsound banking practice or would reduce the amount of its capital below that
necessary to meet minimum applicable regulatory capital
requirements. Current guidance from the Federal Reserve provides,
among other things, that dividends per share generally should not exceed
earnings per share, measured over the previous four fiscal
quarters. As a result, since the Company’s dividends to shareholders
over the last four fiscal quarters have exceeded earnings, the Company does not
expect to continue paying dividends at historic levels over the medium term, and
future dividends will depend on sufficient earnings to support them and approval
of appropriate bank regulatory authorities.
-22-
Equity
Compensation Plan Information
|
Year
Ended December 31, 2009
|
|||
|
Number
of Shares to be Issued Upon Exercise of Outstanding Options, Warrants and
Rights (2)
|
Weighted-Average
Exercise Price of Outstanding Options, Warrants and Rights (2)
|
Number
of Shares Remaining Available for Future Issuance Under Equity
Compensation Plans (2)
|
|
|
Equity
compensation plans approved by security holders(1)
|
|
|
|
| 919,463 | $14.03 | 576,240 | |
|
|
|||
|
Equity
compensation plans not approved by security holders
|
|
||
| 0 | $0 | 0 | |
|
(1)
|
Under
the Company’s respective equity compensation plans, the Company may grant
incentive stock options and non-qualified stock options, restricted stock,
restricted stock units and stock appreciation rights to its employees and
directors, however only employees may receive incentive stock
options.
|
|
(2)
|
All
amounts have been adjusted to reflect subsequent stock splits and stock
dividends.
|
Market
Information
The
Company’s common stock trades on the NASDAQ Global Select Market under the
symbol PCBK. At March 5, 2010, the Company had 18,393,773 shares of
common stock outstanding held by approximately 2,025 shareholders of
record.
The high,
low and closing sales prices (based on daily closing price) for the last eight
quarters are shown in the table below.
|
YEAR
|
2009
|
2008
|
|||||||
|
QUARTER
|
Fourth
|
Third
|
Second
|
First
|
Fourth
|
Third
|
Second
|
First
|
|
|
Market
value:
|
|||||||||
|
High
|
$12.37
|
$11.78
|
$13.27
|
$14.96
|
$15.00
|
$15.22
|
$14.93
|
$14.44
|
|
|
Low
|
8.54
|
9.46
|
10.79
|
9.99
|
11.58
|
9.26
|
10.99
|
13.75
|
|
|
Close
|
11.44
|
10.53
|
12.13
|
12.92
|
14.97
|
14.64
|
10.99
|
13.90
|
-23-
The
information contained in the following chart entitled “Total Return Performance”
is not considered to be “soliciting material”, or “filed”, or incorporated by
reference in any past or future filing by the Company under the Securities
Exchange Act of 1934 or the Securities Act of 1933 unless and only to the extent
that the Company specifically incorporates it by reference.
STOCK PERFORMANCE GRAPH
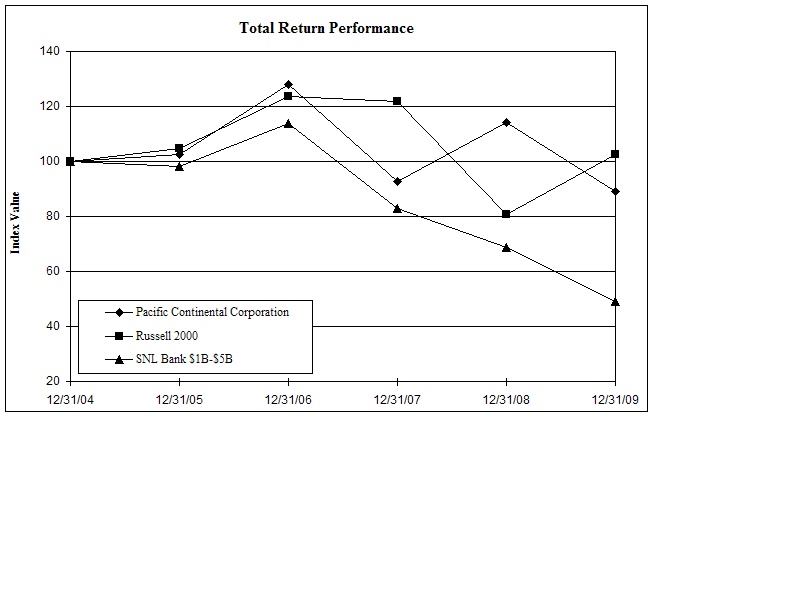
The above
graph and following table compares the total cumulative shareholder return on
the Company’s Common Stock, based on reinvestment of all dividends, to the
cumulative total returns of the Russell 2000 Index and SNL Securities $1 Billion
to $5 Billion Bank Asset Size Index. The graph assumes $100 invested
on December 31, 2004, in the Company’s Common Stock and each of the
indices.
|
Period
Ending
|
||||||
|
Index
|
12/31/04
|
12/31/05
|
12/31/06
|
12/31/07
|
12/31/08
|
12/31/09
|
|
Pacific
Continental Corporation
|
100.00
|
102.67
|
127.99
|
92.65
|
114.08
|
89.08
|
|
Russell
2000
|
100.00
|
104.55
|
123.76
|
121.82
|
80.66
|
102.58
|
|
SNL
Bank $1B-$5B
|
100.00
|
98.29
|
113.74
|
82.85
|
68.72
|
49.26
|
-24-
ITEM
5 Selected Financial
Data
Selected
financial data for the past five years is shown in the table below.
($ in
thousands, except for per share data)
|
2009
|
2008
|
2007
|
2006
|
2005
|
||||||||||||||||
|
For
the year
|
||||||||||||||||||||
|
Net
interest income
|
$ | 54,039 | $ | 49,271 | $ | 43,426 | $ | 40,057 | $ | 30,240 | ||||||||||
|
Provision
for loan losses
|
$ | 36,000 | $ | 3,600 | $ | 725 | $ | 600 | $ | 1,100 | ||||||||||
|
Noninterest
income
|
$ | 4,405 | $ | 4,269 | $ | 3,925 | $ | 4,401 | $ | 4,083 | ||||||||||
|
Noninterest
expense
|
$ | 31,162 | $ | 29,562 | $ | 25,861 | $ | 23,791 | $ | 18,134 | ||||||||||
|
Income
taxes
|
$ | (3,839 | ) | $ | 7,439 | $ | 7,830 | $ | 7,412 | $ | 5,510 | |||||||||
|
Net
income (loss)
|
$ | (4,879 | ) | $ | 12,939 | $ | 12,935 | $ | 12,655 | $ | 9,578 | |||||||||
|
Cash
dividends
|
$ | 3,272 | $ | 4,797 | $ | 4,175 | $ | 3,381 | $ | 2,556 | ||||||||||
|
Per
common share data (1)
|
||||||||||||||||||||
|
Net
income (loss):
|
||||||||||||||||||||
|
Basic
|
$ | (0.35 | ) | $ | 1.08 | $ | 1.09 | $ | 1.09 | $ | 0.98 | |||||||||
|
Diluted
|
$ | (0.35 | ) | $ | 1.08 | $ | 1.08 | $ | 1.08 | $ | 0.95 | |||||||||
|
Cash
dividends
|
$ | 0.25 | $ | 0.40 | $ | 0.35 | $ | 0.29 | $ | 0.25 | ||||||||||
|
Book
value
|
$ | 9.01 | $ | 9.62 | $ | 9.01 | $ | 8.17 | $ | 7.96 | ||||||||||
|
Tangible
book value
|
$ | 7.77 | $ | 7.72 | $ | 7.07 | $ | 6.16 | $ | 5.59 | ||||||||||
|
Market
value, end of year
|
$ | 11.44 | $ | 14.97 | $ | 12.52 | $ | 17.68 | $ | 14.45 | ||||||||||
|
At
year end
|
||||||||||||||||||||
|
Assets
|
$ | 1,199,113 | $ | 1,090,843 | $ | 949,271 | $ | 885,351 | $ | 791,794 | ||||||||||
|
Loans,
less allowance for loan loss (2)
|
$ | 930,997 | $ | 945,787 | $ | 813,647 | $ | 760,957 | $ | 671,171 | ||||||||||
|
Core
deposits (4)
|
$ | 771,986 | $ | 615,832 | $ | 615,892 | $ | 580,210 | $ | 529,794 | ||||||||||
|
Total
deposits
|
$ | 827,918 | $ | 722,437 | $ | 644,424 | $ | 641,272 | $ | 604,271 | ||||||||||
|
Shareholders'
equity
|
$ | 165,662 | $ | 116,165 | $ | 107,509 | $ | 95,735 | $ | 81,412 | ||||||||||
|
Tangible
Equity (3)
|
$ | 142,981 | $ | 93,261 | $ | 84,382 | $ | 72,109 | $ | 57,211 | ||||||||||
|
Average
for the year
|
||||||||||||||||||||
|
Assets
|
$ | 1,129,971 | $ | 1,019,040 | $ | 903,932 | $ | 825,671 | $ | 573,717 | ||||||||||
|
Earning
assets
|
$ | 1,051,315 | $ | 945,856 | $ | 832,451 | $ | 755,680 | $ | 533,930 | ||||||||||
|
Loans,
less allowance for loan losses
|
$ | 943,788 | $ | 882,742 | $ | 785,132 | $ | 712,563 | $ | 501,541 | ||||||||||
|
Core
deposits (4)
|
$ | 703,894 | $ | 613,243 | $ | 590,713 | $ | 533,861 | $ | 425,716 | ||||||||||
|
Total
deposits
|
$ | 782,835 | $ | 699,623 | $ | 654,631 | $ | 605,814 | $ | 461,013 | ||||||||||
|
Interest-paying
liabilities
|
$ | 810,380 | $ | 732,466 | $ | 627,569 | $ | 567,708 | $ | 372,880 | ||||||||||
|
Shareholders'
equity
|
$ | 135,470 | $ | 111,868 | $ | 103,089 | $ | 90,238 | $ | 54,528 | ||||||||||
|
Financial
ratios
|
||||||||||||||||||||
|
Return
on average:
|
||||||||||||||||||||
|
Assets
|
-0.43 | % | 1.27 | % | 1.43 | % | 1.53 | % | 1.67 | % | ||||||||||
|
Equity
|
-3.60 | % | 11.57 | % | 12.55 | % | 14.02 | % | 17.57 | % | ||||||||||
|
Tangible
Equity (3)
|
-4.33 | % | 14.56 | % | 16.23 | % | 19.12 | % | 18.25 | % | ||||||||||
|
Avg
shareholders' equity / avg assets
|
11.99 | % | 10.98 | % | 11.40 | % | 10.93 | % | 9.50 | % | ||||||||||
|
Dividend
payout ratio
|
NM
|
37.07 | % | 32.28 | % | 26.72 | % | 26.69 | % | |||||||||||
|
Risk-based
capital:
|
||||||||||||||||||||
|
Tier
I capital
|
14.38 | % | 10.07 | % | 10.02 | % | 9.97 | % | 9.41 | % | ||||||||||
|
Total
capital
|
15.63 | % | 11.16 | % | 10.98 | % | 11.01 | % | 10.57 | % | ||||||||||
|
(1)
Per common share data is retroactively adjusted to reflect the 10% stock
dividend of 2007.
|
||||||||||||||||||||
|
(2) Outstanding
loans include loans held for sale.
|
||||||||||||||||||||
|
(3)
Tangible equity excludes goodwill and core deposit intangible related to
acquisitions.
|
||||||||||||||||||||
|
(4)
Core deposits include all local time deposits, including local time
deposits over $100.
|
||||||||||||||||||||
-25-
ITEM
6 Management’s Discussion and
Analysis of Financial Condition and Results of Operations
The
following discussion is intended to provide a more comprehensive review of the
Company’s operating results and financial condition than can be obtained from
reading the Consolidated Financial Statements alone. The discussion
should be read in conjunction with the audited financial statements and the
notes included later in this report. All dollar amounts, except per
share data, are expressed in thousands of dollars.
In
addition to historical information, this report may contain forward-looking
statements within the meaning of the Private Securities Litigation Reform Act of
1995. These forward-looking statements include, but are not limited
to, statements about management’s plans, objectives, expectations and intentions
that are not historical facts, and other statements identified by words such as
“expects,” “anticipates,” “intends,” “plans,” “believes,” “should,” “projects,”
“seeks,” “estimates” or words of similar meaning. These forward-looking
statements are based on current beliefs and expectations of management and are
inherently subject to significant business, economic and competitive
uncertainties and contingencies, many of which are beyond the Company’s control.
In addition, these forward-looking statements are subject to assumptions with
respect to future business strategies and decisions that are subject to change.
The following factors, among others, could cause actual results to differ
materially from the anticipated results or other expectations in the
forward-looking statements, including those set forth in this report, or the
documents incorporated by reference:
|
·
|
local
and national economic conditions could be less favorable than expected or
could have a more direct and pronounced effect on us than expected and
adversely affect our ability to continue internal growth at historical
rates and maintain the quality of our earnings
assets;
|
|
·
|
the
local housing / real estate market could continue to
decline;
|
|
·
|
the
risks presented by a continued economic recession, which could adversely
affect credit quality, collateral values, including real estate
collateral, investment values, liquidity and loan originations and loan
portfolio delinquency rates;
|
|
·
|
interest
rate changes could significantly reduce net interest income and negatively
affect funding sources;
|
|
·
|
projected
business increases following any future strategic expansion or opening of
new branches could be lower than
expected;
|
|
·
|
competition
among financial institutions could increase
significantly;
|
|
·
|
the
goodwill we have recorded in connection with acquisitions could become
impaired, which may have an adverse impact on our earnings and
capital;
|
|
·
|
the
reputation of the financial services industry could deteriorate, which
could adversely affect our ability to access markets for funding and to
acquire and retain customers;
|
|
·
|
the
efficiencies we may expect to receive from any investments in personnel,
acquisitions and infrastructure may not be
realized;
|
|
·
|
the
level of non-performing assets and charge-offs or changes in the estimates
of future reserve requirements based upon the periodic review thereof
under relevant regulatory and accounting requirements may
increase;
|
|
·
|
changes
in laws and regulations (including laws and regulations concerning taxes,
banking, securities, executive compensation and insurance) could have a
material adverse effect on our business, financial conditions and results
of operations;
|
|
·
|
acts
of war or terrorism, or natural disasters, such as the effects of pandemic
flu, may adversely impact our
business;
|
|
·
|
the
timely development and acceptance of new banking products and services and
perceived overall value of these products and services by users may
adversely impact our ability to increase market share and control
expenses;
|
|
·
|
changes
in accounting policies and practices, as may be adopted by the regulatory
agencies, as well as the Public Company Accounting Oversight Board, the
Financial Accounting Standards Board and other accounting standard setters
may impact the results of our
operations;
|
|
·
|
the
costs and effects of legal and regulatory developments including the
resolution of legal proceedings or regulatory or other governmental
inquiries and the results of regulatory examinations or reviews may
adversely impact our ability to increase market share and control
expenses; and
|
|
·
|
our
success at managing the risks involved in the foregoing items will have a
significant impact upon our results of operations and future
prospects.
|
Additional
factors that could cause actual results to differ materially from those
expressed in the forward-looking statements are discussed in Risk Factors in
Item 1A. Please take into account that forward-looking statements speak only as
of the date of this report or documents incorporated by reference. The Company
does not undertake any obligation to publicly correct or update any
forward-looking statement if we later become aware that it is not likely to be
achieved.
-26-
HIGHLIGHTS
|
%
Change
|
%
Change
|
|||||||||||||||||||
|
2009
|
2008
|
2009 vs. 2008
|
2007
|
2008 vs. 2007
|
||||||||||||||||
|
Operating
revenue (1)
|
$ | 58,444 | $ | 53,540 | 9 | % | $ | 47,351 | 13 | % | ||||||||||
|
Net
income (loss)
|
$ | (4,879 | ) | $ | 12,939 | -138 | % | $ | 12,935 | 0 | % | |||||||||
|
Earnings
(loss) per share (2)
|
||||||||||||||||||||
|
Basic
|
$ | (0.35 | ) | $ | 1.08 | -132 | % | $ | 1.09 | -1 | % | |||||||||
|
Diluted
|
$ | (0.35 | ) | $ | 1.08 | -132 | % | $ | 1.08 | 0 | % | |||||||||
|
Assets,
period-end
|
$ | 1,199,113 | $ | 1,090,843 | 10 | % | $ | 949,271 | 15 | % | ||||||||||
|
Core
deposits, period-end
|
$ | 771,986 | $ | 615,832 | 25 | % | $ | 615,892 | 0 | % | ||||||||||
|
Deposits,
period-end
|
$ | 827,918 | $ | 722,437 | 15 | % | $ | 644,424 | 12 | % | ||||||||||
|
Return
on assets
|
-0.43 | % | 1.27 | % | 1.43 | % | ||||||||||||||
|
Return
on equity
|
-3.60 | % | 11.57 | % | 12.55 | % | ||||||||||||||
|
Return
on tangible equity (3)
|
-4.33 | % | 14.56 | % | 16.23 | % | ||||||||||||||
|
Net
interest margin
|
5.14 | % | 5.21 | % | 5.22 | % | ||||||||||||||
|
Efficiency
Ratio
|
53.32 | % | 55.21 | % | 54.62 | % | ||||||||||||||
|
(1)
Operating
revenue is defined as net interest income plus noninterest
income.
|
||||||||||||||||||||
|
(2) Per share data for
2007 was retroactively adjusted to reflect the 10% stock dividend paid in
June 2007.
|
||||||||||||||||||||
|
(3) Tangible equity
excludes goodwill and core deposit intangible related to
acquisitions.
|
||||||||||||||||||||
For the
year 2009, the Company recorded a net loss of $4,879, compared to net income of
$12,939 in 2008. The net loss recorded in 2009 and
decline in income from the prior year was primarily due to the $36,000 provision
for loan losses in 2009 as credit losses increased significantly in 2009 over
2008 and the credit quality of the loan portfolio deteriorated due to weak
economic conditions that significantly affected real estate
values. The Company’s core earnings (defined as earnings before
provision for loan losses and taxes) remained strong at $27,282, up 14% over the
prior year. Operating revenue for the year 2009 was up 9% over the
year 2008 and was primarily driven by growth in net interest income, which
accounted for 92% of total operating revenue in 2009. The improvement
in 2009 net interest income was primarily the result of 11% growth in average
earning assets. During 2009, the Company actively managed its
noninterest expense as evidenced by the 53.32% efficiency ratio (noninterest
expense divided by operating revenue) compared to 55.21% for
2008. During the third and fourth quarters of 2009, the Company’s
efficiency ratio was 47.31% and 50.14%, respectively. During
2009, the Company also experienced record growth in outstanding core deposits,
which were up $156,154 or 25% over the prior year end due to expanding existing
deposit relationships and through the development of new deposit
relationships.
Net
income for the year 2008 was $12,939, an increase of $4 over the $12,935
reported for the year 2007. Net income improvement in 2008 over 2007
was modest due to a significant increase in the provision for loan losses, plus
growth in noninterest expenses, which offset increased operating
revenues. Operating revenue for the year 2008 was up 13% over the
year 2007 and was primarily driven by growth in net interest income, which
accounted for 92% of total operating revenue in 2008. The improvement
in 2008 net interest income was the result of 14% growth in average earning
assets combined with a stable net interest margin.
Period-end
assets at December 31, 2009 were $1,199,113, compared to $1,090,843 at December
31, 2008. The increase in period-end assets was primarily
attributable to growth in the Company’s securities portfolio as outstanding
loans at December 31, 2009 were down from the same period last
year. Core deposits, which are defined as demand deposits, interest
checking, money market accounts, and local time deposits (including local time
deposits over $100) were $771,986 and constitute 93% of December 31, 2009
outstanding deposits. Non-interest bearing deposits were $202,088 or
24% of total deposits at year-end December 31, 2009.
-27-
During
2010, the Company believes the following factors could impact reported financial
results:
|
§
|
The
national, regional, and local recession and the effect on loan demand, the
credit quality of existing clients with lending relationships, and vacancy
rates of commercial real estate properties, since a significant portion of
our loan portfolio is secured by real
estate;
|
|
§
|
A
slowing real estate market, and increases in residential home inventories
for sale, and the impact on residential construction lending, delinquency
and default rates of existing residential construction loans in the Bank’s
portfolio, residential mortgage lending, and refinancing activities of
existing homeowners;
|
|
§
|
Changes
and volatility in interest rates negatively impacting yields on earning
assets and the cost of interest-bearing liabilities, thus negatively
affecting the net interest margin and net interest
income;
|
|
§
|
The
ability to grow core deposits during 2010 in a highly competitive
environment where many financial institutions are experiencing liquidity
problems;
|
|
§
|
The
availability of wholesale funding sources due to disruption in the
financial and capital markets;
|
|
§
|
The
ability to manage noninterest expense growth in light of anticipated
increases in regulatory expenses, including FDIC insurance assessments and
expenses related to resolving problem loans;
and
|
|
§
|
The
ability to attract and retain qualified and experienced bankers in all
markets.
|
SUMMARY
OF CRITICAL ACCOUNTING POLICIES
The SEC
defines “critical accounting policies” as those that require the application of
management’s most difficult, subjective, or complex judgments, often as a result
of the need to make estimates about the effect of matters that are inherently
uncertain and may change in future periods. Significant accounting
policies are described in Note 1 of the Notes to Consolidated Financial
Statements for the year ended December 31, 2009 in Item 7 of this
report. Management believes that the following policies and those
disclosed in the Notes to
Consolidated Financial Statements should be considered critical under the
SEC definition:
Allowance
for Loan Losses and Reserve for Unfunded Commitments
The
allowance for outstanding loans is classified as a contra-asset account
offsetting outstanding loans, and the allowance for unfunded commitments is
classified as an “other” liability on the balance sheet. The
allowance for loan losses is established through a provision for loan losses
charged against earnings. The balances of the allowance for loan
losses for outstanding loans and unfunded commitments are maintained at an
amount management believes will be adequate to absorb known and inherent losses
in the loan portfolio and commitments to loan funds. The appropriate
balance of the allowance for loan losses is determined by applying loss factors
to the credit exposure from outstanding loans and unfunded loan
commitments. Estimated loss factors are based on subjective
measurements including management’s assessment of the internal risk
classifications, changes in the nature of the loan portfolios, industry
concentrations, and the impact of current local, regional, and national economic
factors on the quality of the loan portfolio. Changes in these
estimates and assumptions are reasonably possible and may have a material impact
on the Company’s consolidated financial statements, results of operations, or
liquidity.
Goodwill
and Intangible Assets
At
December 31, 2009, the Company had $22,681 in goodwill and other intangible
assets. In accordance with financial accounting
standards, assets with indefinite lives are no longer amortized, but instead are
periodically tested for impairment. Management performs an impairment
analysis of the intangible assets with indefinite lives at least annually and
has determined that there was no impairment as of December 31, 2009, 2008,
and 2007.
Share-based
Compensation
In
December 2004, the Financial Accounting Standards Board (“FASB”) issued a
revision to the previously issued guidance on accounting for stock options and
other forms of equity-based forms of compensation issued to
employees. This standard became effective in the first quarter of
2006. The Company uses the Black-Scholes option pricing model
-28-
to
measure fair value under this standard which is further discussed in Note 1 of
the Notes to Consolidated Financial Statements in Item 7 below.
The
Company adopted the new accounting standard using the modified prospective
method. Therefore, previously reported financial data was not
restated, and expenses related to equity-based payments granted and vesting
during 2007, 2008, and 2009 were recorded as compensation expense.
Recent Accounting
Pronouncements
Recent
accounting pronouncements are discussed in Note 1 of the Notes to the
Consolidated Financial Statements for the year ended December 31, 2009 in Item 7
of this report. None of these pronouncements are expected to have a
significant effect on the Company’s financial condition or results of
operations.
RESULTS
OF OPERATIONS
Net
Interest Income
The
largest component of the Company’s earnings is net interest
income. Net interest income is the difference between interest income
derived from earning assets, principally loans, and the interest expense
associated with interest-bearing liabilities, principally
deposits. The volume and mix of earning assets and funding sources,
market rates of interest, demand for loans, and the availability of deposits
affect net interest income.
4th
Quarter 2009 Compared to 4th
Quarter 2008
Two
tables follow which analyze the changes in net interest income for the fourth
quarter 2009 and fourth quarter 2008. Table I “Average Balance
Analysis of Net Interest Earnings”, provides information with regard to average
balances of assets and liabilities, as well as associated dollar amounts of
interest income and interest expense, relevant average yields or rates, and net
interest income as a percent of average earning assets. Table II
“Analysis of Changes in Interest Income and Interest Expense”, shows the
increase (decrease) in the dollar amount of interest income and interest expense
and the differences attributable to changes in either volume or
rates.
The
Bank’s net interest margin for the fourth quarter 2009 was 5.02% compared to
5.28% for the fourth quarter 2008. Table I shows that yield on
earning assets for the fourth quarter 2009 of 6.21% was down 42 basis points
from fourth quarter 2008 earning asset yields due to three factors: 1) a decline
in yields on both loans and securities; 2) a change in the mix of earning assets
as average lower yielding securities represented 14% of total average earning
assets in fourth quarter 2009 compared to 6% in fourth quarter 2008; and 3)
interest reversals on loans placed on nonaccrual status during the quarter and
interest lost on loans on nonaccrual status. The Bank was able to
mitigate some of the decline in the yield on loans in 2009 when compared to 2008
through its practice of including floors on most of its variable rate
loans. Loan yields remained relatively stable due to active interest
rate floors on approximately $280,000 of the Bank’s variable rate loan portfolio
at December 31, 2009.
Table I
also shows that the rates paid on interest-bearing core deposits and
interest-bearing wholesale funding did not move down as fast as the decline in
earning asset yields, thus causing the net interest margin to compress by 26
basis points. The cost of interest-bearing core deposits dropped 5
basis points, while the cost of interest-bearing wholesale funding moved down 8
basis points. In total, the total cost of interest-bearing
liabilities decreased 12 basis points in fourth quarter 2009 when compared to
fourth quarter 2008, while earnings asset yields declined by 42 basis points as
noted above.
Table I
also shows the difference between the cost of interest-bearing core deposits and
wholesale funding. Overall, interest-bearing core deposits in fourth
quarter 2009 had a rate of 1.51% or 33 basis points lower than wholesale funding
costs at 1.84%. This spread is similar to the same quarter last year
when the cost of interest-bearing core deposits was 36 basis points below the
cost of interest-bearing wholesale funding. However, in the
historically low interest rate environment, the cost of interest-bearing core
deposits remains well above the cost of short-term wholesale funding as noted by
the 1.51% cost of interest-bearing core deposits in fourth quarter 2009 compared
to 0.56% for federal funds purchased. For as long as the current
interest rate environment persists, and to the extent growth in interest-bearing
core deposits is used to pay down short-term borrowings, there will be an
adverse effect on the Bank’s net interest margin.
Table II
shows the changes in net interest income due to rate and volume for the quarter
ended December 31, 2009. Interest income including loan fees for the
fourth quarter 2009 increased by $535 from the same period last
year. Higher
-29-
volumes
of earning assets increased interest income by $1,132, while lower yields on
earning assets decreased interest income by $597. The increase in
interest income due to volume was primarily due to growth in the securities
portfolio. The rate/volume analysis shows that interest expense for
the quarter ended December 31, 2009 decreased by $55 from last year, as changes
in mix and higher volumes caused interest expense to increase by $290, which was
more than offset by a decrease in interest expense of $345 due to lower
rates. Most of the decline in interest expense was due to lower
volumes and rates on interest-bearing wholesale funding.
-30-
|
Table
I
|
||||||||||||||||||||||||
|
Average
Balance Analysis of Net Interest Earnings
|
||||||||||||||||||||||||
|
(dollars
in thousands)
|
||||||||||||||||||||||||
|
Three
Months Ended
|
Three
Months Ended
|
|||||||||||||||||||||||
|
December 31, 2009
|
December 31, 2008
|
|||||||||||||||||||||||
|
Interest
|
Average
|
Interest
|
Average
|
|||||||||||||||||||||
|
Average
|
Income
or
|
Yields
or
|
Average
|
Income
or
|
Yields
or
|
|||||||||||||||||||
|
Balance
|
(Expense)
|
Rates
|
Balance
|
(Expense)
|
Rates
|
|||||||||||||||||||
|
Interest
Earning Assets
|
||||||||||||||||||||||||
|
Federal
funds sold and interest-
|
||||||||||||||||||||||||
|
bearing
deposits in banks
|
$ | 362 | $ | 1 | 1.10 | % | $ | 497 | $ | 2 | 1.60 | % | ||||||||||||
|
Securities
available for sale:
|
||||||||||||||||||||||||
|
Taxable
(1)
|
149,705 | 1,361 | 3.61 | % | 57,972 | 627 | 4.30 | % | ||||||||||||||||
|
Tax-exempt
|
5,464 | 48 | 3.49 | % | 5,187 | 49 | 3.76 | % | ||||||||||||||||
|
Loans,
net of allowance for loan losses(2)(3)(4)
|
934,746 | 15,669 | 6.65 | % | 929,522 | 15,866 | 6.79 | % | ||||||||||||||||
|
Total
interest earning assets
|
1,090,277 | 17,079 | 6.21 | % | 993,178 | 16,544 | 6.63 | % | ||||||||||||||||
|
Non
Earning Assets
|
||||||||||||||||||||||||
|
Cash
and due from banks
|
19,023 | 17,928 | ||||||||||||||||||||||
|
Premises
and equipment
|
20,224 | 20,892 | ||||||||||||||||||||||
|
Goodwill
& other intangibles
|
22,708 | 22,935 | ||||||||||||||||||||||
|
Interest
receivable and other
|
23,286 | 14,845 | ||||||||||||||||||||||
|
Total
non interest assets
|
85,241 | 76,600 | ||||||||||||||||||||||
|
Total
assets
|
$ | 1,175,518 | $ | 1,069,778 | ||||||||||||||||||||
|
Interest-Bearing
Liabilities
|
||||||||||||||||||||||||
|
Money
market and NOW accounts
|
$ | 454,916 | $ | (1,463 | ) | -1.28 | % | $ | 382,144 | $ | (1,367 | ) | -1.42 | % | ||||||||||
|
Savings
deposits
|
28,069 | (86 | ) | -1.22 | % | 21,058 | (39 | ) | -0.74 | % | ||||||||||||||
|
Time
deposits - core (5)
|
92,849 | (636 | ) | -2.72 | % | 44,776 | (355 | ) | -3.15 | % | ||||||||||||||
|
Total
interest-bearing core deposits
|
575,834 | (2,185 | ) | -1.51 | % | 447,978 | (1,761 | ) | -1.56 | % | ||||||||||||||
|
Time
deposits - non-core
|
61,525 | (288 | ) | -1.86 | % | 72,052 | (536 | ) | -2.96 | % | ||||||||||||||
|
Federal
funds purchased
|
5,633 | (8 | ) | -0.56 | % | 9,005 | (24 | ) | -1.06 | % | ||||||||||||||
|
FHLB
& FRB borrowings
|
163,473 | (686 | ) | -1.66 | % | 239,599 | (904 | ) | -1.50 | % | ||||||||||||||
|
Junior
subordinated debentures
|
8,248 | (128 | ) | -6.16 | % | 8,248 | (125 | ) | -6.03 | % | ||||||||||||||
|
Total
interest-bearing wholesale funding
|
238,879 | (1,110 | ) | -1.84 | % | 328,904 | (1,589 | ) | -1.92 | % | ||||||||||||||
|
Total
interest-bearing liabilities
|
814,713 | (3,295 | ) | -1.60 | % | 776,882 | (3,350 | ) | -1.72 | % | ||||||||||||||
|
Noninterest-Bearing
Liabilities
|
||||||||||||||||||||||||
|
Demand
deposits
|
188,310 | 170,897 | ||||||||||||||||||||||
|
Interest
payable and other
|
5,520 | 7,040 | ||||||||||||||||||||||
|
Total
noninterest liabilities
|
193,830 | 177,937 | ||||||||||||||||||||||
|
Total
liabilities
|
1,008,543 | 954,819 | ||||||||||||||||||||||
|
Shareholders'
equity
|
166,975 | 114,959 | ||||||||||||||||||||||
|
Total
liabilities and shareholders' equity
|
$ | 1,175,518 | $ | 1,069,778 | ||||||||||||||||||||
|
Net
Interest Income
|
$ | 13,784 | $ | 13,194 | ||||||||||||||||||||
|
Net
Interest Income as a Percent of Earning Assets
|
5.02 | % | 5.28 | % | ||||||||||||||||||||
|
(1)
Federal Home Loan Bank stock is included in securities available for
sale.
|
||||||||||||||||||||||||
|
(2)
Nonaccrual loans have been included in average balance
totals.
|
||||||||||||||||||||||||
|
(3)
Interest income includes recognized loan origination fees of $251 and $224
for the three months ended
|
||||||||||||||||||||||||
|
December
31, 2009 and 2008, respectively.
|
||||||||||||||||||||||||
|
(4)
Total includes loans held for sale.
|
||||||||||||||||||||||||
|
(5)
Core time deposits include all local time deposits, including local time
deposits over $100.
|
||||||||||||||||||||||||
-31-
|
Table
II
|
||||||||||||
|
Analysis
of Changes in Interest Income and Interest Expense
|
||||||||||||
|
(dollars
in thousands)
|
||||||||||||
|
Three
Months Ended December 31, 2009
|
||||||||||||
|
compared
to December 31, 2008
|
||||||||||||
|
Increase (decrease) due to
|
||||||||||||
|
Volume
|
Rate
|
Net
|
||||||||||
|
Interest
earned on:
|
||||||||||||
|
Federal
funds sold and interest
|
||||||||||||
|
bearing
deposits in banks
|
$ | (1 | ) | $ | 0 | $ | (1 | ) | ||||
|
Securities
available-for-sale:
|
||||||||||||
|
Taxable
|
997 | (263 | ) | 734 | ||||||||
|
Tax-exempt
|
3 | (4 | ) | (1 | ) | |||||||
|
Loans,
net of allowance for loan losses
|
133 | (330 | ) | (197 | ) | |||||||
|
Total
interest income
|
1,132 | (597 | ) | 535 | ||||||||
|
Interest
paid on:
|
||||||||||||
|
Money
market and NOW accounts
|
265 | (169 | ) | 96 | ||||||||
|
Savings
deposits
|
13 | 34 | 47 | |||||||||
|
Time
deposits - core
|
383 | (102 | ) | 281 | ||||||||
|
Total
interest-bearing core deposits
|
661 | (237 | ) | 424 | ||||||||
|
Time
deposits - non-core
|
(77 | ) | (171 | ) | (248 | ) | ||||||
|
Federal
funds purchased
|
(8 | ) | (8 | ) | (16 | ) | ||||||
|
FHLB
& FRB borrowings
|
(286 | ) | 68 | (218 | ) | |||||||
|
Junior
subordinated debentures
|
- | 3 | 3 | |||||||||
|
Total
interest-bearing wholesale funding
|
(371 | ) | (108 | ) | (479 | ) | ||||||
|
Total
interest expense
|
290 | (345 | ) | (55 | ) | |||||||
|
Net
interest income
|
$ | 842 | $ | (252 | ) | $ | 590 | |||||
2009
Compared to 2008
Two
tables follow which analyze the changes in net interest income for the years
2009, 2008, and 2007. Table III “Average Balance Analysis of Net
Interest Earnings”, provides information with regard to average balances of
assets and liabilities, as well as associated dollar amounts of interest income
and interest expense, relevant average yields or rates, and net interest income
as a percent of average earning assets. Table IV, “Analysis of
Changes in Interest Income and Interest Expense”, shows the increase (decrease)
in the dollar amount of interest income and interest expense and the differences
attributable to changes in either volume or rates.
The net
interest margin for the full year 2009 was 5.14%, a decline of 7 basis points
from the 5.21% net interest margin reported for the year 2008. Table
III shows that earning asset yields declined by 61 basis points for the year
2009 when compared to 2008 from 6.97% to 6.36%. The decline in
earning assets yields was due primarily to the 57 basis point drop in the yield
on loans, which resulted from the rapidly declining interest rate environment
experienced throughout 2008 and 2009 that lowered yields on the Bank’s variable
rate loan portfolio. As noted earlier, the Bank’s use of interest
rate floors on its loan portfolio mitigated further decline in loan yields
.
Table III
also shows the overall cost of interest-bearing liabilities for the year 2008
was down 70 basis points from 2.28% in 2008 to 1.58% in 2009. This
decline can be also be attributed to the falling rate environment during late
2008 and into 2009, plus the relatively short-maturity structure of the Bank’s
wholesale funding, which permitted rapid refinancing of funding at much lower
rates throughout the year as noted by the 127 basis point decline in the cost of
interest-bearing wholesale funding from 2.93% in 2008 to 1.66% in
2009. Table III also shows that the spread between the cost of
interest-bearing core deposits and interest-bearing wholesale funding has
narrowed significantly in 2009 when compared to
2008. Interest-bearing core deposits were 12 basis points below the
cost of interest-bearing wholesale funding in
-32-
2009,
while in 2008, the cost of interest-bearing core deposits was 108 basis points
below the cost of interest-bearing wholesale funding.
The
year-to-date December 31, 2009 rate/volume analysis shows that interest income
including loan fees increased by $930 from last year. Higher volumes
of earning assets, both securities and loans, increased interest income by
$6,442 and lower yields on earning assets decreased interest income by
$5,512. Most of the decline in interest income from lower rates was
due to the lower yield on the loan portfolio. The rate/volume
analysis shows that interest expense for the year 2009 decreased by $3,838 from
last year, as higher volumes and changes in mix of deposits and wholesale
funding categories caused interest expense to increase by $2,032, which was more
than offset by lower rates, which decreased interest expense by
$5,870. The change in mix and volumes of interest-bearing wholesale
funding combined with much lower rates paid on wholesale funding were the
primary drivers of lower interest expense in 2009 when compared to
2008.
2008
Compared to 2007
The net
interest margin for the full year 2008 was 5.21%, a decline of 1 basis point
from the 5.22% net interest margin reported for the year 2007. Table
III shows that earning asset yields declined by 134 basis points for the year
2008 when compared to 2007 from 8.31% to 6.97%. The decline in
earning assets yields was due primarily to the 141 basis point drop in yields on
loans, which resulted from the rapidly declining interest rate environment
experienced throughout 2008 that lowered yields on the Bank’s variable rate loan
portfolio. The Bank’s use of interest rate floors on its variable
rate loan portfolio mitigated the decline in loan yields during the last half of
2008.
Table III
also shows the overall cost of interest-bearing liabilities for the year 2007
was down 182 basis points from 4.10% in 2007 to 2.28% in 2008. This
decline can be also be attributed to the falling rate environment during 2008,
plus the relatively short-maturity structure of the Bank’s alternative funding,
which permitted rapid refinancing of funding at much lower rates throughout the
year. Table III also illustrates the difference between the cost of
interest-bearing core deposits for the year 2008 as compared to the cost of
interest-bearing alternative funding. The cost of interest-bearing
core deposits was 1.85% or 108 basis points less than the 2.93% cost of
alternative funding.
The
year-to-date December 31, 2008 rate/volume analysis shows that interest income
including loan fees declined by $3,221 from the prior year. Higher
volumes of earning assets increased interest income by $9,047 and lower yields
on loans decreased interest income by $12,268. The rate/volume
analysis shows that interest expense for the year 2008 decreased by $9,066 from
2007, as higher volumes on all deposit categories caused interest expense to
increase by $5,045, which was more than offset by lower rates, which decreased
interest expense by $14,111.
-33-
|
Table
III
|
||||||||||||||||||||||||||||||||||||
|
Average
Balance Analysis of Net Interest Earnings
|
||||||||||||||||||||||||||||||||||||
|
(dollars
in thousands)
|
||||||||||||||||||||||||||||||||||||
|
2009
|
2008
|
2007
|
||||||||||||||||||||||||||||||||||
|
Interest
|
Average
|
Interest
|
Average
|
Interest
|
Average
|
|||||||||||||||||||||||||||||||
|
Average
Balance
|
Income
or (Expense)
|
Yields
or Rates
|
Average
Balance
|
Income
or (Expense)
|
Yields
or Rates
|
Average
Balance
|
Income
or (Expense)
|
Yields
or Rates
|
||||||||||||||||||||||||||||
|
Interest
Earning Assets
|
||||||||||||||||||||||||||||||||||||
|
Federal
funds sold and interest-
|
||||||||||||||||||||||||||||||||||||
|
bearing
deposits in banks
|
$ | 326 | $ | 5 | 1.53 | % | $ | 554 | $ | 20 | 3.61 | % | $ | 981 | $ | 51 | 5.20 | % | ||||||||||||||||||
|
Securities
available for sale:
|
||||||||||||||||||||||||||||||||||||
|
Taxable
(1)
|
101,752 | 4,698 | 4.62 | % | 57,260 | 2,682 | 4.68 | % | 41,112 | 1,837 | 4.47 | % | ||||||||||||||||||||||||
|
Tax-exempt
|
5,449 | 195 | 3.58 | % | 5,300 | 196 | 3.70 | % | 5,226 | 156 | 2.99 | % | ||||||||||||||||||||||||
|
Loans,
net of allowance for loan
|
||||||||||||||||||||||||||||||||||||
|
losses(2)(3)(4)
|
943,788 | 61,977 | 6.57 | % | 882,742 | 63,047 | 7.14 | % | 785,132 | 67,122 | 8.55 | % | ||||||||||||||||||||||||
|
Total
interest earning assets
|
1,051,315 | 66,875 | 6.36 | % | 945,856 | 65,945 | 6.97 | % | 832,451 | 69,166 | 8.31 | % | ||||||||||||||||||||||||
|
Non
Earning Assets
|
||||||||||||||||||||||||||||||||||||
|
Cash
and due from banks
|
17,590 | 18,241 | 21,662 | |||||||||||||||||||||||||||||||||
|
Premises
and equipment
|
20,396 | 20,955 | 19,755 | |||||||||||||||||||||||||||||||||
|
Goodwill
& other intangibles
|
22,794 | 23,018 | 23,376 | |||||||||||||||||||||||||||||||||
|
Interest
receivable and other
|
17,876 | 10,970 | 6,688 | |||||||||||||||||||||||||||||||||
|
Total
non interest earning assets
|
78,656 | 73,184 | 71,481 | |||||||||||||||||||||||||||||||||
|
Total
assets
|
$ | 1,129,971 | $ | 1,019,040 | $ | 903,932 | ||||||||||||||||||||||||||||||
|
Interest-Bearing
Liabilities
|
||||||||||||||||||||||||||||||||||||
|
Money
market and NOW accounts
|
$ | 422,497 | $ | (5,526 | ) | -1.31 | % | $ | 379,657 | $ | (6,584 | ) | -1.73 | % | $ | 364,780 | $ | (13,358 | ) | -3.66 | % | |||||||||||||||
|
Savings
deposits
|
24,410 | (325 | ) | -1.33 | % | 21,228 | (183 | ) | -0.86 | % | 24,309 | (486 | ) | -2.00 | % | |||||||||||||||||||||
|
Time
deposits - core (5)
|
77,101 | (2,242 | ) | -2.91 | % | 42,566 | (1,427 | ) | -3.35 | % | 32,589 | (1,381 | ) | -4.24 | % | |||||||||||||||||||||
|
Total
interest-bearing core deposits
|
524,008 | (8,093 | ) | -1.54 | % | 443,451 | (8,194 | ) | -1.85 | % | 421,678 | (15,225 | ) | -3.61 | % | |||||||||||||||||||||
|
Time
deposits - non-core
|
78,941 | (1,460 | ) | -1.85 | % | 56,380 | (1,948 | ) | -3.46 | % | 63,918 | (3,347 | ) | -5.24 | % | |||||||||||||||||||||
|
Federal
funds purchased
|
17,603 | (84 | ) | -0.48 | % | 22,094 | (578 | ) | -2.62 | % | 10,128 | (539 | ) | -5.32 | % | |||||||||||||||||||||
|
FHLB
& FRB borrowings
|
181,580 | (2,691 | ) | -1.48 | % | 202,293 | (5,456 | ) | -2.70 | % | 123,597 | (6,121 | ) | -4.95 | % | |||||||||||||||||||||
|
Junior
subordinated debentures
|
8,248 | (508 | ) | -6.16 | % | 8,248 | (498 | ) | -6.04 | % | 8,248 | (508 | ) | -6.16 | % | |||||||||||||||||||||
|
Total
interest-bearing wholesale funding
|
286,372 | (4,743 | ) | -1.66 | % | 289,015 | (8,480 | ) | -2.93 | % | 205,891 | (10,515 | ) | -5.11 | % | |||||||||||||||||||||
|
Total
interest-bearing liabilities
|
810,380 | (12,836 | ) | -1.58 | % | 732,466 | (16,674 | ) | -2.28 | % | 627,569 | (25,740 | ) | -4.10 | % | |||||||||||||||||||||
|
Noninterest-Bearing
Liabilities
|
||||||||||||||||||||||||||||||||||||
|
Demand
deposits
|
179,886 | 169,792 | 169,035 | |||||||||||||||||||||||||||||||||
|
Interest
payable and other
|
4,235 | 4,914 | 4,239 | |||||||||||||||||||||||||||||||||
|
Total
noninterest-bearing liabilities
|
184,121 | 174,706 | 173,274 | |||||||||||||||||||||||||||||||||
|
Total
liabilities
|
994,501 | 907,172 | 800,843 | |||||||||||||||||||||||||||||||||
|
Shareholders'
equity
|
135,470 | 111,868 | 103,089 | |||||||||||||||||||||||||||||||||
|
Total
liabilities and shareholders' equity
|
$ | 1,129,971 | $ | 1,019,040 | $ | 903,932 | ||||||||||||||||||||||||||||||
|
Net
Interest Income
|
$ | 54,039 | $ | 49,271 | $ | 43,426 | ||||||||||||||||||||||||||||||
|
Net
Interest Income as a Percent of
|
||||||||||||||||||||||||||||||||||||
|
Earning
Assets
|
5.14 | % | 5.21 | % | 5.22 | % | ||||||||||||||||||||||||||||||
| (1) Federal Home Loan Bank stock is included in securities available for sale. | ||||||||||||||||||||||||||||||||||||
| (2) Nonaccrual loans have been included in average balance totals. | ||||||||||||||||||||||||||||||||||||
| (3) Interest income includes recognized loan origination fees of $1,284, $1,843 and $2,065 for the years 2008, 2007, and 2006, respectively. | ||||||||||||||||||||||||||||||||||||
| (4) Total includes loans held for sale. | ||||||||||||||||||||||||||||||||||||
|
(5)
Core time deposits include all local time deposits, including local time
deposits over $100.
|
||||||||||||||||||||||||||||||||||||
-34-
|
Table
IV
|
||||||||||||||||||||||||
|
Analysis
of Changes in Interest Income and Interest Expense
|
||||||||||||||||||||||||
|
(dollars
in thousands)
|
||||||||||||||||||||||||
|
2009
compared to 2008
|
2008
compared to 2007
|
|||||||||||||||||||||||
|
Increase
(decrease) due to
|
Increase
(decrease) due to
|
|||||||||||||||||||||||
|
Volume
|
Rate
|
Net
|
Volume
|
Rate
|
Net
|
|||||||||||||||||||
|
Interest
earned on:
|
||||||||||||||||||||||||
|
Federal
funds sold and interest
|
||||||||||||||||||||||||
|
bearing
deposits in banks
|
$ | (8 | ) | $ | (7 | ) | $ | (15 | ) | $ | (22 | ) | $ | (9 | ) | $ | (31 | ) | ||||||
|
Securities
available-for-sale:
|
||||||||||||||||||||||||
|
Taxable
|
2,084 | (68 | ) | 2,016 | 722 | 123 | 845 | |||||||||||||||||
|
Tax-exempt
|
6 | (7 | ) | (1 | ) | 2 | 38 | 40 | ||||||||||||||||
|
Loans,
net of allowance for loan
|
||||||||||||||||||||||||
|
losses
|
4,360 | (5,430 | ) | (1,070 | ) | 8,345 | (12,420 | ) | (4,075 | ) | ||||||||||||||
|
Total
interest income
|
6,442 | (5,512 | ) | 930 | 9,047 | (12,268 | ) | (3,221 | ) | |||||||||||||||
|
Interest
paid on:
|
||||||||||||||||||||||||
|
Money
market and NOW accounts
|
743 | (1,801 | ) | (1,058 | ) | 545 | (7,319 | ) | (6,774 | ) | ||||||||||||||
|
Savings
deposits
|
27 | 115 | 142 | (62 | ) | (241 | ) | (303 | ) | |||||||||||||||
|
Time
deposits
|
1,158 | (343 | ) | 815 | 423 | (377 | ) | 46 | ||||||||||||||||
|
Total
interest-bearing core deposits
|
1,928 | (2,029 | ) | (101 | ) | 906 | (7,937 | ) | (7,031 | ) | ||||||||||||||
|
Time
deposits - non-core
|
780 | (1,268 | ) | (488 | ) | (395 | ) | (1,004 | ) | (1,399 | ) | |||||||||||||
|
Federal
funds purchased
|
(117 | ) | (377 | ) | (494 | ) | 637 | (598 | ) | 39 | ||||||||||||||
|
FHLB
& FRB borrowings
|
(559 | ) | (2,206 | ) | (2,765 | ) | 3,897 | (4,562 | ) | (665 | ) | |||||||||||||
|
Junior
subordinated debentures
|
- | 10 | 10 | - | (10 | ) | (10 | ) | ||||||||||||||||
|
Total
interest-bearing wholesale funding
|
104 | (3,841 | ) | (3,737 | ) | 4,139 | (6,174 | ) | (2,035 | ) | ||||||||||||||
|
Total
interest expense
|
2,032 | (5,870 | ) | (3,838 | ) | 5,045 | (14,111 | ) | (9,066 | ) | ||||||||||||||
|
Net
interest income
|
$ | 4,410 | $ | 358 | $ | 4,768 | $ | 4,002 | $ | 1,843 | $ | 5,845 | ||||||||||||
Provision
for Possible Loan Losses
Management
provides for possible loan losses by maintaining an allowance. The
level of the allowance is determined based upon judgments regarding the size and
nature of the loan portfolio, historical loss experience, the financial
condition of borrowers, the level of nonperforming loans, and current general
economic conditions. Additions to the allowance are charged to
expense. Loans are charged against the allowance when management
believes the collection of principal is unlikely.
The
provision for loan losses totaled $36,000 in 2009, $3,600 in 2008, and $725 in
2007. The increase in the provision for 2009 when compared to 2008
was due to significant net loan charge offs during the current year totaling
$33,613 and continued deterioration in credit quality due to weak economic
conditions, combined with an increase in unallocated reserves. The
increase in the provision for 2008 when compared to 2007 was due to loan growth,
moderate deterioration in credit quality, and an increase in unallocated
reserves in light of significant economic uncertainty.
At
December 31, 2009, the Bank had $36,570 or 3.05% of total assets in
nonperforming assets, net of government guarantees, compared to $7,704 or 0.71%
of total assets at December 31, 2008. The schedule below provides a
more detailed breakdown of nonperforming assets by loan type at December 31,
2009 when compared to December 31, 2008:
-35-
| NONPERFORMING ASSETS | ||||||||
|
Year
Ended
|
||||||||
|
December
31,
|
December
31,
|
|||||||
|
2009
|
2008
|
|||||||
|
Nonaccrual
loans
|
||||||||
|
Real
estate secured loans:
|
||||||||
|
Permanent
Loans:
|
||||||||
|
Multifamily
residential
|
$ | - | $ | - | ||||
|
Residential
1-4 family
|
704 | 100 | ||||||
|
Owner-occupied
commercial
|
375 | - | ||||||
|
Non-owner-occupied
commercial
|
- | - | ||||||
|
Other
loans secured by real estate
|
1,097 | - | ||||||
|
Total
permanent real estate loans
|
2,176 | 100 | ||||||
|
Construction
Loans:
|
||||||||
|
Multifamily
residential
|
4,409 | - | ||||||
|
Residential
1-4 family
|
4,903 | 2,032 | ||||||
|
Commercial
real estate
|
5,537 | 1,660 | ||||||
|
Commercial
bare land and acquisition & development
|
2,338 | - | ||||||
|
Residential
bare land and acquisition & development
|
8,122 | - | ||||||
|
Other
|
- | - | ||||||
|
Total
construction real estate loans
|
25,309 | 3,692 | ||||||
|
Total
real estate loans
|
27,485 | 3,792 | ||||||
|
Commercial
loans
|
5,268 | - | ||||||
|
Consumer
loans
|
39 | 345 | ||||||
|
Other
loans
|
- | - | ||||||
|
Total
nonaccrual loans
|
32,792 | 4,137 | ||||||
|
90
days past due and accruing interest
|
- | - | ||||||
|
Total
nonperforming loans
|
32,792 | 4,137 | ||||||
|
Nonperforming
loans guaranteed by government
|
(446 | ) | (239 | ) | ||||
|
Net
nonperforming loans
|
32,346 | 3,898 | ||||||
|
Foreclosed
assets
|
4,224 | 3,806 | ||||||
|
Total
nonperforming assets, net of guaranteed loans
|
$ | 36,570 | $ | 7,704 | ||||
Nonperforming assets at December 31, 2009 consist of $32,346 of nonaccrual loans (net of $446 in government guarantees) and $4,224 of foreclosed assets. At December 31, 2009, $25,309 or 78% of nonaccrual loans were residential or commercial real estate construction loans as this sector of the loan portfolio suffered significant stress during the year 2009 as economic conditions deteriorated and real estate values declined. Other real estate owned consisted of $394 of individual residential lots, $2,384 of completed residential properties, and a single commercial land property valued at $1,446.
The
allowance for loan losses at December 31, 2009 was $13,367 (1.42% of outstanding
loans, net of loans held for sale) compared to $10,980 (1.15% of loans) and
$8,675 (1.05% of loans) at years end 2008 and 2007, respectively. At
December 31, 2009, the Bank has also reserved $246 for possible losses on
unfunded loan commitments, which is classified in other
liabilities. The 2009 ending allowance includes $1,048 in specific
allowance for $58,861 in impaired loans (net of government guarantees). At
December 31, 2008, the Company had $6,132 of impaired loans (net of government
guarantees) with a specific allowance assigned of $887.
While the
Bank saw some positive trends in fourth quarter 2009 with regard to the overall
credit quality of the loan portfolio, management cannot predict the level of the
provision for loan losses, the level of the allowance for loans losses, nor the
level of nonperforming assets in future quarters as a result of uncertain
economic conditions. At December 31, 2009, and as shown in Item 1 in
the Statistical Information, the Bank’s unallocated reserves were $2,084 or
15.6% of the total allowance for loan losses at year end. Management
believes that the allowance for loan losses at December 31, 2009 is adequate and
this level of unallocated reserves was prudent in light of the economic
conditions and uncertainty that exists in the Northwest markets that the Bank
serves.
Net loan
charge offs were $33,613 in 2009 compared to $1,295 in 2008, and $334 in
2007. The majority of net loan charge offs during 2009 were for
commercial and residential construction and land development
-36-
loans. Net
charge offs as a percentage of average loans were 3.56%, 0.15%, and 0.04% for
2009, 2008, and 2007, respectively.
Noninterest
Income
Noninterest
income is derived from sources other than fees and interest on earning
assets. The Company’s primary sources of noninterest income are
service charge fees on deposit accounts, merchant bankcard activity, income
derived from mortgage banking services, and gains on the sale of
loans.
2009
Compared to 2008
Noninterest
income in 2009 was $4,405, up $136 or 3% from the $4,269 reported for the year
2008. The increase in 2009 noninterest income when compared to 2008
was primarily attributable to a $196 increase in service charges on deposit
accounts and a $108 increase in mortgage banking revenues. Service
charges on deposit accounts increased due to a lower earnings credit rate, which
increased fees on analyzed business accounts, while mortgage banking revenues
were up in 2009 over 2008 due to the low interest rate environment combined with
federal tax rebates available to first-time home buyers both of which spurred
higher levels of mortgage loan originations in 2009 when compared to
2008. These increases were partially offset by declines in Bankcard
processing fee income and the other interest income
category. Bankcard processing fee income of $1,755 was down $68 from
last year due to lower volumes of transactions due to economic
conditions. The decline of $87 in the other interest income category
was primarily the result of a one-time gain of approximately $70 recorded during
2008 on disposal of equipment at the Bank’s Bellevue office, which was damaged
during a falling crane incident.
2008
Compared to 2007
Noninterest
income in 2008 was $4,269, up $344 or 9% from the $3,925 reported for the year
2007. The increase in 2008 noninterest income when compared to 2007
was primarily attributable to a $267 increase in service charges on deposit
accounts and a $193 increase in other fee income, principally bankcard
processing fee income. Service charges on deposit accounts increased
due to lower earnings credit rate, which increased fees on analyzed business
accounts. Bankcard processing fee income accounted for $114 of this
increase. Increases in these categories were partially offset by a
$15 decrease in mortgage banking income. The decline in mortgage
banking income was attributable to a significant slow down in the residential
housing market. The other income category in 2008 was $330, an $87 or
21% decrease from the $417 reported in the other income category for the year
2007.
Noninterest
Expense
Noninterest
expense represents all expenses other than the provision for loan losses and
interest costs associated with deposits and other interest-bearing
liabilities. It incorporates personnel, premises and equipment, data
processing and other operating expenses.
2009
Compared to 2008
Noninterest
expense for the year 2009 was $31,162, up $1,600 or 5% over the $29,562 reported
for the year 2008. The increase in noninterest expense for the year
2009 over 2008 was primarily attributable to a $1,474 increase in FDIC insurance
assessment, a $698 increase in other real estate expense, and a $448 increase in
the other expense category. The increase in FDIC insurance assessment
resulted from growth in core deposits, increase premium rates during the year
2009, and a $510 special assessment made during the second quarter
2009. Other real estate expense increased in 2009 over 2008 primarily
due to $598 in valuation write downs that occurred during 2009. The
growth in the other expense category was mostly attributable to a $381 increase
in legal fees primarily related to legal work performed on problem loans during
2009. The increase in these expenses was partially offset by a $1,098
decline in personnel expense in 2009 when compared to 2008. The
decline in personnel expense was due to reductions in accruals for incentive
compensation, 401k accruals, and group insurance expense on the Company’s
self-insured medical plan. Incentive and 401k accruals declined due
to the significant drop in overall corporate financial performance, while group
insurance expense declined due to a lower claims experience.
-37-
2008
Compared to 2007
Noninterest
expense for the year 2008 was $29,562, up $3,701 or 14% over the $25,861
reported for the year 2007. Personnel expense in 2008 was up $2,422
and accounted for 65% of the total increase in noninterest expense in the
year. Total salary expense was up $1,699 or 16% and benefits and
taxes were up $780 or 16% over last year. Approximately $442 of the
increase in salary expense was due to lower loan origination costs, which are a
direct offset to salary expense. Higher benefits and taxes expense in
2008 resulted from increased group insurance, and accruals for officer
incentives. The other expense category accounted for the majority of
the remaining increase in noninterest expense in 2008 over
2007. Other expenses were $5,490 in 2008, up $588 or 12% over 2007
other expenses of $4,902. The increase in the other expense category
can be attributed to the following areas: 1) increased FDIC assessment of $231;
2) increased travel expense of $89; 3) increased other real estate expense of
$125 due to increases in other real estate owned; and 4) increased repossession
and collection expense of $23 related to increases in non-performing
loans.
BALANCE
SHEET
Loans
At
December 31, 2009, outstanding loans, net of deferred loan fees and excluding
loans held for sale, were $944,364, down $11,993 over outstanding loans of
$956,357 at December 31, 2008. A summary of outstanding loans by
market for the year 2009 follows:
|
Balance
|
Balance
|
$
Increase
|
%
Increase
|
|||||||||||||
|
Dec.
31, 2009
|
Dec.
31, 2008
|
(Decrease)
|
(Decrease
|
|||||||||||||
|
Eugene
Market
|
$ | 259,435 | $ | 237,604 | $ | 21,831 | 9.2 | % | ||||||||
|
Portland
Market
|
435,304 | 432,961 | 2,343 | 0.5 | % | |||||||||||
|
Seattle
Market
|
249,625 | 285,792 | (36,167 | ) | -12.7 | % | ||||||||||
|
Total
|
$ | 944,364 | $ | 956,357 | $ | (11,993 | ) | -1.3 | % | |||||||
More
information on the loan portfolio can be found in statistical information in
Item 1 and in Note 3 of the Notes to Consolidated Financial
Statements in Item 7 below.
Goodwill
and Intangible Assets
At
December 31, 2009, the Company had a recorded balance of $22,031 in goodwill
from the November 30, 2005 acquisition of NWB Financial Corporation and its
wholly-owned subsidiary Northwest Business Bank (NWBF). In addition,
at December 31, 2009 the Company had $650 core deposit intangible assets
resulting from the acquisition of NWBF. The core deposit intangible
was determined to have an expected life of approximately seven years and is
being amortized through 2012 using the straight-line method. During
2009, the Company amortized $223 of the core deposit intangible. In
accordance with generally accepted accounting principals, the Company does not
amortize goodwill or other intangible assets with indefinite lives, but instead
periodically tests these assets for impairment. Management performed
an impairment analysis at December 31, 2009 and determined there was no
impairment of the goodwill at the time of the analysis.
Deposits
Outstanding
deposits at December 31, 2009 were $827,918, an increase of $105,482 over
outstanding deposits of $722,437 at December 31, 2008. Core deposits,
which are defined by the Company as demand, interest checking, money market,
savings, and local time deposits, including local time deposits in excess of
$100 thousand, were $771,986, up $156,154 from outstanding core deposits of
$615,832 at December 31, 2008. At December 31, 2009 and 2008,
respectively, core deposits represented 93% and 85% of total
deposits. A summary of outstanding deposits by market for the year
2009 follows:
-38-
|
Balance
|
Balance
|
$
Increase
|
%
Increase
|
|||||||||||||
|
Dec.
31, 2009
|
Dec.
31, 2008
|
(Decrease)
|
(Decrease
|
|||||||||||||
|
Eugene
Market core deposits
|
$ | 492,012 | $ | 406,098 | $ | 85,914 | 21.2 | % | ||||||||
|
Portland
Market core deposits
|
165,716 | 110,287 | 55,429 | 50.3 | % | |||||||||||
|
Seattle
Market core deposits
|
114,258 | 99,447 | 14,811 | 14.9 | % | |||||||||||
|
Total
core deposits
|
771,986 | 615,832 | 156,154 | 25.4 | % | |||||||||||
|
Other
deposits
|
55,932 | 106,605 | (50,673 | ) | -47.5 | % | ||||||||||
|
Total
|
$ | 827,918 | $ | 722,437 | $ | 105,481 | 14.6 | % | ||||||||
The growth in core deposits during 2009 represented a record for the Company in terms of dollars. The decline in the other deposit category of $50,673 was due to the record growth in core deposits during the year and Company’s decision to exit the State of Oregon and State of Washington community bank time deposit program as both states changed their statutes increasing collateralization required to 100% during the year.
Junior
Subordinated Debentures
The
Company had $8,248 in junior subordinated debentures at December 31, 2009, which
were issued in conjunction with the acquisition of NWBF. At December
31, 2009, the entire $8,248 in junior subordinated debentures had an interest
rate of 6.265% that is fixed through November 2010. In November 2010,
the rate on the junior subordinated debentures will be 3-month LIBOR plus 140
basis points. If the current interest rate environment persists, in
November 2010, the rate on junior subordinated debentures would fall below
2.00%. As of December 31, 2009, the entire balance of the junior
subordinated debentures qualified as Tier 1 capital under regulatory capital
purposes. Additional information regarding the terms of the junior
subordinated debentures, including maturity/repricing dates and interest rate,
is included in Note 10 of the Notes to Consolidated Financial
Statements in Item 7 below.
CAPITAL
RESOURCES
Capital
is the shareholders’ investment in the Company. Capital grows through
the retention of earnings and the issuance of new stock whether through stock
offerings or through the exercise of stock options. Capital formation
allows the Company to grow assets and provides flexibility in times of
adversity.
Shareholders’
equity at December 31, 2009 was $165,662, an increase of $49,497 or 42.6% from
December 31, 2008. The increase in shareholders’ equity during
2009 was the result of two successful capital raises. In January
2009, the Company successfully raised approximately $9,600 of capital, net of
placement fees and transaction costs, by completing a private placement of 750
shares at $13.50 per share. As a result of this transaction, the
Company announced that it had declined to participate in the US Treasury Capital
Purchase Program despite receiving preliminary approval from the US Treasury to
receive up to $30 million in new capital through the issuance of preferred
stock. In October 2009, the Company also successfully raised
approximately $45,700, net of underwriting discounts and transaction costs, in
new capital through an underwritten public offering by issuing 5,520 shares of
common stock at a price of $8.75 per share.
The
Federal Reserve Board and the FDIC have in place guidelines for risk-based
capital requirements applicable to U.S. bank holding companies and
banks. These risk-based capital guidelines take into consideration
risk factors, as defined by regulation, associated with various categories of
assets, both on and off-balance sheet. Under the guidelines, capital
strength is measured in three ways, first by measuring Tier 1 capital to
leverage assets, followed by capital measurement in two tiers, which are used in
conjunction with risk-adjusted assets to determine the risk-based capital
ratios. These guidelines require a minimum of 4% Tier 1 capital to
leverage assets, 4% Tier 1 capital to risk-weighted assets, and 8% total capital
to risk-weighted assets. In order to be classified as
well-capitalized, the highest capital rating, by the Federal Reserve and FDIC,
these three ratios must be in excess of 5.00%, 6.00%, and 10.00%,
respectively. The Company’s leverage capital ratio, Tier 1 risk-based
capital ratio, and Total risk-based capital ratio were 13.66%, 14.38%, and
15.63%, respectively at December 31, 2009, all ratios being well above the
minimum well-capitalized designation. At December 31, 2009, the
Bank’s leverage capital ratio, Tier I risk-based capital ratio, and Total
risk-based capital ratio were 12.24%, 13.39%, and 14.64%, also all well over the
minimum well-capitalized designation by the FDIC.
-39-
The
Company pays cash dividends on a quarterly basis, typically in March, June,
September and December of each year. The Board of Directors considers
the dividend amount quarterly and takes a broad perspective in its dividend
deliberations including a review of recent operating performance, capital
levels, and concentrations of loans as a percentage of capital, and growth
projections. The Board also considers dividend payout ratios,
dividend yield, and other financial metrics in setting the quarterly
dividend. The Company declared and paid cash dividends of $0.25 per
share for the year 2009. During the first and second quarters 2009,
the Company paid dividends of $0.10 each quarter. In third quarter
2009, the Company reduced its quarterly dividend to $0.04 in light of the
significant loss recorded during second quarter 2009, and in fourth quarter
2009, the company again reduced its quarterly dividend to $0.01 per share due to
minimal profits recorded in third quarter 2009 and projections for minimal
profit in fourth quarter 2009. The $0.25 dividend per share paid in
2009 compares to dividends of $0.40 per share for the year 2008.
During
2009, the Federal Reserve issued guidelines to all bank holding companies
regarding the payment of dividends to shareholders, which specifically states
that bank holding companies should not pay dividends in excess of its trailing
four quarter earnings. As a result of the second quarter 2009 loss
and minimal profits recorded in third and fourth quarter 2009, which resulted in
a loss for the year 2009, the Company must obtain permission from the Federal
Reserve and the State of Oregon to pay cash dividends to
shareholders.
The Board
of Directors, at its February 16, 2010 meeting, approved a dividend of $0.01 per
share to be paid on March 15, 2010. If continued for each quarter
during 2010, this would result in an annual dividend of $0.04 for each
outstanding share of common stock in 2010. The Company has sufficient
liquidity to maintain this level of dividend throughout 2010 if approved by
regulators and would not require any dividend from the Bank to the Company in
support of the cash dividend to shareholders.
The
Company projects that earnings retention in 2010 and existing capital will be
sufficient to fund anticipated organic asset growth, while maintaining a
well-capitalized designation from all regulatory agencies.
OFF-BALANCE
SHEET ARRANGEMENTS AND COMMITMENTS
In the
normal course of business, the Bank commits to extensions of credit and issues
letters of credit. The Bank uses the same credit policies in making
commitments to lend funds and conditional obligations as it does for other
credit products. In the event of nonperformance by the customer, the
Bank’s exposure to credit loss is represented by the contractual amount of the
instruments. Commitments to extend credit are agreements to lend to a
customer as long as there is no violation of any condition established by the
contract. Since some commitments may expire without being drawn upon,
the total commitment amounts do not necessarily represent future cash
requirements. At December 31, 2009, the Bank had $133,515 in
commitments to extend credit.
Letters
of credit written are conditional commitments issued by the Bank to guarantee
performance of a customer to a third party. The credit risk involved
is essentially the same as that involved in extending loan facilities to
customers. At December 31, 2009, the Bank had $1,614 in letters of
credit and financial guarantees written.
The Bank
also has internal guidance lines of credit established for certain borrowers,
primarily in the residential construction industry. These guidance
lines are not contractual commitments to extend credit, and may be terminated by
the Bank for any reason without any obligation to the borrower. These
lines provide the Bank’s lenders limits on future extensions of credit to
certain borrowers. The Bank uses the same credit policies in
establishing internal guidance lines as it does for other credit products. At
December 31, 2009, the Bank had established unused and uncommitted guidance
lines totaling approximately $677, compared to unused uncommitted guidance lines
of $1,387 at December 31, 2008.
-40-
The
Company has certain other financial commitments. These future
financial commitments at December 31, 2009, are outlined below:
|
Contractual
Obligations
|
||||||||||||||||||||
|
(dollars
in thousands)
|
Total
|
Less
than One Year
|
1
- 3 Years
|
3
- 5 Years
|
More
than 5 Years
|
|||||||||||||||
|
Junior
subordinated debenture
|
$ | 8,248 | $ | - | $ | - | $ | - | $ | 8,248 | ||||||||||
|
FHLB
borrowings
|
$ | 130,000 | 66,500 | 26,000 | 35,500 | 2,000 | ||||||||||||||
|
Federal
Reserve borrowings
|
$ | 53,025 | 53,025 | - | - | - | ||||||||||||||
|
Fed
Funds
|
$ | 10,000 | 10,000 | |||||||||||||||||
|
Time
Deposits
|
$ | 149,961 | 99,331 | 45,233 | 5,294 | 103 | ||||||||||||||
|
Operating
lease obligations
|
$ | 6,851 | 988 | 1,857 | 1,254 | 2,752 | ||||||||||||||
| $ | 358,085 | $ | 229,844 | $ | 73,090 | $ | 42,048 | $ | 13,103 | |||||||||||
LIQUIDITY
Liquidity
is the term used to define the Company’s ability to meet its financial
commitments. The Company maintains sufficient liquidity to ensure
funds are available for both lending needs and the withdrawal of deposit
funds. The Company derives liquidity through core deposit growth,
maturity of investment securities, and loan payments. Core deposits
include demand, interest checking, money market, savings, and local time
deposits, including local non-public time deposits in excess of $100. Additional
liquidity and funding sources are provided through the sale of loans, sales of
securities, access to national CD markets, and both secured and unsecured
borrowings. The Bank uses a number of measurements to monitor its
liquidity position on a daily, weekly, and monthly basis, which includes its
ability to meet both short-term and long-term obligations, and requires the
Company to maintain a certain amount of liquidity on the asset side of its
balance sheet. The Bank also prepares quarterly projections of its
liquidity position 90 days and 180 days into the future. In addition,
the Bank prepares a Liquidity Contingency Plan at least semi-annually that is
strategic in nature and forward-looking to test the ability of the Bank to fund
a liquidity shortfall arising from various events. The Liquidity
Contingency Plan is presented and reviewed by the Bank’s Asset and Liability
Committee.
Core
deposits at December 31, 2009 were $771,986 and represented 93% of total
deposits compared to 85% at December 31, 2008. During 2009, the Bank
experienced record growth in its core deposit base, which increased $156,154 or
25% over outstanding core deposits at December 31, 2008. Growth in
core deposits was strong in all three of the Bank’s primary
markets. Since outstanding loans during 2009 declined by $11,993, the
Bank used the growth in core deposits to pay down its wholesale funding and fund
$112,685 of growth in its securities portfolio. At December 31, 2009,
the Company’s securities portfolio totaled $167,618 and represented 14% of total
assets. At December 31, 2009, $35,115 of the securities portfolio was
pledged to support public deposits and a portion of the Bank’s secured borrowing
line at the FHLB leaving $132,503 of the securities portfolio unencumbered and
available for sale. In addition, at December 31, 2009, the Bank had
$34,706 of government guaranteed loans that could be sold in the secondary
market at a premium that also supported the Bank’s liquidity
position.
Due to
its strategic focus to market to specific segments, the Bank has been successful
in developing deposit relationships with several large clients, which are
generally defined as deposit relationships of $1,000 or more, which are closely
monitored by management and Bank officers. At December 31, 2009, 36
large deposit relationships with the Bank account for $249,023 or 32% of total
outstanding core deposits. The single largest client represented 5.7%
of outstanding core deposits at December 31, 2009. The loss of this
deposit relationship or other large deposit relationships could cause an adverse
effect on short-term liquidity. During 2009, the Bank implemented a
10-point risk-rating system to evaluate each of its large depositors in order to
assist management in its daily monitoring of the volatility of this portion of
its core deposit base. The risk-rating system attempts to determine
the stability of the deposits of each large depositor, evaluating among other
things the length of time the depositor has been with the Bank and the
likelihood of loss of individual large depositor relationships. Bank
management and officers maintain close relationships and hold regular meetings
with its large depositors to assist in management of these
relationships. The Bank expects to maintain these relationships and
believes it has sufficient sources of liquidity to mitigate the loss of one or
more of these clients and regularly tests its ability to mitigate the loss of
multiple large depositor relationships in its Liquidity Contingency
Plan.
-41-
Borrowing
lines have been established at various correspondent banks, the Federal Home
Loan Bank of Seattle and with the Federal Reserve Bank of San
Francisco. At December 31, 2009, the Bank had secured and unsecured
borrowing lines totaling approximately $545,317 consisting of $359,561 in a
secured borrowing line with the Federal Home Loan Bank of Seattle, $75,000 in
unsecured borrowing lines with various correspondent banks, and $110,756 in a
secured borrowing line with the Federal Reserve Bank of San
Francisco. The Federal Home Loan Bank borrowing line is limited to
the amount of FHLB stock held by the Bank. At December 31, 2009, the
Bank had FHLB stock of $10,652 that would support $239,089 in borrowings from
the FHLB. The Bank presently has collateral pledged to the FHLB in
the form of commercial real estate loans, first and second lien single family
residential loans, multi-family loans, and securities that had a discounted
collateral value of approximately $240,057 for this line. The
$110,756 borrowing line with the Federal Reserve Bank of San Francisco is also
secured through the pledging of commercial and commercial real estate loans
under the Bank’s Borrower-In-Custody program. At December 31, 2009,
the Bank had $130,000 in borrowings outstanding from the FHLB, $10,000
outstanding on its overnight correspondent bank lines, and $53,025 outstanding
with the Federal Reserve Bank of San Francisco.
INFLATION
Substantially
all of the assets and liabilities of the Company are
monetary. Therefore, inflation has a less significant impact on the
Company than does fluctuation in market interest rates. Inflation can
lead to accelerated growth in noninterest expenses, which impacts net
earnings. During the last two years, inflation, as measured by the
Consumer Price Index, has not changed significantly. The effects of
this inflation have not had a material impact on the Company.
ITEM
6A Quantitative and Qualitative
Disclosures about Market Risk
The
Company’s results of operations are largely dependent upon its ability to manage
market risks. Changes in interest rates can have a significant effect
on the Company’s financial condition and results of operations. Although
permitted by its funds management policy, the Company does not presently use
derivatives such as forward and futures contracts, options, or interest rate
swaps to manage interest rate risk. Other types of market risk such
as foreign currency exchange rate risk and commodity price risk do not arise in
the normal course of the Company’s business activities.
Interest
rate risk generally arises when the maturity or repricing structure of the
Company’s assets and liabilities differ significantly. Asset and
liability management, which among other things addresses such risk, is the
process of developing, testing and implementing strategies that seek to maximize
net interest income while maintaining sufficient liquidity. This
process includes monitoring contractual maturity and prepayment expectations
together with expected repricing of assets and liabilities under different
interest rate scenarios. Generally, the Company seeks a structure
that insulates net interest income from large deviations attributable to changes
in market rates.
Interest
rate risk is managed through the monitoring of the Company’s balance sheet by
subjecting various asset and liability categories to interest rate shocks and
gradual interest rate movements over a one-year period of
time. Interest rate shocks use an instantaneous adjustment in market
rates of large magnitudes on a static balance sheet to determine the effect such
a change in interest rates would have on the Company’s net interest income and
capital for the succeeding twelve-month period. Such an extreme
change in interest rates and the assumption that management would take no steps
to restructure the balance sheet does limit the usefulness of this type of
analysis. This type of analysis tends to provide a best-case or
worst-case scenario. In addition to the interest rate shock analysis,
the company also prepares a rolling four quarter forecast of the balance sheet
and income statement using a flat rate scenario i.e. rates unchanged and a
most-likely rate scenario where rates are projected to change based on
management’s analysis of expected economic conditions and interest rate
environment. This analysis takes into account growth in loans and
deposits and management strategies that could be employed to maximize the net
interest margin and net interest income.
The
Company utilizes in-house asset/liability modeling software, ProfitStar, to
determine the effect changes in interest rates have on net interest income.
Interest rate shock scenarios are modeled in a parallel shift of the yield curve
in 100 basis point increments (plus or minus) in the federal funds
rate. Although certain assets and liabilities may have similar
repricing characteristics, they may not react correspondingly to changes in
market interest rates. In the event of a change in interest rates,
prepayment of loans and early withdrawal of time deposits would likely deviate
from those previously assumed. Increases in market rates may also
affect the ability of certain borrowers to make scheduled principal
payments.
-42-
The model
attempts to account for such limitations by imposing weights on the differences
between repricing assets and repricing liabilities within each time
segment. These weights are based on the ratio between the amount of
rate change of each category of asset or liability, and the amount of change in
the federal funds rate. Certain non-maturing liabilities such as
checking accounts and money market deposit accounts are allocated among the
various repricing time segments to meet local competitive conditions and
management’s strategies.
During
the first six months of 2009, the model indicated that the Company was asset
sensitive and projected rising margins in a rising rate
environment. However during the last six months of 2009 and at
December 31, 2009, the in-house model showed the Company had become liability
sensitive, meaning that in a rising rate environment, the net interest margin
and net interest income would decline. The change in the Company’s
interest rate risk position was due to two factors: 1) active of floors on
approximately $280,000 of variable rate loans; and 2) a proportional change in
the Bank’s loan mix as a result of reducing its exposure to certain real estate
construction loans, which are typically prime-based variable rate
loans. This change in loan mix meant that a smaller percentage of
Bank assets would reprice upward if market rates increased, while a large
percentage of the Bank’s core deposit based in the form of money market, NOW
accounts, and savings accounts may be subject to immediate repricing if market
interest rates move up. Management took steps during the last six
months of 2009 to mitigate the interest rate risk in a rising rate scenario, by
extending the maturities of its liabilities through refinancing a portion of it
short-term borrowings into long-term FHLB advances and longer term national
CDs.
The
following table shows the estimated impact of interest rate changes plus 300
basis points and minus 300 basis points on net interest income in 100 basis
point increments. The base figure of $54,039 used in the analysis
represents the actual net interest income for the year 2009. Due to the various
assumptions used for this modeling and potential balance sheet strategies
management may implement to mitigate interest rate risk, no assurance can be
given that projections will reflect actual results.
Interest
Rate Shock Analysis
Net
Interest Income and Market Value Performance
($ in
thousands)
|
Projected
|
Net
Interest Income
|
|||
|
Interest
|
$
Estimated
|
$
Change
|
Change
|
|
|
Rate
Change
|
Value
|
From
Base
|
From
Base
|
|
|
+300
|
47,063
|
(6,976)
|
-12.91%
|
|
|
+200
|
47,938
|
(6,101)
|
-11.29%
|
|
|
+100
|
50,716
|
(3,323)
|
-6.15%
|
|
|
Base
|
54,039
|
0
|
0.00%
|
|
|
-100
|
54,958
|
919
|
1.70%
|
|
|
-200
|
54,805
|
766
|
1.40%
|
|
|
-300
|
54,698
|
659
|
1.22%
|
|
-43-
ITEM
7 Financial Statements and
Supplementary Data

Report
of Independent Registered Public Accounting Firm
To the
Board of Directors and Stockholders
Pacific
Continental Corporation and Subsidiaries
We have
audited the accompanying consolidated balance sheets of Pacific Continental
Corporation and Subsidiaries (Company) as of December 31, 2009 and 2008, and the
related consolidated statements of income, changes in stockholders’ equity,
comprehensive income and cash flows for each of the years in the three-year
period ended December 31, 2009. We also have audited the Company’s internal
control over financial reporting as of December 31, 2009, based on criteria
established in Internal Control - Integrated Framework issued by the Committee
of Sponsoring Organizations of the Treadway Commission (COSO). The Company’s
management is responsible for these financial statements, for maintaining
effective internal control over financial reporting, and for its assessment of
the effectiveness of internal control over financial reporting included in the
accompanying Report of Management on Internal Control over Financial Reporting.
Our responsibility is to express an opinion on these financial statements and an
opinion on the effectiveness of the Company's internal control over financial
reporting based on our audit.
We
conducted our audit in accordance with auditing standards of the Public Company
Accounting Oversight Board (United States). Those standards require that we plan
and perform the audits to obtain reasonable assurance about whether the
financial statements are free of material misstatement and whether effective
internal control over financial reporting was maintained in all material
respects. Our audit of the financial statements included examining, on a test
basis, evidence supporting the amounts and disclosures in the financial
statements, assessing the accounting principles used and significant estimates
made by management, and evaluating the overall financial statements
presentation. Our audit of internal control over financial reporting
included obtaining an understanding of internal control over financial
reporting, assessing the risk that a material weakness exists, and testing and
evaluating the design and operating effectiveness of internal control based on
the assessed risks. Our audits also included performing such other
procedures as we considered necessary in the circumstances. We believe that our
audits provide a reasonable basis for our opinions.
The
Company’s internal control over financial reporting is a process designed to
provide reasonable assurance regarding the reliability of financial reporting
and the preparation of financial statements for external purposes in accordance
with generally accepted accounting principles. The Company’s internal control
over financial reporting includes those policies and procedures that (1) pertain
to the maintenance of records that, in reasonable detail, accurately and fairly
reflect the transactions and dispositions of the assets of the Company; (2)
provide reasonable assurance that transactions are recorded as necessary to
permit preparation of financial statements in accordance with generally accepted
accounting principles, and that receipts and expenditures of the Company are
being made only in accordance with authorizations of management and Directors of
the Company; and (3) provide reasonable assurance regarding prevention or timely
detection of unauthorized acquisition, use, or disposition of the Company's
assets that could have a material effect on the financial
statements.
-44-
Report
of Independent Registered Public Accounting Firm
Page
Two
Because
of its inherent limitations, internal control over financial reporting may not
prevent or detect misstatements. Also, projections of any evaluation of
effectiveness to future periods are subject to the risk that controls may become
inadequate because of changes in conditions, or that the degree of compliance
with the policies or procedures may deteriorate.
In our
opinion, the consolidated financial statements referred to above present fairly,
in all material respects, the consolidated financial position of Pacific
Continental Corporation and Subsidiaries as of December 31, 2009 and 2008, and
the results of their operations and their cash flows for each of the years in
the three-year period ended December 31, 2009 in conformity with accounting
principles generally accepted in the United States of America. Also in our
opinion, Pacific Continental Corporation and Subsidiaries maintained, in all
material respects, effective internal control over financial reporting as of
December 31, 2009 based on criteria established in Internal Control - Integrated
Framework issued by the Committee of Sponsoring Organizations of the Treadway
Commission (COSO).

Portland,
Oregon
March 15,
2010
-45-
Pacific
Continental Corporation and Subsidiaries
Consolidated
Balance Sheets
(Dollars
in thousands)
|
December
31,
|
December
31,
|
|||||||
|
2009
|
2008
|
|||||||
|
ASSETS
|
||||||||
|
Cash
and due from banks
|
$ | 16,698 | $ | 20,172 | ||||
|
Interest-bearing
deposits with banks
|
272 | 283 | ||||||
|
Total
cash and cash equivalents
|
16,970 | 20,455 | ||||||
|
Securities
available-for-sale
|
167,618 | 54,933 | ||||||
|
Loans
held for sale
|
745 | 410 | ||||||
|
Loans,
less allowance for loan losses and net deferred fees
|
930,997 | 945,377 | ||||||
|
Interest
receivable
|
4,408 | 4,021 | ||||||
|
Federal
Home Loan Bank stock
|
10,652 | 10,652 | ||||||
|
Property
and equipment, net of accumulated depreciation
|
20,228 | 20,763 | ||||||
|
Goodwill
and other intangible assets
|
22,681 | 22,904 | ||||||
|
Deferred
tax asset
|
7,177 | 5,043 | ||||||
|
Taxes
receivable
|
5,299 | 273 | ||||||
|
Other
real estate owned
|
4,224 | 3,806 | ||||||
|
Prepaid
FDIC assessment
|
6,242 | - | ||||||
|
Other
assets
|
1,872 | 2,206 | ||||||
|
Total
assets
|
$ | 1,199,113 | $ | 1,090,843 | ||||
|
LIABILITIES
AND SHAREHOLDERS' EQUITY
|
||||||||
|
Deposits
|
||||||||
|
Noninterest-bearing
demand
|
$ | 202,088 | $ | 178,957 | ||||
|
Savings
and interest-bearing checking
|
475,869 | 392,935 | ||||||
|
Time
$100,000 and over
|
68,031 | 67,095 | ||||||
|
Other
time
|
81,930 | 83,450 | ||||||
|
Total
deposits
|
827,918 | 722,437 | ||||||
|
Federal
Funds and Overnight Funds Purchased
|
63,025 | 44,000 | ||||||
|
Federal
Home Loan Bank borrowings
|
130,000 | 194,500 | ||||||
|
Junior
subordinated debentures
|
8,248 | 8,248 | ||||||
|
Accrued
interest and other payables
|
4,260 | 5,493 | ||||||
|
Total
liabilities
|
1,033,451 | 974,678 | ||||||
|
Commitments
and contingencies (Notes 5 and 15)
|
||||||||
|
Shareholders'
equity
|
||||||||
|
Common
stock, 25,000,000 shares authorized
|
136,316 | 80,019 | ||||||
|
issued
& outstanding: 18,393,773 at December 31,
2009
|
||||||||
|
and
12,079,691 at December 31, 2008
|
||||||||
|
Retained
earnings
|
29,613 | 37,764 | ||||||
|
Accumulated
other comprehensive loss
|
(267 | ) | (1,618 | ) | ||||
| 165,662 | 116,165 | |||||||
|
Total
liabilities and shareholders’ equity
|
$ | 1,199,113 | $ | 1,090,843 | ||||
|
See
accompanying notes.
|
||||||||
-46-
Pacific Continental Corporation and Subsidiaries
Consolidated
Statements of Operation
(Dollars in
thousands, except per share amount)
|
Year
Ended December 31,
|
||||||||||||
|
2009
|
2008
|
2007
|
||||||||||
|
Interest
and dividend income
|
||||||||||||
|
Loans
|
$ | 61,977 | $ | 63,047 | $ | 67,122 | ||||||
|
Securities
|
4,893 | 2,787 | 1,973 | |||||||||
|
Dividends
on Federal Home Loan Bank stock
|
- | 91 | 21 | |||||||||
|
Federal
funds sold & interest-bearing deposits with banks
|
5 | 20 | 50 | |||||||||
| 66,875 | 65,945 | 69,166 | ||||||||||
|
Interest
expense
|
||||||||||||
|
Deposits
|
9,553 | 10,142 | 18,572 | |||||||||
|
Federal
Home Loan Bank & Federal Reserve borrowings
|
2,691 | 5,456 | 6,160 | |||||||||
|
Junior
subordinated debentures
|
508 | 498 | 508 | |||||||||
|
Federal
funds purchased
|
84 | 578 | 500 | |||||||||
| 12,836 | 16,674 | 25,740 | ||||||||||
|
Net
interest income
|
54,039 | 49,271 | 43,426 | |||||||||
|
Provision
for loan losses
|
36,000 | 3,600 | 725 | |||||||||
|
Net
interest income after provision for loan losses
|
18,039 | 45,671 | 42,701 | |||||||||
|
Noninterest
income
|
||||||||||||
|
Service
charges on deposit accounts
|
1,872 | 1,676 | 1,409 | |||||||||
|
Other
fee income, principally bankcard
|
1,755 | 1,823 | 1,630 | |||||||||
|
Loan
servicing fees
|
72 | 85 | 99 | |||||||||
|
Mortgage
banking income
|
463 | 355 | 370 | |||||||||
|
Other
noninterest income
|
243 | 330 | 417 | |||||||||
| 4,405 | 4,269 | 3,925 | ||||||||||
|
Noninterest
expense
|
||||||||||||
|
Salaries
and employee benefits
|
16,991 | 18,089 | 15,667 | |||||||||
|
Premises
and equipment
|
4,100 | 3,990 | 3,281 | |||||||||
|
Bankcard
processing
|
506 | 546 | 524 | |||||||||
|
Business
development
|
1,455 | 1,447 | 1,487 | |||||||||
|
FDIC
insurance assessment
|
1,927 | 453 | 222 | |||||||||
|
Other
real estate expense
|
820 | 122 | (2 | ) | ||||||||
|
Other
noninterest expense
|
5,363 | 4,915 | 4,682 | |||||||||
| 31,162 | 29,562 | 25,861 | ||||||||||
|
Income
(loss) before income tax (benefit) provision
|
(8,718 | ) | 20,378 | 20,765 | ||||||||
|
Income
tax (benefit) provision
|
(3,839 | ) | 7,439 | 7,830 | ||||||||
|
Net
income (loss)
|
$ | (4,879 | ) | $ | 12,939 | $ | 12,935 | |||||
|
Earnings
(loss) per share
|
||||||||||||
|
Basic
|
$ | (0.35 | ) | $ | 1.08 | $ | 1.09 | |||||
|
Diluted
|
$ | (0.35 | ) | $ | 1.08 | $ | 1.08 | |||||
|
See
accompanying notes.
|
||||||||||||
-47-
Pacific
Continental Corporation and Subsidiaries
Consolidated
Statements of Changes in Shareholders’ Equity
For
the Years Ended December 31, 2009, 2008, and 2007
(Dollars
in thousands)
|
Accumulated
|
||||||||||||||||||||
|
Other
|
||||||||||||||||||||
|
Number
|
Common
|
Retained
|
Comprehensive
|
|||||||||||||||||
|
of
Shares
|
Stock
|
Earnings
|
Loss
|
Total
|
||||||||||||||||
|
Balance,
January 1, 2007
|
10,647 | $ | 58,255 | $ | 37,725 | $ | (245 | ) | $ | 95,735 | ||||||||||
|
Net
income
|
12,935 | 12,935 | ||||||||||||||||||
|
Other
comprehensive income:
|
||||||||||||||||||||
|
Unrealized
gains on securities
|
362 | |||||||||||||||||||
|
Deferred
income taxes
|
(139 | ) | ||||||||||||||||||
|
Other
comprehensive income
|
223 | 223 | ||||||||||||||||||
|
Comprehensive
income
|
13,158 | |||||||||||||||||||
|
Stock
options exercised and related tax benefit
|
213 | 2,240 | 2,240 | |||||||||||||||||
|
Stock
dividend - 10%
|
1,075 | 16,863 | (16,863 | ) | ||||||||||||||||
|
Share-based
payments
|
551 | 551 | ||||||||||||||||||
|
Cash
dividends
|
(4,175 | ) | (4,175 | ) | ||||||||||||||||
|
Balance,
December 31, 2007
|
11,935 | 77,909 | 29,622 | (22 | ) | 107,509 | ||||||||||||||
|
Net
income
|
12,939 | 12,939 | ||||||||||||||||||
|
Other
comprehensive loss:
|
||||||||||||||||||||
|
Unrealized
losses on securities
|
(2,555 | ) | ||||||||||||||||||
|
Deferred
income taxes
|
959 | |||||||||||||||||||
|
Other
comprehensive loss
|
(1,596 | ) | (1,596 | ) | ||||||||||||||||
|
Comprehensive
income
|
11,343 | |||||||||||||||||||
|
Stock
options exercised and related tax benefit
|
145 | 1,521 | 1,521 | |||||||||||||||||
|
Share-based
payments
|
589 | 589 | ||||||||||||||||||
|
Cash
dividends
|
(4,797 | ) | (4,797 | ) | ||||||||||||||||
|
Balance,
December 31, 2008
|
12,080 | 80,019 | 37,764 | (1,618 | ) | 116,165 | ||||||||||||||
|
Net
loss
|
(4,879 | ) | (4,879 | ) | ||||||||||||||||
|
Other
comprehensive income:
|
||||||||||||||||||||
|
Unrealized
gain on securities
|
2,158 | |||||||||||||||||||
|
Deferred
income taxes
|
(807 | ) | ||||||||||||||||||
|
Other
comprehensive income
|
1,351 | 1,351 | ||||||||||||||||||
|
Comprehensive
loss
|
(3,528 | ) | ||||||||||||||||||
|
Stock
issuance
|
6,270 | 55,293 | 55,293 | |||||||||||||||||
|
Stock
options exercised and related tax benefit
|
44 | 440 | 440 | |||||||||||||||||
|
Share-based
payments
|
564 | 564 | ||||||||||||||||||
|
Cash
dividends
|
(3,272 | ) | (3,272 | ) | ||||||||||||||||
|
Balance,
December 31, 2009
|
18,394 | $ | 136,316 | $ | 29,613 | $ | (267 | ) | $ | 165,662 | ||||||||||
|
See
accompanying notes.
|
||||||||||||||||||||
-48-
Pacific Continental Corporation and Subsidiaries
Consolidated
Statements of Cash Flows
(Dollars in
thousands)
|
Years
Ended December 31,
|
||||||||||||
|
2009
|
2008
|
2007
|
||||||||||
|
Cash
flows from operating activities:
|
||||||||||||
|
Net
income
|
$ | (4,879 | ) | $ | 12,939 | $ | 12,935 | |||||
|
Adjustments
to reconcile net income to net cash
|
||||||||||||
|
from
operating activities:
|
||||||||||||
|
Depreciation
and amortization, net of accretion
|
1,535 | 1,396 | 1,399 | |||||||||
|
Loss
on sale or write-down of property and equipment
|
- | (25 | ) | - | ||||||||
|
Provision
for loan losses
|
36,000 | 3,600 | 725 | |||||||||
|
Losses
on foreclosed assets
|
550 | 119 | - | |||||||||
|
Deferred
income taxes
|
(2,054 | ) | (1,633 | ) | (334 | ) | ||||||
|
Share-based
compensation
|
564 | 626 | 577 | |||||||||
|
Excess
tax benefit of stock options exercised
|
(38 | ) | (59 | ) | (201 | ) | ||||||
|
Production
of mortgage loans held-for-sale
|
(20,043 | ) | (13,103 | ) | (11,235 | ) | ||||||
|
Proceeds
from the sale of mortgage loans held-for-sale
|
19,708 | 12,693 | 13,375 | |||||||||
|
Change
in:
|
||||||||||||
|
Interest
receivable
|
(386 | ) | (369 | ) | 346 | |||||||
|
Deferred
loan fees
|
(342 | ) | (270 | ) | (450 | ) | ||||||
|
Accrued
interest payable and other liabilities
|
(1,571 | ) | 637 | 214 | ||||||||
|
Income
taxes payable (receivable)
|
(5,026 | ) | (1,258 | ) | 451 | |||||||
|
Other
assets
|
(4,597 | ) | 3,139 | (801 | ) | |||||||
|
Net
cash provided by operating activities
|
19,421 | 18,432 | 17,001 | |||||||||
|
Cash
flow from investing activities:
|
||||||||||||
|
Proceeds
from maturities of available for sale investment
securities
|
28,227 | 18,618 | 10,868 | |||||||||
|
Purchase
of available for sale investment securities
|
(138,704 | ) | (21,923 | ) | (25,584 | ) | ||||||
|
Loans
made net of principal collections received
|
(26,877 | ) | (130,457 | ) | (92,445 | ) | ||||||
|
Proceeds
from sales of loans
|
- | - | 37,809 | |||||||||
|
Purchase
of loans
|
(211 | ) | (12,120 | ) | (118 | ) | ||||||
|
Cash
paid for acquisitions
|
(60 | ) | (3 | ) | (15 | ) | ||||||
|
Purchase
of property and equipment
|
(880 | ) | (1,314 | ) | (3,670 | ) | ||||||
|
Proceeds
on sale of foreclosed assets
|
4,905 | 2,642 | - | |||||||||
|
Purchase
of energy tax credits
|
(1,772 | ) | (1,000 | ) | - | |||||||
|
Purchase
of Federal Home Loan Bank stock
|
- | (6,857 | ) | (315 | ) | |||||||
|
Net
cash used by investing activities
|
(135,372 | ) | (152,414 | ) | (73,470 | ) | ||||||
|
Cash
flow from financing activities:
|
||||||||||||
|
Increase
in deposits
|
105,480 | 78,014 | 3,152 | |||||||||
|
Increase
(decrease) in federal funds purchased and FHLB
|
||||||||||||
|
short-term
borrowings
|
(5,975 | ) | 52,640 | (1,050 | ) | |||||||
|
Proceeds
from FHLB term advances originated
|
1,489,500 | 1,744,500 | 689,500 | |||||||||
|
FHLB
advances paid-off
|
(1,529,000 | ) | (1,743,500 | ) | (639,804 | ) | ||||||
|
Proceeds
from stock options exercised
|
402 | 1,445 | 1,943 | |||||||||
|
Income
tax benefit for stock options exercised
|
38 | 59 | 201 | |||||||||
|
Proceeds
from stock issuance
|
55,293 | - | - | |||||||||
|
Dividends
paid
|
(3,272 | ) | (4,797 | ) | (4,175 | ) | ||||||
|
Net
cash provided by financing activities
|
112,466 | 128,361 | 49,767 | |||||||||
|
Net
decrease in cash and cash equivalents
|
(3,485 | ) | (5,621 | ) | (6,702 | ) | ||||||
|
Cash
and cash equivalents, beginning of year
|
20,455 | 26,076 | 32,778 | |||||||||
|
Cash
and cash equivalents, end of year
|
$ | 16,970 | $ | 20,455 | $ | 26,076 | ||||||
|
Supplemental
information:
|
||||||||||||
|
Noncash
investing and financing activities:
|
||||||||||||
|
Transfers
of loans to foreclosed assets
|
$ | 5,213 | $ | 6,706 | $ | 423 | ||||||
|
Change
in unrealized gain (loss) on securities, net of
|
||||||||||||
|
deferred
income taxes
|
1,351 | (1,596 | ) | 223 | ||||||||
|
Cash
paid during the year for:
|
||||||||||||
|
Income
taxes
|
$ | 3,050 | 7,822 | 7,349 | ||||||||
|
Interest
|
$ | 12,739 | 16,526 | 25,959 | ||||||||
| See accompanying notes. |
|
|||||||||||
-49-
Pacific Continental Corporation and Subsidiaries
Notes
to Consolidated Financial Statements
In
preparing these financial statements, the Company has evaluated events and
transactions for potential recognition or disclosure through March 12, 2010, the
date the financial statements were issued. All numbers in the
following notes are expressed in thousands, except per share data.
1. Summary of Significant Accounting
Policies:
Principles of Consolidation –
The consolidated financial statements include the accounts of Pacific
Continental Corporation (the “Company”), a bank holding company, and its
wholly-owned subsidiary, Pacific Continental Bank (the “Bank”) and the Bank’s
wholly-owned subsidiaries, PCB Service Corporation (which owns and operates
bank-related real estate but is currently inactive) and PCB Loan Services
Corporation (which owns and operates certain repossessed or foreclosed
collateral but is currently inactive). The Bank provides commercial
banking, financing, mortgage lending and other services through fourteen offices
located in Western Oregon and Western Washington. All significant
intercompany accounts and transactions have been eliminated in
consolidation.
In
November 2005, the Company formed a wholly-owned Delaware statutory business
trust subsidiary, Pacific Continental Corporation Capital Trust (the “Trust”),
which issued $8,248 of guaranteed undivided beneficial interests in the Pacific
Continental’s Junior Subordinated Deferrable Interest Debentures (“Trust
Preferred Securities”). Pacific Continental has not consolidated the
accounts of the Trust in its consolidated financial statements in accordance
with generally accepted accounting principals. As a result, the
junior subordinated debentures issued by Pacific Continental to the issuer
trust, totaling $8,248 are reflected on Pacific Continental’s consolidated
balance sheet at December 31, 2009, under the caption, “Junior Subordinated
Debentures”. Pacific Continental also recognized its $248 investment
in the Trust, which is recorded among “Other Assets” in its consolidated balance
sheet at December 31, 2009.
Use of Estimates – The
preparation of financial statements in conformity with generally accepted
accounting principles requires management to make estimates and assumptions that
affect the reported amounts of assets and liabilities and disclosure of
contingent assets and liabilities at the date of the financial statements, and
the reported amounts of revenues and expenses during the reporting
period. Actual results could differ from those
estimates. The most significant estimations made by management
involve fair value calculations pertaining to financial assets and liabilities,
the calculation of the allowance for loan losses, and the impairment calculation
for goodwill.
Cash and Cash Equivalents –
For purposes of reporting cash flows, cash and cash equivalents include cash on
hand, amounts due from or deposited with banks, interest-bearing balances due
from banks, and federal funds sold. Generally, federal funds are sold
for one-day periods.
The Bank
is required to maintain certain reserves with the Federal Reserve Bank as
defined by regulation. Such reserves totaling $2,991 and $1,196 were
maintained within the Bank’s cash balances at December 31, 2009 and 2008,
respectively.
Securities Available-for-Sale
– Securities available-for-sale are held for indefinite periods of time and may
be sold in response to movements in market interest rates, changes in the
maturity or mix of Bank assets and liabilities or demand for
liquidity. Although management determines the appropriate
classification of securities at the time of purchase, the Bank classified all
securities as available-for-sale throughout 2009 and 2008. Securities
classified as available-for-sale are reported at estimated fair
value. The difference between estimated fair value and amortized cost
is recorded as a separate component of shareholders’ equity (accumulated other
comprehensive income or loss). Fair values for these investment
securities are based on available market prices. Gains and losses on
the sale of available-for-sale securities are determined using the
specific-identification method. Interest income on securities
available-for-sale is included in income using the level yield
method.
Declines
in fair value of individual available-for-sale securities below their cost that
are other than temporary would result in write-downs of the individual
securities to their fair value. The related write-downs would be
included in earnings as realized losses. Management believes that all
unrealized losses on investment securities at December 31, 2009 and 2008 are
temporary.
-50-
Loans Held for Sale and Mortgage
Banking Activities – The Bank originates residential mortgage loans for
resale in the secondary market. Sales are without recourse and the
Bank generally does not retain mortgage servicing rights. Loans held
for sale are carried at the lower of cost or market. Market value is
determined on an aggregate loan basis.
Loans and Income Recognition –
Loans are stated at the amount of unpaid principal plus loan premiums for
purchased loans, reduced by net deferred loan origination fees, discounts
associated with retained portions of loans sold, and an allowance for loan
losses. Interest on loans is calculated using the simple-interest
method on daily balances of the principal amount outstanding. Accrual
of interest is discontinued on contractually delinquent loans when management
believes, after considering economic and business conditions and collection
efforts that the borrower’s financial condition is such that collection of the
interest is doubtful. Interest income is subsequently recognized only
to the extent cash payments are received or the principal balance of the loan is
brought current. Loan origination fees, net of origination costs and
discounts, are amortized over the lives of the loans as adjustments to
yield.
Allowance for Loan Losses –
The allowance for loan losses is established through a provision for loan losses
charged to expense. Loans are charged against the allowance for loan
losses when management believes that the collectibility of principal is
unlikely. The allowance is an amount that management considers
adequate to absorb possible losses on existing loans that may become
uncollectible based on evaluations of the collectibility of loans and prior loss
experience. The evaluations take into consideration such factors as
changes in the nature of the loan portfolio, overall portfolio quality, review
of specific loans, estimated value of underlying collateral, and current
economic conditions that may affect the borrower’s ability to
pay. This evaluation is inherently subjective as it requires
estimates that are susceptible to significant subsequent revision as more
information becomes available.
A loan is
considered impaired when management believes that it is probable that all
amounts will not be collected according to the contractual terms. An
impaired loan is valued using the present value of expected cash flows
discounted at the loan’s effective interest rate, the observable market price of
the loan or the estimated fair value of the loan’s collateral or related
guaranty. Loans deemed impaired are specifically allocated for in the
allowance for loan losses if the value of the impaired loan is less than the
recorded investment in the loan.
Federal Home Loan Bank Stock –
The investment in Federal Home Loan Bank (“FHLB”) stock is carried at par value,
which approximates its fair value. As a member of the FHLB system,
the Bank is required to maintain a minimum level of investment in FHLB stock
based on specific percentages of its outstanding mortgages, total assets or FHLB
advances. As of December 31, 2009, the minimum required investment
was approximately $5,743. The Bank may request redemption at par
value of any stock in excess of the amount the Bank is required to
hold. Stock redemptions are at the discretion of the
FHLB.
FHLB
stock is generally viewed as long-term investment. Accordingly, when
evaluating FHLB stock for impairment, its value is determined based on the
ultimate recoverability of the par value rather than by recognizing temporary
declines in value. The determination of whether the decline affects
the ultimate recoverability is influenced by criteria such as the
following:
|
|
•
|
The
significance of the decline in net assets of the FHLBs as compared to the
capital stock amount for the FHLBs and the length of time this situation
has persisted;
|
|
|
•
|
Commitments
by the FHLBs to make payments required by low or regulation and the level
of such payments in relation to the operating performance of the
FHLBs;
|
|
|
•
|
The
impact of legislative and regulatory changes on the institution and,
accordingly, on the customer base of the FHLBs;
and
|
|
|
•
|
The
liquidity position of the FHLBs.
|
Foreclosed Assets – Assets
acquired through foreclosure, or deeds in lieu of foreclosure, are initially
recorded at fair value, less the estimated cost of disposal, at the date of
foreclosure. Any excess of the loan’s balance over the fair value of
the foreclosed collateral is charged to the allowance for loan
losses.
-51-
Improvements
to foreclosed assets are capitalized. Subsequent to foreclosure,
management performs periodic valuations and the assets’ carrying value may be
adjusted to the lower of carrying amount or fair value, less costs to
sell. Write downs to net realizable value, if any or any disposition
gains or losses are included in noninterest income or expense.
Property, Plant and Equipment
– Property is stated at cost, net of accumulated depreciation and
amortization. Additions, betterments and replacements of major units
are capitalized. Expenditures for normal maintenance, repairs and
replacements of minor units are charged to expense as incurred. Gains
or losses realized from sales or retirements are reflected in operations
currently.
Depreciation
and amortization is computed by the straight-line method over the estimated
useful lives of the assets. Estimated useful lives are 30 to 40 years
for buildings, 3 to 10 years for furniture and equipment, and up to the lesser
of the useful life or lease term for leasehold improvements.
Goodwill and Other Intangible Assets–
Goodwill represents the excess of cost over the fair value of net assets
acquired in business combinations. In accordance with generally
accepted accounting principles, the Bank does not amortize the balance of
goodwill, but completes periodic assessments of goodwill for
impairment. Goodwill impairment is deemed to exist if the net book
value of a reporting unit giving rise to the recognition of goodwill exceeds
estimated fair value. The Bank’s assessments have not identified
impairment of goodwill since the estimated fair value of the reporting unit
exceed its net book value as of December 31, 2009 and 2008.
Advertising – Advertising
costs are charged to expense during the year in which they are
incurred. Advertising expenses were $817, $756 and $883 for the years
ended December 31, 2009, 2008 and 2007, respectively.
Income Taxes – Income taxes
are accounted for using the asset and liability method. Deferred tax
assets and liabilities are recognized for the expected future tax consequences
attributable to differences between financial statement carrying amounts of
existing assets and liabilities and their respective tax
bases. Deferred tax assets and liabilities are calculated using tax
rates in effect for the year in which the differences are expected to
reverse. Valuation allowances are established to reduce the net
carrying amount of deferred tax assets if it is determined to be more likely
than not, that all or some of the potential deferred tax asset will not be
realized.
Earnings Per Share – Basic
earnings per share are computed by dividing net income by the weighted average
number of shares outstanding during the period. Diluted earnings per
share include the effect of common stock equivalents that would arise from the
exercise of stock options discussed in Note 13. Weighted shares
outstanding are adjusted retroactively for the effect of stock
dividends.
Weighted
average shares outstanding at December 31 are as follows:
|
2009
|
2008
|
2007
|
||||||||||
|
Basic
|
13,961,310 | 11,980,211 | 11,830,369 | |||||||||
|
Common
stock equivalents attributable to
stock-based compensation plans
|
0 | 48,102 | 110,816 | |||||||||
|
Diluted
|
13,961,310 | 12,028,313 | 11,941,185 | |||||||||
Share-Based Payment Plans –
Financial accounting standards require companies to measure and recognize
compensation expense for all share-based payments at the grant date based on the
fair value of the award, as defined in the Financial Accounting Standards
Boards’ (FASB) ASC 718, “Stock Compensation”, and include such costs as an
expense in our income statements over the requisite service (vesting)
period. The Company adopted ASC 718 using the modified prospective
application, whereby the provisions of the statement have been applied
prospectively only from the date of adoption for new (issued subsequent to
December 31, 2005) and unvested stock option awards for which the requisite
service is rendered after the date of adoption. Thus, the Company
recognizes as expense the fair value of stock options issued prior to January 1,
2006, but vesting after January 1, 2006, over the remaining vesting
period. In addition, compensation expense must be recognized for any
awards
-52-
modified,
repurchased, or cancelled after the date of adoption. The Company
uses the Black-Scholes option pricing model to measure fair value.
Fair Value Measurements –
Generally accepted accounting principles define fair value as the price that
would be received to sell an asset or paid to transfer a liability in an orderly
transaction between market participants at the measurement date. FASB ASC 820,
“Fair Value Measurements” establishes a three-level hierarchy for disclosure of
assets and liabilities recorded at fair value. The classification of assets and
liabilities within the hierarchy is based on whether the inputs to the valuation
methodology used for measurement are observable or unobservable. Observable
inputs reflect market-derived or market-based information obtained from
independent sources, while unobservable inputs reflect our estimates about
market data. In general, fair values determined by Level 1 inputs utilize quoted
prices for identical assets or liabilities traded in active markets that the
Company has the ability to access. Fair values determined by Level 2 inputs
utilize inputs other than quoted prices included in Level 1 that are observable
for the asset or liability, either directly or indirectly. Level 2 inputs
include quoted prices for similar assets and liabilities in active markets, and
inputs other than quoted prices that are observable for the asset or liability,
such as interest rates and yield curves that are observable at commonly quoted
intervals. Level 3 inputs are unobservable inputs for the asset or liability,
and include situations where there is little, if any, market activity for the
asset or liability. In certain cases, the inputs used to measure fair value may
fall into different levels of the fair value hierarchy. In
such cases, the level in the fair value hierarchy within which the fair
value measurement in its entirety falls has been determined based on the lowest
level input that is significant to the fair value measurement in its
entirety. The Company’s assessment of the significance of a particular
input to the fair value measurement in its entirety requires judgment, and
considers factors specific to the asset or liability.
Recently Issued Accounting
Pronouncements – In December 2007, the FASB issued FASB ASC 805,
“Business Combinations.” FASB ASC 805 establishes principles and
requirements for how an acquirer recognizes and measures in its financial
statements the identifiable assets acquired, the liabilities assumed, any
noncontrolling interest in the acquired entity and the goodwill acquired.
Furthermore, acquisition-related and other costs will now be expensed rather
than treated as cost components of the acquisition. FASB ASC 805 also
establishes disclosure requirements to enable the evaluation of the nature and
financial effects of the business combination. This statement applies
prospectively to business combinations for which the acquisition date is on or
after January 1, 2009. The adoption of this guidance did not have a
material impact on our consolidated financial statements as related to business
combinations consummated prior to January 1, 2009. We expect the adoption
of this guidance will increase the costs charged to operations for acquisitions
consummated on or after January 1, 2009.
In
December 2007, the FASB issued FASB ASC 810, “Consolidations”, specifically,
“Noncontrolling Interest in Consolidated Financial Statements.” FASB ASC 810
establishes accounting and reporting standards for the noncontrolling interest
in a subsidiary and for the deconsolidation of a subsidiary. The standard also
requires additional disclosures that clearly identify and distinguish between
the interest of the parent’s owners and the interest of the noncontrolling
owners of the subsidiary. This statement became effective on January 1,
2009, for the Company, to be applied prospectively. The adoption of this
guidance did not have a material impact on the Company’s consolidated financial
statements.
In June
2008, FASB issued FASB ASC 260, “Determining Whether Instruments Granted in
Share-Based Payment Transactions Are Participating Securities.” FASB ASC 260
concludes that nonvested share-based payment awards that contain nonforfeitable
rights to dividends or dividend equivalents are participating securities and
shall be included in the computation of EPS pursuant to the two-class method.
This statement is effective for fiscal years beginning after December 15,
2008, to be applied retrospectively. The Company had no restricted
stock that qualifies as participating securities as described under this
pronouncement. The impact of adoption of this guidance did not have a
material impact on the Company’s consolidated financial statements.
On
January 12, 2009, FASB issued FASB ASC 325, “Amendments to the Impairment
Guidance of EITF Issue No. 99-20.” FASB ASC 325 addresses certain practice
issues in preceding guidance by making its other-than-temporary impairment
assessment guidance consistent with FASB ASC 320, “Accounting for Certain
Investments in Debt and Equity Securities.” This guidance removes the reference
to the consideration of a market participant’s estimates of cash flows, and
instead requires an assessment of whether it is probable, based on current
information and events, that the holder of the security will be unable to
collect all amounts due according to the contractual terms. If it is probable
that there has been an adverse change in estimated cash flows, an
other-than-temporary impairment is
-53-
deemed to
exist, and a corresponding loss shall be recognized in earnings equal to the
entire difference between the investment’s carrying value and its fair value at
the balance sheet date of the reporting period for which the assessment is made.
This guidance is effective for interim and annual reporting periods ending after
December 15, 2008, and is applied prospectively. The impact of adoption did
not have a material impact on the Company’s consolidated financial
statements.
On April
1, 2009, the FASB issued FASB ASC 805-20, “Accounting for Assets Acquired and
Liabilities Assumed in a Business Combination That Arise from Contingencies.”
FASB ASC 805 amends and clarifies previous pronouncements to address application
issues raised by preparers, auditors, and members of the legal profession on
initial recognition and measurement, subsequent measurement and accounting, and
disclosure of assets and liabilities arising from contingencies in a business
combination. This guidance is effective for assets or liabilities arising
from contingencies in business combinations for which the acquisition date is on
or after the beginning of the second annual reporting period beginning on or
after December 15, 2008. The impact of adoption did not have a material
impact on the Company’s consolidated financial statements.
On April
9, 2009, the FASB issued FASB ASC 820, “Determining Fair Value When the Volume
and Level of Activity for the Asset or Liability Have Significantly Decreased
and Identifying Transactions That Are Not Orderly.” FASB ASC 820 clarifies the
application of previous guidance when the volume and level of activity for the
asset or liability has significantly decreased and guidance on identifying
circumstances when a transaction may not be considered orderly. This guidance is
effective for interim and annual reporting periods ending after June 15, 2009.
The impact of adoption did not have a material impact on the Company’s
consolidated financial statements
On April
9, 2009, the FASB issued FASB ASC 320, “Recognition and Presentation of
Other-Than-Temporary Impairments.” FASB ASC 320 clarifies the interaction of the
factors that should be considered when determining whether a debt security is
other-than-temporarily impaired. For debt securities, management must
assess whether (a) it has the intent to sell the security and (b) it is more
likely than not that it will be required to sell the security prior to its
anticipated recovery. These steps are done before assessing whether the entity
will recover the cost basis of the investment. Previously, this assessment
required management to assert it has both the intent and the ability to hold a
security for a period of time sufficient to allow for an anticipated recovery in
fair value to avoid recognizing an other-than-temporary impairment. This change
does not affect the need to forecast recovery of the value of the security
through either cash flows or market price. In instances when a determination is
made that an other-than-temporary impairment exists but the investor does not
intend to sell the debt security and it is not more likely than not that it will
be required to sell the debt security prior to its anticipated recovery, this
guidance changes the presentation and amount of the other-than-temporary
impairment recognized in the income statement. The other-than-temporary
impairment is separated into (a) the amount of the total other-than-temporary
impairment related to a decrease in cash flows expected to be collected from the
debt security (the credit loss) and (b) the amount of the total
other-than-temporary impairment related to all other factors. The amount of the
total other-than-temporary impairment related to the credit loss is recognized
in earnings. The amount of the total other-than-temporary impairment
related to all other factors is recognized in other comprehensive income.
This guidance is effective for interim and annual reporting periods ending after
June 15, 2009. The impact of adoption did not have a material impact on
the Company’s consolidated financial statements.
On April
9, 2009, the FASB issued FASB ASC 825, “Interim Disclosures about Fair Value of
Financial Instruments.” FASB ASC 825 amends previous guidance to require
disclosures about fair value of financial instruments for interim reporting
periods of publicly traded companies as well as in annual financial statements.
This guidance also requires those disclosures in summarized financial
information at interim reporting periods. This guidance is effective for
interim and annual reporting periods ending after June 15, 2009. The
impact of adoption did not have a material impact on the Company’s consolidated
financial statements, although additional interim disclosures have been provided
within the Company’s interim reports .
On May
28, 2009, the FASB issued FASB ASC 855, “Subsequent Events.” FASB ASC 855
establishes general standards of accounting for and disclosure of events that
occur after the balance sheet date but before financial statements are issued or
are available to be issued. This guidance sets forth the period after
the balance sheet date during which management of a reporting entity should
evaluate events or transactions that may occur for potential recognition or
disclosure in the financial statements, the circumstances under which an entity
should recognize events or
-54-
transactions
occurring after the balance sheet date in its financial statements, and the
disclosures that an entity should make about events or transactions that
occurred after the balance sheet date. This guidance is effective for
interim and annual reporting periods ending after June 15, 2009. The
impact of adoption did not have a material impact on the Company’s consolidated
financial statements, although additional disclosure is provided in the Notes to
Consolidated Financial Statements.
On June
12, 2009 the FASB issued FASB ASC 860, “Accounting for Transfers of Financial
Assets.” FASB ASC 860 is a revision to preceding guidance and will
require more information about transfers of financial assets, including
securitization transactions, and where entities have continuing exposure to the
risks related to transferred financial assets. It eliminates the
concept of a “qualifying special purpose entity,” changes the requirements for
derecognizing financial assets, and requires additional
disclosures. This statement is effective for interim and annual
reporting periods beginning January 1, 2010. The impact of adoption
is not expected to have a material impact on the Company’s consolidated
financial statements.
In August
2009, the FASB issued Accounting Standards Update No. 2009-04, “Accounting for
Redeemable Equity Instruments – Amendments to Section
480-10-99.” This Update amends Topic 480, “Distinguishing Liabilities
from Equity,” reflecting the SEC staff’s views regarding the application of
Accounting Series Release No. 268, “Presentation in Financial Statements of
Redeemable Preferred Stocks.” This guidance did not have a material
impact on the Company’s consolidated financial statements.
In August
2009, the FASB issued Accounting Standards Update No. 2009-05, “Fair Value
Measurements and Disclosures – Measuring Liabilities at Fair
Value.” This Update provides clarification for Topic 820 for
circumstances in which a quoted price in an active market for the identical
liability is not available. The guidance in this Update is effective
for the first reporting period, including interim periods, beginning after
August 27, 2009. This guidance did not have a material impact on the Company’s
consolidated financial statements.
In
December 2009, the FASB issued Accounting Standards Update No. 2009-16,
“Transfers and Servicing – Accounting for Transfers of Financial
Assets.” This Update formally codifies FASB Statement No. 166,
“Accounting for Transfers of Financial Assets” and provides a revision for Topic
860 to require more information about transfers of financial assets, including
securitization transactions, and where entities have continuing exposure to the
risks related to transferred financial assets. It eliminates the
concept of a “qualifying special-purpose entity,” changes the requirements for
derecognizing financial assets, and requires additional
disclosure. The guidance in this Update is effective for interim and
annual reporting periods beginning January 1, 2010. The impact of
adoption is not expected to have a material impact on the Company’s consolidated
financial statements.
In
December 2009, the FASB issued Accounting Standards Update No. 2009-17,
“Consolidations – Improvements to Financial Reporting by Enterprises Involved
with Variable Interest Entities” This Update formally codifies FASB
Statement No. 167, “Amendments to FASB Interpretation No. 46(R)” and provides a
revision for Topic 810 to change how a reporting entity determines when an
entity that is insufficiently capitalized or is not controlled through voting
(or similar rights) should be consolidated. The determination of
whether a reporting entity is required to consolidate another entity is based
on, among other things, the other entity’s purpose and design and the reporting
entity’s ability to direct the activities of the other entity that most
significantly impact the other entity’s economic performance. This
Update also requires a reporting entity to provide additional disclosures about
its involvement with variable interest entities and any significant changes in
risk exposure due to that involvement. The guidance in this Update is
effective for interim and annual reporting periods beginning January 1,
2010. The impact of adoption is not expected to have a material
impact on the Company’s consolidated financial statements.
Reclassifications – Certain
amounts contained in the 2008 and 2007 consolidated financial statements have
been reclassified where appropriate to conform to the financial statement
presentation used in 2009. These reclassifications had no effect on
previously reported net income (loss).
-55-
2. Securities
Available-for-Sale:
The
amortized cost and estimated fair values of securities available-for-sale at
December 31, 2009 are as follows:
|
Securities
in
|
Securities
in
|
|||||||||||||||||||||||
|
Continuous
|
Continuous
|
|||||||||||||||||||||||
|
Unrealized
|
Unrealized
|
|||||||||||||||||||||||
|
Loss
|
Loss
|
|||||||||||||||||||||||
|
Gross
|
Gross
|
Estimated
|
Position
for
|
Position
For
|
||||||||||||||||||||
|
Amortized
|
Unrealized
|
Unrealized
|
Fair
|
Less
Than
|
12
Months
|
|||||||||||||||||||
|
Cost
|
Gains
|
Losses
|
Value
|
12
Months
|
or
Longer
|
|||||||||||||||||||
|
Unrealized Loss Positions
|
||||||||||||||||||||||||
|
Obligations
of U.S.
|
||||||||||||||||||||||||
|
Government
agencies
|
$ | 5,047 | $ | - | $ | (47 | ) | $ | 5,000 | $ | 5,000 | $ | - | |||||||||||
|
Obligations
of states and
|
||||||||||||||||||||||||
|
political
subdivisions
|
- | - | - | - | - | - | ||||||||||||||||||
|
Mortgage-backed
securities
|
61,721 | - | (2,511 | ) | 59,210 | 53,048 | 6,162 | |||||||||||||||||
| $ | 66,768 | $ | - | $ | (2,558 | ) | $ | 64,210 | $ | 58,048 | $ | 6,162 | ||||||||||||
|
Unrealized Gain Positions
|
||||||||||||||||||||||||
|
Obligations
of U.S.
|
||||||||||||||||||||||||
|
Government
agencies
|
$ | - | $ | - | $ | - | $ | - | ||||||||||||||||
|
Obligations
of states and
|
||||||||||||||||||||||||
|
political
subdivisions
|
6,372 | 337 | - | 6,709 | ||||||||||||||||||||
|
Mortgage-backed
securities
|
94,910 | 1,789 | - | 96,699 | ||||||||||||||||||||
| $ | 101,282 | $ | 2,126 | $ | - | $ | 103,408 | |||||||||||||||||
At
December 31, 2009, there were 61 investment securities in unrealized loss
positions. The unrealized loss associated with the $6,162 in a
continuous unrealized loss position for twelve months or longer was $1,164 at
December 31, 2009. In the opinion of management, these securities are
considered only temporarily impaired due to changes in market interest rate or
the widening of market spreads subsequent to the initial purchase of the
securities, and not due to concerns regarding the underlying credit of the
issuers or the underlying collateral. The decline in value of these
securities has resulted from current economic conditions. The
projected average life of the securities portfolio is approximately three
years.
The
amortized cost and estimated fair values of securities available-for-sale at
December 31, 2009 are as follows:
|
Gross
|
Gross
|
Estimated
|
||||||||||||||
|
Amortized
|
Unrealized
|
Unrealized
|
Fair
|
|||||||||||||
|
Cost
|
Gains
|
Losses
|
Value
|
|||||||||||||
|
Obligations
of U.S. Government agencies
|
$ | 5,047 | $ | - | $ | (47 | ) | $ | 5,000 | |||||||
|
Obligations
of states and political subdivisions
|
6,372 | 337 | - | 6,709 | ||||||||||||
|
Mortgage-backed
securities
|
156,631 | 1,789 | (2,511 | ) | 155,909 | |||||||||||
| $ | 168,050 | $ | 2,126 | $ | (2,558 | ) | $ | 167,618 | ||||||||
-56-
The
amortized cost and estimated fair values of securities available-for-sale at
December 31, 2008 were as follows:
|
Amortized
|
Unrealized
|
Unrealized
|
Fair
|
|||||||||||||
|
Cost
|
Gains
|
Losses
|
Value
|
|||||||||||||
|
Obligations
of U.S. Government agencies
|
$ | 1,994 | $ | 35 | $ | - | $ | 2,029 | ||||||||
|
Obligations
of states and political subdivisions
|
7,429 | 83 | (27 | ) | 7,485 | |||||||||||
|
Mortgage-backed
securities
|
48,100 | 484 | (3,165 | ) | 45,419 | |||||||||||
| $ | 57,523 | $ | 602 | $ | (3,192 | ) | $ | 54,933 | ||||||||
The
amortized cost and estimated fair value of securities at December 31, 2009 and
2008 by maturity are shown below. Obligations of U.S. Government
agencies and states and political subdivisions are shown by contractual
maturity. Mortgage-backed securities are shown by projected average
life.
|
2009
|
2008
|
|||||||||||||||
|
Estimated
|
Estimated
|
|||||||||||||||
|
Amortized
|
Fair
|
Amortized
|
Fair
|
|||||||||||||
|
Cost
|
Value
|
Cost
|
Value
|
|||||||||||||
|
Due
in one year or less
|
$ | 32,730 | $ | 33,110 | $ | 17,880 | $ | 18,010 | ||||||||
|
Due
after one year through 5 years
|
122,580 | 122,063 | 31,984 | 29,373 | ||||||||||||
|
Due
after 5 years through 10 years
|
11,640 | 11,352 | 6,761 | 6,652 | ||||||||||||
|
Due
after 10 years
|
1,100 | 1,093 | 898 | 898 | ||||||||||||
| $ | 168,050 | $ | 167,618 | $ | 57,523 | $ | 54,933 | |||||||||
No
securities available for sale were sold in 2009, 2008, or 2007.
At
December 31, 2009, securities with amortized costs of $34,287 (estimated market
values of $35,115) were pledged to secure certain Treasury and public deposits
as required by law, and to secure borrowing lines.
-57-
3. Loans:
Major
classifications of loans, including loans held for sale, at December 31 are as
follows:
|
December
31,
|
%
of gross
|
December
31,
|
%
of gross
|
|||||||||||||
|
2009
|
loans
|
2008
|
loans
|
|||||||||||||
|
Real
estate secured loans:
|
||||||||||||||||
|
Permanent
Loans:
|
||||||||||||||||
|
Multifamily
residential
|
$ | 68,509 | 7.2 | % | $ | 67,466 | 7.0 | % | ||||||||
|
Residential
1-4 family
|
86,795 | 9.2 | % | 79,189 | 8.3 | % | ||||||||||
|
Owner-occupied
commercial
|
197,884 | 20.9 | % | 188,709 | 19.7 | % | ||||||||||
|
Non-owner-occupied
commercial
|
147,605 | 15.6 | % | 131,183 | 13.7 | % | ||||||||||
|
Other
loans secured by real estate
|
37,404 | 4.0 | % | 23,810 | 2.5 | % | ||||||||||
|
Total
permanent real estate loans
|
538,197 | 56.9 | % | 490,357 | 51.2 | % | ||||||||||
|
Construction
Loans:
|
||||||||||||||||
|
Multifamily
residential
|
18,472 | 2.0 | % | 21,375 | 2.2 | % | ||||||||||
|
Residential
1-4 family
|
41,714 | 4.4 | % | 74,900 | 7.8 | % | ||||||||||
|
Commercial
real estate
|
38,921 | 4.1 | % | 54,203 | 5.7 | % | ||||||||||
|
Commercial
bare land, acquisition & development
|
30,169 | 3.2 | % | 34,756 | 3.6 | % | ||||||||||
|
Residential
bare land, acquisition & development
|
30,484 | 3.2 | % | 33,395 | 3.5 | % | ||||||||||
|
Other
|
1,582 | 0.2 | % | 9,195 | 1.0 | % | ||||||||||
|
Total
construction real estate loans
|
161,342 | 17.1 | % | 227,824 | 23.8 | % | ||||||||||
|
Total
real estate loans
|
699,539 | 74.0 | % | 718,181 | 75.0 | % | ||||||||||
|
Commercial
loans
|
233,821 | 24.7 | % | 226,203 | 23.6 | % | ||||||||||
|
Consumer
loans
|
6,763 | 0.7 | % | 7,484 | 0.8 | % | ||||||||||
|
Other
loans
|
5,629 | 0.6 | % | 6,219 | 0.6 | % | ||||||||||
| 945,752 | 100.0 | % | 958,087 | 100.0 | % | |||||||||||
|
Deferred
loan origination fees
|
(1,388 | ) | (1,730 | ) | ||||||||||||
| 944,364 | 956,357 | |||||||||||||||
|
Allowance
for loan losses
|
(13,367 | ) | (10,980 | ) | ||||||||||||
| $ | 930,997 | $ | 945,377 | |||||||||||||
|
Real
estate loans held for sale
|
$ | 745 | $ | 410 | ||||||||||||
-58-
Allowance for Loan
Losses:
A summary
of activity in the allowance for loan losses is as follows for the periods
indicated:
|
2009
|
2008
|
2007
|
||||||||||
|
Balance,
beginning of year
|
$ | 10,980 | $ | 8,675 | $ | 8,284 | ||||||
|
Provision
charged to income
|
36,000 | 3,600 | 725 | |||||||||
|
Loans
charged against the allowance
|
(33,881 | ) | (1,477 | ) | (396 | ) | ||||||
|
Recoveries
credited to allowance
|
268 | 182 | 62 | |||||||||
|
Balance,
end of year
|
$ | 13,367 | $ | 10,980 | $ | 8,675 | ||||||
It is
management’s opinion that the allowance for loan losses is adequate to absorb
known and inherent risks in the loan portfolio. However, actual
results may differ from estimates.
Loans
considered impaired, net of government guarantees totaled $58,861, $6,132, and
$3,671 at December 31, 2009, 2008, and 2007, respectively. The
specific valuation allowance for loan losses for nonaccrual loans was
approximately $1,048, $887, and $160 at December 31, 2009, 2008, and 2007,
respectively. The average recorded investment in nonaccrual loans was
approximately $22,400, $5,136, and $1,512 in 2009, 2008, and 2007,
respectively. Interest income recognized on nonaccrual loans during
2009, 2008, and 2007 was approximately $2,118, $301, and $226,
respectively. Additional interest income which would have been
realized on nonaccrual loans if they had remained current and still accruing
interest would have been approximately $2,610, $173, and $140 in 2009, 2008 and
2007, respectively. There were no loans 90 days contractually past
due and continuing to accrue interest as of December 31, 2009, 2008, and 2007,
respectively.
At
December 31, 2009, outstanding loans to dental professionals totaled $158,433
and represented 16.8% of total outstanding loans compared to dental professional
loans of $122,205 or 12.8% of total loans at December 31, 2008 There
are no other industry concentrations in excess of 10% of the total loan
portfolio. In addition, a substantial portion of the loan portfolio
is collateralized by real estate and is, therefore, susceptible to changes in
local market conditions. However, management believes that the loan
portfolio is diversified by geographic location and among industry
groups. At December 31, 2009, outstanding residential construction
loans totaled approximately $41,714 and represented 4.4% of total outstanding
loans, compared to residential construction loans of $74,732 or 7.8% of
outstanding loans at December 31, 2008 In addition, at December 31,
2009, unfunded loan commitments for residential construction totaled
approximately $9,948, compared to unfunded loan commitments for residential
construction of $19,818 at December 31, 2008.
4. Loan Participations and Servicing:
In the
normal course of business, the Bank has sold portions of loans to other
institutions in order to extend the Bank’s lending capacity or to mitigate
risk. The unpaid principal balances of these serviced loans at
December 31, 2009 and 2008 were $40,350 and $36,230,
respectively. These loans are not included in the accompanying
consolidated balance sheets and the servicing component of these transactions
are not material to the consolidated financial statements.
-59-
5. Property and
Equipment:
The
balance of property and equipment, including accumulated depreciation and
amortization, at December 31 consists of the following:
|
2009
|
2008
|
|||||||
|
Land
|
$ | 3,834 | $ | 3,834 | ||||
|
Buildings
and improvements
|
18,522 | 18,348 | ||||||
|
Furniture
and equipment
|
8,793 | 8,130 | ||||||
| 31,149 | 30,312 | |||||||
|
Less
accumulated depreciation & amortization
|
(10,921 | ) | (9,549 | ) | ||||
| $ | 20,228 | $ | 20,763 | |||||
The Bank
leases certain facilities for office locations under noncancelable operating
lease agreements expiring through 2039. Rent expense related to these
leases totaled $1,030, $942, and $654, and in 2009, 2008 and 2007,
respectively. The Bank leases approximately 52% of its Springfield
Gateway building to others under noncancelable operating lease agreements
extending through 2012.
Future
minimum payments required and anticipated lease revenues under these leases
are:
|
Property
|
||||||||
|
Lease
|
Leased
|
|||||||
|
Commitments
|
to
Others
|
|||||||
|
2010
|
$ | 988 | $ | 349 | ||||
|
2011
|
953 | 253 | ||||||
|
2012
|
904 | 151 | ||||||
|
2013
|
705 | |||||||
|
2014
|
549 | |||||||
|
Thereafter
|
2,752 | |||||||
| $ | 6,851 | $ | 753 | |||||
Depreciation
expense was $1,340, $1,488, and $1,385 for the years ended December 31, 2009,
2008 and 2007, respectively.
The Bank
capitalized $39 of interest expense related to property additions during
2007. No interest was capitalized for similar property additions in
2009 or 2008.
-60-
6. Goodwill
and Core Deposit Intangibles:
The
following table summarizes the changes in the Company’s goodwill and core
deposit intangible asset for the year ended December 31, 2009.
|
Core
|
||||||||||||
|
Deposit
|
Total
|
|||||||||||
|
Goodwill
|
Intangible
|
Intangibles
|
||||||||||
|
Balance,
December 31, 2007
|
$ | 22,031 | $ | 1,096 | $ | 23,127 | ||||||
|
Amortization
|
- | (223 | ) | (223 | ) | |||||||
|
Balance,
December 31, 2008
|
22,031 | 873 | 22,904 | |||||||||
|
Amortization
|
- | (223 | ) | (223 | ) | |||||||
|
Balance,
December 31, 2009
|
$ | 22,031 | $ | 650 | $ | 22,681 | ||||||
The
goodwill and core deposit intangible assets relate primarily to the NWB
Financial Corporation acquisition in November 2005. In accordance
with ASC 350,
“Intangibles Goodwill and Other”, the Company does not recognize amortization
expense related to its goodwill but completes periodic assessments of goodwill
impairment. Impairment, if deemed to exist, would be charged to
noninterest expense in the period identified. Management completed
its annual assessment of goodwill impairment as of December 31, 2009 and
determined no impairment currently exists.
Forecasted
amortization expense is approximately $223 per year for 2010 and 2011 and $204
for the year 2012 for the core deposit intangible assets acquired during
2005.
7. Deposits:
Scheduled
maturities or repricing of time deposits at December 31 are as
follows:
|
2009
|
2008
|
|||||||
|
2009
|
$ | - | $ | 123,153 | ||||
|
2010
|
99,331 | 9,207 | ||||||
|
2011
|
42,822 | 12,294 | ||||||
|
2012
|
2,412 | 1,109 | ||||||
|
2013
|
4,911 | 4,782 | ||||||
|
2014
|
383 | - | ||||||
|
Thereafter
|
102 | - | ||||||
| $ | 149,961 | $ | 150,545 | |||||
8. Federal Funds and Overnight Funds
Purchased:
The Bank
has unsecured federal funds borrowing lines with correspondent banks totaling
$75,000 at December 31, 2009 of which $10,000 was outstanding as of December 31,
2009. The outstanding balances of these overnight funds were due
January 4, 2010 and carried an interest rate of 0.45%. At December
31, 2008, there was $24,000 borrowed against these lines.
The Bank
also has a secured overnight borrowing line available from the Federal Reserve
Bank totaling $110,756 at December 31, 2009. The Federal Reserve Bank
borrowing line is secured through the pledging of approximately $210,065 of
commercial loans under the Bank’s Borrower-In-Custody program. At December 31,
2009, the outstanding balance was $53,025, consisting of three
advances. The first was due January 4, 2010 and carries an
interest rate of 0.50%. The remaining two advances were due on
January 14, 2010, both advances carried an interest rate of 0.25% and totaled
$50,000. At December 31, 2008, there was $20,000 borrowed
against this line.
-61-
9. Federal Home Loan Bank
Borrowings:
The Bank
has a borrowing line with the FHLB equal to 30% of total assets and subject to
discounted collateral and stock holdings. At December 31, 2009, the
borrowing line was $359,561, this compares to a borrowing line of $327,253 at
December 31, 2008. However, the FHLB borrowing line is limited by the
amount of FHLB stock held and value of collateral pledged. At
December 31, 2009, the FHLB stock held by the Bank would support a total of
$239,089 in borrowings. At December 31, 2009, the Bank had pledged
approximately $350,989 in real estate loans and securities to the FHLB that had
a discounted value of $240,057. At December 31, 2008, the bank had
pledged approximately $441,782 in real estate loans and securities to the FHLB
with a discounted collateral value of $273,978 At December 31, 2009, there was
$130,000 borrowed on this line, including overnight advances of $35,000, $20,000
in short term advances, and $75,000 in long term advances. At
December 31,2008, there was $194,500 borrowed on this line, including CMA
advances of $60,000, $89,000 in short term advances and $45,500 in long term
advances.
Federal
Home Loan Bank borrowings by year of maturity and applicable interest rate are
summarized as follows as of December 31:
|
Rate
|
2009
|
2008
|
||||||||||
|
Cash
Management Advance
|
$ | - | $ | 60,000 | ||||||||
|
2009
|
- | 99,500 | ||||||||||
|
2010
|
0.30 - 5.28 | % | 66,500 | 11,500 | ||||||||
|
2011
|
2.39 - 5.28 | % | 10,000 | 10,000 | ||||||||
|
2012
|
2.02 - 5.28 | % | 16,000 | 4,500 | ||||||||
|
2013
|
2.46 - 4.27 | % | 22,000 | 7,000 | ||||||||
|
2014
|
2.78 - 3.25 | % | 13,500 | - | ||||||||
|
2016
|
5.05 - 5.05 | % | 2,000 | 2,000 | ||||||||
| $ | 130,000 | $ | 194,500 | |||||||||
10. Junior Subordinated
Debentures:
In
connection with the November 2005 acquisition of NWB Financial Corporation, the
Company formed a wholly-owned Delaware statutory business trust subsidiary,
Pacific Continental Corporation Capital Trust (the “Trust”), which issued $8,248
of guaranteed undivided beneficial interests in the Pacific Continental’s Junior
Subordinated Deferrable Interest Debentures (“Trust Preferred
Securities”). These debentures qualify as Tier 1 capital under
Federal Reserve Board guidelines. All of the common securities of the
Trust are owned by Pacific Continental. The proceeds from the
issuance of the common securities and the Trust Preferred Securities were used
by the Trust to purchase $8,248 of junior subordinated debentures of the
Company. The debentures which represent the sole asset of the Trust,
accrue and pay distributions quarterly at a fixed rate of 6.265% per annum of
the stated liquidation value of $1 per capital security.
Pacific
Continental has entered into contractual arrangements which, taken collectively,
fully and unconditionally guarantee payment of: (1) accrued and unpaid
distributions required to be paid on the Trust Preferred Securities, (2) the
redemption price with respect to any Trust Preferred Securities called for
redemption by the Trust, and (3) payments due upon a voluntary or involuntary
dissolution, winding up, or liquidation of the Trust. The Trust
Preferred Securities are mandatorily redeemable upon maturity of the debentures
on January 7, 2036, or upon earlier redemption as provided in the
indenture. Pacific Continental has the right to redeem the debentures
purchased by the Trust in whole or in part, on or after, January, 7,
2011. As specified in the indenture, if the debentures are redeemed
prior to maturity, the redemption price will be the principal amount and any
accrued interest. For the years ended December 31, 2009, 2008 and
2007, the Company recognized net interest expense of $524, $498 and $508,
respectively, related to the Trust Preferred Securities.
-62-
11. Income Taxes:
The
provision (benefit) for income taxes for the years ended December 31 consists of
the following:
|
2009
|
2008
|
2007
|
||||||||||
|
Currently
payable (refundable):
|
||||||||||||
|
Federal
|
$ | (1,809 | ) | $ | 8,571 | $ | 7,608 | |||||
|
State
|
24 | 501 | 556 | |||||||||
| (1,785 | ) | 9,072 | 8,164 | |||||||||
|
Deferred:
|
||||||||||||
|
Federal
|
(1,793 | ) | (1,416 | ) | (288 | ) | ||||||
|
State
|
(261 | ) | (217 | ) | (46 | ) | ||||||
| (2,054 | ) | (1,633 | ) | (334 | ) | |||||||
|
Total
income tax provision (benefit)
|
$ | (3,839 | ) | $ | 7,439 | $ | 7,830 | |||||
The
provision for income taxes results in effective tax rates which are different
than the federal income tax statutory rate. The nature of the
differences for the years ended December 31 was as follows:
|
2009
|
2008
|
2007
|
||||||||||||||||||||||
|
Expected
federal income
|
||||||||||||||||||||||||
|
tax
provision
|
$ | (3,051 | ) | 35.00 | % | $ | 7,132 | 35.00 | % | $ | 7,268 | 35.00 | % | |||||||||||
|
State
income tax, net of
|
||||||||||||||||||||||||
|
federal
income tax effect
|
(396 | ) | 4.54 | % | 660 | 3.24 | % | 733 | 3.53 | % | ||||||||||||||
|
Municipal
securities tax benefit
|
(146 | ) | 1.67 | % | (113 | ) | -0.55 | % | (47 | ) | -0.23 | % | ||||||||||||
|
Equity-based
compensation
|
87 | -1.00 | % | 120 | 0.59 | % | 199 | 0.96 | % | |||||||||||||||
|
Benefit
of purchased tax credits
|
(125 | ) | 1.43 | % | (315 | ) | -1.55 | % | (395 | ) | -1.90 | % | ||||||||||||
|
Deferred
tax rate adjustments
|
||||||||||||||||||||||||
|
and
other
|
(208 | ) | 2.39 | % | (45 | ) | -0.22 | % | 72 | 0.35 | % | |||||||||||||
|
Income
tax provision (benefit)
|
$ | (3,839 | ) | 44.04 | % | $ | 7,439 | 36.51 | % | $ | 7,830 | 37.71 | % | |||||||||||
The tax benefit associated with stock option plans reduced taxes payable by $38, $59 and $201 at December 31, 2009, 2008 and 2007, respectively. Such benefit is credited to common stock.
-63-
The
components of deferred tax assets and liabilities at December 31 are as
follows:
|
2009
|
2008
|
|||||||
|
Assets:
|
||||||||
|
Allowance
for loan losses
|
$ | 5,248 | $ | 4,280 | ||||
|
Basis
adjustments on loans
|
533 | 365 | ||||||
|
Reserve
for self-funded insurance
|
222 | 66 | ||||||
|
Oregon
purchased tax credits
|
3,509 | 1,491 | ||||||
|
Nonqualified
stock options
|
302 | 128 | ||||||
|
Net
unrealized losses on securities
|
166 | 973 | ||||||
|
Nonaccrual
loan interest
|
73 | 86 | ||||||
|
Total
deferred tax assets
|
10,053 | 7,389 | ||||||
|
Liabilities:
|
||||||||
|
Federal
Home Loan Bank stock dividends
|
591 | 582 | ||||||
|
Excess
tax over book depreciation
|
724 | 610 | ||||||
|
Prepaid
expenses
|
694 | 238 | ||||||
|
NWBF
acquisition adjustments
|
253 | 336 | ||||||
|
Other,
principally loan orig. costs and deferred fees
|
614 | 580 | ||||||
|
Total
deferred tax liabilities
|
2,876 | 2,346 | ||||||
|
Net
deferred tax assets
|
$ | 7,177 | $ | 5,043 | ||||
Purchased
tax credits of $3,264 will be utilized to offset future state income
taxes. These credits are recognized over a five year period beginning
in the year of purchase and have an eight year carry forward
period. If unused, the credits will expire in the following
years: $1,111 in 2017, $947 in 2018, $545 in 2019, $402 in 2020 and
$259 in 2021. An Oregon net operating loss carryforward in the amount
of $4,391 will offset future Oregon income. The loss carryforward
will expire in 2024 if not utilized. It is anticipated that all
credits net operating loss and other deferred asset items will be fully utilized
in the normal course of operations and, accordingly, Management has not reduced
deferred tax assets by a valuation allowance.
The
Company adopted the provision of FASB ASC 740, Income Taxes, relating to
accounting for uncertain tax positions on January 1, 2007. As a
result of the implementation of ASC 740, the Company recognized no liability for
unrecognized tax benefits. The Company files tax returns with the
Internal Revenue Service and the Oregon Department of Revenue. Tax
returns for years subsequent to 2006 remain open to examination by these taxing
jurisdictions. The Company’s policy with respect to interest and
penalties ensuing from income tax settlements is to recognize them as
noninterest expense.
12. Retirement Plan:
The Bank
has a 401(k) profit sharing plan covering substantially all
employees. The plan provides for employee and employer
contributions. The total plan expenses, including employer
contributions, were $713 and $784 in 2008 and 2007,
respectively. There were no employer contributions to the plan in
2009.
13. Stock Based
Compensations:
Pursuant
to the 2006 Stock Option and Equity Compensation Plan (the “2006 SOEC Plan”),
incentive stock options, nonqualified stock options, restricted stock,
restricted stock units, or stock appreciation rights may be awarded to attract
and retain Company and Bank employees. Upon adoption of the 2006 SOEC
Plan, the Company’s 1999 Employees’ Stock Option Plan (“1999 ESOP Plan”) and the
Directors’ Stock Option Plan (“1999 DSOP Plan”) were cancelled and no longer
available for future grants. The exercise price for shares of common
stock subject to an option under the 2006 SOEC Plan shall not be less than 100%
of the fair market value of a share of common stock as of the date of grant of
the option; provided, however, that in the case of an incentive stock option
granted to an employee who immediately before the grant of such incentive stock
option is a shareholder-employee, the incentive stock option exercise price
shall be at least 110% of the fair market value of the common stock as of the
date of grant of the incentive stock option. The Compensation Committee of the
Board of Directors may impose any terms or conditions on the vesting of an award
that it determines to be
-64-
appropriate. For
the year ended December 31, 2009, the Company issued 116 incentive stock options
with a fair value of $2.79 per share, to selected employees.
Pursuant
to the Company’s 2006 SOEC Plan, stock appreciation rights (SARs) may be granted
to employees. The stock appreciation rights may be settled in cash or
cash and common stock as determined at the date of issuance. The
Compensation Committee or the Board of Directors determines vesting provisions
when awards are granted, and the awards granted generally vest over three or
four years and have a maximum life of ten years. SARs settled in
stock are recognized as equity-based awards while SARs settled in cash are
recognized on the balance sheet as liability-based awards, both of which are
granted at the fair market value of our common stock at the grant
date. The grant-date fair value of the liability based awards vesting
in the current period, along with the change in fair value of the awards during
the period, are recognized as compensation expense and as an adjustment to the
recorded liability. For the year ended December 31, 2009, the Company
issued 243 SARs, of which 147 have a fair value of $2.76 per unit and are to be
settled in stock and 96 have a fair value of $2.76 per unit and are to be
settled in cash. For the year ended December 31, 2008, 221 SARs were
issued, of which 121 have a fair value of $2.17 per unit and 7 have a fair value
of $1.87 per unit and are to be settled in stock and 92 have a fair value of
$2.59 per unit and 1 have a fair value of $1.63 per unit and are to be settled
in cash. For the year ended December 31, 2007, the Company issued 152
SARs, with a fair value of $2.17 per unit, of which 66 are to be settled in cash
and 86 are to be settled in stock.
Also,
pursuant to the Company’s 2006 SOEC Plan, non-qualified option awards and
restricted stock awards may be granted to directors. Stock options
may be granted at exercise prices of not less than 100% of the fair market value
of our common stock at the grant date. Restricted stock awards may be
granted at the fair market value on the date of the grant. The
maximum life of options granted under this plan is ten years from the grant
date. For the year ended December 31, 2007, the Company issued 17
nonqualified stock options, with a fair value of $3.09 per
option. For the year ended December 31, 2008, the Company issued 4
restricted stock awards, all of which immediately vested, to its Directors, with
a fair value of $14.44 per share, the closing share price on the date of the
grant. For the year ended December 31, 2009, the Company issued 6
restricted stock awards to its Directors, with a fair value of $11.02 per share,
the closing share price on the date of the grant.
The
following tables identify the compensation expenses and tax benefits received by
the Company according to the compensation plans and awards described above for
the years 2009, 2008 and 2007:
|
Year
ended
|
Year
ended
|
Year
ended
|
||||||||||||||||||||||
|
December
31, 2009
|
December
31, 2008
|
December
31, 2007
|
||||||||||||||||||||||
|
Comp.
Exp.
|
Tax
Benefit
|
Comp.
Exp.
|
Tax
Benefit
|
Comp.
Exp.
|
Tax
Benefit
|
|||||||||||||||||||
|
1999
ESOP Plan
|
$ | 13 | $ | - | $ | 159 | $ | - | $ | 282,434 | $ | - | ||||||||||||
|
2006
SOEC - ISOs
|
209 | - | 158 | - | 6,559 | 2,516 | ||||||||||||||||||
|
2006
SOEC - SARS stock
|
251 | 96 | 185 | 68 | 108,150 | - | ||||||||||||||||||
|
2006
SOEC - SARS cash
|
126 | 48 | 37 | 14 | 127,849 | 49,043 | ||||||||||||||||||
|
2006
SOEC - DSOs
|
28 | 11 | 27 | 10 | 26,003 | 9,975 | ||||||||||||||||||
|
2006
SOEC - DRSA
|
63 | 24 | 60 | 22 | 26,204 | 10,052 | ||||||||||||||||||
|
Total
|
$ | 690 | $ | 179 | $ | 626 | $ | 114 | $ | 577,199 | $ | 71,586 | ||||||||||||
-65-
Stock
Options –
The
following table provides the weighted-average fair values for stock options,
exclusive of the options issued as a result of the NWBF acquisition, granted
during the last three years. These values were estimated using the
Black-Scholes option valuation model with the following weighted-average
assumptions:
|
Years
Ended December 31,
|
||||||||||||
|
2009
|
2008
|
2007
|
||||||||||
|
Expected
life in years (1)
|
7.00 | 7.01 | 5.61 | |||||||||
|
Volatility
(1)
|
30.40 | % | 18.93 | % | 17.87 | % | ||||||
|
Interest
Rate (2)
|
2.46 | % | 3.44 | % | 4.81 | % | ||||||
|
Dividend
Yield Rate (3)
|
3.31 | % | 2.77 | % | 1.58 | % | ||||||
|
Average
Fair-Value
|
$ | 2.79 | $ | 2.59 | $ | 4.18 | ||||||
|
(1)
|
Volatility
is based on historical experience over a period equivalent to the expected
life in years.
|
|
(2)
|
Based
on the U.S. Treasury constant maturity interest rate with a term
consistent with the expected life of the options
granted.
|
|
(3)
|
The
Company has paid cash dividends on common stock since
1985. Each grant’s dividend yield is calculated by annualizing
the most recent quarterly cash dividend and dividing that amount by the
market price of the Company’s common stock as of the grant
date.
|
For any
future grants, as required by ASC 718, the Company will estimate the impact of
forfeitures based on our historical experience with previously
granted stock options, and consider the impact of the forfeitures when
determining the amount of expense to record for stock options
granted. For stock options issued prior to the adoption of ASC 718,
forfeitures were recognized when the stock option was actually
forfeited. The Company generally issues new shares of common stock to
satisfy stock option exercises.
A summary
of stock option activity during the current fiscal year is presented
below:
|
Total
Stock Options
|
Shares
(in
thousands)
|
Average
Price Per Share
|
Weighted-Average
Remaining Contractual Life
|
Aggregate
Intrinsic Value
|
||||||||||||
|
Outstanding
at December 31, 2008
|
628 | $ | 14.24 | |||||||||||||
|
Granted
|
116 | 12.07 | ||||||||||||||
|
Exercised
|
(38 | ) | 11.02 | |||||||||||||
|
Forfeited
or expired
|
(187 | ) | 14.66 | |||||||||||||
|
Outstanding
at December 31, 2009
|
519 | $ | 13.85 | 5.85 | $ | 315 | ||||||||||
|
Exercisable
at December 31, 2009
|
269 | $ | 13.57 | 3.76 | $ | 315 | ||||||||||
|
Nonvested
Options
|
Shares
(in
thousands)
|
Weighted-Average
Grant Date Fair Value
|
||||||
|
Outstanding
at December 31, 2008
|
205 | $ | 2.66 | |||||
|
Granted
|
116 | 2.79 | ||||||
|
Vested
|
(68 | ) | 2.15 | |||||
|
Forfeited
or expired
|
(4 | ) | 2.84 | |||||
|
Outstanding
at December 31, 2009
|
249 | $ | 3.03 | |||||
-66-
A summary
of value received by employees and directors exercising stock options over the
last three years is presented below:
|
Years
Ended December 31,
|
||||||||||||
|
2009
|
2008
|
2007
|
||||||||||
|
Total
intrinsic value of
|
||||||||||||
|
stock
options exercised
|
$ | 125 | $ | 488 | $ | 1,206 | ||||||
Stock
Appreciation Rights -
The
following table provides the weighted-average fair values for stock appreciation
rights (SARs) to be settled in stock. The values were estimated using
the Black-Scholes option valuation model with the following weighted-average
assumptions:
|
Years
Ended December 31,
|
||||||||||||
|
2009
|
2008
|
2007
|
||||||||||
|
Expected
life in years (1)
|
6.00 | 6.01 | 6.00 | |||||||||
|
Volatility
(1)
|
31.80 | % | 16.99 | % | 18.68 | % | ||||||
|
Interest
Rate (2)
|
2.17 | % | 3.21 | % | 4.81 | % | ||||||
|
Dividend
Yield Rate (3)
|
3.31 | % | 2.78 | % | 1.58 | % | ||||||
|
Average
Fair-Value
|
$ | 2.76 | $ | 2.15 | $ | 4.45 | ||||||
|
(1)
|
Volatility
is based on historical experience over a period equivalent to the expected
life in years.
|
|
(2)
|
Based
on the U.S. Treasury constant maturity interest rate with a term
consistent with the expected life of the options
granted.
|
|
(3)
|
The
Company has paid cash dividends on common stock since
1985. Each grant’s dividend yield is calculated by annualizing
the most recent quarterly cash dividend and dividing that amount by the
market price of the Company’s common stock as of the grant
date.
|
A summary
of SAR – stock awards activity is presented below:
|
Total
SAR - Stock Awards
|
Awards
(in
thousands)
|
Average
Price Per Award
|
Weighted-Average
Remaining Contractual Life
|
|||||||||
|
Outstanding
at December 31, 2008
|
266 | $ | 16.03 | |||||||||
|
Granted
|
147 | 12.07 | ||||||||||
|
Exercised
|
- | - | ||||||||||
|
Forfeited
or expired
|
(13 | ) | 14.33 | |||||||||
|
Outstanding
at December 31, 2009
|
400 | $ | 14.63 | 8.14 | ||||||||
|
Exercisable
at December 31, 2009
|
116 | $ | 16.50 | 7.23 | ||||||||
|
Nonvested
SAR - Stock Awards
|
Awards
(in
thousands)
|
Weighted-Average
Grant Date Fair Value
|
||||||
|
Outstanding
at December 31, 2008
|
215 | $ | 3.03 | |||||
|
Granted
|
147 | 2.76 | ||||||
|
Vested
|
(63 | ) | 3.24 | |||||
|
Forfeited
or expired
|
(15 | ) | 2.95 | |||||
|
Outstanding
at December 31, 2009
|
284 | $ | 2.85 | |||||
-67-
A summary
of SAR – cash awards activity during the current fiscal year is presented
below:
|
Total
SAR - Cash Awards
|
Awards
(in
thousands)
|
Average
Price Per Award
|
Weighted-Average
Remaining Contractual Life
|
|||||||||
|
Outstanding
at December 31, 2008
|
192 | $ | 16.06 | |||||||||
|
Granted
|
96 | 12.07 | ||||||||||
|
Exercised
|
- | - | ||||||||||
|
Forfeited
or expired
|
(16 | ) | 14.54 | |||||||||
|
Outstanding
at December 31, 2009
|
272 | $ | 14.75 | 8.08 | ||||||||
|
Exercisable
at June 30, 2009
|
83 | $ | 16.52 | 7.20 | ||||||||
|
Nonvested
SAR - Cash Awards
|
Awards
(in
thousands)
|
Weighted-Average
Grant Date Fair Value
|
||||||
|
Outstanding
at December 31, 2008
|
153 | $ | 2.88 | |||||
|
Granted
|
96 | 2.76 | ||||||
|
Vested
|
(44 | ) | 3.11 | |||||
|
Forfeited
or expired
|
(16 | ) | 2.78 | |||||
|
Outstanding
at December 31, 2009
|
189 | $ | 2.77 | |||||
For any
future grants, as required by ASC 718, the Company will estimate the impact of
forfeitures based on our historical experience with previously granted stock
options, and consider the impact of the forfeitures when determining the amount
of expense to record for both stock and cash settled SARs.
At
December 31, 2009, the Company has estimated unrecognized compensation expense
of approximately $446, $495, and $269 for unvested stock options, SAR – stock
awards and SAR – cash awards, respectively. These amounts are based
on a forfeiture rate assumption of 20% for all awards granted to
employees. The weighted-average period of time the unrecognized
compensation expense will be recognized for the unvested stock options, SAR –
stock awards and SAR – cash awards is approximately 2.5, 2.7 and 3.0 years,
respectively.
14. Transactions with Related
Parties:
The Bank
has granted loans to officers and directors and to companies with which they are
associated. Such loans are made on substantially the same terms,
including interest rates and collateral, as those prevailing at the time for
comparable transactions with unrelated parties. Activity with respect
to these loans during the year ended December 31 was as follows:
|
2009
|
2008
|
|||||||
|
Balance,
beginning of year
|
$ | 1,763 | $ | 1,462 | ||||
|
Additions
or renewals
|
874 | 549 | ||||||
|
Amounts
collected
|
(1,549 | ) | (248 | ) | ||||
|
Balance,
end of year
|
$ | 1,088 | $ | 1,763 | ||||
In addition, there were $259 in commitments to extend credit to directors and officers at December 31, 2009, which are included among loan commitments, disclosed in Note 15.
-68-
15. Commitments and
Contingencies:
In order
to meet the financing needs of its clients, the Bank commits to extensions of
credit and issues letters of credit. The Bank uses the same credit
policies in making commitments and conditional obligations as it does for other
products. In the event of nonperformance by the client, the Bank’s
exposure to credit loss is represented by the contractual amount of the
instruments. The Bank’s collateral policies related to financial
instruments with off-balance-sheet risk conform to its general underwriting
guidelines.
Commitments
to extend credit are agreements to lend to a client as long as there is no
violation of any condition established in the contract. Commitments
generally have expiration dates or other termination clauses and may require
payment of a fee. Since some of the commitments may expire without
being drawn upon, the total commitment amounts do not necessarily represent
future cash requirements.
Letters
of credit written are conditional commitments issued by the Bank to guarantee
the performance of a client to a third party. The credit risk
involved in issuing letters of credit is essentially the same as that involved
in extending loan facilities to clients.
Off-balance-sheet
instruments at December 31 consist of the following:
|
2009
|
2008
|
|||||||
|
|
||||||||
| Commitments to extend credit (principally variable rate) | $ | 133,515 | 182,609 | |||||
|
Letters
of credit and financial guarantees written
|
$ | 1,614 | $ | 2,298 | ||||
The
Company has entered into Executive Employment Agreements with two key executive
officers. The employment agreements provide for minimum aggregate
annual base salaries of $566,500, plus performance adjustments, life insurance
coverage, and other perquisites commonly found in such
agreements. The two employment agreements expire in 2011 unless
extended or terminated earlier.
Legal
Contingencies arise from time to time in the normal course of
business. Based upon analysis of management, in consultation with the
Company’s legal counsel, there are no current legal matters which are expected
to have a material effect on the Company’s consolidated financial
statements.
16. Fair Value Disclosures of Financial
Instruments:
The
following disclosures about fair value of financial instruments are made in
accordance with provisions of ASC 825 “Financial Instruments”. The
use of different assumptions and estimation methods could have a significant
effect on fair value amounts. Accordingly, the estimates of fair
value herein are not necessarily indicative of the amounts that might be
realized in a current market exchange.
-69-
The
estimated fair values of the financial instruments at December 31 are as
follows:
|
2009
|
2008
|
|||||||||||||||
|
Carrying
|
Carrying
|
|||||||||||||||
|
Amount
|
Fair
Value
|
Amount
|
Fair
Value
|
|||||||||||||
|
Financial
assets:
|
||||||||||||||||
|
Cash
and cash equivalents
|
$ | 16,970 | $ | 16,970 | $ | 20,455 | $ | 20,455 | ||||||||
|
Securities
available for sale
|
167,618 | 167,618 | 54,933 | 54,933 | ||||||||||||
|
Loans
held for sale
|
745 | 745 | 410 | 410 | ||||||||||||
|
Loans,
net of allowance
|
||||||||||||||||
|
for
loan losses
|
930,997 | 932,608 | 945,377 | 947,091 | ||||||||||||
|
Interest
receivable
|
4,408 | 4,408 | 4,021 | 4,021 | ||||||||||||
|
Federal
Home Loan
|
||||||||||||||||
|
Bank
stock
|
10,652 | 10,652 | 10,652 | 10,652 | ||||||||||||
|
Financial
liabilities:
|
||||||||||||||||
|
Deposits
|
827,918 | 829,893 | 722,437 | 723,188 | ||||||||||||
|
Federal
funds and overnight funds purchased
|
63,025 | 63,025 | 44,000 | 44,000 | ||||||||||||
|
Federal
Home Loan Bank borrowings
|
130,000 | 130,787 | 194,500 | 196,001 | ||||||||||||
|
Junior
subordinated debentures
|
8,248 | 7,987 | 8,248 | 7,903 | ||||||||||||
|
Accrued
interest payable
|
623 | 623 | 527 | 527 | ||||||||||||
Cash and Cash Equivalents – The carrying amount approximates fair value.
Securities available for sale and
Federal Home Loan Bank stock – Fair value is based on quoted market
prices. If a quoted market price is not available, fair value is
estimated using quoted market prices for similar securities. FHLB
stock is valued based on the most recent redemption price.
Loans Held for Sale – Fair
value represents the anticipated proceeds from the sale of related
loans.
Loans – For variable-rate
loans that reprice frequently and have no significant change in credit risk,
fair values are based on carrying values. Fair value of fixed-rate
loans is estimated by discounting the future cash flows using current rates at
which similar loans would be made to borrowers with similar credit ratings and
for the same remaining maturities. Fair values for impaired loans are
estimated using discounted cash flow analyses or underlying collateral values,
where applicable, and considers credit risk. The Company uses an
independent third party in establishing the fair value of its loan
portfolio.
Interest receivable and
payable – The carrying amounts of accrued interest receivable and payable
approximate their fair value.
Deposits – Fair value of
demand, interest-bearing demand and savings deposits is the amount payable on
demand at the reporting date. Fair value of time deposits is
estimated using the interest rates currently offered for deposits of similar
remaining maturities. The Company uses an independent third party to
establish the fair value of time deposits.
Federal Funds Purchased – The
carrying amount is a reasonable estimate of fair value because of the short-term
nature of these borrowings.
Federal Home Loan Bank
Borrowings – Fair value of Federal Home Loan Bank borrowings is estimated
by discounting future cash flows at rates currently available for debt with
similar terms and remaining maturities.
Junior Subordinated
Debentures – Fair value of Junior Subordinated Debentures is estimated by
discounting future cash flows at rates currently available for debt with similar
credit risk, terms and remaining maturities.
Off-Balance-Sheet Financial
Instruments – The carrying amount and fair value are based on fees
charged for similar commitments and are not material.
-70-
Financial
instruments, measured at fair value, are broken down in the table below by
recurring or nonrecurring measurement status. Recurring assets are
initially measured at fair value and are required to be remeasured at fair value
in the financial statements at each reporting date. Assets measured
on a nonrecurring basis are assets that, due to an event or circumstance, were
required to be remeasured at fair value after initial recognition in the
financial statements at some time during the reporting period.
-71-
The table
below shows assets measured at fair value as of December 31, 2009:
|
Carrying
Value
|
Quoted
Prices in Active Markets for Identical Assets
(Level
1)
|
Significant
Other Observable Inputs
(Level
2)
|
Significant
Unobservable Inputs
(Level
3)
|
Year
Ended December 31,
2009
Total
Loss
|
||||||||||||||||
|
Recurring Items
|
||||||||||||||||||||
|
Obligations
of U.S Government agencies
|
$ | 5,000 | $ | - | $ | 5,000 | $ | - | $ | - | ||||||||||
|
Obligation
of states and political subdivisions
|
6,709 | - | 6,709 | - | - | |||||||||||||||
|
Mortgage-backed
securities
|
155,909 | - | 155,909 | - | - | |||||||||||||||
|
Non-Recurring Items
|
||||||||||||||||||||
|
Loans
measured for impairment
|
||||||||||||||||||||
|
(net
of guarantees)
|
$ | 58,861 | $ | - | $ | - | $ | 58,861 | $ | 25,631 | ||||||||||
|
Other
real estate owned
|
4,224 | - | - | 4,224 | 515 | |||||||||||||||
|
Total
|
$ | 230,703 | $ | - | $ | 167,618 | $ | 63,085 | $ | 26,146 | ||||||||||
The table
below shows assets measured at fair value as of December 31, 2008:
|
Carrying Value
|
Quoted
Prices in Active Markets for Identical Assets
(Level
1)
|
Significant
Other Observable Inputs
(Level
2)
|
Significant
Unobservable Inputs
(Level
3)
|
Year
Ended December 31,
2008
Total
Loss
|
||||||||||||||||
|
Recurring Items
|
||||||||||||||||||||
|
Obligations
of U.S Government agencies
|
$ | 2,028 | $ | - | $ | - | $ | - | $ | - | ||||||||||
|
Obligation
of states and political subdivisions
|
7,486 | - | 7,486 | - | - | |||||||||||||||
|
Mortgage-backed
securities
|
45,419 | - | 45,419 | - | - | |||||||||||||||
|
Non-Recurring Items
|
||||||||||||||||||||
|
Loans
measured for impairment
|
||||||||||||||||||||
|
(net
of guarantees)
|
1,927 | - | - | 1,927 | 887 | |||||||||||||||
|
Other
real estate owned
|
3,806 | - | - | 3,806 | 49 | |||||||||||||||
|
Total
|
$ | 82,697 | $ | - | $ | 54,933 | $ | 27,764 | $ | 936 | ||||||||||
-72-
17. Regulatory Matters:
The
Company and the Bank are subject to the regulations of certain federal and state
agencies and receive periodic examinations by those regulatory
authorities. In addition, they are subject to various regulatory
capital requirements administered by federal banking
agencies. Failure to meet minimum capital requirements can initiate
certain mandatory – and possibly additional discretionary – actions by
regulators that, if undertaken, could have a direct material effect on the
consolidated financial statements. Under capital adequacy guidelines
and the regulatory framework for prompt corrective action, the Bank must meet
specific capital guidelines that involve quantitative measures of the Bank’s
assets, liabilities, and certain off-balance-sheet items as calculated under
regulatory accounting practices. The Company and the Bank’s capital
amounts and classification are also subject to qualitative judgments by the
regulators about components, risk weightings and other factors.
Quantitative
measures established by regulation to ensure capital adequacy require the
Company and the Bank to maintain minimum amounts and ratios of Total and Tier I
capital to risk-weighted assets and of Tier I capital to leverage
assets. Management believes, as of December 31, 2009, that the
Company and the Bank meet all capital adequacy requirements to which they are
subject.
As of
December 31, 2009 and according to Federal Reserve and FDIC guidelines, the
Company and the Bank are considered to be well capitalized. To be
categorized as well capitalized, the Company and the Bank must maintain minimum
Total risk-based, Tier I risk-based, and Tier I leverage ratios as set forth in
the following table. There are no conditions or events since that
notification that management believes have changed the institution’s
category.
The
Company’s and the Bank’s actual capital amounts and ratios are presented in the
table.
|
To
Be Well
|
||||||||||||||||||||||||
|
Capitalized
Under
|
||||||||||||||||||||||||
|
For
Capital
|
Prompt
Corrective
|
|||||||||||||||||||||||
|
Actual
|
Adequacy
Purposes
|
Action
Provisions
|
||||||||||||||||||||||
|
Amount
|
Ratio
|
Amount
|
Ratio
|
Amount
|
Ratio
|
|||||||||||||||||||
|
As
of December 31, 2009:
|
||||||||||||||||||||||||
|
Total
capital (to risk
|
||||||||||||||||||||||||
|
weighted
assets)
|
||||||||||||||||||||||||
|
Bank:
|
$ | 153,904 | 14.64 | % | $ | 84,120 | 8 | % | $ | 105,150 | 10 | % | ||||||||||||
|
Company:
|
$ | 164,401 | 15.63 | % | $ | 84,140 | 8 | % | $ | 105,175 | 10 | % | ||||||||||||
|
Tier
I capital (to risk
|
||||||||||||||||||||||||
|
weighted
assets)
|
||||||||||||||||||||||||
|
Bank:
|
$ | 140,749 | 13.39 | % | $ | 42,060 | 4 | % | $ | 63,090 | 6 | % | ||||||||||||
|
Company:
|
$ | 151,248 | 14.38 | % | $ | 42,070 | 4 | % | $ | 63,105 | 6 | % | ||||||||||||
|
Tier
I capital (to leverage
|
||||||||||||||||||||||||
|
assets)
|
||||||||||||||||||||||||
|
Bank:
|
$ | 140,749 | 12.24 | % | $ | 46,006 | 4 | % | $ | 57,508 | 5 | % | ||||||||||||
|
Company:
|
$ | 151,248 | 13.66 | % | $ | 44,292 | 4 | % | $ | 55,365 | 5 | % | ||||||||||||
|
As
of December 31, 2008:
|
||||||||||||||||||||||||
|
Total
capital (to risk
|
||||||||||||||||||||||||
|
weighted
assets)
|
||||||||||||||||||||||||
|
Bank:
|
$ | 113,600 | 11.11 | % | $ | 81,773 | 8 | % | $ | 102,216 | 10 | % | ||||||||||||
|
Company:
|
$ | 114,095 | 11.16 | % | $ | 81,773 | 8 | % | $ | 102,216 | 10 | % | ||||||||||||
|
Tier
I capital (to risk
|
||||||||||||||||||||||||
|
weighted
assets)
|
||||||||||||||||||||||||
|
Bank:
|
$ | 102,424 | 10.02 | % | $ | 40,887 | 4 | % | $ | 61,330 | 6 | % | ||||||||||||
|
Company:
|
$ | 102,919 | 10.07 | % | $ | 40,887 | 4 | % | $ | 61,330 | 6 | % | ||||||||||||
|
Tier
I capital (to leverage
|
||||||||||||||||||||||||
|
assets)
|
||||||||||||||||||||||||
|
Bank:
|
$ | 102,424 | 9.68 | % | $ | 42,306 | 4 | % | $ | 52,882 | 5 | % | ||||||||||||
|
Company:
|
$ | 102,919 | 9.73 | % | $ | 42,306 | 4 | % | $ | 52,882 | 5 | % | ||||||||||||
-73-
18. Parent Company Financial
Information:
Financial
information for Pacific Continental Corporation (Parent Company only) is
presented below:
BALANCE
SHEETS
December
31
|
2009
|
2008
|
|||||||
|
Assets:
|
||||||||
|
Cash
deposited with the Bank
|
$ | 10,639 | $ | 621 | ||||
|
Prepaid
expenses
|
- | 6 | ||||||
|
Equity
in Trust
|
248 | 248 | ||||||
|
Investment
in the Bank, at cost plus equity
|
||||||||
|
in
earnings
|
163,163 | 123,670 | ||||||
| $ | 174,050 | $ | 124,545 | |||||
|
Liabilities
and shareholders' equity:
|
||||||||
|
Liabilities
|
$ | 140 | $ | 132 | ||||
|
Junior
subordinated debentures
|
8,248 | 8,248 | ||||||
|
Shareholders'
equity
|
165,662 | 116,165 | ||||||
| $ | 174,050 | $ | 124,545 | |||||
For the
Periods Ended December 31
|
2009
|
2008
|
2007
|
||||||||||
|
Income:
|
||||||||||||
|
Cash
dividends from the Bank
|
$ | 2,600 | $ | 4,100 | $ | 2,610 | ||||||
| 2,600 | 4,100 | 2,610 | ||||||||||
|
Expenses:
|
||||||||||||
|
Interest
expense
|
508 | 498 | 509 | |||||||||
|
Investor
relations
|
46 | 46 | 52 | |||||||||
|
Legal,
registration expense, and other
|
139 | 94 | 74 | |||||||||
|
Personnel
costs paid to Bank
|
177 | 110 | 109 | |||||||||
| 870 | 748 | 744 | ||||||||||
|
Income
before income tax expense
|
||||||||||||
|
and
equity in undistributed
|
||||||||||||
|
earnings
(loss) from the Bank
|
1,730 | 3,352 | 1,866 | |||||||||
|
Income
tax expense
|
(658 | ) | (1,274 | ) | (709 | ) | ||||||
|
Equity
in undistributed earnings (loss) of the Bank
|
(5,951 | ) | 10,861 | 11,778 | ||||||||
|
Net
income (loss)
|
$ | (4,879 | ) | $ | 12,939 | $ | 12,935 | |||||
-74-
STATEMENTS
OF CASH FLOWS
For the
Periods Ended December 31
|
2009
|
2008
|
2007
|
||||||||||
|
Cash
flows from operating activities:
|
||||||||||||
|
Net
income (loss)
|
$ | (4,879 | ) | $ | 12,939 | $ | 12,935 | |||||
|
Adjustments
to reconcile net income (loss)
|
||||||||||||
|
to
net cash provided by operating
|
||||||||||||
|
activities:
|
||||||||||||
|
Equity
in undistributed earnings (loss) from
|
5,951 | (10,861 | ) | (11,778 | ) | |||||||
|
the
Bank
|
||||||||||||
|
Other,
net
|
(1,592 | ) | (2,542 | ) | (1,609 | ) | ||||||
|
Net
cash used in operating activities
|
(520 | ) | (464 | ) | (452 | ) | ||||||
|
Cash
flows from investing activities:
|
||||||||||||
|
Investment
in bank subsidiary
|
(41,900 | ) | 4,100 | 2,610 | ||||||||
|
Net
cash provided by investing activities
|
(41,900 | ) | 4,100 | 2,610 | ||||||||
|
Cash
flows from financing activities:
|
||||||||||||
|
Proceeds
from stock options exercised
|
417 | 1,445 | 1,939 | |||||||||
|
Proceeds
from share issuance
|
55,293 | - | - | |||||||||
|
Dividends
paid
|
(3,272 | ) | (4,797 | ) | (4,175 | ) | ||||||
|
Net
cash provided by (used in) financing activities
|
52,438 | (3,352 | ) | (2,236 | ) | |||||||
|
Net
increase (decrease) in cash
|
10,018 | 284 | (78 | ) | ||||||||
|
Cash,
beginning of period
|
621 | 337 | 415 | |||||||||
|
Cash,
end of period
|
$ | 10,639 | $ | 621 | $ | 337 | ||||||
ITEM
8 Changes In and Disagreements
with Accountants on Accounting and Financial Disclosure
None
ITEM
8A Controls and
Procedures
Evaluation
of Disclosure Controls and Procedures
An
evaluation was carried out under the supervision and with the participation of
the Company’s management, including the Chief Executive Officer (“CEO”) and
Chief Financial Officer (“CFO”), of the effectiveness of our disclosure controls
and procedures, as defined in Rule 13a-15(e) and 15d-15(e) of the Securities
Exchange Act of 1934 (the “Exchange Act”). Based on that evaluation,
the CEO and CFO have concluded that as of the end of the period covered by this
report, our disclosure controls and procedures are effective to provide
reasonable assurance that information required to be disclosed by us in reports
that we file or submit under the Exchange Act is recorded, processed,
summarized, and timely reported as provided in the SEC rules and
forms. There were no changes in our internal control over financial
reporting (as defined in Rules 13a-15(f) and 15d-15(f) of the Exchange Act)
during the three months ended December 31, 2009 that have materially affected,
or are reasonably likely to materially affect, our internal control over
financial reporting.
Management’s
Report on Internal Control Over Financial Reporting
The
management of the Company is responsible for establishing and maintaining
adequate internal control over financial reporting. This internal
control system has been designed to provide reasonable assurance to the
Company’s management and board of directors regarding the preparation and fair
presentation of the Company’s published financial statements.
-75-
All
internal control systems, no matter how well designed, have inherent
limitations. Therefore, even those systems determined to be effective
can provide only reasonable assurance with respect to financial statement
preparation and presentation.
The
management of Pacific Continental Corporation has assessed the effectiveness of
its internal control over financial reporting at December 31,
2009. To make this assessment, the Company used the criteria for
effective internal control over financial reporting described in Internal Control – Integrated
Framework, issued by the Committee of Sponsoring Organizations of the
Treadway Commission. Based on this assessment, the Company believes
that as of December 31, 2009, the internal control over financial reporting
system met those criteria.
The
Company’s independent auditors, Moss Adams, L.L.P., have issued an attestation
report on the Company’s internal control over financial
reporting. The attestation report can be found on pages 44 and 45 of
this document.
None
PART III
ITEM
9 Directors, Executive
Officers, and Corporate Governance
The
information regarding “Directors and Executive Officers of the Registrant” of
the Company is incorporated by reference from the sections entitled “ELECTION OF
DIRECTORS—Nominees for Director,” “MANAGEMENT” and “COMPLIANCE WITH SECTION
16(a) FILING REQUIREMENTS” of the Company’s 2010 Annual Meeting Proxy Statement
(the “Proxy Statement”).
In
September of 2003, consistent with the requirements of The Sarbanes-Oxley Act of
2002, the Company adopted a Code of Ethics applicable to senior financial
officers including the principal executive officer. The Code of
Ethics was amended in 2007 to reflect non-material changes and is filed as
Exhibit 14 to the Company’s Annual Report on Form 10-K for the year-end December
31, 2007. The Code of Ethics can also be accessed electronically by
visiting the Company’s website.
Information
regarding the Company’s Audit Committee financial expert appears under the
section entitled “INFORMATION REGARDING THE BOARD OF DIRECTORS AND ITS
COMMITTEES – Certain Committees of the Board of Directors” in the Company’s
Proxy Statement and is incorporated by reference.
ITEM
10 Executive
Compensation
The
information regarding “Executive Compensation” is incorporated by reference from
the sections entitled “COMPENSATION DISCUSSION AND ANALYSIS,” “EXECUTIVE
COMPENSATION” and “DIRECTOR COMPENSATION” of the Proxy Statement.
ITEM
11 Security Ownership of
Certain Beneficial Owners and Management and Related Shareholder
Matters
The
information regarding “Security Ownership of Certain Beneficial Owners and
Management” is incorporated by reference from the section entitled “SECURITY
OWNERSHIP OF CERTAIN BENEFICIAL OWNERS AND MANAGEMENT” of the Proxy
Statement.
ITEM
12 Certain Relationships and
Related Transactions and Director Independence
The
information regarding “Certain Relationships and Related Transactions and
Director Independence” is incorporated by reference from the sections entitled
“TRANSACTIONS WITH MANAGEMENT” and “DIRECTOR INDEPENDENCE” of the Proxy
Statement.
-76-
ITEM
13 Principal Accountant Fees
and Services
For
information concerning principal accountant fees and services as well as related
pre-approval policies, see “AUDITORS – Fees Paid to Independent Accountants” in
the Company’s Proxy Statement, which is incorporated by reference.
ITEM
14 Exhibits and Financial
Statement Schedules
(a)(1)(2) See
Index to Consolidated Financial Statements filed under Item 7 of this
report.
All other
schedules to the financial statements required by Regulation S-X are omitted
because they are not applicable, not material, or because the information is
included in the financial statements or related notes.
(a)(3) Exhibit
Index
Exhibit
| 3.1 | Amended and Restated Articles of Incorporation (1) |
|
3.2
|
Amended
and Restated Bylaws (2)
|
|
10.1
|
1999
Employee Stock Option Plan (3)
|
|
10.2
|
1999
Director’s Stock Option Plan (3)
|
|
10.3
|
Amended
2006 Stock Option and Equity Compensation Plan (4)
|
|
10.4
|
Form
of Restricted Stock Award Agreement (5)
|
|
10.5
|
Form
of Stock Option Award Agreement (5)
|
|
10.6
|
Form
of Restricted Stock Unit Agreement (5)
|
|
10.7
|
Form
of Stock Appreciation Rights Agreement (5)
|
|
10.8
|
Change
of Control/Salary Continuation Agreement for Michael Reynolds
(6)
|
|
10.9
|
Change
of Control/Salary Continuation Agreement for Daniel Hempy
(6)
|
|
10.10
|
Change
of Control/Salary Continuation Agreement for Basant Singh
(7)
|
|
10.11
|
Executive
Employment Agreement for Roger Busse (8)
|
|
10.12
|
Executive
Employment Agreement for Hal Brown (8)
|
|
10.13
|
Amendment
to Executive Employment Agreement for Roger Busse (9)
|
|
10.14
|
Amendment
to Executive Employment Agreement for Hal Brown (9)
|
|
10.15
|
NWB
Financial Corporation Employee Stock Option Plan (10)
|
|
10.16
|
NWB
Financial Corporation Director Stock Option Plan (10)
|
|
10.17
|
Director
Fee Schedule (11)
|
|
10.18
|
Director
Stock Trading Plan (8)
|
|
10.19
|
Form
of Common Stock Purchase Agreement between the Company and each of the
Purchasers, dated as of January 6, 2009 (12)
|
|
10.20
|
Form
of Registration Rights Agreement between the Company and each of the
Purchasers, dated as of January 6, 2009 (12)
|
|
14
|
Code
of Ethics for Senior Financial Officers and Principal Executive Officer
(8)
|
|
23.1
|
Consent
of Moss Adams L.L.P
|
|
24.1
|
Power
of Attorney (included on signature page to this report)
|
|
31.1
|
302
Certification, Hal Brown, Chief Executive Officer
|
|
31.2
|
302
Certification, Michael A. Reynolds, Executive Vice President and Chief
Financial Officer
|
|
32
|
Certifications
Pursuant to 18 U.S.C. Section
1350
|
-77-
|
(1)
|
Incorporated
by reference to Exhibit 3 of the Company’s Quarterly Report on Form 10-Q
for the Quarter ended June 30, 2007.
|
|
(2)
|
Incorporated
by reference to Exhibit 3.1 of the Company’s Quarterly Report on Form 10-Q
for the Quarter ended September 30, 2008.
|
|
(3)
|
Incorporated
by reference to Exhibits 99.1 - 99.4 of the Company’s S-8 Registration
Statement (File No. 333-109501).
|
|
(4)
|
Incorporated
by reference to Exhibit 10.3 to the Company’s Quarterly Report on Form
10-Q for the Quarter ended June 30, 2009.
|
|
(5)
|
Incorporated
by reference to Exhibits 99.1-99.5 of the Company’s Form S-8 Registration
Statement (File No. 333-134702).
|
|
(6)
|
Incorporated
by reference to Exhibits 10.3 and 10.4 of the Company’s Quarterly Report
on Form 10-Q for the Quarter ended March 31, 2005.
|
|
(7)
|
Incorporated
by reference to Exhibit 10.10 of the Registration Statement on Form S-4
(File No. 333-128968).
|
|
(8)
|
Incorporated
by reference to Exhibits 10.9, 10.10, and 10.14 of the Company’s Annual
Report on Form 10-K for the fiscal year ended December 31,
2007.
|
|
(9)
|
Incorporated
by reference to the Company’s Current Report on Form 8-K filed April 21,
2009.
|
|
(10)
|
Incorporated
by reference to Exhibits 99.1 and 99.2 of the Company’s Form S-8
Registration Statement (File No. 333-130886).
|
|
(11)
|
Incorporated
by reference to Exhibit 10.15 of the Company’s Annual Report on Form 10-K
for the fiscal year ended December 31, 2008.
|
|
(12)
|
Incorporated
by reference to Exhibits 10.1 and 10.2 of the Company’s Current Report on
Form 8-K filed January 8, 2009.
|
-78-
Pursuant
to the requirements of Section 13 or 15(d) of the Securities Exchange Act of
1934, the registrant has duly caused this report to be signed on its behalf by
the undersigned on March 15, 2010.
PACIFIC
CONTINENTAL CORPORATION
(Company)
By: /s/ Hal M.
Brown
Hal Brown
Chief Executive Officer
Power of
Attorney
Know all
persons by these presents, that each person whose signature appears below
constitutes and appoints Hal M. Brown and Michael A. Reynolds, and each of them,
as such person’s true and lawful attorneys-in-fact and agents, with full power
of substitution and resubstitution, for such person and in such person’s name,
place and stead, in any and all capacities, to sign any and all amendments to
the Report, and to file the same, with all exhibits thereto, and other documents
in connection therewith, with the Securities and Exchange Commission, granting
unto said attorneys-in-fact and agents, each of them, full power and authority
to do and perform each and every act and thing requisite necessary to be done in
connection therewith, as fully to all intents and purposes as such person might
or could do in person, hereby, ratifying and confirming that all said
attorneys-in-fact and agents, or any of them or their or such person’s
substitute or substitutes, may lawfully do or cause to be done by virtue
thereof.
Pursuant
to the requirements of the Securities Exchange Act of 1934, this report has been
signed below by the following persons on behalf of the Company and in the
capacities indicated on the 15th day of March, 2010.
Principal
Executive Officer
By /s/ Hal M.
Brown Chief
Executive Officer
Hal
Brown and
Director
Principal
Financial and Accounting Officer
By /s/ Michael A.
Reynolds Executive
Vice President and
Michael A.
Reynolds
Chief Financial
Officer
Remaining
Directors
By /s/ Robert A.
Ballin Chairman By /s/ Michael
Heijer Director
Robert A.
Ballin Michael
Heijer
By
/s/ Donald
G.
Montgomery Vice
Chairman By/s/ Michael D.
Holzgang Director
Donald G.
Montgomery Michael
D. Holzgang
By /s/ Cathi
Hatch
Director
By /s/ Donald L.
Krahmer, Jr. Director
Cathi
Hatch Donald L.
Krahmer, Jr.
By /s/ Michael S.
Holcomb Director
By /s/ John H.
Rickman Director
Michael
S.
Holcomb
John H. Rickman
-79-
I, Hal
Brown, certify that:
|
1.
|
I
have reviewed this Form 10-K of Pacific Continental
Corporation;
|
|
2.
|
Based
on my knowledge, this report does not contain any untrue statement of a
material fact or omit to state a material fact necessary to make the
statements made, in light of the circumstances under which such statements
were made, not misleading with respect to the period covered by this
report;
|
|
3.
|
Based
on my knowledge, the financial statements, and other financial information
included in this report, fairly present in all material respects the
financial condition, results of operations and cash flows of the
registrant as of, and for, the periods presented in this
report;
|
|
4.
|
The
registrant's other certifying officer(s) and I are responsible for
establishing and maintaining disclosure controls and procedures (as
defined in Exchange Act Rules 13a-15(e) and 15d-15(e)) and internal
control over financial reporting (as defined in Exchange Act Rules
13a-15(f) and 15d-15(f)) for the registrant and
have:
|
|
|
(a)
|
Designed
such disclosure controls and procedures, or caused such disclosure
controls and procedures to be designed under our supervision, to ensure
that material information relating to the registrant, including its
consolidated subsidiaries, is made known to us by others within those
entities, particularly during the period in which this report is being
prepared;
|
|
|
(b)
|
Designed
such internal control over financial reporting, or caused such internal
control over financial reporting to be designed under our supervision, to
provide reasonable assurance regarding the reliability of financial
reporting and the preparation of financial statements for external
purposes in accordance with generally accepted accounting
principles;
|
|
|
(c)
|
Evaluated
the effectiveness of the registrant's disclosure controls and procedures
and presented in this report our conclusions about the effectiveness of
the disclosure controls and procedures, as of the end of the period
covered by this report based on such evaluation;
and
|
|
|
(d)
|
Disclosed
in this report any change in the registrant’s internal control over
financial reporting that occurred during the registrant’s most recent
fiscal quarter (the registrant’s fourth fiscal quarter in the case of an
annual report) that has materially affected, or is reasonably likely to
materially affect, the registrant’s internal control over financial
reporting; and
|
|
5.
|
The
registrant's other certifying officer(s) and I have disclosed, based on
our most recent evaluation of internal control over financial reporting,
to the registrant's auditors and the audit committee of the registrant's
board of directors (or persons performing the equivalent
functions):
|
|
|
(a)
|
All
significant deficiencies and material weaknesses in the design or
operation of internal control over financial reporting which are
reasonably likely to adversely affect the registrant’s ability to record,
process, summarize and report financial information;
and
|
|
|
(b)
|
Any
fraud, whether or not material, that involves management or other
employees who have a significant role in the registrant's internal control
over financial reporting.
|
|
Date: March
15, 2010
|
/s/ Hal Brown
|
|
Hal
Brown, Chief Executive Officer
|
-80-
CERTIFICATION
I,
Michael A. Reynolds, certify that:
|
1.
|
I
have reviewed this Form 10-K of Pacific Continental
Corporation;
|
|
2.
|
Based
on my knowledge, this report does not contain any untrue statement of a
material fact or omit to state a material fact necessary to make the
statements made, in light of the circumstances under which such statements
were made, not misleading with respect to the period covered by this
report;
|
|
3.
|
Based
on my knowledge, the financial statements, and other financial information
included in this report, fairly present in all material respects the
financial condition, results of operations and cash flows of the
registrant as of, and for, the periods presented in this
report;
|
|
4.
|
The
registrant's other certifying officer(s) and I are responsible for
establishing and maintaining disclosure controls and procedures (as
defined in Exchange Act Rules 13a-15(e) and 15d-15(e)) and internal
control over financial reporting (as defined in Exchange Act Rules
13a-15(f) and 15d-15(f)) for the registrant and
have:
|
|
|
(a)
|
Designed
such disclosure controls and procedures, or caused such disclosure
controls and procedures to be designed under our supervision, to ensure
that material information relating to the registrant, including its
consolidated subsidiaries, is made known to us by others within those
entities, particularly during the period in which this report is being
prepared;
|
|
|
(b)
|
Designed
such internal control over financial reporting, or caused such internal
control over financial reporting to be designed under our supervision, to
provide reasonable assurance regarding the reliability of financial
reporting and the preparation of financial statements for external
purposes in accordance with generally accepted accounting
principles;
|
|
|
(c)
|
Evaluated
the effectiveness of the registrant's disclosure controls and procedures
and presented in this report our conclusions about the effectiveness of
the disclosure controls and procedures, as of the end of the period
covered by this report based on such evaluation;
and
|
|
|
(d)
|
Disclosed
in this report any change in the registrant’s internal control over
financial reporting that occurred during the registrant’s most recent
fiscal quarter (the registrant’s fourth fiscal quarter in the case of an
annual report) that has materially affected, or is reasonably likely to
materially affect, the registrant’s internal control over financial
reporting; and
|
|
5.
|
The
registrant's other certifying officer(s) and I have disclosed, based on
our most recent evaluation of internal control over financial reporting,
to the registrant's auditors and the audit committee of the registrant's
board of directors (or persons performing the equivalent
functions):
|
|
|
(a)
|
All
significant deficiencies and material weaknesses in the design or
operation of internal control over financial reporting which are
reasonably likely to adversely affect the registrant’s ability to record,
process, summarize and report financial information;
and
|
|
|
(b)
|
Any
fraud, whether or not material, that involves management or other
employees who have a significant role in the registrant's internal control
over financial reporting.
|
Date: March
15,
2010 /s/ Michael A.
Reynolds
Michael
A. Reynolds, Executive Vice President & CFO
-81-
CERTIFICATION
PURSUANT TO
18
U.S.C. SECTION 1350,
AS
ADOPTED PURSUANT TO
SECTION
906 OF THE SARBANES-OXLEY ACT OF 2002
In
connection with the Annual Report of Pacific Continental Corporation (the
“Company”) on Form 10-K for the period ended December 31, 2009 as filed with the
Securities and Exchange Commission on the date hereof (the “Report”), we, Hal M.
Brown, Chief Executive Officer, and Michael A. Reynolds, Chief Financial
Officer, certify, pursuant to 18 U.S.C. Section 1350, as adopted pursuant to
Section 906 of the Sarbanes-Oxley Act of 2002, that to our
knowledge:
|
(1)
|
The
Report fully complies with the requirements of Section 13(a) or 15(d) of
the Securities Exchange Act of 1934;
and
|
|
(2)
|
The
information contained in the Report fairly presents, in all material
respects, the financial condition and results of operations of the
Company.
|
|
/s/ Hal M. Brown
|
/s/ Michael A. Reynolds
|
|
Hal
M. Brown
|
Michael
A. Reynolds
|
|
Chief
Executive Officer
|
Chief
Financial Officer
|
Dated: March
15, 2010
-82-