Attached files
Table of Contents
Index to Financial Statements
UNITED STATES
SECURITIES AND EXCHANGE COMMISSION
Form 10-K
| x | ANNUAL REPORT UNDER SECTION 13 OR 15(d) OF THE SECURITIES EXCHANGE ACT OF 1934 |
For the fiscal year ended December 31, 2009
Commission file number 001-32977
GMX RESOURCES INC.
(Exact name of registrant as specified in its charter)
| Oklahoma | 73-1534474 | |
| (State or other jurisdiction of incorporation or organization) |
(I.R.S. Employer Identification No.) | |
| 9400 North Broadway, Suite 600, Oklahoma City, Oklahoma |
73114 | |
| (Address of principal executive offices) | (Zip Code) | |
(Registrant’s telephone number, including area code) (405) 600-0711
Securities registered under Section 12(b) of the Exchange Act:
| Title of Class |
Name of Exchange on Which Registered | |
| Common Stock, $0.001 par value |
New York Stock Exchange | |
| Series B Cumulative Preferred Stock, $0.001 par value |
New York Stock Exchange | |
| Series A Preferred Stock Purchase Rights |
New York Stock Exchange |
Securities registered under Section 12(g) of the Exchange Act: None
Indicate by check mark if registrant is a well-known seasoned issuer, as defined in Rule 405 of the Securities Act. Yes ¨ No x
Indicate by check mark if registrant is not required to file reports pursuant to Section 13 or Section 15(d) of the Act. Yes ¨ No x
Indicate by check mark whether the registrant (1) has filed all reports required to be filed by Section 13 or 15(d) of the Securities Exchange Act of 1934 during the preceding 12 months (or for such shorter period that the registrant was required to file such reports), and (2) has been subject to such filing requirements for the past 90 days. Yes x No ¨
Indicate by check mark whether the registrant has submitted electronically and posted on its corporate Web site, if any, every Interactive Data File required to be submitted and posted pursuant to Rule 405 of Regulation S-T (§232.405 of this chapter) during the preceding 12 months (or for such shorter period that the registrant was required to submit and post such files). Yes ¨ No ¨
Indicate by check mark if disclosure of delinquent filers pursuant to Item 405 of Regulation S-K (§229.405 of this chapter) is not contained herein, and will not be contained, to the best of registrant's knowledge, in definitive proxy or information statements incorporated by reference in Part III of this Form 10-K or any amendment to this Form 10-K. ¨
Indicate by check mark whether the registrant is a large accelerated filer, an accelerated filer, a non-accelerated filer, or a smaller reporting company. See definition of “large accelerated filer”, “accelerated filer” and “smaller reporting company” in Rule 12b-2 of the Exchange Act. Check one:
| Large accelerated filer ¨ | Accelerated filer x | |
| Non-accelerated filer ¨ | Smaller reporting company ¨ |
Indicate by check mark whether the registrant is a shell company (as defined in Rule 12b-2 of the Act) Yes ¨ No x
State the aggregate market value of the voting and non-voting common equity held by non-affiliates computed by reference to the price at which the common equity was last sold, or the average bid and asked prices of such common equity, as of the last business day of the registrant’s most recently completed second fiscal quarter. As of June 30, 2009 aggregate market value was $242,242,316.
Indicate the number of shares outstanding of each of the registrant’s classes of common stock, as of the latest practicable date: As of March 3, 2010, there were 30,714,968 shares of Common Stock, par value $0.001 per share, outstanding, which included 2,640,000 shares under a share loan which will be returned to the registrant upon conversion or maturity of certain outstanding convertible notes.
DOCUMENTS INCORPORATED BY REFERENCE: Portions of the Company’s definitive proxy statement for its 2010 annual meeting of shareholders are incorporated into Part III of this Form 10-K by reference.
Table of Contents
Index to Financial Statements
GMX RESOURCES INC.
Form 10-K
| Page | ||||
| 1 | ||||
| Item 1. |
1 | |||
| Item 1A. |
20 | |||
| Item 1B. |
28 | |||
| Item 2. |
28 | |||
| Item 3. |
28 | |||
| Item 4. |
28 | |||
| 29 | ||||
| Item 5. |
29 | |||
| Item 6. |
31 | |||
| Item 7. |
Management's Discussion and Analysis of Financial Condition and Results of Operation |
32 | ||
| Item 7A. |
48 | |||
| Item 8. |
49 | |||
| Item 9. |
Changes in and Disagreements With Accountants on Accounting and Financial Disclosure |
49 | ||
| Item 9A. |
49 | |||
| Item 9B. |
53 | |||
| 54 | ||||
| 55 | ||||
| Item 15. |
55 | |||
Table of Contents
Index to Financial Statements
| Item 1. | Business |
General
GMX Resources Inc. (“GMX”) and its subsidiaries (collectively, the “Company”) is a “pure play” independent oil and natural gas exploration and production company focused on development of unconventional Haynesville/Bossier Shale and Cotton Valley Sands in the Sabine Uplift of the Carthage, North Field of Harrison and Panola counties of East Texas (our “core area”). We state that we are a “pure play” company because materially all of our business is devoted to drilling for and producing oil and natural gas in one core area.
We have three subsidiaries, Diamond Blue Drilling Co. (“Diamond Blue”), which owns three conventional drilling rigs in our core area, Endeavor Pipeline Inc. (“Endeavor Pipeline”), which operates our natural gas gathering system in our core area and Endeavor Gathering, LLC (“Endeavor Gathering”), which owns the natural gas gathering system and related equipment operated by Endeavor Pipeline. A 40% interest in Endeavor Gathering is owned by Kinder Morgan Endeavor LLC (“KME”).
Our principal executive office is located at 9400 North Broadway, Suite 600, Oklahoma City, Oklahoma, 73114 and our telephone number is (405) 600-0711.
History
We were incorporated in 1998 and acquired producing and undeveloped oil and natural gas properties located primarily in our core area, Kansas, and southeastern New Mexico from a bankruptcy liquidation of a small, privately-held company. We have leased additional undeveloped acreage and drilled wells in our core area since 1998. We have since sold the Kansas properties and concentrated our efforts in our core area, primarily since 2003 when we entered into a joint development agreement with Penn Virginia Oil & Gas, L.P. (“PVOG”), a wholly-owned subsidiary of Penn Virginia Corporation (NYSE: PVA). Although the area of mutual interest portion of this joint development agreement has expired, we continue to own acreage in our core area jointly with PVOG. We have drilled approximately 350 vertical and three horizontal Cotton Valley Sands wells in addition to Travis Peak Sand wells. In the fall of 2008, we transitioned into drilling horizontal wells into the Haynesville/Bossier Shale and as of December 31, 2009, had drilled and completed 12 Haynesville/Bossier Shale horizontal (“H/B Hz”) wells. Today we have three rigs drilling H/B Hz wells.
Strategy
Our near-term primary objective is to focus on the continued horizontal well development of our Haynesville/Bossier Shale acreage in East Texas and to selectively increase our leasehold position within our core area. In addition to the Haynesville/Bossier Shale horizontal well development, we intend to resume drilling Cotton Valley Sands horizontal wells on a limited basis in the next two years. Our near-term strategy emphasizes:
| • | Developing our existing Haynesville/Bossier Shale acreage—We seek to maximize the value of our existing assets by developing our properties that we believe will result in the highest rate of return and that we also believe exhibit the lowest risk and the highest production and reserve growth potential. We intend to concentrate on developing our multi-year inventory of drilling locations in the Haynesville/Bossier Shale because we believe this reservoir fits those parameters. We estimate that we have approximately 280 net potential Haynesville/Bossier Shale horizontal drilling locations on 80 acre spacing in central and eastern Harrison and Panola Counties in East Texas, which is approximately a 10 year inventory. |
| • | Maintaining operational control with focus on reducing operating costs—We operate approximately 80% of our proved reserves and have consistently operated with one of the lower operating cost |
1
Table of Contents
Index to Financial Statements
| structures in the industry. Our per unit lease operating expenses have declined from $1.17 per Mcfe for the year ended December 31, 2008 to $0.86 per Mcfe for the year ended December 31, 2009. These results relate primarily to cost control measures implemented in 2009 and an increase in production from Haynesville/Bossier Shale wells. We anticipate that our per unit operating costs will continue to decline as we continue to develop our Haynesville/Bossier Shale rights and our horizontal Haynesville/Bossier Shale production becomes a greater percentage of our overall production. |
| • | Utilizing an integrated model approach in our core area—We operate a significant amount of drilling and gathering infrastructure in our core area, which allows us to better control the drilling, physical gathering, marketing and delivery options for the sale of our natural gas and oil. We plan to continue pursuing the best markets for the sale of our production and, through Endeavor Gathering, prudently expanding our infrastructure to keep pace with increasing production volumes as we develop our Haynesville/Bossier Shale acreage. |
| • | Actively protecting production to provide greater certainty of cash flow and earnings—To help protect our revenues, we currently have hedging instruments in place for 2010 for 13.3 million MMBtu, or approximately 77% of our estimated annual natural gas and crude oil production as of December 31, 2009, at an average floor price of $6.43 per Mcfe. Excluding sold calls, for 2011 and 2012, we have hedged approximately 14.9 million MMBtu and 16.7 million MMBtu of natural gas at a weighted average floor price of $6.14 and $6.08 per MMbtu, respectively. We plan to continue to use hedging to mitigate commodity price risks and protect our cash flow. |
| • | Opportunistically acquiring acreage in our core area—We continue to look to increase our acreage position in the Haynesville/Bossier Shale, particularly in Harrison and Panola Counties in East Texas where we have significant field operations including high and low pressure gathering systems capable of transporting natural gas produced from the Haynesville/Bossier Shale. We continue to concentrate our efforts in areas where we can apply our technical expertise and where we have significant operational control or experience. We plan to continue to expand our Haynesville/Bossier Shale leasehold position beyond our current drilling inventory by adding acreage with similar drilling potential and characteristics to our existing properties. |
Company Strengths
Large, contiguous, high quality acreage position. We hold approximately 70,900 gross acres (50,200 net acres) of leasehold, of which approximately 61,900 gross acres (42,400 net acres) are located in the Haynesville/Bossier Shale resource play in East Texas. As of December 31, 2009, we had drilled and completed twelve successful horizontal Haynesville/Bossier Shale wells with production profiles that support our strategy of continued and focused development of this play on our leasehold. We have approximately 280 net potential undrilled Haynesville/Bossier Shale locations in central and eastern Harrison and Panola counties in East Texas that are near acreage actively being drilled by ourselves and other operators. Furthermore, 19 vertical test wells that we drilled across our properties in 2006 confirmed a consistent 350-foot layer of Haynesville/Bossier Shale to be present, which we believe has substantially reduced the risk associated with our Haynesville/Bossier Shale leasehold. The Cotton Valley Sands resource play in which we operate is a mature and well-understood play. As a result, drilling results are highly stable and predictable. We have a track record of drilling success in our core area with a 100% drilling success rate since the inception of our Company. Substantially all of our Haynesville/Bossier Shale acreage is held by production from our shallower Cotton Valley Sands, Travis Peak and Hosston wells, which gives us the ability to drill where we choose without significant risk of lease expiration.
High degree of operational control. We operate over 80% of our acreage in our core area, which permits us to better manage our operating costs and better control capital expenditures and the timing of development and exploitation activities.
Strong growth profile with significant drilling inventory. We have an inventory of approximately 280 net potential undrilled proved and unproved Haynesville/Bossier Shale drilling locations and approximately 1,400
2
Table of Contents
Index to Financial Statements
net potential undrilled proved and unproved Cotton Valley Sands drilling locations as of December 31, 2009. This large drilling inventory provides us with the potential to continue to exhibit significant organic reserve and production growth. During the five-year period ending December 31, 2009, we grew proved reserves and production at compounded annual growth rates of 41% and 62%, respectively.
Membership in two Haynesville/Bossier Shale consortiums provides us with valuable completion, reserve, and geological information. We are members of the Core Laboratories Haynesville Shale Consortium and the Object Reservoir Haynesville Consortium. The purpose of these consortiums is to share with their members timely information regarding the geological formation, well spacing and completion design information that will lead to maximizing well and reserve performance and our investments in these wells. The consortiums are a cost effective method to learn about the reservoir and trends by other operators and to accelerate the “learning curve” for the members in the consortiums.
Significant infrastructure in place. As of December 31, 2009, we had priority access to approximately 120 miles of gathering pipeline, 115 MMcf per day of takeaway capacity and 22,500 horsepower of compression. We also own salt-water disposal and other field infrastructure as well as three drilling rigs, two of which have the capacity to drill horizontal Haynesville/Bossier Shale wells. Based on our year end 2009 average daily gross production rate of 37.3 MMcfe per day and our takeaway capacity of 115 MMcf per day as of December 31, 2009, we believe our current infrastructure has sufficient capacity to support material growth in production. In November 2009, we contributed our gathering and compression assets to Endeavor Gathering for $36 million as part of a transaction with KME, but we have obtained commitments from Endeavor Gathering for priority rights to its takeaway capacity.
Favorable economics through access to multiple delivery points. Our existing gathering infrastructure provides us with options in determining the delivery points at which we sell our production, which allows us to take advantage of price differentials among those delivery points. Due at least in part to these options, our net realized price for natural gas volumes sold, including sales of processed liquids, and excluding the effects of hedging, was 100% of the 12 month average first-day-of-the-month NYMEX spot price for calendar year 2009.
East Texas
As of December 31, 2009, we owned 403 gross (252 net) producing wells. In our East Texas core area 325 gross (188 net) wells are Cotton Valley Sands wells at depths of 8,000 to 12,000 feet and 45 gross (37 net) wells are productive in the shallower conventional Rodessa, Travis Peak, Hosston and Pettit formations in our core area. In addition, we had 12 gross (11.9 net) Haynesville/Bossier Shale horizontal wells producing at year-end 2009. We have historically grown by developing in our core area with a high degree of drilling success and with low finding and development costs. “Finding and development costs” is defined in “Certain Technical Terms”. The Cotton Valley Sands is considered to be an unconventional natural gas resource that is pervasive throughout large areas, which explains our historical drilling success in this formation. At December 31, 2009, we had 355.3 Bcfe of proved reserves, which were 94% natural gas, 38% proved developed and more than 98% located in our core area.
We presently are focusing a majority of our development efforts on the Haynesville/Bossier Shale areas. As of December 31, 2009, we have approximately 280 net proved and unproved Haynesville/Bossier Shale drilling locations (based on 80 acre well spacing) in Harrison and Panola Counties, Texas surrounded by our existing wells and other operators drilling Haynesville/Bossier Shale wells. We are continuing to see improving Haynesville/Bossier Shale results in East Texas, including Harrison County.
As of December 31, 2009, we had approximately 62,500 gross and 42,600 net acres in the Cotton Valley Sands formation, with approximately 290 net undrilled proved undeveloped Cotton Valley Sands drilling locations based on 20-acre well spacing.
3
Table of Contents
Index to Financial Statements
Our core area properties accounted for more than 98% of our total proved reserves at December 31, 2009, 93% of our total net acreage and 98% of our 2009 production.
We operate 164 wells or 43% of our core area gross wells that produce 70% of our oil and natural gas production, as of December 31, 2009. Average daily net operated plus non-operated production in 2009 was 35.4 MMcf of gas and 325 Bbls of oil. The producing lives of these fields are generally between 12 to 70 years with a majority of the gas produced in the first ten years. Cotton Valley Sands gas sold from the area has a high MMBtu content, which after processing, can result in a net price above average daily Henry Hub natural gas prices. Oil is sold separately at a slight discount to the average Sweet Crude oil price at Cushing, Oklahoma (the NYMEX delivery point), inclusive of deductions. The acreage in East Texas lies on the Sabine Uplift, a broad positive feature that acts as a structural trap for most reservoirs. Most of the reservoirs are shallow and deep marine sediments that tend to have tremendous aerial extent and substantial thicknesses. Natural gas and oil have been produced from 3,000 feet to 11,700 feet in our core area. Prior to shifting our focus to the Haynesville/Bossier Shale, the primary objective of our development was the Cotton Valley Sands, which occurs between 8,200 feet and 10,000 feet and contains multiple layers of sands containing natural gas. Due to the multiple layers and widespread deposition of these gas saturated layers, we have a very high success rate of finding commercial wells.
The following table sets forth the gross and net wells drilled and/or completed in our core area in 2009:
| Wells Drilled & Completed 2009 | ||||
| Gross | Net | |||
| Cotton Valley Sands |
1.0 | 1.0 | ||
| Haynesville/Bossier Shale Horizontal |
12.0 | 11.9 | ||
| Other Shallower formations |
4.0 | 4.0 | ||
| Total |
17.0 | 16.9 | ||
In early 2006, we drilled and completed 19 vertical Haynesville/Bossier Shale wells across our property base. The exploratory work found a gas rich unconventional reservoir below the Cotton Valley Sands. We determined from these tests that the reservoirs had consistent open hole log characteristics across all of our acreage in Harrison and Panola counties. We did extensive open hole logging, coring and a variety of completion methods that determined, in our view, a viable horizontal unconventional candidate. We subsequently joined the Core Laboratories Haynesville Gas Shale Consortium (with approximately 50 other E&P companies) to share technical data with other operators about horizontal shale development. In early 2008, several E&P companies achieved great success in Haynesville/Bossier Shale horizontal exploration near our properties. We determined the Haynesville/Bossier Shale horizontal potential on our properties to be of greater value than the Cotton Valley Sands and gathered the resources necessary to begin Haynesville/Bossier Shale horizontal development. We were also the first company to join the Core Laboratories Haynesville/Bossier Shale Consortium.
In 2009, we funded our drilling and development activity of $179.3 million in our core area with proceeds of a $86 million offering of 4.50% convertible senior notes due 2015 in October 2009, a $65 million common stock offering in May 2009, a $104 million common stock offering in October 2009, and the sale of a non-controlling, minority interest in Endeavor Gathering for $36 million in November 2009, along with proceeds from borrowings on our revolving bank credit facility and cash flow from operations.
4
Table of Contents
Index to Financial Statements
The following table sets forth our proved undeveloped locations in our core area as of December 31, 2009:
| Proved Undeveloped Locations | ||||
| Gross | Net | |||
| Operated |
233 | 233 | ||
| 50% joint venture with PVOG |
98 | 49 | ||
| Total |
331 | 282 | ||
The operated area does not include 36 Haynesville/Bossier Shale undeveloped locations at December 31, 2009 that were determined to be uneconomic based on recent amendments to Regulations S-K and S-X of the Securities and Exchange Commission (“SEC”), which require the use of an average price for the last 12 months when determining reserve estimates. Had the year-end Henry Hub cash price been used, as in 2008, these 36 Haynesville/Bossier Shale undeveloped locations would have been considered proved undeveloped locations at December 31, 2009. See Oil and Natural Gas Reserves.
The pace of future development of this property will depend on availability of capital, future drilling and completion results, the general economic conditions of the energy industry and on the price we receive for the natural gas and crude oil produced. Additionally, in certain areas in which we own our interest jointly with PVOG, the pace of future development will depend on PVOG’s level of activity in those areas. Based on the joint development agreement, we have the ability to limit the number of rigs that PVOG operates in these areas and we have the ability to limit our participation in any PVOG well.
The number of wells we drill in 2010 will vary, and our potential capital expenditures may vary depending on the number of wells drilled, drilling and completion results and other factors. We have budgeted $175 million for capital expenditures in 2010, which is for Haynesville/Bossier Shale and Cotton Valley Sands horizontal drilling, acreage acquisitions, developing gathering systems infrastructure and other capital expenditures. We plan on drilling approximately 22 horizontal wells in 2010, of which 20 will be Haynesville/Bossier Shale horizontal wells, and two will be Cotton Valley Sands horizontal wells. We will fund our drilling expenses primarily from cash on the balance sheet at December 31, 2009, internal cash flow and borrowings under our revolving bank credit facility.
Other Properties
We have approximately 2,400 gross (2,100 net) acres in the Waskom Field in Caddo parish in Louisiana with five gross (2.6 net) producing wells, three of which we operate. We also have properties located in Lea and Roosevelt counties, New Mexico, consisting of approximately 1,920 gross (1,458 net) acres with nine gross (5.7 net) non-operated producing wells. Total reserves and production from these areas represent less than 2% of our proved reserves and 2009 production. We are not actively pursuing additional development of the New Mexico properties.
2010 Plans and Recent Developments
On February 16, 2010, we announced the completion of the Mia Austin #1H Haynesville/Bossier Shale horizontal well with an initial production rate of 14.1 Mcf per day. The well has 4 1/2” casing and a 4,600 foot lateral, with 12 frac stages and was flowing on a 20/64 choke with 5,492 pounds of Flowing Casing Pressure.
Recently, we have changed our production casing size from 4 1/2” to 5 1/2” to allow our completion treatments to be run at higher rates and with additional proppant. We expect to improve completion results with this change and completed well costs are expected to be approximately $8 million on the first few 5 1/2” cased wells. Completed well costs are expected to trend lower due to improved efficiencies throughout the year to approximately $7 million.
5
Table of Contents
Index to Financial Statements
As of December 31, 2009, there were two Helmerich & Payne (“H&P”) FlexRigs™ drilling our operated acreage, which are on three year contracts for long-term use. One additional three year H&P FlexRig™ contract began in January 2010. A fourth three year H&P FlexRig™ contract is scheduled to begin in March 2010, but due to the demand for this type of H&P FlexRig™, we are actively looking to sublease the fourth rig for a six to twelve month contract. Our 2010 capital expenditure budget of approximately $175 million is based on a three rig drilling program and paying a laydown fee on the fourth rig until we see what we believe to be a long term improvement in natural gas prices that will support our drilling program.
Gas Gathering
We have, through our majority-owned subsidiary, Endeavor Gathering, gas gathering lines and compression equipment for gathering and delivery of natural gas from our core area that we operate. As of December 31, 2009, we had invested approximately $60 million in this gathering system, including the purchase of compressors and pipe inventory, which consisted of approximately 120 miles of gathering lines and compressors that collect and compress gas from approximately 99% of our operated gas production from wells in our core area. At year end 2009, this gas gathering system had takeaway capacity of 115 MMcf per day compared to our year end gross production volumes of 37.3 MMcfe per day. This system enables us to improve the control over our production and enhances our ability to obtain access to pipelines for ultimate sale of our gas. At present, Endeavor Gathering only gathers from wells in which we own an interest. Remaining gas is gathered by unrelated third parties. See “Business—Marketing.”
PVOG has installed and operates gathering facilities to each of the wells drilled and operated by PVOG in our jointly-owned areas. PVOG charges us a gathering fee of $0.10/MMBtu and actual cost of compression plus five percent for all gas gathered at the wellhead and redelivered to a central sales point. At year end 2009, the PVOG gathering system had takeaway capacity of 80 MMcf per day compared to production of 20.7 MMcf per day.
Diamond Blue Drilling
Our subsidiary, Diamond Blue, owns three drilling rigs as described below:
| Depth Capacity (Feet) |
Drawworks Horsepower |
Horizontal Capability | ||||
| DBD #7 |
11,000 | 1,000 HP | No | |||
| DBD #9 |
15,000 | 1,200 HP | Yes | |||
| DBD #11 |
14,000 | 1,000 HP | Yes |
We have approximately $30.5 million invested in these rigs, which have been used to drill exclusively on our 100% owned acreage. The ownership of rigs enables us to better control drilling costs and protects us from rig availability risks when rigs are in high demand. However, due to the decline in natural gas prices and our long-term drilling contracts for four rigs from H&P, we laid these rigs down in 2009. The rigs will likely not be returned to operation until natural gas prices increase and capital is available to accelerate our drilling program.
6
Table of Contents
Index to Financial Statements
Oil and Natural Gas Reserves
As of December 31, 2009, MHA Petroleum Consultants, Inc. (“MHA”) estimated our proved reserves to be 355.3 Bcfe. A copy of MHA’s report is included as an exhibit to this Annual Report on Form 10-K. An estimated 133.3 Bcfe is expected to be produced from existing wells and another 222.0 Bcfe is classified as proved undeveloped. Substantially all of our proved reserves relate to our Cotton Valley Sands development based on SEC rules. All of our proved undeveloped reserves are on locations that are adjacent to wells productive in the same formations.
In December 2008, the SEC issued its final rule, Modernization of Oil and Gas Reporting, which is effective for reporting 2009 reserve information. In January 2010, the FASB issued its authoritative guidance on extractive activities for oil and gas to align its requirements with the SEC’s final rule. We adopted the guidance as of December 31, 2009 in conjunction with our year-end reserve report as a change in accounting principle. Under the SEC’s final rule, prior period reserves were not restated. The primary impacts of the SEC’s final rule include:
| • | the use of the twelve-month average of the first-day-of-the-month reference prices (prior to adjustment for location and quality differentials) of $61.18 per Bbl for oil and $3.87 per MMBtu for natural gas compared to the year-end reference prices (prior to adjustment for location and quality differentials) of $79.36 per Bbl for oil and $5.79 per MMBtu for natural gas resulted in negative revisions of 16 Bcfe. |
| • | certain of our undeveloped locations are not scheduled to be developed within five years which had the impact of reducing our proved undeveloped reserves by 25 Bcfe. |
| • | applying the same pricing methodology that was in effect for 2008 in 2009 would have resulted in the recognition of an additional 99 Bcfe in reserves at December 31, 2009. |
7
Table of Contents
Index to Financial Statements
The following table shows the estimated net quantities of our proved reserves as of the dates indicated and the Estimated Future Net Revenues and Present Values attributable to total proved reserves at December 31. All our proved reserves are located in the United States:
| 2007 | 2008 | 2009 | |||||||
| Proved Developed: |
|||||||||
| Gas (Bcf) |
144.2 | 150.6 | 124.6 | ||||||
| Oil (MMBbls) |
1.8 | 1.9 | 1.4 | ||||||
| Total (Bcfe) |
155.0 | 162.1 | 133.3 | ||||||
| Proved Undeveloped: |
|||||||||
| Gas (Bcf) |
262.1 | 284.7 | 208.6 | ||||||
| Oil (MMBbls) |
2.9 | 3.1 | 2.3 | ||||||
| Total (Bcfe) |
279.5 | 303.2 | 222.0 | ||||||
| Total Proved: |
|||||||||
| Gas (Bcf) |
406.3 | 435.3 | 333.2 | ||||||
| Oil (MMBbls) |
4.7 | 5.0 | 3.7 | ||||||
| Total (Bcfe) |
434.5 | 465.3 | 355.3 | ||||||
| Estimated Future Net Revenues1 ($MM) |
$ | 1,896.3 | $ | 1,012.3 | $ | 625.7 | |||
| Present Value1 ($MM) |
$ | 592.8 | $ | 280.7 | $ | 188.6 | |||
| Standardized Measure1 ($MM) |
$ | 427.7 | $ | 228.8 | $ | 188.6 | |||
| 1 | For 2007 and 2008, prices used in calculating Estimated Future Net Revenues and the Present Value were determined using prices as of period end. For 2009, prices used for Estimated Future Net Revenues and the Present Value are an average first-day of the month price for the last 12 months in accordance with recent amendments to Regulations S-K and S-X of the SEC. Estimated Future Net Revenues and the Present Value give no effect to federal or state income taxes attributable to estimated future net revenues. The Present Value or PV-10 represents the discounted future net cash flows attributable to our proved oil and gas reserves before income tax, discounted at 10%. PV-10 may be considered a non-GAAP financial measure as defined by the SEC. We believe that the Estimated Future Net Revenue and Present Value are useful measures in addition to the standardized measure as it assists in both the determination of future cash flows of the current reserves as well as in making relative value comparisons among peer companies. See “Note N—Supplemental Information on Oil and Natural Gas Operations” in our consolidated financial statements for information about the standardized measure of discounted future net cash flows. The standardized measure is dependent on the unique tax situation of each individual company, while the pre-tax Present Value is based on prices and discount factors that are consistent from company to company. We also understand that securities analysts use this measure in similar ways. |
Proved oil and natural gas reserves are the estimated quantities of crude oil and natural gas which geological and engineering data demonstrate with reasonable certainty to be recoverable in future years from known reservoirs under existing economic and operating conditions. Proved developed reserves are reserves that can be expected to be recovered through existing wells with existing equipment and operating methods. Proved undeveloped reserves are reserves that are expected to be recovered from new wells on undrilled acreage, or from existing wells where a relatively major expenditure is required for recompletion.
There are numerous uncertainties inherent in estimating quantities of proved crude oil and natural gas reserves. Crude oil and natural gas engineering is a subjective process of estimating underground accumulations of crude oil and natural gas that cannot be precisely measured. The accuracy of any reserve estimate is a function of the quality of available data and of engineering and geological interpretation and judgment. Results of drilling, testing and production subsequent to the date of the estimate may justify revision of such estimate. Accordingly, reserve estimates are often different from the quantities of crude oil and natural gas that are ultimately recovered.
In accordance with the guidelines of the SEC, our independent reserve engineer’s estimates of future net revenues from our properties, and the PV-10 and standardized measure thereof, were determined to be
8
Table of Contents
Index to Financial Statements
economically producible under existing economic conditions, which requires the use of the 12-month average price for each product, calculated as the unweighted arithmetic average of the first-day-of-the-month price for the period January 2009 through December 2009, except where such guidelines permit alternate treatment, including the use of fixed and determinable contractual price escalations. The average prices used in such estimates were $3.87 per MMbtu of natural gas and $61.19 per Bbl of crude oil. These prices do not include the impact of hedging transactions, nor do they include applicable transportation and quality differentials, nor price differentials between natural gas liquids and oil, which are deducted from or added to the index prices on a well by well basis.
The following table shows the sensitivity of our total 2009 proved reserves by area between the average prices used and the year end prices that would have been used had we applied the same pricing methodology that was in effect for 2007 and 2008 in 2009:
Proved Reserves—2009 SEC Pricing
| Area |
Oil (MMBbl) |
Natural Gas (Bcf) |
Total (Bcfe) |
% Proved Developed |
PV-10 ($ in millions) | |||||||
| Cotton Valley Sands & Other |
3.7 | 307.3 | 329.4 | 33 | % | $ | 155.8 | |||||
| Haynesville/Bossier Shale |
— | 25.9 | 25.9 | 91 | % | $ | 32.8 | |||||
| Total |
3.7 | 333.2 | 355.3 | 37 | % | $ | 188.6 | |||||
Proved Reserves—December 31, 2009 Pricing(1)
| Area |
Oil (MMBbl) |
Natural Gas (Bcf) |
Total (Bcfe) |
% Proved Developed |
PV-10 ($ in millions) | |||||||
| Cotton Valley Sands & Other |
3.8 | 317.3 | 340.2 | 35 | % | $ | 445.3 | |||||
| Haynesville/Bossier Shale |
— | 113.7 | 113.7 | 21 | % | $ | 81.5 | |||||
| Total |
3.8 | 431.0 | 453.9 | 31 | % | $ | 526.8 | |||||
| (1) | The December 31, 2009 Pricing scenario was based on the posted spot prices as of December 31, 2009 for both crude oil and natural gas. For oil, the spot price was $79.39 and was adjusted for quality, transportation fees, and regional price differentials. For natural gas volumes, the Henry Hub spot price of $5.79 per MMBTU was adjusted for energy content, transportation fees, regional price differences, and system shrinkage. |
The amendments to Regulations S-K and S-X of the SEC also revised the guidelines for reporting proved undeveloped reserves. Reserves may be classified as proved undeveloped if there is a high degree of confidence that the quantities will be recovered, and they are scheduled to be drilled within five years of their initial inclusion as proved reserves, unless specific circumstances justify a longer time. In addition, proved undeveloped reserves may be estimated through the use of reliable technology in addition to flow tests and production history.
Approximately 62% of our proved reserves are undeveloped under the new SEC rules. At the end of 2009, we, like other operators, reviewed all our existing proved undeveloped reserves in light of the SEC’s new five-year rule and decided to remove proved undeveloped reserves in the Cotton Valley Sands where we had 30% working interests in non-operated locations. None of these locations were actually beyond the five-year limit, but would have presented scheduling and capital priority issues under the new SEC guidelines going forward, especially in the context of our focus on the Haynesville/Bossier Shale and our substantial number of operated and 50% working interest non-operated Cotton Valley Sands proved undeveloped drilling locations. We still believe the removed locations to be geologically and economically viable. If the price environment should change for the better, we would consider accelerating this development. This determination to remove 30% working interest non-operated
9
Table of Contents
Index to Financial Statements
proved undeveloped locations resulted in the reduction of proved reserves by 53 Bcfe. The remaining proved undeveloped reserves correspond to Cotton Valley Sands drilling locations in both our operated area and areas where we have a 50% working interest in non-operated proved undeveloped drilling locations that are planned to be drilled within the next five years. We currently plan to resume Cotton Valley Sands drilling in 2011 using either a vertical or horizontal drilling program. The quantity and value of our proved undeveloped Cotton Valley Sands reserves are dependent upon our ability to fund the associated development costs, which were an estimated to be $307.4 million in the aggregate as of December 31, 2009. The estimated future development costs do not include exploration costs related to our Haynesville/Bossier Shale drilling program, which is estimated to be in the range of $175 million to $200 million per year based on a three rig drilling program. Based on our 2009 Haynesville/Bossier Shale drilling activity, we have 36 proved undeveloped Haynesville/Bossier Shale locations that were uneconomic at the SEC’s 2009 average first day of the month price and therefore, their associated development cost are not reflected in the $307.4 million of future development costs. We have examined all sources of available funding, including our expected operating cash flows, availability under our revolving bank credit facility, and potential future debt and equity issuances, and we are reasonably certain that we will be able to fund the necessary development costs for our proved undeveloped reserves over the next five years.
The estimates of proved reserves at December 31, 2007, 2008, and 2009 were prepared by our independent petroleum consultant, MHA, in accordance with generally accepted petroleum engineering and evaluation principles and definitions and guidelines established by the SEC. The technical persons responsible for preparing the reserve estimates presented herein meet the requirements regarding qualifications, independence, objectivity and confidentiality set forth in the Standards Pertaining to the Estimating and Auditing of Oil and Gas Reserves Information promulgated by the Society of Petroleum Engineers.
Our policies and practices regarding internal control over the estimating of reserves are structured to objectively and accurately estimate our oil and natural gas reserves quantities and present values in compliance with the SEC’s regulations and U.S. Generally Accepted Accounting Principles. We maintain an internal staff of petroleum engineers and geosciences professionals who work closely with our independent petroleum consultant to ensure the integrity, accuracy and timeliness of data furnished to MHA in their reserves estimation process. Inputs to our reserves estimation process are based on historical results for production history, oil and natural gas prices, lease operating expenses, development costs, ownership interest and other required data. Our technical team meets regularly with representatives of MHA to review properties and discuss methods and assumptions used in MHA’s preparation of the year-end reserves estimates. While we have no formal committee specifically designated to review reserves reporting and the reserves estimation process, our senior management reviews and approves the MHA reserve report and any internally estimated significant changes to our proved reserves on a timely basis.
Our former Vice President—Operations, Richard Q. Hart, Jr., who left the Company in early March, 2010, was the technical person primarily responsible for overseeing the preparation of our year-end 2009 reserves estimates with some assistance from our Vice President—Geosciences, Timothy Benton. Mr. Hart has a Bachelor of Science in Petroleum Engineering and over 30 years of industry experience with positions of increasing responsibility in operations, engineering and reservoir evaluations. He is a member of the Society of Petroleum Engineers. Mr. Benton has assumed responsibility for the preparation of our reserves estimates on a permanent basis since the departure of Mr. Hart. Mr. Benton has over 30 years of industry experience in engineering and reservoir evaluations. He is a Registered Professional Engineer in the state of Oklahoma, a member of the Society of Petrophysics & Well Log Analysts and a member of the Society of Petroleum Engineers. Our Vice President—Geosciences reports directly to our Chief Executive Officer and our President.
No estimates of our proved reserves comparable to those included in this report have been included in reports to any federal agency other than the SEC.
10
Table of Contents
Index to Financial Statements
Costs Incurred
The following table shows certain information regarding the costs incurred by us in our acquisition, exploration, and development activities during the periods indicated.
| 2007 | 2008 | 2009 | |||||||
| (in thousands) | |||||||||
| Development and exploration costs: |
|||||||||
| Development drilling |
$ | 168,246 | $ | 183,081 | $ | 14,202 | |||
| Exploratory drilling |
— | 15,943 | 116,250 | ||||||
| Tubular and other drilling inventories |
— | 39,773 | 1,697 | ||||||
| Asset retirement obligation |
1,463 | 2,407 | 565 | ||||||
| 169,709 | 241,204 | 132,714 | |||||||
| Acquisition: |
|||||||||
| Proved |
7,814 | 23,246 | 6,881 | ||||||
| Unproved |
1,018 | 26,236 | 11,450 | ||||||
| 8,832 | 49,482 | 18,331 | |||||||
| Total |
$ | 178,541 | $ | 290,686 | $ | 151,045 | |||
The exploratory drilling costs of $15.9 million and $116.2 million in 2008 and 2009, respectively, relate to our Haynesville/Bossier Shale drilling. As of December 31, 2009, we had drilled and completed twelve successful horizontal Haynesville/Bossier Shale wells with production profiles that support our strategy of continued and focused development of this play.
Oil and Natural Gas Production, Production Prices and Production Costs
See Part II, Item 7—Management’s Discussion and Analysis of Financial Condition and Results of Operation.
Drilling Results
We drilled or participated in the drilling of wells as set out in the table below for the periods indicated. The table was completed based upon the date drilling commenced. You should not consider the results of prior drilling activities as necessarily indicative of future performance, nor should you assume that there is necessarily any correlation between the number of productive wells drilled and the oil and natural gas reserves generated by those wells. All of the following wells were drilled in the United States.
| Year Ended December 31, | ||||||||||||
| 2007 | 2008 | 2009 | ||||||||||
| Gross | Net | Gross | Net | Gross | Net | |||||||
| Development wells: |
||||||||||||
| Natural Gas |
127.0 | 76.5 | 89.0 | 59.2 | 6.0 | 6.0 | ||||||
| Exploratory wells: |
||||||||||||
| Natural Gas |
— | — | 1.0 | 1.0 | 11.0 | 10.94 | ||||||
| Total |
127.0 | 76.5 | 90.0 | 60.2 | 17.0 | 16.94 | ||||||
As of December 31, 2009, we had two Haynesville/Bossier Shale horizontal wells drilling that are not included in the table above.
11
Table of Contents
Index to Financial Statements
Acreage
The following table shows our developed and undeveloped oil and natural gas lease and mineral acreage as of December 31, 2009.
| Developed | Undeveloped | Total | ||||||||||
| Gross | Net | Gross | Net | Gross | Net | |||||||
| East Texas |
40,364 | 25,942 | 26,461 | 20,668 | 66,825 | 46,610 | ||||||
| Other (United States) |
2,569 | 2,107 | 1,466 | 1,466 | 4,035 | 3,573 | ||||||
| Total |
42,933 | 28,049 | 27,927 | 22,134 | 70,860 | 50,183 | ||||||
We have approximately 280 net potential undrilled Haynesville/Bossier Shale locations in central and eastern Harrison and Panola counties in East Texas that are near acreage actively being drilled by other operators.
Title to oil and natural gas acreage is often complex. Landowners may have subdivided interests in the mineral estate. Oil and natural gas companies frequently subdivide the leasehold estate to spread drilling risk and often create overriding royalties. When we purchased the properties, the purchase included title opinions prepared by counsel analyzing mineral ownership in each well drilled. Further, for each producing well there is a division order signed by the current recipients of payments from production stipulating their assent to the fraction of the revenues they receive. We obtain similar title opinions with respect to each new well drilled. While these practices, which are common in the industry, do not assure that there will be no claims against title to the wells or the associated revenues, we believe that we are within normal and prudent industry practices. Because many of the properties in our current portfolio were purchased out of bankruptcy in 1998, we have the advantage that any known or unknown liens against the properties were cleared in the bankruptcy.
Productive Well Summary
The following table shows our ownership in productive wells as of December 31, 2009. Gross oil and natural gas wells include wells with multiple completions. Wells with multiple completions are counted only once for purposes of the following table.
| Productive Wells | ||||
| Gross | Net | |||
| Natural gas |
378.0 | 232.4 | ||
| Oil |
25.0 | 19.7 | ||
| Total |
403.0 | 252.1 | ||
Substantially all of our productive wells are related to our Cotton Valley Sands development.
Facilities
As of December 31, 2009, we leased 32,458 square feet in Oklahoma City, Oklahoma for our corporate headquarters. The annual rental cost is approximately $487,000. We also lease approximately 2,500 square feet of office space in Marshall, Texas used primarily for land field operations. The annual rent is approximately $24,000.
We own a 50-acre operations field yard approximately seven miles southeast of Marshall, Texas that has approximately 21,500 square feet of office and warehouse space. We also own 48 acres on which our gas gathering sales point is located. In addition, we own 100 acres for expansion of our field operations near Marshall, Texas. In 2008, we opened a second field office of approximately 2,400 square feet dedicated to land operations situated on 14 acres approximately two miles from the operations field yard.
12
Table of Contents
Index to Financial Statements
Employees
As of December 31, 2009, we had 95 full-time employees. This compares to 149 full-time employees at December 31, 2008, including 60 employees of Diamond Blue. We also use a number of independent contractors to assist in land and field operations. We believe our relations with our employees are satisfactory. Our employees are not covered by a collective bargaining agreement.
Marketing
Our ability to market oil and natural gas often depends on factors beyond our control. The potential effects of governmental regulation and market factors, including alternative domestic and imported energy sources, available pipeline capacity, and general market conditions, are not entirely predictable.
Natural Gas. Natural gas is generally sold pursuant to individually negotiated gas purchase contracts, which vary in length from spot market sales of a single day to term agreements that may extend several years. Customers who purchase natural gas include marketing affiliates of the major oil and gas companies, pipeline companies, natural gas marketing companies, and a variety of commercial and public authorities, industrial, and institutional end-users who ultimately consume the gas. Gas purchase contracts define the terms and conditions unique to each of these sales. The price received for natural gas sold on the spot market may vary daily, reflecting changing market conditions. The deliverability and price of natural gas are subject to both governmental regulation and supply and demand forces.
Substantially all of our gas from our East Texas company-operated wells is initially sold to our wholly owned subsidiary, Endeavor Pipeline, which in turn sells gas to unrelated third parties. All of our gas is currently sold under contracts providing for market sensitive terms that are terminable with 30-60 day notice by either party without penalty. This means that we both enjoy the benefits of high prices in increasing price markets and suffer the impact of low prices when gas prices decline. In addition, PVOG markets 100% of the gas produced from wells operated by PVOG in areas we jointly own. A subsidiary of PVOG charges us a marketing fee of 1% of the sales proceeds subject to certain price caps for oil and natural gas sold on our behalf in areas we jointly own.
Crude Oil. Oil produced from our properties is sold at the prevailing field price to one or more of a number of unaffiliated purchasers in the area. Generally, purchase contracts for the sale of oil are cancelable on 30 days’ notice. The price paid by these purchasers is an established market or “posted” price that is offered to all producers.
In 2009, we entered into a firm sales contract for 15 MMBtu per day increasing to 100 MMBtu per day through 2014. We are obligated to sell minimum daily gas volumes or pay a $0.02 per MMBtu for deficiency fee on volumes not sold.
In 2009, our largest purchaser of natural gas was Texla Energy Management, Inc. which accounted for 54% of total natural gas sales. In 2009, our largest purchaser of crude oil was Sunoco, Inc. which accounted for 52% of crude oil sales. We do not believe that the loss of any of our purchasers would have a material adverse affect on our operations as there are other purchasers active in the market.
Competition
We compete with major integrated oil and natural gas companies and independent oil and natural gas companies in all areas of operation. In particular, we compete for property acquisitions and for the equipment and labor required to operate and develop these properties. Most of our competitors have substantially greater financial and other resources than we have. In addition, larger competitors may be able to absorb the burden of any changes in federal, state and local laws and regulations more easily than we can, which could adversely affect our competitive position. These competitors may be able to pay more for exploratory prospects and may be
13
Table of Contents
Index to Financial Statements
able to define, evaluate, bid for and purchase a greater number of properties and prospects than we can. Further, our competitors may have technological advantages and may be able to implement new technologies more rapidly than we can. Our ability to explore for natural gas and oil prospects and to acquire additional properties in the future will depend on our ability to conduct operations, to evaluate and select suitable properties and to consummate transactions in this highly competitive environment. In addition, most of our competitors have operated for a much longer time than we have and have demonstrated the ability to operate through industry cycles.
At various times, we have and may continue to experience occasional or prolonged shortages or unavailability of drilling rigs, drill pipe and other material used in oil and natural gas drilling. Such unavailability could result in increased costs, delays in timing of anticipated development or cause interests in undeveloped oil and natural gas leases to lapse.
Regulation
Exploration and Production. The exploration, production and sale of oil and natural gas are subject to various types of local, state and federal laws and regulations. These laws and regulations govern a wide range of matters, including the drilling and spacing of wells, allowable rates of production, restoration of surface areas, plugging and abandonment of wells and requirements for the operation of wells. Our operations are also subject to various conservation requirements. These include the regulation of the size and shape of drilling and spacing units or proration units and the density of wells that may be drilled and the unitization or pooling of oil and natural gas properties. In this regard, some states allow forced pooling or integration of tracts to facilitate exploration, while other states rely on voluntary pooling of lands and leases. In addition, state conservation laws establish maximum rates of production from oil and natural gas wells, generally prohibit the venting or flaring of natural gas and impose certain requirements regarding the ratability of production. All of these regulations may adversely affect the rate at which wells produce oil and natural gas and the number of wells we may drill. All statements in this report about the number of locations or wells reflect current laws and regulations.
Laws and regulations relating to our business frequently change, and future laws and regulations, including changes to existing laws and regulations, could adversely affect our business.
Environmental Matters. The discharge of oil, gas or other pollutants into the air, soil or water may give rise to liabilities to the government and third parties and may require us to incur costs to remedy discharges. Natural gas, oil or other pollutants, including salt water brine, may be discharged in many ways, including from a well or drilling equipment at a drill site, leakage from pipelines or other gathering and transportation facilities, leakage from storage tanks and sudden discharges from damage or explosion at natural gas facilities of oil and natural gas wells. Discharged hydrocarbons may migrate through soil to water supplies or adjoining property, giving rise to additional liabilities.
A variety of federal and state laws and regulations govern the environmental aspects of natural gas and oil production, transportation and processing and may, in addition to other laws, impose liability in the event of discharges, whether or not accidental, failure to notify the proper authorities of a discharge, and other noncompliance with those laws. Compliance with such laws and regulations may increase the cost of oil and natural gas exploration, development and production, although we do not anticipate that compliance will have a material adverse effect on our capital expenditures or earnings. Failure to comply with the requirements of the applicable laws and regulations could subject us to substantial civil and/or criminal penalties and to the temporary or permanent curtailment or cessation of all or a portion of our operations.
The Comprehensive Environmental Response, Compensation and Liability Act (“CERCLA”), also known as the “superfund law,” imposes liability, regardless of fault or the legality of the original conduct, on some classes of persons that are considered to have contributed to the release of a “hazardous substance” into the environment. These persons include the owner or operator of a disposal site or sites where the release occurred
14
Table of Contents
Index to Financial Statements
and companies that dispose or arrange for disposal of the hazardous substances found at the time. Persons who are or were responsible for releases of hazardous substances under CERCLA may be subject to joint and severable liability for the costs of cleaning up the hazardous substances that have been released into the environment and for damages to natural resources, and it is not uncommon for neighboring landowners and other third parties to file claims for personal injury and property damage allegedly caused by the hazardous substances released into the environment. We could be subject to the liability under CERCLA because our drilling and production activities generate relatively small amounts of liquid and solid waste that may be subject to classification as hazardous substances under CERCLA.
The Resource Conservation and Recovery Act of 1976, as amended (“RCRA”), is the principal federal statute governing the treatment, storage and disposal of hazardous wastes. RCRA imposes stringent operating requirements, and liability for failure to meet such requirements, on a person who is either a “generator” or “transporter” of hazardous waste or an “owner” or “operator” of a hazardous waste treatment, storage or disposal facility. At present, RCRA includes a statutory exemption that allows most oil and natural gas exploration and production waste to be classified as nonhazardous waste. A similar exemption is contained in many of the state counterparts to RCRA. As a result, we are not required to comply with a substantial portion of RCRA’s requirements because our operations generate minimal quantities of hazardous wastes. At various times in the past, proposals have been made to amend RCRA to rescind the exemption that excludes oil and natural gas exploration and production wastes from regulation as hazardous waste. Repeal or modification of the exemption by administrative, legislative or judicial process, or modification of similar exemptions in applicable state statutes, would increase the volume of hazardous waste we are required to manage and dispose of and would cause us to incur increased operating expenses.
Recent legislative and regulatory proposals have focused, among other topics, on climate change initiatives and the downhole injection of various fluids and chemicals for reservoir stimulation and similar purposes. There is a possibility of additional regulation in these and other environmental areas, and any such regulation could require us to change the manner in which we operate or to incur increased operating expenses.
There are numerous state laws and regulations in the states in which we operate that relate to the environmental aspects of our business. These state laws and regulations generally relate to requirements to remediate spills of deleterious substances associated with oil and natural gas activities, the conduct of salt water disposal operations, and the methods of plugging and abandonment of oil and natural gas wells that have been unproductive. Numerous state laws and regulations also relate to air and water quality.
We do not believe that our environmental risks will be materially different from those of comparable companies in the oil and natural gas industry. We believe our present activities substantially comply, in all material respects, with existing environmental laws and regulations. Nevertheless, there can be no assurance that environmental laws will not result in a curtailment of production or material increase in the cost of production, development or exploration or otherwise adversely affect our financial condition and results of operations. Although we maintain liability insurance coverage for liabilities from pollution, environmental risks generally are not fully insurable.
In addition, because we have acquired and may acquire interests in properties that have been operated in the past by others, we may be liable for environmental damage, including historical contamination, caused by such former operators. Additional liabilities could also arise from continuing violations or contamination not discovered during our assessment of the acquired properties.
Marketing and Transportation. Our sales of natural gas are affected by the availability, terms and cost of transportation. The price and terms for access to pipeline transportation are subject to extensive federal and state regulation. From 1985 to the present, several major regulatory changes have been implemented by Congress and the Federal Energy Regulatory Commission (“FERC”) that affect the economics of natural gas production, transportation and sales. In addition, FERC is continually proposing and implementing new rules affecting
15
Table of Contents
Index to Financial Statements
segments of the natural gas industry, most notably interstate natural gas transmission companies, that remain subject to FERC’s jurisdiction. These initiatives may also affect the intrastate transportation of gas under certain circumstances. The stated purpose of many of these regulatory changes is to promote competition among the various sectors of the natural gas industry and these initiatives generally reflect more light-handed regulation.
The ultimate impact of the complex rules and regulations issued by FERC since 1985 cannot be predicted. We cannot predict what further action FERC will take on these matters. We do not believe that we will be affected by any action taken materially differently than other natural gas producers, gatherers and marketers with which we compete.
Additional proposals and proceedings that might affect the natural gas industry are frequently made before Congress, FERC and the courts. The natural gas industry historically has been very heavily regulated; therefore, there is no assurance that the less stringent regulatory approach recently pursued by FERC and Congress will continue.
Our sales of crude oil and condensate are currently not regulated and are made at market prices. In a number of instances, however, the ability to transport and sell such products are dependent on pipelines whose rates, terms and conditions of service are subject to FERC jurisdiction under the Interstate Commerce Act. However, we do not believe that these regulations affect us any differently than other crude oil producers.
Certain Technical Terms
The terms whose meanings are explained in this section are used throughout this document:
Bbl. One stock tank barrel, or 42 U.S. gallons liquid volume, used herein in reference to oil or other liquid hydrocarbons.
BBtu. Billion Btus.
Bcf. Billion cubic feet.
Bcfe. Billion cubic feet of natural gas equivalent, determined using the ratio of one Bbl of oil or condensate to six Mcf of natural gas.
Btu. British thermal unit, which is the heat required to raise the temperature of a one pound mass of water from 58.5 to 59.5 degrees Fahrenheit.
Developed Acreage. The number of acres which are allocated or assignable to producing wells or wells capable of production.
Development Location. A location on which a development well can be drilled.
Development Well. A well drilled within the proved area of an oil or gas reservoir to the depth of a stratigraphic horizon known to be productive in an attempt to recover proved undeveloped reserves.
Drilling Unit. An area specified by governmental regulations or orders or by voluntary agreement for the drilling of a well to a specified formation or formations which may combine several smaller tracts or subdivides a large tract, and within which there is usually some right to share in production or expense by agreement or by operation of law.
Dry Hole. A well found to be incapable of producing either oil or gas in sufficient quantities to justify completion as an oil or gas well.
16
Table of Contents
Index to Financial Statements
Estimated Future Net Revenues. Estimated future gross revenue to be generated from the production of proved reserves, net of estimated production, future development costs, and future abandonment costs, using an average first-day of the month price for the last 12 months under the new SEC rules and costs in effect as of the date of the report or estimate, without giving effect to non-property related expenses such as general and administrative expenses, debt service and future income tax expense or to depreciation, depletion and amortization.
Exploratory Well. A well drilled to find and produce oil or gas in an unproved area, to find a new reservoir in a field previously found to be productive of oil or gas in another reservoir, or to extend a known reservoir.
Finding and Development Costs. The total costs incurred for exploration and development activities (excluding exploratory drilling in progress and drilling inventories), divided by total proved reserve additions. To the extent any portion of the proved reserve additions consist of proved undeveloped reserves, additional costs would have to be incurred in order for such proved undeveloped reserves to be produced. This measure may differ from the measure used by other oil and natural gas companies.
Gross Acre. An acre in which a working interest is owned.
Gross Well. A well in which a working interest is owned.
Infill Drilling. Drilling for the development and production of proved undeveloped reserves that lie within an area bounded by producing wells.
Injection Well. A well which is used to place liquids or gases into the producing zone during secondary/tertiary recovery operations to assist in maintaining reservoir pressure and enhancing recoveries from the field or productive horizons.
Lease Operating Expense. All direct costs associated with and necessary to operate a producing property.
MBbls. Thousand barrels.
MBtu. Thousand Btus.
Mcf. Thousand cubic feet.
Mcfe. Thousand cubic feet of natural gas equivalent, determined using the ratio of one Bbl of oil or condensate to six Mcf of natural gas.
Mcfpd. Thousand cubic feet per day.
MMBbls. Million barrels.
MMBtu. Million Btus.
MMcf. Million cubic feet.
MMcfe. Million cubic feet of natural gas equivalent, determined using the ratio of one Bbl of oil or condensate to six Mcf of natural gas.
Natural Gas Liquids. Liquid hydrocarbons which have been extracted from natural gas (e.g., ethane, propane, butane and natural gasoline).
Net Acres or Net Wells. The sum of the fractional working interests owned in gross acres or gross wells.
17
Table of Contents
Index to Financial Statements
NYMEX. New York Mercantile Exchange.
Operator. The individual or company responsible for the exploration, exploitation and production of an oil or natural gas well or lease, usually pursuant to the terms of a joint operating agreement among the various parties owning the working interest in the well.
Present Value. When used with respect to oil and natural gas reserves, present value means the Estimated Future Net Revenues discounted using an annual discount rate of 10%.
Productive Well. A well that is producing oil or gas or that is capable of production.
Proved Developed Reserves. Proved reserves are expected to be recovered through existing wells with existing equipment and operating methods. Additional oil and natural gas expected to be obtained through the application of fluid injection or other improved recovery techniques for supplementing the natural forces and mechanisms of primary recovery are included as proved developed reserves only after testing by pilot project or after the operation of an installed program as confirmed through production response that increased recovery will be achieved.
Proved Reserves. Proved natural gas and oil reserves are those quantities of natural gas and oil, which, by analysis of geoscience and engineering data, can be estimated with reasonable certainty to be economically producible—from a given date forward, from known reservoirs, and under existing economic conditions, operating methods, and government regulations—prior to the time at which contracts providing the right to operate expire, unless evidence indicates that renewal is reasonably certain, regardless of whether deterministic or probabilistic methods are used for the estimation. The project to extract the hydrocarbons must have commenced or the operator must be reasonably certain that it will commence the project within a reasonable time. The area of a reservoir considered as proved includes (a) the area identified by drilling and limited by fluid contacts, if any, and (b) adjacent undrilled portions of the reservoir that can, with reasonable certainty, be judged to be continuous with it and to contain economically producible natural gas or oil on the basis of available geoscience and engineering data. In the absence of information on fluid contacts, proved quantities in a reservoir are limited by the lowest known hydrocarbons (LKH) as seen in a well penetration unless geoscience, engineering, or performance data and reliable technology establishes a lower contact with reasonable certainty. Where direct observation from well penetrations has defined a highest known oil (HKO) elevation and the potential exists for an associated gas cap, proved oil reserves may be assigned in the structurally higher portions of the reservoir only if geoscience, engineering, or performance data and reliable technology establish the higher contact with reasonable certainty. Reserves which can be produced economically through application of improved recovery techniques (including, but not limited to, fluid injection) are included in the proved classification when (a) successful testing by a pilot project in an area of the reservoir with properties no more favorable than in the reservoir as a whole, the operation of an installed program in the reservoir or an analogous reservoir, or other evidence using reliable technology establishes the reasonable certainty of the engineering analysis on which the project or program was based and (b) the project has been approved for development by all necessary parties and entities, including governmental entities. Existing economic conditions include prices and costs at which economic producibility from a reservoir is to be determined. The price shall be the average price during the 12-month period prior to the ending date of the period covered by the report, determined as an unweighted arithmetic average of the first-day-of-the-month price for each month within such period, unless prices are defined by contractual arrangements, excluding escalations based upon future conditions.
Proved Undeveloped Reserves. Proved reserves that are expected to be recovered from new wells on undrilled acreage, or from existing wells where a relatively major expenditure is required for recompletion. Reserves on undrilled acreage shall be limited to those directly offsetting development spacing areas that are reasonably certain of production when drilled, unless evidence using reliable technology exists that establishes reasonable certainty of economic producibility at greater distances. Undrilled locations can be classified as having undeveloped reserves only if a development plan has been adopted indicating that they are scheduled to
18
Table of Contents
Index to Financial Statements
be drilled within five years, unless the specific circumstances, justify a longer time. Estimates for proved undeveloped reserves are not attributed to any acreage for which an application of fluid injection or other improved recovery technique is contemplated, unless such techniques have been proved effective by actual projects in the same reservoir or an analogous reservoir, or by other evidence using reliable technology establishing reasonable certainty.
Recompletion. The completion for production of an existing wellbore in another formation from that in which the well has previously been completed.
Royalty. An interest in an oil and natural gas lease that gives the owner of the interest the right to receive a portion of the production from the leased acreage (or of the proceeds of the sale), but generally does not require the owners to pay any portion of the costs of drilling or operating wells on the leased acreage. Royalties may be either landowner’s royalties, which are reserved by the owner of a leased acreage at the time the lease is granted, or overriding royalties, which are usually reserved by an owner of the leasehold in connection with the transfer to a subsequent owner.
Secondary Recovery. An artificial method or process used to restore or increase production from a reservoir after the primary production by the natural producing mechanism and reservoir pressure has experienced partial depletion. Gas injection and water flooding are examples of this technique.
Undeveloped Acreage. Lease acreage on which wells have not been drilled or completed to a point that would permit the production of commercial quantities of oil and natural gas regardless of whether such acreage contains proved reserves.
Waterflood. A secondary recovery operation in which water is injected into the producing formation in order to maintain reservoir pressure and force oil toward and into the producing wells.
Working Interest. An interest in an oil and natural gas lease that gives the owner of the interest the right to drill for and produce oil and natural gas on the leased acreage and requires the owner to pay a share of the costs of drilling and production operations.
Workover. To carry out remedial operations on a productive well with the intention of restoring or increasing production.
Availability of Information
We file periodic reports and proxy statements with the SEC. The public may read and copy any materials we file with the SEC at the SEC’s Public Reference Room at 100 F Street N.E., Washington, D.C. 20549. The public may obtain information about the operation of the Public Reference Room by calling the SEC at 1-800-SEC-0330. We file our reports with the SEC electronically. The SEC maintains an Internet site that contains reports, proxy and information statements, and other information regarding issuers that file electronically with the SEC. The address of this site is http://www.sec.gov.
Our Internet address is www.gmxresources.com. We make available on our website free of charge copies of our annual report on Form 10-K, quarterly reports on Form 10-Q, current reports on Form 8-K and amendments to those reports filed or furnished pursuant to Section 13(a) of the Exchange Act as soon as reasonably possible after we electronically file or furnish such material with the SEC.
19
Table of Contents
Index to Financial Statements
| Item 1A. | Risk Factors. |
Risks Related to GMX
Our future performance depends upon our ability to obtain capital to find or acquire additional oil and natural gas reserves that are economically recoverable.
Unless we successfully replace the reserves that we produce, our reserves will decline, eventually resulting in a decrease in oil and natural gas production and lower revenues and cash flows from operations. The business of exploring for, developing and acquiring reserves requires substantial capital expenditures. Our ability to make the necessary capital investment to maintain or expand our oil and natural gas reserves is limited by our relatively small size. In addition, approximately 62% of our total estimated proved reserves at December 31, 2009 were undeveloped. By their nature, estimates of undeveloped reserves are less certain. Recovery of such reserves will require significant capital expenditures and successful drilling operations. Further, our drilling activities are subject to numerous risks, including the risk that no commercially productive oil or natural gas reserves will be encountered. Thus, our future natural gas and oil reserves and production and, therefore, our cash flow and income are highly dependent on our success in efficiently developing and exploiting our current reserves and economically finding or acquiring additional recoverable reserves.
We have historically relied upon draws on our revolving bank credit facility to help fund our capital expenditures. The amounts we may borrow under our revolving bank credit facility are subject to a borrowing base calculation that depends on the value that our bank lenders place on our oil and natural gas properties, which in turn depends on prevailing commodity prices. Lower commodity prices may result in a reduction of our borrowing base. The most recent redetermination by our bank lenders resulted in a reduction of the borrowing base from $175 million to $130 million, upon consummation of the Endeavor Gathering transaction. The next redetermination of our borrowing base by our bank lenders is expected to occur on or around May 1, 2010. Future redeterminations of the borrowing base are expected to occur on or before April 30 and October 31 of each year. Future reductions in our borrowing base may occur for several reasons, including if we do not successfully grow our reserves or if commodity prices further weaken. Our ability to reborrow under our revolving bank credit facility to fund our capital expenditures will be constrained by any reductions in the borrowing base, which could adversely affect our ability to operate our business.
Our revolving bank credit facility contains certain covenants that may inhibit our ability to make certain investments, incur additional indebtedness and engage in certain other transactions, which could adversely affect our ability to meet our future goals. If our revolving bank credit facility were to be accelerated, we may not have sufficient liquidity to repay our indebtedness in full.
Our revolving bank credit facility includes certain covenants that, among other things, restrict:
| • | our investments, loans and advances, the paying of dividends on our common stock, and other restricted payments; |
| • | our incurrence of additional indebtedness; |
| • | the granting of liens, other than liens created pursuant to the revolving bank credit facility and certain permitted liens; |
| • | mergers, consolidations and sales of all or a substantial part of our business or properties; and |
| • | the hedging, forward sale or swap of our production of crude oil or natural gas or other commodities. |
Our revolving bank credit facility requires us to maintain certain financial ratios, including leverage ratios such as total debt to earnings before interest, taxes, depreciation, depletion and amortization expenses (“EBITDA”) and EBITDA to interest ratios.
All of these restrictive covenants may restrict our ability to expend or pursue our business strategies. Our ability to comply with these and other provisions of our revolving bank credit facility may be impacted by lower
20
Table of Contents
Index to Financial Statements
commodity prices, changes in economic or business conditions, results of operations or events beyond our control. The breach of any of these covenants could result in a default under our revolving bank credit facility, in which case, depending on the actions taken by the lenders thereunder or their successors or assignees, such lenders could elect to declare all amounts borrowed under our revolving bank credit facility, together with accrued interest, to be due and payable. If we were unable to repay such borrowings or interest, our lenders could proceed against their collateral. The amounts we can borrow under our revolving bank credit facility are subject to a borrowing base calculation that depends on the value that our banks place on our oil and natural gas properties, which in turn depends on prevailing commodity prices. Lower commodity prices may result in a reduction of our borrowing base. If the indebtedness under our revolving bank credit facility were to be accelerated, our 5.00% convertible senior notes due 2013 and our 4.50% convertible senior notes due 2015 would also be accelerated and we may not have sufficient liquidity to repay our indebtedness in full.
A majority of our production, revenue and cash flow from operating activities is derived from assets that are concentrated in a single geographic area.
Approximately 98% of our estimated proved reserves at December 31, 2009 and a similar percentage of our production during 2009 were associated with our East Texas wells. Accordingly, if the level of production from these properties substantially declines, it could have a material adverse effect on our overall production level and our revenue. Approximately 91% of our estimated proved reserves relate to wells in the Cotton Valley Sands and shallower layers as of December 31, 2009. We plan to devote a smaller portion of our capital expenditure budget to the Cotton Valley Sands formation layer in favor of wells to develop the Haynesville/Bossier Shale formation layer. This may affect the production, revenue and cash flow we derive from further development of the Cotton Valley Sands formation layer.
We embarked on a new exploration and development program in the Haynesville/Bossier Shale in 2008, and it is difficult to predict drilling success rates.
Since the third quarter of 2008, we have directed a substantial majority of our development focus to the drilling of horizontal wells in the Haynesville/Bossier Shale formation layer in our core area. These activities represent a change from our historic focus of drilling developmental vertical wells in the Cotton Valley Sands formation layer. Part of our drilling strategy to maximize recoveries from the Haynesville/Bossier Shale formation layer involves the drilling of horizontal wells using completion techniques that have proven to be successful in other formation layers. Our experience with horizontal drilling in the Haynesville/Bossier Shale formation layer to date is still limited, with a total of twelve Haynesville/Bossier Shale horizontal wells drilled and completed. Furthermore, while the wells drilled in the Haynesville/Bossier Shale formation layer to date have reported very high initial potential rates, our production history in this area is still limited, and we are less able to use past drilling results in this area to help predict our future drilling results. We may not encounter the same drilling results in future Haynesville/Bossier Shale wells, in which event our results of operations or financial condition may be adversely affected.
The loss of our Chief Executive Officer or other key personnel could adversely affect us.
We depend to a large extent on the efforts and continued employment of Ken L. Kenworthy, Jr., our Chief Executive Officer. The loss of his services could adversely affect our business. In addition, if Mr. Kenworthy resigns or we terminate him as our Chief Executive Officer, we would be in default under our revolving bank credit facility, and we would also be required to offer to repurchase all of our outstanding Series B Preferred Stock. If Mr. Kenworthy dies or becomes disabled, we would be required to offer to repurchase all of our outstanding Series B Preferred Stock, and, unless we appoint a successor acceptable to our lenders within four months of Mr. Kenworthy’s death or disability, we would also be in default under our revolving bank credit facility.
21
Table of Contents
Index to Financial Statements
Certain of our Cotton Valley Sands wells produce oil and natural gas at a relatively slow rate.
We expect that our existing Cotton Valley Sands wells and certain other wells that we plan to drill on our existing properties will produce the oil and natural gas constituting the reserves associated with those wells over a period of between 10 and 50 years. Because of the relatively slow rates of production of our wells, our reserves will be affected by long term changes in oil or natural gas prices or both, and we will be limited in our ability to anticipate any price declines by increasing rates of production. We may hedge our reserve position by selling oil and natural gas forward for limited periods of time, but we do not anticipate that, in declining markets, the price of any such forward sales will be attractive.
Delays in development or production curtailment affecting our material properties may adversely affect our financial position and results of operations.
The size of our operations and our capital expenditure budget limits the number of wells that we can develop in any given year. Complications in the development of any single material well may result in a material adverse affect on our financial condition and results of operations. If we were to experience operational problems resulting in the curtailment of production in a material number of our wells, our total production levels would be adversely affected, which would have a material adverse affect on our financial condition and results of operations.
We have entered into long-term rig contracts, which will require a significant portion of our budgeted capital expenditures over their terms.
In 2008, we entered into agreements with Helmerich & Payne for four new FlexRigs™ for three-year terms each, two of which were delivered during 2009 and two which are scheduled to be delivered during the first quarter of 2010. We will be obligated to pay $121.4 million over the remaining terms of these agreements. This represents a significant portion of our future capital expenditures budget. The presence of this commitment will limit our ability to deploy our capital to other projects. Additionally, the term of these commitments restricts our flexibility to adjust the scale of our drilling efforts based on prevailing commodity prices and other industry conditions, meaning that we will continue to be obligated to pay for these rigs even if market conditions do not render their use economical for us. As such, this long-term commitment could have an adverse effect on our financial condition and results of operations.
Increased drilling in the Haynesville/Bossier Shale formation layer in and around our core area may cause pipeline capacity problems that may limit our ability to sell natural gas.
If the Haynesville/Bossier Shale continues to be successful, the amount of gas being produced in and around our core area from these new wells, as well as other existing wells, may exceed the capacity of the various gathering and intrastate or interstate transportation pipelines currently available. If this occurs, it will be necessary for new pipelines and gathering systems to be built. In addition, capital constraints could limit our ability to build intrastate gathering systems necessary to transport our gas to interstate pipelines. In such event, we might have to shut in our wells awaiting a pipeline connection or capacity and/or sell natural gas production at significantly lower prices than we currently project, which would adversely affect our results of operations.
Hedging our production may result in losses or limit potential gains.
We enter into hedging arrangements to limit our risk to decreases in commodity prices. Hedging arrangements expose us to risk of financial loss in some circumstances, including the following:
| • | production is substantially less than expected; |
| • | the counter-party to the hedging contract defaults on its contract obligations; and |
| • | there is a change in the expected differential between the underlying price in the hedging agreement and actual prices received. |
22
Table of Contents
Index to Financial Statements
In addition, these hedging arrangements may limit the benefit we would receive from increases in the prices for oil and natural gas. If we choose not to engage in hedging arrangements in the future, we may be more adversely affected by changes in oil and natural gas prices than our competitors, who may or may not engage in hedging arrangements.
Failure by us to achieve and maintain effective internal control over financial reporting in accordance with the rules of the SEC could harm our business and operating results and/or result in a loss of investor confidence in our financial reports, which could have a material adverse effect on our business.
We have evaluated our internal controls systems to allow management to report on, and our independent auditors to audit, our internal controls over financial reporting. We have performed the system and process evaluation and testing required to comply with the management certification and auditor attestation requirements of Section 404 of the Sarbanes-Oxley Act of 2002. In March 2010, we identified control deficiencies under applicable SEC and Public Company Accounting Oversight Board rules and regulations that remain unremediated. As a public company, we are required to report, among other things, control deficiencies that constitute a “material weakness” or changes in internal controls that, or that are reasonably likely to, materially affect internal controls over financial reporting. We have reported one such “material weakness” in this report. See Part II. Item 9A—Controls and Procedures. A “material weakness” is a deficiency, or combination of deficiencies, in internal control over financial reporting, such that there is a reasonable possibility that a material misstatement of the Company’s annual or interim consolidated financial statements will not be prevented or detected on a timely basis. The report by us of a material weakness may cause investors to lose confidence in our consolidated financial statements, and our stock price may be adversely affected as a result. If we fail to remedy any material weakness, our consolidated financial statements may be inaccurate, we may face restricted access to the capital markets and the price of our securities may be adversely affected.
The continuation of the global economic crisis could adversely impact our business and financial condition.
In 2008, general worldwide economic conditions deteriorated sharply due to the subprime lending crisis, general credit market crisis, collateral effects on the financial and banking industries, decreased consumer confidence, reduced corporate profits and capital spending, and liquidity concerns. These conditions could limit our access to capital and additionally make it difficult for us to accurately forecast and plan future business activities. These conditions also could impact the ability of third parties that purchase natural gas and oil production from us to fulfill their payment obligations to us on a timely basis. The economic situation could also cause our commodity hedging arrangements to be ineffective if our counterparties are unable to perform their obligations or seek bankruptcy protection. We cannot predict the timing or duration of the global economic crisis or the timing or strength of a subsequent economic recovery. If the economy experiences continued weakness at current levels or deteriorates further, our business, financial condition and results of operations could be materially and adversely affected. Additionally, continued weakness in the global economy could result in reduced demand, and consequently lower prices, for oil and natural gas, which would adversely affect our revenues, operating cash flow and ability to obtain capital.
The Endeavor Gathering transaction could have an adverse effect on our reserves and estimated future cash flows.
In November 2009, we completed a transaction with KME relating to Endeavor Gathering. We contributed our gathering, compression, and certain related assets to Endeavor Gathering, and then sold a 40% interest in Endeavor Gathering to KME for $36 million. As a result of this transaction, we will incur additional gathering and compression expenses that we have not had historically, and KME will receive a portion of the net income generated by the assets owned by Endeavor Gathering that we had previously received. These additional expenses could reduce the economic lives of our current and future operated wells. Our reserves and estimated future cash flows could be reduced as a result of the potential reduction in the economic lives of our operated wells.
23
Table of Contents
Index to Financial Statements
Risks Related to the Oil and Natural Gas Industry
Oil and natural gas prices have a material impact on us.
Lower oil and natural gas prices would adversely affect our financial position, financial results, cash flows, access to capital and ability to grow. Our revenues, operating results, profitability and future rate of growth depend primarily upon the prices we receive for the oil and natural gas we sell. Prices also affect the amount of cash flow available for capital expenditures and our ability to borrow money or raise additional capital. The amount we can borrow under our revolving bank credit facility is subject to periodic redeterminations based on the valuation by our banks of our oil and natural gas reserves, which will depend on oil and natural gas prices used by our banks at the time of determination. In addition, we may have full-cost ceiling test write-downs in the future if prices fall.
Historically, the markets for oil and natural gas have been volatile, and they are likely to continue to be volatile. Wide fluctuations in oil and natural gas prices may result from relatively minor changes in the supply of and demand for oil and natural gas, market uncertainty and other factors that are beyond our control, including:
| • | worldwide and domestic supplies of oil and natural gas; |
| • | weather conditions; |
| • | the level of consumer demand; |
| • | the price and availability of alternative fuels; |
| • | the availability of pipeline capacity; |
| • | the price and level of foreign imports; |
| • | domestic and foreign governmental regulations and taxes; |
| • | the ability of the members of the Organization of Petroleum Exporting Countries to agree to and maintain oil price and production controls; |
| • | political instability or armed conflict in oil and natural gas producing regions, and |
| • | the overall economic environment. |
These factors and the volatility of the energy markets make it extremely difficult to predict future oil and natural gas price movements with any certainty. Declines in oil and natural gas prices would not only reduce revenue, but could reduce the amount of oil and natural gas that we can produce economically and, as a result, could have a material adverse effect on our financial condition, results of operations and reserves. Further, oil and natural gas prices do not necessarily move in tandem. Because approximately 94% of our reserves at December 31, 2009 are natural gas reserves, we are more affected by movements in natural gas prices.
Estimates of proved natural gas and oil reserves and present value of proved reserves are not precise.
There are numerous uncertainties inherent in estimating quantities of proved oil and natural gas reserves and their values, including many factors beyond our control. The reserve data included in this report represent only estimates. Reserve engineering is a subjective process of estimating underground accumulations of oil and natural gas that cannot be measured in an exact manner. The accuracy of any reserve estimate is a function of the quality of available data, the precision of the engineering and geological interpretation, and judgment. As a result, estimates of different engineers often vary. The estimates of reserves, future cash flows and present value are based on various assumptions, including those prescribed by the SEC, and are inherently imprecise. Actual future production, cash flows, taxes, development expenditures, operating expenses and quantities of recoverable oil and natural gas reserves may vary substantially from our estimates. Also, the use of a 10% discount factor for reporting purposes may not necessarily represent the most appropriate discount factor, given actual interest rates and risks to which our business or the oil and natural gas industry in general are subject.
24
Table of Contents
Index to Financial Statements
Quantities of proved reserves are estimated based on economic conditions, including average oil and natural gas prices calculated at the date of assessment. A reduction in oil and natural gas prices not only would reduce the value of any proved reserves, but also might reduce the amount of oil and natural gas that could be economically produced, thereby reducing the quantity of reserves. Our proved reserves are estimated using assumptions of decline rates based on historic experience. Due to the limited production history we have in our core area, our initial assumptions of decline rates are subject to modification as we gain more experience in operating our wells. Our reserves and future cash flows may be subject to revisions, based upon changes in economic conditions, including oil and natural gas prices, as well as due to production results, results of future development, operating and development costs, and other factors. Downward revisions of our reserves could have an adverse affect on our financial condition and operating results.
At December 31, 2009, approximately 62% of our estimated proved reserves (by volume) were undeveloped. Estimates of proved undeveloped reserves are less certain than estimates of proved developed reserves. Recovery of proved undeveloped reserves requires significant capital expenditures and successful drilling operations. The reserve data assumes that we will make significant capital expenditures to develop our reserves. Although we have prepared estimates of these oil and natural gas reserves and the costs associated with development of these reserves in accordance with SEC regulations, actual capital expenditures will likely vary from estimated capital expenditures, development may not occur as scheduled and actual results may not be as estimated.
Our 2009 year-end reserve estimates are not directly comparable to prior estimates because of new reporting rules issued by the SEC, and future guidance provided by the SEC may differ from our interpretation of these new rules.
Our year-end 2009 proved reserves estimates included in this report were prepared according to new SEC rules. These rules are different from prior rules in many respects. As a result of these differences, our reserve estimates beginning with year-end 2009 are not directly comparable to our previously-reported reserves. The SEC has not reviewed our or any other reporting company’s reserve estimates under the new rules. In addition, the SEC to date has released only limited interpretive guidance regarding reporting of reserve estimates under the new rules. As a result, while we have prepared our year-end 2009 estimates of proved reserves based on what we and our independent reserve engineers believe to be reasonable interpretations of the new SEC rules, those estimates could differ materially from any estimates we might prepare after considering any future additional SEC guidance regarding the interpretation of the new rules.
Competition in the oil and natural gas industry is intense, and we are smaller than many of our competitors.
We compete with major integrated oil and natural gas companies and independent oil and natural gas companies in all areas of operation. In particular, we compete for property acquisitions and for the equipment and labor required to operate and develop these properties. Most of our competitors have substantially greater financial and other resources than we have. In addition, larger competitors may be able to absorb the burden of any changes in federal, state and local laws and regulations more easily than we can, which would adversely affect our competitive position. These competitors may be able to pay more for exploratory prospects and may be able to define, evaluate, bid for and purchase a greater number of properties and prospects than we can. Further, our competitors may have technological advantages and may be able to implement new technologies more rapidly than we can. Our ability to explore for natural gas and oil prospects and to acquire additional properties in the future will depend on our ability to conduct operations, to evaluate and select suitable properties and to consummate transactions in this highly competitive environment.
We may encounter difficulty in obtaining equipment and services.
Higher oil and natural gas prices and increased oil and natural gas drilling activity generally stimulate increased demand and result in increased prices and unavailability for drilling rigs, crews, associated supplies, equipment and services. While we have recently been successful in acquiring or contracting for services, we
25
Table of Contents
Index to Financial Statements
could experience difficulty obtaining drilling rigs, crews, associated supplies, equipment and services in the future. These shortages could also result in increased costs or delays in timing of anticipated development or cause interests in oil and natural gas leases to lapse. We cannot be certain that we will be able to implement our drilling plans or do so at costs that will be as estimated or acceptable to us.
Due to the recent increase of drilling Haynesville/Bossier Shale wells in and around our core area, demand for higher pressure downhole pipe and other equipment necessary for drilling these wells has been very high. If we are unable to obtain this equipment in a timely manner, the implementation of our Haynesville/Bossier Shale drilling plans could be delayed.
We may incur write-downs of the net book values of our oil and natural gas properties that would adversely affect our equity and earnings.
The full cost method of accounting, which we follow, requires that we periodically compare the net book value of our oil and natural gas properties, including related deferred income taxes, to a calculated “ceiling.” The ceiling is the estimated after-tax present value of the future net revenues from proved reserves using a 10% annual discount rate and using constant prices and costs. Any excess of net book value of oil and natural gas properties is written off as an expense and may not be reversed in subsequent periods even though higher oil and natural gas prices may have increased the ceiling in these future periods. A write-off constitutes a charge to earnings and reduces equity, but does not impact our cash flows from operating activities. On December 31, 2008, we recorded an impairment charge of $192.7 million on our oil and natural gas properties due to a ceiling test write-down based on a natural gas price of $5.71 per MMbtu and a crude oil price of $44.60 per barrel at December 31, 2008. On March 31, 2009, we recorded an additional impairment charge of $138.1 million on our oil and natural gas properties due to a ceiling test write-down based on a natural gas price of $3.63 per MMbtu and a crude oil price of $49.64 per barrel at March 31, 2009. On December 31, 2009, we recorded an impairment charge of $50.1 million on our oil and natural gas properties due to a ceiling test write-down based on a natural gas price of $3.87 per MMbtu and a crude oil price of $61.19 per barrel. If commodity prices continue to remain low, we may be subject to additional ceiling test write-downs. Future write-offs may occur that would have a material adverse effect on our net income in the period taken, but would not affect our cash flows. Even though such write-offs do not affect cash flow, they could have an adverse effect on the price of our publicly traded securities.
Operational risks in our business are numerous and could materially impact us.
Our operations involve operational risks and uncertainties associated with drilling for, and production and transportation of, oil and natural gas, all of which can affect our operating results. Our operations may be materially curtailed, delayed or canceled as a result of numerous factors, including:
| • | the presence of unanticipated pressure or irregularities in formations; |
| • | accidents; |
| • | title problems; |
| • | weather conditions; |
| • | compliance with governmental requirements; |
| • | shortages or delays in the delivery of equipment; |
| • | injury or loss of life; |
| • | severe damage to or destruction of property, natural resources and equipment; |
| • | pollution or other environmental damage; |
| • | clean-up responsibilities; |
26
Table of Contents
Index to Financial Statements
| • | regulatory investigation and penalties; and |
| • | other losses resulting in suspension of our operations. |
In accordance with customary industry practice, we maintain insurance against some, but not all, of the risks described above with a general liability and commercial umbrella policy. We do not maintain insurance for damages arising out of exposure to radioactive material. Even in the case of risks against which we are insured, our policies are subject to limitations and exceptions that could cause us to be unprotected against some or all of the risk. The occurrence of an uninsured loss could have a material adverse effect on our financial condition or results of operations.
Governmental regulations could adversely affect our business.
Our business is subject to certain federal, state and local laws and regulations on taxation, the exploration for and development, production and marketing of oil and natural gas, and environmental and safety matters. Many laws and regulations require drilling permits and govern the spacing of wells, rates of production, prevention of waste and other matters. These laws and regulations have increased the costs of our operations. In addition, these laws and regulations, and any others that are passed by the jurisdictions where we have production, could limit the total number of wells drilled or the allowable production from successful wells, which could limit our revenues.
Laws and regulations relating to our business frequently change, and future laws and regulations, including changes to existing laws and regulations, could adversely affect our business.
In particular and without limiting the foregoing, various tax proposals currently under consideration could result in an increase and acceleration of the payment of federal income taxes assessed against independent oil and natural gas producers, for example by eliminating the ability to expense intangible drilling costs, removing the percentage depletion allowance and increasing the amortization period for geological and geophysical expenses. Any of these changes would increase our tax burden. In addition, proposals under consideration relating to the over-the-counter derivatives market could adversely affect our hedging program related to our natural gas and oil production, since we rely upon the over-the-counter derivatives market for our hedging activities.
Environmental liabilities could adversely affect our business.
In the event of a release of oil, natural gas or other pollutants from our operations into the environment, we could incur liability for any and all consequences of such release, including personal injuries, property damage, cleanup costs and governmental fines. We could potentially discharge these materials into the environment in several ways, including:
| • | from a well or drilling equipment at a drill site; |
| • | leakage from gathering systems, pipelines, transportation facilities and storage tanks; |
| • | damage to oil and natural gas wells resulting from accidents during normal operations; and |
| • | blowouts, cratering and explosions. |
In addition, because we may acquire interests in properties that have been operated in the past by others, we may be liable for environmental damage, including historical contamination, caused by such former operators. Additional liabilities could also arise from continuing violations or contamination that we have not yet discovered relating to the acquired properties or any of our other properties.
To the extent we incur any environmental liabilities, it could adversely affect our results of operations or financial condition.
27
Table of Contents
Index to Financial Statements
Climate change legislation, regulation and litigation could materially adversely affect us.
Many countries, including the United States, have begun considering or implementing legal measures to reduce emissions of “greenhouse gases” (or “GHGs”), in part due to studies suggesting that GHGs may be contributing to the warming of the Earth’s atmosphere. Methane, a primary component of natural gas, and carbon dioxide, a byproduct of the burning of natural gas, are examples of GHGs. In September 2009, the U.S. Environmental Protection Agency (or “EPA”) promulgated a rule requiring certain sources of GHG emissions, including oil and natural gas exploration companies and certain purchasers of natural gas, to monitor and report their GHG emissions to the EPA. In addition, in response to the 2007 U.S. Supreme Court ruling in Massachusetts v. EPA that the EPA has authority to regulate carbon dioxide emissions under the Clean Air Act, the EPA has issued or is considering several proposals that, if finalized, would result in regulation of GHG emissions from a variety of sources. For example, the EPA has issued proposals that could result in a requirement to install best available control technology for GHG emissions when certain stationary sources are built or significantly modified. The U.S. Congress is also actively considering legislation to reduce emissions of GHGs, and certain governmental bodies, including at least one state, have or are considering imposing a fee to be paid by certain emitters of GHGs. Further, a U.S. federal appellate court recently reinstated a lawsuit against five U.S. electric utility companies alleging that those companies have created a public nuisance due to their emissions of carbon dioxide.
Passage of legislation or regulations that regulate or restrict emissions of GHGs, or GHG-related litigation instituted against us or our customers, could result in direct costs to us and could also result in changes to the consumption and demand for natural gas and carbon dioxide produced from our oil and natural gas properties, any of which could have a material adverse effect on our business, financial position, results of operations and prospects.
Horizontal drilling activities could be subject to increased regulation and could expose us to environmental risks that could adversely affect us.
Legislation relating to horizontal drilling activities that could impose new permitting disclosure or other environmental restrictions or obligations on our operations is currently being considered at the federal level, and may in the future be considered at the state or local level. In particular, the U.S. Congress recently signaled a renewed interest in certain downhole injection activities, some of which we utilize in our operations. The focus may lead to new legislation or regulations that could affect our operations. Any additional requirements or restrictions on our operations could result in delays, increased operating costs or a requirement to change or eliminate certain drilling and injection activities in a manner that may materially adversely affect us. In addition, because horizontal drilling involves the injection of water, sand and chemicals under pressure into rock formations to stimulate natural gas production, it is also possible that our drilling and injection operations could adversely affect the environment, which could result in a requirement to perform investigations or clean-ups or in the incurrence of other unexpected material costs or liabilities.
| Item 1B. | Unresolved Staff Comments. |
None.
| Item 2. | Properties. |
The information required by Item 2 is contained in Item 1—Business.
| Item 3. | Legal Proceedings. |
None.
| Item 4. | Reserved. |
28
Table of Contents
Index to Financial Statements
| Item 5. | Market for Registrant’s Common Equity, Related Stockholder Matters and Issuer Purchases of Equity Securities. |
Common Stock
On December 16, 2009, we transferred the listing of our common stock from The NASDAQ Global Select Market to The New York Stock Exchange. The high and low sales prices for our common stock as listed on The NASDAQ Global Select Market or The New York Stock Exchange, as applicable during the periods described below, were as follows:
| High | Low | |||||
| Year Ended December 31, 2008 |
||||||
| First Quarter |
$ | 35.22 | $ | 23.65 | ||
| Second Quarter |
76.89 | 34.09 | ||||
| Third Quarter |
88.35 | 40.74 | ||||
| Fourth Quarter |
47.91 | 16.84 | ||||
| Year Ended December 31, 2009 |
||||||
| First Quarter |
$ | 30.49 | $ | 5.96 | ||
| Second Quarter |
19.10 | 5.57 | ||||
| Third Quarter |
16.61 | 8.38 | ||||
| Fourth Quarter |
19.00 | 10.95 | ||||
As of February 22, 2010, there were 111 record owners of our common stock and an estimated 10,100 beneficial owners.
Dividend Policy
We have never declared or paid any cash dividends on our shares of common stock and do not anticipate paying any cash dividends on our shares of common stock in the foreseeable future. Currently, we intend to retain any future earnings for use in the operation and expansion of our business. Any future decision to pay cash dividends on our common stock will be at the discretion of our board of directors and will be dependent upon our financial condition, results of operations, capital requirements and other facts our board of directors may deem relevant. The declaration and payment of dividends is currently prohibited under the terms of our revolving bank credit facility and may be similarly restricted in the future. See “Management’s Discussion and Analysis of Financial Condition and Results of Operations—Revolving Bank Credit Facility and Other Debt.”
Securities Authorized for Issuance under Equity Compensation Plans
The following table summarizes the number of outstanding options granted to employees and directors, as well as the number of securities remaining available for future issuance, under our equity compensation plans as of December 31, 2009.
| Plan Category |
Number of securities to be issued upon exercise of outstanding options |
Weighted- average exercise price of outstanding options |
Number of securities remaining available for future issuance under equity compensation plans (excluding securities reflected at left) |
|||||
| Equity compensation plans approved by security holders |
576,800 | $ | 30.16 | 160,588 | (1) | |||
| (1) | Includes 136,588 shares that may be issued in the form of restricted stock or bonus stock grants under the Company’s 2008 Long-Term Incentive Plan. |
29
Table of Contents
Index to Financial Statements
Shareholder Return Performance Graph
The following graph compares the cumulative total shareholder returns of our Common Stock during the five years ended December 31, 2009 with the cumulative total shareholder returns of the Russell 2000 Index and the AMEX Oil Index. The comparison assumes an investment of $100 on December 31, 2004 in each of our Common Stock, the Russell 2000 Index and the AMEX Oil Index and that any dividends were reinvested.
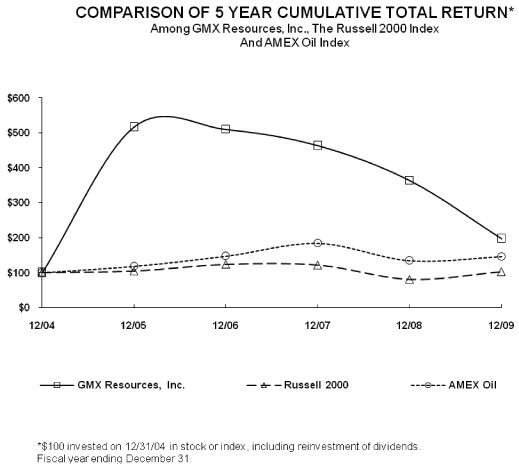
Recent Sales of Unregistered Equity Securities
None during 2009.
Purchases of Equity Securities
The following table presents information about repurchases of our common stock during the three months ended December 31, 2009:
| Period |
Total Number of Shares Purchased(1) |
Average Price Paid per Share |
Total Number of Shares Purchased as Part of Publicly Announced Plans or Programs |
Maximum Number of Shares that May Yet Be Purchased Under the plans or Programs | |||||
| October 1, 2009 to October 31, 2009 |
— | $ | — | — | — | ||||
| November 1, 2009 to November 30, 2009 |
— | — | — | — | |||||
| December 1, 2009 to December 31, 2009 |
422 | 13.74 | — | — | |||||
| (1) | The number of shares of our common stock repurchased reflects the number of shares surrendered to the Company to pay withholding taxes in connection with the vesting of employee restricted stock awards. |
30
Table of Contents
Index to Financial Statements
| Item 6. | Selected Financial Data. |
The following table presents our selective financial information for the periods indicated which were derived from our consolidated financial statements. It should be read in conjunction with our consolidated financial statements and related notes (beginning on page F-1 at the end of this report) and other financial information included herein.
| Year Ended December 31, | ||||||||||||||||||||
| 2005 | 2006 | 2007 | 2008 (as adjusted)(2) |
2009 | ||||||||||||||||
| (in thousands, except share and per share data) | ||||||||||||||||||||
| Statement of Operations Data: |
||||||||||||||||||||
| Oil and natural gas sales |
$ | 19,026 | $ | 31,882 | $ | 67,883 | $ | 125,736 | $ | 94,294 | ||||||||||
| Expenses: |
||||||||||||||||||||
| Lease operations |
2,070 | 4,479 | 8,982 | 15,101 | 11,776 | |||||||||||||||
| Production and severance taxes(1) |
1,241 | 465 | 2,746 | 5,306 | (930 | ) | ||||||||||||||
| General and administrative |
3,389 | 5,829 | 8,717 | 16,899 | 21,390 | |||||||||||||||
| Depreciation, depletion and amortization |
3,982 | 8,046 | 18,681 | 31,744 | 31,006 | |||||||||||||||
| Impairment of oil and natural gas properties |
— | — | — | 192,650 | 188,150 | |||||||||||||||
| Total expenses |
10,682 | 18,819 | 39,126 | 261,700 | 251,392 | |||||||||||||||
| Income (loss) from operations |
8,344 | 13,063 | 28,757 | (135,964 | ) | (157,098 | ) | |||||||||||||
| Total non-operating income (expense) |
24 | (673 | ) | (3,862 | ) | (13,686 | ) | (23,401 | ) | |||||||||||
| Income (loss) before income taxes |
8,368 | 12,390 | 24,895 | (149,650 | ) | (180,499 | ) | |||||||||||||
| (Provision) benefit for income taxes |
(1,212 | ) | (3,415 | ) | (8,010 | ) | 25,013 | 33 | ||||||||||||
| Net income (loss) |
7,156 | 8,975 | 16,885 | (124,637 | ) | (180,466 | ) | |||||||||||||
| Net income attributable to non-controlling interest |
— | — | — | — | 173 | |||||||||||||||
| Net income (loss) applicable to GMX Resources |
7,156 | 8,975 | 16,885 | (124,637 | ) | (180,639 | ) | |||||||||||||
| Preferred stock dividends |
— | 1,799 | 4,625 | 4,625 | 4,625 | |||||||||||||||
| Net income (loss) applicable to GMX Resources common shareholders |
$ | 7,156 | $ | 7,176 | $ | 12,260 | $ | (129,262 | ) | $ | (185,264 | ) | ||||||||
| Earnings (loss) per share—basic |
$ | .81 | $ | .65 | $ | .94 | $ | (9.09 | ) | $ | (9.17 | ) | ||||||||
| Earnings (loss) per share—diluted |
$ | .79 | $ | .64 | $ | .93 | $ | (9.09 | ) | $ | (9.17 | ) | ||||||||
| Weighted average common |
8,797,529 | 11,120,204 | 13,075,560 | 14,216,466 | 20,210,400 | |||||||||||||||
| Weighted average common shares—diluted |
9,102,181 | 11,283,265 | 13,208,746 | 14,216,466 | 20,210,400 | |||||||||||||||
| Statement of Cash Flows Data: |
||||||||||||||||||||
| Cash provided by operating activities |
$ | 16,323 | $ | 38,333 | $ | 52,445 | $ | 83,237 | $ | 49,490 | ||||||||||
| Cash used in investing activities |
(39,549 | ) | (130,573 | ) | (194,998 | ) | (318,360 | ) | (181,324 | ) | ||||||||||
| Cash provided by financing activities |
24,756 | 94,807 | 143,500 | 235,932 | 160,672 | |||||||||||||||
| Balance Sheet Data (at end of period): |
||||||||||||||||||||
| Oil and natural gas properties, net |
$ | 58,927 | $ | 157,300 | $ | 320,955 | $ | 383,890 | $ | 331,329 | ||||||||||
| Total assets |
81,103 | 210,322 | 395,340 | 525,001 | 519,638 | |||||||||||||||
| Long-term debt, including current portion |
1,756 | 41,820 | 125,734 | 224,342 | 190,278 | |||||||||||||||
| Total GMX Resources equity |
61,225 | 131,481 | 208,926 | 243,743 | 243,947 | |||||||||||||||
| (1) | Production and severance taxes in 2006, 2007, 2008 and 2009 reflect severance tax refunds of $1.4 million, $518,000, $1.2 million, and $2.9 million, respectively, received or accrued during the year. |
| (2) | Certain amounts have been restated for correction of accounting errors and retroactively adjusted for the 2009 adoption of newly issued accounting standards related to convertible debt. See “Note B—Correction of Errors” and “Note C—Adoption of Accounting Principles” in our consolidated financial statements for the year ended December 31, 2009. |
31
Table of Contents
Index to Financial Statements
| Item 7. | Management’s Discussion and Analysis of Financial Condition and Results of Operation. |
Summary Operating and Reserve Data
The following table presents an unaudited summary of oil and natural gas production, production prices, production costs and oil and natural gas reserve data for the periods indicated.
| Year Ended December 31, | ||||||||||||||||||
| 2005 | 2006 | 2007 | 2008 | 2009 | ||||||||||||||
| Production: |
||||||||||||||||||
| Oil (MBbls) |
48 | 69 | 127 | 190 | 119 | |||||||||||||
| Natural gas (MMcf) |
1,930 | 3,915 | 7,974 | 11,777 | 12,908 | |||||||||||||
| Gas equivalent (MMcfe) |
2,220 | 4,327 | 8,735 | 12,918 | 13,620 | |||||||||||||
| Average daily (MMcfe) |
6.08 | 11.9 | 23.9 | 35.3 | 37.3 | |||||||||||||
| Average Sales Price: |
||||||||||||||||||
| Oil (per Bbl) |
||||||||||||||||||
| Wellhead price |
$ | 53.35 | $ | 63.22 | $ | 71.08 | $ | 99.16 | $ | 56.61 | ||||||||
| Effect of hedges |
— | — | (1.97 | ) | (10.19 | ) | 19.41 | |||||||||||
| Total |
$ | 53.35 | $ | 63.22 | $ | 69.11 | $ | 88.97 | $ | 76.02 | ||||||||
| Natural gas (per Mcf) |
||||||||||||||||||
| Wellhead price |
$ | 8.52 | $ | 6.79 | $ | 7.00 | $ | 9.50 | $ | 3.85 | ||||||||
| Effect of hedges |
— | 0.24 | 0.41 | (0.26 | ) | 2.76 | ||||||||||||
| Total |
$ | 8.52 | $ | 7.03 | $ | 7.41 | $ | 9.24 | $ | 6.61 | ||||||||
| Average sales price (per Mcfe) |
$ | 8.57 | $ | 7.37 | $ | 7.77 | $ | 9.73 | $ | 6.92 | ||||||||
| Operating and Overhead Costs (per Mcfe): |
||||||||||||||||||
| Lease operating expenses |
$ | 0.93 | $ | 1.04 | $ | 1.03 | $ | 1.17 | $ | 0.86 | ||||||||
| Production and severance taxes |
0.56 | 0.11 | 0.31 | 0.41 | (0.07 | ) | ||||||||||||
| General and administrative |
1.53 | 1.35 | 1.00 | 1.31 | 1.57 | |||||||||||||
| Total |
$ | 3.02 | $ | 2.50 | $ | 2.34 | $ | 2.89 | $ | 2.36 | ||||||||
| Cash Operating Margin (per Mcfe) |
$ | 5.55 | $ | 4.87 | $ | 5.43 | $ | 6.84 | $ | 4.56 | ||||||||
| Other (per Mcfe): |
||||||||||||||||||
| Depreciation, depletion and amortization—oil and natural gas production |
$ | 1.58 | $ | 1.59 | $ | 1.88 | $ | 2.08 | $ | 1.76 | ||||||||
| Estimated Net Proved Reserves (as of period-end): |
||||||||||||||||||
| Natural gas (Bcf) |
150.0 | 236.9 | 406.3 | 435.3 | 333.2 | |||||||||||||
| Oil (MMbls) |
2.0 | 2.7 | 4.7 | 5.0 | 3.7 | |||||||||||||
| Total (Bcfe) |
161.7 | 253.0 | 434.5 | 465.3 | 355.3 | |||||||||||||
| Estimated Future Net Revenues ($MM)(1)(2) |
$ | 692.9 | $ | 519.5 | $ | 1,896.3 | $ | 1,012.3 | $ | 625.7 | ||||||||
| Present Value ($MM)(1)(2) |
$ | 245.0 | $ | 173.3 | $ | 592.8 | $ | 280.7 | $ | 188.6 | ||||||||
| Standardized measure of discounted future net cash flows ($MM)(3) |
$ | 185.5 | $ | 134.4 | $ | 427.7 | $ | 228.8 | $ | 188.6 | ||||||||
| (1) | See “Item 1 Business—Certain Technical Terms.” |
| (2) | The 2009 prices used in calculating Estimated Future Net Revenues and the Present Value are determined using prices as prescribed by the SEC. Estimated Future Net Revenues and the Present Value give no effect to federal or state income taxes attributable to estimated future net revenues. See “Item 1 Business—Reserves.” |
| (3) | The standardized measure of discounted future net cash flows give effect to federal and state income taxes attributable to estimated future net revenues. In years where our effective tax rate is 0%, there is no effect to the standardized measure for federal or state taxes as was the case in 2009. See “Note N—Supplemental Information on Oil and Natural Gas Operations” in our consolidated financial statements. |
32
Table of Contents
Index to Financial Statements
We are an independent oil and gas company engaged in the exploration, development and production of oil and natural gas from the Haynesville/Bossier Shale and Cotton Valley Sands in our core area, the Sabine Uplift of the Carthage, North Field of Harrison and Panola counties of east Texas. We consider and report all of our operations as one segment because our operating areas have similar economic characteristics and each meet the criteria for aggregation as defined in the Financial Accounting Standards Board Accounting Standards Codification 280.
Our strategy is to grow shareholder value through Haynesville/Bossier Shale horizontal well development as well as Cotton Valley Sand wells, to continue acreage acquisitions in our core area, to focus on operational growth in and around our core area, and to convert our natural gas reserves to proved reserves, while maintaining balanced prudent financial management.
Results of Operations—Year ended December 31, 2009 Compared to Year ended December 31, 2008
Certain amounts in 2008 have been restated as disclosed in Note B to the consolidated financial statements and reflect retrospective adjustments for the adoption of ASC 470-20 as disclosed in Note C to the consolidated financial statements.
Oil and Natural Gas Sales. Oil and natural gas sales in the year ended December 31, 2009 decreased 25% to $94.3 million compared to the year ended December 31, 2008. This decrease is due to lower natural gas and oil prices of 29%, offset by a 5% increase in natural gas and oil production. The average prices per barrel of oil and mcf of natural gas received in the year ended December 31, 2009 were $76.02 and $6.61, respectively, compared to $88.97 and $9.24, respectively, in the year ended December 31, 2008. Production of oil decreased to 119 MBbls compared to 190 MBbls for 2008. The decrease in oil production is due to the natural decline in the Company’s Cotton Valley Sands vertical well production, which has historically provided most of the Company’s oil production. H/B horizontal wells typically do not have oil production. Natural gas production increased to 12,908 MMcf for 2009 compared to 11,777 MMcf for the year ended December 31, 2008, an increase of 10%. The increase in natural gas production resulted from production related to 12 producing H/B horizontal wells that were on-line during 2009. Production from H/B horizontal wells accounted for 33% of total production for 2009 compared to 1% for 2008.
In the year ended December 31, 2009, as a result of hedging activities, we recognized an increase in oil and natural gas sales of $37.9 million, compared to a decrease in oil and natural gas sales of $5.0 million in the year ended December 31, 2008. In the year ended December 31, 2009, hedging increased the average natural gas and oil sales price by $2.76 per Mcf and $19.41 per Bbl compared to a reduction of the average natural gas and oil sales price by $0.26 per Mcf and $10.19 per Bbl in the year ended December 31, 2008.
Lease Operations. Lease operations expense decreased $3.3 million in the year ended December 31, 2009 to $11.8 million, a 22% decrease compared to the year ended December 31, 2008. Lease operations expense on an equivalent unit of production basis was $0.86 per Mcfe in the year ended December 31, 2009 compared to $1.17 per Mcfe for the year ended December 31, 2008. The decrease in lease operating expenses on an equivalent unit basis resulted from an increase in H/B horizontal well production and cost control measures implemented during 2009. With little to no incremental increase in lease operating costs from a typical Cotton Valley Sands vertical well, the significantly larger amount of production from a typical H/B horizontal well results in lower per unit lease operating costs.
Production and Severance Taxes. Partially as a result of the recognition of severance tax refunds of approximately $2.9 million in 2009, production and severance taxes decreased 118% from an expense of $5.3 million in the year ended December 31, 2008 to income of $0.9 million in the year ended December 31, 2009. Upon approval by the State of Texas, certain high cost wells, including our H/B horizontal wells, are exempt from severance taxes for a period of ten years and we expect this to reduce our expense going forward. Excluding the production and severance tax refunds received in 2009, production and severance tax expense also decreased $3.3 million in comparison to 2008 due to a decrease in oil and natural gas prices between the two periods and the fact that more producing wells in 2009 have received the production and severance tax exemptions.
33
Table of Contents
Index to Financial Statements
General and Administrative Expense. General and administrative expense for the year ended December 31, 2009 was $21.4 million compared to $16.9 million for the year ended December 31, 2008, an increase of 27%. The increase of $4.5 million was due to an increase in administrative and supervisory personnel. General and administrative expense per equivalent unit of production was $1.57 per Mcfe for the year ended December 31, 2009 compared to $1.31 per Mcfe for the comparable period in 2008. Approximately $4.6 million or 22% of the general and administrative expenses in 2009 was related to non-cash compensation expense compared to $3.1 million or 18% in 2008. A significant portion of the Company’s general and administrative expense is related to non-cash compensation expense. General and administrative expense has not historically varied in direct proportion to oil and natural gas production because certain types of general and administrative expenses are non-recurring or fixed in nature. The Company expects general and administrative expenses on a per Mcfe basis to decrease as production increases.
Depreciation, Depletion and Amortization. Depreciation, depletion and amortization expense decreased 0.7 million to $31.0 million in the year ended December 31, 2009, down 2% from the year ended December 31, 2008. The oil and gas properties depreciation, depletion and amortization rate per equivalent unit of production was $1.76 per Mcfe in the year ended December 31, 2009 compared to $2.08 per Mcfe in the year ended December 31, 2008. The depletion rate decrease was due to a lower cost basis in oil and gas properties subject to amortization due to previously recorded impairment charges as a result of lower crude oil and natural gas prices at year end 2008 and 2009.
Impairment of oil and natural gas properties. As a result of the continued decline in natural gas prices from year-end 2008, which limited the amount of oil and gas properties that could be capitalized on the balance sheet under the SEC’s “ceiling” test, we recognized an impairment charge on oil and gas properties of $188.2 million in the year ended December 31, 2009 compared to an impairment charge on oil and gas properties of $192.7 million in the year ended December 31, 2008. The Company may be required to recognize additional impairment charges or writedowns in future reporting periods if market prices for oil or natural gas continue to decline or remain at their depressed levels.
Interest. Interest expense for the year ended December 31, 2009 was $16.1 million compared to $13.6 million for the year ended December 31, 2008. This increase is due to a greater amount of outstanding debt during 2009 and an increase in non-cash interest expense related to our convertible notes. Interest expense for the years ended December 31, 2008 and 2009 includes non-cash interest expense of $1.9 million and $3.9 million, respectively related to the accretion of the 5.00% senior convertible notes due 2013 and the 4.50% convertible senior notes due 2015.
Loss on Extinguishment of Debt. In October 2009, we entered into an amendment with the Prudential Insurance Company of America (“Prudential”), pursuant to which Prudential agreed to accept repayment of its senior secured subordinated notes with the proceeds of our offering of 4.50% convertible senior notes due 2015. We repaid all the senior secured subordinated notes on October 29, 2009. As a result of prepaying the senior secured subordinated notes, we recognized a pre-payment penalty of $4.6 million and expensed remaining deferred debt issue costs of $0.3 million.
Income Taxes. Income tax for 2009 was a benefit of $33,000 as compared to a benefit of $25.0 million in 2008. The effective tax rates for 2008 and 2009 were 17% and 0%, respectively. The decrease in the effective tax rate from the 34% statutory tax rate in the years ended December 31, 2008 and 2009 was due to $11.5 million and $17.5 million, respectively, of deferred tax expense relating to a valuation allowance for deferred tax assets that reduced our tax benefit.
Results of Operations—Year ended December 31, 2008 Compared to Year ended December 31, 2007
Certain amounts in 2008 have been restated as disclosed in Note B to the consolidated financial statements and reflect retrospective adjustments for the adoption of a new accounting pronouncement related to the accounting for our convertible notes, as disclosed in Note C to the consolidated financial statements.
34
Table of Contents
Index to Financial Statements
Oil and Natural Gas Sales. Oil and natural gas sales in the year ended December 31, 2008 increased 85% to $125.7 million compared to the year ended December 31, 2007. Of the increase, 48% is due to higher natural gas and oil production and 25% to an increase in natural gas and oil prices. The average prices per barrel of oil and mcf of natural gas received in the year ended December 31, 2008 were $88.97 and $9.24, respectively, compared to $69.11 and $7.41, respectively, in the year ended December 31, 2007. Production of oil increased to 190 MBbls compared to 127 MBbls for 2007. Natural gas production increased to 11,777 MMcf for 2008 compared to 7,974 MMcf for the year ended December 31, 2007, an increase of 48%.
In the year ended December 31, 2008, as a result of hedging activities, we recognized a decrease in oil and natural gas sales of $5 million, compared to an increase in oil and natural gas sales of $3 million in the year ended December 31, 2007. In the year ended December 31, 2008, hedging reduced the average natural gas and oil sales price by $0.26 per Mcf and $10.19 per Bbl compared to an increase in natural gas sales price of $0.41 per Mcf and a decrease in oil sales price by $1.97 per Bbl in the year ended December 31, 2007.
Lease Operations. Lease operations expense increased $6.1 million in the year ended December 31, 2008 to $15.1 million , a 68% increase compared to the year ended December 31, 2007. Increased expense resulted from a greater number of producing wells in addition to maintenance expenses for the Company’s growing field operations. Lease operations expense on an equivalent unit of production basis was $1.17 per Mcfe in the year ended December 31, 2008 compared to $1.03 per Mcfe for the year ended December 31, 2007.
Production and Severance Taxes. Production and severance taxes increased 93% to $5.3 million in the year ended December 31, 2008 compared to $2.7 million in the year ended December 31, 2007. Production and severance taxes are assessed on the value of the oil and natural gas produced. The above increase resulted from higher oil and natural gas sales described above offset by severance tax refunds of approximately $1.2 million recorded in 2008. A growing number of wells with natural gas production are exempt from severance taxes or have reduced severance tax rates. We recognized severance tax refunds of approximately $518,000 in 2007. Upon approval from the State of Texas, certain wells are exempt from severance taxes or eligible for a reduced severance tax rate for a period of ten years.
Depreciation, Depletion and Amortization. Depreciation, depletion and amortization expense increased $13.0 million to $31.7 million in the year ended December 31, 2008, up 70% from the year ended December 31, 2007. This increase is due to higher production levels and higher costs. The oil and gas properties depreciation, depletion and amortization rate per equivalent unit of production was $2.08 per Mcfe in the year ended December 31, 2008 compared to $1.88 per Mcfe in the year ended December 31, 2007. The depletion rate increase was largely the result of lower oil and natural gas prices reducing the economic lives and reserves on our wells, which resulted in our oil and natural gas properties being amortized over a smaller reserve base than if reserves were calculated at higher prices.
General and Administrative Expense. General and administrative expense for the year ended December 31, 2008 was $16.9 million compared to $8.7 million for the year ended December 31, 2007, an increase of 94%. The increase of $8.2 million was largely the result of hiring additional administrative and supervisory personnel to manage our growth and compensation increases implemented on July 1, 2008 to align our compensation more closely with our peers. Approximately $3.1 million of the general and administrative expenses was related to non-cash compensation expense compared to $1.6 million in 2007. Additionally, we recorded a $748,000 charge to bad debt expense related to our estimated exposure from a bankruptcy filed by one of our oil purchasers. General and administrative expense per equivalent unit of production was $1.31 per Mcfe for the year ended December 31, 2008 compared to $1.00 per Mcfe for the comparable period in 2007. Excluding the charge to bad debt expense, general and administrative expense on a per unit of production would have been $1.11 per Mcfe for the year-ended 2008. Longer term, general and administrative costs should decline on a per unit basis as our production increases from the Haynesville/Bossier Shale development.
Impairment of oil and natural gas properties. As a result of lower oil and gas prices, which limited the amount of oil and gas properties that could be capitalized on the balance sheet under the SEC’s “ceiling” test, we recognized an impairment charge on oil and gas properties of $192.7 million.
35
Table of Contents
Index to Financial Statements
Interest. Interest expense for the year ended December 31, 2008 was $13.6 million compared to $4.1 million for the year ended December 31, 2007. This increase is due to a greater amount of outstanding debt during 2008. Interest expense for the year ended December 31, 2008 included non-cash interest expense of $1.9 million related to the accretion of the 5.00% convertible senior notes due 2013.
Income Taxes. Income tax for 2008 was a benefit of $25.0 million as compared to an expense of $8.0 million in 2007. The effective tax rates for 2007 and 2008 were 32% and 17%, respectively. The decrease in the effective tax rate in 2008 was due to $11.5 million of deferred tax expense relating to a valuation allowance established for deferred tax assets that reduced our tax benefit.
Net Income and Net Income per Share
Net Income and Net Income Per Share—Year Ended December 31, 2009 Compared to Year Ended December 31, 2008. For the year ended December 31, 2009 and 2008, we reported net loss of $180.5 million and $124.6 million, respectively. Excluding the impairment charge of $188.2 million related to our oil and natural gas properties, the loss on the extinguishment of debt of $5.0 million, and other non-cash charges of $2.9 million, we would have reported net income of $10.7 million for the year ended December 31, 2009. Excluding the impairment charge of $192.7 million ($127.2 million after income taxes) related to our oil and natural gas properties, a non-cash charge to deferred income taxes for a valuation allowance on our net deferred tax asset of $26.1 million and other non-cash charges of $0.7 million, net of tax, we would have reported net income of $24.7 million for the year ended December 31, 2008. Net loss per basic and fully diluted share was $9.17 for the year ended 2009 compared to net loss per basic and fully diluted share of $9.09 for the year ended 2008. Excluding the impairment charge related to our oil and natural gas properties, the loss on the extinguishment of debt, and other non-cash charges including unrealized losses on derivatives, net income per basic and fully diluted share for 2009 would have been $0.53.
Net Income and Net Income Per Share—Year Ended December 31, 2008 Compared to Year Ended December 31, 2007. For the year ended December 31, 2008 and 2007, we reported net loss of $124.6 million and net income of $16.9 million, respectively. Excluding the impairment charge of $192.7 million ($127.2 million after income taxes) related to our oil and natural gas properties and a non-cash charge to deferred income taxes for a valuation allowance on our net deferred tax asset of $26.1 million and other non-cash charges of $0.7 million, net of tax, we would have reported net income of $24.7 million for the year ended December 31, 2008. Net loss per basic and fully diluted share was $9.09, for the year ended 2008 compared to net income per basic and fully diluted share of $0.94 and $0.93 for the year ended December 31, 2007, respectively. Excluding the impairment charge related to our oil and natural gas properties and the valuation allowance on our net deferred tax asset and other non-cash charges including unrealized losses on derivatives, net income per basic and fully diluted share for 2008 would have been $1.74 and $1.62, respectively.
Capital Resources and Liquidity
Our business is capital intensive. Our ability to grow our reserve base is dependent upon our ability to obtain outside capital and generate cash flows from operating activities to fund our drilling and capital expenditures. Our cash flows from operating activities are substantially dependent upon crude oil and natural gas prices, and significant decreases in market prices of crude oil or natural gas could result in reductions of cash flow and affect our drilling and capital expenditure plan. To mitigate a portion of our exposure to fluctuations in commodity prices, we typically enter into crude oil and natural gas swaps, collars, three-way collars, and put spreads.
For the year ended December 31, 2009, our capital expenditures were $179.3 million of which $116.3 million was for drilling and completing H/B horizontal wells; $9.2 million was for rig delay fees; $15.9 million on Cotton Valley Sands and Travis Peak drilling and other drilling related expenditures including tubular inventory and $37.9 million was related to leasehold and infrastructure costs. Anticipated 2010 capital expenditure guidance is $175 million for a three H/B Hz rig drilling program. We continually review our drilling
36
Table of Contents
Index to Financial Statements
and capital expenditure plans and may change the amount we spend based on industry conditions and the availability of capital. We believe our cash in bank, cash flow from operating activities and our availability under our revolving bank credit facility ($130 million at December 31, 2009) are sufficient to fund our 2010 planned oil and gas capital expenditure program.
During 2009, we have accessed the capital markets and sold non-core assets to fund our H/B horizontal drilling program. In May 2009, we were successful in raising $65.3 million, net of expenses, from the sale of 5.75 million shares of common stock. In October 2009, we were again successful in raising $98.8 million, net of expenses, from the sale of 6.95 million shares of common stock and $82.8 million from the issuance of 4.50% convertible senior notes due 2015. In addition to these capital market transactions, we received $36.0 million in November 2009 from the partial monetization of our mid-stream assets in the Endeavor Gathering transaction. We expect that this capital raised during 2009 will be sufficient to fund a three rig drilling program through the point at which our discretionary cash flows will exceed our capital expenditures. We will continually adjust our capital expenditures based on the current commodity price environment to ensure that we have adequate liquidity in cash and/or with availability under our revolving bank credit facility. We anticipate using various derivative contracts such as puts, put spreads, and collars to mitigate natural gas and crude oil price risk on 60% to 80% of our expected production over a rolling 36 month period.
Cash Flow—Year Ended December 31, 2009 Compared to Year Ended December 31, 2008. In 2009, we had a positive cash flow from operating activities of $49.5 million. Our cash flow from operating activities in 2008 was $83.2 million. Cash flow from operating activities before changes in operating assets and liabilities and after preferred stock dividends was $50.4 million in 2009 compared to $73.7 million in 2008. This resulted from a 25% decrease in oil and natural gas sales in 2009. We received a net $160.7 million in cash from financing activities in 2009 compared to 2008 amounts of $235.9 million. The cash flow from financing activities in 2009 was primarily from the sale of common stock of $164.1 million, issuance of 4.50% convertible senior notes due 2015 of $86.3 million, and the sale of the equity interest in Endeavor Gathering for $36.0 million, offset by paydowns of debt under our revolving bank credit facility and Senior Secured Notes totaling $213.7 million. The cash flow from financing activities in 2008 was primarily from the sale of common stock of $134.7 million, issuance of 5.00% convertible senior notes due 2013 of $125.0 million and additional debt under our revolving bank credit facility.
Cash Flow—Year Ended December 31, 2008 Compared to Year Ended December 31, 2007. In 2008, we had a positive cash flow from operating activities of $83.2 million as a result of increased production volume and higher oil and natural gas prices during 2008. Our cash flow from operating activities in 2007 was $52.4 million. Cash flow from operating activities before changes in operating assets and liabilities and after preferred stock dividends was $73.7 million compared to $40.8 million in 2007. This resulted from an 85% increase in oil and natural gas sales in 2008. We received a net $235.9 million in cash from financing activities in 2008 compared to 2007 amounts of $143.5 million. The cash flow from financing activities in 2008 was largely due to the sale of common stock of $134.7 million, issuance of 5.00% convertible senior notes due 2013 of $125.0 million and additional debt under our revolving bank credit facility. The cash inflow in 2007 from financing activities primarily resulted from the sale of common stock, private placement of Senior Secured Notes and additional debt under our revolving bank credit facility.
Revolving Bank Credit Facility and Other Debt
Revolving Bank Credit Facility. We have a secured revolving bank credit facility, which matures on July 15, 2011 and provides for a line of credit of up to $250 million (the “commitment”), subject to a borrowing base, which is based on a periodic evaluation of oil and gas reserves (“borrowing base”). The amount of credit available at any one time under the credit facility is the lesser of the borrowing base or the amount of the commitment.
The loan bears interest at a rate elected by us which is based on the prime, LIBO or federal funds rate plus margins ranging from 1% to 4.75% depending on the base rate used and the amount of the loan outstanding in
37
Table of Contents
Index to Financial Statements
relation to the borrowing base. Principal is payable voluntarily by us or is required to be paid (i) if the loan amount exceeds the borrowing base; (ii) if the Lender elects to require periodic payments as part of a borrowing base redetermination; and (iii) at the maturity date of July 15, 2011. The Company is obligated to pay a facility fee equal to 0.5% per year of the unused portion of the borrowing base payable quarterly.
The borrowing base has been adjusted from time to time and was $130.0 million at December 31, 2009. The loan is secured by a first mortgage on substantially all of our oil and natural gas properties, a pledge of our ownership of the equity interests in subsidiaries, a guaranty from certain of our subsidiaries and a security interest in all of the assets of certain of our subsidiaries.
Effective as of October 17, 2009, we amended the terms of our revolving bank credit facility to document our lenders’ consent to the Endeavor Gathering transaction and the release by the lenders of the contributed assets from the collateral pledged in support of the indebtedness under the revolving credit facility. As part of the amendment, we also agreed to the inclusion of certain covenants in the revolving credit facility that prohibit the creation of certain debt or the creation or incurrence of certain liens by Endeavor Gathering. In addition to the amendments relating to the Endeavor Gathering transaction, this amendment also amended the terms of the revolving bank credit facility to: (i) permit us to offer and sell our 4.50% convertible senior notes due 2015 and to make certain related changes to provisions of the revolving bank credit facility restricting us from (a) selling 4.50% convertible senior notes due 2015 with an aggregate principal amount greater than the amount received by us in our concurrent offering of common stock, and (b) making any payment of principal or interest on the 4.50% convertible senior notes due 2015 if we are in default under the revolving bank credit facility at the time or if any such a payment would cause a default; and (ii) remove the minimum net worth covenant previously imposed on us under the revolving bank credit facility.
In addition to customary reporting and compliance requirements, the principal covenants, as amended as of December 31, 2009, under the revolving bank credit facility are:
| • | Maintain a current ratio (as defined in the loan agreement) of not less than 1 to 1; |
| • | Maintain on a quarterly basis a rolling four quarter ratio of EBITDA to cash interest expense and preferred dividends of not less than 3 to 1; |
| • | Maintain on a quarterly basis a ratio of total debt to EBITDA of no more than 4 to 1; |
| • | Maintain a hedging program on mutually acceptable terms whenever the loan amount outstanding exceeds 75% of the borrowing base; |
| • | Pay all accounts payable within 60 days of the due date other than those being contested in good faith; |
| • | Not incur any other debt other than our Series B Preferred Stock, our $125 million of 5.00% convertible senior notes due 2013, and our $86.5 million of 4.50% convertible senior notes due 2015; |
| • | Not permit any liens other than those permitted by the loan agreement; |
| • | Not make any investments, loans or advances other than as permitted by the loan agreement, which includes permitted investment in Diamond Blue Drilling for no more than three drilling rigs; |
| • | Not engage in any mergers or consolidations or sales of all or substantially all of our assets; |
| • | Not pay any dividends on common stock or make any other distributions with respect to our stock, including stock repurchases; |
| • | Not permit Ken L. Kenworthy Jr. to cease being our chief executive officer, other than by reason of his death or disability unless we name a successor acceptable to the lenders within four months; |
| • | Not permit a person or group (other than existing management) to acquire more than 50% of the outstanding common stock or otherwise suffer a change in control; and |
38
Table of Contents
Index to Financial Statements
| • | Not to make any cash payments in respect of interest or on account of the conversion, purchase, acquisition or termination of our 5.00% convertible senior notes due 2013 or our 4.50% convertible senior notes due 2015 unless no event of default under the loan agreement exists or the payment would not result in such a default and the borrowing base has not been exceeded. |
As of December 31, 2009, we were in compliance with all financial covenants under the revolving bank credit facility.
We will borrow under the revolving bank credit facility up to the borrowing base, currently $130 million, all of which is available as of December 31, 2009, to fund planned capital expenditures and for other general corporate purposes. Our lending bank group consists of Capital One, N.A., BNP Paribas, Union Bank of California, N.A., Compass Bank, Fortis Capital Corp. and Bank of America, N. A.
5.00% Convertible Senior Notes Due 2013. In February 2008, we completed a $125 million private placement of 5.00% Convertible Senior Notes due 2013 (the “5.00% Convertible Notes”). Net proceeds of approximately $121 million were used to repay our revolving bank credit facility and other indebtedness. The 5.00% Convertible Notes are governed by an indenture, dated as of February 15, 2008 (the “Indenture”) between the Company and The Bank of New York Trust Company, N.A., as trustee (the “Trustee”).
The 5.00% Convertible Notes bear interest at a rate of 5.00% per year, payable semiannually in arrears on February 1 and August 1 of each year, beginning August 1, 2008. The 5.00% Convertible Notes mature on February 1, 2013, unless earlier converted or repurchased by us. Holders may convert their 5.00% Convertible Notes at their option prior to the close of business on the business day immediately preceding November 1, 2012 only under the following circumstances:
| • | during any fiscal quarter commencing after March 31, 2008 if the last reported sale price of our common stock for at least 20 trading days during a period of 30 consecutive trading days ending on the last trading day of the preceding fiscal quarter is greater than or equal to 130% of the applicable conversion price on each such trading day; |
| • | during the five business-day period after any five consecutive trading-day period in which the trading price per $1,000 principal amount of 5.00% Convertible Notes for each day of that measurement period was less than 98% of the product of the last reported sale price of our common stock and the applicable conversion rate on each such day; |
| • | upon the occurrence of a corporate event pursuant to which: (1) we issue rights to all or substantially all of the holders of our common stock entitling them to purchase, for a period expiring within 60 days after the date of the distribution, shares of our common stock at a price below the average market price at the time, or (2) we distribute to all or substantially all of the holders of our common stock our assets, debt securities or rights to purchase our securities, if the distribution has a per share value in excess of 10% of the last reported sale price for our common stock at the time; or |
| • | if: (1) a “person” or “group” within the meaning of Section 13(d) of the Exchange Act acquires more than 50% of our outstanding voting stock, (2) we consummate a recapitalization, reclassification or change of our common stock as a result of which our common stock would be converted into or exchanged for stock, other securities, other property or assets, (3) we consummate a share exchange, consolidation or merger pursuant to which our common stock will be converted into cash, securities or other property, (4) we consummate any sale, lease or other transfer in one transaction or a series of transactions of all or substantially all of our and our subsidiaries’ consolidated assets to any person other than one of our subsidiaries, (5) continuing directors cease to constitute at least a majority of our board of directors, (6) our shareholders approve any plan or proposal for our liquidation or dissolution, or (7) our common stock ceases to be listed on a United States national or regional securities exchange (any of the events described in clauses (1) through (7), a “fundamental change”). |
39
Table of Contents
Index to Financial Statements
On and after November 1, 2012 until the close of business on the business day immediately preceding the maturity date, holders may convert their 5.00% Convertible Notes at any time, regardless of the foregoing circumstances.
Upon conversion, we will satisfy our conversion obligation by paying and delivering cash for the lesser of the principal amount or the conversion value, and, if the conversion value is in excess of the principal amount, by paying or delivering, at our option, cash and/or shares of our common stock for such excess. The conversion value is a daily value calculated on a proportionate basis for each day of a 60 trading-day observation period.
The conversion rate is initially 30.7692 shares of our common stock per $1,000 principal amount of 5.00% Convertible Notes (equivalent to a conversion price of approximately $32.50 per share of common stock). The conversion rate is subject to adjustment in some events but will not be adjusted for accrued interest. In addition, following any fundamental change that occurs prior to the maturity date, we will increase the conversion rate for a holder who elects to convert its 5.00% Convertible Notes in connection with such a fundamental change in certain circumstances. The increase in the conversion rate is determined based on a formula that takes into consideration our stock price at the time of the fundamental change (ranging from $25.00 to $150.00 per share) and the remaining time to maturity of the 5.00% Convertible Notes. The increase in the conversion rate ranges from 0% to 30%, increasing as the stock price at the time of the fundamental change increases from $25.00 and declining as the remaining time to maturity of the 5.00% Convertible Notes decreases.
We may not redeem the 5.00% Convertible Notes prior to maturity. However, if we undergo a fundamental change, holders may require us to repurchase the 5.00% Convertible Notes in whole or in part for cash at a price equal to 100% of the principal amount of the 5.00% Convertible Notes to be repurchased plus any accrued and unpaid interest (including additional interest, if any) to, but excluding, the fundamental change repurchase date.
The 5.00% Convertible Notes are senior unsecured obligations of the Company and rank equally in right of payment to all of our other existing and future senior indebtedness and our existing 4.50% Convertible Notes discussed below. The 5.00% Convertible Notes are effectively subordinated to all our secured indebtedness, including indebtedness under our revolving bank credit facility and our senior secured notes, to the extent of the value of our assets pledged as collateral for such indebtedness. The 5.00% Convertible Notes are also effectively subordinated to all liabilities of our subsidiaries, including liabilities under any guarantees they have issued.
4.50% Convertible Senior Notes Due 2015. In October 2009, we completed an $86.3 million public offering of 4.50% convertible senior notes due 2015 (“4.50% Convertible Notes”). The proceeds of the offering were used to repay the Senior Subordinated Secured Notes due 2012 and a portion of the outstanding indebtedness under the revolving bank credit facility.
The 4.50% Convertible Notes bear interest at a rate of 4.50% per year, payable semiannually in arrears on May 1 and November 1 of each year, beginning May 1, 2010. The 4.50% Convertible Notes mature on May 1, 2015, unless earlier converted or repurchased by us. Holders may convert their notes prior to the close of business on the business day immediately preceding February 1, 2015, only under the following circumstances:
| • | during any fiscal quarter commencing after January 1, 2010, if the last reported sale price of our common stock for at least 20 trading days during a period of 30 consecutive trading days ending on the last trading day of the preceding fiscal quarter is greater than or equal to 130% of the applicable conversion price on each such trading day; |
| • | during the five business-day period after any five consecutive trading-day period in which the trading price per $1,000 principal amount of 4.50% Convertible Notes for each day of such five consecutive trading-day period was less than 98% of the product of the last reported sale price of our common stock and the applicable conversion rate on each such day; |
| • | upon the occurrence of a corporate event pursuant to which: (1) we issue rights to all or substantially all of the holders of our common stock entitling them to purchase, for a period of not more than 60 |
40
Table of Contents
Index to Financial Statements
| calendar days after the announcement date of such issuance to subscribe for or purchase, shares of our common stock at a price per share less than the average of the last reported sale prices of our common stock for the 10 consecutive trading day period ending on the trading day immediately preceding the date of announcement of such issuance; (2) we distribute to all or substantially all of the holders of our common stock our assets, debt securities or rights to purchase our securities, if the distribution has a per share value in excess of 10% of the last reported sale price for our common stock on the trading day immediately preceding the date of announcement of such distribution; or (3) we are a party to a consolidation, merger, binding share exchange, or transfer or lease of all or substantially all of our assets, pursuant to which our common stock would be converted into cash, securities or other assets; |
| • | if: (1) a “person” or “group” within the meaning of Section 13(d) of the Exchange Act acquires more than 50% of our outstanding voting stock, (2) we consummate a recapitalization, reclassification or change of our common stock as a result of which our common stock would be converted into or exchanged for stock, other securities, other property or assets, less than 90% of which received by our common shareholders consists of publicly traded securities, (3) we consummate a share exchange, consolidation or merger pursuant to which our common stock will be converted into cash, securities or other property, (4) we consummate any sale, lease or other transfer in one transaction or a series of transactions of all or substantially all of our and our subsidiaries’ consolidated assets to any person other than one of our subsidiaries, (5) continuing directors cease to constitute at least a majority of our board of directors, (6) our shareholders approve any plan or proposal for our liquidation or dissolution, or (7) our common stock ceases to be listed on any of The New York Stock Exchange, The NASDAQ Global Select Market or The NASDAQ Global Market; or |
| • | if we call the 4.50% Convertible Notes for redemption, at any time prior to the close of business on the business day prior to the redemption date (any of the events described in the fourth and fifth bullets above, a “make-whole fundamental change”). |
On and after February 1, 2015 until the close of business on the business day immediately preceding the maturity date, holders may convert their 4.50% Convertible Notes, in multiples of $1,000 principal amount, at the option of the holder regardless of the foregoing circumstances.
Upon conversion, we will satisfy our conversion obligation by paying or delivering cash, shares of our common stock or a combination of cash and shares of our common stock, at our election. The conversion rate is initially 53.3333 shares of our common stock per $1,000 principal amount of 4.50% Convertible Notes (equivalent to a conversion price of approximately $18.75 per share of our common stock). The conversion rate is subject to adjustment in some events but will not be adjusted for accrued and unpaid interest. In addition, following any make-whole fundamental change that occurs prior to the maturity date, we will increase the conversion rate for a holder who elects to convert its 4.50% Convertible Notes in connection with such a make-whole fundamental change in certain circumstances. The increase in the conversion rate is determined based on a formula that takes into consideration our stock price at the time of the make-whole fundamental change (ranging from $15.00 to $100.00 per share) and the remaining time to maturity of the 4.50% Convertible Notes. The increase in the conversion rate declines from a high of 25.0% to 0.0% as the stock price at the time of the make-whole fundamental change increases from $15.00 and the remaining time to maturity of the 4.50% Convertible Notes decreases.
On or after November 1, 2012, and prior to the maturity date, we may redeem for cash all, but not less than all, of the 4.50% Convertible Notes if the last reported sales price of our common stock equals or exceeds 130% of the conversion price then in effect for 20 or more trading days in a period of 30 consecutive trading days ending on the trading day immediately prior to the date of the redemption notice. The redemption price will equal 100% of the principal amount of the 4.50% Convertible Notes to be redeemed plus any accrued and unpaid interest, including any additional interest, to, but excluding, the redemption date. To the extent a holder converts its 4.50% Convertible Notes in connection with our redemption notice, we will increase the conversion rate as described in the preceding paragraph.
41
Table of Contents
Index to Financial Statements
The 4.50% Convertible Notes are senior, unsecured obligations of the Company and rank equally in right of payment with our senior unsecured debt and our existing 5.00% Convertible Notes, and are senior in right of payment to our debt that is expressly subordinated to the 4.50% Convertible Notes, if any. The 4.50% Convertible Notes are structurally subordinated to all debt and other liabilities and commitments of our subsidiaries, including our subsidiaries’ guarantees of our indebtedness under our revolving bank credit facility, and are effectively junior to our secured debt to the extent of the assets securing such debt.
Senior Subordinated Secured Notes. In July 2007, we entered into a Note Purchase Agreement (“Note Agreement”) with The Prudential Insurance Company of America (“Prudential”) providing for the issuance and sale from time to time of up to $100 million in senior subordinated secured notes (the “Secured Notes”) and sold to Prudential an initial tranche of $30 million of 7.58% Series A fixed rate notes due July 31, 2012 with interest payable quarterly. Proceeds from the sale of the Secured Notes were used for general corporate purposes including additional funding of drilling and development costs in the Cotton Valley Sands in East Texas. On October 18, 2009, the Company entered into an amendment with Prudential to provide for the repayment of the outstanding indebtedness of the Secured Notes. The Company repaid all of the outstanding indebtedness under the Secured Notes with a portion of the proceeds from the 4.50% Convertible Notes issued in October 2009. The terms of the repayment included a prepayment penalty of $4.6 million.
Share Lending Agreement
In February 2008, in connection with the offer and sale of the 5.00% Convertible Notes, we entered into a share lending agreement (the “Share Lending Agreement”) with an affiliate of Jefferies & Company, Inc. (the “share borrower”) and Jefferies & Company, Inc., as collateral agent for the Company. Under this agreement, we will loan to the share borrower up to the maximum number of shares of our common stock underlying the 5.00% Convertible Notes during a specified loan availability period. This maximum number of shares is initially 3,846,150 shares. We will receive a loan fee of $0.001 per share for each share of our common stock that we loan to the share borrower, payable at the time such shares are borrowed. The share borrower may borrow and re-borrow up to the maximum number of shares of our common stock during the loan availability period. As of December 31, 2009, 3,140,000 shares of our common stock were subject to outstanding loans to the share borrower, although 500,000 of such shares were returned to us in March 2010.
The share borrower’s obligations under the Share Lending Agreement are unconditionally guaranteed by Jefferies Group, Inc., the ultimate parent company of the share borrower and Jefferies & Company, Inc. (the “guarantor”). If the guarantor receives a rating downgrade for its long term unsecured and unsubordinated debt below a specified level by both Standard & Poor’s Ratings Services and Moody’s Investors Service, Inc. (or any substitute rating agency mutually agreed upon by the Company and the share borrower), or by either of such rating agencies in certain circumstances, the share borrower has agreed to post and maintain with Jefferies & Company, Inc., acting as collateral agent for the Company, collateral in the form of cash, government securities, certificates of deposit, high-grade commercial paper of U.S. issuers, letters of credit or money market shares with a market value at least equal to 100% of the market value of the shares of our common stock borrowed by the share borrower as security for the share borrower’s obligation to return the borrowed shares to the Company pursuant to the Share Lending Agreement.
The loan availability period under the Share Lending Agreement commenced on the date of the Share Lending Agreement and will continue until the date that any of the following occurs:
| • | we notify the share borrower in writing of our intention to terminate the Share Lending Agreement at any time after the entire principal amount of the 5.00% Convertible Notes ceases to be outstanding as a result of conversion, repurchase, at maturity or otherwise; |
| • | we and the share borrower agree to terminate the Share Lending Agreement; |
42
Table of Contents
Index to Financial Statements
| • | we elect to terminate all of the outstanding loans upon a default by the share borrower under the Share Lending Agreement or by the guarantor under its guarantee, including a breach by the share borrower of any of its obligations or a breach in any material respect of any of the representations or covenants under the Share Lending Agreement or a breach by the guarantor of the guarantee, or the bankruptcy of the share borrower or the guarantor; or |
| • | the share borrower elects to terminate all outstanding loans upon the bankruptcy of the Company. |
Any shares we loan to the share borrower will be issued and outstanding for corporate law purposes, and accordingly, the holders of the borrowed shares will have all of the rights of a holder of a share of our outstanding common stock, including the right to vote the shares on all matters submitted to a vote of the Company’s shareholders and the right to receive any dividends or other distributions that we may pay or make on our outstanding shares of common stock. However, under the Share Lending Agreement, the share borrower has agreed:
| • | not to vote any shares of the Company’s common stock it has borrowed to the extent it owns such borrowed shares; and |
| • | to pay to us an amount equal to any cash dividends that we pay on the borrowed shares. |
In view of the contractual undertakings of the share borrower in the Share Lending Agreement, which have the effect of substantially eliminating the economic dilution that otherwise would result from the issuance of the borrowed shares, we believe that under U.S. generally accepted accounting principles currently in effect, the borrowed shares will not be considered outstanding for the purpose of computing and reporting our earnings per share. In October 2009, a new standard for accounting for own-share lending arrangements was issued that concurs with this accounting treatment for earnings per share.
2009 Common Stock Offerings
In May 2009, we completed an offering of 5,750,000 shares of common stock for $12.00 per share. Net proceeds to the Company were $65.3 million. The Company used the net proceeds from this offering to repay outstanding indebtedness under its revolving bank credit facility.
In October 2009, we completed an offering of 6,950,000 shares of common stock at $15.00 per share. Net proceeds to the Company were $98.8 million. The Company used the aggregate net proceeds along with the proceeds from the concurrent issuance of the 4.50% Convertible Notes to repay the outstanding indebtedness under its revolving bank credit facility and to repay all of its outstanding senior subordinated secured notes, and the Company will use the remaining portion of such net proceeds for general corporate purposes.
Working Capital
At December 31, 2009, we had working capital of $22.6 million. Including availability under our credit facility, our working capital as of December 31, 2009 would have been $152.6 million.
43
Table of Contents
Index to Financial Statements
Contractual Obligations
The following table reflects the Company’s contractual obligations as of December 31, 2009:
| Payments Due by Period | |||||||||||||||
| Total | Less than 1 year |
1-3 years | 3-5 years | More than 5 years | |||||||||||
| (in thousands) | |||||||||||||||
| Long-term debt |
$ | 211,250 | $ | — | $ | — | $ | 125,000 | $ | 86,250 | |||||
| Interest on long-term debt |
39,971 | 10,131 | 20,263 | 8,283 | 1,294 | ||||||||||
| Operating leases |
5,888 | 1,131 | 2,247 | 1,293 | 1,217 | ||||||||||
| Drilling contracts |
121,408 | 38,611 | 78,265 | 4,532 | — | ||||||||||
| Transportation agreements |
58,790 | 5,899 | 12,233 | 12,319 | 28,339 | ||||||||||
| Deferred premiums on derivative instruments |
19,299 | 1,491 | 17,808 | — | — | ||||||||||
| Asset retirement obligations |
6,789 | 259 | 646 | 31 | 5,853 | ||||||||||
| 75% PVOG financing(1) |
1,445 | 48 | 215 | 350 | 832 | ||||||||||
| Total |
$ | 464,840 | $ | 57,570 | $ | 131,677 | $ | 151,808 | $ | 123,785 | |||||
| (1) | PVOG financing is payable out of 75% of revenues from the wells financed and repayment is based on estimated production which may vary from actual. |
Other than obligations under our revolving bank credit facility, the 5.00% Convertible Notes, the 4.50% Convertible Notes, the PVOG financing and operating leases, our commitments relate to capital expenditures for development of oil and natural gas properties. We will not enter into drilling or development commitments until such time as a source of funding for such commitments is known to be available, either through financing proceeds, internal cash flow, additional funding under our revolving bank credit facility or working capital.
Off-Balance Sheet Arrangements
We do not currently utilize any off-balance sheet arrangements to enhance our liquidity and capital resources position or for any other purpose.
Critical Accounting Policies
The preparation of the consolidated financial statements requires us to make a number of estimates and assumptions relating to the reported amounts of assets and liabilities and the disclosures of contingent assets and liabilities at the date of the consolidated financial statements and the reported amounts of revenues and expenses during the period. When alternatives exist among various accounting methods, the choice of accounting method can have a significant impact on reported amounts. The following is a discussion of our accounting estimates and judgments which management believes are most significant in its application of generally accepted accounting principles used in the preparation of the consolidated financial statements.
Full Cost Calculations
The accounting for our business is subject to special accounting rules that are unique to the oil and natural gas industry. There are two allowable methods of accounting for oil and natural gas business activities: the successful efforts method and the full-cost method. We follow the full-cost method of accounting under which all costs associated with property acquisition, exploration and development activities are capitalized. We also capitalize internal costs that can be directly identified with our acquisition, exploration and development activities and do not include any costs related to production, general corporate overhead or similar activities. Under the successful efforts method, geological and geophysical costs and costs of carrying and retaining undeveloped properties are charged to expense as incurred. Costs of drilling exploratory wells that do not result in proved reserves are charged to expense. Depreciation, depletion, amortization and impairment of oil and
44
Table of Contents
Index to Financial Statements
natural gas properties are generally calculated on a well by well or lease or field basis versus the aggregated “full cost” pool basis. Additionally, gain or loss is generally recognized on all sales of oil and natural gas properties under the successful efforts method. As a result, our financial statements will differ from companies that apply the successful efforts method since we will generally reflect a higher level of capitalized costs as well as a higher oil and natural gas depreciation, depletion and amortization rate, although this difference could change in periods of lower price environments that result in write-downs of our costs as described below.
The full cost method subjects companies to quarterly calculations of a “ceiling,” or limitation on the amount of properties that can be capitalized on the balance sheet. If our capitalized costs are in excess of the calculated ceiling, the excess must be written off as an expense. Our discounted present value of estimated future net revenues (adjusted for cash flow hedges) from our proved oil and natural gas reserves is a major component of the ceiling calculation, and represents the component that requires the most subjective judgments. Estimates of reserves are forecasts based on engineering data, projected future rates of production and the timing of future expenditures. The process of estimating oil and natural gas reserves requires substantial judgment, resulting in imprecise determinations, particularly for new discoveries.
The passage of time provides more qualitative information regarding estimates of reserves, and revisions are made to prior estimates to reflect updated information. Annual performance revisions have occurred over the past years, which have both increased and decreased in individual years. There can be no assurance that more significant revisions will not be necessary in the future. If future significant revisions are necessary that reduce previously estimated reserve quantities, it could result in a full cost property write-down. In addition to the impact of the estimates of proved reserves on the calculation of the ceiling, estimates of proved reserves are also a significant component of the calculation of the full cost pool amortization.
The estimates of proved undeveloped reserve quantities and values are based on estimated future drilling which assumes that we will have the financing available to fund the estimated drilling costs. If we do not have such financing available at the time projected, the estimates of proved undeveloped reserve quantities and values will change.
While the quantities of proved reserves require substantial judgment, the associated prices of oil and natural gas reserves that are included in the discounted present value of the reserves do not require judgment. The ceiling calculation dictates that prices used in the determination of future net revenues represent the average of the first day of the month price for the 12-month period prior to the end of the quarterly period. Therefore, the future net revenues associated with the estimated proved reserves are not based on our assessment of future prices, but rather are based on prices in effect 12 months prior to each quarter when the ceiling calculation is performed. Such prices are utilized except where different prices are fixed and determinable from applicable contracts for the remaining term of those contracts, including the effects of derivatives qualifying as cash flow hedges. Based on the average first-day-of-the-month prices for natural gas and oil during the 12-months of 2009, these cash flow hedges increased the full-cost ceiling by $69.7 million, thereby reducing the ceiling test write-down by the same amount. Prior to December 31, 2009, the SEC rules required the use of the year-end price in the determination of future net revenues.
Because the ceiling calculation dictates that prices are held constant indefinitely, the resulting value is not indicative of the true fair value of the reserves. Oil and natural gas prices have historically been cyclical and, can be either substantially higher or lower than various industry long-term price forecasts. Therefore, oil and natural gas property write-downs that result from applying the full cost ceiling limitation, and that are caused by fluctuations in price as opposed to reductions in the underlying quantities of reserves, should not be viewed as absolute indicators of a reduction of the ultimate value of the related reserves.
Capitalized costs are amortized on a composite unit-of-production method based on proved oil and natural gas reserves. Depreciation, depletion and amortization expense is also based on the amount of estimated reserves. If we maintain the same level of production year over year, the depreciation, depletion and amortization expense may be significantly different if our estimate of remaining reserves changes significantly.
45
Table of Contents
Index to Financial Statements
Because of the volatile nature of crude oil and natural gas prices, it is not possible to predict the timing or magnitude of full cost writedowns.
Asset Retirement Obligations
Our asset retirement obligations (“ARO”) consist primarily of estimated costs of dismantlement, removal, site reclamation and similar activities associated with our oil and natural gas properties. We recognize the discounted fair value of a liability for an ARO in the period in which it is incurred with the associated asset retirement cost capitalized as part of the carrying cost of the oil and natural gas asset. The recognition of an ARO requires that management make numerous estimates, assumptions and judgments regarding such factors as the existence of a legal obligation for an ARO; estimated probabilities, amounts and timing of settlements; the credit-adjusted risk-free rate to be used; inflation rates; and future advances in technology. In periods subsequent to initial measurement of the ARO, the Company must recognize period-to-period changes in the liability resulting from the passage of time and revisions to either the timing or the amount of the original estimate of undiscounted cash flows. The related capitalized cost, including revisions thereto, is charged as an expense to the consolidated statement of operations.
Income Taxes
As part of the process of preparing the consolidated financial statements, we are required to estimate the federal and state income taxes in each of the jurisdictions in which we operate. This process involves estimating the actual current tax exposure together with assessing temporary differences resulting from differing treatment of items, such as derivative instruments, depreciation, depletion and amortization, and certain accrued liabilities for tax and accounting purposes. These differences and the net operating loss carryforwards result in deferred tax assets and liabilities, which are included in our consolidated balance sheet. We must then assess, using all available positive and negative evidence, the likelihood that the deferred tax assets will be recovered from future taxable income. If we believe that recovery is not more likely than not, we must establish a valuation allowance. Generally, to the extent we establish a valuation allowance or increase or decrease this allowance in a period, we must include an expense or reduction of expense within the tax provisions in the consolidated statement of operations.
Derivative Instruments
We recognize derivative instruments at fair value. Upon entering into a derivative contract, we may designate the derivative as either a fair value hedge or a cash flow hedge, or decide that the contract is not a hedge, and thenceforth, mark the contract to market through earnings. We document the relationship between the derivative instrument designated as a hedge and the hedged items, as well as our objective for risk management and strategy for use of the hedging instrument to manage the risk. Derivative instruments designated as cash flow hedges are linked to specific forecasted transactions. We assess at inception, and on an ongoing basis, whether a derivative instrument used as a hedge is highly effective in offsetting changes in the fair value or cash flows of the hedged item. A derivative that is not a highly effective hedge does not qualify for hedge accounting.
Changes in fair value of a qualifying cash flow hedge are recorded in accumulated other comprehensive income, until earnings are affected by the cash flows of the hedged item. When the cash flow of the hedged item is recognized in the statement of operations, the fair value of the associated cash flow hedge is reclassified from accumulated other comprehensive income into earnings as a component of oil and gas sales. Ineffective portions of a cash flow hedge are recognized currently as a component of oil and gas sales. The changes in fair value of derivative instruments not qualifying or not designated as hedges are reported currently in the consolidated statement of operations as unrealized gains (losses) on derivatives, a component of non-operating income (expense). If a derivative instrument no longer qualifies as a cash flow hedge, hedge accounting is discontinued and the gain or loss that was recorded in accumulated other comprehensive income is recognized over the period anticipated in the original hedge transaction.
46
Table of Contents
Index to Financial Statements
Oil and Gas Revenues
Oil and natural gas revenues are recognized when sold to a purchaser at a fixed or determinable price, when delivery has occurred and title has transferred, and if collectability of the revenue is probable. Delivery occurs and title is transferred when production has been delivered to a purchaser’s pipeline or truck. As a result of the numerous requirements necessary to gather information from purchasers or various measurement locations, calculate volumes produced, perform field and wellhead allocations and distribute and disburse funds to various working interest partners and royalty owners, the collection of revenues from oil and gas production may take up to 60 days following the month of production. Therefore, we make accruals for revenues and accounts receivable based on estimates of our share of production, particularly from properties that are operated by others. Since the settlement process may take 30 to 60 days following the month of actual production, our financial results include estimates of production and revenues for the related time period. We record any differences, which we do not expect to be significant, between the actual amounts ultimately received and the original estimates in the period they become finalized.
During the course of normal operations, the Company and other joint interest owners of natural gas reservoirs will take more or less than their respective ownership share of the natural gas volumes produced. These volumetric imbalances are monitored over the lives of the wells’ production capability. If an imbalance exists at the time the wells’ reserves are depleted, cash settlements are made among the joint interest owners under a variety of arrangements. The Company follows the sales method of accounting for gas imbalances. A liability is recorded when the Company’s excess takes of natural gas volumes exceed its estimated remaining recoverable reserves. No receivables are recorded for those wells where the Company has taken less than its ownership share of gas production. There are no significant imbalances as of December 31, 2007, 2008 or 2009.
Other
See Note A to Consolidated Financial Statements for information related to other accounting and reporting policies.
Recently Issued Accounting Pronouncements
See Note A to Consolidated Financial Statements for a discussion of recently issued accounting pronouncements.
Price Risk Management
See Item 7A—Quantitative and Qualitative Disclosures About Market Risk.
Forward-Looking Statements
All statements made in this document other than purely historical information are “forward looking statements” within the meaning of the federal securities laws. These statements reflect expectations and are based on historical operating trends, proved reserve positions and other currently available information. Forward looking statements include statements regarding future plans and objectives, future exploration and development expenditures and number and location of planned wells and statements regarding the quality of our properties and potential reserve and production levels. These statements may be preceded or followed by or otherwise include the words “believes,” “expects,” “anticipates,” “intends,” “continues,” “plans,” “estimates,” “projects” or similar expressions or statements that events “will,” “should,” “could,” “might” or “may” occur. Except as otherwise specifically indicated, these statements assume that no significant changes will occur in the operating environment for oil and natural gas properties and that there will be no material acquisitions or divestitures except as otherwise described.
47
Table of Contents
Index to Financial Statements
The forward-looking statements in this report are subject to all the risks and uncertainties which are described in this document. We may also make material acquisitions or divestitures or enter into financing transactions. None of these events can be predicted with certainty and are not taken into consideration in the forward-looking statements.
For all of these reasons, actual results may vary materially from the forward looking statements and we cannot assure you that the assumptions used are necessarily the most likely. We will not necessarily update any forward looking statements to reflect events or circumstances occurring after the date the statement is made except as may be required by federal securities laws.
There are a number of risks that may affect our future operating results and financial condition. See “Item 1A. Risk Factors.”
| Item 7A. | Quantitative and Qualitative Disclosures About Market Risk. |
Commodity Price Risk
We are subject to price fluctuations of natural gas and crude oil. Prices received for natural gas and crude oil sold on the spot market are volatile due to factors beyond our control. Reductions in crude oil and natural gas prices could have a material adverse effect on our financial position, results of operations, capital expenditures and quantities of reserves recoverable on an economic basis. Any reduction in reserves, including reductions due to lower prices, can reduce our borrowing base under our revolving bank credit facility and adversely affect our liquidity and our ability to obtain capital for our acquisition and development activities.
To mitigate a portion of our exposure to fluctuations in commodity prices, we enter into financial price risk management activities with respect to a portion of projected crude oil and natural gas production through financial price commodity swaps, collars and put spreads. Our revolving bank credit facility requires us to maintain a hedging program on mutually acceptable terms whenever the loan amount outstanding exceeds 75% of the borrowing base.
Following is a summary of the outstanding natural gas derivative contracts we have in place as of December 31, 2009:
| Effective Date |
Maturity Date |
Notional Amount Per Month |
Remaining Notional Amount as of December 31, 2009 |
Additional Put Options |
Floor | Ceiling | Designation under | ||||||||||
| Natural Gas (MMBtu): |
|||||||||||||||||
| 1/1/2010 |
12/31/2010 | 471,833 | 5,662,000 | $ | 5.00 | $ | 7.50 | $ | — | Cash flow hedge | |||||||
| 1/1/2010 |
12/31/2010 | 471,833 | 5,661,996 | $ | 4.00 | $ | 5.50 | $ | 7.00 | Not designated | |||||||
| 1/1/2010 |
12/31/2010 | 25,000 | 300,000 | $ | — | $ | 8.50 | Not designated | |||||||||
| 5/1/2010 |
12/31/2010 | 241,250 | 1,930,000 | $ | 4.00 | $ | 6.00 | $ | — | Cash flow hedge | |||||||
| 1/1/2011 |
12/31/2011 | 188,781 | 2,265,372 | $ | — | $ | 8.00 | Not designated | |||||||||
| 1/1/2011 |
3/31/2011 | 200,000 | 600,000 | $ | 5.50 | $ | 7.00 | $ | 8.90 | Cash flow hedge | |||||||
| 4/1/2011 |
10/31/2011 | 200,000 | 1,400,000 | $ | 5.00 | $ | 6.50 | $ | 8.30 | Cash flow hedge | |||||||
| 11/1/2011 |
3/31/2012 | 200,000 | 1,000,000 | $ | 5.50 | $ | 7.00 | $ | 10.10 | Cash flow hedge | |||||||
| 1/1/2011 |
12/31/2012 | 1,021,666 | 24,520,000 | $ | 6.00 | $ | — | Cash flow hedge | |||||||||
| 1/1/2011 |
12/31/2012 | 337,500 | 8,100,000 | $ | 4.00 | $ | — | $ | — | Cash flow hedge | |||||||
The estimated total fair value of our derivative contracts in effect at December 31, 2009 was an asset of $29.5 million, of which $12.3 million is classified as a current asset and $17.3 million is classified as a long-term asset. The asset at December 31, 2009, reflects the fact that the prices under our derivative contracts in the aggregate are higher than period end forward prices. The fair value of these contracts varies based on commodity prices. While we will not recognize the benefit from commodity prices in excess of our fixed prices, we mitigate the risk of lower prices.
48
Table of Contents
Index to Financial Statements
Based on the monthly notional amount for natural gas in effect at December 31, 2009, a hypothetical $0.10 increase in natural gas prices would have decreased the fair value of our natural gas swaps and options by $2.7 million and a $0.10 decrease in natural gas prices would increase the fair value of our natural gas swaps and options by $2.8 million.
Interest Rate Risk
Our revolving bank credit facility bears interest at a rate elected by us that is based on the prime, LIBO or federal funds rate plus margins ranging from 1% to 4.75% depending on the base rate used and the amount of the loan outstanding in relation to the borrowing base. The Company is obligated to pay a facility fee equal to 0.5% per year of the unused portion of the borrowing base payable quarterly. As a result, our interest costs fluctuate based on short-term interest rates relating to our credit facility. We had no interest rate derivatives during the years ended December 31, 2008 or 2009. Based on our average borrowings outstanding for 2009, a 100 basis point change in interest rates would change our annual interest expense by approximately $1.0 million.
Our $125 million of 5.00% Convertible Notes and $86 million of 4.50% Convertible Notes have fixed interest rates.
| Item 8. | Financial Statements and Supplementary Data. |
Our consolidated financial statements are presented beginning on page F-1 found at the end of this report.
| Item 9. | Changes in and Disagreements With Accountants on Accounting and Financial Disclosure. |
None.
| Item 9A. | Controls and Procedures. |
Controls and Procedures
Our principal executive officer and principal financial officer have reviewed and evaluated the effectiveness of our disclosure controls and procedures (as defined in Exchange Act Rule 13a-15(e)) as of December 31, 2009. Disclosure controls and procedures include, without limitation, controls and procedures designed to provide us with reasonable assurance that information required to be disclosed by us in the reports that we file or submit under the Exchange Act is recorded, processed, summarized and reported within the time periods specified in the SEC’s rules and forms and is accumulated and communicated to our management, including our principal executive officer and principal financial officer, or persons performing similar functions, as appropriate to allow timely decisions regarding required disclosures. A control system, no matter how well conceived and operated, can provide only reasonable, not absolute, assurance that the objectives of the control system are met. Further, the design of a control system must reflect the fact that there are resource constraints, and the benefits of controls must be considered relative to their costs. Our disclosure controls and procedures are designed to provide us with reasonable assurance of achieving their objectives. Based on that evaluation, and because of the material weakness described below in Management’s Annual Report on Internal Control over Financial Reporting, our principal executive officer and principal financial officer have concluded that our disclosure controls and procedures were not effective as of December 31, 2009.
Changes in Internal Control Over Financial Reporting
During the fourth quarter of 2009, no change occurred in our internal control over financial reporting that materially affected, or is likely to materially affect, our internal control over financial reporting.
49
Table of Contents
Index to Financial Statements
Management’s Annual Report on Internal Control over Financial Reporting
Our management is responsible for establishing and maintaining adequate internal control over financial reporting as defined in Exchange Act Rules 13(a)-15(f) and 15d-15(f). Our system of internal control over financial reporting is designed to provide reasonable assurance regarding the reliability of financial reporting and the preparation of financial statements for external purposes in accordance with generally accepted accounting principles. Our internal control over financial reporting includes those policies and procedures that (i) pertain to the maintenance of records that, in reasonable detail, accurately and fairly reflect the transactions and dispositions of our assets; (ii) provide reasonable assurance that transactions are recorded as necessary to permit preparation of financial statements in accordance with generally accepted accounting principles, and that our receipts and expenditures are being made only in accordance with authorizations of our management and directors; and (iii) provide reasonable assurance regarding prevention or timely detection of unauthorized acquisition, use, or disposition of our assets that could have a material effect on the financial statements.
Because of its inherent limitations, internal control over financial reporting may not prevent or detect misstatements. Also, projections of any evaluation of effectiveness to future periods are subject to the risk that controls may become inadequate because of changes in conditions, or that the degree of compliance with the policies or procedures may deteriorate.
In order to evaluate the effectiveness of internal control over financial reporting, as required by Section 404 of the Sarbanes-Oxley Act, our management, including our principal executive officer and principal financial officer, conducted an assessment, including testing, using the criteria in Internal Control—Integrated Framework, issued by the Committee of Sponsoring Organizations of the Treadway Commission (“COSO”). During that assessment, we identified the following material weakness:
| • | In March 2010, we identified a material weakness in our internal control over financial reporting due to management’s improper application of generally accepted accounting principles resulting in corrections to our previously reported December 31, 2008 consolidated financial statements and the first three quarters of 2009. Management failed to timely detect and correct errors relating to the improper application of generally accepted accounting principles in determining our full cost pool impairment charges, other impairment charges, and related deferred income taxes. Management also failed to timely detect and correct errors as a result of improperly including dilutive securities in our computation of diluted loss per share. After considering the impact of these corrections, management and the audit committee of our Board of Directors concluded that our December 31, 2008 consolidated financial statements should be restated as presented in this Form 10-K and that a material weakness exists in our internal control over financial reporting related to the improper application of generally accepted accounting principles. The errors were determined during the preparation and independent audit of our December 31, 2009 financial statements. As a result, management has concluded that our internal control over financial reporting was not effective as of December 31, 2009. |
As a consequence of the material weakness identified above, our management has implemented a plan to reassign certain duties within the financial reporting department to ensure executive financial management has sufficient resources to properly research new and existing accounting guidance on a regular basis. Management believes this process will result in a more efficient internal control structure and effectively remedy the material weakness identified above.
Grant Thornton LLP, our independent registered public accounting firm, audited internal control over financial reporting and, based on that audit, issued the report that follows.
Ken L. Kenworthy, Jr.
Chief Executive Officer
James A. Merrill
Chief Financial Officer
50
Table of Contents
Index to Financial Statements
Report of Independent Registered Public Accounting Firm
Board of Directors and Shareholders
GMX Resources Inc.
We have audited GMX Resources Inc. (an Oklahoma corporation) and Subsidiaries’ (collectively, the “Company”) internal control over financial reporting as of December 31, 2009, based on criteria established in Internal Control—Integrated Framework issued by the Committee of Sponsoring Organizations of the Treadway Commission (COSO). The Company’s management is responsible for maintaining effective internal control over financial reporting and for its assessment of the effectiveness of internal control over financial reporting, included in the accompanying Management’s Annual Report on Internal Control Over Financial Reporting. Our responsibility is to express an opinion on the Company’s internal control over financial reporting based on our audit.
We conducted our audit in accordance with the standards of the Public Company Accounting Oversight Board (United States). Those standards require that we plan and perform the audit to obtain reasonable assurance about whether effective internal control over financial reporting was maintained in all material respects. Our audit included obtaining an understanding of internal control over financial reporting, assessing the risk that a material weakness exists, testing and evaluating the design and operating effectiveness of internal control based on the assessed risk, and performing such other procedures as we considered necessary in the circumstances. We believe that our audit provides a reasonable basis for our opinion.
A company’s internal control over financial reporting is a process designed to provide reasonable assurance regarding the reliability of financial reporting and the preparation of financial statements for external purposes in accordance with generally accepted accounting principles. A company’s internal control over financial reporting includes those policies and procedures that (1) pertain to the maintenance of records that, in reasonable detail, accurately and fairly reflect the transactions and dispositions of the assets of the company; (2) provide reasonable assurance that transactions are recorded as necessary to permit preparation of financial statements in accordance with generally accepted accounting principles, and that receipts and expenditures of the company are being made only in accordance with authorizations of management and directors of the company; and (3) provide reasonable assurance regarding prevention or timely detection of unauthorized acquisition, use, or disposition of the company’s assets that could have a material effect on the financial statements.
Because of its inherent limitations, internal control over financial reporting may not prevent or detect misstatements. Also, projections of any evaluation of effectiveness to future periods are subject to the risk that controls may become inadequate because of changes in conditions, or that the degree of compliance with the policies or procedures may deteriorate.
A material weakness is a deficiency, or combination of control deficiencies, in internal control over financial reporting, such that there is a reasonable possibility that a material misstatement of the company’s annual or interim financial statements will not be prevented or detected on a timely basis. The following material weakness has been identified and included in management’s assessment. The Company identified a material weakness in its internal control over financial reporting due to management’s failure to timely detect and correct errors relating to the improper application of generally accepted accounting principles in determining the Company’s full cost pool impairment charges, other impairment charges, and related deferred income taxes. Management also failed to timely detect and correct errors as a result of improperly including dilutive securities in the Company’s computation of diluted loss per share.
In our opinion, because the effect of the material weakness described above on the achievement of the objectives of the control criteria, GMX Resources Inc. and Subsidiaries has not maintained effective internal control over financial reporting as of December 31, 2009, based on criteria established in Internal Control—Integrated Framework issued by COSO.
51
Table of Contents
Index to Financial Statements
We also have audited, in accordance with the standards of the Public Company Accounting Oversight Board (United States), the consolidated balance sheet of GMX Resources Inc. and Subsidiaries as of December 31, 2009, and the related consolidated statements of operations, changes in equity, comprehensive income (loss) and cash flows for the year then ended. The material weakness identified above was considered in determining the nature, timing and extent of audit tests applied in our audit of the 2009 financial statements, and this report does not affect our report dated March 16, 2010, which expressed an unqualified opinion on those financial statements.
We do not express an opinion or any other form of assurance on the corrective actions and other changes in internal controls reported in Management’s Annual Report on Internal Control over Financial Reporting.
/s/ GRANT THORNTON LLP
Oklahoma City, Oklahoma
March 16, 2010
52
Table of Contents
Index to Financial Statements
Certifications
Our chief executive and chief financial officers have completed the certifications required to be filed as an Exhibit to this Report (See Exhibits 31.1 and 31.2) relating to the design of our disclosure controls and procedures and the design of our internal control over financial reporting.
| Item 9B. | Other Information. |
None.
53
Table of Contents
Index to Financial Statements
In accordance with the provisions of General Instruction G(3), information required by Items 10 through 14 of Form 10-K is incorporated herein by reference to the Company’s Proxy Statement for the 2010 Annual Meeting of Shareholders to be filed prior to April 30, 2010.
54
Table of Contents
Index to Financial Statements
| Item 15. | Exhibits and Financial Statement Schedules. |
The following documents are filed as part of this report.
Financial Statements: See Index to Consolidated Financial Statements and Consolidated Financial Statement Schedule set forth on page F-1 of this report.
Exhibits: For a list of documents filed as exhibits to this report, see the Exhibit Index immediately preceding the Exhibits filed with this report.
55
Table of Contents
Index to Financial Statements
SIGNATURES
Pursuant to the requirements of Section 13 or 15(d) of the Securities Exchange Act of 1934, the Registrant has duly caused this report to be signed on its behalf by the undersigned, thereunto duly authorized.
| GMX RESOURCES INC. | ||||||||
| Dated: March 16, 2010 | By: | /s/ JAMES A. MERRILL | ||||||
| James A. Merrill, Chief Financial Officer | ||||||||
Pursuant to the requirement of the Securities Exchange Act of 1934, this report has been signed below by the following persons on behalf of the Registrant and in the capacities and on the dates indicated.
| Signatures |
Title |
Date | ||
| /s/ KEN L. KENWORTHY, JR. Ken L. Kenworthy, Jr. |
Chief Executive Officer and Director (Principal Executive Officer) | March 16, 2010 | ||
| /s/ JAMES A. MERRILL James A. Merrill |
Chief Financial Officer (Principal Financial and Accounting Officer) | March 16, 2010 | ||
| /s/ T. J. BOISMIER T. J. Boismier |
Director | March 16, 2010 | ||
| /s/ STEVEN CRAIG Steven Craig |
Director | March 16, 2010 | ||
| /s/ KEN L. KENWORTHY, SR. Ken L. Kenworthy, Sr. |
Director | March 16, 2010 | ||
| /s/ JON W. MCHUGH Jon W. McHugh |
Director | March 16, 2010 | ||
56
Table of Contents
Index to Financial Statements
INDEX TO CONSOLIDATED FINANCIAL STATEMENTS
F-1
Table of Contents
Index to Financial Statements
REPORT OF INDEPENDENT REGISTERED PUBLIC ACCOUNTING FIRM
Board of Directors and Shareholders
GMX Resources Inc.
We have audited the accompanying consolidated balance sheet of GMX Resources Inc. (an Oklahoma corporation) and Subsidiaries (collectively, the “Company”) as of December 31, 2009, and the related consolidated statements of operations, changes in equity, comprehensive income (loss) and cash flows for the year then ended. These financial statements are the responsibility of the Company’s management. Our responsibility is to express an opinion on these financial statements based on our audit.
We conducted our audit in accordance with the standards of the Public Company Accounting Oversight Board (United States). Those standards require that we plan and perform the audit to obtain reasonable assurance about whether the financial statements are free of material misstatement. An audit includes examining, on a test basis, evidence supporting the amounts and disclosures in the financial statements. An audit also includes assessing the accounting principles used and significant estimates made by management, as well as evaluating the overall financial statement presentation. We believe that our audit provides a reasonable basis for our opinion.
In our opinion, the consolidated financial statements referred to above present fairly, in all material respects, the financial position of GMX Resources Inc. and Subsidiaries as of December 31, 2009 and the results of their operations and their cash flows for the year then ended in conformity with accounting principles generally accepted in the United States of America.
As discussed in Note A to the consolidated financial statements, the Company changed its method of estimating oil and gas reserves and related disclosures in 2009. Also, as discussed in Note C to the consolidated financial statements, the Company changed the manner in which it accounts for convertible notes that may be settled in cash upon conversion, as of January 1, 2009, and retrospectively applied the effects of the adjustments to prior periods.
We also have audited the adjustments to the 2008 consolidated financial statements to retrospectively apply the change in accounting for convertible notes that may be settled in cash upon conversion, as described in Note C to the consolidated financial statements. In our opinion, such adjustments are appropriate and have been properly applied. We were not engaged to audit, review, or apply any procedures to the 2008 financial statements of the Company other than with respect to such adjustments and, accordingly, we do not express an opinion or any other form of assurance on the 2008 financial statements taken as a whole.
We also have audited, in accordance with the standards of the Public Company Accounting Oversight Board (United States), GMX Resources Inc. and Subsidiaries’ internal control over financial reporting as of December 31, 2009, based on criteria established in Internal Control—Integrated Framework issued by the Committee of Sponsoring Organizations of the Treadway Commission (COSO) and our report dated March 16, 2010 expressed an adverse opinion thereon.
/s/ GRANT THORNTON LLP
Oklahoma City, Oklahoma
March 16, 2010
F-2
Table of Contents
Index to Financial Statements
REPORT OF INDEPENDENT REGISTERED PUBLIC ACCOUNTING FIRM
The Board of Directors and
Stockholders of GMX Resources Inc. and Subsidiaries
We have audited, before the effects of the adjustments to retrospectively apply the change in accounting described in Note C, the consolidated balance sheet of GMX Resources Inc. and Subsidiaries as of December 31, 2008, and the related consolidated statements of operations, changes in equity, comprehensive income (loss), and cash flows for each of the two years in the period ended December 31, 2008. (The 2008 financial statements before the effects of the adjustments discussed in Note C are not presented herein.) The 2008 and 2007 financial statements are the responsibility of the company's management. Our responsibility is to express an opinion on these financial statements based on our audit.
We conducted our audit in accordance with the standards of the Public Company Accounting Oversight Board (United States). Those standards require that we plan and perform the audit to obtain reasonable assurance about whether the financial statements are free of material misstatement. An audit includes examining, on a test basis, evidence supporting the amounts and disclosures in the financial statements. An audit also includes assessing the accounting principles used and significant estimates made by management, as well as evaluating the overall financial statement presentation. We believe that our audit provides a reasonable basis for our opinion.
In our opinion, the 2008 and 2007 financial statements, before the effects of the adjustments to retrospectively apply the change in accounting described in Note C, present fairly, in all material respects, the financial position of GMX Resources Inc. and Subsidiaries as of December 31, 2008, and the results of their operations and their cash flows for each of the two years in the period ended December 31, 2008, in conformity with generally accepted accounting principles in the United States of America.
As discussed in Note B to the financial statements, the 2008 financial statements have been restated to correct a material misstatement.
We were not engaged to audit, review, or apply any procedures to the adjustments to retrospectively apply the change in accounting described in Note C and, accordingly, we do not express an opinion or any other form of assurance about whether such adjustments are appropriate and have been properly applied. Those adjustments were audited by Grant Thornton LLP.
/s/ Smith, Carney & Co., p.c.
Oklahoma City, Oklahoma
February 27, 2009, except for
Note B, which is dated March 16, 2010.
F-3
Table of Contents
Index to Financial Statements
GMX Resources Inc. and Subsidiaries
Consolidated Balance Sheets
(dollars in thousands, except share data)
| December 31, | ||||||||
| 2008 | 2009 | |||||||
| (as adjusted and restated) |
||||||||
| ASSETS | ||||||||
| CURRENT ASSETS: |
||||||||
| Cash and cash equivalents |
$ | 6,716 | $ | 35,554 | ||||
| Accounts receivable—interest owners |
576 | 1,233 | ||||||
| Accounts receivable—oil and natural gas revenues, net |
9,145 | 9,340 | ||||||
| Derivative instruments |
21,325 | 12,252 | ||||||
| Inventories |
691 | 326 | ||||||
| Prepaid expenses and deposits |
2,040 | 3,809 | ||||||
| Total current assets |
40,493 | 62,514 | ||||||
| OIL AND NATURAL GAS PROPERTIES, BASED ON THE FULL COST METHOD |
||||||||
| Properties being amortized |
600,662 | 756,412 | ||||||
| Properties not subject to amortization |
36,034 | 39,789 | ||||||
| Less accumulated depreciation, depletion, and impairment |
(252,806 | ) | (464,872 | ) | ||||
| 383,890 | 331,329 | |||||||
| PROPERTY AND EQUIPMENT, AT COST, NET |
93,487 | 101,755 | ||||||
| DERIVATIVE INSTRUMENTS |
3,751 | 17,292 | ||||||
| OTHER ASSETS |
3,380 | 6,748 | ||||||
| TOTAL ASSETS |
$ | 525,001 | $ | 519,638 | ||||
| LIABILITIES AND EQUITY | ||||||||
| CURRENT LIABILITIES: |
||||||||
| Accounts payable |
$ | 35,599 | $ | 19,180 | ||||
| Accrued expenses |
6,089 | 12,907 | ||||||
| Accrued interest |
3,290 | 3,361 | ||||||
| Revenue distributions payable |
5,293 | 4,434 | ||||||
| Current maturities of long-term debt |
61 | 48 | ||||||
| Total current liabilities |
50,332 | 39,930 | ||||||
| LONG-TERM DEBT, LESS CURRENT MATURITIES |
224,281 | 190,230 | ||||||
| DEFERRED PREMIUMS ON DERIVATIVE INSTRUMENTS |
— | 16,299 | ||||||
| OTHER LIABILITIES |
6,645 | 7,151 | ||||||
| COMMITMENTS AND CONTINGENCIES—SEE NOTE J |
||||||||
| EQUITY: |
||||||||
| Preferred stock, par value $.001 per share, 10,000,000 shares authorized: |
||||||||
| Series A Junior Participating Preferred Stock 25,000 shares authorized, none issued and outstanding |
— | — | ||||||
| 9.25% Series B Cumulative Preferred Stock, 3,000,000 Shares authorized, 2,000,000 shares issued and outstanding (aggregate liquidation preference $50,000,000) |
2 | 2 | ||||||
| Common stock, par value $.001 per share—authorized 50,000,000 shares issued and outstanding 18,794,691 shares in 2008 and 31,214,968 shares in 2009 |
19 | 31 | ||||||
| Additional paid-in capital |
328,002 | 520,307 | ||||||
| Accumulated deficit |
(99,576 | ) | (284,840 | ) | ||||
| Accumulated other comprehensive income, net of taxes |
15,296 | 8,447 | ||||||
| Total GMX Resources’ equity |
243,743 | 243,947 | ||||||
| Noncontrolling interest |
— | 22,081 | ||||||
| Total equity |
243,743 | 266,028 | ||||||
| TOTAL LIABILITIES AND EQUITY |
$ | 525,001 | $ | 519,638 | ||||
See accompanying notes to consolidated financial statements.
F-4
Table of Contents
Index to Financial Statements
GMX Resources Inc. and Subsidiaries
Consolidated Statements of Operations
(dollars in thousands, except share and per share data)
| Year Ended December 31, | ||||||||||||
| 2007 | 2008 | 2009 | ||||||||||
| (as adjusted and restated) |
||||||||||||
| OIL AND GAS SALES |
$ | 67,883 | $ | 125,736 | $ | 94,294 | ||||||
| EXPENSES: |
||||||||||||
| Lease operations |
8,982 | 15,101 | 11,776 | |||||||||
| Production and severance taxes |
2,746 | 5,306 | (930 | ) | ||||||||
| Depreciation, depletion, and amortization |
18,681 | 31,744 | 31,006 | |||||||||
| Impairment of oil and natural gas properties |
— | 192,650 | 188,150 | |||||||||
| General and administrative |
8,717 | 16,899 | 21,390 | |||||||||
| Total expenses |
39,126 | 261,700 | 251,392 | |||||||||
| Income (loss) from operations |
28,757 | (135,964 | ) | (157,098 | ) | |||||||
| NON-OPERATING INCOME (EXPENSES): |
||||||||||||
| Interest expense |
(4,088 | ) | (13,617 | ) | (16,127 | ) | ||||||
| Loss on extinguishment of debt |
— | — | (4,976 | ) | ||||||||
| Interest and other income |
226 | 285 | 72 | |||||||||
| Unrealized loss on derivatives |
— | (354 | ) | (2,370 | ) | |||||||
| Total non-operating expenses |
(3,862 | ) | (13,686 | ) | (23,401 | ) | ||||||
| Income (loss) before income taxes |
24,895 | (149,650 | ) | (180,499 | ) | |||||||
| (PROVISION) BENEFIT FOR INCOME TAXES |
(8,010 | ) | 25,013 | 33 | ||||||||
| NET INCOME (LOSS) |
16,885 | (124,637 | ) | (180,466 | ) | |||||||
| Net income attributable to noncontrolling interest |
— | — | 173 | |||||||||
| NET INCOME (LOSS) APPLICABLE TO GMX RESOURCES |
16,885 | (124,637 | ) | (180,639 | ) | |||||||
| Preferred stock dividends |
4,625 | 4,625 | 4,625 | |||||||||
| NET INCOME (LOSS) APPLICABLE TO COMMON SHAREHOLDERS |
$ | 12,260 | $ | (129,262 | ) | $ | (185,264 | ) | ||||
| EARNINGS (LOSS) PER SHARE—Basic |
$ | 0.94 | $ | (9.09 | ) | $ | (9.17 | ) | ||||
| EARNINGS (LOSS) PER SHARE—Diluted |
$ | 0.93 | $ | (9.09 | ) | $ | (9.17 | ) | ||||
| WEIGHTED AVERAGE COMMON SHARES—Basic |
13,075,560 | 14,216,466 | 20,210,400 | |||||||||
| WEIGHTED AVERAGE COMMON SHARES—Diluted |
13,208,746 | 14,216,466 | 20,210,400 | |||||||||
See accompanying notes to consolidated financial statements.
F-5
Table of Contents
Index to Financial Statements
GMX Resources Inc. and Subsidiaries
Consolidated Statement of Changes in Equity
Year Ended December 31, 2007, 2008, and 2009
(dollars and shares in thousands)
| Preferred shares |
Common shares |
Preferred par value |
Common par value |
Additional paid-in capital |
Retained earnings (accumulated deficit) |
Accumulated other comprehensive income |
Total GMX Resources equity |
Non-controlling interest |
Total equity |
|||||||||||||||||||||||||
| BALANCE AT DECEMBER 31, 2006 |
2,000 | 11,242 | $ | 2 | $ | 11 | $ | 113,266 | $ | 17,426 | $ | 776 | $ | 131,481 | $ | — | $ | 131,481 | ||||||||||||||||
| Stock Options Exercised |
— | 26 | — | — | 77 | — | — | 77 | — | 77 | ||||||||||||||||||||||||
| Stock Compensation Expense |
— | — | — | — | 1,573 | — | — | 1,573 | — | 1,573 | ||||||||||||||||||||||||
| Preferred Stock Dividends |
— | — | — | — | — | (4,625 | ) | — | (4,625 | ) | — | (4,625 | ) | |||||||||||||||||||||
| Shares Issued |
— | 2,000 | — | 2 | 65,627 | — | — | 65,629 | — | 65,629 | ||||||||||||||||||||||||
| Net Income |
— | — | — | — | — | 16,885 | — | 16,885 | — | 16,885 | ||||||||||||||||||||||||
| Other Comprehensive Loss |
— | — | — | — | — | — | (2,094 | ) | (2,094 | ) | — | (2,094 | ) | |||||||||||||||||||||
| BALANCE AT DECEMBER 31, 2007 |
2,000 | 13,268 | $ | 2 | $ | 13 | $ | 180,543 | $ | 29,686 | $ | (1,318 | ) | $ | 208,926 | — | $ | 208,926 | ||||||||||||||||
| Stock Options Exercised |
— | 73 | — | — | 979 | — | — | 979 | — | 979 | ||||||||||||||||||||||||
| Restricted Stock Awards |
— | 14 | — | — | — | — | — | — | — | — | ||||||||||||||||||||||||
| Stock Compensation Expense |
— | — | — | — | 3,545 | — | — | 3,545 | — | 3,545 | ||||||||||||||||||||||||
| Preferred Stock Dividends |
— | — | — | — | — | (4,625 | ) | — | (4,625 | ) | — | (4,625 | ) | |||||||||||||||||||||
| Shares Issued |
— | 2,000 | — | 2 | 133,685 | — | — | 133,687 | — | 133,687 | ||||||||||||||||||||||||
| Shares Pursuant to Share Lending Agreement |
— | 3,440 | — | 4 | — | — | — | 4 | — | 4 | ||||||||||||||||||||||||
| Convertible Debt Issued (as adjusted) |
— | — | — | — | 9,250 | — | — | 9,250 | — | 9,250 | ||||||||||||||||||||||||
| Net Loss (as restated) |
— | — | — | — | — | (124,637 | ) | — | (124,637 | ) | — | (124,637 | ) | |||||||||||||||||||||
| Other Comprehensive Income |
— | — | — | — | — | — | 16,614 | 16,614 | — | 16,614 | ||||||||||||||||||||||||
| BALANCE AT DECEMBER 31, 2008 (as adjusted and restated) |
2,000 | 18,795 | $ | 2 | $ | 19 | $ | 328,002 | $ | (99,576 | ) | $ | 15,296 | $ | 243,743 | — | $ | 243,743 | ||||||||||||||||
| Stock Options Exercised |
— | 1 | — | — | 5 | — | — | 5 | — | 5 | ||||||||||||||||||||||||
| Restricted Stock Awards |
— | 19 | — | — | — | — | — | — | — | — | ||||||||||||||||||||||||
| Stock Compensation Expense |
— | — | — | — | 5,844 | — | — | 5,844 | — | 5,844 | ||||||||||||||||||||||||
| Preferred Stock Dividends |
— | — | — | — | — | (4,625 | ) | — | (4,625 | ) | — | (4,625 | ) | |||||||||||||||||||||
| Shares Issued |
— | 12,700 | — | 13 | 164,051 | — | — | 164,064 | — | 164,064 | ||||||||||||||||||||||||
| Shares Pursuant to Share Lending Agreement |
— | (300 | ) | — | (1 | ) | — | — | — | (1 | ) | — | (1 | ) | ||||||||||||||||||||
| Convertible Debt Issued |
— | — | — | — | 8,421 | — | — | 8,421 | — | 8,421 | ||||||||||||||||||||||||
| Sale of Subsidiary Membership Interest to Noncontrolling Interest |
— | — | — | — | 13,984 | — | — | 13,984 | 21,908 | 35,892 | ||||||||||||||||||||||||
| Net Loss |
— | — | — | — | — | (180,639 | ) | — | (180,639 | ) | 173 | (180,466 | ) | |||||||||||||||||||||
| Other Comprehensive Loss |
— | — | — | — | — | — | (6,849 | ) | (6,849 | ) | — | (6,849 | ) | |||||||||||||||||||||
| BALANCE AT DECEMBER 31, 2009 |
2,000 | 31,215 | $ | 2 | $ | 31 | $ | 520,307 | $ | (284,840 | ) | $ | 8,447 | $ | 243,947 | $ | 22,081 | $ | 266,028 | |||||||||||||||
See accompanying notes to consolidated financial statements.
F-6
Table of Contents
Index to Financial Statements
GMX Resources Inc. and Subsidiaries
Consolidated Statements of Comprehensive Income (Loss)
(dollars in thousands)
| Years Ended December 31, | ||||||||||||
| 2007 | 2008 | 2009 | ||||||||||
| (as adjusted and restated) |
||||||||||||
| Net income (loss) |
$ | 16,885 | $ | (124,637 | ) | $ | (180,466 | ) | ||||
| Other comprehensive income (loss), net of income tax: |
||||||||||||
| Change in fair value of derivative instruments, net of income taxes of ($53), $6,499 and $6,961, respectively |
(98 | ) | 12,615 | 13,513 | ||||||||
| Reclassification of (gain) loss on settled contracts, net of income taxes of ($1,027), $2,060 and ($10,489), respectively |
(1,996 | ) | 3,999 | (20,362 | ) | |||||||
| Comprehensive income (loss) |
14,791 | (108,023 | ) | (187,315 | ) | |||||||
| Comprehensive income attributable to the noncontrolling interest |
— | — | 173 | |||||||||
| Comprehensive income (loss) attributable to GMX Resources Shareholders |
$ | 14,791 | $ | (108,023 | ) | $ | (187,488 | ) | ||||
See accompanying notes to consolidated financial statements.
F-7
Table of Contents
Index to Financial Statements
GMX Resources Inc. and Subsidiaries
Consolidated Statements of Cash Flows
(dollars in thousands)
| Year Ended December 31, | ||||||||||||
| 2007 | 2008 | 2009 | ||||||||||
| (as adjusted and restated) |
||||||||||||
| CASH FLOWS DUE TO OPERATING ACTIVITIES |
||||||||||||
| Net income (loss) |
$ | 16,885 | $ | (124,637 | ) | $ | (180,466 | ) | ||||
| Adjustments to reconcile net income (loss) to net cash provided by operating activities: |
||||||||||||
| Depreciation, depletion, and amortization |
18,681 | 31,744 | 31,006 | |||||||||
| Impairment of oil and natural gas properties |
— | 192,650 | 188,150 | |||||||||
| Deferred income taxes |
7,977 | (25,039 | ) | — | ||||||||
| Non-cash stock compensation expense |
1,573 | 3,085 | 4,635 | |||||||||
| Loss on extinguishment of debt |
— | — | 4,976 | |||||||||
| Other |
273 | 520 | 6,867 | |||||||||
| Decrease (increase) in: |
||||||||||||
| Accounts receivable |
(5,333 | ) | 717 | (1,338 | ) | |||||||
| Prepaid expenses and other assets |
(913 | ) | (1,089 | ) | (71 | ) | ||||||
| Increase (decrease) in: |
||||||||||||
| Accounts payable and accrued expenses |
9,985 | 3,558 | (2,852 | ) | ||||||||
| Revenue distributions payable |
3,317 | 1,728 | (1,417 | ) | ||||||||
| Net cash provided by operating activities |
52,445 | 83,237 | 49,490 | |||||||||
| CASH FLOWS DUE TO INVESTING ACTIVITIES |
||||||||||||
| Additions to oil and natural gas properties |
(174,509 | ) | (281,447 | ) | (162,076 | ) | ||||||
| Purchase of property and equipment |
(20,489 | ) | (36,913 | ) | (19,248 | ) | ||||||
| Net cash used in investing activities |
(194,998 | ) | (318,360 | ) | (181,324 | ) | ||||||
| CASH FLOWS DUE TO FINANCING ACTIVITIES |
||||||||||||
| Advance on revolving bank credit facility |
120,139 | 190,000 | 99,000 | |||||||||
| Payments on debt |
(66,225 | ) | (204,210 | ) | (179,079 | ) | ||||||
| Proceeds from sale of common stock |
65,706 | 134,681 | 164,069 | |||||||||
| Issuance of 5.00% Convertible Senior Notes |
— | 125,000 | — | |||||||||
| Issuance of 4.50% Convertible Senior Notes |
— | — | 86,250 | |||||||||
| Dividends paid on Series B preferred stock |
(4,625 | ) | (4,625 | ) | (4,625 | ) | ||||||
| Proceeds from (repayment of) Senior Secured Notes |
30,000 | — | (34,590 | ) | ||||||||
| Sale of equity interest of a business |
— | — | 36,000 | |||||||||
| Fees paid related to financing activities |
(1,495 | ) | (4,914 | ) | (7,085 | ) | ||||||
| Other |
— | — | 732 | |||||||||
| Net cash provided by financing activities |
143,500 | 235,932 | 160,672 | |||||||||
| NET INCREASE IN CASH |
947 | 809 | 28,838 | |||||||||
| CASH AND CASH EQUIVALENTS AT BEGINNING OF PERIOD |
4,960 | 5,907 | 6,716 | |||||||||
| CASH AND CASH EQUIVALENTS AT END OF PERIOD |
$ | 5,907 | $ | 6,716 | $ | 35,554 | ||||||
| SUPPLEMENTAL CASH FLOW DISCLOSURE CASH PAID (RECEIVED) DURING THE PERIOD FOR: |
||||||||||||
| INTEREST, NET OF AMOUNTS CAPITALIZED |
$ | 3,402 | $ | 10,343 | $ | 15,611 | ||||||
| INCOME TAXES |
$ | — | $ | 26 | $ | (33 | ) | |||||
See accompanying notes to consolidated financial statements.
F-8
Table of Contents
Index to Financial Statements
GMX Resources Inc. and Subsidiaries
Notes to Consolidated Financial Statements
December 31, 2007, 2008 and 2009
NOTE A—NATURE OF OPERATIONS AND SUMMARY OF SIGNIFICANT ACCOUNTING POLICIES
NATURE OF BUSINESS AND PRINCIPLES OF CONSOLIDATION
GMX Resources Inc. and subsidiaries (collectively “GMXR”) is engaged primarily in natural gas and crude oil exploration, development and production in the Haynesville/Bossier Shale and Cotton Valley Sands of East Texas, (the “core area”). GMXR owns and operates drilling rigs exclusively for GMXR through a wholly owned subsidiary, Diamond Blue Drilling Co. Additionally, Endeavor Pipeline Inc. (“Endeavor Pipeline”), a wholly owned subsidiary, operates our gathering system in our core area. In November 2009, the gas gathering, compression, and related equipment owned by Endeavor Pipeline was transferred to a newly formed entity, Endeavor Gathering, LLC, (“Endeavor Gathering”) and a 40% membership interest in Endeavor Gathering was sold to a third party. Endeavor Gathering will provide firm capacity gathering services as well as development of future gathering infrastructure needs in support of GMXR’s operations in its core area. Endeavor Pipeline will continue to serve as the operator of the gathering facilities.
The accompanying consolidated financial statements have been prepared in conformity with accounting principles generally accepted in the United States (“GAAP”). References to GAAP issued by the Financial Accounting Standards Board (“FASB”) in these footnotes are to the FASB Accounting Standards Codification (“ASC”). The consolidated financial statements include the accounts of GMXR and its’ wholly and majority owned subsidiaries. Undivided interests in oil and gas joint ventures are consolidated on a proportionate basis. All significant intercompany transactions have been eliminated.
USE OF ESTIMATES: The preparation of financial statements in conformity with accounting principles generally accepted in the United States requires management to make estimates and assumptions that affect the reported amounts of oil and gas reserves assets and liabilities, disclosure of contingent assets and liabilities at the date of the financial statements and the reported amounts of revenues and expenses during the reporting period. Actual results could differ from those estimates. Significant estimates include estimates for proved oil and natural gas reserve quantities, deferred income taxes, asset retirement obligations, fair value of derivative instruments, useful lives of property and equipment, expected volatility and contract term to exercise outstanding stock options, and others, and are subject to change.
RECLASSIFICATION: Certain reclassifications have been made to prior years amounts to conform to current year presentations.
CASH AND CASH EQUIVALENTS: The Company considers all highly liquid investments with maturities of three months or less at the time of purchase to be cash equivalents. The carrying value of cash and cash equivalents approximates fair value due to the short-term nature of these instruments.
CONCENTRATIONS OF CREDIT RISK: Substantially all of the Company’s receivables are within the oil and gas industry, primarily from purchasers of natural gas and crude oil and from partners with interests in common properties operated by the Company. Although diversified among many companies, collectability is dependent upon the financial wherewithal of each individual company as well as the general economic conditions of the industry. The receivables are not collateralized; however the Company does review these parties for creditworthiness and general financial condition.
The Company has accounts with separate banks in Louisiana and Oklahoma. At December 31, 2008 and 2009, the Company had $6.2 million and $32.3 million, respectively, invested in overnight investment sweep accounts. Bank deposit accounts may, at times, exceed federally insured limits. The Company has not
F-9
Table of Contents
Index to Financial Statements
GMX Resources Inc. and Subsidiaries
Notes to Consolidated Financial Statements—(Continued)
December 31, 2007, 2008 and 2009
experienced any losses in such accounts and does not believe it is exposed to significant credit risk on its cash. The difference between the investment amount and the cash and cash equivalents amount on the accompanying consolidated balance sheets represents uncleared disbursements and non-interest bearing checking accounts.
The Company currently uses natural gas and crude oil commodity derivatives to hedge a portion of its exposure to natural gas and crude oil price volatility. These arrangements expose the Company to credit risk from its counterparties. To mitigate that risk, the Company only uses counterparties that are highly-rated entities with corporate credit ratings at or exceeding A or Aa as classified by Standard & Poor’s and Moody’s, respectively.
Sales to individual customers constituting 10% or more of total natural gas and crude oil sales were as follows for each of the years ended December 31:
| 2007 | 2008 | 2009 | |||||||
| Natural gas |
|||||||||
| Texla Energy Management, Inc. |
11 | % | 20 | % | 54 | % | |||
| Various purchasers through Penn Virginia Oil & Gas, L.P. |
45 | % | 42 | % | 21 | % | |||
| BP Energy Company |
0 | % | 0 | % | 12 | % | |||
| Waskom Gas Processing Company |
0 | % | 10 | % | 11 | % | |||
| CrossTex Energy Services, Inc. |
40 | % | 22 | % | 1 | % | |||
| Crude oil |
|||||||||
| Sunoco, Inc |
0 | % | 14 | % | 52 | % | |||
| Various purchasers through Penn Virginia Oil & Gas, L.P. |
44 | % | 54 | % | 43 | % | |||
| Teppco Crude Oil, LLC |
55 | % | 14 | % | 0 | % | |||
| SemCrude, L.P. . |
0 | % | 17 | % | 0 | % |
If the Company were to lose a purchaser, it believes it could replace it with a substitute purchaser with substantially equivalent terms.
INVENTORIES: Inventories consist of crude oil in tanks and natural gas liquids. Treated and stored crude oil inventory and natural gas liquids at the end of the year are valued at the lower of production cost or market.
ACCOUNTS RECEIVABLE: The Company has receivables from joint interest owners and oil and gas purchasers that are generally uncollateralized. The Company reviews these parties for creditworthiness and general financial condition. Accounts receivable are generally due within 30 days and accounts outstanding longer than 60 days are considered past due. If necessary, the Company would determine an allowance by considering the length of time past due, previous loss history, future net revenues of the debtor’s ownership interest in oil and gas properties operated by the Company and the owners ability to pay its obligation, among other things. The Company writes off accounts receivable when they are determined to be uncollectible.
The Company establishes provisions for losses on accounts receivable if it determines that it will not collect all or part of the outstanding balance. The Company regularly reviews collectability and establishes or adjusts the allowance as necessary using the specific identification method. Due to the bankruptcy filing of one purchaser in 2008, the Company had recorded an allowance for doubtful accounts of $748,000 at December 31, 2008. There was no allowance for doubtful accounts at December 31, 2009.
OIL AND NATURAL GAS PROPERTIES: The Company follows the full cost method of accounting for its oil and natural gas properties and activities. Accordingly, the Company capitalizes all costs incurred in connection with the acquisition, exploration and development of oil and natural gas properties. The Company
F-10
Table of Contents
Index to Financial Statements
GMX Resources Inc. and Subsidiaries
Notes to Consolidated Financial Statements—(Continued)
December 31, 2007, 2008 and 2009
capitalizes internal costs that can be directly identified with exploration and development activities, but does not include any costs related to production, general corporate overhead, or similar activities. Capitalized costs include geological and geophysical work, 3D seismic, delay rentals, drilling and completing and equipping oil and gas wells, including salaries and benefits and other internal costs directly attributable to these activities. Also included in oil and natural gas properties are tubular and other lease and well equipment of $33.1 million and $32.2 million at December 31, 2008 and 2009, respectively, that have not been placed in service but for which we plan to utilize in our on-going exploration and development activities.
Proceeds from dispositions of oil and gas properties are accounted for as a reduction of capitalized costs, with no gain or loss generally recognized upon disposal of oil and natural gas properties unless such disposal significantly alters the relationship between capitalized costs and proved reserves. Revenues from services provided to working interest owners of properties in which GMX also owns an interest, to the extent they exceed related costs incurred, are accounted for as reductions of capitalized costs of oil and natural gas properties.
Investments in unevaluated properties and major development projects are not amortized until proved reserves associated with the projects can be determined or until impairment occurs. The balance of unevaluated properties is comprised of capital costs incurred for undeveloped acreage, exploratory wells in progress and capitalized interest costs. We assess all items classified as unevaluated property on a quarterly basis for possible impairment or reduction in value. We assess our properties on an individual basis or as a group if properties are individually insignificant. Our assessment includes consideration of the following factors, among others: intent to drill; remaining lease term; geological and geophysical evaluations; drilling results and activity; the assignment of proved reserves; and the economic viability of development if proved reserves are assigned. During any period in which these factors indicate an impairment, the cumulative drilling costs incurred to date for such property and all or a portion of the associated leasehold costs are transferred to the full-cost pool and are then subject to amortization.
Depreciation, depletion and amortization of oil and gas properties (“DD&A”) are provided using the units-of-production method based on estimates of proved oil and gas reserves and production, which are converted to a common unit of measure based upon their relative energy content. The Company’s cost basis for depletion includes estimated future development costs to be incurred on proved undeveloped properties. The computation of DD&A takes into consideration restoration, dismantlement, and abandonment costs and the anticipated proceeds from salvaging equipment. DD&A expense for oil and natural gas properties was $16.4 million, $26.9 million and $23.9 million for the years ended December 31, 2007, 2008, and 2009, respectively.
Capitalized costs are subject to a “ceiling test,” which limits the net book value of oil and natural gas properties less related deferred income taxes to the estimated after-tax future net revenues discounted at a 10-percent interest rate. The lower of cost or fair value of unproved properties is added to the future net revenues less income tax effects. At December 31, 2009, future net revenues are calculated using prices that represent the average of the first day of the month price for the 12-month period prior to the end of the period. Such prices are utilized except where different prices are fixed and determinable from applicable contracts for the remaining term of those contracts, including the effects of derivatives qualifying as cash flow hedges. Based on average prices for the prior 12-month period for natural gas and oil as of December 31, 2009, these cash flow hedges increased the full-cost ceiling by $69.7 million, thereby reducing the ceiling test write-down by the same amount. Our qualifying cash flow hedges as of December 31, 2009, which consisted of swaps and collars, covered 7.6 Bcf, 13.5 Bcf, and 14.0 Bcf in 2010, 2011, and 2012, respectively. Our natural gas and oil hedging activities are discussed in Note F of these consolidated financial statements.
Two primary factors impacting the ceiling test are reserve levels and natural gas and oil prices, and their associated impact on the present value of estimated future net revenues. Revisions to estimates of natural gas and
F-11
Table of Contents
Index to Financial Statements
GMX Resources Inc. and Subsidiaries
Notes to Consolidated Financial Statements—(Continued)
December 31, 2007, 2008 and 2009
oil reserves and/or an increase or decrease in prices can have a material impact on the present value of estimated future net revenues. Any excess of the net book value, less deferred income taxes, is generally written off as an expense.
PROPERTY AND EQUIPMENT: Property and equipment are capitalized and stated at cost, while maintenance and repairs are expensed currently. Depreciation and amortization of other property and equipment are provided when assets are placed in service using the straight-line method based on estimated useful lives ranging from three to twenty years. In 2009, we changed the estimated useful life of the pipeline assets from 10 to 20 years. Depreciation and amortization expense for property and equipment was $2.3 million, $4.8 million and $7.1 million for the years ending December 31, 2007, 2008, and 2009, respectively.
IMPAIRMENT OF LONG-LIVED ASSETS: Pipeline and gathering system assets and other long-lived assets used in operations are periodically assessed to determine if circumstances indicate that the carrying amount of an asset may not be recoverable. An impairment loss is recognized only if the carrying amount of a long-lived asset is not recoverable from its undiscounted cash flows. An impairment loss is the difference between the carrying amount and fair value of the asset. GMXR had no such impairment losses for the years ended December 31, 2007, 2008 or 2009.
DEBT ISSUE COSTS: The Company amortizes debt issue costs related to its revolving bank credit facility, 5.00% Convertible Senior Notes and 4.50% Convertible Senior Notes as interest expense over the scheduled maturity period of the debt. Unamortized debt issue costs were approximately $4.9 million and $8.6 million as of December 31, 2008 and 2009, respectively. The Company includes those unamortized costs in current prepaid expenses and deposits and other assets.
REVENUE DISTRIBUTIONS PAYABLE: For certain oil and natural gas properties, the Company receives production proceeds from the purchaser and further distributes such amounts to other revenue and royalty owners. Production proceeds applicable to other revenue and royalty owners are reflected as revenue distributions payable in the accompanying balance sheets. We recognize revenue for only our net interest in oil and natural gas properties.
DEFERRED INCOME TAXES: Deferred income taxes are provided for significant carryforwards and temporary differences between the tax basis of an asset or liability and its reported amount in the financial statements that will result in taxable or deductible amounts in future years. Deferred income tax assets or liabilities are determined by applying the presently enacted tax rates and laws. The Company records a valuation allowance for the amount of net deferred tax assets when, in management’s opinion, it is more likely than not that such assets will not be realized.
GMXR recognizes the financial statement effects of tax positions when it is more likely than not, based on the technical merits, that the position will be sustained upon examination by a taxing authority. Recognized tax positions are initially and subsequently measured as the largest amount of tax benefit that is more likely than not of being realized upon ultimate settlement with a taxing authority. Liabilities for unrecognized tax benefits related to such tax positions are included in other long-term liabilities unless the tax position is expected to be settled within the upcoming year, in which case the liabilities are included in accrued expenses and other current liabilities. As of December 31, 2009 and 2008, GMXR had no such liabilities.
REVENUE RECOGNITION: Natural gas and crude oil revenues are recognized when sold to a purchaser at a fixed or determinable price, when delivery has occurred and title has transferred, and if collectability of the revenue is probable. Delivery occurs and title is transferred when production has been delivered to a purchaser’s
F-12
Table of Contents
Index to Financial Statements
GMX Resources Inc. and Subsidiaries
Notes to Consolidated Financial Statements—(Continued)
December 31, 2007, 2008 and 2009
pipeline or truck. As a result of the numerous requirements necessary to gather information from purchasers or various measurement locations, calculate volumes produced, perform field and wellhead allocations and distribute and disburse funds to various working interest partners and royalty owners, the collection of revenues from oil and gas production may take up to 60 days following the month of production. Therefore, the Company makes accruals for revenues and accounts receivable based on estimates of its share of production, particularly from properties that are operated by others. Since the settlement process may take 30 to 60 days following the month of actual production, the Company’s financial results include estimates of production and revenues for the related time period. The Company records any differences, which are not expected to be significant, between the actual amounts ultimately received and the original estimates in the period they become finalized.
NATURAL GAS BALANCING: During the course of normal operations, the Company and other joint interest owners of natural gas reservoirs will take more or less than their respective ownership share of the natural gas volumes produced. These volumetric imbalances are monitored over the lives of the wells’ production capability. If an imbalance exists at the time the wells’ reserves are depleted, cash settlements are made among the joint interest owners under a variety of arrangements. The Company follows the sales method of accounting for gas imbalances. A liability is recorded when the Company’s natural gas volumes exceed its estimated remaining recoverable reserves. No receivables are recorded for those wells where the Company has taken less than its ownership share of gas production. There are no significant imbalances as of December 31, 2008 or 2009.
PRODUCTION AND SEVERANCE TAXES: Production taxes are set by state and local governments and vary as to the tax rate and the value to which that rate is applied. In Texas, where substantially all of our production is derived, severance taxes are levied as a percent of revenue received. The rate in Texas is complicated by certain severance tax exemptions or rate deductions on high cost wells. Approval of these exemptions or rate reductions is on a well by well basis, and credits are not recognized until approvals are received. Production and severance taxes for the years ended December 31, 2007, 2008 and 2009 reflect tax refunds of $518,000, $1.2 million and $2.9 million, respectively.
DERIVATIVE INSTRUMENTS: The Company uses derivative financial instruments to manage its exposure to lower oil and natural gas prices. Derivative instruments are measured at fair value and recognized as assets or liabilities in the balance sheet. Upon entering into a derivative contract, the derivative may be designated as a cash flow hedge. The relationship between the derivative instrument designated as a hedge and the hedged items is documented, as well as our objective for risk management and strategy for use of the hedging instrument to manage the risk. Derivative instruments designated as cash flow hedges are linked to specific forecasted transactions. At inception, and on an ongoing basis, a derivative instrument used as a hedge is assessed as to whether it is highly effective in offsetting changes in the cash flows of the hedged item. A derivative that is not a highly effective hedge does not qualify for hedge accounting.
Changes in fair value of a qualifying cash flow hedge are recorded in accumulated other comprehensive income, until earnings are affected by the cash flows of the hedged item. When the cash flow of the hedged item is recognized in the statement of operations, the fair value of the associated cash flow hedge is reclassified from accumulated other comprehensive income into earnings as a component of oil and gas sales. Ineffective portions of a cash flow hedge are recognized currently in earnings as a component of oil and gas sales. The changes in fair value of derivative instruments not qualifying or not designated as hedges are reported currently in the consolidated statement of operations as unrealized gains (losses) on derivatives, a component of non-operating income (expense). If a derivative instrument no longer qualifies as a cash flow hedge, hedge accounting is discontinued and the gain or loss that was recorded in accumulated other comprehensive income is recognized over the period anticipated in the original hedge transaction.
F-13
Table of Contents
Index to Financial Statements
GMX Resources Inc. and Subsidiaries
Notes to Consolidated Financial Statements—(Continued)
December 31, 2007, 2008 and 2009
FAIR VALUE. Fair value is defined as the price that would be received to sell an asset or price paid to transfer a liability in an orderly transaction between market participants at the measurement date. Inputs used in determining fair value are characterized according to a hierarchy that prioritizes those inputs based upon the degree to which they are observable. The three levels of the fair-value-measurement hierarchy are as follows:
Level 1—inputs represent quoted prices in active markets for identical assets or liabilities (for example, exchange-traded commodity derivatives).
Level 2—inputs other than quoted prices included within Level 1 that are observable for the asset or liability, either directly or indirectly (for example, quoted market prices for similar assets or liabilities in active markets or quoted market prices for identical assets or liabilities in markets not considered to be active, inputs other than quoted prices that are observable for the asset or liability, or market-corroborated inputs).
Level 3—inputs that are not observable from objective sources, such as the Company’s internally developed assumptions used in pricing an asset or liability.
In determining fair value, the Company utilizes observable market data when available, or models that incorporate observable market data. In addition to market information, the Company incorporates transaction-specific details that, in management’s judgment, market participants would take into account in measuring fair value. In arriving at fair-value estimates, the Company utilizes the most observable inputs available for the valuation technique employed. If a fair-value measurement reflects inputs at multiple levels within the hierarchy, the fair-value measurement is characterized based upon the lowest level of input that is significant to the fair-value measurement. Recurring fair-value measurements are performed for derivatives instruments. The carrying amount of cash and cash equivalents, accounts receivable, accounts payable and deferred premiums on derivative instruments reported on the balance sheet approximates fair value.
ASSET RETIREMENT OBLIGATIONS: The Company’s asset retirement obligations relate to estimated future plugging and abandonment expenses on its oil and gas properties and related facilities disposal. These obligations to abandon and restore properties are based upon estimated future costs that may change based upon future inflation rates and changes in statutory remediation rules. The Company records the fair value of a liability for an asset retirement obligation in the period in which it is incurred and a corresponding increase in the carrying amount of oil and gas properties.
ENVIRONMENTAL LIABILITIES: Environmental expenditures that relate to an existing condition caused by past operation and that do not contribute to current or future revenue generation are expensed. Liabilities are accrued when environmental assessments and/or clean-ups are probable, and the costs can be reasonably estimated. As of December 31, 2008 and 2009, the Company has not accrued for or been fined or cited for any environmental violations that would have a material adverse effect upon the financial position, operating results or the cash flows of the Company.
F-14
Table of Contents
Index to Financial Statements
GMX Resources Inc. and Subsidiaries
Notes to Consolidated Financial Statements—(Continued)
December 31, 2007, 2008 and 2009
BASIC EARNINGS PER SHARE AND DILUTED EARNINGS PER SHARE: Basic net income per common share is computed by dividing the net income (loss) applicable to common stock by the weighted average number of shares of common stock outstanding during the period. Diluted net income per common share is calculated in the same manner, but also considers the impact to net income and common shares for the potential dilution from our convertible notes, outstanding stock options and non-vested restricted stock awards. The following table reconciles the weighted average shares outstanding used for these computations for the years ending December 31:
| 2007 | 2008 | 2009 | ||||
| Weighted average shares outstanding—basic |
13,075,560 | 14,216,466 | 20,210,400 | |||
| Effective of dilutive securities: |
||||||
| Stock options |
133,186 | — | — | |||
| Weighted average shares outstanding—diluted |
13,208,746 | 14,216,466 | 20,210,400 | |||
Common shares outstanding loaned in connection with the 5.00% Convertible Senior Notes issued in February 2008 in the amount of 3,440,000 and 3,140,000 shares were not included in the computation of earnings per common share for the years ending December 31, 2008 or 2009, respectively.
For purposes of calculating weighted average common shares—diluted, non-vested restricted stock and outstanding stock options would be included in the computation using the treasury stock method, with the proceeds equal to the amount of cash received from the employee upon exercise and the average unrecognized compensation during the period, adjusted for any estimated future tax consequences recognized directly in equity.
Due to our net loss from operations for the years ended December 31, 2008 and 2009, we excluded the effects of the convertible notes, stock options and shares of non-vested restricted stock as they would have been antidilutive. The amount of shares excluded for 2008 and 2009 was 995,000 and 794,000, respectively.
STOCK BASED COMPENSATION: The Company recognizes compensation expense for all stock-based payment awards made to employees, contractors and non-employee directors. Stock-based compensation expense is measured at the grant date based on the fair value of the award and is recognized as expense over the requisite service period, which is generally the vesting period. For stock options, the Company uses the Black-Scholes option-pricing model to determine the option fair value, which requires the input of highly subjective assumptions, including the expected volatility of the underlying stock, the expected term of the award, the risk-free interest rate and expected future divided payments. Expected volatilities are based on our historical volatility. The expected life of an award is estimated using historical exercise behavior data and estimated future behavior. The risk-free interest rate is based on the U.S. Treasury yields in effect at the time of grant and extrapolated to approximate the expected life of the award. The Company does not expect to declare or pay dividends in the foreseeable future.
COMMITMENTS AND CONTINGENCIES: Liabilities for loss contingencies arising from claims, assessments, litigation, or other sources are recorded when it is probable that a liability has been incurred and the amount can be reasonably estimated.
SUPPLEMENTAL DISCLOSURE OF NON-CASH INVESTING AND FINANCING ACTIVITIES: During the years ended December 31, 2007, 2008 and 2009, the Company recorded non-cash additions to oil and gas properties of $2.6 million, $3.6 million and $1.2 million, respectively related to the depreciation of its
F-15
Table of Contents
Index to Financial Statements
GMX Resources Inc. and Subsidiaries
Notes to Consolidated Financial Statements—(Continued)
December 31, 2007, 2008 and 2009
Company-owned rigs and the capitalization of non-cash stock compensation expense related to employees directly involved in exploration and development activities.
Capital additions funded through accounts payable include $30.1 million, $34.6 million, and $25.6 million for the years ended December 31, 2007, 2008, and 2009, respectively.
During the years ended December 31, 2007, 2008 and 2009, the Company recorded a net non-cash asset and related liability of $1.5 million, $2.4 million, and $565,000 respectively, associated with the asset retirement obligation on the acquisition and/or development of oil and gas properties.
Interest of $122,000, $361,000, and $1.8 million was capitalized during the years ended December 31, 2007, 2008, and 2009, respectively, related to the unproved properties that were not being currently depreciated, depleted or amortized and on which development activities were not in progress.
RECENTLY ISSUED ACCOUNTING PRONOUNCEMENTS: The Company adopted a new standard for its derivative instruments and hedging activities, effective January 1, 2009. The standard does not change the Company’s accounting for derivatives, but requires enhanced disclosures regarding the Company’s methodology and purpose for entering into derivative instruments, accounting for derivative instruments and related hedged items (if any), and the impact of derivative instruments on the Company’s consolidated financial position, results of operations and cash flows.
The Company adopted new accounting and reporting standards for noncontrolling interests in a subsidiary and for the deconsolidation of subsidiaries, effective January 1, 2009. Specifically, these standards require the recognition of noncontrolling interests (formerly referred to as minority interests) as a component of total equity. These standards establish a single method of accounting for changes in a parent’s ownership interest in a subsidiary that do not result in deconsolidation and specifically provide that dispositions of subsidiary stock are required to be accounted for as equity transactions with no gain or loss recognized upon disposal. Finally, consolidated net income and comprehensive income are presented to include amounts attributable to both the parent and noncontrolling interests. See “Note D—Noncontrolling Interests”.
The Company adopted a new accounting standard for business combinations, effective January 1, 2009. The standard applies prospectively to the Company for future business combinations. The standard expands the definition of what qualifies as a business, thereby increasing the scope of transactions that qualify as business combinations. Furthermore, under the standard, changes in estimates of income tax liabilities existing at the date of, or arising in connection with, past business combinations are accounted for as adjustments to current-period income as opposed to adjustments to goodwill. The adoption of the standard had no impact on the Company’s consolidated financial position, results of operations or cash flows.
The Company adopted a new standard on determining whether instruments granted in share-based payment transactions constitute participating securities, effective January 1, 2009. This standard addresses whether instruments granted in share-based payment transactions are participating securities prior to vesting, and therefore included in the allocation of earnings for purposes of computing EPS. Unvested share-based payment awards, whether paid or unpaid, that contain nonforfeitable rights to dividends or dividend equivalents constitute participating securities and are included in the computation of EPS. The Company’s restricted stock awards do not contain nonforfeitable rights to dividends or dividend equivalents, and thereby do not qualify as participating securities. The adoption of the standard had no impact on the Company’s consolidated financial position, results of operations or cash flows.
F-16
Table of Contents
Index to Financial Statements
GMX Resources Inc. and Subsidiaries
Notes to Consolidated Financial Statements—(Continued)
December 31, 2007, 2008 and 2009
In December 2009, the Company adopted revised oil and gas reserve estimation and disclosure requirements. The primary impact of the new disclosures for the Company is to align the definition of proved reserves with the Securities and Exchange Commission (SEC) Modernization of Oil and Gas Reporting rules, which were issued by the SEC at the end of 2008 and effective for fiscal periods ending on or after December 31, 2009. The accounting standards revised the definition of proved oil and gas reserves to require that the average, first-day-of-the-month price during the 12-month period preceding the end of the year rather than the year-end price, must be used when estimating whether reserve quantities are economical to produce. This same 12-month average price is also used in calculating the aggregate amount of (and changes in) future cash inflows related to the standardized measure of discounted future net cash flows. The rules also allow for the use of reliable technology to estimate proved oil and gas reserves, if those technologies have been demonstrated to result in reliable conclusions about reserve volumes. The unaudited supplemental information on oil and gas exploration and production activities for 2009 has been presented following these new reserve estimation and disclosure rules, which may not be applied retrospectively. The 2007 and 2008 data are presented in accordance with the Financial Accounting Standards Board (FASB) oil and gas disclosure requirements effective during those respective periods. The Company’s fourth quarter 2009 DD&A and impairment calculations were based upon proved reserves that were determined using the new reserve guidelines, whereas DD&A and impairment calculations in previous quarters within 2009 were based on the prior SEC methodology. See “Note N—Supplemental Information on Oil and Natural Gas Properties” for additional disclosures associated with the adoption of this standard.
The Company adopted a new standard for the accounting treatment for certain convertible debt instruments that may be settled upon conversion in cash, shares of common stock or any portion thereof at the election of the issuing company that requires the use of a bifurcation model under which the value of the debt instrument is determined without regard to the conversion feature. The difference between the issuance amount of the debt instrument and the value determined is recorded as an equity contribution. The resulting debt discount is amortized over the period the convertible debt is expected to be outstanding as additional non-cash interest expense. This standard was effective for financial statements issued for fiscal years beginning after December 15, 2008, and early adoption was not permitted. The Company adopted this standard effective January 1, 2009. This new standard changed the accounting treatment for the Company’s 5.00% convertible notes that were issued in February 2008. As this new standard was required to be applied retrospectively for any instrument within its scope that was outstanding during any of the periods presented, certain amounts in the Company’s consolidated financial statements for the year ended December 31, 2008 have been adjusted See “Note C—Adoption of Accounting Principles” for additional disclosures associated with the adoption of this standard.
In October 2009, a new standard for accounting for own-share lending arrangements in contemplation of convertible debt issuance was issued. The standard requires that such share-lending arrangement be measured at fair value at the date of issuance and recognized as an issuance cost with an offset to paid-in-capital and the loaned shares be excluded in the computation of basic and diluted earnings per share. The issuance cost is required to be amortized as interest expense over the life of the financing arrangement. The standard also requires additional disclosures including a description and the terms of the arrangement and the reason for entering into the arrangement. Retrospective application is required for all arrangements outstanding as of the beginning of the fiscal years beginning on or after December 15, 2009. We entered into a share lending arrangement in connection with the February 2008 issuance of our 5.00% Convertible Senior Notes due 2013. The impact of the provision on our financial statements was evaluated and considered immaterial. We will adopt the standard on its effective date as of the beginning of the fiscal year beginning January 1, 2010.
F-17
Table of Contents
Index to Financial Statements
GMX Resources Inc. and Subsidiaries
Notes to Consolidated Financial Statements—(Continued)
December 31, 2007, 2008 and 2009
NOTE B—CORRECTION OF ERRORS
The Company concluded that its previously issued financial statements for the year ended December 31, 2008, and the quarters ended March 31, June 30, and September 30, 2009, respectively, contain errors. The errors relate to (i) the method used to record the Company's full cost pool impairment charges in the fourth quarter of 2008 and first quarter of 2009, other impairment charges recorded during 2009 and related deferred income taxes in the fourth quarter of 2008 and the first and second quarters of 2009, and (ii) the computation of the Company's diluted loss per share for 2008 and the first three quarters of 2009.
The errors in the prior full cost pool impairment charge calculations are primarily due to a failure to appropriately account for the effects of deferred income taxes or deferred income tax benefits on the impairment charges. The Securities and Exchange Commission issued additional guidance in October 2009 that clarified the proper methodology for this calculation, which came to the attention of the Company during the preparation of its financial statements for the year ended December 31, 2009. The Company also determined that it incorrectly recorded a lower of cost or market inventory valuation charge on certain long-lived assets during the first and second quarters of 2009.
With respect to the computation of the Company's diluted loss per share for the year ended December 31, 2008, and the first three quarters of 2009, the Company applied the dilutive effect of additional shares issuable pursuant to convertible securities, unvested restricted stock awards and stock options in calculating diluted loss per share. However, these additional shares should have been excluded from the calculations as their effect is antidilutive of the basic loss per share amounts. As a result, the Company's diluted loss per share amounts for such periods should have been reported as equal to the basic loss per share amounts in such periods.
The following financial statement line items in the consolidated balance sheet as of December 31, 2008 were adjusted to correct the errors:
| As Reported | Adjustments due to Correction of Errors |
As Restated for Correction of Errors(1) |
||||||||||
| (in thousands) | ||||||||||||
| ASSETS | ||||||||||||
| OIL AND NATURAL GAS PROPERTIES, BASED ON THE FULL COST METHOD |
||||||||||||
| Properties being amortized |
$ | 608,865 | $ | (8,203 | ) | $ | 600,662 | |||||
| Accumulated depreciation, depletion and impairment |
$ | (211,785 | ) | $ | (41,021 | ) | $ | (252,806 | ) | |||
| PROPERTY AND EQUIPMENT, AT COST, NET |
$ | 85,284 | $ | 8,203 | $ | 93,487 | ||||||
| DEFERRED INCOME TAXES |
$ | 11,519 | $ | (11,519 | ) | $ | — | |||||
| LIABILITIES AND EQUITY | ||||||||||||
| CURRENT LIABILITIES |
||||||||||||
| Deferred income tax |
$ | (6,996 | ) | $ | (6,996 | ) | $ | — | ||||
| EQUITY |
||||||||||||
| Accumulated deficit |
$ | (56,652 | ) | $ | (45,544 | ) | $ | (102,196 | ) | |||
| (1) | The restated amounts will not agree to the consolidated financial statements due to the retrospective application of the adoption of ASC 470-20. See “Note C—Adoption of Accounting Principles.” |
F-18
Table of Contents
Index to Financial Statements
GMX Resources Inc. and Subsidiaries
Notes to Consolidated Financial Statements—(Continued)
December 31, 2007, 2008 and 2009
The following financial statement line items in the consolidated statement of operations for the year ended December 31, 2008 were adjusted to correct the errors:
| As Reported | Adjustments due to Correction of Errors |
As Adjusted for Correction of Errors(1) |
||||||||||
| (in thousands) | ||||||||||||
| EXPENSES: |
||||||||||||
| Impairment of oil and natural gas properties |
$ | 151,629 | $ | 41,021 | $ | 192,650 | ||||||
| Income (loss) from operations |
$ | (94,943 | ) | $ | (41,021 | ) | $ | (135,964 | ) | |||
| (PROVISION) BENEFIT FOR INCOME TAXES |
$ | 24,980 | $ | (4,523 | ) | $ | 20,457 | |||||
| NET INCOME (LOSS) |
$ | (81,713 | ) | $ | (45,544 | ) | $ | (127,257 | ) | |||
| NET INCOME (LOSS) APPLICABLE TO COMMON SHAREHOLDERS |
$ | (86,338 | ) | $ | (45,544 | ) | $ | (131,882 | ) | |||
| EARNINGS (LOSS) PER SHARE—BASIC |
$ | (6.07 | ) | $ | (3.21 | ) | $ | (9.28 | ) | |||
| EARNINGS (LOSS) PER SHARE—DILUTED |
$ | (5.66 | ) | $ | (3.62 | ) | $ | (9.28 | ) | |||
| (1) | The restated amounts will not agree to the consolidated financial statements due to the retrospective application of the adoption of ASC 470-20. See “Note C—Adoption of Accounting Principles.” |
The effects on the 2009 quarterly financial statements is disclosed in “Note O—Quarterly Financial Data (Unaudited)”.
NOTE C—ADOPTION OF ACCOUNTING PRINCIPLES
On January 1, 2009, the Company was required to adopt ASC 470-20, which changes the accounting treatment of the Company’s 5.00% Convertible Notes that may be fully or partially settled in cash upon conversion. Under ASC 470-20, the initial carrying value of the liability component of our 5.00% Convertible Notes was restated to exclude the value of the embedded equity conversion option based upon available market information at the time of the original issuance and using the liability measurement approach prescribed in ASC 470-20. In accordance with the transition provision of the pronouncements, the comparative financial statements have been adjusted to apply the new pronouncement retrospectively.
The following financial statement line items in the consolidated balance sheet as of December 31, 2008 were affected:
| As Restated | Adjustments due to Adoption of ASC 470-20 |
As Adjusted | ||||||||||
| (in thousands) | ||||||||||||
| ASSETS | ||||||||||||
| OTHER ASSETS |
$ | 3,691 | $ | (311 | ) | $ | 3,380 | |||||
| LIABILITIES AND EQUITY | ||||||||||||
| LONG-TERM DEBT, LESS CURRENT MATURITIES |
$ | 236,462 | $ | (12,181 | ) | $ | 224,281 | |||||
| EQUITY |
||||||||||||
| Additional paid-in capital |
$ | 318,752 | $ | 9,250 | $ | 328,002 | ||||||
| Accumulated deficit |
$ | (102,196 | ) | $ | 2,620 | $ | (99,576 | ) | ||||
F-19
Table of Contents
Index to Financial Statements
GMX Resources Inc. and Subsidiaries
Notes to Consolidated Financial Statements—(Continued)
December 31, 2007, 2008 and 2009
As the 5.00% Convertible Notes were issued in February 2008, there was no financial statement impact for the year ended December 31, 2007. The following financial statement line items in the consolidated statement of operations for the year ended December 31, 2008 were affected by the retrospective adjustments:
| As Restated | Adjustments due to Adoption of ASC 470-20 |
As Adjusted | ||||||||||
| (in thousands) | ||||||||||||
| NON-OPERATING INCOME (EXPENSES) |
||||||||||||
| Interest expense |
$ | (11,681 | ) | $ | (1,936 | ) | $ | (13,617 | ) | |||
| (PROVISION) BENEFIT FOR INCOME TAXES |
$ | 20,457 | $ | 4,556 | $ | 25,013 | ||||||
| NET INCOME (LOSS) |
$ | (127,257 | ) | $ | 2,620 | $ | (124,637 | ) | ||||
| NET INCOME (LOSS) APPLICABLE TO COMMON SHAREHOLDERS |
$ | (131,882 | ) | $ | 2,620 | $ | (129,262 | ) | ||||
| EARNINGS (LOSS) PER SHARE—BASIC |
$ | (9.28 | ) | $ | (0.19 | ) | $ | (9.09 | ) | |||
| EARNINGS (LOSS) PER SHARE—DILUTED |
$ | (9.28 | ) | $ | (0.19 | ) | $ | (9.09 | ) | |||
Amounts presented in the following footnotes represent the restated and adjusted amounts.
NOTE D—NONCONTROLLING INTEREST
On November 1, 2009, GMXR and its wholly owned subsidiary, Endeavor Pipeline transferred mid-stream gas gathering, compression, and related equipment to a newly formed Endeavor Gathering and sold a 40% membership interest in Endeavor Gathering from GMXR for $36.0 million. Endeavor Gathering will provide firm capacity gathering services to GMXR in our Cotton Valley Sands and Haynesville/Bossier Shale horizontal developments in East Texas, and will also provide funding of future gathering infrastructure needs to support GMXR's production growth. Endeavor Pipeline will continue to operate the gas gathering system on a day-to-day basis. Proceeds from the sale were used to reduce outstanding indebtedness under the bank revolving credit facility. The sale of the membership interest was treated as an equity transaction. The results of operations and financial position of Endeavor Gathering are included in the consolidated financial statements of GMXR. The portion of Endeavor Gathering’s results of operations not attributable to GMXR are recorded as noncontrolling interests.
Distributions to the members will be made on a quarterly basis to the members and allocated 80% and 20% to the noncontrolling interest and to GMXR, respectively until the noncontrolling interest member has received $36.0 million. Subsequently, distributions will be allocated 40% and 60% to the noncontrolling interest member and GMXR, respectively.
The following table sets forth the effects of changes in GMXR’s ownership interest in Endeavor Gathering on GMXR’s equity for the years ended December 31:
| 2007 | 2008 | 2009 | |||||||||
| (in thousands) | |||||||||||
| Net income (loss) applicable to GMX Resources |
$ | 16,885 | $ | (124,637 | ) | $ | (180,639 | ) | |||
| Transfers from the noncontrolling interest: |
|||||||||||
| Increase in GMXR paid-in capital for sale of 40% membership interest in Endeavor Gathering |
— | — | $ | 13,984 | |||||||
| Change from net income (loss) applicable to GMXR and transfers to noncontrolling interest |
$ | 16,885 | $ | (124,637 | ) | $ | (166,655 | ) | |||
F-20
Table of Contents
Index to Financial Statements
GMX Resources Inc. and Subsidiaries
Notes to Consolidated Financial Statements—(Continued)
December 31, 2007, 2008 and 2009
NOTE E—PROPERTY AND EQUIPMENT
Major classes of property and equipment included the following at December 31:
| December 31, | ||||||||
| 2008 | 2009 | |||||||
| (in thousands) | ||||||||
| Pipeline and related facilities |
$ | 58,628 | $ | 68,440 | ||||
| Drilling rigs |
30,458 | 30,492 | ||||||
| Machinery and equipment |
12,919 | 5,173 | ||||||
| Buildings and leasehold improvement |
4,807 | 6,003 | ||||||
| Office equipment |
1,495 | 2,324 | ||||||
| 108,307 | 112,432 | |||||||
| Less accumulated depreciation and amortization |
(16,484 | ) | (12,751 | ) | ||||
| 91,823 | 99,681 | |||||||
| Land |
1,664 | 2,074 | ||||||
| $ | 93,487 | $ | 101,755 | |||||
NOTE F—DERIVATIVE ACTIVITIES
The Company is subject to price fluctuations for natural gas and crude oil. Prices received for natural gas and crude oil sold on the spot market are volatile due to factors beyond the Company’s control. Reductions in crude oil and natural gas prices could have a material adverse effect on the Company’s financial position, results of operations, capital expenditures and quantities of reserves recoverable on an economic basis. Any reduction in reserves, including reductions due to lower prices, can reduce the Company’s borrowing base under the revolving bank credit facility and adversely affect the Company’s liquidity and ability to obtain capital for acquisition and development activities.
To mitigate a portion of its exposure to fluctuations in commodity prices, the Company enters into financial price risk management activities with respect to a portion of projected crude oil and natural gas production through financial price swaps, collars, and put spreads (collectively “derivatives”). Additionally, the Company uses basis protection swaps to reduce basis risk. Basis is the difference between the physical commodity being hedged and the price of the futures contract used for hedging. Basis risk is the risk that an adverse change in the futures market will not be completely offset by an equal and opposite change in the cash price of the commodity being hedged. Basis risk exists in natural gas due to the geographic price differentials between a given cash market location and the futures contract delivery locations. Settlement or expiration of the hedges is designed to coincide as closely as possible with the physical sale of the commodity being hedged—daily for oil and monthly for natural gas—to obtain reasonable assurance that a gain in the cash sale will offset the loss on the hedge and vice versa.
The Company’s revolving bank credit facility requires it to maintain a hedging program on mutually acceptable terms whenever the loan amount outstanding exceeds 75% of the borrowing base.
F-21
Table of Contents
Index to Financial Statements
GMX Resources Inc. and Subsidiaries
Notes to Consolidated Financial Statements—(Continued)
December 31, 2007, 2008 and 2009
The Company’s derivative financial instruments potentially consist of price swaps, collars, put spreads and basis swaps. A description of these types of instruments is provided below:
| Fixed price swaps |
The Company receives a fixed price and pays a variable price to the contract counterparty. The fixed-price payment and the floating price payment are netted, resulting in a net amount due to or from the counterparty. | |
| Costless collars |
The instrument contains a fixed floor price (long put option) and ceiling price (short call option), where the purchase price of the put option equals the sales price of the call option. At settlement, if the market price exceeds the ceiling price, the Company pays the difference between the market price and the ceiling price. If the market price is less than the fixed floor price, the Company receives the difference between the fixed floor price and the market price. If the market price is between the ceiling and the fixed floor price, no payments are due from either party. | |
| Three-way collars |
A three-way collar contract consists of a standard collar contract plus a put sold by the Company with a price below the floor price of the collar. This additional put requires us to make a payment to the counterparty if the settlement price for any settlement period is below the put price. Combining the collar contract with the additional put results in the Company being entitled to a net payment equal to the difference between the floor price of the standard collar and the additional put price if the settlement price is equal to or less than the additional put price. If the settlement price is greater than the additional put price, the result is the same as it would have been with a standard collar contract only. Therefore, if market prices are below the additional put option, the Company would be entitled to receive the market price plus the difference between the additional put option and the floor. This strategy enables the Company to increase the floor and the ceiling price of the collar beyond the range of a traditional costless collar while defraying the associated cost with the sale of the additional put. | |
| Put spreads |
A put spread is the same as a three-way collar without the ceiling price (short call option). Therefore, if market prices are below the additional put option, the Company would be entitled to receive the market price plus the difference between the additional put option and the floor. | |
| Basis swaps |
Natural gas basis protection swaps are arrangements that guarantee a price differential between NYMEX natural gas futures and Houston Ship Channel, which is a close proximity for the Company’s primary market hubs. The Company receives a payment from the counterparty if the price differential is less than the stated terms of the contract and pays the counterparty if the price differential is greater than the stated terms of the contract. | |
The Company utilizes counterparties for our derivative instruments that are members of our lending bank group and that the Company believes are credit-worthy entities at the time the transactions are entered into. The Company closely monitors the credit ratings of these counterparties. Additionally, the Company performs both quantitative and qualitative assessments of these counterparties based on their credit ratings and credit default swap rates where applicable. However, the recent events in the financial markets demonstrate there can be no assurance that a counterparty financial institution will be able to meet its obligations to the Company.
None of the Company’s derivative instruments contain credit-risk-related contingent features. Additionally, the Company has not incurred any credit-related losses associated with derivative activities and believes that its counterparties will continue to be able to meet their obligations under these transactions.
F-22
Table of Contents
Index to Financial Statements
GMX Resources Inc. and Subsidiaries
Notes to Consolidated Financial Statements—(Continued)
December 31, 2007, 2008 and 2009
ASC 815 requires all derivative instruments to be recognized at fair value in the balance sheet. Fair value is generally determined based on the difference between the fixed contract price and the underlying estimated market price at the determination date. Derivative instruments with the same counterparty are presented on a net basis where the legal right of offset exists. The following is a summary of the asset and liability fair values of the Company’s derivative contracts:
| Balance Sheet Location |
Asset Fair Value | |||||||
| December 31, 2008 | December 31, 2009 | |||||||
| (in thousands) | ||||||||
| Derivatives designated as Hedging Instruments under ASC 815 |
||||||||
| Natural gas |
Current derivative asset | $ | 15,655 | $ | 12,896 | |||
| Natural gas |
Derivative instruments—non-current | 5,908 | 19,144 | |||||
| Crude oil |
Current derivative asset | 2,742 | — | |||||
| $ | 24,305 | $ | 32,040 | |||||
| Derivatives not designated as Hedging Instruments under ASC 815 |
||||||||
| Natural gas |
Current derivative asset | $ | 3,043 | $ | — | |||
| $ | 3,043 | $ | — | |||||
| Total derivative asset fair value |
$ | 27,348 | $ | 32,040 | ||||
| Balance Sheet Location |
Liability Fair Value | |||||||
| December 31, 2008 | December 31, 2009 | |||||||
| (in thousands) | ||||||||
| Derivatives designated as Hedging Instruments under ASC 815 |
||||||||
| Natural gas |
Current derivative asset | $ | 114 | $ | — | |||
| Natural gas basis |
Derivative instruments—non-current | — | 549 | |||||
| $ | 114 | $ | 549 | |||||
| Derivatives not designated as Hedging Instruments under ASC 815 |
||||||||
| Natural gas |
Current derivative asset | $ | — | $ | 374 | |||
| Natural gas basis |
Current derivative asset | — | 270 | |||||
| Natural gas |
Derivative instruments—non-current | 2,158 | 1,303 | |||||
| 2,158 | 1,947 | |||||||
| Total derivative liability fair value |
$ | 2,272 | $ | 2,496 | ||||
| Net derivative fair value |
$ | 25,076 | $ | 29,544 | ||||
F-23
Table of Contents
Index to Financial Statements
GMX Resources Inc. and Subsidiaries
Notes to Consolidated Financial Statements—(Continued)
December 31, 2007, 2008 and 2009
Following is a summary of the outstanding volumes and prices on the oil and natural gas swaps and options in place as of December 31, 2009:
| Effective Date |
Maturity Date |
Notional Amount Per Month |
Remaining Notional Amount as of December 31, 2009 |
Additional Put Options |
Floor | Ceiling | Designation under | ||||||||||
| Natural Gas (MMBtu): |
|||||||||||||||||
| 1/1/2010 |
12/31/2010 | 471,833 | 5,662,000 | $ | 5.00 | $ | 7.50 | $ | — | Cash flow hedge | |||||||
| 1/1/2010 |
12/31/2010 | 471,833 | 5,661,996 | $ | 4.00 | $ | 5.50 | $ | 7.00 | Not designated | |||||||
| 1/1/2010 |
12/31/2010 | 25,000 | 300,000 | $ | — | $ | 8.50 | Not designated | |||||||||
| 5/1/2010 |
12/31/2010 | 241,250 | 1,930,000 | $ | 4.00 | $ | 6.00 | $ | — | Cash flow hedge | |||||||
| 1/1/2011 |
12/31/2011 | 188,781 | 2,265,372 | $ | — | $ | 8.00 | Not designated | |||||||||
| 1/1/2011 |
3/31/2011 | 200,000 | 600,000 | $ | 5.50 | $ | 7.00 | $ | 8.90 | Cash flow hedge | |||||||
| 4/1/2011 |
10/31/2011 | 200,000 | 1,400,000 | $ | 5.00 | $ | 6.50 | $ | 8.30 | Cash flow hedge | |||||||
| 11/1/2011 |
3/31/2012 | 200,000 | 1,000,000 | $ | 5.50 | $ | 7.00 | $ | 10.10 | Cash flow hedge | |||||||
| 1/1/2011 |
12/31/2012 | 1,021,666 | 24,520,000 | $ | 6.00 | $ | — | Cash flow hedge | |||||||||
| 1/1/2011 |
12/31/2012 | 337,500 | 8,100,000 | $ | 4.00 | $ | — | $ | — | Cash flow hedge | |||||||
Natural gas contracts are settled against Inside FERC—Houston Ship Channel Index Price or NYMEX and all oil contracts are settled against NYMEX Light Sweet Crude. The Inside FERC—Houston Ship Channel Index Price and NYMEX Light Sweet Crude have historically had a high degree of correlation with the actual prices received by the Company.
Effects of derivative instruments on the Consolidated Statement of Operations
For derivative instruments that are designated and qualify as a cash flow hedge, the effective portion of the gain or loss on the derivative is reported as a component of other comprehensive income and reclassified into earnings in the same period or periods during which the hedged transaction affects earnings. Gains and losses on the derivative representing either hedge ineffectiveness or hedge components excluded from the assessment of effectiveness are recognized in current earnings.
| For the Year Ended December 31, 2009 | ||||||||||||
| Amount of Gain (Loss) Recognized in OCI on Derivative (Effective Portion) |
Location of Gain Reclassified from Accumulated OCI into Income Excluded |
Amount of Gain Reclassified from Accumulated OCI into Income (Effective Portion) |
Amount of Gain Recognized in Income on Derivative (Ineffective Portion and Amount Excluded from Effectiveness Testing) | |||||||||
| (in thousands) | (in thousands) | |||||||||||
| Natural gas |
$ | 20,911 | Oil and Gas Sales | $ | 28,546 | $ | 1,018 | |||||
| Crude oil |
(437 | ) | Oil and Gas Sales | 2,305 | — | |||||||
| $ | 20,474 | $ | 30,851 | $ | 1,018 | |||||||
F-24
Table of Contents
Index to Financial Statements
GMX Resources Inc. and Subsidiaries
Notes to Consolidated Financial Statements—(Continued)
December 31, 2007, 2008 and 2009
| For the Year Ended December 31, 2008 | |||||||||||
| Amount of Gain Recognized in OCI on Derivative (Effective Portion) |
Location of Gain Reclassified from Accumulated OCI into Income Excluded |
Amount of Gain Reclassified from Accumulated OCI into Income (Effective Portion) |
Amount of Gain Recognized in Income on Derivative (Ineffective Portion and Amount Excluded from Effectiveness Testing) | ||||||||
| (in thousands) | (in thousands) | ||||||||||
| Natural gas |
$ | 14,999 | Oil and Gas Sales | $ | 4,032 | $ | 925 | ||||
| Crude oil |
4,115 | Oil and Gas Sales | 2,027 | 89 | |||||||
| $ | 19,114 | $ | 6,059 | $ | 1,014 | ||||||
Assuming that the market prices of oil and gas futures as of December 31, 2009 remain unchanged, the Company would expect to transfer a gain of approximately $6.4 million from accumulated other comprehensive income to earnings during the next 12 months. The actual reclassification into earnings will be based on market prices at the contract settlement date.
For derivative instruments that do not qualify as hedges pursuant to ASC 815, changes in the fair value of these derivatives that occur prior to their maturity (i.e., temporary fluctuations in value) are recognized in current earnings. A summary of the effect of the derivatives not qualifying for hedges is as follows:
| Year Ended December 31, 2008 |
Year Ended December 31, 2009 |
|||||||||||
| Location of Loss |
Amount of Loss Recognized in Income on Derivative |
Location of Gain (Loss) |
Amount of Gain (Loss) Recognized in Income on Derivative |
|||||||||
| (in thousands) | (in thousands) | |||||||||||
| Realized |
||||||||||||
| Natural gas |
Oil and gas sales |
$ | — | Oil and gas sales |
$ | 5,920 | ||||||
| Unrealized |
||||||||||||
| Natural gas |
Unrealized losses on derivatives |
(354 | ) | Unrealized losses on derivatives |
(2,100 | ) | ||||||
| Natural gas basis |
Unrealized losses on derivatives |
— | Unrealized losses on derivatives |
(270 | ) | |||||||
| $ | (354 | ) | $ | (3,550 | ) | |||||||
F-25
Table of Contents
Index to Financial Statements
GMX Resources Inc. and Subsidiaries
Notes to Consolidated Financial Statements—(Continued)
December 31, 2007, 2008 and 2009
The valuation of our derivative instruments are based on industry standard models that primarily rely on market observable inputs. Substantially all of the assumptions for industry standard models are observable in active markets throughout the full term of the instrument. The Company categorizes these measurements as Level 2. The following table sets forth by level within the fair value hierarchy our derivative instruments, which are our only financial assets and liabilities that were accounted for at fair value on a recurring basis, as of December 31, 2009 and 2008:
| As of December 31, 2008: | As of December 31, 2009: | |||||||||||||||||
| Quoted Prices in Active Markets (Level 1) |
Significant Other Observable Inputs (Level 2) |
Significant Unobservable Inputs (Level 3) |
Quoted Prices in Active Markets (Level 1) |
Significant Other Observable Inputs (Level 2) |
Significant Unobservable Inputs (Level 3) | |||||||||||||
| (in thousands) | ||||||||||||||||||
| Financial assets: |
||||||||||||||||||
| Natural gas derivative instruments |
$ | — | $ | 22,334 | $ | — | $ | — | $ | 29,544 | $ | — | ||||||
| Crude oil derivative instruments |
$ | — | $ | 2,742 | $ | — | $ | — | $ | — | $ | — | ||||||
NOTE G—LONG-TERM DEBT
The table below presents the carrying amounts and approximate fair values of our debt obligations. The carrying amounts of our revolving bank credit facility borrowings approximate their fair values due to the short-term nature and frequent repricing of these obligations. The approximate fair values of our convertible debt securities are determined based on market quotes from independent third party brokers as they are actively traded in an established market. The fair values of our senior secured notes were estimated using discounted cash flow analyses, based on current market rates for instruments with similar cash flows.
| December 31, | ||||||||||||
| 2008 | 2009 | |||||||||||
| Carrying Amount | Fair Value | Carrying Amount | Fair Value | |||||||||
| (in thousands) | ||||||||||||
| Revolving bank credit facility(1) |
$ | 80,000 | $ | 80,000 | $ | — | $ | — | ||||
| 5.00% Senior Convertible Notes due February 2013 |
112,819 | 114,910 | 115,646 | 111,406 | ||||||||
| 4.50% Senior Convertible Notes due May 2015 |
— | — | 73,187 | 87,652 | ||||||||
| Senior Subordinated Secured Notes due July 2012(2) |
30,000 | 36,792 | — | — | ||||||||
| Joint venture financing(3) |
1,523 | 1,523 | 1,445 | 1,445 | ||||||||
| Total |
$ | 224,342 | $ | 233,225 | $ | 190,278 | $ | 200,503 | ||||
| (1) | Maturity date of July 2011 bearing a weighted average interest rate of 3.25% and 3.83% as of December 31, 2008 and 2009, respectively, collateralized by all assets of the Company |
| (2) | Fixed interest rate of 7.58% and secured by a second lien on all assets of the Company |
| (3) | Non-recourse, no interest rate |
F-26
Table of Contents
Index to Financial Statements
GMX Resources Inc. and Subsidiaries
Notes to Consolidated Financial Statements—(Continued)
December 31, 2007, 2008 and 2009
Maturities of Long-Term Debt
Maturities of long-term debt as of December 31, 2009 are as follows:
| Year |
Amount | ||
| (in thousands) | |||
| 2010 |
$ | 48 | |
| 2011 |
89 | ||
| 2012 |
126 | ||
| 2013 |
125,160 | ||
| 2014 |
190 | ||
| Thereafter |
87,082 | ||
| $ | 212,695 | ||
Revolving Bank Credit Facility
The Company has an executed loan agreement providing for a secured revolving line of credit up to an amount established as the borrowing base, which is based on the Company’s oil and natural gas reserves (the “borrowing base”). The loan bears interest at a rate elected by the Company that is based on the prime, LIBO or federal funds rate plus margins ranging from 1% to 4.75% depending on the base rate used and the amount of the loan outstanding in relation to the borrowing base.
Principal is payable voluntarily by the Company or is required to be paid (i) if the loan amount exceeds the borrowing base; (ii) if the lender elects to require periodic payments as a part of a borrowing base re-determination; and (iii) at the maturity date of July 15, 2011. The Company is obligated to pay a facility fee equal to 0.5% per year of the unused portion of the borrowing base payable quarterly. The borrowing base has been adjusted from time to time and was $130 million at December 31, 2009. The loan is secured by a first mortgage on assets of the Company.
As part of the regular redetermination in 2008, the Company and the banks executed an amended and restated loan agreement providing for up to $250 million in loans as the borrowing base permits. The revolving bank credit facility was repaid in July 2008 with proceeds from a common stock offering. The Company subsequently reborrowed on the facility to fund development and exploration activities and for general corporate purposes and again repaid the outstanding indebtedness in October 2009 with proceeds from the common stock offering, 4.50% Convertible Senior Notes and the sale of the membership interest in Endeavor Gathering.
Effective as of October 17, 2009, we amended the terms of our revolving bank credit facility to document our lenders’ consent to the Endeavor Gathering transaction and the release by the lenders of the contributed assets from the collateral pledged in support of the indebtedness under the revolving credit facility. As part of the amendment, we also agreed to the inclusion of certain covenants in the revolving credit facility that prohibit the creation of certain debt or the creation of incurrence of certain liens by Endeavor Gathering. In addition to the amendments relating to the Endeavor Gathering transaction, this amendment also amended the terms of the revolving bank credit facility to: (i) permit us to offer and sell our 4.50% convertible notes and to make certain related changes to provisions of the revolving bank credit facility restricting us from (a) selling 4.50% convertible senior notes with an aggregate principal amount greater than the amount received by us in our concurrent offering of common stock, and (b) making any payment of principal or interest on the 4.50% convertible senior notes if we are in default under the revolving bank credit facility at the time or if any such a payment would cause a default; and (ii) remove the minimum net worth covenant previously imposed on us under the revolving bank credit facility.
F-27
Table of Contents
Index to Financial Statements
GMX Resources Inc. and Subsidiaries
Notes to Consolidated Financial Statements—(Continued)
December 31, 2007, 2008 and 2009
The agreement contains various affirmative and restrictive covenants. These covenants, among other things, prohibit additional indebtedness, sales of assets, mergers and consolidations, dividends and distributions, and changes in management and require the maintenance of various financial ratios. The required and actual financials ratios as of December 31, 2009 are shown below:
| Financial Covenant |
Required Ratio | Actual Ratio | ||
| Current ratio(1) |
Not less than 1 to 1 | 4.51 to 1 | ||
| Ratio of total debt to EBITDA(2) |
Not greater than 4 to 1 | 3.25 to 1 | ||
| Ratio of EBITDA, as defined in the revolving bank credit facility agreement to cash interest expense(3) |
Not less than 3 to 1 | 3.24 to 1 |
| (1) | Current ratio is defined in our revolving bank credit facility as the ratio of current assets plus the unused and available portion of the revolving bank credit facility ($130 million as of December 31, 2009) to current liabilities. The calculation will not include the effects, if any, of derivatives under ASC 815. As of December 31, 2009, current assets included derivatives assets of $12.3 million. In addition, the convertible notes are not considered a current liability unless one or more convertible notes have been surrendered for conversion and then only to the extent of the cash payment due on the conversion of the notes surrendered. As of December 31, 2009, none of the convertible notes had been surrendered for conversion. |
| (2) | EBITDA as defined in our revolving bank credit facility as of December 31, 2009 is calculated as follows (amounts in thousands): |
| Net loss |
$ | (180,466 | ) | |
| Plus: |
||||
| Interest expense |
16,127 | |||
| Early extinguishment of debt |
4,976 | |||
| Impairment of oil and natural gas properties |
188,150 | |||
| Depreciation, depletion and amortization |
31,006 | |||
| Non-cash compensation and other expenses |
6,258 | |||
| Less: |
||||
| Income tax benefit |
33 | |||
| EBITDA |
$ | 66,018 | ||
| (3) | Cash interest expense is defined in the revolving bank credit facility as all interest, fees, charges, and related expenses payable in cash for the applicable period payable to a lender in connection with borrowed money or the deferred purchase price of assets that is considered interest expense under GAAP, plus the portion of rent paid or payable for that period under capital lease obligations that should be treated as interest. For 2009, cash interest expense included fees paid related to bank financing activities and other loan fees of $2.9 million. As of December 31, 2009, non-cash interest expense of $5.4 million was deducted from interest expense to arrive at the cash interest expense used in the debt covenant calculation. Non-cash interest expense primarily relates to the amortization of debt issuance costs. Capitalized interest of $1.8 million was added to interest expense. |
As of December 31, 2009, the Company was in compliance with financial covenants under the revolving bank credit facility. The lenders may accelerate all of the indebtedness under the revolving bank credit facility upon the occurrence of any event of default unless the Company cures any such default within any applicable grace period. For payments of principal and interest under the revolving bank credit facility, the Company
F-28
Table of Contents
Index to Financial Statements
GMX Resources Inc. and Subsidiaries
Notes to Consolidated Financial Statements—(Continued)
December 31, 2007, 2008 and 2009
generally has a three business day grace period, and a 30-day cure period for most covenant defaults, but not for defaults of certain specific covenants, including the financial covenants and negative covenants.
5.00% Convertible Senior Notes
In February 2008, the Company completed a $125 million private placement of 5.00% convertible senior notes due 2013 (“5.00% Convertible Notes”). In connection with such offering, we agreed to loan up to 3,846,150 shares of our common stock to an affiliate of Jefferies & Company, Inc. to facilitate hedging transactions by purchasers of the notes.
As a result of the adoption of the new authoritative accounting guidance under ASC Topic 470 as of January 1, 2009 and its retrospective application (as discussed in Note B), the Company recorded a debt discount of $14.3 million, which represented the fair value of the equity conversion feature, and recorded a corresponding increase in additional paid-in capital (“APIC”), net of deferred taxes. In addition, the transaction costs incurred directly related to the issuance of the 5.00% Convertible Notes were allocated proportionately to the equity conversion feature and recorded as APIC. The equity component is not subsequently re-valued as long as it continues to qualify for equity treatment.
The debt discount is amortized as additional non-cash interest expense over the expected term of the 5.00% Convertible Notes through February 2013. As of December 31, 2009, the net carrying amount was as follows (amounts in the thousands):
| Principal amount |
$ | 125,000 | ||
| Unamortized debt discount |
(9,354 | ) | ||
| Carrying amount |
$ | 115,646 | ||
The 5.00% Convertible Notes bear interest at a rate of 5.00% per year, payable semiannually in arrears on February 1 and August 1 of each year, beginning August 1, 2008. As a result of the amortization of the debt discount through non-cash interest expense, the effective interest rate on the 5.00% Convertible Notes is 8.7% per annum. The amount of the cash interest expense recognized with respect to the 5.00% contractual interest coupon for the years ended December 31, 2009 and 2008 was $6.3 million and $5.5 million, respectively. The amount of non-cash interest expense for the years ended December 31, 2009 and 2008 related to the amortization of the debt discount and amortization of the transaction costs was $3.5 million and $2.7 million, respectively. As of December 31, 2009, the unamortized discount is expected to be amortized into earnings over 3.1 years. The carrying value of the equity component of the 5.00% Convertible Notes was $9.3 million as of December 31, 2009.
Holders may convert their 5.00% Convertible Notes at their option prior to the close of business on the business day immediately preceding November 1, 2012 only under the following circumstances:
| • | during any fiscal quarter commencing after March 31, 2008 if the last reported sale price of the common stock for at least 20 trading days during a period of 30 consecutive trading days ending on the last trading day of the preceding fiscal quarter is greater than or equal to 130% of the applicable conversion price on each such trading day; |
| • | during the five business-day period after any five consecutive trading-day period in which the trading price for each day of that measurement period was less than 98% of the last reported sale price of our common stock and the applicable conversion rate on each such day; or |
F-29
Table of Contents
Index to Financial Statements
GMX Resources Inc. and Subsidiaries
Notes to Consolidated Financial Statements—(Continued)
December 31, 2007, 2008 and 2009
| • | the occurrence of certain sales of assets, distributions or changes to distribution rights to common stockholders, mergers and consolidations, changes in management, or our common stock ceases to be listed on a United States national or regional securities exchange, among other things. |
On and after November 1, 2012 until the close of business on the business day immediately preceding the maturity date, holders may convert their 5.00% Convertible Notes at any time, regardless of the foregoing circumstances.
Upon conversion, the Company will satisfy its conversion obligation by paying and delivering cash for the lesser of the principal amount or the conversion value, and, if the conversion value is in excess of the principal amount, by paying or delivering, at its option, cash and/or shares of its common stock for such excess. The conversion value is a daily value calculated on a proportionate basis for each day of a 60 trading-day observation period. The conversion rate is initially 30.7692 shares of the Company’s common stock per $1,000 principal amount of notes (equivalent to a conversion price of approximately $32.50 per share of common stock). The conversion rate is subject to adjustment in some events but will not be adjusted for accrued interest. In addition, following any fundamental change that occurs prior to the maturity date, we will increase the conversion rate for a holder who elects to convert its 5.00% Convertible Notes in connection with such a fundamental change in certain circumstances. The increase in the conversion rate is determined based on a formula that takes into consideration our stock price at the time of the fundamental change (ranging from $25.00 to $150.00 per share) and the remaining time to maturity of the notes. The increase in the conversion rate ranges from 0% to 30% increasing as the stock price at the time of the fundamental change increases from $25.00 and declines as the remaining time to maturity of the notes decreases.
We may not redeem the 5.00% Convertible Notes prior to maturity. However, if we undergo a fundamental change, holders may require us to repurchase the 5.00% Convertible Notes in whole or in part for cash at a price equal to 100% of the principal amount of the 5.00% Convertible Notes to be repurchased plus any accrued and unpaid interest (including additional interest, if any) to, but excluding, the fundamental change repurchase date.
The 5.00% Convertible Notes are senior unsecured obligations of the Company and rank equally in right of payment to all of the Company’s other existing and future senior indebtedness. The 5.00% Convertible Notes are effectively subordinated to revolving bank credit facility, to the extent of the value of our assets pledged as collateral for such indebtedness. The 5.00% Convertible Notes are also effectively subordinated to all liabilities of our subsidiaries, including liabilities under any guarantees they have issued.
4.50% Convertible Senior Notes
In October 2009, the Company completed at $86.3 million private placement of 4.50% convertible senior notes due 2015 (“4.50% Convertible Notes”). The proceeds of the offering were used to repay the Senior Subordinated Secured Notes due 2012 and a portion of the outstanding indebtedness under the revolving bank credit facility. The Company recorded a debt discount of $13.4 million, which represented the fair value of the equity conversion feature, and recorded a corresponding increase in APIC, net of deferred taxes. In addition, the transaction costs incurred directly related to the issuance of the 4.50% Convertible Notes were allocated proportionately to the equity conversion feature and recorded as APIC. The equity component is not subsequently re-valued as long as it continues to qualify for equity treatment. As of December 31, 2009, the net carrying amount was as follows (amounts in thousands):
| Principal amount |
$ | 86,250 | ||
| Unamortized debt discount |
(13,063 | ) | ||
| Carrying amount |
$ | 73,187 | ||
F-30
Table of Contents
Index to Financial Statements
GMX Resources Inc. and Subsidiaries
Notes to Consolidated Financial Statements—(Continued)
December 31, 2007, 2008 and 2009
The 4.50% Convertible Notes bear interest at a rate of 4.50% per year, payable semiannually in arrears on November 1 and May 1 of each year, beginning May 1, 2010. As a result of the amortization of the debt discount through non-cash interest expense, the effective interest rate on the 4.50% Convertible Notes is 9.09% per annum. The amount of the cash interest expense recognized with respect to the 4.50% contractual interest coupon for the year ended December 31, 2009 was $0.6 million. The amount of non-cash interest expense for the year ended December 31, 2009 related to the amortization of the debt discount and amortization of the transaction costs was $0.4 million. As of December 31, 2009, the unamortized discount is expected to be amortized into earnings over 5.3 years. The carrying value of the equity component of the 4.50% Convertible Notes was $8.4 million as of December 31, 2009.
Holders may convert their notes prior to the close of business on the business day immediately preceding February 1, 2015, only under the following circumstances:
The 4.50% Convertible Notes bear interest at a rate of 4.50% per year, payable semiannually in arrears on May 1 and November 1 of each year, beginning May 1, 2010. The 4.50% Convertible Notes mature on May 1, 2015, unless earlier converted or repurchased by us. Holders may convert their notes prior to the close of business on the business day immediately preceding February 1, 2015, only under the following circumstances:
| • | during any fiscal quarter commencing after January 1, 2010, if the last reported sale price of our common stock for at least 20 trading days during a period of 30 consecutive trading days ending on the last trading day of the preceding fiscal quarter is greater than or equal to 130% of the applicable conversion price on each such trading day; |
| • | during the five business-day period after any five consecutive trading-day period in which the trading price per $1,000 principal amount of 4.50% Convertible Notes for each day of such five consecutive trading-day period was less than 98% of the product of the last reported sale price of our common stock and the applicable conversion rate on each such day; |
| • | upon the occurrence of a corporate event pursuant to which: (1) we issue rights to all or substantially all of the holders of our common stock entitling them to purchase, for a period of not more than 60 calendar days after the announcement date of such issuance to subscribe for or purchase, shares of our common stock at a price per share less than the average of the last reported sale prices of our common stock for the 10 consecutive trading day period ending on the trading day immediately preceding the date of announcement of such issuance; (2) we distribute to all or substantially all of the holders of our common stock our assets, debt securities or rights to purchase our securities, if the distribution has a per share value in excess of 10% of the last reported sale price for our common stock on the trading day immediately preceding the date of announcement of such distribution; or (3) we are a party to a consolidation, merger, binding share exchange, or transfer or lease of all or substantially all of our assets, pursuant to which our common stock would be converted into cash, securities or other assets; |
| • | if: (1) a “person” or “group” within the meaning of Section 13(d) of the Exchange Act acquires more than 50% of our outstanding voting stock, (2) we consummate a recapitalization, reclassification or change of our common stock as a result of which our common stock would be converted into or exchanged for stock, other securities, other property or assets, less than 90% of which received by our common shareholders consists of publicly traded securities, (3) we consummate a share exchange, consolidation or merger pursuant to which our common stock will be converted into cash, securities or other property, (4) we consummate any sale, lease or other transfer in one transaction or a series of transactions of all or substantially all of our and our subsidiaries’ consolidated assets to any person other than one of our subsidiaries, (5) continuing directors cease to constitute at least a majority of our board of directors, (6) our shareholders approve any plan or proposal for our liquidation or dissolution, |
F-31
Table of Contents
Index to Financial Statements
GMX Resources Inc. and Subsidiaries
Notes to Consolidated Financial Statements—(Continued)
December 31, 2007, 2008 and 2009
| or (7) our common stock ceases to be listed on any of The New York Stock Exchange, The NASDAQ Global Select Market or The NASDAQ Global Market; or |
| • | if we call the 4.50% Convertible Notes for redemption, at any time prior to the close of business on the business day prior to the redemption date (any of the events described in the fourth and fifth bullets above, a “make-whole fundamental change”). |
On and after February 1, 2015 until the close of business on the business day immediately preceding the maturity date, holders may convert their 4.50% Convertible Notes, in multiples of $1,000 principal amount, at the option of the holder regardless of the foregoing circumstances.
Upon conversion, we will satisfy our conversion obligation by paying or delivering cash, shares of our common stock or a combination of cash and shares of our common stock, at our election. The conversion rate is initially 53.3333 shares of our common stock per $1,000 principal amount of 4.50% Convertible Notes (equivalent to a conversion price of approximately $18.75 per share of our common stock). The conversion rate is subject to adjustment in some events but will not be adjusted for accrued and unpaid interest. In addition, following any make-whole fundamental change that occurs prior to the maturity date, we will increase the conversion rate for a holder who elects to convert its 4.50% Convertible Notes in connection with such a make-whole fundamental change in certain circumstances. The increase in the conversion rate is determined based on a formula that takes into consideration our stock price at the time of the make-whole fundamental change (ranging from $15.00 to $100.00 per share) and the remaining time to maturity of the 4.50% Convertible Notes. The increase in the conversion rate declines from a high of 25.0% to 0.0% as the stock price at the time of the make-whole fundamental change increases from $15.00 and the remaining time to maturity of the 4.50% Convertible Notes decreases.
On or after November 1, 2012, and prior to the maturity date, we may redeem for cash all, but not less than all, of the 4.50% Convertible Notes if the last reported sales price of our common stock equals or exceeds 130% of the conversion price then in effect for 20 or more trading days in a period of 30 consecutive trading days ending on the trading day immediately prior to the date of the redemption notice. The redemption price will equal 100% of the principal amount of the 4.50% Convertible Notes to be redeemed, plus any accrued and unpaid interest, including any additional interest, to, but excluding, the redemption date. To the extent a holder converts its 4.50% Convertible Notes in connection with our redemption notice, we will increase the conversion rate as described in the preceding paragraph.
The 4.50% Convertible Notes are senior, unsecured obligations of the Company and rank equally in right of payment with our senior unsecured debt and our existing 5.00% Convertible Notes, and are senior in right of payment to our debt that is expressly subordinated to the 4.50% Convertible Notes, if any. The 4.50% Convertible Notes are structurally subordinated to all debt and other liabilities and commitments of our subsidiaries, including our subsidiaries’ guarantees of our indebtedness under our revolving bank credit facility, and are effectively junior to our secured debt to the extent of the assets securing such debt.
Senior Subordinated Secured Notes
In July 2007, we entered into a Note Purchase Agreement (“Note Agreement”) with The Prudential Insurance Company of America (“Prudential”) providing for the issuance and sale from time to time of up to $100 million in senior subordinated secured notes (the “Secured Notes”) and sold to Prudential an initial tranche of $30 million of 7.58% Series A fixed rate notes due July 31, 2012 with interest payable quarterly. Proceeds from the sale of the Secured Notes were used for general corporate purposes including additional funding of drilling and development costs in the Cotton Valley Sands in East Texas. On October 18, 2009, the Company
F-32
Table of Contents
Index to Financial Statements
GMX Resources Inc. and Subsidiaries
Notes to Consolidated Financial Statements—(Continued)
December 31, 2007, 2008 and 2009
entered into an amendment with Prudential to provide for the repayment of the outstanding indebtedness of the Secured Notes. The Company repaid all of the outstanding indebtedness under the Secured Notes with a portion of the proceeds from the 4.50% Convertible Senior Notes issued in October 2009. The terms of the repayment included a prepayment penalty of $4.6 million. Additionally, we expensed approximately $0.3 million in deferred debt issue costs.
Joint Venture Financing
In 2004, we entered into an arrangement with PVOG to purchase dollar denominated production payments from the Company on certain wells drilled during a portion of 2004. Under this agreement, PVOG provided $2.8 million in funding for our share of costs of four wells drilled which is repayable solely from 75% of GMX’s share of production revenues from these wells without interest.
NOTE H—ASSET RETIREMENT OBLIGATIONS
The activity incurred in the asset retirement obligation is as follows:
| 2008 | 2009 | |||||||
| (in thousands) | ||||||||
| Beginning balance |
$ | 3,625 | $ | 6,049 | ||||
| Liabilities incurred |
2,742 | 324 | ||||||
| Liabilities settled |
(256 | ) | (204 | ) | ||||
| Accretion |
273 | 378 | ||||||
| Revisions |
(335 | ) | 242 | |||||
| Ending balance(1) |
6,049 | 6,789 | ||||||
| Less current portion(1) |
587 | 259 | ||||||
| $ | 5,462 | $ | 6,530 | |||||
| (1) | The Company’s liability for asset retirement obligations is included in other liabilities in the consolidated balance sheets, net of the current obligations. The current portion is included in accrued expenses in the consolidated balance sheets. |
NOTE I—INCOME TAXES
Income tax expense consists of the following for the years ended December 31:
| 2007 | 2008 | 2009 | |||||||||
| (in thousands) | |||||||||||
| Current tax expense (benefit) |
$ | 33 | $ | 26 | $ | (33 | ) | ||||
| Deferred tax expense (benefit) |
7,977 | (25,039 | ) | — | |||||||
| $ | 8,010 | $ | (25,013 | ) | $ | (33 | ) | ||||
F-33
Table of Contents
Index to Financial Statements
GMX Resources Inc. and Subsidiaries
Notes to Consolidated Financial Statements—(Continued)
December 31, 2007, 2008 and 2009
Total income tax expense differed from the amounts computed by applying the U.S. federal tax rate to earnings before income taxes as a result of the following for the years ended December 31:
| 2007 | 2008 | 2009 | |||||||
| U.S. statutory tax rate |
34 | % | 34 | % | 34 | % | |||
| Statutory depletion |
(4 | ) | (4 | ) | — | ||||
| Change in valuation allowance |
— | (17 | ) | (33 | ) | ||||
| Other |
2 | 4 | (1 | ) | |||||
| Effective income tax rate |
32 | % | 17 | % | — | % | |||
Intangible development costs may be capitalized or expensed for income tax reporting purposes, whereas they are capitalized and amortized for financial statement purposes. Lease and well equipment and other property and equipment may be depreciated for income tax reporting purposes using accelerated methods and different lives. Other temporary differences include the effect of hedging transactions and stock based compensation awards. Deferred income taxes are provided on these temporary differences to the extent that income taxes which otherwise would have been payable are reduced. Deferred income tax assets are also available to offset future income taxes.
The following table sets forth the Company’s deferred tax assets and liabilities at December 31:
| 2007 | 2008 | 2009 | ||||||||||
| (in thousands) | ||||||||||||
| Deferred tax assets: |
||||||||||||
| Federal net operating loss carryforwards |
$ | 10,318 | $ | 13,132 | $ | 26,500 | ||||||
| Property and equipment |
— | — | 548 | |||||||||
| Statutory depletion carryforwards |
3,627 | 3,588 | 2,245 | |||||||||
| Stock compensation expense |
311 | 641 | 1,030 | |||||||||
| Derivative instruments |
680 | 734 | 662 | |||||||||
| Oil and natural gas properties |
— | 23,059 | 60,089 | |||||||||
| Other |
243 | 34 | 431 | |||||||||
| Valuation allowance on deferred tax assets not expected to be realized |
— | (26,075 | ) | (80,009 | ) | |||||||
| Total |
15,179 | 15,113 | 11,496 | |||||||||
| Deferred tax liabilities: |
||||||||||||
| Oil and natural gas properties |
(25,805 | ) | — | — | ||||||||
| Property and equipment |
(1,299 | ) | (1,983 | ) | — | |||||||
| Derivative instruments |
— | (9,260 | ) | (4,237 | ) | |||||||
| Convertible debt |
— | (3,870 | ) | (7,259 | ) | |||||||
| Total |
(27,104 | ) | (15,113 | ) | (11,496 | ) | ||||||
| Net deferred tax asset (liability) |
$ | (11,925 | ) | $ | — | $ | — | |||||
The valuation allowance for deferred tax assets increased by $53.9 million in 2009. In determining the carrying value of a deferred tax asset, accounting standards provides for the weighing of evidence in estimating whether and how much of a deferred tax asset may be recoverable. As we have incurred net operating losses in 2009 and prior years, relevant accounting guidance suggest that cumulative losses in recent years constitute significant negative evidence, and that future expectations about income are insufficient to overcome a history of
F-34
Table of Contents
Index to Financial Statements
GMX Resources Inc. and Subsidiaries
Notes to Consolidated Financial Statements—(Continued)
December 31, 2007, 2008 and 2009
such losses. Therefore, with the before mentioned adjustment of $53.9 million, we have reduced the carrying value of our net deferred tax asset to zero. The valuation allowance has no impact on our net operating loss (“NOL”) position for tax purposes, and if we generate taxable income in future periods, we will be able to use our NOLs to offset taxes due at that time. The Company will continue to assess the valuation allowance against deferred tax assets considering all available evidence obtained in future reporting periods.
At December 31, 2009, the Company had federal net operating loss carryforwards of $77.9 million which will begin to expire in 2018 if unused. The Company’s federal net operating loss carryforward has an annual limitation under Internal Revenue Code Section 382. In addition, at December 31, 2009, the Company had tax percentage depletion carryforwards of approximately $6.6 million which are not subject to expiration.
The Company and its subsidiaries file income tax returns in the U.S. federal jurisdiction and in various states. With few exceptions, the Company is no longer subject to U.S. federal or state income tax examinations by these tax authorities for years before and including 2005. We have not paid any significant interest or penalties associated with our income taxes, but classify both interest expense and penalties as part of our income tax expense.
NOTE J—COMMITMENTS AND CONTINGENCIES
The Company is party to various legal actions arising in the normal course of business. Matters that are probable of unfavorable outcome to the Company and which can be reasonably estimated are accrued. Such accruals are based on information known about the matters, the Company’s estimates of the outcomes of such matters, and its experience in contesting, litigating, and settling similar matters. None of the actions are believed by management to involve future amounts that would be material to the Company’s financial position or results of operations after consideration of recorded accruals.
The Company leases offices and certain equipment under operating leases and has contracts with a drilling contractor for the use of four rigs with 5 year terms. Additionally, in 2009, the Company entered into a firm transportation and a firm sales contract for various terms through 2020. Under these contracts, the Company is obligated to transport or sell minimum daily gas volumes, as calculated on a monthly basis, or pay for any deficiencies, at a set rate. The firm transportation contract for 50 Mmbtu per day commences with the completion of a pipeline which occurred in the first quarter of 2010. The sales contract was effective in September, 2009 for 15 Mmbtu per day and increases through 2014 up to 100 Mmbtu per day. These commitments are not recorded in the accompanying consolidated balance sheets.
The following is schedule by year of these obligations and minimum lease payments at December 31, 2009:
| Year |
Operating Leases | Transportation | Drilling Contracts | Total | ||||||||
| (in thousands) | ||||||||||||
| 2010 |
$ | 1,131 | $ | 5,899 | $ | 38,611 | $ | 45,641 | ||||
| 2011 |
1,129 | 6,043 | 43,143 | 50,315 | ||||||||
| 2012 |
1,118 | 6,190 | 35,122 | 42,430 | ||||||||
| 2013 |
802 | 6,349 | 4,532 | 11,683 | ||||||||
| 2014 |
491 | 5,970 | — | 6,461 | ||||||||
| Thereafter |
1,217 | 28,339 | — | 29,556 | ||||||||
| Total |
$ | 5,888 | $ | 58,790 | $ | 121,408 | $ | 186,086 | ||||
F-35
Table of Contents
Index to Financial Statements
GMX Resources Inc. and Subsidiaries
Notes to Consolidated Financial Statements—(Continued)
December 31, 2007, 2008 and 2009
Rent expense for the years ended December 31, 2007, 2008 and 2009 was $239,000, $693,000, and $1.4 million respectively.
NOTE K—STOCK COMPENSATION PLANS
We recognized $1.6 million, $3.1 million and $4.6 million of stock compensation expense for the years ending December 31, 2007, 2008 and 2009, respectively. These non-cash expenses are reflected as a component of the Company’s general and administrative expense. To the extent amortization of compensation costs relates to employees directly involved in exploration and development activities, such amounts are capitalized to oil and natural gas properties. Stock based compensation capitalized as part of oil & natural gas properties was $526,000 and $1.2 million for the years ended December 31, 2008 and 2009. We did not capitalize any stock based compensation for the year ended December 31, 2007.
2008 Long-Term Incentive Plan
In May 2008, the Board of Directors and shareholders adopted the 2008 Long-Term Incentive Plan (or “LTI Plan”) to retain and attract employees, consultants and directors, and to stimulate the active interest in the development and financial success of the Company. The LTI Plan provides for the grant of stock options, restricted stock awards, bonus stock awards, stock appreciation rights, performance units and performance bonuses, subject to certain conditions. Subject to certain adjustments, the aggregate number of shares of common stock available for awards may not exceed 750,000 shares, nor shall any individual employee award exceed 200,000 shares or $1,000,000 in any calendar year. The maximum period for exercise of an option or stock appreciation right may not be more than ten years from the date of grant and the exercise price may not be less than the fair market value of the shares underlying the option or stock appreciation right on the date of grant. Awards granted under the LTI Plan become vested at dates or upon the satisfaction of certain performance or other criteria as determined by the Board of Directors. No awards may be granted under the LTI Plan after May 2018.
2000 Stock Option Plan
In October 2000, the Board of Directors and shareholders adopted the GMX Resources Inc. Stock Option Plan (the “2000 Option Plan”). Under the 2000 Option Plan, the Company may grant both stock options intended to qualify as incentive stock options under Section 422 of the Internal Revenue Code and options which are not qualified as incentive stock options.
The maximum number of shares of common stock issuable under the 2000 Option Plan, as amended in May 2007, is 850,000, subject to appropriate adjustment in the event of reorganization, stock split, stock dividend, reclassification or other change affecting the Company’s common stock. All officers, employees and directors are eligible to receive awards under the 2000 Option Plan. The exercise price of options granted is not less than 100% of the fair market value of the shares on the date of grant. Options granted become exercisable as the Board of Directors may determine in connection with the grant of each option. In addition, the Board of Directors may at any time accelerate the date that any option granted becomes exercisable. Stock options generally vest over four years and have a 10-year contractual term. There have been no options for which vesting was accelerated in 2007, 2008, or 2009.
The Board of Directors may amend or terminate the 2000 Option Plan at any time, except that no amendment will become effective without the approval of the shareholders except to the extent such approval may be required by applicable law or by the rules of any securities exchange upon which the Company shares are admitted to listed trading. The 2000 Option Plan will terminate in 2010, except with respect to awards then outstanding.
F-36
Table of Contents
Index to Financial Statements
GMX Resources Inc. and Subsidiaries
Notes to Consolidated Financial Statements—(Continued)
December 31, 2007, 2008 and 2009
Stock Options
The following table provides information related to stock option activity under the 2000 Option Plan for the years ended December 31, 2007, 2008 and 2009:
| Number of shares underlying options |
Weighted average exercise price per share |
Aggregate intrinsic value(1) (in thousands) |
Weighted average grant date fair value per share | |||||||||
| Outstanding as of January 1, 2007 |
270,250 | $ | 14.89 | |||||||||
| Granted |
336,000 | 38.14 | $ | 14.46 | ||||||||
| Exercised |
(25,750 | ) | 3.00 | $ | 798 | |||||||
| Forfeited |
(6,000 | ) | 31.27 | |||||||||
| Outstanding as of December 31, 2007 |
574,500 | 28.86 | ||||||||||
| Granted |
100,000 | 25.84 | $ | 25.84 | ||||||||
| Exercised |
(73,450 | ) | 13.34 | $ | 2,396 | |||||||
| Forfeited |
(18,000 | ) | 33.41 | |||||||||
| Outstanding as of December 31, 2008 |
583,050 | 30.16 | ||||||||||
| Exercised |
(750 | ) | 6.10 | $ | 3 | |||||||
| Forfeited |
(5,500 | ) | 33.95 | |||||||||
| Outstanding as of December 31, 2009 |
576,800 | 30.16 | $ | — | ||||||||
| Exercisable as of December 31, 2009 |
332,300 | $ | 25.65 | $ | — | |||||||
| (1) | The intrinsic value is the amount by which the market value of the underlying stock exceeds the exercise price. |
The weighted-average remaining contractual life of outstanding and exercisable options at December 31, 2009 was 6.9 and 6.4 years, respectively. As of December 31, 2009 there was $2.5 million of total unrecognized compensation costs related to non-vested stock options granted under the Company’s stock option plan. That cost is expected to be recognized over a weighted average period of 1.5 years.
The fair value of each stock award is estimated on the date of grant using the Black-Scholes option pricing model. Assumptions used in the valuation are disclosed in the following table:
| 2007 | 2008 | 2009 | ||||||
| Expected volatility |
38.8 | % | 41.3 | % | — | |||
| Expected dividend yields |
0 | % | 0 | % | — | |||
| Expected term (in years) |
4 | 4 | — | |||||
| Risk free rate |
4.9 | % | 2.7 | % | — |
The Company estimated volatility is based on the historical volatility of the Company’s common stock. The risk free interest rate is based on the U. S. Treasury yield curve in effect at the time of grant for the expected term of the option. The expected dividend yield is based on the Company’s current dividend yield and the best estimate of projected dividend yield for future periods within the expected life of the option.
Restricted Stock
In July 2008, the Company began issuing restricted stock awards to its officers, independent directors, consultants and certain employees under the LTI Plan. The holders of these shares have all the rights and
F-37
Table of Contents
Index to Financial Statements
GMX Resources Inc. and Subsidiaries
Notes to Consolidated Financial Statements—(Continued)
December 31, 2007, 2008 and 2009
privileges of owning the shares (including voting rights) except that the holders are not entitled to delivery of a portion thereof until certain passage of time requirements are met. With respect to the restricted stock granted to officers, consultants, and employees of the Company, the shares generally vest over a 3 or 4 year period. With respect to restricted shares issued to the Company’s independent board members, the shares vest over a two year period. The fair value of the awards issued is determined based on the fair market value of the shares on the date of grant. The value is amortized over the vesting period.
A summary of the status of our unvested shares of restricted stock and the changes for the years ending December 31, 2008 and 2009 is presented below:
| Number of unvested restricted shares |
Weighted average grant- date fair value per share | |||||
| Unvested shares as of January 1, 2008 |
— | $ | — | |||
| Granted |
79,347 | $ | 74.11 | |||
| Vested |
(16,521 | ) | $ | 76.65 | ||
| Forfeited |
(98 | ) | $ | 76.73 | ||
| Unvested shares as of December 31, 2008 |
62,728 | $ | 73.44 | |||
| Granted |
542,847 | $ | 18.55 | |||
| Vested |
(23,574 | ) | $ | 70.38 | ||
| Forfeited |
(1,471 | ) | $ | 29.00 | ||
| Unvested shares as of December 31, 2009 |
580,530 | $ | 22.35 | |||
As of December 31, 2009, there was $10.7 million of unrecognized compensation expense related to non-vested restricted stock grants. This unrecognized compensation cost is expected to be recognized over a weighted-average period of 3.3 years.
The vesting of certain restricted stock grants results in state and federal income tax benefits related to the difference between the market price of the common stock at the date of vesting and the date of grant. During the years ended December 31, 2008 and 2009, we did not recognize excess tax benefits related to the vesting of restricted stock due to the market price of the common stock at the date of grant exceeding the market price at the vesting date.
401(k) Plan
The GMX Resources Inc. 401(k) Plan was adopted April 15, 2001. The plan is a qualified retirement plan under the Internal Revenue Code. All employees are eligible who have attained age 21. GMX matches the employee contributions up to 5% of the employee’s gross wages. The Company contributed $115,000, $448,000 and $281,000 in 2007, 2008 and 2009, respectively.
NOTE L—CAPITAL STOCK
In February 2007, the Company completed a public offering of 2,000,000 shares of our common stock for $34.82 per share. Net proceeds to the Company were approximately $65.6 million, which the Company used to fund drilling and development of our East Texas properties and for other general corporate purposes and to reduce indebtedness under our revolving bank credit facility.
F-38
Table of Contents
Index to Financial Statements
GMX Resources Inc. and Subsidiaries
Notes to Consolidated Financial Statements—(Continued)
December 31, 2007, 2008 and 2009
In July 2008, the Company completed an offering of 2,000,000 shares of common stock for $70.50 per share. Net proceeds to the Company were approximately $134.0 million. The Company repaid outstanding indebtedness under its revolving bank credit facility. The balance of the net proceeds were used to fund the development of oil and natural gas properties, acquisitions of additional oil and natural gas properties and for general corporate purposes.
In May 2009, the Company completed an offering of 5,750,000 shares of common stock for $12.00 per share. Net proceeds to the Company were $65.3 million. The Company used the net proceeds from this offering to repay outstanding indebtedness under its revolving bank credit facility.
In October 2009, the Company completed an offering of 6,950,000 shares of common stock at $15.00 per share. Net proceeds to the Company were approximately $98.8 million. The Company used the net proceeds from this offering, along with the proceeds from the concurrent issuance of the 4.50% Convertible Notes, to repay the outstanding indebtedness under its revolving bank credit facility and to repay all of its outstanding senior subordinated secured notes, and for general corporate purposes.
In August 2006, GMX sold 2,000,000 shares of 9.25% Series B Cumulative Preferred Stock at $25.00 per share in a public offering, resulting in a total offering of $50 million. The net proceeds of $47.1 million from the sale of preferred stock were used to fund the drilling and development of the Company’s East Texas properties and for other general corporate purposes. The annual dividend on each share of Series B Cumulative Preferred Stock is $2.3125 (an aggregate of $4.6 million) and is payable quarterly when, as and if declared by the Company, in cash (subject to specified exceptions), in arrears to holders of record as of the dividend payment record date, on or about the last calendar day of each March, June, September and December.
The Series B Cumulative Preferred Stock is not convertible into the Company’s common stock and can be redeemed at the Company’s option after September 30, 2011 at $25.00 per share. The Series B Cumulative Preferred Stock will be required to be redeemed prior to September 30, 2011 at specified redemption prices and thereafter at $25.00 per share in the event of a change of ownership or control of the Company if the acquirer is not a public company meeting certain financial criteria.
F-39
Table of Contents
Index to Financial Statements
GMX Resources Inc. and Subsidiaries
Notes to Consolidated Financial Statements—(Continued)
December 31, 2007, 2008 and 2009
NOTE M—OIL AND NATURAL GAS OPERATIONS
Costs incurred in oil and natural gas property acquisitions, exploration, and development activities are as follows for the years ended December 31:
| 2007 | 2008 | 2009 | |||||||
| (in thousands) | |||||||||
| Development and exploration costs: |
|||||||||
| Development drilling |
$ | 168,246 | $ | 183,081 | $ | 14,202 | |||
| Exploratory drilling |
— | 15,943 | 116,250 | ||||||
| Tubular and other drilling inventories |
— | 39,773 | 1,697 | ||||||
| Asset retirement obligation |
1,463 | 2,407 | 565 | ||||||
| 169,709 | 241,204 | 132,714 | |||||||
| Acquisition: |
|||||||||
| Proved |
7,814 | 23,246 | 6,881 | ||||||
| Unproved(1) |
1,018 | 26,236 | 11,450 | ||||||
| 8,832 | 49,482 | 18,331 | |||||||
| Total |
$ | 178,541 | $ | 290,686 | $ | 151,045 | |||
| (1) | Includes $122,000, $361,000, and $1.8 million of capitalized interest for the years ended December 31, 2007, 2008, and 2009, respectively. |
Costs excluded from amortization are as follows at December 31:
| 2008 | 2009 | |||||
| (in thousands) | ||||||
| Unproved property acquisition |
$ | 21,660 | $ | 33,122 | ||
| Exploratory drilling |
14,374 | 6,667 | ||||
| $ | 36,034 | $ | 39,789 | |||
Unproved property acquisition costs include costs to acquire new leasehold, unevaluated leaseholds, and capitalized interest. Of the $33.1 million of unproved property costs at December 31, 2009 being excluded from the amortization base, $0.5 million, $21.0 million and $11.5 million were incurred in 2007, 2008, and 2009, respectively. Subject to industry conditions, evaluation of most of these properties and the inclusion of their costs in the amortized capital costs is expected to be completed within three years.
The average DD&A rate per equivalent unit of production was $1.88, $2.08 and $1.76 for the years ended December 31, 2007, 2008 and 2009, respectively.
NOTE N—SUPPLEMENTAL INFORMATION ON OIL AND NATURAL GAS OPERATIONS (UNAUDITED)
In December 2008, the SEC issued its final rule, Modernization of Oil and Gas Reporting, which is effective for reporting 2009 reserve information. In January 2010, the FASB issued its authoritative guidance on extractive activities for oil and gas to align its requirements with the SEC’s final rule. We adopted the guidance as of December 31, 2009 in conjunction with our year-end reserve report as a change in accounting principle that is
F-40
Table of Contents
Index to Financial Statements
GMX Resources Inc. and Subsidiaries
Notes to Consolidated Financial Statements—(Continued)
December 31, 2007, 2008 and 2009
inseparable from a change in accounting estimate. Under the SEC’s final rule, prior period reserves were not restated. The primary impacts of the SEC’s final rule include:
| • | the use of the twelve-month average of the first-day-of-the-month reference prices (prior to adjustment for location and quality differentials) of $61.18 per Bbl for oil and $3.87 per MMBtu for natural gas compared to the year-end reference prices (prior to adjustment for location and quality differentials) of $79.36 per Bbl for oil and $5.79 per MMBtu for natural gas resulted in negative revisions of 16 Bcfe. |
| • | certain of our undeveloped locations are not scheduled to be developed within five years had the impact of reducing our proved undeveloped reserves by 25 Bcfe. |
| • | applying the same pricing methodology that was in effect for 2008 in 2009 would have resulted in the recognition of an additional 99 Bcfe in reserves at December 31, 2009. |
All of our reserves were located in the United States. Our reserves were based upon reserve reports prepared by the independent petroleum engineers of MHA Petroleum Consultants, Inc. (“MHA”). Management believes the reserve estimates presented herein, in accordance with generally accepted engineering and evaluation principles consistently applied, are reasonable. However, there are numerous uncertainties inherent in estimating quantities and values of proved reserves and in projecting future rates of production and the amount and timing of development expenditures, including many factors beyond our control. Reserve engineering is a subjective process of estimating the recovery from underground accumulations of oil and gas that cannot be measured in an exact manner, and the accuracy of any reserve estimate is a function of the quality of available data and of engineering and geological interpretation and judgment. Because all reserve estimates are to some degree speculative, the quantities of oil and gas that are ultimately recovered, production and operating costs, the amount and timing of future development expenditures and future oil and gas sales prices may all differ from those assumed in these estimates. In addition, different reserve engineers may make different estimates of reserve quantities and cash flows based upon the same available data.
Therefore, the Standardized Measure shown below represents estimates only and should not be construed as the current market value of the estimated oil and gas reserves attributable to our properties. In this regard, the information set forth in the following tables includes revisions of reserve estimates attributable to proved properties included in the preceding year’s estimates. Such revisions reflect additional information from subsequent development activities, production history of the properties involved and any adjustments in the projected economic life of such properties resulting from changes in product prices. Decreases in the prices of oil and natural gas have had, and could have in the future, an adverse effect on the carrying value of our proved reserves, reserve volumes and our revenues, profitability and cash flow.
Our reserves shown are net wellhead volumes that have not been reduced for lease use volumes (volumes that are consumed or lost between the wellhead and the point of custody transfer). Lease use volumes were estimated to be 6%, 10% and 11% of ending proved reserves as of December 31, 2007, 2008 and 2009, respectively. Historically, the Company has reduced the natural gas price used in determining future cash inflows to compensate for lease use volumes and in determining net realized price.
F-41
Table of Contents
Index to Financial Statements
GMX Resources Inc. and Subsidiaries
Notes to Consolidated Financial Statements—(Continued)
December 31, 2007, 2008 and 2009
Estimated Quantities of Oil and Natural Gas
The following table sets forth certain data pertaining to our proved, proved developed and proved undeveloped reserves for the three years ended December 31, 2009.
| OIL (MBBLS) |
GAS (MMCF) |
|||||
| December 31, 2007 |
||||||
| Proved reserves, beginning of period |
2,693 | 236,850 | ||||
| Extensions, discoveries, and other additions |
2,019 | 185,730 | ||||
| Production |
(127 | ) | (7,974 | ) | ||
| Revisions of previous estimates |
108 | (8,264 | ) | |||
| Proved reserves, end of period |
4,693 | 406,342 | ||||
| December 31, 2008 |
||||||
| Proved reserves, beginning of period |
4,693 | 406,342 | ||||
| Extensions, discoveries, and other additions |
1,613 | 132,434 | ||||
| Production |
(190 | ) | (11,777 | ) | ||
| Revisions of previous estimates |
(1,112 | ) | (91,678 | ) | ||
| Proved reserves, end of period |
5,004 | 435,321 | ||||
| December 31, 2009 |
||||||
| Proved reserves, beginning of period |
5,004 | 435,321 | ||||
| Extensions, discoveries, and other additions |
38 | 25,672 | ||||
| Production |
(119 | ) | (12,908 | ) | ||
| Revisions of previous estimates |
(1,244 | ) | (114,873 | ) | ||
| Proved reserves, end of period |
3,679 | 333,212 | ||||
| Proved Developed Reserves |
||||||
| December 31, 2006 |
932 | 69,279 | ||||
| December 31, 2007 |
1,776 | 144,164 | ||||
| December 31, 2008 |
1,920 | 150,585 | ||||
| December 31, 2009 |
1,439 | 124,611 | ||||
| Proved Undeveloped Reserves |
||||||
| December 31, 2006 |
1,761 | 167,571 | ||||
| December 31, 2007 |
2,917 | 262,178 | ||||
| December 31, 2008 |
3,084 | 284,736 | ||||
| December 31, 2009 |
2,240 | 208,601 |
Revisions of Previous Estimates
In 2009, we had negative revisions of 122 Bcfe. Certain of our Cotton Valley Sands undeveloped locations are scheduled for development beyond five years and were excluded from our proved reserves, resulting in a negative revision of 53 Bcfe. The proved reserves for Cotton Valley Sands producers were reduced by 53 Bcfe based on individual well production history. Negative revisions of 16 Bcfe were related to lower natural gas prices as declines in prices result in certain reserves becoming uneconomic at earlier periods.
F-42
Table of Contents
Index to Financial Statements
GMX Resources Inc. and Subsidiaries
Notes to Consolidated Financial Statements—(Continued)
December 31, 2007, 2008 and 2009
In 2008, we had a total of 98 Bcfe of negative revisions primarily related to the significant decline in oil and natural gas prices at December 31, 2008 as declines in prices result in certain reserves becoming uneconomic at earlier periods.
In 2007, we revised the timing of drilling of undeveloped Cotton Valley Sands reserves presuming a 20-acre pattern of development from a 40-acre pattern resulting in the negative revision of previous estimates.
Extensions, Discoveries and Other Additions
In 2009, we had a total of 25 Bcfe of extensions and discoveries, including 22 Bcfe in the Haynesville Shale resulting from successful drilling during 2009 that extended and developed the proved acreage.
In 2008 and 2007, the increases in proved reserves from extensions and discoveries is the direct result of additional drilling on our acreage in the Cotton Valley Sands formation.
Standardized measure of discounted future net cash flows
The Standardized Measure of discounted future net cash flows (discounted at 10%) from production of proved reserves was developed as follows:
| • | An estimate was made of the quantity of proved reserves and the future periods in which they are expected to be produced based on year-end economic conditions. |
| • | In accordance with SEC guidelines, the engineers’ estimates of future net revenues from our proved properties and the present value thereof for 2009 are made using the twelve-month average of the first-day-of-the-month reference prices as adjusted for location and quality differentials. Prior year estimates were not required to be restated and reflect previously disclosed estimates using year-end prices. These prices are held constant throughout the life of the properties. Oil and natural gas prices are adjusted for each lease for quality, contractual agreements, lease use shrinkage and regional price variations. |
| • | The future gross revenue streams were reduced by estimated future operating costs (including production and ad valorem taxes) and future development and abandonment costs, all of which were based on current costs in effect at December 31 of the year presented and held constant throughout the life of the properties. |
| • | Future income taxes were calculated by applying the statutory federal and state income tax rate to pre-tax future net cash flows, net of the tax basis of the properties involved and utilization of available tax carryforwards related to oil and gas operations. |
F-43
Table of Contents
Index to Financial Statements
GMX Resources Inc. and Subsidiaries
Notes to Consolidated Financial Statements—(Continued)
December 31, 2007, 2008 and 2009
The following summary sets forth the Company’s future net cash flows relating to proved oil and natural gas reserves based on the standardized measure as of December 31:
| 2007 | 2008 | 2009 | ||||||||||
| (in thousands) | ||||||||||||
| Future cash inflows |
$ | 3,549,360 | $ | 2,586,574 | $ | 1,540,047 | ||||||
| Future production costs |
(1,097,465 | ) | (1,014,500 | ) | (591,102 | ) | ||||||
| Future development costs |
(555,623 | ) | (559,777 | ) | (323,246 | ) | ||||||
| Future income tax provisions |
(528,126 | ) | (187,084 | ) | — | |||||||
| Net future cash inflows |
1,368,146 | 825,213 | 625,699 | |||||||||
| Less effect of a 10% discount factor |
(940,416 | ) | (596,420 | ) | (437,121 | ) | ||||||
| Standardized measure of discounted future net cash flows |
$ | 427,730 | $ | 228,793 | $ | 188,578 | ||||||
Principal changes in the standardized measure of discounted future net cash flows attributable to the Company’s proved reserves are as follows at December 31:
| 2007 | 2008 | 2009 | ||||||||||
| (in thousands) | ||||||||||||
| Standardized measure, beginning of year |
$ | 134,434 | $ | 427,730 | $ | 228,793 | ||||||
| Sales of oil and natural gas, net of production costs |
(53,131 | ) | (110,375 | ) | (45,233 | ) | ||||||
| Net changes in prices and production costs |
182,156 | (255,999 | ) | (135,218 | ) | |||||||
| Change in estimated future development costs |
75,335 | 96,063 | 76,929 | |||||||||
| Extensions and discoveries, net of future development costs |
172,308 | 49,551 | 60,206 | |||||||||
| Previously estimated development cost incurred |
30,977 | 120,028 | 143,316 | |||||||||
| Revisions of quantity estimates |
(17,257 | ) | (106,288 | ) | (82,836 | ) | ||||||
| Accretion of discount |
54,192 | 164,367 | 83,475 | |||||||||
| Changes in timing of production and other |
(25,081 | ) | (269,525 | ) | (192,723 | ) | ||||||
| Net changes in income taxes |
(126,203 | ) | 113,241 | 51,869 | ||||||||
| Standardized measure, end of year |
$ | 427,730 | $ | 228,793 | $ | 188,578 | ||||||
F-44
Table of Contents
Index to Financial Statements
GMX Resources Inc. and Subsidiaries
Notes to Consolidated Financial Statements—(Continued)
December 31, 2007, 2008 and 2009
NOTE O—QUARTERLY FINANCIAL DATA (UNAUDITED)
Summarized unaudited quarterly financial data for 2008 and 2009 are as follows:
| First Quarter(3) |
Second Quarter(3) |
Third Quarter(3) |
Fourth Quarter |
|||||||||||||
| (in thousands, except per share data) | ||||||||||||||||
| 2009 |
||||||||||||||||
| Oil and gas sales |
$ | 22,826 | $ | 22,837 | $ | 23,075 | $ | 25,556 | ||||||||
| Income (loss) before income taxes(1) |
(134,282 | ) | 2,890 | 1,846 | (50,953 | ) | ||||||||||
| Net income (loss)(1) |
(131,854 | ) | (63 | ) | (1,222 | ) | (47,327 | ) | ||||||||
| Net income applicable (loss) to GMX Resources Common Shareholders(1) |
(133,010 | ) | (1,220 | ) | (2,378 | ) | (49,656 | ) | ||||||||
| Basic earnings (loss) per share(2) |
(8.66 | ) | (0.07 | ) | (0.11 | ) | (1.87 | ) | ||||||||
| Diluted earnings (loss) per share(2) |
(8.66 | ) | (0.07 | ) | (0.11 | ) | (1.87 | ) | ||||||||
| First Quarter |
Second Quarter |
Third Quarter |
Fourth Quarter(3) |
|||||||||||||
| (in thousands, except per share data) | ||||||||||||||||
| 2008 |
||||||||||||||||
| Oil and gas sales |
$ | 27,199 | $ | 38,040 | $ | 36,408 | $ | 24,089 | ||||||||
| Income (loss) before income taxes(1) |
9,498 | 17,612 | 14,284 | (191,045 | ) | |||||||||||
| Net income (loss)(1) |
6,247 | 12,306 | 9,631 | (152,821 | ) | |||||||||||
| Net income (loss) applicable to GMX Resources Common Shareholders(1) |
5,091 | 11,149 | 8,475 | (153,977 | ) | |||||||||||
| Basic earnings (loss) per share(2) |
0.38 | 0.84 | 0.57 | (10.04 | ) | |||||||||||
| Diluted earnings (loss) per share(2) |
0.38 | 0.76 | 0.50 | (10.04 | ) | |||||||||||
| (1) | Includes impairment charges on our oil and natural gas properties due to a ceiling test write-down of $192.7 million, $138.1 million and $50.1 million for the fourth quarter 2008, first quarter 2009 and fourth quarter 2009, respectively |
| (2) | The sum of the per share amounts per quarter does not equal the per share amount for the year due to the changes in the average number of common shares outstanding. |
| (3) | Amounts adjusted for correction of accounting errors and the adoption of new issued accounting standards related to convertible debt. See “Note B—Correction of Errors” and “Note C—Adoption of Accounting Principles” and the following information. |
F-45
Table of Contents
Index to Financial Statements
GMX Resources Inc. and Subsidiaries
Notes to Consolidated Financial Statements—(Continued)
December 31, 2007, 2008 and 2009
The effects of the restatement on the 2008 and 2009 unaudited quarterly financial data are as follows:
| For the Three Months Ended December 31, 2008(1) | ||||||||||||||||
| As Previously Reported |
Corrections | Adjustments(1) | As Adjusted and Restated |
|||||||||||||
| Income Statement |
||||||||||||||||
| Impairment of oil and natural gas properties |
$ | 151,629 | $ | 41,021 | $ | — | $ | 192,650 | ||||||||
| Interest expense |
3,086 | — | 194 | 3,280 | ||||||||||||
| Income (loss) before income taxes |
(149,830 | ) | (41,021 | ) | (194 | ) | (191,045 | ) | ||||||||
| (Provision) benefit for income taxes |
38,784 | (560 | ) | — | 38,224 | |||||||||||
| Net income (loss) |
(111,046 | ) | (41,581 | ) | (194 | ) | (152,821 | ) | ||||||||
| Net income (loss) applicable to common shareholders |
(112,202 | ) | (41,581 | ) | (194 | ) | (153,977 | ) | ||||||||
| Earnings (loss) per share—basic |
(7.31 | ) | — | — | (10.04 | ) | ||||||||||
| Earnings (loss) per share—diluted |
(7.27 | ) | — | — | (10.04 | ) | ||||||||||
| Weighted average common shares—diluted |
15,425,855 | — | — | 15,341,546 | ||||||||||||
| (1) | Amounts have been adjusted for the adoption of ASC 470-20 in 2009 which retrospectively changes the accounting treatment of the Company’s 5.00% Convertible Notes. |
| March 31, 2009 | ||||||||||||
| As Reported |
Corrections | As Restated | ||||||||||
| (Amounts in thousands, except share and per share data) |
||||||||||||
| Balance Sheet |
||||||||||||
| Oil and natural gas properties based on the full cost method, net of accumulated depreciation, depletion and impairment |
$ | 307,365 | $ | (5,662 | ) | $ | 301,703 | |||||
| Property and equipment, at cost, net |
88,492 | 11,147 | 99,639 | |||||||||
| Deferred income tax assets |
62,651 | (62,651 | ) | — | ||||||||
| Total assets |
513,729 | (57,166 | ) | 456,563 | ||||||||
| Deferred income tax liabilities |
8,725 | (8,725 | ) | — | ||||||||
| Accumulated deficit |
(183,492 | ) | (48,441 | ) | (231,933 | ) | ||||||
| Total liabilities and equity |
513,729 | (57,166 | ) | 456,563 | ||||||||
F-46
Table of Contents
Index to Financial Statements
GMX Resources Inc. and Subsidiaries
Notes to Consolidated Financial Statements—(Continued)
December 31, 2007, 2008 and 2009
| For the Three Months Ended March 31, 2009 | ||||||||||||
| Income Statement |
||||||||||||
| Impairment of oil and natural gas properties |
$ | 183,728 | $ | (45,650 | ) | $ | 138,078 | |||||
| Depreciation, depletion, and amortization |
9,716 | (856 | ) | 8,860 | ||||||||
| Income (loss) before taxes |
(180,788 | ) | 46,506 | (134,282 | ) | |||||||
| (Provision) benefit for income taxes |
56,354 | (53,926 | ) | 2,428 | ||||||||
| Net income (loss) |
(124,434 | ) | (7,420 | ) | (131,854 | ) | ||||||
| Net income (loss) applicable to common shareholders |
(125,590 | ) | (7,420 | ) | (133,010 | ) | ||||||
| Earnings (loss) per share—basic |
(8.18 | ) | — | (8.66 | ) | |||||||
| Earnings (loss) per share—diluted |
(8.15 | ) | — | (8.66 | ) | |||||||
| Weighted average common shares—diluted |
15,403,517 | — | 15,354,680 | |||||||||
| June 30, 2009 | ||||||||||||
| As Reported | Corrections | As Restated | ||||||||||
| (Amounts in thousands, except share and per share data) |
||||||||||||
| Balance Sheet |
||||||||||||
| Oil and gas properties based on the full cost method, net of accumulated depreciation, depletion and impairment |
$ | 334,432 | $ | 2,241 | $ | 336,673 | ||||||
| Property and equipment, at cost, net |
94,155 | 6,229 | 100,384 | |||||||||
| Deferred income tax assets |
56,928 | (56,928 | ) | — | ||||||||
| Total assets |
529,963 | (48,458 | ) | 481,505 | ||||||||
| Deferred income tax liabilities |
8,118 | (8,118 | ) | — | ||||||||
| Accumulated deficit |
(192,814 | ) | (40,340 | ) | (233,154 | ) | ||||||
| Total liabilities and equity |
529,963 | (48,458 | ) | 481,505 | ||||||||
| For the Three Months Ended June 30, 2009 | ||||||||||||
| Income Statement |
||||||||||||
| Impairment of oil and natural gas properties |
$ | 2,789 | $ | (2,789 | ) | $ | — | |||||
| Depreciation, depletion, and amortization |
6,837 | (196 | ) | 6,641 | ||||||||
| Income (loss) before taxes |
(95 | ) | 2,985 | 2,890 | ||||||||
| (Provision) benefit for income taxes |
(8,069 | ) | 5,116 | (2,953 | ) | |||||||
| Net income (loss) |
(8,164 | ) | 8,101 | (63 | ) | |||||||
| Net income (loss) applicable to common shareholders |
(9,321 | ) | 8,101 | (1,220 | ) | |||||||
| Earnings (loss) per share—basic |
(0.52 | ) | — | (0.07 | ) | |||||||
| Earnings (loss) per share—diluted |
(0.51 | ) | — | (0.07 | ) | |||||||
| Weighted average common shares—diluted |
18,132,849 | — | 18,093,208 | |||||||||
| For the Six Months Ended June 30, 2009 | ||||||||||||
| Income Statement |
||||||||||||
| Impairment of oil and natural gas properties |
$ | 186,517 | $ | (48,439 | ) | $ | 138,078 | |||||
| Depreciation, depletion, and amortization |
16,553 | (1,052 | ) | 15,501 | ||||||||
| Income (loss) before taxes |
(180,883 | ) | 49,491 | (131,392 | ) | |||||||
| (Provision) benefit for income taxes |
48,285 | (48,810 | ) | (525 | ) | |||||||
| Net income (loss) |
(132,598 | ) | 681 | (131,917 | ) | |||||||
| Net income (loss) applicable to common shareholders |
(134,911 | ) | 681 | (134,230 | ) | |||||||
| Earnings (loss) per share—basic |
(8.06 | ) | — | (8.02 | ) | |||||||
| Earnings (loss) per share—diluted |
(8.03 | ) | — | (8.02 | ) | |||||||
| Weighted average common shares—diluted |
16,791,133 | — | 16,746,112 | |||||||||
F-47
Table of Contents
Index to Financial Statements
GMX Resources Inc. and Subsidiaries
Notes to Consolidated Financial Statements—(Continued)
December 31, 2007, 2008 and 2009
| September 30, 2009 | ||||||||||||
| As Reported | Corrections | As Restated | ||||||||||
| (Amounts in thousands, except share and per share data) |
||||||||||||
| Balance Sheet |
||||||||||||
| Oil and gas properties based on the full cost method, net of accumulated depreciation, depletion, and impairment |
$ | 352,386 | $ | 2,323 | $ | 354,709 | ||||||
| Property and equipment, at cost, net |
94,682 | 6,229 | 100,911 | |||||||||
| Deferred income tax asset |
53,047 | (53,047 | ) | — | ||||||||
| Total assets |
535,843 | (44,495 | ) | 491,348 | ||||||||
| Deferred income tax liabilities |
5,715 | (5,715 | ) | — | ||||||||
| Accumulated deficit |
(195,597 | ) | (38,780 | ) | (234,377 | ) | ||||||
| Total liabilities and equity |
535,843 | (44,495 | ) | 491,348 | ||||||||
| For the Three Months Ended September 30, 2009 | ||||||||||||
| Income Statement |
||||||||||||
| Depreciation, depletion, and amortization |
$ | 7,834 | $ | (82 | ) | $ | 7,752 | |||||
| Income (loss) before taxes |
1,764 | 82 | 1,846 | |||||||||
| (Provision) benefit for income taxes |
(4,546 | ) | 1,478 | (3,068 | ) | |||||||
| Net income (loss) |
(2,782 | ) | 1,560 | (1,222 | ) | |||||||
| Net income (loss) applicable to common shareholders |
(3,938 | ) | 1,560 | (2,378 | ) | |||||||
| Earnings (loss) per share—basic |
(0.19 | ) | — | (0.11 | ) | |||||||
| Earnings (loss) per share—diluted |
(0.19 | ) | — | (0.11 | ) | |||||||
| Weighted average common shares—diluted |
21,160,616 | — | 21,122,331 | |||||||||
| For the Nine Months Ended September 30, 2009 | ||||||||||||
| Income Statement |
||||||||||||
| Impairment of oil and natural gas properties |
$ | 186,517 | $ | (48,439 | ) | $ | 138,078 | |||||
| Depreciation, depletion, and amortization |
24,386 | (1,134 | ) | 23,252 | ||||||||
| Income (loss) before taxes |
(179,120 | ) | 49,573 | (129,547 | ) | |||||||
| (Provision) benefit for income taxes |
43,738 | (47,332 | ) | (3,594 | ) | |||||||
| Net income (loss) |
(135,382 | ) | 2,241 | (133,141 | ) | |||||||
| Net income (loss) applicable to shareholders |
(138,851 | ) | 2,241 | (136,610 | ) | |||||||
| Earnings (loss) per share—basic |
(7.61 | ) | — | (7.49 | ) | |||||||
| Earnings (loss) per share—diluted |
(7.60 | ) | — | (7.49 | ) | |||||||
| Weighted average common shares—diluted |
18,278,639 | — | 18,235,889 | |||||||||
F-48
Table of Contents
Index to Financial Statements
EXHIBIT INDEX
| Incorporated by Reference | ||||||||||||
| Exhibit |
Exhibit Description |
Form | SEC File No. |
Exhibit | Filing Date | Filed Herewith | ||||||
| 3.1 |
Amended and Restated Certificate of Incorporation of GMX Resources Inc. | SB-2 | 353-49328 | 3.1 | 11/06/2000 | |||||||
| 3.2 |
Amended and Restated Bylaws of GMX Resources Inc | 8-K | 001-32977 | 3.2 | 11/04/2008 | |||||||
| 3.3 |
Certificate of Designation of Series A Junior Participating Preferred Stock of GMX Resources Inc. | 8-K | 000-32325 | 3.1 | 05/18/2005 | |||||||
| 3.4 |
Certificate of Designation of 9.25% Series B Cumulative Preferred Stock | 8-A12B | 001-32977 | 4.1 | 08/08/2006 | |||||||
| 4.1(a) |
Rights Agreement dated May 17, 2005 by and between GMX Resources Inc. and UMB Bank, N.A., as Rights Agent | 8-K | 000-32325 | 4.1 | 05/18/2005 | |||||||
| 4.1(b) |
Amendment No. 1 to Rights Agreement dated February 1, 2008 | 8-A/A | 001-32977 | 2.1 | 02/21/2008 | |||||||
| 4.1(c) |
Amendment No. 2 to Rights Agreement dated October 30, 2008 | 8-A/A | 001-32977 | 1 | 11/17/2008 | |||||||
| 4.2 |
Indenture dated February 15, 2008, between GMX Resources Inc. and The Bank of New York Trust Company, N.A., as trustee | 8-K | 001-32977 | 4.1 | 02/15/2008 | |||||||
| 4.3 |
Indenture dated October 28, 2009, between GMX Resources Inc. and The Bank of New York Mellon Trust Company, N.A., as trustee | 8-K | 001-32977 | 4.1 | 10/28/2009 | |||||||
| 4.4 |
Supplemental Indenture dated October 28, 2009, between GMX Resources Inc. and The Bank of New York Mellon Trust Company, N.A., as trustee | 8-K | 001-32977 | 4.1 | 10/28/2009 | |||||||
| 10.1 |
Amended and Restated Stock Option Plan | 10-Q | 001-32977 | 10.1 | 11/09/2007 | |||||||
| 10.2 |
Form of Director Indemnification Agreement | SB-2 | 333-49328 | 10.5 | 11/06/2000 | |||||||
| 10.3(a) |
Participation Agreement dated December 29, 2003 by and among Penn Virginia Oil & Gas Company, the Company and its wholly owned subsidiaries | 8-K | 000-32325 | 10.1 | 12/31/2003 | |||||||
| 10.3(b) |
First Amendment dated February 27, 2004 to Participation Agreement between GMX Resources Inc. and Penn Virginia Oil & Gas Corporation | 8-K | 000-32325 | 10.1 | 09/14/2004 | |||||||
| 10.3(c) |
Second Amendment dated May 9, 2004 to Participation Agreement between GMX Resources Inc. and Penn Virginia Oil & Gas Corporation | 8-K | 000-32325 | 10.2 | 09/14/2004 | |||||||
E-1
Table of Contents
Index to Financial Statements
| Incorporated by Reference | ||||||||||||
| Exhibit |
Exhibit Description |
Form | SEC File No. |
Exhibit | Filing Date | Filed Herewith | ||||||
| 10.3(d) |
Third Amendment dated April 6, 2004 to Participation Agreement between GMX Resources Inc. and Penn Virginia Oil & Gas Corporation | 8-K | 000-32325 | 10.3 | 09/14/2004 | |||||||
| 10.3(e) |
Fourth Amendment dated August 11, 2004 to Participation Agreement between GMX Resources Inc. and Penn Virginia Oil & Gas Corporation | 8-K | 000-32325 | 10.4 | 09/14/2004 | |||||||
| 10.3(f) |
Fifth Amendment dated effective January 1, 2005 to Participation Agreement between GMX Resources Inc. and Penn Virginia Oil & Gas L.P., successor to Penn Virginia Oil & Gas Corporation | 10-QSB | 000-32325 | 10.6(e) | 05/12/2005 | |||||||
| 10.3(g) |
Sixth Amendment dated effective January 1, 2006, to Participation Agreement between GMX Resources Inc. and Penn Virginia Oil & Gas L.P., successor to Penn Virginia Oil & Gas Corporation | 8-K | 000-32325 | 10.1 | 01/20/2006 | |||||||
| 10.4(a) |
Third Amended and Restated Loan Agreement dated June 12, 2008 among Capital One, National Association and Union Bank of California N.A. | 8-K | 001-32977 | 10.1 | 06/18/2008 | |||||||
| 10.4(b) |
First Amendment to Restated Loan Agreement dated October 29, 2008, between GMX Resources Inc., Capital One, National Association and Union Bank of California, N.A. | 10-Q | 001-32977 | 10.4(b) | 11/10/2008 | |||||||
| 10.4(c) |
Second Amendment to Restated Loan Agreement dated November 12, 2008, between GMX Resources Inc., Capital One, National Association, and Union Bank of California, N.A. | 8-K | 001-32977 | 10.1 | 03/02/2009 | |||||||
| 10.4(d) |
Third Amendment to Restated Loan Agreement dated February 27, 2009 between GMX Resources Inc., Capital One, National Association, and Union Bank of California, N.A. | 8-K | 001-32977 | 10.2 | 03/02/2009 | |||||||
| 10.4(e) |
Fourth Amendment to Restated Loan Agreement dated June 3, 2009 among GMX Resources Inc., Capital One, National Association, Union Bank, N.A., BNP Paribas and Compass Bank | 8-K | 001-32977 | 10.1 | 06/08/2009 | |||||||
E-2
Table of Contents
Index to Financial Statements
| Incorporated by Reference | ||||||||||||
| Exhibit |
Exhibit Description |
Form | SEC File No. |
Exhibit | Filing Date | Filed Herewith | ||||||
| 10.4(f) |
Fifth Amendment to Restated Loan Agreement and Waiver dated as of October 17, 2009, among GMX Resources Inc., Capital One, National Association, as Administrative Agent, and the banks named therein | 8-K | 001-32977 | 10.1 | 10/20/2009 | |||||||
| 10.5 |
Gas Gathering and Processing Agreement effective January 31, 2008 between PVR East Texas Gas Processing LLC and GMX Resources Inc. | 8-K | 001-32977 | 10.1 | 02/01/2008 | |||||||
| 10.6 |
Purchase Agreement dated February 11, 2008, between GMX Resources Inc. and Jefferies & Company, Inc., as representative of the Initial Purchasers named therein | 8-K | 001-32977 | 10.1 | 02/15/2008 | |||||||
| 10.7 |
Share Lending Agreement dated February 11, 2008, between GMX Resources Inc., Jefferies Funding LLC and Jefferies & Company, Inc., as collateral agent | 8-K | 001-32977 | 10.3 | 02/15/2008 | |||||||
| 10.8 |
Registration Rights Agreement dated February 11, 2008, between GMX Resources Inc. and Jefferies Funding LLC | 8-K | 001-32977 | 10.4 | 02/15/2008 | |||||||
| 10.9 |
2008 Long-Term Incentive Plan (Effective as of May 28, 2008) | 8-K | 001-32977 | 10.1 | 06/16/2008 | |||||||
| 10.10 |
Underwriting Agreement dated July 17, 2008, between GMX Resources Inc. and Jefferies & Company, Inc., as Representative | 8-K | 001-32977 | 1.1 | 07/21/2008 | |||||||
| 10.11 |
Purchase Agreement dated May 13, 2009, between GMX Resources Inc. and Merrill Lynch & Co., as Representative | 8-K | 001-32977 | 1.1 | 05/18/2009 | |||||||
| 10.12 |
Underwriting Agreement dated October 22, 2009, between GMX Resources Inc. and Credit Suisse Securities (USA) LLC, as representative of the several underwriters named therein | 8-K | 001-32977 | 1.1 | 10/28/2009 | |||||||
| 10.13 |
Underwriting Agreement dated October 22, 2009, between GMX Resources Inc. and Credit Suisse Securities (USA) LLC, as representative of the several underwriters named therein | 8-K | 001-32977 | 1.2 | 10/28/2009 | |||||||
| 10.14 |
Purchase Agreement dated October 16, 2009, between GMX Resources Inc. and Kinder Morgan Endeavor LLC | 8-K | 001-32977 | 10.1 | 10/19/2009 | |||||||
| 10.15 |
Amended and Restated Limited Liability Company Agreement of Endeavor Gathering LLC dated effective November 1, 2009, between GMX Resources Inc. and Kinder Morgan Endeavor LLC | 8-K | 001-32977 | 10.1 | 11/5/2009 | |||||||
E-3
Table of Contents
Index to Financial Statements
| Incorporated by Reference | ||||||||||||
| Exhibit |
Exhibit Description |
Form | SEC File No. |
Exhibit | Filing Date | Filed Herewith | ||||||
| 10.16 |
Pipeline Operating Agreement dated effective November 1, 2009, between Endeavor Gathering LLC and Endeavor Pipeline Inc. | 8-K | 001-32977 | 10.2 | 11/5/2009 | |||||||
| 10.17 |
Gas Gathering Agreement dated effective November 1, 2009, among GMX Resources Inc., Endeavor Pipeline Inc. and Endeavor Gathering LLC | 8-K | 001-32977 | 10.3 | 11/5/2009 | |||||||
| 14 |
Code of Business Conduct and Ethics | 001-32977 | * | |||||||||
| 21 |
List of Subsidiaries | 001-32977 | * | |||||||||
| 23.1 |
Consent of Independent Accountants | 001-32977 | * | |||||||||
| 23.2 |
Consent of MHA Petroleum Consultants | 001-32977 | * | |||||||||
| 23.3 |
Consent of Independent Accountants | 001-32977 | * | |||||||||
| 31.1 |
Rule 13a-14(a) Certification of Chief Executive Officer | 001-32977 | * | |||||||||
| 31.2 |
Rule 13a-14(a) Certification of Chief Financial Officer | 001-32977 | * | |||||||||
| 32.1 |
Certification of Chief Executive Officer pursuant to 18 U.S.C. § 1350 | 001-32977 | * | |||||||||
| 32.2 |
Certification of Chief Financial Officer pursuant to 18 U.S.C. § 1350 | 001-32977 | * | |||||||||
| 99.1 |
Report of MHA Petroleum Consultants, Inc. | 001-32977 | * | |||||||||
E-4