Attached files
Table of Contents
SECURITIES AND EXCHANGE COMMISSION
Washington, D.C. 20549
FORM 10-K
ANNUAL REPORT PURSUANT TO SECTION 13 OR 15(d)
OF THE SECURITIES EXCHANGE ACT OF 1934
For the Fiscal Year Ended December 31, 2009
Commission File Number 0-23006
DSP GROUP, INC.
(Exact name of registrant as specified in its charter)
| Delaware | 94-2683643 | |
| (State or other jurisdiction of incorporation and organization) |
(I.R.S. Employer Identification No.) |
2580 North First Street, Suite 460, San Jose, CA 95131
(Address of principal executive offices, including zip code)
(408) 986-4300
(Registrant’s telephone number)
Securities registered pursuant to Section 12(b) of the Act:
None
Securities registered pursuant to Section 12(g) of the Act:
Common Stock, $.001 per share
(Title of class)
Indicate by check mark if the registrant is a well-known seasoned issuer, as defined in Rule 405 of the Securities Act. Yes ¨ No x
Indicate by check mark if the registrant is not required to file reports pursuant to Section 13 or Section 15(d) of the Exchange Act. Yes ¨ No x
Indicate by check mark whether the Registrant (1) has filed all reports required to be filed by Section 13 or 15(d) of the Securities Exchange Act of 1934 during the preceding 12 months (or for such shorter period that the Registrant was required to file such reports), and (2) has been subject to such filing requirements for the past 90 days. Yes x No ¨
Indicate by check mark whether the registrant has submitted electronically and posted on its corporate Web site, if any, every Interactive Data File required to be submitted and posted pursuant to Rule 405 of Regulation S-T (§232.405 of this chapter) during the preceding 12 months (or for such shorter period that the registrant was required to submit and post such files). Yes ¨ No ¨
Indicate by check mark if disclosure of delinquent filers pursuant to Item 405 of Regulation S-K is not contained herein, and will not be contained, to the best of Registrant’s knowledge, in definitive proxy or information statements incorporated by reference in Part III of this Form 10-K or any amendment to this Form 10-K. ¨
Indicate by check mark whether the registrant is a large accelerated filer, an accelerated filer, a non-accelerated filer, or a smaller reporting company. See definitions of “large accelerated filer,” “accelerated filer,” and “smaller reporting company” in Rule 12b-2 of the Exchange Act.
Large accelerated filer ¨ Accelerated filer x Non-accelerated filer ¨ Smaller reporting company ¨
Indicate by check mark whether the registrant is a shell company (as defined in Rule 12b-2 of the Exchange Act). Yes ¨ No x
As of June 30, 2009, the aggregate market value of voting stock held by non-affiliates of the Registrant, based on the closing price of the Common Stock on June 30, 2009 as reported on the NASDAQ Global Select Market, was approximately $86,969,157. Shares of Common Stock held by each officer and director and by each person who owns 5% or more of the outstanding Common Stock have been excluded from this computation in that such persons may be deemed to be affiliates. This determination of affiliate status is not necessarily a conclusive determination for other purposes.
As of March 10, 2010, the Registrant had outstanding 23,125,431 shares of Common Stock.
Documents incorporated by reference: Portions of the Registrant’s proxy statement to be filed pursuant to Regulation 14A within 120 days after Registrant’s fiscal year end of December 31, 2009 are incorporated herein by reference into Item 5 of Part II and Items 10, 11, 12, 13 and 14 of Part III of this annual report.
Table of Contents
DSP GROUP, INC.
| Page No. | ||||
| PART I |
||||
| Item 1. |
2 | |||
| Item 1A. |
12 | |||
| Item 1B. |
27 | |||
| Item 2. |
27 | |||
| Item 3. |
27 | |||
| Item 4. |
28 | |||
| PART II |
||||
| Item 5. |
MARKET FOR REGISTRANT’S COMMON EQUITY, RELATED STOCKHOLDER MATTERS AND ISSUER PURCHASES OF EQUITY SECURITIES. | 29 | ||
| Item 6. |
31 | |||
| Item 7. |
MANAGEMENT’S DISCUSSION AND ANALYSIS OF FINANCIAL CONDITION AND RESULTS OF OPERATIONS. | 33 | ||
| Item 7A. |
46 | |||
| Item 8. |
47 | |||
| Item 9. |
CHANGES IN AND DISAGREEMENTS WITH ACCOUNTANTS ON ACCOUNTING AND FINANCIAL DISCLOSURE. | 95 | ||
| Item 9A. |
95 | |||
| Item 9B. |
95 | |||
| PART III |
||||
| Item 10. |
96 | |||
| Item 11. |
96 | |||
| Item 12. |
SECURITY OWNERSHIP OF CERTAIN BENEFICIAL OWNERS AND MANAGEMENT AND RELATED STOCKHOLDER MATTERS. | 96 | ||
| Item 13. |
CERTAIN RELATIONSHIPS AND RELATED TRANSACTIONS, AND DIRECTOR INDEPENDENCE. | 96 | ||
| Item 14. |
96 | |||
| PART IV |
||||
| Item 15. |
97 | |||
| 101 | ||||
i
Table of Contents
This report and certain information incorporated herein by reference contain forward-looking statements, which are provided under the “safe harbor” protection of the Private Securities Litigation Reform Act of 1995. All statements included or incorporated by reference in this report, other than statements that are purely historical in nature, are forward-looking statements. Forward-looking statements are generally written in the future tense and/or are preceded by words such as “will,” “may,” “should,” “could,” “expect,” “suggest,” “believe,” “anticipate,” “intend,” “plan,” or other similar words. Forward-looking statements include statements regarding:
| • | Our belief that new products and categories of products for home communication, including Wi-Fi application products, will start to contribute to our revenues in 2010 and beyond; |
| • | Our belief that we are prepared to meet the exciting challenges of the dynamic and evolving market for short-range multimedia communication and home wireless networking by our ability to integrate voice, data and video technologies; |
| • | Our belief that CAT-iq, which has been widely embraced by all leading European operators, will also proliferate into other regions that have adopted DECT telephony, such as the U.S., and that this new standard will enable the introduction of new cordless products into the market; |
| • | Our belief that the XpandR™ product family will present unique opportunities for us to expand the domain of applications and add new customers served by our products; |
| • | Our belief that international sales will continue to account for a significant portion of our net product sales for the foreseeable future; |
| • | Our optimism about an economic recovery in 2010, and our belief that our revenues and gross profit will increase in 2010 as compared to 2009 mainly due to the launching of new products and operational efficiencies; |
| • | Our belief that U.S. sales of our 2.4GHz and 5.8GHz products will continue to decrease during 2010; |
| • | Our belief that sales of our DECT 6.0 products in the U.S. market will continue to increase; |
| • | Our belief that sales of our DECT and 2.4GHz products will continue to represent a substantial percentage of our revenues for 2010; |
| • | Our belief that the rapid deployment of new communication access methods, as well as the projected lack of growth in fixed-line telephony, will reduce our total revenues derived from, and unit sales of, cordless telephony products, including our DECT, 2.4GHz and 5.8GHz product, for the long term; |
| • | Our belief that the market will remain price sensitive in 2010 and that price erosion will continue; |
| • | Our belief that we compete favorably in our industry with respect to price, system integration level, range, voice quality, customer support and the timing of product introductions; |
| • | Our belief that relations with our employees are good; and |
| • | Our belief that our available cash and cash equivalents at December 31, 2009 should be sufficient to finance our operations for both the short and long term. |
This Annual Report on Form 10-K includes trademarks and registered trademarks of DSP Group. Products or service names of other companies mentioned in this Annual Report on Form 10-K may be trademarks or registered trademarks of their respective owners.
1
Table of Contents
PART I
| Item 1. | BUSINESS. |
Introduction
DSP Group, Inc. (NASDAQ: DSPG) is a leading global provider of wireless chipset solutions for converged communications at home. Delivering system solutions that combine semiconductors and software with reference designs, DSP Group enables consumer electronics (CE) manufacturers to cost-effectively develop new revenue-generating applications with fast time to market.
At the forefront of semiconductor innovation and operational excellence for over two decades, and with a leading position in wireless home telephony market, DSP Group provides a broad portfolio of wireless chipsets integrating Digital Enhanced Cordless Telecommunications (DECT), Wi-Fi, Public Switched Telephone Network (PSTN) and Voice over Internet Protocol (VoIP)/Communications over Internet Protocol (CoIP) technologies with state-of-the-art application processors. Enabling converged voice, audio, video and data connectivity across diverse consumer products—from cordless and VoIP phones to home gateways and connected multimedia screens—DSP Group proactively partners with CE manufacturers to shape the future of converged communications at home.
We were incorporated in California in 1987 and reincorporated in Delaware in 1994. We completed our initial public offering in February 1994. In November 2002, we transferred the assets and liabilities of our DSP cores licensing business to one of our then wholly-owned subsidiaries and immediately after the separation, the subsidiary affected a combination with Parthus Technologies plc to form CEVA, Inc. (NASDAQ: CEVA).
In September 2007, we acquired the cordless and VoIP terminals business (the “CIPT Business”) of NXP B.V. (“NXP”), then a part of NXP’s Mobile and Personal Business Unit. The CIPT Business targets applications for the cordless and VoIP residential telephony market, mainly European DECT.
Industry Environment and Our Business
Over the past two decades, communications technology has evolved from simple analog voice signals transmitted over networks of copper telephone lines to complex analog and digital voice and data signals transmitted over hybrid networks, such as copper, wireless transmission over radio frequencies (RF), DSL cable and fiber optic lines. In addition, information is increasingly available via wired and wireless networks through a variety of access devices, including cordless phones, cellular phones, personal computers, tablets, personal digital assistants (PDAs), and portable media players (PMPs) and digital cable, satellite and IP set-top boxes. Moreover, the desire to leverage existing telecommunications infrastructure, compounded by the increased use of new data-intensive computing, communication and video applications, are driving the convergence of voice, audio, data and video.
Our focus on the design of highly-integrated, mixed-signal devices that combine complex RF, analog and digital functions enables us to address the complex challenges of integrating various technologies, platforms and processes posed by these emerging trends in the communications industry. Our integrated circuit (IC) products are customizable, achieve high functionality and performance at reduced power consumption, especially for cordless applications, IP telephony and multi-media products, and can be manufactured in high volumes using cost-effective process technologies. Our systems architecture provides an open design environment for original design manufacturers (ODMs) to design and market their own end products with maximum differentiation.
In response to the growing trend towards wireless residential connectivity in the past few years, we developed and are offering leading wireless voice and data transmission solutions for various applications. Since 1999, we have developed various technologies, including Direct Sequence Spread Spectrum (DSSS), Frequency Hopping Spread Spectrum (FHSS), Orthogonal Frequency Digital Modulation (OFDM), Digital Narrow Band, Complementary Metal Oxide Semiconductor (CMOS), Gallium Arsenide (GaAs) technology, and Silicon
2
Table of Contents
Germanium (SiGe) Radio Frequency (RF) chips for 900MHz, 2.4GHz and 5.8GHz Industry Scientific and Medical (ISM) bands, European DECT (1.9GHz), DECT 6.0, (1.8GHz), Korean DECT (1.7GHz), Bluetooth (2.4GHz) and Wi-Fi (802.11, 2.4GHz/5GHz). With the acquisition of the CIPT Business in 2007, we added both BiCMOS and deep sub-micron CMOS technologies to our portfolio of technologies.
We also are an active member in all relevant cordless industry standardization bodies such as the DECT Forum and the European Telecommunications Standards Institute. Such involvement enables us to define standards and keep abreast of the latest innovations and requirements. We also maintain close relationships with many world-leading telecom service providers, thereby providing us with insight into future plans across the industry.
Product Development
Since 1989, when we introduced the first Integrated Digital Telephony (IDT) speech processor, DSP Group has continued to bring innovative products to the market. In 2001, we introduced the 900MHz narrow-band cordless chipset into mass market. During the same year, we also developed an integrated CMOS RF device which combines a communications modem and RF device into an integrated phone-on-a-chip solution. This device was an important step in our development efforts to integrate telephony features.
In 2002, we introduced a complete chipset for a 2.4GHz single handset solution and an advanced Enhanced Digital Cordless Telephone (EDCT) 2.4GHz multi-handset solution with walkie-talkie and in-room baby monitor capabilities, thereby supporting the transition of the U.S. market from 900MHz to 2.4GHz technology. For the 5.8GHz market, we also developed the first generation up-converter solution and are in the process of developing a complete IC device solution to replace the discrete 5.8GHz converter currently used in the market. During 2006, we introduced to the market our RF technology in the 5.8GHz radio chip, which enabled improved sensitivity.
In 2003, we moved into the multimedia communications market by acquiring the assets of Teleman Multimedia Inc., a U.S. corporation. Teleman developed an advanced silicon platform for video compression and decompression designed to interface with image sensors and panel displays. During October 2004, we acquired substantially all of the assets of Bermai Inc., a U.S. corporation. Bermai developed an advanced Wi-Fi technology which is optimized for quality of service (QoS) for video streaming applications. The incorporation of this acquired Wi-Fi technology into our existing technology enabled us to develop low power, cost optimized solutions for residential voice, video and data communication over broadband.
In 2004, we completed the development of our chipset for the DECT market. This product line included the DE56000 baseband processor family, CMOS RF transceiver and SiGe power amplifier. The DE56000 chipset family also entered into mass production during the fourth quarter of 2004 for incorporation into products developed for the U.S. 2.4GHz and 5.8GHz markets. We also have used our RF technology for the 5.8GHz radio chip to introduce a DECT solution covering 1.7-1.9GHz bands with superior channel capacity for voice and data. During 2006 and 2007, the first DECT 6.0 products were introduced to the U.S. market by our customers. Also during 2007, we started production of a RF transceiver, which in addition to providing outstanding performance characteristics, allows simultaneous support of up to 12 handset links and supports emerging next generation DECT standard—CAT-IQ—which is aimed at the global DECT market.
We also announced in 2004 the development of an Internet Protocol (IP) cordless phone that enables connectivity to a broadband line feeding VoIP with cordless phone capabilities. In addition, we have started the development of a new feature that is anticipated to enable connectivity of cellular phones to residential fixed-line phones.
During 2005, we developed a motion JPEG cordless application for slow motion monitoring applications, such as door phones, security and baby monitoring, as well as USB dongle connectivity to a variety of PC instant messaging applications, such as Skype, MSN and GoogleTalk. All these applications, together with cellular connectivity, were incorporated into end products of our customers that entered into the market in 2006.
3
Table of Contents
During 2006, we introduced to the market our short wave (SW) radio technology for the 5.8GHz radio chip. The new product achieves improved sensitivity. We have used this technology to introduce a DECT solution covering 1.7-1.9GHz banks with superior channel capacity for voice and data.
During 2007, we acquired the CIPT Business, strengthening our research and development capabilities with development sites in Europe and India. This business line had developed cordless and VoIP products using ARM7™ and ARM9™ processors and BiCMOS radio frequency technology. During 2007 and 2008, the CIPT Business focused its development efforts on the ARM9-based products, including VegaONE, a single chip cordless system solution containing the ARM9 processor, a programmable burst mode controller, power management, audio codecs, RF transceiver and power amplifier; and VegaFireBird, a powerful dual core processor suitable for VoIP-base stations and high-end terminals containing an ARM9 processor and a REAL™ DSP core alongside a programmable burst mode controller.
During 2008, we introduced a new generation of 1.9GHz cordless RF devices, integrating the power amplifier into the transceiver, thereby substantially reducing the cost of production for our customers by reducing the bill-of-materials cost for the devices.
Also during 2008, we implemented several actions, primarily targeting the overlap between the two cordless product lines within the company following the acquisition of the CIPT Business, to reduce research and development expenses within the company. The activities included discontinuing BiCMOS RF product development to concentrate on CMOS for cordless product lines and consolidating our system and baseband IC activities into fewer development sites within the company.
In 2008, we also launched the first generation of our XpandR™ family of multimedia chipset solutions, a system-on-a-chip (SoC) solution supporting both Wi-Fi, DECT and an application processor. The XpandR family of products integrates much of the company’s technology from cordless applications and technologies that we acquired and developed further in-house such as the processing capability from Teleman and the Wi-Fi technology from Bermai. Concurrent with the introduction of this first generation of XpandR products to the market, we started developing a second generation of XpandR products family.
During 2009, we introduced the second generation of our XpandR family. The XpandR II chipset solution includes a powerful dual-core wireless multimedia and DECT baseband processor, an analog front end and power management unit, Wi-Fi and cordless RF chips, and comprehensive multimedia peripherals to enable the development of always-on portable, connected multimedia products. The XpandR II chipset significantly reduces cost of production for our customers by reducing the bill-of-materials cost for the targeted multimedia devices and enabling higher end applications at an optimized cost.
Also, during 2009, we launched the XceedR DCX family of chipsets combining RF and ARM9 baseband functions in a single package with a rich set of telephony features and advanced audio processing capabilities. DCX provides a cost-performance solution for mid-range DECT/DECT6.0/CAT-iq and offers a total integrated digital cordless telephone solution—comprising a digital processing unit (DPU), radio frequency analog processing unit (RFAPU), hardware development kit (HDK) and software development kit (SDK).
We expect that all of the above referenced products will continue to contribute a significant share of our business in 2010. We further anticipate that new products and categories of products for home communication, including Wi-Fi application products, will start contributing to our revenues in 2010 and beyond.
Target Markets and DSP Group Products
Our work in the field of wireless residential technologies has yielded various synergistic product families targeted for specific segments of the residential communications market. We believe that we are prepared to meet the exciting challenges of the dynamic and evolving market for short-range multimedia communication and home wireless networking by our ability to integrate voice, data and video technologies.
4
Table of Contents
The acquisition of the CIPT Business significantly enhanced our product portfolio, especially in the cordless telephony and VoIP areas, as described below.
Products Targeted for Digital Cordless Telephony
We are a world-leading provider of chipsets for cordless telephony applications. Our XceedR cordless chipsets provide a total integrated digital cordless solution that includes all required digital baseband, analog interface and RF functionality. XceedR enables worldwide coverage, supporting all RF bands and cordless protocols, such as:
| • | 1.7GHz -1.9GHz DECT—used in Europe, U.S. (DECT6.0), Korea and Latin America; |
| • | 2.4GHz—used in Japan, China and the U.S.; the dominant protocols for this RF band is our proprietary EDCT and WDCT (Wireless Digital Cordless Technology) protocols; and |
| • | 5.8GHz—used in the U.S. with our proprietary EDCT cordless protocol. |
The XceedR chipset portfolio combines wireless communications technology with a range of telephony features, and audio and voice-processing algorithms to provide the industry’s lowest system cost and smallest footprint. Enhanced with our hardware and software packages, XceedR chipsets are highly versatile and enable the development of an array of cordless telephony solutions at a lower effort and faster time to market than alternative silicon offerings.
The XceedR chipset portfolio is comprised of two families—XceedR DE and XceedR DCX:
The XceedR DE chipset family is a mature and field-proven family of integrated digital baseband processors RF chips for digital cordless telephony. The chipset is used to develop fully integrated cordless telephone systems, digital answering machines, digital voice recorders (DVRs), digital baby monitors, and other low-to-mid-range audio applications. Including the industry’s most advanced digital cordless solutions, the XceedR DE family maintains multi-line, multi-handset and digital answering machine capabilities, while supporting various RF protocols such as DECT (1.7GHz-1.9GHz), FHSS DECT 2.4GHz, and EDCT 2.4GHz and 5.8GHz. Integration of the TeakLite™ RISC DSP core into the DE56 baseband chip enables software implementation of a variety of voice coders, and provides a flexible platform for developing a wide range of solutions. With its DSP-based architecture, the chipset enables cost-effective incorporation of the most advanced audio and telephony features.
The XceedR DCX chipset family is the next step in flexibility and performance for digital cordless applications. Combining state-of-the-art RF and ARM9 baseband functions in a single package with a rich set of telephony features and advanced audio-processing capabilities, the DCX provides the best cost-performance solution for mid-to-high-range DECT/DECT6.0/CAT-iq (Cordless Advanced Technology—Internet and Quality) and WDCT cordless applications. Supporting all RF bands, the XceedR DCX chipset family offers a total integrated digital cordless telephone solution that includes a digital baseband controller, analog interface, RF transceiver, and power amplifier. Comprised of Flash-based chips and a full set of ROM-based products with various memory configurations, the XceedR DCX chipset family meets all digital cordless application needs.
Products Targeted for the VoIP Market
In 2004, we announced that we were developing an IP cordless phone that was anticipated to enable connectivity to a broadband line feeding VoIP with cordless phone capabilities.
We continue to sell our current line of VoIP speech co-processors, which are DSP core-based, highly-integrated speech processors, targeted at the low to medium density Integrated Access Device (IAD), residential gateway and VoIP telephony markets. These devices integrate all necessary DSP functionality with built-in analog front-end and support one to four channels of VoIP and FAX over IP for use in conjunction with other microprocessors to transmit VoIP-based public and private networks, including the Internet, local area networks
5
Table of Contents
(LANs), frame relay networks, DSL links, cable networks, other data networks and combined data/voice networks. “Voice-over-IP” refers to the transmission of voice signals over networks using the Internet protocol, which involves dividing the signals into numerous small data packets that are individually transmitted over a network and re-assembled in the correct order at their destination. This technology also can be used to implement the speech component of video conferencing applications.
In 2005, we developed an integrated CoIP telephony system that supports both PSTN line and broadband for the emerging VoIP residential market, supporting Session Initiation Protocol (SIP) together with advanced TR-069 protocol, thereby enabling telecommunication operators’ remote control and remote upgrade of VoIP products.
The acquisition of the CIPT Business enhanced our customer base for the VoIP market by adding major telecom brands to our customer base in Europe and Asia.
In 2008, we continued to sell products for the CoIP market while developing a new platform based on ARM9, the VegaFireBird and VegaONE products, to the advanced IAD market.
The XciteR family of chipsets is based on the legacy VegaFireBird and provides embedded solutions for low-cost corded IP-phones to advanced cordless IP-phones with DECT handsets and headsets, which are based on the new XciteR DCX chipset family. Our VoIP chipset family is most suitable for enterprise IP telephony products and some of the leading vendors are already developing their IP telephones with our chipsets.
Products Targeted for Multimedia Connected Screens
To capitalize on the increasing convergence of voice, data, audio and video, we offer the XpandR family of multimedia chipset solutions. XpandR is the world’s only system-on-a-chip (SoC) solution based on dual-core ARM and DSP, Wi-Fi and DECT baseband processors and comprehensive multimedia peripherals along with companion analog front-end and power management unit, and Wi-Fi and cordless RF chips, to enable the development of always-on portable, connected multimedia products.
The XpandR solution supports a full spectrum of connected applications—including web browsing, email, widgets, web radio, Picasa and YouTube uploading—based on open platform frameworks such as Android. In addition, the solution supports an array of home-specific applications, including universal remote control and interactive TV controller, Digital Living Network Alliance (DLNA) client for local streaming, home automation, and monitoring and storage manager.
XpandR-I—in 2008, we demonstrated the first member of the XpandR product family—the DW52 chip with ARM9 and DSP in a single chip along with its companion RF ICs to support Wi-Fi a/b/g/e.
XpandR-II—in 2009, we demonstrated the second member of the XpandR product family—the DMW74; this chipset enhances the CPU speed to 240MHz and the integration level by adding more functionality and more peripherals on-chip. The XpandR-II chipset has been designed by several vendors into enhanced products such as Wi-Fi handsets, multimedia tablets and Android cordless multimedia handsets, which represent the evolution of the cordless home phones and improve the experience of smartphones for home users.
XpandR-III: the DMW96—the third generation XpandR processor—is expected to be sampled during 2010. DMW96 is a state-of-the-art system-on-a-chip (SoC) that features an advanced low-power media system that integrates smart acceleration engines to deliver high-definition video, image processing, 2D/3D graphics, as well as a dedicated security controller and 802.11n that will complement a full offering for converged voice, data, audio and video processor chip—a chip that is targeted at low bit rate video applications, such as those based on H.263, JPEG and MPEG4 compression standards. DMW96 includes a complete stand-alone system, including direct image sensor and display interfaces, as well as an advanced video compression engine. Target applications include video telephony, home security and portable multimedia. DMW96 can be used in a system with our cordless chipsets to provide wireless video transmission.
6
Table of Contents
Products Targeted for the Digital Voice Recorder
We developed a DVR that integrates the TeakLiteDSPCore® to enable many different speech compression rates at the highest possible quality. During 2005, we developed and released an integrated DVR with MP3 playback and USB dongle connectivity for voice recording application for personal and business use. We continued to ship our DVR products to major brand name manufacturers in Japan and Korea in 2009.
Customers
We sell our products primarily through distributors and directly to original equipment manufacturers (OEMs) and ODMs who incorporate our products into consumer products for the worldwide residential wireless communications market. In 2009, we continued expanding our customer base, and in some cases, increased our share of business with existing customers. Our customer list now includes additional major brand names and direct OEMs and ODMs worldwide. The major consumer electronics manufacturers and brands that have incorporated our ICs into their products include: Accton, AEG, Alcatel, Alcotel, AT&T, Audioline, Aztech, Belgacom, Binatone, British Telecom, Brother, CCT Tech, China Mobile, China Telecom, Deutsche Telekom, Doro, France Telecom, Freebox, Gaoxinqi, GE, Giant Electronics, Global China Technologies, Grandstream, Hagenuk, Huawei, Intelbras, JXE, Korea Telecom, KPN, LG Electronics, Matsushita, Motorola, NEC, NTT, OpenPeak, Panasonic, Philips, Pioneer, Plantronics, Sagem, Samsung, Sanyo, SGW, Sharp, Siemens (Gigaset), SK Telesys, Sony, Swisscom, TCL, Telecom Italia, Telefonica, Telstra, Thomson, Topcom, Uniden, Urmet, Verizon, VTech, WNC, Xingtel and Yamaha.
International Sales and Operations
Export sales accounted for 98% of our total revenues for 2009, 92% for 2008 and 98% for 2007. Although most of our sales to foreign entities are denominated in United States dollars, we are subject to risks of conducting business internationally. These risks include unexpected changes in regulatory requirements, fluctuations in exchange rates that could increase the price of our products in foreign markets, delays resulting from difficulty in obtaining export licenses for certain technology, tariffs, other barriers and restrictions and the burden of complying with a variety of foreign laws. See Note 13 of the attached Notes to Consolidated Financial Statements for the year ended December 31, 2009, for a summary of the geographic breakdown of our revenues and location of our long-lived assets.
Moreover, a portion of our expenses in Israel is paid in Israeli currency (New Israeli Shekel (NIS)), which subjects us to the risks of foreign currency fluctuations between the U.S. dollar and the NIS. Our primary expenses paid in NIS are employee salaries and lease payments on our Israeli facilities. As a result, an increase in the value of Israeli currency in comparison to the U.S. dollar could increase the cost of our technology development, research and development expenses and general and administrative expenses. From time to time, we use derivative instruments to minimize the effects of currency fluctuations, but our hedging positions may be partial, may not exist at all in the future or may not succeed in minimizing our foreign currency fluctuation risks.
In addition, due to the acquisition of the CIPT Business, a portion of our expenses in Europe is paid in Euro and Swiss Franc, which subjects us to the risks of foreign currency fluctuations between the U.S. dollar and the Euro and the Swiss Franc. Our primary expenses paid in Euro and Swiss Franc are employee salaries and lease and operational payments on our European facilities. As a result, an increase in the value of the Euro and Swiss Franc in comparison to the U.S. dollar also could increase the cost of our technology development, research and development expenses and general and administrative expenses.
Sales, Marketing and Distribution
We market and distribute our products through our direct sales and marketing offices, as well as through a network of distributors. Our sales and marketing team, working out of our sales offices in Hong Kong; Zurich, Switzerland; Nierenberg, Germany; San Jose, California; Tokyo, Japan; Herzelia Pituach, Israel and Edinburgh, Scotland, pursues business with our customers in North and South America, Europe and Asia. In territories where
7
Table of Contents
we do not have sales offices, we operate solely through a network of distributors and representatives. Sales to Hong Kong-based VTech represented 29% of our total revenues for 2009, 21% for 2008 and 10% in 2007. Revenues derived from sales through our Japanese distributor, Tomen Electronics, represented 22% of our total revenues for 2009, 25% for 2008 and 37% for 2007. Furthermore, Tomen Electronics sells our products to a limited number of customers. One customer, Panasonic, has continually accounted for a majority of sales through Tomen Electronics. Sales to Panasonic through Tomen Electronics generated approximately 13%, 13% and 23% of our revenue in 2009, 2008 and 2007, respectively. Sales through Tomen Electronics or directly to Uniden represented 12%, 13% and 13% of our total revenues in 2009, 2008 and 2007 respectively. Sales to Hong Kong-based CCT Telecom represented 8%, 9% and 12% of our total revenues for 2009, 2008 and 2007, respectively. The loss of any of our significant customers or distributors could harm our business, financial condition and results of operations. In addition, our customers and distributors are not subject to minimum purchase requirements and can cease making purchases of our products at any time.
As our products are generally incorporated into consumer products sold by our OEM customers, our revenues are affected by seasonal buying patterns of consumer products sold by our OEM customers. The fourth quarter in any given year is usually the strongest quarter of sales for our OEM customers and, as a result, the third quarter in any given year is usually the strongest quarter for our revenues as our OEM customers request increased shipments of our products in anticipation of the fourth quarter holiday season. This trend can be generally observed from reviewing our quarterly information and results of operations.
Manufacturing and Design Methodology
As part of the acquisition of the CIPT Business, we entered into a Manufacturing Services Collaboration Agreement, as amended, with NXP pursuant to which NXP agreed to provide us with specified manufacturing, pre-testing, assembling and final-testing services relating to CIPT Business products at agreed upon prices for up to seven years following the closing of the Acquisition. The services are provided on a purchase order basis. The agreement also sets forth specified capacity guarantees by NXP, logistics for our provision of production schedules, our purchase obligations, penalties for late/non delivery by NXP and various technical specifications for the manufacturing services. In order to meet the agreement obligations, NXP uses its internal fabrication and back-end production facilities, as well as third parties. We currently buy finished goods from NXP under the manufacturing agreement. In order to enable NXP to provide such services, we provide binding capacity commitments to NXP based on a periodic rolling forecast. The manufacturing agreement with NXP provides that we may be subject to monetary penalties if we fail to meet our capacity commitments to NXP that we previously provided to them.
Products from the CIPT Business currently represent a substantial portion of our total revenues and are anticipated to continue to generate significant revenues for us in future periods. Our business could be materially harmed if NXP fails to achieve acceptable manufacturing yields, quality levels or allocate to us a sufficient portion of its foundry, and assembly and testing capacities to meet our needs for the CIPT Business products due to its capacity constraints, including as a result of the worldwide shortage in manufacturing capacity or the provision of manufacturing services to NXP’s internal business units or other third parties. We also may encounter capacity shortage issues in the future if sales for the CIPT Business products continue to increase as we anticipate and NXP cannot sufficiently meet our increasing demands. A capacity shortage could lengthen our CIPT Business products’ manufacturing cycle, cause a delay in the shipment of our products to our customers, lead to a loss of sales of our products, harm our reputation and competitive position with customers, and our revenues could be materially reduced. Our business would be materially harmed if NXP cannot for any reason fulfill its manufacturing obligations to us under the manufacturing agreement, including due to financial or operational hardships within NXP as a result of the cyclical nature of semiconductors industry or otherwise, and we are unable to obtain a satisfactory replacement to fulfill customer orders on a timely basis and in a cost-effective manner. Unforeseen difficulties with NXP’s manufacturing of the CIPT Business products could materially harm our business, financial condition and results of operations. Moreover, in accordance with the MSCA, NXP’s manufacturing of certain CIPT Business products would expire in 2010, subject to our ability to extend the period for two consecutive one-year terms under specified circumstances. Upon expiration as a result
8
Table of Contents
of our inability to extend the manufacturing period by NXP, we may experience difficulty in finding a suitable replacement manufacturer for these CIPT Business products, which may result in a disruption in product shipments, harm our customer relationships and generally disrupt our business. Even in the event we are able to find a suitable replacement manufacturer, transitioning of manufacturing processes, including re-qualification of CIPT Business Products, may be a difficult process. There are inherent and unforeseen risks and delays associated with the transfer of manufacturing capacities from one facility to another, including production and shipment delays, capacity constraints with the replacement manufacturer, IP incompatibility, logistical and administrative concerns or general difficulties associated with starting a new manufacturing process. Therefore, even with a suitable replacement manufacturer, we may experience a significant disruption in product shipments, harm to our customer relationships and generally a disruption of our business. In addition, we may incur higher manufacturing costs with the replacement manufacturer which may decrease our gross margins and generally adversely affect our results of operations.
Other than products for the CIPT Business for which we have an arrangement with NXP, we contract certain of our product fabrication services for speech and telephony processors and RF devices mainly from TSMC, TriQuint and IBM. A majority of our integrated circuit products at this time are manufactured by TSMC. We intend to continue to use independent foundries to manufacture our digital speech processors, cordless devices and other products for the consumer telephony and computer telephony markets. Our reliance on independent foundries involves a number of risks, including the foundries’ ability to achieve acceptable manufacturing yields at competitive costs and their allocation of sufficient capacity to us to meet our needs. While we currently believe we have adequate capacity to support our current sales levels, we may encounter capacity issues in the future. In the event of a worldwide shortage in foundry capacity, we may not be able to obtain a sufficient allocation of foundry capacity to meet our product needs. Shortage or lack of capacity at the foundries we use to manufacture our products may lead to increased operating costs and lower gross margins. In addition, such a shortage could lengthen our products’ manufacturing cycle and cause a delay in the shipment of our products to our customers. Moreover, as TSMC produces a significant portion of our wafer supply, earthquakes, aftershocks or other natural disasters in Asia could preclude us from obtaining an adequate supply of wafers to fill customer orders. Unforeseen difficulties with our independent foundries could harm our business, financial condition and results of operations.
Other than products for the CIPT Business for which we have an arrangement with NXP, we use independent subcontractors located in Asia, to assemble and test certain of our products. We develop detailed testing procedures and specifications for each product and require each subcontractor to use these procedures and specifications before shipping us the finished products. We test and/or assemble our products at ASE, KYEC, SPIL and Giga.
Furthermore, our IDT speech processor products require an external component in the finished product to provide flash memory, which is supplied by third party manufacturers. Temporary fluctuations in the pricing and availability of this component could negatively impact sales of our IDT speech processors, which could in turn harm our business, financial condition and results of operations.
Competition
The markets in which we operate are extremely competitive, and we expect that competition will continue to increase. In each of our business activities, we face current and potential competition from competitors that have sometimes significantly greater financial, technical, manufacturing, marketing, sales and distribution resources and management expertise than we do. Our future prospects will depend greatly on our ability to successfully develop and introduce new products that are responsive to market demands. We cannot assure you that we will be able to successfully develop or market new products.
The principal competitive factors in the cordless telephony market include price, system integration level, range, voice quality, customer support and the timing of product introductions by us and our competitors. We believe that we are competitive with respect to most of these factors. Our principal competitors in the cordless
9
Table of Contents
market include Lantiq (formerly Infineon) and SiTel (formerly the DECT division of National Semiconductor). Similar principal competitive factors affect the VoIP market. We also believe that we are competitive with respect to most of these factors. Our principal competitors in the VoIP market include Broadcom, Infineon, SiTel, Texas Instruments and new Taiwanese IC vendors. Our principal competitors in the multimedia market include Wi-Fi and multimedia application processor IC vendors like Atheros, Broadcom, CSR, Freescale, Intel, Marvel, Ralink, Samsung and Texas Instruments.
Price competition in the markets in which we currently compete and propose to compete is intense and may increase, which could harm our business, financial condition and results of operations. We have experienced and will continue to experience increased competitive pricing pressures for our ICs. Moreover, price competition has intensified due to the lack of new model launches and the anticipation of new products in the market. We were able to partially offset price reductions which occurred during 2009 through manufacturing cost reductions, improvements in our yield percentages and by achieving a higher level of product integration. However, we cannot assure you that we will be able to further reduce production costs, or be able to compete successfully with respect to price or any other key competitive factors in the future.
In future periods, due to various new developments in the residential telephony market, we also may be required to enter into new markets with competitors that have more established presence, and significantly greater financial, technical, manufacturing, marketing, sales and distribution resources and management expertise than we do.
Furthermore, there is a growing threat from alternative technologies accelerating the decline of the fixed-line telephony market. This competition comes from mobile telephony, including emerging dual-mode mobile Wi-Fi phones, and other innovative applications, such as Skype and iChat. Given that we derive a significant amount of revenues from chipsets incorporated into fixed-line telephony products, if we are unable to develop new technologies in the face of the decline of this market, our business could be materially adversely affected.
Research and Development
We believe that timely development and introduction of new products are essential to maintain our competitive position. We currently conduct most of our product development at our facilities. At December 31, 2009, we had a staff of 256 research and development personnel, of which 180 were located in Israel. We also employ independent contractors to assist with certain product development and testing activities. We spent approximately $56.1 million in 2009, $73.9 million in 2008 and $58.5 million in 2007 on research and development activities.
As noted above, due to various new developments in the home residential market, including the rapid deployment of new communication access methods and the rise of alternative technologies in lieu of fixed-line telephony, we will be required to expand our current product lines and develop products and services targeted at a wider multimedia market. We will need to continue to invest in research and development, and our research and development expenses may increase in the future, including the addition of new research and development personnel, to keep pace with new and rapidly changing trends in our industry.
Licenses, Patents and Trademarks
As of December 31, 2009, we have been granted a total of 138 patents, including 82 United States patents, 1 Canadian patent, 7 Israeli patents, 4 Japanese patents, 6 German, French and Great Britain patents, 2 Italian patents and 1 Taiwanese patent. We have a total of over 110 pending patents, out of which 5 patent applications have been approved and are pending publication, 45 patents are pending in the United States, 21 patents are pending in Europe (PCT), 18 patents are pending in Japan and 6 patents are pending in Korea.
We actively pursue foreign patent protection in countries of interest to us. Our policy is to apply for patents or for other appropriate statutory protection when we develop valuable new or improved technology. The status of any patent involves complex legal and factual questions, and the breadth of claims allowed is uncertain.
10
Table of Contents
Accordingly, we cannot assure you that any patent application filed by us will result in a patent being issued, or that our patents, and any patents that may be issued in the future, will afford adequate protection against competitors with similar technology; nor can we provide assurance that patents issued to us will not be infringed or designed around by others. In addition, the laws of certain countries in which our products are or may be developed, manufactured or sold, including China, Hong Kong, Japan, Korea and Taiwan, may not protect our products and intellectual property rights to the same extent as the laws of the United States.
We attempt to protect our trade secrets and other proprietary information through agreements with our customers, suppliers, employees and consultants, and through other security measures. Although we intend to protect our rights vigorously, we cannot assure you that these measures will be successful.
The semiconductor industry is subject to frequent litigation regarding patent and other intellectual property rights. While claims involving any material patent or other intellectual property rights have not been brought against us to date, we cannot provide assurance that third parties will not assert claims against us or our customers with respect to existing or future products, or that we will not need to assert claims against third parties to protect our proprietary technology. For example, in a lawsuit against Microsoft Corporation, AT&T asserted that our TrueSpeech 8.5 algorithm includes certain elements covered by a patent held by AT&T. AT&T sued Microsoft, one of our TrueSpeech 8.5 licensees, for infringement. We were not named in AT&T’s suit against Microsoft. In addition, patent infringement claims are increasingly being asserted by patent holding companies (so-called patent “trolls”), which do not use technology and whose sole business is to enforce patents against companies, such as us, for monetary gain. Because such patent holding companies do not provide services or use technology, the assertion of our own patents by way of counter-claim may be ineffective. We have received claims that our products infringe upon the proprietary rights of such patent holding companies. In addition, third parties have asserted and may in the future assert intellectual property infringement claims against our customers, which we have agreed in certain circumstances to indemnify and defend against such claims. If litigation becomes necessary to determine the validity of any third party claims or to protect our proprietary technology, it could result in significant expense to us and could divert the efforts of our technical and management personnel, whether or not the claim has any merit and notwithstanding that the litigation is determined in our favor. In the event of an adverse result in any litigation, we could be required to expend significant resources to develop non-infringing technology or to obtain licenses to the technology that is the subject of the litigation. We cannot provide assurance that we would be successful in developing non-infringing technology or that any licenses would be available on commercially reasonable terms.
We have trademark registration for the following marks in the United States: TRUESPEECH and TRIPLE RATE CODER.
While our ability to compete may be affected by our ability to protect our intellectual property, we believe that because of the rapid pace of technological change in our industry, our technical expertise and ability to innovate on a timely basis and in a cost-effective manner will be more important in maintaining our competitive position than the protection of our intellectual property. In addition, we believe that due to rapid technological changes in residential telephony, computer telephony and personal computer markets, patents and trade secret protection are important but must be supported by other factors, including expanding the knowledge, ability and experience of our personnel, new product introductions and frequent product enhancements. Although we continue to implement protective measures and intend to defend our intellectual property rights vigorously, we cannot assure you that these measures will be successful.
Backlog
At December 31, 2009, our backlog was approximately $48.7 million, compared to approximately $35.1 million and $75.8 million at December 31, 2008 and 2007, respectively. We include in our backlog all accepted product purchase orders with respect to which a delivery schedule has been specified for product shipment within one year. Our business is characterized by short-term order and shipment schedules. Product orders in our current
11
Table of Contents
backlog are subject to change, sometimes on short notice, due to changes in delivery schedules or cancellation by a purchaser. Accordingly, although useful for scheduling production, backlog as of any particular date may not be a reliable measure of our sales for any future period.
Employees
At December 31, 2009, we had 409 employees, including 256 in research and development, 64 in marketing and sales and 89 in corporate, administration and manufacturing coordination. Competition for personnel in the semiconductor and personal computer industries in general is intense. We believe that our future prospects will depend, in part, on our ability to continue to attract and retain highly-skilled technical, marketing and management personnel, who are in great demand. In particular, there is a limited supply of RF chip designers and highly-qualified engineers with digital signal processing experience. We believe that our relations with our employees are good.
Web Site Access to Company’s Reports
Our Internet Web site address is www.dspg.com. Our annual reports on Form 10-K, quarterly reports on Form 10-Q, current reports on Form 8-K, and amendments to those reports filed or furnished pursuant to Section 13(a) or 15(d) of the Exchange Act are available free of charge through our Web site as soon as reasonably practicable after they are electronically filed with, or furnished to, the Securities and Exchange Commission. We will also provide the reports in electronic or paper form free of charge upon request.
Our website and the information contained therein or connected thereto are not intended to be incorporated into this Annual Report on Form 10-K.
| Item 1A. | RISK FACTORS. |
The following risk factors, among others, could in the future affect our actual results of operations and could cause our actual results to differ materially from those expressed in forward-looking statements made by us. These forward-looking statements are based on current expectations and we assume no obligation to update this information. Before you decide to buy, hold, or sell our common stock, you should carefully consider the risks described below, in addition to the other information contained elsewhere in this report. The following risk factors are not the only risk factors facing our company. Additional risks and uncertainties not presently known to us or that we currently deem immaterial may also affect our business. Our business, financial condition, and results of operation could be seriously harmed if any of the events underlying any of these risks or uncertainties actually occurs. In that event, the market price for our common stock could decline, and you may lose all or part of your investment.
We generate a significant amount of our total revenues from the sale of digital cordless telephony products and our business and operating results may be materially adversely affected if we do not continue to succeed in this highly competitive market or if sales within the overall cordless digital market decreases.
Sales of our digital cordless telephony products comprised a majority of our total revenues for 2009. Specifically, sales of our DECT, 2.4GHz, 5.8GHz and CoIP products comprised 92% of our total revenues for 2009, 89% for 2008 and 86% for 2007. Revenues from our DECT products represented 77%, 70% and 38% of our total revenues for 2009, 2008 and 2007, respectively. Revenues from our 2.4GHz and 5.8GHz products represented 12% and 2%, respectively, of our total revenues for 2009, 13% and 6%, respectively, of our total revenues for 2008 and 19% and 24%, respectively, of our total revenues for 2007. We believe U.S. sales of our 2.4GHz and 5.8GHz products will continue to decrease in 2010.
Any adverse change in the digital cordless market or in our ability to compete and maintain our competitive position in that market would harm our business, financial condition and results of operations. The digital cordless telephony market is extremely competitive and is facing intensive pricing pressures, and we expect that
12
Table of Contents
competition and pricing pressures will only increase. Our existing and potential competitors in this market include large and emerging domestic and foreign companies, many of whom have significantly greater financial, technical, manufacturing, marketing, sale and distribution resources and management expertise than we do. It is possible that we may one day be unable to respond to increased pricing competition for digital cordless telephony processors or other products through the introduction of new products or reduction of manufacturing costs. This inability to compete would have a material adverse effect on our business, financial condition and results of operations. Likewise, any significant delays by us in developing, manufacturing or shipping new or enhanced products in this market also would have a material adverse effect on our business, financial condition and results of operations.
In addition, we believe new developments in the residential connectivity market may adversely affect the revenues we derive from our digital cordless telephony products. For example, the projected decline in fixed-line telephony together with the rapid deployment of new communication access methods, including mobile, wireless broadband, cable and other connectivity, may compound the decrease in sales of products using fixed-line telephony. This decrease in demand would reduce our revenues derived from, and unit sales of, our digital cordless telephony products.
We rely significantly on revenue derived from a limited number of customers.
We expect that a limited number of customers, varying in identity from period-to-period, will account for a substantial portion of our revenues in any period. Our four largest customers—VTech, Panasonic, Uniden and CCT Telecom accounted for approximately 62% of our total revenues for 2009, 56% in 2008 and 58% in 2007. Sales to VTech represented 29%, 21% and 10% of our total revenues for 2009, 2008 and 2007, respectively. Sales to Panasonic represented 13%, 13% and 23% of our total revenues for 2009, 2008 and 2007, respectively. Sales to Uniden represented 12% of total revenues for 2009 and 13% of our total revenues for both 2008 and 2007. Sales to CCT Telecom represented 8%, 9% and 12% of total revenues for 2009, 2008 and 2007, respectively. Typically, our sales are made on a purchase order basis, and none of our customers has entered into a long-term agreement requiring it to purchase our products. Moreover, we do not typically require our customers to purchase a minimum quantity of our products, and our customers can generally cancel or significantly reduce their orders on short notice without significant penalties. A significant amount of our revenues will continue to be derived from a limited number of large customers. Furthermore, the primary customers for our products are original equipment manufacturers (OEMs) and original design manufacturers (ODMs) in the cordless digital market. This industry is highly cyclical and has been subject to significant economic downturns at various times, particularly in recent periods. These downturns are characterized by production overcapacity and reduced revenues, which at times may affect the financial stability of our customers. Therefore, the loss of one of our major customers, or reduced demand for products from, or the reduction in purchasing capability of, one of our major customers, could have a material adverse effect on our business, financial condition and results of operations.
Because our products are components of end products, if OEMs do not incorporate our products into their end products or if the end products of our OEM customers do not achieve market acceptance, we may not be able to generate adequate sales of our products.
Our products are not sold directly to the end-user; rather, they are components of end products. As a result, we rely upon OEMs to incorporate our products into their end products at the design stage. Once an OEM designs a competitor’s product into its end product, it becomes significantly more difficult for us to sell our products to that customer because changing suppliers involves significant cost, time, effort and risk for the customer. As a result, we may incur significant expenditures on the development of a new product without any assurance that an OEM will select our product for design into its own product and without this “design win” it becomes significantly difficult to sell our products. Moreover, even after an OEM agrees to design our products into its end products, the design cycle is long and may be delayed due to factors beyond our control which may result in the end product incorporating our products not to reach the market until long after the initial “design
13
Table of Contents
win” with the OEM. From initial product design-in to volume production, many factors could impact the timing and/or amount of sales actually realized from the design-in. These factors include, but are not limited to, changes in the competitive position of our technology, our customers’ financial stability, and our ability to ship products according to our customers’ schedule. Moreover, the current global economic downturn may further prolong an OEM customer’s decision-making process and design cycle.
Furthermore, we rely on the end products of our OEM customers that incorporate our products to achieve market acceptance. Many of our OEM customers face intense competition in their markets. If end products that incorporate our products are not accepted in the marketplace, we may not achieve adequate sales volume of our products, which would have a negative effect on our results of operations.
We rely on a primary distributor for a significant portion of our total revenues and the failure of this distributor to perform as expected would materially reduce our future sales and revenues.
We sell our products to customers primarily through a network of distributors. Particularly, revenues derived from sales through our Japanese distributor, Tomen Electronics, accounted for 22% of our total revenues for 2009, 25% for 2008 and 37% for 2007. Our future performance will depend, in part, on this distributor to continue to successfully market and sell our products. Furthermore, Tomen Electronics sells our products to a limited number of customers. One customer, Panasonic, has continually accounted for a majority of the sales through Tomen Electronics. Sales to Panasonic through Tomen Electronics generated approximately 13%, 13% and 23% of our total revenues for 2009, 2008 and 2007, respectively. The loss of Tomen Electronics as our distributor and our inability to obtain a satisfactory replacement in a timely manner would materially harm our sales and results of operations. Additionally, the loss of Panasonic and Tomen Electronics’ inability to thereafter effectively market our products would also materially harm our sales.
Because our quarterly operating results may fluctuate significantly, the price of our common stock may decline.
Our quarterly results of operations may vary significantly in the future for a variety of reasons, many of which are outside our control, including the following:
| • | fluctuations in volume and timing of product orders; |
| • | timing, rescheduling or cancellation of significant customer orders and our ability, as well as the ability of our customers, to manage inventory; |
| • | changes in demand for our products due to seasonal consumer buying patterns and other factors; |
| • | timing of new product introductions by us, including our DECT and XpandR products, and by our customers or competitors; |
| • | changes in the mix of products sold by us or our competitors; |
| • | fluctuations in the level of sales by our OEM customers and other vendors of end products incorporating our products; |
| • | timing and size of expenses, including expenses to develop new products and product improvements and expenses resulting from restructuring activities; |
| • | entry into new markets, including China, Korea and South America; |
| • | our ability to scale our operations in response to changes in demand for our existing products and services or demand for new products requested by our customers; |
| • | mergers and acquisitions by us, our competitors and our existing and potential customers; and |
| • | general economic conditions, including current economic conditions in the United States and worldwide, and the adverse effects on the semiconductor and consumer electronics industries. |
14
Table of Contents
Each of the above factors is difficult to forecast and could harm our business, financial condition and results of operations. Also, we sell our products to OEM customers that operate in consumer markets. As a result, our revenues are affected by seasonal buying patterns of consumer products sold by our OEM customers that incorporate our products and the market acceptance of such products supplied by our OEM customers. The fourth quarter in any given year is usually the strongest quarter for sales by our OEM customers in the consumer markets, and thus, our third quarter in any given year is usually the strongest quarter for revenues as our OEM customers request increased shipments of our products in anticipation of the increased activity in the fourth quarter. By contrast, the first quarter in any given year is usually the weakest quarter for us.
Our revenues, gross margins and profitability may be materially adversely affected by the continued decline in average selling prices of our products and other factors, including increases in assembly and testing expenses, and raw material and commodity costs.
We have experienced and will continue to experience a decrease in the average selling prices of our products. Decreasing average selling prices could result in decreased revenues even if the volume of products sold increases. Decreasing average selling prices may also require us to sell our products at much lower gross margin than in the past and reduce profitability. Although we have to date been able to partially offset on an annual basis the declining average selling prices through general operational efficiencies and manufacturing cost reductions by achieving a higher level of product integration and improving our yield percentages, there is no guarantee that our ongoing efforts will be successful or that they will keep pace with the anticipated, continued decline in average selling prices of our products. As an example, our gross margin for 2009 was 37.0%, as compared to 37.3% and 40.5% in 2008 and 2007, respectively. In addition to the continued decline in the average selling prices of our products, our gross profit may decrease in the future due to other factors, including the roll-out of new products in any given period and the penetration of new markets which may require us to sell products at a lower margin, our failure to introduce new engineering processes and mix of products sold.
Our gross margins also are affected by the product mix. For example, DECT products have lower average gross margins than 5.8GHz and 2.4GHz products and the increased sales of DECT products lower our gross margins. We anticipate that the shift to DECT 6.0 products in the U.S. market will continue in 2010. This trend will continue to put pressure on our gross margins.
Furthermore, increases in the price of silicon wafers, increases in testing costs and increases in gold, oil and other commodities which may result in increased production costs, mainly assembly and packaging costs may result in a decrease to our gross margins. Moreover, our suppliers may pass the increase in raw materials and commodity costs onto us which would further reduce the gross margin of our products. In addition, as we are a fabless company, global market trends such as “over-capacity” problems so that there is a shortage of capacity to fulfill our fabrication needs also may increase our raw material costs and thus decrease our gross margin.
Because we have significant international operations, we may be subject to political, economic and other conditions relating to our international operations that could increase our operating expenses and disrupt our business.
Although the majority of end users of the consumer products that incorporate our products are located in the U.S., we are dependent on sales to OEM customers, located outside of the U.S., that manufacture these consumer products. Also, we depend on a network of distributors to sell our products that also are primarily located outside of the U.S. Export sales, primarily consisting of digital cordless telephony products shipped to manufacturers in Europe and Asia, including Japan and Asia Pacific, represented 98% of our total revenues for 2009, 92% for 2008 and 98% for 2007. Furthermore, pursuant to the acquisition of the CIPT Business from NXP, we established new foreign subsidiaries, and currently have material operations, in Germany, Switzerland, Hong Kong and India and employ a number of individuals within those foreign operations. As a result, the occurrence of any negative international political, economic or geographic events, as well as our failure to mitigate the
15
Table of Contents
challenges in managing an organization operating in various countries, could result in significant revenue shortfalls and disrupt our workforce within our foreign operations. These shortfalls and disruptions could cause our business, financial condition and results of operations to be harmed. Some of the risks of doing business internationally include:
| • | unexpected changes in foreign government regulatory requirements; |
| • | fluctuations in the exchange rate for the United States dollar; |
| • | import and export license requirements; |
| • | imposition of tariffs and other barriers and restrictions; |
| • | burdens of complying with a variety of foreign laws, treaties and technical standards; |
| • | uncertainty of laws and enforcement in certain countries relating to the protection of intellectual property; |
| • | difficulty in collecting accounts receivable and longer payment cycles for international customers than existing customers; |
| • | difficulty in staffing and managing foreign operations and maintaining the morale and productivity of employees within foreign operations; |
| • | multiple and possibly overlapping tax structures and potentially adverse tax consequences; |
| • | political and economic instability; and |
| • | changes in diplomatic and trade relationships. |
One or more of these factors may have a material adverse effect on our future operations and consequently, on our business, financial conditions and operating results.
Because we depend on independent foundries to manufacture all of our integrated circuit products, we are subject to additional risks that may materially disrupt our business.
All of our integrated circuit products are manufactured by independent foundries. While these foundries have been able to adequately meet the demands of our increasing business, we are and will continue to be dependent upon these foundries to achieve acceptable manufacturing yields, quality levels and costs, and to allocate to us a sufficient portion of their foundry capacity to meet our needs in a timely manner.
While we currently believe we have adequate capacity to support our current sales levels pursuant to our arrangement with our foundries, we may encounter capacity shortage issues in the future. In the event of a worldwide shortage in foundry capacity, we may not be able to obtain a sufficient allocation of foundry capacity to meet our product needs or we may incur additional costs to ensure specified quantities of products and services. Over-capacity at the current foundries we use, or future foundries we may use, to manufacture our integrated circuit products may lead to increased operating costs and lower gross margins. In addition, such a shortage could lengthen our products’ manufacturing cycle and cause a delay in the shipment of our products to our customers. This could ultimately lead to a loss of sales of our products, harm our reputation and competitive position, and our revenues could be materially reduced. Our business could also be harmed if our current foundries terminate their relationship with us and we are unable to obtain satisfactory replacements to fulfill customer orders on a timely basis and in a cost-effective manner.
In addition, as TSMC produces a significant portion of our integrated circuit products and ASE tests and assembles a significant portion of them, earthquakes, aftershocks or other natural disasters in Asia, or adverse changes in the political situation in Taiwan, could preclude us from obtaining an adequate supply of wafers to fill customer orders. Such events could harm our reputation, business, financial condition, and results of operations.
16
Table of Contents
Because we depend on NXP to manufacture all of our products for the CIPT Business, we are subject to additional risks that may materially disrupt our business.
As part of the acquisition of the CIPT Business, we entered into a Manufacturing Services Collaboration Agreement, as amended, with NXP pursuant to which NXP agreed to provide us with specified manufacturing, pre-testing, assembling and final-testing services relating to the CIPT Business products for up to seven years following the closing of the Acquisition at predetermined costs. Products from the CIPT Business (e.g, DECT and Voice-over-Internet Protocol (VoIP) products) currently represent a substantial portion of our total revenues and are anticipated to continue to generate significant revenues for the company in future periods. While NXP has been able to generally meet our manufacturing demands to date, in some cases NXP has failed to meet its required delivery schedule and may be subject to late delivery penalties as a result. These late deliveries have not adversely impacted our ability to satisfy our customers’ requirements in a timely manner. Our business also could be materially harmed if NXP fails to achieve acceptable manufacturing yields, quality levels or allocate to us a sufficient portion of its foundry, and assembly and testing capacities to meet our needs for the CIPT Business products due to its capacity constraints, including as a result of the provision of manufacturing services to NXP’s internal business units or other third parties. We also may encounter capacity shortage issues in the future if sales for the CIPT Business products continue to increase as we anticipate and NXP cannot sufficiently meet our increasing demands. A capacity shortage could lengthen our CIPT Business products’ manufacturing cycle, cause a delay in the shipment of our products to our customers, lead to a loss of sales of our products, harm our reputation and competitive position with customers, some of whom we recently established relationships as a result of the acquisition, and our revenues could be materially reduced. Our business would be materially harmed if NXP cannot for any reason fulfill its manufacturing obligations to us under the manufacturing agreement, including due to financial or operational hardships within NXP as a result of the cyclical nature of the semiconductors industry or otherwise, and we are unable to obtain a satisfactory replacement to fulfill customer orders on a timely basis and in a cost-effective manner.
Additionally, in order to enable NXP to provide the specified manufacturing, pre-testing, assembling and final-testing services relating to the CIPT Business products to us, we provide binding capacity commitments to NXP based on a periodic rolling forecast. The manufacturing agreement with NXP provides that we may be subject to monetary penalties if we fail to meet our capacity commitments to NXP that we previously provided to them. If we fail to meet our capacity commitments due to errors in planning logistics, a decrease in forecast from our customers or other reasons, we may be subject to such monetary penalties.
Moreover, in accordance with the MSCA, NXP’s manufacturing of certain CIPT Business products would expire in 2010, subject to our ability to extend the period for two consecutive one-year terms under specified circumstances. Upon expiration as a result of our inability to extend the manufacturing period by NXP, we may experience difficulty in finding a suitable replacement manufacturer for these CIPT Business products, which may result in a disruption in product shipments, harm our customer relationships and generally disrupt our business. Even in the event we are able to find a suitable replacement manufacturer, transitioning of manufacturing processes, including re-qualification of CIPT Business Products, may be a difficult process. There are inherent and unforeseen risks and delays associated with the transfer of manufacturing capacities from one facility to another, including production and shipment delays, capacity constraints with the replacement manufacturer, IP incompatibility, logistical and administrative concerns or general difficulties associated with starting a new manufacturing process. Therefore, even with a suitable replacement manufacturer, we may experience a significant disruption in product shipments, harm to our customer relationships and generally a disruption of our business. In addition, we may incur higher manufacturing costs with the replacement manufacturer which may decrease our gross margins and generally adversely affect our results of operations.
Furthermore, NXP’s assembly and testing facility in the Philippines, where some of our products were assembled and tested by NXP pursuant to the manufacturing agreement, has been sold to STMicroelectronics. Our business also would be materially harmed if NXP cannot fulfill its assembly and testing services for the specified products as a result of the sale. There are inherent and unforeseen risks and delays associated with the transfer of assembly and testing capacities from one facility to another.
17
Table of Contents
Our operating results are affected by general economic conditions and the highly cyclical nature of the semiconductor industry.
During the global downturn that started in the second half of 2008 and continued throughout 2009, general worldwide economic conditions significantly deteriorated, and resulted in decreased consumer confidence and spending, reduced corporate profits and capital spending, adverse business conditions and liquidity concerns. These conditions made and continue to make it extremely difficult for our customers, the end-product customers, our vendors and us to accurately forecast and plan future business activities and make reliable projections. Furthermore, during challenging economic times our customers may face various economic issues, including reduced demand for their products, longer product cycles, inability to gain timely access to sufficient credit, focus on cash preservation and tighter inventory management, all of which could result in an impairment of their ability to make timely payments to us and could cause reduced spending on our products. In 2009, we experienced a decrease of 31% in total revenues from 2008. Although business conditions improved during the second half of 2009, that trend may not continue.
Moreover, we operate within the semiconductor industry which experiences significant fluctuations in sales and profitability. The industry was materially adversely affected by the 2008-2009 global downturn. Downturns in the semiconductor industry are characterized by diminished product demand, excess customer inventories, accelerated erosion of prices and excess production capacity. These factors could cause substantial fluctuations in our revenues and in our results of operations.
If global economic and market conditions remain uncertain or persist, spread or deteriorate further, we could experience a material adverse impact on our business and results of operations.
Because the manufacture of our products is complex, the foundries on which we depend may not achieve the necessary yields or product reliability that our business requires.
The manufacture of our products is a highly complex and precise process, requiring production in a highly controlled environment. Changes in manufacturing processes or the inadvertent use of defective or contaminated materials by a foundry could adversely affect the foundry’s ability to achieve acceptable manufacturing yields and product reliability. If the foundries we currently use do not achieve the necessary yields or product reliability, our ability to fulfill our customers’ needs could suffer. This could ultimately lead to a loss of sales of our products and have a negative effect on our gross margins and results of operations.
Furthermore, there are other significant risks associated with relying on these third-party foundries, including:
| • | risks due to the fact that we have reduced control over production cost, delivery schedules and product quality; |
| • | less recourse if problems occur as the warranties on wafers or products supplied to us are limited; and |
| • | increased exposure to potential misappropriation of our intellectual property. |
As we depend on independent subcontractors, located in Asia, to assemble and test our semiconductor products, we are subject to additional risks that may materially disrupt our business.
Independent subcontractors, located in Asia, assemble and test our semiconductor products. Because we rely on independent subcontractors to perform these services, we cannot directly control our product delivery schedules or quality levels. We are dependent on these subcontractors to allocate to us a sufficient portion of their capacity to meet our needs in a timely manner. Our future success also depends on the financial viability of our independent subcontractors. If the capital structures of our independent subcontractors weaken, we may experience product shortages, production delays, quality assurance problems, increased manufacturing costs, and/or supply chain disruption. All of this could ultimately lead to a loss of sales of our products, harm our reputation and competitive position, and our revenues could be materially harmed.
18
Table of Contents
Moreover, the economic, market, social, and political situations in countries where some of our independent subcontractors are located are unpredictable, can be volatile, and can have a significant impact on our business because we may not be able to obtain product in a timely manner. Market and political conditions, including currency fluctuation, terrorism, political strife, war, labor disruption, and other factors, including natural or man-made disasters, adverse changes in tax laws, tariff, import or export quotas, power and water shortages, or interruption in air transportation, in areas where our independent subcontractors are located also could have a severe negative impact on our operating capabilities.
In order to sustain the future growth of our business, we must penetrate new markets and our new products must achieve widespread market acceptance.
In order to increase our sales volume and expand our business, we must penetrate new markets and introduce new products. We are exploring opportunities to expand sales of our products to China, Korea and South America. However, there are no assurances that we will gain significant market share in those competitive markets. In addition, many North American, European and Japanese OEMs are moving their manufacturing sites to Southeast Asia as a result of the cyclical nature of manufacturing capacity issues and cost of silicon integrated circuits, the continued decline of average selling prices of chipsets and other industry-wide factors. This trend may cause the mix of our OEM customers to change in the future, thereby further necessitating our need to penetrate new markets. Furthermore, to sustain the future growth of our business, we need to introduce new products as sales of our older products taper off. Moreover, the penetration of new competitive markets and introduction of new products could require us to reduce the sale prices of our products or increase the cost per product and thus reducing our total gross profit in future periods. As an example, we introduced to the market the XpandR platform that integrates DECT and Wi-Fi capabilities to enable multimedia and web-related applications in our future products. Our future growth is dependent on market acceptance and penetration of the XpandR-based products, for which we can provide no assurances. Our inability to penetrate the market or lack of customer acceptance of these products may harm our business and potential growth.
We are subject to order and shipment uncertainties and if we are unable to accurately predict customer demand, our business may be harmed.
We typically sell products pursuant to purchase orders rather than long-term purchase commitments. Customers can generally cancel, change or defer purchase orders on short notice without incurring a significant penalty. Given current market conditions, we have less ability to accurately predict what or how many products our customers will need in the future. In addition, we have little visibility into and no control of the demand by our customer’s customers—generally consumer electronics retailers. A decrease in the consumer electronics retailers’ demand or a build up of their inventory, both of which are out of our control, may cause a cancellation, change or deferral of purchase orders on at short notice by our customers. Anticipating demand is difficult because our customers and their customers face volatile pricing and unpredictable demand for their own products, and are increasingly focused on cash preservation and tighter inventory management. We place orders with our suppliers based on forecasts of our customers’ demand and, in some instances, may establish buffer inventories to accommodate anticipated demand. Our forecasts are based on multiple assumptions, each of which may introduce error into our estimates. If we overestimate our customers’ demand or our customers overestimate their demand, we may allocate resources to manufacturing products that we may not be able to sell when we expect to, if at all. As a result, we could hold excess or obsolete inventory, which would reduce our profit margins and adversely affect our financial results. Conversely, if we underestimate our customers’ demand or our customers underestimate their demand and insufficient manufacturing capacity is available, we could forego revenue opportunities and potentially lose market share and damage our customer relationships.
As a result of the acquisition of NXP’s CIPT Business, we now maintain inventory, or hubbing, arrangements with certain of our customers. Pursuant to these arrangements, we deliver products to a customer or a designated third party warehouse based upon the customer’s projected needs, but do not recognize product revenue unless and until the customer reports that it has removed our product from the warehouse to incorporate
19
Table of Contents
into its end products. Since we own inventory that is physically located in a third party’s warehouse, our ability to effectively manage inventory levels may be impaired, causing our total inventory turns to decrease, which could increase expenses associated with excess and obsolete product and negatively impact our cash flow.
We are dependent on a small number of OEM customers, and our business could be harmed by the loss of any of these customers or reductions in their purchasing volumes.
We sell our products to a limited number of OEM customers directly or through a network of distributors. Moreover, many North American, European and Japanese OEMs are moving their manufacturing sites to Southeast Asia, as a result of the cyclical nature of manufacturing capacity issues and cost of silicon integrated circuits, the continued decline of average selling prices of chipsets and other industry-wide factors. In addition, OEMs located in Southeast Asia are growing and gaining competitive strength. As a result, the mix of our OEM customers may change in the future. However, we may not succeed in attracting new customers as these potential customers may have pre-existing relationships with our current or potential competitors. This trend also may promote the consolidation of OEMs located in North America, Europe and Japan with OEMs located in Southeast Asia, which may reduce the number of our potential customers and reduce the volume of chipsets the combined OEM customer may purchase from us. However, as is common in our industry, we typically do not enter into long term contracts with our customers in which they commit to purchase products from us. The loss of any of our OEM customers may have a material adverse effect on our results of operations. To attract new customers, we may be faced with intense price competition, which may affect our revenues and gross margins.
There are several emerging market trends that may challenge our ability to continue to grow our business.
We believe new technological developments in the home connectivity market may adversely affect our operating results. For example, the rapid deployment of new communication access methods, including mobile, wireless broadband, cable and other connectivity, as well as the projected lack of growth in products using fixed-line telephony would reduce our total revenues derived from, and unit sales of, cordless fixed-line telephony products. Our ability to maintain our growth will depend on the expansion of our product lines to capitalize on the emerging access methods and on our success in developing and selling a portfolio of “system-on-a-chip” solutions that integrate video, voice, data and communication technologies in a wider multimedia market, as well as on our success in developing and selling DECT, XpandR and video products. We cannot assure you that we will succeed in expanding our product lines or portfolio of “system-on-a-chip” solutions, or that they would receive market acceptance.
Furthermore, there is a growing threat from alternative technologies accelerating the decline of the fixed-line telephony market. This competition comes from mobile telephony, including emerging dual-mode mobile Wi-Fi phones, and other innovative applications, such as Skype and iChat. Given that we derive a significant amount of revenues from chipsets incorporated into fixed-line telephony products, if we are unable to develop new technologies in the face of the decline of this market, our business could be materially adversely affected.
The possible emerging trend of our OEM customers outsourcing their production may cause our revenue to decline.
We believe there may be an emerging trend of our OEM customers outsourcing their production to third parties. We have invested substantial resources to build relationships with our OEM customers. However the outsourcing companies whom our OEM customers may choose to outsource production may not have prior business relationship with us or may instead have prior or ongoing relationships with our competitors. The emergence of this trend may require us to expend substantial additional resources to build relationships with these outsourcing companies, which would increase our operating expenses. Even if we do expend such resources, there are no assurances that these outsourcing companies will choose to incorporate our chipsets rather than chipsets of our competitors. Our inability to retain an OEM customer once such customer chooses to outsource production would have a material adverse effect on our future revenue.
20
Table of Contents
Because we have significant operations in Israel, we may be subject to political, economic and other conditions affecting Israel that could increase our operating expenses and disrupt our business.
Our principal research and development facilities are located in the State of Israel and, as a result, at December 31, 2009, 268 of our 409 employees were located in Israel, including 180 out of 256 of our research and development personnel. In addition, although we are incorporated in Delaware, a majority of our directors and executive officers are residents of Israel. Although substantially all of our sales currently are being made to customers outside of Israel, we are nonetheless directly influenced by the political, economic and military conditions affecting Israel. Any major hostilities involving Israel, or the interruption or curtailment of trade between Israel and its present trading partners, could significantly harm our business, operating results and financial condition.
Israel’s economy has been subject to numerous destabilizing factors, including a period of rampant inflation in the early to mid-1980s, low foreign exchange reserves, fluctuations in world commodity prices, military conflicts and civil unrest. In addition, Israel and companies doing business with Israel have been the subject of an economic boycott by the Arab countries since Israel’s establishment. Although they have not done so to date, these restrictive laws and policies may have an adverse impact on our operating results, financial condition or expansion of our business.
Since the establishment of the State of Israel in 1948, a state of hostility has existed, varying in degree and intensity, between Israel and the Arab countries. Although Israel has entered into various agreements with certain Arab countries and the Palestinian Authority, and various declarations have been signed in connection with efforts to resolve some of the economic and political problems in the Middle East, hostilities between Israel and some of its Arab neighbors have recently escalated and intensified. We cannot predict whether or in what manner these conflicts will be resolved. Our results of operations may be negatively affected by the obligation of key personnel to perform military service. In addition, certain of our officers and employees are currently obligated to perform annual reserve duty in the Israel Defense Forces and are subject to being called for active military duty at any time. Although we have operated effectively under these requirements since our inception, we cannot predict the effect of these obligations on the company in the future. Our operations could be disrupted by the absence, for a significant period, of one or more of our officers or key employees due to military service.
The tax benefits available to us under Israeli law require us to meet several conditions, and may be terminated or reduced in the future, which would increase our taxes.
Our facilities in Israel have been granted Approved Enterprise and Beneficiary Enterprise status under the Law for the Encouragement of Capital Investments, 1959, commonly referred to as the Investment Law, and as amended. The Investment Law provides that capital investments in a production facility (or other eligible assets) may be designated as an Approved Enterprise. Under that law, we receive certain tax benefits in Israel. To be eligible for tax benefits, we must meet certain conditions, relating principally to adherence to the investment program filed with the Investment Center of the Israeli Ministry of Industry and Trade and to periodic reporting obligations. Although we believe we have met such conditions in the past, should we fail to meet such conditions in the future, we would be subject to corporate tax in Israel at the standard corporate tax rate (25% for 2010) and could be required to refund tax benefits already received. We cannot assure you that such grants and tax benefits will be continued in the future at their current levels, if at all. The tax benefits under these investment plans are scheduled to gradually expire by 2015. The termination or reduction of certain programs and tax benefits (particularly benefits available to us as a result of the Approved Enterprise status of our facilities and programs) or a requirement to refund tax benefits already received may have a material adverse effect on our business, operating results and financial condition.
On April 1, 2005, an amendment to the Investment Law came into effect. The amendment revised the criteria for investments qualified to receive tax benefits. An eligible investment program under the amendment will qualify for benefits as a Beneficiary Enterprise (rather than the previous terminology of Approved Enterprise). Among other things, the amendment provides tax benefits to both local and foreign investors and
21
Table of Contents
simplifies the approval process. The amendment does not apply to investment programs approved prior to December 31, 2004. The new tax regime applies to new investment programs only. We believe that we are currently in compliance with these requirements. However, if we fail to meet these requirements, we would be subject to corporate tax in Israel at the regular statutory rate (25% for 2010). We also could be required to refund tax benefits, with interest and adjustments for inflation based on the Israeli consumer price index.
We may engage in future acquisitions that could dilute our stockholders’ equity and harm our business, results of operations and financial condition.
We have pursued, and will continue to pursue, growth opportunities through internal development and acquisition of complementary businesses, products and technologies. We are unable to predict whether or when any other prospective acquisition will be completed. The process of integrating an acquired business may be prolonged due to unforeseen difficulties and may require a disproportionate amount of our resources and management’s attention. We cannot assure you that we will be able to successfully identify suitable acquisition candidates, complete acquisitions, integrate acquired businesses into our operations, or expand into new markets. Further, once integrated, acquisitions may not achieve comparable levels of revenues, profitability or productivity as our existing business or otherwise perform as expected. The occurrence of any of these events could harm our business, financial condition or results of operations. Future acquisitions may require substantial capital resources, which may require us to seek additional debt or equity financing.
Future acquisitions by us could result in the following, any of which could seriously harm our results of operations or the price of our stock:
| • | issuance of equity securities that would dilute our current stockholders’ percentages of ownership; |
| • | large one-time write-offs; |
| • | the incurrence of debt and contingent liabilities; |
| • | difficulties in the assimilation and integration of operations, personnel, technologies, products and information systems of the acquired companies; |
| • | diversion of management’s attention from other business concerns; |
| • | contractual disputes; |
| • | risks of entering geographic and business markets in which we have no or only limited prior experience; and |
| • | potential loss of key employees of acquired organizations. |
Third party claims of infringement or other claims against us could adversely affect our ability to market our products, require us to redesign our products or seek licenses from third parties, and seriously harm our operating results and disrupt our business.
As is typical in the semiconductor industry, we and our customers have been and may from time to time be notified of claims that we may be infringing patents or intellectual property rights owned by third parties. For example, in a lawsuit against Microsoft Corporation, AT&T asserted that our TrueSpeech 8.5 algorithm includes certain elements covered by a patent held by AT&T. AT&T sued Microsoft, one of our TrueSpeech 8.5 licensees, for infringement. We were not named in AT&T’s suit against Microsoft. In addition, patent infringement claims are increasingly being asserted by patent holding companies (so-called patent “trolls”), which do not use technology and whose sole business is to enforce patents against companies, such as us, for monetary gain. Because such patent holding companies do not provide services or use technology, the assertion of our own patents by way of counter-claim may be ineffective. We have received claims that our products infringe upon the proprietary rights of such patent holding companies. In addition, third parties have asserted and may in the future assert intellectual property infringement claims against our customers, which we have agreed in certain
22
Table of Contents
circumstances to indemnify and defend against such claims. If litigation becomes necessary to determine the validity of any third party claims, it could result in significant expense to us and could divert the efforts of our technical and management personnel, whether or not the claim has merit and notwithstanding that the litigation is determined in our favor.
If it appears necessary or desirable, we may try to obtain licenses for those patents or intellectual property rights that we are allegedly infringing. Although holders of these types of intellectual property rights commonly offer these licenses, we cannot assure you that licenses will be offered or that the terms of any offered licenses will be acceptable to us. Our failure to obtain a license for key intellectual property rights from a third party for technology used by us could cause us to incur substantial liabilities, suspend the manufacturing of products utilizing the technology or damage the relationship with our customers. Alternatively, we could be required to expend significant resources to develop non-infringing technology. We cannot assure you that we would be successful in developing non-infringing technology. The occurrence of any of these events could harm our business, financial condition or results of operations.
We may not be able to adequately protect or enforce our intellectual property rights, which could harm our competitive position.
Our success and ability to compete is in part dependent upon our internally-developed technology and other proprietary rights, which we protect through a combination of copyright, trademark and trade secret laws, as well as through confidentiality agreements and licensing arrangements with our customers, suppliers, employees and consultants. In addition, we have filed a number of patents in the United States and in other foreign countries with respect to new or improved technology that we have developed. However, the status of any patent involves complex legal and factual questions, and the breadth of claims allowed is uncertain. Accordingly, we cannot assure you that any patent application filed by us will result in a patent being issued, or that the patents issued to us will not be infringed by others. Also, our competitors and potential competitors may develop products with similar technology or functionality as our products, or they may attempt to copy or reverse engineer aspects of our product line or to obtain and use information that we regard as proprietary. Moreover, the laws of certain countries in which our products are or may be developed, manufactured or sold, including Hong Kong, Japan, Korea and Taiwan, may not protect our products and intellectual property rights to the same extent as the laws of the United States. Policing the unauthorized use of our products is difficult and may result in significant expense to us and could divert the efforts of our technical and management personnel. Even if we spend significant resources and efforts to protect our intellectual property, we cannot assure you that we will be able to prevent misappropriation of our technology. Use by others of our proprietary rights could materially harm our business and expensive litigation may be necessary in the future to enforce our intellectual property rights.
Because our products are complex, the detection of errors in our products may be delayed, and if we deliver products with defects, our credibility will be harmed, the sales and market acceptance of our products may decrease and product liability claims may be made against us.
Our products are complex and may contain errors, defects and bugs when introduced. If we deliver products with errors, defects or bugs, our credibility and the market acceptance and sales of our products could be significantly harmed. Furthermore, the nature of our products may also delay the detection of any such error or defect. If our products contain errors, defects and bugs, then we may be required to expend significant capital and resources to alleviate these problems. This could result in the diversion of technical and other resources from our other development efforts. Any actual or perceived problems or delays may also adversely affect our ability to attract or retain customers. Furthermore, the existence of any defects, errors or failures in our products could lead to product liability claims or lawsuits against us or against our customers. We generally provide our customers with a standard warranty for our products, generally lasting one year from the date of purchase. Although we attempt to limit our liability for product defects to product replacements, we may not be successful, and customers may sue us or claim liability for the defective products. A successful product liability claim could result in substantial cost and divert management’s attention and resources, which would have a negative impact on our financial condition and results of operations.
23
Table of Contents
We are exposed to the credit risk of our customers and to credit exposures in weakened markets, which could result in material losses.
Most of our sales are on an open credit basis. Because of current conditions in the global economy, our exposure to credit risks relating to sales on an open credit basis has increased. We expect demand for enhanced open credit terms, for example, longer payment terms, to continue and believe that such arrangements are a competitive factor in obtaining business. Although we monitor and attempt to mitigate credit risks, including through insurance coverage from time to time, there can be no assurance that our efforts will be effective. Moreover, even if we attempt to mitigate credit risks through insurance coverage, such coverage may not be sufficient to cover all of our losses and we would be subject to a deductible under any insurance coverage. Furthermore, as part of the acquisition of the CIPT Business from NXP, we increased our customer base with new customers in Europe and Asia. As a result, our future credit risk exposure may increase. Although any losses to date relating to credit exposure of our customers have not been material, future losses, if incurred, could harm our business and have a material adverse effect on our operating results and financial condition. Moreover, the loss of a customer due to its financial default also could harm our future business and potential growth.
Our executive officers and key personnel are critical to our business, and because there is significant competition for personnel in our industry, we may not be able to attract and retain such qualified personnel.
Our success depends to a significant degree upon the continued contributions of our executive management team, and our technical, marketing, sales customer support and product development personnel. The loss of significant numbers of such personnel could significantly harm our business, financial condition and results of operations. We do not have any life insurance or other insurance covering the loss of any of our key employees. Because our products are specialized and complex, our success depends upon our ability to attract, train and retain qualified personnel, including qualified technical, marketing and sales personnel. However, the competition for personnel is intense and we may have difficulty attracting and retaining such personnel.
We may have exposure to additional tax liabilities as a result of our foreign operations.
We are subject to income taxes in both the United States and various foreign jurisdictions. In addition to our significant operations in Israel, pursuant to the acquisition of the CIPT Business from NXP, we currently have operations in Germany, Switzerland, Hong Kong and India. Significant judgment is required in determining our worldwide provision for income taxes and other tax liabilities. In the ordinary course of a global business, there are many intercompany transactions and calculations where the ultimate tax determination is uncertain. We are regularly under audit by tax authorities. Our intercompany transfer pricing may be reviewed by the U.S. Internal Revenue Service and by foreign tax jurisdictions. Although we believe that our tax estimates are reasonable, due to the complexity of our corporate structure, the multiple intercompany transactions and the various tax regimes, we cannot assure you that a tax audit or tax dispute to which we may be subject will result in a favorable outcome for us. If taxing authorities do not accept our tax positions and impose higher tax rates on our foreign operations, our overall tax expenses could increase.
Legislative action in the United States could materially and adversely affect us from a tax perspective.
Legislative action may be taken by the U.S. Congress which, if ultimately enacted, would adversely affect our effective tax rate and/or require us to take further action, at potentially significant expense, to seek to preserve our effective tax rate. In 2009 and 2010, President Obama’s administration announced budgets, which included proposed future tax legislation that could substantially modify the rules governing the U.S. taxation of certain non-U.S. affiliates. These potential changes include, but are not limited to, curbing the deferral of U.S. taxation of certain foreign earnings and limiting the ability to use foreign tax credits. Many details of the proposal remain unknown, and any legislation enacting such modifications would require Congressional support and approval. We cannot predict the outcome of any specific legislative proposals. However, if any of these proposals are enacted into law, they could significantly impact our effective tax rate.
24
Table of Contents
We are exposed to fluctuations in currency exchange rates.
A significant portion of our business is conducted outside the United States. Export sales to manufacturers in Europe and Asia, including Japan and Asia Pacific, represented 98% of our total revenues for 2009. Although most of our revenue and expenses are transacted in U.S. dollars, we may be exposed to currency exchange fluctuations in the future as business practices evolve and we are forced to transact business in local currencies. Moreover, part of our expenses in Israel are paid in Israeli currency, which subjects us to the risks of foreign currency fluctuations between the U.S. dollar and the New Israeli Shekel (NIS) and to economic pressures resulting from Israel’s general rate of inflation. Our primary expenses paid in NIS are employee salaries and lease payments on our Israeli facilities. Furthermore, due to the acquisition of the CIPT Business from NXP, a portion of our expenses for our European operations are paid in the Euro and Swiss Franc, which subjects us to the risks of foreign currency fluctuations between the U.S. dollar and the Euro and Swiss Franc. Our primary expenses paid in the Euro and Swiss Franc are employee salaries, lease and operational payments on our European facilities. As a result, an increase in the value of the NIS, Euro and Swiss Franc in comparison to the U.S. dollar, which has been the trend in most of the year due to the devaluation of the U.S. dollar, could increase the cost of our technology development, research and development expenses and general and administrative expenses, all of which could harm our operating profit. From time to time, we use derivative instruments in order to minimize the effects of currency fluctuations, but our hedging positions may be partial, may not exist at all in the future or may not succeed in minimizing our foreign currency fluctuation risks. Our financial results may be harmed if the trend relating to the devaluation of the U.S. dollars continues for an extended period.
Because the markets in which we compete are subject to rapid changes, our products may become obsolete or unmarketable.
The markets for our products and services are characterized by rapidly changing technology, short product life cycles, evolving industry standards, changes in customer needs, demand for higher levels of integration, growing competition and new product introductions. Our future growth is dependent not only on the continued success of our existing products but also successful introduction of new products. Our ability to adapt to changing technology and anticipate future standards, and the rate of adoption and acceptance of those standards, will be a significant factor in maintaining or improving our competitive position and prospects for growth. If new industry standards emerge, our products or our customers’ products could become unmarketable or obsolete, and we could lose market share. We may also have to incur substantial unanticipated costs to comply with these new standards. If our product development and improvements take longer than planned, the availability of our products would be delayed. Any such delay may render our products obsolete or unmarketable, which would have a negative impact on our ability to sell our products and our results of operations.
Because of changing customer requirements and emerging industry standards, we may not be able to achieve broad market acceptance of our products. Our success is dependent, in part, on our ability to:
| • | successfully develop, introduce and market new and enhanced products at competitive prices and in a timely manner in order to meet changing customer needs; |
| • | convince leading OEMs to select our new and enhanced products for design into their own new products; |
| • | respond effectively to new technological changes or new product announcements by others; |
| • | effectively use and offer leading technologies; and |
| • | maintain close working relationships with our key customers. |
There are no assurances that we will be successful in these pursuits, that the demand for our products will continue or that our products will achieve market acceptance. Our failure to develop and introduce new products that are compatible with industry standards and that satisfy customer requirements, and the failure of our products to achieve broad market acceptance, could have a negative impact on our ability to sell our products and our results of operations.
25
Table of Contents
Because the markets in which we compete are highly competitive, and many of our competitors have greater resources than we do, we cannot be certain that our products will be accepted in the marketplace or capture market share.
The markets in which we operate are extremely competitive and characterized by rapid technological change, evolving standards, short product life cycles and price erosion. We expect competition to intensify as current competitors expand their product offerings and new competitors enter the market. Given the highly competitive environment in which we operate, we cannot be sure that any competitive advantages enjoyed by our current products would be sufficient to establish and sustain our new products in the market. Any increase in price or competition could result in the erosion of our market share, to the extent we have obtained market share, and would have a negative impact on our financial condition and results of operations.
In each of our business activities, we face current and potential competition from competitors that have significantly greater financial, technical, manufacturing, marketing, sales and distribution resources and management expertise than we do. These competitors may also have pre-existing relationships with our customers or potential customers. Further, in the event of a manufacturing capacity shortage, these competitors may be able to manufacture products when we are unable to do so. Our principal competitors in the cordless market include Lantiq (formerly Infineon) and SiTel (formerly the DECT division of National Semiconductor). Our principal competitors in the VoIP market include Broadcom, Infineon, SiTel, Texas Instruments and new Taiwanese IC vendors. Our principal competitors in the multimedia market include Wi-Fi and multimedia application processor IC vendors like Atheros, Broadcom, CSR, Freescale, Intel, Marvel, Ralink, Samsung and Texas Instruments.
As discussed above, various new developments in the home residential market may require us to enter into new markets with competitors that have more established presence, and significantly greater financial, technical, manufacturing, marketing, sales and distribution resources and management expertise than we do. The expenditure of greater resources to expand our current product lines and develop a portfolio of “system-on-a-chip” solutions that integrate video, voice, data and communication technologies in a wider multimedia market may increase our operating expenses and reduce our gross profit. We cannot assure you that we will succeed in developing and introducing new products that are responsive to market demands.
An unfavorable government review of our federal income tax returns or changes in our effective tax rates could adversely affect our operating results.
Our future effective tax rates could be adversely affected by earnings being lower than anticipated in countries where we have lower statutory rates and higher than anticipated in countries where we have higher statutory rates, by changes in the valuation of our deferred tax assets and liabilities, or by changes in tax laws, regulations, accounting principles or interpretations thereof. In addition, we are subject to the periodic examination of our income tax returns by the IRS and other tax authorities. We regularly assess the likelihood of adverse outcomes resulting from these examinations to determine the adequacy of our provision for income taxes. The outcomes from these examinations may have an adverse effect on our operating results and financial condition.
We may experience difficulties in transitioning to smaller geometry process technologies or in achieving higher levels of design integration, which may result in reduced manufacturing yields, delays in product deliveries and increased expenses.
A growing trend in our industry is the integration of greater semiconductor content into a single chip to achieve higher levels of functionality. In order to remain competitive, we must achieve higher levels of design integration and deliver new integrated products on a timely basis. This will require us to expend greater research and development resources, and may require us to modify the manufacturing processes for some of our products, to achieve greater integration. We periodically evaluate the benefits, on a product-by-product basis, of migrating to smaller geometry process technologies to reduce our costs. Although this migration to smaller geometry
26
Table of Contents
process technologies has helped us to offset the declining average selling prices of our products, this effort may not continue to be successful. Also, because we are a fabless semiconductor company, we depend on our foundries to transition to smaller geometry processes successfully. We cannot assure you that our foundries will be able to effectively manage the transition. In case our foundries or we experience significant delays in this transition or fail to efficiently implement this transition, our business, financial condition and results of operations could be materially and adversely affected.
Our certificate of incorporation and bylaws contain anti-takeover provisions that could prevent or discourage a third party from acquiring us.
Our certificate of incorporation and bylaws contain provisions that may prevent or discourage a third party from acquiring us, even if the acquisition would be beneficial to our stockholders. We have a staggered board, which means it will generally take two years to change the composition of our board. Our board of directors also has the authority to fix the rights and preferences of shares of our preferred stock and to issue such shares without a stockholder vote. It is possible that these provisions may prevent or discourage third parties from acquiring us, even if the acquisition would be beneficial to our stockholders. In addition, these factors may also adversely affect the market price of our common stock, and the voting and other rights of the holders of our common stock.
Our stock price may be volatile so you may not be able to resell your shares of our common stock at or above the price you paid for them.
Announcements of developments related to our business, announcements by competitors, quarterly fluctuations in our financial results, changes in the general conditions of the highly dynamic industry in which we compete or the national economies in which we do business, and other factors could cause the price of our common stock to fluctuate, perhaps substantially. In addition, in recent years, the stock market has experienced extreme price fluctuations, which have often been unrelated to the operating performance of affected companies. These factors and fluctuations could have a material adverse effect on the market price of our common stock.
| Item 1B. | UNRESOLVED STAFF COMMENTS. |
None.
| Item 2. | PROPERTIES. |
Our principal executive offices in the United States are located in San Jose, California, where we lease approximately 3,800 square feet under a lease that expires in February 2011. Portions of our operations are located in leased facilities in Rancho Cordova, California; Colorado Springs, Colorado; and Bloomington, Minnesota. These facilities are leased through 2011. Our operations in Israel are located in leased facilities, with the primary leased facility of approximately 58,136 square feet located in Herzelia Pituach, Israel. These facilities are leased through November 2013. The Company’s subsidiary in Tokyo, Japan has a lease that terminates in October 2010. The Company’s subsidiary in Scotland has lease agreements for its facilities that terminate in 2010. The Company’s subsidiaries in Germany, India and Switzerland, primarily housing the CIPT Business acquired from NXP, have sublease agreements with NXP for their facilities that terminate from 2010 through 2012. In addition, the Company’s subsidiary in Hong Kong entered into a lease agreement that is effective until 2010. We believe that our existing facilities are adequate to meet our needs for the immediate future.
| Item 3. | LEGAL PROCEEDINGS. |
From time to time, we may become involved in litigation relating to claims arising from our ordinary course of business activities. Also, as is typical in the semiconductor industry, we have been and may from time to time be notified of claims that we may be infringing patents or intellectual property rights owned by third parties. For example, in a lawsuit against Microsoft Corporation, AT&T asserted that our TrueSpeech 8.5 algorithm includes
27
Table of Contents
certain elements covered by a patent held by AT&T. AT&T sued Microsoft, one of our TrueSpeech 8.5 licensees, for infringement. We were not named in AT&T’s suit against Microsoft. We currently believe that there are no claims or actions pending or threatened against us, the ultimate disposition of which would have a material adverse effect on us.
| Item 4. | RESERVED. |
28
Table of Contents
PART II
| Item 5. | MARKET FOR REGISTRANT’S COMMON EQUITY, RELATED STOCKHOLDER MATTERS AND ISSUER PURCHASES OF EQUITY SECURITIES. |
Our common stock, par value $0.001, trades on the NASDAQ Global Select Market (NASDAQ symbol “DSPG”). The following table presents for the periods indicated the high and low sales prices for our common stock as reported by the NASDAQ Global Select Market:
| Year Ended December 31, 2009 |
High | Low | ||
| First Quarter |
8.54 | 3.83 | ||
| Second Quarter |
7.86 | 4.09 | ||
| Third Quarter |
9.41 | 6.74 | ||
| Fourth Quarter |
8.43 | 5.27 | ||
| Year Ended December 31, 2008 |
High | Low | ||
| First Quarter |
13.18 | 9.305 | ||
| Second Quarter |
14.16 | 6.67 | ||
| Third Quarter |
8.41 | 6.70 | ||
| Fourth Quarter |
8.07 | 4.64 | ||
As of March 10, 2010, there were 23,125,431 shares of common stock outstanding, representing approximately 47 holders of record. There were we believe approximately 2,962 beneficial holders as of February 18, 2010. We have never paid cash dividends on our common stock and presently intend to continue a policy of retaining any earnings for reinvestment in our business.
Equity Compensation Plan Information
Information relating to our equity compensation plans will be presented under the caption “Equity Compensation Plan Information” of our definitive proxy statement pursuant to Regulation 14A in connection with the annual meeting of stockholders to be held on May 24, 2010. The definitive proxy statement will be filed with the Securities and Exchange Commission no later than 120 days after the end of the fiscal year covered by this report. Such information is incorporated herein by reference.
Issuer Purchases of Equity Securities
There were no repurchases of our common stock pursuant to our board authorized share repurchase program during the fourth quarter of 2009.
In March 1999, our board of directors authorized the repurchase of up to 4.0 million shares of our common stock. In July 2003, October 2004, January 2007 and January 2008, our board authorized an additional 2.5 million shares, 2.5 million shares, 3.0 million shares and 2.9 million shares of our common stock, respectively, for repurchase. The number of shares authorized for repurchase after giving affect to the January 2008 board approval was 5.1 million shares. Also in January 2008, our board of directors approved the company’s entry into a share repurchase plan in accordance with Rule 10b5-1 of the United States Securities Exchange Act of 1934, as amended, for up to 5 million shares of the 5.1 million shares of our common stock authorized for repurchase, which plan expired in October 2008.
At December 31, 2009, 255,488 shares of our common stock remained available for repurchase under our board authorized share repurchase program. The repurchase program is being affected from time to time, depending on market conditions and other factors, through open market purchases and privately negotiated transactions. The repurchase program has no set expiration or termination date.
Information relating to our equity compensation plans will be presented under the caption “Equity Compensation Plan Information” of our definitive proxy statement pursuant to Regulation 14A in connection with the annual meeting of stockholders to be held on May 24, 2010. The definitive proxy statement will be filed with the Securities and Exchange Commission no later than 120 days after the end of the fiscal year covered by this report. Such information is incorporated herein by reference.
29
Table of Contents
Stock Performance Graph
Notwithstanding anything to the contrary set forth in any of the Company’s previous or future filings under the Securities Act of 1933, as amended, or the Securities Exchange Act of 1934, as amended, that might incorporate this proxy statement or future filings made by the Company under those statutes, the Stock Performance Graph shall not be deemed filed with the United States Securities and Exchange Commission and shall not be deemed incorporated by reference into any of those prior filings or into any future filings made by the Company under those statutes.
The graph below compares the cumulative total stockholder return on our common stock with the cumulative total return on the Standard & Poor’s 500 Index and Standard & Poor’s Information Technology Index. The period shown commences on December 31, 2004 and ends on December 31, 2009, the end of our last fiscal year. The graph assumes an investment of $100 on December 31, 2004, and the reinvestment of any dividends.
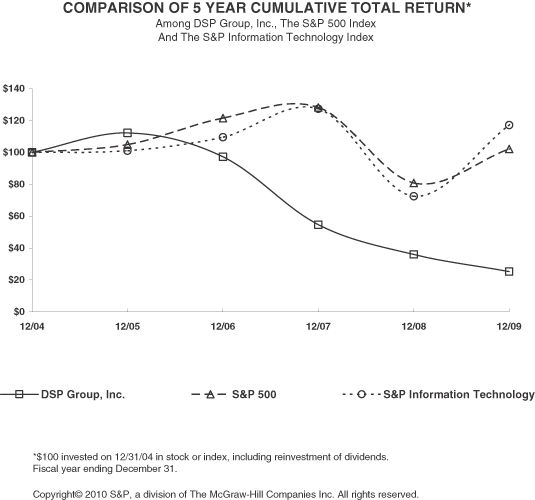
Comparisons in the graph above are based upon historical data and are not indicative of, nor intended to forecast, future performance of our common stock.
30
Table of Contents
| Item 6. | SELECTED FINANCIAL DATA. |
The selected historical consolidated financial data presented below is derived from our consolidated financial statements. The selected consolidated financial data set forth below is qualified in its entirety by, and should be read in conjunction with, our consolidated financial statements for the year ended December 31, 2009, and the discussion of our business, operations and financial results in the section captioned, “Management’s Discussion and Analysis of Financial Condition and Results of Operations.”
| Year Ended December 31, | ||||||||||||||||||
| 2009 | 2008 | 2007 | 2006 | 2005 | ||||||||||||||
| (U.S. dollars in thousands) | ||||||||||||||||||
| Statements of Operations Data: |
||||||||||||||||||
| Revenues |
$ | 212,186 | $ | 305,800 | $ | 248,788 | $ | 216,948 | $ | 187,225 | ||||||||
| Cost of revenues |
133,590 | 191,811 | 148,075 | 128,559 | 101,074 | |||||||||||||
| Gross profit |
78,596 | 113,989 | 100,713 | 88,389 | 86,151 | |||||||||||||
| Operating expenses |
||||||||||||||||||
| Research and development |
56,148 | 73,856 | 58,488 | 47,525 | 40,290 | |||||||||||||
| General, administrative, sales and marketing |
33,117 | 40,583 | 33,674 | 27,443 | 20,517 | |||||||||||||
| In process research and development write-off |
— | — | 10,350 | — | — | |||||||||||||
| Amortization of intangible assets |
12,258 | 22,853 | 11,102 | — | — | |||||||||||||
| Impairment of goodwill and other intangible assets |
— | 181,534 | — | — | — | |||||||||||||
| Restructuring cost |
— | 1,870 | — | — | — | |||||||||||||
| Total operating expenses |
101,523 | 320,696 | 113,614 | 74,968 | 60,807 | |||||||||||||
| Operating (loss) income |
(22,927 | ) | (206,707 | ) | (12,901 | ) | 13,421 | 25,344 | ||||||||||
| Financial and other income |
||||||||||||||||||
| Financial income, net |
2,857 | 160 | 10,541 | 13,198 | 10,166 | |||||||||||||
| Income (loss) before taxes on income (loss) |
(20,070 | ) | (206,547 | ) | (2,360 | ) | 26,619 | 35,510 | ||||||||||
| Taxes on income (loss) |
(11,634 | ) | 5,847 | 2,393 | 4,240 | 6,037 | ||||||||||||
| Net income (loss) |
$ | (8,436 | ) | $ | (212,394 | ) | $ | (4,753 | ) | $ | 22,379 | $ | 29,473 | |||||
| Weighted average number of Common Stock outstanding during the period used to compute basic net earnings per share |
23,655 | 28,387 | 29,495 | 29,343 | 28,435 | |||||||||||||
| Weighted average number of Common Stock outstanding during the period used to compute diluted net earnings per share |
23,655 | 28,387 | 29,495 | 30,049 | 29,843 | |||||||||||||
| Basic net earnings (loss) per share |
$ | (0.36 | ) | $ | (7.48 | ) | $ | (0.16 | ) | $ | 0.76 | $ | 1.04 | |||||
| Diluted net earnings (loss) per share |
$ | (0.36 | ) | $ | (7.48 | ) | $ | (0.16 | ) | $ | 0.74 | $ | 0.99 | |||||
| Balance Sheet Data: |
||||||||||||||||||
| Cash, cash equivalents, marketable securities and bank deposits |
$ | 123,065 | $ | 121,501 | $ | 167,737 | $ | 348,882 | $ | 345,216 | ||||||||
| Working capital |
$ | 68,013 | $ | 92,359 | $ | 134,896 | $ | 169,760 | $ | 145,745 | ||||||||
| Total assets |
$ | 219,769 | $ | 249,254 | $ | 512,843 | $ | 413,988 | $ | 400,005 | ||||||||
| Total stockholders’ equity |
$ | 165,489 | $ | 178,627 | $ | 424,857 | $ | 366,749 | $ | 349,134 | ||||||||
31
Table of Contents
| Year Ended December 31, | |||||||||||||||||||||||||||||||
| Fiscal Years by Quarter | 2009 | 2008 | |||||||||||||||||||||||||||||
| Quarterly Data: | 4th | 3rd | 2nd | 1st | 4th | 3rd | 2nd | 1st | |||||||||||||||||||||||
| (Unaudited, U.S. dollars in thousands, except per share amount) | |||||||||||||||||||||||||||||||
| Revenues |
$ | 54,720 | $ | 65,532 | $ | 52,020 | $ | 39,914 | $ | 71,551 | $ | 87,368 | $ | 74,152 | $ | 72,729 | |||||||||||||||
| Gross profit |
$ | 21,381 | $ | 24,725 | $ | 19,080 | $ | 13,410 | $ | 28,201 | $ | 32,866 | $ | 25,969 | $ | 26,953 | |||||||||||||||
| Net Income (loss) |
$ | (2,871 | ) | $ | 6,803 | $ | (1,677 | ) | $ | (10,691 | ) | $ | (194,401 | ) | $ | (3,030 | ) | $ | (7,355 | ) | $ | (7,608 | ) | ||||||||
| Net earnings (loss) per share—Basic |
$ | (0.13 | ) | $ | 0.30 | $ | (0.07 | ) | $ | (0.41 | ) | $ | (7.23 | ) | $ | (0.11 | ) | $ | (0.26 | ) | $ | (0.25 | ) | ||||||||
| Net earnings (loss) per share—Diluted |
$ | (0.13 | ) | $ | 0.29 | $ | (0.07 | ) | $ | (0.41 | ) | $ | (7.23 | ) | $ | (0.11 | ) | $ | (0.26 | ) | $ | (0.25 | ) | ||||||||
32
Table of Contents
| Item 7. | MANAGEMENT’S DISCUSSION AND ANALYSIS OF FINANCIAL CONDITION AND RESULTS OF OPERATIONS. |
The following discussion and analysis is intended to provide an investor with a narrative of our financial results and an evaluation of our financial condition and results of operations. The discussion should be read in conjunction with our consolidated financial statements and notes thereto.
Business Overview
DSP Group is a leading global provider of wireless chipset solutions for converged communications at home, delivering system solutions that combine semiconductors and software with reference designs. We provide a broad portfolio of wireless chipsets integrating DECT, Wi-Fi, PSTN and VoIP technologies with state-of-the-art application processors. We also enable converged voice, audio, video and data connectivity across diverse consumer products—from cordless and VoIP phones to home gateways and connected multimedia screens. Our current primary focus is digital cordless telephony with sales of our in-house developed DECT, CoIP, 2.4GHz and 5.8GHz chipsets representing approximately 92% of our total revenues for 2009.
In September 2007, we acquired the CIPT Business of NXP (the “Acquisition”). In connection with the Acquisition, we paid NXP approximately $200 million in cash and issued 4,186,603 shares of our common stock to NXP. On March 12, 2009, we repurchased the shares of common stock issued to NXP in connection with the Acquisition for an aggregate consideration of approximately $20 million.
Our business operates in a highly competitive environment. Our revenues were $212.2 million for 2009, a decrease of 31% in comparison to 2008. During 2009, sales of our DECT 6.0 products in the U.S. market increased from $71.9 million in 2008 to $78.8 million in 2009. We believe that sales of our DECT 6.0 products in the U.S. market will continue to increase. Competition has historically increased pricing pressures for our products and decreased our average selling prices, and we believe this trend will continue. Our gross margin decreased to 37.0% of total revenues for 2009 from 37.3% for 2008, primarily due to the decline in overall revenues, the continued decline in average selling prices of our products, and increased sales of DECT products with lower gross margins in lieu of 5.8GHz and 2.4GHz products with higher gross margins. In addition to general market competitiveness, the cordless telephony market is undergoing a challenging period of transition characterized by stagnation due to the lack of new model launches and market anticipation of next generation products. As a result, we expect the market to remain price sensitive and expect price erosion to continue. Moreover, various other factors, including increases in the cost of raw materials and commodities and our suppliers passing such increases onto us, increases in silicon wafer costs and increases in production, assembly and testing costs, all may decrease our gross profit in future periods. The market downturn that started during the second half of 2008 and continued throughout 2009 also resulted in a significant downturn of the semiconductor industry, the industry in which we operate. Moreover, our semiconductor OEM customers incorporate our chipsets into consumer electronics products, the demand for which significantly slowed in 2009 due to the economic downturn and decreased consumer confidence. Furthermore, the continued uncertainty with global economic conditions and outlook has resulted in a decrease in product demand, excess customer inventories, accelerated erosion of prices, longer product cycles and decision-making processes at our customers’ organizations, reduced corporate profits and capital, liquidity concerns and general adverse business conditions. Notwithstanding these challenges, we remain optimistic about a recovery in 2010 and currently anticipate that our revenues and gross profit will be higher in 2010 as compared to 2009, mainly due to our launch of new products and operational efficiencies.
We had operating losses of $22.9 million for 2009, compared to $206.7 million for 2008. The decrease in operating losses for 2009 was primarily attributable to (i) the impairment and amortization of intangible assets related to the Acquisition in the amount of $204.4 million for 2008, in comparison to $12.3 million for 2009, (ii) a decrease in expenses related to research and development in 2009 as compared to 2008, mainly due to the shut down of, or reduction in capacity and the number of employees at, some of our sites as part of our restructuring and (iii) restructuring expenses in the amount of $1.87 million for 2008 in comparison to no such
33
Table of Contents
expenses incurred for 2009. The above decreases were offset to some extent by the decrease in revenues in 2009 as compared to 2008. Operating expenses decreased by 68% in 2009 compared to 2008, reaching a level of $101.5 million. The decrease in operating expenses was mainly due to the same factors as noted above for the decrease in operating losses.
In addition to the highly competitive environment in which we operate, we believe there are also several emerging market trends that challenge our continued business growth potential. For example, the rapid deployment of new communication access methods, including mobile, wireless broadband, cable and other connectivity, as well as the projected lack of growth in products using fixed-line telephony, may reduce our revenues derived from, and unit sales of, cordless telephony products, which are currently our primary focus. Our business also may be affected by the outcome of the current competition between cellular phone operators and fixed-line operators for the provision of residential communication. A significant majority of our revenues are currently generated from sales of chipsets used in cordless phones that are based on fixed-line telephony.
Nonetheless, we recognize the competitive landscape and are actively engaged in addressing these market challenges and trends. We decreased our operating expenses by 68% to $101.5 million for 2009 as compared to 2008. Our operating losses also decreased to $22.9 million for 2009 as compared to $206.7 million for 2008. Revenues derived from the sale of DECT products represented 77% of our total revenues for 2009 as compared to 70% of our total revenues for 2008. We are also concentrating our development efforts on a new cordless telephony DECT standard, the CAT-iq protocol, which stands for Cordless Advanced Technology: Internet and Quality. CAT-iq has been widely embraced by all leading European operators, and we believe that this technology will also proliferate into other regions that have adopted DECT telephony, such as the U.S. This new standard is anticipated to enable the introduction of new cordless products into the market as telecom operators have begun deploying home gateways and mobile handsets with CAT-iq in the market. In addition to DECT technologies, we are investing in developing CoIP (Cordless over IP) technologies in-house. Our goal is to leverage the Wi-Fi technology acquired in 2004 from Bermai Inc. to further develop and offer products for residential communication that integrate voice, data and video with broadband offerings. We already introduced to the market the XpandR platform that integrates DECT and Wi-Fi capabilities to enable multimedia and web-related applications in our future products. In 2010, our third generation of the XpandR platform will be sampled by potential customers. However, our success in introducing new products and penetrating new markets may not occur and may require us to substantially increase our operating expenses. As a result, our past operating results should not be relied upon as an indication of future performance.
As of December 31, 2009, our principal source of liquidity consisted of cash and cash equivalents of $38.0 million and marketable securities and short and long term deposits of $85.0 million, totaling $122.9 million.
Critical Accounting policies
Our consolidated financial statements are prepared in accordance with U.S. GAAP. In connection with the preparation of the financial statements, we are required to make assumptions and estimates about future events, and apply judgment that affect the reported amounts of assets, liabilities, revenue, expenses and the related disclosure. We base our assumptions, estimates and judgments on historical experience, current trends and other factors that management believes to be relevant at the time the consolidated financial statements are prepared. On a regular basis, management reviews our accounting policies, assumptions, estimates and judgments to ensure that our financial statements are presented fairly and in accordance with U.S. GAAP. However, because future events and their effects cannot be determined with certainty, actual results could differ from our assumption and estimates, and such differences could be material.
Our significant accounting policies are discussed in Note 3, Significant Accounting Policies, of the Notes to Consolidated Financial Statements, included in Item 8, Financial Statements and Supplementary Data, of this Annual Report on Form 10-K.
34
Table of Contents
Management believes that the following accounting policies require management’s most difficult, subjective and complex judgments, resulting from the need to make estimates about the effect of matters that are inherently uncertain. Management has reviewed these critical accounting policies and related disclosures with our independent auditors and audit committee.
| Description |
Judgments & Uncertainties |
Effect if Actual Results Differ from Assumptions | ||
| Tax Contingencies: Like most companies, domestic and foreign tax authorities periodically audit our income tax returns. These audits include questions regarding our tax filing positions, including the timing and amount of deductions and the allocation of income among various tax jurisdictions. In evaluating the exposure associated with our various tax filing positions, including state, foreign and local taxes, we record reserves for probable exposures. A number of years may elapse before a particular matter, for which we have established a reserve, is audited and fully resolved.
We report a liability for unrecognized tax benefits resulting from uncertain tax positions taken or expected to be taken in a tax return. We recognize interest and penalties, if any, related to unrecognized tax benefits in income tax expense. |
The estimate of our tax contingency reserve contains uncertainty because management must use judgment to estimate the exposure associated with our various tax filing positions.
According to FASB ASC No. 740, the first step is to evaluate the tax position for recognition by determining if the weight of available evidence indicates it is more likely than not that the position will be sustained on audit, including resolution of related appeals or litigation processes, if any. The second step is to measure the tax benefit as the largest amount which is more than 50% likely of being realized upon ultimate settlement. |
Although management believes that its estimates and judgments about tax contingencies are reasonable, actual results could differ, and we may be exposed to gains or losses that could be material. To the extent we prevail in matters for which reserve has been established, or are required to pay amounts in excess of the reserve, our effective tax rate for a given financial statement period could be materially affected. An unfavorable tax settlement would require use of our cash and result in an increase in our effective tax rate for the year of resolution. A favorable tax settlement would be recognized as a reduction in our effective tax rate for the year of resolution. | ||
| Tax Valuation Allowance: The Company has a valuation allowance for deferred tax assets based on the determination that it is more likely than not that some of these assets will not be realized. |
Our management inherently must make estimates to determine the ultimate realization of these assets. The estimate of our tax valuation allowance contains uncertainty because management must use judgment to estimate the expected results for tax purposes. | Although management believes that its estimates and judgments about expected results for tax purposes are reasonable, actual results could differ, and we may be required to record an additional valuation allowance for our deferred tax assets. | ||
| Other Intangible Assets: The identifiable intangible assets included on our balance sheet are current technology and customer relations, acquired from NXP as a result of the Acquisition.
We review goodwill and other intangible assets for potential impairment annually during the |
We determine fair value using widely accepted valuation techniques, including discounted cash flow and market multiple analyses. These types of analyses require us to make assumptions and estimates regarding industry economic factors and the profitability of future business | If our estimates or their related assumptions change in the future, we may be required to record additional impairment charges for our intangible assets. | ||
35
Table of Contents
| Description |
Judgments & Uncertainties |
Effect if Actual Results Differ from Assumptions | ||
| second quarter of each fiscal year and when events or changes in circumstances indicate the carrying value of the goodwill or other intangible assets may be impaired, we may obtain an appraisal from an independent valuation firm to determine the amount of impairment, if any. In addition to the use of an independent valuation firm, we perform internal valuation analyses and consider other publicly available market information. We review other intangible assets for potential impairment when events or changes in circumstances indicate the carrying value of the other intangible assets may be impaired. In such an event, we may obtain an appraisal from an independent valuation firm to determine the amount of impairment, if any. In addition to the use of an independent valuation firm, we perform internal valuation analyses and consider other publicly available market information. | strategies. It is our policy to conduct impairment testing based on our current business strategy in light of present industry and economic conditions, as well as future expectations. | |||
| Contingencies and Other Accrued Expenses: We are from time to time involved in legal proceedings and other claims. We are required to assess the likelihood of any adverse judgments or outcomes to these matters, as well as potential ranges of probable losses. |
A determination of the amount of reserve required, if any, for any contingencies and accruals is made after careful analysis of each individual issue. The required reserve may change due to future developments, such as a change in the settlement strategy in dealing with any contingencies, which may result in higher net losses. | If actual results are not consistent with our assumptions and judgments, we may be exposed to gains or losses that could be material. | ||
| Inventory Write-Off: We value our inventory at the lower of the cost of the inventory or fair market value through the establishment of write-off and inventory loss reserve. We have not made any changes in the accounting methodology used to establish our markdown or inventory loss reserves during the past three fiscal years. |
Our write-off represents the excess of the carrying value, typically cost, over the amount we expect to realize from the ultimate sale or other disposal of inventory based upon our assumptions regarding forecasted consumer demand, the promotional environment, inventory aging and technological obsolescence. | If our estimates regarding consumer demand are inaccurate or changes in technology affect demand for certain products in an unforeseen manner, we may be exposed to losses or gains in excess of our established write-off that could be material. | ||
36
Table of Contents
| Description |
Judgments & Uncertainties |
Effect if Actual Results Differ from Assumptions | ||
| Equity-Based Compensation Expense: Equity-based compensation expense is measured on the grant date based on the fair value of the award and is recognized as an expense over the requisite service periods. |
Determining the fair value of equity-based awards on the grant date requires the exercise of judgment, including the amount of equity-based awards that are expected to be forfeited. We consider many factors when estimating expected forfeitures, including types of awards, employee class, and historical experience. Actual results, and future changes in estimates, may differ substantially from our current estimates. | Although management believes that their estimates and judgments about equity-based compensation expense are reasonable, actual results could differ. | ||
| Pension Liability: We account for pension liability in accordance with FASB ASC No. 715 “Defined Benefit Plans.” |
The costs and obligations of our defined benefit pension plans are dependent on actuarial assumptions. The two critical assumptions used, which impact the net periodic pension cost (income) and the benefit obligations, are the discount rate and expected return on plan assets. The discount rate represents the market rate for a high quality government bond, and the expected return on plan assets is based on current and expected asset allocations, historical trends and expected returns on plan assets. These key assumptions are evaluated annually. Changes in these assumptions can result in different expense and liability amounts. | Although management believes that their estimates and judgments about pension liability are reasonable, actual results could differ, and we may be exposed to gains or losses that could be material. | ||
| Business Combination: In September 2007, we acquired the assets and assumed the liabilities of the CIPT Business for approximately $270 million. The Acquisition was accounted in accordance with business combination accounting. We allocated the purchase price of the CIPT Business to tangible and acquisition-related intangible assets acquired and liabilities assumed, as well as to in-process research and development, based on their estimated fair values. |
We make estimates of fair value using reasonable assumptions based on historical experience and information obtained from the management of NXP in order to allocate the purchase price to the tangible and intangible assets.
Assumptions are also made regarding the estimated useful life of the intangible assets. |
The valuations require significant estimates and assumptions, especially with respect to acquisition-related intangible assets. Although management believes that their estimates and judgments about the business combination are reasonable, actual results could differ. | ||
37
Table of Contents
| Description |
Judgments & Uncertainties |
Effect if Actual Results Differ from Assumptions | ||
| Marketable Securities: Management determines the appropriate classification for our investments in debt and equity securities at the time of purchase and re-evaluates such determination at each balance sheet date. |
The marketable securities are periodically reviewed for impairment. If it is concluded that any of these investments are impaired, management determines whether such impairment is “other-than-temporary.” Factors that are considered in making such a determination include the duration and severity of the impairment, the reason for the decline in value and the potential recovery period, and our intent to sell, or whether it is more likely than not that we will be required to sell, the investment before recovery of its cost basis. If any impairment is considered “other-than-temporary,” the investment is written down to its fair value and a corresponding charge is recorded in financial income, net. | Although management believes that their considerations and judgments about fair value and whether a loss associated with a marketable security is other-than-temporary, actual results could differ. Given current market conditions and uncertainty, management’s judgments could prove to be wrong, and companies with relatively high credit ratings and solid financial conditions may not be able to fulfill their obligations and thereby cause other-than-temporary losses. |
Results of Operations:
Total Revenues. Our total revenues were $212.2 million in 2009, $305.8 million in 2008 and $248.8 million in 2007. The decrease of 31% in revenues for 2009 as compared to 2008 was primarily as a result of decreased sales of our products mainly due to the significant global economic downturn that started during the second half of 2008 and continued throughout 2009, and the continued decline in the average selling prices of our products. The increase in 2008 revenues in comparison to 2007 was primarily as a result of the inclusion of the revenues of the CIPT Business from the beginning of the year in 2008 in comparison to its inclusion as of September 4, 2007, the date of the completion of the Acquisition. Sales of DECT products were $163.2 million, $213.2 and $95.7 million for the years ended 2009, 2008 and 2007, respectively, representing approximately 77%, 70% and 38% of our total revenues for 2009, 2008, and 2007, respectively. This represents a decrease of 23% in absolute dollars in 2009 as compared 2008, which was mainly attributable to the general decrease in sales of all of our products in the European market. The increase in sales of DECT products from 2007 to 2008 was mainly attributable to the consolidation of the results of the CIPT Business within our combined results beginning on September 4, 2007 and the shift in sales from 2.4GHz and 5.8GHz products to DECT 6.0 products in the U.S. market. Sales of 2.4GHz products were $25.8 million, $38.5 million and $47.4 million for 2009, 2008 and 2007, respectively, representing 12%, 13% and 19% of our total revenues for 2009, 2008 and 2007, respectively. This represents a decrease of 33% in absolute dollars in 2009 as compared 2008. Sales of 5.8GHz products were $3.9 million, $18.3 million and $60.5 million for 2009, 2008 and 2007, respectively, representing approximately 2%, 6% and 24% of our total revenues for 2009, 2008 and 2007, respectively. This represents a decrease of 79% in absolute dollars in 2009 as compared 2008. The decrease in percentage of revenues and absolute dollars for the comparable periods relating to our 2.4GHz and 5.8GHz products was mainly attributable to the shift in sales of those products to DECT 6.0 products in the U.S. market. Revenues from CoIP products were $3.2 million, $1.7 million and $10.0 million for the years ended in 2009, 2008 and 2007, respectively. Sales of CoIP products represented approximately 1%, 1% and 4% of our total revenues for 2009, 2008 and 2007, respectively. This represents an increase of 88% in absolute dollars in 2009 as compared 2008.
38
Table of Contents
The following table shows the breakdown of revenues for the periods indicated by geographic location (in thousands):
| Year Ended December 31, | |||||||||
| 2009 | 2008 | 2007 | |||||||
| United States |
$ | 3,382 | $ | 23,579 | $ | 6,132 | |||
| Japan |
71,388 | 108,471 | 122,832 | ||||||
| Europe |
15,448 | 31,724 | 18,657 | ||||||
| Hong Kong |
95,204 | 120,175 | 89,748 | ||||||
| Korea |
20,233 | 11,922 | 5,248 | ||||||
| Other |
6,531 | 9,929 | 6,171 | ||||||
| Total revenues |
$ | 212,186 | $ | 305,800 | $ | 248,788 | |||
The decreased sales of our products to the above referenced geographic locations for 2009 as compared to 2008 primarily resulted from decreased sales to customers in those locations mainly due to the significant global economic downturn that started during the second half of 2008 and continued throughout 2009, and the continued decline in the average selling prices of our products.
As our products are generally incorporated into consumer products sold by our OEM customers, our revenues are affected by seasonal buying patterns of consumer products sold by our OEM customers that incorporate our products. The fourth quarter in any given year is usually the strongest quarter of sales for our OEM customers and, as a result, the third quarter in any given year is usually the strongest quarter for our revenues as our OEM customers request increased shipments of our products in anticipation of the fourth quarter holiday season. This trend can be generally observed from reviewing our quarterly information and results of operations. However the magnitude of this trend varies annually.
Significant Customers. VTech is a significant OEM customer based in Hong Kong. Sales to VTech represented 29%, 21% and 10% of our total revenues for 2009, 2008 and 2007, respectively. The increase was primarily due to the decrease in overall revenues for 2009, which increased the percentage of revenues attributable to VTech of our total revenues for 2009. Another significant customer of the company in Hong Kong is CCT Telecom, whose sales represented 8%, 9% and 12% of our total revenues for 2009, 2008 and 2007, respectively.
The Japanese market and the OEMs that operate in that market are among the largest suppliers of residential wireless products with significant market share in the U.S. market. Revenues derived from sales through our largest distributor, Tomen Electronics, accounted for 22% of our total revenues in 2009, as compared to 25% in 2008 and 37% in 2007. The sales decrease for the comparable periods was primarily due to a decrease in absolute dollars of sales to Panasonic and the Japanese domestic market.
Tomen Electronics sells our products to a limited number of customers. One customer, Panasonic, has continually accounted for a majority of sales through Tomen Electronics. Sales to Panasonic through Tomen Electronics generated approximately 13%, 13% and 23% of our total revenues in 2009, 2008 and 2007, respectively. Sales through Tomen Electronics or directly to Uniden represented 12%, 13% and 13% for 2009, 2008 and 2007, respectively. The loss of Tomen Electronics as a distributor and our inability to obtain a satisfactory replacement in a timely manner would harm our sales and results of operations. Additionally, the loss of Panasonic and Tomen Electronics’ inability to thereafter effectively market our products would also harm our sales and results of operations.
The loss of a significant customer, or reduced demand for products from, or the reduction in purchasing capability of, one of our significant customers, could have a material adverse effect on our business, financial condition and results of operations.
Significant Products. Revenues from our DECT products represented 77%, 70% and 38% of our total revenues for 2009, 2008 and 2007, respectively. Revenues from our 2.4GHz and 5.8GHz products represented 12% and 2%, respectively, of our total revenues for 2009, 13% and 6%, respectively, of our total revenues for
39
Table of Contents
2008, and 19% and 24% respectively of our total revenues for 2007. We believe that sales of DECT and 2.4GHz products will continue to represent a substantial percentage of our revenues for 2010. However, we believe that U.S. sales of our 2.4GHz and 5.8GHz products will decrease in 2010. We believe that the rapid deployment of new communication access methods, as well as the projected lack of growth in fixed-line telephony, will reduce our total revenues derived from, and unit sales of, cordless telephony products, including our DECT, 2.4GHz and 5.8GHz products, for the long term.
Gross Profit. Gross profit as a percentage of revenues was 37.0% in 2009, 37.3% in 2008 and 40.5% in 2007. The decrease in our gross profit for 2009 as compared to 2008 was primarily due to the decline in overall revenues, the continuing decline in the average selling prices of our products and increased sales of DECT products with lower average gross margins on account of 5.8GHz and 2.4GHz products with higher average gross margins. The decrease was offset to some extent by savings realized from the shut down of, or reduction in capacity at, some of our sites as part of our restructuring plans, manufacturing cost reductions, improvements in our yield percentages and by achieving a higher level of product integration. As gross profit reflects the sale of chips and chipsets that have different margins, changes in the mix of products sold have impacted and will continue to impact our gross profit in future periods. Our gross profit may decrease in the future due to a variety of factors, including the continued decline in the average selling prices of our products, changes in the mix of products sold, our failure to achieve cost reductions, roll-out of new products in any given period, our success in introducing new engineering processes to reduce manufacturing costs, increases in the cost of raw materials such as gold, oil and silicon wafers, and increases in production, assembly and testing costs. Moreover, our suppliers may pass the increase in the cost of raw materials and commodities onto us which would further reduce the gross margins of our products. We cannot guarantee that our ongoing efforts in cost reduction and yield improvements will be successful or that they will keep pace with the anticipated continuing decline in average selling prices of our products. One approach we are using to offset the expected decrease in gross profit is offering our customers “bare-die” chips that eliminate assembly and testing services in return for lower selling prices to our customers. Other steps we are taking include the implementation of cost improvement plans to reduce testing costs and offering our customers more cost effective products. However, we can provide no assurance that any alternative solutions we provide to our customers will be acceptable to them or that these steps will help us offset the continued decrease in gross margins of our products.
Cost of goods sold consists primarily of costs of wafer manufacturing and fabrication, assembly and testing of integrated circuit devices and related overhead costs, and compensation and associated expenses related to manufacturing and testing support and logistics personnel.
Operating Expenses. Our operating expenses were $101.5 million in 2009, $320.7 million in 2008 and $113.6 million in 2007. The decrease in operating expenses for 2009 as compared to 2008 was primarily attributable to (i) impairment of goodwill and other intangible assets related mainly to the Acquisition in the amount of $181.5 million in 2008, (ii) a decrease in the amortization cost for intangible assets related to the Acquisition in the amount of $10.6 million, resulting from the recording of impairment costs related to such intangible assets in 2008 which decreased the original cost of such intangible assets for future amortization measurement, including in 2009, (iii) a decrease in payroll and facilities expenses related to research and development, resulting from our restructuring plans, which included a reduction in the numbers of employees and the shut-down of some of our sites, (iv) a decrease in sales commissions due to decreased sales for 2009, and (v) a decrease in equity-based compensation expenses. Our operating losses were $22.9 million in 2009, as compared to $206.5 million of operating losses in 2008 and $12.9 million of operating losses in 2007. The decrease in operating losses was mainly due to the decrease in operating expenses as noted above, offset to some extent by the decrease in overall revenues and gross margin.
Research and Development Expenses. Our research and development expenses decreased to $56.1 million for 2009 from $73.9 million for 2008. Research and development expenses increased to $73.9 million in 2008 from $58.5 million in 2007. The decrease for 2009 in research and development expenses, as compared to 2008, was mainly attributed to (i) savings of $13.9 million for 2009 as a result of the shut-down of, or reduction in capacity and the number of employees at, some of our sites as part of our restructuring plans,
40
Table of Contents
(ii) a devaluation of the New Israeli Shekel (NIS) against the U.S. dollar which reduced the research and development expenses attributable to our Israeli facilities and employees, (iii) a decrease in equity-based compensation expenses by $2.0 million for 2009 as compared to 2008, and (iv) a decrease in other expenses such as travel expenses for 2009 as compared to 2008. Equity-based compensation expenses amounted to $5.3 million for 2009. The above referenced expense decreases were offset to some extent by an increase in IP purchases and tapeout expenses in 2009 as compared to 2008.
The increase in research and development expenses in 2008 as compared to 2007 was mainly attributed to (i) the inclusion of the expenses of the CIPT Business in the combined results for all of 2008, as compared to the inclusion of such expenses since September 4, 2007 for 2007; (ii) an increase in IP and tape-out expenses; (iii) an increase in labor expenses related to research and development due to the increase in the number of employees, as well as increases in salary, and (iv) the devaluation of the U.S. dollar against the NIS for 2008, as compared to 2007, that increased our salaries and other expenses for our Israeli employees and facilities. Equity-based compensation expenses amounted to $7.2 and $7.1 million for 2008 and 2007, respectively. The above-referenced increases were partially offset by a decrease in other project-related expenses in 2008 as compared to 2007.
Our research and development expenses as a percentage of our total revenues were 26%, 24% and 24% for 2009, 2008 and 2007, respectively. The increase in research and development expenses as a percentage of our total revenues in 2009 as compared to 2008 was due to the decrease in absolute dollars of our total revenues for 2009 as compared to 2008.
Research and development expenses consist mainly of payroll expenses to employees involved in research and development activities, expenses related to IP purchases, tapeout and mask work, subcontracting, labor contractors and engineering expenses, depreciation and maintenance fees related to equipment and software tools used in research and development, and facilities expenses associated with and allocated to research and development activities.
Sales and Marketing Expenses. Our sales and marketing expenses were $17.9 million for 2009, $22.7 million for 2008 and $19.1 million for 2007. The decrease in sales and marketing was mainly attributed to (i) a decrease in sales commissions paid due to a lower level of revenues subject to sales commissions for 2009 as compared to 2008, (ii) a decrease in payroll expenses due to a lower number of sales and marketing employees and contractors, partially as a result of our restructuring plans, and (iii) the devaluation of the NIS against the U.S. dollar.
The increase in sales and marketing expenses between 2007 and 2008 was mainly a result of the inclusion of the expenses of the CIPT Business in the combined results for all of 2008, as compared to the inclusion of such expenses since September 4, 2007 for 2007. The increase in our sales and marketing expenses in 2008 in comparison to 2007 was partially offset by a decrease in sales commission due to a lower level of revenues subject to commissions, and a decrease in the average commission.
Our sales and marketing expenses as a percentage of our total revenues were 8%, 7% and 8% for 2009, 2008 and 2007, respectively. The increase in sales and marketing expenses as a percentage of our total revenues for 2009 was due to the decrease in absolute dollars of our total revenues in 2009 as compared to 2008.
Sales and marketing expenses consist mainly of sales commissions, payroll expenses to direct sales and marketing employees, travel, trade show expenses, and facilities expenses associated with and allocated to sales and marketing activities.
General and Administrative Expenses. Our general and administrative expenses were $15.2 million, $17.9 million and $14.6 million for 2009, 2008 and 2007 respectively. The decrease in general and administrative expenses was mainly attributed to (i) a decrease in equity-based compensation expenses of $0.8 million for 2009 as compared to 2008, (ii) operational savings as a result of the shut-down of some of our sites as part of our restructuring plans, (iii) a decrease in other expenses such as accounting and legal expenses for 2009 as compared to 2008, and (iv) the devaluation of the NIS against the U.S. dollar.
41
Table of Contents
The increase in general and administrative expenses for 2008 as compared to 2007 was mainly a result of the inclusion of the expenses of the CIPT Business in the combined results for all of 2008, as compared to such expenses included since September 4, 2007 for 2007. One additional factor that increased general and administrative expenses was higher professional fees for 2008, as compared to the same periods in 2007. The increase in general and administrative expenses for 2008 was partially offset by a decrease related to equity-based compensation expense. Equity-based compensation expense amounted to $4.1 million and $4.6 million for 2008 and 2007, respectively.
General and administrative expenses as a percentage of our total revenues were 7% in 2009 and 6% in both 2008 and 2007. The increase in general and administrative expenses as a percentage of our total revenues was due to the decrease in absolute dollars of our total revenues in 2009 as compared to 2008.
Our general and administrative expenses consist mainly of payroll expenses for management and administrative employees, accounting and legal fees, expenses related to investor relations as well as facilities expenses associated with general and administrative activities.
Amortization of Intangible Assets. During 2009, 2008 and 2007, we recorded an expense item of approximately $12.3 million, $22.8 million and $11.1 million, respectively, relating to the amortization of intangible assets associated with the Acquisition. The decrease in 2009 as compared to 2008 was due to the impairment costs of such intangible assets in 2008, which reduced the basic cost of such intangible assets and therefore the future amortization cost of such intangible assets, including in 2009. The increase from 2007 as compared to 2008 was due to the inclusion of the amortization expense for the full year 2008 as compared to the inclusion of such expense since September 4, 2007 for 2007.
Impairment of Goodwill and Other Intangible Assets. In the fourth quarter of 2008, we performed an additional impairment test due to indicators that occurred subsequent to our second quarter 2008 annual impairment test. Indicators we considered important which could trigger an impairment include, but are not limited to, significant underperformance relative to historical or projected future operating results, significant changes in the manner of use of the acquired assets or the strategy for our overall business, significant negative industry or economic trends, a significant decline in our stock price for a sustained period and our market capitalization relative to net book value. We determined, based on the valuation conducted during the fourth quarter of 2008, that goodwill, trade name and trademark acquired in the Acquisition, were impaired and that there was partial impairment of our other intangible assets, namely current technology and customer relations. The impairment was prompted primarily by the continued deterioration in market conditions in general and the decrease in our projected income for future periods. As a result, we recorded an expense item in the amount of approximately $181.5 million related to the impairment of goodwill and other intangible assets. $142.4 million of impairment was allocated to goodwill and $39.1 million was allocated to other intangible assets. No impairment loss was recorded in 2009.
Restructuring Costs and Other. During the third quarter of 2008, we initiated an additional restructuring plan, subsequent to our initial restructuring plan following the Acquisition, to improve operating efficiency at our various operating sites and to reduce our operating expenses for 2009. The restructuring plan was completed as of June 30, 2009. As a significant majority of the restructuring associated with the additional restructuring plan occurred during the third quarter of 2008, we recognized an expense in the amount of $1.87 million, mainly for employee contract termination costs. This expense amount is net of $0.54 million of gain resulting from adjustments made to our employee pension liabilities associated with employees whose employment was terminated in connection with the restructuring plan.
Interest and Other Income, net. Interest and other income, net, was $2.9 million in 2009, $0.2 million in 2008 and $10.5 million in 2007. The increase in 2009 was due to the gain from the realization of previously impaired available-for-sale securities in the amount of $531,000, as compared to a loss in the amount of approximately $3.0 million in 2008 due to the decline in the fair value of such securities, which was offset to some extent by lower interest income as a result of (i) a decrease in our level of cash, cash equivalents and marketable securities which was attributable to our various share repurchases, and (ii) lower interest rates.
42
Table of Contents
The decrease in 2008 compared to 2007 was due to the payment of approximately $200 million in cash on September 4, 2007 as partial consideration for the Acquisition, which resulted in less investment balance held during 2008. Additional factors for the decreased financial income for 2008, as compared to 2007, were (i) lower interest rates, (ii) the repurchase of 4.8 million shares of our common stock for approximately $49.0 million in cash during 2008, (iii) the devaluation of the Euro against the U.S. dollar, which resulted in expenses associated with exchange rates differences, and (iv) the decline in fair market value of one of our marketable securities which resulted as of December 31, 2008, in an impairment loss in the amount of approximately $3.0 million.
Our total cash, cash equivalents and marketable securities were $123.1 million as of December 31, 2009, compared to $121.5 million as of December 31, 2008.
Provision for Income Taxes. Our income tax benefit was $11.6 million for 2009, as compared to tax expenses of $5.8 million and $2.4 million in 2008 and 2007, respectively. Three main items caused an increase in our income tax benefit for 2009, as compared to tax expenses in 2008: (i) pursuant to a settlement with the U.S. Internal Revenue Service relating to an audit of our U.S. federal income tax returns for 2003 and 2004, we recorded a tax benefit of $3.5 million as a result of the partial reversal of the tax reserves associated with the tax audit, (ii) we recorded a tax benefit of $7.6 million as a result of the reversal of an income tax contingency reserve that was determined to be no longer required due to the expiration of applicable limitation statutes, and (iii) deferred tax valuation allowance recorded in 2008 due to the change in the estimation for taxable income in future years.
During 2009, we did not record any net deferred tax assets due to our current estimation of future taxable income, primarily as a result of general adverse market conditions.
DSP Group Ltd., our Israeli subsidiary, was granted “Approved Enterprise” status by the Israeli government with respect to six separate investment plans. Approved Enterprise status allows our Israeli subsidiary to enjoy a tax holiday for a period of two or four years, and a reduced corporate tax rate of 10%-25% (based on the percentage of foreign ownership) for an additional six or eight years, on each investment plan’s proportionate share of taxable income. The tax benefits under these investment plans are scheduled to gradually expire by 2015.
On April 1, 2005, an amendment to the Israeli Investment Law came into effect. The amendment revised the criteria for investments qualified to receive tax benefits. An eligible investment program under the amendment qualifies for benefits as a Privileged Enterprise (rather than the previous terminology of Approved Enterprise). Among other things, the amendment provides tax benefits to both local and foreign investors and simplified the approval process. The amendment does not apply to investment programs approved prior to December 31, 2004. The new tax regime applies to new investment programs only. We believe that we are currently in compliance with these requirements. However, if we fail to meet these requirements, we would be subject to corporate tax in Israel at the regular statutory rate (25% for 2010). We also could be required to refund tax benefits, with interest and adjustments for inflation based on the Israeli consumer price index.
As of December 31, 2006, DSP Group Ltd. has elected the status of a Privileged Enterprise under the amendment to the Israeli Investment Law for its seventh plan. The seventh plan entitles DSP Group Ltd. to a corporate tax exemption for a period of two years and to a reduced corporate tax rate of 10%-25% (based on the percentage of foreign ownership) for an additional period of eight years from the first year it has taxable income.
In connection with the Acquisition, we received a tax ruling from the Swiss tax authorities with respect to the taxable income generated by our Swiss subsidiary, including the amortization period for tax purposes of goodwill and all other intangible assets acquired in the Acquisition by our Swiss subsidiary. Pursuant to the tax ruling, our Swiss subsidiary is entitled to reduced tax rates of approximately 10% to 15%, depending on the source of income, and tax amortization period of up to 10 years for the goodwill and other intangible assets acquired in the Acquisition by our Swiss subsidiary.
43
Table of Contents
LIQUIDITY AND CAPITAL RESOURCES
Operating Activities. We generated $26.6 million, $16.4 million and $55.5 million of cash and cash equivalents from operating activities during 2009, 2008 and 2007, respectively. The increase in net cash provided by operating activities for 2009, as compared to net cash provided by operating activities for 2008, resulted from changes in working capital as follows (i) a decrease in other accounts receivable and prepaid expenses by $5.4 million during 2009, mainly due to excess tax advances that were refunded from tax authorities, as compared to an increase by $7.4 million during 2008, mainly due to tax advances paid to tax authorities and the payment of other deposits, (ii) an increase in accrued compensation and benefits by $0.5 million during 2009, as compared to a decrease of $5.5 million during 2008, mainly due to severance payments associated with our restructuring plans that were paid during 2008 and higher employee bonus payments made in 2008 as compared to 2009, and (iii) a decrease in trade payables (including to related parties) by $0.3 million during 2009, as compared to a decrease of $10.9 million (including to related parties) during 2008. The above changes in working capital were offset to some extent by an increase in operating losses for 2009, as compared to 2008 (after eliminating non-cash charges such as intangible assets amortization and equity-based compensation expense from the operating losses for both periods).
Investing Activities. We invest excess cash in marketable securities of varying maturities, depending on our projected cash needs for operations, capital expenditures and other business purposes. During 2009, we purchased $86.1 million of investments in marketable securities, and short and long term deposits, as compared to $48.1 million during 2008 and $63.5 million during 2007. During the same periods, $55.5 million, $89.4 million and 272.0 million, respectively, of investments in marketable securities and deposits matured, were called by the issuer or were sold.
As of December 31, 2009, the amortized cost of our marketable securities and deposits was $83.8 million and their stated market value was $85.0 million, representing an unrealized gain of $1.2 million, which was mainly caused by overall market conditions and interest rate changes.
Our capital equipment purchases for 2009, consisting primarily of research and development software tools, computers and other peripheral equipment, engineering test and lab equipment, leasehold improvements, furniture and fixtures, totaled $4.5 million, as compared to $8.2 million for 2008 and $3.4 million for 2007.
During 2009, we made an investment of $2.2 million in an Israeli private company in return for approximately 30% of the equity of the company, on a fully diluted basis. We also have the option to acquire the remaining equity of the Israeli private company within a 24 months period for an additional $8.7 million.
Financing Activities. During the first quarter of 2009, we repurchased 4,186,603 shares of our common stock that were issued to NXP in connection with the Acquisition at a purchase price of $4.78 per share for approximately $20.0 million. During 2009, no employee stock options were exercised, as compared to the receipt of $0.1 million during 2008 and $3.1 million during 2007 upon the exercise of employee stock options. We cannot predict cash flows from option exercises and employee stock purchases for future periods.
Pursuant to authorizations in March 1999, July 2003, October 2004, January 2007 and January 2008, our board of directors authorized a share repurchase program for the repurchase of an aggregate of 14.9 million shares of our common stock. Also in January 2008, our board approved the company’s entry into a share repurchase plan, in accordance with Rule 10b5-1 of the Securities Exchange Act of 1934, for the repurchase of 5.0 million of the aggregate shares of our common stock authorized for repurchase, which plan has since expired. As of December 31, 2009, 255,488 shares of our common stock remain authorized for repurchase pursuant to our share repurchase program.
During 2008, we repurchased 4,798,000 shares of our common stock at an average purchase price of $10.21 per share for approximately $49.0 million pursuant to our share repurchase program. During 2007, we repurchased approximately 1,618,000 shares of our common stock at an average purchase price of $15.88 per share for an aggregate amount of approximately $25.7 million. No repurchases were made during 2009 pursuant to our share repurchase program.
44
Table of Contents
As of December 31, 2009, we had cash and cash equivalents totaling approximately $38.0 million and marketable securities and time deposits of approximately $85.0 million.
Our working capital at December 31, 2009 was approximately $68.0 million, as compared to $92.4 million as of December 31, 2008. The decrease in working capital was mainly due to our investment in long-term marketable securities and time deposits. We believe that our current cash, cash equivalents, time deposits and marketable securities will be sufficient to meet our cash requirements for both the short and long term.
In addition, as part of our business strategy, we may evaluate potential acquisitions of businesses, products and technologies. Accordingly, a portion of our available cash may be used at any time for the acquisition of complementary products or businesses. Such potential transactions may require substantial capital resources, which may require us to seek additional debt or equity financing. We cannot assure you that we will be able to successfully identify suitable acquisition candidates, complete acquisitions, integrate acquired businesses into our current operations, or expand into new markets. Furthermore, we cannot assure you that additional financing will be available to us in any required time frame and on commercially reasonable terms, if at all. See the section of the risk factors entitled “We may engage in future acquisitions that could dilute our stockholders’ equity and harm our business, results of operations and financial condition.” for more detailed information.
Contractual Obligations
The following table aggregates our material expected obligations and commitments as of December 31, 2009 (in thousands):
| Payment Due By Period | |||||||||||||||
| Contractual Obligations |
Total | Less Than 1 Year |
2-3 Years |
4-5 Years |
More Than 5 Years | ||||||||||
| Operating Lease Commitments(1) |
$ | 10,304 | $ | 4,331 | $ | 4,468 | $ | 1,505 | — | ||||||
| Capital Lease |
455 | 455 | — | — | — | ||||||||||
| Purchase Obligations(2) |
7,036 | 7,036 | — | — | — | ||||||||||
| Net Pension Liability(3) |
775 | 11 | 33 | 350 | $ | 381 | |||||||||
| Total Contractual Obligations |
$ | 18,570 | $ | 11,833 | $ | 4,501 | $ | 1,855 | $ | 381 | |||||
| (1) | Represents mainly operating lease payments for facilities and vehicles under non-cancelable lease agreements. See Note 15 to Notes to Consolidated Financial Statements. |
| (2) | Represents purchase obligations with NXP pursuant to a Manufacturing Services Collaboration Agreement, as amended, we entered into with NXP in connection with the Acquisition. The amount of the purchase obligations set forth in the table includes payments due under agreements to purchase finished goods from NXP. See Note 14 to Notes to Consolidated Financial Statements. |
| (3) | Includes estimates of gross contributions required to meet the requirements of several defined benefit plans. Amounts are subject to change based upon the performance of plan assets, as well as the discount rate used to determine the plan obligations. We do not have any long-term debt. |
At December 31, 2009, we had a liability for unrecognized tax benefits and an accrual for the payment of related interests totaling $3.1 million. Due to the uncertainties related to those tax matters, we currently are unable to make a reasonably reliable estimate of when cash settlement with a taxing authority will occur.
Off-Balance Sheet Arrangements
We do not have any off-balance sheet arrangements, as such term is defined in recently enacted rules by the Securities and Exchange Commission, that have or are reasonably likely to have a current or future effect on our financial condition, changes in financial condition, revenues or expenses, results of operations, liquidity, capital expenditures or capital resources that are material to investors.
45
Table of Contents
| Item 7A. | QUANTITATIVE AND QUALITATIVE DISCLOSURES ABOUT MARKET RISK. |
Interest Rate Risk. It is our policy not to enter into interest rate derivative financial instruments, except for hedging of foreign currency exposures discussed below. We do not currently have any significant interest rate risk since we do not have any financial obligations.
The majority of our cash and cash equivalents are invested in high grade certificates of deposits with major U.S., European and Israeli banks. Generally, cash and cash equivalents and short term deposits may be redeemed and therefore minimal credit risk exists with respect to them. Nonetheless, cash deposits with these banks exceed the Federal Deposit Insurance Corporation (“FDIC”) insurance limits in the U.S. or similar limits in foreign jurisdictions, to the extent such deposits are even insured in such foreign jurisdictions. While we monitor on a systematic basis the cash balances and adjust the balances as appropriate, these balances could be impacted if one or more of the financial institutions with which we deposit our funds fails or is subject to other adverse conditions in the financial or credit markets. To date we have experienced no loss of principal or lack of access to our cash; however, we can provide no assurances that access to our cash will not be affected if the financial institutions that we hold our cash fail or the financial and credit markets continue to worsen.
We hold an investment portfolio of marketable securities consisting principally of debentures of U.S. corporations, and state and political subdivisions of the U.S. government. We intend, and have the ability, to hold such investments until recovery of any temporary declines in market value or maturity. We typically do not attempt to reduce or eliminate our market exposures on our investment securities because the majority of our investments are short-term. However, we can provide no assurances that we will recover present declines in the market value of our investments.
Interest rate fluctuations relating to our cash and cash equivalents and within our investment portfolio have not had, and we do not currently anticipate such fluctuations will have, a material affect on our financial position on an annual or quarterly basis.
Foreign Currency Exchange Rate Risk. A significant part of our sales and expenses are denominated in U.S. dollars. Part of our expenses in Israel is paid in NIS, which subjects us to the risks of foreign currency fluctuations between the U.S. dollar and the NIS. Our primary expenses paid in NIS are employee salaries and lease payments on our Israeli facilities. Furthermore, due to the Acquisition, a portion of our expenses for our European operations are paid in the Euro and Swiss Franc, which subjects us to the risks of foreign currency fluctuations between the U.S. dollar and the Euro and Swiss Franc. Our primary expenses paid in Euro and Swiss Franc are employee salaries, lease and operational payments on our European facilities. To partially protect the company against an increase in value of forecasted foreign currency cash flows resulting from salary and lease payments denominated in NIS during 2009, we instituted a foreign currency cash flow hedging program. The option and forward contracts used are designated as cash flow hedges, as defined by ASB ASC No. 815, “Derivatives and Hedging,” and are all effective as hedges of these expenses. For more information about our hedging activity, see Note 3 to the attached Notes to the Condensed Consolidated Financial Statement for the period ended December 31, 2009. An increase in the value of the NIS, Euro and Swiss Franc in comparison to the U.S. dollar could increase the cost of our research and development expenses and general and administrative expenses, all of which could harm our operating profit. Although we currently are using a hedging program to minimize the effects of currency fluctuations relating to the NIS, our hedging position is partial, may not exist at all in the future and may not succeed in minimizing our foreign currency fluctuation risks.
46
Table of Contents
| Item 8. | FINANCIAL STATEMENTS AND SUPPLEMENTARY DATA. |
47
Table of Contents

REPORT OF INDEPENDENT REGISTERED PUBLIC ACCOUNTING FIRM
To The Stockholders and Board of Directors of
DSP GROUP, INC.
We have audited the accompanying consolidated balance sheets of DSP Group, Inc. (the “Company”) as of December 31, 2009 and 2008, and the related consolidated statements of operations, changes in stockholders’ equity, and cash flows for each of the three years in the period ended December 31, 2009. Our audits also included the financial statement schedule listed in the Index at Item 15(a). These financial statements and schedule are the responsibility of the Company’s management. Our responsibility is to express an opinion on these financial statements and schedule based on our audits.
We conducted our audits in accordance with the standards of the Public Company Accounting Oversight Board (United States). Those standards require that we plan and perform the audit to obtain reasonable assurance about whether the financial statements are free of material misstatement. An audit includes examining, on a test basis, evidence supporting the amounts and disclosures in the financial statements. An audit also includes assessing the accounting principles used and significant estimates made by management, as well as evaluating the overall financial statement presentation. We believe that our audits provide a reasonable basis for our opinion.
In our opinion, the consolidated financial statements referred to above present fairly, in all material respects, the consolidated financial position of the Company at December 31, 2009 and 2008, and the consolidated results of its operations and its cash flows for each of the three years in the period ended December 31, 2009, in conformity with U.S. generally accepted accounting principles. Also, in our opinion, the related financial statement schedule, when considered in relation to the basic financial statements taken as a whole, presents fairly in all material respects the information set forth therein.
We also have audited, in accordance with the standards of the Public Company Accounting Oversight Board (United States), DSP Group, Inc.’s internal control over financial reporting as of December 31, 2009, based on criteria established in Internal Control-Integrated Framework issued by the Committee of Sponsoring Organizations of the Treadway Commission and our report dated March 16, 2010 expressed an unqualified opinion thereon.
| /s/ Kost Forer Gabbay & Kasierer
|
| KOST FORER GABBAY & KASIERER |
| A Member of Ernst & Young Global |
Tel-Aviv, Israel
March 16, 2010
48
Table of Contents

REPORT OF INDEPENDENT REGISTERED PUBLIC ACCOUNTING FIRM
To the Stockholders and Board of Directors of
DSP GROUP INC.
We have audited DSP Group, Inc.’s (the “Company”) internal control over financial reporting as of December 31, 2009, based on criteria established in Internal Control-Integrated Framework issued by the Committee of Sponsoring Organizations of the Treadway Commission (the “COSO criteria”). The Company’s management is responsible for maintaining effective internal control over financial reporting, and for its assessment of the effectiveness of internal control over financial reporting included in the accompanying Management’s Annual Report on Internal Control over Financial Reporting. Our responsibility is to express an opinion on the Company’s internal control over financial reporting based on our audit.
We conducted our audit in accordance with the standards of the Public Company Accounting Oversight Board (United States). Those standards require that we plan and perform the audit to obtain reasonable assurance about whether effective internal control over financial reporting was maintained in all material respects. Our audit included obtaining an understanding of internal control over financial reporting, assessing the risk that a material weakness exists, testing and evaluating the design and operating effectiveness of internal control based on the assessed risk, and performing such other procedures as we considered necessary in the circumstances. We believe that our audit provides a reasonable basis for our opinion.
A company’s internal control over financial reporting is a process designed to provide reasonable assurance regarding the reliability of financial reporting and the preparation of financial statements for external purposes in accordance with generally accepted accounting principles. A company’s internal control over financial reporting includes those policies and procedures that (1) pertain to the maintenance of records that, in reasonable detail, accurately and fairly reflect the transactions and dispositions of the assets of the company; (2) provide reasonable assurance that transactions are recorded as necessary to permit preparation of financial statements in accordance with generally accepted accounting principles, and that receipts and expenditures of the company are being made only in accordance with authorizations of management and directors of the company; and (3) provide reasonable assurance regarding prevention or timely detection of unauthorized acquisition, use, or disposition of the company’s assets that could have a material effect on the financial statements.
Because of its inherent limitations, internal control over financial reporting may not prevent or detect misstatements. Also, projections of any evaluation of effectiveness to future periods are subject to the risk that controls may become inadequate because of changes in conditions, or that the degree of compliance with the policies or procedures may deteriorate.
In our opinion, the Company maintained, in all material respects, effective internal control over financial reporting as of December 31, 2009, based on the COSO criteria.
We also have audited, in accordance with the standards of the Public Company Accounting Oversight Board (United States), the consolidated balance sheets of the Company as of December 31, 2009 and 2008, and the related consolidated statements of operations, changes in stockholders’ equity and cash flows for each of the three years in the period ended December 31, 2009 and our report dated March 16, 2010 expressed an unqualified opinion thereon.
| /s/ Kost Forer Gabbay & Kasierer
|
| KOST FORER GABBAY & KASIERER |
| A Member of Ernst & Young Global |
Tel-Aviv, Israel
March 16, 2010
49
Table of Contents
CONSOLIDATED BALANCE SHEETS
U.S. dollars in thousands
| December 31, | ||||||
| 2009 | 2008 | |||||
| ASSETS |
||||||
| CURRENT ASSETS: |
||||||
| Cash and cash equivalents |
$ | 37,986 | $ | 68,886 | ||
| Restricted deposits |
120 | 115 | ||||
| Marketable securities and short-term deposits |
19,567 | 12,449 | ||||
| Trade receivables, net |
28,352 | 39,603 | ||||
| Deferred income taxes |
178 | 306 | ||||
| Other accounts receivable and prepaid expenses |
12,162 | 14,607 | ||||
| Inventories |
12,427 | 14,098 | ||||
| Related party receivable |
— | 2,760 | ||||
| Total current assets |
110,792 | 152,824 | ||||
| PROPERTY AND EQUIPMENT, NET |
10,090 | 14,822 | ||||
| LONG-TERM ASSETS: |
||||||
| Long-term marketable securities and deposits |
65,392 | 40,051 | ||||
| Long-term prepaid expenses and lease deposits |
1,286 | 1,331 | ||||
| Deferred income taxes |
15 | 212 | ||||
| Severance pay fund |
9,521 | 7,286 | ||||
| Intangible assets, net |
20,473 | 32,728 | ||||
| Investment in other companies |
2,200 | — | ||||
| 98,887 | 81,608 | |||||
| Total assets |
$ | 219,769 | $ | 249,254 | ||
The accompanying notes are an integral part of the consolidated financial statements.
50
Table of Contents
DSP GROUP, INC.
CONSOLIDATED BALANCE SHEETS
U.S. dollars in thousands, except share and per share data
| December 31, | ||||||||
| 2009 | 2008 | |||||||
| LIABILITIES AND STOCKHOLDERS’ EQUITY |
||||||||
| CURRENT LIABILITIES: |
||||||||
| Trade payables |
$ | 18,309 | $ | 12,721 | ||||
| Accrued compensation and benefits |
9,900 | 11,490 | ||||||
| Income tax accruals and payables |
2,939 | 15,878 | ||||||
| Accrued expenses and other accounts payable |
11,631 | 12,070 | ||||||
| Related party payables |
— | 8,306 | ||||||
| Total current liabilities |
42,779 | 60,465 | ||||||
| LONG-TERM LIABILITIES: |
||||||||
| Accrued severance pay |
10,572 | 8,008 | ||||||
| Accrued pensions |
929 | 1,675 | ||||||
| Deferred tax liabilities |
— | 24 | ||||||
| Other long-term liability |
— | 455 | ||||||
| Total long-term liabilities |
11,501 | 10,162 | ||||||
| COMMITMENTS AND CONTINGENCIES |
||||||||
| STOCKHOLDERS’ EQUITY: |
||||||||
| Capital stock: |
||||||||
| Preferred stock, $ 0.001 par value—Authorized shares: 5,000,000 shares at December 31, 2009 and 2008; Issued and outstanding shares: none at December 31, 2009 and 2008 |
— | — | ||||||
| Common stock, $ 0.001 par value—Authorized shares: 50,000,000 shares at December 31, 2009 and 2008; Issued and outstanding shares: 22,901,051 and 26,730,914 shares at December 31, 2009 and 2008, respectively |
23 | 27 | ||||||
| Additional paid-in capital |
325,579 | 314,479 | ||||||
| Treasury stock |
(123,350 | ) | (107,744 | ) | ||||
| Accumulated other comprehensive income |
2,174 | 51 | ||||||
| Accumulated deficit |
(38,937 | ) | (28,186 | ) | ||||
| Total stockholders’ equity |
165,489 | 178,627 | ||||||
| Total liabilities and stockholders’ equity |
$ | 219,769 | $ | 249,254 | ||||
The accompanying notes are an integral part of the consolidated financial statements.
51
Table of Contents
CONSOLIDATED STATEMENTS OF OPERATIONS
U.S. dollars in thousands, except share and per share data
| Year ended December 31, | ||||||||||||
| 2009 | 2008 | 2007 | ||||||||||
| Revenues |
$ | 212,186 | $ | 305,800 | $ | 248,788 | ||||||
| Costs of revenues (including $8,013, $78,118 and $33,165 with related party for the years ended December 31, 2009, 2008 and 2007, respectively)(1) |
133,590 | 191,811 | 148,075 | |||||||||
| Gross profit |
78,596 | 113,989 | 100,713 | |||||||||
| Operating expenses: |
||||||||||||
| Research and development(2) |
56,148 | 73,856 | 58,488 | |||||||||
| Sales and marketing(3) |
17,889 | 22,712 | 19,060 | |||||||||
| General and administrative(4) |
15,228 | 17,871 | 14,614 | |||||||||
| In-process research and development write-off |
— | — | 10,350 | |||||||||
| Amortization of intangible assets |
12,258 | 22,853 | 11,102 | |||||||||
| Impairment of goodwill and other intangible assets |
— | 181,534 | — | |||||||||
| Restructuring cost and other |
— | 1,870 | — | |||||||||
| Total operating expenses |
101,523 | 320,696 | 113,614 | |||||||||
| Operating loss |
(22,927 | ) | (206,707 | ) | (12,901 | ) | ||||||
| Financial income, net |
2,857 | 160 | 10,541 | |||||||||
| Loss before taxes on income |
(20,070 | ) | (206,547 | ) | (2,360 | ) | ||||||
| Taxes on income (income tax benefit)(5) |
(11,634 | ) | 5,847 | 2,393 | ||||||||
| Net loss |
$ | (8,436 | ) | $ | (212,394 | ) | $ | (4,753 | ) | |||
| Net loss per share: |
||||||||||||
| Basic and Diluted |
$ | (0.36 | ) | $ | (7.48 | ) | $ | (0.16 | ) | |||
| Weighted average number of shares used in per share computations of net loss: |
||||||||||||
| Basic and Diluted |
23,655 | 28,387 | 29,495 | |||||||||
| (1) | Includes equity-based compensation expense in the amount of $778, $919 and $663 for the years ended December 31, 2009, 2008 and 2007, respectively. |
| (2) | Includes equity-based compensation expense in the amount of $5,253, $7,247 and $7,143 for the years ended December 31, 2009, 2008 and 2007, respectively. |
| (3) | Includes equity-based compensation expense in the amount of $1,773, $1,696 and $1,616 for the years ended December 31, 2009, 2008 and 2007, respectively. |
| (4) | Includes equity-based compensation expense in the amount of $3,296, $4,076 and $4,600 for the years ended December 31, 2009, 2008 and 2007, respectively. |
| (5) | Includes tax benefit (expenses) resulting from equity-based compensation expense in the amount of $0, $(1,070) and $580 for the years ended December 31, 2009, 2008 and 2007, respectively. The tax expense above in 2008 is comprised of a tax benefit of $459 offset by an increase in the deferred tax valuation allowance of $1,529. |
The accompanying notes are an integral part of the consolidated financial statements.
52
Table of Contents
STATEMENTS OF CHANGES IN STOCKHOLDERS’ EQUITY
U.S. dollars and shares in thousands
| Number of shares of common stock |
Common stock amount |
Additional paid-in capital |
Treasury stock |
Accumulated other comprehensive income |
Retained earnings (accumulated deficit) |
Total comprehensive income (loss) |
Total stockholders’ equity |
|||||||||||||||||||||||
| Balance at January 1, 2007 |
28,378 | $ | 28 | $ | 216,041 | $ | (44,546 | ) | $ | 28 | $ | 195,198 | $ | 366,749 | ||||||||||||||||
| Issuance of treasury stock upon purchase of ESPP shares by employees |
93 | (* | ) | — | 2,124 | — | (456 | ) | 1,668 | |||||||||||||||||||||
| Issuance of treasury stock upon exercise of stock options by employees |
190 | (* | ) | — | 4,317 | — | (1,441 | ) | 2,876 | |||||||||||||||||||||
| Tax benefit related to exercise of stock options |
— | — | 147 | — | — | — | 147 | |||||||||||||||||||||||
| Issuance of shares in relation to the acquisition of the cordless and VoIP terminals business of NXP B.V. (“Acquisition”) |
4,187 | 4 | 70,331 | — | — | — | 70,335 | |||||||||||||||||||||||
| Purchase of treasury stock |
(1,618 | ) | (1 | ) | (25,698 | ) | — | — | (25,699 | ) | ||||||||||||||||||||
| Equity-based compensation expenses for employees |
— | — | 14,022 | — | — | — | 14,022 | |||||||||||||||||||||||
| Cumulative impact of change in accounting for uncertainties in income taxes |
— | — | — | — | — | (1,485 | ) | (1,485 | ) | |||||||||||||||||||||
| Total comprehensive loss: |
||||||||||||||||||||||||||||||
| Net loss |
— | — | — | — | — | (4,753 | ) | $ | (4,753 | ) | (4,753 | ) | ||||||||||||||||||
| Change in unrealized gain from hedging activities, net |
— | — | — | — | 453 | — | 453 | 453 | ||||||||||||||||||||||
| Change in unrealized loss from marketable securities |
— | — | — | — | (223 | ) | — | (223 | ) | (223 | ) | |||||||||||||||||||
| Change in unrealized loss from pension |
— | — | — | — | (277 | ) | — | (277 | ) | (277 | ) | |||||||||||||||||||
| Change in foreign currency translation adjustments, net |
— | — | — | — | 1,044 | — | 1,044 | 1,044 | ||||||||||||||||||||||
| Total comprehensive loss |
$ | (3,756 | ) | |||||||||||||||||||||||||||
| Balance at December 31, 2007 |
31,230 | $ | 31 | $ | 300,541 | $ | (63,803 | ) | $ | 1,025 | $ | 187,063 | $ | 424,857 | ||||||||||||||||
| Issuance of treasury stock upon purchase of ESPP shares by employees |
290 | (* | ) | — | 4,901 | — | (2,811 | ) | 2,090 | |||||||||||||||||||||
| Issuance of treasury stock upon exercise of stock options by employees |
9 | (* | ) | — | 145 | — | (44 | ) | 101 | |||||||||||||||||||||
| Purchase of treasury stock |
(4,798 | ) | (4 | ) | — | (48,987 | ) | — | — | (48,991 | ) | |||||||||||||||||||
| Equity-based compensation expenses |
— | — | 13,938 | — | — | — | 13,938 | |||||||||||||||||||||||
| Total comprehensive loss: |
||||||||||||||||||||||||||||||
| Net loss |
— | — | — | — | — | (212,394 | ) | $ | (212,394 | ) | (212,394 | ) | ||||||||||||||||||
| Change in unrealized loss from hedging activities, net |
— | — | — | — | (508 | ) | — | (508 | ) | (508 | ) | |||||||||||||||||||
| Change in unrealized loss from marketable securities |
— | — | — | — | 69 | — | 69 | 69 | ||||||||||||||||||||||
| Change in unrealized loss from pension |
— | — | — | — | 236 | — | 236 | 236 | ||||||||||||||||||||||
| Change in foreign currency translation adjustments, net |
— | — | — | — | (771 | ) | — | (771 | ) | (771 | ) | |||||||||||||||||||
| Total comprehensive loss |
$ | (213,368 | ) | |||||||||||||||||||||||||||
| Balance at December 31, 2008 |
26,731 | $ | 27 | $ | 314,479 | $ | (107,744 | ) | $ | 51 | $ | (28,186 | ) | $ | 178,627 | |||||||||||||||
| (*) | Represents an amount lower than $1. |
The accompanying notes are an integral part of the consolidated financial statements.
53
Table of Contents
DSP GROUP INC.
STATEMENTS OF CHANGES IN STOCKHOLDERS’ EQUITY
U.S. dollars and shares in thousands
| Number of shares of common stock |
Common stock amount |
Additional paid-in capital |
Treasury stock |
Accumulated other comprehensive income |
Retained earnings |
Total comprehensive income (loss) |
Total stockholders’ equity |
||||||||||||||||||||||
| Balance at December 31, 2008 |
26,731 | $ | 27 | $ | 314,479 | $ | (107,744 | ) | $ | 51 | $ | (28,186 | ) | $ | 178,627 | ||||||||||||||
| Issuance of treasury stock upon purchase of ESPP shares by employees |
357 | (* | ) | — | 4,418 | — | (2,315 | ) | 2,103 | ||||||||||||||||||||
| Purchase of treasury stock |
(4,187 | ) | (4 | ) | — | (20,024 | ) | — | — | (20,028 | ) | ||||||||||||||||||
| Equity-based compensation expenses |
— | — | 11,100 | — | — | — | 11,100 | ||||||||||||||||||||||
| Total comprehensive loss: |
|||||||||||||||||||||||||||||
| Net loss |
— | — | — | — | (8,436 | ) | $ | (8,436 | ) | (8,436 | ) | ||||||||||||||||||
| Change in unrealized gain from hedging activities, net |
— | — | — | — | 253 | — | 253 | 253 | |||||||||||||||||||||
| Change in unrealized gain from marketable securities |
— | — | — | — | 1,344 | — | 1,344 | 1,344 | |||||||||||||||||||||
| Change in unrealized gain from pension |
— | — | — | — | 464 | — | 464 | 464 | |||||||||||||||||||||
| Change in foreign currency translation adjustments, net |
— | — | — | — | 62 | — | 62 | 62 | |||||||||||||||||||||
| Total comprehensive loss |
$ | (6,313 | ) | ||||||||||||||||||||||||||
| Balance at December 31, 2009 |
22,901 | $ | 23 | $ | 325,579 | $ | (123,350 | ) | $ | 2,174 | $ | (38,937 | ) | $ | 165,489 | ||||||||||||||
| (*) | Represents an amount lower than $1. |
The accompanying notes are an integral part of the consolidated financial statements.
54
Table of Contents
CONSOLIDATED STATEMENTS OF CASH FLOWS
U.S. dollars in thousands
| Year ended December 31, | ||||||||||||
| 2009 | 2008 | 2007 | ||||||||||
| Cash flows from operating activities: |
||||||||||||
| Net loss |
$ | (8,436 | ) | $ | (212,394 | ) | $ | (4,753 | ) | |||
| Adjustments required to reconcile net loss to net cash provided by operating activities: |
||||||||||||
| Depreciation |
7,216 | 7,335 | 6,081 | |||||||||
| Equity-based compensation expenses related to employees’ stock options |
11,100 | 13,938 | 14,022 | |||||||||
| Decrease (increase) in deferred income taxes assets, net |
308 | 8,248 | (4,892 | ) | ||||||||
| Capital loss (gain) from sale and disposal of property and equipment |
38 | 552 | (10 | ) | ||||||||
| Loss (profit) from sale of marketable securities and other-than-temporary impairment on marketable securities |
(933 | ) | 3,065 | 1,510 | ||||||||
| Amortization and impairment of other intangible assets and impairment of goodwill |
12,258 | 204,815 | 11,868 | |||||||||
| In-process research and development write-off |
— | — | 10,350 | |||||||||
| Accrued interest and amortization of premium on marketable securities and short-term deposits |
496 | 1,298 | 3,162 | |||||||||
| Profit from realization of foreign currency translation adjustment |
— | (341 | ) | — | ||||||||
| Decrease (increase) in trade receivables, net |
11,388 | 12,556 | (30,147 | ) | ||||||||
| Decrease (increase) in other accounts receivable and prepaid expenses |
5,432 | (7,357 | ) | 23,542 | ||||||||
| Decrease in inventories |
1,642 | 2,110 | 1,488 | |||||||||
| Decrease (increase) in long-term prepaid expenses and lease deposits |
46 | (637 | ) | (22 | ) | |||||||
| Increase (decrease) in trade payables |
7,130 | (7,107 | ) | 6,679 | ||||||||
| Increase (decrease) in accrued compensation and benefits |
533 | (5,574 | ) | 3,612 | ||||||||
| Increase (decrease) in income taxes payable |
(12,941 | ) | 1,752 | 1,645 | ||||||||
| Decrease in accrued expenses and other accounts payable |
(1,068 | ) | (568 | ) | (181 | ) | ||||||
| Increase in accrued severance pay, net |
328 | 302 | 44 | |||||||||
| Increase (decrease) in accrued pensions |
(282 | ) | 177 | 146 | ||||||||
| Increase (decrease) in related party receivable/payable |
(7,658 | ) | (5,800 | ) | 11,346 | |||||||
| Net cash provided by operating activities |
26,597 | 16,370 | 55,490 | |||||||||
| Cash flows from investing activities: |
||||||||||||
| Purchase of marketable securities and deposits |
(86,144 | ) | (48,081 | ) | (63,482 | ) | ||||||
| Proceeds from maturity and sale of marketable securities and deposits |
55,461 | 89,438 | 271,974 | |||||||||
| Proceeds from sale of property and equipment |
— | — | 68 | |||||||||
| Purchase of property and equipment |
(4,527 | ) | (8,185 | ) | (3,395 | ) | ||||||
| Investment in other company |
(2,200 | ) | — | — | ||||||||
| Payment for acquisition of the cordless and VoIP Terminals business of NXP B.V.(1) |
— | (843 | ) | (206,040 | ) | |||||||
| Net cash provided by (used in) investing activities |
(37,410 | ) | 32,329 | (875 | ) | |||||||
The accompanying notes are an integral part of the consolidated financial statements.
55
Table of Contents
DSP GROUP, INC.
CONSOLIDATED STATEMENTS OF CASH FLOWS
U.S. dollars in thousands
| Year ended December 31, | ||||||||||||
| 2009 | 2008 | 2007 | ||||||||||
| Cash flows from financing activities: |
||||||||||||
| Issuance of common stock and treasury stock upon exercise of stock options |
— | 101 | 3,116 | |||||||||
| Purchase of treasury stock |
(20,028 | ) | (48,991 | ) | (25,699 | ) | ||||||
| Tax benefit related to exercise of stock options |
— | — | 130 | |||||||||
| Net cash used in financing activities |
(20,028 | ) | (48,890 | ) | (22,453 | ) | ||||||
| Increase (decrease) in cash and cash equivalents |
(30,841 | ) | (191 | ) | 32,162 | |||||||
| Cash and cash equivalents at the beginning of the year |
68,886 | 69,586 | 37,344 | |||||||||
| Cash (erosion) due to exchange rate differences |
(59 | ) | (509 | ) | 80 | |||||||
| Cash and cash equivalents at the end of the year |
$ | 37,986 | $ | 68,886 | $ | 69,586 | ||||||
| Supplemental disclosures of cash flows activities: |
||||||||||||
| Cash paid during the year for: |
||||||||||||
| Taxes on income |
$ | 2,457 | $ | 3,193 | $ | 6,777 | ||||||
| (1) | On September 4, 2007, the Company acquired certain assets and assumed certain liabilities of the cordless and VoIP terminals business of NXP B.V. |
The net fair value of the assets acquired and the liabilities assumed, on the date of the Acquisition, was as follows:
| Working capital, excluding cash and cash equivalents |
$ | 18,600 | ||
| Pension liability |
(1,298 | ) | ||
| Property and equipment |
2,798 | |||
| Technology |
77,080 | |||
| Backlog |
4,449 | |||
| In-process research and development |
10,350 | |||
| Customer relations |
23,321 | |||
| Trademarks |
590 | |||
| Goodwill |
140,762 | |||
| 276,652 | ||||
| Issuance of shares |
(70,335 | ) | ||
| Unpaid transaction costs |
(277 | ) | ||
| $ | 206,040 | |||
The accompanying notes are an integral part of the consolidated financial statements.
56
Table of Contents
NOTES TO CONSOLIDATED FINANCIAL STATEMENTS
U.S. dollars in thousands, except share and per share data
NOTE 1:- GENERAL
DSP Group, Inc. (the “Company”), a Delaware corporation, and its subsidiaries, collectively, are a fabless semiconductor company offering advanced chipset solutions for a variety of applications. The Company is a worldwide leader in the short-range wireless communication market, enabling home networking convergence for voice, audio, video and data.
All of the Company’s integrated circuit products are manufactured and tested by independent foundries and test houses. While these foundries and test houses have been able to adequately meet the demands of the Company’s business, the Company is and will continue to be dependent upon these foundries and test houses to achieve acceptable manufacturing yields, quality levels and costs, and to allocate to the Company a sufficient portion of foundry and test capacity to meet the Company’s needs in a timely manner. For the manufacturing services with NYP B.V., see also Note 14. Revenues could be materially and adversely affected should any of these foundries and test houses fail to meet the Company’s request for products due to a shortage of production capacity, process difficulties, low yield rates or financial instability. Additionally, certain of the raw materials, components, and subassemblies included in the products manufactured by the Company’s original equipment manufacturer (OEM) customers, which incorporate the Company’s products, are obtained from a limited group of suppliers. Disruptions, shortages, or termination of certain of these sources of supply could occur and could negatively affect the Company’s financial condition and results of operations.
The Company sells its products primarily through distributors and directly to original equipment manufacturers (OEMs) and original design manufacturers (ODMs) who incorporate the Company’s products into consumer products. The Company’s future performance will depend, in part, on the continued success of its distributors in marketing and selling its products. The loss of the Company’s distributors and the Company’s inability to obtain satisfactory replacements in a timely manner may harm the Company’s sales and results of operations. In addition, the Company expects that a limited number of customers, varying in identity from period-to-period, will account for a substantial portion of its revenues in any period. A significant amount of its revenues will continue to be derived from a limited number of large customers. The loss of, or reduced demand for products from, any of the Company’s major customers could have a material adverse effect on the Company’s business, financial condition and results of operations.
Sales to Hong Kong-based VTech Holdings Ltd. (“VTech”) represented 29%, 21% and 10% of the Company’s total revenues for 2009, 2008 and 2007, respectively. Revenues derived from sales through one distributor, Tomen Electronics Corporation (“Tomen Electronics”), accounted for 22%, 25% and 37% of the Company’s total revenues for 2009, 2008 and 2007, respectively. The Japanese market and the OEMs that operate in that market are among the largest suppliers in the world with significant market share in the U.S. market for residential wireless products. Tomen Electronics sells the Company’s products to a limited number of customers. One customer, Panasonic Communications Co., Ltd. (“Panasonic”), has continually accounted for a majority of the sales of Tomen Electronics. Sales to Panasonic through Tomen Electronics generated approximately 13%, 13% and 23% of the Company’s total revenues for 2009, 2008 and 2007, respectively. Additionally, sales to Uniden America Corporation (“Uniden”) through Tomen Electronics or directly to Uniden represented 12%, 13% and 13% of the Company’s total revenues for the 2009, 2008 and 2007 respectively. Sales to CCT Telecom Holdings Ltd. represented 8%, 9% and 12% of the Company’s total revenues for 2009, 2008 and 2007, respectively.
During the second half of 2008, the Company faced an adverse change in the business climate in which it operates, due to a significant downturn in the semiconductors industry that led to a significant decrease in demand for the Company’s products. The Company realized that its future corporate sales would be adversely impacted by the market downturn.
57
Table of Contents
DSP GROUP INC.
NOTES TO CONSOLIDATED FINANCIAL STATEMENTS—(Continued)
U.S. dollars in thousands, except share and per share data
As a result, the Company concluded that impairment indicators existed as of December 31, 2008. The Company recorded in 2008 an impairment of intangible assets and goodwill as follows:
| 1. | Goodwill—approximately $142,450 |
| 2. | Intangible assets—approximately $39,084 (see Note 8) |
Acquisition (the “Acquisition”) of the Cordless and VoIP Terminals Business (the “CIPT Business”) of NXP B.V. (“NXP”),
On September 4, 2007, the Company acquired certain assets and assumed certain liabilities of the CIPT Business, then a part of the Mobile and Personal Business Unit of NXP.
The CIPT Business targets applications for the cordless and VoIP residential telephony market, mainly European (1.9GHz) telephony (DECT). In connection with the Acquisition, the Company paid NXP approximately $200,000 in cash and issued 4,186,603 shares of the Company’s Common stock to NXP. With the Acquisition, the Company sought to elevate the cordless and VoIP terminals business, leverage NXP’s customer relations in Europe and introduce to the market products containing new features and applications. In connection with the Acquisition, the Company entered into a manufacturing agreement, which was subsequently amended, with NXP for the production of the products constituting the CIPT Business (See Note 14).
The Acquisition was accounted for using the purchase method of accounting. Accordingly, the purchase price was allocated to the assets acquired and the liabilities assumed based on the estimated fair value on the date of the Acquisition. The allocation period ended on December 28, 2007, when the Company determined that it had the information necessary to properly identify and measure the fair value of the assets acquired and the liabilities assumed.
The results of operations of the CIPT Business have been included in the Company’s consolidated financial statements since September 4, 2007.
The total consideration of $277,218 (including estimated transaction costs of $5,718, which included investment banking fees, legal and accounting fees, and other external costs directly related to the Acquisition) for the CIPT Business included payments to NXP of (i) cash in the amount of $201,123 and (ii) 4,186,603 newly issued shares of the Company’s common stock, with an aggregate value of $70,377.
58
Table of Contents
DSP GROUP INC.
NOTES TO CONSOLIDATED FINANCIAL STATEMENTS—(Continued)
U.S. dollars in thousands, except share and per share data
Based upon a valuation of the tangible and intangible assets acquired and liabilities assumed, the Company allocated the total cost of the Acquisition as follows:
| As of September 4, 2007 |
||||
| Current assets |
$ | 29,551 | ||
| Property and equipment |
2,798 | |||
| Other non-current assets |
286 | |||
| Intangible assets: |
||||
| Goodwill |
140,762 | |||
| In-process research and development |
10,350 | |||
| Current technology |
77,080 | |||
| Customer relations |
23,321 | |||
| Trade name and trademark |
590 | |||
| Backlog |
4,449 | |||
| Total assets acquired |
289,187 | |||
| Liabilities assumed: |
||||
| Current liabilities |
(4,671 | ) | ||
| Restructuring accrual |
(6,000 | ) | ||
| Pension liability |
(1,298 | ) | ||
| Net assets acquired |
$ | 277,218 | ||
In performing the purchase price allocation, the Company considered, among other factors, the intention for future use of the acquired assets, analyses of historical financial performance and estimates of future performance of the CIPT Business’ products. The fair value of the intangible assets was based on a valuation using an income approach and estimates and assumptions provided by management.
The amount allocated to in-process research and development (“IPR&D”) of the cordless and VoIP technologies was determined using the income approach. These technologies were considered to have no alternative future use, other than the technological indications for which they were in development, and no technological feasibility had been established. Accordingly, this amount was expensed in the consolidated statement of operations, upon consummation of the Acquisition.
The amount of the excess cost attributable to current technologies related to VoIP and cordless technologies, other than the technology that was identified as IPR&D, was determined using the income approach on the basis of the present value of cash flows attributable to the current VoIP and cordless technologies and is amortized on a straight-line basis over expected future life of between four to five years. The expected future life period was estimated based on the duration of the cash flow associated with the existing technologies and management’s estimates of its useful life.
The value assigned to customer relations was determined using the income approach. This valuation was based on the backlog on the date of the Acquisition, historical revenues by customer and customer renewal rates, and is amortized using the accelerated method over 11 years, which is the expected cash flow utilization period.
The value of trade names and trademarks was based on cost to generate and maintain such intellectual property. This cost was estimated based on historical advertising and promotion spending and is amortized on a straight-line basis over two years.
The value assigned to the backlog was determined using the income approach and is amortized on a straight line basis over 0.3 years.
59
Table of Contents
DSP GROUP INC.
NOTES TO CONSOLIDATED FINANCIAL STATEMENTS—(Continued)
U.S. dollars in thousands, except share and per share data
The excess of the cost of $140,762 over the net aggregate amounts assigned to assets acquired and liabilities assumed was recognized as goodwill. An acquired workforce that did not meet the separability criteria was included in the amount assigned to goodwill. The goodwill recognized represented mainly the synergies, both in revenues and expenses, the Company expected of the CIPT Business and the expected benefits to the Company from the acquisition of a major competitor in the cordless and VoIP market.
Following the Acquisition, the Company approved a plan to restructure certain operations of the CIPT Business to eliminate redundant costs resulting from the Acquisition and improve operational efficiencies. The restructuring charges recorded were based on the Company management’s best estimates.
The estimated restructuring costs associated with exiting activities of the CIPT Business totaled $6,000, consisting primarily of employee severance costs. These costs were recognized as a liability assumed in the Acquisition and included in the allocation of the cost to acquire the CIPT Business and, accordingly, resulted in an increase in goodwill. The Company finalized the restructuring plan as of June 30, 2008. All restructuring costs related to that plan were paid in cash.
The unaudited pro forma information below assumes that the Acquisition was consummated on January 1, 2007, included the effect of amortization of intangibles and other assets and did not include the IPR&D write-off on this date. This data is presented for information purposes only and is not necessarily indicative of the results of future operations or the results that would have been achieved had the Acquisition taken place on January 1, 2007. The pro forma information is as follows:
| Year ended December 31, 2007 | |||
| Unaudited | |||
| Net revenues |
$ | 366,195 | |
| Net income |
$ | 3,217 | |
| Net earning per share—basic |
$ | 0.10 | |
| Net earning per share—diluted |
$ | 0.10 | |
NOTE 2:- RESTRUCTURING COSTS AND OTHER
Following the Acquisition, the Company approved a plan to restructure certain operations of the CIPT Business to eliminate redundant costs resulting from the Acquisition and improve operational efficiencies.
The restructuring costs associated with exiting activities of the CIPT Business totaled $6,000, consisting primarily of employee severance costs. These costs were recognized as a liability assumed in the Acquisition and included in the allocation of the cost to acquire the CIPT Business and, accordingly, resulted in an increase in goodwill. The Company finalized the restructuring plan as of June 30, 2008. All restructuring costs relating to the restructuring plan were paid in cash.
During the third quarter of 2008, the Company initiated an additional restructuring plan to improve operating efficiency at its various operating sites and to reduce its operating expenses for 2009. As a significant majority of the restructuring associated with the additional restructuring plan occurred during the third quarter of 2008, the Company recognized an expense of $1,870 mainly for employee contract termination costs on its statement of operations for the third quarter of 2008. This expense amount is net of $537 of gain resulting from
60
Table of Contents
DSP GROUP INC.
NOTES TO CONSOLIDATED FINANCIAL STATEMENTS—(Continued)
U.S. dollars in thousands, except share and per share data
adjustments made to the Company’s employee pension liabilities associated with employees whose employment was terminated in connection with the restructuring plan. As of December 31, 2008, payments aggregating $1,609 were made in connection with the additional restructuring plan.
Summary of the plan:
| Initial costs |
Adjustments to cost |
Cash payments |
Accrued as of December 31, 2008 |
Total costs | |||||||||||||
| Severance and related benefits |
$ | 1,920 | $ | (42 | ) | $ | (1,441 | ) | $ | 437 | $ | 1,878 | |||||
| Other |
487 | 42 | (168 | ) | 361 | 529 | |||||||||||
| Total restructuring and other |
$ | 2,407 | $ | — | $ | (1,609 | ) | $ | 798 | $ | 2,407 | ||||||
The Company has finalized the restructuring plan as of June 30, 2009 and all restructuring costs relating to the restructuring plan have been paid in cash.
NOTE 3:- SIGNIFICANT ACCOUNTING POLICIES
Use of estimates
The preparation of financial statements in conformity with U.S. generally accepted accounting principles requires management to make estimates, judgments and assumptions. The Company’s management believes that the estimates, judgments and assumptions used are reasonable based upon information available at the time that these estimates, judgments and assumptions are made. These estimates, judgments and assumptions can affect the reported amounts of assets and liabilities and disclosure of contingent assets and liabilities at the dates of the financial statements, and the reported amounts of revenue and expenses during the reporting period. Actual results could differ from those estimates.
Financial statements in U.S. dollars
Most of the revenues of the Company and its subsidiaries are generated in U.S. dollars (“dollar”). In addition, a substantial portion of the costs of the Company and its subsidiaries are incurred in dollars. The Company’s management believes that the dollar is the currency of the primary economic environment in which the Company and its subsidiaries operate. Thus, the functional and reporting currency of the Company and its subsidiaries is the dollar.
Monetary accounts maintained in currencies other than the dollar are remeasured into dollars in accordance with Financial Accounting Standards Board (“FASB”) Accounting Standards Code (“ASC”) No. 830-30, “Translation of Financial Statement.” All transaction gains and losses resulting from the remeasurement of monetary balance sheet items are reflected in the consolidated statements of operations as financial income or expenses as appropriate, and have not been significant to date for all years presented.
As a result of the Acquisition, the financial statements of the Company’s subsidiaries whose functional currency is not the dollar, specifically DSP Group Technologies GmbH and DSP Group France SAS (which was liquidated as of July 2008) have been translated into dollars. All amounts on the balance sheets have been translated into the dollar using the exchange rates in effect on the relevant balance sheet dates. All amounts in the statements of operations have been translated into the dollar using the average exchange rate for the relevant periods. The resulting translation adjustments are reported as a component of accumulated other comprehensive income in stockholders’ equity.
61
Table of Contents
DSP GROUP INC.
NOTES TO CONSOLIDATED FINANCIAL STATEMENTS—(Continued)
U.S. dollars in thousands, except share and per share data
Accumulated other comprehensive income related to foreign currency translation adjustments, net, amounted to $335 and $273 as of December 31, 2009 and 2008, respectively. In 2008, an amount of $341 was transferred from accumulated other comprehensive income to the consolidated statement of operations as a result of the liquidation of DSP Group France SAS as of July 2008.
Principles of consolidation
The consolidated financial statements include the accounts of the Company and its subsidiaries. Intercompany transactions and balances have been eliminated in consolidation.
Cash and cash equivalents
The Company and its subsidiaries consider all highly liquid investments, which are readily convertible to cash with a maturity of three months or less at the date of acquisition, to be cash equivalents.
Short-term deposits
Bank deposits with original maturities of more than three months and less than one year are presented at cost, including accrued interest.
Marketable securities
The Company and its subsidiaries account for investments in debt and equity securities in accordance with FASB ASC No. 320-10, “Investments in Debt and Equity Securities.” Management determines the appropriate classification of the Company’s investments in debt and equity securities at the time of purchase and reevaluates such determinations at each balance sheet date.
The Company classified all of its investments in marketable securities as available for sale.
Available-for-sale securities are carried at fair value, with the unrealized gains and losses, net of taxes, reported in other comprehensive income using the specific identification method. Unrealized losses determined to be other-than-temporary are recorded as a financial expense. The amortized cost of marketable securities is adjusted for amortization of premiums and accretion of discounts to maturity. Such amortization is included in financial income. Interest and dividends on securities are included in financial income.
Prior to the second quarter of 2007, marketable securities were classified as held-to-maturity as the Company previously had the intent and ability to hold the securities to maturity and were stated at amortized cost.
Due to the anticipated Acquisition, beginning in the second quarter of 2007, the Company classified its debt securities as available-for-sale. Since the Company did not have the intent to hold the securities until maturity, the Company changed the classification of its investments from held-to-maturity to available-for-sale. As a result of the sale of securities in connection with the Acquisition, the Company recognized an impairment loss on its marketable securities in the amount of approximately $1,500.
The marketable securities are periodically reviewed for impairment. If management concludes that any of these investments are impaired, management determines whether such impairment is other-than-temporary. Factors considered in making such a determination include the duration and severity of the impairment, the reason for the decline in value and the potential recovery period, and the Company’s intent to sell, or whether it is more likely than not that the Company will be required to sell the investment before recovery of cost basis. If any impairment is considered “other-than-temporary”, the investment is written down to its fair value through a
62
Table of Contents
DSP GROUP INC.
NOTES TO CONSOLIDATED FINANCIAL STATEMENTS—(Continued)
U.S. dollars in thousands, except share and per share data
corresponding charge to financial income, net. For the year ended December 31, 2008, the Company recorded an other-than-temporary impairment loss in the amount of $2,961 as financial expenses. During 2009, the Company recorded $531 of gains from the realization of that previously impaired available-for-sale security. (See note 4).
Fair value of financial instruments
Cash and cash equivalents, short-term deposits, marketable securities, trade receivables, trade payables and accrued liabilities are measured at fair values.
Fair value is an exit price, representing the amount that would be received for selling an asset or paid to transfer a liability in an orderly transaction between market participants. As such, fair value is a market-based measurement that should be determined based on assumptions that market participants would use in pricing an asset or a liability. A three-tier fair value hierarchy is established as a basis for considering such assumptions and for inputs used in valuation methodologies to measure fair value:
| Level 1 |
— | Observable inputs that reflect quoted prices (unadjusted) for identical assets or liabilities in active markets. | ||
| Level 2 |
— | Include other inputs that are directly or indirectly observable in the marketplace. | ||
| Level 3 |
— | Unobservable inputs which are supported by little or no market activity. | ||
The fair value hierarchy also requires an entity to maximize the use of observable inputs and minimize the use of unobservable inputs when measuring fair value.
Inventories
Inventories are stated at the lower of cost or market value. Inventory reserves are provided to cover risks arising from slow-moving items or technological obsolescence.
The Company and its subsidiaries periodically evaluate the quantities on hand relative to historical, current and projected sales volume. Based on this evaluation, an impairment charge is recorded when required to write-down inventory to its market value.
Cost is determined as follows:
Work in progress—on the basis of raw materials and manufacturing costs on an average basis.
Finished products—on the basis of raw materials and manufacturing costs on an average basis.
Property and equipment
Property and equipment are stated at cost, net of accumulated depreciation. Depreciation is calculated using the straight-line method over the estimated useful lives of the assets, at the following annual rates:
| % | ||
| Computers and equipment |
20-33 | |
| Office furniture and equipment |
7-10 | |
| Motor vehicles |
15 | |
| Leasehold improvements |
Over the shorter of the related lease period or the life of the asset |
63
Table of Contents
DSP GROUP INC.
NOTES TO CONSOLIDATED FINANCIAL STATEMENTS—(Continued)
U.S. dollars in thousands, except share and per share data
Property and equipment of the Company and its subsidiaries are reviewed for impairment whenever events or changes in circumstances indicate that the carrying amount of an asset may not be recoverable. The recoverability of assets to be held and used is measured by a comparison of the carrying amount of such assets to the future undiscounted cash flows expected to be generated by the assets. If such assets are considered to be impaired, the impairment to be recognized is measured by the amount by which the carrying amount of the assets exceeds the fair value of the assets.
As of December 31 2009, 2008 and 2007, no impairment losses were identified for property and equipment.
Investments in other companies
The Company’s investment in an Israeli private company, in which the Company holds approximately 30% of the equity of the company, on a fully diluted basis, is presented at cost. The investment is reviewed to determine if its value has been impaired and adjustments are recorded as necessary.
Goodwill and other intangible assets
Goodwill and certain other purchased intangible assets have been recorded as a result of acquisitions. Goodwill represents the excess of the purchase price in a business combination over the fair value of net tangible and intangible assets acquired. Goodwill is not amortized, but rather is subject to an annual impairment test. The Company performs an annual impairment test during the second quarter of each fiscal year, or more frequently if impairment indicators are present. The Company operates in one operating segment, and this segment comprises its only reporting unit and only group of assets. Fair value is determined using discounted cash flows, market multiples and market capitalization. Significant estimates used in the methodologies include estimates of future cash-flows, future short-term and long-term growth rates, weighted average cost of capital and market multiples for the reporting unit. Intangible assets that are not considered to have an indefinite useful life are amortized using the straight-line basis over their estimated useful lives, which range from 0.3 to 7.3 years. The carrying amount of these assets is reviewed whenever events or changes in circumstances indicate that the carrying value of an asset may not be recoverable. Recoverability of these assets is measured by comparison of the carrying amount of the asset to the future undiscounted cash flows the asset is expected to generate. If the asset is considered to be impaired, the amount of any impairment is measured as the difference between the carrying value and the fair value of the impaired asset.
During 2009 and 2007, no impairment losses were identified. During 2008, impairment losses in the amount of $181,534 were recognized ($142,450 relating to goodwill impairment and $39,084 relating to impairment of other intangible assets) (See Notes 1 and 8).
Severance pay
DSP Group Ltd., the Company’s Israeli subsidiary (“DSP Israel”), has a liability for severance pay pursuant to Israeli law, based on the most recent monthly salary of its employees multiplied by the number of years of employment as of the balance sheet date for such employees. DSP Israel’s liability is fully provided for by monthly accrual and deposits with severance pay funds and insurance policies.
The deposited funds include profits accumulated up to the balance sheet date. The deposited funds may be withdrawn only upon the fulfillment of the obligation pursuant to Israel’s Severance Pay Law or labor agreements. The value of the deposited funds is based on the cash surrender value of these policies and includes immaterial profits.
Severance expense for the years ended December 31, 2009, 2008 and 2007, was approximately $1,969, $2,600 and $1,703, respectively.
64
Table of Contents
DSP GROUP INC.
NOTES TO CONSOLIDATED FINANCIAL STATEMENTS—(Continued)
U.S. dollars in thousands, except share and per share data
Employee benefit plan
The Company has a 401(K) deferred compensation plan covering all employees in the U.S. All eligible employees may elect to contribute up to 75% of their compensation to the plan through salary deferrals, subject to IRS limits. The maximum deferral for calendar year 2009 was $16.5 ($22.0 if the employee reached the age of 50 by December 31, 2009). The Company currently offers an employer matching program. This matching contribution currently is 50% of the employee’s contribution up to a maximum of 3% of the employee’s compensation per year. This matching contribution vests 25% per year over the first four years of the employee’s service to the Company. Employer contribution to the plan for the years 2009, 2008 and 2007 was $80, $45 and $43, respectively.
Revenue recognition
The Company and its subsidiaries generate their revenues from sales of products. The Company and its subsidiaries sell their products through a direct sales force and through a network of distributors. Revenue is recognized when title to the product passes to the customer.
Product sales are recognized when persuasive evidence of an agreement exists, delivery of the product has occurred, the fee is fixed or determinable, collectability is reasonably assured, and no significant obligations remain.
Product revenues on shipment to distributors are deferred until the distributors resell the Company’s products to the end-customers (“sell through”) based upon receipt of reports from the distributors provided all other revenue recognition criteria are met.
The Company does not grant any rights of return.
Warranty
The Company warrants its products against errors, defects and bugs for generally one year. The Company estimates the costs that may be incurred under its warranty and records a liability in the amount of such costs. The Company periodically assesses the adequacy of its recorded warranty liabilities and adjusts the amounts as necessary. Warranty costs and liability were immaterial for the years ended December 31, 2009, 2008 and 2007.
Research and development costs
Research and development costs are charged to the consolidated statement of operations as incurred.
Equity-based compensation
At December 31, 2009, the Company has five stock-based employee compensation plans, which are described more fully in Note 12.
The Company accounts for equity-based compensation in accordance with FASB ASC No. 718, “Stock Compensation” (“FASB ASC No. 718”). FASB ASC No. 718-10 requires companies to estimate the fair value of equity-based awards on the date of grant using an option-pricing model. The value of the portion of the award that is ultimately expected to vest is recognized as an expense over the requisite service periods in the Company’s consolidated statements of operations.
The Company recognizes compensation expenses for the value of its awards granted based on the accelerated attribution method, rather than a straight-line method over the requisite service period of each of the
65
Table of Contents
DSP GROUP INC.
NOTES TO CONSOLIDATED FINANCIAL STATEMENTS—(Continued)
U.S. dollars in thousands, except share and per share data
awards, net of estimated forfeitures. FASB ASC No. 718 requires forfeitures to be estimated at the time of grant and revised, if necessary, in subsequent periods if actual forfeitures differ from those estimates. Estimated forfeitures are based on actual historical pre-vesting forfeitures.
FASB ASC No. 718 requires cash flows resulting from tax deductions in excess of the compensation costs recognized for those equity-based awards to be classified as financing cash flows.
The Company selected the binomial option pricing model as the most appropriate fair value method for its equity-based awards and values options and stock appreciation rights (SARs) based on the market value of the underlying shares on the date of grant. The option-pricing model requires a number of assumptions, of which the most significant are the expected stock price volatility and the expected term of the equity-based award. Expected volatility is calculated based upon actual historical stock price movements. The expected term of the equity-based award granted is based upon historical experience and represents the period of time that the award granted is expected to be outstanding. The risk-free interest rate is based on the yield from U.S. treasury bonds with an equivalent term. The Company has historically not paid dividends and has no foreseeable plans to pay dividends.
Net loss per share
Basic net loss per share is computed based on the weighted average number of shares of common stock outstanding during the year. Diluted net earnings per share further include the dilutive effect of stock options and SARs outstanding during the year, all in accordance with FASB ASC No. 260, “Earnings Per Share.”
The total weighted average number of shares related to the outstanding options and SARs excluded from the calculations of diluted net loss per share due to their anti-dilutive effect was 7,790,926, 8,656,161 and 6,924,392 for the years ended December 31, 2009, 2008 and 2007, respectively.
Income taxes
The Company and its subsidiaries account for income taxes in accordance with FASB ASC No. 740, “Income Taxes.” This topic prescribes the use of the liability method, whereby deferred tax asset and liability account balances are determined based on differences between financial reporting and tax bases of assets and liabilities and are measured using the enacted tax rates that will be in effect when the differences are expected to reverse. The Company and its subsidiaries provide a valuation allowance, if necessary, to reduce deferred tax assets to their estimated realizable value.
Deferred tax liabilities and assets are classified as current or non current based on the classification of the related asset or liability for financial reporting, or according to the expected reversal dates of the specific temporary differences if not related to an asset or liability for financial reporting.
The Company reports a liability for unrecognized tax benefits resulting from uncertain tax positions taken or expected to be taken in a tax return. The Company recognizes interest and penalties, if any, related to unrecognized tax benefits in income tax expense.
Concentrations of credit risk
Financial instruments that potentially subject the Company to concentrations of credit risk consist principally of cash and cash equivalents, short-term deposits, trade receivables, long-term lease deposits and marketable securities.
66
Table of Contents
DSP GROUP INC.
NOTES TO CONSOLIDATED FINANCIAL STATEMENTS—(Continued)
U.S. dollars in thousands, except share and per share data
The majority of cash and cash equivalents and short-term deposits of the Company and its subsidiaries is invested in dollar deposits with major U.S., European and Israeli banks. Such cash and cash equivalents in U.S. banks may be in excess of insured limits and are not insured in other jurisdictions. Generally, cash and cash equivalents and short-term deposits may be redeemed on demand and therefore a minimal credit risk exists with respect to these deposits and investments.
The Company’s marketable securities consist of investment-grade corporate bonds and U.S. government agency securities. As of December 31, 2009, the amortized cost of the Company’s marketable securities was $58,511, and their stated market value was $59,701, representing an unrealized gain of $1,190.
A significant portion of the products of the Company and its subsidiaries is sold to original equipment manufacturers of consumer electronics products. The customers of the Company and its subsidiaries are located primarily in Japan, Hong Kong, Taiwan, Korea, Europe and the United States. The Company and its subsidiaries perform ongoing credit evaluations of their customers. A specific allowance for doubtful accounts is determined, based on management’s estimation and historical experience. Under certain circumstances, the Company may require a letter of credit. The Company covers most of its trade receivables through credit insurance. Allowance for doubtful accounts amounted to $117 and $184 as of December 31, 2009 and 2008, respectively.
The Company and its subsidiaries have no off-balance-sheet concentration of credit risk, except for certain derivative instruments as mentioned below.
Derivative instruments
FASB ASC No. 815, “Derivatives and Hedging,” requires companies to recognize all of their derivative instruments as either assets or liabilities on the balance sheet at fair value.
For derivative instruments that are designated and qualify as a cash flows hedge (i.e., hedging the exposure to variability in expected future cash flows that is attributable to a particular risk), the effective portion of the gain or loss on the derivative instrument is reported as a component of other comprehensive income and reclassified into earnings in the same period or periods during which the hedged transaction affects earnings. Any gain or loss on a derivative instrument in excess of the cumulative change in the present value of future cash flows of the hedged item is recognized in current earnings during the period of change.
To protect against the increase in value of forecasted foreign currency cash flows resulting from salary and rent payments in New Israeli Shekel (“NIS”) during the year, the Company instituted a foreign currency cash flow hedging program. The Company hedges portions of the anticipated payroll and rent of its Israeli facilities denominated in NIS for a period of one to 12 months with put options and forward contracts. These forward contracts and put options are designated as cash flow hedges and are all effective as hedges of these expenses.
67
Table of Contents
DSP GROUP INC.
NOTES TO CONSOLIDATED FINANCIAL STATEMENTS—(Continued)
U.S. dollars in thousands, except share and per share data
The fair value of the outstanding derivative instruments at December 31, 2008 and 2009 is summarized below:
| Fair Value of Derivative Instruments | ||||||||
| Balance Sheet Location |
As of December 31, 2009 |
As of December 31, 2008 | ||||||
| Derivative Assets |
||||||||
| Foreign exchange forward contracts and put options |
Other accounts receivable and prepaid expenses(*) | 227 | — | |||||
| Total |
$ | 227 | $ | — | ||||
| Derivative Liabilities |
||||||||
| Foreign exchange forward contracts and put options |
Other accounts payable and accrued expenses | $ | — | $ | 27 | |||
| Total |
$ | — | $ | 27 | ||||
| (*) | Estimated to be reclassified into earnings during 2010. |
The effect of derivative instruments in cash flow hedging transactions on income and other comprehensive income (“OCI”) for the years ended December 31, 2008 and 2009 is summarized below:
| Gains (Losses) on Derivatives Recognized in OCI | |||||||
| Year ended December 31, | |||||||
| 2009 | 2008 | ||||||
| Foreign exchange forward contracts |
$ | (343 | ) | $ | 452 | ||
| Gains (Losses) Reclassified from OCI into Income | |||||||||
| Location | Year ended December 31, | ||||||||
| 2009 | 2008 | ||||||||
| Foreign exchange forward contracts |
Operating expenses | $ | (597 | ) | $ | 961 | |||
As of December 31, 2009 and 2008, the Company had outstanding forward contracts in the amount of $6,050 and $10,800, respectively, and outstanding option contract in the amount of $4,050 and $4,750, respectively.
Comprehensive income
The Company accounts for comprehensive income in accordance with FASB ASC No. 220, “Comprehensive Income.” This topic establishes standards for the reporting and display of comprehensive income and its components in a full set of general purpose financial statements. Comprehensive income generally represents all changes in stockholders’ equity during the period except those resulting from investments by, or distributions to, stockholders. The Company determined that its items of comprehensive income relates to gains and losses on hedging derivative instruments, unrealized gains and losses on available-for-sale securities, unrealized gains and losses from pension and unrealized gain and losses from foreign currency translation adjustments.
Treasury stock
The Company repurchases its common stock from time to time on the open market or in other transactions and holds such shares as treasury stock. The Company presents the cost to repurchase treasury stock as a reduction of stockholders’ equity.
68
Table of Contents
DSP GROUP INC.
NOTES TO CONSOLIDATED FINANCIAL STATEMENTS—(Continued)
U.S. dollars in thousands, except share and per share data
From time to time, the Company reissues treasury shares under its employee stock purchase plan and equity incentive plans, upon purchases or exercises of equity awards under the plans. When treasury stock is reissued, the Company accounts for the re-issuance in accordance with FASB ASC No. 505-30, “Treasury Stock” and charges the excess of the purchase cost over the re-issuance price (loss) to retained earnings. The purchase cost is calculated based on the specific identification method. In case the purchase cost is lower than the re-issuance price, the Company credits the difference to additional paid-in capital.
New accounting pronouncements
In August 2009, the FASB issued ASU No. 2009-05, “Measuring Liabilities at Fair Value,” (“FASB ASU No. 2009-05”) which provides additional guidance on how companies should measure liabilities at fair value under FASB ASC No. 820, “Fair Value Measurements and Disclosures” (“FASB ASC N. 820”) FASB ASU No. 2009-05 clarifies that the quoted price for an identical liability should be used. However, if such information is not available, an entity may use the quoted price of an identical liability when traded as an asset, quoted prices for similar liabilities or similar liabilities traded as assets, or another valuation technique (such as the market or income approach). FASB ASU No. 2009-05 also indicates that the fair value of a liability is not adjusted to reflect the impact of contractual restrictions that prevent its transfer and indicates circumstances in which quoted prices for an identical liability or quoted price for an identical liability traded as an asset may be considered level 1 fair value measurements. For the Company, FASB ASU No. 2009-05 was effective on October 1, 2009. The Company’s adoption of FASB ASU No. 2009-05 did not have a material impact on its consolidated results of operations or financial condition.
In June 2009, FASB issued ASC No. 105 “Generally Accepted Accounting Principles” (the “Codification”). The Codification was effective for interim and annual periods ended after September 15, 2009 and became the single official source of authoritative, nongovernmental U.S. generally accepted accounting principles (U.S. GAAP), other than guidance issued by the Securities and Exchange Commission. All other literature is non-authoritative. The adoption of the Codification did not have a material impact on the Company’s consolidated financial statements and notes thereto. The Company has appropriately updated its disclosures with the appropriate Codification references for the year ended December 31, 2009. As such, all the notes to the consolidated financial statements have been updated with the appropriate Codification references.
In May 2009, FASB issued ASC No. 855 “Subsequent Events” (“FASB ASC No. 855”). FASB ASC No. 855 is intended to establish general standards of accounting for and disclosure of events that occur after the balance sheet date but before financial statements are issued or are available to be issued. Specifically, FASB ASC No. 855 sets forth the period after the balance sheet date during which management of a reporting entity should evaluate events or transactions that may occur for potential recognition or disclosure in the financial statements, the circumstances under which an entity should recognize events or transactions occurring after the balance sheet date in its financial statements, and the disclosures that an entity should make about events or transactions that occurred after the balance sheet date. FASB ASC No. 855 was effective for fiscal years and interim periods ended after June 15, 2009. This guidance was amended by ASU 2010-9 in February 2010. The adoption of the updated guidance did not have a material impact on the Company’s consolidated results of operations or financial condition.
In April, 2009, the Company adopted the FASB’s updated guidance relating to investments and debt securities, which amends the other-than-temporary impairment (“OTTI”), guidance in U.S. GAAP to make the guidance more operational and to improve the presentation of OTTIs in the financial statements. Under the updated guidance, if OTTI occurs, and it is more likely than not that the Company will not sell the investment or debt security before the recovery of its amortized cost basis, then the OTTI is separated into (a) the amount representing the credit loss and (b) the amount related to all other factors. The amount of the total OTTI related
69
Table of Contents
DSP GROUP INC.
NOTES TO CONSOLIDATED FINANCIAL STATEMENTS—(Continued)
U.S. dollars in thousands, except share and per share data
to credit loss is recognized in earnings. The amount of the total OTTI related to other factors is recognized in accumulated other comprehensive income. The adoption of the updated guidance did not have a material impact on the Company’s consolidated results of operations or financial condition.
In April 2009, the Company adopted the FASB’s updated guidance related to fair value measurements and disclosures, which provides additional guidance for estimating fair value in accordance with the guidance related to fair value measurements when the volume and level of activity for an asset or liability have significantly decreased. The updated standard also includes guidance on identifying circumstances that indicate a transaction is not orderly. The adoption of the updated guidance did not have a material impact on the Company’s consolidated results of operations or financial condition.
In December 2008, the FASB issued authoritative guidance on employers’ disclosures about post-retirement benefit plan assets, which requires additional disclosures for employers’ pension and other post-retirement benefit plan assets. Pension and other post-retirement benefit plan assets were not included within the scope of the guidance on fair value measurements. This guidance requires employers to disclose information about fair value measurements of plan assets similar to the disclosures required under the fair value measurement guidance, including the investment policies and strategies for the major categories of plan assets, and significant concentrations of risk within plan assets. This guidance is effective for fiscal years ended after December 15, 2009, with earlier adoption permitted. The Company adopted this guidance in the fourth quarter of 2009 and has provided additional disclosure of its post-retirement benefit plan assets in these Notes to the Consolidated Financial Statements for the year ended 2009.
NOTE 4:- MARKETABLE SECURITIES AND TIME DEPOSITS
The following is a summary of marketable securities and time deposits at December 31, 2009 and 2008:
| Amortized cost | Unrealized gains (losses), net |
Fair value | ||||||||||||||||||
| 2009 | 2008 | 2009 | 2008 | 2009 | 2008 | |||||||||||||||
| Short and long-term deposit |
$ | 25,258 | $ | 2,518 | $ | — | $ | — | $ | 25,258 | $ | 2,518 | ||||||||
| U.S. government obligations and political subdivisions |
14,703 | 19,163 | (88 | ) | 274 | 14,615 | 19,437 | |||||||||||||
| Corporate obligations |
43,808 | 30,973 | 1,278 | (428 | ) | 45,086 | 30,545 | |||||||||||||
| $ | 83,769 | $ | 52,654 | $ | 1,190 | $ | (154 | ) | $ | 84,959 | $ | 52,500 | ||||||||
The amortized cost of marketable debt securities and time deposits at December 31, 2009, by contractual maturities or anticipated date of sale, are shown below:
| Amortized cost |
Unrealized gains (losses) |
Fair value | |||||||||||
| Gains | Losses | ||||||||||||
| Due in one year or less |
$ | 19,473 | $ | 94 | $ | — | $ | 19,567 | |||||
| Due after one year to five years |
64,296 | 1,250 | (154 | ) | 65,392 | ||||||||
| $ | 83,769 | $ | 1,344 | $ | (154 | ) | $ | 84,959 | |||||
70
Table of Contents
DSP GROUP INC.
NOTES TO CONSOLIDATED FINANCIAL STATEMENTS—(Continued)
U.S. dollars in thousands, except share and per share data
The amortized cost of marketable debt securities and time deposits at December 31, 2008, by contractual maturities or anticipated date of sale, are shown below:
| Amortized cost |
Unrealized gains (losses) |
Fair value | |||||||||||
| Gains | Losses | ||||||||||||
| Due in one year or less |
$ | 12,495 | $ | 35 | $ | (81 | ) | $ | 12,449 | ||||
| Due after one year to five years |
40,159 | 334 | (443 | ) | 40,051 | ||||||||
| $ | 52,654 | $ | 369 | $ | (524 | ) | $ | 52,500 | |||||
Of the unrealized losses outstanding as of December 31, 2009 and 2008, no losses were outstanding for more than 12 months.
The actual maturity dates may differ from the contractual maturities because debtors may have the right to call or prepay obligations without penalties.
As of December 31, 2009, the unrealized losses in the Company’s investments in all types of marketable securities were temporary and no impairment loss was realized in the Company’s consolidated statements of operations.
As of December 31, 2008, the Company determined that the decline in fair value of one of its securities was other than temporary. The amortized cost of available-for-sale debt securities at December 31, 2008 set forth in the table above included a write down of $2,961 associated with the referenced security. During 2009, the Company recorded $531 of gains from the realization of the same previously impaired available-for-sale security.
NOTE 5:- OTHER ACCOUNTS RECEIVABLE AND PREPAID EXPENSES
| December 31, | ||||||
| 2009 | 2008 | |||||
| Tax receivables |
$ | 6,403 | $ | 11,367 | ||
| Employees |
92 | 61 | ||||
| Prepaid expenses |
2,160 | 2,127 | ||||
| Deposits |
3,074 | 384 | ||||
| Others |
433 | 668 | ||||
| $ | 12,162 | $ | 14,607 | |||
71
Table of Contents
DSP GROUP INC.
NOTES TO CONSOLIDATED FINANCIAL STATEMENTS—(Continued)
U.S. dollars in thousands, except share and per share data
NOTE 6:- INVENTORIES
Inventories are composed of the following:
| December 31, | ||||||
| 2009 | 2008 | |||||
| Work-in-progress |
$ | 2,654 | $ | 1,617 | ||
| Finished products(*) |
9,773 | 12,481 | ||||
| $ | 12,427 | $ | 14,098 | |||
| (*) | The finished products inventory includes $613 and $755 of inventory held in consignment by other parties, at December 31, 2009 and 2008, respectively. |
Inventory write-downs amounted to $626, $2,046 and $1,674 for the years ended December 31, 2009, 2008 and 2007, respectively.
NOTE 7:- PROPERTY AND EQUIPMENT
Composition of assets, grouped by major classifications, is as follows:
| December 31, | ||||||
| 2009 | 2008 | |||||
| Cost: |
||||||
| Computers and equipment |
$ | 47,337 | $ | 49,714 | ||
| Office furniture and equipment |
1,573 | 1,563 | ||||
| Motor vehicles |
171 | 102 | ||||
| Leasehold improvements |
4,406 | 4,319 | ||||
| 53,487 | 55,698 | |||||
| Less—accumulated depreciation |
43,397 | 40,876 | ||||
| Depreciated cost |
$ | 10,090 | $ | 14,822 | ||
During 2009, the Company recorded a disposal of equipment in the amount of $3,500, which ceased to be used. As all such assets were fully depreciated at the time of the disposal, no capital gains or losses were recorded in the consolidated statements of operations.
Depreciation expenses, which also include amortization expenses of assets recorded under capital leases, amounted to $7,216, $7,335 and $6,081 for the years ended December 31, 2009, 2008 and 2007, respectively.
As of December 31, 2009 and 2008, assets within the computers and equipment category included an amount of $5,608 for both years, which was accounted for as capital leases. Such assets included an amount of $3,982 and $2,380 at December 31, 2009 and 2008, respectively, for accumulated depreciation and amortization.
For more information about leased equipment, see Note 15.
72
Table of Contents
DSP GROUP INC.
NOTES TO CONSOLIDATED FINANCIAL STATEMENTS—(Continued)
U.S. dollars in thousands, except share and per share data
NOTE 8:- INTANGIBLE ASSETS, NET
The following table shows the Company’s intangible assets for the periods presented:
| Useful life (years) |
December 31, | |||||||
| 2009 | 2008 | |||||||
| Cost: |
||||||||
| Current technology |
4.2-5.3 | $ | 77,080 | $ | 77,080 | |||
| Customer relations |
7.3 | 23,541 | 23,538 | |||||
| Trade name and trademark |
2 | 590 | 590 | |||||
| Backlog |
0.3 | 4,449 | 4,449 | |||||
| Patents |
4 | 4,009 | 4,009 | |||||
| Workforce |
4 | 570 | 570 | |||||
| 110,239 | 110,236 | |||||||
| Accumulated amortization: |
||||||||
| Current technology |
31,156 | 23,083 | ||||||
| Customer relations |
10,105 | 5,920 | ||||||
| Trade name and trademark |
393 | 393 | ||||||
| Backlog |
4,449 | 4,449 | ||||||
| Patents |
4,009 | 4,009 | ||||||
| Workforce |
570 | 570 | ||||||
| 50,682 | 38,424 | |||||||
| Impairment: |
||||||||
| Current technology |
28,817 | 28,817 | ||||||
| Customer relations |
10,070 | 10,070 | ||||||
| Trade name and trademark |
197 | 197 | ||||||
| 39,084 | 39,084 | |||||||
| Amortized cost |
$ | 20,473 | $ | 32,728 | ||||
| a. | Amortization expenses amounted to $12,258, $23,281 and $11,868 for the years ended December 31, 2009, 2008 and 2007, respectively. |
| b. | In 2008, as a result of circumstances which indicated that the carrying amount of certain intangible assets would not be recoverable, the Company reassessed the fair value of its intangible assets, which resulted in impairment charges of approximately $39,084. |
| c. | Estimated amortization expenses for the years ending: |
| Year ending December 31, |
|||
| 2010 |
10,016 | ||
| 2011 |
7,959 | ||
| 2012 |
2,146 | ||
| 2013 |
218 | ||
| 2014 |
134 | ||
| $ | 20,473 | ||
73
Table of Contents
DSP GROUP INC.
NOTES TO CONSOLIDATED FINANCIAL STATEMENTS—(Continued)
U.S. dollars in thousands, except share and per share data
NOTE 9:- FAIR VALUE MEASUREMENTS
The Company measures its cash equivalents, short-term deposits, marketable securities and foreign currency derivative contracts at fair value. Cash equivalents, short-term deposits, marketable securities and foreign currency derivative contracts are classified within Level 1 or Level 2 value hierarchies. This is because cash equivalents, short-term deposits and marketable securities are valued using quoted market prices or alternative pricing sources and models utilizing market observable inputs. Foreign currency derivative contracts are classified within Level 2 value hierarchy as the valuation inputs are based on quoted prices and market observable data of similar instruments.
The following table provides information by value level for assets and liabilities that are measured at fair value on a recurring basis as of December 31, 2009.
| Balance as of | Fair Value Measurements | ||||||||||
| Description |
December 31, 2009 | Level 1 | Level 2 | Level 3 | |||||||
| Assets: |
|||||||||||
| Cash equivalents: |
|||||||||||
| Time deposits |
$ | 14,691 | — | $ | 14,691 | — | |||||
| Money market mutual funds |
$ | 2,100 | $ | 2,100 | — | — | |||||
| Short-term marketable securities and cash deposits: |
|||||||||||
| Corporate debt securities |
$ | 4,360 | — | $ | 4,360 | — | |||||
| Time deposits |
$ | 15,208 | — | $ | 15,208 | — | |||||
| Long-term marketable securities: |
|||||||||||
| U.S. government securities |
$ | 14,615 | — | $ | 14,615 | — | |||||
| Corporate debt securities |
$ | 40,727 | — | $ | 40,727 | — | |||||
| Time deposits |
$ | 10,050 | — | $ | 10,050 | — | |||||
| Derivative assets |
$ | 227 | — | $ | 227 | — | |||||
The following table provides information by value level for assets and liabilities that are measured at fair value on a recurring basis as of December 31, 2008.
| Balance as of | Fair Value Measurements | ||||||||||
| Description |
December 31, 2008 | Level 1 | Level 2 | Level 3 | |||||||
| Assets: |
|||||||||||
| Cash equivalents: |
|||||||||||
| Time deposits |
$ | 28,656 | — | $ | 28,656 | — | |||||
| Money market mutual funds |
$ | 7,127 | $ | 7,127 | — | — | |||||
| Short-term marketable securities and cash deposits: |
|||||||||||
| Corporate debt securities |
$ | 9,931 | — | $ | 9,931 | — | |||||
| Time deposits |
$ | 2,518 | — | $ | 2,518 | — | |||||
| Long-term marketable securities: |
|||||||||||
| U.S. government securities |
$ | 19,437 | — | $ | 19,437 | — | |||||
| Corporate debt securities |
$ | 20,614 | — | $ | 20,614 | — | |||||
| Derivative liability |
$ | 27 | — | $ | 27 | — | |||||
74
Table of Contents
DSP GROUP INC.
NOTES TO CONSOLIDATED FINANCIAL STATEMENTS—(Continued)
U.S. dollars in thousands, except share and per share data
In addition to the assets and liabilities described above, the Company’s financial instruments also include cash, trade receivables, other accounts receivable, related party receivables, trade payables, accrued expenses and other payables. The fair value of these financial instruments was not materially different from their carrying value at December 31, 2009 and 2008 due to the short-term maturity of these instruments.
Assets and Liabilities Measured at Fair Value on a Non-Recurring Basis:
Effective January 1, 2009, the Company adopted the provisions of FASB ASC No. 820 for non-financial assets and liabilities. The adoption of ASC 820 for non-financial assets and liabilities did not have a material impact on the Company’s financial condition or results of operations.
NOTE 10:- PENSION LIABILITIES
The Company acquired the CIPT Business on September 4, 2007. This business sponsors various defined benefits schemes for their employees, including pension funds, early retirement benefits, lump sum retirement indemnities and jubilee awards in several countries.
The largest of these plans that the Company assumed in connection with the Acquisition is the Swiss pension fund that insures the retirement, disability and death benefits of the employees who were formerly covered by the NXP Semiconductors Switzerland AG scheme. The Swiss pension plan is currently the only pension plan externally funded through a foundation. The difference between the liability (the Projected Benefit Obligation or PBO) and the market value of the plan assets is accounted for in the consolidated financial statements of the Company. The other defined benefits plans that the Company assumed in connection with the Acquisition that are accounted for in the Company’s consolidated financial statements are the pension plans in Germany and India. Consistent with the requirements of local law, the Company deposits funds for certain plans with insurance companies, third-party trustees, or into government-managed accounts, and/or accrues for the unfunded portion of the obligation.
For year end accounting purposes, liabilities in respect of the Swiss pension fund and the German plans have been recalculated based on updated employee numbers and asset values at December 31, 2009. These plans together represent 99% of the PBO of the entire group. The value for the other liabilities has been projected from results of the valuation on the date of Acquisition and updated for changes in discount rate.
During 2008, the Company implemented an additional restructuring plan, subsequent to the initial restructuring plan undertaken following the Acquisition, to improve operating efficiency at its various operating sites and to reduce its operating expenses for 2009. The additional restructuring plan involved the Swiss operating site and the termination of employment of certain Swiss employees. The Swiss employee terminations led to curtailments (reduction of benefits due to cancellation of future salary increases in the valuation) and settlements (transfer out of accumulated benefits) of the Swiss pension fund. Furthermore, free reserves of approximately $550 following the partial liquidation of the former Swiss pension fund have been transferred to the Company.
75
Table of Contents
DSP GROUP INC.
NOTES TO CONSOLIDATED FINANCIAL STATEMENTS—(Continued)
U.S. dollars in thousands, except share and per share data
The following tables provide a reconciliation of the changes in the plans’ benefit obligation and fair value of assets for the years ended December 31, 2009 and 2008, and the statement of funded status as of December 31, 2009 and 2008:
| December 31, | ||||||||
| 2009 | 2008 | |||||||
| Accumulated benefit obligation |
$ | 2,822 | $ | 4,004 | ||||
| Change in benefit obligation |
||||||||
| Benefit obligation at beginning of year |
$ | 5,522 | $ | 14,462 | ||||
| Service cost |
413 | 1,023 | ||||||
| Interest cost |
186 | 521 | ||||||
| Employee contributions |
124 | 408 | ||||||
| Plan curtailments |
(85 | ) | (3,018 | ) | ||||
| Plan settlements |
(836 | ) | (8,290 | ) | ||||
| Benefits paid from the plan |
(1,020 | ) | — | |||||
| Expenses paid |
(7 | ) | (25 | ) | ||||
| Premiums paid |
(15 | ) | (126 | ) | ||||
| Actuarial loss (gain) |
20 | (70 | ) | |||||
| Exchange rates and others |
(60 | ) | 637 | |||||
| Benefit obligation at end of year |
$ | 4,242 | $ | 5,522 | ||||
| Change in plan assets |
||||||||
| Fair value of plan assets at beginning of year |
$ | 3,847 | $ | 12,704 | ||||
| Actual return on plan assets |
812 | (2,379 | ) | |||||
| Employer contributions to plan |
347 | 424 | ||||||
| Employee contributions |
124 | 408 | ||||||
| Plan settlements |
(835 | ) | (8,290 | ) | ||||
| Expenses paid |
(7 | ) | (25 | ) | ||||
| Benefits paid from the plan |
(1,020 | ) | — | |||||
| Premiums paid |
(15 | ) | (126 | ) | ||||
| Acquisitions/divestitures |
— | 550 | ||||||
| Exchange rates |
60 | 581 | ||||||
| Fair value of plan assets at end of year |
$ | 3,313 | $ | 3,847 | ||||
The assumptions used in the measurement of the Company’s pension expense and benefit obligations as of December 31, 2009, 2008 and 2007 are as follow:
| December 31, | 2007 | ||||||||
| 2009 | 2008 | ||||||||
| Weighted-average assumptions |
|||||||||
| Discount rate |
3.99 | % | 3.99 | % | 3.54 | % | |||
| Expected return on plan assets |
4.20 | % | 4.40 | % | 4.40 | % | |||
| Rate of compensation increase |
3.04 | % | 3.08 | % | 4.00 | % | |||
The amounts reported for net periodic pension costs and the respective benefit obligation amounts are dependent upon the actuarial assumptions used. The Company reviews historical trends, future expectations, current market conditions, and external data to determine the assumptions. The discount rate is determined
76
Table of Contents
DSP GROUP INC.
NOTES TO CONSOLIDATED FINANCIAL STATEMENTS—(Continued)
U.S. dollars in thousands, except share and per share data
considering the yield of government bonds. For purposes of calculating the 2009 net periodic benefit cost and benefit obligation, the Company used a discount rate of 3.99%. The rate of compensation increase is determined by the Company, based on its long-term plans for such increases.
The following table provides the components of net periodic benefit cost for the years ended December 31, 2009, 2008 and 2007:
| December 31, | 2007 | |||||||||||
| 2009 | 2008 | |||||||||||
| Components of net periodic benefit cost |
||||||||||||
| Service cost |
$ | 413 | $ | 1,023 | $ | 282 | ||||||
| Interest cost |
186 | 521 | 108 | |||||||||
| Expected return on plan assets |
(155 | ) | (600 | ) | (131 | ) | ||||||
| Amortization of net loss |
9 | 6 | 26 | |||||||||
| Settlement gain recognized |
(278 | ) | (401 | ) | — | |||||||
| Net periodic benefit cost |
$ | 175 | $ | 549 | $ | 285 | ||||||
| Net amounts recognized in the consolidated balance sheets as of December 31, 2009 and 2008 consist of: |
||||||||||||
| Noncurrent liabilities |
$ | 929 | $ | 1,675 | ||||||||
| Net amounts recognized in the consolidated balance sheets |
$ | 929 | $ | 1,675 | ||||||||
| Net amounts recognized in accumulated other comprehensive income as of December 31, 2009 and 2008 consist of: |
||||||||||||
| Net actuarial (Loss) Gain |
$ | (588 | ) | (604 | ) | |||||||
| Other |
1,011 | 563 | ||||||||||
| Net amounts recognized in accumulated other comprehensive income |
$ | 423 | (41 | ) | ||||||||
The Company expects to make contributions of $76 to the pension plan during 2010.
The estimated amount that will be amortized from accumulated other comprehensive income into net periodic benefit cost in 2010 is as follows:
| 2010 | |||
| Net actuarial loss and other |
$ | 21 | |
| $ | 21 | ||
Benefit payments are expected to be paid as follows:
| Year ending December 31, |
|||
| 2010 |
$ | 11 | |
| 2011 |
$ | 15 | |
| 2012 |
$ | 18 | |
| 2013 |
$ | 284 | |
| 2014 |
$ | 66 | |
| 2015-2019 |
$ | 381 | |
77
Table of Contents
DSP GROUP INC.
NOTES TO CONSOLIDATED FINANCIAL STATEMENTS—(Continued)
U.S. dollars in thousands, except share and per share data
The plan asset allocations at December 31 of the relevant years are as follows:
| December 31, | ||||||
| 2009 | 2008 | |||||
| Bonds |
44.8 | % | 30.6 | % | ||
| Real estate |
12.6 | % | 14.5 | % | ||
| Cash |
12.0 | % | 10.9 | % | ||
| Shares |
19.0 | % | 30.2 | % | ||
| Other |
11.6 | % | 13.8 | % | ||
| 100 | % | 100 | % | |||
The fair value of the Company’s pension plan assets at December 31, 2009 by asset category, classified by the three levels of inputs described in Note 3, are as follows:
| Fair Value Measurements at December 31, 2009 Using: | ||||||||||||
| Total Carrying Value at December 31, 2009 |
Quoted Prices in Active Markets (Level 1) |
Significant Other Observable Inputs (Level 2) |
Significant Unobservable Inputs (Level 3) | |||||||||
| Cash |
$ | 397 | $ | 397 | $ | — | $ | — | ||||
| Equity securities |
630 | 630 | — | |||||||||
| Real estate |
419 | 329 | 90 | |||||||||
| Corporate bonds |
1,484 | 1,484 | ||||||||||
| Others |
383 | 383 | ||||||||||
| Total assets measured at fair value |
$ | 3,313 | $ | 2,840 | $ | 473 | $ | 0 | ||||
Valuation Techniques: For Level 1 inputs, the Company utilizes quoted market prices as these instruments have active markets. For Level 2 inputs, the Company utilizes quoted market prices in markets that are not active, broker or dealer quotations, or utilizes alternative pricing sources with reasonable levels of price transparency.
Regarding the policy for amortizing actuarial gains or losses for pension and post-employment plans, the Company has chosen the “corridor” option. This option consists of recognizing in the statements of operations, the part of unrecognized actuarial gains or losses exceeding 10% of the greater of the PBO or the market value of the plan assets. If amortization is required, the minimum amortization amount is that excess divided by the average remaining service period of the active employees expected to receive benefits under the plan.
For the years ended December 31, 2009 and 2008, actuarial gains of $3 and $236, respectively, were recognized in other comprehensive income.
The gains and losses for the old age part time benefits under the German plans, jubilee awards and long service incentive payments are recognized in the year they occur in the consolidated statements of operations due to their immateriality.
78
Table of Contents
DSP GROUP INC.
NOTES TO CONSOLIDATED FINANCIAL STATEMENTS—(Continued)
U.S. dollars in thousands, except share and per share data
NOTE 11:- FINANCIAL INCOME, NET
The components of financial income, net were as follows:
| Year Ended December 31, | |||||||||
| 2009 | 2008 | 2007 | |||||||
| Foreign exchange gains |
$ | 415 | $ | 160 | $ | 68 | |||
| Interest income |
2,190 | 4,140 | 12,857 | ||||||
| Realized gains on marketable securities, net |
933 | — | — | ||||||
| Other |
— | 1 | 4 | ||||||
| Financial income |
$ | 3,538 | $ | 4,301 | $ | 12,929 | |||
| Realized losses on marketable securities, net |
$ | — | $ | 104 | $ | 1,510 | |||
| Write down of marketable securities |
— | 2,961 | — | ||||||
| Foreign exchange losses |
346 | 831 | 546 | ||||||
| Interest expenses |
118 | 93 | 72 | ||||||
| Other |
217 | 152 | 260 | ||||||
| Financial expense |
$ | 681 | $ | 4,141 | $ | 2,388 | |||
| Financial income, net |
$ | 2,857 | $ | 160 | $ | 10,541 | |||
NOTE 12:- STOCKHOLDERS’ EQUITY
Preferred Stock
The Company’s Board of Directors has the authority, without any further vote or action by the stockholders, to provide for the issuance of up to 5,000,000 shares of preferred stock in one or more series with such designations, rights, preferences, and limitations as the Board of Directors may determine, including the consideration received, the number of shares comprising each series, dividend rates, redemption provisions, liquidation preferences, sinking fund provisions, conversion rights and voting rights. No shares of preferred stock are currently outstanding.
Common Stock
Currently, 50,000,000 shares of common stock are authorized. Holders of common stock are entitled to one vote per share on all matters to be voted upon by the Company’s stockholders. Subject to the rights of holders of preferred stock, if any, in the event of liquidation, dissolution or winding up, holders of common stock are entitled to share ratably in all of the Company’s assets. The Company’s Board of Directors may declare a dividend out of funds legally available therefore and, subject to the rights of holders of preferred stock, if any, the holders of common stock are entitled to receive ratably any such dividends.
Holders of common stock have no preemptive rights or other subscription rights to convert their shares into any other securities. There are no redemption or sinking fund provisions applicable to common stock.
Dividend Policy
At December 31, 2009, the Company had an accumulated deficit of $38,937. The Company has never paid cash dividends on the common stock and presently intends to follow a policy of retaining earnings for reinvestment in its business.
79
Table of Contents
DSP GROUP INC.
NOTES TO CONSOLIDATED FINANCIAL STATEMENTS—(Continued)
U.S. dollars in thousands, except share and per share data
Share Repurchase Program
In March 1999, the Company’s board of directors authorized the repurchase of up to 4.0 million shares of our common stock. In July 2003, October 2004, January 2007 and January 2008, the Company’s board authorized an additional 2.5 million shares, 2.5 million shares, 3.0 million shares and 2.9 million shares of common stock, respectively, for repurchase. The number of shares authorized for repurchase after giving affect to the January 2008 board approval was 5.1 million shares. Also in January 2008, the Company’s board of directors approved the Company’s entry into a share repurchase plan in accordance with Rule 10b5-1 of the United States Securities Exchange Act of 1934, as amended, for up to 5 million shares of the 5.1 million shares of the Company’s common stock authorized for repurchase. The plan, which became effective on February 7, 2008, expired on October 31, 2008.
During the first quarter of 2009, in accordance with the Stock Repurchase Agreement executed by the Company and NXP on January 27, 2009, the Company repurchased 4,186,603 shares of its common stock that were issued to NXP in connection with the Acquisition at the purchase price of $4.78 per share for approximately $20,028.
In 2008 and 2007, the Company repurchased 4,798,000 and 1,618,000 shares, respectively, of common stock at an average purchase price of $10.21 and $15.88 per share, respectively, for an aggregate purchase price of $48,991 and $25,699, respectively. No shares were repurchased under the Company’s board-authorized share repurchase program during 2009. As of December 31, 2009, 255,488 shares of common stock remained authorized for repurchase under the Company’s board-authorized share repurchase program.
In 2009, 2008 and 2007, the Company issued 357,000, 299,000 and 283,000 shares, respectively, of common stock, out of treasury stock, to employees who exercised their equity awards or purchased shares from the Company’s 1993 Employee Stock Purchase Plan (“ESPP”).
Stock Purchase Plan and Equity Incentive Plans
The Company has various equity incentive plans under which employees, officers, non-employee directors of the Company and its subsidiaries and others, including consultants, may be granted rights to purchase the Company’s common stock. The plans authorize the administrator to grant incentive stock options at an exercise price of not less than 100% of the fair market value of the common stock on the date the option is granted and non-qualified stock options. It is the Company’s policy to grant options at the fair market value.
Equity awards granted under all stock incentive plans that are cancelled or forfeited before expiration become available for future grant.
During 2009, 2008 and 2007, the Company granted to employees and executive officers of the Company and its subsidiaries primarily share appreciation rights (“SARs”), capped with a ceiling, under the various equity incentive plans. The SAR unit confers the holder the right to stock appreciation over a preset price of the Company’s common stock during a specified period of time. When the unit is exercised, the appreciation amount is paid through the issuance of shares of the Company’s common stock. The ceiling limits the maximum income for each SAR unit. SARs are considered an equity instrument as it is a net share settled award capped with a ceiling.
A summary of the various plans is as follows:
1993 Director Stock Option Plan
Upon the closing of the Company’s initial public offering, the Company adopted the 1993 Director Stock Option Plan (the “Directors Plan”). Under the Directors Plan, which expires in 2014, the Company is authorized
80
Table of Contents
DSP GROUP INC.
NOTES TO CONSOLIDATED FINANCIAL STATEMENTS—(Continued)
U.S. dollars in thousands, except share and per share data
to issue nonqualified stock options to the Company’s outside non-employee directors to purchase up to 1,680,875 shares of common stock at an exercise price equal to the fair market value of the common stock on the date of grant. The Directors Plan, as amended, provides that each person who becomes an outside, non-employee director of the Board of Directors shall automatically be granted an option to purchase 30,000 shares of common stock (the “First Option”).
Thereafter, each outside director shall automatically be granted an option to purchase 15,000 shares of common stock (a “Subsequent Option”) on January 1 of each year if, on such date, he shall have served on the Board of Directors for at least six months. In addition, an option to purchase an additional 15,000 shares of common stock (a “Committee Option”) is granted on January 1 of each year to each outside director for each committee of the Board on which he shall have served as a chairperson for at least six months.
Options granted under the Directors Plan generally have a term of 10 years. One-third of the shares are exercisable after the first year and thereafter one-third at the end of each twelve-month period.
As of December 31, 2009, 354,180 shares of common stock remained available for grant under that plan.
1998 Non-Officer Employee Stock Option Plan
In 1998, the Company adopted the 1998 Non-Officer Employee Stock Option Plan (the “1998 Plan”). Under the 1998 Plan, employees may be granted non-qualified stock options for the purchase of common stock. The 1998 Plan currently provides for the purchase of up to 5,062,881 shares of common stock. As of December 31, 2009, 433,361 shares of common stock remained available for grant under the 1998 Plan.
The exercise price of options under the 1998 Plan shall not be less than the fair market value of common stock for nonqualified stock options, as determined by the Company’s Board of Directors.
Options under the 1998 Plan are generally exercisable over a 48-month period beginning 12 months after issuance, or as determined by the Company’s Board of Directors. Options under the 1998 Plan expire up to seven years after the date of grant.
2001 Stock Incentive Plan
In 2001, the Company adopted the 2001 Stock Incentive Plan (the “2001 Plan”). Under the 2001 Plan, employees, directors and consultants may be granted incentive or non-qualified stock options and other awards for the purchase of common stock. The 2001 Plan expires in 2011. 1,526,314 shares of common stock are currently reserved for issuance under the 2001 Plan. As of December 31, 2009, 169,975 shares of common stock remained available for grant under that plan.
The 2001 Plan authorizes the administrator to grant incentive stock options at an exercise price of not less than 100% of the fair market value of the common stock on the date the option is granted.
Equity awards under the 2001 Plan are generally exercisable over a 48-month period beginning 12 months after issuance or as determined by the Company’s Board of Directors. Equity awards under the 2001 plan expire up to seven years after the date of grant.
81
Table of Contents
DSP GROUP INC.
NOTES TO CONSOLIDATED FINANCIAL STATEMENTS—(Continued)
U.S. dollars in thousands, except share and per share data
2003 Israeli Share Option Plan
In 2003, the Company adopted the 2003 Israeli Share Option Plan (the “2003 Plan”), which complies with the Israeli tax reforms. Qualified options and shares are held in trust until the later of 24 months from the date of grant of the equity awards, or the vesting of the equity awards based on a vesting schedule determined by a committee appointed by the Company’s Board of Directors. 7,090,086 shares of common stock were reserved for issuance as of December 31, 2009 under the plan. Pursuant to the terms of the 2003 Plan, on the first business day of each calendar year beginning in 2004, the number of shares authorized under the plan increases by an amount equal to 3% of the number of shares of common stock outstanding as of such date, or a lower number of shares determined by the Company’s Board of Directors. As of December 31, 2009, 890,854 shares of common stock remained available for grant under the 2003 Plan.
Equity awards under the 2003 Plan are generally exercisable over a 48-month period beginning 12 months after issuance, or as determined by the Board of Directors. Equity awards under the 2003 Plan expire up to seven years after the date of grant.
1993 Employee Stock Purchase Plan
Upon the closing of the Company’s initial public offering, the Company adopted the ESPP. The Company has reserved an aggregate of 2,000,000 shares of common stock for issuance under the ESPP. The ESPP provides that substantially all employees may purchase stock at 85% of its fair market value on specified dates via payroll deductions. There were approximately 357,000, 290,000 and 93,000 shares of common stock issued at a weighted average purchase price of $5.90, $7.19 and $17.90 under the ESPP in 2009, 2008 and 2007, respectively.
Stock Reserved for Future Issuance
The following table summarizes the number of outstanding shares of common stock available for future issuance at December 31, 2009 (after giving effect to the above increases in the stock option plans):
| ESPP |
546 | |
| Equity awards |
1,848 | |
| Undesignated preferred stock |
5,000 | |
| 7,394 | ||
82
Table of Contents
DSP GROUP INC.
NOTES TO CONSOLIDATED FINANCIAL STATEMENTS—(Continued)
U.S. dollars in thousands, except share and per share data
The following is a summary of activities relating to the Company’s stock options and SARs granted among the Company’s various plans:
| Year ended December 31, | ||||||||||||||||||
| 2009 | 2008 | 2007 | ||||||||||||||||
| Amount of options/ SARs |
Weighted average exercise price |
Amount of options/SARs |
Weighted average exercise price |
Amount of options/SARs |
Weighted average exercise price | |||||||||||||
| in thousands | in thousands | in thousands | ||||||||||||||||
| Options outstanding at beginning of year |
8,359 | $ | 18.54 | 6,507 | $ | 22.65 | 6,465 | $ | 24.61 | |||||||||
| Changes during the year: |
||||||||||||||||||
| Granted(1) |
2,981 | $ | 6.11 | 3,179 | $ | 10.01 | 2,152 | $ | 20.18 | |||||||||
| Exercised |
— | $ | — | (9 | ) | $ | 11.48 | (190 | ) | $ | 15.13 | |||||||
| Forfeited and cancelled |
(907 | ) | $ | 16.16 | (1,318 | ) | $ | 18.31 | (1,920 | ) | $ | 27.22 | ||||||
| Options/SARs outstanding at end of year(2) |
10,433 | $ | 15.20 | 8,359 | $ | 18.54 | 6,507 | $ | 22.65 | |||||||||
| Options/SARs exercisable at end of year(3) |
5,433 | $ | 20.68 | 4,091 | $ | 22.89 | 3,346 | $ | 22.97 | |||||||||
| (1) | SAR grants made prior to January 1, 2009 are convertible for a maximum number of shares of the Company’s common stock equal to 50% of the SAR units subject to the grant. SAR grants made on or after January 1, 2009 are convertible for a maximum number of shares of the Company’s common stock equal to 75% of the SAR units subject to the grant. |
| (2) | Due to the ceiling imposed on the SAR grants, the outstanding amount above can be exercised for a maximum of 7,622,809 shares of the Company’s common stock as of December 31, 2009. |
| (3) | Due to the ceiling imposed on the SAR grants, the exercisable amount above can be exercised for a maximum of 4,109,188 shares of the Company’s common stock as of December 31, 2009. |
The options and SARs outstanding as of December 31, 2009, have been separated into ranges of exercise price as follows:
| Range of exercise price |
Outstanding | Remaining contractual life (years) |
Aggregate intrinsic value(*) |
Weighted average exercise price |
Exercisable | Remaining contractual life (years) |
Aggregate intrinsic value(*) |
Weighted average exercise price | ||||||||||||
| $ |
thousands | thousands | $ | |||||||||||||||||
| 5.81— 7.23 |
2,843 | 6.09 | $ | — | $ | 6.01 | 96 | 5.94 | $ | — | $ | 6.28 | ||||||||
| 8.02—10.23 |
2,548 | 5.30 | — | $ | 9.99 | 1,053 | 5.03 | — | $ | 10.14 | ||||||||||
| 11.60—14.82 |
246 | 6.87 | — | $ | 12.55 | 95 | 6.61 | — | $ | 12.69 | ||||||||||
| 15.18—19.97 |
568 | 3.36 | — | $ | 17.35 | 417 | 2.86 | — | $ | 17.47 | ||||||||||
| 20.31—28.72 |
4,203 | 3.00 | — | $ | 24.30 | 3,747 | 2.86 | — | $ | 24.45 | ||||||||||
| Above 30.00 |
25 | 0.01 | — | $ | 38.19 | 25 | 0.01 | — | $ | 38.19 | ||||||||||
| 10,433 | 4.51 | $ | — | $ | 15.20 | 5,433 | 3.39 | — | $ | 20.68 | ||||||||||
| (*) | Calculation of aggregate intrinsic value is based on the share price of the Company’s common stock as of December 31, 2009 ($5.63 per share). |
As of December 31, 2009, the outstanding number of SARs was 6,778,386 and based on the share price of the Company’s common stock as of December 31, 2009 ($5.63 per share), none of those SARs were in-the-money as of December 31, 2009.
83
Table of Contents
DSP GROUP INC.
NOTES TO CONSOLIDATED FINANCIAL STATEMENTS—(Continued)
U.S. dollars in thousands, except share and per share data
The weighted-average estimated fair value of employee stock options and SARs granted during the years ended December 31, 2009, 2008 and 2007 was $2.47, $3.63 and $6.97, respectively, per share using the binomial model with the following weighted-average assumptions (annualized percentages):
| Year ended December 31, | |||||||||
| 2009 | 2008 | 2007 | |||||||
| Volatility |
61.92 | % | 52.16 | % | 37.17 | % | |||
| Risk-free interest rate |
2.00 | % | 3.32 | % | 4.74 | % | |||
| Dividend yield |
0 | % | 0 | % | 0 | % | |||
| Pre-vest cancellation rate(*) |
3.50 | % | 3.80 | % | 7.66 | % | |||
| Post-vest cancellation rate(**) |
2.15 | % | 1.69 | % | 0.85 | % | |||
| Suboptimal exercise factor(***) |
1.64 | 1.66 | 1.67 | ||||||
| Expected life |
4.07 years | 4.37 years | 5.25 years | ||||||
| (*) | The pre-vest cancellation rate was calculated on an annual basis and is presented for 2009 and 2008 on an annual basis. For 2007, the rates presented here are of the total cancellations from grant. |
| (**) | The post-vest cancellation rate was calculated on a monthly basis and is presented here on an annual basis. |
| (***) | The ratio of the stock price to strike price at the time of exercise of the option. |
The Company used its historical volatility and its implied volatility for calculating volatility. The computation of volatility uses a combination of historical volatility and implied volatility derived from the Company’s exchange traded options with similar characteristics.
The risk-free interest rate assumption is based on U.S. treasury bill interest rates appropriate for the term of the Company’s employee equity-based awards.
The dividend yield assumption is based on the Company’s historical and expectation of future dividend payouts and may be subject to substantial change in the future.
The expected term of employee equity-based awards represents the weighted-average period the awards are expected to remain outstanding and is a derived output of the binomial model. The expected life of employee equity-based awards is impacted by all of the underlying assumptions used in the Company’s model. The binomial model assumes that employees’ exercise behavior is a function of the award’s remaining contractual life and the extent to which the award is in-the-money (i.e., the average stock price during the period is above the strike price of the award). The binomial model estimates the probability of exercise as a function of these two variables based on the history of exercises and cancellations on past award grants made by the Company.
As equity-based compensation expense recognized in the consolidated statement of operations is based on awards ultimately expected to vest, it should be reduced for estimated forfeitures. The forfeitures are estimated at the time of grant and revised, if necessary, in subsequent periods if actual forfeitures differ from those estimates.
Pre and post-vesting forfeitures were estimated based on historical experience.
The Company’s aggregate compensation expenses for the years ended December 31, 2009, 2008 and 2007 totaled $11,100, $13,938 and $14,022, respectively. The total tax benefit (expenses) recognized in the consolidated statements of operations for the years ended December 31, 2009, 2008 and 2007, was $0, $(1,070) and $580, respectively, for the Company’s equity-based compensation arrangements. The above tax expenses in 2008 included a tax benefit of $459 offset by a deferred taxes valuation allowance of $1,529.
84
Table of Contents
DSP GROUP INC.
NOTES TO CONSOLIDATED FINANCIAL STATEMENTS—(Continued)
U.S. dollars in thousands, except share and per share data
A summary of the status of the Company’s non-vested stock options and SARs as of December 31, 2009, and changes during the year ended December 31, 2009, is presented below:
| Non-vested shares |
Shares | Weighted average grant date fair value | ||||
| (In thousands) | ||||||
| Non-vested at January 1, 2009 |
4,268 | $ | 5.04 | |||
| Granted |
2,981 | $ | 2.47 | |||
| Vested |
(1,970 | ) | $ | 5.26 | ||
| Forfeited |
(279 | ) | $ | 4.61 | ||
| Non-vested at December 31, 2009 |
5,000 | $ | 3.45 | |||
As of December 31, 2009, equity-based compensation arrangements to purchase 7,059 shares of common stock were vested and expected to vest (the calculation takes into consideration the forfeiture rate).
As of December 31, 2009, there was a total unrecognized compensation expense of $6,887 related to non-vested equity-based compensation arrangements granted under the Company’s various plans. That expense is expected to be recognized during the period from 2010 through 2013.
NOTE 13:- MAJOR CUSTOMERS AND GEOGRAPHIC INFORMATION
The Company operates in one reportable segment (see Note 1 for a brief description of the Company’s business).
The following is a summary of operations within geographic areas based on customer locations:
| Year ended December 31, | |||||||||
| 2009 | 2008 | 2007 | |||||||
| Revenue distribution: |
|||||||||
| Hong-Kong |
$ | 95,204 | $ | 120,175 | $ | 89,748 | |||
| Japan |
71,388 | 108,471 | 122,832 | ||||||
| Korea |
20,233 | 11,922 | 5,248 | ||||||
| Europe |
15,448 | 31,724 | 18,657 | ||||||
| United States |
3,382 | 23,579 | 6,132 | ||||||
| Other |
6,531 | 9,929 | 6,171 | ||||||
| $ | 212,186 | $ | 305,800 | $ | 248,788 | ||||
The following is a summary of long-lived assets within geographic areas based on the assets locations:
| December 31, | |||||||||
| 2009 | 2008 | 2007 | |||||||
| Long-lived assets: |
|||||||||
| Europe |
$ | 21,532 | $ | 34,460 | $ | 234,100 | |||
| Israel |
7,558 | 9,527 | 7,486 | ||||||
| United States |
653 | 1,419 | 3,970 | ||||||
| Other |
820 | 2,144 | 6,683 | ||||||
| $ | 30,563 | $ | 47,550 | $ | 252,239 | ||||
For a summary of revenues from major customers please see Note 1.
85
Table of Contents
DSP GROUP INC.
NOTES TO CONSOLIDATED FINANCIAL STATEMENTS—(Continued)
U.S. dollars in thousands, except share and per share data
NOTE 14:- RELATED PARTIES BALANCES AND TRANSACTIONS
As partial consideration for the Acquisition, the Company issued to NXP 4,186,603 shares of its common stock, representing 16% of the Company’s outstanding common stock as of December 31, 2008.
In connection with the Acquisition, the Company, DSP Israel and NXP entered into, among others, the following ancillary documents, each effective as of September 4, 2007:
| (1) | Manufacturing Services Collaboration Agreement, as amended, pursuant to which NXP agreed to provide the Company and its affiliates with specified manufacturing, pre-testing, assembling and final-testing services relating to the CIPT Business products at agreed upon prices for up to seven years following the closing of the Acquisition. The services are provided on a purchase order basis. |
| (2) | Umbrella Transitional Services Agreement pursuant to which NXP agreed to provide the Company and its affiliates with other specified transitional services at agreed upon prices for a limited period to assist the Company and its affiliates in achieving a smooth transition of the CIPT Business. The services are provided pursuant to specified service level agreements and include HR, finance and administration, IT, infrastructure, warehousing, CAD tool services, Intellectual Property Library Services and R&D services. The term of each service is agreed upon in the service level agreements. |
On January 27, 2009, the Company and NXP entered into a Stock Repurchase Agreement (the “Repurchase Agreement”) pursuant to which the Company agreed to repurchase the 4,186,603 shares of the Company’s common stock issued to NXP in connection with the Acquisition (the “Shares”). The per share purchase price for the Shares was determined by the parties to be the average closing price per share of the common stock on the NASDAQ Global Market during the 20 business days commencing on February 5, 2009, less fifteen percent of such average. The closing of the repurchase occurred on March 12, 2009 (the “Closing Date”), at which time the Company repurchased the Shares for an aggregate consideration of approximately $20,028. Effective as of the Closing Date, the Stockholders Agreement previously executed by the Company and NXP and all rights and obligations of the parties therein terminated and the NXP nominee to the Company’s Board of Directors resigned. The termination of the Stockholders Agreement had no impact on the Manufacturing Services Collaboration Agreement, as amended or the Umbrella Transitional Services Agreement.
| a. | Balances with related party: |
| December 31, | ||||||
| 2009 | 2008 | |||||
| Other accounts receivable and prepaid expenses |
$ | — | $ | 2,760 | ||
| Trade payables |
$ | — | $ | 7,414 | ||
| Accrued expenses and other accounts payable |
$ | — | $ | 893 | ||
| b. | Transactions with related party: |
| Year ended December 31, | |||||||||
| 2009(3) | 2008 | 2007 | |||||||
| Cost of revenues(1) |
$ | 8,013 | $ | 78,118 | $ | 33,165 | |||
| Research and development expenses(2) |
$ | 209 | $ | 3,173 | $ | 1,503 | |||
| Sales and marketing expenses(2) |
$ | 19 | $ | 378 | $ | 199 | |||
| General and administrative expenses(2) |
$ | 60 | $ | 439 | $ | 176 | |||
86
Table of Contents
DSP GROUP INC.
NOTES TO CONSOLIDATED FINANCIAL STATEMENTS—(Continued)
U.S. dollars in thousands, except share and per share data
| (1) | Includes the purchase of inventory from NXP pursuant to the Manufacturing Services Collaboration Agreement described above. |
| (2) | Includes certain research and development, sales and marketing, and general and administrative services provided by NXP pursuant to the agreements described above. |
| (3) | The amounts included for 2009 were for the period that NXP was deemed a related party. |
NOTE 15:- COMMITMENTS AND CONTINGENCIES
Commitments
The Company and its subsidiaries lease certain equipment and facilities under non-cancelable operating leases. The Company has significant leased facilities in Herzliya Pituach, Israel and California. The lease agreement for the Israeli facilities is effective until November 2013. The Company has various agreements for its facilities in the U.S. terminating in 2010 through 2011. The Company’s subsidiaries in Scotland, Japan and Hong-Kong have lease agreements for their facilities that terminate in 2010. The Company’s subsidiaries in Germany, India and Switzerland have sublease agreements with NXP for their facilities that terminate in 2010 through 2012. The Company has operating lease agreements for its motor vehicles, which terminate in 2010 through 2012. In addition, certain of the Company’s subsidiaries have fixed service agreements with NXP (see Note 14).
At December 31, 2009, the Company is required to make the following minimum lease payments under non-cancelable operating leases for its motor vehicles and facilities:
| Year ended December 31, |
|||
| 2010 |
$ | 4,331 | |
| 2011 |
2,573 | ||
| 2012 |
1,895 | ||
| 2013 |
1,505 | ||
| $ | 10,304 | ||
Facilities rental expenses amounted to $3,163 (out of which $102 is to a related party), $3,368 (out of which $677 is to a related party) and $2,502 (out of which $303 is to a related party) for the years ended December 31, 2009, 2008 and 2007, respectively.
Purchase obligations with NXP as of December 31, 2009 totaled $7,036. Purchase obligations include payments due under agreements to purchase finished goods.
At December 31, 2009, the Company is required to make the following minimum lease payments under capital leases for the purchase of computer equipment:
| Year ended December 31, |
|||
| 2010 |
$ | 455 | |
| $ | 455 | ||
87
Table of Contents
DSP GROUP INC.
NOTES TO CONSOLIDATED FINANCIAL STATEMENTS—(Continued)
U.S. dollars in thousands, except share and per share data
Claims
| a. | The Company is involved in certain claims arising in the normal course of business. However, the Company believes that the ultimate resolution of these matters will not have a material adverse effect on its financial position, results of operations, or cash flows. |
| b. | From time to time, the Company may become involved in litigation relating to claims arising in the ordinary course of business activities. Also, as is typical in the semiconductor industry, the Company has been and, from time to time may be, notified of claims that it may be infringing on patents or intellectual property rights owned by third parties. For example, in a lawsuit against Microsoft Corporation, AT&T asserted that the Company’s TrueSpeech 8.5 algorithm includes certain elements covered by a patent held by AT&T. AT&T sued Microsoft, one of the Company’s TrueSpeech 8.5 licensees, for infringement. The Company was not named in AT&T’s suit against Microsoft. During 2002, the Company recorded a provision, which was included in the costs of revenues, in respect of this legal exposure. The Company and its legal counsel currently believe that there are no claims or actions pending or threatened against it, the ultimate disposition of which would have a material adverse effect on the Company. |
NOTE 16:- TAXES ON INCOME
| a. | The provision for income taxes is as follows: |
| Year ended December 31, | ||||||||||||
| 2009 | 2008 | 2007 | ||||||||||
| Domestic taxes: |
||||||||||||
| Federal taxes: |
||||||||||||
| Current |
$ | (13,095 | ) | $ | (1,051 | ) | $ | 3,618 | ||||
| Deferred(*) |
— | (2,260 | ) | (344 | ) | |||||||
| Valuation allowance |
— | 6,172 | — | |||||||||
| (13,095 | ) | 2,861 | 3,274 | |||||||||
| State taxes: |
||||||||||||
| Current |
173 | 21 | (102 | ) | ||||||||
| Deferred |
— | (1,034 | ) | 160 | ||||||||
| Valuation allowance |
— | 1,340 | — | |||||||||
| 173 | 327 | 58 | ||||||||||
| Foreign taxes: |
||||||||||||
| Current |
963 | (1,787 | ) | 2,762 | ||||||||
| Deferred |
42 | (15,979 | ) | (3,701 | ) | |||||||
| Valuation allowance |
283 | 20,425 | — | |||||||||
| 1,288 | 2,659 | (939 | ) | |||||||||
| Taxes on income |
$ | (11,634 | ) | $ | 5,847 | $ | 2,393 | |||||
| (*) | Including $0, $459 and $580 in 2009, 2008 and 2007, respectively, relating to tax benefits resulting from equity-based compensation expenses. |
Tax benefits associated with the exercise of non-qualified stock options reduced current taxes payable by $147 in 2007. Such benefits were credited to additional paid-in capital in 2007. There were no such benefits in 2008 and 2009.
88
Table of Contents
DSP GROUP INC.
NOTES TO CONSOLIDATED FINANCIAL STATEMENTS—(Continued)
U.S. dollars in thousands, except share and per share data
| b. | Loss before taxes is comprised as follows: |
| Year ended December 31, | ||||||||||||
| 2009 | 2008 | 2007 | ||||||||||
| Domestic |
$ | (4,851 | ) | $ | (10,868 | ) | $ | 4,379 | ||||
| Foreign |
(15,219 | ) | (195,679 | ) | (6,739 | ) | ||||||
| $ | (20,070 | ) | $ | (206,547 | ) | $ | (2,360 | ) | ||||
| c. | A reconciliation between the Company’s effective tax rate assuming all income is taxed at statutory tax rate applicable to the income of the Company and the U.S. statutory rate is as follows: |
| Year ended December 31, | ||||||||||||
| 2009 | 2008 | 2007 | ||||||||||
| Losses before taxes on income (loss) |
$ | (20,070 | ) | $ | (206,547 | ) | $ | (2,360 | ) | |||
| Theoretical tax at U.S. statutory tax rate (35%) |
$ | (7,025 | ) | $ | (72,291 | ) | $ | (826 | ) | |||
| State taxes, net of federal benefit |
3 | (892 | ) | 1 | ||||||||
| Foreign income taxed at rates other than the U.S. rate (including valuation allowance) |
3,008 | 66,059 | (2,488 | ) | ||||||||
| Nondeductible equity-based compensation expenses |
3,885 | 4,419 | 4,328 | |||||||||
| Current adjustment and interest of uncertain tax position liability |
(10,970 | ) | 510 | 1,820 | ||||||||
| Valuation allowance in U.S. |
— | 7,512 | — | |||||||||
| Other |
(534 | ) | 530 | (442 | ) | |||||||
| $ | (11,633 | ) | $ | 5,847 | $ | 2,393 | ||||||
89
Table of Contents
DSP GROUP INC.
NOTES TO CONSOLIDATED FINANCIAL STATEMENTS—(Continued)
U.S. dollars in thousands, except share and per share data
| d. | Deferred income taxes reflect the net tax effects of temporary differences between the carrying amounts of assets and liabilities for financial reporting purposes and the amounts used for income tax purposes. |
| December 31, | ||||||||
| 2009 | 2008 | |||||||
| Deferred tax assets (short-term): |
||||||||
| Reserves and accruals |
$ | 237 | $ | 127 | ||||
| Intangible assets |
— | 388 | ||||||
| Total deferred tax assets (short-term) |
237 | 515 | ||||||
| Valuation allowance |
(59 | ) | (209 | ) | ||||
| Total |
178 | 306 | ||||||
| Deferred tax assets (long-term): |
||||||||
| Reserves and accruals |
2,703 | 2,478 | ||||||
| Equity-based compensation |
1,873 | 1,529 | ||||||
| Intangible assets |
5,363 | 22,242 | ||||||
| Carryforward tax losses |
18,509 | 1,432 | ||||||
| Other |
220 | 258 | ||||||
| Total deferred tax assets (long-term) |
28,668 | 27,939 | ||||||
| Valuation allowance |
(28,653 | ) | (27,727 | ) | ||||
| Total |
15 | 212 | ||||||
| Total deferred tax assets |
$ | 193 | $ | 518 | ||||
| Deferred tax liabilities (long-term): |
||||||||
| Other |
$ | — | $ | (24 | ) | |||
| Total deferred tax liabilities |
$ | — | $ | (24 | ) | |||
Management believes that the deferred net tax assets will not be realized based on current levels of future taxable income and potentially refundable taxes. Accordingly, a valuation allowance in the amount of $28,712 and $27,937 was provided as of December 31, 2009 and 2008, respectively.
90
Table of Contents
DSP GROUP INC.
NOTES TO CONSOLIDATED FINANCIAL STATEMENTS—(Continued)
U.S. dollars in thousands, except share and per share data
| e. | Uncertain tax positions |
A reconciliation of the beginning and ending balances of the total amounts of gross unrecognized tax benefits is as follows:
| December 31, 2009 |
||||
| Gross unrecognized tax benefits at January 1, 2009 |
$ | 14,859 | ||
| Decrease in tax positions for previous years |
(343 | ) | ||
| Increases in tax positions for previous years |
118 | |||
| Decrease due to settlement agreement with the tax authorities |
(4,974 | ) | ||
| Increase in interest related to tax positions |
362 | |||
| Increases in tax positions for current year |
730 | |||
| Lapse in statute of limitations |
(7,645 | ) | ||
| Gross unrecognized tax benefits at December 31, 2009 |
$ | 3,107 | ||
| December 31, 2008 |
||||
| Gross unrecognized tax benefits at January 1, 2008 |
$ | 14,066 | ||
| Increases in interest related to tax positions |
789 | |||
| Increases in tax positions for current year |
4 | |||
| Gross unrecognized tax benefits at December 31, 2008 |
$ | 14,859 | ||
The total amount of net unrecognized tax benefits that, if recognized, would affect the effective tax rate was $3,107 and $14,859 at December 31, 2009 and 2008, respectively. The Company accrues interest and penalties relating to unrecognized tax benefits in its provision for income taxes. At December 31, 2009 and 2008, the Company had accrued interest and penalties related to unrecognized tax benefits of $489 and $3,500, respectively.
Pursuant to a tax settlement with the U.S. Internal Revenue Service, relating to the audit of the Company’s U.S. federal income tax returns for 2003 and 2004, the Company paid $1,486 to the Internal Revenue Service and, due to the reversal of the applicable income tax accrual, recorded a tax benefit of $3,488 during 2009.
The Company reversed an income tax contingency reserve that was determined to be no longer required due to the expiration of applicable limitation statutes. Pursuant to this reversal, the Company recorded a tax benefit of $7,645 during 2009.
The Company and certain of its subsidiaries file income tax returns in the U.S. federal jurisdiction and various state and foreign jurisdictions. The last examination conducted by U.S. tax authorities was in respect to the Company’s U.S. federal income tax returns for 2004. The statute of limitations relating to the consolidated Federal income tax return is closed for all tax years up to and including 2004.
With respect to DSP Israel, the Israeli tax authorities audited its income tax returns for the years ended before 2004, and therefore such returns are closed for the years ended before 2004.
| f. | Tax benefits under the Law for the Encouragement of Capital Investments, 1959 (“Investment Law”): |
Six separate investment plans of DSP Israel’s production facilities have been granted “Approved Enterprise” status and one investment plan of DSP Israel’s production facilities was filed under “Beneficiary Enterprise” status under the Investment Law. The Investment Law provides certain Israeli tax benefits for eligible capital investments in a production facility, as discussed in greater detail below.
91
Table of Contents
DSP GROUP INC.
NOTES TO CONSOLIDATED FINANCIAL STATEMENTS—(Continued)
U.S. dollars in thousands, except share and per share data
On April 1, 2005, an amendment to the Investment Law came into effect (the “Amendment”) and significantly changed the provisions of the Investment Law. Generally, DSP Israel’s investment programs that obtained approval for Approved Enterprise status prior to enactment of the Amendment will continue to be subject to the old provisions of the Investment Law.
The Amendment enacted major changes in the manner in which tax benefits are awarded under the Investment Law so that companies are no longer required to get the Investment Center’s prior approval to qualify for tax benefits. An enterprise that receives tax benefits without the initial approval from the Investment Center is called a “Beneficiary Enterprise,” rather than the previous terminology of Approved Enterprise. The period of tax benefits for a new Beneficiary Enterprise commences in the “Year of Commencement,” which is the later of: (1) the year in which taxable income is first generated by the company, or (2) the year of election.
In addition, under the Amendment, tax benefits are available to production facilities, which generally are required to derive more than 25% of their business income from export. Furthermore, in order to receive the tax benefits under the Amendment, a company must make an investment in the Benefited Enterprise exceeding a certain percentage or a minimum amount specified in the Investment Law.
If a company requests the “alternative benefits” track for an Approved Enterprise under the old provisions of the Investment Law, it is precluded from filing a year of election notice for a Beneficiary Enterprise for two years after the year in which the Approved Enterprise was activated (the “Cooling Period”). “Alternative benefits” track is a waiver of grants in return for a tax exemption.
DSP Israel has chosen the “alternative benefits” track for all of its investment plans. Accordingly, DSP Israel’s income from an “Approved Enterprise” and “Beneficiary Enterprise” is tax-exempt for a period of two or four years and is subject to a reduced corporate tax rate of 10%-25% (based on the percentage of foreign ownership) for an additional period of eight or five years, respectively.
DSP Israel’s first and second plans, which were completed and commenced operations in 1994 and 1996, respectively, were tax exempt for two and four years, respectively, from the first year they had taxable income and were entitled to a reduced corporate tax rate of 10%-25% (based on the percentage of foreign ownership) for an additional period of eight and six years, respectively. As of 2009, those plans were no longer entitled to a reduced corporate tax.
DSP Israel’s third plan, which was completed and commenced operations in 1998, was tax exempt for two years from the first year it had taxable income and was entitled to a reduced corporate tax rate of 10%-25% (based on the percentage of foreign ownership) for an additional period of eight years from the first year it had taxable income. As of 2009, this plan was no longer entitled to a reduced corporate tax.
DSP Israel’s fourth, fifth and sixth plans were approved in 1998, 2001 and 2003, respectively, which entitled DSP Israel to a corporate tax exemption for a period of two years and to a reduced corporate tax rate of 10%-25% (based on the percentage of foreign ownership) for an additional period of eight years from the first year the production facility subject to the plan had taxable income.
DSP Israel’s seventh plan has been in operation since 2006 and entitles DSP Israel to a corporate tax exemption for a period of two years and a reduced corporate tax rate of 10%-25% (based on the percentage of foreign ownership) for an additional period of eight years from the first year it has taxable income.
Since DSP Israel is operating under more than one approval, its effective tax rate is the result of a weighted combination of the various applicable tax rates and tax exemptions and the computation is made for income derived from each plan on the basis and formulas specified in the Investment Law and the approvals.
92
Table of Contents
DSP GROUP INC.
NOTES TO CONSOLIDATED FINANCIAL STATEMENTS—(Continued)
U.S. dollars in thousands, except share and per share data
During 2006, DSP Israel received an approval for the erosion of tax basis in respect to its fifth and sixth plans. During 2008, DSP Israel received an approval for the erosion of tax basis in respect to its second, third and fourth plans. Those approvals resulted in increasing the taxable income attributed to the fourth, fifth and sixth plans, which are currently in operation and will be taxed at a lower tax rate than the previous plans, which in turn will decrease the overall effective tax rate.
Through December 31, 2009, DSP Israel believes it met all the conditions required under the plans, which include inter-alia an obligation to invest certain amounts in property and equipment and an obligation to finance a percentage of investments by share capital.
Should DSP Israel fail to meet such conditions in the future, it could be subject to corporate tax in Israel at the standard tax rate (25% for 2010) and could be required to refund tax benefits already received.
The period of tax benefits for DSP Israel’s seventh plan, as detailed above, is subject to limitations of the earlier of 12 years from commencement of production or the year of election, or 14 years from receipt of approval (“the years’ limitation”). The years’ limitation does not apply to the Company’s first six plans which were implemented prior to the Amendment.
As of December 31, 2009, approximately $36,402 was derived from tax exempt profits earned by DSP Israel’s “Approved Enterprises” and “Beneficiary Enterprise.” The Company has determined that such tax-exempt income will not be distributed as dividends and intends to reinvest the amount of its tax exempt income earned by DSP Israel. Accordingly, no provision for deferred income taxes has been provided on income attributable to DSP Israel’s “Approved Enterprises” and “Beneficiary Enterprise” as such income is essentially permanently reinvested.
If DSP Israel’s retained tax-exempt income is distributed in a manner other than on its complete liquidation, the income would be taxed at the applicable corporate tax rate (currently 10%) as if it had not elected the alternative tax benefits under the Investment Law and an income tax liability of approximately $4,045 would have been incurred as of December 31, 2009.
DSP Israel’s income from sources other than the “Approved Enterprises” and “Beneficiary Enterprise” during the benefit period will be subject to tax at the effective standard corporate tax rate in Israel (25% in 2010).
By virtue of the Investment Law, DSP Israel is entitled to claim accelerated rates of depreciation on equipment used by an “Approved Enterprise” and “Beneficiary Enterprise” during the first five tax years from the beginning of such use.
| g. | Tax benefits under Israel’s Law for Encouragement of Industry (Taxation), 1969: |
DSP Israel is an “industrial company” under the Law for the Encouragement of Industry (Taxation), 1969, and as such is entitled to certain tax benefits, mainly the amortization of costs relating to know-how and patents, over eight years and accelerated depreciation.
| h. | Reduction in Israeli tax rate: |
Until December 31, 2003, the regular tax rate applicable to income of companies (which are not entitled to benefits due to “Approved Enterprise,” as described above) was 36%. In June 2004 and in July 2005, the “Knesset” (Israeli parliament) passed amendments to the Income Tax Ordinance (No. 140 and Temporary Provision), 2004 and (No. 147), 2005, respectively, which determined, among other things, that the corporate tax rate is to be gradually reduced to the following tax rates: 2006—31%, 2007—29%, 2008—27%, 2009—26% and 2010 and thereafter—25%.
93
Table of Contents
DSP GROUP INC.
NOTES TO CONSOLIDATED FINANCIAL STATEMENTS—(Continued)
U.S. dollars in thousands, except share and per share data
In July 2009, the Knesset passed the Law for Economic Efficiency (Amended Legislation for Implementing the Economic Plan for 2009 and 2010), 2009, which prescribes, among others, an additional gradual reduction in the rates of the Israeli corporate tax and real capital gains tax starting 2011 to the following tax rates: 2011—24%, 2012—23%, 2013—22%, 2014—21%, 2015—20%, 2016 and thereafter—18%.
| i. | Israeli transfer pricing regulations: |
On November 29, 2006, Income Tax Regulations (Determination of Market Terms), 2006, promulgated under Section 85A of the Income Tax Ordinance, came into effect (the “TP Regulations”). Section 85A of the Income Tax Ordinance and the TP Regulations generally require that all cross-border transactions carried out between related parties be conducted on an arm’s length principle basis and will be taxed accordingly.
| j. | Non-U.S. or Israeli subsidiaries are taxed according to the applicable laws in their countries of residence except in Switzerland. In connection with the Acquisition, the Company applied for a tax ruling with the Swiss tax authorities to determine the tax rate applicable to the taxable income generated by the Company’s Swiss subsidiary, established in connection with the Acquisition, including the amortization period for tax purposes of goodwill and other intangible assets acquired in the Acquisition. The Swiss tax ruling process was finalized during the second quarter of 2008. Pursuant to the tax ruling, the Company’s Swiss subsidiary is entitled to reduced tax rates of approximately 10% to 15% depending on the source of income and a tax amortization period of 5 to 10 years for the goodwill and other intangible assets acquired in the Acquisition. |
| k. | DSP Israel has accumulated losses for tax purposes as of December 31, 2009, of approximately $22,122, which may be carried forward and offset against taxable income in the future for an indefinite period. The Swiss subsidiary has accumulated losses for tax purposes as of December 31, 2009, of approximately $158,611, which may be carried forward and offset against taxable income in the future for a period of seven years. |
NOTE 17:- NET LOSS PER SHARE
The following table sets forth the computation of basic and diluted net loss per share:
| Year ended December 31, | ||||||||||||
| 2009 | 2008 | 2007 | ||||||||||
| Numerator: |
||||||||||||
| Net loss |
$ | (8,436 | ) | $ | (212,394 | ) | $ | (4,753 | ) | |||
| Denominator: |
||||||||||||
| Weighted average number of shares of common stock outstanding during the year used to compute basic net loss per share (in thousands) |
23,655 | 28,387 | 29,495 | |||||||||
| Incremental shares attributable to exercise of outstanding options (assuming proceeds would be used to purchase treasury stock) (in thousands) |
— | — | — | |||||||||
| Weighted average number of shares of common stock used to compute diluted net loss per share (in thousands) |
23,655 | 28,387 | 29,495 | |||||||||
| Basic net loss per share |
$ | (0.36 | ) | $ | (7.48 | ) | $ | (0.16 | ) | |||
| Diluted net loss per share |
$ | (0.36 | ) | $ | (7.48 | ) | $ | (0.16 | ) | |||
94
Table of Contents
| Item 9. | CHANGES IN AND DISAGREEMENTS WITH ACCOUNTANTS ON ACCOUNTING AND FINANCIAL DISCLOSURE. |
None.
| Item 9A. | CONTROLS AND PROCEDURES. |
Evaluation of Disclosure Controls and Procedures
As of the end of the period covered by this report, we carried out an evaluation, under the supervision and with the participation of our Chief Executive Officer and Chief Financial Officer, of the effectiveness of the design and operation of our disclosure controls and procedures. Based on this evaluation, our Chief Executive Officer and Chief Financial Officer concluded that our disclosure controls and procedures were effective as of December 31, 2009.
There has been no change in our internal control over financial reporting that occurred during our most recent fiscal quarter that has materially affected or is reasonably likely to materially affect our internal control over financial reporting.
Management’s Annual Report on Internal Control over Financial Reporting
Our management is responsible for establishing and maintaining adequate internal control over financial reporting, as such term is defined in Rule 13a-15(f) and Rule 15d-15(f) promulgated under the Securities Exchange Act of 1934, as amended. Our internal control over financial reporting is a process designed to provide reasonable assurance regarding the reliability of financial reporting and the preparation of financial statements for external purposes in accordance with generally accepted accounting principles. Because of its inherent limitations, internal control over financial reporting may not prevent or detect misstatements. Also, projections of any evaluation of effectiveness to future periods are subject to the risk that controls may become inadequate because of changes in conditions, or that the degree of compliance with the policies or procedures may deteriorate.
Under the supervision and with the participation of our management, including our principal executive officer and principal financial officer, we conducted an evaluation of the effectiveness of our internal control over financial reporting based on the framework in Internal Control—Integrated Framework issued by the Committee of Sponsoring Organizations of the Treadway Commission. Based on this assessment, our management concluded that our internal control over financial reporting was effective as of December 31, 2009.
The effectiveness of our internal control over financial reporting as of December 31, 2009 has been audited by Kost, Forer, Gabbay & Kasierer, a member of Ernst & Young Global, an independent registered public accounting firm, who audited and reported on the consolidated financial statements of the company for the year ended December 31, 2009, as stated in their report which is presented in this Annual Report on Form 10-K under Item 8.
| Item 9B. | OTHER INFORMATION. |
None.
95
Table of Contents
PART III
Certain information required by Part III of this Annual Report is omitted and will be incorporated by reference herein from our definitive proxy statement pursuant to Regulation 14A in connection with the 2009 Annual Meeting of Stockholders to be held on May 24, 2010.
| Item 10. | DIRECTORS, EXECUTIVE OFFICERS AND CORPORATE GOVERNANCE. |
Information relating to our directors and executive officers will be presented under the captions “Proposal No. 1—Election of Directors” and “Executive Offices and Directors” in our definitive proxy statement. Such information is incorporated herein by reference.
| Item 11. | EXECUTIVE COMPENSATION. |
Information relating to executive compensation will be presented under the caption “Executive Compensation” in our definitive proxy statement. Such information is incorporated herein by reference.
| Item 12. | SECURITY OWNERSHIP OF CERTAIN BENEFICIAL OWNERS AND MANAGEMENT AND RELATED STOCKHOLDER MATTERS. |
Information relating to the security ownership of our common stock by our management and other beneficial owners will be presented under the caption “Security Ownership of Certain Beneficial Owners and Management” in our definitive proxy statement. Such information is incorporated herein by reference.
Information relating to our equity compensation plans will be presented under the caption “Equity Compensation Plan Information” in our definitive proxy statement. Such information is incorporated herein by reference.
| Item 13. | CERTAIN RELATIONSHIPS AND RELATED TRANSACTIONS, AND DIRECTOR INDEPENDENCE. |
Information relating to certain relationships of our directors and executive officers and related transactions, as well as director independence information, will be presented under the caption “Certain Relationships and Related Transactions” in our definitive proxy statement. Such information is incorporated herein by reference.
| Item 14. | PRINCIPAL ACCOUNTANT FEES AND SERVICES. |
Information relating to principal accountant fees and services will be presented under the caption “Principal Accountant Fees and Services” in our definitive proxy statement. Such information is incorporated herein by reference.
96
Table of Contents
PART IV
| Item 15. | EXHIBITS AND FINANCIAL STATEMENT SCHEDULES. |
| (a) | The following documents have been filed as a part of this Annual Report on Form 10-K. |
| 1. | Index to Financial Statements. |
Description:
| Report of Kost, Forer, Gabbay & Kasierer, a member of Ernst & Young Global |
||
| Consolidated Balance Sheets as of December 31, 2009 and 2008 |
||
| Consolidated Statements of Operations for the years ended December 31, 2009, 2008 and 2007 |
||
| Consolidated Statements of Changes in Stockholders’ Equity for the years ended December 31, 2009, 2008 and 2007 |
||
| Consolidated Statements of Cash Flows for the years ended December 31, 2009, 2008 and 2007 |
||
| Notes to Consolidated Financial Statements |
||
| 2. | Index to Financial Statement Schedules. |
The following financial statement schedule and related auditor’s report are filed as part of this Annual Report on Form 10-K:
Description:
| Valuation and Qualifying Accounts |
Schedule II |
All other schedules are omitted because they are not applicable or the required information is included in the attached consolidated financial statements or the related notes for the year ended December 31, 2009.
List of Exhibits:
| Exhibit |
Description | |
| 2.1 | Share and Business Sale Agreement, dated September 3, 2007, by and among DSP Group, Inc., DSP Group Ltd. and NXP, B.V. (filed as Exhibit 2.1 to the Registrant’s Current Report on 8-K filed September 7, 2007, and incorporated herein by reference). | |
| 3.1 | Amended and Restated Certificate of Incorporation (filed as Exhibit 3.1B to the Registrant’s Registration Statement on Form S-1, file no. 33-73482, as declared effective on February 11, 1994, and incorporated herein by reference). | |
| 3.2 | Certificate of Amendment of the Amended and Restated Certificate of Incorporation, Effective as of July 19, 1999 (filed as Exhibit 3.2 to the Registrant’s Annual Report on Form 10-K for the year ended December 31, 2006, and incorporated herein by reference). | |
| 3.3 | Amended and Restated Bylaws, effective as of October 30, 2008 (filed as Exhibit 99.2 to the Registrant’s Current Report on Form 8-K filed on October 30, 2008, and incorporated herein by reference). | |
| 10.1 | Amended and Restated 1991 Employee and Consultant Stock Plan (filed as Exhibit 10.1 to the Registrant’s Annual Report on Form 10-K for the year ended December 31, 2003, and incorporated herein by reference).†† | |
97
Table of Contents
| Exhibit |
Description | |
| 10.2 | Amended and Restated 1993 Director Stock Option Plan (filed as Exhibit 10.2 to the Registrant’s Annual Report on Form 10-K for the year ended December 31, 2008, and incorporated herein by reference).†† | |
| 10.3 | Form of Option Agreement for Israeli Directors under the Amended and Restated 1993 Director Stock Option Plan (filed as Exhibit 10.4 to the Registrant’s Quarterly Report on Form 10-Q for the quarter ended September 30, 2004, and incorporated herein by reference).†† | |
| 10.4 | Form of Option Agreement for Non-Israeli Directors under the Amended and Restated 1993 Director Stock Option Plan (filed as Exhibit 10.4 to the Registrant’s Quarterly Report on Form 10-Q for the quarter ended September 30, 2004, and incorporated herein by reference).†† | |
| 10.5 | 1993 Employee Stock Purchase Plan and form of subscription agreement thereunder.††* | |
| 10.6 | Form of Indemnification Agreement for directors and executive officers (filed as Exhibit 10.1 to the Registrant’s Registration Statement on Form S-1, file no. 33-73482, as declared effective on February 11, 1994, and incorporated herein by reference). | |
| 10.7 | Employment Agreement, dated April 22, 1996, by and between the Registrant and Eliyahu Ayalon (filed as Exhibit 10.3 to the Registrant’s Quarterly Report on Form 10-Q for the quarter ended June 30, 1996, and incorporated herein by reference).†† | |
| 10.8 | Lease, dated November 28, 1996, by and between DSP Semiconductors Ltd. and Gav-Yam Lands Company Ltd., relating to the property located on Shenkar Street, Herzelia Pituach, Israel (filed as Exhibit 10.1 to the Registrant’s Quarterly Report on Form 10-Q for the quarter ended September 30, 1997, and incorporated herein by reference). | |
| 10.9 | Amendment to Employment Agreement with Eliyahu Ayalon, dated as of November 3, 1997 (filed as Exhibit 10.26 to the Registrant’s Annual Report on Form 10-K for the year ended December 31, 1997, and incorporated herein by reference).†† | |
| 10.10 | Lease, dated September 13, 1998, between DSP Group, Ltd. and Bayside Land Corporation Ltd., relating to the property located on Shenkar Street, Herzelia Pituach, Israel (filed as Exhibit 10.22 to the Registrant’s Annual Report on Form 10-K for the year ended December 31, 1998, and incorporated herein by reference). | |
| 10.11 | Amended and Restated 1998 Non-Officer Employee Stock Option Plan (filed as Exhibit 10.19 to the Registrant’s Annual Report on Form 10-K for the year ended December 31, 2003, and incorporated herein by reference).†† | |
| 10.12 | Employment Agreement, dated May 1, 1999, by and between the Registrant and Boaz Edan (filed as Exhibit 10.24 to the Registrant’s Annual Report on Form 10-K for the year ended December 31, 1999, and incorporated herein by reference).†† | |
| 10.13 | Appendix Agreement, dated May 5, 1999, by and between DSP Group, Ltd. and Bayside Land Corporation Ltd., relating to the property located on Shenkar Street, Herzelia Pituach, Israel (filed as Exhibit 10.25 to the Registrant’s Annual Report on Form 10-K for the year ended December 31, 1999, and incorporated herein by reference). | |
| 10.14 | Amendment to Employment Agreement with Eliyahu Ayalon, effective as of November 11, 1999 (filed as Exhibit 10.26 to the Registrant’s Annual Report on Form 10-K for the year ended December 31, 1999, and incorporated herein by reference).†† | |
| 10.15 | Non-Exclusive Distribution Agreement between the Registrant and Tomen Electronics Corporation as amended on October 12, 2000 (filed as Exhibit 10.28 to the Registrant’s Annual Report on Form 10-K for the year ended December 31, 2000, and incorporated herein by reference). | |
98
Table of Contents
| Exhibit |
Description | |
| 10.16 | Amended and Restated 2001 Stock Incentive Plan and form of option agreement thereunder (filed as Exhibit 10.31 to the Registrant’s Annual Report on Form 10-K for the year ended December 31, 2003, and incorporated herein by reference).†† | |
| 10.17 | Amended and Restated 2003 Israeli Share Incentive Plan (filed as Exhibit 99.1 to the Registrant’s Current Report on Form 8-K filed on April 11, 2006, and incorporated herein by reference) and form of option agreement thereunder (filed as Exhibit 10.32 to the Registrant’s Annual Report on Form 10-K for the year ended December 31, 2003, and incorporated herein by reference).†† | |
| 10.18 | Agreement, dated March 5, 2003, between DSP Group, Ltd. and The Gav-Yam Real Estate Company Ltd., relating to the property located on Shenkar Street, Herzelia Pituach, Israel (filed as Exhibit 10.33 to the Registrant’s Quarterly Report on Form 10-Q for the quarter ended March 31, 2003, and incorporated herein by reference). | |
| 10.19 | Form of Option Agreement under DSP Group, Inc.’s 2001 Stock Incentive Plan for Eliyahu Ayalon (filed as Exhibit 10.41 to Registrant’s Annual Report on Form 10-K for the year ended December 31, 2003, and incorporated herein by reference).†† | |
| 10.20 | Form of Option Agreement under DSP Group, Inc.’s 2001 Stock Incentive Plan for Boaz Edan (filed as Exhibit 10.41 to Registrant’s Annual Report on Form 10-K for the year ended December 31, 2003, and incorporated herein by reference).†† | |
| 10.21 | Manufacturing Capacity Agreement, effective as of July 1, 2004, by and among DSP Group, Inc., DSP Group, Ltd, and Taiwan Semiconductor Manufacturing Company Ltd (filed as Exhibit 10.4 to the Registrant’s Quarterly Report on Form 10-Q for the quarter ended September 30, 2004, and incorporated herein by reference) (confidential treatment has been granted for portions of this exhibit). | |
| 10.22 | Employment Agreement, dated June 26, 2003, by and between the Registrant and Eli Fogel (filed as Exhibit 10.45 to Registrant’s Annual Report on Form 10-K for the year ended December 31, 2004, and incorporated herein by reference).†† | |
| 10.23 | Form of Non-Qualified Stock Option Agreement Providing for the Grant of Options as a Material Inducement of Employment (filed as Exhibit 4.1 to Registrant’s Registration Statement on Form S-8 filed on July 21, 2005, and incorporated herein by reference).†† | |
| 10.24 | Form of Stock Appreciation Right Agreement for Executive Officers pursuant to the Amended and Restated 2003 Israeli Share Incentive Plan (filed as Exhibit 99.2 to Registrant’s Current Report on 8-K filed on April 11, 2006, and incorporated herein by reference).†† | |
| 10.25 | Stock Appreciation Right Agreement with Eliyahu Ayalon, dated July 2, 2006 (filed as Exhibit 99.1 to Registrant’s Current Report on 8-K filed on July 5, 2006, and incorporated herein by reference).†† | |
| 10.26 | Stock Appreciation Right Agreement with Boaz Edan, dated July 2, 2006 (filed as Exhibit 99.2 to Registrant’s Current Report on 8-K filed on July 5, 2006, and incorporated herein by reference).†† | |
| 10.27 | Manufacturing Services Collaboration Agreement, dated September 4, 2007, by and among DSP Group, Inc., DSP Group Ltd. and NXP, B.V. (filed as Exhibit 10.39 to Registrant’s Quarterly Report on 10-Q for the quarter ended September 30, 2007, and incorporated herein by reference) (confidential treatment has been granted for portions of this exhibit). | |
| 10.28 | Intellectual Property Transfer and License Agreement, dated September 4, 2007, by and among DSP Group, Inc., DSP Group Ltd. and NXP, B.V. (filed as Exhibit 10.40 to Registrant’s Quarterly Report on 10-Q for the quarter ended September 30, 2007, and incorporated herein by reference) (confidential treatment has been granted for portions of this exhibit). | |
99
Table of Contents
| Exhibit |
Description | |
| 10.29 | Intellectual Property Library Services and R&D Agreement, dated September 4, 2007, by and among DSP Group, Inc., DSP Group Ltd. and NXP, B.V. (filed as Exhibit 10.41 to Registrant’s Quarterly Report on 10-Q for the quarter ended September 30, 2007, and incorporated herein by reference) (confidential treatment has been granted for portions of this exhibit). | |
| 10.30 | Umbrella Transitional Services Agreement, dated September 4, 2007, by and among DSP Group, Inc., DSP Group Ltd. and NXP, B.V. (filed as Exhibit 10.42 to Registrant’s Quarterly Report on 10-Q for the quarter ended September 30, 2007, and incorporated herein by reference) (confidential treatment has been granted for portions of this exhibit). | |
| 10.31 | Employment Agreement by and between Brian Robertson and DSP Group Switzerland AG, effective September 1, 2007 (filed as Exhibit 10.1 to Registrant’s Current Report on Form 8-K filed on November 6, 2007, and incorporated herein by reference).†† | |
| 10.32 | Amendment Agreement to Manufacturing Services Collaboration Agreement, dated January 27, 2009, by and among DSP Group, Inc., DSP Group Ltd. and NXP, B.V. (confidential treatment requested for portions of this exhibit) (filed as Exhibit 10.38 to the Registrant’s Annual Report on Form 10-K for the year ended December 31, 2008, and incorporated herein by reference). | |
| 10.33 | Stock Repurchase Agreement, dated January 27, 2009, by and between DSP Group, Inc. and NXP, B.V. (filed as Exhibit 10.1 to Registrant’s Current Report on 8-K filed on February 2, 2009, and incorporated herein by reference). | |
| 10.34 | Employment Agreement by and between Registrant and Ofer Elyakim, effective May 1, 2008 (filed as Exhibit 10.40 to the Registrant’s Annual Report on Form 10-K for the year ended December 31, 2008, and incorporated herein by reference).†† | |
| 10.34 | Amendment to Employment Agreement by and among DSP Group, Inc., DSP Group, Ltd. and Eli Ayalon, as amended, effective as of October 27, 2009 (filed as Exhibit 10.1 to Registrant’s Current Report on 8-K filed on October 29, 2009, and incorporated herein by reference).†† | |
| 10.35 | Separation Agreement by and among Boaz Edan, DSP Group, Inc. and DSP Group, Ltd., effective as of November 30, 2009 (filed as Exhibit 10.1 to Registrant’s Current Report on 8-K filed on November 30, 2009, and incorporated herein by reference).†† | |
| 21.1 | Subsidiaries of DSP Group, Inc.* | |
| 23.1 | Consent of Kost Forer Gabbay & Kasierer, a member of Ernst & Young Global, Independent Registered Public Accounting Firm.* | |
| 24.1 | Power of Attorney (See signature page of this Annual Report on Form 10-K).* | |
| 31.1 | Rule 13a-14(a)/15d-14(a) Certification of Chief Executive Officer.* | |
| 31.2 | Rule 13a-14(a)/15d-14(a) Certification of Chief Financial Officer.* | |
| 32.1 | Section 1350 Certification of Chief Executive Officer.* | |
| 32.2 | Section 1350 Certification of Chief Financial Officer.* | |
| † | Portions of this exhibit have been redacted and filed separately with the Commission along with a confidential treatment request. |
| †† | Management contract or compensatory plan or arrangement required to be filed as an exhibit pursuant to Item 15(c) of Form 10-K. |
| * | Filed herewith. |
100
Table of Contents
Pursuant to the requirements of Section 13 or 15(d) of the Securities Exchange Act of 1934, the Registrant has duly caused this report to be signed on its behalf by the undersigned, thereunto duly authorized.
| DSP GROUP, INC. | ||
| By: | /S/ OFER ELYAKIM | |
| Ofer Elyakim Chief Executive Officer (Principal Executive Officer) | ||
Date: March 16, 2010
Power of Attorney
KNOW ALL MEN BY THESE PRESENTS, that each person whose signature appears below constitutes and appoints Ofer Elyakim and Dror Levy or either of them, his true and lawful attorneys-in-fact and agents, with full power of substitution and re-substitution, for him and in his name, place and stead, in any and all capacities to sign any and all amendments to this Annual Report on Form 10-K, and to file the same, with all exhibits thereto and other documents in connection therewith, with the Securities and Exchange Commission, granting unto said attorneys-in-fact and agents, and each of them, full power and authority to do and perform each and every act and thing requisite and necessary to be done in connection therewith, as fully to all intents and purposes as he might or could do in person, hereby ratifying and confirming all that said attorneys-in-fact and agents, or either of them, or their or his substitutes or substitute, may lawfully do or cause to be done by virtue hereof.
Pursuant to the requirements of the Securities Exchange Act of 1934, this report has been signed below by the following persons on behalf of the Registrant and in the capacities and on the dates indicated.
| Signature |
Title |
Date | ||
| /S/ ELIYAHU AYALON Eliyahu Ayalon |
Chairman of the Board |
March 16, 2010 | ||
| /S/ OFER ELYAKIM Ofer Elyakim |
Chief Executive Officer (Principal Executive Officer) |
March 16, 2010 | ||
| /S/ DROR LEVY Dror Levy |
Chief Financial Officer and Secretary (Principal Financial Officer and Principal Accounting Officer) |
March 16, 2010 | ||
| /S/ ZVI LIMON Zvi Limon |
Director |
March 16, 2010 | ||
| /S/ YAIR SHAMIR Yair Shamir |
Director |
March 16, 2010 | ||
| /S/ YAIR SEROUSSI Yair Seroussi |
Director |
March 16, 2010 | ||
| /S/ LOUIS SILVER Louis Silver |
Director |
March 16, 2010 | ||
101
Table of Contents
| Signature |
Title |
Date | ||
| /S/ PATRICK TANGUY Patrick Tanguy |
Director |
March 16, 2010 | ||
| /S/ AVIGDOR WILLENZ Avigdor Willenz |
Director |
March 16, 2010 | ||
102
Table of Contents
Schedule II
DSP GROUP, INC.
VALUATION AND QUALIFYING ACCOUNTS
(in thousands)
| Description |
Balance at Beginning of Period |
Charged to (deducted from) Costs and Expenses |
Balance at End of Period | ||||
| Year ended December 31, 2007: |
|||||||
| Allowance for doubtful accounts |
0 | 100 | 100 | ||||
| Sales returns reserve |
100 | (100 | ) | 0 | |||
| Year ended December 31, 2008: |
|||||||
| Allowance for doubtful accounts |
100 | 84 | 184 | ||||
| Sales returns reserve |
0 | 0 | 0 | ||||
| Year ended December 31, 2009: |
|||||||
| Allowance for doubtful accounts |
184 | (67 | ) | 117 | |||
| Sales returns reserve |
0 | 0 | 0 |