Attached files
Table of Contents
UNITED STATES
SECURITIES AND EXCHANGE COMMISSION
WASHINGTON, D.C. 20549
FORM 10-K
| x | ANNUAL REPORT PURSUANT TO SECTION 13 OR 15(d) OF THE SECURITIES EXCHANGE ACT OF 1934 |
For the fiscal year ended December 31, 2009
OR
| ¨ | TRANSITION REPORT PURSUANT TO SECTION 13 OR 15(d) OF THE SECURITIES EXCHANGE ACT OF 1934 |
Commission File No. 000-30334
Angiotech Pharmaceuticals, Inc.
(Exact Name of Registrant as Specified in its Charter)
| British Columbia, Canada | 98-0226269 | |
| (State or Other Jurisdiction of Incorporation or Organization) | (I.R.S. Employer Identification No.) | |
| 1618 Station Street, Vancouver, BC, Canada | V6A 1B6 | |
| (Address of principal executive offices) | (Zip Code) | |
Registrant’s telephone number, including area code: (604) 221-7676
Securities registered pursuant to Section 12(b) of the Act:
| Title of each class |
Name of each exchange on which registered | |
| Common shares, without par value | The NASDAQ Global Select Market |
Securities registered pursuant to Section 12(g) of the Act:
None
Indicate by check mark if the Registrant is a well-known seasoned issuer, as defined in Rule 405 of the Securities Act. Yes ¨ No x
Indicate by check mark if the Registrant is not required to file reports pursuant to Section 13 or Section 15(d) of the Act. Yes ¨ No x
Indicate by check mark whether the registrant: (1) has filed all reports required to be filed by Section 13 or 15(d) of the Securities Exchange Act of 1934 during the preceding 12 months and (2) has been subject to such filing requirements for the past 90 days. Yes x No ¨
Indicate by check mark whether the registrant has submitted electronically and posted on its corporate Web site, if any, every Interactive Data File required to be submitted and posted pursuant to Rule 405 of Regulation S-T (§232.405 of this chapter) during the preceding 12 months (or for such shorter period that the registrant was required to submit and post such files). Yes ¨ No ¨
Indicate by check mark if disclosure of delinquent filers pursuant to Item 405 of Regulation S-K is not contained herein, and will not be contained, to the best of the registrant’s knowledge, in definitive proxy or information statements incorporated by reference in Part III of this Form 10-K or any amendment to this Form 10-K. ¨
Indicate by check mark whether the registrant is a large accelerated filer, an accelerated filer, a non-accelerated filer, or a smaller reporting company. See definitions of “large accelerated filer,” “accelerated filer” and “smaller reporting company” in Rule 12b-2 of the Exchange Act.
| Large accelerated filer ¨ | Accelerated filer x | |||
| Non-accelerated filer ¨ (Do not check if a smaller reporting company) |
Smaller reporting company ¨ | |||
Indicate by check mark whether the Registrant is a shell company (as defined in Rule 12b-2 of the Exchange Act). Yes ¨ No x
The aggregate market value of the common shares held by non-affiliates as of June 30, 2009 of the registrant (based on the last reported sale price of the common shares of U.S.$1.71, as reported on The NASDAQ Global Select Market) was approximately U.S. $145,566,700.
As of March 16, 2010 the registrant had 85,157,159 outstanding common shares.
DOCUMENTS INCORPORATED BY REFERENCE
Part III of this Annual Report on Form 10-K incorporates by reference information from the definitive Proxy Statement for the registrant’s 2010 annual general meeting of shareholders.
Table of Contents
Angiotech Pharmaceuticals, Inc.
Table of Contents
Annual Report on Form 10-K for the year ended December 31, 2009
| PART I | ||||
| ITEM 1. |
2 | |||
| ITEM 1A. |
17 | |||
| ITEM 1B. |
36 | |||
| ITEM 2. |
36 | |||
| ITEM 3. |
37 | |||
| ITEM 4. |
38 | |||
| PART II | ||||
| ITEM 5. |
39 | |||
| ITEM 6. |
42 | |||
| ITEM 7. |
MANAGEMENT’S DISCUSSION AND ANALYSIS OF FINANCIAL CONDITION AND RESULTS OF OPERATIONS |
45 | ||
| ITEM 7A. |
76 | |||
| ITEM 8. |
76 | |||
| ITEM 9. |
CHANGES IN AND DISAGREEMENTS WITH ACCOUNTANTS ON ACCOUNTING AND FINANCIAL DISCLOSURE |
77 | ||
| ITEM 9A. |
77 | |||
| ITEM 9B. |
77 | |||
| PART III | ||||
| ITEM 10. |
78 | |||
| ITEM 11. |
78 | |||
| ITEM 12. |
SECURITY OWNERSHIP OF CERTAIN BENEFICIAL OWNERS AND MANAGEMENT AND RELATED STOCKHOLDER MATTERS |
78 | ||
| ITEM 13. |
CERTAIN RELATIONSHIPS AND RELATED TRANSACTIONS, AND DIRECTOR INDEPENDENCE |
78 | ||
| ITEM 14. |
78 | |||
| PART IV | ||||
| ITEM 15. |
79 | |||
| 83 | ||||
Table of Contents
In this Annual Report on Form 10-K, references to “the Company”, “Angiotech”, “us” or “we” are to Angiotech Pharmaceuticals, Inc. and all of its subsidiaries as a whole, except where it is clear that these terms only refer to Angiotech Pharmaceuticals, Inc.
Accounting Standards
In this Annual Report on Form 10-K, all dollar amounts are in U.S. dollars, except where otherwise stated and financial reporting is made in accordance with U.S. generally accepted accounting principles (“U.S. GAAP”).
Currency and Exchange Rates
The Company’s consolidated functional and reporting currency is the U.S. dollar. The Canadian dollar is the functional currency for the parent company Angiotech Pharmaceuticals, Inc. (on a non-consolidated basis) and its Canadian subsidiaries, the U.K pound is the functional currency of our U.K subsidiary, Pearsalls Limited, the Danish Kroner is the functional currency of our Danish subsidiary, PBN Medicals Denmark A/S, and the U.S. dollar is the functional currency for all other subsidiaries.
NOTICE REGARDING WEBSITE ACCESS TO COMPANY REPORTS
We file electronically with the Securities and Exchange Commission (“SEC”) our Annual Report on Form 10-K, Quarterly Reports on Form 10-Q and Current Reports on Form 8-K pursuant to Section 13(a) or 15(d) of the Securities Exchange Act of 1934 (“the Exchange Act”). You may obtain a free copy of our Annual Report on Form 10-K, Quarterly Reports on Form 10-Q and Current Reports on Form 8-K, and any amendments to those reports, on the day of filing with the SEC and on our website at: www.angiotech.com. Our website and the information on our website is not part of this Annual Report on Form 10-K.
You may also read and copy any materials we file with the SEC at the SEC’s Public Reference Room at 100 F Street, NE, Washington, DC 20549. You may also obtain information on the operation of the Public Reference Room by calling the SEC at 1-800-SEC-0330. The SEC maintains an Internet site at www.sec.gov that contains reports, proxy and information statements, and other information regarding the issuers such as us that file electronically.
1
Table of Contents
| BUSINESS |
Summary
We are a specialty pharmaceutical and medical device company that discovers, develops and markets innovative technologies primarily focused on acute and surgical applications. We currently operate in two segments: Medical Products and Pharmaceutical Technologies. Our Medical Products segment manufactures and markets a wide range of single-use specialty medical products and medical device components. These products are sold directly by us to end users or other third-party medical products manufacturers. Our Pharmaceutical Technologies segment focuses primarily on establishing product development and marketing collaborations with major medical device, pharmaceutical or biomaterials companies and to date has derived the majority of its revenue from royalties due from partners that develop, market and sell products incorporating our technologies. Currently, our principal revenues in this segment are from royalties derived from sales by Boston Scientific Corporation (“BSC”) of TAXUS® coronary stent systems incorporating the drug paclitaxel. For the year ended December 31, 2009, we recorded $192.0 million in direct sales of our various medical products and $87.7 million in royalties and license fees received from our partners. For additional financial information, for the last three fiscal years, about our two segments and the geographic areas in which we operate, refer to Note 19 of the Consolidated Financial Statements included in this Annual Report on Form 10-K.
Our research and development efforts focus on understanding and characterizing biological conditions that often occur concurrent with medical device implantation, surgery or acute trauma, including scar formation and inflammation, cell proliferation, bleeding and coagulation, infection, and tumor tissue overgrowth. Our strategy is to utilize our various technologies in the areas of drugs, drug delivery, surface modification, biomaterials and medical devices to create and commercialize novel, proprietary medical products that reduce surgical procedure side effects, improve surgical outcomes, shorten hospital stays, or are easier or safer for a physician to use.
We develop our products using a proprietary and systematic discovery approach. We use our drug screening capabilities to identify new uses for known pharmaceutical compounds. We look for compounds that address the underlying biological causes of conditions that can occur with medical device implantation, surgery or acute trauma. Once appropriate drugs have been identified, we work to formulate the drug, or a combination of drugs, with our portfolio of drug, drug delivery and surface modification technologies and biomaterials to develop a novel surgical implant or medical device. We have patent protected, or have filed patent applications for, certain of our technology and many of our products and potential product candidates.
Over the last three years, revenue in our Pharmaceutical Technologies segment has declined significantly, primarily due to lower royalties derived from sales by BSC of TAXUS coronary stent systems. This decline in royalty revenue has negatively and materially impacted our liquidity and results of operations. As a result of this and other factors impacting our business and the capital markets, our management and Board of Directors believe a transaction or transactions of significant size and scope may be necessary to meaningfully address liquidity concerns and the working capital needs of our business. Our evaluation of various financial and strategic alternatives continued through 2009, and is expected to continue in 2010.
Business Strategy
Our strategy is to apply our various technologies to develop and commercialize novel, proprietary medical device, surgical implant and pharmaceutical products that address the most frequent problems or complications observed in connection with medical device use or surgical procedures. Specific tactical elements of our strategy include:
| • |
Identifying and Prioritizing Market Opportunities. We begin our product development process by identifying medical devices or surgical procedures where problems or complications arise soon after device implantation or the initial procedure, and where re-intervention may be expensive, potentially |
2
Table of Contents
| harmful for patients or difficult to perform. We target areas where we have previously developed successful technologies, such as the treatment of scar formation and cell proliferation with paclitaxel and its analogues or derivatives, or where we have particular scientific focus or expertise. For example, numerous human trials have indicated that paclitaxel dramatically improves the clinical performance of stents used to treat patients with coronary artery disease, which has led to improved patient outcomes, premium pricing and growth of the stent market. We believe other medical devices and surgical implants could be similarly affected through the proprietary addition of locally-delivered therapeutics. |
| • |
Developing Novel, Proprietary Product Candidates. After prioritizing opportunities, we identify the biology that may contribute to complications or failures of a device or procedure. We then screen and select a potential drug or drugs to combine with our biomaterial or drug delivery technologies, or engineer a novel medical device product design, to create proprietary, locally-delivered drug formulation, drug-device combination or novel medical device product candidates. We continually assess and study applications of our technology, including analyzing the biology pertaining to the failure of certain medical devices and surgical implants, and determining the therapeutic drug selection, concentration, total dose and drug release characteristics or engineering enhancements required to enhance medical device and surgical implant performance. We believe this approach may allow us to create additional novel medical devices and surgical implants that achieve better clinical results. |
| • |
Establishing and Developing Intellectual Property Portfolio. After identifying potentially useful technologies or developing novel product candidates, we incorporate these elements into new patent filings or our existing patent portfolio, and we attempt to develop and establish new intellectual property in jurisdictions throughout the world. For example, we believe we are among the first companies to develop an extensive intellectual property portfolio of products combining approved pharmaceutical agents, such as paclitaxel, with medical devices and surgical implants. Recognizing the importance of intellectual property in our industry, we plan to continue to pursue patent protection in the United States, the European Union and other significant markets, as well as to protect trade secrets and know-how as our research and development activities uncover additional important medical product and therapeutic opportunities. |
| • |
Selecting Commercialization Path. Once we reach a certain stage with a technology or product candidate, we select a development and commercialization path. Where we have a distribution channel, we may elect to fully develop a product ourselves, or in selected cases where product opportunities may not fit our commercial capabilities, we will license certain of our products, technologies or product candidates to be developed, manufactured or commercialized by partners. |
| • |
Pursuing Selective Strategic Acquisitions and Licenses. To support our product development and commercialization activities, we have pursued, and will continue to selectively pursue, acquisitions or licenses to obtain proprietary pharmaceutical compounds or compound classes, formulation technologies, medical device technologies and intellectual property or other commercial assets. |
Business Overview
Medical Products
Our Medical Products segment manufactures and markets a wide range of single-use specialty medical products and medical device components. These products are sold directly to end users or other third-party medical products manufacturers. This segment contains specialized direct sales and distribution capabilities as well as significant manufacturing capabilities. Many of our medical products are made using our proprietary manufacturing processes or are protected by our intellectual property.
Certain of our product lines, which we refer to as our Proprietary Medical Products, are marketed and sold by our two direct sales groups. We believe these product lines may contain technology advantages that provide the potential for more substantial revenue growth as compared to our overall product portfolio. We also invest
3
Table of Contents
significant capital and resources in sales and marketing and research and development with respect to existing and potential new Proprietary Medical Products.
Certain of our product lines, which we refer to as our Base Medical Products, represent more mature product lines and are supported by a small group of direct sales personnel, as well as a network of independent sales representatives and medical product distributors. These sales tend to exhibit greater volatility or slower growth when compared to sales of our Proprietary Medical Products. This is particularly the case with our sales of components to third-party medical device manufacturers, which may be impacted by customer concentration and the business issues that certain of our large customers may face, as well as to a more limited extent by economic and credit market conditions.
Proprietary Medical Products
Our most significant Proprietary Medical Products include:
| • |
Quill™ SRS. Our Quill SRS product line is a surface modified suture material that contains proprietary patterns of tiny barbs or other patterns, which can eliminate the need for surgeons to tie knots when closing certain wound types. We believe that use of Quill SRS may lead to faster surgical times, improved wound cosmesis and lower wound infection and complication rates. Quill SRS may also provide for stronger wound closure due to its ability to distribute tension across the entire length of a wound over large numbers of barbs or anchors, as opposed to a far fewer number of knots or anchor points with traditional sutures or surgical staples. Due to this ability to distribute tension, we believe Quill SRS may enable certain tissue types to be repaired that are not addressable by other wound closure technologies. |
| • |
SKATER™ Drainage Catheters. Our SKATER drainage catheter product is used to facilitate drainage of fluid from wounds, infectious tissues or surgical sites. Our SKATER catheter features larger lumens and drainage holes, kink resistance, resistance to encrustation and high radiopacity. SKATER is offered in multiple sizes and configurations to address the most typical drainage applications including specific designs for centesis, or small volume drainage procedures, drainage from the biliary duct and nephrostomy procedures. |
| • |
Option™ IVC Filter. Inferior vena cava (“IVC”) filters are implanted in patients that are at high risk for developing pulmonary embolism, which can be a life-threatening condition. IVC filters are implanted in the inferior vena cava and are designed to catch clot material to prevent it from reaching the lungs, while allowing blood to continue to flow normally. IVC filters have been shown in several studies to significantly reduce the risk of pulmonary embolism and related mortality in certain high-risk patient populations. We received approval from the U.S. Food and Drug Administration (“FDA”) to market and sell our Option IVC Filter, which we licensed from our partner Rex Medical, LLC, in June 2009. We commenced commercial sales of our IVC filters in July 2009. We believe our Option IVC Filter may have a number of potential competitive benefits, which include a unique filter design that may reduce the potential for filter migration after implantation, which may make the product safer for patients, insertion potential through either the femoral or jugular route, which may make the product easier for a physician to use, and the use of non-thrombogenic material, which may reduce the risk of blood clots occurring in the filter. We also believe the unique design of the Option IVC Filter may allow physicians to remove or retrieve the device from patients more easily, or after longer periods of time have passed as compared to existing competitive IVC filters. |
| • |
HemoStream™ Dialysis Catheter. Our HemoStream dialysis catheter product, which we market and sell pursuant to a license from our partner Rex Medical, LLC, is used for short-term vascular access for patients with kidney disease that are undergoing hemodialysis. HemoStream has a novel triple outflow lumen that is designed to prevent the common complication of “sidewalling”, which occurs when the catheter is drawn next to the vessel wall during dialysis. This is a common problem with dialysis catheters. |
4
Table of Contents
| • |
BioPince™ Full Core Biopsy Devices. Our BioPince biopsy instrument product line is used to obtain tissue samples from patients for analysis and diagnosis of disease. BioPince features a proprietary tri-axial “Cut and Trap” cannula system, which allows the device to deliver cylindrical, full-length biopsy specimens that are complete and largely undamaged, which we believe significantly improves the diagnostic value of the sample. |
| • |
5-FU-Eluting Medical Device Product Candidates. Our proprietary 5-flourouracil (“5-FU”) technology is designed to be combined with selected implantable medical devices in order to reduce infection that can occur concurrent with the use of such devices. Through our proprietary drug identification strategy, we elected to evaluate 5-FU, a drug previously approved by the FDA for treatment of various types of cancer, as a compound that may help to prevent certain types of infection that can occur with medical device implants, including central venous catheters (“CVC”). CVCs are usually inserted into critically ill patients for extended periods of time to administer fluids, drugs, and nutrition, as well as facilitate frequent blood draws. To evaluate the safety and efficacy of our 5-FU CVC, we conducted a randomized, single-blind, 960-patient, 25-center study to evaluate whether our 5-FU-eluting CVC prevents bacterial colonization at least as well as the market-leading anti-infective CVC. In October 2007, we announced this study had met its primary statistical endpoint of non-inferiority as compared to the market leading anti-infective CVC (a chlorhexidine / silver sulfadiazine (CH-SS) coated CVC) and indicated an excellent safety profile. There were no statistically significant differences in the rate of adverse events related to the study devices, or in the rates of catheter-related bloodstream infections. Additionally, there was no evidence for acquired resistance to 5-FU in clinical isolates exposed to the drug for a second time. Based on the positive results achieved in the study, in December 2007, we filed a request for 510(k) clearance from the FDA to market and sell the CVC in the U.S. and in April 2008, we announced that we had received 510(k) clearance from the FDA to market our 5-FU CVC in the U.S. We are currently developing potential launch plans for this product, as well as evaluating certain product line extensions relating to this clinical program. Should sufficient liquidity and capital resources be available, we anticipate commencing commercialization of this technology during the second half of 2010. |
Base Medical Products
Our Base Medical Products are comprised of four primary product groups, including:
| • |
Biopsy Products. We manufacture, market and sell a wide range of soft tissue biopsy products, both disposable and re-usable for use in different types of breast, lung, spinal and bone marrow biopsies. Some key features of our soft tissue biopsy products include echogenic tips for placement under ultrasound guidance, numerically ordered centimeter markings to facilitate precise depth placement, and adjustable needle stops allowing the restriction of forward movement and localizing the needle to the biopsy site. We also offer a range of bone marrow biopsy products. The most significant of these product lines, the T-Lok™, has an ergonomically designed twist-lock handle, which improves a clinician’s ability to penetrate hard bone to obtain the biopsy sample. An adjustable needle stop to control the depth of penetration allows the clinician to safely aspirate at the sternum of the patient. Other selected products in our biopsy group include fixation pins, breast localization markers, tunneling stylets and surgical tunnelers, and isotope seed spacers and needles for prostate cancer treatment. |
| • |
Ophthalmic Products. We manufacture, market and sell a wide range of surgical blades, marketed under the SharpPoint™ and SharpGuard™ brands, which are used primarily in cataract or other ophthalmic surgery where very small incisions are required. Our products include clear corneal knives, standard implant knives, pilot tip implant knives, precision depth knives, Sharptome™ crescent knives, spoon knives, stab knives, vitrectomy knives to create small, precise incisions, sub-2mm series knives, and a variety of slit and specialty knives. Other selected products in our ophthalmic group include a variety of cannula needles for the administration of anesthetic or for irrigation or aspiration in ophthalmic surgery, a full line of absorbable and non-absorbable microsurgical ophthalmic sutures, our |
5
Table of Contents
| UltraPlug™ punctum plugs for treatment of dry eye symptoms and our Ultrafit™ trephine blades for penetrating keratoplasty surgery and the Tan EndoGlide for the precise transplantation of human corneal endothelial cells. |
| • |
Surgery Products. We manufacture, market and sell a wide range of traditional surgical wound closure products, sold primarily under our Sharpoint and Look™ brand names. These products are used by surgeons in a wide variety of applications in hospitals, surgery centers and physician offices. We also sell a significant amount of our general suture products for use in dental surgery. Our suture configurations vary in diameter, length, and material. Our product lines also include a full line of bio-absorbable and non-absorbable suture materials, including PGA, Monoderm™, polypropylene, poly-ethylene-terephthatate, glycolide and e-caprolactone, polyglycolic acid, plain and chromic gut, nylon and silk. This wide range of materials allows us to offer a range of handling characteristics and bio-absorption times for our product line. Our product lines also include a wide variety of needle types, including drilled-end and channel surgical needles. Drilled-end suture needles have a precisely drilled butt end for maximum suture holding strength and are adequately tempered for securing strong attachment of the suture. Channel needles have a channel with an underlying receptacle for attachment of the suture. |
| • |
Medical Device Component Manufacturing. We manufacture, market and sell a wide range of medical device components for other medical device manufacturers, who then use the provided components as part of assembling their own finished medical device products. The components we manufacture and sell are often similar to selected components used in our own Base Medical Product offerings, or are custom components produced for certain customers by utilizing specific proprietary capabilities or expertise. Our most significant manufacturing capabilities include metal grinding and polishing, plasma welding, chemical etching, electropolishing and electro-chemical marking, plastics injection molding, plastics and polymer extrusion and silk suture formation, weaving of medical grade textiles and packaging and assembly. In addition, our manufacturing facilities each maintain engineering and machining capabilities in order to support production orders and new product opportunities for our key customers. |
Pharmaceutical Technologies
Our Pharmaceutical Technologies segment focuses primarily on establishing product development and marketing partnerships with major medical device, pharmaceutical or biomaterials companies, and to date has derived the majority of its revenue from royalties due from partners that develop, market and sell products incorporating our technologies. Currently our principal revenues in this segment are from royalties derived from sales by BSC of TAXUS coronary stent systems incorporating the drug paclitaxel. We also have a partnership with Cook Medical Inc. (“Cook”) whereby Cook is utilizing our proprietary paclitaxel technology in peripheral vascular stent applications. We expect we may begin to receive royalties derived from sales by Cook of its Zilver-PTX peripheral stent system in 2010.
TAXUS Paclitaxel-Eluting Coronary Stents
The most significant commercial products containing technology developed and licensed by our Pharmaceutical Technologies segment are the TAXUS Express, TAXUS Liberté and TAXUS Element coronary stent systems. These products are sold by BSC, our exclusive licensee in the coronary paclitaxel-eluting stent field. We are entitled to receive royalties based on the commercial sale of all of BSC’s various TAXUS products. BSC has received approval in various countries throughout the world and commenced commercial sales of a broad portfolio of coronary stent products utilizing our proprietary paclitaxel technology, including:
| • |
January 2003. BSC commenced sales of the TAXUS Express paclitaxel-eluting coronary stent system in the European Union and other countries outside of the United States. |
| • |
March 2004. BSC commenced sales of the TAXUS Express paclitaxel-eluting coronary stent system in the United States. |
6
Table of Contents
| • |
January 2005. BSC commenced sales of the TAXUS Liberté paclitaxel-eluting coronary stent system in 18 countries outside of the European Union and the U.S. The TAXUS Liberté stent system represents BSC’s second generation commercial product incorporating our research, technology and intellectual property related to the use of paclitaxel to treat restenosis and other local inflammatory diseases. |
| • |
September 2005. BSC commenced sales of the TAXUS Liberté paclitaxel-eluting coronary stent system in Europe. |
| • |
September 2008. BSC received approval to market and sell the Taxus Express2 Atom™ Paclitaxel-Eluting Coronary Stent System in the United States. The TAXUS Atom stent systems are the only drug-eluting stents available that are specifically designed to treat lesions with diameters as small as 2.25 millimeters. |
| • |
October 2008. BSC commenced sales of the TAXUS Liberté paclitaxel-eluting coronary stent system in the U.S. |
| • |
May 2009. BSC commenced sales of the TAXUS Liberté Atom Paclitaxel-Eluting Coronary Stent System in the U.S. |
| • |
July 2009. BSC commenced sales of the TAXUS Liberté Long Stent in the U.S., which at 38 millimeters is the longest available drug-eluting stent. |
BSC has concluded several clinical trials of paclitaxel-eluting coronary stents that have demonstrated positive results, including six separate clinical studies, with a total of over 31,000 patients studied over a five-year period, designed to evaluate the near and long-term safety and efficacy of the various TAXUS coronary stent systems. These various studies have universally indicated that paclitaxel-eluting coronary stents significantly reduce the incidence of restenosis and the need for repeat surgical procedures at the treated lesion site in coronary artery disease patients. In addition, there have been independent clinical trials of paclitaxel-eluting coronary stents that have demonstrated positive results, including a study published in May 2009 by the Journal of American College of Cardiology (“JACC”) detailing data collected and analyzed from the Swedish Coronary Angiography and Angioplasty Registry, which holds data on all patients undergoing coronary angioplasty in Sweden. The objective of this independent study was to evaluate restenosis rates of drug-eluting stents in patients with and without diabetes in a real-world setting. The JACC article reported that both the TAXUS Liberté stent and BSC’s first-generation the TAXUS Express stent were the only stents in the study showing no increased risk of restenosis for patients with diabetes as compared to those without diabetes. Other competing drug-eluting stents evaluated in the registry showed significant increased risk of restenosis in patients with diabetes. In addition, the study showed that the TAXUS Liberté stent had an approximately 23 percent lower restenosis rate at two years compared to the prior-generation TAXUS Express stent.
Certain clinicians suggested in 2006 that the use of drug-eluting stents may cause an increased rate of late thrombosis (the formation of blood clots in the stent long after the initial stent implantation) and in turn, potentially lead to an increased rate of myocardial infarctions (heart attacks) or deaths as compared to bare metal stents. These suggestions led to a significant decrease in the use of drug-eluting stents, beginning in the second half of 2006 and continuing through 2008. While subsequent analysis of clinical data suggest that these concerns may have been unreasonable and use of drug-eluting stents increased in 2009, usage has yet to recover to the levels observed in 2005 prior to the initial reporting of physician concerns.
In addition, starting in mid 2008 and early 2009, several new competitive drug-eluting stents were made commercially available in the United States, Europe and Japan. The reduction in drug-eluting stent usage, combined with the entry of new competitors, has had significant negative impacts on the levels of royalty revenue we received from BSC in 2007, 2008 and 2009. Royalty revenues derived from sales of stent systems from BSC declined by 24% from 2007 to 2008 and 32% from 2008 to 2009.
7
Table of Contents
Zilver-PTX Paclitaxel-Eluting Peripheral Vascular Stents
In August 2009, we announced that our partner Cook Medical Inc. (“Cook”) had reported CE Mark approval and commercial launch of the Zilver-PTX paclitaxel-eluting peripheral vascular stent in the European Union (“E.U.”). The Zilver-PTX stent, which is under evaluation in clinical trials being conducted by Cook, is a specialized stent product incorporating our proprietary paclitaxel technology and is designed for placement in diseased arteries in the limbs to restore blood flow. We license Cook the rights to use paclitaxel with peripheral stents and certain other non-coronary medical devices. Subject to the terms of our license agreement with Cook, we are entitled to receive royalty payments upon the commercial sale of paclitaxel-eluting peripheral vascular stent products, including the Zilver-PTX stent.
Research and Product Development
We maintain significant research and development capabilities and personnel. Our capabilities include drug screening, drug formulation, analytical chemistry, drug delivery and carrier manipulation and formulation and medical device and mechanical engineering. We also employ personnel with expertise in clinical development, regulatory affairs and quality control that are responsible for conducting product development, clinical trial, regulatory and quality control activities with respect to certain of our existing and new product candidates once initial research activities with respect to a product or product candidate have been completed.
We, or our partners, are evaluating several new product candidates that incorporate our proprietary technologies and capabilities, including certain product candidates undergoing human clinical testing conducted both by us and our partners. We also maintain several pre-clinical or research stage programs and conduct various product and process improvement initiatives related to our currently marketed products and our manufacturing facilities. The following discussion outlines our most advanced product candidates and their stage of development, and summarizes our most recently concluded or terminated clinical development programs.
Partner Clinical Programs
Independent TAXUS Clinical Data. In May 2009, we announced that BSC had disclosed the publication of an article in the JACC reviewing data on more than 19,000 patients from the Swedish national registry who were evaluated for restenosis, or the re-narrowing of arteries, after percutaneous coronary intervention (“PCI”). The Swedish Coronary Angiography and Angioplasty Registry holds data on all patients undergoing PCI in Sweden. The objective of this independent study was to evaluate restenosis rates of drug-eluting stents (“DES”) in patients with and without diabetes in a real-world setting. The article reported that patients who received a TAXUS Liberté paclitaxel-eluting stent had numerically lower incidences of repeat procedures to treat restenosis at two years as compared to patients treated with ‘olimus-based DES, including Johnson & Johnson, Inc.’s Cypher® stent and Medtronic Inc.’s Endeavor® stent.
In the patients with diabetes, the TAXUS Liberté demonstrated a statistically significant lower restenosis rate compared to the Endeavor, which had more than two times the risk of repeat procedures. The JACC article reported that both the TAXUS Liberté stent and BSC’s first-generation paclitaxel-eluting stent, the TAXUS Express, were the only stents in the study showing no increased risk of restenosis for patients with diabetes as compared to those without diabetes. Data for both the Cypher and Endeavor stents indicated significant increased risk of restenosis in patients with diabetes. In addition, the study showed that the TAXUS Liberté had an approximately 23 percent lower restenosis rate at two years compared to the prior-generation TAXUS Express.
The Swedish registry study included four DES brands: TAXUS Liberté, TAXUS Express, Cypher and Endeavor. In total, the registry included 35,478 DES implants during 22,962 procedures in 19,004 patients, with 1,807 restenoses reported over a mean 29-month follow-up period. For the entire study population, the repeat revascularization rate per stent was 3.5 percent after one year and 4.9 percent after two years. Overall, the adjusted risk of restenosis was 1.23 times higher in patients with diabetes than in patients without diabetes. In patients with diabetes, restenosis was higher in the non-TAXUS stents. The sirolimus-eluting Cypher and the zotorolimus-eluting Endeavor had higher restenosis rates in patients with diabetes compared with those in patients without diabetes (1.25 times and 1.77 times, respectively).
8
Table of Contents
TAXUS Element™ Paclitaxel-Eluting Coronary Stent System. The platinum chromium TAXUS Element pacitaxel-eluting coronary stent system is currently being evaluated by BSC in its PERSEUS clinical trial, which commenced in July 2007 and is designed for submission to the FDA in an application for approval to market and sell the TAXUS Element stent system in the U.S. The platinum chromium TAXUS Element paclitaxel-eluting coronary stent system is the third-generation BSC coronary stent platform that incorporates our research, technology and intellectual property related to the use of paclitaxel. The TAXUS Element stent features BSC’s proprietary platinum chromium alloy, which is designed to enable thinner stent struts, increased flexibility and a lower stent profile while improving radial strength, recoil and radiopacity. In addition, the TAXUS Element stent platform incorporates new balloon technology intended to improve upon BSC’s market-leading Maverick® balloon catheter technology.
On October 8, 2008, we announced that BSC had completed enrollment in the PERSEUS clinical trial and on March 15, 2010, we announced BSC’s results for this clinical trial. The PERSEUS clinical program compared the TAXUS Element stent to prior-generation stents in more than 1,600 patients in two parallel trials at 90 centers worldwide. This clinical program evaluated the safety and efficacy of the TAXUS Element stent in two studies. The first study evaluated the safety and efficacy of the TAXUS Element stent compared to the TAXUS Express2 stent in 1,264 patients with “workhorse” lesions from 2.75 to 4.0 mm. This prospective, randomized (3:1) trial met its primary endpoint of non-inferiority for target lesion failure (“TLF”) at 12 months with rates of 5.6 percent for the TAXUS Element Stent and 6.1 percent for the TAXUS Express2 stent. The secondary endpoint of in-segment percent diameter stenosis at nine months, as measured by quantitative coronary angiography, was also met. The second study compared the TAXUS Element stent to a historic control (TAXUS V de novo bare-metal Express coronary stent system) in 224 patients with lesions from 2.25 to 2.75 mm. The trial met its primary endpoint of superiority for in-stent late loss at nine months with unadjusted values of 0.38 mm for the TAXUS Element stent and 0.80 mm for the Express stent, which was statistically significant. The trial also met its secondary endpoint of superiority for TLF at 12 months, showing a reduction, which was statistically significant, with an unadjusted rate of 7.3 percent for the TAXUS Element stent compared to a pre-specified performance goal of 19.5 percent based on historical outcomes for the Express control stent.
In May 2009 we announced that our partner BSC had launched TAXUS Element in select markets worldwide. BSC is expected to launch the TAXUS Element in the E.U. in 2010 and in the U.S. in 2011.
TAXUS PETAL™ Bifurcation Paclitaxel-Eluting Coronary Stent System. The TAXUS PETAL bifurcation paclitaxel-eluting coronary stent system, which is under evaluation in clinical trials being conducted by BSC, represents a novel BSC coronary stent product candidate that incorporates our research, technology and intellectual property related to the use of paclitaxel. Conventional coronary stents were designed to treat tubular arteries, and are considered less than optimal for the y-shaped anatomy of a bifurcated area of the coronary arteries. The TAXUS PETAL is a specialized coronary stent designed to treat both the main branch and the side branch of a bifurcation by incorporating an innovative side structure (the PETAL strut) in the middle of the stent that opens into a side branch.
In July 2007, BSC initiated the TAXUS PETAL I First Human Use trial, which is expected to enroll a total of 45 patients in New Zealand, France and Germany. The trial is a non-randomized study with an initial assessment of acute performance and safety (including rates of death, myocardial infarction and target vessel revascularization) at 30 days and six months, with continued annual follow-up to occur for five years. Upon successful completion of this study, BSC has indicated that it intends to begin a pivotal trial which if successful would provide a basis for U.S. and international approvals for the commercialization of the TAXUS PETAL stent.
Zilver-PTX Paclitaxel-Eluting Peripheral Vascular Stent System. In August 2009, we announced that our partner Cook had reported CE Mark approval and commercial launch of the Zilver- PTX stent in the E.U.
It is estimated that approximately 27 million people suffer from peripheral artery disease, or PAD, in Europe and North America. Of patients with PAD, only approximately one quarter of them indicate any substantive
9
Table of Contents
symptoms. The “silent” nature of this condition can result in a number of patients being diagnosed only when their condition has progressed to the severe stage. In patients with severe PAD whose condition is not improving with risk-factor modification, exercise programs or pharmacological therapy, invasive surgical procedures may be necessary. These procedures may include angioplasty, stenting or surgery. To date, stent procedures for PAD in the limbs have been limited due to high observed rates of restenosis or other failure of the procedure requiring a subsequent surgical procedure, as well as risk of stent fracture with existing products, as these stents are exposed and not protected by the patient’s anatomy as with coronary stents.
Cook is a co-exclusive licensee, together with BSC, of our proprietary paclitaxel technology to reduce restenosis following stent placement in PAD. The Zilver-PTX stent is designed to reduce restenosis following placement of a stent in PAD patients. The Zilver-PTX stent is currently undergoing multiple human clinical trials in the U.S., Japan, the E.U. and selected other countries to assess product safety and efficacy.
In January 2007, Cook released nine-month data from its E.U. clinical study. The preliminary data presented by Cook on the first 60 patients in the randomized trial, which is examining the safety of using Cook’s Zilver-PTX stent to treat blockages, or lesions, of the superficial femoral artery (“SFA”) above the knee, indicated that the Zilver-PTX stent showed an equal adverse event rate to conventional angioplasty for treating SFA lesions. The Zilver-PTX stent also displayed a zero-percent fracture rate for 41 lesions at six months and 18 lesions at one year.
In July 2007, Cook announced that the first U.S. patients in a randomized pivotal human clinical trial of the Zilver-PTX stent were treated at Tri-City Medical Center in Oceanside, CA. The trial is designed to randomize patients to receive either the Zilver-PTX stent or balloon angioplasty. Data from this clinical trial is intended to be used to support submission to the FDA for approval in the U.S. to market the device. In addition, data collected on Japanese and U.S. patients is expected to be combined for the final evaluation of the device and used for regulatory submissions in both markets for approval.
In June 2008, Cook reported positive interim results from the registry arm of a clinical study designed to measure the efficacy of the Zilver-PTX stent in treating PAD patients, specifically in the treatment of blockages in the femoropopliteal artery. The data published in the Zilver-PTX registry involved 791 patients from Europe, Russia, Canada and Korea and demonstrated highly positive results. Only 8 percent of all patients with de novo (new) lesions required a reintervention to reopen the artery in the first 12 months — a rate significantly surpassing existing treatments for PAD in the SFA, such as balloon angioplasty and bare metal (non-drug-eluting) stents. In addition, specific patient groups that are often very hard to treat, such as diabetics and patients with in-stent restenosis (those treated previously with a noncoated stent), were shown in the trial to benefit from the Zilver-PTX. As indicated by the trial data, the superior results achieved in the first year have been largely maintained throughout 24 months, which is an important clinical milestone. In comparison with other trial data obtained, the Zilver-PTX stent demonstrated a reduction in reintervention of between 50 percent and 75 percent, which is an important patient benefit. The results were reported by trial investigators at the 2008 SVS Vascular Annual Meeting, and revealed clinical improvement, excellent durability and fracture resistance, high rates of event-free survival (“EFS”) and freedom from target lesion revascularization (“TLR”). Interim data was compiled at six and 12 months using 435 patients and 200 patients, respectively. The corresponding EFS rates were 94% and 84%, and freedom from TLR was 96% and 88%. Evaluation of stent x-rays is ongoing, and currently suggests stent fractures in approximately one percent of cases at six months and less than two percent of cases at 12 months. In addition, the Zilver-PTX stent exhibited no safety concerns and results were better than expected for Trans-Atlantic Inter-Society Consensus class C and D lesions, occlusions, in-stent restenosis and lesions greater than seven centimeters. Follow-up to the registry arm of the study will continue through the next two years.
In September 2008, Cook announced it had completed enrollment in its pivotal human clinical trial for the Zilver-PTX. The 420 patients enrolled in Cook’s randomized trial include PAD patients treated in Germany, the U.S. and Japan. On the same date, Cook announced that it had enrolled an additional 780 patients in the E.U., Canada and Korea in a clinical registry to evaluate the safety of the Zilver-PTX stent. Those data were used to obtain CE Mark approval in the E.U.and launch the device there, with additional regulatory submissions pending in additional markets.
10
Table of Contents
In April 2009, we announced that Cook had reported data that showed that 82 percent of patients who were treated with Cook’s Zilver-PTX stent were free from reintervention at two-year follow up. The Zilver-PTX Registry study, involving 792 patients globally, is assessing the safety and efficacy of the Zilver-PTX in treating peripheral artery disease. The most recent results were reported at the 31st International Symposium Charing Cross Controversies Challenges Consensus. Data was compiled at 12 and 24 months for 593 patients and 177 patients respectively. The registry, which enrolled a broad spectrum of patients, includes patients with complex lesions (e.g., long lesions, total occlusions, in-stent restenosis). The corresponding event-free survival rates were 87 percent and 78 percent, respectively, and freedom from target lesion revascularization was 89 percent and 82 percent, respectively. Clinical measures that included ankle-brachial index, Rutherford score, and walking distance and speed scores showed significant improvement at six and 12 months and were maintained through 24 months. Detailed evaluation of stent x-rays demonstrated excellent stent integrity through 12 months, confirming previously published results showing 99 percent completely intact stents (less than 1 percent stent fracture rates observed) with a mean follow up of 2.4 years in the challenging superior femoral artery and popliteal arteries, including behind the knee locations.
Angiotech Clinical Programs
MultiStem® Stem Cell Therapy. The MultiStem stem cell therapy is under evaluation in clinical trials being conducted together with our partner Athersys, Inc. (“Athersys”) for the treatment of acute myocardial infarction. MultiStem stem cells are proprietary adult stem cells derived from bone marrow that have demonstrated the ability in laboratory experiments to form a wide range of cell types. MultiStem may work through several mechanisms, but a primary mechanism appears to be the production of multiple therapeutic molecules produced in response to inflammation and tissue damage. We and Athersys believe that MultiStem may represent a unique “off the shelf” stem cell product candidate, based on its potential ability to be used without tissue matching or immunosupression, and its potential capacity for large scale production. We entered into an agreement with Athersys in May 2006 to co-develop and commercialize MultiStem for use in the indications of acute myocardial infarction and peripheral vascular disease. On December 20, 2007, we and Athersys announced we had received authorization from the FDA to commence a phase I human clinical trial to evaluate the safety of MultiStem in the treatment of acute myocardial infarction.
In February 2010, Athersys announced that enrollment for the phase I clinical trial had been completed. Initial results of the clinical trial are expected to be announced by the second half of 2010. The phase I clinical trial is an open label, multi-center dose escalation trial evaluating the safety and maximum tolerated dose of a single administration of allogeneic MultiStem cells following an acute myocardial infarction. Following standard treatment, enrolled patients receive MultiStem delivered via a catheter that enables rapid and efficient delivery of MultiStem into the region of damage in the heart. The study is being conducted at multiple cardiovascular treatment centers in the United States, including the Cleveland Clinic, Columbia University Medical Center and Henry Ford Health System, and includes patients in three treatment cohorts or dose groups, as well as a non-treated registry group. In preclinical studies conducted by Athersys and independent cardiovascular research teams, administration of MultiStem following an ischemic injury to the heart has been associated with a number of benefits, including an increase in ejection fraction, or volume of blood pumped from the heart, a reduction of inflammation in the region of ischemic injury and increased angiogenesis, each believed to help augment recovery and healing.
Upon completion of the phase I human clinical trial which is currently being conducted by Athersys, we may, at our option, assume lead responsibility for further clinical development. We currently own marketing and commercialization rights with respect to this product candidate.
Completed or Suspended Clinical Programs
Bio-Seal™ Lung Biopsy Tract Plug System. Bio-Seal is a novel technology designed to prevent air leaks in patients having lung biopsies by plugging the biopsy track with an expanding hydrogel plug. On contact with moist tissue, the hydrogel plug absorbs fluids and expands to fill the void created by the biopsy needle puncture. The plug is
11
Table of Contents
absorbed into the body after healing of the puncture site has occurred. We are the worldwide manufacturer and distributor of Bio-Seal, which has received CE Mark approval and is currently marketed and sold in the E.U.
Bio-Seal has undergone a human clinical trial in the U.S. which was designed to assess the safety and efficacy of Bio-Seal, with the primary endpoint being reduction in rates of pneumothorax in patients undergoing lung biopsy procedures. The study was designed to provide a basis for FDA clearance for the commercialization of Bio-Seal. The prospective, randomized, controlled clinical trial enrolled and randomized 339 patients at 15 different investigational sites. Inspiratory upright chest x-rays were performed at 30 to 60 minutes, 24 hours and 30 days after treatment. The trial enrolled its first patient in October 2005 and completed enrollment in June 2008. In March 2009, we announced positive results from this clinical trial at the Society of Interventional Radiologists Annual Scientific Meeting in San Diego, CA. The trial demonstrated a statistically significant clinical benefit in the group receiving Bio-Seal. The Bio-Seal treatment arm hit the primary end point of clinical success for rate of absence of pneumothorax at each time period as compared to traditional treatment. Based on the per-protocol population, the clinical success rate was 85% using Bio-Seal and 69% in the control group. This difference was statistically significant (p=0.002). Although not powered for statistical analysis, positive trends were also observed for Bio-Seal subjects as compared to the control group in various secondary endpoints, including fewer Bio-Seal subjects admitted to the hospital for pneumothoraces (9.4% vs. 13.6%), fewer chest tube placements in Bio-Seal patients (3.5% vs. 10.7%), and fewer additional chest x-rays required in Bio-Seal patients (0.6% vs. 5.3%).
Data from this clinical trial was submitted to the FDA, with the objective of receiving 510(k) clearance to market Bio-Seal in the U.S. Subsequent to this submission, the FDA asked us various questions about the study and our submission and we responded to all of the questions from the FDA. In October 2009, we announced that we had received correspondence from the FDA regarding our 510(k) submission for Bio-Seal, stating the FDA’s view that Bio-Seal is a class III device that requires PMA for FDA marketing clearance. As a result, we are reviewing our options with respect to this product candidate, including possibly appealing this FDA decision, and we are discussing the possible preparation of a PMA submission with our partner, Biopsy Sciences, LLC. We have not incurred material expense to date with respect to activities regarding this product candidate. Should we elect to continue to pursue development or regulatory approvals for this product candidate that require us to incur material expense, we will provide further updates in our public disclosure.
5-FU-Eluting Central Venous Catheter. Central venous catheters (“CVC”) are usually inserted into critically ill patients for extended periods of time to administer fluids, drugs, and nutrition, as well as facilitate frequent blood draws. Through our proprietary drug identification strategy, we have elected to evaluate 5-Fluorouracil (“5-FU”), a drug previously approved by the FDA for treatment of various types of cancer, as a compound that may help to prevent certain types of infection in patients receiving a CVC. We recently completed a human clinical trial in the U.S. designed to assess the safety and efficacy of our 5-FU-eluting CVC in preventing various types of catheter related infections. The study was a randomized, single-blind, 960-patient, 25-center study and was designed to evaluate whether our 5-FU-eluting CVC prevents bacterial colonization at least as well as the market-leading anti-infective CVC. On July 10, 2007, we announced that we had completed enrollment of the study, and on October 9, 2007, we announced this study had met its primary statistical endpoint of non-inferiority as compared to the market leading anti-infective CVC (a chlorhexidine / silver sulfadiazine (CH-SS) coated CVC) and indicated an excellent safety profile. In March 2008, we presented the clinical trial data at the 28th International Symposium on Intensive Care and Emergency Medicine in Brussels, Belgium. Based on the clinical trial data, the investigators concluded that our 5-FU CVC met the primary endpoint of the study; specifically that our 5-FU CVC product candidate was non-inferior in its ability to prevent bacterial colonization of the catheter tip when compared to catheters coated with CH-SS. There were no statistically significant differences in the rate of adverse events related to the study devices, or in the rates of catheter-related bloodstream infections. Additionally, there was no evidence for acquired resistance to 5-FU in clinical isolates exposed to the drug for a second time. Based on the positive results achieved in the study, in December 2007, we filed a request for 510(k) clearance from the FDA to market and sell the CVC in the U.S. and on April 17, 2008, we announced that we had received 510(k) clearance from the FDA to market our 5-FU CVC in the U.S. We are currently developing
12
Table of Contents
potential launch plans for this product, as well as evaluating certain product line extensions relating to this clinical program. Should sufficient liquidity and capital resources be available, we anticipate commencing commercialization of this technology during the second half of 2010.
Vascular Wrap™. Our paclitaxel-eluting mesh surgical implant, or Vascular Wrap, is designed to treat complications, including graft stenosis or restenosis that may occur in connection with vascular graft implants in hemodialysis patients or in patients that have peripheral artery disease. Vascular grafts are implanted in patients in order to bypass diseased blood vessels, or to provide access to the vascular system of kidney failure patients in order to facilitate the process of hemodialysis. In many cases, these vascular grafts fail due to proliferation of cells or scar tissue into the graft (graft stenosis or restenosis), which can negatively impact blood flow through the vascular graft.
In April 2008, we elected to suspend enrollment in our U.S. and E.U. human clinical trials for our Vascular Wrap product candidate in patients undergoing surgery for hemodialysis access, pending a safety review to evaluate an imbalance of infections observed between the two study groups. As a result of these observations, we elected to notify physicians to suspend further enrollment in the trials, pending a full review of the potential cause of the implant site infections. There are currently no plans to resume enrollment in these clinical trials; however, we are continuing to monitor, evaluate and collect data with respect to the patients that were enrolled in the clinical trial. We are continuing to evaluate alternatives for this program, including potential collaborations, partnerships, divestitures or future clinical development initiatives.
Patents, Proprietary Rights and Licenses
Patents and other proprietary rights are essential to our business. We file patent applications to protect technology, inventions and improvements to inventions that are considered important to our business. We also rely upon trade secrets, continuing technological innovations and licensing opportunities to develop and maintain our competitive position. Furthermore, we endeavor to extend our intellectual property portfolio by exclusively licensing patents and patent applications from others and initiating research collaborations with outside sources.
Our patents and patent applications relate to, among other things:
| • |
the use of paclitaxel and other agents for the treatment of diseases, such as restenosis; |
| • |
compositions of and use of pharmacologic agents as medical device coatings and drug-eluting biomaterials; |
| • |
hybrid polymer systems designed for localized delivery of bioactive agents and controlled elution of drugs from medical device surfaces; |
| • |
non-reactive hydrophilic/hydrophobic polymer matrix, which can be varied to optimize performance characteristics such as lubricity, flexibility and hydration; |
| • |
hemostatic and sealant compositions, as well as broad intellectual property rights relating to collagen; |
| • |
drug delivery compositions, such as our proprietary systemic formulation, medical device coatings and other local drug delivery systems; |
| • |
self-anchoring devices, including those for wound closure; and |
| • |
methods of making and using the above. |
As part of our patent strategy, we have filed a variety of patent applications internationally. Oppositions have been filed against various granted patents that we either own or license and which are related to certain of our technologies. See “— Legal Proceedings” elsewhere in this Annual Report on Form 10-K for a discussion of the proceedings related to certain of such oppositions. An adverse decision by an Opposition Division in any country, or subsequently, by a Board of Appeal, could result in revocation of our patent or a narrowing of the scope of protection afforded by the patent. The ultimate outcomes of the pending oppositions, including appeals, are uncertain at this time. We do not know whether the patents that we have received or licensed, or those we may be able to obtain or license in the future, would be held valid or enforceable by a court or whether our
13
Table of Contents
patents would be found to infringe a competitor’s patents related to its technology or product. Further, we have no assurance that third parties will not (whether pursuant to or in breach of the terms) modify or terminate any license they have granted to us.
Regulatory
The research and development, manufacture, labeling, advertising, sale and marketing of our drug and medical device products and those of our collaborators are subject to extensive regulation by the FDA and comparable regulatory agencies in state and local jurisdictions and in foreign countries. Because in some cases we may focus on combining pharmaceutical compounds with medical devices and biomaterials, we may be subject to both drug and device regulations depending upon the categorization of the commercial product or potential product candidate.
Drug and device licensing laws require registration of manufacturing facilities, carefully controlled research and testing of products, government review and approval or clearance of results prior to marketing of products, adherence to current Good Manufacturing Practices (“cGMPs”), during production and processing of products, and compliance with comprehensive post-marketing requirements including restrictions on advertising and promotion and requirements for reporting adverse events to the FDA in the United States and other regulatory authorities abroad. In the United States, these activities are subject to rigorous regulation by the FDA. Similar regulations apply in the European Union and other markets.
Our success is ultimately dependent upon our and our collaborators obtaining marketing approval or clearance for potential product candidates currently under development and will depend on our and our collaborators’ ability to comply with FDA and other market regulations governing the manufacturing, quality control, pre-clinical evaluation, and clinical testing of those candidates. If we or our present or future collaborators are not able to comply with the continuing FDA regulations that accompany FDA approval, the FDA may halt our clinical trials, require us to recall a drug from distribution, or withdraw approval of the new drug application for the relevant drug or the 510(k) or Premarket Approval for the relevant device. Depending on the circumstances surrounding the clinical evaluation of a product, we may sponsor clinical trials, contract clinical trial activities to contract research organizations (“CROs”) or rely upon our corporate collaborators to sponsor such clinical development. There can be no assurance that any of our and our collaborators’ clinical trials or product development activities will provide favorable data or that the data will be acceptable to any government regulatory agency to provide us with approval to market and sell our products or product candidates. Moreover, even if we and our collaborators believe the results of our product development activities are favorable, regulatory authorities may interpret the results differently than we do.
We have significant medical device component engineering and manufacturing, as well as finished goods and packaging manufacturing operations. The manufacturing processes used in the production of finished medical devices are subject to FDA regulatory inspection, and must comply with FDA regulations, including its Quality Systems Regulation, (“QSR”), which sets forth the cGMP requirements for medical devices. The QSR requires manufacturers of finished medical devices to follow elaborate design, testing, control, documentation and other quality assurance procedures during the finished device manufacturing process. Our FDA registered facilities are subject to FDA inspection at any time for compliance with the QSR and other FDA regulatory requirements. Failure to comply with these regulatory requirements and similar foreign requirements may result in civil and criminal enforcement actions, including financial penalties, seizures, injunctions or other measures. In some cases, failure to comply with the QSR could prevent us or our customers from marketing products or gaining clearance to market additional products. Our products must also comply with state and foreign regulatory requirements.
Manufacturing and Distribution
We have significant manufacturing capabilities, with six significant medical device manufacturing facilities located in the United States, Europe and Puerto Rico. Our medical device manufacturing capabilities include polymer handling and extrusion, metals, plastics, textiles and packaging and assembly. Our suture manufacturing capabilities include the ability to make and handle various approved polymer materials in multiple lengths,
14
Table of Contents
diameters and configurations. Our metal manufacturing capabilities include bending, grinding, drilling, polishing, chemical etching, thermal curing and wire winding. Our plastics manufacturing capabilities include injection molding, insert molding and wire coating. Our textile manufacturing capabilities include braiding and embroidery of selected suture materials, including silk. Our assembly and packaging capabilities include small lot assembly, suture attachment and kit assembly. We also maintain manufacturing capabilities for certain of our biomaterials and coating technologies, including dedicated resources and technology to process and manufacture certain types of drug-eluting medical devices.
We devote resources to develop procedures and process controls for our products and product candidates to ensure successful technology transfer for commercial scale manufacturing. We expect that process and assay development performed during pre-clinical and clinical stages of manufacturing will result in products with the desired use and stability. These activities include scaling up production methods, developing quality control systems, optimizing batch-to-batch reproducibility, testing sterilization methods and establishing reliable sources of raw materials for synthesizing proprietary products.
Sales and Marketing
We market and sell various Proprietary Medical Products through two specialty direct sales organizations, and our various Base Medical Products through a small group of direct sales representatives as well as a larger group of independent sales representatives and independent medical products distributors. Our direct sales teams comprised approximately 100 individuals as of December 2009. The majority of our direct sales teams are based in the United States.
Our direct sales groups target hospital-based physician customers, as well as alternate site health care providers such as ambulatory surgery centers and urgent care centers. The primary goal of our direct sales teams is to increase market share of our Proprietary Medical Products that have the highest margins or the most substantial technological advantages.
Our smaller direct sales group, our independent sales representatives and independent distributors that focus on our Base Medical Products target hospital customers, alternate site health care providers such as ambulatory surgery centers and urgent care centers, physician offices and dental offices. The primary goal of this direct sales group, our independent sales representatives and independent distributors that support our Base Medical Products is to maintain our market share and revenue levels for these products.
Competition
We expect to face competition from companies utilizing and developing technologies that target the same diseases and clinical indications that our technologies target. Some of the companies developing these technologies have substantially greater product development capabilities and financial, scientific, manufacturing, sales and marketing resources and experience than we do.
The medical device, biotechnology and pharmaceutical industries are subject to rapid and substantial technological change. There can be no assurance that developments by others will not render obsolete our products or technologies or that we will be able to keep pace with technological developments. Some competitive products have an entirely different approach or means to accomplish the desired therapeutic effect than our product candidates. These competitive products, including any enhancements or modifications made to such products in the future, could be more effective and/or less costly than our products, technologies or our product candidates.
There are a number of companies that are marketing or developing competing drug-eluting coronary stents or other treatments for restenosis that may be considered to be directly competitive with our technology. Certain of our competitors have developed and commercialized coronary drug- eluting stents that compete with BSC’s TAXUS stents and which have been approved for use in the United States, European Union and certain other countries. The launch of these competing products has had a significant impact on BSC’s sales of TAXUS, and has resulted in a decline in our royalty revenue received from BSC. The continued successful commercialization
15
Table of Contents
of any of these or other technologies to treat restenosis following angioplasty or stent placement could have a material adverse impact on our business.
We compete with a number of additional large companies across various of our product lines. These competitors have substantially greater business and financial resources than we do. These competitors include the Ethicon division of Johnson & Johnson and Covidien, Inc. in surgical sutures and wound closure devices; C.R. Bard Inc., the Allegiance division of Cardinal Health, Inc. and the Sherwood, Davis & Geck division of Covidien, Inc. in biopsy needle devices; and Alcon, Inc., Allergan, Inc. and the Allegiance division of Cardinal Health, Inc. in ophthalmology products.
Employees
As of December 31, 2009, on a worldwide basis, we had approximately 1,350 employees, including 900 in manufacturing, 100 in R&D, 150 in sales and marketing and 200 in administration. In addition, we have contractual arrangements with scientists at various research and academic institutions. All personnel or their management companies execute confidentiality agreements with us. While we will continue to seek to hire highly qualified employees, we believe that we have employed a sufficient number of qualified personnel.
Reimbursement
In the United States, health care providers generally rely on third-party payers, including both private health insurance plans and governmental payers, such as Medicare and Medicaid, to cover and reimburse all or part of the cost of a medical device and the procedures in medical devices that are used. Our ability to commercialize human therapeutic products and product candidates successfully will depend in part on the extent to which coverage and reimbursement for such products and related treatments will be available from government health administration authorities, private health insurers and other third-party payers or supported by the market for these products. Third-party payers are increasingly challenging the price of medical products and services and instituting cost containment measures to control or significantly influence the purchase of medical products and services. These cost containment measures, if instituted in a manner affecting the coverage for or payment of our products, could have a material adverse effect on our ability to operate profitably.
There can be no assurance that third-party payers’ coverage and reimbursement will be available or sufficient for our current products or the products we might develop. We believe that recommendations and endorsements by physicians are essential for market acceptance of our products, and we do not know whether these recommendations or endorsements will be obtained. We also believe that surgeons will not use these products unless they determine, based on clinical data and other factors, that the clinical benefits to patients and cost savings achieved through use of these products outweigh their cost. Acceptance among physicians may also depend upon the ability to train surgeons and other potential users of our products and the willingness of such users to learn new techniques.
In the United States, there have been and we expect there will continue to be a number of legislative and regulatory proposals to change the healthcare system in ways that could significantly affect our business. Efforts by governmental and third-party payers to reduce healthcare costs or the announcement of legislative proposals or reforms to implement government controls could cause a reduction in sales or in the selling price of our products, which could seriously harm our business. We cannot predict the impact on our business of any legislation or regulations related to the healthcare system that may be enacted or adopted in the future.
Environmental
Our business is subject to a broad range of government regulation and requirements, including federal, state, local and foreign environmental laws and regulations governing, among other matters, air emissions, wastewater discharges, workplace health and safety as well as the use, handling, storage and disposal of hazardous materials and remediation of contamination associated with the release of these materials at or from our facilities or off-site disposal locations. Some of these laws can impose liability for remediation costs on a party regardless of fault or the lawfulness of its conduct. Many of our manufacturing processes involve the use and subsequent regulated disposal of hazardous materials. To date, such matters have not had a material adverse impact on our business or financial condition. We cannot assure you, however, that such matters will not have such an effect in the future.
16
Table of Contents
| RISK FACTORS |
You should consider carefully the following information about these risks, together with all of the other information contained within this document. Additional risks and uncertainties not currently known to us or that we currently deem immaterial may impair our business operations. If any of the following risks actually occur, our business, results of operations and financial condition could be harmed.
Risks Related to Our Business
We have historically been unprofitable and may not be able to achieve and maintain profitability.
We began operations in 1992 and have incurred a loss from operations in a majority of the years in which we have been operating. Our ability to become profitable and maintain profitability will depend on, among other things, the amounts of royalty revenue we receive from our corporate partners; our ability to restructure our existing indebtedness and improve our capital structure; our ability to maintain and improve sales of our existing product lines; our ability to successfully market and sell certain new products and technologies; our ability to research, develop and successfully launch new products and technologies; our ability to improve our profit margins through lower manufacturing costs and efficiencies or improved product sales mix; and our ability to effectively control our various operating costs.
Our working capital and funding needs may vary significantly depending upon a number of factors including, but not limited to, the level of royalty revenue we receive from corporate partners; our levels of sales and gross profit; costs associated with our manufacturing operations, including capital expenditures, labor and raw materials costs, and our ability to realize manufacturing efficiencies from our various operations; fluctuations in certain working capital items, including inventory and accounts receivable, that may be necessary to support the growth of our business or new product introductions; progress of our research and development programs and costs associated with completing clinical studies and the regulatory process; collaborative and license arrangements with third parties; the cost of filing, prosecuting and enforcing our patent claims and other intellectual property rights; expenses associated with litigation; opportunities to in-license complementary technologies or potential acquisitions; potential milestone or other payments we may make to licensors or corporate partners; and technological and market developments that impact our royalty revenue, sales levels or competitive position in the marketplace.
The significant decline in TAXUS royalty payments we received from BSC, the large amount of our outstanding indebtedness and the related cash interest payments due on such indebtedness, the current economic conditions affecting our and our partners’ or customers’ financial stability, as well as the capital and other expenditures required to develop the medical products segment of our business, among other factors, have adversely affected our operations and liquidity. Under the terms of our credit facility, financing under the credit facility may not be available when we need it, and financing in addition to our credit facility, may not be available, if at all, on attractive or acceptable terms due to credit market conditions and other factors. While we have been pursuing options to improve our capital structure and address our potential working capital needs, our efforts have not been successful to date. Due to numerous factors that may impact our future cash position, working capital and liquidity, as discussed below, and the significant cash that will be necessary to continue to service our current level of debt obligations, there can be no assurances that we will have adequate liquidity and capital resources to satisfy our financial obligations beyond 2010. If our cash flows are worse than expected, we may require additional funds in order to meet the funding requirements of our commercial operations for our research and development programs, to satisfy certain contractual obligations, for other operating and capital requirements, to satisfy milestone or other payment obligations due to licensors or corporate partners, to repay or refinance our indebtedness or for potential acquisitions or in-licensing of technologies.
17
Table of Contents
Our obligation to pay cash interest on our notes has had, and we expect will continue to have, an adverse effect on our liquidity.
We currently have two series of notes outstanding: Senior Floating Rate Notes due 2013 (the “Floating Rate Notes”) and 7.75% Senior Subordinated Notes due 2014 (the “Subordinated Notes”). We are obligated to make periodic cash interest payments on both the Floating Rate Notes and the Subordinated Notes.
As a result of these required cash interest payments, combined with the significant decline in royalty payments we received from BSC, we have had significant liquidity issues. If our cash flows are worse than expected, we may be unable to access additional sources of liquidity to fund our cash needs or to refinance our outstanding notes, which could further adversely affect our financial condition or results of operations and our ability to make payments on our debt, and could force us to seek the protection of the bankruptcy laws.
We have recently effected reductions in our operating costs and as a result, our ability to cut costs further may be limited.
Beginning in late 2008 and continuing into 2009, we implemented various initiatives to reduce operating costs across all functions of the company and focus our business efforts on our most promising near term product opportunities. As a result of these cost-cutting initiatives, we may have a more limited ability to further reduce costs to increase our liquidity should such a measure become necessary. Any further reductions may have a materially negative impact on our business.
We depend on BSC for a significant amount of our revenues and cash flows, and for the management and development of TAXUS product franchise.
We are dependent on BSC for a significant amount of our revenue and cash flows and anticipate that we may remain dependent on BSC for the next several years. We do not have control over the sales and marketing efforts, stent pricing, production volumes, distribution or regulatory environment related to BSC’s paclitaxel-eluting coronary stent program. Our involvement is limited to the terms of our 1997 License Agreement (as amended) with BSC and Cook, which provides for the receipt of royalty revenue based on the net sales of TAXUS.
Royalty revenue from BSC has declined, as described in “Management’s Discussion and Analysis of Financial Condition and Results of Operations” in this Annual Report on Form 10-K, which BSC has attributed to a decline in the number of angioplasty procedures in the United States, as well as competition in the drug-eluting stent market, and may decline further in the future. If BSC is impaired in its ability to market and distribute TAXUS, whether for these reasons or due to a failure to comply with applicable regulatory requirements, discovery of a defect in the device, increased incidence of adverse events or identification of other safety issues, or previously unknown problems with the manufacturing operations for TAXUS (any of which could, under certain circumstances, result in a manufacturing injunction), our revenues could be further significantly reduced. BSC’s failure to resolve these issues in a timely manner and to the satisfaction of the FDA and other regulatory authorities, or the occurrence of similar problems in the future, could delay the launch of additional TAXUS product lines in the United States and could have a significant impact on our royalty revenue from sales of TAXUS.
Additionally, BSC may terminate our 1997 License Agreement under certain circumstances, including: if BSC is unable to acquire a supply of paclitaxel at a commercially reasonable price; if BSC reasonably determines that the paclitaxel-eluting coronary stent is no longer commercially viable; or if our license agreement with the National Institutes of Health (“NIH”), certain rights under which are sublicensed to BSC, terminates.
The amounts payable by BSC to us vary from 1% to 9% of net sales depending on various factors, including volume of sales in each quarterly period and patent protection laws in the country of sale. From these amounts, we must pay certain royalties to our licensors, including the NIH and the University of British Columbia
18
Table of Contents
(“UBC”), under license agreements. The royalty rates paid by BSC to us are described in “Management’s Discussion and Analysis of Financial Condition and Results of Operations” in this Annual Report on Form 10-K. There is no guarantee that royalty payments under our 1997 License Agreement will continue, and demand for BSC’s paclitaxel-eluting coronary stent products could continue to decline as a result of the factors stated above, as well as technological change, reimbursement or other factors. Also, the royalty rate payable by BSC could decline if and when patent protection expires, or no longer exists as defined by our 1997 License Agreement, in certain jurisdictions.
BSC may be enjoined from the selling, or otherwise become subject to limitations applicable to its ability to sell, TAXUS in the United States.
Our royalty revenue derived from the sale of paclitaxel-eluting coronary stents depends on BSC’s ability to continue to sell its various TAXUS paclitaxel-eluting stent products and to launch next generation paclitaxel-eluting stents in the United States. Historically, stent manufacture and sale is the subject of a substantial amount of U.S. patent litigation, and we anticipate that our licensees, including BSC and others, may be involved in material legal proceedings related to paclitaxel-eluting stents.
Many of the products we are depending on to grow our business are not yet ready for sale or have only recently been introduced for sale.
Many of the products we are depending on to produce future growth are not yet ready for sale or have only recently been introduced for sale. Introduction of a new product to the marketplace requires significant financial expenditures that we may not be able to fund. If any of our products are not approved for sale or do not achieve market acceptance, our ability to generate revenues will be adversely affected.
Our success depends on the successful commercialization of our technology.
The successful commercialization of our technology is crucial for our success. Successful product development in the pharmaceutical and medical device industry is highly uncertain and very few research and development projects produce a commercial product. Medical devices, pharmaceutical applications and surgical implants utilizing our technology are in various stages of clinical and commercial development and face a variety of risks and uncertainties. Principally, these risks and uncertainties include the following:
| • |
Future clinical trial results may show that some or all of our technology, or the technology of our strategic collaborators that incorporate our technology, is not safe or effective. |
| • |
Even if our technology is shown to be safe and effective, we and our strategic collaborators may face significant or unforeseen difficulties in manufacturing our medical devices or the medical devices and surgical implants that use our technology. These difficulties may become apparent when we or our strategic collaborators manufacture the medical devices or surgical implants on a small scale for clinical trials and regulatory approval or may only become apparent when scaling-up the manufacturing to commercial scale. |
| • |
Even if our technology-based products are successfully developed, receive all necessary regulatory approvals and are commercially produced, there is no guarantee that there will be market acceptance of them or that they will not cause unanticipated side effects in patients. For example, if drug-eluting stents are found to cause, or are perceived to be the cause of, blood clots in patients, then sales of our drug-eluting stent products may be adversely affected. In addition, there is no guarantee that there will be market acceptance of our products. Our ability to achieve market acceptance for any of our products will depend on a number of factors, including whether or not competitors may develop technologies which are superior to or less costly than our technology-based products, and whether governmental and private third-party payers provide adequate coverage and reimbursement for our products, with the result that our technology-based products, even if they are successfully developed, manufactured and approved, may not generate significant revenues. |
19
Table of Contents
If we are unsuccessful in dealing with any of these risks, or if we are unable to successfully commercialize our technology for some other reason, it would likely seriously harm our ability to generate revenue.
We may be unsuccessful in marketing, selling and distributing certain of our products.
We distribute a number of our products worldwide. In order to achieve commercial success for our approved products, we have established our sales and marketing force in the United States, Europe and other parts of the world. If our distribution personnel or methods are not sufficient to ensure we have supply to meet demand for our products or if there is a quality control failure with our products, it could harm our prospects, business, financial condition and results of operations.
To the extent that we enter into co-promotion or other marketing and sales arrangements with other companies, any revenues received will be dependent on the efforts of others, and we do not know whether these efforts will be successful. Failure to develop a direct sales and marketing force or to enter into appropriate arrangements with other companies to market and sell our products will reduce our ability to generate revenues.
If our products are alleged to be harmful, we may not be able to sell them, we may be subject to product liability claims not covered by insurance and our reputation could be damaged.
The nature of our business exposes us to potential liability risks inherent in the testing, manufacturing and marketing of pharmaceutical products and medical devices. Using our drug candidates or devices in clinical trials may expose us to product liability claims. These risks will expand with respect to drugs or devices, if any, that receive regulatory approval for commercial sale. In addition, some of the products we manufacture and sell are designed to be implanted in the human body for varying periods of time. Even if a drug or device were approved for commercial use by an appropriate governmental agency, there can be no assurance that users will not claim that effects other than those intended may have resulted from our products. Component failures, manufacturing flaws, quality system failures, design defects, inadequate disclosure of product-related risks or product-related information or other safety issues with respect to these or other products we manufacture or sell could result in an unsafe condition or injury to, or death of, a patient. In addition, although many of our products are subject to review and approval by the FDA or other regulatory agencies, under the current state of the law, any approval of our products by such agencies will not prohibit product liability lawsuits from being brought against us in the event that our products are alleged to be defective, even if such products have been used for their approved indications and appropriate labels have been included.
In the event that anyone alleges that any of our products are harmful, we may experience reduced consumer demand for our products or our products may be recalled from the market. In addition, we may be forced to defend individual or class action lawsuits and, if unsuccessful, to pay a substantial amount in damages. A recall of some of our products could result in exposure to additional product liability claims, lost sales and significant expense to perform the recall. The outcome of litigation, particularly class action lawsuits, is difficult to assess or quantify. Plaintiffs in these types of lawsuits often seek recovery of very large or indeterminate amounts, including not only actual damages, but also punitive damages. The magnitude of the potential loss relating to these types of lawsuits may remain unknown for substantial periods of time. In addition, the cost to defend against any future litigation may be significant.
We do not have insurance covering our costs and losses as a result of any recall of products or devices incorporating our technologies, whether such recall is instituted by a device manufacturer or us as required by a regulatory agency. Insurance to cover costs and losses associated with product recalls is expensive. If we seek insurance covering product recalls in the future it may not be available on acceptable terms. Even if obtained, insurance may not fully protect us against potential liability or cover our losses. Some manufacturers that suffered such claims in the past have been forced to cease operations or declare bankruptcy.
We do have insurance covering product liability. However, our insurance may not fully protect us from potential product liability claims. If a product liability claim or a series of claims is brought against us in excess of our
20
Table of Contents
insurance coverage, our business could suffer. Some manufacturers that suffered such claims in the past have been forced to cease operations or declare bankruptcy.
We face and will continue to face significant competition.
Competition from pharmaceutical companies, medical device companies, biotechnology companies and academic and research institutions is intense and is expected to increase. Many of our competitors and potential competitors have substantially greater product development capabilities, experience conducting clinical trials and financial, scientific, manufacturing, sales and marketing resources and experience than our company. We also face competition from non-medical device companies, such as pharmaceutical companies, which may offer non-surgical alternative therapies for disease states which are currently or intended to be treated using our products. Other companies may:
| • |
develop and obtain patent protection for products earlier than us; |
| • |
design around patented technology developed by us; |
| • |
obtain regulatory approvals for such products more rapidly; |
| • |
have greater manufacturing capabilities and other resources; |
| • |
have larger or more experienced sales forces; |
| • |
develop more effective or less expensive products; or |
| • |
have greater success in obtaining adequate third-party payer coverage and reimbursement for their competing products. |
While we intend to expand our technological capabilities in order to remain competitive, there is a risk that:
| • |
research and development by others will render our technology or product candidates obsolete or non-competitive; |
| • |
treatments or cures developed by others will be superior to any therapy developed by us; and |
| • |
any therapy developed by us will not be preferred to any existing or newly-developed technologies. |
The commercial potential of our products and product candidates will be significantly limited if we are not able to obtain adequate levels of reimbursement or market acceptance for them.
Our ability to commercialize human therapeutic products and product candidates successfully will depend in part on the extent to which coverage and reimbursement for such products and related treatments will be available from government health administration authorities, private health insurers and other third-party payers or supported by the market for these products. There can be no assurance that third-party payers’ coverage and reimbursement will be available or sufficient for the products we might develop.
Third party payers are increasingly challenging the price of medical products and services and instituting cost containment measures to control or significantly influence the purchase of medical products and services. These cost containment measures, if instituted in a manner affecting the coverage of or payment for our products, could have a material adverse effect on our ability to operate profitably. In some countries in the European Union and in the United States, significant uncertainty exists as to the reimbursement status of newly-approved healthcare products, and we do not know whether adequate third-party coverage and reimbursement will be available for us to realize an appropriate return on our investment in product development, which could seriously harm our business. In the United States, while reimbursement amounts previously approved appear to have provided a reasonable rate of return, there can be no assurance that our products will continue to be reimbursed at current rates or that third-party payers will continue to consider our products cost-effective and provide coverage and reimbursement for our products, in whole or in part.
21
Table of Contents
We cannot be certain that our products will gain commercial acceptance among physicians, patients and third party payers, even if necessary international and United States marketing approvals are maintained. We believe that recommendations and endorsements by physicians will be essential for market acceptance of our products, and we do not know whether these recommendations or endorsements will be obtained. We also believe that surgeons will not use these products unless they determine, based on clinical data and other factors, that the clinical benefits to patients and cost savings achieved through use of these products outweigh their cost. Acceptance among physicians may also depend upon the ability to train surgeons and other potential users of our products and the willingness of such users to learn these relatively new techniques.
We depend on our strategic collaborators for the development, regulatory approval, testing, manufacturing and the potential commercialization of our products.
Historically, our strategy has been to enter into various arrangements with corporate and academic collaborators, licensors, licensees and others for the research, development, clinical testing, regulatory approval, manufacturing, marketing and commercialization of our product candidates. For instance, we collaborate with BSC and Cook to develop and market paclitaxel-eluting coronary and peripheral stents. Strategic collaborators, both existing (particularly BSC) and those that we may collaborate with in the future, are or may be essential to the development of our technology and potential revenue and we have little control over or access to information regarding our collaborators’ activities with respect to our products.
Our strategic collaborators may fail to successfully develop or commercialize our technology to which they have rights for a number of reasons, including:
| • |
failure of a strategic collaborator to continue, or delays in, its funding, research, development and commercialization activities; |
| • |
the pursuit or development by a strategic collaborator of alternative technologies, either on its own or with others, including our competitors, as a means for developing treatments for the diseases targeted by our programs; |
| • |
the preclusion of a strategic collaborator from developing or commercializing any product, through, for example, litigation or other legal action; and |
| • |
the failure of a strategic collaborator to make required milestone payments, meet contractual milestone obligations or exercise options which may result in our terminating applicable licensing arrangements. |
We have and we expect that we will continue to enter into licensing agreements with third parties to give us access to technologies that we may use to develop products through our strategic collaboration and partnership arrangements. The technologies governed by these license agreements may be critical to our ability to maintain our competitive advantage in our existing products and to develop future products. For example, through licenses with NIH and UBC, we have been granted access to technologies that have contributed to the development of the TAXUS paclitaxel-eluting coronary stent.
Pursuant to terms of existing license agreements, licensors have the ability to terminate their respective licenses upon the occurrence of certain specified circumstances. Events which may allow licensors to exercise these termination provisions include our bankruptcy, sub-licensing without the licensor’s consent, a transaction which results in a change of control of us, our failure to use the required level of diligence efforts to develop, market and sell products based on the licensed technology, our failure to maintain adequate levels of insurance with respect to the licensed technologies or other acts or omissions that may constitute a breach by us of our license agreement. In addition, any failure to continue to have access to these technologies may materially affect the benefits that we currently derive from the collaboration and partnership arrangements and may negatively impact our results and operations.
22
Table of Contents
If our process related to product development does not result in an approved and commercially successful product, our business could be adversely affected.
We focus our research and development activities on areas in which we have particular strengths. The outcome of any development program is highly uncertain, notwithstanding how promising a particular program may seem. Success in pre-clinical and early-stage clinical trials may not necessarily translate into success in large-scale clinical trials. Further, clinical trials are expensive and require increased investment, which will adversely affect our short-term profitability.
In addition, we will need to obtain and maintain regulatory approval in order to market new products. Notwithstanding the outcome of clinical trials for new products, regulatory approval may not be achieved. The results of clinical trials are susceptible to varying interpretations that may delay, limit or prevent approval or result in the need for post-marketing studies. In addition, changes in regulatory policy for product approval during the period of product development and review by regulators of a new application may cause delays or rejection. Even if we receive regulatory approval, this approval may include limitations on the indications for which we can market the product. There is no guarantee that we will be able to satisfy the applicable regulatory requirements, and we may suffer a significant variation from planned revenue as a result.
Our planned clinical trials may not begin on time, or at all, and our planned and ongoing clinical trials may not be completed on schedule, or at all.
The commencement or completion of any of our clinical trials may be delayed or halted for numerous reasons, including, but not limited to, the following:
| • |
the FDA or other regulatory authorities do not approve a clinical trial protocol or a clinical trial, or place a clinical trial on hold; |
| • |
the data and safety monitoring committee of a clinical trial recommends that a trial be placed on hold or suspended; |
| • |
patients do not enroll in clinical trials at the rate we expect; |
| • |
patients are not followed-up at the rate we expect; |
| • |
patients experience adverse side effects or events related to our products; |
| • |
patients die or suffer adverse medical effects during a clinical trial for a variety of reasons, including the advanced stage of their disease and medical problems, which may or may not be related to our product candidates; |
| • |
regulatory inspections of our clinical trials or manufacturing facilities, which may, among other things, require us to undertake corrective action or suspend or terminate our clinical trials if investigators find us not to be in compliance with regulatory requirements; |
| • |
the failure of our manufacturing process to produce finished products which conform to design and performance specifications; |
| • |
changes in governmental regulations or administrative actions; |
| • |
the interim results of the clinical trial are inconclusive or negative; |
| • |
pre-clinical or clinical data is interpreted by third parties in different ways; |
| • |
our clinical trial expenditures are constrained by our budgetary considerations; |
| • |
our trial design, although approved, is inadequate to demonstrate safety and/or efficacy; or |
| • |
our financial resources are not sufficient to commence or complete a trial. |
Clinical trials may require the enrollment of large numbers of patients, and suitable patients may be difficult to identify and recruit. Patient enrollment in clinical trials and completion of patient follow-up in clinical trials
23
Table of Contents
depend on many factors, including the size of the patient population, the nature of the trial protocol, the proximity of patients to clinical sites and the eligibility criteria for the study and patient compliance. For example, patients may be discouraged from enrolling in our clinical trials if the trial protocol requires them to undergo extensive post-treatment procedures to assess the safety and effectiveness of our products, or they may be persuaded to participate in contemporaneous trials of competitive products. Delays in patient enrollment or failure of patients to continue to participate in a study may cause an increase in costs and delays or may result in the failure of the trial.
Our clinical trial costs will increase if we have material delays in our clinical trials or if we need to perform more or larger clinical trials than planned. Adverse events during a clinical trial could cause us to repeat a trial, terminate a trial or cancel an entire program.
Pre-clinical development is a long, expensive and uncertain process, and we may terminate one or more of our ongoing pre-clinical development programs.
We may determine that certain of our ongoing pre-clinical product candidates or programs do not have sufficient potential to warrant the allocation of resources. Accordingly, we may elect to terminate programs for such product candidates. If we terminate a pre-clinical program in which we have invested significant resources, our prospects may suffer, as we will have expended resources on a program that will not provide a return on our investment and we will have missed the opportunity to have allocated those resources to potentially more productive uses. For example, as part of our cost reduction measures we have terminated one of our pre-clinical development programs.
We may not be able to protect our intellectual property or obtain necessary intellectual property rights from third parties, which could adversely affect our business.
Our success depends, in part, on ensuring that our intellectual property rights are covered by valid and enforceable patents or effectively maintained as trade secrets and on our ability to detect violations of our intellectual property rights and enforce such rights against others.
The validity of our patent claims depends, in part, on whether pre-existing public information described or rendered obvious our inventions as of the filing date of our patent applications. We may not have identified all prior art, such as U.S. and foreign patents, published applications or published scientific literature that could adversely affect the validity of our issued patents or the patentability of our pending patent applications. For example, patent applications in the United States are maintained in confidence for up to 18 months after their filing. In some cases, however, patent applications remain confidential in the U.S. Patent and Trademark Office (the “USPTO”), for the entire time prior to issuance as a U.S. patent. Patent applications filed in countries outside the United States are not typically published until at least 18 months from their first filing date. Similarly, publication of discoveries in scientific or patent literature often lags behind actual discoveries. Therefore, we cannot be certain that we were the first to invent, or the first to file patent applications related to, our technology. In the event that a third party has also filed a U.S. patent application covering a similar invention, we may have to participate in an adversarial proceeding, known as an interference, declared by the USPTO to determine priority of invention in the United States. It is possible that we may be unsuccessful in the interference, resulting in a loss of some portion or all of our U.S. patent positions. The laws in some foreign jurisdictions do not protect intellectual property rights to the same extent as in the United States, and many companies have encountered significant difficulties in protecting and defending such rights in foreign jurisdictions. If we encounter such difficulties or we are otherwise precluded from effectively protecting our intellectual property rights in foreign jurisdictions, our business prospects could be substantially harmed.
We frequently seek patents to protect our intellectual property. It should be recognized that we may not be able to obtain patent protection for key elements of our technology, as the patent positions of pharmaceutical, biotechnology and medical device companies are uncertain and involve complex legal and factual questions for
24
Table of Contents
which important legal issues are largely unresolved. For example, no consistent policy has emerged regarding the scope of health-related patent claims that are granted by the USPTO or enforced by the U.S. federal courts. Rights under any of our issued patents may not provide commercially meaningful protection for our products or afford us a commercial advantage against our competitors or their competitive products or processes. In addition, even if a patent is issued, the coverage claimed in a patent application may be significantly reduced in the patent as granted.
There can be no assurance that:
| • |
patent applications will result in the issuance of patents; |
| • |
additional proprietary products developed will be patentable; |
| • |
licenses we have obtained from third parties that we use in connection with our technology will not be terminated; |
| • |
patents issued will provide adequate protection or any competitive advantages; |
| • |
patents will not be successfully challenged by any third parties; or |
| • |
the patents of others will not impede our or our collaborators’ ability to commercialize our technology. |
For example, the drug paclitaxel is itself not covered by composition of matter patents. Therefore, although we are developing an intellectual property portfolio around the use of paclitaxel for intended commercial applications, others may be able to engage in off-label use of paclitaxel for the same indications, causing us to lose potential revenue. Furthermore, others may independently develop similar products or technologies or, if patents are issued to us, design around any patented technology developed by us, which could affect our potential to generate revenues and harm our results of operations.
Patent protection for our technology may not be available based on prior art. The publication of discoveries in scientific or patent literature often lags behind actual discoveries. As a consequence, there may be uncertainty as to whether we or a third party were the first creator of inventions covered by issued patents or pending patent applications or that we or a third party were the first to file patent applications for such inventions. Moreover, we might have to participate in interference proceedings declared by the USPTO, or other proceedings outside the United States, including oppositions, to determine priority of invention or patentability, which could result in substantial cost to us even if the outcome were favorable. An unfavorable outcome in an interference or opposition proceeding could preclude us, our collaborators and our licensees from making, using or selling products using the technology or require us to obtain license rights from prevailing third parties. We do not know whether any prevailing party would offer us a license on commercially acceptable terms, if at all. We may also be forced to pay damages or royalties for our past use of such intellectual property rights, as well as royalties for any continued usage.
As part of our patent strategy, we have filed a variety of patent applications internationally. Oppositions have been filed against various granted patents that we either own or license and which are related to certain of our technologies. See “Legal Proceedings” elsewhere in this Annual Report on Form 10-K for a discussion of the proceedings related to certain of such oppositions.
Our future success and competitive position depend in part on our ability to obtain and maintain certain proprietary intellectual property rights used in our approved products and principal product candidates. Any such success depends in part on effectively prosecuting claims against others who we believe are infringing our rights and by effectively defending claims of intellectual property infringement brought by our competitors and others. The stent-related markets have experienced rapid technological change and obsolescence in the recent past, and our competitors have strong incentives to attempt to stop or delay us from introducing new products and technologies. See “— We may incur substantial costs as a result of litigation or other proceedings relating to patent and other intellectual property rights.”
25
Table of Contents
We do not know whether the patents that we have obtained or licensed, or may be able to obtain or license in the future, would be held valid or enforceable by a court or whether a competitor’s technology or product would be found to infringe such patents. Further, we have no assurance that third parties will not properly or improperly modify or terminate any license they have granted to us.
We have obtained licenses from third parties with respect to their intellectual property that we use in connection with our technology. However, we may need to obtain additional licenses for the development of our current or future products. Licenses may not be available on satisfactory terms or at all. If available, these licenses may obligate us to exercise diligence in bringing our technology to market and may obligate us to make minimum guarantee or milestone payments. This diligence and these milestone payments may be costly and could adversely affect our business. We may also be obligated to make royalty payments on the sales, if any, of products resulting from licensed technology and may be responsible for the costs of filing and prosecuting patent applications. These costs could affect our results of operations and decrease our earnings.
Certain of our key technologies include trade secrets and know-how that may not be protected by patents. There can be no assurance that we will be able to protect our trade secrets. To help protect our rights, we require employees, consultants, advisors and collaborators to enter into confidentiality agreements. We cannot assure you that all employees, consultants, advisors and collaborators have signed such agreements, or that these agreements will adequately protect our trade secrets, know-how or other proprietary information in the event of any unauthorized use or disclosure. Furthermore, we may not have adequate remedies for any such breach. Any disclosure of confidential data into the public domain or to third parties could allow our competitors to learn our trade secrets and use the information in competition against us.
If certain single-source suppliers fail to deliver key product components in a timely manner, our manufacturing ability would be impaired and our product sales could suffer.
We depend on certain single-source suppliers that supply components used in the manufacture of certain of our products. If we need alternative sources for key component parts for any reason, these component parts may not be immediately available to us. If alternative suppliers are not immediately available, we will have to identify and qualify alternative suppliers, and production of these components may be delayed. We may not be able to find an adequate alternative supplier in a reasonable time period or on commercially acceptable terms, if at all. Shipments of affected products have been limited or delayed as a result of such problems in the past, and similar problems could occur in the future. Our inability to obtain our key source supplies for the manufacture of our products may require us to delay shipments of products, harm customer relationships or force us to curtail or cease operations.
If physicians do not recommend and endorse our products or products that use our technology, or if our working relationships with physicians deteriorate, our products or products that use our technology may not be accepted in the marketplace, which could adversely affect our sales and royalty revenues.
In order for us to sell our products or continue to receive royalty revenues from the sale of products that use our technologies, physicians must recommend and endorse them. We believe that recommendations and endorsements by physicians will be essential for market acceptance of our products, and we do not know whether we will obtain the necessary recommendations or endorsements from physicians. Acceptance of our products or of products that use our technology depends on educating the medical community as to the distinctive characteristics, perceived benefits, safety, clinical efficacy and cost-effectiveness of these products compared to products of competitors, and on training physicians in the proper application of these products. If we are not successful in obtaining the recommendations or endorsements of physicians for our products or our collaborators are not successful in doing the same for their products that use our technology, our sales and royalty revenues may not increase or may decline.
In addition, if we fail to maintain our working relationships with physicians, many of our products may not be developed and marketed in line with the needs and expectations of professionals who use and support our
26
Table of Contents
products. The research, development, marketing and sales of many of our new and improved products is dependent upon our maintaining working relationships with physicians. We rely on these professionals to provide us with considerable knowledge and experience regarding our products and the marketing of our products. Physicians assist us as researchers, marketing consultants, product consultants, inventors and as public speakers. If we are unable to maintain our strong relationships with these professionals and continue to receive their advice and input, the development and marketing of our products could suffer, which could adversely affect the acceptance of our products in the marketplace and our sales.
If we are unable to license new technologies to utilize in the development of products, or our existing license agreements are terminated, our ability to maintain our competitive advantage in our existing products and to develop future products may be adversely affected.
We have entered into, and we expect that we will continue to enter into, licensing agreements with third parties to give us access to technologies that we may use to develop products through our strategic collaboration and partnership arrangements. The technologies governed by these license agreements may be critical to our ability to maintain our competitive advantage in our existing products and to develop future products. For example, through licenses with the NIH and UBC, we have been granted access to technologies that have contributed to the developments of the TAXUS paclitaxel-eluting coronary stent.
Pursuant to terms of our existing license agreements, licensors have the right under certain specified circumstances to terminate their respective licenses. Events that may allow licensors to exercise these termination provisions include:
| • |
our bankruptcy; |
| • |
sub-licensing without the licensor’s consent; |
| • |
a transaction which results in a change of control of us; |
| • |
our failure to use the required level of diligence to develop, market and sell products based on the licensed technology; |
| • |
our failure to maintain adequate levels of insurance with respect to the licensed technologies; or |
| • |
other acts or omissions that may constitute a breach by us of our license agreement. |
In addition, any failure to continue to have access to these technologies may materially adversely affect the benefits that we currently derive from our collaboration and partnership arrangements and may adversely affect our results and operations.
Compulsory licensing and/or generic competition may affect our business in certain countries.
In a number of countries, governmental authorities have the right to grant licenses to others to use a pharmaceutical or medical device company’s patents or other intellectual property without the consent of the owner of the patent or other intellectual property. Governmental authorities could use this right to grant licenses under our patents or other intellectual property to others or could require us to grant licenses under our patents or other intellectual property to others, thereby allowing our competitors to manufacture and sell their own versions of our products. In other circumstances, governmental authorities could use this right to require us or our licensees to reduce the prices of our products. In all of these situations, our sales or the sales of our licensee(s), and the results of our operations, in these countries could be adversely affected.
We may incur substantial costs as a result of litigation or other proceedings relating to patent and other intellectual property rights.
In connection with maintaining the value of our various intellectual property and exclusivity rights, we regularly evaluate the activities of others worldwide. Our success will depend, in part, on our ability to obtain patents, or
27
Table of Contents
licenses to patents, maintain trade secret protection and enforce our rights against others. Should it become necessary to protect those rights, we intend to pursue all cost-efficient strategies, including, when appropriate, negotiation or litigation in any relevant jurisdiction. For a summary of certain of our current legal proceedings, see “Legal Proceedings” elsewhere in this Annual Report on Form 10-K.
We intend to pursue and to defend vigorously any and all actions of third parties related to our material patents and technology. Any failure to obtain and protect intellectual property could adversely affect our business and our ability to operate could be hindered by the proprietary rights of others.
Our involvement in intellectual property litigation could result in significant expense, adversely affecting the development of product candidates or sales of the challenged product or intellectual property and diverting the efforts of our technical and management personnel, whether or not such litigation is resolved in our favor. Some of our competitors may be able to sustain the costs of complex patent litigation more effectively than we can because they have substantially greater resources and intellectual property litigation may be used against us as a means of gaining a competitive advantage. Competing parties frequently file multiple suits to leverage patent portfolios across product lines, technologies and geographies and to balance risk and exposure between the parties. Uncertainties resulting from the initiation and continuation of any litigation could affect our ability to continue our operations. In the event of an adverse outcome as a defendant in any such litigation, we may, among other things, be required to:
| • |
pay substantial damages or back royalties; |
| • |
cease the development, manufacture, use or sale of product candidates or products that infringe upon the intellectual property of others; |
| • |
expend significant resources to design around a patent or to develop or acquire non-infringing intellectual property; |
| • |
discontinue processes incorporating infringing technology; or |
| • |
obtain licenses to the infringed intellectual property. |
We cannot assure you that we will be successful in developing or acquiring non-infringing intellectual property or that necessary licenses will be available upon reasonable terms, if at all. Any such development, acquisition or license could require the expenditure of substantial time and other resources and could adversely affect our business and financial results. If we cannot develop or acquire such intellectual property or obtain such licenses, we could encounter delays in any introduction of products or could find that the development, manufacture or sale of products requiring such licenses could be prohibited.
If third parties file patent applications, or are issued patents claiming technology also claimed by us in pending applications, we may be required to participate in interference proceedings with the USPTO, or other proceedings outside the United States, including oppositions, to determine priority of invention or patentability, which could result in substantial cost to us even if the eventual outcome were favorable.
Our ability to operate could be hindered by the proprietary rights of others.
A number of pharmaceutical, biotechnology and medical device companies as well as research and academic institutions have developed technologies, filed patent applications or received patents on various technologies that may be related to our business. Some of these technologies, applications or patents may conflict with or adversely affect our technologies or intellectual property rights, including those that we license from others. We are aware of other parties holding intellectual property rights that may represent prior art or other potentially conflicting intellectual property, including stents coated with agents intended to reduce restenosis. Any conflicts with the intellectual property of others could limit the scope of the patents, if any, that we may be able to obtain or result in the denial of our current or future patent applications altogether.
28
Table of Contents
If patents that cover our activities are issued to other persons or companies, we could be charged with infringement. In the event that other parties’ patents cover any portion of our activities, we may be forced to develop alternatives or negotiate a license for such technology. We do not know whether we would be successful in either developing alternative technologies or acquiring licenses upon reasonable terms, if at all. Obtaining any such licenses could require the expenditure of substantial time and other resources and could harm our business and decrease our earnings. If we do not obtain such licenses, we could encounter delays in the introduction of our products or could find that the development, manufacture or sale of products requiring such licenses is prohibited.
Technological advances and evolving industry standards could reduce our future product sales, which could cause our revenues to grow more slowly or decline.
The markets for our products are characterized by rapidly changing technology, changing customer needs, evolving industry standards and frequent new product introductions and enhancements. The emergence of new industry standards in related fields may adversely affect the demand for our products. This could happen, for example, if new standards and technologies emerged that were incompatible with customer deployments of our applications. In addition, any compounds, products or processes that we develop may become obsolete or uneconomical before we recover any of the expenses incurred in connection with their development. We cannot assure you that we will succeed in developing and marketing product enhancements or new products that respond to technological change, new industry standards, changed customer requirements or competitive products on a timely and cost-effective basis. Additionally, even if we are able to develop new products and product enhancements, we cannot assure you that they will achieve market acceptance.
We may be subject to damages resulting from claims that we or our employees have wrongfully used or disclosed alleged trade secrets of their former employers.
Many of our employees were previously employed at universities or other biotechnology or pharmaceutical companies, including our competitors or potential competitors. Although no such claims against us are currently pending, we may be subject to claims that these employees or we have used or disclosed trade secrets or other proprietary information of their former employers. Litigation may be necessary to defend against these claims. Even if we are successful in defending against these claims, litigation could result in substantial costs and be a distraction to management. If we fail in defending such claims, in addition to paying monetary damages, we may lose valuable intellectual property rights or personnel. A loss of key research personnel or their work product could hamper or prevent our ability to commercialize certain product candidates, which could severely harm our business.
We may incur significant costs complying with environmental laws and regulations.
Our research and development processes and manufacturing operations involve the use of hazardous materials. We are subject to federal, state, provincial, local and other laws and regulations in the countries in which we operate or sell our products, which govern the use, manufacture, storage, handling and disposal of such materials and certain waste products. The risk of accidental contamination or injury from these materials cannot be completely eliminated. In the event of an accident or the discovery of pre-existing contamination at one or more of our facilities, we could be held liable for any damages that result and any such liability could exceed our resources. In addition, our manufacturing facilities may become subject to new or increased legislation or regulation as a result of climate control initiatives. We may not be specifically insured with respect to these liabilities, and we do not know whether we will be required to incur significant costs to comply with environmental laws and regulations in the future, or whether our operations, business or assets will be harmed by current or future environmental laws or regulations.
Future legislation or regulatory changes to, or consolidation in, the healthcare system may affect our ability to sell our product profitably.
There have been, and we expect there will continue to be, a number of legislative and regulatory proposals to change the healthcare system, and some could involve changes that could significantly affect our business. For
29
Table of Contents
example, the recent healthcare reform bills proposed by the U.S. House of Representatives and Senate both included a tax on medical device manufacturers based on their annual sales. Efforts by governmental and third-party payers to reduce health care costs or the announcement of legislative proposals or reforms to implement government controls could cause a reduction in sales or in the selling price of our products, which would seriously harm our business. Additionally, initiatives to reduce the cost of healthcare have resulted in a consolidation trend in the healthcare industry, including hospitals. This in turn has resulted in greater pricing pressures and the exclusion of certain suppliers from certain market segments as consolidated groups such as group purchasing organizations, independent delivery networks and large single accounts continue to consolidate purchasing decisions for some of our hospital customers. We expect that market demand, government regulation, and third-party reimbursement policies will continue to change the worldwide healthcare industry, resulting in further business consolidations and alliances among our customers and competitors, which may reduce competition, exert further downward pressure on the prices of our products and may adversely impact our business, financial condition or results of operations.
We must receive regulatory approval for each of our product candidates before they can be sold commercially in Canada, the United States or internationally, which can take significant time and be very costly.
The development, manufacture and sale of medical devices and human therapeutic products in Canada, the United States and internationally is governed by a variety of statutes and regulations. These laws require, among other things:
| • |
regulatory approval of manufacturing facilities and practices; |
| • |
adequate and well-controlled research and testing of products in pre-clinical and clinical trials; |
| • |
review and approval of submissions containing manufacturing, pre-clinical and clinical data in order to obtain marketing approval based on establishing the safety and efficacy of the product for each use sought, including adherence to cGMPs during production and storage; and |
| • |
control of marketing activities, including advertising and labeling. |
The product candidates currently under development by us or our collaborators will require significant research, development, pre-clinical and clinical testing, pre-market review and approval, and investment of significant funds prior to their commercialization. In many instances, we are dependent on our collaborators for regulatory approval and compliance, and have little or no control over these matters. The process of completing clinical testing and obtaining such approvals is likely to take many years and require the expenditure of substantial resources, and we do not know whether any clinical studies by us or our collaborators will be successful, that regulatory approvals will be received, or that regulatory approvals will be obtained in a timely manner. Despite the time and resources expended by us, regulatory approval is never guaranteed. Even if regulatory approval is obtained, regulatory agencies may limit the approval to certain diseases, conditions or categories of patients who can use them.
If any of our development programs are not successfully completed in a timely fashion, required regulatory approvals are not obtained in a timely fashion, or products for which approvals are obtained are not commercially successful, it could seriously harm our business.
Our products and manufacturing facilities that have, or may receive, regulatory approval, are or will be subject to ongoing regulation. In addition, we have little or no control over the manufacturing facilities of our collaborators in which certain of our products are manufactured.
Our products and manufacturing operations are subject to extensive regulation in the United States by the FDA and by similar regulatory agencies abroad. Ongoing regulation includes compliance with an array of manufacturing and design controls and testing, quality control, storage and documentation procedures. Regulatory agencies may also require expensive post-approval studies. Any adverse events associated with our
30
Table of Contents
products must also be reported to regulatory authorities. If deficiencies in our or our collaborators’ manufacturing and laboratory facilities are discovered, or we or our collaborators fail to comply with applicable post-market regulatory requirements, a regulatory agency may close the facility or suspend manufacturing.
With respect to products manufactured by third-party contractors, we are, and we expect to continue to be, dependent on our collaborators for continuing regulatory compliance and we may have little or no control over these matters. Our ability to control third-party compliance with FDA and other regulatory requirements will be limited to contractual remedies and rights of inspection. Our failure or the failure of third-party manufacturers to comply with regulatory requirements applicable to our products may result in legal or regulatory action by those regulatory authorities. There can be no assurance that our or our collaborators’ manufacturing processes will satisfy regulatory, cGMP or International Standards Organization (“ISO”) requirements.
In addition, there may be uncertainty as to whether or not we or others who are involved in the manufacturing process will be able to make the transition to commercial production of some of our newly developed products. A failure to achieve regulatory approval for manufacturing facilities or a failure to make the transition to commercial production for our products will adversely affect our prospects, business, financial condition and results of operations.
If we are unable to fully comply with federal and state “fraud and abuse laws”, we could face substantial penalties, which may adversely affect our business, financial condition and results of operations.
We are subject to various laws pertaining to health care fraud and abuse, including the U.S. Anti-Kickback Statute, physician self-referral laws, the U.S. False Claims Act, the U.S. Health Insurance Portability and Accountability Act of 1996, the U.S. False Statements Statute, and state law equivalents to these U.S. federal laws, which may not be limited to government-reimbursed items and may not contain identical exceptions. Violations of these laws are punishable by criminal and civil sanctions, including, in some instances, civil and criminal penalties, damages, fines, exclusion from participation in U.S. federal and state healthcare programs, including Medicare and Medicaid, and the curtailment or restructuring of operations. Any action against us for violation of these laws could have a significant impact on our business. In addition, we are subject to the U.S. Foreign Corrupt Practices Act. Any action against us for violation by us or our agents or distributors of this act could have a significant impact on our business.
Consolidation in the healthcare industry could have an adverse effect on our revenues and results of operations.
Many healthcare industry companies, including medical device companies, have consolidated to create new companies with greater market power. If the healthcare industry continues to consolidate, competition to provide goods and services to industry participants will become more intense. These industry participants may try to use their market power to negotiate price concessions or reductions for medical devices that incorporate components produced by us. If we are forced to reduce our prices because of consolidation in the healthcare industry, our revenues would decrease and our consolidated earnings, financial condition or cash flows would suffer.
We may incur losses associated with foreign currency fluctuations.
We report our operating results and financial position in U.S. dollars in order to more accurately represent the currency of the economic environment in which we operate.
Our operations are in some instances conducted in currencies other than the U.S. dollar and fluctuations in the value of foreign currencies relative to the U.S. dollar could cause us to incur currency exchange losses. In addition to the U.S. dollar, we currently conduct operations in Canadian dollars, Euros, Swiss francs, Danish kroner, Swedish kroner, Norwegian kroner and U.K. pounds sterling. Exchange rate fluctuations may reduce our future operating results and comprehensive income. For a description of the effects of exchange rate fluctuations on our results, see “Quantitative and Qualitative Disclosures about Market Risk” in this Annual Report on Form 10-K.
31
Table of Contents
We have not entered into any forward currency contracts or other financial derivatives to hedge foreign exchange risk, and therefore we are subject to foreign currency transaction and translation gains and losses. We purchase goods and services in U.S. and Canadian dollars, Euros, Swiss francs, Danish kroner, and U.K. pounds sterling, and earn a significant portion of our license and milestone revenues in U.S. dollars. Foreign exchange risk is managed primarily by satisfying foreign denominated expenditures with cash flows or assets denominated in the same currency.
Acquisition of companies or technologies may result in disruptions to our business.
As part of our business strategy, we may acquire additional assets and businesses principally relating to or complementary to our current operations. Any acquisitions or mergers by us will be accompanied by the risks commonly encountered in acquisitions of companies. These risks include, among other things, higher than anticipated acquisition costs and expenses, the difficulty and expense of integrating the operations and personnel of the companies and the loss of key employees and customers as a result of changes in management.
In addition, geographic distances may make integration of acquired businesses more difficult. We may not be successful in overcoming these risks or any other problems encountered in connection with any acquisitions.
If significant acquisitions are made for cash consideration, we may be required to use a substantial portion of our available cash, cash equivalents and short-term investments. Future acquisitions by us may cause large one-time expenses or create goodwill or other intangible assets that could result in significant asset impairment charges in the future. Acquisition financing may not be available on acceptable terms, if at all.
If we fail to hire and retain key management, scientific and technical personnel, we may be unable to successfully implement our business plan.
We are highly dependent on our senior management and scientific and technical personnel. The competition for qualified personnel in the healthcare field is intense, and we rely heavily on our ability to attract and retain qualified managerial, scientific and technical personnel. Our ability to manage growth effectively will require continued implementation and improvement of our management systems and the ability to recruit and train new employees. We may not be able to successfully attract and retain skilled and experienced personnel, which could harm our ability to develop our product candidates and generate revenues.
Risks Relating to our Indebtedness, Shares, and Organization and Structure
Our existing indebtedness has adversely affected our operations and we may need to restructure our existing debt to ensure that our cash flows are adequate to service our debt.
As described elsewhere in this Annual Report on Form 10-K, we have a significant amount of debt outstanding, including our Floating Rate Notes and Subordinated Notes. The amount and terms of our indebtedness and other financial obligations have adversely affected our operations. For example, it:
| • |
requires us to dedicate a substantial portion of our cash flow from operations to the payment of interest on our indebtedness, thereby reducing the funds available to us for operations and future business opportunities; |
| • |
limits our planning flexibility for, or ability to react to, changes in our business and the industry as discussed under “Management’s Discussion and Analysis of Financial Condition and Results of Operations — Business Overview” in this Annual Report on Form 10-K; |
| • |
increases our vulnerability to general adverse economic and industry conditions; |
| • |
limits our ability to obtain additional financing in the future for working capital, capital expenditures, acquisitions, general corporate purposes or other purposes; and |
| • |
places us at a competitive disadvantage with competitors who may have less indebtedness and other obligations or greater access to financing. |
32
Table of Contents
As discussed under “Management’s Discussion and Analysis of Financial Condition and Results of Operations,” our management and Board of Directors have been pursuing one or more transactions of significant size and scope to meaningfully address liquidity concerns and the working capital needs of our business. To address these issues, we entered into a revolving credit facility with Wells Fargo Foothill, LLC in the first quarter of 2009 and filed a shelf registration statement with the SEC and final short-form base shelf prospectus in British Columbia and Ontario that became effective in the fourth quarter of 2009. However, as part of this effort to restructure our balance sheet, we believe that we need to refinance or restructure all or a portion of our indebtedness, including the Floating Rate Notes and the Subordinated Notes, at or prior to the time it matures. We may not be able to implement any restructuring alternatives on terms acceptable to us or at all. Market conditions or the condition of our business may limit our ability to take some of these actions. Additionally, our secured revolving credit facility restricts our ability to sell certain assets and refinance existing indebtedness, and the indentures governing our Floating Rate Notes and Subordinated Notes restrict our ability to take certain actions in connection with debt restructurings and contain provisions requiring that proceeds from certain equity issuances be applied toward reductions of the applicable debt. If we do not decrease the amount of debt outstanding or restructure our existing indebtedness, we will be unable to meet our existing debt obligations without significant reductions in our expenses, if at all, which would adversely affect our business and results of operations.
If our cash flows prove inadequate to service our debt and provide for our other obligations, we may be required to refinance all or a portion of our existing debt or future debt at terms unfavorable to us.
Our ability to make payments on and refinance our debt, including the Floating Rate Notes, the Subordinated Notes, any borrowings under our revolving credit facility and other financial obligations, and to fund our capital expenditures and acquisitions will depend on our ability to generate substantial operating cash flow or to raise additional capital. This will depend on our future performance, which will be subject to prevailing economic conditions and to financial, business and other factors beyond our control. Although we have a revolving credit facility in place, if our cash flows are worse than expected, and the amounts we are able to draw on that facility prove inadequate to meet our interest payments on the Floating Rate Notes and Subordinated Notes and other obligations in the future, we may be required to refinance all or a portion of our existing or future debt, including the Floating Rate Notes, the Subordinated Notes or our revolving credit facility, on or before maturity, to sell assets or to obtain additional financing. We cannot assure you that we will be able to refinance any of our indebtedness, including the Floating Rate Notes, the Subordinated Notes or the revolving credit facility, sell any such assets or obtain such additional financing on commercially reasonable terms or at all.
The indentures governing the Floating Rate Notes and Subordinated Notes and the agreement govering our revolving credit facility contain covenants that may limit our ability to take advantage of certain business opportunities advantageous to us that may arise.
The indentures governing the Floating Rate Notes and Subordinated Notes and the agreement governing our revolving credit facility contain certain covenants that, among other things, limit our ability and the ability of certain of our subsidiaries to:
| • |
incur, assume or guarantee additional indebtedness or issue preferred stock; |
| • |
pay dividends or make other equity distributions to our shareholders; |
| • |
purchase or redeem our capital stock; |
| • |
make certain investments; |
| • |
create liens; |
| • |
sell or otherwise dispose of assets; |
| • |
engage in transactions with our affiliates; and |
| • |
merge or consolidate with another entity or transfer all or substantially all of our assets. |
33
Table of Contents
These restrictions could limit our ability to obtain future financing, make acquisitions or needed capital expenditures, withstand economic downturns in our business, industry or the economy in general, conduct operations or otherwise take advantage of business opportunities that may arise.
Although the indentures for the Floating Rate Notes and Subordinated Notes and our revolving credit facility contain fixed charge coverage test that limit our ability to incur indebtedness, these limitations are subject to a number of significant exceptions and qualifications. A breach of any of the covenants defined by our credit facility agreement could result in our inability to draw on the facility or the immediate repayment of any then outstanding principal and interest. Neither of the indentures nor our revolving credit facility imposes any limitation on our incurrence of liabilities that are not considered “Indebtedness” under the indentures (such as operating leases), nor do the indentures impose any limitation on the amount of liabilities incurred by subsidiaries, if any, that might be designated as “Unrestricted Subsidiaries” under the indentures. Despite current indebtedness levels, we and our subsidiaries may still be able to incur substantially more debt. This could further exacerbate the risks associated with our leverage. Also, although the indentures and our revolving credit facility limit our ability to make restricted payments, these restrictions are subject to significant exceptions and qualifications.
The current global credit and financial market conditions may exacerbate certain risks affecting our business.
The recent significantly challenging global credit and financial market conditions may make obtaining additional financing for our business difficult or impossible, or may make it more difficult to pursue a restructuring or other transaction with respect to our existing indebtedness.
In addition, the recent tightening of global credit may lead to a disruption in the performance of our third-party contractors, suppliers or collaborators. We rely on third parties for several important aspects of our business, including royalty revenue, portions of our product manufacturing, clinical development of future collaboration products, conduct of clinical trials and raw materials. If such third parties are unable to satisfy their commitments to us, our business would be adversely affected.
Certain of our products are used in elective medical procedures which are not covered by insurance. Adverse changes in the economy or other conditions or events have had and may continue to have an adverse effect on consumer spending and may reduce the demand for these procedures. Any such changes, conditions or events could have an adverse effect on our sales and results of operations.
We and our subsidiaries are permitted to incur substantially more debt, which could further exacerbate the risks associated with our leverage.
The terms of the indentures governing the Floating Rate Notes and Subordinated Notes and our revolving credit facility expressly permit the incurrence of additional amounts of debt for specified purposes. Moreover, neither the indentures governing the Floating Rate Notes and Subordinated Notes nor our revolving credit facility imposes any limitation on our incurrence of liabilities that are not defined as “Indebtedness” under such indentures or facility (such as trade payables). If we are unable to restructure our existing indebtedness, we may be forced to incur additional debt or other liabilities, exacerbating the related risks that we now face.
The NASDAQ and/or the Toronto Stock Exchange may delist our common shares from quotation on its exchange, which could limit investors’ ability to make transactions in our common shares and subject us to additional trading restrictions.
The NASDAQ rules provide that the exchange can delist a company’s shares for failing to maintain a share price above a dollar. Our common shares are currently trading at approximately one dollar and have traded in the past at less than a dollar on the NASDAQ. We cannot assure you that we will continue to meet the listing requirements of the NASDAQ or that our common shares will continue to be traded on the NASDAQ in the future.
34
Table of Contents
The Toronto Stock Exchange may delist a company’s shares if, in the opinion of the Toronto Stock Exchange, the financial condition and/or the operating results of the company appear to be unsatisfactory or appear not to warrant continuation of the securities on the trading list. The Toronto Stock Exchange may consider a number of factors when determining whether to delist a company’s shares, including the company’s ability to meet its obligations as they become due, working capital position, quick asset position, total assets, capitalization, cash flow, earnings, annual revenues, public distribution of the listed shares, share price and trading activity. We cannot assure you that we will continue to meet the listing requirements of the Toronto Stock Exchange or that our common shares will continue to be traded on the Toronto Stock Exchange in the future.
The threat of delisting and/or a delisting of our common shares could have material adverse effects by, among other things:
| • |
reducing the liquidity and market price of our common shares; |
| • |
reducing the number of investors willing to hold or acquire our common shares, thereby further restricting our ability to obtain equity financing; |
| • |
reducing the amount of news and analyst coverage of our company; and |
| • |
reducing our ability to retain, attract and motivate our directors, officers and employees. |
United States investors may not be able to obtain enforcement of civil liabilities against us.
We were formed under the laws of British Columbia, Canada. A substantial portion of our assets are located outside the United States. In addition, a majority of the members of our board of directors and our officers are residents of countries other than the United States. As a result, it may be impossible for United States investors to affect service of process within the United States upon us or these persons or to enforce against us or these persons any judgments in civil and commercial matters, including judgments under United States federal or state securities laws. In addition, a Canadian court may not permit United States investors to bring an original action in Canada or to enforce in Canada a judgment of a state or federal court in the United States.
Laws and provisions in our notice of articles, articles, shareholder rights plan and stock option plan could delay or deter a change in control.
Our notice of articles and articles allow for the issuance of Class I Preference shares. The board of directors may set the rights and restrictions of any series of preference shares in its sole discretion without the approval of the holders of our common shares. The rights and restrictions of our preference shares may be superior to those of the common shares. Accordingly, the issuance of preference shares also could have the effect of delaying or preventing a change of control of our company. There are at present, no preference shares outstanding.
In addition, under the Business Corporations Act (British Columbia) and our articles, some business combinations, including the sale, lease or other disposition of all or substantially all of our undertaking, must be approved by at least three-quarters of the votes cast by our shareholders in aggregate or, in some cases, approved by at least three-quarters of the votes cast by holders of each class of shares. In some cases, a business combination must be approved by a court. Shareholders may also have a right to dissent from the transactions, in which case, we may be required to pay dissenting shareholders the fair value of their common shares provided they have followed the required procedures.
In addition, our shareholders adopted a shareholder rights plan which provides for substantial dilution to an acquirer of 20% or more of our common shares, except in certain circumstances, including a) the acquirer makes a bid to all shareholders, which, among other things, is held open for at least 60 days and is accepted by independent shareholders holding at least 50% of the outstanding common shares, or b) the bid is otherwise approved by our board of directors. The shareholder rights plan must be reconfirmed by the shareholders every three years.
35
Table of Contents
Furthermore, all of our executive officers have contractual rights under employment agreements that provide for 12 to 24 months severance pay in the event of a change of control of our company. Under our stock option plan, following a change of control, all outstanding stock options vest immediately. In the event that an offer is made to our shareholders generally or to a class of our shareholders, that if accepted would result in the offeror becoming a control person (generally meaning a person holding 20% or more of a company’s voting shares), our board of directors has the discretion under our stock option plan to determine to accelerate the vesting and expiry date of all outstanding options.
Limitations on the ability to acquire and hold our common shares may be imposed by the Competition Act (Canada). This legislation permits the Commissioner of Competition to review any acquisition of a significant interest in our company so long as our assets are valued above certain thresholds. This legislation grants the Commissioner jurisdiction to challenge such an acquisition before the Competition Tribunal if the Commissioner believes that it would, or would be likely to, result in a substantial lessening or prevention of competition in any market in Canada. A reviewable acquisition may not proceed unless the relevant minister is satisfied or is deemed to be satisfied that there is likely to be a net benefit to Canada from the transaction.
Each of these matters could delay or deter a change in control that would be attractive to, and provide liquidity for, shareholders, and could limit the price that investors are willing to pay in the future for our common shares.
| UNRESOLVED STAFF COMMENTS |
None.
| PROPERTIES |
We have 16 facilities located in six different countries, which include Canada, the United States, Puerto Rico, the United Kingdom, Denmark and Switzerland. Of the 16 facilities, 11 are primarily used to manufacture and distribute medical devices or materials for medical device products. Our other 5 facilities are primarily used for research, development and administrative activities. Collectively, these facilities have over 540,000 square feet of modern technical manufacturing, research and administrative operations. The following chart summarizes the facilities where our domestic and international operations occur:
| Location 1 |
Primary Purpose |
Segment |
Owned or Leased | |||
| Chicago, IL |
Administration |
Medical Products |
Leased | |||
| Lausanne, Switzerland |
Administration |
Medical Products |
Leased | |||
| Gainesville, FL |
Manufacturing |
Medical Products |
Owned | |||
| Henrietta, NY |
Manufacturing |
Medical Products |
Leased | |||
| Laguna Hills, CA |
Manufacturing |
Medical Products |
Leased | |||
| North Bend, WA |
Administration |
Pharmaceutical Technologies |
Leased | |||
| Reading, PA |
Manufacturing |
Medical Products |
Owned | |||
| Aguadilla, Puerto Rico |
Manufacturing |
Medical Products |
Leased | |||
| Rincon, Puerto Rico |
Manufacturing |
Medical Products |
Leased | |||
| Stenlose, Denmark (3 facilities) |
Manufacturing |
Medical Products |
2 Leased, 1 Owned | |||
| Taunton, United Kingdom |
Manufacturing |
Medical Products |
Owned | |||
| Vancouver, B.C. (2 facilities) |
Administration and Research |
Pharmaceutical Technologies |
Leased | |||
| Wheeling, IL |
Manufacturing |
Medical Products |
Owned |
| 1 |
Excluded from this list are our two properties that are vacant and are held for sale. One facility is in Syracuse, NY with 77,000 square feet and the other is a 1.6 acre parcel of bare land adjacent to our corporate headquarters in Vancouver, B.C. |
36
Table of Contents
We have several important, and in some cases proprietary, manufacturing capabilities and processes. These include specific capabilities in the areas of various metal bending, grinding and chemical etching, electroplating and electropolishing, plastic injection molding, wire coating, braiding and weaving of surgical textiles and kit assembly and packaging.
| LEGAL PROCEEDINGS |
| i) |
On April 4, 2005, together with BSC, we commenced a legal action in the Netherlands against Sahajanand Medical Technologies Pvt. Ltd. (“SMT”) for patent infringement. On May 3, 2006, the Dutch trial court ruled in our favor, finding that our EP (NL) 0 706 376 patent was valid, and that SMT’s Infinnium™ stent infringed the patent. On March 13, 2008, a Dutch Court of Appeal held a hearing to review the correctness of the trial court’s decision. The Court of Appeal released its judgment on January 27, 2009, ruling against SMT (finding our patent novel, inventive, and sufficiently disclosed). The Court of Appeal however requested amendment of claim 12 before rendering its decision on infringement. We have filed a response to the Court of Appeal’s decision, and have additionally filed a further writ against SMT seeking to prevent SMT from, among other things, using its CE mark for SMT’s Infinnium stent. Any decision of the Court of Appeal is appealable to the Supreme Court of the Netherlands. On October 22, 2009 we and BSC settled this litigation with SMT on favorable terms. We have continued this matter before the Court of Appeal with respect to the requested amendment to claim 12. A hearing is scheduled for April 22, 2010. |
| ii) |
On March 23, 2006, RoundTable Healthcare Partners, LP (“RoundTable”) as the Seller’s Representative, we as Buyer, and LaSalle Bank (“LaSalle”) as Escrow Agent, executed an Escrow Agreement under which we deposited $20 million with LaSalle. On April 4, 2007, LaSalle received an Escrow Claim Notice issued by us, which directed LaSalle to remit the $20 million to us as Buyer. On or about April 16, 2007, LaSalle received from RoundTable a Notice of Objection to our Escrow Claim Notice. On July 3, 2007, LaSalle filed an action in the Circuit Court of Cook County, Illinois, asking the court to resolve this dispute. After various hearings and discussions, we executed a Joint Letter of Direction allowing the release of $6.5 million to RoundTable, thereby leaving the amount in dispute being approximately $13.5 million. On March 21, 2008, this action was moved to the United States District Court for the Southern District of New York. This dispute was settled in January 2010. As a result of the settlement, all legal proceedings were dismissed and we received approximately $4.7 million from the escrow account. |
| iii) |
In July 2004, Dr. Gregory Baran initiated legal action, alleging infringement by Medical Device Technologies Inc. (“MDT”) of two U.S. patents owned by Dr. Baran. These patents allegedly cover MDT’s BioPince™ automated biopsy device. On September 25, 2007, the judge issued her decision pursuant to the Markman hearing of December 2005. We submitted a Motion for Summary Judgment to the court based upon the Markman decision and on September 30, 2009, the judge ruled in our favor, finding that the BioPince did not infringe a key claim of Dr. Baran’s patents. Dr. Baran has appealed this decision. |
| iv) |
At the EPO, various patents either owned or licensed by or to the Company are in opposition proceedings including the following: |
| • |
In EP0784490, an oral hearing took place on October 1, 2009, and the patent with amendments was maintained by the EPO. |
| • |
In EP0809515 (which is licensed from (and to) BSC), the EPO held an oral hearing on January 30, 2008 and thereafter revoked this patent. An appeal was filed on April 22, 2008. On June 25, 2009 the EPO issued a notice stating that the decision under appeal was set aside and the patent would be remitted to the First Instance for further prosecution. |
| • |
In EP0830110 (which is licensed from Edwards LifeSciences Corporation) an amended form of this patent was found valid after an oral hearing on September 28, 2006; however, the opponent |
37
Table of Contents
| appealed the decision on December 21, 2006. An oral hearing took place on September 9, 2009, and the EPO cancelled the appeal proceedings and maintained the patent in the same form as allowed by the Opposition Division. |
| • |
In EP1155689, no hearing date has yet been set by the EPO. |
| • |
In EP1407786 (which is licensed from (and to) BSC), the patent was revoked in a decision from the EPO on December 9, 2008. An appeal was filed on January 30, 2009. An appeal was also filed on behalf of the opponent on April 8, 2009. On September 1, 2009, a request to withdraw appeal was filed. On October 1, 2009, the appeal proceedings were terminated and the decision to revoke the patent was made final by the EPO. |
| • |
In EP1429664, an oral hearing had been scheduled for May 27, 2009; however, the oral hearing was canceled by the EPO on May 14, 2009. On September 14, 2009, the EPO terminated the appeal proceedings and maintained the patent. |
| • |
In EP1159974, the EPO has scheduled oral proceedings for June 9, 2010. |
| • |
In EP1159975, a Notice of Opposition was filed on June 5, 2009. Angiotech has until March 21, 2010 to file a response. |
| • |
In EP0876165, the EPO revoked the patent as an outcome of an oral hearing held on June 24, 2009. On August 20, 2009, a Notice of Appeal was filed. |
| • |
In EP0991359, a Notice of Opposition was filed. Angiotech filed a response on September 8, 2009. No hearing date has yet been set by the EPO. |
| RESERVED |
38
Table of Contents
| MARKET FOR REGISTRANT’S COMMON EQUITY, RELATED STOCKHOLDER MATTERS AND ISSUER PURCHASES OF EQUITY SECURITIES |
Trading Price and Volume
Our common shares are publicly traded on the Toronto Stock Exchange under the trading symbol “ANP” and on the NASDAQ Global Select Market under the trading symbol “ANPI”. The following table summarizes the high and low prices for our common shares during 2009 and 2008 on a quarterly basis. The prices listed below are in Canadian dollars for trading on the Toronto Stock Exchange and in U.S dollars for trading on the NASDAQ Global Select Market.
| Quarter |
Canadian Dollars (TSX) |
U.S. Dollars (NASDAQ) | ||||||||||
| 2009: |
High | Low | High | Low | ||||||||
| Q1 |
$ | 0.68 | $ | 0.33 | $ | 0.56 | $ | 0.26 | ||||
| Q2 |
3.10 | 0.55 | 2.94 | 0.44 | ||||||||
| Q3 |
2.41 | 1.39 | 2.17 | 1.20 | ||||||||
| Q4 |
1.88 | 1.27 | 1.77 | 1.20 | ||||||||
| Quarter |
Canadian Dollars (TSX) |
U.S. Dollars (NASDAQ) | ||||||||||
| 2008: |
High | Low | High | Low | ||||||||
| Q1 |
$ | 3.68 | $ | 1.50 | $ | 3.68 | $ | 1.50 | ||||
| Q2 |
3.55 | 2.07 | 3.49 | 2.10 | ||||||||
| Q3 |
3.10 | 0.55 | 3.10 | 0.53 | ||||||||
| Q4 |
0.88 | 0.11 | 0.79 | 0.10 | ||||||||
39
Table of Contents
Comparative Shareholder Return Performance Graph
The following graph compares cumulative total Shareholder return on $100 invested in Common shares of the Company on December 31, 2004 with the cumulative total return of the S&P/TSX Composite Index (“S&P/TSX”) and the NASDAQ Biotechnology Index, assuming the re-investment of dividends. The Common shares began trading on the TSX on December 18, 1997.
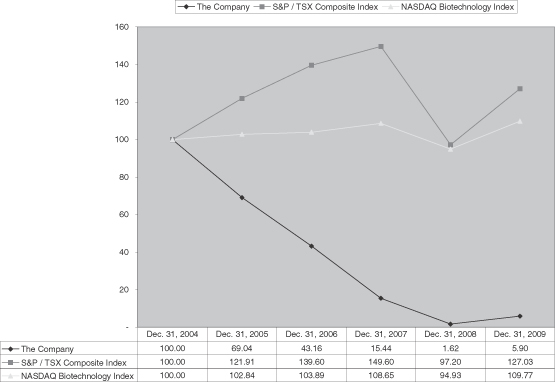
Based on information provided by our transfer agent, as of March 8, 2010, we had 498 shareholders of record. We believe we have approximately 18,800 beneficial owners of our common shares in total. This belief is based on the preliminary search for beneficial holders conducted in order to estimate the number of proxy statements and annual reports required by intermediaries for our 2010 Annual General Meeting.
Dividend Policy
We have not declared or paid any dividends on our common shares since inception. The declaration of dividend payments is at the sole discretion of our Board of Directors. The Board of Directors may declare dividends in the future depending upon numerous factors that ordinarily affect dividend policy, including the results of our operations, our financial position and general business conditions.
40
Table of Contents
Securities Authorized for Issuance under Equity Compensation Plan
The following table provides information as of December 31, 2009 with respect to the shares of the Company’s common stock that may be issued under existing equity compensation plans:
| Plan Category |
(a) Number of securities to be issued upon exercise of outstanding options, warrants and rights |
(b) Weighted average of exercise price of outstanding options, warrants and rights |
(c) Number of securities remaining available for future issuance under equity compensation plans (excluding securities reflected in column (a)) | ||||
| Common shares, without par value, pursuant to the Angiotech Pharmaceuticals Inc. 2006 Stock Incentive Plan |
8,156,457 | $ | 4.23 | 5,294,888 | |||
| Common shares, without par value, pursuant to the American Medical Instruments Holdings Inc. 2003 Stock Option Plan |
300,480 | $ | 15.44 | Nil | |||
Sale of Unregistered Securities Within the Past Twelve Months
None.
Purchases of Equity Securities by the Company and its Affiliates Made in the Fourth Quarter
None.
41
Table of Contents
| SELECTED FINANCIAL DATA |
The following table sets forth selected consolidated financial information for each of our five most recently completed financial years. This data should be read in conjunction with our Management’s Discussion and Analysis of Financial Condition and Results of Operations, the audited consolidated financial statements, including the notes to the financial statements, and the risk factors set out in this Annual Report on Form 10-K.
CONSOLIDATED STATEMENTS OF INCOME
| (in thousands of U.S. $) |
Year ended December 31, 2009 |
Year ended December 31, 2008 |
Year ended December 31, 2007 |
Year ended December 31, 2006 |
Year ended December 31, 2005 |
|||||||||||||||
| REVENUE |
||||||||||||||||||||
| Product sales, net (1) |
$ | 191,951 | $ | 190,816 | $ | 170,193 | $ | 138,590 | $ | 5,334 | ||||||||||
| Royalty revenue |
62,171 | 91,546 | 116,659 | 175,254 | 189,203 | |||||||||||||||
| License fees (2) |
25,556 | 910 | 842 | 1,231 | 5,111 | |||||||||||||||
| 279,678 | 283,272 | 287,694 | 315,075 | 199,648 | ||||||||||||||||
| EXPENSES |
||||||||||||||||||||
| License and royalty fees |
10,431 | 14,258 | 18,652 | 25,986 | 28,345 | |||||||||||||||
| Cost of products sold |
104,616 | 101,052 | 94,949 | 69,543 | 5,653 | |||||||||||||||
| Research and development |
23,701 | 53,192 | 53,963 | 45,393 | 31,988 | |||||||||||||||
| Selling, general and administration |
81,504 | 98,483 | 99,315 | 78,933 | 37,837 | |||||||||||||||
| Depreciation and amortization |
33,251 | 33,998 | 33,429 | 36,014 | 9,540 | |||||||||||||||
| In-process research and development |
— | 2,500 | 8,125 | 1,042 | 54,957 | |||||||||||||||
| Write-down of assets held for sale (3) |
3,090 | 1,283 | — | — | — | |||||||||||||||
| Write-down of goodwill (4) |
— | 649,685 | — | — | — | |||||||||||||||
| 256,593 | 954,451 | 308,433 | 256,911 | 168,320 | ||||||||||||||||
| Operating income (loss) |
23,085 | (671,179 | ) | (20,739 | ) | 58,164 | 31,328 | |||||||||||||
| Other (expenses) income: |
||||||||||||||||||||
| Foreign exchange (loss) gain |
(1,612 | ) | 540 | (341 | ) | 515 | 1,092 | |||||||||||||
| Investment and other income |
378 | 1,192 | 10,393 | 6,235 | 10,006 | |||||||||||||||
| Interest expense on long-term debt |
(38,039 | ) | (44,490 | ) | (51,748 | ) | (35,502 | ) | — | |||||||||||
| Write-down and other deferred financing charges (5) |
(643 | ) | (16,544 | ) | — | (9,297 | ) | — | ||||||||||||
| Write-down / loss on redemption of investments (6) |
— | (23,587 | ) | (8,157 | ) | — | (5,967 | ) | ||||||||||||
| Total other (expenses) income |
(39,916 | ) | (82,889 | ) | (49,853 | ) | (38,049 | ) | 5,131 | |||||||||||
| (Loss) income from continuing operations before income taxes and cumulative effect of change in accounting policy |
(16,831 | ) | (754,068 | ) | (70,592 | ) | 20,115 | 36,459 | ||||||||||||
| Income tax (recovery) expense |
6,037 | (12,892 | ) | (14,545 | ) | 2,092 | 28,055 | |||||||||||||
| (Loss) income from continuing operations before cumulative effect of change in accounting policy |
(22,868 | ) | (741,176 | ) | (56,047 | ) | 18,023 | 8,404 | ||||||||||||
| Loss from discontinued operations, net of income taxes (7) |
— | — | (9,893 | ) | (7,708 | ) | (9,591 | ) | ||||||||||||
| Cumulative effect of change in accounting policy |
— | — | — | 399 | — | |||||||||||||||
| Net (loss) income |
(22,868 | ) | $ | (741,176 | ) | $ | (65,940 | ) | $ | 10,714 | $ | (1,187 | ) | |||||||
| Basic net income (loss) per common share: |
||||||||||||||||||||
| Continuing operations |
$ | (0.27 | ) | $ | (8.71 | ) | $ | (0.66 | ) | $ | 0.21 | $ | 0.10 | |||||||
| Discontinued operations |
— | — | (0.12 | ) | (0.09 | ) | (0.11 | ) | ||||||||||||
| Total |
$ | (0.27 | ) | $ | (8.71 | ) | $ | (0.78 | ) | $ | 0.12 | $ | (0.01 | ) | ||||||
| Diluted net income (loss) per common share: |
||||||||||||||||||||
| Continuing operations |
$ | (0.27 | ) | $ | (8.71 | ) | $ | (0.66 | ) | $ | 0.21 | $ | 0.10 | |||||||
| Discontinued operations |
— | — | (0.12 | ) | (0.09 | ) | (0.11 | ) | ||||||||||||
| Total |
$ | (0.27 | ) | $ | (8.71 | ) | $ | (0.78 | ) | $ | 0.12 | $ | (0.01 | ) | ||||||
| Basic weighted average number of common shares outstanding (in thousands) |
85,130 | 85,118 | 85,015 | 84,752 | 84,121 | |||||||||||||||
| Diluted weighted average number of common shares outstanding (in thousands) |
85,130 | 85,118 | 85,015 | 85,437 | 85,724 | |||||||||||||||
42
Table of Contents
BALANCE SHEET INFORMATION
| As at |
December 31, | |||||||||||||||||||
| (in thousands of U.S.$) |
2009 | 2008 | 2007 | 2006 | 2005 | |||||||||||||||
| Cash, cash equivalents and short-term investments |
$ | 57,322 | $ | 39,800 | $ | 91,326 | $ | 108,617 | $ | 195,442 | ||||||||||
| Working capital |
66,512 | 51,767 | 97,745 | 115,892 | 181,317 | |||||||||||||||
| Total assets |
370,059 | 385,197 | 1,150,108 | 1,224,624 | 494,694 | |||||||||||||||
| Total long-term obligations |
620,160 | 623,655 | 645,096 | 658,366 | 4,459 | |||||||||||||||
| Deficit |
(866,541 | ) | (843,673 | ) | (102,497 | ) | (34,893 | ) | (45,607 | ) | ||||||||||
| Total shareholders’ (deficit) equity |
(313,287 | ) | (299,873 | ) | 442,072 | 498,692 | 462,680 | |||||||||||||
QUARTERLY RESULTS
The following tables present our unaudited consolidated quarterly results of operations for each of our last eight quarters:
| Quarter ended | |||||||||||||||
| (in thousands of U.S.$, except per share data) |
December 31, 2009 |
September 30, 2009 |
June 30, 2009 |
March 31, 2009 | |||||||||||
| Revenue |
|||||||||||||||
| Product sales |
$ | 49,976 | $ | 48,660 | $ | 47,179 | $ | 46,136 | |||||||
| Royalty and license revenue |
13,585 | 14,584 | 17,394 | 42,164 | |||||||||||
| Total revenues |
63,561 | 63,244 | $ | 64,573 | 88,300 | ||||||||||
| Gross Margin: |
|||||||||||||||
| Medical Products |
20,965 | 22,702 | 21,497 | 22,170 | |||||||||||
| Pharmaceutical Technologies |
11,091 | 12,121 | 14,826 | 39,259 | |||||||||||
| Total Gross Margin |
32,056 | 34,823 | 36,323 | 61,429 | |||||||||||
| Operating (loss) income |
(8,016 | ) | 4,018 | (412 | ) | 27,495 | |||||||||
| Net (loss) income |
$ | (15,633 | ) | $ | (7,802 | ) | $ | (11,877 | ) | $ | 12,444 | ||||
| Basic (loss) income per share |
$ | (0.18 | ) | $ | (0.09 | ) | $ | (0.14 | ) | $ | 0.15 | ||||
| Diluted loss per share |
$ | (0.18 | ) | $ | (0.09 | ) | $ | (0.14 | ) | $ | 0.14 | ||||
| Quarter ended | ||||||||||||||||
| (in thousands of U.S.$, except per share data) |
December 31, 2008 |
September 30, 2008 |
June 30, 2008 |
March 31, 2008 |
||||||||||||
| Revenue |
||||||||||||||||
| Product sales |
$ | 46,054 | $ | 46,502 | $ | 50,533 | $ | 47,727 | ||||||||
| Royalty and license revenue |
16,027 | 21,858 | 25,589 | 28,982 | ||||||||||||
| Total revenues |
62,081 | 68,360 | 76,122 | 76,709 | ||||||||||||
| Gross Margin: |
||||||||||||||||
| Medical Products |
22,432 | 21,730 | 23,724 | 21,878 | ||||||||||||
| Pharmaceutical Technologies |
13,253 | 18,406 | 21,928 | 24,611 | ||||||||||||
| Total Gross Margin |
35,685 | 40,136 | 45,652 | 46,489 | ||||||||||||
| Operating loss |
(53,407 | ) | (601,852 | ) | (7,284 | ) | (8,636 | ) | ||||||||
| Net loss |
$ | (76,964 | ) | $ | (622,378 | ) | $ | (26,071 | ) | $ | (15,763 | ) | ||||
| Basic and diluted loss per share |
$ | (0.90 | ) | $ | (7.31 | ) | $ | (0.31 | ) | $ | (0.19 | ) | ||||
| 1) |
In the second quarter of 2007, we recorded a credit of $2.6 million against our product sales related to our decision to accept returns of Contour Threads brands as part of our consolidation and discontinuation of the Contour Threads brands, which was concurrent with our launch of our Quill SRS brands. |
| 2) |
In the first quarter of 2009, we received a one-time up-front payment of $25.0 million from Baxter International Inc. under the terms of an Amended and Restated Distribution and License Agreement. The payment was received in lieu and settlement of future royalty and milestone obligations relating to existing formulations of CoSeal and any future products. |
| 3) |
In the fourth quarter of 2008, we recorded an impairment charge of $1.3 million on two properties we intended to sell and reclassified these properties and one other as available for sale. In the fourth quarter of 2009, we conducted our |
43
Table of Contents
| annual impairment test on long-lived assets and recorded a further impairment charge of $3.1 million on two properties which were classified as held for sale. |
| 4) |
At the end of the third quarter of 2008, we wrote-down our goodwill carrying value associated with our Medical Products segment by $599.4 million. The remaining balance of $26.8 million was subsequently written off in the fourth quarter of 2008. We also determined that the goodwill associated with our Pharmaceuticals Technology segment was impaired as at December 31, 2008 and accordingly, wrote off the remaining balance of $23.5 million. As a result, our goodwill balance for the Medical Products and Pharmaceutical Technology segments was nil as at December 31, 2008 and 2009. |
| 5) |
In connection with the early termination of the term loan portion of our credit facility with Wells Fargo Foothill, LLC in the second quarter of 2009, we wrote off $0.6 million of deferred financing charges. In the third quarter of 2008, we expensed deferred financing charges of $13.5 million related to the suspension of the note purchase agreement. A further $3.0 million was expensed in the fourth quarter of 2008 related to this matter. In 2006, we repaid a credit facility of $425 million and expensed the unamortized balance of the deferred financing charges related to this facility. |
| 6) |
In 2008, we wrote-down and realized a loss on investments of $10.7 million, $1.9 million and $11.0 million in the second, third and fourth quarters, respectively. In 2007, we wrote-down and realized a loss on investments of $8.2 million in the first quarter. |
| 7) |
In the fourth quarter of 2006, we recorded an impairment charge of $7.7 million related to our decision to discontinue the operations of the following subsidiaries: American Medical Instruments Inc. (“AMI”) (Dartmouth), Point Technologies, Inc and Point Technologies SA. In the first quarter of 2007, we recorded a further impairment of $8.9 million related to the discontinuance of these operations. |
On March 23, 2006, the Company completed the acquisition of 100% of the outstanding shares of privately held AMI, a leading independent manufacturer of specialty, single use medical devices.
44
Table of Contents
| MANAGEMENT’S DISCUSSION AND ANALYSIS OF FINANCIAL CONDITION AND RESULTS OF OPERATIONS |
ANGIOTECH PHARMACEUTICALS, INC.
For the year ended December 31, 2009
(All amounts following are expressed in U.S. dollars unless otherwise indicated.)
The following management’s discussion and analysis (“MD&A”), dated December 31, 2009, should be read in conjunction with our audited consolidated financial statements for the year ended December 31, 2009 prepared in accordance with United States generally accepted accounting principles (“U.S. GAAP”) and the applicable rules and regulations of the U.S. Securities and Exchange Commission (“SEC”) for the presentation of annual financial information. Additional information relating to our company is available by accessing the SEDAR website at www.sedar.com or the SEC’s EDGAR website at www.sec.gov/edgar.shtml.
Forward-Looking Statements and Cautionary Factors That May Affect Future Results
Statements contained in this Annual Report on Form 10-K that are not based on historical fact, including without limitation statements containing the words “believes,” “may,” “plans,” “will,” “estimates,” “continues,” “anticipates,” “intends,” “expects” and similar expressions, constitute “forward-looking statements” within the meaning of the Private Securities Litigation Reform Act of 1995 and constitute “forward-looking information” within the meaning of applicable Canadian securities laws. All such statements are made pursuant to the “safe harbor” provisions of applicable securities legislation. Forward-looking statements may involve, but are not limited to, comments with respect to our objectives and priorities for 2010 and beyond, our strategies or future actions, our targets, expectations for our financial condition and the results of, or outlook for, our operations, research and development and product and drug development. Such forward-looking statements involve known and unknown risks, uncertainties and other factors that may cause the actual results, events or developments to be materially different from any future results, events or developments expressed or implied by such forward-looking statements.
Many such known risks, uncertainties and other factors are taken into account as part of our assumptions underlying these forward-looking statements and include, among others, the following: general economic and business conditions in the U.S., Canada and the other regions in which we operate; market demand; technological changes that could impact our existing products or our ability to develop and commercialize future products; competition; existing governmental legislation and regulations and changes in, or the failure to comply with, governmental legislation and regulations; availability of financial reimbursement coverage from governmental and third-party payers for products and related treatments; adverse results or unexpected delays in pre-clinical and clinical product development processes; adverse findings related to the safety and/or efficacy of our products or products sold by our partners; decisions, and the timing of decisions, made by health regulatory agencies regarding approval of our technology and products; the requirement for substantial funding to conduct research and development, to expand manufacturing and commercialization activities; and any other factors that may affect our performance.
In addition, our business is subject to certain operating risks that may cause any results expressed or implied by the forward-looking statements in this Annual Report on Form 10-K to differ materially from our actual results. These operating risks include: our ability to attract and retain qualified personnel; our ability to successfully complete pre-clinical and clinical development of our products; changes in our business strategy or development plans; our failure to obtain patent protection for discoveries; loss of patent protection resulting from third-party challenges to our patents; commercialization limitations imposed by patents owned or controlled by third parties; our ability to obtain rights to technology from licensors; liability for patent claims and other claims asserted
45
Table of Contents
against us; our ability to obtain and enforce timely patent and other intellectual property protection for our technology and products; the ability to enter into, and to maintain, corporate alliances relating to the development and commercialization of our technology and products; market acceptance of our technology and products; our ability to successfully manufacture, market and sell our products; the availability of capital to finance our activities; our ability to restructure and to service our debt obligations; and any other factors referenced in our other filings with the applicable Canadian securities regulatory authorities or the SEC.
For a more thorough discussion of the risks associated with our business, see the section entitled “Risk Factors” in this Annual Report on Form 10-K.
Given these uncertainties, assumptions and risk factors, investors are cautioned not to place undue reliance on such forward-looking statements. Except as required by law, we disclaim any obligation to update any such factors or to publicly announce the result of any revisions to any of the forward-looking statements contained in this Annual Report on Form 10-K to reflect future results, events or developments.
This Annual Report on Form 10-K contains forward-looking information that constitutes “financial outlooks” within the meaning of applicable Canadian securities laws. We have provided this information to give shareholders general guidance on management’s current expectations of certain factors affecting our business, including our future financial results. Given the uncertainties, assumptions and risk factors associated with this type of information, including those described above, investors are cautioned that the information may not be appropriate for other purposes.
Business Overview
We are a specialty pharmaceutical and medical device company that discovers, develops and markets innovative technologies primarily focused on acute and surgical applications. We generate our revenue through our sales of medical products and components, as well as from royalties derived from sales by our partners of products utilizing certain of our proprietary technologies. For the year ended December 31, 2009, we recorded $192.0 million in direct sales of our various medical products and $87.7 million in royalties and license fees received from our partners.
Our research and development efforts focus on understanding and characterizing biological conditions that often occur concurrent with medical device implantation, surgery or acute trauma, including scar formation and inflammation, cell proliferation, bleeding and coagulation, infection and tumor tissue overgrowth. Our strategy is to utilize our various technologies in the areas of drugs, drug delivery, surface modification, biomaterials and medical devices to create and commercialize novel, proprietary medical products that reduce surgical procedure side effects, improve surgical outcomes, shorten hospital stays, or are easier or safer for a physician to use.
We develop our products using a proprietary and systematic discovery approach. We use our drug screening and medical engineering capabilities to identify new uses for known pharmaceutical compounds or opportunities for novel medical products. In our drug screening process, we look for compounds that address the underlying biological causes of conditions that can occur with medical device implantation, surgery or acute trauma. Once appropriate opportunities have been identified, we work to formulate a drug, or a combination of drugs, with our portfolio of drug, drug delivery and surface modification technologies and biomaterials, or reengineer or surface modify selected materials, to develop a novel surgical implant or medical device. We have patent protected, or have filed patent applications for, certain of our technology and many of our products and potential product candidates.
We currently operate in two segments: Pharmaceutical Technologies and Medical Products.
Pharmaceutical Technologies
Our Pharmaceutical Technologies segment focuses primarily on establishing product development and marketing collaborations with major medical device, pharmaceutical or biomaterials companies, and to date has derived the
46
Table of Contents
majority of its revenue from royalties due from partners that develop, market and sell products incorporating our technologies. Our principal revenues in this segment have been royalties derived from sales by Boston Scientific Corporation (“BSC”) of TAXUS® coronary stent systems incorporating the drug paclitaxel.
Medical Products
Our Medical Products segment manufactures and markets a wide range of single-use specialty medical products, primarily medical device products and medical device components. These products are sold directly to end users or other third-party medical device manufacturers. This segment contains two specialized direct sales and distribution organizations as well as significant manufacturing capabilities. Many of our medical products are made using our proprietary manufacturing processes or are protected by our intellectual property.
Proprietary Medical Products. Certain of our product lines, which we refer to as our Proprietary Medical Products, are marketed and sold by our two direct sales groups. We believe certain of these product lines contain technology advantages that have the potential for more substantial revenue growth as compared to our overall product portfolio. Our most significant commercial Proprietary Medical Products include our Quill™ SRS wound closure product line, SKATER™ line of drainage catheters, Option™ Inferior Vena Cava Filter (“Option IVC Filter”), HemoStream™ dialysis catheter, and BioPince™ full core biopsy device.
Base Medical Products. Certain of our product lines, which we refer to as our Base Medical Products, represent more mature finished goods product lines in the ophthalmology, biopsy and general surgery areas, and medical device components manufactured by us and sold to other third-party medical device manufacturers who assemble those components into finished medical devices. Sales of our Base Medical Products are supported by a small group of direct sales personnel, as well as a network of independent sales representatives and medical product distributors. These sales tend to exhibit greater volatility or slower growth when compared to sales of our Proprietary Medical Products. This is particularly the case with our sales of components to third-party medical device manufacturers, which may be impacted by customer concentration and the business issues that certain of our large customers may face, as well as to a more limited extent by economic and credit market conditions.
Financial and Strategic Alternatives Process. Over the last three years, revenue in our Pharmaceutical Technologies segment has declined significantly, primarily due to lower royalties derived from sales by BSC of TAXUS coronary stent systems. This decline in royalty revenue has negatively and materially impacted our liquidity and results of operations. As a result of this and other factors impacting our business and the capital markets, our management and Board of Directors have been pursuing a transaction or transactions of significant size and scope to meaningfully address liquidity concerns and the working capital needs of our business since 2007. As part of this continuing process, in 2009 we entered into a credit facility for interim senior secured financing for working capital and liquidity purposes, filed a shelf registration statement in the U.S., and filed a corresponding short form base shelf prospectus in British Columbia and Ontario, (as described in more detail below) to allow us to more quickly access the public markets if we determined that attractive financing was available.
Significant Recent Developments
Shelf Registration Statement on Form S-3. On July 23, 2009, we announced that we had filed a shelf registration statement on Form S-3 with the SEC and a corresponding preliminary short form base shelf prospectus with the securities commissions of British Columbia and Ontario. On December 7, 2009, the shelf registration statement on Form S- 3 (as amended by Amendment No.1 on Form S-3/A) was declared effective by the SEC and we filed a final short form base shelf prospectus with the securities commissions of British Columbia and Ontario (collectively, the “Offering Documents”). The Offering Documents allow us to offer Common shares, Class I Preference shares, debt securities, warrants or units for initial aggregate proceeds of up to $250.0 million to potential purchasers in the U.S., British Columbia and Ontario.
47
Table of Contents
Quill SRS. In August 2009, we announced the launch of a series of proprietary Quill SRS products designed for wound closure procedures in laparoscopic, or minimally invasive, gynecology procedures, including hysterectomies and myomectomies. In 2008, there were approximately 750,000 hysterectomies performed in the U.S. of which approximately 130,000 were performed laparoscopically. In addition, there were approximately 72,000 myomectomies performed in the U.S. to remove uterine fibroid tumors. Our proprietary Quill SRS technology may offer significant advantages in wound closure in certain laparoscopic surgical procedures, whether performed manually by surgeons or through robotic assistance. We believe the primary advantage of Quill SRS in laparoscopic procedures is the ability to use Quill SRS to close a wound without having to tie knots. The exercise of tying knots can be particularly challenging and time-consuming when surgeons operate in a smaller surgical field, as is the case for most laparoscopic surgical procedures. A second potential advantage of Quill SRS in these procedures is minimizing or eliminating the need for a third hand to maintain tension on the suture in order to deal with tissue recoil, as may be required with a traditional suturing technique. A third potential advantage of Quill SRS in these procedures is the ability of Quill SRS to maintain the tension along the length of the wound, which may provide hemostatic benefits and thereby eliminate or minimize the need for standard hemostatic sutures. Patients may also benefit as a result of these potential advantages through reduced surgical times, and therefore reduced time under anesthesia, and health care facilities and payors may also benefit from the potential to reduce operating room time needed, or the total cost of material needed, to complete such surgical procedures.
Our Quill SRS products for laparoscopic gynecology procedures are available in our polydioxanone (PDO) suture material in size -0- with 7 cm by 7 cm and 14 cm by 14 cm lengths, and include our newly designed 36 mm needles. The use of Quill SRS in laparoscopic gynecological surgery was first reported by James Greenberg, MD, and Jon Einarsson, MD, MPH, of the Centre for Women’s Surgery at Brigham & Women’s/Faulkner Hospitals and Harvard Medical School Boston, Massachusetts in the Journal of Minimally Invasive Gynecology, in November 2008. The results of this small feasibility study looked at the application of Quill SRS in myomectomy and total laparoscopic hysterectomy vaginal cuff closures. This publication was then followed by a podium presentation at the American Association of Gynecologic Laparoscopists (AAGL) annual meeting in the fall of 2008 confirming that there were no post operative issues or complications from the use of Quill SRS in these procedures in a patient series that had grown to 150 patients reviewed to that date.
Option Inferior Vena Cava Filter. In June 2009, we announced that the U.S. Food and Drug Administration (“FDA”) had granted 510(k) clearance for the Option IVC Filter, for use in both permanent and retrievable indications. In August 2009, we announced the commercial launch of the Option IVC Filter in the U.S.
IVC filters are implanted in patients that are at high risk for developing pulmonary embolism, which can be a life threatening condition. IVC filters are implanted in the inferior vena cava and are designed to catch clot material to prevent it from reaching the lungs, while allowing blood to continue to flow normally. Patients at high risk for pulmonary embolism are typically patients undergoing a significant surgical procedure, trauma patients or patients that have experienced a previous embolic event. IVC filters have been shown in several studies to significantly reduce the risk of pulmonary embolism and related mortality in certain high risk patient populations. In certain cases, once the risk of an embolic event has passed, the IVC filter will be removed in a subsequent surgical procedure. In 2009, there were approximately 205,000 IVC filters implanted in the U.S.
We believe the Option IVC Filter may have a number of potential competitive benefits, which include a unique filter design that may reduce the potential for filter migration after implantation, thereby making the product safer for patients insertion potential through either the femoral or jugular route, which may make the product easier for a physician to use and the use of non-thrombogenic material, which may reduce the risk of blood clots occurring in the filter. We also believe the unique design of the Option IVC Filter may allow physicians to remove or retrieve the device from patients more easily, or after longer periods of time have passed, as compared to existing competitive IVC filters.
The Option IVC Filter was approved based upon the results of a U.S. multi-center prospective clinical trial. The purpose of the clinical trial was to evaluate the device’s safety and efficacy in preventing pulmonary emboli and
48
Table of Contents
to assess the ability to retrieve the device from the body up to 175 days following implantation. The results, representing a total of 100 patients, were presented at the 2009 Society of Interventional Radiology conference in San Diego, CA in March 2009. Successful filter implantation was achieved in 100% of the subjects and the retrieval success rate in the study was 92.3%. Clinical success, which was achieved in 88% of subjects, was defined as placement of the filter without subsequent pulmonary embolism, significant filter migration or embolization, symptomatic caval thrombosis or other complications requiring filter removal or invasive intervention.
The Option IVC Filter was licensed in March 2008 from our partner Rex Medical, L.P. (“Rex Medical”). We are obligated to pay royalties and milestone payments to Rex Medical derived from our sales of the Option IVC Filter. We made a milestone payment of $2.5 million to Rex Medical upon 510(k) clearance of the Option IVC Filter during 2009 and recorded the payment as an intangible asset. In addition, as of December 31, 2009 we have accrued $5.0 million related to sales-based milestone payments and recorded $4.5 million of these potential future payments as an intangible asset.
Zilver-PTX® CE Mark Approval. In August 2009, we announced that our partner Cook Medical Inc. (“Cook”) had reported CE Mark approval and commercial launch of the Zilver-PTX paclitaxel-eluting peripheral vascular stent in the European Union (“E.U.”). The Zilver-PTX stent, which is under evaluation in clinical trials being conducted by Cook, is a specialized stent product incorporating our proprietary paclitaxel technology and is designed for placement in diseased arteries in the limbs to restore blood flow. We license Cook the rights to use paclitaxel with peripheral stents and certain other non-coronary medical devices. Subject to the terms of our license agreement with Cook, we are entitled to receive royalty payments upon the commercial sale of paclitaxel-eluting peripheral vascular stent products, including the Zilver-PTX stent.
License, Distribution, Development and Supply Agreements with Haemacure Corporation. In June 2009, we announced that we had entered into license, distribution, development and supply agreements for fibrin and thrombin technologies with Haemacure Corporation (“Haemacure”). The collaboration provides us with access to technology for certain of our surgical product candidates that are currently in preclinical development. As part of this collaboration, we agreed to provide to Haemacure a senior secured bridge financing facility. The senior secured bridge loan provided up to $2.5 million of financing to Haemacure. The loan is senior to all of Haemacure’s existing and future indebtedness, subject to certain exceptions, bears interest at an annual rate of 10%, compounded quarterly, and has a term of two years. The senior secured bridge loan also has certain equity conversion features and rights to board representation upon conversion. As of December 31, 2009, all of the available $2.5 million of the loan had been drawn by Haemacure.
On January 11, 2010, Haemacure announced that on January 8, 2010 it had filed a notice of intention to make a proposal to its creditors under the Bankruptcy and Insolvency Act (Canada) and that its wholly-owned U.S. subsidiary sought court protection under Chapter 11 of the Bankruptcy Code in the U.S. Haemacure’s Board of Directors authorized these actions in light of Haemacure’s financial condition and inability to raise additional financing. We have agreed to provide up to a maximum amount of $1.0 million of additional financing, of which $0.8 million has been provided as of March 12, 2010 to fund Haemacure’s insolvency proceedings and day-to-day operations. The funds are being disbursed in accordance with a schedule agreed to by Haemacure and us. All funds loaned to Haemacure to date and in the future are secured by substantially all of their assets. We hope to exercise our security in the future to acquire Haemacure’s assets. As the bankruptcy proceedings in Canada and the U.S. are ongoing and the outcome cannot be determined, we have not yet completed our assessment of the potential accounting impact.
Bio-Seal™ Lung Biopsy Tract Plug System. In October 2009 we announced that we had received correspondence from the FDA regarding our 510(k) submission for Bio-Seal, stating that Bio-Seal is a class III device that requires Pre-Market Approval (“PMA”) for FDA marketing clearance in the U.S. As a result, we are reviewing our options with respect to this product candidate, including possibly appealing this FDA decision, and are discussing the possible preparation of a PMA submission with our partner, Biopsy Sciences, LLC. We have
49
Table of Contents
not incurred material expense to date with respect to activities regarding this product candidate. Should we elect to continue to pursue development or regulatory approvals for this product candidate that require us to incur material expense, we will provide further updates in our public disclosure.
Ongoing Clinical Programs
The following discussion describes our product candidates, or certain of our partners’ product candidates, that are being evaluated in ongoing human clinical trials and their stage of development:
Partner Clinical Programs
Independent TAXUS Clinical Data. In May 2009 we announced that BSC had disclosed the publication of an article in the Journal of the American College of Cardiology (“JACC”) reviewing data on more than 19,000 patients from the Swedish national registry who were evaluated for restenosis, or the re-narrowing of arteries, after percutaneous coronary intervention (“PCI”). The Swedish Coronary Angiography and Angioplasty Registry holds data on all patients undergoing PCI in Sweden. The objective of this independent study was to evaluate restenosis rates of drug-eluting stents (“DES”) in patients with and without diabetes in a real-world setting. The article reported that patients who received a TAXUS Liberté® paclitaxel-eluting stent had numerically lower incidences of repeat procedures to treat restenosis at two years as compared to patients treated with ‘olimus-based DES, including Johnson & Johnson, Inc.’s Cypher® stent and Medtronic Inc.’s Endeavor® stent.
In the patients with diabetes, the TAXUS Liberté demonstrated a statistically significant lower restenosis rate compared to the Endeavor, which had more than two times the risk of repeat procedures. The JACC article reported that both the TAXUS Liberté stent and BSC’s first-generation paclitaxel-eluting stent, the TAXUS Express®, were the only stents in the study showing no increased risk of restenosis for patients with diabetes as compared to those without diabetes. Data for both the Cypher and Endeavor stents indicated significant increased risk of restenosis in patients with diabetes. In addition, the study showed that the TAXUS Liberté had an approximately 23 percent lower restenosis rate at two years compared to the prior-generation TAXUS Express.
The Swedish registry study included four DES brands: TAXUS Liberté, TAXUS Express, Cypher and Endeavor. In total, the registry included 35,478 DES implants during 22,962 procedures in 19,004 patients, with 1,807 restenoses reported over a mean 29-month follow-up period. For the entire study population, the repeat revascularization rate per stent was 3.5 percent after one year and 4.9 percent after two years. Overall, the adjusted risk of restenosis was 1.23 times higher in patients with diabetes than in patients without diabetes. In patients with diabetes, restenosis was higher in the non-TAXUS stents. The sirolimus-eluting Cypher and the zotorolimus-eluting Endeavor had higher restenosis rates in patients with diabetes compared with those in patients without diabetes (1.25 times and 1.77 times, respectively).
TAXUS Element™ Paclitaxel-Eluting Coronary Stent System. The platinum chromium TAXUS Element pacitaxel-eluting coronary stent system is currently being evaluated by BSC in its PERSEUS clinical trial, which commenced in July 2007 and is designed for submission to the FDA in an application for approval to market and sell the TAXUS Element stent system in the U.S. The platinum chromium TAXUS Element paclitaxel-eluting coronary stent system is the third-generation BSC coronary stent platform that incorporates our research, technology and intellectual property related to the use of paclitaxel. The TAXUS Element stent features BSC’s proprietary platinum chromium alloy, which is designed to enable thinner stent struts, increased flexibility and a lower stent profile while improving radial strength, recoil and radiopacity. In addition, the TAXUS Element stent platform incorporates new balloon technology intended to improve upon BSC’s market-leading Maverick® balloon catheter technology.
On October 8, 2008, we announced that BSC had completed enrollment in the PERSEUS clinical trial and on March 15, 2010, we announced BSC’s results for this clinical trial. The PERSEUS clinical program compared the TAXUS Element stent to prior-generation stents in more than 1,600 patients in two parallel trials at 90 centers worldwide. This clinical program evaluated the safety and efficacy of the TAXUS Element stent in two
50
Table of Contents
studies. The first study evaluated the safety and efficacy of the TAXUS Element stent compared to the TAXUS Express2 stent in 1,264 patients with “workhorse” lesions from 2.75 to 4.0 mm. This prospective, randomized (3:1) trial met its primary endpoint of non-inferiority for target lesion failure (“TLF”) at 12 months with rates of 5.6 percent for the TAXUS Element Stent and 6.1 percent for the TAXUS Express2 stent. The secondary endpoint of in-segment percent diameter stenosis at nine months, as measured by quantitative coronary angiography, was also met. The second study compared the TAXUS Element stent to a historic control (TAXUS V de novo bare-metal Express coronary stent system) in 224 patients with lesions from 2.25 to 2.75 mm. The trial met its primary endpoint of superiority for in-stent late loss at nine months with unadjusted values of 0.38 mm for the TAXUS Element stent and 0.80 mm for the Express stent, which was statistically significant. The trial also met its secondary endpoint of superiority for TLF at 12 months, showing a reduction, which was statistically significant, with an unadjusted rate of 7.3 percent for the TAXUS Element stent compared to a pre-specified performance goal of 19.5 percent based on historical outcomes for the Express control stent.
In May 2009, we announced that our partner BSC had launched TAXUS Element in select markets worldwide. BSC is expected to launch the TAXUS Element in the E.U. in 2010 and in the U.S. in 2011.
TAXUS PETAL™ Bifurcation Paclitaxel-Eluting Coronary Stent System. The TAXUS PETAL bifurcation paclitaxel-eluting coronary stent system, which is under evaluation in clinical trials being conducted by BSC, represents a novel BSC coronary stent product candidate that incorporates our research, technology and intellectual property related to the use of paclitaxel. Conventional coronary stents were designed to treat tubular arteries, and are considered less than optimal for the y-shaped anatomy of a bifurcated area of the coronary arteries. The TAXUS PETAL is a specialized coronary stent designed to treat both the main branch and the side branch of a bifurcation by incorporating an innovative side structure (the PETAL strut) in the middle of the stent that opens into a side branch.
In July 2007 BSC initiated the TAXUS PETAL I First Human Use trial, which is expected to enroll a total of 45 patients in New Zealand, France and Germany. The trial is a non-randomized study with an initial assessment of acute performance and safety (including rates of death, myocardial infarction and target vessel revascularization) at 30 days and six months, with continued annual follow-up to occur for five years. Upon successful completion of this study, BSC has indicated that it intends to begin a pivotal trial which if successful would provide a basis for U.S. and international approvals for the commercialization of the TAXUS PETAL stent.
Zilver-PTX Paclitaxel-Eluting Peripheral Vascular Stent System. In August 2009, we announced that our partner Cook had reported CE Mark approval and commercial launch of the Zilver PTX stent in the E.U.
It is estimated that approximately 27 million people suffer from peripheral artery disease (“PAD”), in Europe and North America. Of patients with PAD, approximately only one quarter indicate any substantive symptoms. The “silent” nature of this condition can result in a number of patients being diagnosed only when their condition has progressed to the severe stage. In patients with severe PAD whose condition is not improving with risk-factor modification, exercise programs or pharmacological therapy, invasive surgical procedures may be necessary. These procedures may include angioplasty, stenting or surgery. To date, stent procedures for PAD in the limbs have been limited due to high observed rates of restenosis or other failure of the procedure requiring a subsequent surgical procedure, as well as risk of stent fracture with existing products, as these stents are exposed and not protected by the patient’s anatomy as with coronary stents.
Cook is a co-exclusive licensee, together with BSC, of our proprietary paclitaxel technology to reduce restenosis following stent placement in PAD. The Zilver PTX stent is designed to reduce restenosis following placement of a stent in PAD patients. The Zilver PTX stent is currently undergoing multiple human clinical trials in the U.S., Japan, the E.U. and selected other countries to assess product safety and efficacy.
In January 2007, Cook released nine-month data from its E.U. clinical study. The preliminary data presented by Cook on the first 60 patients in the randomized trial, which is examining the safety of using Cook’s Zilver PTX stent to treat blockages, or lesions, of the superficial femoral artery (“SFA”) above the knee, indicated that the
51
Table of Contents
Zilver PTX stent showed an equal adverse event rate to conventional angioplasty for treating SFA lesions. The Zilver PTX stent also displayed a zero percent fracture rate for 41 lesions at six months and 18 lesions at one year.
In July 2007, Cook announced that the first U.S. patients in a randomized pivotal human clinical trial of the Zilver PTX stent were treated at Tri-City Medical Center in Oceanside, CA. The trial is designed to randomize patients to receive either the Zilver PTX stent or balloon angioplasty. Data from this clinical trial is intended to be used to support submission to the FDA for approval in the U.S. to market the device. In addition, data collected on Japanese and U.S. patients is expected to be combined for the final evaluation of the device and used for regulatory submissions in both markets for approval.
In June 2008, Cook reported positive interim results from the registry arm of a clinical study designed to measure the efficacy of the Zilver PTX stent in treating PAD patients, specifically in the treatment of blockages in the femoropopliteal artery.
The data published in the Zilver PTX registry involved 791 patients from Europe, Russia, Canada and Korea demonstrated highly positive results. Only 8 percent of all patients with de novo (new) lesions required a reintervention to reopen the artery in the first 12 months — a rate significantly surpassing existing treatments for PAD in the SFA, such as balloon angioplasty and bare metal (non-drug-eluting) stents. In addition, specific patient groups that are often very hard to treat, such as diabetics and patients with in-stent restenosis (those treated previously with a noncoated stent), were shown in the trial to benefit from the Zilver PTX. As indicated by the trial data, the superior results achieved in the first year have been largely maintained throughout 24 months, which is an important clinical milestone. In comparison with other trial data obtained, the Zilver PTX stent demonstrated a reduction in reintervention of between 50 percent and 75 percent, which is an important patient benefit.
The results were reported by trial investigators at the 2008 SVS Vascular Annual Meeting, and revealed clinical improvement, excellent durability and fracture resistance, high rates of event-free survival (“EFS”) and freedom from target lesion revascularization (“TLR”). Interim data was compiled at six and 12 months using 435 patients and 200 patients, respectively. The corresponding EFS rates were 94% and 84%, and freedom from TLR was 96% and 88%. Evaluation of stent x-rays is ongoing, and currently suggests stent fractures in approximately one percent of cases at six months and less than two percent of cases at 12 months. In addition, the Zilver PTX stent exhibited no safety concerns and results were better than expected for Trans-Atlantic Inter-Society Consensus class C and D lesions, occlusions, in-stent restenosis and lesions greater than seven centimeters. Follow-up to the registry arm of the study will continue through two years.
In September 2008, Cook announced it had completed enrollment in its pivotal human clinical trial for the Zilver PTX. The 420 patients enrolled in Cook’s randomized trial include PAD patients treated in Germany, the U.S. and Japan. On the same date, Cook announced that it had enrolled an additional 780 patients in the E.U., Canada and Korea in a clinical registry to evaluate the safety of the Zilver PTX stent. Those data were used to obtain CE Mark approval in the E.U. and launch the device there, with additional regulatory submissions pending in additional markets.
In April 2009, we announced that Cook had reported data that showed that 82 percent of patients who were treated with Cook’s Zilver PTX stent were free from reintervention at two-year follow up. The Zilver PTX Registry study, involving 792 patients globally, is assessing the safety and efficacy of the Zilver PTX in treating peripheral artery disease. The most recent results were reported at the 31st International Symposium Charing Cross Controversies Challenges Consensus. Data was compiled at 12 and 24 months for 593 patients and 177 patients respectively. The registry, which enrolled a broad spectrum of patients, includes patients with complex lesions (e.g., long lesions, total occlusions, in-stent restenosis). The corresponding event-free survival rates were 87 percent and 78 percent, respectively, and freedom from target lesion revascularization was 89 percent and 82 percent, respectively. Clinical measures that included ankle-brachial index, Rutherford score, and walking distance and speed scores showed significant improvement at six and 12 months and were maintained through 24 months. Detailed evaluation of stent x-rays demonstrated excellent stent integrity through 12 months, confirming previously published results showing 99 percent completely intact stents (less than 1 percent stent fracture rates observed) with a mean follow up of 2.4 years in the challenging superior femoral artery and popliteal arteries, including behind the knee locations.
52
Table of Contents
Angiotech Clinical Programs
MultiStem® Stem Cell Therapy. The MultiStem stem cell therapy is under evaluation in clinical trials being conducted together with our partner Athersys, Inc. (“Athersys”) for the treatment of acute myocardial infarction. MultiStem stem cells are proprietary adult stem cells derived from bone marrow that have demonstrated the ability in laboratory experiments to form a wide range of cell types. MultiStem may work through several mechanisms, but a primary mechanism appears to be the production of multiple therapeutic molecules produced in response to inflammation and tissue damage. We and Athersys believe that MultiStem may represent a unique “off the shelf” stem cell product candidate, based on its potential ability to be used without tissue matching or immunosupression, and its potential capacity for large scale production. We entered into an agreement with Athersys in May 2006 to co-develop and commercialize MultiStem for use in the indications of acute myocardial infarction and peripheral vascular disease. On December 20, 2007, we and Athersys announced we had received authorization from the FDA to commence a phase I human clinical trial to evaluate the safety of MultiStem in the treatment of acute myocardial infarction.
In February 2010, Athersys announced that enrollment for the phase I clinical trial had been completed. Initial results of the clinical trial are expected to be announced by the second half of 2010. The phase I clinical trial is an open label, multi-center dose escalation trial evaluating the safety and maximum tolerated dose of a single administration of allogeneic MultiStem cells following an acute myocardial infarction. Following standard treatment, enrolled patients receive MultiStem delivered via a catheter that enables rapid and efficient delivery of MultiStem into the region of damage in the heart. The study is being conducted at multiple cardiovascular treatment centers in the United States, including the Cleveland Clinic, Columbia University Medical Center and Henry Ford Health System, and includes patients in three treatment cohorts or dose groups, as well as a non-treated registry group. In preclinical studies conducted by Athersys and independent cardiovascular research teams, administration of MultiStem following an ischemic injury to the heart has been associated with a number of benefits, including an increase in ejection fraction, or volume of blood pumped from the heart, a reduction of inflammation in the region of ischemic injury and increased angiogenesis, each believed to help augment recovery and healing.
Upon completion of the phase I human clinical trial which is currently being conducted by Athersys, we may, at our option, assume lead responsibility for further clinical development. We currently own marketing and commercialization rights with respect to this product candidate.
Completed or Suspended Clinical Programs
Bio-Seal Lung Biopsy Tract Plug System. Bio-Seal is a novel technology designed to prevent air leaks in patients having lung biopsies by plugging the biopsy track with an expanding hydrogel plug. On contact with moist tissue, the hydrogel plug absorbs fluids and expands to fill the void created by the biopsy needle puncture. The plug is absorbed into the body after healing of the puncture site has occurred. We are the worldwide manufacturer and distributor of Bio-Seal, which has received CE Mark approval and is currently marketed and sold in the E.U.
Bio-Seal has undergone a human clinical trial in the U.S. which was designed to assess the safety and efficacy of Bio-Seal, with the primary endpoint being reduction in rates of pneumothorax in patients undergoing lung biopsy procedures. The study was designed to provide a basis for FDA clearance for the commercialization of Bio-Seal. The prospective, randomized, controlled clinical trial enrolled and randomized 339 patients at 15 different investigational sites. Inspiratory upright chest x-rays were performed at 30 to 60 minutes, 24 hours and 30 days after treatment. The trial enrolled its first patient in October 2005 and completed enrollment in June 2008. In March 2009, we announced positive results from this clinical trial at the Society of Interventional Radiologists Annual Scientific Meeting in San Diego, CA. The trial demonstrated a statistically significant clinical benefit in the group receiving Bio-Seal. The Bio-Seal treatment arm hit the primary end point of clinical success for rate of absence of pneumothorax at each time period as compared to traditional treatment. Based on the per-protocol
53
Table of Contents
population, the clinical success rate was 85% using Bio-Seal and 69% in the control group. This difference was statistically significant (p=0.002). Although not powered for statistical analysis, positive trends were also observed for Bio-Seal subjects as compared to the control group in various secondary endpoints, including fewer Bio-Seal subjects admitted to the hospital for pneumothoraces (9.4% vs. 13.6%), fewer chest tube placements in Bio-Seal patients (3.5% vs. 10.7%), and fewer additional chest x-rays required in Bio-Seal patients (0.6% vs. 5.3%).
Data from this clinical trial was submitted to the FDA, with the objective of receiving 510(k) clearance to market Bio-Seal in the U.S. Subsequent to this submission, the FDA asked us various questions about the study and our submission and we responded to all of the questions from the FDA. In October 2009, we announced that we had received correspondence from the FDA regarding our 510(k) submission for Bio-Seal, stating the FDA’s view that Bio-Seal is a class III device that requires PMA for FDA marketing clearance. As a result, we are reviewing our options with respect to this product candidate, including possibly appealing this FDA decision, and we are discussing the possible preparation of a PMA submission with our partner, Biopsy Sciences, LLC. We have not incurred material expense to date with respect to activities regarding this product candidate. Should we elect to continue to pursue development or regulatory approvals for this product candidate that require us to incur material expense, we will provide further updates in our public disclosure.
5-FU-Eluting Central Venous Catheter. Central venous catheters (“CVC”) are usually inserted into critically ill patients for extended periods of time to administer fluids, drugs, and nutrition, as well as facilitate frequent blood draws. Through our proprietary drug identification strategy, we have elected to evaluate 5-Fluorouracil (“5-FU”), a drug previously approved by the FDA for treatment of various types of cancer, as a compound that may help to prevent certain types of infection in patients receiving a CVC. We recently completed a human clinical trial in the U.S. designed to assess the safety and efficacy of our 5-FU-eluting CVC in preventing various types of catheter related infections. The study was a randomized, single-blind, 960-patient, 25-center study and was designed to evaluate whether our 5-FU-eluting CVC prevents bacterial colonization at least as well as the market-leading anti-infective CVC. On July 10, 2007, we announced that we had completed enrollment of the study, and on October 9, 2007, we announced this study had met its primary statistical endpoint of non-inferiority as compared to the market leading anti-infective CVC (a chlorhexidine / silver sulfadiazine (CH-SS) coated CVC) and indicated an excellent safety profile. In March 2008, we presented the clinical trial data at the 28th International Symposium on Intensive Care and Emergency Medicine in Brussels, Belgium. Based on the clinical trial data, the investigators concluded that our 5-FU CVC met the primary endpoint of the study; specifically that our 5-FU CVC product candidate was non-inferior in its ability to prevent bacterial colonization of the catheter tip when compared to catheters coated with CH-SS. There were no statistically significant differences in the rate of adverse events related to the study devices, or in the rates of catheter-related bloodstream infections. Additionally, there was no evidence for acquired resistance to 5-FU in clinical isolates exposed to the drug for a second time. Based on the positive results achieved in the study, in December 2007 we filed a request for 510(k) clearance from the FDA to market and sell the CVC in the U.S. and on April 17, 2008, we announced that we had received 510(k) clearance from the FDA to market our 5-FU CVC in the U.S. We are currently developing potential launch plans for this product, as well as evaluating certain product line extensions relating to this clinical program. Should sufficient liquidity and capital resources be available, we anticipate commencing commercialization of this technology during the second half of 2010.
Vascular Wrap™. Our paclitaxel-eluting mesh surgical implant, or Vascular Wrap, is designed to treat complications, including graft stenosis or restenosis that may occur in connection with vascular graft implants in hemodialysis patients or in patients that have peripheral artery disease. Vascular grafts are implanted in patients in order to bypass diseased blood vessels, or to provide access to the vascular system of kidney failure patients in order to facilitate the process of hemodialysis. In many cases, these vascular grafts fail due to proliferation of cells or scar tissue into the graft (graft stenosis or restenosis), which can negatively impact blood flow through the vascular graft.
In April 2008, we elected to suspend enrollment in our U.S. and E.U. human clinical trials for our Vascular Wrap product candidate in patients undergoing surgery for hemodialysis access, pending a safety review to evaluate an
54
Table of Contents
imbalance of infections observed between the two study groups. As a result of these observations, we elected to notify physicians to suspend further enrollment in the trials, pending a full review of the potential cause of the implant site infections. There are currently no plans to resume enrollment in these clinical trials, however, we are continuing to monitor, evaluate and collect data with respect to the patients that were enrolled in the clinical trial. We are continuing to evaluate alternatives for this program, including potential collaborations, partnerships, divestitures or future clinical development initiatives.
Acquisitions
As part of our business development efforts we have completed several significant acquisitions in the past. Terms of certain of these acquisitions require us to make future milestone or contingent payments upon achievement of certain product development and commercialization objectives, as discussed under “Contractual Obligations”. During the three-year period ended December 31, 2009, we did not complete any acquisitions.
Collaboration, License and Sales and Distribution Agreements
In connection with our research and development efforts, we have entered into various arrangements with corporate and academic collaborators, licensors, licensees and others for the research, development, clinical testing, regulatory approval, manufacturing, marketing and commercialization of our product candidates. Terms of the various license agreements may require us, or our collaborators, to make milestone payments upon achievement of certain product development and commercialization objectives and pay royalties on future sales of commercial products, if any, resulting from the collaborations.
In June 2009, we announced that we had entered into license, distribution, development and supply agreements for fibrin and thrombin technologies with Haemacure. The collaboration provides us with access to technology for certain of our surgical product candidates which are currently in preclinical development. As part of this collaboration, we agreed to provide to Haemacure a senior secured bridge financing facility. The senior secured bridge loan provided $2.5 million of financing to Haemacure, as made available in multiple draw-downs throughout 2009. The loan is senior to all of Haemacure’s existing and future indebtedness, subject to certain exceptions, bears interest at an annual rate of 10%, compounded quarterly, and has a term of two years. The senior secured bridge loan also has certain equity conversion features and rights to board representation upon conversion. As of December 31, 2009, $2.5 million of the loan had been drawn by Haemacure.
On January 11, 2010, Haemacure announced that on January 8, 2010 it had filed a notice of intention to make a proposal to its creditors under the Bankruptcy and Insolvency Act (Canada) and that its wholly-owned U.S. subsidiary sought court protection under Chapter 11 of the Bankruptcy Code in the U.S. Haemacure’s Board of Directors authorized these actions in light of Haemacure’s financial condition and inability to raise additional financing. We have agreed to provide up to a maximum amount of $1.0 million of additional financing, of which $0.8 million has been provided as of March 12, 2010 to fund Haemacure’s insolvency proceedings and day-to-day operations. The funds are being disbursed in accordance with a schedule agreed to by Haemacure and us. All funds loaned to Haemacure to date and in the future are secured by substantially all of their assets. We hope to exercise our security in the future to acquire Haemacure’s assets. As the bankruptcy proceedings in Canada and the U.S. are ongoing and the outcome cannot be determined, we have not yet completed our assessment of the potential accounting impact.
On March 31, 2009, we announced the completion of an Amended and Restated Distribution and License Agreement with Baxter International Inc. (“Baxter”) related to our COSEAL® technology. As consideration for the Amended and Restated Distribution and License Agreement, we received $25 million. Angiotech and Baxter initially entered into a Distribution and License Agreement in 2003 relating to certain intellectual property for our COSEAL surgical sealant. The Distribution and License Agreement entitled Baxter to market and sell COSEAL worldwide (excluding Japan), from which we have derived royalty revenue from Baxter. The original Distribution and License Agreement also gave Baxter an option for distribution rights in Japan. As a result of this
55
Table of Contents
transaction, Baxter will obtain worldwide rights to COSEAL and certain additional fields of use for COSEAL, and expanded worldwide rights to COSEAL derivatives. Baxter will owe no further royalty or milestone obligations to us relating to the existing formulation of COSEAL or any future products under the terms of the Amended and Restated Distribution and License Agreement.
Agreements relating to our material collaborations, licenses, sales and distribution arrangements are listed in the exhibits index to this Annual Report on Form 10-K and may be found at the locations specified therein.
Critical Accounting Policies and Estimates
Our consolidated financial statements are prepared in accordance with U.S. GAAP. These accounting principles require management to make estimates and assumptions that affect the reported amounts of assets, liabilities, revenue and expenses. We believe that the estimates and assumptions upon which we rely are reasonable and are based upon information available to us at the time the estimates and assumptions were made. Actual results could differ materially from our estimates.
We believe the following policies to be critical to understanding our financial condition, results of operations, and expectations for 2010 because these policies require management to make significant estimates, assumptions and judgments about matters that are inherently uncertain.
Revenue Recognition
Product Sales
We recognize revenue from product sales, including shipments to distributors, when the product is shipped from our facilities to the customer provided that we have not retained any significant risks of ownership or future obligations with respect to products shipped. We recognize revenue from product sales net of provisions for future returns. These provisions are established in the same period as the related product sales are recorded and are based on estimates derived from our historical experience. The estimates are adjusted to reflect actual returns.
We consider revenue to be realized or realizable and earned when all of the following criteria are met: persuasive evidence of a sales arrangement exists; delivery has occurred or services have been rendered; the price is fixed or determinable; and collection is reasonably assured. These criteria are generally met at the time of shipment when the risk of loss and title pass to the customer or distributor.
We include amounts billed to customers for shipping and handling in revenue. The corresponding costs for shipping and handling are included in cost of products sold.
Royalty Revenue
We recognize royalty revenue when we have fulfilled the terms in accordance with the contractual agreement, have no future obligations, the amount of the royalty fee is determinable and collection is reasonably assured. We record royalty revenue from BSC on a cash basis due to the difficulty of accurately estimating the BSC royalty before we receive the reports and payments from BSC. This results in a one quarter lag between the time we record royalty revenue and the time the associated sales were recorded by BSC.
License Fees
License fees are comprised of initial fees and milestone payments derived from collaborative and other licensing arrangements. License fees are recognized as revenue when persuasive evidence of an arrangement exists, the contracted fee is fixed or determinable, the intellectual property is delivered to the customer, collection is reasonably assured and the Company has substantially completed its performance obligations. Non-refundable
56
Table of Contents
milestone payments are recognized upon the achievement of specified milestones when the milestone payment is substantive in nature, achievement of the milestone was not reasonably assured at the inception of the agreement and the Company has no further significant performance obligations to fulfill under the arrangement. Initial fees and non-refundable milestone payments received which require the ongoing involvement of the Company are deferred and amortized into income on a straight-line basis over the period of ongoing involvement if there is no other method under which performance can be objectively measured.
Income Tax Expense
Income taxes are accounted for using the liability method. Deferred income tax assets and liabilities result from the temporary differences between the amount of assets and liabilities recognized for financial statement and income tax purposes, and for operating losses, capital losses and tax credit carry forwards, using tax rates expected to be in effect for the years in which the differences are expected to reverse. The carrying value of our net deferred income tax assets assumes that we will be able to generate sufficient future taxable income in certain tax jurisdictions to realize the value of these assets. Management evaluates the realizability of the deferred tax assets and assesses the need for any valuation allowance adjustment on a periodic basis. A valuation allowance is provided to reduce the net deferred income tax assets if, based upon the available evidence, it is more likely than not that some or all of the deferred income tax assets will not be realized.
Significant estimates are required in determining our provision for income taxes including, but not limited to, reserves for uncertain tax positions and valuation allowances for deferred income tax assets. Some of these estimates are based on interpretations of existing tax laws or regulations. Our effective tax rate may change from period to period based on the mix of income among the different foreign jurisdictions in which we operate, changes in tax laws in these jurisdictions, and changes in the amount of valuation allowance recorded.
The Company uses a two-step approach for recognizing and measuring the income tax benefits of uncertain tax positions taken or expected to be taken in a tax return. A tax benefit from an uncertain tax position is recognized if it is more-likely-than-not that the position will be sustained upon examination by the tax authority based on the technical merits of the position. The tax benefit of an uncertain tax position that meets the more-likely-than-not recognition threshold is measured as the largest amount that is greater than 50% likely to be realized upon settlement with the tax authority. To the extent a full benefit is not expected to be realized, an income tax liability is established. Any change in judgment related to the expected resolution of uncertain tax positions are recognized in the year of such a change. Accrued interest and penalties related to unrecognized tax benefits are recorded in income tax expense in the current year.
Stock-based Compensation
We account for stock-based compensation in accordance with ASC No. 718 — Compensation-Stock Compensation. ASC No. 718 requires us to recognize the grant date fair value of share-based compensation awards granted to employees over the requisite service period. We use the Black-Scholes option pricing model to calculate stock option values, which requires certain assumptions including the future stock price volatility and expected time to exercise. Changes to any of these assumptions, or the use of a different option pricing model (such as the binomial model), could produce a different fair value for stock-based compensation, which could have a material impact on our earnings.
Cash Equivalents and Investments
We may invest our excess cash balances in short-term securities, principally investment grade commercial debt and government agency notes. At December 31, 2009, we held one equity security which was classified as available-for-sale, and accordingly, was recorded at fair market value.
As part of our strategic product development efforts, we also invest in equity securities of certain companies with which we have collaborative agreements. The equity securities of some of these companies do not have a readily
57
Table of Contents
determinable fair value. These investments are recorded using the cost method of accounting and are tested for impairment by reference to anticipated undiscounted cash flows expected to result from the investment, the results of operations and financial position of the investee, and other evidence supporting the net realizable value of the investment.
Goodwill
We test goodwill for possible impairment at least annually and whenever changes in circumstances occur that would indicate impairment in the value of goodwill. When the carrying value of a reporting unit’s goodwill exceeds the implied fair value of the goodwill, an impairment loss is recognized in an amount equal to the excess. Circumstances that could trigger impairment include adverse changes or outcomes in legal or regulatory matters, technological advances, decreases in anticipated demand, unanticipated competition, and significant declines in our share price. We estimate fair value based on a discounted projection of future cash flows which are subject to significant uncertainty and estimates. If future cash flows are less than those projected, an impairment charge may become necessary that could have a material impact on our financial position and results of operations. We tested our goodwill for impairment during the year ended December 31, 2008 and determined that, due to a significant and sustained decline in our public stock market capitalization during 2008, our goodwill was impaired and as a consequence, we recorded an impairment charge of $649.7 million during year ended December 31, 2008. Accordingly, we had no goodwill remaining on our balance sheet as of December 31, 2008.
Intangible Assets
Our identifiable intangible assets are primarily comprised of technologies acquired through our business combinations. Intangible assets also include in-licensed proven medical technologies. We amortize intangible assets to reflect the pattern in which the economic benefits of the intangible asset are consumed over the estimated life of the technologies, which is generally on a straight-line basis and range from two to twelve years depending on the circumstances and the intended use of the technology. We determine the estimated useful lives for intangible assets based on a number of factors such as legal, regulatory or contractual limitations; known technological advances; anticipated demand for our products; and the existence or absence of competition.
We review long-lived assets subject to amortization to determine if any adverse conditions exist or a change in circumstances has occurred that would indicate impairment or a change in the remaining useful life. Conditions that may indicate impairment include, but are not limited to, a significant adverse change in legal factors or business climate that could affect the value of an asset, a product recall, or an adverse action or assessment by a regulator. If an impairment indicator exists, we test the asset (asset group) for recoverability. For purposes of the recoverability test, intangible assets are grouped with other assets and liabilities at the lowest level of identifiable cash flows if the intangible asset does not generate cash flows independent of other assets and liabilities. If the carrying value of the asset (asset group) exceeds the undiscounted cash flows expected to result from the use and eventual disposition of the asset (asset group), an impairment charge is recorded to write the carrying value down to the fair value in the period identified.
We generally calculate fair value of assets (asset groups) as the present value of estimated future cash flows expected to generate from the asset using a risk-adjusted discount rate. In determining the estimated future cash flows associated with our assets (asset groups), assumptions about future revenue contributions, cost structures and remaining useful lives of the asset (asset group) are used. The use of alternative assumptions, including estimated cash flows, discount rates, and alternative estimated remaining useful lives could result in different calculations of impairment.
No indicators of impairment were identified at December 31, 2009.
58
Table of Contents
Results of Operations
Overview
The following discussion and analysis of results from our operations excludes the financial results from our discontinued operations (see “Results of Operations — Discontinued Operations”) for the comparative periods, unless otherwise noted.
| (in thousands of U.S.$, except per share data) |
Years ended December 31, | |||||||||||
| 2009 | 2008 | 2007 | ||||||||||
| Revenues |
||||||||||||
| Pharmaceutical Technologies |
$ | 87,727 | $ | 92,456 | $ | 117,501 | ||||||
| Medical Products |
191,951 | 190,816 | 170,193 | |||||||||
| Total revenues |
279,678 | 283,272 | 287,694 | |||||||||
| Operating income (loss) |
23,085 | (671,179 | ) | (20,739 | ) | |||||||
| Other (expense) income |
(39,916 | ) | (82,889 | ) | (49,853 | ) | ||||||
| Loss from continuing operations before income taxes |
(16,831 | ) | (754,068 | ) | (70,592 | ) | ||||||
| Income tax expense (recovery) |
6,037 | (12,892 | ) | (14,545 | ) | |||||||
| Net loss from continuing operations |
$ | (22,868 | ) | $ | (741,176 | ) | $ | (56,047 | ) | |||
| Basic and diluted net loss per common share, continuing operations |
$ | (0.27 | ) | $ | (8.71 | ) | $ | (0.66 | ) | |||
For the year ended December 31, 2009, we recorded a net loss of $22.9 million ($0.27 basic and diluted net loss per common share), compared to a net loss of $741.2 million ($8.71 basic and diluted net loss per common share) for the year ended December 31, 2008. The decrease in net loss of $718.3 million is primarily due to the write-down of goodwill of $649.7 million recorded in 2008. The remaining decrease in net loss of $68.6 million is due to several factors, including: (i) a $29.5 million decrease in research and development costs; (ii) a $17.0 million decrease in selling, general and administrative expenses, (iii) a $23.6 million decrease in write-downs of various investments; (iv) a $15.9 million decrease in deferred financing charges related primarily to the write-down of certain transaction costs incurred in 2008 totaling $16.5 million; (v) a $6.5 million decrease in interest expense due primarily to lower interest expense incurred on our Senior Floating Rate Notes due 2013 (the “Floating Rate Notes”), and (vi) a $25.0 million payment received from our partner Baxter in the first quarter of 2009. These factors were offset by a $22.8 million net reduction in royalty revenue derived from BSC’s sales of paclitaxel-eluting coronary stent systems as compared to the comparable period in 2008 (net of license and royalty fees), and an income tax expense of $6.0 million recorded in 2009 as compared to an income tax recovery of $12.9 million recorded in 2008.
For the year ended December 31, 2008, we recorded a net loss from continuing operations of $741.2 million ($8.71 basic and diluted net loss per share) compared to net loss from continuing operations of $56.0 million ($0.66 basic and diluted net loss per share) for the year ended December 31, 2007. The increase in the net loss of $685.2 million is due primarily to the write-down of an aggregate of $649.7 million of goodwill recorded in 2008. Also increasing the net loss were (i) a $25.1 million reduction in royalty revenue, as BSC’s sales of paclitaxel-eluting coronary stent systems declined substantially in 2008 as compared to prior comparable periods; (ii) $16.5 million of transaction costs accrued related to the abandoned proposed financing transaction; (iii) an $18.6 million write-down or loss on redemption of two available-for-sale equity securities, one of which we disposed of, and the other of which was trading below cost for an extended period of time (as compared to $8.2 million in 2007); (iv) a $5.0 million write-down of a long term investment for which we could not obtain sufficient assurance we would be able to recover our carrying value; and (v) a $2.5 million payment for in-process research and development expense made during the first quarter of 2008 (as compared to $8.0 million in 2007). Partially offsetting the increase in the net loss was a $14.5 million increase in gross profit relating to higher medical products sales and a $7.2 million reduction in interest expense, as the interest rate applied to our Floating Rate Notes declined.
59
Table of Contents
Revenues
| (in thousands of U.S.$) |
Years ended December 31, | ||||||||
| 2009 | 2008 | 2007 | |||||||
| Medical Products: |
|||||||||
| Product sales |
$ | 191,951 | $ | 190,816 | $ | 170,193 | |||
| Pharmaceutical Technologies: |
|||||||||
| Royalty revenue — paclitaxel-eluting stents |
57,420 | 84,079 | 110,477 | ||||||
| Royalty revenue — other |
4,751 | 7,467 | 6,182 | ||||||
| License fees |
25,556 | 910 | 842 | ||||||
| 87,727 | 92,456 | 117,501 | |||||||
| Total revenues |
$ | 279,678 | $ | 283,272 | $ | 287,694 | |||
We operate in two reportable segments:
Pharmaceutical Technologies
Our Pharmaceutical Technologies segment includes royalty revenue generated from licensing our proprietary paclitaxel technology to various partners, as well as revenue derived from the licensing of certain of our biomaterials and other technologies. Currently, our principal revenues in this segment are royalties derived from sales by BSC of TAXUS coronary stent systems incorporating the drug paclitaxel.
Royalty revenue derived from sales of TAXUS stent systems by BSC for the year ended December 31, 2009 decreased by 32% as compared to the year ended December 31, 2008. The decrease in royalty revenues was a result of lower sales of TAXUS stent systems by BSC. Royalty revenue for year ended December 31, 2009 was based on BSC’s net sales for the period October 1, 2008 to September 30, 2009 of $926 million, of which $411 million was in the U.S., compared to net sales of $1.2 billion for the same period in 2008, of which $637 million was in the U.S. The average gross royalty rate earned in the year ended December 31, 2009 on BSC’s net sales was 6.4% for sales in the U.S. and 6.1% for sales in other countries, compared to an average rate of 7.1% for sales in the U.S. and 6.4% for sales in other countries for year ended December 31, 2008.
The average gross royalty rate relating to TAXUS sales in the U.S. declined during the year ended December 31, 2009 as compared to the year ended December 31, 2008 as a result of our tiered royalty rate structure, whereby we receive higher royalty rates on sales volume above certain contractually established baselines. The average gross royalty rate relating to sales in countries other than the U.S. declined in 2009 primarily due to an additional royalty payment we received during the first quarter of 2008 relating to royalties on sales outside of the U.S. that were owed from prior periods in 2007.
Royalty revenue derived from sales of paclitaxel-eluting coronary stent systems by BSC for the year ended December 31, 2008 decreased by 24% as compared to the year ended December 31, 2007. The decrease in royalty revenues was primarily a result of lower sales of paclitaxel-eluting stents by BSC. Royalty revenue for the year ended December 31, 2008 was based on BSC’s net sales for the period October 1, 2007 to September 30, 2008 of $1.2 billion, of which $637 million was in the U.S., compared to net sales of $1.6 billion, of which $1.0 billion was in the U.S., for the comparable period in the prior year. The average gross royalty rate earned in the year ended December 31, 2008 on BSC’s net sales was 7.1% for sales in the U.S. and 6.4% for sales in other countries, compared to an average rate of 7.6% for sales in the U.S. and 5.6% for sales in other countries for the year ended December 31, 2007.
The average gross royalty rate for countries other than the U.S. improved in the year ended December 31, 2008 primarily due to the contribution of royalty revenue from BSC’s sales during the applicable period in Japan, where the average gross royalty rate we receive is higher, as compared to minimal royalty revenue received relating to sales in Japan in the comparable period in the prior year.
60
Table of Contents
License fees increased by $24.6 million for the year ended December 31, 2009 as compared to the year ended December 31, 2008 due to the $25.0 million payment received as a result of our entry into the Amended and Restated Distribution and License Agreement with Baxter in the first quarter of 2009. The payment was recorded as revenue in the current year as the Company had no further ongoing involvement in relation to this collaboration. Other royalty revenue decreased by $2.7 million for the year ended December 31, 2009 as compared to the year ended December 31, 2008 primarily due to our entry into the Amended and Restated Distribution and License Agreement with Baxter.
We expect revenues in our Pharmaceutical Technologies segment may decrease in 2010 as compared to revenues recorded in 2009 and 2008, primarily as a result of the continued competitive pressures in the market for drug-eluting coronary stent systems and the related potential decline in royalty revenues we derive from sales by BSC of TAXUS, and the elimination of ongoing royalty payments from Baxter as a result of our entry into the Amended and Restated Distribution and License Agreement, for which we received the $25.0 million payment as noted above. Our royalties derived from sales by BSC of TAXUS declined from $84.1 million for the year ended December 31, 2008 to $57.4 million for the year ended December 31, 2009.
Medical Products
Revenue from our Medical Products segment for the year ended December 31, 2009 was $192.0 million, an increase of 1% from the $190.8 million recorded for the year ended December 31, 2008. This slight increase was due primarily to a 32% increase in sales of our Proprietary Medical Products, partly offset by a 9% decline in sales of our Base Medical Products.
Sales of our Proprietary Medical Products increased to $59.8 million during the year ended December 31, 2009 from $45.2 million during the year ended December 31, 2008, due primarily to higher sales of certain of our product lines, most significantly our Quill SRS product line, SKATER product line, Option IVC Filter and Hemostream dialysis catheter. Sales of our Proprietary Medical Products during the year ended December 31, 2009 as compared to the year ended December 31, 2008 were also negatively impacted by foreign currency fluctuations. Excluding the impact of foreign currency changes, sales of our Proprietary Medical Products would have increased by 35% during the year ended December 31, 2009 as compared to the prior year.
The increase in sales of our Proprietary Medical Products was offset by a 9% decline in sales of our Base Medical Products to $132.1 million during the year ended December 31, 2009 from $145.6 million during the year ended December 31, 2008, due primarily to lower sales of medical device components to other third-party medical device manufacturers. During the year ended December 31, 2009, certain of our customers elected to postpone or cancel orders, or implemented inventory reduction programs in response to changing economic and credit market conditions. In November 2008, we began the transfer of the manufacturing of surgical needles to our facility in Aguadilla, Puerto Rico from our facility in Syracuse, New York. We believe that the closure of our Syracuse production facility in November 2008 and the finalization of our move of surgical needle production to Aguadilla, combined with the difficult economic and credit market environment, negatively impacted our Base Medical Product sales during the year ended December 31, 2009 as compared to the prior year. Sales of our Base Medical Products were also impacted to a lesser extent by foreign currency fluctuations. Excluding the impact of foreign currency changes, sales of our Base Medical Products would have decreased by 8% during the year ended December 31, 2009 as compared to the prior year.
Revenue from our Medical Products segment for the year ended December 31, 2008 was $190.8 million, an increase of 12% compared to $170.2 million in the year ended December 31, 2007. The increase was due to several factors, including increased sales of various of our Proprietary Medical Products, and improvement of Base Medical Products sales of medical devices and device components to other third party medical device manufacturers. This increase also reflects the effect of the one-time $3.0 million charge against revenue in 2007 relating to the discontinuation of the Contour Threads brand and the accrual of a reserve against potential product that may be returned.Excluding the impact of the $3.0 million accrual in 2007 relating to the Contour Threads
61
Table of Contents
brand discontinuation, revenue growth as compared to 2007 was 10%. The impact of foreign currency fluctuations on sales of our Medical Products in 2008 as compared to 2007 was not significant
Because we believe certain of our Proprietary Medical Products have a high potential for growth, we expect that revenue in our Medical Products segment will continue to increase during 2010 as compared to 2009. This expected growth may be mitigated or offset by more limited growth of our Base Medical Products, in particular if our sales of medical devices and device components to third-party customers continue at lower than expected levels.
Expenditures
| (in thousands of U.S.$) |
Years ended December 31, | ||||||||
| 2009 | 2008 | 2007 | |||||||
| Cost of products sold |
104,616 | 101,052 | 94,949 | ||||||
| License and royalty fees |
$ | 10,431 | $ | 14,258 | $ | 18,652 | |||
| Research and development |
23,701 | 53,192 | 53,963 | ||||||
| Selling, general and administrative |
81,504 | 98,483 | 99,315 | ||||||
| Depreciation and amortization |
33,251 | 33,998 | 33,429 | ||||||
| In-process research and development |
— | 2,500 | 8,125 | ||||||
| Write-down of assets held for sale |
3,090 | 1,283 | — | ||||||
| Write-down of goodwill |
— | 649,685 | — | ||||||
| $ | 256,593 | $ | 954,451 | $ | 308,433 | ||||
Cost of Products Sold
Cost of products sold is comprised of costs and expenses related to the production of our various medical device, device component and biomaterial products and technologies, including direct labor, raw materials, depreciation and certain fixed overhead costs related to our various manufacturing facilities and operations.
Cost of products sold increased by $3.5 million to $104.6 million for the year ended December 31, 2009 compared to $101.1 million for the year ended December 31, 2008. The increase in cost of products sold for the year ended December 31, 2009 as compared to the year ended December 31, 2008 was due to several factors, including primarily (i) excess labor and other costs incurred during the first half of 2009 relating to surgical needle orders expected from a large customer that were subsequently cancelled; (ii) increases in royalty expense relating to increased sales of certain of our Proprietary Medical Products; specifically our Option IVC filter and Hemostream dialysis catheter; (iii) changes in our mix of product sales among our Base Medical Products to certain items that have higher production costs relative to the revenue they produced; (iv) added costs incurred to re-work certain product inventory due to packaging errors during the fourth quarter in our facilities in Stenlose, Denmark and Gainsville, FL, and (v) modest increases in distribution costs relating to the move of our E.U. product distribution activities to a new central location in Belgium from our previous location in Denmark. These factors were partially offset by lower labor and other production costs for surgical needles in our new facility in Aguadilla, Puerto Rico as compared to our old production facility in Syracuse, NY.
Gross margins for our Medical Products segment sales were 45.5% for year ended December 31, 2009 as compared to 47.1% for year ended December 31, 2008. Gross margins during 2009 as compared to 2008 were negatively impacted by the factors noted above. In addition, certain product sales strategies for our Base Medical Products, which are designed to increase sales volume and improve our utilization of fixed production capacity, negatively impacted gross margin percentage during 2009 most significantly during the fourth quarter of 2009. Partly offsetting the impact of these negative factors were a relative increase in sales of our higher gross margin Proprietary Medical Products.
62
Table of Contents
Cost of products sold increased by $6.2 million to $101.1 million for the year ended December 31, 2008 compared to $94.9 million for the year ended December 31, 2007, primarily due to increased sales. Gross margins for our product sales were 47.1% for the year ended December 31, 2008 compared to 44.2% for the year ended December 31, 2007. Gross margins in the year ended December 31, 2008 as compared to the year ended December 31, 2007 were positively impacted by an increase in sales of higher margin product lines, the launch of certain new, higher margin product lines for which there were no material sales in the comparable prior year period, and the effect of higher sales volumes on the absorption of fixed overhead and labor costs.
We expect that cost of products sold will continue to be significant and that gross margins may improve in 2010, primarily as a result of improved sales mix and specifically as a result of potential increases in sales of our Proprietary Medical Products that provide higher relative gross margins. These improvements may be offset by the impact of certain sales and pricing initiatives for our Base Medical Products designed to improve sales volume, market share, fixed manufacturing capacity utilization and thereby overall operating cash flow derived from our Base Medical Products.
License and Royalty Fees on Royalty Revenue
License and royalty fee expenses include license and royalty payments due to certain of our licensors, primarily relating to paclitaxel-eluting coronary stent system royalty revenue received from BSC. The decrease in this expense in 2009 and 2008 reflects the reduction in our royalty revenue. We expect license and royalty fee expense to continue to be a significant cost in 2010, commensurate with the amount of royalty revenue we earn. As described above, we expect that royalty revenues may continue to decline in 2010, which we expect to result in a corresponding decrease in our license and royalty fee expenses.
Research and Development
Our research and development expense is comprised of costs incurred in performing research and development activities, including salaries and benefits, clinical trial and related clinical manufacturing costs, contract research costs, patent procurement costs, materials and supplies, and operating and occupancy costs. Our research and development activities occur in two main areas:
(i) Discovery and pre-clinical research. Our discovery and pre-clinical research efforts are divided into several distinct areas of activity, including screening and pre-clinical evaluation of pharmaceuticals and various biomaterials and drug delivery technologies, evaluation of mechanism of action of pharmaceuticals, mechanical engineering and pursuing patent protection for our discoveries.
(ii) Clinical research and development. Clinical research and development refers to internal and external activities associated with clinical studies of product candidates in humans, and advancing clinical product candidates towards a goal of obtaining regulatory approval to manufacture and market these product candidates in various geographies.
Research and development expenditures decreased significantly to $23.7 million for the year ended December 31, 2009 as compared to $53.2 million for the year ended December 31, 2008. The decrease was primarily due to the suspension of enrollment in our Vascular Wrap clinical trial, a reduction of staffing within our clinical and research departments and reduction in other direct costs in the second half of 2008 relating to the postponement or elimination of other selected research programs and activities.
Research and development expenditures were $53.2 million for the year ended December 31, 2008 as compared to $54.0 million for the year ended December 31, 2007. Research and development expenditures increased in the first half of 2008, primarily relating to our Vascular Wrap clinical program, and due to severance costs of $1.9 million relating to a significant reduction in staffing within our clinical and research departments completed in the second quarter. This was offset in the second half of 2008 by a $0.6 million decrease in clinical trial costs for
63
Table of Contents
our suspended Vascular Wrap clinical program and a $1.4 million reduction related to our completed 5-FU CVC clinical program (for which significant clinical trial activities have materially concluded). Ongoing clinical programs added $0.7 million in costs as compared to 2007. Also adding to research and development expenditures in the second half of 2008 were severance costs of $1.6 million due to a significant additional reduction in staffing within our clinical and research departments completed primarily during the third quarter.
We expect our research and development expenditures in 2010 to be consistent with the level of expenditures in 2009 and lower as compared to the level of expenditures in 2008 and 2007, reflecting the factors described above. Although we expect the level of research and development expenditures to be lower in 2010 as compared to 2008 and 2007, we anticipate we will continue to incur significant research and development expenditures in 2010 and in future periods.
Selling, General and Administrative Expenses
Our selling, general and administrative expenses are comprised of direct selling and marketing costs related to the sale of our various medical products, including salaries, benefits and sales commissions, and our various management and administrative support functions, including salaries, commissions, benefits and other operating and occupancy costs.
Selling, general and administrative expenditures were $81.5 million for the year ended December 31, 2009 as compared to $98.5 million for the year ended December 31, 2008. The lower expenditures during the year ended December 31, 2009 as compared to the year ended December 31, 2008 were primarily due to reduced severance costs and salaries and benefits as a result of the reduction in staff in selling, general and administrative departments completed in the first and third quarters of 2008, reduced professional fees as well as reduced severance and other restructuring charges related to the closure and consolidation of our Syracuse, NY manufacturing facility completed in the fourth quarter of 2008.
Selling, general and administrative expenditures were $98.5 million during the year ended December 31, 2008 as compared to $99.3 million during the year ended December 31, 2007. Higher expenditures in salaries, benefits and related costs, accounting and tax consulting fees and travel were offset by lower expenditures for other operating costs and lower litigation expenses in 2008 as compared to 2007. Salaries, benefits and related costs increased by $6.5 million in 2008 primarily due to the increase in direct sales and marketing personnel implemented in the U.S. and E.U. during the second half of 2007. Litigation costs decreased $1.7 million as compared to the prior year period, due primarily to reaching agreement in the third quarter of 2007 with Conor MedSystems, Inc. (“Conor”) and its parent company Johnson & Johnson to settle all outstanding patent litigation with respect to Conor’s CoStar® paclitaxel-eluting stent. Other operating costs decreased by $4.6 million in 2008 as compared to 2007 due to certain personnel rationalization and other cost reduction initiatives undertaken in our general and administrative areas, primarily during the third quarter.
We expect that selling, general and administrative expenses may modestly increase in 2010 as compared to 2009 and 2008, primarily due to potential increases in selling and marketing expenses relating to increased sales of certain of our Proprietary Medical Products. These expenditures could fluctuate depending on product sales levels, the timing of launch of certain new products and growth of new product sales, or as a result of litigation or other legal expenses that may be incurred to support and defend our intellectual property portfolio or other aspects of our business.
Depreciation and Amortization
Depreciation and amortization expense was $33.3 million for the year ended December 31, 2009 as compared to $34.0 million for the year ended December 31, 2008. Depreciation and amortization expense is comprised of amortization of licensed technologies and identifiable intangible assets purchased through business combinations of $30.0 million and $30.2 million for the years ended December 31, 2009 and 2008, respectively, and depreciation expense of property, plant and equipment of $3.3 million and $3.8 million for the years ended December 31, 2009 and 2008, respectively.
64
Table of Contents
Depreciation and amortization expense was $34.0 million for the year ended December 31, 2008 compared to $33.4 million for the year ended December 31, 2007, and is comprised of amortization of licensed technologies and identifiable intangible assets purchased through business combinations of $30.2 million and $29.9 million, respectively, and depreciation of property, plant and equipment of $3.8 million and $3.5 million, respectively.
We expect depreciation and amortization expense during 2010 to be comparable to 2009.
In-process Research and Development (“IPR&D”)
We record IPR&D expense relating to acquired or in-licensed technologies that are at an early stage of development and have no alternative future use. We had no IPR&D expense in the year ended December 31, 2009. For the year ended December 31, 2008, we recorded IPR&D expense of $2.5 million for an initial license payment made to Rex Medical to obtain the marketing rights for the Option IVC Filter. For the year ended December 31, 2007, we recorded IPR&D expense of $8.1 million, of which $7.0 million relates to the extension of our collaboration with CombinatoRx Inc. and $1.0 million relates to a collaboration agreement with Rex Medical.
We may incur further IPR&D expenditures in future periods in the event we in-license or acquire additional early stage technologies.
Write-down of Assets Held For Sale
In connection with our plans for capacity rationalization and consolidation in our Medical Products segment, in 2008, we reclassified two of our long-lived assets as current assets held for sale in accordance with guidance for accounting for impairment of long-lived assets under ASC No. 350 — General Intangibles Other than Goodwill and ASC No. 360 — Property, Plant and Equipment. These properties have a carrying value of approximately $2.3 million as of December 31, 2009, which represents the lower of cost and fair value less cost to sell. Impairment charges related to these properties of $0.8 million and $1.3 million have been recorded against income from continuing operations for the years ended December 31, 2009 and 2008, respectively. In addition, and also in connection with our capacity rationalization in our Pharmaceutical Technologies segment, in 2008, we reclassified a property that is no longer used as a current asset as held for sale. This property has a carrying value of approximately $3.0 million as of December 31, 2009, which represents the lower of cost and fair value less cost to sell. Impairment charges related to this property of $2.3 million have been recorded against income from continuing operations for the year ended December 31, 2009. Subsequent to December 31, 2009, the Company sold one property classified as held for sale at its December 31, 2009 carrying value of $0.8 million.
Write-down of Goodwill
As a result of a significant and sustained decline in our public stock market capitalization during 2008, we determined that our goodwill was impaired and as a consequence we recorded an impairment charge of $649.7 million during year ended December 31, 2008. Accordingly, we had no goodwill remaining on our balance sheet as of December 31, 2008 and 2009. We utilized the income approach in determining the implied fair value of the goodwill, which requires estimates of future operating results and cash flows discounted using estimated discount rates.
65
Table of Contents
Other Income (Expense)
| (in thousands of U.S.$) |
Years ended December 31, | |||||||||||
| 2009 | 2008 | 2007 | ||||||||||
| Foreign exchange (loss) gain |
$ | (1,612 | ) | $ | 540 | $ | (341 | ) | ||||
| Investment and other income |
378 | 1,192 | 10,393 | |||||||||
| Interest expense on long term-debt |
(38,039 | ) | (44,490 | ) | (51,748 | ) | ||||||
| Write-down of deferred financing charges |
(643 | ) | (16,544 | ) | — | |||||||
| Write-down or net loss on redemption of investments |
— | (23,587 | ) | (8,157 | ) | |||||||
| $ | (39,916 | ) | $ | (82,889 | ) | $ | (49,853 | ) | ||||
Net foreign exchange gains and losses were primarily the result of changes in the relationship of the U.S. to Canadian dollar and other foreign currency exchange rates when translating our foreign currency denominated cash, cash equivalents and short-term investments to U.S. dollars for reporting purposes at period end. We continue to hold foreign currency denominated cash and cash equivalents to meet our anticipated operating and capital expenditure needs in future periods in jurisdictions outside of the U.S. We do not use derivatives to hedge against exposures to foreign currency arising from our balance sheet financial instruments and therefore are exposed to future fluctuations in the U.S. dollar to foreign currency exchange rates.
Investment and other income for the year ended December 31, 2009 of $0.4 million represented a decrease of $0.8 million when compared to investment and other income of $1.2 million for the year ended December 31, 2008, primarily as a result of lower interest income received in 2009 due to lower excess cash balances available for investment.
Investment and other income for the year ended December 31, 2008 decreased by $9.2 million when compared to the year ended December 31, 2007, primarily due to the fact that the 2007 comparative period included a gain of $7.5 million realized on the recovery of investments owned by Cohesion Technologies, Inc. which we acquired in 2003. In addition, we earned lower interest income in 2008 due primarily to lower cash balances available to invest and lower interest rates.
During the year ended December 31, 2009, we incurred interest expense of $38.0 million on our outstanding long-term debt obligations, as compared to $44.5 million for the year ended December 31, 2008. The decrease resulted from a decline in the interest rate applicable on our Floating Rate Notes due to lower LIBOR rates. The interest rate decline resulted in an average interest rate of 4.7% on our Floating Rate Notes for the year ended December 31, 2009 as compared to 7.7% for the year ended December 31, 2008. Interest expense also includes $2.8 million and $2.3 million for amortization of deferred financing costs for the year ended December 31, 2009 and December 31, 2008, respectively.
During the year ended December 31, 2008, we incurred interest expense of $44.5 million on our outstanding long-term debt obligations, as compared to $51.7 million for the year ended December 31, 2007. The decrease of $7.1 million resulted from a decline, during 2008, in the interest rate applicable on our Floating Rate Notes due to a decline in the LIBOR rates. The interest rate decline resulted in an average interest rate of 7.7% for 2008 as compared to 9.0% in 2007. Interest expense in 2008 also includes $2.3 million for amortization of deferred financing costs.
Write-down and other deferred financing charges for the year ended December 31, 2009 related to a charge of $0.6 million resulting from the write-off of the portion of the deferred financing charges related to our term loan facility with Wells Fargo Foothill LLC (“Wells Fargo”) that terminated on May 29, 2009. Write-down and other deferred financing charges for the year ended December 31, 2008 of $16.5 million were a result of recognized costs related to our exploration of proposed financing and strategic alternatives.
66
Table of Contents
The write-down or net loss on redemption of investments for the year ended December 31, 2008 of $23.6 million is comprised of a loss of $8.8 million realized on the sale of our common stock holdings in CombinatoRx, Inc., an unrealized loss of $9.8 million on an available-for-sale equity security that had been trading below carrying value for an extended period and for which management does not intend to hold for a sufficient period of time to reasonably expect a recovery to initial carrying value and an unrealized loss of $5.0 million on the write-down in carrying value of shares held in a private biotechnology company classified as long term investments. The write-down or net loss on redemption of investments for the year ended December 31, 2007 of $8.2 million is comprised of a loss of $9.6 million realized on the sale of our common stock holdings in Orthovita, Inc., partially offset by a gain of $1.4 million realized on the sale of our common stock holdings in NuVasive, Inc.
Income Tax
Income tax expense for the year ended December 31, 2009 was $6.0 million compared to an income tax recovery of $12.9 million for the year ended December 31, 2008. The income tax expense for 2009 is primarily due to net income in 2009 from U.S. and foreign operations and includes the recognition of a $6.1 million prepaid tax charge relating to taxes paid in prior years in connection with an inter-company transfer of the intellectual property underlying the transaction with Baxter.
The effective tax rate for 2009 differs from than the statutory Canadian tax rate of 30.0%, primarily due to valuation allowances on net operating losses and the net effect of lower tax rates on earnings in foreign jurisdictions.
For the year ended December 31, 2009, income tax expense of $6.0 million consisted of a current and deferred income tax expense of $0.6 million on a net loss from Canadian operations and a current and deferred income tax expense of $5.4 million on net income from U.S. and foreign operations.
Income tax recovery for the year ended December 31, 2008 was $12.9 million compared to income tax recovery of $14.5 million for the year ended December 31, 2007. The income tax recovery for 2008 is primarily due to a net loss from operations, the amortization of identifiable intangible assets, tax deductions relating to international financing structures, and a recovery of taxes paid in prior years as a result of the carryback of current year losses. The income tax recovery for 2008 also includes a recovery of $3.8 million relating to the settlement of an outstanding Quebec income tax reassessment and a charge of $6.1 million related to an accrual under FIN 48.
The effective tax rate for 2008 is lower than the statutory Canadian tax rate of 31.0%, primarily due to valuation allowances on net operating losses, tax deductions related to international financing structures, provincial income tax credits, the net effect of lower tax rates on earnings in foreign jurisdictions, and goodwill impairment charges.
For the year ended December 31, 2008, income tax recovery of $12.9 million consisted of a current and deferred income tax recovery of $6.2 million on a net loss from Canadian operations and a current and deferred income tax recovery of $6.7 million on net losses from U.S. and foreign operations.
Discontinued Operations
In September 2006, we determined that certain operating subsidiaries acquired through our acquisition of American Medical Instruments Holdings, Inc. (“AMI”) were not aligned with our business strategy and we began actively looking to dispose of these subsidiaries. The operations were categorized as discontinued and the net loss for these operations has been shown separately on the statements of operations of these subsidiaries. On July 31, 2007, we completed the sale of 100% of the issued and outstanding shares of Point Technologies, Inc. and its subsidiary Point Technologies S.A. for proceeds of $2.6 million. On August 30, 2007, we sold all of the assets and liabilities of American Medical Instruments (Dartmouth, MA), Inc. for proceeds of $2.2 million.
67
Table of Contents
The operating results of discontinued operations are summarized as follows:
| (in thousands of U.S.$) |
Year ended December 31, 2007 |
|||
| Revenue |
$ | 7,580 | ||
| Operating loss |
(632 | ) | ||
| Other income and expense |
(1,991 | ) | ||
| Impairment charge |
(8,879 | ) | ||
| Loss before income taxes |
(11,502 | ) | ||
| Income tax recovery |
(1,609 | ) | ||
| Net loss from discontinued operations |
$ | (9,893 | ) | |
Liquidity and Capital Resources
At December 31, 2009, we had working capital of $66.5 million and cash resources of $49.5 million, consisting of cash and cash equivalents. In aggregate, our working capital increased by $14.7 million as compared to December 31, 2008, primarily due to the $25.0 million in cash received pursuant to the transaction with Baxter in the first quarter of 2009, offset by the net loss for the year ended December 31, 2009.
We maintain a revolving credit facility with Wells Fargo. The total potential available credit under the revolving credit facility is $25.0 million (subject to a borrowing base formula based on certain of our and our subsidiaries’ finished goods inventory and accounts receivable). As of December 31, 2009, the amount of financing available under the revolving credit facility was approximately $12.6 million, which is net of a $1.5 million letter of credit issued under the revolving credit facility. As of December 31, 2009, there were no borrowings outstanding under the revolving credit facility.
Our cash resources and any borrowings available under the revolving credit facility, in addition to cash generated from operations or cash available per commitments of certain of our creditors, are used to support our continuing clinical studies, research and development initiatives, sales and marketing initiatives, working capital requirements, debt servicing requirements and for general corporate purposes. We may also use our cash resources to fund acquisitions of, or investments in, businesses, products or technologies that expand, complement or are otherwise related to our business.
At any time, the amount of financing available under the revolving credit facility, which is secured by certain of our inventory and accounts receivable assets, may be significantly less than $25.0 million and is expected to fluctuate from month to month with changes in levels of certain finished goods and accounts receivable. Any borrowings outstanding under the revolving credit facility bear interest ranging from LIBOR + 3.25% to LIBOR + 3.75%, with a minimum Base LIBOR Rate of 2.25%. As the minimum Base LIBOR Rate under the revolving credit facility is 2.25% and the LIBOR rate was 0.25% on December 31, 2009, a 0.50% increase or decrease in the LIBOR rate as of December 31, 2009 would have no impact on interest payable under the credit facility. The revolving credit facility includes certain covenants and restrictions with respect to our operations and requires us to maintain certain levels of Adjusted EBITDA and interest coverage ratios, among other terms and conditions. A breach of any of these covenants could result in the Company’s inability to draw on the facility or the immediate repayment of any then outstanding principal and interest. Repayment of any amounts drawn under the revolving credit facility can be made at certain points in time with ultimate maturity being February 27, 2013. Prepayments made under the revolving credit facility in certain circumstances cannot be re-borrowed by us. We maintain this facility to provide additional liquidity and capital resources for working capital and general corporate purposes in the near term and more flexibility and time to explore other longer-term options for our overall capital structure and working capital needs.
On July 23, 2009, we announced that we had filed a shelf registration statement on Form S-3 with the SEC and a corresponding preliminary short form base shelf prospectus with the securities commissions of British Columbia
68
Table of Contents
and Ontario. On December 7, 2009, the shelf registration statement on Form S-3 (as amended by our Amendment No.1 on Form S-3/A) was declared effective by the SEC and we filed a final short form base shelf prospectus with the securities commissions of British Columbia and Ontario. The Offering Documents allow us to make offerings of Common shares, Class I Preference shares, debt securities, warrants or units for initial aggregate proceeds of up to $250.0 million to potential purchasers in British Columbia, Ontario and the U.S. We believe that having the ability to issue these securities gives us the flexibility to raise capital quickly and effect other long-term changes to our capital structure that we may deem advisable in the future. However, there is no assurance that the company will be able to complete any such offerings.
Due to numerous factors that may impact our future cash position, working capital and liquidity as discussed below and the significant cash that will be necessary to continue to service our current level of debt obligations, there can be no assurance that we will have adequate liquidity and capital resources to satisfy our financial obligations beyond 2010.
Our cash inflows and the amounts of expenditures that will be necessary to execute our business plan are subject to numerous uncertainties, including but not limited to changes in drug-eluting coronary stent markets, including the impact of increased competition in such markets and research relating to the efficacy of drug-eluting stents, the sales achieved in such markets by our partner BSC, the timing and success of product sales and marketing initiatives and new product launches, the timing and success of our research, product development and clinical trial activities, the timing of completing certain operational initiatives including facility closures, our ability to effect reductions in certain aspects of our budgets in an efficient and timely manner, changes in interest rates and regulatory or legislative changes. These and other uncertainties may adversely affect our liquidity and capital resources to a significant extent and may force us to further reduce our expenditures on research and development or on our various new product and sales and marketing initiatives in order for us to continue to service our debt obligations. Such further reductions in our budgeted expenditures may have an adverse effect on our new product development and sales growth initiatives and reduce our ability to achieve the revenue growth targets, product launch or new product development timelines in our current operating plan. There can also be no assurance that such reductions in expenditures will be adequate to provide sufficient cash flow to continue to service our current level of debt obligations.
In particular, should our royalties received from BSC decline more significantly than we expect in future periods as a result of competition in the drug-eluting stent market or due to negative research or publications relating to the efficacy of drug-eluting stents, our liquidity may continue to be adversely affected, and we may be forced to explore alternative funding sources through debt, equity or other public or private securities offerings, or to pursue certain reorganization, restructuring or other strategic or financial alternatives. We may not be able to complete any restructuring, reorganization or strategic activities on terms that would be favorable for our current lenders or our shareholders. Capital markets conditions deteriorated significantly during 2008 and 2009, including a significant and material decline in the level of corporate lending activity, combined with a significant increase in the cost of any such lending, and current conditions continue to be challenging for us. Current and future market conditions may have a material effect on our ability to complete any of the activities as described on favorable terms, if at all.
As a result of uncertainty and volatility relating to the market and competitive environment for drug-eluting stents and to address our liquidity needs, we continue to assess a broad range of strategic and financial alternatives (see “Business Overview — Financial and Strategic Alternatives Process”).
69
Table of Contents
Cash Flow Highlights
| (in thousands of U.S.$) |
Years ended December 31, | |||||||||||
| 2009 | 2008 | 2007 | ||||||||||
| Cash and cash equivalents, beginning of year |
$ | 38,952 | $ | 91,326 | $ | 99,332 | ||||||
| Cash provided by (used in) operating activities |
21,971 | (38,007 | ) | (5,562 | ) | |||||||
| Cash (used in) provided by investing activities |
(8,187 | ) | (8,239 | ) | 259 | |||||||
| Cash used in financing activities |
(3,400 | ) | (4,378 | ) | (1,637 | ) | ||||||
| Effect of exchange rate changes on cash |
206 | (1,750 | ) | (1,066 | ) | |||||||
| Net increase (decrease) in cash and cash equivalents |
10,590 | (52,374 | ) | (8,006 | ) | |||||||
| Cash and cash equivalents, end of year |
$ | 49,542 | $ | 38,952 | $ | 91,326 | ||||||
Cash Flows from Operating Activities
Cash provided by operating activities for the year ended December 31, 2009 was $22.0 million compared to cash used in operating activities of $38.0 million for the year ended December 31, 2008. The increase in cash provided by operating activities of $60.0 million was due primarily to: (i) the one-time cash payment of $25.0 million received from Baxter in the first quarter of 2009; (ii) a lower net loss resulting from reduced research and development and selling, general and administrative costs, offset by a reduction of royalty revenue; and (iii) a $25.7 million improvement in cash from changes in working capital. Working capital changes during the year ended December 31, 2009 included net cash outflows from accounts receivable of $2.1 million due primarily to sales growth of our Quill SRS product line and our Option IVC Filter during the year, net cash outflows from accounts payable and accrued liabilities of $5.4 million due to payments made during the period, net cash inflows resulting from lower inventory of $3.2 million, net cash inflows of $1.7 million relating to income taxes payable and net cash inflows of $7.6 million relating to prepaid expenses and other assets due to non-cash tax expense.
Cash used in operating activities for the year ended December 31, 2008 was $38.0 million compared to cash used of $5.6 million for the year ended December 31, 2007. Net loss for the year ended December 31, 2008, excluding non-cash items, resulted in cash outflows of $16.9 million compared to cash outflows of $14.7 million for the year ended December 31, 2007. The increase in cash used in operating activities was due to factors consistent with those that impacted net loss, as described above under “Results of Operations — Overview”. Working capital requirements resulted in net cash outflows of $21.1 million during 2008 compared to net cash inflows of $9.1 for 2007. The net cash outflows in 2008 primarily resulted from a $5.5 million increase during the year in trade accounts receivable, consistent with the increase in medical product sales as compared to 2007, an increase of $5.1 million during the year of inventory balances built in order to meet production requirements for certain of our medical products in the U.S. and E.U. and a decrease of $12.5 million in accounts payable and accrued liabilities due to lower spending.
Cash Flows from Investing Activities
Net cash used in investing activities for the year ended December 31, 2009 was $8.2 million compared to net cash used of $8.2 million for the year ended December 31, 2008. For the year ended December 31, 2009, the net cash used in investing activities was primarily for capital expenditures of $4.4 million. In addition, payments were made to our partners Rex Medical and Haemacure of $2.5 million and $1.6 million, respectively during 2009.
Net cash used in investing activities for the year ended December 31, 2008 was $8.2 million compared to net cash provided of $0.3 million for the year ended December 31, 2007. For 2008, the net cash used in investing activities was primarily related to capital expenditures of $7.7 million. We also paid a $0.8 million licensing milestone to a partner upon our successful completion of enrollment in our Bio-Seal human clinical trial and invested $2.5 million in IPR&D for an initial license payment to Rex Medical. These cash outflows were offset by proceeds on sale of short-term investments of $2.8 million.
70
Table of Contents
Depending on the level of our cash portfolio, we may invest our excess cash in short-term marketable securities, principally investment grade commercial debt and government agency notes. Investments are made with the secondary objective of achieving the highest rate of return while meeting our primary objectives of liquidity and safety of principal. Our investment policy limits investments to certain types of instruments issued by institutions with investment grade credit ratings and places restrictions on maturities and concentration by type and issuer. At December 31, 2009, we were not holding any short-term marketable securities.
At December 31, 2009 and December 31, 2008, we retained the following cash and cash equivalents denominated in foreign currencies in order to meet our anticipated foreign operating and capital expenditures in future periods.
| (in thousands of U.S.$) |
December 31, 2009 |
December 31, 2008 | ||||
| Canadian dollars |
$ | 5,542 | $ | 3,942 | ||
| Swiss franc |
986 | 3,053 | ||||
| Euro |
5,680 | 5,263 | ||||
| Danish krone |
412 | 2,022 | ||||
| Other |
2,587 | 2,806 | ||||
Cash Flows from Financing Activities
Net cash used in financing activities for the year ended December 31, 2009 was $3.4 million, primarily for expenditures related to our revolving credit facility (see “Liquidity and Capital Resources” above and note 14(f) to the audited consolidated financial statements for the year ended December 31, 2009).
Net cash used in financing activities for the year ended December 31, 2008 was $4.4 million, primarily for expenditures related to an abandoned financing transaction, as well as expenditures related to the credit facility announced on March 2, 2009 (see “Liquidity and Capital Resources” above and note 14(f) to the audited consolidated financial statements for the year ended December 31, 2009). The expenditures related to the abandoned financing transaction had been capitalized as part of deferred financing costs related to the transaction, but were expensed in late 2008 based upon our September 22, 2008 announcement that we would not be able to satisfy certain closing conditions of the proposed transaction. These cash outflows were offset with a small amount of cash received on the exercise of employee stock options.
Long-Term Debt
(a) Senior Floating Rate Notes
On December 11, 2006, we issued Floating Rate Notes in the aggregate principal amount of $325 million. The Floating Rate Notes bear interest at an annual rate of LIBOR plus 3.75%, which is reset quarterly. Interest is payable quarterly in arrears on March 1, June 1, September 1, and December 1 of each year through to maturity. The Floating Rate Notes are unsecured senior obligations, are guaranteed by certain of our subsidiaries and rank equally in right of payment to all of our existing and future senior indebtedness. At December 31, 2009, the interest rate on these notes was 4.01%. We may redeem all or a part of the notes at specified redemption prices.
(b) Senior Subordinated Notes
On March 23, 2006, we issued 7.75% Senior Subordinated Notes due 2014 (the “Subordinated Notes”) in the aggregate principal amount of $250.0 million. These Subordinated Notes bear interest at an annual rate of 7.75% payable semi-annually in arrears on April 1 and October 1 of each year through to maturity. The Subordinated Notes are unsecured obligations. The Subordinated Notes and related note guarantees provided by us and certain of our subsidiaries are subordinated to our Floating Rate Notes described above, our existing and future senior indebtedness. We may redeem all or a part of the notes at specified redemption prices.
71
Table of Contents
(c) Proforma Interest Expense
The following table (unaudited) shows the estimated interest payable for both the Senior Floating Rate Notes and the Senior Subordinated Notes over the next five years, assuming a December 31, 2009 base LIBOR rate of 0.25% as well as the impact on the estimated interest payable of a 0.5% increase or a 0.25% decrease in the base LIBOR rate:
| (unaudited) | ||||||
| Year |
Base LIBOR | 0.5% Increase in base LIBOR |
0.25% Decrease in base LIBOR | |||
| 2010 |
32,556 | 34,203 | 31,732 | |||
| 2011 |
32,556 | 34,203 | 31,732 | |||
| 2012 |
32,556 | 34,203 | 31,732 | |||
| 2013 |
31,436 | 32,944 | 30,682 | |||
| 2014 |
4,844 | 4,844 | 4,844 | |||
(d) Debt Covenants
The terms of the indentures governing our Floating Rate Notes and our Subordinated Notes include various covenants that impose restrictions on the operation of our business and the business of our subsidiaries, including the incurrence of certain liens and other indebtedness.
In addition, our revolving credit facility includes a number of customary financial covenants, including a requirement to maintain certain levels of adjusted earnings before interest, taxes, depreciation and amortization (“Adjusted EBITDA”) and interest coverage ratios, as well as covenants that limit our ability to, among other things, incur indebtedness, create liens, merge or consolidate, sell or dispose of assets, change the nature of our business, make distributions or make advances, loans or investments.
Contractual Obligations
At December 31, 2009, our significant contractual obligations for the next five years and thereafter include:
| (in thousands of U.S.$) |
Payments due by period | |||||||||
| Total | Less than 1 year | 1 to 3 years | 3 to 5 years | More than 5 years | ||||||
| Long-term debt repayments |
575,000 | — | — | 575,000 | — | |||||
| Long-term debt interest obligations |
133,947 | 32,556 | 65,111 | 36,280 | — | |||||
| Operating leases |
26,192 | 3,559 | 6,051 | 5,774 | 10,807 | |||||
| Other tax liability |
3,898 | — | — | — | 3,898 | |||||
| Total obligations |
739,037 | 36,115 | 71,162 | 617,054 | 14,705 | |||||
Long-term debt includes $325.0 million of Floating Rate Notes and $250.0 million of Subordinated Notes. Repayments are based on contractual commitments as defined in the indentures governing the notes. Long-term debt interest obligations on variable (floating) rate debt are estimated using the current interest rates in effect at December 31, 2009. Long-term debt repayments and interest obligations assume no early repayment of principal.
We have entered into operating leases in the ordinary course of business for office and laboratory space with various third parties. The longest term of these leases will expire in July 2019.
The table above does not include any cost sharing or milestone payments in connection with research and development collaborations with third parties as these payments are contingent on the achievement of specific developmental, regulatory or commercial activities and milestones as described in note 18(a)(ii) to the 2009 annual audited financial statements. In addition, we may have to make royalty payments based on a percentage of future sales of certain products in the event regulatory approval for marketing is obtained.
72
Table of Contents
Contingencies
We are party to various legal proceedings, including patent infringement litigation and other matters. See Part I, Item 3 and Note 18(b) “Contingencies”, in the Notes to the Consolidated Financial Statements of Part II, Item 8 of this Annual Report on Form 10-K for more information.
Inflation
The effects of inflation or changing prices have not had a material impact on our net sales, revenues or income from continuing operations for the last three years.
Off-Balance Sheet Arrangements
As of December 31, 2009, we do not have any off-balance sheet arrangements, as defined by applicable securities regulators in Canada and the U.S., that have, or are reasonably likely to have, a current or future effect on our financial condition, changes in financial condition, revenues or expenses, results of operations, liquidity, capital expenditures or capital resources that would be material to investors.
Recently Adopted Accounting Policies
The Company currently accounts for business combinations in accordance with ASC No. 805 — Business Combinations. New guidance was issued under ASC No. 805 which changes accounting for business combinations by requiring acquiring entities to recognize all assets acquired and liabilities assumed in a transaction at the acquisition-date fair value with limited exceptions. This includes a change in the accounting treatment and disclosure of specific items in a business combination. Furthermore, the new guidance amends and clarifies the initial recognition and measurement, subsequent measurement and accounting, and related disclosures related to the treatment of assets and liabilities which are assumed in a business combination and arise from contingencies. ASC No. 805 applies prospectively to business combinations for which the acquisition date is on or after the beginning of the first annual reporting period beginning on or after December 15, 2008. We have adopted this standard without material impact to our 2009 consolidated financial results.
Effective January 1, 2009, the Company has adopted ASC No. 350-30, Intangibles — Goodwill and Other and ASC No. 805-20-20, Business Combinations — Identifiable Assets and Liabilities and Any Noncontrolling interest. This standard considers how defensive intangible assets should be accounted for subsequent to their acquisition, including the estimated useful life that should be assigned to such assets.
Under ASC 820-10 — Fair Value Measurements and Disclosures, the effective date for the adoption of the fair value measurement framework was deferred by the SEC for certain non-financial assets and non-financial liabilities, due to implementation difficulties, to years beginning after November 15, 2008 and interim periods within those years. The guidance was adopted January 1, 2009 with no impact to the Company’s consolidated financial statements.
Effective January 1, 2009, the Company adopted the new guidance under ASC No. 808-10 — Collaborative Arrangement, which requires collaborators to present the results of activities for which they act as the principal on a gross basis. Any payments received from (made to) other collaborators should be recorded in accordance with other applicable GAAP or, in the absence of other applicable GAAP, guidance provided by authoritative accounting literature or a reasonable, rational, and consistently applied accounting policy. Furthermore, the standard clarifies whether transactions under a collaborative arrangement are part of a vendor-customer (or analogous) relationship and addresses appropriate income statement classification and disclosures related to these arrangements. ASC 808-10 is effective for fiscal years beginning December 15, 2008. This standard had no impact on the Company’s financial results given that it relates to disclosure and presentation only.
Effective January 1, 2009, the Company adopted the new guidance under ASC 275-10-50 — Risks and Uncertainties Disclosure and ASC 350, Intangibles — Goodwill and Other. ASC 275-10-50 amends the factors
73
Table of Contents
that should be considered in developing renewal or extension assumptions used to determine the useful life of a recognized intangible asset under ASC No. 350. The intent of the position is to improve the consistency between the useful life of a recognized intangible asset under ASC No. 350 and the period of expected cash flows used to measure the fair value of the intangible asset. ASC No. 275-10-50 and ASC No. 350 are effective for fiscal years beginning after December 15, 2008. Adoption of this standard had no material impact on our consolidated balance sheets, results of operations or cash flows.
For the quarter ended September 30, 2009, the Company adopted the amended disclosures about the fair value of financial instruments under ASC No. 825-10-65-1— Financial Instruments. The new guidance is applicable to interim reporting periods of publicly traded companies as well as the annual financial statements. This standard had no impact on our financial results given that it relates to disclosure and presentation only.
The Company adopted ASC No. 320-10-65-1, Investments — Debt and Equity Securities. This standard amends the impairment guidance for certain debt securities and requires an investor to assess the likelihood of selling the security prior to recovering the cost base. If the investor is able to sufficiently demonstrate that it will not have to sell the security before recovery, impairment charges related to non-credit losses would be reflected in other comprehensive income. The standard also expands and increases disclosure requirements related to debt and equity securities. Adoption of this standard during the quarter ended September 30, 2009 had no material impact on our consolidated balance sheets, results of operations or cash flows.
The Company has adopted ASC No. 820-10-65, Fair Value Measurements and Disclosures on a prospective basis on July 1, 2009. This section provides additional guidance on fair value measurements in inactive markets. The new approach is designed to address whether a market is inactive, and if so, whether a transaction in that market should be considered distressed. It also provides additional guidance on how fair value measurements might be determined in an active market. Adoption of this standard had no material impact on our consolidated balance sheets, results of operations or cash flows.
In August 2009 the FASB issued an accounting standard update on measuring liabilities at fair value under ASC No. 820, Fair Value Measurements and Disclosures. The update provides clarification on how to measure the fair value of a liability when a quoted price for an identical liability is not available in an active market. This includes a discussion of appropriate valuation techniques. ASC No. 820 is effective for reporting periods, including interim periods, beginning after August 26, 2009. Given that the Company did not elect the fair value option of any of its liabilities, the adoption of this standard had no impact on the valuation of the Company’s liabilities.
Future Accounting Pronouncements
In June 2009, the FASB issued a new standard under ASC No. 810-10 — Consolidation which changes the consolidation model for VIE’S. The revised model increases the qualitative analysis required when identifying which entity is the primary beneficiary that has (i) the power to direct the activities of a VIE that most significantly impact the entity’s economic performance and (ii) the obligation to absorb losses or the right to receive benefits from the VIE. The new standard eliminates the QSPE exemption, requires ongoing reconsideration of the primary beneficiary and amends the events which trigger reassessment of whether an entity is a VIE. The new guidance is effective for annual and interim periods beginning after November 15, 2009. We are assessing the potential impact that the adoption of this standard may have on our consolidated financial position, results of operations or cash flows.
In October 2009, the FASB issued ASU No. 2009-13, Multiple-Deliverable Revenue Arrangements, under ASC No. 605. The new guidance provides a more flexible alternative to identify and allocate consideration among multiple elements in a bundled arrangement when vendor-specific objective evidence or third-party evidence of selling price is not available. ASU No. 2009-13 requires the use of the relative selling price method and eliminates the residual method to allocation arrangement consideration. Additional expanded qualitative and quantitative disclosures are also required. The guidance is effective prospectively for revenue arrangements
74
Table of Contents
entered into or materially modified in years beginning on or after June 15, 2010. We are assessing the potential impact that the adoption of ASU No. 2009-13 may have on our consolidated balance sheets, results of operations and cash flows.
Outstanding Share Data
As of December 31, 2009, there were 85,138,081 common shares issued and outstanding for a total of $472.7 million in share capital. At December 31, 2009, we had 5,171,709 CDN dollar stock options, and stock options with tandem stock appreciation rights, which we refer to as awards, outstanding under the Angiotech Pharmaceuticals, Inc. stock option plan (of which 2,723,882 were exercisable) at a weighted average exercise price of CDN$5.99. We also had 2,984,748 U.S. dollar awards outstanding under this plan at December 31, 2009 (of which 921,891 were exercisable), at a weighted average exercise price of US$1.64. Pursuant to the 2006 Stock Incentive Plan, holders of each CDN dollar award and U.S. dollar award issued on or after October 1, 2002 may exercise their tandem stock appreciation right instead of the underlying stock option. The holder exercising the underlying stock option receives one common share of Angiotech Pharmaceuticals, Inc. for each option exercised. The holder exercising the tandem stock appreciation right portion of an award receives a portion of a common share of Angiotech Pharmaceuticals, Inc. with a fair value equal to the excess of the fair value of the common share subject to the underlying option at the time of exercise over the option price as set forth in the option agreement. Holders of each CDN dollar stock option issued prior to October 1, 2002 may exercise each option for one common share of Angiotech Pharmaceuticals, Inc.
As of December 31, 2009, there were 78 stock options outstanding in the AMI stock option plan (of which 29 were exercisable). Each AMI stock option is exercisable for approximately 3,852 common shares of Angiotech Pharmaceuticals, Inc. at a weighted average exercise price of US$15.44 per option.
75
Table of Contents
| QUANTITATIVE AND QUALITATIVE DISCLOSURES ABOUT MARKET RISK |
The primary objective of our investment activities is to preserve our capital to fund operations. We also seek to maximize income from our investments without assuming significant risk. To achieve our objectives, we maintain a portfolio of cash equivalents and investments in a variety of securities of high credit quality. As of December 31, 2009, we had cash and cash equivalents of $49.5 million.
Interest Rate Risk
As the issuer of the Floating Rate Notes, we are exposed to interest rate risk. The interest rate on the Floating Rate Notes is reset quarterly to 3-month LIBOR plus 3.75%. The aggregate principal amount of the Floating Rate Notes is $325 million and the notes bear interest at a rate of approximately 4.01% at December 31, 2009 (6.0% at December 31, 2008). Based upon the average floating rate debt levels of the Company during the year, a 100 basis point increase in interest rates would have impacted our interest expense by approximately $3.3 million for each of the years ended December 31, 2009 and 2008. We do not use derivatives to hedge against interest rate risk.
Foreign Currency Risk
We operate internationally and enter into transactions denominated in foreign currencies. As such, our financial results are subject to the variability that arises from exchange rate movements in relation to the U.S. dollar. Our foreign currency exposures are primarily limited to the Canadian dollar, the Swiss franc, the Danish kroner, the Euro and the U.K. pound sterling. We incurred foreign exchange loss of $1.6 million for the year ended December 31, 2009 (December 31, 2008 - $0.5 million foreign exchange gain) primarily as a result of changes in the relationship of the U.S. to Canadian dollar and other foreign currency exchange rates when translating our foreign currency-denominated cash, cash equivalents and short-term investments to U.S. dollars for reporting purposes at period end. We have not entered into any forward currency contracts or other financial derivatives to hedge foreign exchange risk, and therefore we are subject to foreign currency transaction and translation gains and losses. We purchase goods and services in U.S. and Canadian dollars, Swiss francs, Danish kroner, Euros, and U.K. pounds sterling, and earn a significant portion of our license and milestone revenues in U.S. dollars. Foreign exchange risk is managed primarily by satisfying foreign denominated expenditures with cash flows or assets denominated in the same currency.
Since we operate internationally and approximately 11.4% of our net revenue for the year ended December 31, 2009 was generated in other than the U.S. dollar, foreign currency exchange rate fluctuations could significantly impact our financial position, results of operations, cash flows and competitive position.
For purposes of specific risk analysis, we used a sensitivity analysis to measure the potential impact to our consolidated financial statements for a hypothetical 10% strengthening of the U.S. dollar compared within the other currencies which we denominate product sales in for the year ended December 31, 2009. Assuming a 10% strengthening of the U.S. dollar, our product net revenue would have been negatively impacted by approximately $2.9 million.
| FINANCIAL STATEMENTS AND SUPPLEMENTARY DATA |
The consolidated financial statements and financial statement schedules in Part IV, Item 15(a) (1) and (2) of this report are incorporated by reference into this Item 8.
Management’s Report on Internal Control over Financial Reporting
See index to financial statements included under Item 15 in this Annual Report on Form 10-K.
76
Table of Contents
| CHANGES IN AND DISAGREEMENTS WITH ACCOUNTANTS ON ACCOUNTING AND FINANCIAL DISCLOSURE |
None.
| CONTROLS AND PROCEDURES |
(a) Evaluation of Disclosure Controls and Procedures.
Based upon an evaluation of the effectiveness of disclosure controls and procedures, our Chief Executive Officer (“CEO”) and Chief Financial Officer (“CFO”) have concluded that as of the end of the period covered by this Form 10-K our disclosure controls and procedures (as defined in Rules 13a-15(e) or 15d-15(e) under the Exchange Act) were effective to provide reasonable assurance that information required to be disclosed in our Exchange Act reports is recorded, processed, summarized and reported within the time periods specified by the rules and forms of the SEC and is accumulated and communicated to management, including the CEO and CFO, as appropriate to allow timely decisions regarding required disclosure.
It should be noted that the design of any system of controls is based in part upon certain assumptions about the likelihood of future events, and there can be no assurance that any design will succeed in achieving its stated goals under all potential future conditions, regardless of how remote. However, our CEO and CFO have concluded that our disclosure controls and procedures are effective under circumstances where our disclosure controls and procedures should reasonably be expected to operate effectively.
(b) Management’s Report on Internal Control over Financial Reporting
Our management is responsible for establishing and maintaining adequate internal control over financial reporting (as defined in Rule 13a-15(f) under the Exchange Act) to provide reasonable assurance regarding the reliability of our financial reporting and the preparation of financial statements for external purposes in accordance with generally accepted accounting principles.
Due to its inherent limitations, internal control over financial reporting may not prevent or detect misstatements. Also, projections of any evaluation of effectiveness to future periods are subject to the risk that controls may become inadequate due to changes in conditions, or that the degree of compliance with the policies or procedures may deteriorate.
Under the supervision and with the participation of our management, including our CEO and CFO, we conducted an evaluation of the effectiveness of our internal control over financial reporting using the criteria set forth by the Committee of Sponsoring Organizations of the Treadway Commission in Internal Control — Integrated Framework. Based on its evaluation, our management concluded that our internal control over financial reporting was effective as of December 31, 2009.
The effectiveness of our internal control over financial reporting as of December 31, 2009 has been audited by PricewaterhouseCoopers LLP, an independent registered public accounting firm, as stated in its report which appears herein.
(c) Changes in Internal Control over Financial Reporting
No change was made to our internal control over financial reporting during the fiscal quarter ended December 31, 2009 that has materially affected, or is reasonably likely to materially affect, such internal control over financial reporting.
| OTHER INFORMATION |
None
77
Table of Contents
| DIRECTORS, EXECUTIVE OFFICERS AND CORPORATE GOVERNANCE |
The information required by this Item is set forth under the captions “Election of Directors” and “Corporate Governance” in our definitive Proxy Statement, which will be filed with the SEC pursuant to Regulation 14A under the Exchange Act and is incorporated herein by reference.
| EXECUTIVE COMPENSATION |
The information required by this Item is set forth under the captions “Executive Compensation”, and “Corporate Governance” in our definitive Proxy Statement, which will be filed with the SEC pursuant to Regulation 14A under the Exchange Act and is incorporated herein by reference.
| SECURITY OWNERSHIP OF CERTAIN BENEFICIAL OWNERS AND MANAGEMENT AND RELATED STOCKHOLDER MATTERS |
The information required by this Item is set forth under the caption “Security Ownership of Certain Beneficial Owners and Management and Related Stockholder Matters” in our definitive Proxy Statement, which will be filed with the SEC pursuant to Regulation 14A under the Exchange Act and is incorporated herein by reference.
| CERTAIN RELATIONSHIPS AND RELATED TRANSACTIONS, AND DIRECTOR INDEPENDENCE |
The information required by this Item is set forth under the captions “Certain Relationships and Related Transactions” and “Corporate Governance” in our definitive Proxy Statement, which will be filed with the SEC pursuant to Regulation 14A under the Exchange Act and is incorporated herein by reference.
| PRINCIPAL ACCOUNTANT FEES AND SERVICES |
The information required by this Item is set forth under the caption “Appointment of Auditors” in our definitive Proxy Statement, which will be filed with the SEC pursuant to Regulation 14A under the Exchange Act and is incorporated herein by reference.
78
Table of Contents
| EXHIBITS AND FINANCIAL STATEMENT SCHEDULES |
| (a) |
The following documents are included as part of this Annual Report on Form 10-K. |
| (1) |
Financial Statements: |
| † |
Page numbers refer to Exhibit 13 of this Annual Report on Form 10-K. |
| (2) |
Financial Statement Schedule: |
| Page † | ||
| Schedule II — Valuation of Qualifying Accounts for the years ended December 31, 2009, 2008 and 2007 |
F-48 |
| † |
Page numbers refer to Item F of this Annual Report on Form 10-K. |
All other schedules are omitted as the information required is inapplicable or the information is presented in the consolidated financial statements or related notes.
| (3) |
Exhibits: |
The exhibits listed below are filed as part of this Annual Report on Form 10-K. References under the caption “Location” to exhibits or other filings indicate that the exhibit or other filing has been filed, that the indexed exhibit and the exhibit or other filing referred to are the same and that the exhibit or other filing referred to is incorporated by reference. Management contracts and compensatory plans or arrangements filed as exhibits to this Annual Report on Form 10-K are identified by an asterisk. The Commission file number for our Exchange Act filings referenced below is 000-30334.
| Exhibit |
Description |
Location | ||
| 3.1 |
Notice of Articles of Angiotech Pharmaceuticals, Inc. |
Exhibit 4.1, Form S-3 | ||
| 3.2 |
Articles of Angiotech Pharmaceuticals, Inc. |
Exhibit 3, Form 6-K | ||
| 3.3 |
Amendment to the Articles of Angiotech Pharmaceuticals, Inc. |
Exhibit 4.3, Form S-3 | ||
| 4.1 |
Indenture dated March 23, 2006 among Angiotech Pharmaceuticals, Inc., certain of its subsidiaries and Wells Fargo Bank N.A., for 7.75% Senior Subordinated Notes due 2014 |
Exhibit 99.2, Form 6-K | ||
| 4.2 |
Indenture dated December 11, 2006 among Angiotech Pharmaceuticals, Inc., certain of its subsidiaries and Wells Fargo Bank N.A., for Senior Floating Rate Notes due 2013 |
Exhibit 2, Form 6-K | ||
79
Table of Contents
| Exhibit |
Description |
Location | ||
| 4.3 |
Shareholder Rights Plan Agreement between Angiotech Pharmaceuticals, Inc. and Computershare Trust Company of Canada as Rights Agent, Amended and Restated as of October 30, 2008 |
Exhibit 4.3, Form 10-K | ||
| 10.1 |
Credit Agreement, dated as of February 27, 2009, by and among Angiotech Pharmaceuticals, Inc., as Parent, the subsidiaries of Parent listed as borrowers on the signature pages thereto, as Borrowers, the lenders signatory thereto, as Lenders, and Wells Fargo Foothill, LLC, as Arranger and Administrative Agent |
Exhibit 10.1, Form 8-K | ||
| 10.2 |
First Amendment, dated as of May 29, 2009, to Credit Agreement, dated as of February 27, 2009, by and among Angiotech Pharmaceuticals, Inc., as Parent, the subsidiaries of Parent listed as borrowers on the signature pages thereto, as Borrowers, the lenders signatory thereto, as Lenders, and Wells Fargo Foothill, LLC, as Arranger and Administrative Agent |
Exhibit 10.1, Form 8-K | ||
| 10.3 |
License Agreement by and among Angiotech Pharmaceuticals, Inc., Boston Scientific Corporation and Cook Incorporated, dated as of July 9, 1997 |
Exhibit, Form 20-FR | ||
| 10.4 |
September 24, 2004 Amendment Between Angiotech Pharmaceuticals, Inc. and Cook Incorporated Modifying July 9, 1997 License Agreement Among Angiotech Pharmaceuticals, Inc., Boston Scientific Corporation, and Cook Incorporated** |
Exhibit 10.3, Form 10-K | ||
| 10.5 |
Amendment Between Angiotech Pharmaceuticals, Inc. and Boston Scientific Corporation Modifying July 9, 1997 License Agreement Among Angiotech Pharmaceuticals, Inc., Boston Scientific Corporation, and Cook Incorporated |
Exhibit 10.4, Form 10-K | ||
| 10.6 |
Distribution and License Agreement by and among Angiodevice International GmbH (as assignee of Angiotech Pharmaceuticals, Inc., Angiotech International, GmbH, and Cohesion Technologies, Inc.), Baxter Healthcare Corporation and Baxter Healthcare, S.A., dated April 1, 2003** |
Exhibit 10.5, Form 10-K | ||
| 10.7 |
Manufacturing and Supply Agreement, by and among Angiodevice International GmbH (as assignee of Angiotech Pharmaceuticals, Inc., Angiotech International, GmbH, and Cohesion Technologies, Inc.), Baxter Healthcare Corporation and Baxter Healthcare, S.A., dated April 1, 2003** |
Exhibit 10.6, Form 10-K | ||
| 10.8 |
Amendment No. 1 dated December 23, 2004 to Distribution and License Agreement, by and among Angiodevice International GmbH (as assignee of Angiotech Pharmaceuticals, Inc., Angiotech International, GmbH, and Cohesion Technologies, Inc.), Baxter Healthcare Corporation and Baxter Healthcare, S.A., dated April 1, 2003 |
Exhibit 10.7, Form 10-K | ||
| 10.9 |
Amendment No. 1 dated January 21, 2005 to Manufacturing and Supply Agreement, by and among Angiodevice International GmbH (as assignee of Angiotech Pharmaceuticals, Inc., Angiotech International, GmbH, and Cohesion Technologies, Inc.), Baxter Healthcare Corporation and Baxter Healthcare, S.A., dated April 1, 2003 |
Exhibit 10.8, Form 10-K | ||
80
Table of Contents
| Exhibit |
Description |
Location | ||
| 10.10 |
Amendment No. 2 dated October 8, 2007 to Distribution and License Agreement, by and among Angiodevice International GmbH (as assignee of Angiotech Pharmaceuticals, Inc., Angiotech International, GmbH, and Cohesion Technologies, Inc.), Baxter Healthcare Corporation and Baxter Healthcare, S.A., dated April 1, 2003** |
Exhibit 10.9, Form 10-K | ||
| 10.11 |
Amended and Restated Distribution and License Agreement by and among Angiotech Pharmaceuticals (U.S.) Inc., Angiodevice International GmbH, Baxter Healthcare Corporation and Baxter Healthcare, S.A, dated as of January 1, 2009** |
Exhibit 10.1, Form 10-Q | ||
| 10.12 |
Agreement and Plan of Merger among Angiotech Pharmaceuticals, Inc., Angiotech Pharmaceuticals (US), Inc., Quaich Acquisition, Inc. and Quill Medical, Inc. dated May 25, 2006** |
Exhibit 10.10, Form 10-K | ||
| 10.13 |
License Agreement between Public Health Service (through the Office of Technology Transfer, National Institutes of Health) and Angiotech Pharmaceuticals, Inc., dated November 19, 1997** |
Exhibit 10.11, Form 10-K | ||
| 10.14 |
First Amendment between Public Health Service (through the Office of Technology Transfer, National Institutes of Health) and Angiotech Pharmaceuticals, Inc., dated March 28, 2002 modifying the License Agreement between Public Health Service (through the Office of Technology Transfer, National Institutes of Health) and Angiotech Pharmaceuticals, Inc., dated November 19, 1997** |
Exhibit 10.12, Form 10-K | ||
| 10.15 |
Second Amendment between Public Health Service (through the Office of Technology Transfer, National Institutes of Health) and Angiotech Pharmaceuticals, Inc., dated May 23, 2007 modifying the License Agreement between Public Health Service (through the Office of Technology Transfer, National Institutes of Health) and Angiotech Pharmaceuticals, Inc., dated November 19, 1997** |
Exhibit 10.13, Form 10-K | ||
| 10.16 |
License Agreement between Angiotech Pharmaceuticals, Inc. and The University of British Columbia, dated August 1, 1997** |
Exhibit 10.14, Form 10-K | ||
| 10.17 |
Amendment to License Agreement between Angiotech Pharmaceuticals, Inc. and The University of British Columbia, dated February 27, 2004, modifying the License Agreement between Angiotech Pharmaceuticals, Inc. and The University of British Columbia, dated August 1, 1997** |
Exhibit 10.15, Form 10-K | ||
| 10.18* |
Form of Indemnification Agreement for US Officers |
Exhibit 10.1, Form 10-Q | ||
| 10.19* |
Form of Indemnification Agreement for Canadian Officers |
Exhibit 10.2, Form 10-Q | ||
| 10.20* |
Form of Indemnification Agreement for Canadian Directors |
Exhibit 10.3, Form 10-Q | ||
| 10.21* |
Form of Indemnification Agreement for US Directors |
Exhibit 10.4, Form 10-Q | ||
| 10.22* |
Executive Employment Agreement between Angiotech Pharmaceuticals, Inc. and William L. Hunter, dated April 23, 2004 |
Exhibit 10.19, Form 10-K | ||
81
Table of Contents
| Exhibit |
Description |
Location | ||
| 10.23* |
Executive Employment Agreement between Angiotech Pharmaceuticals, Inc. and K. Thomas Bailey, dated August 8, 2007** |
Exhibit 10.20, Form 10-K | ||
| 10.24* |
Executive Employment Agreement between Angiotech Pharmaceuticals, Inc. and David D. McMasters, dated October 30, 2007** |
Exhibit 10.21, Form 10-K | ||
| 10.25* |
Executive Employment Agreement between Angiotech Pharmaceuticals, Inc. and Rui Avelar, dated October 15, 2007 |
Exhibit 10.22, Form 10-K | ||
| 10.26* |
Executive Employment Agreement between Angiotech Pharmaceuticals, Inc. and Jeffrey Walker, dated October 15, 2007** |
Exhibit 10.23, Form 10-K | ||
| 10.27* |
Executive Employment Agreement between Angiotech Pharmaceuticals, Inc. and Chris J.W. Dennis, dated December 17, 2007 (as amended)** |
Exhibit 10.24, Form 10-K | ||
| 10.28* |
Executive Employment Agreement between Angiotech Pharmaceuticals, Inc. and Gary Ingenito, dated November 26, 2007** |
Exhibit 10.25, Form 10-K | ||
| 10.29* |
Executive Employment Agreement between Angiotech Pharmaceuticals, Inc. and Jeffery M. Gross dated October 29, 2008 |
Filed herewith | ||
| 10.30* |
Angiotech Pharmaceuticals, Inc. 2001 Stock Option Plan |
Exhibit to Form S-8, | ||
| 10.31* |
Angiotech Pharmaceuticals, Inc. 2004 Stock Option Plan |
Exhibit 10.27, Form 10-K | ||
| 10.32* |
Angiotech Pharmaceuticals, Inc. 2006 Stock Option Plan |
Exhibit 10.28, Form 10-K | ||
| 10.33* |
American Medical Instruments Holdings, Inc. 2003 Stock Option Plan |
Exhibit 10.29, Form 10-K | ||
| 14.1 |
Code of Ethics for Chief Executive Officer, Chief Financial Officer and SVP Finance |
Filed herewith | ||
| 14.2 |
Guide of Business Conduct |
Filed herewith | ||
| 21 |
List of Worldwide Subsidiaries |
Filed herewith | ||
| 23.1 |
Consent of PricewaterhouseCoopers LLP |
Filed herewith | ||
| 31.1 |
Certification of CEO Pursuant to Securities Exchange Act Rules 13a-14 and 15d-14 as Adopted Pursuant to Section 302 of the Sarbanes-Oxley Act of 2002 |
Filed herewith | ||
| 31.2 |
Certification of CFO Pursuant to Securities Exchange Act Rules 13a-14 and 15d-14 as Adopted Pursuant to Section 302 of the Sarbanes-Oxley Act of 2002 |
Filed herewith | ||
| 32.1 |
Certification of CEO and CFO Pursuant to 18 U.S.C. Section 1350 as Adopted Pursuant to Section 906 of the Sarbanes-Oxley Act of 2002 |
Filed herewith | ||
| ** |
portions of this exhibit have been omitted and filed separately with the Commission pursuant to a request for confidential treatment |
82
Table of Contents
Pursuant to the requirements of Section 13 or 15(d) of the Securities Exchange Act of 1934, the Registrant has duly caused this Report to be signed on its behalf by the undersigned, thereunto duly authorized.
| Angiotech Pharmaceuticals, Inc. | ||||
| Date: March 16, 2010 |
By: |
/S/ K. THOMAS BAILEY | ||
| K. Thomas Bailey Chief Financial Officer | ||||
POWER OF ATTORNEY
KNOW ALL PERSONS BY THESE PRESENTS that each person whose signature appears below constitute and appoint William L. Hunter, Chief Executive Officer, and K. Thomas Bailey, Chief Financial Officer, and each of them, the lawful attorney and agent or attorneys and agents with power and authority to do any and all acts and things and to execute all instruments which said attorneys and agents, or either of them, determine may be necessary or advisable or required to enable Angiotech Pharmaceuticals, Inc. to comply with the Securities Exchange Act of 1934, as amended, and any rules or regulations or requirements of the Securities and Exchange Commission in connection with this Annual Report on Form 10-K. Without limiting the generality of the foregoing power and authority, the powers granted include the power and authority to sign the names of the undersigned officers and directors in the capacities indicated below to this Annual Report on Form 10-K or amendments or supplements thereto, and each of the undersigned hereby ratifies and confirms all that said attorneys and agents or either of them, shall do or cause to be done by virtue hereof. This Power of Attorney may be signed in several counterparts.
Pursuant to the requirements of the Securities Exchange Act of 1934, this Report has been signed below by the following persons on behalf of the registrant and in the capacities and on the dates indicated.
| Signatures |
Title |
Date | ||
| /S/ WILLIAM L. HUNTER William L. Hunter, M.D. |
President, Chief Executive Officer and Director (Principal Executive Officer) |
March 16, 2010 | ||
| /S/ K. THOMAS BAILEY K. Thomas Bailey |
Chief Financial Officer |
March 16, 2010 | ||
| /S/ JAY DENT Jay Dent |
Senior Vice President, Finance |
March 16, 2010 | ||
| /S/ DAVID HOWARD David Howard |
Chairman of the Board of Directors |
March 16, 2010 | ||
| /S/ LAURA BREGE Laura Brege |
Director |
March 16, 2010 | ||
| /S/ EDWARD BROWN Edward Brown |
Director |
March 16, 2010 | ||
| /S/ ARTHUR H. WILLMS Arthur Willms |
Director |
March 16, 2010 | ||
| /S/ HENRY A, MCKINNELL JR. Henry A, McKinnell Jr. |
Director |
March 16, 2010 | ||
83
Table of Contents
REPORT OF INDEPENDENT REGISTERED PUBLIC ACCOUNTING FIRM
To the Board of Directors and Shareholders
In our opinion, the consolidated financial statements listed in the index appearing under Item 15(a)(1) present fairly, in all material respects, the financial position of Angiotech Pharmaceuticals, Inc and its subsidiaries at December 31, 2009 and December 31, 2008, and the results of their operations and their cash flows for each of the three years in the period ended December 31, 2009 in conformity with accounting principles generally accepted in the United States of America. In addition, in our opinion, the financial statement schedule listed in the index appearing under Item 15(a)(2) presents fairly, in all material respects, the information set forth therein when read in conjunction with the related consolidated financial statements. Also in our opinion, the Company maintained, in all material respects, effective internal control over financial reporting as of December 31, 2009, based on criteria established in Internal Control — Integrated Framework issued by the Committee of Sponsoring Organizations of the Treadway Commission (COSO). The Company’s management is responsible for these financial statements, for maintaining effective internal control over financial reporting and for its assessment of the effectiveness of internal control over financial reporting, included in Management’s Report on Internal Control over Financial Reporting under Item 9A. Our responsibility is to express opinions on these financial statements and on the Company’s internal control over financial reporting based on our integrated audits. We conducted our audits in accordance with the standards of the Public Company Accounting Oversight Board (United States). Those standards require that we plan and perform the audits to obtain reasonable assurance about whether the financial statements are free of material misstatement and whether effective internal control over financial reporting was maintained in all material respects. Our audits of the financial statements included examining, on a test basis, evidence supporting the amounts and disclosures in the financial statements, assessing the accounting principles used and significant estimates made by management, and evaluating the overall financial statement presentation. Our audit of internal control over financial reporting included obtaining an understanding of internal control over financial reporting, assessing the risk that a material weakness exists, and testing and evaluating the design and operating effectiveness of internal control based on the assessed risk. Our audits also included performing such other procedures as we considered necessary in the circumstances. We believe that our audits provide a reasonable basis for our opinions.
A company’s internal control over financial reporting is a process designed to provide reasonable assurance regarding the reliability of financial reporting and the preparation of financial statements for external purposes in accordance with generally accepted accounting principles. A company’s internal control over financial reporting includes those policies and procedures that (i) pertain to the maintenance of records that, in reasonable detail, accurately and fairly reflect the transactions and dispositions of the assets of the company; (ii) provide reasonable assurance that transactions are recorded as necessary to permit preparation of financial statements in accordance with generally accepted accounting principles, and that receipts and expenditures of the company are being made only in accordance with authorizations of management and directors of the company; and (iii) provide reasonable assurance regarding prevention or timely detection of unauthorized acquisition, use, or disposition of the company’s assets that could have a material effect on the financial statements.
Because of its inherent limitations, internal control over financial reporting may not prevent or detect misstatements. Also, projections of any evaluation of effectiveness to future periods are subject to the risk that controls may become inadequate because of changes in conditions, or that the degree of compliance with the policies or procedures may deteriorate.
| /s/PricewaterhouseCoopers LLP |
| Vancouver, Canada |
| March 16, 2010 |
F-1
Table of Contents
Angiotech Pharmaceuticals, Inc.
CONSOLIDATED BALANCE SHEETS
(All amounts expressed in thousands of U.S. dollars)
| December 31, 2009 |
December 31, 2008 |
|||||||
| ASSETS |
||||||||
| Current assets |
||||||||
| Cash and cash equivalents [note 5] |
$ | 49,542 | $ | 38,952 | ||||
| Short-term investments [note 6] |
7,780 | 848 | ||||||
| Accounts receivable |
28,167 | 25,524 | ||||||
| Income taxes receivable |
1,090 | — | ||||||
| Inventories [note 7] |
35,541 | 38,594 | ||||||
| Deferred income taxes, current portion [note 12] |
4,284 | 3,820 | ||||||
| Prepaid expenses and other current assets |
3,294 | 5,234 | ||||||
| Total current assets |
129,698 | 112,972 | ||||||
| Assets held for sale [note 8] |
5,300 | 8,422 | ||||||
| Property, plant and equipment [note 9] |
46,879 | 49,108 | ||||||
| Intangible assets [note 10(a)] |
173,019 | 195,477 | ||||||
| Deferred financing costs [note 14(e)] |
11,409 | 11,363 | ||||||
| Other assets |
3,754 | 7,855 | ||||||
| Total assets |
$ | 370,059 | $ | 385,197 | ||||
| LIABILITIES AND SHAREHOLDERS’ DEFICIT |
||||||||
| Current liabilities |
||||||||
| Accounts payable and accrued liabilities [note 11] |
$ | 46,324 | $ | 46,620 | ||||
| Income taxes payable |
10,858 | 8,071 | ||||||
| Interest payable on long-term debt |
6,004 | 6,514 | ||||||
| Total current liabilities |
63,186 | 61,205 | ||||||
| Deferred leasehold inducement |
2,888 | 2,780 | ||||||
| Deferred income taxes [note 12] |
36,778 | 40,577 | ||||||
| Other tax liability [note 13] |
3,898 | 3,145 | ||||||
| Long-term debt [note 14] |
575,000 | 575,000 | ||||||
| Other liabilities |
1,596 | 2,363 | ||||||
| Total non-current liabilities |
$ | 620,160 | $ | 623,865 | ||||
| Commitments and contingencies [note 18] |
||||||||
| Shareholders’ deficit |
||||||||
| Share capital [note 15] Authorized: 200,000,000 Common shares, without par value 50,000,000 Class I Preference shares, without par value
Common shares issued and outstanding: December 31, 2009 — 85,138,081 |
472,742 | 472,739 | ||||||
| Additional paid-in capital |
33,687 | 32,107 | ||||||
| Accumulated deficit |
(866,541 | ) | (843,673 | ) | ||||
| Accumulated other comprehensive income |
46,825 | 38,954 | ||||||
| Total shareholders’ deficit |
(313,287 | ) | (299,873 | ) | ||||
| Total liabilities and shareholders’ deficit |
$ | 370,059 | $ | 385,197 | ||||
See accompanying notes to the consolidated financial statements
F-2
Table of Contents
Angiotech Pharmaceuticals, Inc.
CONSOLIDATED STATEMENTS OF OPERATIONS
(All amounts expressed in thousands of U.S. dollars, except share and per share data)
| Year ended December 31, 2009 |
Year ended December 31, 2008 |
Year ended December 31, 2007 |
||||||||||
| REVENUE |
||||||||||||
| Product sales, net |
$ | 191,951 | $ | 190,816 | $ | 170,193 | ||||||
| Royalty revenue |
62,171 | 91,546 | 116,659 | |||||||||
| License fees [note 16] |
25,556 | 910 | 842 | |||||||||
| 279,678 | 283,272 | 287,694 | ||||||||||
| EXPENSES |
||||||||||||
| Cost of products sold |
104,616 | 101,052 | 94,949 | |||||||||
| License and royalty fees |
10,431 | 14,258 | 18,652 | |||||||||
| Research and development |
23,701 | 53,192 | 53,963 | |||||||||
| Selling, general and administration |
81,504 | 98,483 | 99,315 | |||||||||
| Depreciation and amortization |
33,251 | 33,998 | 33,429 | |||||||||
| In-process research and development [note 17] |
— | 2,500 | 8,125 | |||||||||
| Write-down of assets held for sale [note 8] |
3,090 | 1,283 | — | |||||||||
| Write-down of goodwill [note 10(b)] |
— | 649,685 | — | |||||||||
| 256,593 | 954,451 | 308,433 | ||||||||||
| Operating income (loss) |
23,085 | (671,179 | ) | (20,739 | ) | |||||||
| Other (expenses) income: |
||||||||||||
| Foreign exchange (loss) gain |
(1,612 | ) | 540 | (341 | ) | |||||||
| Investment and other income |
378 | 1,192 | 10,393 | |||||||||
| Interest expense on long-term debt |
(38,039 | ) | (44,490 | ) | (51,748 | ) | ||||||
| Write-down of deferred financing charges [note 14(e) & 14(f)] |
(643 | ) | (16,544 | ) | — | |||||||
| Write-down / loss on redemption of investments [note 6] |
— | (23,587 | ) | (8,157 | ) | |||||||
| Total other expenses |
(39,916 | ) | (82,889 | ) | (49,853 | ) | ||||||
| Loss from continuing operations before income taxes |
(16,831 | ) | (754,068 | ) | (70,592 | ) | ||||||
| Income tax expense (recovery) [note 12] |
6,037 | (12,892 | ) | (14,545 | ) | |||||||
| Loss from continuing operations |
(22,868 | ) | (741,176 | ) | (56,047 | ) | ||||||
| Loss from discontinued operations, net of income taxes [note 3] |
— | — | (9,893 | ) | ||||||||
| Net loss |
$ | (22,868 | ) | $ | (741,176 | ) | $ | (65,940 | ) | |||
| Basic and diluted net loss per common share [note 22]: |
||||||||||||
| Continuing operations |
$ | (0.27 | ) | $ | (8.71 | ) | $ | (0.66 | ) | |||
| Discontinued operations [note 3] |
— | — | (0.12 | ) | ||||||||
| Total |
$ | (0.27 | ) | $ | (8.71 | ) | $ | (0.78 | ) | |||
| Basic and diluted weighted average number of common shares outstanding (in thousands) [note 22] |
85,130 | 85,118 | 85,015 | |||||||||
See accompanying notes to the consolidated financial statements
F-3
Table of Contents
Angiotech Pharmaceuticals, Inc.
CONSOLIDATED STATEMENTS OF SHAREHOLDERS’ (DEFICIT) EQUITY
(All amounts expressed in thousands of U.S. dollars, except share data)
| Common Shares | Additional paid-in capital |
Accumulated deficit |
Accumulated other comprehensive income |
Comprehensive income (loss) |
Total shareholders’ equity(deficit) |
|||||||||||||||||||
| Shares | Amount | |||||||||||||||||||||||
| Balance at December 31, 2006 |
84,983,735 | $ | 472,390 | $ | 25,082 | $ | (34,893 | ) | $ | 36,113 | $ | 498,692 | ||||||||||||
| Adjustment for the adoption of Financial Accounting Standards Board (“FASB”) interpretation No. (FIN) 48 |
(1,664 | ) | (1,664 | ) | ||||||||||||||||||||
| Exercise of stock options for cash |
90,248 | 228 | 228 | |||||||||||||||||||||
| Stock-based compensation |
4,587 | 4,587 | ||||||||||||||||||||||
| Net unrealized loss on available-for-sale securities, net of taxes (nil) |
(9,567 | ) | $ | (9,567 | ) | (9,567 | ) | |||||||||||||||||
| Reclassification of net unrealized loss on available-for-sale securities, net of taxes (nil) |
3,097 | 3,097 | 3,097 | |||||||||||||||||||||
| Cumulative translation adjustment |
12,639 | 12,639 | 12,639 | |||||||||||||||||||||
| Net loss |
(65,940 | ) | (65,940 | ) | (65,940 | ) | ||||||||||||||||||
| Comprehensive loss |
$ | (59,771 | ) | |||||||||||||||||||||
| Balance at December 31, 2007 |
85,073,983 | $ | 472,618 | $ | 29,669 | $ | (102,497 | ) | $ | 42,282 | $ | 442,072 | ||||||||||||
| Exercise of stock options for cash |
48,000 | 121 | 121 | |||||||||||||||||||||
| Stock-based compensation |
2,438 | 2,438 | ||||||||||||||||||||||
| Net unrealized loss on available-for-sale securities, net of taxes (nil) |
(9,572 | ) | $ | (9,572 | ) | (9,572 | ) | |||||||||||||||||
| Reclassification of realized loss on available-for-sale securities, net of taxes (nil) |
13,860 | 13,860 | 13,860 | |||||||||||||||||||||
| Cumulative translation adjustment |
(7,616 | ) | (7,616 | ) | (7,616 | ) | ||||||||||||||||||
| Net loss |
(741,176 | ) | (741,176 | ) | (741,176 | ) | ||||||||||||||||||
| Comprehensive loss |
$ | (744,504 | ) | |||||||||||||||||||||
| Balance at December 31, 2008 |
85,121,983 | $ | 472,739 | $ | 32,107 | $ | (843,673 | ) | $ | 38,954 | $ | (299,873 | ) | |||||||||||
| Exercise of stock options for cash |
16,098 | 3 | 3 | |||||||||||||||||||||
| Stock-based compensation |
1,580 | 1,580 | ||||||||||||||||||||||
| Net unrealized gain on available-for-sale securities, net of taxes (nil) |
6,932 | 6,932 | 6,932 | |||||||||||||||||||||
| Cumulative translation adjustment |
939 | 939 | 939 | |||||||||||||||||||||
| Net loss |
(22,868 | ) | (22,868 | ) | (22,868 | ) | ||||||||||||||||||
| Comprehensive loss |
$ | (14,997 | ) | |||||||||||||||||||||
| Balance at December 31, 2009 |
85,138,081 | $ | 472,742 | $ | 33,687 | $ | (866,541 | ) | $ | 46,825 | $ | (313,287 | ) | |||||||||||
See accompanying notes to the consolidated financial statements
F-4
Table of Contents
Angiotech Pharmaceuticals, Inc.
CONSOLIDATED STATEMENTS OF CASH FLOWS
(All amounts expressed in thousands of U.S. dollars)
| Year ended December 31, 2009 |
Year ended December 31, 2008 |
Year ended December 31, 2007 |
||||||||||
| OPERATING ACTIVITIES |
||||||||||||
| Net loss |
$ | (22,868 | ) | $ | (741,176 | ) | $ | (65,940 | ) | |||
| Adjustments to reconcile net income to cash provided by operating activities: |
||||||||||||
| Depreciation and amortization |
37,026 | 38,171 | 37,892 | |||||||||
| Loss on disposition of property, plant and equipment |
369 | — | — | |||||||||
| Loss on disposition of intangible assets |
— | 113 | 32 | |||||||||
| Write-down on assets held for sale |
3,090 | 1,837 | 1,156 | |||||||||
| Write-down / loss on redemption of investments |
— | 23,584 | 647 | |||||||||
| Write-down of deferred financing charges |
643 | 16,544 | — | |||||||||
| Write-down of goodwill |
— | 649,685 | — | |||||||||
| Impairment of assets from discontinued operations |
— | — | 8,879 | |||||||||
| Deferred income taxes |
(4,321 | ) | (12,464 | ) | (10,386 | ) | ||||||
| Stock-based compensation expense |
1,579 | 2,438 | 4,587 | |||||||||
| Non-cash interest expense |
2,788 | 2,237 | 2,245 | |||||||||
| In-process research and development |
— | 2,500 | 8,125 | |||||||||
| Other |
(850 | ) | (335 | ) | (1,934 | ) | ||||||
| Net change in non-cash working capital items relating to operating activities [note 23] |
4,515 | (21,141 | ) | 9,135 | ||||||||
| Cash provided by (used in) operating activities |
21,971 | (38,007 | ) | (5,562 | ) | |||||||
| INVESTING ACTIVITIES |
||||||||||||
| Proceeds from short-term investments |
— | 2,756 | 9,285 | |||||||||
| Purchase of long-term investments |
— | — | (15,000 | ) | ||||||||
| Proceeds from long-term investments |
— | — | 22,965 | |||||||||
| Purchase of property, plant and equipment |
(4,366 | ) | (7,669 | ) | (7,131 | ) | ||||||
| Purchase of intangible assets |
(2,500 | ) | (1,000 | ) | (6,466 | ) | ||||||
| Proceeds from sale of assets held for sale |
— | — | 4,832 | |||||||||
| Loans advanced |
(1,573 | ) | — | — | ||||||||
| In-process research and development |
— | (2,500 | ) | (8,125 | ) | |||||||
| Other |
252 | 174 | (101 | ) | ||||||||
| Cash used in investing activities |
(8,187 | ) | (8,239 | ) | 259 | |||||||
| FINANCING ACTIVITIES |
||||||||||||
| Deferred financing charges and costs |
(3,403 | ) | (4,499 | ) | (1,865 | ) | ||||||
| Proceeds from stock options exercised |
3 | 121 | 228 | |||||||||
| Cash used in financing activities |
(3,400 | ) | (4,378 | ) | (1,637 | ) | ||||||
| Effect of exchange rate changes on cash |
206 | (1,750 | ) | (1,066 | ) | |||||||
| Net increase (decrease) in cash and cash equivalents |
10,590 | (52,374 | ) | (8,006 | ) | |||||||
| Cash and cash equivalents, beginning of year |
38,952 | 91,326 | 99,332 | |||||||||
| Cash and cash equivalents, end of year |
$ | 49,542 | $ | 38,952 | $ | 91,326 | ||||||
Supplemental note disclosure [note 23]
See accompanying notes to the consolidated financial statements
F-5
Table of Contents
Angiotech Pharmaceuticals, Inc.
NOTES TO THE CONSOLIDATED FINANCIAL STATEMENTS
Angiotech Pharmaceuticals, Inc. (the “Company”), is incorporated under the Business Corporations Act (British Columbia). The Company is a specialty pharmaceutical and medical device company that discovers develops and markets innovative technologies primarily focused on acute and surgical applications. The Company generates its revenue through sales of medical products and components, as well as from royalties derived from sales by its partners of products utilizing certain of its proprietary technologies.
The Company’s research and development efforts focus on understanding and characterizing biological conditions that often occur concurrent with medical device implantation, surgery or acute trauma, including scar formation and inflammation, cell proliferation, bleeding and coagulation, infection, and tumour tissue overgrowth. Its strategy is to utilize its various technologies in the areas of drugs, drug delivery, surface modification, biomaterials and medical devices to create and commercialize novel, proprietary medical products that reduce surgical procedure side effects, improve surgical outcomes, shorten hospital stays, or are easier or safer for a physician to use.
The Company develops its products using a proprietary and systematic discovery approach. The Company uses its drug screening capabilities to identify new uses for known pharmaceutical compounds. The Company looks for compounds that address the underlying biological causes of conditions that can occur with medical device implantation, surgery or acute trauma. Once appropriate drugs have been identified, the Company works to formulate the drug, or a combination of drugs, with its portfolio of drug, drug delivery and surface modification technologies and biomaterials to develop a novel surgical implant or medical device. The Company has patent protected, or has filed patent applications for, certain of its technology and many of its products and potential product candidates.
1. BASIS OF PRESENTATION
(a) These consolidated financial statements have been prepared in accordance with generally accepted accounting principles in the United States of America (“U.S. GAAP”). All amounts herein are expressed in U.S. dollars unless otherwise noted. All tabular amounts are expressed in thousands of U.S. dollars, except share and per share data, unless otherwise noted.
(b) Liquidity risk
Liquidity risk is the risk that the Company will encounter difficulty in meeting obligations associated with its financial liabilities and other contractual obligations. The Company monitors and manages its liquidity risk by preparing rolling cash flow forecasts, monitoring the condition and value of assets available to be used as security in financing arrangements, seeking flexibility in financing arrangements and establishing programs to monitor and maintain compliance with terms of financing agreements. A key component of managing liquidity risk is also ensuring that operating cash flows are optimized. The Company’s principal objective in managing liquidity risk is to maintain cash and access to cash at levels sufficient to meet its day-to-day operating requirements.
For the year ended December 31, 2009, the Company reported a balance of cash and cash equivalents (“cash resources”) of $49.5 million, which represented a net increase in cash resources of $10.6 million as compared to December 31, 2008. For the year ended December 31, 2009, operating activities provided $22.0 million, and the Company used $8.2 million to fund investing activities and $3.4 million for financing activities. The Company’s cash resources are used to support clinical studies, research and development initiatives, sales and marketing initiatives, working capital requirements, debt servicing requirements and for general corporate costs. Its cash resources may also be used to fund acquisitions of, or investments in, businesses, products or technologies that expand, complement or are otherwise related to its business.
F-6
Table of Contents
During 2008 and 2009, The Company undertook various initiatives and developed a plan to manage its operating and liquidity risks including:
| • |
Reduction of research and development activities and reduction in staffing within the clinical and research and development departments. |
| • |
Cost containment initiatives including staffing reductions in general and administrative departments, a supplier concession program and other cost reduction initiatives. |
| • |
Selective reduction in certain sales and marketing investments and investments in medical affairs. |
| • |
Postponement of selected planned capital expenditures. |
| • |
Obtaining a financing commitment from Wells Fargo Foothill, LLC (“Wells Fargo”) as described below and in note 14(f). |
| • |
Completing an Amended and Restated Distribution and License Agreement with our partner Baxter International Inc. (“Baxter”) as described in note 16. |
The Company faces a number of risks and uncertainties that may significantly impact its ability to generate cash flows from its operations and to fund its capital expenditures and future opportunities. These risks and uncertainties may materially impact its liquidity position throughout 2010 and future years. The more significant risks and uncertainties that have and may continue to impact its future operating results, cash flows and liquidity position are as follows:
| • |
Revenue from the Pharmaceutical Technologies segment declined $4.7 million for the year ended December 31, 2009, as compared to 2008, primarily as a result of decrease in royalty revenue derived from sales by Boston Scientific Corporation (“BSC”) of TAXUS coronary stent systems primarily due to new competitive entrants into the U.S. drug-eluting stent market beginning in 2008. The decrease in royalty revenue derived from sales by BSC of TAXUS coronary stent systems was $26.7 million for the year ended December 31, 2009, as compared to 2008. The decline in sales by BSC of TAXUS coronary stent systems was offset by the one-time license fee received in the first quarter of 2009 from Baxter of $25.0 million. Under the Company’s license agreement with BSC, the Company does not control the direct or indirect sales of the TAXUS products. The Company expects the impact of new competitive conditions to continue to impact it which would result in lower revenues and cash flows derived from sales of TAXUS in 2010 and subsequent years. |
| • |
Revenue from the Medical Products segment for the year ended December 31, 2009 was $192.0 million compared to $190.8 million in 2008. The continuing difficult economic environment, credit markets and liquidity environment may have an impact on the Company’s customers and therefore on its product sales in 2010 and future years. In light of these conditions, the Company is continuously monitoring and managing its sales activities; however, several factors that may affect its revenues are not within its control. In addition, the Company continues to implement its marketing plans for its Proprietary Medical Products such as the Quill SRS product line with the expectation of continued growth in 2010. It is possible that the expected growth in revenue in the 2010 for the Company’s newer product lines may not be achieved and revenues for other products may decline. |
| • |
In 2008 and continuing into 2009 the Company implemented initiatives that reduced research and development costs, selling, general and administrative costs and capital expenditures. The Company continues to closely monitor costs in relation to sales activity and forecasted revenues. The Company expects that some limited future cost reductions could be achieved if forecasted revenues are not achieved. However, such cost reductions may affect the Company’s future opportunities. In addition, as reported in note 18, the Company has entered into certain commitments and is exposed to certain contingencies for which the outcome is not necessarily within its control. Acceleration of research and development activities under collaboration agreements by counterparties and any unexpected outcomes in respect of contingencies may require payments earlier than they are currently expected. |
F-7
Table of Contents
| • |
As discussed in note 14(f), on May 29, 2009, the Company entered into an amendment to its senior secured term loan and revolving credit facility with Wells Fargo that it had originally entered into in February 2009. This financing originally included a delayed draw secured term loan facility of up to $10.0 million and a secured revolving credit facility, with a borrowing base derived from the value of certain of its finished goods inventory and accounts receivable, providing up to an additional $22.5 million in available credit, subject to certain terms and conditions. The amendment included, among other things, early termination of the term loan facility, which was originally scheduled to terminate on August 31, 2009. The amendment also expanded the definition of Permitted Investments and eliminated a $2.5 million availability block, increasing the total available credit under the revolving credit facility to $25.0 million (subject to a borrowing base formula derived from the value of certain of the Company’s finished goods inventory and accounts receivable). As of December 31, 2009, the amount of financing available under the revolving credit facility was approximately $12.6 million (net of a $1.5 million letter of credit secured under the revolving credit facility). There were no borrowings outstanding under the revolving credit facility. The secured credit facility includes certain covenants and restrictions with respect to the Company’s operations and requires it to maintain certain levels of adjusted earnings before interest, taxes, depreciation and amortization (“Adjusted EBITDA”) and interest coverage ratios, among other terms and conditions. These covenants may limit the Company’s ability to borrow under the revolving credit facility or may require repayment. It is possible that events and circumstances may occur that may affect the Company’s ability to operate its business within the restrictions proposed by the financial covenants and other restrictions relating to the revolving credit facility and therefore, there is no assurance that the Company will be able to continue to meet these covenants. |
| • |
The Company’s future interest payments related to its long-term debt continue to be significant. During the year ended December 31, 2009, the Company incurred interest expense of $38.0 million on outstanding long-term debt obligations, as compared to $44.5 million for 2008. Additional interest expense will be incurred if the revolving credit facility described above is utilized. The Senior Floating Rate Notes due 2013 (“Floating Rate Notes”) reset quarterly to an interest rate of 3-month London Interbank Offered Rate (“LIBOR”) plus 3.75% and bore an interest rate of 4.0% at December 31, 2009 compared to 6.0% at December 31, 2008. Volatility in the LIBOR and interest rates in general are outside of the Company’s control. The Company does not use derivatives to hedge against this interest rate risk and it is possible that volatility in the LIBOR will continue throughout the 2010. Changes in the LIBOR will affect interest costs. |
| • |
The Company is significantly leveraged and has significant future interest payments with Senior Floating Rate Notes due December 1, 2013 and the Senior Subordinated Notes due April 1, 2014. The Company is continuing to evaluate a range of financial and strategic alternatives with its financial and legal advisors with respect to its capital structure. There can be no assurance that the Company will be able to consummate any new financing or other transaction that would be favorable to it. Actions to pursue alternative financing structures may require the Company to incur additional costs, which may impact its cash and liquidity position. |
While the Company believes that it has developed planned courses of action and identified other opportunities to mitigate the operating and liquidity risks outlined above, there can be no assurance that the Company will be able to achieve any or all of the opportunities it has identified or obtain sufficient liquidity to execute on its business plan. Furthermore, there may be other material risks and uncertainties that may impact the Company’s liquidity position that it has not yet identified.
2. SUMMARY OF SIGNIFICANT ACCOUNTING POLICIES
(a) Consolidation
These consolidated financial statements include the accounts of the Company and its wholly-owned subsidiaries. All intercompany transactions and balances have been eliminated on consolidation.
F-8
Table of Contents
(b) Use of estimates
The Company’s preparation of financial statements in conformity with U.S. GAAP requires management to make estimates and assumptions that affect the reported amount of assets and liabilities and disclosures of contingent assets and liabilities at the dates of the financial statements and the reported amounts of revenue and expenses during the reported periods. Actual results could differ materially from these estimates.
(c) Foreign currency translation
The Company’s functional and reporting currency is the U.S. dollar. Foreign currency denominated revenues and expenses are translated using average rates of exchange during the year. Foreign currency denominated monetary assets and liabilities are translated at the rate of exchange in effect at the balance sheet date with foreign exchange gains (losses) included in the Statement of Operations, except for the translation gains (losses) arising from available-for-sale instruments which are recorded through Other Comprehensive Income until realized through disposal or impairment. Foreign currency denominated non monetary assets and liabilities are re-translated using historical exchange rates.
The assets and liabilities of foreign subsidiaries that have a functional currency different from the reporting currency are translated into the reporting currency with all resulting exchange differences recognized in other comprehensive income. Assets and liabilities are translated at each balance sheet date at the closing rate at the date of the balance sheet. Income and expenses are translated at average exchange rates. The Company has certain subsidiaries which also have a U.S. dollar denominated functional and reporting currency and therefore it does not record additional translation gains (losses) on consolidation since the functional and reporting currency of the subsidiary is the same as the parent Company.
(d) Cash equivalents
The Company considers all highly liquid financial instruments purchased with an original maturity of three months or less to be cash equivalents. Cash equivalents are recorded at cost plus accrued interest. The carrying value of these cash equivalents approximates its fair value.
(e) Investments
The Company classifies marketable equity securities as available-for-sale. Investments that are classified as available-for-sale are carried at fair value with unrealized gains or losses, net of tax, reflected in accumulated other comprehensive income (loss). Realized losses are determined on a specific identification method and included in write-down/loss on redemption of investments. When the Company believes that the unrealized losses are other than temporary, these losses are included in the statement of operations and reclassified out of accumulated other comprehensive income (loss).
The Company classifies its investments in equity securities as long-term investments, unless the Company expects to sell the investment in less than one year. Long-term investments for which fair value is not readily determinable are recorded at cost. The Company regularly reviews its long-term investments for impairment indicators by reference to quoted market prices, the results of operations, financial position of the investee and other evidence supporting the net realizable value of the investment. If an impairment indicator is identified which signals that the carrying amount may not be recoverable and the impact is other-than temporary, the investment is written down to its estimated fair value and the resulting losses are included in the determination of income for the period. Where fair value information is not readily available, the fair value of investments may be estimated using inputs which are in compliance with ASC No. 810 — Fair Value Measurements and Disclosures but may not be readily observable in active markets. A valuation model is developed for each investment using key assumptions about future cash flows and discount rates. These assumptions are based on historical experience, market trends and the anticipated return for each investment.
F-9
Table of Contents
(f) Allowance for doubtful accounts
Accounts receivable are presented net of an allowance for doubtful accounts. In determining the allowance for doubtful accounts, which includes specific reserves, the Company reviews accounts receivable aging, customer financial strength, credit standing and payment history to assess the probability of collection. The Company continually monitors the collectability of the receivables. Receivables are written off when management determines they are uncollectible.
(g) Inventories
Raw materials are recorded at the lower of cost, determined on a specific item basis, and net realizable value. Work-in-process, which includes inventory stored at a stage preceding final assembly and packaging, and finished goods are recorded at the lower of cost, determined on a standard cost basis which approximates average cost, and net realizable value.
(h) Property, plant and equipment
Property, plant and equipment are recorded at cost less accumulated depreciation. Depreciation is provided using the straight-line method over the following terms:
| Buildings |
40 years | |
| Leasehold improvements |
Term of the lease | |
| Manufacturing equipment |
3 – 10 years | |
| Research equipment |
5 years | |
| Office furniture and equipment |
3 – 10 years | |
| Computer equipment |
3 – 5 years |
(i) Goodwill and intangible assets
As at December 31, 2008, the Company’s goodwill balance of $649.7 million was determined to be impaired and was therefore written off (see note 10(b)). Goodwill represents the difference between the purchase price and the estimated fair value of the net assets acquired under the purchase method of accounting. In accordance with Accounting Standards Codification (“ASC”) No. 350, Intangibles — Goodwill and Other, goodwill was not amortized and was pushed-down to the reporting entities.
Where goodwill is recorded, it is tested for impairment at least annually in all of the Company’s reporting units and whenever changes in circumstances occur that would indicate impairment in the value of goodwill. When the carrying value of a reporting unit’s goodwill exceeds the implied fair value of the goodwill, an impairment loss is recognized which is equal to the excess. Examples of circumstances that could trigger impairment include adverse changes or outcomes in legal or regulatory matters, technological advances, decreases in anticipated demand, unanticipated competition, and significant declines in the Company’s share price. The Company estimates fair value based on a discounted projection of future cash flows which are subject to significant uncertainty and estimates.
F-10
Table of Contents
Intangible assets with finite lives are amortized based on their estimated useful lives. The amortization method is selected to best reflect the pattern in which the economic benefits are derived from the intangible asset. If the pattern cannot be reliably or reasonably determined, straight line amortization is applied. Amortization is generally determined using the straight line method over the following terms:
| Acquired technologies |
2 - 10 years | |
| Customer relationships |
10 years | |
| In-licensed technologies |
5 - 10 years | |
| Trade name and other |
2 - 12 years |
(j) Impairment of long-lived assets
The Company reviews long-lived assets subject to amortization to determine if any adverse conditions exist or a change in circumstances has occurred that would indicate impairment or a change in the remaining useful life. Conditions that may indicate impairment include, but are not limited to, a significant adverse change in legal factors or business climate that could affect the value of an asset, a product recall, or an adverse action or assessment by a regulator. If an impairment indicator exists, the Company tests the asset (asset group) for recoverability. For purposes of the recoverability test, long-lived assets are grouped with other assets and liabilities at the lowest level of identifiable cash flows if the long-lived asset does not generate cash flows independent of other assets and liabilities. If the carrying value of the asset (asset group) exceeds the undiscounted cash flows expected to result from the use and eventual disposition of the asset (asset group), an impairment charge is recorded to write the carrying value down to the fair value in the period identified.
The Company generally calculates fair value of assets (asset groups) as the present value of estimated future cash flows expected to generate from the asset using a risk-adjusted discount rate. In determining the estimated future cash flows associated with our assets (asset groups), assumptions about future revenue contributions, cost structures and remaining useful lives of the asset (asset group) are used. The use of alternative assumptions, including estimated cash flows, discount rates, and alternative estimated remaining useful lives could result in different calculations of impairment.
(k) Revenue recognition
(i) Product sales
Revenue from product sales, including shipments to distributors, is recognized when the product is shipped from the Company’s facilities to the customer provided that the Company has not retained any significant risks of ownership or future obligations with respect to products shipped. Revenue from product sales is recognized net of provisions for future returns. These provisions are established in the same period as the related product sales are recorded and are based on estimates derived from historical experience and adjusted to actual returns when determinable.
Revenue is considered to be realized or realizable and earned when all of the following criteria are met: persuasive evidence of a sales arrangement exists; delivery has occurred or services have been rendered; the price is fixed or determinable; and collectability is reasonably assured. These criteria are generally met at the time of shipment when the risk of loss and title passes to the customer or distributor.
Amounts billed to customers for shipping and handling are included in revenue. Where applicable, revenue is recorded net of sales taxes. The corresponding costs for shipping and handling are included in cost of products sold.
(ii) Royalty revenue
Royalty revenue is recognized when the Company has fulfilled the terms in accordance with the contractual agreement, has no future obligations, the amount of the royalty fee is determinable and collection is
F-11
Table of Contents
reasonably assured. The Company records royalty revenue from Boston Scientific Corporation (“BSC”) on a cash basis due to the difficulty in accurately estimating the BSC royalty before the reports and payments are received by the Company.
(iii) License fees
License fees are comprised of initial fees and milestone payments derived from collaborative and other licensing arrangements. License fees are recognized as revenue when persuasive evidence of an arrangement exists, the contracted fee is fixed or determinable, the intellectual property is delivered to the customer, collection is reasonably assured and the Company has substantially completed its performance obligations. Non-refundable milestone payments are recognized upon the achievement of specified milestones when the milestone payment is substantive in nature, achievement of the milestone was not reasonably assured at the inception of the agreement and the Company has no further significant performance obligations to fulfill under the arrangement. Initial fees and non-refundable milestone payments received which require the ongoing involvement of the Company are deferred and amortized into income on a straight-line basis over the period of ongoing involvement if there is no other method under which performance can be objectively measured.
(l) Income taxes
Income taxes are accounted for using the liability method. Deferred income tax assets and liabilities result from the temporary differences between the amount of assets and liabilities recognized for financial statement and income tax purposes, and for operating losses, capital losses and tax credit carry forwards, using tax rates expected to be in effect for the years in which the differences are expected to reverse. A valuation allowance is provided to reduce the deferred income tax assets if, based upon the available evidence, it is more likely than not that some or all of the deferred income tax assets will not be realized.
(m) Accounting for Uncertainty in Income Taxes
The Company accounts for uncertainty related to income tax positions in accordance with ASC No. 740-10 — Income taxes. ASC No. 740-10 requires the use of a two-step approach for recognizing and measuring the income tax benefits of uncertain tax positions taken or expected to be taken in a tax return, as well as enhanced disclosures regarding uncertain tax positions. A tax benefit from an uncertain tax position may only be recognized if it is more-likely-than-not that the position will be sustained upon examination by the tax authority based on the technical merits of the position. The tax benefit of an uncertain tax position that meets the more-likely-than-not recognition threshold is measured as the largest amount that is greater than 50% likely to be realized upon settlement with the tax authority. To the extent a full benefit is not expected to be realized, an income tax liability is established. Any change in judgment related to the expected resolution of uncertain tax positions are recognized in the year of such a change. Accrued interest and penalties related to unrecognized tax benefits are recorded in income tax expense in the current year.
(n) Research and development costs
Research and development expenses are comprised of costs incurred in performing research and development activities including salaries and benefits, clinical trial and related clinical manufacturing costs, contract research costs, patent procurement costs, materials and supplies, and other operating and occupancy costs. Amounts paid for medical technologies used solely in research and development activities and with no alternative future use are expensed in the year incurred.
Advance payments for non-refundable portions of research and development activities are deferred and capitalized until the related goods are delivered or services are performed.
F-12
Table of Contents
(o) In-process research and development costs
In-process research and development costs, including upfront fees and milestones paid to collaborators, are expensed in the year incurred if the technology has not demonstrated technological feasibility and does not have any alternative future use.
(p) Net loss per common share
Net loss per common share is calculated using the weighted average number of common shares outstanding during the period. Diluted net loss per common share is calculated using the treasury stock method which uses the weighted average number of common shares outstanding during the period and also includes the dilutive effect of potentially issuable common shares from outstanding stock options.
(q) Stock-based compensation
The Company accounts for stock based compensation expense in accordance with ASC No. 718 — Compensation: Stock Compensation and ASC No. 505-50 — Equity: Equity Based Payments to Non-Employees. These standards require the Company to recognize the grant date fair value of stock-based compensation awards granted to employees over the requisite service period. The compensation expense recognized reflects estimates of award forfeitures at the time of grant and revised in subsequent periods, if necessary when forfeitures rates are expected to change. The Company uses yield rates on U.S. Treasury or Canadian Government securities for a period approximating the expected term of the award to estimate the risk-free interest rate in the grant-date fair value assessment. The Company used its historical volatility as a basis to estimate the expected volatility assumption used in the Black-Scholes model. The Company has not paid any dividends on common stock since its inception and does not anticipate paying dividends on its common stock in the foreseeable future. Generally, the stock options granted have a maximum term of five years and vest over a four-year period from the date of the grant. When an employee ceases employment at the Company, any unexercised vested options granted will expire either immediately, within 365 days from the last date of service or on the original expiration date at the time the option was granted, as defined in the Company’s Stock Incentive Plan. The expected life of employee stock options is based on a number of factors, including historic exercise patterns, cancellations and forfeiture rates, and the vesting period and contractual term of the options.
(r) Deferred leasehold inducement
Leasehold inducements are deferred and amortized to reduce rent expense on a straight line basis over the term of the lease.
(s) Deferred financing costs
Financing costs for long-term debt are capitalized and amortized on a straight-line basis, which approximates the effective-interest rate method to interest expense over the life of the debt instruments.
(t) Costs for patent litigation and legal proceedings
Costs for patent litigation or other legal proceedings are expensed as incurred and included in selling, general and administrative expenses.
(u) Recently adopted accounting policies
The Company currently accounts for business combinations in accordance with ASC No. 805 — Business Combinations. New guidance was issued under ASC No. 805 which changes accounting for business combinations by requiring acquiring entities to recognize all assets acquired and liabilities assumed in a transaction at the acquisition-date fair value with limited exceptions. This includes a change in the accounting
F-13
Table of Contents
treatment and disclosure of specific items in a business combination. Furthermore, the new guidance amends and clarifies the initial recognition and measurement, subsequent measurement and accounting, and related disclosures related to the treatment of assets and liabilities which are assumed in a business combination and arise from contingencies. ASC No. 805 applies prospectively to business combinations for which the acquisition date is on or after the beginning of the first annual reporting period beginning on or after December 15, 2008. We have adopted this standard without material impact to our 2009 consolidated financial results.
Effective January 1, 2009, the Company has adopted ASC No. 350-30, Intangibles — Goodwill and Other and ASC No. 805-20-20, Business Combinations – Identifiable Assets and Liabilities and Any Noncontrolling interest. This standard considers how defensive intangible assets should be accounted for subsequent to their acquisition, including the estimated useful life that should be assigned to such assets.
Under ASC 820-10 — Fair Value Measurements and Disclosures, the effective date for the adoption of the fair value measurement framework was deferred by the SEC for certain non-financial assets and non-financial liabilities, due to implementation difficulties, to years beginning after November 15, 2008 and interim periods within those years. The guidance was adopted January 1, 2009 with no impact to the Company’s consolidated financial statements.
Effective January 1, 2009, the Company adopted the new guidance under ASC No. 808-10 — Collaborative Arrangement, which requires collaborators to present the results of activities for which they act as the principal on a gross basis. Any payments received from (made to) other collaborators should be recorded in accordance with other applicable GAAP or, in the absence of other applicable GAAP, guidance provided by authoritative accounting literature or a reasonable, rational, and consistently applied accounting policy. Furthermore, the standard clarifies whether transactions under a collaborative arrangement are part of a vendor-customer (or analogous) relationship and addresses appropriate income statement classification and disclosures related to these arrangements. ASC 808-10 is effective for fiscal years beginning December 15, 2008. This standard had no impact on the Company’s financial results given that it relates to disclosure and presentation only.
Effective January 1, 2009, the Company adopted the new guidance under ASC 275-10-50 — Risks and Uncertainties Disclosure and ASC 350, Intangibles — Goodwill and Other. ASC 275-10-50 amends the factors that should be considered in developing renewal or extension assumptions used to determine the useful life of a recognized intangible asset under ASC No. 350. The intent of the position is to improve the consistency between the useful life of a recognized intangible asset under ASC No. 350 and the period of expected cash flows used to measure the fair value of the intangible asset. ASC No. 275-10-50 and ASC No. 350 are effective for fiscal years beginning after December 15, 2008. Adoption of this standard had no material impact on our consolidated balance sheets, results of operations or cash flows.
For the quarter ended September 30, 2009, the Company adopted the amended disclosures about the fair value of financial instruments under ASC No. 825-10-65-1 — Financial Instruments. The new guidance is applicable to interim reporting periods of publicly traded companies as well as the annual financial statements. This standard had no impact on our financial results given that it relates to disclosure and presentation only.
The Company adopted ASC No. 320-10-65-1, Investments — Debt and Equity Securities. This standard amends the impairment guidance for certain debt securities and requires an investor to assess the likelihood of selling the security prior to recovering the cost base. If the investor is able to sufficiently demonstrate that it will not have to sell the security before recovery, impairment charges related to non-credit losses would be reflected in other comprehensive income. The standard also expands and increases disclosure requirements related to debt and equity securities. Adoption of this standard during the quarter ended September 30, 2009 had no material impact on our consolidated balance sheets, results of operations or cash flows.
The Company has adopted ASC No. 820-10-65, Fair Value Measurements and Disclosures on a prospective basis on July 1, 2009. This section provides additional guidance on fair value measurements in inactive markets. The new approach is designed to address whether a market is inactive, and if so, whether a transaction in that
F-14
Table of Contents
market should be considered distressed. It also provides additional guidance on how fair value measurements might be determined in an active market. Adoption of this standard had no material impact on our consolidated balance sheets, results of operations or cash flows.
In August 2009 the FASB issued an accounting standard update on measuring liabilities at fair value under ASC No. 820, Fair Value Measurements and Disclosures. The update provides clarification on how to measure the fair value of a liability when a quoted price for an identical liability is not available in an active market. This includes a discussion of appropriate valuation techniques. ASC No. 820 is effective for reporting periods, including interim periods, beginning after August 26, 2009. Given that the Company did not elect the fair value option of any of its liabilities, the adoption of this standard had no impact on the valuation of the Company’s liabilities.
(v) Future accounting pronouncements
In June 2009, the FASB issued a new standard under ASC No. 810-10, Consolidation which changes the consolidation model for VIE’S. The revised model increases the qualitative analysis required when identifying which entity is the primary beneficiary that has (i) the power to direct the activities of a VIE that most significantly impact the entity’s economic performance and (ii) the obligation to absorb losses or the right to receive benefits from the VIE. The new standard eliminates the QSPE exemption, requires ongoing reconsideration of the primary beneficiary and amends the events which trigger reassessment of whether an entity is a VIE. The new guidance is effective for annual and interim periods beginning after November 15, 2009. We are assessing the potential impact that the adoption of this standard may have on our consolidated financial position, results of operations or cash flows.
In October 2009 the FASB issued ASU No. 2009-13, Multiple-Deliverable Revenue Arrangements, under ASC No. 605. The new guidance provides a more flexible alternative to identify and allocate consideration among multiple elements in a bundled arrangement when vendor-specific objective evidence or third-party evidence of selling price is not available. ASU No. 2009-13 requires the use of the relative selling price method and eliminates the residual method to allocation arrangement consideration. Additional expanded qualitative and quantitative disclosures are also required. The guidance is effective prospectively for revenue arrangements entered into or materially modified in years beginning on or after June 15, 2010. We are assessing the potential impact that the adoption of ASU No. 2009-13 may have on our consolidated balance sheets, results of operations and cash flows.
3. DISCONTINUED OPERATIONS
In 2006, the Company determined that certain operating subsidiaries in the Medical Products segment were not aligned with the Company’s current business strategy and, consequently, began actively looking to dispose of these operations. These operations were categorized as discontinued and included the following subsidiaries: American Medical Instruments, Inc. located in Dartmouth, Massachusetts; Point Technologies, Inc. located in Boulder, Colorado; and Point Technologies S.A. located in Costa Rica. On July 31, 2007, the Company completed the sale of 100% of the issued and outstanding shares of Point Technologies, Inc. for proceeds of $2.6 million and on August 30, 2007, the Company sold all of the assets and liabilities of the Dartmouth operations for proceeds of $2.2 million. Prior to the disposal of these operations, the assets and liabilities of these operations were shown separately on the balance sheet as current and long-term assets and current and long-term liabilities from discontinued operations and the net losses for these operations were shown separately on the statements of operations.
Management reviewed the carrying value of the discontinued operations and recorded an impairment charge of $8.9 million for the year ended December 31, 2007. The impairment charge was determined based on management’s best estimates of net proceeds on ultimate disposition.
F-15
Table of Contents
The operating results of discontinued operations are included in the Consolidated Statements of Operations as “Loss from discontinued operations, net of income taxes.” The amounts for the years ended December 31, 2007 are summarized as follows:
| Year ended December 31, 2007 |
||||
| Revenues |
$ | 7,580 | ||
| Operating loss |
(632 | ) | ||
| Other income (expense) |
2 | |||
| Loss on disposal of subsidiary |
(1,993 | ) | ||
| Impairment charge |
(8,879 | ) | ||
| Loss before income taxes |
(11,502 | ) | ||
| Income tax recovery |
(1,609 | ) | ||
| Loss from discontinued operations |
$ | (9,893 | ) | |
| Loss per common share: |
||||
| Basic |
$ | (0.12) | ||
| Diluted |
$ | (0.12) | ||
| Shares used in computing loss per share: |
||||
| Basic |
85,015 | |||
| Diluted |
85,015 | |||
4. FINANCIAL INSTRUMENTS AND FINANCIAL INSTRUMENT RISK
For certain of the Company’s financial assets and liabilities, including cash and cash equivalents, accounts receivable, accounts payable and accrued liabilities, the carrying amounts approximate fair value due to their short-term nature. The fair value of short-term investments approximates $7.8 million as at December 31, 2009 (December 31, 2008 - $0.8 million). The total fair value of long-term debt and accrued interest approximates $436.8 million (December 31, 2008 - $224.2 million) and has a carrying value of $581.0 million as at December 31, 2009 (December 31, 2008 - $581.5 million).
The fair values of short-term investments and long-term debt, including accrued interest, is based on quoted market prices in active markets for identical assets as at December 31, 2009 and 2008.
Financial risk includes interest rate risk, exchange rate risk and credit risk. Interest rate risk arises due to the Company’s long-term debt bearing fixed and variable interest rates. The interest rate on the Senior Floating Rate Notes due 2013 is reset quarterly to 3-month LIBOR plus 3.75%. The Floating Rate Notes currently bear interest at a rate of 4.01%. The Company does not use derivatives to hedge against interest rate risks.
Foreign exchange rate risk arises as a portion of the Company’s investments, revenues and expenses are denominated in other than U.S. dollars. The Company’s financial results are subject to the variability that arises from exchange rate movements in relation to the U.S. dollar, and is primarily limited to the Canadian dollar, the Swiss franc, the Euro, the Danish kroner and the UK pound sterling. Foreign exchange risk is primarily managed by satisfying foreign denominated expenditures with cash flows or assets denominated in the same currency.
Credit risk arises as the Company provides credit to its customers in the normal course of business. The Company performs credit evaluations of its customers on a continuing basis and the majority of its trade receivables are unsecured. The maximum credit risk loss that the Company could face is limited to the carrying amount of accounts receivable. Concentrations of credit risk with respect to trade accounts receivable are limited due to the large number of customers and their dispersion across many geographic areas. However, a significant amount of trade accounts receivable is with the national healthcare systems of several countries. Although the
F-16
Table of Contents
Company does not currently foresee a credit risk associated with these receivables, payment is dependent upon the financial stability of those countries’ national economies. At December 31, 2009, accounts receivable is net of an allowance for uncollectible accounts of $0.5 million (December 31, 2008 -$0.3 million).
5. CASH AND CASH EQUIVALENTS
Cash and cash equivalents includes the following:
| December 31, 2009 |
December 31, 2008 | |||||
| U.S. dollars |
$ | 34,335 | $ | 21,866 | ||
| Canadian dollars |
5,542 | 3,942 | ||||
| Swiss francs |
986 | 3,053 | ||||
| Euros |
5,680 | 5,263 | ||||
| Danish kroner |
412 | 2,022 | ||||
| Other |
2,587 | 2,806 | ||||
| $ | 49,542 | $ | 38,952 | |||
All cash and cash equivalents are held in interest and non-interest bearing bank accounts.
6. SHORT TERM INVESTMENTS
| December 31, 2009 |
Cost | Gross Unrealized Gains |
Carrying value | ||||||
| Short-term investments: |
|||||||||
| Available-for-sale equity securities |
$ | 848 | $ | 6,932 | $ | 7,780 | |||
| December 31, 2008 |
Cost | Gross Unrealized Losses |
Carrying value | ||||||
| Short-term investments: |
|||||||||
| Available-for-sale equity securities |
$ | 848 | $ | — | $ | 848 | |||
Short term investments as at December 31, 2009 and 2008 include investments in biotechnology companies.
All of our available-for sale securities are publicly traded equity securities.
In 2008, the Company recorded a $14.8 million (December 31, 2007 - $nil) other-than-temporary impairment on certain investments and realized an $8.8 million (December 31, 2007 - $8.2 million) loss on the disposition of a short-term available-for-sale investment.
7. INVENTORIES
| December 31, 2009 |
December 31, 2008 | |||||
| Raw materials |
$ | 10,352 | $ | 10,357 | ||
| Work in process |
12,283 | 12,232 | ||||
| Finished goods |
12,906 | 16,005 | ||||
| $ | 35,541 | $ | 38,594 | |||
As at December 31, 2009, the inventory allowance was $3.0 million (December 31, 2008 - $2.1 million). For the year ended December 31, 2009, inventory write-downs and obsolescence charges were $1.8 million (December 31, 2008 - $1.0 million, December 31, 2007 – $2.4 million).
F-17
Table of Contents
8. ASSETS HELD FOR SALE
During the year ended December 31, 2008 and in connection with the Company’s plans for capacity rationalization and consolidation in the Medical Products segment, the Company reclassified two of its long-lived assets as held for sale in accordance with guidance for accounting for impairment of long-lived assets under ASC No. 350 — General Intangibles Other than Goodwill and ASC No. 360 — Property, Plant and Equipment. During the year ended December 31, 2009, the Company recorded an impairment charge of $0.8 million (December 31, 2008 - $1.3 million) to adjust the carrying value to $2.3 million (December 31, 2008 - $3.1 million), which represented the lower of cost and fair value less estimated selling costs. Subsequent to year end, one of these properties was sold for gross proceeds of $0.8 million.
In connection with the 2008 capacity rationalization plans in the Pharmaceutical Technologies segment, the Company also reclassified a property that is no longer in use as held for sale. For the year ended December 31, 2009, the Company recorded an impairment charge of $2.3 million to adjust the carrying value of the property to $3.0 million (December 31, 2008 - $5.3 million), which represents the lower of cost and fair value less estimated selling costs.
9. PROPERTY, PLANT AND EQUIPMENT
| December 31, 2009 |
Cost | Accumulated Depreciation |
Net Book Value | ||||||
| Land |
$ | 4,796 | $ | — | $ | 4,796 | |||
| Buildings |
14,736 | 2,248 | 12,488 | ||||||
| Leasehold improvements |
19,709 | 6,292 | 13,417 | ||||||
| Manufacturing equipment |
20,396 | 9,175 | 11,221 | ||||||
| Research equipment |
8,197 | 5,235 | 2,962 | ||||||
| Office furniture and equipment |
4,398 | 3,577 | 821 | ||||||
| Computer equipment |
8,183 | 7,009 | 1,174 | ||||||
| $ | 80,415 | $ | 33,536 | $ | 46,879 | ||||
| December 31, 2008 |
Cost | Accumulated Depreciation |
Net Book Value | ||||||
| Land |
$ | 4,755 | $ | — | $ | 4,755 | |||
| Buildings |
14,200 | 1,257 | 12,943 | ||||||
| Leasehold improvements |
17,944 | 5,108 | 13,836 | ||||||
| Manufacturing equipment |
18,815 | 6,302 | 12,513 | ||||||
| Research equipment |
7,316 | 4,363 | 2,953 | ||||||
| Office furniture and equipment |
3,698 | 2,486 | 1,212 | ||||||
| Computer equipment |
9,000 | 7,104 | 1,896 | ||||||
| $ | 75,728 | $ | 26,620 | $ | 49,108 | ||||
Depreciation expense, including depreciation expense allocated to cost of goods sold was $7.1 million for the year ended December 31, 2009 (December 31, 2008 - $7.9 million, December 31, 2007 - $7.9 million).
F-18
Table of Contents
10. INTANGIBLE ASSETS AND GOODWILL
(a) Intangible Assets
| December 31, 2009 |
Cost | Accumulated Amortization |
Net Book Value | ||||||
| Acquired technologies |
$ | 135,060 | $ | 64,935 | $ | 70,125 | |||
| Customer relationships |
110,778 | 41,530 | 69,248 | ||||||
| In-licensed technologies |
53,882 | 28,710 | 25,172 | ||||||
| Trade names and other |
14,511 | 6,037 | 8,474 | ||||||
| $ | 314,231 | $ | 141,212 | $ | 173,019 | ||||
| December 31, 2008 |
Cost | Accumulated Amortization |
Net Book Value | ||||||
| Acquired technologies |
$ | 128,061 | $ | 52,303 | $ | 75,758 | |||
| Customer relationships |
110,509 | 32,426 | 78,083 | ||||||
| In-licensed technologies |
55,829 | 24,104 | 31,725 | ||||||
| Trade names and other |
14,410 | 4,499 | 9,911 | ||||||
| $ | 308,809 | $ | 113,332 | $ | 195,477 | ||||
Amortization expense for the year ended December 31, 2009 was $30.0 million (year ended December 31, 2008 -$30.2 million; year ended December 31, 2007 - $29.4 million).
The following table summarizes the estimated amortization expense for each of the five succeeding fiscal years for intangible assets held as of December 31, 2009:
| 2010 |
30,543 | |
| 2011 |
30,405 | |
| 2012 |
30,405 | |
| 2013 |
30,405 | |
| 2014 |
28,665 |
(b) Goodwill Impairment
During the year ended December 31, 2008, the Company tested goodwill for impairment and determined that goodwill was impaired due to a significant and sustained decline in the Company’s public share price and market capitalization, reorganization activities, uncertainties about future cash flows and implied risk premiums used by market participants. As a result, the Company recorded a $649.7 million write-down of goodwill, which consisted of a $626.2 million write-down to the Medical Products segment and a $23.5 million write-down to the Pharmaceutical Technologies segment. The carrying value of goodwill is therefore $nil for the years ended December 31, 2009 and 2008.
11. ACCOUNTS PAYABLE AND ACCRUED LIABILITIES
| December 31, 2009 |
December 31, 2008 | |||||
| Trade accounts payable |
$ | 5,110 | $ | 4,700 | ||
| Accrued license and royalty fees |
13,738 | 4,196 | ||||
| Employee-related accruals |
14,054 | 17,382 | ||||
| Accrued professional fees |
4,141 | 9,888 | ||||
| Accrued contract research |
704 | 2,121 | ||||
| Other accrued liabilities |
8,577 | 8,333 | ||||
| $ | 46,324 | $ | 46,620 | |||
F-19
Table of Contents
12. INCOME TAXES
(a) The components of the provision for (recovery of) income taxes from continuing operations are as follows:
| Year ended December 31, 2009 |
Year ended December 31, 2008 |
Year ended December 31, 2007 |
|||||||||
| Current income tax expense (recovery): |
|||||||||||
| Canada |
523 | $ | (4,281 | ) | $ | (7,062 | ) | ||||
| Foreign |
4,505 | 5,138 | 5,061 | ||||||||
| 5,028 | 857 | (2,001 | ) | ||||||||
| Deferred income tax expense (recovery): |
|||||||||||
| Canada |
63 | (1,897 | ) | 2,951 | |||||||
| Foreign |
946 | (11,852 | ) | (15,495 | ) | ||||||
| 1,009 | (13,749 | ) | (12,544 | ) | |||||||
| Income tax expense (recovery) |
$ | 6,037 | $ | (12,892 | ) | $ | (14,545 | ) | |||
(b) The provision for income taxes is based on net income (loss) from continuing operations before income taxes as follows:
| Year ended December 31, 2009 |
Year ended December 31, 2008 |
Year ended December 31, 2007 |
||||||||||
| Canada |
$ | (27,984 | ) | $ | (20,510 | ) | $ | (48,018 | ) | |||
| Foreign |
11,153 | (733,558 | ) | (22,574 | ) | |||||||
| $ | (16,831 | ) | $ | (754,068 | ) | $ | (70,592 | ) | ||||
(c) The reconciliation between the combined Canadian federal and provincial income taxes at the statutory rate and the provision for income taxes from continuing operations, is as follows:
| Year ended December 31, 2009 |
Year ended December 31, 2008 |
Year ended December 31, 2007 |
||||||||||
| Net income (loss) before income taxes |
$ | (16,831 | ) | $ | (754,068 | ) | $ | (70,592 | ) | |||
| Statutory tax rate |
30.0 | % | 31.0 | % | 34.1 | % | ||||||
| Expected income tax expense (recovery) |
(5,049 | ) | (233,761 | ) | (24,072 | ) | ||||||
| Tax rate changes on deferred tax assets and liabilities |
(426 | ) | 2,143 | 1,686 | ||||||||
| Foreign tax rate differences |
(5,464 | ) | 4,200 | (12,984 | ) | |||||||
| Foreign exchange losses |
(640 | ) | (14,049 | ) | (4,937 | ) | ||||||
| Change in valuation allowance |
3,091 | 64,001 | 18,555 | |||||||||
| Reassessment of prior years’ taxes [see paragraph (g)] |
1,057 | (3,845 | ) | 1,126 | ||||||||
| Non-deductible portion of the capital (gains) losses |
— | (5,484 | ) | (1,011 | ) | |||||||
| Capital losses |
— | (45,045 | ) | — | ||||||||
| Non-deductible stock based compensation |
323 | 583 | 1,370 | |||||||||
| Goodwill impairment |
— | 198,369 | — | |||||||||
| Uncertain tax positions |
740 | 6,082 | 1,039 | |||||||||
| Taxable dividends from subsidiaries |
1,719 | 4,208 | 10,146 | |||||||||
| Cost capitalized to investment in subsidiaries |
1,124 | — | — | |||||||||
| Release of prepaid taxes |
6,211 | 422 | 842 | |||||||||
| Permanent differences and other |
3,351 | 9,284 | (6,305 | ) | ||||||||
| Income tax expense (recovery) |
$ | 6,037 | $ | (12,892 | ) | $ | (14,545 | ) | ||||
F-20
Table of Contents
(d) Deferred income tax assets and liabilities result from the temporary differences between the amount of assets and liabilities recognized for financial statement and income tax purposes. The significant components of the net deferred income tax assets and liabilities are as follows:
| December 31, 2009 |
December 31, 2008 |
|||||||
| Deferred income tax assets |
||||||||
| Property, plant and equipment |
$ | 1,538 | $ | 1,797 | ||||
| Intangible assets |
9,478 | 16,676 | ||||||
| Other assets |
5,532 | 5,889 | ||||||
| Accrued liabilities |
5,742 | 4,941 | ||||||
| Unrealized foreign exchange losses |
3,239 | 3,431 | ||||||
| Operating loss carry forwards |
31,037 | 28,154 | ||||||
| Capital loss carry forwards |
51,943 | 54,390 | ||||||
| Tax credits |
18,987 | 16,118 | ||||||
| Total gross deferred income tax assets |
127,496 | 131,396 | ||||||
| Less: valuation allowance |
(95,159 | ) | (91,986 | ) | ||||
| Total deferred income tax assets |
$ | 32,337 | $ | 39,410 | ||||
| Deferred income tax liabilities |
||||||||
| Property, plant and equipment |
$ | 1,503 | $ | 1,725 | ||||
| Identifiable intangible assets |
62,093 | 72,410 | ||||||
| Other liabilities |
99 | 526 | ||||||
| Undistributed earnings of foreign subsidiaries [see paragraph (f)] |
1,138 | 1,506 | ||||||
| Total deferred tax liabilities |
64,832 | 76,167 | ||||||
| Net deferred income tax assets (liabilities) |
$ | (32,494 | ) | $ | (36,757 | ) | ||
The realization of deferred income tax assets is dependent upon the generation of sufficient taxable income during future periods in which the temporary differences are expected to reverse. The valuation allowance is reviewed on a quarterly basis and if the assessment of the “more likely than not” criteria changes, the valuation allowance is adjusted accordingly. The valuation allowance continues to be applied against certain deferred income tax assets where the Company has assessed that the realization of such assets does not meet the “more likely than not” criteria. During 2009, the Company increased the valuation allowance by $3.2 million related primarily to the Company’s Canadian operations.
(e) The Company has unclaimed U.S. federal and state research and development investment tax credits of approximately $4.4 million (December 31, 2008 - $4.4 million) available to reduce future U.S. income taxes otherwise payable. The Company also has Canadian federal and provincial investment tax credits of approximately $14.1 million (December 31, 2008 - $12.2 million) available.
The Company has a net operating loss carry forward balance of approximately $206.1 million (December 31, 2008 - $144.2 million) available to offset future taxable income in Canada ($35.9 million, December 31, 2008 - $15.0 million), the U.S. ($53.3 million, December 31, 2008 - $69.5 million), Switzerland ($116.9 million, December 31, 2008 - $58.6 million) and other European countries (nil, December 31, 2008 - $1.1 million). A portion of the losses in the U.S. are subjected to limitation but the Company does not expect the limitation will impair the use of any of the losses.
The Company has foreign tax credits in the U.S. of approximately $2.1 million available to use against foreign-source income.
The Company has a capital loss carry forward balance of approximately $406.6 million (December 31, 2008 - $410.0 million) available to offset future capital gains in the U.S. ($4.4 million, December 31, 2008 - $4.4 million) and Canada ($402.2 million, December 31, 2008 - $405.6 million). The capital losses can be carried forward indefinitely for Canada and five years for the U.S.
F-21
Table of Contents
The investment tax credits and loss carry forwards expire as follows:
| Federal tax credits |
Provincial/state tax credits |
Operating Loss Carry forwards | |||||||
| 2010 |
— | — | 9,824 | ||||||
| 2011 |
— | — | 15,886 | ||||||
| 2012 |
926 | — | 16,641 | ||||||
| 2013 |
2,093 | 72 | 6,841 | ||||||
| 2014 |
1,412 | — | 3,037 | ||||||
| 2015 |
1,519 | — | 16,686 | ||||||
| 2016 |
— | — | 48,272 | ||||||
| 2017 |
— | — | — | ||||||
| 2018 |
436 | 27 | — | ||||||
| 2019 |
573 | — | — | ||||||
| 2020 |
464 | 19 | — | ||||||
| 2021 |
278 | — | — | ||||||
| 2022 |
189 | — | — | ||||||
| 2023 |
232 | — | 4,375 | ||||||
| 2024 |
457 | — | 5,164 | ||||||
| 2025 |
276 | — | 10,715 | ||||||
| 2026 |
2,405 | — | 7,397 | ||||||
| 2027 (or later) |
4,746 | 2,386 | 61,281 | ||||||
| $ | 16,006 | $ | 2,504 | $ | 206,119 | ||||
(f) The Company has not recognized a deferred income tax liability for the undistributed earnings of certain foreign subsidiaries which are essentially investments in those foreign subsidiaries and are permanent in duration. It is not practical to determine the amount of these liabilities.
(g) In September 2006, the Quebec National Assembly enacted legislation (Bill 15) that retroactively changed certain tax laws that subject the Company to additional taxes for the 2004 and 2005 taxation years. As a result of the Quebec income tax assessment, a total of $14.4 million had been accrued as of December 31, 2007 of which $1.1 million was accrued in 2007. During 2008, the Company settled with the Canada Revenue Agency and Revenue Quebec and recognized a recovery of $3.8 million. The fiscal 2009 reassessments were unrelated to this settlement.
13. OTHER TAX LIABILITY
Effective January 1, 2007, the Company adopted the provisions of FASB Interpretation No. 48, Accounting for Uncertainty in Income Taxes. As of December 31, 2009 and December 31, 2008, the total amount of the Company’s unrecognized tax benefits were $11.4 million and $10.4 million, respectively. If recognized in future periods, the unrecognized tax benefits would affect our effective tax rate.
The reserve for uncertain tax positions includes accrued interest and penalties of $0.7 million (December 31, 2008 - $0.7 million). In accordance with the Company’s accounting policies, accrued interest and penalties, if incurred, relating to unrecognized tax benefits are recognized as a component of income tax expense.
The taxation years 2003 - 2008 remain open to examination by the Canada Revenue Agency and taxation years 2006 - 2009 remain open to examination by the Internal Revenue Service. The Company files income tax returns in Canada, the U.S. and various foreign jurisdictions.
F-22
Table of Contents
A reconciliation of the change in the reserves for an uncertain tax positions from January 1, 2008 – December 31, 2009 is as follows:
| 2009 | 2008 | |||||||
| Balance as of January 1 |
$ | 10,416 | $ | 4,693 | ||||
| Tax positions related to current year: |
||||||||
| Additions |
1,049 | 6,744 | ||||||
| Reductions |
— | — | ||||||
| Tax positions related to prior years: |
||||||||
| Additions |
294 | 356 | ||||||
| Reductions |
(300 | ) | (360 | ) | ||||
| Settlements |
(92 | ) | (667 | ) | ||||
| Lapses in statutes of limitations |
— | (350 | ) | |||||
| Balance as of December 31 |
$ | 11,367 | $ | 10,416 | ||||
14. LONG-TERM DEBT
| December 31, 2009 |
December 31, 2008 | |||||
| Senior Floating Rate Notes due December 1, 2013 (a) |
$ | 325,000 | $ | 325,000 | ||
| 7.75% Senior Subordinated Notes due April 1, 2014 (b) |
250,000 | 250,000 | ||||
| $ | 575,000 | $ | 575,000 | |||
(a) Senior Floating Rate Notes
On December 11, 2006, the Company issued Senior Floating Rate Notes due December 1, 2013 (“Senior Floating Rate Notes”), in the aggregate principal amount of $325 million. The Senior Floating Rate Notes are unsecured senior obligations, which are guaranteed by certain of the Company’s subsidiaries, and rank equally in right of payment to all of the Company’s existing and future senior unsubordinated indebtedness. The guarantees of its guarantor subsidiaries are unconditional, joint and several. The Company has provided condensed consolidating guarantor financial information as at December 31, 2009 and 2008 and for the years ended December 31, 2009, 2008 and 2007 (note 25).
The Company may redeem all or a part of the Senior Floating Rate Notes at the redemption prices (expressed as percentages of principal amount) set forth below plus accrued and unpaid interest, if any, on the notes redeemed, to the applicable redemption date, if redeemed during the twelve-month period beginning on the dates indicated below:
| Year |
Percentage (%) | |
| December 1, 2009 |
102 | |
| December 1, 2010 |
101 | |
| December 1, 2011 |
100 |
In certain change of control situations, the Company is required to make an offer to purchase the then-outstanding Senior Floating Rate Notes at a price equal to 101% of their stated principal amount, plus accrued and unpaid interest to the applicable repurchase date, if any.
(b) Senior Subordinated Notes
On March 23, 2006, the Company issued 7.75% Senior Subordinated Notes due April 1, 2014 (the “Senior Subordinated Notes”), in the aggregate principal amount of $250 million. The Senior Subordinated Notes were used to
F-23
Table of Contents
fund the Company’s 2006 acquisition of American Medical Instruments Holdings, Inc. (“AMI”). The Senior Subordinated Notes and related Note guarantees provided by the Company and certain of its subsidiaries are subordinated to senior indebtedness. The Company has provided condensed consolidating guarantor financial information as of December 31, 2009 and 2008 and for the years ended December 31, 2009, 2008 and 2007 (note 25).
As at December 31, 2009, the Company has not redeemed any of the Senior Subordinated Notes.
The Company currently has the option to redeem all or a part of the Senior Subordinated Notes at the redemption prices (expressed as percentages of principal amount) set forth below plus accrued and unpaid interest, if any, on the notes redeemed, to the applicable redemption date, if redeemed during the twelve-month period beginning on the dates indicated below:
| Year |
Percentage (%) | |
| April 1, 2009 |
105.813 | |
| April 1, 2010 |
103.875 | |
| April 1, 2011 |
101.938 | |
| April 1,2012 and thereafter |
100.000 |
In certain change of control situations, the Company is required to make an offer to purchase the then-outstanding Senior Subordinated Notes at a price equal to 101% of their stated principal amount, plus accrued and unpaid interest to the applicable repurchase date, if any.
(c) Covenants
Material covenants in the indentures governing the Senior Subordinated Notes and Senior Floating Rate Notes (the “Indentures”) specify maximum or permitted amounts for certain types of capital transactions and restrict, and under specified circumstances prohibit, the payment of dividends by the Company. If the Senior Subordinated Notes or Senior Floating Rate Notes are rated investment grade and no event of default exists, certain covenants will no longer apply. At December 31, 2009, the Senior Subordinated Notes and Senior Floating Rate Notes are not rated investment grade. Outstanding principal amounts and interest accrued and unpaid may become immediately due and payable upon the occurrence of events of default specified in the Indentures. There are also certain limitations on asset sales and subsequent use of proceeds pursuant to the Indentures. As of December 31, 2009, the Company was not in breach of any provision of the Indentures governing the Senior Subordinated Notes and Senior Floating Rate Notes that would cause an event of default to occur.
(d) Interest
The Senior Floating Rate Notes bear interest at an annual rate of LIBOR (London Interbank Offered Rate), which is reset quarterly, plus 3.75%. The effective interest rate on these notes for the year ended December 31, 2009 was 4.00% (December 31, 2008 – 6.92%) and the rate in effect on December 31, 2009 was 4.01% (December 31, 2008 – 5.97%). Interest is payable quarterly in arrears on March 1, June 1, September 1, and December 1 of each year through to maturity.
The Senior Subordinated Notes bear interest at 7.75% annually payable in arrears on April 1 and October 1 of each year through to maturity.
F-24
Table of Contents
The following table (unaudited) shows the estimated interest payable for both the Senior Floating Rate Notes and the Senior Subordinated Notes over the next five years, assuming a December 31, 2009 base LIBOR rate of 0.25% as well as the impact on the estimated interest payable of a 0.5% increase or a 0.25% decrease in the base LIBOR rate:
| Year |
(unaudited) | |||||
| Base LIBOR | 0.5% Increase in base LIBOR |
0.25% Decrease in base LIBOR | ||||
| 2010 |
32,556 | 34,203 | 31,732 | |||
| 2011 |
32,556 | 34,203 | 31,732 | |||
| 2012 |
32,556 | 34,203 | 31,732 | |||
| 2013 |
31,436 | 32,944 | 30,682 | |||
| 2014 |
4,844 | 4,844 | 4,844 | |||
(e) Deferred financing costs
Deferred financing costs are capitalized and amortized on a straight-line basis, which approximates the effective interest rate method, to interest expense over the life of the debt instruments.
| December 31, 2009 |
Cost | Accumulated Amortization |
Net Book Value | ||||||
| Debt issuance costs relating to: |
|||||||||
| Senior floating rate notes |
$ | 8,000 | $ | 3,506 | $ | 4,494 | |||
| Senior subordinated notes |
8,718 | 4,087 | 4,631 | ||||||
| Revolving Credit Facility (note 14(f)) |
2,563 | 551 | 2,012 | ||||||
| Other |
272 | — | 272 | ||||||
| $ | 19,553 | $ | 8,144 | $ | 11,409 | ||||
| December 31, 2008 |
Cost | Accumulated Amortization |
Net Book Value | ||||||
| Debt issuance costs relating to: |
|||||||||
| Senior floating rate notes |
$ | 8,000 | $ | 2,358 | $ | 5,642 | |||
| Senior subordinated notes |
8,718 | 2,997 | 5,721 | ||||||
| $ | 16,718 | $ | 5,355 | $ | 11,363 | ||||
In connection with the Company’s 2008 termination of its tender offer for its outstanding Senior Floating Rate Notes and 7.75% Senior Floating Rate Notes, the Company recorded a $16.5 million write-down of deferred financing costs which had been accrued.
f) Revolving Credit Facility
In February 2009, the Company entered into a financing agreement with Wells Fargo. The financing agreement included a delayed draw secured term loan facility of up to $10.0 million and a secured revolving credit facility, which may provide up to an additional $22.5 million in available credit subject to certain terms and conditions. The secured term loan facility is subject to a borrowing base formula based on the value of certain of our finished goods inventory and accounts receivable and is secured by certain assets held by our North American operations.
On May 29, 2009, the Company entered into an amendment to the existing financing agreement with Wells Fargo which, among other things, included the early termination of the term loan facility originally scheduled to terminate on August 31, 2009. In connection with the early termination of the term loan facility, $0.6 million of the remaining unamortized deferred financing costs related to the term loan facility was expensed. The
F-25
Table of Contents
amendment also expanded the definition of “Permitted Investments” and eliminated a $2.5 million availability block, increasing the total available credit under the revolving credit facility to $25.0 million. As of December 31, 2009, the amount of financing available under the revolving credit facility was approximately $12.6 million (net of a $1.5 million letter of credit secured under the revolving credit facility). There were no borrowings outstanding under the revolving credit facility.
At any time, the amount of financing available under the revolving credit facility, which is derived from the value of certain of our inventory and accounts receivable assets, may be significantly less than $25.0 million and is expected to fluctuate from month to month with changes in levels of qualifying finished goods inventory and accounts receivable. Any borrowings outstanding under the revolving credit facility bear interest ranging from LIBOR plus 3.25% to LIBOR plus 3.75%, with a minimum Base LIBOR Rate of 2.25%. As the minimum Base LIBOR Rate under the revolving credit facility is 2.25% and the LIBOR was 0.25% on December 31, 2009, a 0.50% increase or decrease in the LIBOR as of December 31, 2009 would have no impact on interest payable under the credit facility.
The revolving credit facility includes certain covenants and restrictions with respect to operations and requires the Company to maintain certain levels of Adjusted EBITDA and interest coverage ratios, among other terms and conditions. A breach of any of these covenants could result in the Company’s inability to draw on the facility or the immediate repayment of any then outstanding principal and interest. Repayment of any amounts drawn under the revolving credit facility can be made at certain points in time with ultimate maturity being February 27, 2013. Prepayments made under the revolving credit facility in certain circumstances cannot be re-borrowed by the Company. The purpose of this facility is to provide additional liquidity for working capital and general corporate purposes.
15. SHARE CAPITAL
(a) Authorized
200,000,000 Common shares without par value
50,000,000 Class I Preference shares without par value
The Class I Preference shares are issuable in Series. The directors may, by resolution, fix the number of shares in a series of Class I Preference shares and create, define and attach special rights and restrictions as required. None of these shares are currently issued and outstanding.
During the year ended December 31, 2009, the Company issued 16,098 common shares upon exercises of stock options (December 31, 2008 – 48,000, December 31, 2007 – 90,248). The Company issues new shares to satisfy stock option exercises.
(b) Stock Options
Angiotech Pharmaceuticals, Inc.
In June 2006, the shareholders approved the adoption of the 2006 Stock Incentive Plan (the “2006 Plan”) which superseded the Company’s previous stock option plans. The 2006 Plan incorporated all of the options granted under the previous stock option plans and, in total, provides for the issuance of non-transferable stock options and stock-based awards (as defined below) to purchase up to 13,937,756 common shares to employees, officers, directors of the Company, and persons providing ongoing management or consulting services to the Company. The 2006 Plan provides for, but does not require, the granting of tandem stock appreciation rights that at the option of the holder may be exercised instead of the underlying option. A stock option with a tandem stock appreciation right is referred to as an award. When the tandem stock appreciation right portion of an award is exercised, the underlying option is cancelled. The tandem stock appreciation rights are settled in equity and the optionee receives common shares with a fair market value equal to the excess of the fair value of the shares
F-26
Table of Contents
subject to the option at the time of exercise (or the portion thereof so exercised) over the aggregate option price of the shares set forth in the option agreement. The exercise price of the options and awards is fixed by the Board of Directors, but will generally be at least equal to the market price of the common shares at the date of grant, and for options issued under the 2006 Plan and the Company’s 2004 Stock Option Plan (the “2004 Plan”), the term may not exceed five years. For options grandfathered from the stock option plans prior to the 2004 Plan, the term did not exceed 10 years. Options and awards granted are also subject to certain vesting provisions. Options and awards generally vest monthly after being granted over varying terms from 2 to 4 years.
A summary of CDN$ stock option and award activity is as follows:
| No. of Stock Options and Awards |
Weighted average exercise price (in CDN$) |
Weighted average remaining contractual term (years) |
Aggregate intrinsic value (in CDN$) | ||||||||
| Outstanding at December 31, 2007 |
7,675,944 | $ | 15.55 | 3.16 | $ | 177 | |||||
| Granted |
1,355,300 | 0.22 | |||||||||
| Exercised |
(48,000 | ) | 2.50 | ||||||||
| Forfeited |
(1,338,612 | ) | 16.12 | ||||||||
| Outstanding at December 31, 2008 |
7,644,632 | 12.82 | 2.67 | 196 | |||||||
| Granted |
1,469,000 | 0.41 | |||||||||
| Exercised |
(10,229 | ) | 0.21 | ||||||||
| Forfeited |
(1,266,694 | ) | 16.06 | ||||||||
| Cancelled |
(2,665,000 | ) | 17.73 | ||||||||
| Outstanding at December 31, 2009 |
5,171,709 | $ | 5.99 | 3.18 | $ | 2,800 | |||||
| Exercisable at December 31, 2009 |
2,723,882 | $ | 10.25 | 2.56 | $ | 637 | |||||
| Exercisable and expected to vest at December 31, 2009 |
4,706,621 | $ | 7.17 | 3.01 | $ | 2,434 | |||||
At December 31, 2009, there were 4,651,759 awards outstanding (December 31, 2008 – 4,149,482). The options and awards presented in the table above expire at various dates from January 26, 2010 to December 9, 2014.
A summary of U.S.$ award activity is as follows:
| No. of Awards |
Weighted average exercise price (in U.S.$) |
Weighted average remaining contractual term (years) |
Aggregate intrinsic value (in U.S.$) | ||||||||
| Outstanding at December 31, 2007 |
1,051,218 | $ | 9.39 | 3.73 | $ | — | |||||
| Granted |
1,160,500 | 0.21 | |||||||||
| Forfeited |
(420,750 | ) | 10.42 | ||||||||
| Outstanding at December 31, 2008 |
1,790,968 | 3.19 | 4.19 | 64 | |||||||
| Granted |
1,386,000 | 0.40 | |||||||||
| Exercised |
(6,970 | ) | 0.26 | ||||||||
| Forfeited |
(125,250 | ) | 2.33 | ||||||||
| Cancelled |
(60,000 | ) | 18.00 | ||||||||
| Outstanding at December 31, 2009 |
2,984,748 | $ | 1.64 | 3.74 | $ | 2,278 | |||||
| Exercisable at December 31, 2009 |
921,891 | $ | 3.38 | 3.21 | $ | 518 | |||||
| Exercisable and expected to vest at December 31, 2009 |
2,592,426 | $ | 2.26 | 3.55 | $ | 1,932 | |||||
F-27
Table of Contents
These awards expire at various dates from November 30, 2011 to December 9, 2014.
American Medical Instruments Holdings, Inc. (“AMI”)
On March 9, 2006, AMI granted 304 stock options under AMI’s 2003 Stock Option Plan (the “AMI Stock Option Plan”), each of which is exercisable for approximately 3,852 common shares of the Company upon exercise. All outstanding options and warrants granted prior to the March 9, 2006 grant were settled and cancelled upon the acquisition of AMI. No further options to acquire common shares of the Company can be issued pursuant to the AMI Stock Option Plan. Approximately 1,171,092 of the Company’s common shares were reserved in March 2006 to accommodate future exercises of the AMI options.
| No. of Shares Underlying Options |
Weighted average exercise price (in U.S.$) |
Weighted average remaining contractual term (years) |
Aggregate intrinsic value (in U.S.$) | ||||||||
| Outstanding at December 31, 2007 |
443,012 | $ | 15.44 | 8.20 | $ | — | |||||
| Forfeited |
(79,935 | ) | 15.44 | ||||||||
| Outstanding at December 31, 2008 |
363,077 | 15.44 | 7.19 | — | |||||||
| Forfeited |
(62,597 | ) | 15.44 | ||||||||
| Outstanding at December 31, 2009 |
300,480 | 15.44 | 6.19 | — | |||||||
| Exercisable at December 31, 2009 |
112,694 | $ | 15.44 | 6.19 | — | ||||||
| Exercisable and expected to vest at December 31, 2009 |
264,813 | $ | 15.44 | 6.19 | $ | — | |||||
These options expire on March 8, 2016.
(c) Stock-based compensation expense
For the year ended December 31, 2009, the Company recorded stock-based compensation expense of $1.6 million (December 31, 2008 - $2.4 million, December 31, 2007 - $4.6 million) relating to awards granted under its stock option plan, modified or settled subsequent to October 1, 2002. The Company expenses the compensation cost of stock-based payments over the service period using the straight-line method over the vesting period and is estimated using the Black-Scholes option pricing model using the following weighted average assumptions for grants in the respective periods:
| Year Ended December 31, 2009 |
Year Ended December 31, 2008 |
Year Ended December 31, 2007 |
|||||||
| Dividend Yield |
Nil | Nil | Nil | ||||||
| Expected Volatility |
108.0% - 126.8 | % | 81.8% - 95.9 | % | 36.3% - 50.7 | % | |||
| Weighted Average Volatility |
113.9 | % | 90.6 | % | 41.9 | % | |||
| Risk-free Interest Rate |
0.37% - 1.31 | % | 1.11% - 2.25 | % | 2.93% - 5.05 | % | |||
| Expected Term (Years) |
3 | 3 | 3 |
The weighted average fair value of awards granted in the years ended December 31, 2009, 2008 and 2007 are presented below:
| Year Ended December 31, 2009 |
Year Ended December 31, 2008 |
Year Ended December 31, 2007 | ||||
| CDN$ awards |
CDN$0.28 | CDN$0.14 | CDN$2.95 | |||
| U.S.$ awards |
$0.27 | $0.11 | $2.31 |
F-28
Table of Contents
A summary of the status of the Company’s nonvested awards as of December 31, 2009 and changes during the year ended December 31, 2009, is presented below:
| Nonvested CDN$ Awards |
No. of Awards |
Weighted average grant-date fair value (in CDN$) | ||||
| Nonvested at December 31, 2008 |
1,968,003 | $ | 1.24 | |||
| Granted |
1,469,000 | 0.28 | ||||
| Vested |
(937,239 | ) | 1.38 | |||
| Forfeited |
(51,938 | ) | 4.98 | |||
| Nonvested at December 31, 2009 |
2,447,826 | $ | 0.53 | |||
| Nonvested U.S.$ Awards |
No. of Awards |
Weighted average grant-date fair value (in U.S.$) | ||||
| Nonvested at December 31, 2008 |
1,420,490 | $ | 0.60 | |||
| Granted |
1,386,000 | 0.27 | ||||
| Vested |
(643,024 | ) | 0.65 | |||
| Forfeited |
(101,077 | ) | 0.49 | |||
| Nonvested at December 31, 2009 |
2,062,389 | $ | 0.37 | |||
A summary of the status of the Company’s common shares underlying nonvested AMI stock options as of December 31, 2009 and changes during the year ended December 31, 2009, is presented below:
| Company Shares Underlying Nonvested AMI Options |
No. of Shares Underlying Options |
Weighted average grant-date fair value (in U.S.$) | ||||
| Nonvested at December 31, 2008 |
313,478 | $ | 6.51 | |||
| Vested |
(86,675 | ) | 6.51 | |||
| Forfeited |
(39,002 | ) | 6.51 | |||
| Nonvested at December 31, 2009 |
187,801 | $ | 6.51 | |||
As of December 31, 2009, there was $1.6 million of total unrecognized compensation cost related to nonvested stock awards granted under the 2006 Plan. These costs are expected to be recognized over a weighted average period of 1.9 years.
As of December 31, 2009, there was $0.7 million of total unrecognized compensation cost related to the nonvested AMI stock options. These costs are expected to be recognized over a period of 2.25 years on a straight-line basis as a charge to income. The total fair value of options vested during the year ended December 31, 2009 was $495,000 (December 31, 2008 - $360,000).
During the years ended December 31, 2009, 2008 and 2007 the following activity occurred:
| (in thousands) |
Year Ended December 31, 2009 |
Year Ended December 31, 2008 |
Year Ended December 31, 2007 | ||||||
| Total intrinsic value of stock options exercised: |
|||||||||
| CDN dollar options |
$ | 17 | $ | 33 | $ | 257 | |||
| U.S. dollar options |
$ | 10 | $ | n/a | $ | n/a | |||
| Total fair value of stock awards vested |
$ | 1,559 | $ | 2,367 | $ | 4,401 | |||
F-29
Table of Contents
Cash received from stock option exercises for the years ended December 31, 2009, 2008, and 2007 were $2,000, $121,000 and $228,000 respectively. The tax benefit realized from the option exercises of the share-based payment arrangements totalled $7,900 for the year ended December 31, 2009; and $nil respectively for each of the years ended December 31, 2008 and 2007.
The Black-Scholes pricing model was developed for use in estimating the fair value of traded options which have no vesting restrictions and are fully transferable. In addition, option valuation models require the input of highly subjective assumptions including the expected stock price volatility. The Company’s employee stock options have characteristics significantly different from those of traded options and changes in the subjective input assumptions can materially affect the fair value estimate.
(d) Shareholder rights plan
The Company adopted a shareholder’s rights plan (“the Plan”) on February 10, 1999, amended and restated March 5, 2002, June 9, 2005 and October 30, 2008. According to the Plan, each shareholder is issued one right. Each right will entitle the holder to acquire common shares of the Company at a 50% discount to the market upon certain specified events, including upon a person or group of persons acquiring 20% or more of the total common shares of the Company. The rights are not exercisable in the event of a Permitted Bid as defined in the Plan. The Plan must be reconfirmed by the Company’s shareholders every three years.
16. LICENCE FEE REVENUE
Under an Amended and Restated Distribution and Licence Agreement with our partner Baxter, the Company received a one-time payment of $25.0 million, which was received in lieu and settlement of future royalty and milestone obligations related to existing formulations of CoSeal surgical sealant or any future products. Given that all deliverables were provided to Baxter and the Company’s performance obligations were substantially complete, the payment was recognized as licence fee revenue in the first quarter of 2009.
17. IN-PROCESS RESEARCH AND DEVELOPMENT
The Company made in-process research and development payments as follows:
| Year ended December 31, 2009 |
Year ended December 31, 2008 |
Year ended December 31, 2007 | |||||||
| CombinatoRx Incorporated |
$ | — | $ | — | $ | 7,000 | |||
| Rex Medical LP |
— | 2,500 | 1,000 | ||||||
| Lipose Corporation |
— | — | 125 | ||||||
| Total |
— | $ | 2,500 | $ | 8,125 | ||||
18. COMMITMENTS AND CONTINGENCIES
(a) Commitments
i) Lease commitments
The Company has entered into operating lease agreements for office, laboratory and manufacturing space which expire through July 2019. Future minimum annual lease payments under these leases are as follows:
| 2010 |
$ | 3,559 | |
| 2011 |
3,101 | ||
| 2012 |
2,950 | ||
| 2013 |
2,902 | ||
| 2014 |
2,872 | ||
| Thereafter |
10,807 | ||
| $ | 26,191 | ||
F-30
Table of Contents
Rent expense for the year ended December 31, 2009 amounted to $3.2 million (December 31, 2008 - $3.5 million, December 31, 2007 - $2.4 million).
ii) Commitments
We have entered into research and development collaboration agreements that involve joint research efforts. Certain collaboration costs and any eventual profits will be shared as per terms provided for in the agreements. We may also be required to make milestone, royalty, and/or other research and development funding payments under research and development collaboration and other agreements with third parties. These payments are contingent upon the achievement of specific development, regulatory and/or commercial milestones. We accrue for these payments when it is probable that a liability has been incurred and the amount can be reasonably estimated. We do not accrue for these payments if the outcome of achieving these milestones is not determinable. Our significant contingent milestone, royalty and other research and development commitments are as follows:
Quill Medical, Inc. (“Quill”)
In connection with the acquisition of Quill in June 2006, we may be required to make additional contingent payments of up to $150 million upon the achievement of certain revenue growth and a development milestone. These payments are primarily contingent upon the achievement of significant incremental revenue growth over a five-year period from July 1, 2006, subject to certain conditions.
National Institutes of Health (“NIH”)
In November 1997, we entered into an exclusive license agreement with the Public Health Service of the United States, through the NIH, whereby we were granted an exclusive, worldwide license to certain technologies of the NIH relating to the use of paclitaxel. Pursuant to this license agreement, we agreed to pay NIH milestone payments upon achievement of certain clinical and commercial development milestones and pay royalties on net TAXUS sales by BSC and Zilver-PTX sales by Cook Medical Inc. At December 31, 2009, we have accrued royalty fees of $7.3 million (December 31, 2008 - $2.7 million) payable to NIH under this agreement related to royalties earned on 2009 sales. In the future, the amounts owing to NIH at any one time may fluctuate as compared to the historical amounts owed based on a recent amendment to the agreement which provides us with additional flexibility regarding payments.
Biopsy Sciences LLC (“Biopsy Sciences”)
In connection with the acquisition of certain assets from Biopsy Sciences in January 2007, we may be required to make certain contingent payments of up to $2.7 million upon the achievement of certain clinical and regulatory milestones and up to $10.7 million for achieving certain commercialization milestones. As of December 31, 2009, we have paid $0.7 million relating to the successful completion of the U.S. clinical trial enrollment for the Bio-Seal lung biopsy tract plug system.
Rex Medical LP (“Rex Medical”)
In March 2008, we entered into an agreement with Rex Medical to manufacture and distribute the Option IVC Filter. For the quarter ended June 30, 2008, we made a payment of $2.5 million to Rex Medical to obtain the marketing rights for the Option IVC Filter. We recorded this payment as an in-process and research development cost. For the quarter ended June 30, 2009, we made a milestone payment of $2.5 million upon achievement of U.S. Food and Drug Administration (“FDA”) 510(k) clearance. We have capitalized this payment as an intangible asset. As at December 31, 2009, we achieved the first sales target which triggered a milestone payment of $0.5 million. The milestone was accrued and is expected to be paid in early 2010. Under terms of this agreement, we may be required to make further contingent payments of up to $4.5 million upon achievement of certain commercialization milestones. We have accrued and capitalized these expected contingent payments as an addition to the intangible asset. Actual payments may differ materially from our estimate of the expected contingent payments given that they are dependent on the realization of future sales targets as defined under the terms of the agreement. We are also committed to making escalating royalty payments of 30% to 47.5% based on annual net sales of these products, which are recognized as cost of products sold.
F-31
Table of Contents
Haemacure Corporation (“Haemacure”)
In June 2009, we entered into license, distribution, development and supply agreements for fibrin and thrombin technologies with Haemacure. The collaboration provides us with access to technology for certain of our surgical product candidates which are currently in preclinical development. As part of this collaboration, we have agreed to provide to Haemacure a senior secured bridge financing facility. The senior bridge loan provided $2.5 million to Haemacure in multiple draw-downs throughout 2009. The loan is senior to all of Haemacure’s existing and future indebtedness and, subject to certain exceptions, bears interest at an annual rate of 10%, compounded quarterly, and for a term of two years. As of December 31, 2009, $2.5 million of the loan had been drawn upon by Haemacure. The loan was fair valued with $1.6M being capitalized to long term assets on account of our secured interest and $0.9 million, which was initially recorded as pre-payment for future services, was fully amortized by the end of 2009.
On January 11, 2010 Haemacure announced that it had filed a notice of intention to make a proposal to its creditors under the Bankruptcy and Insolvency Act (Canada) and that its wholly-owned U.S. subsidiary sought court protection under Chapter 11 in the U.S. The filings were completed on Friday, January 8, 2010. Haemacure’s Board of Directors authorized these actions in light of Haemacure’s financial condition and inability to raise additional financing. We have agreed to provide up to a maximum amount of $1.0 million of additional financing, of which $0.8 million has been provided as of March 12, 2010 to fund Haemacure’s insolvency proceedings and day-to-day operations. The funds are being disbursed in accordance with a schedule agreed to by Haemacure and us. All funds loaned to Haemacure to date and in the future are secured by substantially all of their assets. We hope to exercise our security in the future to acquire Haemacure’s assets. Of the total of $2.5 million paid as of December 31, 2009, $1.6 million has been classified as other assets and $0.9 million, which was previously classified as a prepaid expense, has been fully amortized.
(b) Contingencies
From time to time, we may be subject to claims and legal proceedings brought against us in the normal course of business. Such matters are subject to many uncertainties. We believe that adequate provisions have been made in the accounts where required. However, we are not able to determine the outcome or estimate potential losses of the pending legal proceedings listed below, or other legal proceedings, to which we may become subject in the normal course of business or estimate the amount or range of any possible loss we might incur if it does not prevail in the final, non-appealable determinations of such matters. We cannot provide assurance that the legal proceedings listed here, or other legal proceedings not listed here, will not have a material adverse impact on our financial condition or results of operations.
BSC, a licensee, is often involved in legal proceedings (to which we are not a party) concerning challenges to its stent business. If a party opposing BSC is successful, and if a court were to issue an injunction against BSC, royalty revenue would likely be significantly reduced. The ultimate outcome of any such proceedings is uncertain at this time. BSC has recently settled two significant litigation matters with Johnson & Johnson involving its stent business in exchange for payment to Johnson & Johnson of over $2.4 billion.
On April 4, 2005, together with BSC, we commenced a legal action in the Netherlands against Sahajanand Medical Technologies Pvt. Ltd. (“SMT”) for patent infringement. On May 3, 2006, the Dutch trial court ruled in our favor, finding that our EP (NL) 0 706 376 patent was valid, and that SMT’s Infinnium™ stent infringed the patent. On March 13, 2008, a Dutch Court of Appeal held a hearing to review the correctness of the trial court’s decision. The Court of Appeal released their judgment on January 27, 2009, ruling against SMT (finding our patent novel, inventive, and sufficiently disclosed). The Court of Appeal however requested amendment of claim 12 before rendering their decision on infringement. We have filed a response to the Court of Appeal’s decision, and have additionally filed a further Writ against SMT seeking to prevent SMT from, among other things, using its CE mark for SMT’s Infinnium stent. Any decision of the Court of Appeal is appealable to the Supreme Court of the Netherlands. On October 22, 2009 we and BSC settled this litigation with SMT on favorable terms. We have continued this matter before the Court of Appeal with respect to the requested amendment to claim 12. A hearing is scheduled for April 22, 2010.
F-32
Table of Contents
On March 23, 2006, RoundTable Healthcare Partners, LP (“RoundTable”) as Seller Representative, we as Buyer, and LaSalle Bank (“LaSalle”) as Escrow Agent, executed an Escrow Agreement under which we deposited $20 million with LaSalle. On April 4, 2007, LaSalle received an Escrow Claim Notice issued by us, which directed LaSalle to remit the $20 million to us as Buyer. On or about April 16, 2007, LaSalle received from RoundTable a Notice of Objection to our Escrow Claim Notice. On July 3, 2007, LaSalle filed an action in the Circuit Court of Cook County, Illinois, asking the court to resolve this dispute. After various hearings and discussions, we executed a Joint Letter of Direction allowing the release of $6.5 million to RoundTable, thereby leaving the amount in dispute being approximately $13.5 million. On March 21, 2008, this action was moved to the United States District Court for the Southern District of New York. This dispute was subsequently settled in January 2010. As a result of the settlement, all legal proceedings were dismissed and Angiotech received approximately $4.7 million from the escrow account which is expected to be recognized as a recovery in the first quarter of 2010.
In July 2004, Dr. Gregory Baran initiated legal action, alleging infringement by Medical Device Technologies Inc. (“MDT”) of two U.S. patents owned by Dr. Baran. These patents allegedly cover MDT’s BioPince™ automated biopsy device. On September 25, 2007, the judge issued her decision pursuant to the Markman hearing of December 2005. We submitted a Motion for Summary Judgment to the court based upon the Markman decision and on September 30, 2009, the judge ruled in our favor, finding that the BioPince did not infringe a key claim of Dr. Baran’s patents. Dr. Baran has appealed this decision.
At the European Patent Office (“EPO”), various patents either owned or licensed by or to us are in opposition proceedings including the following:
| • |
In EP0784490, an oral hearing took place on October 1, 2009, and the patent with amendments was maintained by the EPO. |
| • |
In EP0809515 (which is licensed from (and to) BSC), the EPO held an oral hearing on January 30, 2008 and thereafter revoked this patent. An appeal was filed on April 22, 2008. On June 25, 2009 the EPO issued a notice stating that the decision under appeal was set aside and the patent would be remitted to the First Instance for further prosecution. |
| • |
In EP0830110 (which is licensed from Edwards LifeSciences Corporation) an amended form of this patent was found valid after an oral hearing on September 28, 2006; however, the opponent appealed the decision on December 21, 2006. An oral hearing took place on September 9, 2009, and the EPO cancelled the appeal proceedings and maintained the patent in the same form as allowed by the Opposition Division. |
| • |
In EP1155689, no hearing date has yet been set by the EPO. |
| • |
In EP1407786 (which is licensed from (and to) BSC), the patent was revoked in a decision from the EPO on December 9, 2008. An appeal was filed on January 30, 2009. An appeal was also filed on behalf of the opponent on April 8, 2009. On September 1, 2009, a request to withdraw appeal was filed. On October 1, 2009, the appeal proceedings were terminated and the decision to revoke the patent was made final by the EPO. |
| • |
In EP1429664, an oral hearing had been scheduled for May 27, 2009; however, the oral hearing was canceled by the EPO on May 14, 2009. On September 14, 2009, the EPO terminated the appeal proceedings and maintained the patent. |
| • |
In EP1159974, the EPO has scheduled oral proceedings for June 9, 2010. |
| • |
In EP1159975, a Notice of Opposition was filed on June 5, 2009. Angiotech has until March 21, 2010 to file a response. |
| • |
In EP0876165, the EPO revoked the patent as an outcome of an oral hearing held on June 24, 2009. On August 20, 2009, a Notice of Appeal was filed. |
| • |
In EP0991359, a Notice of Opposition was filed. Angiotech filed a response on September 8, 2009. No hearing date has yet been set by the EPO. |
F-33
Table of Contents
On July 7, 2008, we entered into a note purchase agreement (the “Note Purchase Agreement”) with Ares and New Leaf under which Ares and New Leaf agreed to purchase between $200 and $300 million, at our option, of convertible notes to be issued by the newly formed subsidiary. In connection with our entry into the Note Purchase Agreement, we commenced a tender offer for our Floating Rate Notes and Subordinated Notes for an aggregate purchase price of $165 million including accrued and unpaid interest and certain premiums. On September 22, 2008, we announced that we would be unable to satisfy the conditions to closing in the Note Purchase Agreement, and on September 23, 2008, we announced the termination of the tender offer and the transaction was abandoned. Ares and New Leaf subsequently terminated the Note Purchase Agreement on November 19, 2008. The Note Purchase Agreement provided for a non-refundable fee, subject to certain conditions, of $3 million to Ares and New Leaf plus reimbursement of up to an additional $3 million for Ares’ and New Leaf’s transaction-related expenses. The Note Purchase Agreement also provided that if we were to enter into an agreement related to an Alternate Transaction, as defined in the Note Purchase Agreement, within 12 months of termination of the Note Purchase Agreement, we would have been required to pay Ares and New Leaf a non-refundable fee of $10 million plus reimburse Ares and New Leaf for transaction-related expenses of up to an additional $4 million (subject to certain conditions) upon our agreement to such Alternative Transaction. On June 17, 2009, we entered into a Settlement Agreement and Mutual Release (the “Settlement Agreement”) with Ares and New Leaf that fully resolved any existing and potential claims under the Note Purchase Agreement in exchange for a payment of $3 million to Ares and New Leaf. Prior to entering into the Settlement Agreement, we paid Ares and New Leaf $2 million in partial satisfactions of their claims under the Note Purchase Agreement. In connection with certain types of Alternative Transactions, we may also be required under the terms of agreements with certain advisors to pay fees to such advisors, whether or not such advisors participate in such Alternative Transaction.
19. SEGMENTED INFORMATION
The Company operates in two reportable segments: (i) Pharmaceutical Technologies and (ii) Medical Products.
The Pharmaceutical Technologies segment includes royalty revenue generated from out-licensing technology related to the drug-eluting stent and other technologies.
The Medical Products segment includes revenues and gross margins of single use, specialty medical devices including suture needles, biopsy needles / devices, micro surgical ophthalmic knives, drainage catheters, self-anchoring sutures, other specialty devices, biomaterials and other technologies.
F-34
Table of Contents
The Company reports segmented information on each of these segments to the gross margin level. All other income and expenses are not allocated to segments as they are not considered in evaluating the segment’s operating performance. The following tables represent reportable segment information for the years ended December 31, 2009, 2008 and 2007:
| Year ended December 31, 2009 |
Year ended December 31, 2008 |
Year ended December 31, 2007 |
||||||||||
| Revenue |
||||||||||||
| Medical Products |
$ | 191,951 | $ | 190,816 | $ | 170,193 | ||||||
| Pharmaceutical Technologies |
87,727 | 92,456 | 117,501 | |||||||||
| Total revenue |
$ | 279,678 | $ | 283,272 | $ | 287,694 | ||||||
| Cost of products sold — Medical Products |
104,616 | 101,052 | 94,949 | |||||||||
| Licence and royalty fees — Pharmaceutical Technologies |
10,431 | 14,258 | 18,652 | |||||||||
| Gross margin |
||||||||||||
| Medical Products |
87,335 | 89,764 | 75,244 | |||||||||
| Pharmaceutical Technologies |
77,296 | 78,198 | 98,849 | |||||||||
| Total gross margin |
$ | 164,631 | $ | 167,962 | $ | 174,093 | ||||||
| Research and development |
23,701 | 53,192 | 53,963 | |||||||||
| Selling, general and administration |
81,504 | 98,483 | 99,315 | |||||||||
| Depreciation and amortization |
33,251 | 33,998 | 33,429 | |||||||||
| In-process research and development |
— | 2,500 | 8,125 | |||||||||
| Write-down of assets held for sale |
3,090 | 1,283 | — | |||||||||
| Write-down of goodwill |
— | 649,685 | — | |||||||||
| Operating (loss) income |
$ | 23,085 | $ | (671,179 | ) | $ | (20,739 | ) | ||||
| Other (expense) income |
(39,916 | ) | (82,889 | ) | (49,853 | ) | ||||||
| Loss from continuing operations before income taxes |
$ | (16,831 | ) | $ | (754,068 | ) | $ | (70,592 | ) | |||
The Company allocates its assets to the two reportable segments; however, as noted above, depreciation, income taxes and other expense and income are not allocated to segment operating units.
During the year ended December 31, 2009, revenue from two licensees represented approximately 29% of total revenue (December 31, 2008 – 32%, December 31, 2007 – 40%).
The following tables represent total assets and capital expenditures for each reportable segment at December 31, 2009 and 2008:
| December 31, 2009 |
December 31, 2008 | |||||
| Total assets |
||||||
| Pharmaceutical Technologies |
$ | 70,848 | $ | 67,506 | ||
| Medical Products |
299,211 | 317,691 | ||||
| Total assets |
$ | 370,059 | $ | 385,197 | ||
| Capital expenditures |
||||||
| Pharmaceutical Technologies |
$ | 1,188 | $ | 902 | ||
| Medical Products |
3,178 | 7,855 | ||||
| Total capital expenditures |
$ | 4,366 | $ | 8,757 | ||
F-35
Table of Contents
Geographic information
Revenues are attributable to countries based on the location of the Company’s customers or, for revenue from collaborators, the location of the collaborator’s customers.
| December 31, | |||||||||
| 2009 | 2008 | 2007 | |||||||
| United States |
$ | 172,318 | $ | 169,181 | $ | 166,748 | |||
| Europe |
60,001 | 65,166 | 71,021 | ||||||
| Others |
47,359 | 48,925 | 49,925 | ||||||
| Total |
$ | 279,678 | $ | 283,272 | $ | 287,694 | |||
During the year ended December 31, 2008, the Company classified $5.3 million of property, plant and equipment as held for sale (note 8). The carrying values of these assets are included in the table below for net long lived assets by country:
| For the year ended December 31, | ||||||
| 2009 | 2008 | |||||
| United States |
$ | 34,655 | $ | 36,627 | ||
| Canada |
11,807 | 14,588 | ||||
| Other |
5,717 | 6,315 | ||||
| Total |
$ | 52,179 | $ | 57,530 | ||
20. RESTRUCTURING CHARGES
From 2007 to 2009, the Company executed various capacity rationalization and consolidation initiatives. During the year ended December 31, 2009, the Company recorded charges of $0.8 million related to relocation activities at our Puerto Rico location.
For the year ended December 31, 2008, the Company recorded restructuring charges of $4.9 million (December 31, 2007 – $5.2 million), which included $1.8 million (December 31, 2007 – $3.2 million) of severance benefits for the Syracuse location and $3.1 million (December 31, 2007 – $2.0 million) of relocation charges for the Syracuse and Puerto Rico locations. As at December 31, 2009, we have terminated or transferred all of the employees at the Syracuse location and $0.4 million is accrued for remaining severance costs to be paid. The charges related to relocation activities are being expensed as incurred.
The charges are recorded to selling, general and administration costs in the statement of operations.
Changes in the accrued liability for severance charges for the years ended December 31, 2009 and 2008 is as follows:
| Severance Benefits | ||||
| Balance, December 31, 2007 |
3,227 | |||
| Severances charged |
1,664 | |||
| Accretion expense |
156 | |||
| Severances paid |
(973 | ) | ||
| Balance, December 31, 2008 |
$ | 4,074 | ||
| Severances paid |
(3,674 | ) | ||
| Balance, December 31, 2009 |
$ | 400 | ||
F-36
Table of Contents
21. PRODUCT RETURNS
During the year ended December 31, 2007, the Company elected to discontinue its Contour Threads branded product line for selected aesthetic surgical applications and to focus marketing and branding efforts on the launch of its Quill SRS barbed suture product in a broader range of general surgery and aesthetic surgery applications. As part of this decision, the Company communicated an offer to its customers to refund, at the customer’s sole election, any unused inventory of Contour Threads product returned to the Company by June 1, 2007. The returned product was written off. The deadline was later extended indefinitely to meet customer demands and maintain strong customer relations. In connection with this decision, the Company recorded a pre-tax charge of approximately $3.0 million, which was recorded as an adjustment to revenue in the second quarter of 2007. Actual returns during the year ended December 31, 2007 were $2.4 million and the Company determined that an accrual of $0.2 million for estimated future returns was appropriate at December 31, 2007. As such, a recovery of $0.4 million was recorded as an adjustment to revenue in the fourth quarter of 2007.
22. LOSS PER SHARE
Loss per share was calculated as follows:
| Year ended December 31, 2009 |
Year ended December 31, 2008 |
Year ended December 31, 2007 |
||||||||||
| Numerator: |
||||||||||||
| Net loss from continuing operations |
$ | (22,868 | ) | $ | (741,176 | ) | $ | (56,047 | ) | |||
| Net loss from discontinued operations, net of income taxes |
— | — | (9,893 | ) | ||||||||
| Net loss |
$ | (22,868 | ) | $ | (741,176 | ) | $ | (65,940 | ) | |||
| Denominator: |
||||||||||||
| Basic weighted average common shares outstanding |
85,130 | 85,118 | 85,015 | |||||||||
| Basic and diluted net loss per common share: |
||||||||||||
| Continuing operations |
$ | (0.27 | ) | $ | (8.71 | ) | $ | (0.66 | ) | |||
| Discontinued operations |
— | — | $ | (0.12 | ) | |||||||
| Total |
$ | (0.27 | ) | $ | (8.71 | ) | $ | (0.78 | ) | |||
For the year ended December 31, 2009, 3,411,357 stock options were excluded from the calculation of diluted net loss per common share, as the effect of including them would have been anti-dilutive (December 31, 2008 – 9,798,677, December 31, 2007 – 8,171,921).
23. CHANGE IN NON-CASH WORKING CAPITAL ITEMS RELATING TO OPERATING ACTIVITIES AND SUPPLEMENTAL CASH FLOW INFORMATION
The change in non-cash working capital items relating to operations was as follows:
| Year ended December 31, 2009 |
Year ended December 31, 2008 |
Year ended December 31, 2007 |
||||||||||
| Accounts receivable |
$ | (2,122 | ) | $ | (5,524 | ) | $ | 2,297 | ||||
| Inventories |
3,244 | (5,156 | ) | (344 | ) | |||||||
| Prepaid expenses and other assets |
7,623 | 2,038 | 536 | |||||||||
| Accounts payable and accrued liabilities |
(5,417 | ) | (11,843 | ) | 2,912 | |||||||
| Income taxes payable |
1,698 | 156 | 3,021 | |||||||||
| Interest payable |
(511 | ) | (812 | ) | 713 | |||||||
| $ | 4,515 | $ | (21,141 | ) | $ | 9,135 | ||||||
F-37
Table of Contents
Supplemental disclosure
| Year ended December 31, 2009 |
Year ended December 31, 2008 |
Year ended December 31, 2007 | |||||||
| Interest paid |
$ | 35,671 | $ | 43,066 | $ | 48,790 | |||
| Income taxes paid |
8,748 | 3,720 | 5,512 | ||||||
| Income tax refund |
5,179 | 7,373 | 8,691 | ||||||
| Financing activities not yet paid |
— | 7,745 | — | ||||||
24. COMPARATIVE FIGURES
Certain prior period figures have been reclassified to conform to current period presentation.
25. CONDENSED CONSOLIDATING GUARANTOR FINANCIAL INFORMATION
The following presents the condensed consolidating guarantor financial information as of December 31, 2009 and 2008, and for the years ended December 31, 2009, 2008 and 2007 for the direct and indirect subsidiaries of the Company that serve as guarantors of the Senior Subordinated Notes and the Senior Floating Rate Notes, and for the Company’s subsidiaries that do not serve as guarantors. Non-guarantor subsidiaries include the Swiss subsidiaries and a Canadian Trust that cannot guarantee the debt of the Company. All of the Company’s subsidiaries are 100% owned, and all guarantees are full and unconditional, joint and several.
F-38
Table of Contents
Condensed Consolidating Balance Sheet
Year end December 31, 2009
USD (in ‘000s)
| Parent Company Angiotech Pharmaceuticals, Inc. |
Guarantors Subsidiaries |
Non Guarantors Subsidiaries |
Consolidating Adjustments |
Consolidated Total |
||||||||||||||
| ASSETS |
||||||||||||||||||
| Current assets |
||||||||||||||||||
| Cash and cash equivalents |
$ | 20,602 | $ | 16,912 | $ | 12,028 | $ | — | $ | 49,542 | ||||||||
| Short term investments |
7,780 | — | — | — | 7,780 | |||||||||||||
| Accounts receivable |
— | 18,272 | 9,826 | 69 | 28,167 | |||||||||||||
| Income tax receivable |
1,090 | — | — | — | 1,090 | |||||||||||||
| Inventories |
— | 29,776 | 6,776 | (1,011 | ) | 35,541 | ||||||||||||
| Deferred income taxes, current portion |
1,692 | 6,918 | — | (4,326 | ) | 4,284 | ||||||||||||
| Prepaid expenses and other current assets |
1,554 | 1,329 | 411 | — | 3,294 | |||||||||||||
| Total Current Assets |
32,718 | 73,207 | 29,041 | (5,268 | ) | 129,698 | ||||||||||||
| Investment in subsidiaries |
231,026 | 407,344 | — | (638,370 | ) | — | ||||||||||||
| Assets held for sale |
3,000 | 2,300 | — | — | 5,300 | |||||||||||||
| Property, plant and equipment |
8,807 | 30,719 | 7,353 | — | 46,879 | |||||||||||||
| Intangible assets |
12,490 | 140,798 | 19,731 | 173,019 | ||||||||||||||
| Deferred financing costs |
9,398 | 2,011 | — | — | 11,409 | |||||||||||||
| Other assets |
2,479 | 459 | 816 | — | 3,754 | |||||||||||||
| Total Assets |
299,918 | 656,838 | 56,941 | (643,638 | ) | 370,059 | ||||||||||||
| LIABILITIES AND SHAREHOLDERS’ (DEFICIT) EQUITY |
| |||||||||||||||||
| Current liabilities |
||||||||||||||||||
| Accounts payable and accrued liabilities |
17,974 | 22,205 | 6,292 | (147 | ) | 46,324 | ||||||||||||
| Income taxes payable |
9,749 | 714 | 395 | — | 10,858 | |||||||||||||
| Interest payable on long-term debt |
5,965 | 39 | — | — | 6,004 | |||||||||||||
| Total Current Liabilities |
33,688 | 22,958 | 6,687 | (147 | ) | 63,186 | ||||||||||||
| Deferred leasehold inducement |
2,506 | 382 | — | — | 2,888 | |||||||||||||
| Deferred income taxes |
— | 40,668 | 439 | (4,329 | ) | 36,778 | ||||||||||||
| Other tax liabilities |
2,011 | 756 | 1,131 | — | 3,898 | |||||||||||||
| Long-term debt |
575,000 | — | — | — | 575,000 | |||||||||||||
| Other liabilities |
— | — | 1,596 | — | 1,596 | |||||||||||||
| Total Non-current Liabilities |
579,517 | 41,806 | 3,166 | (4,329 | ) | 620,160 | ||||||||||||
| Total Shareholders’ (Deficit) Equity |
(313,287 | ) | 592,074 | 47,088 | (639,161 | ) | (313,287 | ) | ||||||||||
| Equity |
$ | 299,918 | $ | 656,838 | $ | 56,941 | $ | (643,638 | ) | $ | 370,059 | |||||||
F-39
Table of Contents
Condensed Consolidating Balance Sheet
As at December 31, 2008
USD (in ‘000s)
| Parent Company Angiotech Pharmaceuticals, Inc. |
Guarantors Subsidiaries |
Non Guarantors Subsidiaries |
Consolidating Adjustments |
Consolidated Total |
||||||||||||||
| ASSETS |
||||||||||||||||||
| Current assets |
||||||||||||||||||
| Cash and cash equivalents |
$ | 10,180 | $ | 6,572 | $ | 22,200 | $ | — | $ | 38,952 | ||||||||
| Short term investments |
848 | — | — | — | 848 | |||||||||||||
| Accounts receivable |
235 | 16,263 | 10,027 | (1,001 | ) | 25,524 | ||||||||||||
| Inventories |
— | 31,939 | 7,824 | (1,169 | ) | 38,594 | ||||||||||||
| Deferred income taxes, current portion |
— | 3,820 | — | — | 3,820 | |||||||||||||
| Prepaid expenses and other current assets |
1,674 | 3,074 | 486 | — | 5,234 | |||||||||||||
| Total Current Assets |
12,937 | 61,668 | 40,537 | (2,170 | ) | 112,972 | ||||||||||||
| Long term investments |
825 | — | 736 | — | 1,561 | |||||||||||||
| Investment in subsidiaries |
249,803 | 368,873 | 0 | (618,676 | ) | — | ||||||||||||
| Assets held for sale |
5,322 | 3,100 | — | 8,422 | ||||||||||||||
| Property, plant and equipment |
9,194 | 30,326 | 9,588 | — | 49,108 | |||||||||||||
| Intangible assets |
15,112 | 158,097 | 22,268 | — | 195,477 | |||||||||||||
| Goodwill |
— | — | — | — | — | |||||||||||||
| Deferred financing costs |
11,363 | — | — | — | 11,363 | |||||||||||||
| Deferred income taxes |
— | — | — | — | — | |||||||||||||
| Other assets |
271 | 5,911 | 112 | — | 6,294 | |||||||||||||
| Total Assets |
304,827 | 627,975 | 73,241 | (620,846 | ) | 385,197 | ||||||||||||
| LIABILITIES AND SHAREHOLDERS’ (DEFICIT) EQUITY |
| |||||||||||||||||
| Current liabilities |
||||||||||||||||||
| Accounts payable and accrued liabilities |
21,345 | 22,328 | 6,294 | (3,347 | ) | 46,620 | ||||||||||||
| Income taxes payable |
(1,260 | ) | 6,974 | 2,357 | — | 8,071 | ||||||||||||
| Interest payable on long-term debt |
6,514 | — | — | — | 6,514 | |||||||||||||
| Deferred revenue, current portion |
— | — | 210 | — | 210 | |||||||||||||
| Total Current Liabilities |
26,599 | 29,302 | 8,861 | (3,347 | ) | 61,415 | ||||||||||||
| Deferred revenue |
— | — | 999 | — | 999 | |||||||||||||
| Deferred leasehold inducement |
2,768 | 12 | — | — | 2,780 | |||||||||||||
| Deferred income taxes |
(1,959 | ) | 42,010 | 526 | — | 40,577 | ||||||||||||
| Other tax liabilities |
2,292 | 585 | 268 | — | 3,145 | |||||||||||||
| Long-term debt |
575,000 | — | — | — | 575,000 | |||||||||||||
| Other liabilities |
— | 272 | 882 | — | 1,154 | |||||||||||||
| Total Non-current Liabilities |
578,101 | 42,879 | 2,675 | — | 623,655 | |||||||||||||
| Total Shareholders’ (Deficit) Equity |
(299,873 | ) | 555,794 | 61,705 | (617,499 | ) | (299,873 | ) | ||||||||||
| Total Liabilities and Shareholders’ (Deficit) Equity |
$ | 304,827 | $ | 627,975 | $ | 73,241 | $ | (620,846 | ) | $ | 385,197 | |||||||
F-40
Table of Contents
Condensed Consolidated Statement of Operations
Year ended December 31, 2009
USD (in ‘000s)
| Parent Company Angiotech Pharmaceuticals, Inc. |
Guarantors Subsidiaries |
Non Guarantors Subsidiaries |
Consolidating Adjustments |
Consolidated Total |
||||||||||||||||
| REVENUE |
||||||||||||||||||||
| Product sales, net |
$ | — | $ | 153,364 | $ | 58,887 | $ | (20,300 | ) | $ | 191,951 | |||||||||
| Royalty revenue |
57,420 | 3,414 | 1,337 | — | 62,171 | |||||||||||||||
| License fees |
— | 356 | 25,200 | — | $ | 25,556 | ||||||||||||||
| 57,420 | 157,134 | 85,424 | (20,300 | ) | 279,678 | |||||||||||||||
| EXPENSES |
||||||||||||||||||||
| Cost of products sold |
85 | 82,905 | 42,488 | (20,862 | ) | 104,616 | ||||||||||||||
| License and royalty fees |
10,421 | — | 10 | — | 10,431 | |||||||||||||||
| Research & development |
14,491 | 8,827 | 383 | — | 23,701 | |||||||||||||||
| Intercompany R&D charges |
2,078 | (2,078 | ) | — | — | — | ||||||||||||||
| Selling, general and administration |
16,375 | 53,334 | 11,795 | — | 81,504 | |||||||||||||||
| Depreciation and amortization |
4,535 | 24,527 | 4,189 | — | 33,251 | |||||||||||||||
| Write-down of assets held for sale |
2,290 | 800 | — | — | 3,090 | |||||||||||||||
| 50,275 | 168,315 | 58,865 | (20,862 | ) | 256,593 | |||||||||||||||
| Operating income (loss) |
7,145 | (11,181 | ) | 26,560 | 562 | 23,085 | ||||||||||||||
| Other income (expense) |
||||||||||||||||||||
| Foreign exchange gain (loss) |
7,393 | (2,100 | ) | (6,905 | ) | — | (1,612 | ) | ||||||||||||
| Investment and other income |
(78,446 | ) | (245 | ) | 111 | 78,958 | 378 | |||||||||||||
| Interest expense on long-term debt |
58,755 | (96,039 | ) | (755 | ) | — | (38,039 | ) | ||||||||||||
| Write-down of deferred financing charges |
— | (643 | ) | — | — | (643 | ) | |||||||||||||
| Management fees |
(47 | ) | 47 | — | — | — | ||||||||||||||
| Total other expenses |
(12,345 | ) | (98,980 | ) | (7,549 | ) | 78,958 | (39,916 | ) | |||||||||||
| Income (loss) before income taxes |
(5,200 | ) | (110,161 | ) | 19,011 | 79,520 | (16,831 | ) | ||||||||||||
| Income tax (recovery) expense |
129 | (4,099 | ) | 3,975 | 6,032 | 6,037 | ||||||||||||||
| Income (loss) from operations |
(5,329 | ) | (106,062 | ) | 15,036 | 73,488 | (22,868 | ) | ||||||||||||
| Equity in subsidiaries |
(17,539 | ) | 257 | — | 17,282 | — | ||||||||||||||
| Net income (loss) |
$ | (22,868 | ) | $ | (105,805 | ) | $ | 15,036 | $ | 90,769 | $ | (22,868 | ) | |||||||
F-41
Table of Contents
Condensed Consolidated Statement of Operations
Year ended December 31, 2008
USD (in ‘000s)
| Parent Company Angiotech Pharmaceuticals, Inc. |
Guarantors Subsidiaries |
Non Guarantors Subsidiaries |
Consolidating Adjustments |
Consolidated Total |
||||||||||||||||
| REVENUE |
||||||||||||||||||||
| Royalty revenue |
$ | 84,079 | $ | 2,426 | $ | 5,041 | $ | — | $ | 91,546 | ||||||||||
| Product sales, net |
— | 143,578 | 79,012 | (31,774 | ) | 190,816 | ||||||||||||||
| License fees |
— | 389 | 1,000 | (479 | ) | 910 | ||||||||||||||
| 84,079 | 146,393 | 85,053 | (32,253 | ) | 283,272 | |||||||||||||||
| EXPENSES |
||||||||||||||||||||
| License and royalty fees |
14,250 | 8 | — | — | 14,258 | |||||||||||||||
| Cost of products sold |
— | 75,631 | 56,505 | (31,084 | ) | 101,052 | ||||||||||||||
| Research & development |
32,442 | 19,621 | 1,129 | — | 53,192 | |||||||||||||||
| Intercompany R&D charges |
5,329 | (6,405 | ) | 753 | 323 | — | ||||||||||||||
| Selling, general and administration |
22,969 | 57,764 | 17,750 | — | 98,483 | |||||||||||||||
| Depreciation and amortization |
4,806 | 25,445 | 3,747 | — | 33,998 | |||||||||||||||
| In-process research and development |
— | 2,500 | — | — | 2,500 | |||||||||||||||
| Write-down of assets held for sale |
— | 1,283 | — | — | 1,283 | |||||||||||||||
| Write-down of goodwill |
— | 537,531 | 112,154 | — | 649,685 | |||||||||||||||
| 79,796 | 713,378 | 192,038 | (30,761 | ) | 954,451 | |||||||||||||||
| Operating loss |
4,283 | (566,984 | ) | (106,985 | ) | (1,492 | ) | (671,179 | ) | |||||||||||
| Other income (expense) |
||||||||||||||||||||
| Foreign exchange gain (loss) |
49,985 | 2,284 | (51,729 | ) | — | 540 | ||||||||||||||
| Investment and other income |
(9,419 | ) | (438 | ) | 11,049 | — | 1,192 | |||||||||||||
| Interest expense on long-term debt |
(32,251 | ) | (20,302 | ) | 8,063 | — | (44,490 | ) | ||||||||||||
| Write-down and other deferred financing charges |
(16,531 | ) | — | (13 | ) | — | (16,544 | ) | ||||||||||||
| Write-down/loss on redemption of investments |
(23,583 | ) | — | (4 | ) | — | (23,587 | ) | ||||||||||||
| Management fees |
(2,597 | ) | 2,384 | (109 | ) | 322 | — | |||||||||||||
| Total other expenses |
(34,396 | ) | (16,072 | ) | (32,743 | ) | 322 | (82,889 | ) | |||||||||||
| Loss from continuing operations before income taxes |
(30,113 | ) | (583,057 | ) | (139,728 | ) | (1,170 | ) | (754,068 | ) | ||||||||||
| Income tax expense (recovery) |
(3,176 | ) | (11,088 | ) | 1,498 | (126 | ) | (12,892 | ) | |||||||||||
| Loss from continuing operations |
(26,937 | ) | (571,968 | ) | (141,226 | ) | (1,044 | ) | (741,176 | ) | ||||||||||
| Loss from discontinued operations, net of income taxes |
— | — | — | — | — | |||||||||||||||
| Equity in subsidiaries |
(714,239 | ) | (51,062 | ) | — | 765,301 | — | |||||||||||||
| Net income (loss) |
$ | (741,176 | ) | $ | (623,030 | ) | $ | (141,226 | ) | $ | 764,257 | $ | (741,176 | ) | ||||||
F-42
Table of Contents
Condensed Consolidated Statement of Operations
Year Ended December 31, 2007
| Parent Company Angiotech Pharmaceuticals, Inc. |
Guarantor Subsidiaries |
Non-Guarantor Subsidiaries |
Consolidating Adjustments |
Consolidated Totals |
||||||||||||||||
| REVENUE |
||||||||||||||||||||
| Royalty revenue |
$ | 110,477 | $ | 1,827 | $ | 4,355 | $ | — | $ | 116,659 | ||||||||||
| Product sales, net |
— | 150,801 | 50,540 | (31,148 | ) | 170,193 | ||||||||||||||
| License fees |
— | (181 | ) | 1,023 | — | 842 | ||||||||||||||
| Intercompany R&D charges |
(4,091 | ) | 7,481 | (2,910 | ) | (480 | ) | — | ||||||||||||
| 106,386 | 159,928 | 53,008 | (31,628 | ) | 287,694 | |||||||||||||||
| EXPENSES |
||||||||||||||||||||
| License and royalty fees |
18,821 | 8 | 3 | (180 | ) | 18,652 | ||||||||||||||
| Cost of products sold |
— | 94,236 | 31,068 | (30,355 | ) | 94,949 | ||||||||||||||
| Research and development |
32,637 | 20,153 | 1,173 | — | 53,963 | |||||||||||||||
| Selling, general and administration |
31,311 | 55,990 | 12,014 | — | 99,315 | |||||||||||||||
| Depreciation and amortization |
4,680 | 25,518 | 3,231 | — | 33,429 | |||||||||||||||
| In-process research and development |
7,125 | 1,000 | — | — | 8,125 | |||||||||||||||
| 94,574 | 196,905 | 47,489 | (30,535 | ) | 308,433 | |||||||||||||||
| Operating income |
11,812 | (36,977 | ) | 5,519 | (1,093 | ) | (20,739 | ) | ||||||||||||
| Other income (expenses) |
||||||||||||||||||||
| Foreign exchange gain (loss) |
4,879 | 2,371 | (7,588 | ) | (3 | ) | (341 | ) | ||||||||||||
| Investment and other income |
3,696 | 4,145 | 2,552 | — | 10,393 | |||||||||||||||
| Interest income (expense) |
(10,129 | ) | (66,296 | ) | 24,677 | — | (51,748 | ) | ||||||||||||
| Management fees |
(2,568 | ) | 2,455 | (367 | ) | 480 | — | |||||||||||||
| Loss on redemption of available for sale securities |
— | (8,157 | ) | — | — | (8,157 | ) | |||||||||||||
| Total other income (expenses) |
(4,122 | ) | (65,482 | ) | 19,274 | 477 | (49,853 | ) | ||||||||||||
| Income (loss) from continuing operations before income taxes |
7,690 | (102,459 | ) | 24,793 | (616 | ) | (70,592 | ) | ||||||||||||
| Income tax expense (recovery) |
(5,242 | ) | (14,212 | ) | 4,909 | — | (14,545 | ) | ||||||||||||
| Income (loss) from continuing operations |
12,932 | (88,247 | ) | 19,884 | (616 | ) | (56,047 | ) | ||||||||||||
| Subsidiaries income (loss) |
(78,872 | ) | 34,096 | — | 44,776 | — | ||||||||||||||
| Income (loss) from discontinued operations, net of income taxes |
— | (9,893 | ) | 537 | (537 | ) | (9,893 | ) | ||||||||||||
| Net (loss) income |
$ | (65,940 | ) | $ | (64,044 | ) | $ | 20,421 | $ | 43,623 | $ | (65,940 | ) | |||||||
F-43
Table of Contents
Condensed Consolidating Statement of Cash Flows
Year end December 31, 2009
USD (in ‘000s)
| Parent Company Angiotech Pharmaceuticals, Inc. |
Guarantors Subsidiaries |
Non Guarantors Subsidiaries |
Consolidating Adjustments |
Consolidated Total |
|||||||||||||||
| OPERATING ACTIVITIES: |
|||||||||||||||||||
| Cash used in operating activities |
$ | (1,379 | ) | $ | 43,966 | $ | (20,891 | ) | $ | 21,696 | |||||||||
| INVESTING ACTIVITIES: |
|||||||||||||||||||
| Purchase of property, plant and equipment |
(1,581 | ) | (2,258 | ) | (625 | ) | — | (4,464 | ) | ||||||||||
| Purchase of intangible assets |
— | (2,500 | ) | — | — | (2,500 | ) | ||||||||||||
| Loans advanced |
(1,200 | ) | (1,200 | ) | |||||||||||||||
| Other |
12 | 334 | (94 | ) | — | 252 | |||||||||||||
| Cash used in investing activities |
(2,769 | ) | (4,424 | ) | (719 | ) | — | (7,912 | ) | ||||||||||
| FINANCING ACTIVITIES: |
|||||||||||||||||||
| Deferred financing charges and costs |
(3,403 | ) | — | — | — | (3,403 | ) | ||||||||||||
| Dividends received / (paid) |
24,800 | (21,800 | ) | (3,000 | ) | — | — | ||||||||||||
| Intercompany notes payable/receivable |
(6,830 | ) | (7,418 | ) | 14,248 | — | — | ||||||||||||
| Proceeds from stock options exercised |
3 | — | — | — | 3 | ||||||||||||||
| Cash provided by (used in) financing activities |
14,570 | (29,218 | ) | 11,248 | — | (3,400 | ) | ||||||||||||
| Effect of exchange rate changes on cash and cash equivalents |
— | 16 | 190 | — | 206 | ||||||||||||||
| Net (decrease) increase in cash and cash equivalents |
10,422 | 10,340 | (10,172 | ) | — | 10,590 | |||||||||||||
| Cash and cash equivalents, beginning of period |
10,180 | 6,572 | 22,200 | — | 38,952 | ||||||||||||||
| Cash and cash equivalents, end of period |
$ | 20,602 | $ | 16,912 | $ | 12,028 | $ | — | $ | 49,542 | |||||||||
F-44
Table of Contents
Condensed Consolidating Statement of Cash Flows
Year ended December 31, 2008
USD (in ‘000s)
| Parent Company Angiotech Pharmaceuticals, Inc. |
Guarantors Subsidiaries |
Non Guarantors Subsidiaries |
Consolidating Adjustments |
Consolidated Total |
|||||||||||||||
| OPERATING ACTIVITIES: |
|||||||||||||||||||
| Cash (used in) provided by operating activities |
$ | (55,123 | ) | $ | (15,046 | ) | $ | 32,162 | $ | — | $ | (38,007 | ) | ||||||
| INVESTING ACTIVITIES: |
|||||||||||||||||||
| Proceeds from short-term investments |
2,756 | — | — | — | 2,756 | ||||||||||||||
| Purchase of property, plant and equipment |
(1,005 | ) | (4,942 | ) | (1,722 | ) | — | (7,669 | ) | ||||||||||
| Purchase of intangible assets |
— | (1,000 | ) | — | — | (1,000 | ) | ||||||||||||
| In-process research and development |
— | (2,500 | ) | — | — | (2,500 | ) | ||||||||||||
| Other |
236 | 28 | (90 | ) | — | 174 | |||||||||||||
| Cash provided by (used in) investing activities |
1,987 | (8,414 | ) | (1,812 | ) | — | (8,239 | ) | |||||||||||
| FINANCING ACTIVITIES: |
|||||||||||||||||||
| Deferred financing costs on long-term obligations |
(4,485 | ) | — | (14 | ) | — | (4,499 | ) | |||||||||||
| Proceeds from stock options exercised |
121 | — | — | — | 121 | ||||||||||||||
| Dividends received / (paid) |
20,000 | 12,344 | (32,344 | ) | — | — | |||||||||||||
| Intercompany notes payable/receivable |
23,891 | (2,596 | ) | (21,295 | ) | — | — | ||||||||||||
| Cash provided by (used in) financing activities |
39,527 | 9,748 | (53,653 | ) | — | (4,378 | ) | ||||||||||||
| Effect of exchange rate changes on cash and cash equivalents |
— | (51 | ) | (1,699 | ) | — | (1,750 | ) | |||||||||||
| Net increase (decrease) in cash and cash equivalents |
(13,609 | ) | (13,763 | ) | (25,002 | ) | — | (52,374 | ) | ||||||||||
| Cash and cash equivalents, beginning of year |
23,790 | 20,334 | 47,202 | — | 91,326 | ||||||||||||||
| Cash and cash equivalents, end of year |
$ | 10,181 | $ | 6,571 | $ | 22,200 | $ | — | $ | 38,952 | |||||||||
F-45
Table of Contents
Condensed Consolidating Statement of Cash Flows
Year Ended December 31, 2007
| Parent Company Angiotech Pharmaceuticals, Inc. |
Guarantor Subsidiaries |
Non- Guarantor Subsidiaries |
Consolidating Adjustments |
Consolidated Totals |
||||||||||||||||
| OPERATING ACTIVITIES: |
||||||||||||||||||||
| Cash provided by (used in) operating activities |
$ | (8,352 | ) | $ | 26,570 | $ | 40,185 | $ | (63,965 | ) | $ | (5,562 | ) | |||||||
| INVESTING ACTIVITIES: |
||||||||||||||||||||
| Purchase of property, plant and equipment |
(3,145 | ) | (3,300 | ) | (686 | ) | — | (7,131 | ) | |||||||||||
| Proceeds from short-term investments |
— | 9,285 | — | — | 9,285 | |||||||||||||||
| Purchase of long-term investments |
(15,000 | ) | 10,000 | — | (10,000 | ) | (15,000 | ) | ||||||||||||
| Proceeds from long-term investments |
— | 22,965 | — | — | 22,965 | |||||||||||||||
| Investment in subs |
— | (28,735 | ) | (2,511 | ) | 31,246 | — | |||||||||||||
| Purchase of intangibles assets |
— | (6,466 | ) | — | — | (6,466 | ) | |||||||||||||
| Proceeds from sale of assets held for sale |
— | 4,832 | — | — | 4,832 | |||||||||||||||
| Other assets |
399 | (500 | ) | — | — | (101 | ) | |||||||||||||
| In-process research and development |
(7,125 | ) | (1,000 | ) | — | — | (8,125 | ) | ||||||||||||
| Cash (used in) provided by investing activities |
(24,871 | ) | 7,081 | (3,197 | ) | 21,246 | 259 | |||||||||||||
| FINANCING ACTIVITIES: |
||||||||||||||||||||
| Share capital issued |
— | — | 332 | (332 | ) | — | ||||||||||||||
| Deferred financing costs on long-term obligations |
(1,865 | ) | — | — | — | (1,865 | ) | |||||||||||||
| Dividends paid |
— | (28,434 | ) | (14,617 | ) | 43,051 | — | |||||||||||||
| Notes receivable / payable |
(845 | ) | 2,808 | (1,963 | ) | — | — | |||||||||||||
| Proceeds from stock options exercised and share capital issued |
228 | — | — | — | 228 | |||||||||||||||
| Cash (used in) provided by financing activities |
(2,482 | ) | (25,626 | ) | (16,248 | ) | 42,719 | (1,637 | ) | |||||||||||
| Effect of exchange rate changes on cash |
— | — | (1,066 | ) | — | (1,066 | ) | |||||||||||||
| Net increase (decrease) in cash and cash equivalents |
(35,705 | ) | 8,025 | 19,674 | — | (8,006 | ) | |||||||||||||
| Cash and cash equivalents, beginning of year |
59,495 | 12,309 | 27,528 | — | 99,332 | |||||||||||||||
| Cash and cash equivalents, end of year |
$ | 23,790 | $ | 20,334 | $ | 47,202 | $ | — | $ | 91,326 | ||||||||||
F-46
Table of Contents
26. SUBSEQUENT EVENTS
Escrow Settlement
In connection with the 2006 acquisition of American Medical Instruments Holdings Inc. (“AMI”), RoundTable Healthcare Partners (“Roundtable”) and Angiotech entered into an Escrow Agreement on March 23, 2006. Under this agreement, Angiotech deposited $20.0 million with LaSalle Bank (“LaSalle”), which was designated as the Escrow Agent. On April 4, 2007, Angiotech issued an Escrow Claim Notice to LaSalle to return the $20.0 million, which was subsequently disputed by Roundtable. After various hearings and discussions, a Joint Letter of Direction was executed and $6.5 million was released to RoundTable, thereby leaving the amount in dispute at approximately $13.5 million. On January 14, 2010, a settlement agreement was signed whereby Angiotech would receive $4.7 million from the escrow account. On January 15, 2010, the Company received the settlement funds, which will be recorded as a recovery from the purchase of AMI in first quarter of 2010. All legal proceedings have been dismissed.
Land Sale and Building
On January 11, 2010 Haemacure announced that it had filed a notice of intention to make a proposal to its creditors under the Bankruptcy and Insolvency Act (Canada) and that its wholly-owned U.S. subsidiary sought court protection under Chapter 11 in the U.S. The filings were completed on Friday, January 8, 2010. Haemacure’s Board of Directors authorized these actions in light of Haemacure’s financial condition and inability to raise additional financing. We have agreed to provide up to a maximum amount of $1.0 million of additional financing, of which $0.8 million has been provided as of March 12, 2010 to fund Haemacure’s insolvency proceedings and operations. The funds are being disbursed in accordance with a schedule agreed to by Haemacure and us. All funds loaned to Haemacure to date and in the future are secured by substantially all of their assets. We hope to exercise our security in the future to acquire Haemacure’s assets. As the bankruptcy proceedings in Canada and the U.S. are ongoing and the outcome cannot be determined, we have not yet completed our assessment of the potential accounting impact.
Haemacure
In January 2010, the Company completed the sale of a property, previously classified as an asset held for sale, for proceeds of $0.8 million. As at December 31, 2009, the carrying value of this property was $0.8 million.
F-47
Table of Contents
VALUATION AND QUALIFYING ACCOUNTS
Years Ended December 31, 2009, 2008 and 2007
(in thousands of U.S. dollars)
| Balance at Beginning of Year |
Additions | Deductions | Balance at End of Year | |||||||||||
| Charged to Costs and Expenses |
Charged to Other accounts |
|||||||||||||
| Deferred Income Tax Valuation Allowance: |
||||||||||||||
| Year ended December 31, 2009 |
$ | 91,986 | — | — | $ | 3,173 | $ | 95,159 | ||||||
| Year ended December 31, 2008 |
42,005 | 55,514 | (579 | ) | — | 96,940 | ||||||||
| Year ended December 31, 2007 |
19,293 | 22,133 | 579 | — | 42,005 | |||||||||
| Balance at Beginning of Year |
Balance at End of Year | |||||
| Accounts Receivable Allowance: |
||||||
| Year ended December 31, 2009 |
$ | 270 | $ | 471 | ||
| Year ended December 31, 2008 |
214 | 270 | ||||
| Year ended December 31, 2007 |
546 | 214 | ||||
F-48