Attached files
| file | filename |
|---|---|
| 8-K - FORM 8-K - OMNI ENERGY SERVICES CORP | d8k.htm |
 March 15, 2010 Brian Recatto, President & CEO Ron Mogel, Sr. Vice President & CFO Roth OC Growth Stock Conference EXHIBIT 99.1 |
 2 www.omnienergy.com This Company Overview (“Overview”) has been prepared by management of OMNI
Energy Services Corp. This Overview is intended solely for
informational purposes. Certain statements in this presentation contain
forward-looking statements within the meaning of Section 27A of the Securities Act of 1933, and Section 21E of the Securities Exchange Act of 1934. All
forward- looking statements included in this presentation are based on
information available to us as of the date hereof and we assume no
obligation to update any forward-looking statements. Forward- looking statements involve known or unknown risks, uncertainties and other factors, which may cause our actual results, performance or achievements, or industry results to be
materially different from any future results, performance or achievements
expressed or implied by such forward-looking statements. Factors that
could cause or contribute to such differences include but are not limited to
risks associated with: the impact of the current economic climate, the timely conversion of seismic drilling backlog into revenue, the acceptance and use of
OMNI’s environmental cleaning services, OMNI's dependence on activity in the oil and gas industry, labor shortages, dependence on significant customers, seasonality and weather risks,
competition, technological evolution, the outcome of pending litigation, the
continued growth of our environmental and other services and equipment
leasing segments and other risks detailed in the Company's filings with the
Securities and Exchange Commission; and the other factors including, but not
limited to, the items discussed under "Risk Factors" contained in our Report on Form 10-K for the year ending December 31, 2008 and December 31, 2009 when filed in March 2010. Forward Looking Statements |
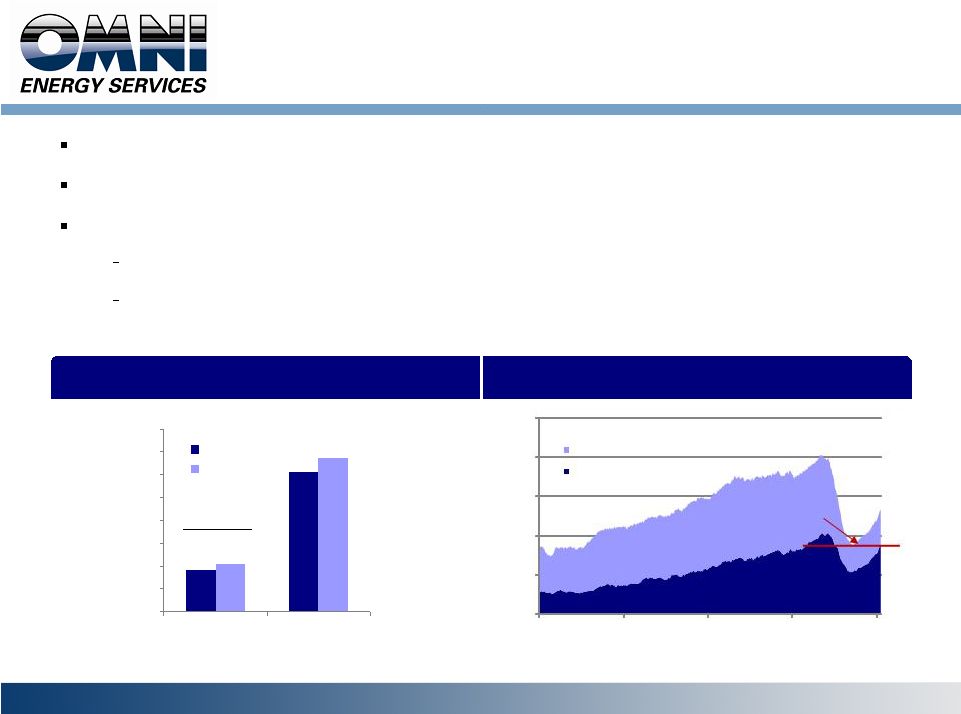 3 www.omnienergy.com Market Environment Market appears to be stabilizing Operators with shale acreage are expanding drilling programs in 2010 Market supply / demand relationship expected to rebalance in 2010 Rig count showing modest improvement Industrial sector stabilizing Expanding E&P Capital Budgets ($bn) North American Rig Count Recovering Source: Baker Hughes. Source: The Original E&P Spending Survey, 12/16/2009 13% growth $90 $305 $102 $337 $0 $50 $100 $150 $200 $250 $300 $350 $400 North America International 2009 2010 0 500 1,000 1,500 2,000 2,500 Jan-02 Jan-04 Jan-06 Jan-08 Jan-10 Vertical Directional/Horizontal Recovery driven by resource plays |
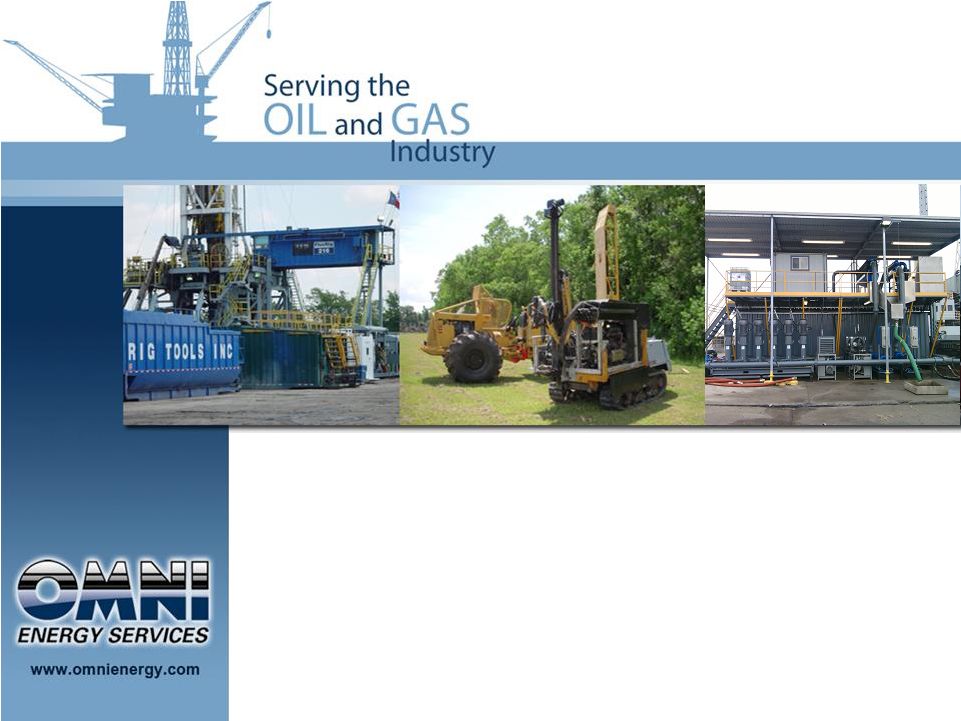
 4 www.omnienergy.com Overview of OMNI Diversified oilfield services company Headquartered in Carencro, LA Founded in 1987, IPO in 1997 NASDAQ Global Market Ticker: OMNI Well positioned in the most active North American producing areas Gulf Coast, East Texas, Rocky Mountains, Appalachia Haynesville Shale, Barnett Shale, Bakken Shale, Marcellus Shale Reputation for providing consistent, safe and reliable services Seismic services, environmental services, equipment rentals, fluid handling and transportation services Management team experienced in working through oilfield cycles
|
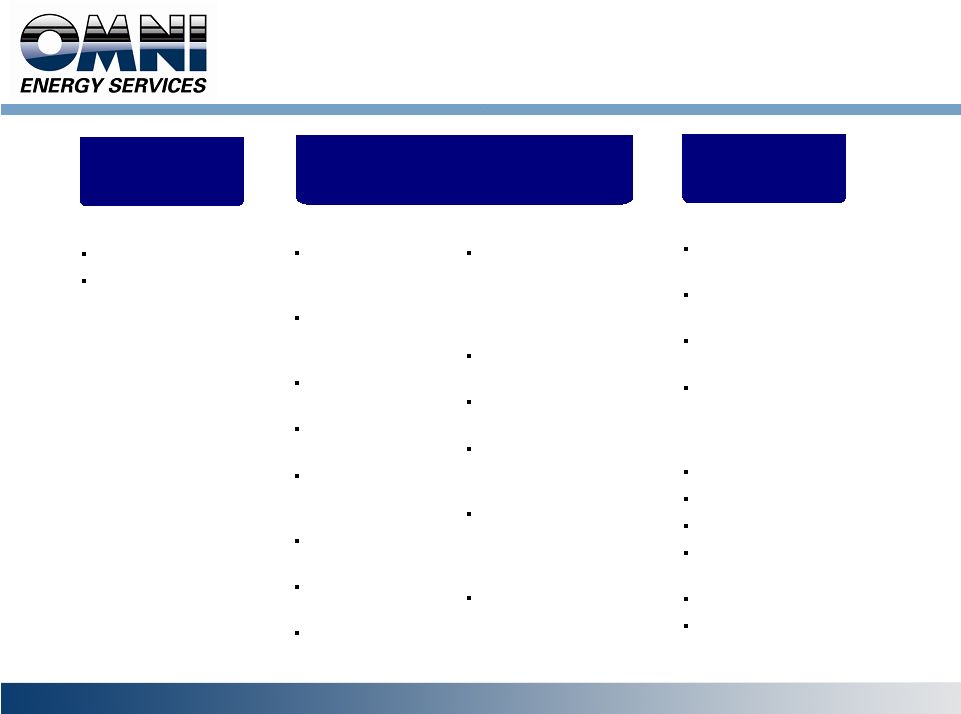 5 www.omnienergy.com Diversification of Services Environmental and Other Services Seismic Services Equipment Rental Transportation of non-hazardous fluids such as saltwater and spent drilling fluids Saltwater disposal wells Provide drilling fluids and chemicals Fluid storage, mixing and pumping services Fluid trucking, recycling, tank cleaning and disposal services Wellhead installation and preheating Extensive fleet of rental equipment Water, mud and disposal pumps Mud, fuel, and frac tanks Specialized lifting units such as industrial forklifts and manlifts Wireline units Generators Air compressors High pressure washers Lighting systems Oilfield cooling fans Seismic drilling Seismic permitting Onshore, dockside and offshore services Hazardous and non- hazardous oilfield waste management Drilling rig, tank and vessel cleaning NORM decontamination Platform abandonment services Environmental pit cleaning Metal stress relieving Hydroblasting 21% of Revenue 31% of Revenue 48% of Revenue Note: Percentage of revenue based off of TTM 9/30/09 revenues.
|
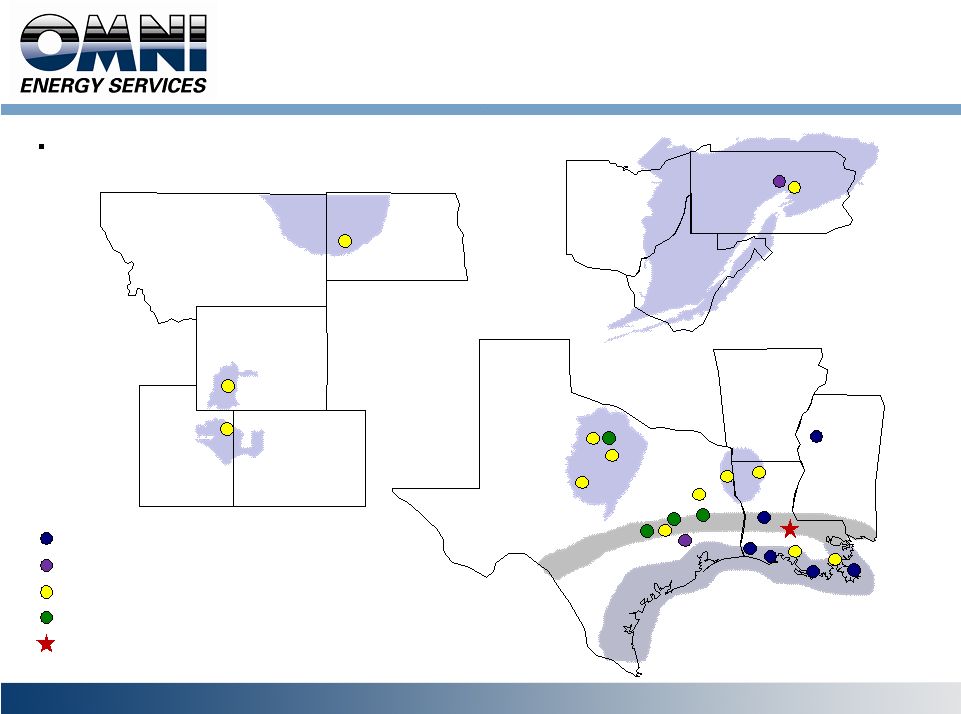 6 www.omnienergy.com Well Positioned Operations Green River Basin Uinta Basin Piceance Basin Bakken Shale Montana North Dakota Wyoming Utah Colorado Barnett Shale Texas Mississippi Louisiana Arkansas Haynesville Shale Austin Chalk Transition Zone Pennsylvania Ohio West Virginia Marcellus Shale Environmental Operations Seismic Drilling Operations Equipment Rental Operations Fluid Services Operations OMNI Corporate Headquarters Assets positioned around prolific oil and gas plays |
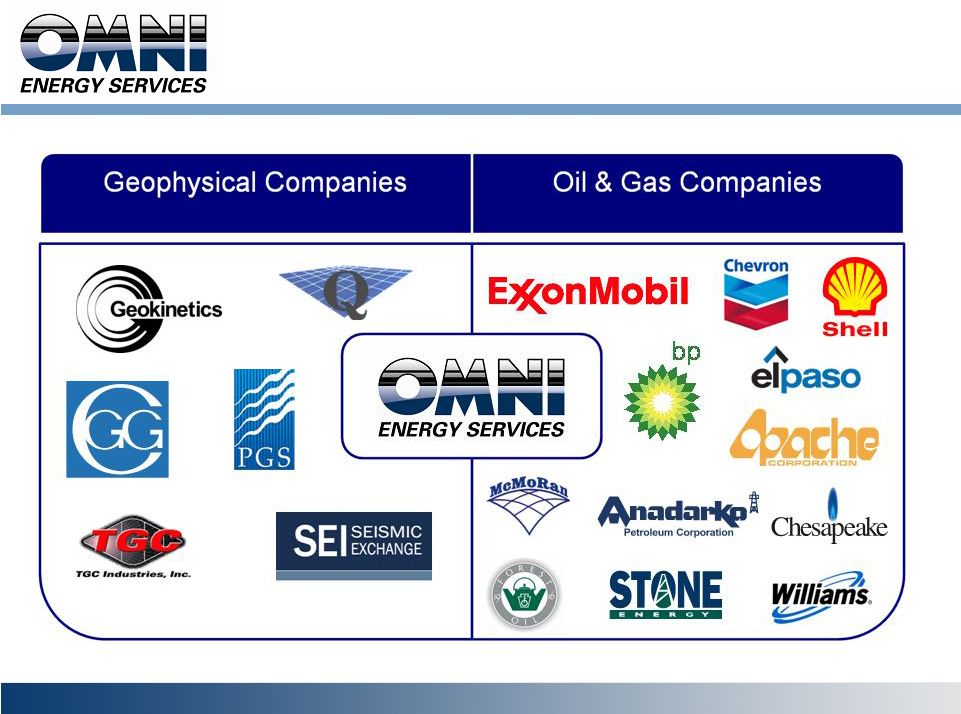 7 www.omnienergy.com Blue Chip Customer Base |
 8 www.omnienergy.com Company History OMNI founded to provide seismic drilling services to the geophysical industry Initial Public Offering December 1997 Acquired AirJac Drilling, a division of Veritas Land DGC. OMNI became largest provider of seismic drilling support services to geophysical companies in the U.S. Acquired Preheat, which provides rental equipment and specialized environmental services Acquired Rig Tools, which provides rental equipment and environmental cleaning services. Acquired Charles Holston, Inc., which provides fluid handling services, environmental services and equipment rentals. Expanded services in Rocky Mountains. Acquired Bailey Operating, Inc., which extended the Company’s core businesses into the Barnett Shale. Acquired Industrial Lift Truck and B.E.G. Liquid Mud Acquired Trussco, Inc. a provider of dock-side and offshore tank, vessel, boat and barge cleaning Awarded significant contract in the Haynesville Shale Installed first I.M.P.A.C.T. System Offshore. Implemented strategic cost reductions, reduced operational costs, improved receivable collections, reduced head count in line with activity levels. |
 9 www.omnienergy.com Seismic Services Integrated range of seismic drilling, surveying, and permitting services Data acquisition customers have successfully moved projects forward and backlog is increasing One of the largest transition zone and highland drilling fleets in the U.S. Approximately 85% of Transition Zone market share More than 65% of market share in highland areas served Fleet of specialized vehicles: Pontoon Drills / Pull Boats Ardco Drill, Marsh, Swamp and Water Buggies Multi-Engine Airboat Mounted Drills Man Portable and Articulating Tractor Drills Track Rigs Recently expanded in Marcellus Shale Estimate only 5% of Marcellus has been shot with 3-D seismic Pursuing large commercial geothermal contracts Operating Areas Acquisitions Gulf Coast and Marcellus Shale AirJac Drilling (2002) Cypress Consulting (2007) Financial Performance $MM 2006 2007 2008 2009 2010E Revenue $50.6 $81.0 $71.8 $37.5 $28.9 % of OMNI 51.1% 46.9% 37.1% 30.7% 24.1% Adj. EBITDA 1 $13.3 $21.6 $15.9 $6.5 $7.3 % of OMNI 43.3% 45.7% 34.6% 26.3% 23.1% (1) Excludes Corporate EBITDA. |
 10 www.omnienergy.com Provides dock-side and offshore hazardous and non- hazardous oilfield waste management and environmental cleaning services, including: Waste management Drilling rig tank and vessel cleaning Tank degassing and demolition Oil field waste disposal Rig pit cleaning Safe vessel entry NORM decontamination Platform abandonment services Expanded into the Haynesville Shale in 2009 Complements equipment rental service offering Installed first I.M.P.A.C.T. System Offshore (patent filed) Operating Areas Acquisitions Environmental and Other Services Gulf Coast, East Texas and Haynesville Shale B.E.G. Liquid Mud Assets (2008) Charles Holston, Inc. (2007) Trussco, Inc. (2004) (1) Excludes Corporate EBITDA. Financial Performance $MM 2006 2007 2008 2009 2010E Revenue $32.2 $59.7 $77.8 $58.9 $66.1 % of OMNI 32.5% 34.6% 40.2% 48.1% 55.1% Adj. EBITDA $15.3 $14.4 $18.6 $12.2 $15.9 % of OMNI 49.8% 30.4% 40.4% 49.4% 50.3% 1 1 |
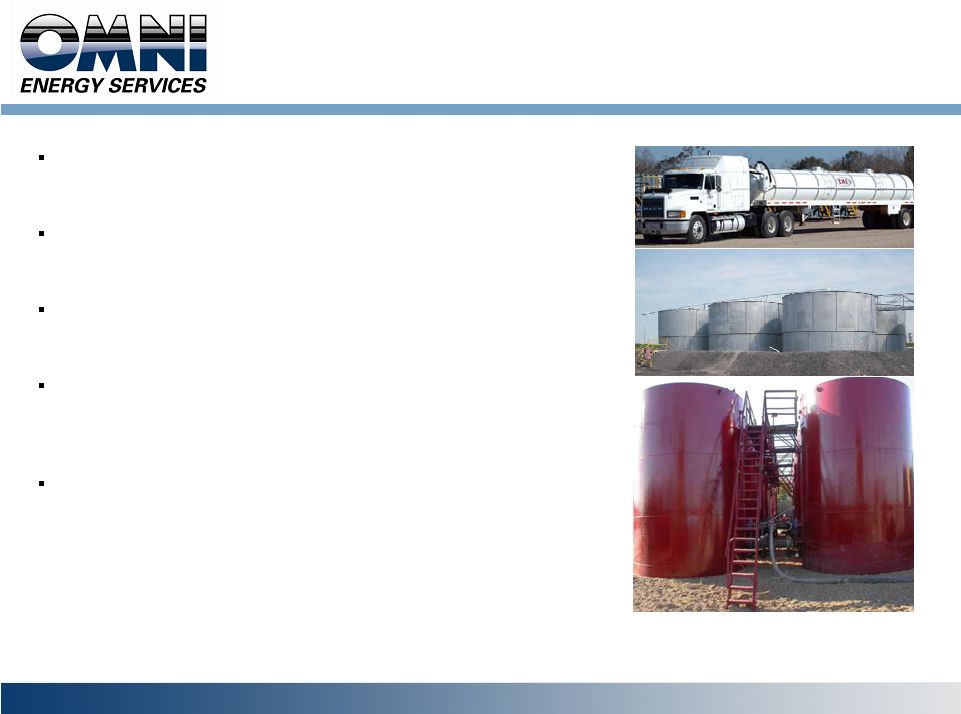 11 www.omnienergy.com Services provided through OMNI's B.E.G. Liquid Mud division, Charles Holston division and Rig Tools division. Offers transportation of non-hazardous byproducts, such as saltwater and spent drilling fluids. Fluid services include drilling fluids, chemicals, storage, mixing and fluid pumping. Fleet of over fifty130-barrel vacuum tankers, roll-off frames and boxes, winch trucks, crane trucks and air movers. In June 2007, the Company acquired certain assets of Bailey Operating, Inc., which geographically extended its core businesses into the Barnett Shale region in North Texas. Environmental and Other Services |
 12 www.omnienergy.com Technological Initiatives A.T.L.A.N.T.I.S. Can clean six liquid mud tanks simultaneously Reduce confined space entry time by up to 80% Reduce crew size and fatigue factor Reduce cleaning duration by up to 60% over conventional cleaning methods Minimize waste disposal cost ™ |
 13 www.omnienergy.com Equipment Rental Provides rental equipment principally to drilling contractors. Extensive fleet of rental equipment including: Water, mud and disposal pumps Mud, fuel and frac tanks Air compressors Wireline units Generators High pressure washers Light towers Steam cleaners Oilfield cooling fans Tubing Acquired Industrial Lift Truck and Equipment Co. allowing OMNI to expand products line into specialized lifting units such as industrial forklifts and manlifts. Operating Areas Acquisitions Gulf Coast, East Texas, Rocky Mountains, Haynesville Shale, Barnett Shale, Bakken Shale, and Marcellus Shale Industrial Lift (2008) Rig Tools, Inc. (2006) Preheat, Inc. (2006) Financial Performance $MM 2006 2007 2008 2009 2010E Revenue $16.2 $31.8 $44.0 $26.0 $25.0 % of OMNI 16.4% 18.5% 22.7% 21.2% 20.8% Adj. EBITDA $2.1 $11.3 $11.5 $6.0 $8.4 % of OMNI 6.9% 23.9% 25.0% 24.3% 26.6% (1) Excludes Corporate EBITDA. 1 |
 14 www.omnienergy.com Investment Highlights Services for both oil and gas plays provide diversified cash flows Seismic, environmental, fluid handling, and equipment rental services Cash flow positive operations throughout oilfield cycles Regional leadership in seismic services provides access to all new transition zone projects and exposure to prolific highland shale plays Offshore focus as commodity demand improves: Recent large oil discovery indicates continued viability of the Gulf of Mexico
Anticipated gas recovery will improve Gulf of Mexico shelf opportunities
Comprehensive suite of services to support gas-driven land exploration and
production recovery in 2010 Experienced management with proven ability to grow through all cycles Organic growth opportunities and proven ability to acquire/integrate complementary business lines |
 15 www.omnienergy.com Financial Review |
 16 www.omnienergy.com Financial Highlights Solid operating cash flow Managing cost structure: Headcount management – “Rightsizing” Improved safety program / claims management Facility consolidations Increased review of discretionary spending Capital expenditures modified to coincide with current activity levels |
 17 www.omnienergy.com Summary Income Statement Managing costs for solid cash flow 1 Excludes goodwill and asset impairment charges of $25.5 million in 2008 and $2.5 million
in 2009. ($MM) 2006 2007 2008 2009 Low High Operating revenue 99.0 $ 172.5 $ 193.6 $ 122.4 $ 110.0 $ 130.0 $ Adjusted EBITDA 26.0 36.6 36.3 19.1 22.0 27.0 Operating income 1 19.7 23.3 21.8 4.0 8.4 13.4 Net income 1 21.8 10.2 6.8 (0.4) 2.2 4.9 Diluted net income per share 1 0.89 $ 0.40 $ 0.34 $ (0.02) $ 0.12 $ 0.24 $ For the FYE December 31, 2010E |
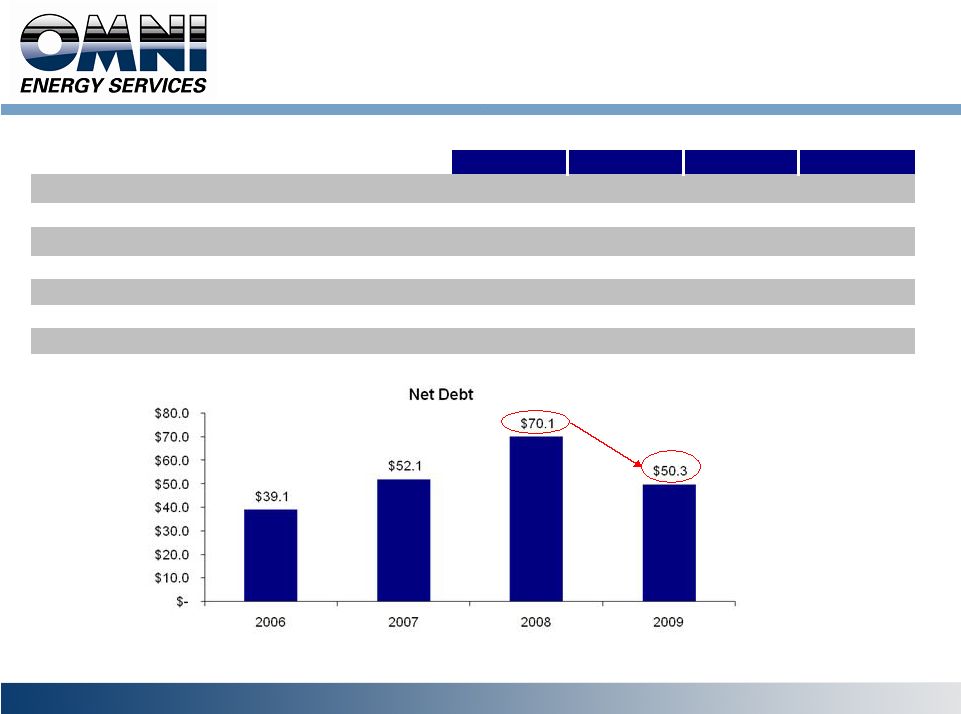 18 www.omnienergy.com Financial Strength 1 At 12/31/08, we discontinued the practice of borrowing the full availability on the
line of credit; includes restricted cash 2 Includes pre-tax goodwill and
asset and impairment charges of $25.5 million and $ 2.6 million for 2008 and 2009, respectively. Reflects the Acquisitions of BEG and ILT ($MM) Decrease of $19.8 million ($MM) 12/31/2006 12/31/2007 12/31/2008 12/31/2009 Cash and Cash Equivalents 1 13.7 $ 14.5 $ 3.0 $ 2.0 $ Total Debt 52.8 66.6 73.1 52.3 Total Stockholder's Equity 2 39.4 60.2 51.0 49.5 Total Book Capitalization 92.2 126.8 124.1 101.8 Credit Statistics Debt / Book Capitalization 57.3% 52.5% 58.9% 51.4% Net Debt / Book Capitalization 42.4% 41.1% 56.5% 49.4% |
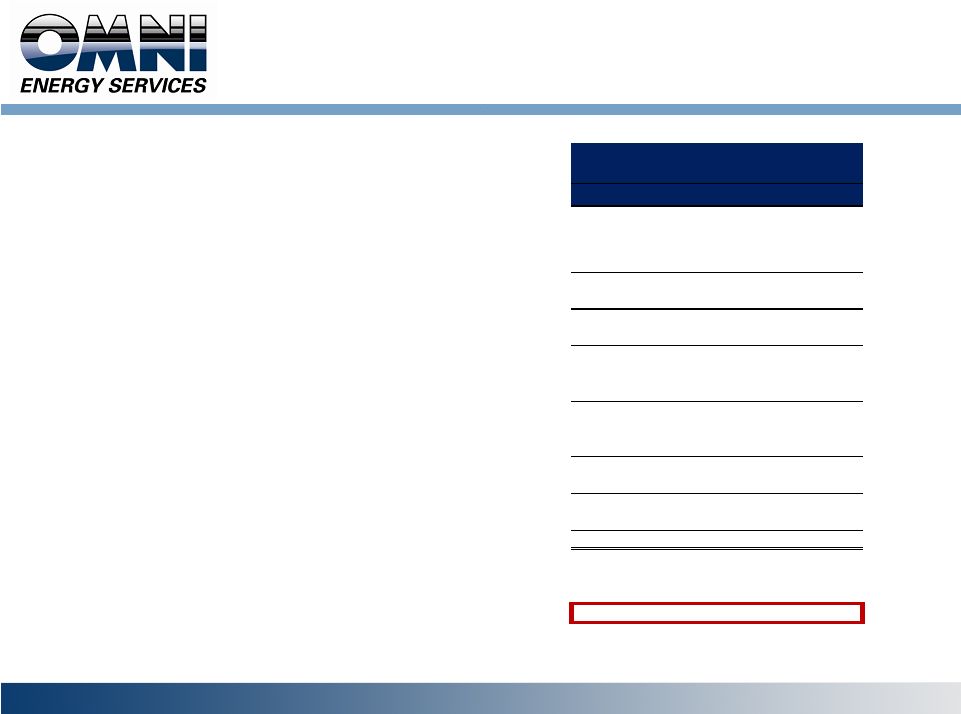 19 www.omnienergy.com 2010 Guidance (Dollars in Millions) Low High Revenue: Services 85.0 $
101.0 $ Rentals 25.0 29.0 Total Revenue 110.0 130.0 Direct Costs (Excludes D&A) 70.4 82.2 Gross Profit 39.6 47.8 General & Administrative Expenses 17.6 20.8 EBITDA 22.0 27.0 Depreciation & Amortization 13.3 13.3 Stock-based compensation 1.4 1.4 EBIT 7.3 12.3 Interest Expense 2.0 2.0 Amortization of Loan Closing Costs 1.5 1.5 Income Before Taxes 3.8 8.8 Income Tax Expense 1.5 3.5 Net income available to common stockholders 2.3 5.3 Preferred Stock Dividends 0.5 0.5 Net income 1.8 $
4.8 $
Margins: Gross Profit 36.0% 36.8% EBITDA 20.0% 20.8% EBIT 6.6% 9.5% Net income 1.6% 3.7% Projected Fiscal Year 2010 |
 20 www.omnienergy.com Conclusion Strong participant in specific regional oil and gas service sectors Positioned to capitalize on industry turnaround Cash-flow positive Multiple potential growth drivers Upturn in exploration and development cycles Organic growth by geography Organic growth through environmental services Organic growth through new technologies and new markets |
 21 www.omnienergy.com Adjusted EBITDA (Dollars in Millions) FY 2006 FY 2007 FY 2008 FY 2009 Low High Net income (loss) available to common shareholders 20.9 $ 9.4 $ (14.1) $ (3.4) $ 2.2 $ 4.9 $ Interest expense 5.0 6.9 6.8 3.7 3.5 3.5 (Gain) loss on debt extinguishment - 1.1 (0.1) - - - Other (income) expense and dividends on preferred 0.7 0.4 0.6 0.6 0.5 0.5 Depreciation and amortization 5.7 10.8 13.3 13.5 12.2 12.2 Non-cash stock compensation 0.6 2.5 1.2 1.5 1.4 1.4 Impairment of goodwill and intangibles - - 25.0 2.4 - - Impairment of fixed assets - - 0.4 0.2 - - Income tax (benefit) expense (6.8) 5.5 3.2 0.6 2.2 4.5 Adjusted EBITDA 26.0 $ 36.6 $ 36.3 $ 19.1 $ 22.0 $ 27.0 $ Segment Adjusted EBITDA Seismic 13.3 $ 21.6 $ 15.9 $ 6.5 $ 6.7 $ 7.9 $ Environmental and other services 15.3 14.4 18.6 12.2 14.6 17.2 Equipment leasing 2.1 11.3 11.5 6.0 7.8 9.0 30.7 47.3 46.0 24.7 29.1 34.1 Corporate (5.3) (13.2) (11.3) (7.3) (8.5) (8.5) 25.4 34.1 34.7 17.4 20.6 25.6 Non-cash stock compensation 0.6 2.5 1.2 1.5 1.4 1.4 Impairment of fixed assets - - 0.4 0.2 - - Adjusted EBITDA 26.0 $ 36.6 $ 36.3 $ 19.1 $ 22.0 $ 27.0 $ 2010E |
 22 www.omnienergy.com Adjusted EBITDA Rationale EBITDA consists of earnings (net income or loss) before interest expense, provision for income taxes, depreciation and amortization and impairments. Adjusted EBITDA includes other
income (expense), non-cash stock-based compensation and gain or loss
on debt extinguishment because these items are either non-recurring or
non-cash. This term, as we define it, may not be comparable to similarly
titled measures employed by other companies and is not a measure of performance calculated in accordance with U.S. generally accepted accounting principles (GAAP). The Securities and Exchange Commission (SEC) has adopted rules regulating the use of
non-GAAP financial measures, such as EBITDA and Adjusted EBITDA, in
disclosures and press releases. These rules require non-GAAP financial measures to be presented with, and reconciled to, the most nearly comparable financial measure calculated and presented in accordance with
GAAP. Set forth on the previous slide is a reconciliation of net income
(loss) to Adjusted EBITDA. Management uses Adjusted EBITDA to measure the
operating results and effectiveness of our ongoing business. We believe this
measurement is important to our investors and financial analysts because it allows a more effective evaluation of the Company's performance using the same measurements
that management uses. Adjusted EBITDA is an indication of the Company's
ability to generate cash available to internally fund our expansion plans and service our debt obligations. This non-GAAP financial measure may not be comparable to similarly titled measurements used by other
companies and should not be used as a substitute for net income (loss),
earnings (loss) per share, operating cash flow or other GAAP operating
measurements. |
 March 15, 2010 Brian Recatto, President & CEO Ron Mogel, Sr. Vice President & CFO Roth OC Growth Stock Conference |