Attached files
| file | filename |
|---|---|
| EX-23 - EX-23 - LECG CORP | a2197264zex-23.htm |
| EX-32.1 - EX-32.1 - LECG CORP | a2197264zex-32_1.htm |
| EX-31.2 - EX-31.2 - LECG CORP | a2197264zex-31_2.htm |
| EX-21.1 - EX-21.1 - LECG CORP | a2197264zex-21_1.htm |
| EX-31.1 - EX-31.1 - LECG CORP | a2197264zex-31_1.htm |
Use these links to rapidly review the document
TABLE OF CONTENTS
ITEM 8. FINANCIAL STATEMENTS AND SUPPLEMENTARY DATA
UNITED STATES
SECURITIES AND EXCHANGE COMMISSION
WASHINGTON, D.C. 20549
FORM 10-K
ý |
ANNUAL REPORT PURSUANT TO SECTION 13 OR 15(d) OF THE SECURITIES EXCHANGE ACT OF 1934 |
|
For the Fiscal Year ended December 31, 2009 |
||
OR |
||
o |
TRANSITION REPORT PURSUANT TO SECTION 13 OR 15(d) OF THE SECURITIES EXCHANGE ACT OF 1934 |
|
For the Transition Period from to |
||
Commission File Number 000-50464
LECG CORPORATION
(Exact name of registrant as specified in its charter)
| Delaware (State or other jurisdiction of incorporation or organization) |
81-0569994 (I.R.S. Employer Identification Number) |
|
2000 Powell Street, Suite 600 Emeryville, California 94608 (Address of principal executive offices including zip code) |
(510) 985-6700 (Registrant's telephone number, including area code) |
SECURITIES REGISTERED PURSUANT TO SECTION 12(b) OF THE ACT:
| Title of each class | Name of each exchange on which registered | |
|---|---|---|
| Common Stock, $0.001 Par Value | NASDAQ Global Select Market |
SECURITIES REGISTERED PURSUANT TO SECTION 12(g) OF THE ACT:
None
Indicate by check mark if the registrant is a well-known seasoned issuer, as defined in Rule 405 of the Securities Act. Yes o No ý
Indicate by check mark if the registrant is not required to file reports pursuant to Section 13 or Section 15(d) of the Act. Yes o No ý
Indicate by check mark whether the registrant (1) has filed all reports required to be filed by Section 13 or 15(d) of the Securities Exchange Act of 1934 during the preceding 12 months (or for such shorter period that the registrant was required to file such reports), and (2) has been subject to such filing requirements for the past 90 days. Yes ý No o
Indicate by check mark whether the Registrant has submitted electronically and posted on its corporate Web site, if any, every Interactive Data File required to be submitted and posted pursuant to Rule 405 of Regulation S-T during the preceding 12 months (or for such shorter period that the Registrant was required to submit and post such files). Yes o No o
Indicate by check mark if disclosure of delinquent filers pursuant to Item 405 of Regulation S-K is not contained herein, and will not be contained, to the best of registrant's knowledge, in definitive proxy or information statements incorporated by reference in Part III of this Form 10-K or any amendment to this Form 10-K. ý
Indicate by check mark whether the registrant is a large accelerated filer, an accelerated filer, a non-accelerated filer, or a smaller reporting company. See the definitions of "large accelerated filer, "accelerated filer," and "smaller reporting company" in Rule 12b-2 of the Exchange Act.
| Large accelerated filer o | Accelerated filer ý | Non-accelerated filer o (Do not check if a smaller reporting company) |
Smaller reporting company o |
Indicate by check mark whether the registrant is a shell company (as defined in Rule 12b-2 of the Act). Yes o No ý
The approximate aggregate market value of the registrant's common stock held by non-affiliates as of June 30, 2009 (the last business day of the registrant's most recently completed second fiscal quarter) was $61,299,703* (based on the closing price for the common stock on the NASDAQ Global Select Market).
As of March 10, 2010, there were 36,870,842 shares of the registrant's common stock outstanding.
- *
- Excludes the common stock held by executive officers, directors and stockholders whose ownership equals or exceeds 10% of the common stock outstanding at June 30, 2009. This calculation does not reflect a determination that such persons are affiliates for any other purposes.
2
Forward-Looking Statements
The following discussion and other parts of this Annual Report on Form 10-K concerning our future business, operating and financial condition and statements using the terms "believes", "expects", "will", "could", "plans", "anticipates", "estimates", "predicts", "intends", "potential", "continue", "should", "may", or the negative of these terms or similar expressions are "forward-looking" statements as defined in the Private Securities Litigation Reform Act of 1995. These statements are based upon our current expectations as of the date of this Report. There may be events in the future that we are not able to accurately predict or control that may cause actual results to differ materially from expectations. Information contained in these forward-looking statements is inherently uncertain, and actual performance is subject to a number of risks, including but not limited to, (1) our ability to successfully attract, integrate and retain our experts and professional staff, (2) dependence on key personnel, (3) successful management and utilization of professional staff, (4) dependence on growth of our service offerings, (5) our ability to maintain and attract new business, (6) our ability to maintain and comply with the covenants under our new credit facility, (7) the cost and contribution of additional hires and acquisitions, (8) risks relating to the recent closing of our Merger with SMART and our ability to successfully integrate the service offerings, professional staff, facilities and culture of the predecessor organizations, (9) successful administration of our business and financial reporting capabilities including maintaining effective internal control over financial reporting, (10) potential professional liability, (11) intense competition, (12) risks inherent in international operations, and,(13) risks inherent in successfully transitioning and managing our restructured business. Further information on these and other potential risk factors that could affect our financial results may be described from time to time in our periodic filings with the Securities and Exchange Commission and include those set forth in this Report under Item 1A. "Risk Factors." We cannot guarantee any future results, levels of activity, performance or achievement. We undertake no obligation to update any of these forward-looking statements after the date of this Report.
Introduction
We provide expert services through our highly credentialed experts and professional staff whose skills and qualifications allows us the opportunity to address complex, unstructured business and public policy problems. We deliver independent expert testimony and original authoritative studies in both adversarial and non-adversarial environments. We conduct economic, financial, accounting and statistical analyses to provide objective opinions and strategic advice to legislative, judicial, regulatory and business decision makers. Our skills include electronic discovery, forensic accounting, data collection, econometric modeling and other types of statistical analyses, report preparation and oral presentation at depositions. Our experts are renowned academics, former senior government officials, experienced industry leaders, technical analysts and seasoned consultants. Our clients include Fortune Global 500 corporations, major law firms and local, state and federal governments and agencies in the United States and other countries throughout the world.
On November 13, 2003 we completed our initial public offering in which we issued 8,625,000 shares of our Common Stock at $17.00 per share and received net proceeds of $134.1 million. The entity that operated our business prior to the completion of the initial public offering was LECG, LLC, a limited liability company and wholly owned subsidiary of LECG Holding Company, LLC. Following completion of the initial public offering, the sole shareholder of LECG Holding Company, LLC was LECG Corporation ("LECG").
Our total expert and professional staff headcount was 495 at December 31, 2003, and was 642 at December 31, 2009. Since August 2003, we have completed 12 acquisitions in order to add expert and professional staff, to expand into new practice areas, and to strengthen our existing practice areas. We
3
have also made individual and group hires, including experienced professionals from consulting firms, government, and educational institutions.
Our office locations expanded from 24 at December 31, 2003 to 32 at December 31, 2009, including 19 offices in the United States and 13 offices in 10 foreign countries.
Recent development—Merger with SMART
On March 10, 2010, we completed our merger (which we refer to as the Merger) with SMART Business Holdings, Inc. (SMART), a privately held provider of business advisory services, and we received a $25.0 million cash investment from SMART's majority shareholder, Great Hill Equity Partners III, LP (which we refer to as the investment). In the Merger transaction, we acquired 100% of SMART's outstanding stock, in exchange for which we issued 10,927,869 shares of LECG common stock, and we assumed approximately $42.8 million of SMART debt. Simultaneously with the consummation of the Merger, SMART's majority shareholder, Great Hill Equity Partners III, LP, made a $25.0 million cash investment into LECG in exchange for our issuance to them of 6,313,131 shares of Series A Convertible Redeemable Preferred Stock. This stock is convertible share-for-share into LECG's common stock (equivalent to a price of $3.96 per share), and provides a 7.5% dividend payable in cash or Series A Convertible Redeemable Preferred Stock at our discretion. As a result of the issuance of the common stock and Series A Convertible Redeemable Preferred Stock, Great Hill Equity Partners III, LP owns approximately 40% of our outstanding voting shares.
Mr. Steve Samek, the Chief Executive Officer of SMART prior to the Merger, will become our CEO before the end of March 2010. The combined entity will operate under the LECG name and continue as a publicly-traded company. The Merger will be accounted for under the purchase method of accounting.
SMART provides business advisory, consulting, technology, accounting, compensation and benefits, tax, and transaction advisory services to a range of industry sectors including: banking and capital markets, government, healthcare, higher education, insurance/reinsurance, life sciences, manufacturing and distribution, not-for-profit and real estate. SMART is an international firm comprised of approximately 500 employees (this number includes the employees of SMART and Associates, LLP, discussed below), many of whom have either come from national or international consulting and accounting firms or industry and have held senior-level executive or director positions prior to joining SMART.
SMART derives a significant portion of revenues from SMART and Associates, LLP (SMART LLP), which offers attestation and public accounting services for non-SEC registered companies. SMART and SMART LLP are separate and independent legal entities operating under a structured management agreement.
As of December 31, 2009, SMART had ten office locations, including nine offices in the United States and one international office in London, United Kingdom. Its headquarters is located in Devon, PA, and its core markets include Chicago, London, New York, and Philadelphia.
LECG segments
In 2008, we reorganized our historical practice groups and individual experts into two operating segments: Economics Services, and Finance and Accounting Services. Below is a description of our two operating segments:
- •
- Economics Services segment is composed of energy and environment, global
competition, labor and employment, regulated industries, and securities sectors as follows:
- •
- Energy and environment—provides expertise in the regulated energy, environment and natural resources industries.
4
- •
- Global competition—offers a complete range of services on
antitrust matters, including mergers and acquisitions, before courts and regulatory authorities around the world. The services involve the use of economic and statistical techniques to develop
independent and objective analyses concerning issues related to merger reviews, monopolization claims, cartels, and quantification of damages. Experts in this area frequently testify before courts and
appear before competition authorities in many jurisdictions around the world.
- •
- Labor and employment—provides litigation support, independent
expert testimony, and business advisory services, including issues of statistical liability in discrimination, wrongful termination, and wage and hour claims.
- •
- Regulated industries—provides expertise in a broad range of
regulated industries, such as telecommunications, transportation and financial claims.
- •
- Securities—specializes in the study of capital markets. These
leading financial economists conduct independent analyses in disputes involving allegations of securities fraud, valuation of complex securities, and capital market transactions such as mergers and
acquisitions.
- •
- Finance and Accounting Services segment is composed of electronic
discovery, financial services, forensic accounting, healthcare, higher education, intellectual property, and international finance and accounting services sectors as
follows:
- •
- Electronic discovery—provides direct collaboration with
outside counsel, general counsel, corporate executives, bank examiners, bankruptcy trustees, forensic accountants, fraud examiners, and damages experts to deliver objective advice and testimony in all
phases of the electronic discovery process including litigation preparedness, computer forensics and data analytics.
- •
- Financial services—provides banking advisory services to
leading financial service firms world wide, addressing regulatory compliance, tax, and dispute resolution, and provides representation before applicable regulatory authorities and assists clients in
regulatory compliance and SEC investigations and litigation.
- •
- Forensic accounting—provides a broad range of expertise in
accounting, auditing, computer forensics, regulatory (SEC), valuation, tax, and securities litigation, and offers a comprehensive mix of forensic accounting services, including internal
investigations, fraud investigations, and when necessary, expert witness testimony.
- •
- Healthcare—provides analyses and insight to clients
confronting the uncertain healthcare environment by advising clients in the development of strategies, designing and understanding policies, and responding to legal and regulatory challenges, and
offers a broad range of litigation support, management advisory, compliance, and expert testimony services.
- •
- Higher education—provides strategic advice and management
consulting to companies, universities, governments, and non-profit organizations with a focus on research and development and higher education.
- •
- Intellectual property—provides expertise in areas such as
capturing value from technological innovation and knowledge assets, estimating damages due to infringement or misappropriation, definition of markets and analyses of non-infringing
alternatives, transfer pricing valuation studies, and valuation of businesses, opportunities, and intangible assets.
- •
- International finance and accounting services—provides expert finance and accounting services to clients outside the United States, with particular emphasis on investigations, damages analysis and expert testimony in international arbitrations.
5
We present and discuss information about our internal management and reporting in the Results of Operations section and other parts of Management's Discussion and Analysis of Financial Condition and Results of Operations.
BUSINESS ENVIRONMENT FOR EXPERT SERVICES
Demand for expert services
Management, courts, arbitration panels, tribunals, regulatory authorities, legislative bodies and boards of directors throughout the world use independent expert analysis and advice to help resolve disputes through litigation, arbitration and negotiation, as well as to understand and address the impact of regulation and legislation. These processes generate ongoing demand for original authoritative economic, financial and statistical analyses, usually irrespective of the business cycle. The credibility of expert analysis and advice is enhanced if the work is independent, is prepared by highly qualified individuals and is informed by the objective facts and circumstances concerned. Judges, jurors, arbitrators, legislators, senior executives and boards of directors tend to give greater weight to experts who do not have a vested interest in the outcome. When trying to resolve or assess important, complex issues, it is frequently insufficient to rely on already published studies. Typically, original and forensic analysis must be conducted based on specific data, documents and facts.
Dispute resolution and decision-making
Disputes are an inherent element of the economy and generally occur regardless of the business cycle. Disputes that require expert analysis and advice typically have significant financial impact for the parties involved, and as the costs of, or potential for adverse outcomes increase, the demand for expert services grows. Expert analysis and advice can also help shape policy choices and can help guide affected parties' responses. The dispute resolution and decision-making processes can be assisted by independent, objective expert analysis of facts, data, causes and consequences.
- •
- Litigation. Complex litigation continues to grow, driven by legislative ambiguities, regulatory activities, judicial interpretations and private actions, including class action law suits. Litigation arises from many areas of economic activity, including mergers and acquisitions, intellectual property, contract disputes, interpretation and enforcement, and taxation. Hundreds of millions of dollars in damages are frequently sought and sometimes awarded in the United States. Both defendants and plaintiffs seek expert analysis and advice to inform courts, arbitration panels and juries in determining appropriate remedies.
Many aspects of business behavior, including mergers and acquisitions, pricing policies, collaborative arrangements, exclusivity arrangements and patent licensing are scrutinized by governments and private parties with respect to antitrust issues. Antitrust scrutiny creates the need for analyses of effects of mergers and acquisitions, assessment of organizational arrangements and distribution policies, pricing behavior and pricing patterns. While the United States has led the development of antitrust laws, many non-U.S. jurisdictions are increasingly applying antitrust policies, procedures and methods of analysis and assessment. The result is a high degree of transferability of and demand for independent expert analysis and advice across jurisdictional boundaries.
Intellectual property disputes have also increased as intellectual property rights, including patents, trade secrets, copyrights and trademarks have become more important and valuable. The rate and complexity of patent applications filed with the United States Patent and Trademark Office have grown dramatically in the last decade. In addition, new fields for which patents were not issued 30 years ago, such as biotechnology and software, are now significant areas for patent applications in the United States. Claims of patent infringement are common and often require independent valuations and assessments. The increased complexity of patent
6
- •
- Arbitration. Arbitration is often used to resolve commercial disputes under
long-term contracts arising from changes in the business environment due to a number of factors, including government action, new technology and shifts in critical input costs. For
instance, long-term gas supply contracts for electric utilities may not be able to adequately address changes in world energy prices, and contracting parties may seek a resolution to these
unanticipated changes through arbitration rather than litigation. Various governments and financial institutions are signatories to certain treaties which allow for them to engage in dispute
resolution through the use of arbitration proceedings. Such proceedings have the potential to provide a multi-national solution to a variety of complex matters. International arbitration has seen a
growing number of cases brought before the International Centre for Settlement of Investment Disputes ("ICSID") created by the World Bank, examples of which include investment disputes between
sovereign governments and private foreign investors. Parties increasingly rely on arbitration to maintain commercial contracts over time. Authoritative reports are often commissioned to analyze
unanticipated changes and help determine the appropriate adjustments that should be made.
- •
- Negotiation. In commercial contexts, parties frequently negotiate to resolve disputes
in order to avoid litigation or arbitration. Negotiation is less structured than litigation or arbitration and often involves multiple parties to a transaction or to a settlement. A report or a
finding from an expert known to be knowledgeable and independent can help resolve disputes. For instance, in the environmental claims area, the resolution of disputes regarding recoveries or the
assessment of exposure can be aided by authoritative reports that calculate the exposure among all parties, including insurers.
- •
- Regulation. Government regulation remains considerable and involves high stakes for new and existing businesses. For example, the United States telecommunications industry has over 50 active regulatory agencies, including state agencies, the Federal Communications Commission, and the Department of Justice. In addition to specific regulations covering industries such as electricity, telecommunications, mail, insurance, financial markets, healthcare, railroads and airlines, there are general regulations such as health and safety, environmental protection and international trade.
applications and the increased value of these intangible assets have created a significant amount of intellectual property-based litigation. Determination of lost profits, reasonable royalties, valuations and other market impacts require detailed economic, financial and statistical analysis.
- •
- Legislation. Representative bodies around the world, such as legislatures and parliaments, continuously modify the rules by which society and the economy are organized. The legislative process frequently provides an opportunity for experts to study legislative impact on behalf of businesses and trade associations. In the United States, legislative bodies and executive branches
In many instances, affected parties engage experts to evaluate the economic and financial impact of regulation. The Telecommunications Act of 1996 generated the submission of a number of studies and reports by affected parties in an effort to influence rule making by the Federal Communications Commission. Regulatory decisions are frequently challenged in the courts, often resulting in demand for additional studies. Regulatory activity has increased internationally. For example, as the European Union seeks increasingly to harmonize financial services rules across its internal market, the regulatory role of the European Commission has grown correspondingly. Regulatory decisions in Europe have a corresponding impact on financial markets and institutions in the United States. Consequently, United States governmental agencies such as the Federal Reserve have a strong interest in the regulatory environments in which these institutions operate outside the United States. Demand for expert analysis on regulatory issues is both domestic and international, as regulators around the world increasingly draw upon the skills of outside experts to help shape and improve policy.
7
of government often seek expert advice, as do corporations and trade associations. Legislation will often have a material impact on national, state and local economies. For example, environmental legislation like the Clean Air Act and securities legislation like the Sarbanes-Oxley Act of 2002 have had significant economic impact on businesses. Authoritative reports, detailed analysis and the presentation of data can shape business behavior and legislative and market outcomes. Once enacted, legislation invites further analyses and creates the opportunity to provide compliance studies and impact assessments.
Supply of expert services
Experts come from universities, think tanks, public and private research laboratories, governmental bodies, private enterprises and professional services firms. Many potential providers of expert services do not readily offer expert analysis or advice as an identified line of business.
Large-scale authoritative studies and analyses for dispute resolution are unsuited to traditional consulting and academic environments. For instance, most universities, think tanks and laboratories do not allow faculty or staff to use the institution's facilities or students when they are on private consulting engagements. Traditional consulting firms are also not designed to support a broad range of individuals with highly specialized and differentiated expertise. Management consulting firms often operate by leveraging particular methodologies and concepts. Providing expert services requires specialized analysis and highly customized approaches that can involve the analysis of large numbers of legal documents and electronic data related to the issues at hand.
Addressing expert needs
Experts provide a unique managerial challenge because they are highly specialized, educated, independent and self-motivated, and may have already enjoyed senior management or executive-level status. We believe experts desire to work in an organization that enables professional autonomy, brings together other experts with substantive specialized knowledge, provides clear incentives that align returns for both the expert and the firm, employs experienced professional staff with strong analytical and project management skills, and provides the requisite administrative infrastructure.
- •
- Objective
rewards. Because professional activities for experts are substantially self-directed, and because of the need for autonomy,
compensation systems are more effective if they are tied to objective financial criteria over which the expert has significant control.
- •
- Association with other
experts. Experts benefit from being able to call upon the expertise of their colleagues. Bringing together experts in a services
organization can create a collegial environment in which knowledge can be exchanged, and colleagues can share work, ideas, professional experiences and client opportunities.
- •
- Professional staff. Engagements often include a multitude of tasks that require various levels of expertise and sophistication. Expert services are typically requested or required in time-sensitive matters with high financial impact where effective professional staff, and occasionally other experts, are critical factors in completing an engagement. The ability to utilize professional staff enables experts to focus their time on the high level components of a project. Also, because reputations are at stake when experts testify, experts require and demand experienced professional staff who can assist them on substantive issues including data collection, statistical analysis, presentation preparation and project management.
Addressing client challenges
Expert services are highly specialized and their effective delivery requires identifying individuals with substantive knowledge of the specific problems or issues under consideration, quality reputations
8
and the ability to clearly communicate and defend analyses and advice under rigorous questioning or cross-examination. On-time performance is critical, especially when there are deadlines for reports and appearances before judges, juries, arbitrators and legislators. In addition, clients expect that experts will be efficient in leveraging the capabilities of professional staff to manage costs.
OUR COMPETITIVE STRENGTHS
Our competitive strengths enable us to provide high-quality, independent expert testimony, original authoritative studies and strategic advice to Fortune Global 500 companies, major law firms and local, state and federal government agencies in the United States and internationally. We continually seek new talent to deepen our existing capabilities as well as expand into new areas. We believe that our experts' qualifications, independence, experience and reputations give us a strong presence in the marketplace for expert services.
Renowned experts
Our experts include internationally recognized faculty and former faculty from many of the world's best universities, many of whom are also significant contributors to academic and professional literature in economics and finance. These experts specialize in areas such as antitrust, policy, complex financial damages, forensic accounting, electronic discovery, environmental damages assessment, telecommunications regulation and deregulation, bankruptcy, corporate restructuring, electricity market design, healthcare and intellectual property valuation. Many of our experts also have valuable hands-on industry experience or have worked in or with government agencies, such as the Federal Deposit Insurance Corporation, United States Department of Justice, United States Securities and Exchange Commission, United States Federal Trade Commission, Internal Revenue Service, Environmental Protection Agency, European Commission, United Kingdom's Office of Gas and Electricity Markets and national treasuries around the world. The reputations and experience of our experts drives the demand for our services.
Our growth is dependent upon our ability to hire and retain leading experts in fields where we believe there is substantial business opportunity for expert analysis and advice due to the significant economic and financial impact of the disputes and decisions involved. Our focus of informing decision-makers involved in complex dispute resolution enables us to effectively recruit and retain top expert talent from a variety of disciplines.
Entrepreneurial culture
Our organizational structure fosters an entrepreneurial culture that enables us to attract, deploy and retain leading independent experts from academia, government and the private sector. Our experts are credentialed, self-motivated, individuals with highly specialized knowledge who respond best to an organization such as ours that provides them with a high degree of autonomy and intellectual freedom. We have demonstrated the ability to effectively identify, recruit and integrate additional experts into our company. We also have the ability to develop experts from within the firm.
Highly proficient professional staff
We employ an experienced professional staff to support our experts. The utilization of our professional staff is important to the profitability of our business. Many of our professional staff have advanced degrees in economics, finance or related disciplines, and relevant business and public service experience. Our professional staff enables our experts to focus their time on the most significant components of a project by assisting them on issues such as data collection, statistical analysis, data and fact auditing, presentation preparation and project management. This allows the expert to deliver a higher quality, more robust and timely work product in a cost-effective manner. Many of our professional staff have become experts in their own right, testifying, authoring studies, developing sophisticated models and providing strategic advice.
9
OUR EXPERT SERVICES BUSINESS
We provide expert services including independent expert testimony, original authoritative studies and strategic advice to Fortune Global 500 corporations, major law firms, local, state and regional governments and governmental agencies in the United States and internationally. Demand for our services is driven by clients attempting to resolve complex disputes through litigation, arbitration or negotiation, or seeking to understand and address regulation and legislation. We apply our core competencies to matters arising from these key drivers to provide independent expert services to our clients.
Core competencies
Our experts and professional staff have specialized knowledge in economic, financial and statistical theories, antitrust policy, complex financial damages, electronic discovery and data organization, forensic accounting and other areas requiring complex analyses. In addition, many of our experts and professional staff also possess in-depth knowledge of specific markets, regulations and industries. These core competencies enable us to incorporate complex methodologies and tools developed in research settings to deliver independent expert testimony, original authoritative studies and strategic advice in adversarial and non-adversarial settings to assist in dispute resolution and decision-making. The reputations of our experts and the quality of our experts' services have resulted in a high level of repeat business and the development of significant new business.
Services provided
Our experts and professional staff provide independent expert testimony, original authoritative studies and strategic advice to help resolve complex disputes and inform legislative, judicial, regulatory and business decision-makers. Our experts and professional staff manage information and conduct independent, sophisticated economic, financial and statistical analyses for clients attempting to resolve disputes through litigation, arbitration or negotiation or seeking to understand and address regulation and legislation.
- •
- Expert
testimony. Our experts provide independent oral and written expert testimony on behalf of plaintiffs and defendants in trial,
arbitration and mediation proceedings, as well as in matters before regulatory agencies and legislative bodies. Our experts have testified throughout the world on matters such as antitrust policy,
class certification, complex merger filings, contract damages, employment discrimination, damage quantification as well as on the valuation of a wide range of intellectual property assets, including
patents, copyrights, trademarks, trade secrets and trade dress.
- •
- Authoritative
studies. We prepare and provide independent authoritative studies generally in connection with litigation; such as studies containing
detailed economic, financial and statistical analyses. Authoritative studies are often commissioned in support of expert testimony or to analyze proposed regulations or legislation. Large amounts of
information and data must often be assembled by staff in order to conduct these analyses. We also prepare expert studies that are used during arbitration and negotiation.
- •
- Advisory services. Our experts and professional staff provide independent strategic advice and expert consulting, particularly in industries with heavy regulatory oversight. This advice is usually provided to senior management and boards of directors of our clients. Our services include the analysis and evaluation of potential mergers and the integration of businesses, the economic analysis of prospective investments, securities litigation consulting, transfer pricing valuation, risk management analysis in connection with large insurance claims, the design of regulatory compliance systems and the management of intangible assets. We frequently advise on regulatory strategy and on market design. In the finance area, we perform valuations of assets, including
10
intellectual property, such as patents, trade secrets and trademarks. We provide advice regarding licensing and transfer pricing strategies and protocols.
Representative practice area expertise
Our experts have specific expertise in practice areas that include competition policy/antitrust; complex damages including intellectual property, environmental claims; market and regulatory design; valuation analysis; labor and employment; forensic accounting; electronic discovery, bankruptcy and securities litigation. Many of our projects span multiple practice areas, and many of our staff work in several practice areas. We have also developed new practice areas in the past several years, such as labor and employment, bankruptcy and reorganization and securities litigation, as the issues facing our clients evolve and new business opportunities arise.
- •
- Competition
policy/antitrust. We have provided expert services in the antitrust field since our founding. Many antitrust projects require special
skills and, in many cases, experience with or exposure to approaches and methods used by the antitrust enforcement agencies. Antitrust issues increasingly involve other practice areas in the firm such
as regulatory design and intellectual property. Mergers involving large multinational corporations often require coordination across many of our offices worldwide.
- •
- Securities. As damages from business litigation become more complex, there is a need
for expert advice based on advanced economic and financial analysis. Our practice in this area includes many professionals with a deep understanding of the application of advanced methodologies and
techniques in economics, finance, accounting and statistics. An important element of this practice is assessing damages in securities litigation, as well as damage issues related to patent, copyright
and trademark infringement and trade secret misappropriation. These issues can involve determinations of lost profits, damages and reasonable royalties.
- •
- Regulated industries. We help businesses and governments understand and address market and regulatory policies through the use of economic and financial analyses. Our insights, analyses, recommendations and presentations are used to respond to proposed policy changes, as well as initiate new policies that address strategic objectives. We offer a broad array of services in market and regulatory design ranging from testimony and guidance in front of regulatory commissions or legislative bodies, to the actual design and oversight of independent system administration in the electricity sector.
- •
- Labor and
employment. Our experts perform statistical analyses and evaluate discrimination, wrongful termination and wage and hour claims. Our
experts calculate economic loss and damages by analyzing employer statistics for potential disparities in hiring, layoffs, promotions, and pay and performance assessments. Our experts have advised on
human resource management, benefits, collective bargaining and arbitration.
- •
- Intellectual property and damages. We provide a global perspective, solid expertise and recognized credentials to our clients' intellectual property-related issues. In an increasingly knowledge-driven economy, a company's intangible assets are often its most important assets and
Many industries in the United States are exposed to claims of environmental damages due to current or legacy activities, including oil spills, chemical spills and other sources of environmental contamination. Our experts provide advice on how contamination affects property values. Our experts also quantify damages and estimate penalty exposure. Piecing together the data that addresses liability issues, the amount of damage, and the coverage available under legacy insurance policies involves historical research, the quantification of damages and the apportionment of damages to multiple insurers when the insured has complex insurance coverage profiles.
11
- •
- Forensic
accounting. We provide forensic accounting services in connection with complex commercial disputes and regulatory investigations. We
gather and analyze voluminous financial data to uncover evidence, reconstruct complex financial transactions and events and identify potential liabilities or areas of fraud.
- •
- Electronic discovery
services. The capability for law firms to effectively manage and access case documentation and data is critical to attorneys responsible
for the outcome of a case and the clients they represent. Our electronic discovery experts work directly with outside counsel, general counsel and corporate executives to deliver objective advice in
all phases of electronic discovery. Our electronic discovery services include: litigation readiness planning, electronic discovery consulting, litigation information management, data preservation,
computer forensics, email recovery and reconstruction, and transactional data analysis.
- •
- Bankruptcy and
restructuring. We provide a comprehensive scope of specialized accounting and tax services to clients, courts and law firms in
connection with bankruptcy and reorganization matters, which include providing expert consulting to trustees, receivers, examiners, debtors, creditor committees, and secured creditors. Our experts
also serve as trustees, receivers and examiners in Chapter 11 and Chapter 7 cases.
- •
- Mergers and acquisitions. We advise firms and government agencies in assessing the competitive implications of mergers and acquisitions. We have presented analyses to government agencies and testified in hundreds of merger-related matters. Our experts perform extensive data and information collection to answer important factual questions and provide empirical support for expert opinions based on state-of-the-art merger analyses.
the major source of its competitive advantage. Developing, managing, and protecting these assets is a key component of an effective business strategy. Our intellectual property services include expert testimony, damages analysis, market issues, valuation and management of intellectual property.
Representative industry expertise
Over time we have been able to develop deep knowledge of specific client industries, including the following:
- •
- Energy. For over a decade, our experts have been engaged to provide expert advice to the petroleum industry in the areas of exploration, refining, pipeline transportation and distribution. We have advised on mergers and acquisitions, provided analysis of competitive effects, modeled refining operations, assessed intermodal competition facing pipelines and analyzed the effects of multiple channels of distribution. We have detailed knowledge of the oil and gas industry not only in the United States, but also in many other countries and regions, including Australia, New Zealand and Europe.
- •
- Financial services. Our experts provide services related to numerous companies and entities involved in financial services, including banks, insurance companies, capital market organizations and the government and regulatory entities with respective oversight. Our services have typically focused on performing complex economic and financial analyses associated with industry consolidation, the evolving regulatory and accounting environment and risk management. Our
In the electricity area our experts have been involved in network modeling, market design, auctions and pricing. They have developed a deep understanding of different regulatory regimes around the world. The firm's experts have provided services to generators, independent system operators, transmission companies and service companies. Our experts have performed cross-jurisdictional studies on electricity policy issues in the United States, Australia, New Zealand, the United Kingdom and Chile.
12
- •
- Healthcare and
pharmaceuticals. We have a diverse healthcare and pharmaceuticals practice which spans competition analysis, patent damages, commercial
disputes, cost and public policy analysis, strategic consulting and regulatory compliance. Our clients include pharmaceutical and biotech companies, hospitals, managed care providers and physicians
groups. Our experts and staff have been involved in healthcare and health insurance reform efforts in several states. Our work frequently involves analyzing large amounts of electronic data. We are
able to analyze healthcare claim issues, perform regulatory compliance reviews and design systems to help providers comply with regulations and analyze existing and emerging market competition. We
advise providers on information systems designs most likely to facilitate regulatory compliance, financial viability and restructuring programs.
- •
- Telecommunications. We have a long-standing telecommunications practice that has advised firms regarding regulatory, litigation and strategic planning in the United States and internationally. We have assessed various pricing regimes, analyzed emerging competition, modeled new entry and commented on various proposals to restructure the industry. We have in-depth knowledge of regulatory environments around the world including the United States, the United Kingdom, Australia, New Zealand, Argentina and the Baltic States.
services have included expert testimony related to valuation and damages, as well as class certification and authoritative public policy studies assessing the impacts of regulation on markets, product offerings and consumers.
Representative clients
We provide expert services to Fortune Global 500 corporations, major law firms and local, state and federal governments and agencies in the United States and other countries throughout the world. Our ten largest clients represented 14%, 13%, and 18% of our revenues in 2009, 2008 and 2007, respectively. No single client accounted for more than 3% of our revenues in any of those periods. We are frequently approached directly by law firms on behalf of clients to provide independent testimony, authoritative studies and/or strategic advice in matters involving litigation, arbitration, negotiation, legislation or regulation. In these cases, our engagement and billing arrangements are often with such law firms.
International operations
We have international offices in Argentina, Australia, Belgium, France, Hong Kong, Italy, Mexico, New Zealand, Spain and the United Kingdom. Our international revenues accounted for 19%, 23% and 17% of our consolidated revenues in 2009, 2008 and 2007, respectively. International practice areas include competition policy and antitrust, finance and damages, regulatory expertise and transfer pricing. Through our international operations, we provide law firms, businesses, regulators, and governmental agencies with independent and objective advice and analysis on matters of economics, finance and strategy. Our international experts and professional staff work across a range of industries and have particular expertise in financial services, communications and media, and energy and utilities.
Financial information about our geographic areas and risks associated with our international operations appear in Note 16 of Notes to Consolidated Financial Statements included under "Segment Reporting" in this Form 10-K report and in Item 1A: "Risk Factors."
SMART'S BUSINESS
Company Overview
Founded in 1988, SMART provides business advisory, consulting, technology, accounting, compensation and benefits, tax, and transaction advisory services to a range of industry sectors
13
including: banking and capital markets, government, healthcare, higher education, insurance/reinsurance, life sciences, manufacturing and distribution, not-for-profit and real estate. SMART is an international firm comprised of approximately 500 employees (this number includes the employees of SMART and Associates, LLP, discussed below), many of whom have either come from national or international consulting and accounting firms or industry and have held senior-level executive or director positions prior to joining SMART.
SMART derives a significant portion of revenues from SMART and Associates, LLP ("SMART LLP"), which offers attestation and public accounting services for non-SEC registered companies. SMART and SMART LLP are separate and independent legal entities operating under a structured management agreement.
SMART had ten office locations as of December 31, 2009, including nine offices in the United States and one international office in London, United Kingdom. Its headquarters is located in Devon, PA, and its core markets include Chicago, London, New York, and Philadelphia.
Services
SMART (in some cases in conjunction with SMART LLP) offers the following services to its clients:
- •
- Actuarial
solutions. SMART offers life and property and casualty actuarial solutions. Its actuarial services team evaluates many of the risks
associated with doing business and assists clients with all of their actuarial needs, from strategic planning to profitability studies.
- •
- Audit, risk and compliance
solutions. SMART's accounting and risk management professionals assist clients with implementing compliance programs, developing
streamlined enterprise risk management models, and identifying opportunities for enhancing the effectiveness of the internal audit function. Its audit, risk, and compliance solutions include external
audits for non-SEC registered companies (through SMART LLP), compliance program management, enterprise risk management, internal audits, quality assurance reviews, and
Sarbanes-Oxley compliance.
- •
- Executive
solutions. SMART works closely with its clients to understand and measure the performance of their business to ultimately grow revenues
or reduce costs. SMART's executive solutions include business strategy and planning, business valuation, key performance indicators, and operations excellence.
- •
- Financial
solutions. SMART's financial solutions include software selection, implementation, rollout and training, policy and procedures review
and documentation, business intelligence and analysis, spend management, activity-based costing, business process management, working capital management and program management.
- •
- Legal
solutions. SMART offers resources to help law firms and legal departments manage information, integrate mission-critical technologies,
and measure compliance to standard operating procedures and best practices, both internally and when collaborating with one another.
- •
- Outsourcing solutions. SMART offers accounting, business process, tax, and technology outsourcing solutions. Its accounting outsourcing services include interim management, CFO outsourcing, bookkeeping, reports, check writing, monthly financial statements, invoicing, unemployment compensation, and related back-office needs. SMART's business process outsourcing services include new technology and software implementation, revised processes and procedures, and personnel and department changes. Its tax outsourcing services include complete tax department outsourcing, co-sourcing, specific project assistance, audit assistance, amended returns, and contingency tax services. SMART also provides technology outsourcing
14
- •
- People
solutions. SMART's people solutions include compensation and benefits services and human capital management services. SMART's
compensation and benefits practice helps design new compensation and benefit plans, evaluate and enhance existing plans, and review programs for compliance with changing laws and regulations, while
minimizing tax, financial, and regulatory burdens. Its compensation and benefits services include corporate recovery services, career path planning, health and welfare, retirement plan evaluation and
design, and total rewards. SMART's Human Capital Management solutions include change management, organizational dynamics, strategic human resources advisory, training and instructional design, and
merger and integration/consolidation and restructuring services.
- •
- Tax
solutions. SMART's tax team assists clients with tax services in the following areas: federal tax, international tax, property tax,
sales and use tax, state and local tax, strategic wealth services, tax technology, tax provision, and transaction advisory. The details of these tax services are as follows:
- •
- Federal tax services. IRS representation, strategic tax
planning, tax compliance, and transaction advisory services.
- •
- International tax services. Repatriation planning and
analysis, transfer pricing analysis/documentation/support, formation and exit strategies, organizational restructuring, and cross-border financing evaluation.
- •
- Property tax services. Personal property tax compliance,
personal property tax consulting, and real estate tax consulting.
- •
- Sales and use tax services. Sales and use tax compliance
outsourcing, sales and use tax consulting, and tax technology.
- •
- State and local tax services. Audit and controversy
support, credits and incentives, liability analysis and calculation, multi-state tax planning, payroll taxes and income tax withholding, and tax compliance.
- •
- Tax provision services. Income tax accounting
implementation and ongoing compliance, Sarbanes-Oxley readiness and compliance, resolution of global tax accounting issues and coordination with new International Financial Reporting Standards (IFRS)
rules, and global tax provision process improvement and remediation.
- •
- Transaction advisory services. Pre and
post-transaction Program Management Office (PMO) services to help manage due diligence, regulatory filing and post-merger integration activities.
- •
- Technology solutions. SMART's technology solutions include application development, business applications, business continuity/disaster recovery planning, business intelligence/data warehousing, IT infrastructure and security, IT strategy/assessment/planning, PCI compliance, PMO and governance, and software implementation. SMART's business intelligence solutions include data warehousing model architecture design and implementation, selection of analytical tools and software, enhanced report design from existing systems, and distribution of data through information portals and executive dashboards. SMART's IT infrastructure and security services include internet attack and penetration analysis, security architecture, application controls review, incident response, and identity management.
services including assessments for organizations, data centers, call centers, application development, application support, and project management.
15
Industries
SMART provides services for clients in the following industries: banking and capital markets, government, healthcare, higher education, insurance/reinsurance, life sciences, manufacturing and distribution, not-for-profit and real estate. SMART expects its focus in financial services, public sector, and healthcare to increase as a direct consequence of the changing regulatory, risk management, and reporting and controls landscape.
- •
- Banking and capital
markets. SMART assists financial institutions involved in capital markets, corporate banking and wealth management. In capital markets,
SMART helps its clients with improving front office sales and trading, trade reconciliation and risk management, trade operations, product control and financial reporting, and compliance. In corporate
banking, SMART offers transaction banking solutions in strategic billing and pricing, supply chain finance and client management. From a wealth management perspective, SMART advises clients on the
infrastructure, operational and compliance facets of setting up a trust business, trust accounting system migration and implementation and client reporting.
- •
- Government. SMART has worked with a variety of state and regional counties and
municipalities around the country on a range of projects providing IT and management consulting services. Its teams help clients with a broad spectrum of projects. Examples include enterprise resource
planning, software selection and implementation initiatives to fully define and re-design the functional requirements of a state agency, county, municipal, or special district program or
system.
- •
- Healthcare. SMART provides services that meet the specific financial, clinical, and
technical needs of healthcare providers including community hospitals, health systems, academic medical centers, long-term care, home care, physician multi-practices, and managed care
organizations. SMART's healthcare services include medical management and patient safety. Its medical management services include: medical management systems strategy, medical management process and
systems requirements analysis, medical management solution architecture design, and medical management system selection and implementation. Its patient safety services include patient safety culture
assessment, patient safety process reviews, and quality data reporting.
- •
- Higher
education. SMART offers colleges and universities a complete range of professional services to help meet the evolving administrative
needs of academia. SMART's services for higher education include Enterprise Resource Planning (ERP) system implementation and support (BANNER), business intelligence and reporting, and student
administration. Its business intelligence and reporting services include: strategic planning, report identification and development, tool selection, and implementation services.
- •
- Insurance/reinsurance. SMART offers a broad range of services to property and
casualty insurance companies, life and health insurance companies, HMOs, Managing Agents (MGAs), third-party administrators, primary carriers and receivers, stock companies, agents and brokers, and
insurance regulators. SMART's insurance/reinsurance services include statutory or regulatory accounting, risk management, claims management, tax advice, run-off services and commutations,
arbitration and lawsuits support, MGA/Third Party Administrator investigations, and insurance/reinsurance disputes and reconciliations.
- •
- Life
sciences. SMART offers compliance and risk management solutions and customer relationship management solutions to companies in the life
sciences industry. It has experience with biotechnology, medical device, clinical research, pharmaceutical organizations, and other members of the life sciences supply chain, ranging from startups to
global leaders.
- •
- Manufacturing and distribution. SMART has a broad range of industry and functional experience covering all aspects of operational, financial, and acquisition services for companies
16
- •
- Not-for-profit. SMART offers services to enhance the regulatory compliance, operational efficiency, internal controls and governance, and business management
for
not-for-profit organizations. It provides services for the following types of not-for-profit organizations: charitable foundations, memberships,
education, government units, healthcare, professional/trade associations, social, arts and culture, and religious organizations.
- •
- Real estate. SMART's real estate clients include third-party managed service operators, owners, owner-operators, investment managers, real estate investment trusts and global real estate fund managers. SMART offers enterprise risk management, accounting and assurance, tax, and software services to the real estate industry.
in the manufacturing and distribution industry. Its manufacturing and distribution services include just-in-time inventory, root cause analysis, lean flow procedures, facility feasibility studies, inventory controls, merger and acquisition support, product cost methodologies, turnaround diagnostic services and trend analyses. Additionally, SMART provides assistance to clients by serving as technical consultants in matters of accounting for certain transactions specific to the manufacturing industry.
EMPLOYEES
As of December 31, 2009, we had 806 employees and 68 exclusive independent contractors, consisting of 290 experts, 352 professional staff and 232 administrative staff members.
Upon the closing the Merger with SMART on March 10, 2010, we gained approximately 500 additional employees (including the employees of SMART LLP).
Experts and professional staff
Experts
We classify our experts as directors or principals. As of December 31, 2009, we had 290 experts, consisting of 208 directors and 82 principals. Directors tend to be more experienced than principals, and generally have more established reputations. Directors are expected to generate more engagements than principals. Principals are hired from outside the Company or promoted from the ranks of senior professionals after they have achieved a sufficient reputation of their own and developed the ability to attract new business. Directors tend to be paid a higher percentage of their individual billings, which we refer to as pass-through rates, and may receive other forms of variable compensation not typically offered to principals. Our agreements with our directors and principals generally provide for exclusivity with us in consideration for consulting fees determined by the expert's time billed and collected, as well as project origination fees for work originated or managed by the expert. The agreements generally are terminable at will and generally do not restrict competition with us following termination. However, our agreements generally limit post-departure solicitation of certain clients and staff. From time to time, we will allow experts to accept engagements outside the firm, and we also engage experts not otherwise associated with us.
In addition to our experts, we had affiliate relationships with approximately 200 individuals, who worked with us on a non-exclusive basis during 2009. Fee-based revenue from affiliates accounted for approximately 1.4% of our revenues in 2009. We compensate these affiliates similarly to the majority of our experts; that is, they are paid upon our receipt of payment from clients.
We offer our experts a lucrative compensation model, a collegial atmosphere, high autonomy and transparency of compensation through contractually agreed pass-through rates on billed and collected work, as well as project origination fees. We refer to this variable compensation as the "expert model." Under the expert model, our experts are compensated based on a percentage of their own billings, or pass-through rates, ranging from 30% to 100%, and currently average approximately 72% of their
17
individual billings. The possibility of lucrative compensation is coupled with high accountability as each expert's compensation on a project is linked to our ability to collect on that project, leaving the expert at-risk for payment from us. As of December 31, 2009, approximately 64% of our experts participated in this variable compensation model. We also compensate certain experts based on specified revenue and gross margin targets that are calculated and evaluated on groups of experts and staff working together throughout the year. Experts not participating in either of these variable compensation models are paid a fixed salary and are typically eligible for bonus compensation based on revenue, leverage and other criteria.
We allow our experts to retain significant control over their time commitments. This flexibility enables our experts to pursue the educational, research, publishing and professional activities that add to their reputations and increase their value as experts.
Our experts have entered into agreements with us in which they have agreed that they will exclusively utilize our support staff in connection with their expert services work, whenever the staff with the required level of expertise is available. In calculating incentive compensation for individual experts under the expert model, we generally deduct the cost of an expert's own executive assistants, employment related taxes and certain benefits, as well as a portion of the cost of business development activities. While some of our experts are exclusive independent contractors, most are our employees.
Professional staff
Our professional staff includes highly educated individuals with a broad range of experience and skills needed to support our experts and complement their talents. We recruit our professional staff from leading universities and through references from our experts. Additionally, we seek individuals with highly relevant business, government or professional experience. Most of our professional staff are full-time employees and are available to our experts throughout our company, based on the expertise required for a given project.
MARKETING
The reputation of the firm and of our experts for professional excellence and independence is the most important factor in our business development efforts. We endeavor to capitalize on the professional visibility and accomplishments of our experts and professional staff. We maintain and enhance our name and reputation through our performance and quality of work on engagements, speeches, presentations and articles in industry, business, economic, legal and scientific journals.
We also market our services directly through corporate efforts and through the individual efforts of our professionals. We sponsor, attend and organize conferences and seminars on topical issues at which our experts lecture, present studies, speak on panels and meet with attendees.
COMPETITION
The market for expert and professional advisory services is highly competitive and fragmented. We compete with a large number of service providers in each practice area. We consider some of our principal competitors to be:
- •
- economic, legal and management consulting firms such as CRA International, Inc., Navigant Consulting, Inc.,
National Economic Research Associates, Inc., FTI Consulting, Inc. and Huron Consulting Group Inc.;
- •
- current and former consulting arms of large accounting firms such as BearingPoint, Accenture and Capgemini;
- •
- general management and strategy consulting firms such as Bain & Company, Booz Allen Hamilton and The Boston Consulting Group;
18
- •
- specialized or industry-specific consulting or research firms; and
- •
- individual academics, researchers and private consultants.
Many of our competitors have significantly greater personnel, financial, technical and marketing resources as well as greater name recognition than we do. We also expect to continue to face competition from new entrants because the barriers to entry into consulting services are relatively low.
We believe the principal competitive factors in our markets include:
- •
- reputation of the firm and experts;
- •
- client referrals;
- •
- ability to access leading experts and staff;
- •
- ability to provide project management skills;
- •
- ability to be responsive and to meet deadlines;
- •
- ability to communicate findings to relevant parties; and
- •
- fee structure.
We believe that we compete favorably with respect to each of these factors.
AVAILABLE INFORMATION
Our internet address is www.lecg.com. Documents we have filed with the Securities and Exchange Commission ("SEC"), including our Annual Reports on Form 10-K, Quarterly Reports on Form 10-Q, Current Reports on Form 8-K and any amendments to those reports can be accessed through the investor relations link on our website as soon as reasonably practicable after we electronically file such material with or furnish it to the SEC. The information found on our website is not part of this or any other report we file with or furnish to the SEC.
Set forth below are certain risks and uncertainties that affect our business and that could cause our actual results to differ materially from the results contemplated by forward-looking statements we may make in our press releases, conference calls and other communications with our investors, and in our reports filed with the Securities and Exchange Commission, including those contained in this Report. The occurrence of any of the following risks could harm our business, financial condition, results of operations or cash flows. In that case, the market price of our common stock could decline, and stockholders may lose all or part of their investment. The markets and economic environment in which we compete is constantly changing, and it is not possible to predict or identify all the potential risk factors. Additional risks and uncertainties not presently known to us or that we do not currently consider to be material could also impair our operations.
Risks relating to our Merger with SMART
The combined company must continue to retain, motivate and recruit executives, experts, professional staff and other key employees, which may be difficult in light of uncertainty regarding the integration of the two businesses, and failure to do so could negatively affect the combined company.
Our Merger with SMART is a significant business combination for us, which substantially changes the size and profile of our company, and which also introduces a new chief executive officer for us. Managing change of this magnitude presents a challenge and presents risks for any business, but particularly for a professional services organization. For the Merger to be successful, our combined company must be successful at retaining key personnel following the completion of the Merger. Experienced experts, professional staff and executives are in high demand and competition for their
19
talents can be intense. Employees of both SMART and LECG may experience uncertainty about their future role with the combined company until, or even after, strategies with regard to the combined company are announced or executed. Our competitors may seek to exploit that uncertainty in their efforts to recruit our experts and key employees, and we may experience increased attrition. These potential distractions of the Merger may adversely affect our ability to retain, motivate and attract executives, experts, professional staff, and other key employees and keep them focused on applicable strategies and goals. A failure by our combined company to retain and motivate executives, experts, professional staff, and other key employees during the period after the completion of the Merger could have a material and adverse impact on the business of the combined company.
We may fail to realize some or all of the anticipated benefits of the Merger, which may adversely affect the value of our common stock.
The success of the Merger will depend, in part, on our ability to realize the anticipated benefits and cost savings from combining the historical businesses of SMART and LECG. However, to realize these anticipated benefits and cost savings, we must successfully combine those businesses. If we are not able to achieve these objectives within the anticipated time frame, or at all, the anticipated benefits and cost savings of the Merger may not be realized or may take longer to realize than expected, and the value of our common stock may be adversely affected.
SMART and LECG have operated independently through the completion of the Merger. It is possible that the integration process could result in the loss of key employees, including experts, consultants, other professionals and senior management, in the disruption of ongoing business, or in the identification of inconsistencies in practices, controls, procedures and policies, any of which could adversely affect our ability to maintain relationships with clients, experts, professional staff, contractors, creditors, lessors, landlords, or to otherwise achieve the anticipated benefits of the Merger.
Specifically, risks in integrating the operations of SMART into our operations in order to realize the anticipated benefits of the Merger include, among other things:
- •
- failure of clients to accept new products or services or to continue as clients of the combined company;
- •
- failure to successfully manage relationships with expert witnesses, consultants and other professionals, which could
result in the loss of key revenue generating experts;
- •
- the loss of key employees and expert staff critical to the ongoing operation of the business;
- •
- failure to effectively coordinate sales and marketing efforts to communicate the capabilities of the combined company;
- •
- failure to combine product and service offerings quickly and effectively;
- •
- failure to successfully develop new products and services on a timely basis that address the market opportunities of the
combined company;
- •
- failure to compete effectively against companies already serving the broader market opportunities expected to be available
to the combined company;
- •
- unexpected revenue attrition;
- •
- failure to successfully integrate and harmonize financial reporting and information technology systems of LECG and SMART;
and
- •
- failure to maintain an effective internal control environment as required under the Sarbanes-Oxley Act of 2002 (SMART is a private company and not subject to the Sarbanes-Oxley Act of 2002).
20
Integration efforts will also require effective leadership and will divert management attention and resources. An inability to realize in full the anticipated benefits of the Merger, as well as any delays encountered in the integration process, could have an adverse effect on our business and results of operations, which may affect the value of the shares of our common stock after the completion of the Merger.
In addition, the integration process will likely result in additional expenses and may result in unforeseen expenses, and the anticipated benefits of the integration plans may not be realized. Actual cost synergies, if achieved at all, may be lower than we expect and may take longer to achieve than anticipated. If we are not able to adequately address these challenges, we may be unable to successfully integrate SMART's operations into its own, or to realize the anticipated benefits of the integration of the two companies.
The move of our corporate headquarters will lead to loss of personnel and institutional knowledge, and may disrupt the continuity of our control functions.
In March 2010, in connection with the closing of our merger with SMART, we announced the relocation and consolidation of our corporate headquarters to suburban Philadelphia, Pennsylvania, which is scheduled to be completed by the end of the third quarter of 2010. This move and consolidation will include our human resources, finance and accounting, information technology, conflict clearance and legal functional organizations. This relocation will significantly increase employee turnover. For the functional groups in which significant numbers of employees are being replaced, there may be interruptions and inefficiencies as new employees gain experience in their new roles and familiarize themselves with business processes and operating requirements, and in particular with our public company reporting and internal controls compliance requirements. The loss of personnel could lead to disruptions in control functions stemming from delays in filling vacant positions and a lack of personnel with institutional or procedural knowledge and experience. We may face significant challenges resulting from the relocation of key functions to our new principal executive offices, including difficulties in retaining and attracting officers, key personnel and other employees. The relocation will also require significant management time and effort, which could otherwise be devoted to focusing on ongoing business operations and other initiatives and opportunities. In addition, we may not realize the benefits we anticipate from the relocation, which is intended to produce cost savings and create more a unified, streamlined infrastructure. Any such difficulties or disruptions could have an adverse effect on our business, results of operations or financial condition.
We will incur significant transaction and Merger-related costs.
We expect to incur a number of non-recurring costs associated with combining the operations of the two companies. The substantial majority of non-recurring expenses resulting from the Merger will be comprised of transaction costs related to the Merger, facilities and systems consolidation costs and employment-related costs, including severance and other employee separation costs. We will also incur fees and costs related to formulating integration plans. Transaction costs incurred by LECG through February 28, 2010 totaled approximately $2.5 million. We are still in the process of quantifying systems integration and exit activity-related costs, but this amount could ultimately total several million dollars. Additional unanticipated costs may be incurred in the integration of the two companies' businesses. Although we expect that the elimination of duplicative costs, as well as the realization of other efficiencies related to the integration of the businesses, should allow us to offset incremental transaction and Merger-related costs over time, this net benefit may not be achieved in the near term, or at all.
21
The Merger may not be accretive and may cause dilution to our earnings per share, which may negatively affect the market price of our common stock.
We currently anticipate that the Merger will be accretive to earnings per share during the first full calendar year after the Merger. This expectation is based on preliminary estimates which may materially change. We could also encounter additional transaction and integration-related costs or other factors such as the failure to realize all of the benefits anticipated in the Merger. All of these factors could cause dilution to our earnings per share or decrease or delay the expected accretive effect of the Merger and cause a decrease in the price of our common stock.
Risks relating to our debt and our working capital requirements
We have assumed term loan debt of approximately $40.8 million, which is due on March 31, 2011 and for which we must make significant quarterly debt service payments. If we are unable to make required payments and comply with the covenants, or in the event we are required to refinance this debt in unfavorable market conditions, we may have to pay penalties or higher interest rates and be subject to more stringent financial covenants, which could adversely affect our results of operations.
Prior to our merger with SMART, SMART had term loan bank debt of approximately $40.8 million, and we have assumed that indebtedness as part of the Merger. In connection with the closing of the Merger, we and SMART entered into an amendment of the credit agreement with the lenders, in which the lenders consented to the Merger and we became co-borrowers with SMART. The lenders hold a security interest in substantially all of our assets. As amended, the terms of the loan required that we make a $4.0 million principal payment upon closing (March 10, 2010) and subsequent quarterly principal payments of $3.0 million through December 31, 2010, plus interest, and additional amounts in the event that we have cash balances in excess of specified thresholds or we engage in capital raising transactions. The loan includes a number of financial and operating covenants, and is due on March 31, 2011.
Our indebtedness limits our ability to borrow additional funds and requires us to dedicate a substantial portion of our cash flow from operations to service the debt, thereby reducing the availability of our cash flow to fund working capital, capital expenditures and other general corporate expenditures. This, in turn (1) increases our vulnerability to adverse general economic or industry conditions and to increases in interest rates; (2) limits our flexibility in planning for, or reacting to, changes in our business or our industry; (3) limits our ability to make strategic acquisitions and investments, introduce new services, enter new markets, or exploit business opportunities; and (4) places us at a competitive disadvantage relative to competitors that have less debt or greater financial resources.
If we fail to make any of the quarterly or other required payments, we fail to satisfy the financial or operating covenants, or we are unable to repay the loan when due, we would be in default and it could have an adverse effect on our business, results of operations or financial condition. If there were an event of default under our loan agreement and we were unable to obtain a waiver or amendment, the lenders could cause all amounts outstanding to be due and payable immediately. Our assets or cash flow may not be sufficient to fully repay our indebtedness if accelerated upon an event of default, and there is no guarantee that we would be able to repay, refinance or restructure the payment obligations.
At or prior to maturity, we will likely seek to refinance this indebtedness. In the event we are required to refinance our credit facility in unfavorable market conditions, we may have to pay interest at higher rates on outstanding borrowings and may be subject to more stringent financial covenants than we are today, which could adversely affect our results of operations. We cannot be certain that we will be able to obtain refinancing on acceptable terms.
22
We no longer have a revolving credit facility to provide us with flexible access to working capital to operate our business, and we cannot be certain of our access to additional capital if needed.
Historically, we have relied upon a revolving credit facility to provide us with adequate working capital to operate our business. In connection with our merger with SMART, we were required to repay the outstanding balance under our revolving credit facility and to terminate that facility. As a result, we no longer have access to that facility as a flexible source of working capital. Although our cash balances have increased as a result of the Merger and the related investment, we may not have sufficient capital to fund our operating needs and/or we may need to secure additional financing to fund our working capital requirements or to repay outstanding debt. We cannot be certain that we will be able to raise additional capital, or that any amount, if raised, will be sufficient to meet our cash requirements. Also, if we are not able to borrow or otherwise raise additional capital when needed, we may be forced to curtail our operations.
Risks relating to our expert and professional services businesses
We are dependent on retaining our experts to keep our existing clients and ongoing and future projects, and our financial results and growth prospects could suffer if we are unable to successfully attract and retain our experts and professional staff.
Many of our clients are attracted to us by their desire to engage individual experts, and the ongoing relationship with our clients is often managed primarily by our individual experts. If an expert terminates his or her relationship with us, it is probable that most of the clients and projects for which that expert is responsible will continue with the expert, and the clients will terminate or significantly reduce their relationship with us. We generally do not have non-competition agreements with any of our experts, unless the expert came to us through an acquisition of a business. Consequently, experts can generally terminate their relationship with us at any time and immediately begin to compete against us. Our top five experts accounted for 12%, 15% and 17% of our revenues in 2009, 2008, and 2007, respectively. If any of these individuals, our other experts terminate their relationship with us or compete against us, it could materially harm our business and financial results.
In addition, if we are unable to attract, develop, and retain highly qualified experts, professional staff and administrative personnel, our ability to adequately manage and staff our existing projects and obtain new projects could be impaired, which would adversely affect our business, our financial results and our prospects for growth. Qualified professionals are in great demand, and we face significant competition for both experts and professional staff with the requisite credentials and experience. Our competition comes from other consulting firms, research firms, governments, universities and other similar enterprises. Many of these competitors may be able to offer greater compensation and benefits or more attractive lifestyle choices, career paths or geographic locations than we do. Increasing competition for these professionals may also significantly increase our labor costs, which could negatively affect our margins and results of operations. The loss of services from, or the failure to recruit, a significant number of experts, professional staff or administrative personnel could harm our business, including our ability to secure and complete new projects.
Our financial results could suffer if we are unable to achieve or maintain high utilization and billing rates for our professional staff.
Our profitability depends to a large extent on the utilization of our professional staff and the billing rates we are able to charge for their services. Utilization of our professional staff is affected by a number of factors, including:
- •
- the number and size of client engagements;
23
- •
- our experts' use of professional staff to perform the projects they obtain from clients and the nature of specific client
engagements, some of which require greater professional staff involvement than others;
- •
- the timing of the commencement, completion and termination of projects, which in many cases is unpredictable;
- •
- our ability to transition our professional staff efficiently from completed projects to new engagements;
- •
- our ability to forecast demand for our services and thereby maintain an appropriate level of professional staff; and
- •
- conditions affecting the industries in which we practice as well as general economic conditions.
The billing rates of our professional staff that we are able to charge are also affected by a number of additional factors, including:
- •
- the quality of our expert and professional services;
- •
- the market demand for the expert services we provide;
- •
- our competition and the pricing policies of our competitors; and
- •
- general economic conditions.
Forecasting demand for our services and managing staffing levels and transitions in the face of the uncertainties in engagement demand is quite difficult, especially during the current U.S. and European economic slow-down. If we are unable to achieve and maintain high utilization as well as maintain or increase the billing rates for our billable professional staff, our financial results could suffer materially.
SMART's Sarbanes-Oxley compliance business may decline.
The demand for SMART's services related to Sarbanes-Oxley or other regulatory compliance has declined over the last year and may decline further. A key component of SMART's business includes services related to Sarbanes-Oxley and other regulatory compliance. There can be no assurance that there will be ongoing demand for these services.
A reversal of or decline in the current trend of businesses utilizing third-party service providers may have a material adverse effect on the acquired SMART business' financial condition and results of operations.
SMART's business and growth depend in part on the trend toward businesses utilizing third-party service providers. This trend may not continue. Current and potential customers may elect to perform such services with their own employees. A significant reversal of, or a decline in, this trend would have a material adverse effect on the financial condition and results of operations of service offerings we acquired from SMART.
Restrictions imposed by state accountancy authority conflict of interest rules may limit our ability to provide services to SMART and Associates, LLP.
Restrictions imposed by state accountancy laws and regulations preclude us from rendering audit and attest services (other than internal audit services). As such, SMART and SMART and Associates, LLP, an affiliate of SMART ("SMART LLP"), have entered into an agreement under which audit and attest services may be provided to SMART's clients by SMART LLP. Under this agreement, SMART pays for all the direct and indirect overhead costs of SMART LLP and in exchange SMART LLP pays SMART a management fee.
24
While state accountancy conflict rules generally only apply to public companies for which SMART LLP does not provide audit or attest services, state accountancy authorities may in the future extend current restrictions on the profession to include private companies. To the extent that SMART LLP is affected by any such change in state conflict of interest rules, we may experience a decline in fee revenue from the management fee which SMART LLP currently pays.
Our client projects may be terminated or initiated suddenly, which may negatively impact our financial results.
Our projects generally center on decisions, disputes, proceedings or transactions in which clients are seeking expert advice and opinions. Our projects can terminate suddenly and without advance notice to us. Our clients may decide at any time to settle their disputes or proceedings, to abandon or defer their transactions or to take other actions that result in the early termination of a project. Our clients are ordinarily under no contractual obligation to continue using our services. If an engagement is terminated unexpectedly, or even upon the planned completion of a project, our professionals working on that engagement may be underutilized until we assign and transition them to other projects. The termination, deferral or significant reduction in the scope of a single large engagement could negatively impact our results of operations in a given reporting period.
Conversely, projects may be initiated or expanded suddenly, and we may not be able to adequately manage the demands placed upon our experts and staff when that occurs. This could result in inefficiencies and additional time spent on engagements by our experts and staff that we may not be able to bill and collect. For example, in 2006 and 2007 we experienced a significant increase in work performed that we considered uncollectible, a part of which was the result of our failure to successfully manage certain engagements. If we are unable to successfully manage the requirements and time spent by experts and staff on engagements, our financial results may be adversely impacted.
Our ability to maintain and attract new business depends upon our reputation, the professional reputation of our experts and the quality of our services on client projects.
Our ability to secure new projects depends heavily upon our reputation and the individual reputations of our experts and professional staff. Any factor that diminishes our reputation or that of our experts and professional staff could make it substantially more difficult for us to attract new projects and clients. Similarly, because we obtain many of our new projects from clients that we have worked with in the past or from referrals by those clients, any client that is dissatisfied with the quality of our work or that of our experts and professional staff could seriously impair our ability to secure additional new projects and clients.
In litigation, we believe that there has been an increase in the frequency of challenges made by opposing parties to the qualifications of experts. In the event a court or other decision-maker determines that an expert is not qualified to serve as an expert witness in a particular matter, then this determination could harm the expert's reputation and ability to act as an expert in other engagements which could in turn harm our business reputation and our ability to obtain new engagements.
We depend on complex damages and competition policy/antitrust practices, which could be adversely affected by changes in the legal, regulatory and economic environment.
Our expert services business is heavily concentrated in the practice areas of complex damages and competition policy/antitrust, including mergers and acquisitions. Projects in our complex damages practice area account for 27%, 23%, and 20% of our billings in 2009, 2008, and 2007, respectively. Projects in our competition policy/antitrust practice area, including mergers and acquisitions, accounted for 17%, 18%, and 18% of our billings in 2009, 2008, and 2007, respectively. Changes in the federal antitrust laws or the federal regulatory environment, or changes in judicial interpretations of these laws could substantially reduce the need for expert consulting services in these areas. This would reduce our
25
revenues and the number of future projects in these practice areas. In addition, adverse changes in general economic conditions, particularly conditions influencing the merger and acquisition activity of larger companies, could also negatively impact the number and scope of our projects in proceedings before the Department of Justice and the Federal Trade Commission.
Intense competition from economic, business and financial consulting firms could hurt our business.
The market for expert consulting and professional advisory services is intensely competitive, highly fragmented and subject to rapid change. Many of our competitors are national and international in scope and have significantly greater personnel, financial, technical and marketing resources. We may be unable to compete successfully with our existing competitors or with any new competitors. There are relatively low barriers to entry, and we have faced and expect to continue to face additional competition from new entrants into the economic, business and financial consulting industries. In the litigation and regulatory expert services markets, we compete primarily with economic, business and financial consulting firms and individual academics. Expert services are also available from a variety of participants in the business consulting market, including general management consulting firms, the consulting practices of major accounting firms, technical and economic advisory firms, regional and specialty consulting firms, small consulting companies and the internal professional resources of companies.
Conflicts of interest could preclude us from accepting projects.
We provide our expert services primarily in connection with significant or complex decisions, disputes and regulatory proceedings that are often adversarial or involve sensitive client information. Our engagement by a given client may preclude us from accepting projects with that client's competitors or adversaries because of conflicts of interest or other business reasons. As we increase the diversity of our service offerings and the size of our operations, the number of conflict situations can be expected to increase. Moreover, in many industries in which we provide services, for example the petroleum and telecommunications industries, there has been a continuing trend toward business consolidations and strategic alliances, the impact of which is to reduce the number of companies that may seek our services and to increase the chances that we will be unable to accept new projects as a result of conflicts of interest. If we are unable to accept new assignments for any reason, our business may not grow and our professional staff may become underutilized, which would adversely affect our revenues and results of operations in future periods.
Our engagements could result in professional liability, which could be very costly and hurt our reputation.
Our projects typically involve complex analysis and the exercise of professional judgment. As a result, we are subject to the risk of professional liability. Many of our projects involve matters that could have a severe impact on a client's business, cause a client to gain or lose significant amounts of money or assist or prevent a client from pursuing desirable business opportunities. If a client questions the quality of our work, the client could threaten or bring a lawsuit to recover damages or contest its obligation to pay our fees. Litigation alleging that we performed negligently or breached any other obligations to a client could expose us to significant liabilities and damage our reputation. We carry professional liability insurance intended to cover many of these types of claims, but the policy limits and the breadth of coverage may be inadequate to cover any particular claim or all claims plus the cost of legal defense. For example, we provide services on engagements in which the amounts in controversy or the impact on a client may substantially exceed the limits of our errors and omissions insurance coverage. If we are found to have professional liability with respect to work performed on such an engagement, we may not have sufficient insurance to cover the entire liability. Defending ourselves in any litigation, regardless of the outcome, is often very costly, could result in distractions to our management and experts and could harm our business and our reputation.
26
Other risks relating to our business
Recent turmoil in the credit markets and in the financial services industry may impact our ability to collect receivables on a timely basis and may negatively impact our cash flow.
Recently, the credit markets and the financial services industry have been experiencing a period of unprecedented turmoil and upheaval. While the ultimate outcome of these events cannot be predicted, they could adversely impact the availability of financing and working capital to our clients and therefore adversely impact our ability to collect amounts due from such clients or cause them to terminate their contracts with us completely.
The implementation of our 2009, 2008 and 2007 restructuring activities, which involved workforce reductions and office closures, may not successfully achieve improved long-term operating results.
In the second and third quarters of 2009, the fourth quarter of 2008, and in 2007 we implemented a number of restructuring actions intended to better align our cost structure with current business levels and market conditions. In connection with the restructuring actions, we incurred charges totaling $5.5 million during the second and third quarter of 2009, $6.4 million during the fourth quarter of 2008 and $10.7 million during 2007, respectively. These charges included one-time termination benefits, write-offs of unearned signing bonuses, lease termination costs and other costs. As a result of these restructuring actions, our fee-generating head count was reduced, and the employment of some experts and professional staff with unique skills was terminated. In the future, other experts and employees may leave our company voluntarily due to the uncertainties associated with our business environment and their job security, and we have experienced and may continue to experience morale issues. In addition, we may lose revenue and miss opportunities to generate revenue and we may not achieve the improved longer-term operating results that we anticipated. Any of these consequences may harm our business and our future results of operations.
Our estimated restructuring accruals may not be adequate.
While our management uses all available information to estimate restructuring charges, particularly facilities costs, our estimated accruals for restructuring related to our 2009 and 2008 activities and the 2007 value recovery plan may prove to be inadequate. If our actual sublease revenues or the results of our exiting negotiations differ from our assumptions, we may have to record additional charges, which could materially affect our results of operations, financial position and cash flow.
Impairment charges could reduce our results of operations.
In accordance with the provisions of Financial Accounting Standards Board ("FASB") Accounting Standard Codification ("ASC") 350, Goodwill and Other Intangible Assets ("ASC 350"), we test goodwill and other intangible assets with indefinite useful lives for impairment on an annual basis or on an interim basis if an event occurs that might reduce the fair value of the reporting unit below its carrying value. We conduct testing for impairment during the fourth quarter of each year using an October 1st measurement date. Various uncertainties, including changes in business trends, deterioration in the political environment, continued adverse conditions in the capital markets or changes in general economic conditions, could impact the expected cash flows to be generated by an intangible asset or group of intangible assets, and may result in an impairment of those assets. For example, we recorded a goodwill impairment charge of $118.8 million and other impairment charges of $5.4 million for the year ended December 31, 2008. Although any such impairment charge would be a non-cash expense, further impairment of our intangible assets could materially increase our expenses and reduce our results of operations.
27
Changes in our effective tax rate may harm our results of operations.
A number of factors may increase our future effective tax rates, including:
- •
- the jurisdictions in which profits are determined to be earned and taxed;
- •
- the resolution of issues arising from tax audits with various tax authorities;
- •
- changes in the valuation of our deferred tax assets and liabilities;
- •
- adjustments to estimated taxes upon finalization of various tax returns;
- •
- increases in expenses not deductible for tax purposes, including impairments of goodwill;
- •
- changes in available tax credits or limitations on our ability to utilize foreign tax credits;
- •
- changes in share-based compensation;
- •
- changes in tax laws or the interpretation of such tax laws, and changes in generally accepted accounting principles; and
- •
- the repatriation of non-U.S. earnings for which we have not previously provided for U.S. taxes.
Any significant change in our future effective tax rates could reduce net income or negatively impact earnings for future periods.
If we are unable to manage the growth of our business successfully, our financial results and business prospects could suffer.
In past years we experienced significant growth in the number of our experts and professional staff. We also expanded our practice areas and opened offices in new locations. On March 10, 2010, we completed the Merger of SMART, which has more than 500 employees in ten offices throughout the United States and Europe. We may not be able to successfully manage a significantly larger and more geographically diverse workforce as we increase the number of our experts and professional staff and expand our practice areas. In 2009, 2008 and 2007 we recognized restructuring charges of $5.7 million, $5.9 million and $10.7 million, respectively, primarily related to the termination of experts and professional staff who were generally direct hires in new practice areas during the past three years. We also closed 11 facilities from 2007 to 2009 and consolidated office spaces in four locations during the third quarter of 2009. From 2006 to 2008, we experienced increased and sometimes unplanned selling, general and administrative costs. In 2009, we recognized acquisition and integration costs of $2.2 million.
In addition, growth increases the demands on our management, our internal systems, procedures and controls. To successfully manage growth and maintain our capability of complying with existing and new regulatory requirements, we must add administrative staff and periodically update and strengthen our operating, financial and other systems, procedures and controls, which will increase our costs and may reduce our profitability. There are certain key personnel that have developed over time a deep institutional knowledge of, and have helped shape and implement our expert compensation models, including developing the financial and operational support systems and contractual agreements necessary to administer their complexities. This institutional knowledge has been an essential element in our ability to respond to the demands imposed by our growth.
In 2006, we reported a material weakness in connection with the calculation of certain complex, non-standard compensation arrangements and business acquisition performance-based agreements. At December 31, 2007, we had remediated that material weakness. However, in connection with our Merger with SMART and the relocation of our headquarters, and as we acquire new businesses in the future, we will need to properly and timely manage the accounting for the acquisition and compensation arrangements, and integrate their financial reporting systems into ours, including our
28
disclosure controls and procedures. We may be unable to successfully implement changes and make improvements to our information and control systems in an efficient or timely manner and we may discover additional deficiencies in our existing systems and controls. Any failure to successfully manage growth, retain key administrative personnel, and maintain adequate internal disclosure controls and procedures or controls over financial reporting, could result in the identification of additional material weaknesses in our controls which could harm our financial results and business prospects.
Additional hiring and acquisitions could disrupt our operations, increase our costs or otherwise harm our business.
A portion of our business strategy is dependent in part upon our ability to grow by hiring individuals or groups of experts and by acquiring other expert services firms. However, we may be unable to identify, hire, acquire or successfully integrate new experts and consulting practices without substantial expense, delay or other operational or financial problems. And, we may be unable to achieve the financial, operational and other benefits we anticipate from any hiring or acquisition. Hiring additional experts or acquiring other expert services firms could also involve a number of additional risks, including:
- •
- the diversion of management's and key senior experts' time, attention and resources, especially since key senior experts
involved in the recruiting and acquisition process also provide consulting services that account for a significant amount of our revenues;
- •
- loss of key acquisition related personnel;
- •
- the incurrence of significant signing and performance bonuses, which could adversely impact our profitability and cash
flow, or result in the later write-off of unearned portions of such bonus, which could adversely impact our profitability;
- •
- additional expenses associated with the amortization, impairment or write-off of acquired intangible assets,
which could adversely impact our profitability;
- •
- potential assumption of debt to acquire businesses;
- •
- potential impairment of existing relationships with our experts, professionals and clients;
- •
- the creation of conflicts of interest that require us to decline engagements that we otherwise could have accepted;
- •
- increased costs to improve, coordinate or integrate managerial, operational, financial and administrative systems;
- •
- increased costs associated with the opening and build-out of new offices, redundant offices in the same city
where consolidation is not immediately possible or office closures where consolidation is possible, which would result in the immediate recognition of expense associated with the abandoned lease;
- •
- dilution to our stockholders as a result of issuing equity securities in connection with hiring new experts or acquiring
other expert services firms; and
- •
- difficulties in integrating diverse corporate cultures.
We are subject to additional risks associated with international operations.
We currently have operations in Argentina, Australia, Belgium, France, Hong Kong, Italy, Mexico, New Zealand, Spain and the United Kingdom. Revenues attributable to activities outside of the United States were 19%, 23%, and 17% in 2009, 2008, and 2007, respectively. Foreign tax laws can be complex and disputes with foreign tax authority can be lengthy and span multiple years. We have been involved in a tax dispute with the Argentine tax authority since 2007 regarding a potential income tax deficiency
29
related to our 2003 and 2004 tax returns and a withholding tax deficiency in connection with our 2005 withholding tax return totaling approximately $3.3 million, which includes potential interest if our position is not ultimately sustained. We paid this amount and filed an appeal with the tax authorities, objecting to their position and requesting a refund. On April 8, 2009, we were notified that the AFIP had terminated the penalty procedures relating to amounts previously paid for the 2003 and 2004 income tax and 2005 withholding tax deficiencies due to the passage of Argentine National Law No. 26.476 (Tax Moratorium). However, we may still be subject to penalties and interest on a potential underpayment of taxes related to the 2005 withholding tax return. Also, based on the results of the completed audit discussed above, we may receive additional notices for assessments of additional income taxes, penalties, and interest related to our 2005 and 2006 income tax returns and withholding taxes, penalties, and interest payments made to the U.S. parent company to settle intercompany balances from June 2005 to December 2007.
We may continue to expand internationally and our international revenues may account for an increasing portion of our revenues in the future. In addition to the tax dispute noted above, our international operations carry special financial and business risks, including:
- •
- greater difficulties in managing and staffing foreign operations;
- •
- less stable political and economic environments;
- •
- cultural differences that adversely affect utilization;
- •
- currency fluctuations that adversely affect our financial position and operating results;
- •
- unexpected changes in regulatory requirements, tariffs and other barriers;
- •
- civil disturbances or other catastrophic events that reduce business activity; and
- •
- greater difficulties in collecting accounts receivable.
The occurrence of any one of these factors could have an adverse effect on our operating results.
Because following the closing of the Merger and the Investment, the Great Hill Entities hold a significant interest in our voting stock, the influence of our other public stockholders over the election of directors and significant corporate actions may be more limited than it would be if there were no stockholder owning such a significant percentage of our outstanding voting stock.
The Great Hill Entities own approximately 40% of our outstanding voting stock and have designated two of the members of our board of directors. Although a Governance Agreement imposes limits on the Great Hill Entities regarding taking specified actions related to the acquisition of additional shares of our capital stock and the removal of directors, the Great Hill Entities will nonetheless still be able to exert significant influence over the outcome of a range of corporate matters, including significant corporate transactions requiring a stockholder vote, such as a merger or a sale of the combined company or its assets. This concentration of ownership and influence in management and board decision-making could also harm the price of our common stock following completion of the Merger by, among other things, discouraging a potential acquirer from seeking to acquire shares of our common stock (whether by making a tender offer or otherwise) or otherwise attempting to obtain control of the combined company.
Sales of our common stock by the Great Hill Entities or issuances of shares of our common stock in connection with future acquisitions or otherwise could cause the price of our common stock to decline.
If the Great Hill Entities sell a substantial number of their shares of our common stock in the future, the market price of our common stock could decline. The perception among investors that these sales may occur could produce the same effect. The Great Hill Entities have rights, subject to specified conditions, to require us to file registration statements covering shares of common stock held by them
30
or to include shares of common stock held by them in registration statements that we may file. By exercising their registration rights and selling a large number of shares of our common stock, the Great Hill Entities could cause the price of our common stock to decline. Furthermore, if we were to include common stock held by the Great Hill Entities in a registration statement we initiate, those additional shares could impair our ability to raise needed capital by depressing the price at which we could sell its common stock.
One component of our business strategy is to make acquisitions. In the event of any future acquisitions, we could issue additional shares of common stock, which would have the effect of diluting existing LECG stockholders' percentage ownership of our common stock and could cause the price of our common stock to decline.
The SMART Merger and the Investment were dilutive to our existing stockholders.
As a result of the Merger and the related investment, we issued approximately 17.2 million new shares of capital stock to Great Hill Equity Partners III, LP, and Great Hill Investors, LLC (together, the "Great Hill Entities"), which represents approximately 40% of the total outstanding voting power of all LECG stockholders following the closing of the Merger and the Investment. The issuance of these shares caused immediate and significant dilution to existing LECG stockholders. An additional approximately 1.1 million new shares of our common stock may also be issued to Great Hill III to satisfy certain indemnification obligations described in the Merger Agreement, and we have agreed to grant the Great Hill Entities pre-emptive rights for certain future new issuances of its capital stock. Further, the holders of the Series A Preferred Stock issued pursuant to the Investment are entitled to receive cumulative dividends at a rate of 7.5% per share per annum subject to potential increase as described in the Merger Agreement, which may be paid in cash or additional shares of our capital stock. The dividends, if paid in stock, will further dilute our current stockholders.
The market price of our common stock after the Merger may be affected by factors different from those affecting the shares of LECG prior to the Merger.
The historic businesses of SMART differ from those of LECG in important respects and, accordingly, the results of operations of the combined company and the market price of our common stock following the Merger may be affected by factors different from those previously affecting the independent results of operations of SMART and LECG.
Our stock price has been and may continue to be volatile.
The price of our common stock has fluctuated widely and may continue to do so, depending upon many factors, including but not limited to the risk factors listed above and the following:
- •
- the limited trading volume of our common stock on the NASDAQ Global Select Market;
- •
- variations in our quarterly results of operations;
- •
- the hiring or departure of key personnel, including experts;
- •
- our ability to maintain high utilization of our professional staff;
- •
- announcements by us or our competitors;
- •
- the loss of significant clients;
- •
- changes in our reputation or the reputations of our experts;
- •
- acquisitions or strategic alliances involving us or our competitors;
- •
- changes in the legal and regulatory environment affecting businesses to which we provide services;
31
- •
- changes in estimates of our performance or recommendations by securities analysts;
- •
- inability to meet quarterly or yearly estimates or targets of our performance; and
- •
- market conditions in the industry and the economy as a whole.
The issuance of preferred stock could discourage or prevent an acquisition of our company, even if the acquisition would be beneficial to our stockholders.
Our board of directors has the authority to issue preferred stock and to determine the preferences, limitations and relative rights of shares of preferred stock and to fix the number of shares constituting any series and the designation of such series, without any further vote or action by our stockholders. The preferred stock could be issued with voting, liquidation, dividend and other rights superior to the rights of our common stock. The potential issuance of preferred stock may make it more difficult for a person to acquire a majority of our outstanding voting stock, and thereby delay or prevent a change in control of us, discourage bids for our common stock over the market price and adversely affect the market price and the relative voting and other rights of the holders of our common stock.
Our charter documents and Delaware law could prevent a takeover that stockholders consider favorable and could also reduce the market price of our stock.
Our amended and restated certificate of incorporation and our bylaws contain provisions that could delay or prevent a change in control of our company. For example, our charter documents prohibit stockholder actions by written consent.
In addition, the provisions of Section 203 of Delaware General Corporate Law govern us. These provisions may prohibit large stockholders, in particular those owning 15% or more of our outstanding voting stock, from merging or combining with us. These and other provisions in our amended and restated certificate of incorporation, our bylaws and under Delaware law could reduce the price that investors might be willing to pay for shares of our common stock in the future and result in the market price being lower than it would be without these provisions.
ITEM 1B. UNRESOLVED STAFF COMMENTS
None.
Our principal executive offices are located in a leased facility in Emeryville, California, consisting of approximately 48,000 square feet of office space, under an eight-year lease that expires in July 2010. This facility accommodates our principal administrative and finance operations. As of December 31, 2009, we also had significant offices in the following cities:
- •
- Washington, D.C.: approximately 56,000 square feet of office space, under a lease that expires in 2011,
- •
- Chicago, Illinois: approximately 28,000 square feet of office space under a lease that expires in 2015,
- •
- Lake Oswego, Oregon: approximately 23,000 square feet of office space under a lease that expires in 2014,
- •
- San Diego, California: approximately 20,000 square feet of office space, under a lease that expires in 2016,
- •
- Century City, California: approximately 26,000 square feet of office space, under a lease that expires in 2010, and
32
- •
- London, United Kingdom, approximately 23,000 square feet of office space under a lease that expires in 2019, with an option to cancel in 2014.
We occupy leased facilities in a total of 21 cities throughout the United States and in 15 cities in other countries, including Argentina, Australia, Belgium, France, Hong Kong, Italy, Mexico, New Zealand, Spain and the United Kingdom. We do not own any real property. We believe that our leased facilities are adequate to meet our current needs and that we will be able to obtain additional leased facilities on commercially reasonable term to meet our future needs.
As a result of the closing the Merger with SMART on March 10, 2010, we gained ten additional office locations, including nine offices in the United States and one international office in London, United Kingdom. As of March 10, 2010, SMART also had significant offices in the following cities:
- •
- Devon, Pennsylvania: approximately 52,000 square feet of office space, under a lease that expires in 2017, and
- •
- Chicago, Illinois: approximately 20,000 square feet of office space under a lease that expires in 2016.
We are party to certain legal proceedings arising out of the ordinary course of business, including proceedings that involve claims of wrongful termination by experts and professional staff who formerly worked for us, and claims for payment of disputed amounts relating to agreements in which we have acquired businesses. The outcomes of these matters are uncertain, and we are not able to estimate the amount or range of amounts that may become payable as a result of a judgment or settlement in such proceedings. However, in the opinion of our management, the outcomes of these matters, individually or in the aggregate, would not have a material adverse effect on our business, financial position, results of operations or cash flows.
ITEM 4. (REMOVED AND RESERVED)
33
ITEM 5. MARKET FOR REGISTRANT'S COMMON EQUITY, RELATED STOCK MATTERS AND ISSUER PURCHASES OF EQUITY SECURITIES
Our Common Stock is traded on the NASDAQ Global Select Market under the symbol of XPRT. The following table sets forth, for the period indicated, the low and high closing prices per share for our Common Stock as reported by the NASDAQ Global Select Market.
| |
Low | High | |||||
|---|---|---|---|---|---|---|---|
For the Year Ended December 31, 2009 |
|||||||
First Quarter |
$ | 1.61 | $ | 7.00 | |||
Second Quarter |
$ | 2.39 | $ | 4.15 | |||
Third Quarter |
$ | 3.00 | $ | 4.22 | |||
Fourth Quarter |
$ | 2.53 | $ | 3.66 | |||
For the Year Ended December 31, 2008 |
|||||||
First Quarter |
$ | 8.13 | $ | 14.62 | |||
Second Quarter |
$ | 8.43 | $ | 10.71 | |||
Third Quarter |
$ | 7.40 | $ | 10.59 | |||
Fourth Quarter |
$ | 4.00 | $ | 7.90 | |||
As of February 26, 2010, there were approximately 87 holders of record of our Common Stock. This number does not include stockholders for whom shares were held in a "nominee" or "street" name. We believe there are approximately 3,100 beneficial owners of our Common Stock.
We currently expect that we will retain our future earnings, if any, for use in the operation and expansion of our business and do not anticipate paying any dividends on our Common Stock in the foreseeable future. Future cash dividends, if any on our Common Stock, will be at the discretion of our board of directors and will depend upon, among other things, our future operations and earnings, capital requirements and surplus, general financial condition, contractual restrictions and other factors the board of directors may deem relevant. Also, our credit facility contains restrictions on our ability to pay cash dividends.
Securities authorized for issuance under equity compensation plans
The information required by this item appears under Item 12. "Security ownership of certain beneficial owners and management and related stockholders matters" included elsewhere in this Annual Report on Form 10-K.
Issuer purchases of equity securities
No purchases of our equity securities were made by or on behalf of LECG during the three months ended December 31, 2009.
Unregistered sales of equity securities
There were no unregistered sales of equity securities completed during the year ended December 31, 2009.
34
Stock performance graph
The following graph compares our cumulative total stockholder return to that of the NASDAQ Composite Index, and that of a peer group of companies consisting of CRA International, Inc., FTI Consulting, Inc., Huron Consulting Group, Inc. and Navigant Consulting, Inc. during the five-year period from December 31, 2004 through December 31, 2009. The comparison assumes that $100 was invested on December 31, 2004. We paid no dividends during the period shown. The performance of the market index and the peer group comparison is shown on a total return, i.e. dividends reinvested basis. The peer group returns are determined based on the returns of each component issuer of the peer group, weighted according to the respective issuer's stock market capitalization at the beginning of the period presented.
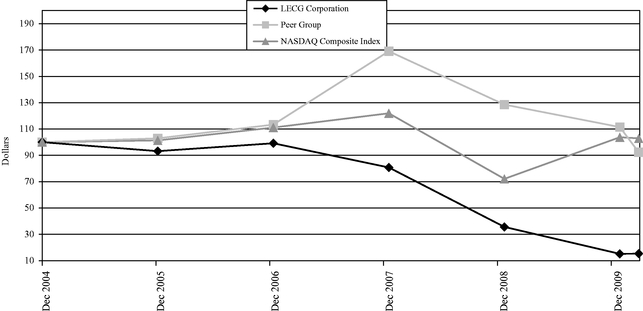
| |
Value of Investments | |||||||||||||||||||||
|---|---|---|---|---|---|---|---|---|---|---|---|---|---|---|---|---|---|---|---|---|---|---|
| |
12/31/2004 | 12/31/2005 | 12/31/2006 | 12/31/2007 | 12/31/2008 | 12/31/2009 | 2/26/2010 | |||||||||||||||
LECG Corporation |
100.00 | 93.19 | 99.09 | 80.75 | 35.98 | 16.03 | 15.28 | |||||||||||||||
Peer Group |
100.00 | 102.93 | 113.25 | 169.07 | 128.92 | 112.04 | 92.34 | |||||||||||||||
NASDAQ Composite Index |
100.00 | 101.37 | 111.03 | 121.92 | 72.49 | 104.31 | 102.89 | |||||||||||||||
35
ITEM 6. SELECTED FINANCIAL DATA
We have derived the following selected consolidated financial data as of and for the years ended December 31, 2009, 2008, 2007, 2006 and 2005 from our audited consolidated financial statements. The selected consolidated financial data reported below includes the financial results of the following businesses as of their acquisition dates, which affects the comparability of the consolidated financial statement information from different periods: Secura (March 2007), Mack Barclay (May 2006), Lancaster (December 2005), Beach (December 2005), Neilson (November 2005), Bates (August 2005), and Cook (March 2005). Please see "Item 7. Management's Discussion and Analysis of Financial Condition and Operations" and the Notes to Consolidated Financial Statements included in this Annual Report on Form 10-K for more information about these acquisitions and their effect on our consolidated financial statements. We completed our Merger with SMART on March 10, 2010, which is a significant transaction that will affect the comparability of our results in future periods to the selected consolidated financial data reported below. The information set forth below is not necessarily indicative of the results of future operations and should be read in conjunction with "Item 7. Management's Discussion and Analysis of Financial Condition and Results of Operations" and the consolidated financial statements and related notes included elsewhere in this Annual Report on Form 10-K.
| |
Year ended December 31, | |||||||||||||||||
|---|---|---|---|---|---|---|---|---|---|---|---|---|---|---|---|---|---|---|
| |
2009 | 2008 | 2007 | 2006 | 2005 | |||||||||||||
| |
(in thousands, except per share data) |
|||||||||||||||||
Fee-based revenues, net |
$ | 253,376 | $ | 322,714 | $ | 351,544 | $ | 326,660 | $ | 264,910 | ||||||||
Reimbursable revenues |
9,820 | 12,965 | 18,885 | 18,625 | 13,163 | |||||||||||||
Revenues |
263,196 | 335,679 | 370,429 | 345,285 | 278,073 | |||||||||||||
Direct costs |
188,319 | 221,476 | 228,069 | 211,619 | 169,136 | |||||||||||||
Reimbursable costs |
10,163 | 13,339 | 18,557 | 18,264 | 13,174 | |||||||||||||
Cost of services |
198,482 | 234,815 | 246,626 | 229,883 | 182,310 | |||||||||||||
Gross profit |
64,714 | 100,864 | 123,803 | 115,402 | 95,763 | |||||||||||||
Operating expenses: |
||||||||||||||||||
General and administrative expenses |
73,258 | 88,021 | 83,901 | 73,165 | 53,817 | |||||||||||||
Depreciation and amortization |
4,997 | 5,939 | 7,284 | 6,793 | 4,306 | |||||||||||||
Goodwill impairment |
— | 118,800 | — | — | 1,063 | |||||||||||||
Other impairments |
10,071 | 5,358 | — | — | — | |||||||||||||
Restructuring charges |
5,659 | 5,937 | 10,689 | — | — | |||||||||||||
Divestiture charges |
1,800 | 3,136 | — | — | — | |||||||||||||
Operating (loss) income |
(31,071 | ) | (126,327 | ) | 21,929 | 35,444 | 36,577 | |||||||||||
Interest income |
160 | 445 | 635 | 861 | 809 | |||||||||||||
Interest expense |
(2,680 | ) | (636 | ) | (508 | ) | (670 | ) | (346 | ) | ||||||||
Other expense, net |
(571 | ) | (1,849 | ) | (502 | ) | (402 | ) | (10 | ) | ||||||||
(Loss) income from continuing operations before income taxes |
(34,162 | ) | (128,367 | ) | 21,554 | 35,233 | 37,030 | |||||||||||
Income tax (benefit) expense |
39,957 | (41,680 | ) | 8,753 | 14,340 | 15,185 | ||||||||||||
(Loss) income from continuing operations |
(74,119 | ) | (86,687 | ) | 12,801 | 20,893 | 21,845 | |||||||||||
Discontinued operations(1): |
||||||||||||||||||
Income from operations of discontinued subsidiary, net of income taxes of $0, $0, $535, $394 and $365 |
— | — | 778 | 574 | 531 | |||||||||||||
Loss on disposal of subsidiary |
— | — | (2,219 | ) | — | — | ||||||||||||
(Loss) income from discontinued operations |
— | — | (1,441 | ) | 574 | 531 | ||||||||||||
Net (loss) income |
$ | (74,119 | ) | $ | (86,687 | ) | $ | 11,360 | $ | 21,467 | $ | 22,376 | ||||||
36
| |
Year ended December 31, | |||||||||||||||||
|---|---|---|---|---|---|---|---|---|---|---|---|---|---|---|---|---|---|---|
| |
2009 | 2008 | 2007 | 2006 | 2005 | |||||||||||||
| |
(in thousands, except per share data) |
|||||||||||||||||
Basic earnings per share: |
||||||||||||||||||
(Loss) income from continuing operations |
$ | (2.90 | ) | $ | (3.42 | ) | $ | 0.51 | $ | 0.86 | $ | 0.94 | ||||||
(Loss) income from discontinued operations |
— | — | (0.06 | ) | 0.02 | 0.02 | ||||||||||||
Basic earnings per share |
$ | (2.90 | ) | $ | (3.42 | ) | $ | 0.45 | $ | 0.88 | $ | 0.96 | ||||||
Diluted earnings per share: |
||||||||||||||||||
(Loss) income from continuing operations |
$ | (2.90 | ) | $ | (3.42 | ) | $ | 0.51 | $ | 0.83 | $ | 0.89 | ||||||
(Loss) income from discontinued operations |
— | — | (0.06 | ) | 0.02 | 0.02 | ||||||||||||
Diluted earnings per share |
$ | (2.90 | ) | $ | (3.42 | ) | $ | 0.45 | $ | 0.85 | $ | 0.91 | ||||||
Shares used in calculating earnings per share |
||||||||||||||||||
Basic |
25,583 | 25,330 | 25,117 | 24,345 | 23,409 | |||||||||||||
Diluted |
25,583 | 25,330 | 25,499 | 25,250 | 24,557 | |||||||||||||
- (1)
- Reflects our SVEWG subsidiary as discontinued operations for 2005 through 2006 as we sold this subsidiary on December 31, 2007.
| |
As of December 31, | |||||||||||||||
|---|---|---|---|---|---|---|---|---|---|---|---|---|---|---|---|---|
Consolidated balance sheet data
|
2009 | 2008 | 2007 | 2006 | 2005 | |||||||||||
| |
(in thousands) |
|||||||||||||||
Cash and cash equivalents |
$ | 13,044 | $ | 19,510 | $ | 21,602 | $ | 26,489 | $ | 35,722 | ||||||
Total assets |
190,811 | 256,207 | 359,319 | 327,153 | 272,885 | |||||||||||
Revolving credit facility |
12,000 | — | — | — | — | |||||||||||
Total stockholder's equity |
98,116 | 168,606 | 253,490 | 231,114 | 195,066 | |||||||||||
37
ITEM 7. MANAGEMENT'S DISCUSSION AND ANALYSIS OF FINANCIAL CONDITION AND RESULTS OF OPERATIONS
The following discussion and other parts of this Annual Report on Form 10-K concerning our future business, operating and financial condition and statements using the terms "believes", "expects", "will", "could", "plans", "anticipates", "estimates", "predicts", "intends", "potential", "continue", "should", "may", or the negative of these terms or similar expressions are "forward-looking" statements as defined in the Private Securities Litigation Reform Act of 1995. These statements are based upon our current expectations as of the date of this Report. There may be events in the future that we are not able to accurately predict or control that may cause actual results to differ materially from expectations. Information contained in these forward-looking statements is inherently uncertain, and actual performance is subject to a number of risks, including but not limited to, (1) our ability to successfully attract, integrate and retain our experts and professional staff, (2) dependence on key personnel, (3) successful management and utilization of professional staff, (4) dependence on growth of our service offerings, (5) our ability to maintain and attract new business, (6) our ability to maintain and comply with the covenants under our new credit facility, (7) the cost and contribution of additional hires and acquisitions, (8) risks relating to the recent closing of our Merger with SMART and our ability to successfully integrate the service offerings, professional staff, facilities and culture of the predecessor organizations, (9) successful administration of our business and financial reporting capabilities including maintaining effective internal control over financial reporting, (10) potential professional liability, (11) intense competition, (12) risks inherent in international operations, and,(13) risks inherent in successfully transitioning and managing our restructured business. Further information on these and other potential risk factors that could affect our financial results may be described from time to time in our periodic filings with the Securities and Exchange Commission and include those set forth in this Report under Item 1A. "Risk Factors." We cannot guarantee any future results, levels of activity, performance or achievement. We undertake no obligation to update any of these forward-looking statements after the date of this Report.
Recent event—Merger with SMART
On March 10, 2010, we completed our merger (which we refer to as the Merger) with SMART Business Holdings, Inc. (SMART), a privately held provider of business advisory services, and we received a $25.0 million cash investment from SMART's majority shareholder, Great Hill Equity Partners III, LP (which we refer to as the investment). In the Merger transaction, we acquired 100% of SMART's outstanding stock, in exchange for which we issued 10,927,869 shares of LECG common stock, and we assumed approximately $42.8 million of SMART debt as of March 10, 2010. Simultaneously with the consummation of the Merger, SMART's majority shareholder, Great Hill Equity Partners III, LP, made a $25.0 million cash investment into LECG in exchange for our issuance to them of 6,313,131 shares of Series A Convertible Redeemable Preferred Stock. This stock is convertible share-for-share into LECG's common stock (equivalent to a price of $3.96 per share), and provides a 7.5% dividend payable in cash or Series A Convertible Redeemable Preferred Stock at our discretion. As a result of the issuance of the common stock and Series A Convertible Redeemable Preferred Stock, Great Hill Equity Partners III, LP owns approximately 40% of our outstanding voting shares.
The Merger is accounted for under the purchase method of accounting. "Note 18—Subsequent event—SMART merger and term loan facility" of the Notes to Consolidated Financial Statements included in this Annual Report on Form 10-K provides information regarding our preliminary estimate of the purchase price allocation.
As a result of our Merger with SMART, we have grown significantly and expanded our areas of practice. We have also significantly increased our cost structure and we have assumed additional debt in the amount of $42.8 million. In conjunction with completing the Merger, we repaid and terminated our prior credit facility, and we became co-borrowers with SMART under a term loan that is further
38
described in "Note 18—Subsequent event—SMART merger and term loan facility" of the Notes to Consolidated Financial Statements included in this Annual Report on Form 10-K.
Certain business developments in 2009
In the second and third quarters of 2009, we executed restructuring actions intended to better align our cost structure with current business and market conditions. These combined actions included a workforce reduction of 133 billable headcount (109 involuntary terminations and 24 voluntary terminations which were not replaced) and 41 administrative staff, as well as adjustments to the compensation structure of 81 billable headcount and 39 administrative staff. These actions also included the divestiture of our Canadian practice and the consolidation of office spaces in four locations. We recognized restructuring charges totaling $5.7 million, consisting of non-cash charges of $1.2 million related to the write-off of draw deficit and unearned signing and performance bonuses, and cash charges of $4.5 million related to one-time termination benefits and lease termination costs. We also recognized a charge of $1.7 million related to the Canadian divestiture and $0.1 million of trailing charges related to the divestiture of a portion of our Milan, Italy practice.
Further financial information regarding our goodwill impairment, other intangible asset impairments, and restructuring, divestiture and other asset impairment charges is included in "Note 4—Goodwill", "Note 5—Other intangible assets" and "Note 14—Restructuring, divestiture and other asset impairment charges", in Notes to Consolidated Financial Statements contained in this Annual Report Form 10-K.
Revenue, operating profit and cash flow drivers
We derive substantially all of our revenues from professional services activities. Our revenue is determined by our ability to secure new business from our existing and new clients, by the prices we obtain for our services, and by the size and the utilization of our expert and professional staff workforce. Our ability to generate new business is determined by developments in the economy as well as by our existing and prospective clients' perceptions of the quality of our work and the professional reputations of our experts.
Our gross profit consists of revenue less costs of services. The primary component of our costs of services is expert and professional staff compensation costs, including salaries, variable compensation arrangements, bonuses, equity compensation costs, and bonus amortization associated with signing, retention, and performance bonuses.
Our operating profit is calculated by subtracting our operating expenses from our gross profit. Our operating expenses include general and administrative expenses comprised of compensation for personnel in executive and operational management, finance and accounting, human resources, information technology and marketing, as well as facility costs, professional services, recruiting, marketing and business development costs. Our operating expenses also include depreciation of property and equipment and amortization of intangible assets. Restructuring charges, consisting of one-time termination benefits, write-offs of unearned bonuses and draw deficit and lease termination costs, reduced our operating profit in 2009, 2008 and 2007. Other impairments and divestiture charges reduced our operating profit in 2009 and 2008. Also, goodwill impairment charge reduced our operating profit in 2008.
Our operating cash flow is driven by our operating profit, our accounts receivable levels, and payments of signing, retention and performance bonuses we make to our experts and professional staff. We have made and will continue to make signing, retention and performance bonus payments. We use our operating cash flow to fund our investing activities, including business acquisitions and any related earn-out payments. We have made and may be required to make future performance-based purchase price payments for acquisitions completed between 2005 and 2007.
39
Billable headcount
The following table summarizes billable headcount by segment as of December 31, 2009 and the two prior years.
| |
|
|
|
Change since December 31, | ||||||||||||||||||
|---|---|---|---|---|---|---|---|---|---|---|---|---|---|---|---|---|---|---|---|---|---|---|
| |
December 31, | 2009 to 2008 | 2008 to 2007 | |||||||||||||||||||
| |
2009 | 2008 | 2007 | Number | % | Number | % | |||||||||||||||
Economics Services |
227 | 287 | 308 | (60 | ) | -21 | % | (21 | ) | -7 | % | |||||||||||
Finance and Accounting Services |
415 | 496 | 521 | (81 | ) | -16 | % | (25 | ) | -5 | % | |||||||||||
Consolidated |
642 | 783 | 829 | (141 | ) | -18 | % | (46 | ) | -6 | % | |||||||||||
The decrease in consolidated billable headcount since December 31, 2008 is primarily due to 133 terminations as a result of our second and third quarter 2009 restructuring actions and 17 terminations as a result of our divestiture activities, including 56 terminations in our Economics segment and 94 terminations in our Finance and Accounting Service segment, and nine hires, net of attrition.
The decrease in consolidated billable headcount since December 31, 2007 to December 31, 2008 is primarily due to 35 terminations in connection with our 2008 restructuring activities, including 11 terminations in our Economics segment and 24 terminations in our Finance and Accounting Service segment, and 11 terminations due to attrition, net of ongoing recruitment efforts.
Signing, retention, and performance bonuses and associated bonus amortization
In connection with our retention and hiring efforts in 2009, 2008, and 2007, we paid signing, retention and performance bonuses of $10.6 million, $17.4 million, and $38.4 million, respectively, which are amortized over periods ranging from one to seven years. Amortization of signing, retention and performance bonuses expense was $17.8 million, $16.5 million, and $12.1 million in 2009, 2008, and 2007, respectively. Future amortization expense for bonuses recognized as of December 31, 2009 is expected to be (in thousands):
2010 |
$ | 14,046 | ||
2011 |
8,179 | |||
2012 |
5,438 | |||
2013 |
4,466 | |||
2014 |
2,006 | |||
Thereafter |
204 | |||
Total |
$ | 34,339 | ||
Acquisitions
Since August 2003, we have acquired 12 businesses. Most of our acquisition agreements required us to make performance-based purchase price payments annually or at other intervals if specified performance targets are achieved during specified measurement periods. These performance-based payments were recorded as additional purchase price and goodwill at the end of each specified measurement period. We have made acquisition-related payments of $5.6 million, $9.7 million, $23.8 million, $22.2 million and $32.1 million in 2009, 2008, 2007, 2006 and 2005, respectively, including the initial purchase price payments, the fair value of our common stock issued, transaction costs, and performance-based purchase price and guaranteed payments. The results of operations of the acquired businesses are included in our operating results from the date of acquisition. Our payments related to prior acquisitions are described in the Contractual Obligations and Commitments section of this Item 7. Management's Discussion and Analysis of Financial Condition and Results of Operations. As of
40
December 31, 2009 we are obligated to make additional payments of $1.1 million in July 2010 and $0.1 million in March 2011.
Gross margin
Revenues
We derive our revenue primarily from professional service fees that are billed at hourly rates on a time and expense basis. Revenue related to these services is recognized when the earnings process is complete and collection is reasonably assured. Revenues are recognized net of amounts estimated to be unrealizable based on several factors, including the historical percentage of write-offs due to fee adjustments for both unbilled and billed receivables.
Fee-based revenues, net are comprised of:
- •
- fees for the services of our professional staff and subcontractors;
- •
- fees for the services of our experts and affiliates; and
- •
- realization allowance.
Reimbursable revenues are comprised of costs that are reimbursable by clients, including travel, document reproduction, subscription data services and other costs, and amounts we charge for services provided by others.
Our revenue results for any given reporting period are impacted principally by our professional staff utilization rate, the number of business days in each period, the number of professional staff available to work, and the number of hours worked by our experts. For example, during the fourth quarter of each year, vacations taken by our clients can result in the deferral of activity on existing and new engagements, which could negatively impact our utilization rate. The number of hours worked by our experts and staff is affected by the number of vacation days taken by them as well as the number of holidays in each quarter. Also, we typically have fewer business days available in the fourth quarter of each year, which can reduce revenues in that period.
Cost of services
Direct costs are comprised of:
- •
- salary, bonuses, employer taxes and benefits of all professional staff and salaried experts;
- •
- compensation to experts based on a percentage of their individual professional fees;
- •
- compensation to experts based on specified revenue and gross margin performance targets;
- •
- compensation to subcontractors and affiliates;
- •
- fees earned by experts and other business generators as project origination fees;
- •
- amortization of signing, retention and performance bonuses that are subject to vesting over time; and
- •
- equity-based compensation.
Reimbursable costs are costs that are reimbursable by clients, including travel, document reproduction, subscription data services, and costs incurred for services provided by others.
Hourly fees charged by the professional staff that support our experts, rather than the hourly fees charged by our experts, generate a majority of our gross profit. Most of our experts are compensated based on a percentage of their billings from 30% to 100%, and averaging approximately 72%, 71% and 70% of their individual billings on particular projects in 2009, 2008 and 2007, respectively. Such experts
41
are paid when we have received payment from our clients. We refer to these experts as at-risk experts. Some of our experts are compensated based on a percentage of performance targets such as revenue or gross margin associated with engagements generated by an expert or a group of experts. Experts not on either of these compensation models are compensated under a salary plus performance-based bonus model. We make advance payments, or draws, to many of our non-salaried experts, and any outstanding draws previously paid to experts are deducted from the experts' fee payments. We recognize an estimate of compensation expense for expert advances that we consider may ultimately be unrecoverable. In some cases, we guarantee an expert's draw at the inception of their employment for a period of time, which is typically one year or less. In such cases, if the expert's earnings do not exceed their draws within a reasonable period of time prior to the end of the guarantee period, we recognize an estimate of the compensation expense we will ultimately incur by the end of the guarantee period.
Because of the manner in which we pay our experts, our gross profit is significantly dependent on the margin on our professional staff services. The number of professional staff and the level of experience of professional staff assigned to a project will vary depending on the size, nature and duration of each engagement. We manage our personnel costs by monitoring engagement requirements and utilization of the professional staff. As an inducement to encourage experts to utilize our professional staff, experts generally receive project origination fees. Such fees are based primarily on a percentage of the collected professional staff fees. Project origination fees can also include a percentage of the collected expert fees for those experts acting in a support role on an engagement. These fees have averaged 10%, 12% and 11% of professional staff revenues in 2009, 2008, and 2007, respectively. Experts are generally required to use our professional staff unless the skills required to perform the work are not available through us. In these instances we engage outside individual or firm-based consultants, who are typically compensated on an hourly basis. Both the revenue and the cost resulting from the services provided by these outside consultants are recognized in the period in which the services are performed.
Hiring and/or retaining experts sometimes involves the payment of upfront cash amounts. In some cases, the payment of a portion of an upfront amount is due at a future date. These types of upfront payments are recognized when the payment is made, the obligation to pay such amount is incurred, or on the execution date of the retention agreement, and are generally amortized over the period for which they are recoverable from the individual expert up to a maximum period of seven years.
We have also paid or are obligated to pay certain performance bonuses that are subject to recovery of unearned amounts if the expert were to voluntarily leave us, be terminated for cause, or fail to meet certain performance criteria prior to a specified date. Like signing and retention bonuses, these performance bonuses are amortized over the period for which unearned amounts are recoverable from the individual expert up to a maximum period of seven years, and we recognize such performance bonuses at the time we determine it to be more likely than not that the performance criteria will be met.
Most of our agreements allow us to recover signing, retention and performance bonuses from the employee if he or she were to voluntarily leave us or be terminated for cause prior to a specified date. However, for the purpose of recognizing expense, we amortize such signing, retention and performance bonuses over the shorter of the contractual recovery period or seven years. If an employee is involuntarily terminated, we generally cannot recover the unearned amount and we write off the unearned amount at the time of termination.
CRITICAL ACCOUNTING POLICIES
Revenue recognition
Revenue includes all amounts earned that are billed or billable to clients, including reimbursable expenses, and are reduced for amounts related to work performed that are estimated to be
42
unrealizable. Expert revenues consist of revenues generated by experts who are our employees as well as revenues generated by experts who are independent contractors. There is no operating, business or other substantive distinction between our employee experts and our exclusive independent contractor experts.
Revenues primarily arise from time and expense contracts, which are recognized in the period in which the services are performed. We also enter into certain performance-based contracts for which performance fees are dependent upon a successful outcome, as defined by the consulting engagement. Revenues related to performance-based fee contracts are recognized in the period when the earnings process is complete and we have received payment for the services performed under the contract. Revenues are also generated from fixed price contracts, which are recognized as the agreed upon services are performed. Fixed price and performance-based contracts revenues are not a material component of total revenues.
We recognize revenue net of an estimate for amounts that will not be collected from the client due to fee adjustments. This estimate is based on several factors, including our historical percentage of fee adjustments and review of unbilled and billed receivables. These estimates are reviewed by management on a quarterly basis.
Accounts receivable, reserves for unrealizable revenue and allowance for bad debts
Accounts receivable consist of unbilled and billed amounts due from clients, which are recognized net of reserves for unrealizable revenue and allowances for bad debts. We maintain reserves for unrealizable revenue and allowance for bad debts based on several factors, including the length of time receivables are past due, economic trends and conditions affecting our clients base, specific knowledge of a client's inability to meet its financial obligations, significant one-time events and historical write-off experience. We review the adequacy of our reserves on a quarterly basis. These estimates may be significantly different from actual results. If the financial condition of a client deteriorates in the future, impacting the client's ability to make payments, an increase to our allowance might be required or our allowance may not be sufficient to cover actual write-offs.
Equity-based compensation
We account for equity based compensation under the provisions of FASB ASC 718, Compensation—Stock Compensation ("ASC 718"). ASC 718 requires the recognition of the fair value of equity-based compensation in operations. The fair value of our stock option awards are estimated using a Black-Scholes option valuation model. This model requires the input of highly subjective assumptions and elections including expected stock price volatility and the estimated life of each award. In addition, the calculation of equity-based compensation costs requires that we estimate the number of awards that will be forfeited during the vesting period. Our forfeiture rate is based upon historical experience as well as anticipated employee turnover considering certain qualitative factors. The fair value of equity-based awards is amortized over the vesting period of the award and we elected to use the straight-line method for awards granted after the adoption of ASC 718.
Income taxes
We account for income taxes in accordance with FASB ASC 740, Income Taxes ("ASC 740"). The objectives of accounting for income taxes are to recognize the amount of taxes payable or refundable for the current year and deferred tax liabilities and assets for the future tax consequences of events that have been recognized in an entity's consolidated financial statements or tax returns. We must assess the likelihood that we will be able to recover our deferred tax assets. If recovery is not likely, we must increase our provision for taxes by recording a valuation allowance against the deferred tax assets that we estimate will not ultimately be recoverable. Judgment is required in assessing the future tax
43
consequences of events that have been recognized in our consolidated financial statements or tax returns. Variations in the actual outcome of these future tax consequences could materially impact our financial position, results of operations or cash flows.
We account for uncertainty in income taxes recognized in our financial statements using a two-step approach. The first step is to evaluate the tax position for recognition by determining if the weight of available evidence indicates it is "more likely than not" that the position will be sustained on audit, including resolution of related appeals or litigation processes, if any. The second step is to measure the tax benefit as the largest amount which is more than 50% likely to be realized upon ultimate settlement. We assessed that it had an unrecognized tax benefit of $3.8 million as of December 31.
Our deferred tax assets are generally projected to reverse over the next one to thirty-three years. The extended reversal period is the result of significant income tax basis in intangible assets which were impaired for financial statement purposes during 2008. Tax amortization from these assets, if not offset with current taxable income, would create a net operating loss with a 20-year carryforward period for federal tax purposes. At December 31, 2009, we reviewed our net deferred tax assets, as well as future projected taxable income, for recovery using the "more likely than not" approach by assessing the available evidence surrounding recoverability. We considered all available evidence, both positive and negative, including forecasts of future taxable income, tax planning strategies and past operating results which includes a net loss for 2009 and 2008. Even though we project income in future years, based upon past losses, the current economic environment, and the difficulty of accurately projecting taxable income, we determined that it was "more likely than not" that our net deferred tax assets may not be realized. Consequently, a full valuation allowance of $55.6 million has been recorded at December 31, 2009, against our net deferred tax assets. In future years, if we begin to generate taxable income and our management determines that the net deferred tax asset is recoverable, the valuation allowance will be reversed. Any such reversal will result in a tax benefit in the period of reversal.
Goodwill and other intangible assets
Goodwill relates to our business acquisitions, reflecting the excess of purchase price over fair value of identifiable net assets acquired. ASC 350 requires that goodwill and intangible assets with indefinite lives not be amortized, but rather tested for impairment at least annually, or whenever events or changes in circumstances indicate the carrying amounts of these assets may not be recoverable. Our annual impairment test is performed during the fourth quarter of each year using an October 1st measurement date.
Factors that we consider important in determining whether to perform an impairment review on a date other than October 1st, include significant underperformance relative to forecasted operating results, significant negative industry or economic trends, and permanent declines in our stock price and related market capitalization. If we determine that the carrying value of goodwill may not be recoverable, we will assess impairment based on a projection of discounted future cash flows for each reporting unit, or some other fair value measurement such as the quoted market price of our stock and the resulting market capitalization, and then measure the amount of impairment, if necessary, based on the difference between the carrying value of our reporting units assigned goodwill and its implied fair value. Determining the fair value of our reporting units and the implied fair value of a reporting units' assigned goodwill requires the use of estimates and assumptions and significant management judgments all of which could materially effect our determination and measurement of impairment. As a result of our 2008 annual impairment test, we recognized a goodwill impairment charge of $118.8 million in the fourth quarter of 2008. In the second quarter of 2009, we recorded an additional $1.8 million of goodwill related to a contingent business acquisition payment. As of October 1, 2009, we concluded that there was no impairment to our $1.8 million goodwill asset based on our 2009 annual test.
44
Other intangible assets that are separable from goodwill and have determinable useful lives are valued separately and amortized over their expected useful lives. Other intangible assets consist principally of customer relationships, contract rights, non-compete agreements and trade processes and are generally amortized over six months to 20 years. We evaluate the recoverability of our other intangible assets over their remaining useful life when changes in events or circumstances warrant an impairment review. If the carrying value of an intangible asset is determined to be impaired and unrecoverable over its originally estimated useful life, we will record an impairment charge to reduce the asset's carrying value to its fair value and then amortize the remaining value prospectively over the revised remaining useful life. We generally determine the fair value of our intangible asset using a discounted cash flow model as quoted market prices for these types of assets is not readily available. Due to changes in events and circumstances in the fourth quarter of 2008, we performed an impairment test and determined that certain amounts related to our intangible assets were not recoverable. As a result, we recorded a $4.5 million impairment charge related to the net carrying value of our customer relationship and trade name intangible assets.
Recently issued accounting standards
See "Note 2—Summary of significant accounting policies" in Notes to Consolidated Financial Statements contained in this Form 10-K, regarding the impact of certain recent accounting pronouncements on our consolidated financial statements.
RESULTS OF OPERATIONS
As previously discussed in the Business section of this Form 10-K, our historical practice groups and individual experts were reorganized into two operating segments during the second quarter of 2008. These two segments are referred to as Economics Services and Finance and Accounting Services. The Chief Operating Decision Maker considers the key profit/loss measurement of the two segments to be gross profit and gross margin. As such, only revenue, costs of services and gross margin are presented and discussed at the segment level. Historical segment revenue, costs of services and other operational data have been recast as if the current management and reporting structure had been in place since the beginning of each period presented. Since we have historically measured our business performance at a consolidated entity level and made resource allocation decisions differently under that structure, the recasting of historical segment information throughout this Management's Discussion and Analysis is not intended to represent the actual results that would have been achieved if our business had been managed under the new structure since the beginning of each period presented, or intended to predict future results.
45
Years Ended December 31, 2009, 2008 and 2007
The following table sets forth the amounts and the percentage of revenues represented by the line items in our Consolidated Statement of Operations for the years ended December 31, 2009, 2008 and 2007, respectively. Our Consolidated Statements of Operations include the financial results of the Secura business which we acquired in March 2007.
| |
Year ended December 31, | |||||||||||
|---|---|---|---|---|---|---|---|---|---|---|---|---|
| |
2009 | 2008 | 2007 | |||||||||
| |
($ in thousands) |
|||||||||||
Fee-based revenues, net |
96.3 | % | 96.1 | % | 94.9 | % | ||||||
Reimbursable revenues |
3.7 | % | 3.9 | % | 5.1 | % | ||||||
Revenues |
100.0 | % | 100.0 | % | 100.0 | % | ||||||
Direct costs |
71.6 | % | 66.0 | % | 61.6 | % | ||||||
Reimbursable costs |
3.9 | % | 4.0 | % | 5.0 | % | ||||||
Cost of services |
75.5 | % | 70.0 | % | 66.6 | % | ||||||
Gross profit |
24.5 | % | 30.0 | % | 33.4 | % | ||||||
Operating expenses: |
||||||||||||
General and administrative expenses |
27.8 | % | 26.2 | % | 22.6 | % | ||||||
Depreciation and amortization |
1.9 | % | 1.8 | % | 2.0 | % | ||||||
Goodwill impairment |
0.0 | % | 35.4 | % | 0.0 | % | ||||||
Other impairments |
3.8 | % | 1.6 | % | 0.0 | % | ||||||
Restructuring charges |
2.2 | % | 1.8 | % | 2.9 | % | ||||||
Divestiture charges |
0.7 | % | 0.9 | % | 0.0 | % | ||||||
Operating (loss) income |
-11.9 | % | -37.7 | % | 5.9 | % | ||||||
Interest income |
0.1 | % | 0.1 | % | 0.2 | % | ||||||
Interest expense |
-1.0 | % | -0.2 | % | -0.1 | % | ||||||
Other expense, net |
-0.2 | % | -0.6 | % | -0.1 | % | ||||||
(Loss) income from continuing operations before income taxes |
-13.0 | % | -38.4 | % | 5.9 | % | ||||||
Income tax (benefit) expense |
15.2 | % | -12.4 | % | 2.4 | % | ||||||
(Loss) income from continuing operations |
-28.2 | % | -26.0 | % | 3.5 | % | ||||||
Discontinued operations: |
||||||||||||
Income from operations of discontinued subsidiary, net of income taxes |
0.0 | % | 0.0 | % | 0.2 | % | ||||||
Loss on disposal of subsidiary |
0.0 | % | 0.0 | % | -0.6 | % | ||||||
(Loss) income from discontinued operations |
0.0 | % | 0.0 | % | -0.4 | % | ||||||
Net (loss) income |
-28.2 | % | -26.0 | % | 3.1 | % | ||||||
46
Revenues and cost of services
The following table sets forth our consolidated revenues, cost of services, gross profit and gross margin and certain operating metrics for the years ended December 31, 2009, 2008 and 2007.
| |
Year ended December 31, | |
|
|
|
||||||||||||||||||
|---|---|---|---|---|---|---|---|---|---|---|---|---|---|---|---|---|---|---|---|---|---|---|---|
| |
2009 | 2008 | 2007 | Change 2009 - 2008 | Change 2008 - 2007 | ||||||||||||||||||
| |
($ in thousands, except rate amounts) |
||||||||||||||||||||||
Fee-based revenues, net |
$ | 253,376 | $ | 322,714 | $ | 351,544 | $ | (69,338 | ) | -21.5 | % | $ | (28,830 | ) | -8.2 | % | |||||||
Reimbursable revenues |
9,820 | 12,965 | 18,885 | (3,145 | ) | -24.3 | % | (5,920 | ) | -31.3 | % | ||||||||||||
Revenues |
263,196 | 335,679 | 370,429 | (72,483 | ) | -21.6 | % | (34,750 | ) | -9.4 | % | ||||||||||||
Direct costs |
188,319 | 221,476 | 228,069 | (33,157 | ) | -15.0 | % | (6,593 | ) | -2.9 | % | ||||||||||||
Reimbursable costs |
10,163 | 13,339 | 18,557 | (3,176 | ) | -23.8 | % | (5,218 | ) | -28.1 | % | ||||||||||||
Cost of services |
198,482 | 234,815 | 246,626 | (36,333 | ) | -15.5 | % | (11,811 | ) | -4.8 | % | ||||||||||||
Gross profit |
$ | 64,714 | $ | 100,864 | $ | 123,803 | $ | (36,150 | ) | -35.8 | % | $ | (22,939 | ) | -18.5 | % | |||||||
Gross margin |
24.6 | % | 30.0 | % | 33.4 | % | -5.4 | % | -3.4 | % | |||||||||||||
Billable headcount, period average |
711 |
789 |
909 |
(78 |
) |
-9.9 |
% |
(120 |
) |
-13.2 |
% |
||||||||||||
Average billable rate |
$ | 313 | $ | 335 | $ | 308 | $ | (22 | ) | -6.6 | % | $ | 27 | 8.8 | % | ||||||||
Jr./Sr. staff paid utilization rate |
68.4 | % | 71.4 | % | 71.4 | % | -3.0 | % | 0.0 | % | |||||||||||||
Estimate of unrealizable revenue |
11,970 |
13,856 |
16,241 |
(1,886 |
) |
-13.6 |
% |
(2,385 |
) |
-14.7 |
% |
||||||||||||
% of gross fee-based revenue |
4.5 | % | 4.1 | % | 4.4 | % | 0.4 | % | -0.3 | % | |||||||||||||
Revenues
Our revenues have been negatively impacted over the last year and a half by the global economic downturn, as demand for our services has been stagnated by the significant uncertainties of the current business environment. We have executed a series of restructuring and divestiture actions in order to rationalize our costs with the current business environment. These actions have included significant reductions in billable headcount, which has translated into lower revenues.
The 21.5% decrease in fee-based revenues, net for 2009 compared to 2008 was primarily the result of a 9.9% decrease in average billable headcount and a 6.6% decrease in the average billable rate. Average billable headcount decreased by 78 from 2008 to 2009 due primarily to the terminations in connection with our 2009 restructuring activities and voluntary attrition. The decrease in the average billable rate was caused primarily by decreases of 17% and 5% in the average exchange rates for British pound sterling and the Eurodollar, respectively. Also contributing to the decrease was a shift in our revenue mix from high rate billable headcount to lower rate billable headcount.
The 8.2% decrease in fee-based revenues, net for 2008 compared to 2007 was primarily the result of a 13.2% decrease in average billable headcount, partially offset by an 8.8% increase in the average billable rate. Average billable headcount decreased by 120 from 2007 to 2008 due primarily to the timing of terminations in connection with our 2007 value recovery plan and voluntary attrition. The increase in the average billable rate was due primarily to billing rate increases at the beginning of 2008 and changes in the mix of billable hours to higher bill-rate experts.
The $1.9 million decrease in our estimate of unrealizable revenue for 2009 compared to 2008 was due to a 21.2% decrease in gross fee-based revenue partially offset by an increase in our historical trailing 12 months write offs. The $2.4 million decrease in our estimate of unrealizable revenue for 2008 compared to 2007 was due to an 8.5% decrease in gross fee-based revenue, as well as a decrease in our historical trailing 12 month write-offs, which is the basis of our estimate.
47
Reimbursable revenues for 2009 and 2008 decreased primarily due to lower travel-related out-of-pocket expenses for matters worked on during 2009 compared to 2008, and during 2008 compared to 2007.
Revenues from our international operations were $49.9 million in 2009, which represents 19% of total revenue as compared to 23% of total revenue in 2008. In 2009 our international operations revenue decreased by $25.6 million, or 34% as compared to 2008. The decrease was primarily due to a decrease in business activity in our London office and other European subsidiaries year over year, the divestiture of a portion of our practice in Milan, Italy effective December 31, 2008, the divestiture of our Canadian practice in the second quarter of 2009, and the decrease in average exchange rates. There was an increase in business activity in Asia Pacific which accounted for $2.4 million of the increase year over year, partly due to our expansion into Hong Kong during the fourth quarter of 2008.
Revenues from our international operations were $75.6 million in 2008, which represents 23% of total revenue as compared to 17% of total revenue in 2007. In 2008 our international operations revenue increased by $12.1 million, or 19% as compared to 2007, primarily due to increased business activity in Europe and Asia-Pacific (where we expanded our operations into Australia) and which accounted for increases of $7.2 million and $2.8 million, respectively.
Cost of services
The decrease in direct costs for 2009 compared to 2008 resulted from reductions in billable headcount of 10% in connection with our 2008 and 2009 restructuring activities and through voluntary attrition and lower revenues generated by our at-risk experts. Decreased salary costs for professional staff and decreased compensation earned by at-risk and gross margin model experts due to lower revenues were partially offset by increased salary and related costs for newly hired experts on the salary/bonus compensation model. Also offsetting the decrease in direct costs for 2009 compared to 2008 was an increase in signing, retention and performance bonus amortization of $0.7 million due to capitalization of bonuses totaling $10.6 million and the resulting additional amortization since 2008. The increased amortization resulting from new signing, retention and performance bonuses was partially offset by decreased amortization related to the write-off of approximately $9.2 million of unearned signing and performance bonuses in connection with our 2008 and 2009 restructuring and impairment charges.
Expert and professional staff costs decreased by $11.7 million, or 5.5%, from 2007 to 2008. Decreased salary costs for professional staff was the result of headcount reductions in connection with our 2007 restructuring activities. Decreased compensation earned by at-risk experts was the result of both headcount reductions as well as lower revenues as these experts are paid a percentage of their own billings plus a percentage of professional staff billings on cases they originate. Decreased compensation for experts on the gross margin model was due primarily to headcount reductions in 2007 and lower revenue. Compensation costs for salary/bonus model experts increased from 2007 to 2008 as the result of a full year of salary costs for experts hired in connection with the Secura acquisition in March 2007, as well as expert hires made in the third and fourth quarters of 2008. Offsetting the decrease in expert and professional staff costs was an increase in signing, retention and performance bonus amortization of $4.2 million to $16.2 million in 2008 from $12.0 million in 2007 which was due to the capitalization of new bonuses since November 2007 and the resulting additional amortization, including $9.9 million of bonuses recognized in 2008 as well as $19.8 million of retention bonuses recognized in November 2007 for two key experts. The increased amortization resulting from new signing, retention and performance bonuses was partially offset by decreased amortization related to the write-off of approximately $6.0 million of unearned signing and performance bonuses in connection with our 2007 and 2008 restructuring activities. Equity-based compensation increased to $4.0 million in 2008 from $3.1 million in 2007 as we granted approximately 1.2 million restricted stock units and/or shares to certain experts in May 2008.
48
Reimbursable costs for 2009 and 2008 decreased primarily due to lower travel-related out-of-pocket expenses for matters worked on during 2009 compared to 2008, and during 2008 compared to 2007.
Gross margin
The 5.4% decrease in our gross margin to 24.6% in 2009 from 30.0% in 2008 was primarily due to a 21.5% decrease in fee-based revenues, net, without a proportionate decrease in our direct costs. The decrease in direct costs included a $33.9 million decrease in expert and professional staff compensation, partially offset by a $0.7 million increase in signing, performance and retention bonus amortization. Generally reimbursable revenue is a pass through cost to our clients and we typically do not generate profit from this activity. However, gross margin related to reimbursable revenues and costs is negative for 2009 primarily due to our inability to pass certain research and data retrieval costs to our clients and to a lesser extent, due to the delayed timing of when these types of costs are incurred and then ultimately used in client related work.
The 3.4% decrease in our gross margin to 30.0% in 2008 from 33.4% in 2007 was primarily due to an 8.2% decrease in fee-based revenues, net, partially offset by a 2.9% decrease in direct costs. The decrease in direct costs included an $11.7 million decrease in expert and professional staff compensation offset by a $5.1 million increase in signing, performance and retention bonus amortization and equity-based compensation. Generally reimbursable revenue is a pass through cost to our clients and we typically do not generate profit from this activity. However, gross margin related to reimbursable revenues and costs is negative for 2008 primarily due to our inability to pass certain research and data retrieval costs to our clients and to a lesser extent, due to the delayed timing of when these types of costs are incurred and then ultimately used in client related work.
Segment results
Economics Services
The following table sets forth the revenues, cost of services, gross profit and gross margins, and certain operating metrics for our Economic Services segment for the years ended December 31, 2009, 2008 and 2007.
| |
Year ended December 31, | |
|
|
|
||||||||||||||||||
|---|---|---|---|---|---|---|---|---|---|---|---|---|---|---|---|---|---|---|---|---|---|---|---|
| |
2009 | 2008 | 2007 | Change 2009 - 2008 | Change 2008 - 2007 | ||||||||||||||||||
| |
($ in thousands, except rate amounts) |
||||||||||||||||||||||
Fee-based revenues, net |
$ | 106,186 | $ | 142,295 | $ | 151,926 | $ | (36,109 | ) | -25.4 | % | $ | (9,631 | ) | -6.3 | % | |||||||
Reimbursable revenues |
3,223 | 4,490 | 5,985 | (1,267 | ) | -28.2 | % | (1,495 | ) | -25.0 | % | ||||||||||||
Revenues |
109,409 | 146,785 | 157,911 | (37,376 | ) | -25.5 | % | (11,126 | ) | -7.0 | % | ||||||||||||
Direct costs |
75,945 | 95,546 | 101,914 | (19,601 | ) | -20.5 | % | (6,368 | ) | -6.2 | % | ||||||||||||
Reimbursable costs |
3,390 | 4,970 | 5,853 | (1,580 | ) | -31.8 | % | (883 | ) | -15.1 | % | ||||||||||||
Cost of services |
79,335 | 100,516 | 107,767 | (21,181 | ) | -21.1 | % | (7,251 | ) | -6.7 | % | ||||||||||||
Gross profit |
$ | 30,074 | $ | 46,269 | $ | 50,144 | $ | (16,195 | ) | -35.0 | % | $ | (3,875 | ) | -7.7 | % | |||||||
Gross margin |
27.5 | % | 31.5 | % | 31.8 | % | -4.0 | % | -0.3 | % | |||||||||||||
Billable headcount, period average |
253 |
299 |
314 |
(46 |
) |
-15.4 |
% |
(15 |
) |
-4.8 |
% |
||||||||||||
Average billable rate |
$ | 355 | $ | 364 | $ | 337 | $ | (9 | ) | -2.5 | % | $ | 27 | 8.0 | % | ||||||||
Jr./Sr. staff paid utilization rate |
67.1 | % | 73.6 | % | 75.6 | % | -6.5 | % | -2.0 | % | |||||||||||||
Estimate of unrealizable revenue |
3,788 |
5,849 |
6,428 |
(2,061 |
) |
-35.2 |
% |
(579 |
) |
-9.0 |
% |
||||||||||||
% of gross fee-based revenue |
3.4 | % | 3.9 | % | 4.1 | % | -0.5 | % | -0.2 | % | |||||||||||||
49
Revenues
Fee-based revenues decreases in 2009 compared to 2008 primarily in our global competition practice and to a lesser extent our regulate industries, securities and labor practices. Fee-based revenues decreased in 2008 compared to 2007 in our global competition, regulated industries and labor areas. All of the Economic Services practice areas have been negatively impacted since the fourth quarter of 2008 by the global economic slowdown.
The decrease in fee-based revenues, net for 2009 compared to 2008 was primarily the result of a 15.4% decrease in the average billable headcount and a 6.5% decrease in professional staff utilization and 2.5% decrease in the average billable rate. Average billable headcount decreased by 46 for 2009 compared to 2008 primarily due to our 2008 and 2009 restructuring activities and voluntary attrition. The decrease in the average billable rate was caused by a shift to lower billing rate experts, and to a lesser extent, decreases of 17% and 5% in the average exchange rates for British pound sterling and the Eurodollar, respectively.
The decrease in fee-based revenues, net for 2008 compared to 2007 was primarily the result of a 4.8% decrease in the average billable headcount and a 2.0% decrease in professional staff utilization, partially offset by an 8.0% increase in the average billable rate. Average billable headcount decreased by 15 for 2008 compared to 2007 due primarily to terminations in connection with our 2007 value recovery plan.
The $2.1 million decrease in our estimate of unrealizable revenue for 2009 compared to 2008 was due to a 25.8% decrease in gross fee-based revenue and a decrease in our historical trailing 12 months write offs, which is the basis of our estimate. The $0.6 million decrease in our estimate of unrealizable revenue for 2008 compared to 2007 was primarily due to a decrease in our historical trailing 12 months write-offs and a decrease in our gross fee-based revenue.
Reimbursable revenues for 2009 and 2008 decreased primarily due to lower travel-related out-of-pocket expenses for matters worked on during 2009 compared to 2008, and during 2008 compared to 2007.
Cost of services
The decrease in direct costs in 2009 compared to 2008 was primarily due to a $20.0 million decrease in expert and professional staff compensation slightly offset by a $0.4 million increase in non-cash compensation. The $20.0 million decrease in expert and professional staff compensation was primarily due to decreased salary costs related to the terminations resulting from our 2008 and 2009 restructuring activities, as well as decreased compensations earned by at-risk experts due to lower revenue. The $0.6 million increase in non-cash bonus amortization is primarily due to the payment of additional retention bonuses to certain experts since 2008, partially offset by amortization decreases due to the write-off of unearned bonuses for terminated professionals. Equity-based compensation decreased by $0.2 million.
The decrease in direct costs in 2008 compared to 2007 was driven by a $9.1 million decrease in expert and professional staff compensation, partially offset by a $2.7 million increase in non-cash compensation. The decrease in expert and professional staff compensation was primarily driven by lower billable headcount as a result of our 2007 value recovery plan actions, and lower compensation earned by at-risk experts due to the overall decline in revenue. The $2.8 million increase in signing, retention and performance bonus amortization was primarily due to the capitalization of signing, retention and performance bonuses paid since November 2007, including a $10.0 million retention bonus paid to a key expert, and the resulting additional amortization. Equity-based compensation decreased by $0.1 million.
50
Reimbursable costs for 2009 and 2008 decreased primarily due to lower travel-related out-of-pocket expenses for matters worked on during 2009 compared to 2008, and during 2008 compared to 2007.
Gross margin
The 4.0% decrease in our gross margin to 27.5% in 2009 from 31.5% in 2008 was primarily due to a 25.4% decrease in fee-based revenues, net with a 20.5% decrease in direct costs. The decrease in direct costs included a $20.0 million decrease in expert and professional staff compensation, slightly offset by a $0.4 million increase in non-cash compensation. Generally reimbursable revenue is a pass through cost to our clients and we typically do not generate profit from this activity. However, gross margin related to reimbursable revenues and costs is negative for 2009 primarily due to our inability to pass certain research and data retrieval costs to our clients and to a lesser extent, delayed timing of when these types of costs are incurred and then ultimately used in client related work.
The 0.3% decrease in our gross margin to 31.5% in 2008 from 31.8% in 2007 was primarily due to a 6.3% decrease in fee-based revenues, net partially offset by a 6.2% decrease in direct costs. The $6.4 million decrease in direct costs reflected a $9.1 million decrease in expert and professional staff compensation, partially offset by a net increase of $2.7 million in signing, retention, and performance amortization and equity-based compensation. Generally reimbursable revenue is a pass through cost to our clients and we typically do not generate profit from this activity. However, gross margin related to reimbursable revenues and costs is negative for 2008 primarily due to our inability to pass certain research and data retrieval costs to our clients and to a lesser extent, delayed timing of when these types of costs are incurred and then ultimately used in client related work.
Finance and Accounting Services
The following table sets forth the revenues, cost of services, gross profit and gross margin, and certain operating metrics for our Finance and Accounting Services segment for the years ended December 31, 2009, 2008 and 2007, respectively and include the financial results of the Secura business which we acquired as of March 2007.
| |
Year ended December 31, | |
|
|
|
||||||||||||||||||
|---|---|---|---|---|---|---|---|---|---|---|---|---|---|---|---|---|---|---|---|---|---|---|---|
| |
2009 | 2008 | 2007 | Change 2009 - 2008 | Change 2008 - 2007 | ||||||||||||||||||
| |
($ in thousands, except rate amounts) |
||||||||||||||||||||||
Fee-based revenues, net |
$ | 147,190 | $ | 180,419 | $ | 199,618 | $ | (33,229 | ) | -18.4 | % | $ | (19,199 | ) | -9.6 | % | |||||||
Reimbursable revenues |
6,597 | 8,475 | 12,900 | (1,878 | ) | -22.2 | % | (4,425 | ) | -34.3 | % | ||||||||||||
Revenues |
153,787 | 188,894 | 212,518 | (35,107 | ) | -18.6 | % | (23,624 | ) | -11.1 | % | ||||||||||||
Direct costs |
112,374 | 125,930 | 126,155 | (13,556 | ) | -10.8 | % | (225 | ) | -0.2 | % | ||||||||||||
Reimbursable costs |
6,773 | 8,369 | 12,704 | (1,596 | ) | -19.1 | % | (4,335 | ) | -34.1 | % | ||||||||||||
Cost of services |
119,147 | 134,299 | 138,859 | (15,152 | ) | -11.3 | % | (4,560 | ) | -3.3 | % | ||||||||||||
Gross profit |
$ | 34,640 | $ | 54,595 | $ | 73,659 | $ | (19,955 | ) | -36.6 | % | $ | (19,064 | ) | -25.9 | % | |||||||
Gross margin |
22.5 | % | 28.9 | % | 34.7 | % | -6.4 | % | -5.8 | % | |||||||||||||
Billable headcount, period average |
458 |
490 |
595 |
(32 |
) |
-6.5 |
% |
(105 |
) |
-17.6 |
% |
||||||||||||
Average billable rate |
$ | 288 | $ | 315 | $ | 289 | $ | (27 | ) | -8.6 | % | $ | 26 | 9.0 | % | ||||||||
Jr./Sr. staff paid utilization rate |
69.2 | % | 70.0 | % | 69.2 | % | -0.8 | % | 0.8 | % | |||||||||||||
Estimate of unrealizable revenue |
8,182 |
8,007 |
9,813 |
175 |
2.2 |
% |
(1,806 |
) |
-18.4 |
% |
|||||||||||||
% of gross fee-based revenue |
5.3 | % | 4.2 | % | 4.7 | % | 1.1 | % | -0.5 | % | |||||||||||||
51
Revenues
Fee-based revenues decreases in 2009 compared to 2008 were primarily in our international, damages and intellectual property, and forensic accounting practices offset by an increase in financial services. Fee-based revenues decreases in 2008 compared to 2007 were primarily in our eDiscovery, forensic accounting and healthcare practice areas with an increase in financial services as the result of increased revenues from the Secura group acquired in March 2007 and strong growth in our international practices, while revenues in our damages and intellectual property and higher education areas remained relatively flat.
The decrease in fee-based revenues, net for 2009 compared to 2008 was primarily the result of a 6.5% decrease in the average billable headcount and a 0.8% decrease in professional staff utilization and an 8.6% decrease in the average billable rate. While the average billable headcount decreased by 32 for 2009 compared to 2008, there were 94 terminations in connection with our 2009 restructuring activities and the divestitures of a portion of our practice in Milan, Italy effective December 31, 2008 and our Canadian practice in the second quarter of 2009 partially offset by 13 new hires net of attrition. The decrease in the average billable rate was caused by a shift to lower billing rate experts, and to a lesser extent, decreases of 17% and 5% in the average exchange rates for British pound sterling and the Eurodollar, respectively.
The decrease in fee-based revenues, net for 2008 compared to 2007 was primarily due to a 17.6% decrease in the average billable headcount, partially offset by a 9.0% increase in the average billable rate. Average billable headcount decreased by 105 for 2008 compared to 2007, due primarily to terminations in connection with the 2007 recovery plan and voluntary attrition. The increase in the average billable rate was caused by billing rate increases at the beginning of 2008 and an increase in expert versus professional staff billable hours.
The $0.2 million increase in our estimate of unrealizable revenue for 2009 compared to 2008 was primarily due an increase in our historical trailing 12 months write-offs, which is the basis of our estimate, substantially offset by the decrease in our gross fee-based revenue. The $1.8 million decrease in our estimate of unrealizable revenue for 2008 compared to 2007 was primarily due a 10.0% decrease in gross fee-based revenue and a decrease in our historical trailing 12 months write-offs, which is the basis of our estimate. Reimbursable revenues for 2009 and 2008 decreased primarily due to lower travel-related out-of-pocket expenses for matters worked on during 2008 compared to 2007, and during 2008 compared to 2007.
Cost of services
The decrease in direct costs in 2009 compared to 2008 was primarily due to a $13.8 million decrease in expert and professional staff compensation, slightly offset by a $0.2 million increase in non-cash equity based compensation. The $13.8 million decrease in expert and professional staff compensation was primarily due to decreased salary costs related to the terminations resulting from our 2008 and 2009 restructuring activities, as well as decreased compensations earned by at-risk experts due to lower revenue. The $0.2 million increase in non-cash equity based compensation is primarily due to expense associated with restricted stock grants made to certain experts in May 2008, as well as other grants made since December 2008.
The decrease in direct costs for 2008 compared to 2007 was due to a $2.7 million decrease in expert and staff compensation costs largely offset by a $2.5 million increase in non-cash compensation. The $2.7 million decrease in expert and professional staff compensation was due to decreased salary costs as a result of headcount reductions in connection with our 2007 value recovery plan and voluntary attrition as well as decreased compensation earned by certain experts on the gross margin model, partially offset by increased compensation earned by at-risk experts due to higher revenues generated by them individually, and salary costs for newly hired experts. The $1.5 million increase in signing,
52
retention and performance bonus amortization was primarily due to the capitalization of bonuses recognized since November 2007, including a $9.8 million retention bonus to a key expert in November 2007, and the resulting additional amortization The $1.0 million increase in equity-based compensation expense is due to expense associated with restricted stock grants made to certain experts in May 2008 as well as other grants made since September 30, 2007.
Reimbursable costs for 2009 and 2008 decreased primarily due to lower travel-related out-of-pocket expenses for matters worked on during 2009 compared to 2008, and during 2008 compared to 2007.
Gross margin
The 6.4% decrease in the gross margin to 22.5% in 2009 from 28.9% in 2009 is primarily due to an 18.4% decrease in fee-based revenues, net with only a 10.8% decrease in direct costs. The $13.6 million decrease in direct costs includes a $13.8 million decrease in expert and professional staff compensation, slightly offset by a $0.2 million increase in equity-based compensation,
The 5.8% decrease in the gross margin to 28.9% in 2008 from 34.7% in 2007 is primarily due to a 9.6% decrease in fee-based revenues, net with only a 0.2% decrease in direct costs. The $0.2 million decrease in direct costs includes a $2.7 million decrease in expert and professional staff compensation, largely offset by a $2.5 million increase in signing, retention and performance bonus amortization and equity-based compensation.
Operating expenses
The following table sets forth our operating expenses for years ended December 31, 2009, 2008 and 2007:
| |
Year ended December 31, | |
|
|
|
|||||||||||||||||
|---|---|---|---|---|---|---|---|---|---|---|---|---|---|---|---|---|---|---|---|---|---|---|
| |
2009 | 2008 | 2007 | Change 2009 - 2008 | Change 2008 - 2007 | |||||||||||||||||
| |
($ in thousands) |
|||||||||||||||||||||
General and administrative expenses |
$ | 73,258 | $ | 88,021 | $ | 83,901 | $ | (14,763 | ) | -16.8 | % | $ | 4,120 | 4.9 | % | |||||||
Depreciation and amortization |
4,997 | 5,939 | 7,284 | (942 | ) | -15.9 | % | (1,345 | ) | -18.5 | % | |||||||||||
Goodwill impairment |
— | 118,800 | — | (118,800 | ) | -100.0 | % | 118,800 | — | |||||||||||||
Other impairments |
10,071 | 5,358 | — | 4,713 | 88.0 | % | 5,358 | — | ||||||||||||||
Restructuring charges |
5,659 | 5,937 | 10,689 | (278 | ) | -4.7 | % | (4,752 | ) | -44.5 | % | |||||||||||
Divestiture charges |
1,800 | 3,136 | — | (1,336 | ) | -42.6 | % | 3,136 | — | |||||||||||||
Total operating expenses |
$ | 95,785 | $ | 227,191 | $ | 101,874 | $ | (131,406 | ) | -57.8 | % | $ | 125,317 | 123.0 | % | |||||||
General and administrative
Our general and administrative expenses are comprised of compensation costs for our administrative staff, including salaries, bonuses, benefit costs and equity-based compensation; facility costs; legal, accounting and financial advisory fees; recruiting and training costs; marketing and advertising costs; travel expenses incurred by management; costs related to computers, telecommunications and supplies; and other operating expenses.
Our results for 2009 include a $2.8 million stock-based compensation expense reversal due to the termination of employment of one of our experts in August 2009. Offsetting this expense recovery was the accelerated expense of $0.6 million related to the voluntary surrender of stock options.
53
In response to the ongoing economic downturn, during 2009 we implemented cost saving measures to reduce our general and administrative expenditures. These actions included a workforce reduction of 41 administrative staff, an adjustment to the compensation structure of 39 administrative staff, elimination of certain employee benefits, a reduction our office space in four locations, and further reductions in discretionary spending. As a result of our 2008 and 2009 cost saving measures, headcount reductions and lower legal fees in connection with litigation arising in the normal course of business, our general and administrative expenses decreased as follows: a $3.2 million, or 10.3% decrease in base compensation and benefit costs; a $0.8 million or 4.7% in occupancy costs; a $3.5 million, or 66.3%, decrease in recruiting and training expenses due to decreased hiring activities; a $3.3 million or 29.7% decrease in legal, consulting, temporary staff and other outside services; a $3.2 million, or 41.6%, decrease in marketing costs, including events and conferences; a $1.2 million, or 51.2%, reduction in travel expenses for corporate and business development purposes; a $0.9 million, or 21.3% decrease in computer expenses; and a $0.6 million or 14.4% reduction in communication and other operating expenses. These decreases were partially offset by a $2.6 million increase in discretionary general and administrative bonuses for a key expert to provide leadership services until the completion of the proposed Merger with SMART as well as $2.1 million of acquisition costs related to this Merger. Acquisition costs include legal, accounting and other service fees and travel costs.
The increase in general and administrative expenses for 2008 compared to 2007 was primarily the result of a $1.6 million, or 27%, increase in marketing expenses, a $1.6 million or 17%, increase in outside services, and a $1.2 million or 30.3% increase in recruiting and training costs. Higher marketing and related costs were primarily due to increased events and conferences costs, and business development costs incurred to generate new business, public relations and branding initiatives designed to increase the awareness of the LECG brand, partially offset by decreases in website development costs. Outside services increased primarily due to legal fees in connection with litigation arising in the normal course of business. Recruiting and training costs increased period over period in connection with hiring experts and professional staff. In 2007, hiring and training efforts were suspended due to our 2007 value recovery plan. Salary, bonus and related costs for administrative staff were flat from 2007 to 2008.
Equity based compensation increased by $0.2 million primarily due to additional restricted stock issuances in 2008 and the second half of 2007.
Depreciation and amortization
The decrease in depreciation and amortization for 2009 compared to 2008 was primarily due to the impairment of certain intangible assets in the fourth quarter of 2008.
The decrease in depreciation and amortization for 2008 compared to 2007 was primarily due to the full amortization during 2008 of certain intangible assets acquired in connection with the acquisitions of CFES, Mack Barclay, Neilson Elggren and Secura.
Goodwill impairment charges
We performed our annual goodwill impairment test using an October 1st measurement date and concluded that our goodwill assets was not impaired as of measurement date or at December 31, 2009.
We completed our annual goodwill impairment test in connection with the preparation of our 2008 annual consolidated financial statements using an October 1st measurement date. Due to the worldwide financial crisis and decreased global economic activity in the latter half of 2008, particularly the substantial and continued economic slowdown in the U. S. and Europe, we experienced a significant decrease in revenues during the fourth quarter of 2008. As a result, we incorporated these events and circumstances into our cash flow model to determine the relative fair value of our two reporting units and the implied fair value of their assigned goodwill. The implied fair value of each reporting units'
54
goodwill was less than their respective carrying values, and as a result, we concluded that our goodwill asset was fully impaired for both reporting units. Consequently, we recorded a $118.8 million impairment charge in the fourth quarter of 2008 as follows: $50.0 million related to the Economics Services segment and $68.8 million related to the Finance and Accounting Services segment.
Other impairment charges
We recognized other non-cash impairment charges totaling $10.1 million during 2009, consisting of $5.9 million related to the write-off of unearned bonuses for terminated experts, $1.4 million of net charges related to the write-off of certain client receivables, $2.0 million related to certain prepaid costs which we considered unrecoverable, and $0.8 million related to other asset write-offs. The $1.4 million charge related to two specific client receivables that have been the subject of arbitration proceedings. We determined that these receivables were impaired based primarily on the length of time these amounts have been outstanding and the lack of progress and favorable developments in the arbitration proceedings. The impairment charge represents the gross amount of these receivables, net of anticipated recoveries from the at-risk experts who originally worked on these matters.
We recognized other impairment charges in 2008 totaling $5.4 million: $4.0 million of the impairment charge was in connection with our customer relationships intangible asset; $0.5 million was due to the discontinued use of a trade name intangible asset; $0.7 million was related to the expensing of certain prepaid costs which we considered unrecoverable; and $0.2 million was related to other asset write-offs.
Restructuring charges
During the second and third quarters of 2009, we executed restructuring actions intended to further rationalize our cost structure with current business and market conditions. These actions included a workforce reduction of 133 billable headcount and 41 administrative staff, as well as an adjustment to the compensation structure of 81 billable headcount and 39 administrative staff. The workforce reduction was mostly composed of involuntary terminations, but also included voluntary terminations that were not replaced. Net restructuring charges in 2009 totaled $5.7 million, of which $1.2 million was non-cash related and $4.5 million was cash related, and were primarily composed of $2.5 million in one-time termination benefits, $1.9 million of lease termination costs, and $1.3 million of unearned bonus and draw deficit write-offs. We recognized net restructuring charges in 2008 of $5.9 million, of which $6.4 million was related to the termination of 35 billable headcount and 37 administrative staff and the closure of two offices during the fourth quarter of 2008, partially offset by a $0.5 million benefit in the third quarter of 2008 resulting from changes in estimated costs of rent payments for a facility vacated in 2007.
We recognized a restructuring charge in 2007 of $10.7 million. The 2007 restructuring charge related to the termination of 121 billable headcount and seven administrative staff during 2007 and the closure of seven offices and a computer facility during the same period.
55
Restructuring charges in our Consolidated Statements of Operations were as follows (in thousands):
| |
Year ended December 31, | |||||||||
|---|---|---|---|---|---|---|---|---|---|---|
| |
2009 | 2008 | 2007 | |||||||
One-time termination benefits |
$ | 2,496 | $ | 3,211 | $ | 1,700 | ||||
Write-off of unearned signing and performance bonuses(1) |
975 | 2,338 | 3,668 | |||||||
Write-off of expert advances paid in excess of expert fees earned(1) |
262 | — | 3,813 | |||||||
Lease buyout and rent payments for office closure and other costs(2) |
1,925 | 888 | 1,508 | |||||||
Restructuring charge recovery |
— | (500 | ) | — | ||||||
Total |
$ | 5,658 | $ | 5,937 | $ | 10,689 | ||||
- (1)
- Represents
non-cash charges.
- (2)
- Includes non-cash (benefit) charges of ($0.1), $0.1 million and $0.2 million in 2009, 2008 and 2007, respectively.
Divestiture charges
In 2009, the $1.8 million of divestiture charges included a loss on the divestiture of our Canadian practice of $1.7 million and $0.1 million of transaction costs related to the February 2009 divestiture of a portion of our practice in Milan, Italy. On May 31, 2009, we executed a sales agreement to transfer most of the assets of our Canadian subsidiary, net of certain liabilities totaling $1.7 million, to a former employee for $0.6 million in cash. We paid severance to terminated Canadian employees and transaction costs totaling $0.7 million during 2009 which was recorded as divestiture charges. The cash flows from our Canadian practice were not material to our consolidated revenues, gross profit, or results of operations.
We recognized a charge in the fourth quarter of 2008 in connection with the divestiture of a portion of our practice in Milan, Italy. While we closed the transaction in February 2009, the terms of the sale were substantially agreed to and we estimated and recorded a loss of approximately $3.1 million as of December 31, 2008.
Interest income, interest expense and other expense, net
The following table sets forth our interest income, interest expense and other expense, net for the years ended December 31, 2009, 2008 and 2007:
| |
Year ended December 31, | |
|
|
|
|||||||||||||||||
|---|---|---|---|---|---|---|---|---|---|---|---|---|---|---|---|---|---|---|---|---|---|---|
| |
2009 | 2008 | 2007 | Change 2009 - 2008 | Change 2008 - 2007 | |||||||||||||||||
| |
($ in thousands) |
|||||||||||||||||||||
Interest income |
$ | 160 | $ | 445 | $ | 635 | $ | (285 | ) | -64.0 | % | $ | (190 | ) | -29.9 | % | ||||||
Interest expense |
$ | (2,680 | ) | $ | (636 | ) | $ | (508 | ) | $ | (2,044 | ) | 321.4 | % | $ | (128 | ) | 25.2 | % | |||
Other expense, net |
$ | (571 | ) | $ | (1,849 | ) | $ | (502 | ) | $ | 1,278 | -69.1 | % | $ | (1,347 | ) | 268.3 | % | ||||
The decrease in interest income from 2008 to 2009 and from 2007 to 2008 is due to lower cash balances held in interest-bearing accounts. The increase in interest expense in 2009 compared to 2008 primarily due to higher borrowings and interest rates on our line of credit as well as increased loan fee amortization costs due to amendments made to our line of credit in the first and fourth quarters of 2009. In addition, during the fourth quarter of 2009, we recorded $0.5 million of loan fee impairment charge due to a reduction in the commitment amount under our revolving credit facility. The increase in interest expense in 2008 compared to 2007 is due to higher outstanding balances on our line of credit.
56
The decrease in other expense in 2009 compared to 2008 is primarily due to lower net mark-to-market losses on our deferred compensation plan assets. The increase in other expense from 2007 to 2008 is primarily due to a $1.6 million increase in net mark-to-market losses on our deferred compensation plan assets, partially offset by a $0.3 million increase in foreign currency transaction gains.
Income taxes
Our income tax expense or benefit for the years ended December 31, 2009, 2008 and 2007 is as follows:
| |
Year ended December 31, | |
|
|
|
|||||||||||||||||
|---|---|---|---|---|---|---|---|---|---|---|---|---|---|---|---|---|---|---|---|---|---|---|
| |
2009 | 2008 | 2007 | Change 2009 - 2008 | Change 2008 - 2007 | |||||||||||||||||
| |
($ in thousands) |
|||||||||||||||||||||
Income tax (benefit) expense |
$ | 39,957 | $ | (41,680 | ) | $ | 8,753 | $ | 81,637 | -195.9 | % | $ | (50,433 | ) | -576.2 | % | ||||||
Our effective tax rate in 2009 was (117.0%), compared to 32.5% in 2008 and 40.6% in 2007. In 2009, we recognized an income tax expense of $40.0 million on a loss from continuing operations of $34.2 million. The change in the effective tax rate in 2009 is due primarily to the full valuation allowance recorded against our net deferred tax assets. Our deferred tax assets are generally projected to reverse over the next one to thirty-three years. The extended reversal period is the result of significant income tax basis in intangible assets which were impaired for financial statement purposes during 2008. Tax amortization from these assets, if not offset with current taxable income, would create a net operating loss with a 20-year carryforward period for federal tax purposes. At December 31, 2009, we reviewed our net deferred tax assets, as well as projected taxable income, for recovery using the "more likely than not" approach by assessing the available evidence surrounding its recoverability. We considered all available evidence, both positive and negative, including forecasts of future taxable income, tax planning strategies and past operating results which includes a net loss for 2009 and 2008. Even though we project income in future years, based upon past losses, the current economic environment, and the difficulty of accurately projecting income, we determined that it was "more likely than not" that our net deferred tax assets may not be realized. A full valuation allowance against our net deferred tax assets was recorded in 2009 which decreased the effective rate by 144.0%. In future years, if we begin to generate taxable income and our management determines that the net deferred tax asset is recoverable, the valuation allowance will be reversed. Any such reversal will result in a tax benefit in the period of reversal. The effective tax rate was also impacted by approximately $2.0 million of acquisition-related costs that are not deductible for tax purposes, which decreased the tax benefit by approximately $0.7 million and decreased the effective rate by 2.0% compared to 2008. In 2009, the Company recorded approximately $1.8 million of losses in certain foreign jurisdictions, for which no tax benefit was recorded, which decreased the effective rate by 1.8% compared to 2008.
In 2008, we recognized an income tax benefit of $41.7 million on a loss from continuing operations of $128.4 million. The change in the effective tax rate in 2008 is due primarily to the tax impact of the goodwill impairment charge, as well as the valuation allowance placed on our foreign tax credits. Approximately $11.7 million of the $118.8 million goodwill impairment charge represents a permanent difference, or an amount that is not deductible for tax purposes, which decreases the tax benefit by approximately $4.1 million and decreased the effective rate by 3.2%. In 2008, we also recorded a $3.7 million valuation allowance against the deferred tax asset related to our foreign tax credit carryforwards, which will expire in ten years, as we are currently unable to conclude that the realization of these credits is reasonably assured. We will continue to evaluate the likelihood of ultimately realizing the benefit of our foreign tax credits in future periods. The impact of the valuation allowance was to reduce the overall benefit of the loss from continuing operations by $3.7 million, and decrease the effective rate by 2.7%.
57
For 2007, we had income from continuing operations of $21.6 million. The effective rate in 2007 was primarily influenced by federal, foreign and state statutory rates. Permanent differences had a minor impact on the effective rates for 2007.
In 2007 the Argentine taxing authority ("AFIP") completed its audit of LECG Buenos Aires' ("LECG BA") income tax returns for 2003 and 2004 and its withholding tax return for 2005. In connection with this audit, the AFIP issued a notice to disallow certain deductions claimed for those years as well as a proposal to impose a withholding tax on certain payments made by LECG BA to LECG LLC, our U.S. parent company. The AFIP proposed to limit the deductibility of costs charged by LECG LLC to LECG BA for expert and staff services performed by our personnel outside of Argentina on client related matters, and to require withholding tax on certain payments by LECG BA for services rendered by our personnel outside of LECG BA. In 2008, we elected to pay to the Argentine government $2.0 million for potential tax deficiencies and $1.3 million of potential interest in order to avoid the accrual of additional interest, while reserving our right to defend our position in Argentine tax court. We have recorded $3.3 million of payments to the Argentine taxing authority as Other long-term assets in the Condensed Consolidated Balance Sheets at December 31, 2009 and 2008.
On April 8, 2009, we were notified that the AFIP had terminated the penalty procedures relating to amounts previously paid for the 2003 and 2004 income tax and 2005 withholding tax deficiencies due to the passage of Argentine National Law No. 26.476 (Tax Moratorium). However, we may still be subject to penalties and interest on a potential underpayment of taxes related to the 2005 withholding tax return. Also, based on the results of the completed audit discussed above, we may receive additional notices for assessments of additional income taxes, penalties, and interest related to our 2005 and 2006 income tax returns and withholding taxes, penalties, and interest on payments made to the U.S. parent company to settle intercompany balances from June 2005 to December 2007.
If we are unsuccessful in defending our position, amounts paid in connection with the potential income and withholding tax deficiency would qualify for a foreign tax credit on our U.S. tax return and would result in a deferred tax asset on our Condensed Consolidated Balance Sheets, the realization of which would be dependent upon the ability to utilize the foreign tax credit within the ten-year expiration period. We believe that we properly reported these transactions in our Argentine tax returns and have assessed that our position in this matter will be sustained. Accordingly, we have not recognized any additional tax liability in connection with this matter at December 31, 2009.
Discontinued operations
On December 31, 2007, we completed the sale of our wholly-owned subsidiary Silicon Valley Expert Witness Group, Inc. ("SVEWG") for $7.0 million to a privately held company owned by the former majority shareholder of SVEWG, as disclosed in the Notes to Consolidated Financial Statements included in the Annual Report on Form 10-K for 2009. The following table shows selected financial data of SVEWG included in income from operations of discontinued subsidiary for the periods presented (in thousands):
| |
Year ended December 31, 2007 |
|||
|---|---|---|---|---|
Revenues |
$ | 10,958 | ||
Income from operations of discontinued subsidiary before income taxes |
$ | 1,313 | ||
Income tax expense |
535 | |||
Income from operations of discontinued subsidiary, net of income taxes |
$ | 778 | ||
Further financial information regarding discontinued operations is included in "Note 15—Discontinued operations" in Notes to Consolidated Financial Statements contained in this Form 10-K.
58
LIQUIDITY AND CAPITAL RESOURCES
Our current sources of liquidity are our cash on hand and cash generated by operations, including the timely collection of our billed receivables. As of December 31, 2009, we had $13.0 million in cash and cash equivalents. Also, on March 10, 2010, we received a $25.0 million cash investment from Great Hill Partners in connection with the SMART Merger and we used a portion of that amount to repay $19.0 million outstanding under our then existing revolving credit facility. Our primary financing needs will be (a) to service the principal and interest payments associated with the term loan facility (which is discussed below) that we assumed as part of the SMART Merger, under an amendment entered into on March 10, 2010, (b) to continue funding our business operations, including our payroll-related costs, current operating lease commitments, signing, retention and performance bonuses, and (c) to a lesser extent, to fund our remaining performance-based purchase price payments related to prior acquisitions and funding strategic acquisitions. We will also need to fund the integration costs related to our Merger with SMART, which may be significant. Further, the retention of key experts, the recruitment of additional experts and professional staff, and our expansion into new geographic and service areas are important elements of our business and we expect to continue to recruit and hire experts and professional staff through a mix of individual hires, group hires and acquisitions in order to deepen our existing service offerings.
Term loan facility
On March 10, 2010, we entered into a Sixth Amendment to Credit Agreement and Consent (the "Amendment") and became a co-borrower with SMART Business Advisory and Consulting, LLC, under a Credit Agreement with the Bank of Montreal ("BMO") and the syndicate bank members. The Amendment provides for a $40.8 million term loan which is guaranteed by us and our domestic subsidiaries. The Amendment also allows us to seek up to an additional $10.0 million of subordinated debt, subject to certain repayment and maturity restrictions. The term loan matures on March 31, 2011 and required a $4.0 million principal payment at closing (March 10, 2010), and subsequent quarterly principal payments of $3.0 million beginning on June 30, 2010 through December 31, 2010. The remaining outstanding principal is due in full on March 31, 2011. Interest is payable quarterly at a rate consisting of the Base Rate plus 6.50%. The Base Rate is defined as the greater of (i) three percent, (ii) BMO's prevailing prime commercial rate, (iii) the Federal Funds rate plus 0.5%, or (iv) LIBOR plus 1.5%. The current interest rate in effect as of the date of the Amendment was 9.75%. We paid approximately $0.2 million in fees related to this Amendment, which will be amortized over the remaining term of the Amendment.
The Amendment contains non-financial and financial covenants, including a total funded debt to EBITDA ratio, a minimum fixed charge ratio, maximum rental and capital expenditures, and minimum quarterly EBITDA and cash balance requirements. Also, cash balances in excess of certain amounts at each quarter-end must be used to make additional principal payments. Maintaining compliance with our debt covenants is critical to our operations. The current economic downturn adds uncertainty to our anticipated revenue levels, as seen by declines in our revenue during the third and fourth quarters of 2008 and again in the second and third quarters of 2009. We have executed a number of restructuring actions in response to these revenue declines. Should revenues declines continue or other unforeseen adverse developments occur, we would seek to remain in compliance with the debt covenants through further restructuring actions.
Future needs
The continued economic downturn adds uncertainty to our anticipated revenue and earnings levels and to the timing of cash receipts which are needed to support our operations. In addition, cash payments for principal and interest related to the term loan facility which we assumed in connection with the SMART Merger, merger-related integration costs, future signing, retention and performance
59
bonuses, and recruiting fees and performance-based acquisition payments could affect our cash needs. We anticipate significant integration costs and the continued use of signing, retention and performance bonuses to recruit and retain expert talent; however, the timing and magnitude of those events and opportunities cannot be predicted. These cash needs have historically caused us to make use of a revolving credit facility throughout the year, and the current economic downturn had resulted in our need to utilize such borrowings more frequently and to a greater degree than we did historically. We terminated our revolving credit facility in conjunction with the closing of the SMART Merger and we no longer have access to that line of credit.
Also, we initiated a series of restructuring actions beginning in the fourth quarter of 2008 and again in the second and third quarters of 2009, that were designed to reduce and better align our costs with current business conditions and revenue levels. We believe funds generated by our operations, including our ability to collect our outstanding billed receivables will provide adequate support to fund our anticipated cash needs for at least the next twelve months. However, if our revenues decrease from their current levels, it may be necessary for us to implement further cost reductions or seek to obtain the subordinated debt financing allowed under the Amendment to ensure that our cash needs are met for at least the next twelve months.
We currently anticipate that we will retain all of our earnings, if any, for development of our business and do not anticipate paying any cash dividends in the foreseeable future.
Cash flows
| |
Year ended December 31, | |||||||||||
|---|---|---|---|---|---|---|---|---|---|---|---|---|
| |
2009 | 2008 | 2007 | |||||||||
| |
(in thousands) |
|||||||||||
Net cash provided by (used in): |
||||||||||||
Operating activities |
$ | (7,060 | ) | $ | 12,113 | $ | 17,236 | |||||
Investing activities |
(9,055 | ) | (12,594 | ) | (26,518 | ) | ||||||
Financing activities |
9,348 | 173 | 3,553 | |||||||||
Effect of exchange rates on changes in cash |
301 | (1,784 | ) | 842 | ||||||||
Net decrease in cash and cash equivalents |
$ | (6,466 | ) | $ | (2,092 | ) | $ | (4,887 | ) | |||
Operating activities
Net cash used in operations in 2009 was $7.1 million as compared to $12.1 million net cash provided by operations in 2008 and $17.2 million net cash provided by operations in 2007. The $19.2 million increase in net cash used in operations over the prior year was the result of changes in our earnings and the timing and amounts of working capital used during the respective years. Significant uses of cash in our operations in 2009 were: a $74.1 million net loss, a $5.2 million decrease in accrued compensation, $10.6 million of signing, retention and performance bonuses paid during the year, a $3.2 million decrease in accounts payable and other accrued liabilities, and a $5.3 million increase in income taxes receivable. Off-setting these cash uses was the add-back of $90.3 million of non-cash expenses including $49.5 million of deferred taxes. In connection with our 2008 and 2009 restructuring activities, we made cash payments of $5.6 million during 2009. We anticipate $1.6 million of additional cash expenditures in 2010 related to the conclusion of these restructuring activities. In 2009, we paid $1.9 million for income taxes and received a $6.4 million refunds related to our 2008 federal and state tax returns and prior year's Canadian returns. We currently estimate refunds of approximately $17.0 million for federal, state, and foreign tax jurisdictions, primarily due to our taxable net loss for the year and recent rule changes in the federal net operating loss carry-back period.
60
Net cash provided by operations in 2008 was $12.1 million. Significant uses of cash in our operations in 2008 were: an $86.7 million net loss, a $4.3 million decrease in accrued compensation, $17.4 million of signing, retention and performance bonuses paid during the year, and a $4.5 million increase in income taxes receivable. Off-setting these cash uses was the add-back of $114.4 million of non-cash expenses, a $9.3 million decrease in accounts receivable and a $5.0 million increase in accounts payable and other accrued liabilities.
Net cash provided by operations in 2007 was $17.2 million. The primary sources and uses of cash from operations in 2007 were net income of $11.4 million, which included non-cash expenses of $35.9 million and a $3.7 million decrease in accounts receivable resulting from the timing of our collections. In connection with our 2007 value recovery plan, we paid $1.2 million of one-time termination benefits and $0.4 million of facility closure costs during 2007. In 2007, we paid $38.4 million in signing, retention and performance bonuses. In 2007, we paid $10.4 million for income taxes, $2.6 million of which was applied to 2008 tax liabilities.
Investing activities
Net cash used in investing activities was $9.1 million for 2009 as compared to $12.6 million in 2008 and $26.5 million in 2007. Acquisition related payments in 2009, 2008 and 2007, accrued purchase price payable at December 31, 2009 were as follows (in thousands):
| |
|
|
|
Accrued purchase price payable at 12/31/2009 |
|
|
||||||||||||
|---|---|---|---|---|---|---|---|---|---|---|---|---|---|---|---|---|---|---|
| |
Year ended December 31, | |
Date of final potential payment |
|||||||||||||||
| |
Potential remaining payments |
|||||||||||||||||
| |
2009 | 2008 | 2007 | |||||||||||||||
Payment in connection with acquisitions (net of cash acquired and including transaction costs): Secura |
$ | — | $ | — | $ | 9,196 | ||||||||||||
Total payments in connection with acquisitions |
— | — | 9,196 | |||||||||||||||
Additional acquisition related payments: |
||||||||||||||||||
Secura |
1,700 | — | — | $ | 100 | $ | — | Mar-11 | ||||||||||
Mack Barclay |
738 | 5,300 | 1,845 | 1,055 | — | Jul-10 | ||||||||||||
Lancaster |
— | 240 | 372 | — | — | n/a | ||||||||||||
Beach |
— | — | 500 | — | — | n/a | ||||||||||||
Neilson Elggren |
1,007 | 1,509 | 1,234 | — | 1,500 | Dec-10 | ||||||||||||
Bates |
1,850 | 2,000 | 4,588 | — | — | n/a | ||||||||||||
Cook |
— | 172 | 243 | — | — | n/a | ||||||||||||
WAG |
— | — | 1,227 | — | — | n/a | ||||||||||||
EA |
— | — | 1,863 | — | — | n/a | ||||||||||||
LRTS |
290 | 515 | 847 | — | — | n/a | ||||||||||||
CFES |
— | — | 1,856 | — | — | n/a | ||||||||||||
Total payments |
5,585 | 9,736 | 14,575 | $ | 1,155 | $ | 1,500 | |||||||||||
Total acquisition related payments |
$ | 5,585 | $ | 9,736 | $ | 23,771 | ||||||||||||
Investing activities in 2009, 2008 and 2007 also included investments in computer hardware and software additions totaling $1.4 million, $3.2 million and $3.8 million, respectively. Investing activities in 2009 and 2008 also included $0.6 million and $0.5 million, respectively, of payments received on our note receivable in connection with the sale of our wholly-owned subsidiary SVEWG, Inc. on December 31, 2007. Investment activities in 2009 included $2.7 million of divestiture payments, net of cash receipts in connection with the divestiture of a portion of our Milan, Italy practice and our Canadian practice.
61
Financing activities
Net cash provided by financing activities in 2009 was $9.3 million, consisting primarily of $45.0 million of borrowings under our revolving line of credit offset by principal repayments of $33.0 million, and $2.7 million of loan fees paid in connection with amendments to our revolving line of credit in the first and fourth quarters of 2009.
We borrowed and repaid a cumulative total of $61.0 million under our revolving credit line over the course of 2008.
Net cash provided by financing activities in 2007 was $3.6 million, as the result of $2.1 million of proceeds from the exercise of options, $0.2 million from the issuance of 13,286 shares of common stock in connection with our Employee Stock Purchase Plan, and $1.3 million of tax benefit from option exercises and equity compensation plans. We borrowed and repaid $13.0 million under our revolving credit line during 2007, and we paid $0.1 million of loan fees to amend our revolving credit line, including the modification of a restrictive covenant related to the total amount of signing, retention and performance bonus payments made within a 12-month period.
Effect of exchange rates on changes in cash
The $0.3 million positive effect in 2009 resulted from the translation of cash balances held in foreign locations that were primarily denominated in British pound sterling, New Zealand dollars, Canadian dollars and Eurodollars at higher exchange rates relative to the US dollar at December 31, 2009 compared to December 31, 2008. The $1.8 million negative effect in 2008 resulted from the translation of cash balances held in foreign locations that were primarily denominated in British pound sterling and Canadian dollars at lower exchange rates relative to the US dollar at December 31, 2008 compared to December 31, 2007. The $0.8 million positive effect in 2007 resulted from the translation of cash balances held in foreign locations that were primarily denominated in Canadian dollars and the Euro at higher exchange rates relative to the US dollar at December 31, 2007 compared to December 31, 2006.
62
CONTRACTUAL OBLIGATIONS AND COMMITMENTS
The following table provides summary information concerning our future contractual and contingent obligations and commitments, including the acquisitions and expert hires disclosed below and other contingent commitments relating to other expert agreements, operating leases and purchase commitments.
| |
Payments due by years ending December 31, | |||||||||||||||||||||
|---|---|---|---|---|---|---|---|---|---|---|---|---|---|---|---|---|---|---|---|---|---|---|
| |
2010 | 2011 | 2012 | 2013 | 2014 | Thereafter | Total* | |||||||||||||||
| |
(in thousands) |
|||||||||||||||||||||
Operating leases(2) |
$ | 13,621 | $ | 8,696 | $ | 6,635 | $ | 5,858 | $ | 3,685 | $ | 3,243 | $ | 41,738 | ||||||||
Accrued retention and performance bonuses(3) |
2,325 | — | — | — | — | — | 2,325 | |||||||||||||||
Contingent retention and performance bonuses(4) |
9,065 | 10,150 | 2,100 | 5,100 | — | — | 26,415 | |||||||||||||||
Earned expert bonuses(5) |
10,581 | — | — | — | — | — | 10,581 | |||||||||||||||
Contingent performance bonus commitments(6) |
323 | 2,707 | 1,320 | 750 | 750 | 1,000 | 6,850 | |||||||||||||||
Accrued purchase price(7) |
1,055 | 100 | — | — | — | — | 1,155 | |||||||||||||||
Contingent purchase price commitment(8) |
1,500 | — | — | — | — | — | 1,500 | |||||||||||||||
Purchase commitments(9) |
1,088 | 4 | — | — | — | — | 1,092 | |||||||||||||||
Total(1) |
$ | 39,558 | $ | 21,657 | $ | 10,055 | $ | 11,708 | $ | 4,435 | $ | 4,243 | $ | 91,656 | ||||||||
- *
- We
have a $3.8 million liability related to tax uncertainties that is recorded in our Consolidated Balance Sheet. This liability is excluded from our
schedule above as the timing of these potential payments cannot be reasonably estimated.
- (1)
- Includes
the maximum potential payments associated with contractual obligations that are contingent upon the achievement of significant specified
performance criteria and that have a determinable maximum amount. We have other contractual obligations that are contingent upon the achievement of specified performance criteria that do not have
determinable maximum amounts and therefore are excluded from this table. The amounts and timing of payments included in the table are estimates. Actual payments, if any, may differ materially from the
estimates presented. If different assumptions were used, the timing and amounts of the estimates would have been materially different.
- (2)
- We
lease our office facilities and certain equipment under operating lease arrangements expiring on various dates through 2017. We lease office facilities
under noncancelable operating leases that include fixed or minimum payments plus, in some cases, scheduled base rent increases over the term of the lease and additional rents based on the Consumer
Price Index. Certain leases provide for monthly payments of real estate taxes, insurance, and other expenses.
- (3)
- Represents
amounts accrued as of December 31, 2009 under certain expert agreements with claw back provisions of which $2.3 million was paid
prior to February 28, 2010.
- (4)
- Represents
the maximum payment under the terms of certain expert agreements with claw back provisions and are subject to achieving certain significant
performance criteria. Actual amounts, if any, to be paid could be significantly less than the maximum presented and may vary in timing from that which is presented in the table and includes the
following:
- •
- In connection with the hiring of certain experts and professional staff in March 2004, we will pay $1.3 million of additional performance bonuses if additional specified performance targets are achieved prior to March 2011.
63
- •
- In connection with the hiring of certain experts and professional staff in August 2006, we will pay performance bonuses of
$6.0 million if specified performance targets are achieved.
- •
- In connection with the modification of certain expert agreements made during 2009, we will pay retention bonuses of
$7.3 million, of which $4.8 million was paid prior to February 28, 2010.
- •
- In connection with the modification of certain expert agreements made during 2009, we will pay performance bonuses of
$11.0 million if specified performance bonus targets are achieved prior to January 2013, of which $0.8 million was paid prior to February 28, 2010.
- (5)
- Represents
actual amounts to be paid which were accrued at December 31, 2009 under certain bonus agreements that do not include claw back provisions.
- (6)
- Includes
the maximum potential payments for certain bonus agreements that do not include claw back provisions. Excluded from this amount are other
contractual obligations that are contingent upon the achievement of specified performance criteria. The amounts and timing of such payments included in the table are estimates. Actual amounts, if any,
to be paid could be significantly less than the maximum presented and may vary in timing from that which is presented in the schedule and includes the following:
- •
- In connection with the hiring of an expert in July 2009, we will pay $3.5 million of performance bonuses if
specified performance bonuses are achieved prior to January 2015.
- (7)
- Represents
amounts accrued as of December 31, 2009. See table included in future "Liquidity and Capital Resources" under "Investing Activities" and
the discussions included under "Additional payments related to prior acquisitions" for further details.
- (8)
- Represents
maximum amount of performance-based purchase price related to Neilson Elggren acquisition. Actual amount, if any, to be paid could be
significantly less than the maximum presented and may vary in timing from that which is presented in the schedule. See table included in future "Liquidity and Capital Resources" under "Investing
Activities" and the discussions included under "Additional future payments related to prior acquisitions" for further details.
- (9)
- Primarily represents maintenance, service and outsourcing contracts.
Additional future payments related to prior acquisitions
In March 1, 2007, we acquired substantially all of the operating assets of The Secura Group, LLC ("Secura"), an expert, consulting and regulatory compliance services firm specializing in the financial services industry. In May 2009, the Company entered into an amendment to the Secura asset purchase agreement to settle certain contingent obligations to the seller. The original agreement required additional purchase price payments of up to $2.5 million after December 2010, if certain performance targets were achieved through December 2010. Under the terms of the amendment, the Company will make guaranteed payments totaling $1.8 million, of which $1.7 million was paid in December 2009 and the remaining $0.1 million is due March 2011. There are no further performance-based purchase price commitments.
In May 2006, we acquired substantially all of the assets of BMB Mack Barclay, Inc. and affiliates ("Mack Barclay"), an expert services firm specializing in complex economic and accountancy issues in business and litigation environments. As a result of achieving specified performance targets through April 30, 2008, we recognized $4.1 million of additional purchase price, of which $2.3 million and $1.8 million was paid in July 2008 and 2007, respectively. In September 2008, we entered into an amendment to the Mack Barclay asset purchase agreement to settle all remaining contingent obligations to the seller. The original agreement provided for additional purchase price payments of up to $4.7 million by July 2011, if certain performance targets were achieved through April 2011. Under the terms of the amendment, we will make guaranteed payments totaling $4.1 million, of which
64
$3.0 million was paid in December 2008, and the remaining $1.1 million is due July, 2010. There are no further performance-based purchase price commitments.
In November 2005, we acquired substantially all of the assets of Neilson Elggren LLP ("Neilson Elggren"), a financial and insolvency expert and consulting services firm. As a result of achieving specified performance targets through December 31, 2008, we have recognized $3.7 million of additional purchase price, of which $1.0 million, $1.5 million and $1.2 million was paid in January 2009, 2008 and 2007, respectively. An additional payment of up to $1.5 million will also be made in December 2010 if higher targets are met by October 2010.
ITEM 7A. QUANTITATIVE AND QUALITATIVE DISCLOSURES ABOUT MARKET RISK
Cash investment policy
Our investment policy requires us to invest any funds we have that are in excess of our current operating requirements. As of December 31 2009, our cash and cash equivalents consisted primarily of non-interest bearing checking accounts. The recorded carrying amounts of cash and cash equivalents approximates fair value due to their short maturities.
Our cash investment guidelines are consistent with the objectives of preservation and safety of funds invested and ensuring liquidity. Eligible investments include money market accounts, US Treasuries, US Agency securities, commercial paper, municipal bonds, AAA rated asset-backed securities, certificates of deposit and agency backed mortgage securities. We seek the highest quality credit rating available for each type of security used for investment purposes. Maturities are not to exceed 18 months.
Interest rate risk
Our interest income and expense is sensitive to changes in the general level of interest rates in the United States, particularly since the majority of our investments are short-term in nature and interest on our short-term borrowings (as of December 31, 2009) is based on the greater of the prime rate, the federal funds rate plus 3.5%, the federal funds rate plus 4.0% or the Eurocurrency rate plus 5.5%. Due to the nature of our short-term investments and borrowings, we have concluded that we do not have material market risk exposure.
Market risk
Our deferred compensation plan assets consist of the cash surrender value of company-owned variable universal life insurance policies. These insurance policies are held to insure against the sudden death of the plan participants and as an offset to our liability to the plan participants. The cash surrender value for these insurance products at any given point in time is determined by the fair value of the underlying investment funds, referred to as insurance subaccounts, which are designed to emulate most of the characteristics of a retail mutual fund. The plan assets are reflected at fair value in our consolidated balance sheets with changes recorded in other income/expense at the end of each reporting period. We are subject to market fluctuations and our net earnings has been and may in the future be affected by these fluctuations due to the timing of when we authorize the reallocation of insurance subaccounts to match changes to the plan participants' investment allocations or when we have plan asset values that are greater than plan participant liabilities, which occasionally occurs due to the timing of participant distributions. If the fair value of the underlying investment funds of our deferred compensation plan assets were to fluctuate 20%, we believe that our consolidated financial position, results from operations and cash flows would not be materially affected.
65
Currency risk
We currently have operations in Argentina, Australia, Belgium, France, Hong Kong, Italy, Mexico, New Zealand, Spain and the United Kingdom. Commercial bank accounts denominated in the local currency for operating purposes are maintained in each country. The functional currency in each location is the local currency. Fluctuations in exchange rates of the U.S. dollar against foreign currencies can and have resulted in foreign exchange translation gains and losses. We had an unrealized foreign currency translation gain of approximately $0.7 million in the year ended December 31, 2009. Our realized foreign transaction gains and losses were immaterial in the years ended December 31, 2009, 2008 and 2007.
At December 31, 2009, we had U.S. dollar equivalents of approximately $0.6 million in net liability with a Canadian Dollar functional currency, $4.3 million in net assets with a Euro functional currency, $5.5 million in net assets with a Argentine peso functional currency, $6.3 million in net assets with a United Kingdom pound sterling functional currency, and $1.1 million in net assets with a New Zealand dollar functional currency.
If exchange rates on such currencies were to fluctuate 10%, we believe that our consolidated financial position, results from operations and cash flows would not be materially affected.
66
ITEM 8. FINANCIAL STATEMENTS AND SUPPLEMENTARY DATA
INDEX TO CONSOLIDATED FINANCIAL STATEMENTS
67
REPORT OF INDEPENDENT REGISTERED PUBLIC ACCOUNTING FIRM
To
the Board of Directors and Stockholders
LECG Corporation
Emeryville, California
We have audited the accompanying consolidated balance sheets of LECG Corporation and subsidiaries (the "Company") as of December 31, 2009 and 2008, and the related consolidated statements of operations, stockholders' equity, and cash flows for each of the three years in the period ended December 31, 2009. These consolidated financial statements are the responsibility of the Company's management. Our responsibility is to express an opinion on these consolidated financial statements based on our audits.
We conducted our audits in accordance with the standards of the Public Company Accounting Oversight Board (United States). Those standards require that we plan and perform the audit to obtain reasonable assurance about whether the financial statements are free of material misstatement. An audit includes examining, on a test basis, evidence supporting the amounts and disclosures in the financial statements. An audit also includes assessing the accounting principles used and significant estimates made by management, as well as evaluating the overall financial statement presentation. We believe that our audits provide a reasonable basis for our opinion.
In our opinion, such consolidated financial statements present fairly, in all material respects, the financial position of LECG Corporation and subsidiaries as of December 31, 2009 and 2008, and the results of their operations and their cash flows for each of the three years in the period ended December 31, 2009, in conformity with accounting principles generally accepted in the United States of America.
We have also audited, in accordance with the standards of the Public Company Accounting Oversight Board (United States), the Company's internal control over financial reporting as of December 31, 2009, based on the criteria established in Internal Control—Integrated Framework issued by the Committee of Sponsoring Organizations of the Treadway Commission and our report dated March 12, 2010, expressed an unqualified opinion on the Company's internal control over financial reporting.
/s/ DELOITTE & TOUCHE LLP
San
Francisco, California
March 12, 2010
68
REPORT OF INDEPENDENT REGISTERED PUBLIC ACCOUNTING FIRM ON
INTERNAL CONTROL OVER FINANCIAL REPORTING
To
the Board of Directors and Stockholders
LECG Corporation
Emeryville, California
We have audited the internal control over financial reporting of LECG Corporation and subsidiaries (the "Company") as of December 31, 2009, based on criteria established in Internal Control—Integrated Framework issued by the Committee of Sponsoring Organizations of the Treadway Commission. The Company's management is responsible for maintaining effective internal control over financial reporting and for its assessment of the effectiveness of internal control over financial reporting. Our responsibility is to express an opinion on the Company's internal control over financial reporting based on our audit.
We conducted our audit in accordance with the standards of the Public Company Accounting Oversight Board (United States). Those standards require that we plan and perform the audit to obtain reasonable assurance about whether effective internal control over financial reporting was maintained in all material respects. Our audit included obtaining an understanding of internal control over financial reporting, assessing the risk that a material weakness exists, testing and evaluating the design and operating effectiveness of internal control based on the assessed risk, and performing such other procedures as we considered necessary in the circumstances. We believe that our audit provides a reasonable basis for our opinion.
A company's internal control over financial reporting is a process designed by, or under the supervision of, the company's principal executive and principal financial officers, or persons performing similar functions, and effected by the company's board of directors, management, and other personnel to provide reasonable assurance regarding the reliability of financial reporting and the preparation of financial statements for external purposes in accordance with generally accepted accounting principles. A company's internal control over financial reporting includes those policies and procedures that (1) pertain to the maintenance of records that, in reasonable detail, accurately and fairly reflect the transactions and dispositions of the assets of the company; (2) provide reasonable assurance that transactions are recorded as necessary to permit preparation of financial statements in accordance with generally accepted accounting principles, and that receipts and expenditures of the company are being made only in accordance with authorizations of management and directors of the company; and (3) provide reasonable assurance regarding prevention or timely detection of unauthorized acquisition, use, or disposition of the company's assets that could have a material effect on the financial statements.
Because of the inherent limitations of internal control over financial reporting, including the possibility of collusion or improper management override of controls, material misstatements due to error or fraud may not be prevented or detected on a timely basis. Also, projections of any evaluation of the effectiveness of the internal control over financial reporting to future periods are subject to the risk that the controls may become inadequate because of changes in conditions, or that the degree of compliance with the policies or procedures may deteriorate.
In our opinion, the Company maintained, in all material respects, effective internal control over financial reporting as of December 31, 2009, based on the criteria established in Internal Control—Integrated Framework issued by the Committee of Sponsoring Organizations of the Treadway Commission.
We have also audited, in accordance with the standards of the Public Company Accounting Oversight Board (United States), the consolidated financial statements as of and for the year ended December 31, 2009, of the Company and our report dated March 12, 2010, expressed an unqualified opinion on those consolidated financial statements.
/s/ DELOITTE & TOUCHE LLP
San
Francisco, California
March 12, 2010
69
LECG CORPORATION AND SUBSIDIARIES
CONSOLIDATED BALANCE SHEETS
(in thousands, except share data)
| |
December 31, | ||||||||
|---|---|---|---|---|---|---|---|---|---|
| |
2009 | 2008 | |||||||
Assets |
|||||||||
Current assets: |
|||||||||
Cash and cash equivalents |
$ | 13,044 | $ | 19,510 | |||||
Accounts receivable, net of allowance of $1,992 and $973 |
85,451 | 87,122 | |||||||
Prepaid expenses |
4,981 | 5,996 | |||||||
Deferred tax assets, net—current portion |
— | 14,123 | |||||||
Signing, retention and performance bonuses—current portion |
14,046 | 15,282 | |||||||
Income taxes receivable |
13,498 | 7,662 | |||||||
Other current assets |
1,660 | 2,447 | |||||||
Note receivable—current portion |
547 | 518 | |||||||
Total current assets |
133,227 | 152,660 | |||||||
Property and equipment, net |
7,814 | 11,011 | |||||||
Goodwill |
1,800 | — | |||||||
Other intangible assets, net |
3,078 | 3,790 | |||||||
Signing, retention and performance bonuses |
20,293 | 34,976 | |||||||
Deferred compensation plan assets |
10,017 | 9,684 | |||||||
Note receivable |
1,351 | 1,946 | |||||||
Deferred tax assets, net |
5,731 | 36,952 | |||||||
Other long-term assets |
7,500 | 5,188 | |||||||
Total assets |
$ | 190,811 | $ | 256,207 | |||||
Liabilities and stockholders' equity |
|||||||||
Current liabilities: |
|||||||||
Accrued compensation |
$ | 45,363 | $ | 49,313 | |||||
Accounts payable and other accrued liabilities |
8,823 | 11,493 | |||||||
Payable for business acquisitions—current portion |
1,055 | 3,846 | |||||||
Deferred revenue |
3,052 | 2,450 | |||||||
Borrowings under line of credit |
12,000 | — | |||||||
Deferred tax liabilities, net—current portion |
5,731 | — | |||||||
Liabilities associated with divestiture |
— | 2,642 | |||||||
Total current liabilities |
76,024 | 69,744 | |||||||
Payable for business acquisitions |
100 | 1,055 | |||||||
Deferred compensation plan obligations |
10,163 | 9,632 | |||||||
Deferred rent |
6,156 | 6,601 | |||||||
Other long-term liabilities |
252 | 569 | |||||||
Total liabilities |
92,695 | 87,601 | |||||||
Commitments and contingencies |
— |
— |
|||||||
Stockholders' equity |
|||||||||
Common stock, $.001 par value, 200,000,000 shares authorized, 25,895,679 and 25,559,253 shares outstanding at December 31, 2009 and 2008, respectively |
26 | 26 | |||||||
Additional paid-in capital |
174,917 | 172,005 | |||||||
Accumulated other comprehensive loss |
(690 | ) | (1,407 | ) | |||||
Accumulated deficit |
(76,137 | ) | (2,018 | ) | |||||
Total stockholders' equity |
98,116 | 168,606 | |||||||
Total liabilities and stockholders' equity |
$ | 190,811 | $ | 256,207 | |||||
See notes to consolidated financial statements
70
LECG CORPORATION AND SUBSIDIARIES
CONSOLIDATED STATEMENTS OF OPERATIONS
(in thousands, except per share amounts)
| |
Year ended December 31, | ||||||||||||
|---|---|---|---|---|---|---|---|---|---|---|---|---|---|
| |
2009 | 2008 | 2007 | ||||||||||
Fee-based revenues, net |
$ | 253,376 | $ | 322,714 | $ | 351,544 | |||||||
Reimbursable revenues |
9,820 | 12,965 | 18,885 | ||||||||||
Revenues |
263,196 | 335,679 | 370,429 | ||||||||||
Direct costs |
188,319 | 221,476 | 228,069 | ||||||||||
Reimbursable costs |
10,163 | 13,339 | 18,557 | ||||||||||
Cost of services |
198,482 | 234,815 | 246,626 | ||||||||||
Gross profit |
64,714 | 100,864 | 123,803 | ||||||||||
Operating expenses: |
|||||||||||||
General and administrative expenses |
73,258 | 88,021 | 83,901 | ||||||||||
Depreciation and amortization |
4,997 | 5,939 | 7,284 | ||||||||||
Goodwill impairment |
— | 118,800 | — | ||||||||||
Other impairments |
10,071 | 5,358 | — | ||||||||||
Restructuring charges |
5,659 | 5,937 | 10,689 | ||||||||||
Divestiture charges |
1,800 | 3,136 | — | ||||||||||
Operating (loss) income |
(31,071 | ) | (126,327 | ) | 21,929 | ||||||||
Interest income |
160 | 445 | 635 | ||||||||||
Interest expense |
(2,680 | ) | (636 | ) | (508 | ) | |||||||
Other expense, net |
(571 | ) | (1,849 | ) | (502 | ) | |||||||
(Loss) income from continuing operations |
|||||||||||||
before income taxes |
(34,162 | ) | (128,367 | ) | 21,554 | ||||||||
Income tax expense (benefit) |
39,957 | (41,680 | ) | 8,753 | |||||||||
(Loss) income from continuing operations |
(74,119 | ) | (86,687 | ) | 12,801 | ||||||||
Discontinued operations: |
|||||||||||||
Income from operations of discontinued subsidiary, net of income taxes of $535 |
— | — | 778 | ||||||||||
Loss on disposal of subsidiary |
— | — | (2,219 | ) | |||||||||
Loss from discontinued operations |
— | — | (1,441 | ) | |||||||||
Net (loss) income |
$ | (74,119 | ) | $ | (86,687 | ) | $ | 11,360 | |||||
Basic earnings per share: |
|||||||||||||
(Loss) income from continuing operations |
$ | (2.90 | ) | $ | (3.42 | ) | $ | 0.51 | |||||
Loss from discontinued operations |
— | — | (0.06 | ) | |||||||||
Basic earnings per share |
$ | (2.90 | ) | $ | (3.42 | ) | $ | 0.45 | |||||
Diluted earnings per share: |
|||||||||||||
(Loss) income from continuing operations |
$ | (2.90 | ) | $ | (3.42 | ) | $ | 0.51 | |||||
Loss from discontinued operations |
— | — | (0.06 | ) | |||||||||
Diluted earnings per share |
$ | (2.90 | ) | $ | (3.42 | ) | $ | 0.45 | |||||
Shares used in calculating earnings per share |
|||||||||||||
Basic |
25,583 | 25,330 | 25,117 | ||||||||||
Diluted |
25,583 | 25,330 | 25,499 | ||||||||||
See notes to consolidated financial statements
71
LECG CORPORATION AND SUBSIDIARIES
CONSOLIDATED STATEMENTS OF CASH FLOWS
(in thousands)
| |
Year ended December 31, | |||||||||||
|---|---|---|---|---|---|---|---|---|---|---|---|---|
| |
2009 | 2008 | 2007 | |||||||||
Cash flows from operating activities |
||||||||||||
Net (loss) income |
$ | (74,119 | ) | $ | (86,687 | ) | $ | 11,360 | ||||
Adjustments to reconcile net (loss) income to net cash (used) provided by in operating activities: |
||||||||||||
Bad debt expense |
1,032 | 132 | 174 | |||||||||
Depreciation and amortization of property and equipment |
4,285 | 4,489 | 4,884 | |||||||||
Amortization of intangible assets |
712 | 1,450 | 2,415 | |||||||||
Goodwill impairment |
— | 118,800 | — | |||||||||
Other impairments |
10,071 | 5,358 | — | |||||||||
Amortization of signing, retention and performance bonuses |
17,767 | 16,522 | 12,091 | |||||||||
Deferred taxes |
49,492 | (44,708 | ) | (5,770 | ) | |||||||
Equity-based compensation |
3,967 | 6,778 | 5,731 | |||||||||
Excess tax benefits from equity-based compensation |
— | (41 | ) | 736 | ||||||||
Non cash restructuring charges |
1,150 | 2,441 | 7,639 | |||||||||
Divestiture charges |
1,800 | 3,136 | — | |||||||||
Loss on disposal of subsidiary |
— | — | 2,219 | |||||||||
Other |
— | 71 | (24 | ) | ||||||||
Changes in assets and liabilities: |
||||||||||||
Accounts receivable |
(1,449 | ) | 9,258 | 3,700 | ||||||||
Signing, retention and performance bonuses paid |
(10,552 | ) | (17,397 | ) | (38,428 | ) | ||||||
Prepaid and other current assets |
2,138 | (57 | ) | (2,274 | ) | |||||||
Accounts payable and other accrued liabilities |
(3,246 | ) | 4,969 | 725 | ||||||||
Income taxes receivable |
(5,271 | ) | (4,485 | ) | 2,062 | |||||||
Accrued compensation |
(5,194 | ) | (4,260 | ) | 10,650 | |||||||
Deferred revenue |
671 | (348 | ) | 359 | ||||||||
Deferred compensation plan assets, net of liabilities |
197 | 415 | (1,091 | ) | ||||||||
Deferred rent |
(1,154 | ) | (947 | ) | (310 | ) | ||||||
Other assets |
980 | (3,646 | ) | 536 | ||||||||
Other liabilities |
(337 | ) | 870 | (148 | ) | |||||||
Net cash (used) provided by operating activities |
(7,060 | ) | 12,113 | 17,236 | ||||||||
Cash flows from investing activities |
||||||||||||
Business acquisitions earn out payments |
(5,585 | ) | (9,736 | ) | (23,771 | ) | ||||||
Divestiture payments |
(3,275 | ) | — | — | ||||||||
Purchase of property and equipment |
(1,381 | ) | (3,217 | ) | (3,839 | ) | ||||||
Proceeds from disposal of subsidiary, net of cash transferred |
— | — | 1,029 | |||||||||
Proceeds from note receivable |
566 | 536 | — | |||||||||
Proceeds from divestiture |
619 | — | — | |||||||||
Other |
1 | (177 | ) | 63 | ||||||||
Net cash used in investing activities |
(9,055 | ) | (12,594 | ) | (26,518 | ) | ||||||
Cash flows from financing activities |
||||||||||||
Borrowings under revolving credit facility |
45,000 | 61,000 | 13,000 | |||||||||
Repayments under revolving credit facility |
(33,000 | ) | (61,000 | ) | (13,000 | ) | ||||||
Proceeds from exercise or issuance of stock to employee and other |
— | 46 | 2,097 | |||||||||
Excess tax benefits from equity-based compensation |
— | 41 | 1,282 | |||||||||
Proceeds from issuance of stock—employee stock purchase plan |
40 | 85 | 199 | |||||||||
Payment of loan fees |
(2,692 | ) | — | (102 | ) | |||||||
Other |
— | 1 | 77 | |||||||||
Net cash provided by financing activities |
9,348 | 173 | 3,553 | |||||||||
Effect of exchange rates on changes in cash |
301 | (1,784 | ) | 842 | ||||||||
Decrease in cash and cash equivalents |
(6,466 | ) | (2,092 | ) | (4,887 | ) | ||||||
Cash and cash equivalents, beginning of year |
19,510 | 21,602 | 26,489 | |||||||||
Cash and cash equivalents, end of year |
$ | 13,044 | $ | 19,510 | $ | 21,602 | ||||||
Supplemental disclosure |
||||||||||||
Cash paid for interest |
$ | 1,350 | $ | 400 | $ | 259 | ||||||
Cash (refunded) paid for income taxes |
$ | (4,502 | ) | $ | 7,392 | $ | 10,421 | |||||
Non cash investing and financing activities |
||||||||||||
Establishment of note receivable from SVEWG |
$ | — | $ | — | $ | 3,000 | ||||||
Forgiveness of purchase price liability to SVEWG |
$ | — | $ | — | $ | 2,000 | ||||||
See notes to consolidated financial statements
72
LECG CORPORATION AND SUBSIDIARIES
CONSOLIDATED STATEMENTS OF STOCKHOLDERS' EQUITY
(in thousands, except share data)
| |
Common stock | |
Accumulated other comprehensive income (loss) |
|
|
|||||||||||||||||
|---|---|---|---|---|---|---|---|---|---|---|---|---|---|---|---|---|---|---|---|---|---|---|
| |
Retained earnings (accumulated deficit) |
|
Total comprehensive income (loss) |
|||||||||||||||||||
| |
Shares | Par value | Additional paid-in capital |
Total stockholders' equity |
||||||||||||||||||
Balance January 1, 2007 |
24,907,072 | 25 | 156,900 | 73,309 | 880 | 231,114 | ||||||||||||||||
Issuance of common stock— |
13,286 | — | 199 | — | — | 199 | ||||||||||||||||
Issuance of restricted stock, net |
117,505 | — | 1 | — | — | 1 | ||||||||||||||||
Equity compensation |
— | — | 5,771 | — | — | 5,771 | ||||||||||||||||
Exercise of options |
406,815 | — | 2,097 | — | 2,097 | |||||||||||||||||
Tax benefit of stock option exercises and Employee Stock Purchase Plan disqualifying dispositions |
— | — | 1,282 | — | — | 1,282 | ||||||||||||||||
Option profit forfeiture |
— | — | 75 | — | — | 75 | ||||||||||||||||
Net income |
— | — | — | 11,360 | — | 11,360 | $ | 11,360 | ||||||||||||||
Foreign currency translation adjustment |
— | — | — | — | 1,591 | 1,591 | 1,591 | |||||||||||||||
Total comprehensive income |
— | — | — | — | — | — | $ | 12,951 | ||||||||||||||
Balance at December 31, 2007 |
25,444,678 | 25 | 166,325 | 84,669 | 2,471 | 253,490 | ||||||||||||||||
Issuance of common stock— |
10,770 | — | 85 | — | — | 85 | ||||||||||||||||
Issuance of restricted stock, net |
89,000 | 1 | 1 | — | — | 2 | ||||||||||||||||
Equity compensation |
— | — | 6,778 | — | — | 6,778 | ||||||||||||||||
Exercise of options |
14,805 | — | 46 | — | — | 46 | ||||||||||||||||
Tax deficiencies on equity awards |
— | — | (1,230 | ) | — | — | (1,230 | ) | ||||||||||||||
Net loss |
— | — | — | (86,687 | ) | — | (86,687 | ) | $ | (86,687 | ) | |||||||||||
Foreign currency translation adjustment |
— | — | — | — | (3,878 | ) | (3,878 | ) | (3,878 | ) | ||||||||||||
Total comprehensive loss |
— | — | — | — | — | — | $ | (90,565 | ) | |||||||||||||
Balance at December 31, 2008 |
25,559,253 | 26 | 172,005 | (2,018 | ) | (1,407 | ) | 168,606 | ||||||||||||||
Issuance of common stock— |
13,837 | — | 40 | — | — | 40 | ||||||||||||||||
Issuance of restricted stock, net |
322,589 | — | — | — | — | — | ||||||||||||||||
Equity compensation |
— | — | 4,005 | — | — | 4,005 | ||||||||||||||||
Tax deficiencies on equity awards |
— | — | (1,133 | ) | — | — | (1,133 | ) | ||||||||||||||
Net loss |
— | — | — | (74,119 | ) | — | (74,119 | ) | $ | (74,119 | ) | |||||||||||
Foreign currency translation adjustment |
— | — | — | — | 717 | 717 | 717 | |||||||||||||||
Total comprehensive loss |
— | — | — | — | — | — | $ | (73,402 | ) | |||||||||||||
Balance at December 31, 2009 |
25,895,679 | $ | 26 | $ | 174,917 | $ | (76,137 | ) | $ | (690 | ) | $ | 98,116 | |||||||||
See notes to consolidated financial statements
73
LECG CORPORATION AND SUBSIDIARIES
NOTES TO CONSOLIDATED FINANCIAL STATEMENTS
1. Basis of presentation and operations
The accompanying consolidated financial statements include the accounts of LECG Corporation and its wholly owned subsidiaries (collectively, the "Company" or "LECG"). The Company provides expert services, including economic and financial analysis, expert testimony, litigation support and strategic management consulting to a broad range of public and private enterprises. Services are provided by academics, recognized industry leaders and former high-level government officials (collectively, "experts") with the assistance of a professional support staff. The Company's experts are comprised of employees of the Company as well as exclusive independent contractors. These services are provided primarily in the United States (U.S.) from the Company's headquarters in Emeryville, California and its 18 other offices across the country. The Company also has international offices in Argentina, Australia, Belgium, France, Hong Kong, Italy, Mexico, New Zealand, Spain and the United Kingdom. Subsequent to December 31, 2009, the Company completed a Merger with SMART Business Holdings, Inc. ("SMART") which results in an expansion in the services offered by the Company and in the number of its office locations. See "Note 18—Subsequent event—SMART merger and term loan facility" for more information regarding the Merger, the receipt of $25.0 million in exchange for 6.3 million of Preferred Stock, the assumption of $42.8 million of debt and a discussion of debt covenant compliance.
2. Summary of significant accounting policies
Principles of consolidation
The accompanying consolidated financial statements include the accounts of the Company and its wholly owned subsidiaries. All intercompany transactions and balances have been eliminated from the consolidated results of operations and financial position.
Use of estimates
The preparation of consolidated financial statements in conformity with accounting principles generally accepted in the United States of America requires management to make estimates and assumptions that affect the reported amounts of assets and liabilities, and disclosure of contingent liabilities at the date of the consolidated financial statements and the reported amounts of revenues and expenses during the reporting period. Actual results could differ materially from those estimates. The Company's significant estimates include the valuation of intangible assets, the reserve for uncollectible receivables, the valuation of the deferred tax assets and equity-based compensation assumptions
Fair value
The carrying amount of cash and cash equivalents, accounts receivable, note receivable, deferred compensation plan assets, accounts payable and borrowings under the line of credit approximate their estimated fair values because of the short maturity or variable interest rate of these financial instruments.
Cash and cash equivalents
Cash and cash equivalents consist principally of amounts with an original maturity of 90 days or less.
74
LECG CORPORATION AND SUBSIDIARIES
NOTES TO CONSOLIDATED FINANCIAL STATEMENTS (Continued)
2. Summary of significant accounting policies (Continued)
Accounts receivable, reserves for unrealizable revenue and allowance for bad debts
Accounts receivable consist of unbilled and billed amounts due from clients, which are recognized net of reserves for unrealizable revenue and allowances for bad debts. The Company maintains reserves for unrealizable revenue and allowance for bad debts based on several factors, including the length of time receivables are past due, economic trends and conditions affecting our clients base, specific knowledge of a client's inability to meet its financial obligations, significant one-time events and historical write-off experience. The Company reviews the adequacy of its reserves on a quarterly basis. These estimates may be significantly different from actual results. If the financial condition of a client deteriorates in the future, impacting the client's ability to make payments, an increase to our allowance might be required or our allowance may not be sufficient to cover actual write-offs.
The Company provided an allowance for bad debts as follows (in thousands):
| |
December 31, | |||||||||
|---|---|---|---|---|---|---|---|---|---|---|
| |
2009 | 2008 | 2007 | |||||||
Balance at beginning of year |
$ | 973 | $ | 866 | $ | 906 | ||||
Charged to general and administrative expenses |
1,032 | 132 | 174 | |||||||
Amounts written off and other adjustments, net of recoveries |
(13 | ) | (25 | ) | (214 | ) | ||||
Balance at end of year |
$ | 1,992 | $ | 973 | $ | 866 | ||||
Signing, retention and performance bonuses
Hiring experts sometimes involves the payment of cash signing bonuses. In some cases, the payment of a portion of a signing bonus is due at a future date. Signing bonuses are recognized when the payment is made or the obligation to pay such bonus is incurred and are generally amortized over the period for which they are recoverable from the individual expert up to a maximum period of seven years. Retention of key experts sometimes involves the payment of cash retention bonuses. Retention bonuses are recognized on the execution date of the retention agreement and are amortized over the period for which unearned amounts are recoverable from the individual expert, up to a maximum of seven years. The Company has also paid or is obligated to pay certain performance bonuses that are subject to recovery of unearned amounts if the expert were to voluntarily leave the Company, be terminated for cause, or fail to meet certain performance criteria prior to a specified date. Like signing and retention bonuses, these performance bonuses are amortized over the period which unearned amounts are recoverable from the individual expert, up to a maximum period of seven years, and the Company recognizes such performance bonuses at the time that it determines it to be more likely than not that the performance criteria will be met.
Most of the Company's agreements allow the Company to recover signing, retention and performance bonuses from the employee if he or she were to voluntarily leave the Company or be terminated for cause prior to a specified date over periods ranging from one to 15 years. However, for the purpose of recognizing expense, the Company amortizes such signing, retention and performance bonuses over the shorter of the contractual recovery period or seven years. If an employee is involuntarily terminated, the Company generally writes off the unearned amount at the time of termination. In 2009, 2008 and 2007, the Company wrote-off $6.9 million, $2.3 million and $3.7 million,
75
LECG CORPORATION AND SUBSIDIARIES
NOTES TO CONSOLIDATED FINANCIAL STATEMENTS (Continued)
2. Summary of significant accounting policies (Continued)
respectively, of unearned signing, retention and performance bonuses in connection with the Company's restructuring activities (see "Note 14—Restructuring, divestiture and other asset impairment charges").
Amortization of signing, retention and performance bonuses included in cost of services was $16.9 million, $16.2 million, and $12.0 million in 2009, 2008 and 2007, respectively. Amortization of signing, retention and performance bonuses included in general and administrative expenses was $0.9 million, $0.3 million and $0.1 million in 2009, 2008 and 2007, respectively.
The estimated future bonus amortization associated with signing, retention and performance bonuses recognized as of December 31, 2009 is as follows (in thousands):
2010 |
$ | 14,046 | ||
2011 |
8,179 | |||
2012 |
5,438 | |||
2013 |
4,466 | |||
2014 |
2,006 | |||
Thereafter |
204 | |||
Total |
$ | 34,339 | ||
Property and equipment
Property and equipment is stated at cost, net of accumulated depreciation and amortization. Depreciation and amortization is computed using the straight-line method over the assets' estimated useful life. The cost of leasehold improvements is amortized over the shorter of the useful life of the asset or the applicable lease term. Estimated useful lives generally range from three to five years for computers, software, and other equipment, and five years for furniture and fixtures. The Company's policy is to evaluate its property and equipment for impairment whenever events or changes in circumstances indicate that the carrying amount of such assets may not be recoverable. Recoverability of assets to be held and used is measured by a comparison of the carrying amount of the asset to future undiscounted net cash flows expected to be generated by the asset. If such asset is considered to be impaired, the impairment to be recognized would be measured as the difference between the related carrying amount and fair value.
Goodwill and other intangible assets
Goodwill relates to the Company's business acquisitions, reflecting the excess of purchase price over fair value of identifiable net assets acquired. Financial Accounting Standards Board ("FASB") Accounting Standard Codification ("ASC") 350, Intangible—Goodwill and Other ("ASC 350"), provides that goodwill and intangible assets with indefinite lives be tested for impairment at least annually, or whenever events or changes in circumstances indicate the carrying amounts of these assets may not be recoverable. The Company's annual impairment test is performed during the fourth quarter of each year using an October 1st measurement date.
Factors that the Company considers important in determining whether to perform an impairment review on a date other than October 1st, include significant underperformance relative to forecasted operating results, significant negative industry or economic trends, and permanent declines in its stock price and related market capitalization. If the Company determines that the carrying value of goodwill
76
LECG CORPORATION AND SUBSIDIARIES
NOTES TO CONSOLIDATED FINANCIAL STATEMENTS (Continued)
2. Summary of significant accounting policies (Continued)
may not be recoverable, it will assess impairment based on a projection of discounted future cash flows for each reporting unit, or some other fair value measurement such as the quoted market price of its stock and the resulting market capitalization, and then measure the amount of impairment, if necessary, based on the difference between its carrying value and implied fair value. The Company determined that there was no impairment to its $1.8 million goodwill asset as of December 31, 2009.
Other intangible assets that are separable from goodwill and have determinable useful lives are valued separately and amortized over their expected useful lives. Other intangible assets consist principally of customer relationships, contract rights, non-compete agreements and trade processes and are generally amortized over six months to 20 years. The Company evaluates the recoverability of its other intangible assets over their remaining useful life when changes in events or circumstances warrant an impairment review. If the carrying value of an intangible asset is determined to be impaired and unrecoverable over its originally estimated useful life, the Company will record an impairment charge to reduce the asset's carrying value to its fair value and then amortize the remaining value prospectively over the revised remaining useful life. The Company generally determines the fair value of its intangible asset using a discounted cash flow model as quoted market prices for these types of assets is not readily available. The Company determined that there was no impairment to its other intangible assets at December 31, 2009.
Income taxes
The Company accounts for income taxes in accordance with FASB ASC 740, Income Taxes ("ASC 740"), under which deferred assets and liabilities are recognized based upon anticipated future tax consequences attributable to differences between consolidated financial statement carrying values of assets and liabilities and their respective tax bases. A valuation allowance is established to reduce the carrying value of deferred tax assets if it is considered more likely than not that such assets will not be realized. The Company accounts for uncertainty in income taxes recognized in its consolidated financial statements using a two-step approach. The first step is to evaluate the tax position for recognition by determining if the weight of available evidence indicates it is more likely than not that the position will be sustained on audit, including resolution of related appeals or litigation processes, if any. The second step is to measure the tax benefit as the largest amount which is more than 50% likely of being realized upon ultimate settlement.
Deferred revenue
Deferred revenue consists of retainers paid by clients to the Company. Such amounts are recognized as revenue when services are rendered.
Deferred rent
At December 31, 2009, the Company leased office space in 32 cities. The Company recognizes rent expense on a straight-line basis over the term of the lease, taking into account lessor incentives for tenant improvements, periods where no rent payment is required ("rent holidays") and escalation clauses. The Company recognizes deferred rent as the difference between the expense recorded on a straight-line basis and the payments made per the terms of the lease. Certain leases include landlord incentives for leasehold improvements. These incentives are recorded as deferred rent and amortized on a straight-line basis as reductions to rent expense over the lease term.
77
LECG CORPORATION AND SUBSIDIARIES
NOTES TO CONSOLIDATED FINANCIAL STATEMENTS (Continued)
2. Summary of significant accounting policies (Continued)
Revenue recognition
Revenue includes all amounts earned that are billed or billable to clients, including reimbursable expenses, and have been reduced for amounts that are estimated to be unrealizable. Expert revenues consist of revenues generated by experts who are employees of the Company as well as revenues generated by experts who are independent contractors. There is no operating, business or other substantive distinction between the Company's employee experts and the Company's exclusive independent contractor experts.
Revenues primarily arise from time and expense contracts, which are recognized in the period in which the services are performed. The Company also infrequently enters into certain performance-based contracts for which performance fees are dependent upon a successful outcome, as defined by the terms of the engagement. Revenues related to performance-based fee contracts are recognized in the period when the earnings process is complete and the Company has received payment for the services performed under the contract. Revenues under these types of arrangements have not been material to date. Revenues are also generated from fixed price contracts, which are recognized as the agreed upon services are performed. Fixed price contract revenues are not a material component of total revenues.
The Company recognizes revenue net of an estimate for amounts that will not be collectible from the client due to fee adjustments. This estimate is based on several factors, including the Company's historical percentage of fee adjustments and its periodic review of unbilled and billed receivables. These estimates are reviewed by management on a quarterly basis.
Cost of services
Costs of services consist of compensation to experts and professional staff, project costs that include reimbursable expenses and fees charged for outside services, equity-based compensation, and amortization of signing, retention, and performance bonuses.
The majority of the Company's compensation to experts consists of expert fees and project origination fees. Expert fees represent amounts earned by the experts based on their contractual "pass-through" percentage applied to revenues generated by work they perform in the period. Project origination fees represent the contractual percentage applied to professional staff revenue, and in certain circumstances other fee-based revenue, recognized on engagements secured by such experts. Expert fees and project origination fees are accrued in the period in which the associated revenue is recognized. The remaining experts' compensation consists of compensation paid based on a percentage of performance targets such as revenue or gross margin associated with the experts' engagements or under a salary and bonus model.
The Company makes advance payments or draws to many of its non-salaried experts. Any outstanding draws previously paid to experts are deducted from the experts' fee payments until fully recovered. The Company recognizes an estimate for expert advances that it considers to be unrecoverable. The Company recognized additional expense (benefit) in connection with its estimate of these unrecoverable amounts of ($0.2) million, $0.1 million and ($0.7) million in 2009, 2008 and 2007, respectively.
78
LECG CORPORATION AND SUBSIDIARIES
NOTES TO CONSOLIDATED FINANCIAL STATEMENTS (Continued)
2. Summary of significant accounting policies (Continued)
Equity-based compensation
The Company accounts for equity based compensation under the provisions of FASB ASC 718, Compensation—Stock Compensation ("ASC 718"). ASC 718 requires the recognition of the fair value of equity-based compensation in operations. The fair value of the Company's stock option awards are estimated using a Black-Scholes option valuation model. This model requires the input of highly subjective assumptions and adjustments including expected stock price volatility and the estimated life of each award. In addition, the calculation of equity-based compensation costs requires that the Company estimate the number of awards that will be forfeited during the vesting period. The Company's forfeiture rate is based upon its historical experience as well as anticipated employee turnover considering certain qualitative factors. The fair value of equity-based awards is amortized over the vesting period of the award and the Company elected to use the straight-line method for awards granted after the adoption of ASC 718.
Foreign currency translation
Assets and liabilities of the Company's non-U.S. subsidiaries that operate in a local currency environment are generally translated to U.S. dollars at period-end exchange rates. Income and expense items are translated at weighted average rates of exchange prevailing during the year. Translation adjustments are recorded in accumulated other comprehensive (loss) income within stockholders' equity. Foreign currency transaction gains and losses are a result of the effect of exchange rate changes on transactions denominated in currencies other than the functional currency, including U.S. dollars. Gains and losses on those foreign currency transactions are included in determining net (loss) income for the period in which exchange rates change.
Comprehensive (loss) income
Comprehensive (loss) income represents net (loss) income plus other comprehensive (loss) income resulting from changes in foreign currency translation.
Discontinued operations
The Company has presented the Silicon Valley Expert Witness Group, Inc. ("SVEWG") as a discontinued operation in its 2007 consolidated financial statements, consistent with the provisions of FASB ASC 360, Property, Plant, and Equipment ("ASC 360"). The 2007 results from SVEWG's operations, net of taxes are reflected in the accompanying consolidated financial statements as discontinued operations (see "Note 15—Discontinued operations").
Segment reporting
FASB ASC 280, Segment Reporting ("ASC 280"), establishes annual and interim reporting standards for an enterprise's business segments and related disclosures about its products, services, geographic areas and major clients. LECG had historically managed and reported internal financial information on a consolidated, office location, and individual expert/practice group profitability basis. As of the second quarter of 2008, the Company reorganized its historical practice groups and individual experts into two operating segments: Economics Services and Finance and Accounting Services. The Chief Operating Decision Maker of LECG ("CODM") considers the key profit/loss measurement of the segments to be gross profit and gross margin. Segment managers, who are accountable directly to the Company's CEO
79
LECG CORPORATION AND SUBSIDIARIES
NOTES TO CONSOLIDATED FINANCIAL STATEMENTS (Continued)
2. Summary of significant accounting policies (Continued)
(who is the CODM), were assigned to each operating segment. See "Note 16—Segment reporting" for a presentation of the Company's revenues, cost of services, gross profit and gross margin and other operating metrics.
Recently issued accounting standards
In December 2007, the FASB issued ASC 805, Business Combinations ("ASC 805"). ASC 805 significantly changes the accounting for business combinations in a number of areas including the treatment of contingent consideration, contingencies, acquisition costs, in-process research and development and restructuring costs. In addition, under ASC 805, changes in deferred tax asset valuation allowances and acquired income tax uncertainties in a business combination after the measurement period will impact income tax expense. In April 2009, the FASB issued additional guidance that requires assets acquired and liabilities assumed in a business combination that arise from contingencies be recognized at fair value only if fair value can be reasonably estimated, and eliminates the requirement to disclose an estimate of the range of outcomes of recognized contingencies at the acquisition date. ASC 805 is effective for fiscal years beginning after December 15, 2008. The adoption of ASC 805, prospectively, will have a material effect on the Company's results of operations and financial position to the extent the Company has acquisitions, as costs that have historically been capitalized as part of the purchase price will now be expensed as incurred, such as accounting, legal and other professional fees.
In December 2007, the FASB issued ASC 810, Consolidation ("ASC 810"), which requires noncontrolling interests in subsidiaries to be included in the equity section of the balance sheet. It clarifies that a noncontrolling interest in a subsidiary, which is sometimes referred to as minority interest, is a third-party ownership interest in the consolidated entity that should be reported as a component of equity in the consolidated financial statements. Among other requirements, ASC 810 requires the Consolidated Statement of Operations to be reported at amounts that include the amounts attributable to both the parent and the noncontrolling interest. ASC 810 also requires disclosure on the face of the Consolidated Statement of Operations of the amounts of consolidated net income attributable to the parent and to the non-controlling interest. ASC 810 is effective for fiscal years beginning on or after December 15, 2008. The adoption of ASC 810 did not have a material impact on the Company's Consolidated Financial Statements.
3. Business acquisitions and additional payments related to prior acquisitions
The Company's historical business acquisitions have consisted almost entirely of experts and professional staff having specialized knowledge of specific markets, regulations and industries. Each of the acquired businesses is fundamentally dependent on the qualifications, expertise and reputation of the individuals. Therefore, in each acquisition, the excess of purchase price over the net tangible and intangible assets acquired and any additional performance-based payments are treated as goodwill under ASC 805.
In March 2007, the Company acquired substantially all of the operating assets of The Secura Group, LLC ("Secura"), an expert, consulting and regulatory compliance services firm specializing in the financial services industry. In May 2009, the Company entered into an amendment to the Secura asset purchase agreement to settle certain contingent obligations to the seller. The original agreement required additional purchase price payments of up to $2.5 million after December 2010, if certain
80
LECG CORPORATION AND SUBSIDIARIES
NOTES TO CONSOLIDATED FINANCIAL STATEMENTS (Continued)
3. Business acquisitions and additional payments related to prior acquisitions (Continued)
performance targets were achieved through December 2010. Under the terms of the amendment, the Company will make guaranteed payments totaling $1.8 million, of which $1.7 million was paid in December 2009 and the remaining $0.1 million is due March 2011. There are no further performance-based purchase price commitments.
In May 2006, the Company acquired substantially all of the assets of BMB Mack Barclay, Inc. and affiliates ("Mack Barclay"), an expert services firm specializing in complex economic and accountancy issues in business and litigation environments. As a result of achieving specified performance targets, the Company recognized $4.1 million of additional purchase price, of which $2.3 million and $1.8 million was paid in July 2008 and 2007, respectively. In September 2008, the Company entered into an amendment to the Mack Barclay asset purchase agreement to settle all remaining contingent obligations to the seller. The original agreement provided for additional purchase price payments of up to $4.7 million by July 2011, if certain performance targets were achieved through April 2011. Under the terms of the amendment, the Company will make guaranteed payments totaling $4.1 million, of which $3.0 million was paid in December 2008 and the remaining $1.1 million is due July 2010. There are no further performance-based purchase price commitments.
In December 2005, the Company acquired substantially all of the assets of Lancaster Consulting LLC ("Lancaster"), an expert services firm specializing in general management, mergers and acquisitions, litigation and financial management consulting. As a result of achieving specified performance targets, the Company recognized $1.3 million of additional purchase price, of which $0.7 million, $0.2 million and $0.4 million was paid in February 2009, and March 2008 and 2007, respectively. There are no further performance-based purchase price commitments.
In November 2005, the Company acquired substantially all of the assets of Neilson Elggren LLP ("Neilson Elggren"), a financial and insolvency expert and consulting services firm. As a result of achieving specified performance targets, the Company recognized $3.7 million of additional purchase price, of which $1.0 million, $1.5 million and $1.2 million was paid in January 2009, 2008 and 2007, respectively. An additional payment of up to $1.5 million will also be made in December 2010 if higher targets are met by October 2010.
In August 2005, the Company purchased the business (including certain assets, experts and professional staff) of Bates Private Capital Inc. ("Bates"), an expert services firm specializing in dispute resolution for the retail securities industry. As a result of achieving specified performance targets, the Company recognized $8.1 million of additional purchase price, of which $4.6 million and $3.5 million was paid in 2007 and 2006, respectively. In November 2008, the Company entered into an amendment to the Bates asset purchase agreement to settle all remaining contingent obligations to the seller. The original agreement provided for additional purchase price payments of up to $4.9 million by September 2011, if certain performance targets were achieved through July 2011. Under the terms of the amendment, the Company will make guaranteed payments totaling $3.9 million, of which $2.0 million was paid in November 2008 and the remaining $1.9 million was paid in January 2009. There are no further performance-based purchase price commitments.
In March 2004, the Company acquired the business of Low Rosen Taylor Soriano ("LRTS"), an expert services firm located in Toronto, Canada, providing expert services in the areas of business valuation and damages quantification. As a result of achieving certain performance targets, the Company recognized additional purchase price of $4.2 million, of which $0.3 million, $0.5 million,
81
LECG CORPORATION AND SUBSIDIARIES
NOTES TO CONSOLIDATED FINANCIAL STATEMENTS (Continued)
3. Business acquisitions and additional payments related to prior acquisitions (Continued)
$0.8 million, $1.6 million and $1.0 million was paid in February 2009, 2008, 2007, 2006 and 2005, respectively. There are no further performance-based purchase price commitments.
Changes in the carrying amount of goodwill in 2009 and 2008, accrued purchase price payable at December 31, 2009, potential remaining purchase price and date of final potential payment by acquisition are as follows (in thousands):
| |
|
|
|
Accrued purchase price payable at 12/31/2009(1) |
|
|
||||||||||||
|---|---|---|---|---|---|---|---|---|---|---|---|---|---|---|---|---|---|---|
| |
|
Year ended December 31, | |
Date of final potential payment(3) |
||||||||||||||
| |
Acquisition Date |
Potential remaining payments(2) |
||||||||||||||||
| |
2009 | 2008 | ||||||||||||||||
Goodwill balance at beginning of year |
$ | — | $ | 106,813 | ||||||||||||||
Additional acquisition related payments(4): |
||||||||||||||||||
Secura |
Mar-07 | $ | 1,800 | $ | — | $ | 100 | $ | — | Mar-11 | ||||||||
Mack Barclay |
May-06 | — | 6,021 | 1,055 | — | Jul-10 | ||||||||||||
Lancaster |
Dec-05 | — | 738 | — | — | n/a | ||||||||||||
Neilson Elggren |
Nov-05 | — | 1,006 | — | 1,500 | Dec-10 | ||||||||||||
Bates |
Aug-05 | — | 3,850 | — | — | n/a | ||||||||||||
LRTS |
Mar-04 | — | 375 | — | — | n/a | ||||||||||||
Other |
— | — | (3 | ) | — | — | n/a | |||||||||||
Total additions |
1,800 | 11,987 | $ | 1,155 | $ | 1,500 | ||||||||||||
Goodwill impairment (see Note 4) |
— | (118,800 | ) | |||||||||||||||
Goodwill balance at end of year |
$ | 1,800 | $ | — | ||||||||||||||
- (1)
- Included
in "Payable for business acquisitions" on the Consolidated Balance Sheets.
- (2)
- Represents
additional purchase price and goodwill to be recognized in the future if specified performance targets and conditions are met.
- (3)
- Represents
final date of any potential payment.
- (4)
- Represents additional payments purchase price earned or settled by sellers subsequent to the business acquisition.
4. Goodwill
In May 2009, the Company entered into an amendment to the Secura Group, LLC ("Secura") asset purchase agreement to settle certain contingent obligations to the former sellers. As a result, the Company is required to make additional purchase price payments totaling $1.8 million, of which $1.7 million was paid December 31, 2009 and $0.1 million is due March 1, 2011. The original asset purchase agreement required an additional purchase price payment of up to $2.5 million if Secura exceeded a compound annual growth rate of revenue of 7% or greater and a cumulative gross margin of 40% or greater from February 2007 to December 2010. Secura had exceeded these financial performance targets through May 2009 and the Company negotiated a $1.8 million settlement with the
82
LECG CORPORATION AND SUBSIDIARIES
NOTES TO CONSOLIDATED FINANCIAL STATEMENTS (Continued)
4. Goodwill (Continued)
Secura sellers for this contingent obligation. The Company recorded the purchase price settlement as goodwill based on Secura's financial performance in excess of the earn-out targets and its original operating forecast through the date of the settlement agreement in May 2009.
The additional purchase price goodwill asset is subject to review for impairment under the criteria outlined in ASC 350. For impairment testing purposes, the Company assigned this goodwill to the Finance and Accounting Services segment. At December 31, 2009, the Economics reporting unit did not have any assigned goodwill. The Company performed its annual goodwill impairment test using an October 1st measurement date. The fair value of the FAS reporting unit exceeded its carrying value; and as a result, the Company concluded that the $1.8 million goodwill asset was not impaired as of the measurement date or at December 31, 2009.
The Company completed its annual goodwill impairment test in connection with the preparation of its 2008 annual consolidated financial statements using an October 1st measurement date. Due to the worldwide financial crisis and decreased global economic activity in the latter half of 2008, particularly the substantial and continued economic slowdown in the U. S. and Europe, the Company experienced a significant decrease in revenues in the fourth quarter of 2008. As a result, the Company incorporated these events and circumstances into its cash flow model to determine the fair value of the Company's two reporting units and the implied fair value of the goodwill assigned to those reporting units. The implied fair value of each reporting units' goodwill was significantly less than the carrying value, and as a result, the Company concluded that its goodwill asset was fully impaired for both reporting units. Consequently, a $118.8 million impairment charge was recorded in the fourth quarter of 2008 as follows: $50.0 million related to the Economics Services segment and $68.8 million related to the Finance and Accounting Services segment.
Changes in the carrying amount of goodwill are as follows (in thousands):
| |
December 31, | |||||||
|---|---|---|---|---|---|---|---|---|
| |
2009 | 2008 | ||||||
Balance at beginning of year (gross) |
$ | — | $ | 106,813 | ||||
Additional acquisition related payments (see Note 3) |
1,800 | 11,987 | ||||||
Goodwill impairment charges (accumulated) |
— | (118,800 | ) | |||||
Balance at end of period |
$ | 1,800 | $ | — | ||||
83
LECG CORPORATION AND SUBSIDIARIES
NOTES TO CONSOLIDATED FINANCIAL STATEMENTS (Continued)
5. Other intangible assets
Other intangible assets related to our acquisitions were as follows (in thousands):
| |
Gross(1) | Accumulated amortization(1) |
Impairment | Net | |||||||||
|---|---|---|---|---|---|---|---|---|---|---|---|---|---|
As of December 31, 2008: |
|||||||||||||
Customer relationships |
$ | 10,500 | $ | (3,621 | ) | $ | (4,005 | ) | $ | 2,874 | |||
Other identifiable intangible assets |
2,166 | (799 | ) | (451 | ) | 916 | |||||||
Total |
$ | 12,666 | $ | (4,420 | ) | $ | (4,456 | ) | $ | 3,790 | |||
As of December 31, 2009: |
|||||||||||||
Customer relationships |
$ | 6,495 | $ | (4,081 | ) | $ | — | $ | 2,414 | ||||
Other identifiable intangible assets |
1,626 | (962 | ) | — | 664 | ||||||||
Total |
$ | 8,121 | $ | (5,043 | ) | $ | — | $ | 3,078 | ||||
- (1)
- Fully amortized intangible assets are eliminated from the gross and accumulated amortization amounts in the period the intangible asset fully amortized.
In 2008, the Company determined that the carrying value of its customer relationship intangible asset was not recoverable over the original estimate of its useful life, based in part on lower projected revenues in 2008 as compared to the original revenue projection used to determine the fair value of the customer relationship intangible asset. Also, in November 2008 the Company entered into an agreement with the original shareholders of a prior acquisition to cease using a trade name. As a result of these two changes in events and circumstances, the Company recorded a partial impairment of $4.0 million related to the customer relationship intangible asset and a full impairment of $0.5 million related to the discontinued use of the trade name. The impairment charges reflected as Other impairments in the Consolidated Statement of Operations for the year ended December 31, 2008. As a result of these impairments, annual amortization costs decreased by $0.7 million in 2009.
Intangible asset amortization expense for 2009, 2008 and 2007 was $0.7 million, $1.5 million and $2.4 million respectively.
The estimated future amortization expense for other intangible assets as of December 31, 2009 is as follows (in thousands):
2010 |
$ | 707 | ||
2011 |
656 | |||
2012 |
618 | |||
2013 |
522 | |||
2014 |
333 | |||
Thereafter |
242 | |||
Total |
$ | 3,078 | ||
84
LECG CORPORATION AND SUBSIDIARIES
NOTES TO CONSOLIDATED FINANCIAL STATEMENTS (Continued)
6. Property and equipment
Property and equipment consists of the following (in thousands):
| |
December 31, | ||||||
|---|---|---|---|---|---|---|---|
| |
2009 | 2008 | |||||
Computer equipment |
$ | 9,821 | $ | 9,540 | |||
Furniture, fixture and other |
8,587 | 9,262 | |||||
Software |
7,165 | 6,281 | |||||
Leasehold improvements |
9,394 | 10,093 | |||||
Total |
34,967 | 35,176 | |||||
Less: accumulated depreciation and amortization |
(27,153 | ) | (24,165 | ) | |||
Property and equipment, net |
$ | 7,814 | $ | 11,011 | |||
Depreciation and amortization expense was approximately $4.3 million, $4.5 million and $4.9 million in 2009, 2008 and 2007, respectively.
7. Borrowing arrangements
As of December 31, 2009, the Company had $12.0 million in outstanding borrowings under its revolving credit facility (the "Facility") and $1.6 million in outstanding letters of credit. The interest rate in effect at December 31, 2009 was 6.75%. Borrowings under the Facility are guaranteed by LECG Corporation and its domestic subsidiaries. The Facility expires in December 2011.
On November 4, 2009, the Company executed the fifth amendment to the Facility to provide a waiver for the potential non-compliance with two of the financial covenants (the fixed charge coverage ratio at September 30, 2009, and the ratio of Adjusted EBITDA to aggregate signing and performance bonuses in the 12 months ended September 30, 2009), and to make other modifications to the terms of the Facility. As a result of the fifth amendment, the terms of the Facility included the following: (i) a covenant to maintain a total debt to adjusted EBITDA ratio of less than 2.50 to 1.00 for any computation period ending prior to December 31, 2009, and a ratio of less than 2.00 to 1.00 for computation periods ending on December 31, 2009 and thereafter; (ii) a minimum required fixed charge coverage ratio of 1.25 to 1.00 for the fourth quarter of 2009, 1.50 to 1.00 for the first quarter of 2010, 1.75 to 1.00 for the second quarter of 2010, and 2.00 to 1.00 for the third quarter of 2010 and thereafter; and (iii) the commitment amount under the Facility was $75 million. The lenders continue to hold a security interest in the Company's accounts receivable and other personal property and the Facility continues to include other customary financial and non-financial covenants, including asset, leverage and debt coverage ratios, as well as limitations on the total amount of signing, retention and performance bonus payments made within a 12 month period. At December 31, 2009, the Company was in compliance with these covenants under the Facility.
The Company also amended the Facility in February and March of 2009 to provide waivers for potential non-compliance with certain financial covenants. These amendments have been superseded by the fifth amendment. The Company paid $2.7 million in fees in 2009 related to these amendments which have been amortized ratably over the remaining term of the Facility.
On March 10, 2010 the Company received a $25.0 million cash investment from Great Hill Partners in connection with the SMART Merger and used the proceeds to repay $19.0 million
85
LECG CORPORATION AND SUBSIDIARIES
NOTES TO CONSOLIDATED FINANCIAL STATEMENTS (Continued)
7. Borrowing arrangements (Continued)
outstanding under this Facility. The Facility was terminated on that date and the unamortized portion of capitalized loan fees, totaling approximately $1.6 million, will be expensed in the first quarter of 2010. Also in connection with the SMART Merger, the Company assumed approximately $40.8 million of term debt. See "Note 18—Subsequent event—SMART merger and term loan facility" for more information regarding this term loan facility.
8. Accrued compensation
Accrued compensation consists of the following (in thousands):
| |
December 31, | ||||||
|---|---|---|---|---|---|---|---|
| |
2009 | 2008 | |||||
Expert compensation |
$ | 23,734 | $ | 27,944 | |||
Project origination fees |
10,736 | 12,421 | |||||
Vacation payable |
2,098 | 2,444 | |||||
Professional staff compensation |
1,157 | 1,289 | |||||
Administrative staff compensation |
3,727 | 1,643 | |||||
Signing, retention and performance bonuses payable |
2,125 | 763 | |||||
Other payroll liabilities |
1,786 | 2,809 | |||||
Total accrued compensation |
$ | 45,363 | $ | 49,313 | |||
9. Commitments and contingencies
Legal proceedings
The Company is party to certain legal proceedings arising out of the ordinary course of business, including proceedings that involve claims of wrongful termination by experts and professional staff who formerly worked for the Company, and claims for payment of disputed amounts relating to agreements in which the Company has acquired businesses. The outcomes of these matters are uncertain, and the Company's management is not able to estimate the amount or range of amounts that may become payable as a result of a judgment or settlement in such proceedings. However, in the opinion of the Company's management, the outcomes of these proceedings, individually and in the aggregate, would not have a material adverse effect on the Company's business, financial position, results of operations or cash flows.
Business acquisitions and expert hires
The Company made commitments in connection with its historical business acquisitions that require the Company to pay additional purchase consideration to the sellers if specified performance targets are met over a number of years, as specified in the related purchase agreements. These amounts are generally calculated and payable at the end of a calendar or fiscal year or other interval. The maximum amount of additional purchase consideration that may be required to be paid (by no later than December 2010) is $1.5 million if and when future performance targets are met. See "Note 3—Business acquisitions and additional payments related to prior acquisitions" for commitments and contingencies related to the acquisition of Neilson Elggren.
86
LECG CORPORATION AND SUBSIDIARIES
NOTES TO CONSOLIDATED FINANCIAL STATEMENTS (Continued)
9. Commitments and contingencies (Continued)
In connection with the hiring of certain experts and professional staff in March 2004, the Company will pay additional performance bonuses of $2.5 million if specified performance targets are achieved prior to March 2011. In connection with the hiring of certain experts and professional staff in August 2006, the Company will pay performance bonuses of $6.0 million if specified performance targets are achieved by December 2011. All such performance bonus payments are subject to amortization from the time the bonus is earned through July 2014.
Significant expert retention and performance bonus contingencies
In the third and fourth quarters of 2009, the Company entered into amended employment agreements with several experts and has made or is committed to make the following retention payments or performance-related payments if certain criteria are achieved at various measurement periods from 2010 to 2013. All such retention and performance payments will only be made if the expert is an employee of the Company on the payment date. Also, these payments are subject to amortization and potential repayment if the expert voluntarily terminates or is terminated for cause, generally from the time the payment is made through 2017. The table below presents the potential payments due by the years ending December 31 (in thousands):
Year ending December 31,
|
Retention | Performance | Total | |||||||
|---|---|---|---|---|---|---|---|---|---|---|
2010 |
$ | 5,913 | $ | 3,475 | $ | 9,388 | ||||
2011 |
500 | 12,357 | 12,857 | |||||||
2012 |
500 | 2,920 | 3,420 | |||||||
2013 |
500 | 5,350 | 5,850 | |||||||
2014 |
— | 750 | 750 | |||||||
Thereafter |
— | 1,000 | 1,000 | |||||||
Total |
$ | 7,413 | $ | 25,852 | $ | 33,265 | ||||
Leases
The Company leases its office facilities and certain equipment under non-cancelable operating lease arrangements expiring on various dates through 2017. Such leases include fixed or minimum payments plus, in some cases, free rent periods and scheduled base rent increases over the term of the lease, as well as additional rents based on the Consumer Price Index. The Company recognizes rent expense on a straight-line basis over the lease term. Certain leases provide for monthly payments of
87
LECG CORPORATION AND SUBSIDIARIES
NOTES TO CONSOLIDATED FINANCIAL STATEMENTS (Continued)
9. Commitments and contingencies (Continued)
real estate taxes, insurance and other operating expenses applicable to the property. Future minimum annual lease payments under long-term operating leases are as follows (in thousands):
Year ending December 31,
|
Minimum operating lease commitments |
Sublease income |
Net operating lease commitments |
|||||||
|---|---|---|---|---|---|---|---|---|---|---|
2010 |
$ | 13,621 | $ | (1,128 | ) | $ | 12,493 | |||
2011 |
8,696 | (557 | ) | 8,139 | ||||||
2012 |
6,635 | (282 | ) | 6,353 | ||||||
2013 |
5,858 | (290 | ) | 5,568 | ||||||
2014 |
3,685 | (299 | ) | 3,386 | ||||||
Thereafter |
3,243 | (785 | ) | 2,458 | ||||||
Total |
$ | 41,738 | $ | (3,341 | ) | $ | 38,397 | |||
Rent expense net of sublease income, was $13.0 million, $14.0 million and $14.2 million for 2009, 2008 and 2007, respectively.
10. Income taxes
U.S. and international components of (loss) income from continuing operations before income taxes are as follows (in thousands):
| |
Year ended December 31, | |||||||||
|---|---|---|---|---|---|---|---|---|---|---|
| |
2009 | 2008 | 2007 | |||||||
U.S. |
$ | (33,616 | ) | $ | (134,895 | ) | $ | 12,571 | ||
International |
(546 | ) | 6,528 | 8,983 | ||||||
Total |
$ | (34,162 | ) | $ | (128,367 | ) | $ | 21,554 | ||
88
LECG CORPORATION AND SUBSIDIARIES
NOTES TO CONSOLIDATED FINANCIAL STATEMENTS (Continued)
10. Income taxes (Continued)
Components of the Company's income tax expense (benefit) on income (loss) from continuing operations are as follows (in thousands):
| |
Year ended December 31, | ||||||||||
|---|---|---|---|---|---|---|---|---|---|---|---|
| |
2009 | 2008 | 2007 | ||||||||
Current |
|||||||||||
Federal |
$ | (9,720 | ) | $ | (1,443 | ) | $ | 8,529 | |||
State |
— | — | 3,166 | ||||||||
Foreign |
(266 | ) | 4,352 | 2,828 | |||||||
Total current |
(9,986 | ) | 2,909 | 14,523 | |||||||
Deferred |
|||||||||||
Federal |
40,429 | (36,119 | ) | (4,291 | ) | ||||||
State |
9,419 | (8,464 | ) | (1,340 | ) | ||||||
Foreign |
95 | (6 | ) | (139 | ) | ||||||
Total deferred |
49,943 | (44,589 | ) | (5,770 | ) | ||||||
Income tax (benefit) expense |
$ | 39,957 | $ | (41,680 | ) | $ | 8,753 | ||||
A reconciliation of the statutory federal income tax rate to the Company's effective tax rate for continuing operations is as follows:
| |
Year ended December 31, | |||||||||
|---|---|---|---|---|---|---|---|---|---|---|
| |
2009 | 2008 | 2007 | |||||||
Tax at U.S. statutory rate |
35.0 | % | 35.0 | % | 35.0 | % | ||||
State income taxes |
— | 4.3 | 5.5 | |||||||
Goodwill impairment |
— | (3.2 | ) | — | ||||||
Foreign earnings |
(1.8 | ) | — | (0.1 | ) | |||||
Valuation allowance |
(146.8 | ) | (2.7 | ) | (0.7 | ) | ||||
Acquisition costs |
(2.0 | ) | — | — | ||||||
Other |
(1.4 | ) | (0.9 | ) | 0.9 | |||||
|
(117.0 | )% | 32.5 | % | 40.6 | % | ||||
89
LECG CORPORATION AND SUBSIDIARIES
NOTES TO CONSOLIDATED FINANCIAL STATEMENTS (Continued)
10. Income taxes (Continued)
Deferred income taxes reflect the net tax effects of temporary differences between the carrying amount of assets and liabilities for financial reporting purposes and the amounts for income tax purposes. Significant components of deferred tax assets and liabilities are as follows (in thousands):
| |
As of December 31, | ||||||||
|---|---|---|---|---|---|---|---|---|---|
| |
2009 | 2008 | |||||||
Deferred tax assets: |
|||||||||
Accrued compensation and other |
$ | 13,040 | $ | 13,782 | |||||
Equity-based compensation |
6,734 | 7,183 | |||||||
Net operating losses/capital losses |
3,501 | 1,189 | |||||||
Depreciation and amortizaton |
36,661 | 40,355 | |||||||
Foreign tax credit |
4,975 | 4,721 | |||||||
Total deferred tax asset |
64,911 | 67,230 | |||||||
Deferred tax liabilities: |
|||||||||
State taxes |
(3,896 | ) | (3,378 | ) | |||||
Depreciation and amortization |
(87 | ) | (171 | ) | |||||
Prepaid expenses |
(5,323 | ) | (8,014 | ) | |||||
Total deferred tax liability |
(9,306 | ) | (11,563 | ) | |||||
Valuation allowance |
(55,605 | ) | (4,592 | ) | |||||
Net deferred tax asset |
$ | — | $ | 51,075 | |||||
At December 31, 2009, the Company's gross deferred tax assets included $35.0 million of state net operating loss carryforwards which expire through 2029. The Company also has $2.0 million of capital loss carryforwards which expire in 2012 if not utilized. The Company also has $5.0 million of foreign tax credit carryforwards with a ten-year carryforward period which begin to expire in 2014. The Company's deferred tax assets are generally projected to reverse over the next one to thirty-three years. The extended reversal period is the result of significant income tax basis in intangibles which were impaired for financial statement purposes during 2008. Tax amortization from these assets, if not offset with current taxable income, would create a net operating loss with a 20-year carryforward period for federal tax purposes. At December 31, 2009, the Company reviewed its deferred tax assets, as well as projected taxable income, for recovery using the "more likely than not" approach by assessing the available evidence surrounding its recoverability. The Company considered all available evidence, both positive and negative, including forecasts of future taxable income, tax planning strategies and past operating results which includes the net loss for 2009 and 2008. Even though the Company projects income in future years, based upon past losses, the current economic environment, and the difficulty of accurately projecting taxable income, the Company determined that it was "more likely than not" that its net deferred tax assets may not be realized. Consequently, a full valuation allowance of $55.6 million has been recorded at December 31, 2009, against the Company's net deferred tax assets. In future years, if the Company begins to generate taxable income and management determines that the deferred tax asset is recoverable, the valuation allowance will be reversed. Any such reversal will result in a tax benefit in the period of reversal.
As of December 31, 2008, the Company had valuation allowances on deferred tax assets totaling $4.6 million. In 2008, the Company recognized $3.7 million of valuation allowance based on its
90
LECG CORPORATION AND SUBSIDIARIES
NOTES TO CONSOLIDATED FINANCIAL STATEMENTS (Continued)
10. Income taxes (Continued)
assessment of the likelihood of using its foreign tax credits, net of amounts to be carried back for use in prior periods, within the allowed ten-year carryforward period. In 2007, the Company recognized a valuation allowance of $0.9 million in connection with a $2.2 million capital loss on the sale of SVEWG, as the loss expires in 2012 and the Company's ability to realize the benefit of the loss is limited to future gains from the sale of capital assets.
We are entitled to a deduction for federal and state income taxes when non-qualified stock options are exercised and stock purchased through its Employee Stock Purchase Plan ("ESPP") is sold prior to the end of the required holding period. The Company recognized a total benefit from option exercises and disqualifying dispositions from its ESPP of $2.0 million, $0.2 million and $0 in 2007, 2008 and 2009 respectively. The Company recognized a reduction to previously established deferred tax assets as a consequence of options exercised in the amounts of $0.7 million, $1.4 million and $0 in 2007, 2008 and 2009, respectively, and an increase to additional paid in capital of $1.3 million, $1.2 million and $0 in 2007, 2008 and 2009 as a consequence of both option exercises and disqualifying dispositions from the ESPP.
In 2007 the Argentine taxing authority ("AFIP") completed its audit of LECG Buenos Aires' ("LECG BA") income tax returns for 2003 and 2004 and its 2005 withholding tax return and issued a notice to disallow certain deductions claimed for those years as well as a proposal to impose a withholding tax on certain payments made by LECG BA to LECG LLC, its U.S. parent company. The AFIP proposed to limit the deductibility of costs charged by LECG LLC to LECG BA for expert and staff services performed by LECG personnel outside of Argentina on client related matters, and to require withholding tax on certain payments by LECG BA for services rendered by LECG personnel outside of LECG BA. In 2008, the Company elected to pay to the Argentine government $2.0 million for potential tax deficiencies and $1.3 million of potential interest in order to avoid the accrual of additional interest, while reserving its right to defend its position in Argentine tax court. The Company has recorded $3.3 million of payments to the Argentine taxing authority as Other long-term assets in the Consolidated Balance Sheets at December 31, 2009 and 2008.
On April 8, 2009, the Company was notified that the AFIP had terminated the penalty procedures relating to amounts previously paid for the 2003 and 2004 income tax and 2005 withholding tax deficiencies due to the passage of Argentine National Law No. 26.476 (Tax Moratorium). However, the Company may still be subject to penalties and interest on a potential underpayment of taxes related to the 2005 withholding tax return. Also, based on the results of the completed audit discussed above, the Company may receive additional notices for assessments of additional income taxes, penalties, and interest related to the Company's 2005 and 2006 income tax returns and withholding taxes, penalties, and interest on payments made to the U.S. parent company to settle intercompany balances from June 2005 to December 2007.
Amounts paid in connection with the potential income and withholding tax deficiency would qualify for a foreign tax credit on LECG's U.S. tax return and would result in a deferred tax asset on LECG's Consolidated Balance Sheet, the realization of which would be dependent upon the ability to utilize the foreign tax credit within the ten-year expiration period. The Company believes that it properly reported these transactions in its Argentine tax returns and has assessed that its position in this matter will be sustained. Accordingly, the Company has not recognized any additional tax liability in connection with this matter at December 31, 2009.
91
LECG CORPORATION AND SUBSIDIARIES
NOTES TO CONSOLIDATED FINANCIAL STATEMENTS (Continued)
10. Income taxes (Continued)
The Company assessed that it had an unrecognized tax benefit of $3.8 million as of December 31, 2009, which if recognized, would impact the effective tax rate. A reconciliation of the beginning and ending amount of unrecognized tax benefits is as follows (in thousands):
| |
2009 | 2008 | 2007 | |||||||
|---|---|---|---|---|---|---|---|---|---|---|
Balance at January 1, |
$ | — | $ | — | $ | — | ||||
Additions based on tax positions related to the current year |
3,437 | — | — | |||||||
Additions for tax positions related to prior years |
317 | — | — | |||||||
Reductions for tax positions related to prior years |
— | — | — | |||||||
Balance at December 31, |
$ | 3,754 | $ | — | $ | — | ||||
The Company's policy is to recognize interest and penalties related to uncertain tax positions as a component of its provision for income taxes. As of December 31, 2009, the Company has not accrued any interest and penalties related to uncertain tax positions. The Company does not anticipate any material change to its gross unrecognized tax benefits balance within the next 12 months.
The Company files income tax returns in the United States and in various states, local and foreign jurisdictions. The Company's significant tax jurisdictions are the U.S. and California. The tax years subsequent to 2005 remain open to examination by the Internal Revenue Service. Generally, the tax years subsequent to 2004 remain open to examination by various state and local taxing authorities.
11. Retirement and deferred compensation plans
The Company has a 401(k) Plan under which all employees are immediately eligible. Company matching contributions are at the discretion of management and are recorded as compensation expense when contributed. The Company contributions vest 25% per year over the first four years of employment and then immediately thereafter. The Company contributed $0.7 million, $1.1 million and $1.4 million to the 401(k) Plan for 2009, 2008 and 2007, respectively.
The Company has a deferred compensation plan under which highly compensated employees are eligible to defer up to 15% of their bonuses, salary, expert fees and project origination fees and qualifying stock option gains. Employee deferrals are invested in a company-owned life insurance product through a trust. However, in accordance with IRS regulations, participant contributions represent unsecured obligations of the Company and the trust assets are first subject to the Company's secured creditor's claims. As of December 31, 2009, long-term assets totaled $10.0 million, which represents the cash surrender value of the company-owned insurance product, and long-term liabilities include $10.2 million of unsecured obligations to the plan participants. The Company recognized $0.3 million, $1.8 million and $0.2 million of charges primarily related to market fluctuations in the fair value of the deferred compensation plan investments for 2009, 2008, and 2007, respectively. The Company recognized the administrative expense of this deferred compensation plan of $0.4 million, $0.4 million and $0.3 million for 2009, 2008 and 2007, respectively. These charges are reflected in Other expense, net.
92
LECG CORPORATION AND SUBSIDIARIES
NOTES TO CONSOLIDATED FINANCIAL STATEMENTS (Continued)
12. Equity-based compensation
At December 31, 2009, the Company had the equity-based compensations plans described below. The following table summarizes equity-based compensation and its effect on direct costs, general and administrative expenses and earnings (in thousands):
| |
Year ended December 31, | |||||||||
|---|---|---|---|---|---|---|---|---|---|---|
| |
2009 | 2008 | 2007 | |||||||
Direct costs |
$ | 4,022 | $ | 4,019 | $ | 3,146 | ||||
General and administrative (benefit) expenses |
(55 | ) | 2,759 | 2,585 | ||||||
Equity-based compensation effect on earnings before income tax |
3,967 | 6,778 | 5,731 | |||||||
Income tax benefit |
(1,563 | ) | (2,704 | ) | (2,327 | ) | ||||
Equity-based compensation effect on earnings |
$ | 2,404 | $ | 4,074 | $ | 3,404 | ||||
For 2009, equity-based compensation expense is composed of $6.2 million of recurring equity-based compensation charges offset by approximately $2.8 million of stock-based compensation expense recovery related to previously recognized expense on the unvested portion of certain 7-year cliff vesting options of a terminated employee. Also included in equity-based compensation expense for 2009 is approximately $0.6 million of accelerated expense related to the voluntary surrender of stock options.
Employee Stock Purchase Plan
In November 2003, the Company adopted an Employee Stock Purchase Plan ("ESPP") under which eligible United States and New Zealand employees may purchase newly issued shares of common stock of the Company at a discount from the closing price of the stock. The purchase price is 95% of the closing price of the Company's common stock on the last day of the six-month offering periods, which end in April and October. The plan is non-compensatory under ASC 718. Employees pay for their shares of common stock through payroll deductions at a rate equal to any whole percentage from 1% to 15% of their gross wages. Under the ESPP, there were 10,869 common shares issued in April 2009 at a price of $2.76 per share and 2,968 common shares issued in October 2009 at a price of $3.28 per share. Cash received from the purchase of stock through the ESPP was $0.1 million, $0.1 million and $0.2 million in the years ended December 31, 2009, 2008 and 2007, respectively.
The board of directors authorized 950,000 shares of common stock for issuance under the ESPP, which also provides for annual increases in the number of shares available for issuance on the first day of each fiscal year, equal to the lesser of: (1) 1.5% of the outstanding shares of the Company's common stock on the first day of the fiscal year; (2) 500,000 shares; or (3) a lesser amount as determined by the board of directors. The Company issued 339,249 shares of common stock pursuant to the Purchase Plan through December 31, 2009, leaving 610,751 shares reserved for issuance.
Stock options
The Company has a 2003 Stock Option Plan (the "Plan"), amended and restated as of February 6, 2008, under which restricted stock, restricted stock units and stock options may be granted to employees, directors and consultants to purchase, in the aggregate, up to 6,387,000 common shares.
93
LECG CORPORATION AND SUBSIDIARIES
NOTES TO CONSOLIDATED FINANCIAL STATEMENTS (Continued)
12. Equity-based compensation (Continued)
The Plan provides for increases in the number of shares available for issuance on the first day of each calendar year, equal to the lesser of:
- •
- 4% of the outstanding shares of common stock on the first day of the fiscal year;
- •
- 1,250,000 shares; or
- •
- a lesser amount as may be determined by the board of directors.
As of December 31, 2009, 2,402,792 shares were available for grant under the Plan. The board of directors approved an increase in the Plan by an additional 1,022,000 shares in April 2009.
Options issued under the Plan have an exercise price equal to or, in certain cases, greater than the closing market price of the underlying stock on the date of grant. Vesting is based on service periods that range from date of grant to 9.5 years, with five and seven years being the most common. Options granted under the Plan expire ten years from the date of grant.
Black-Scholes assumptions
The fair value of each option award is estimated on the date of grant using the Black-Scholes option valuation model that employs the assumptions and inputs appearing in the table below. Certain inputs are presented as the range of values for that input used throughout the periods presented. Expected volatility is measured using the historical volatility of LECG's stock price from the time of its initial public offering in November 2003 through the option's grant date. The expected term is calculated using the Securities and Exchange Commission guidance in Staff Accounting Bulletin ('SAB") No. 110 amended SAB No. 107 that permits the application of a "simplified" method based on the average of the vesting term and the contractual term of the option. The expected dividend rate is 0%, as LECG expects that no dividends will be paid during the term of the options granted that are currently outstanding, and the risk-free interest rate is based on published yields on U.S. Treasury securities with maturities commensurate with the expected term of the option. For the year ended December 31, 2009, the annual forfeiture rate was estimated to be 2.5% based on the Company's qualitative and quantitative analysis of the Company's historical forfeitures. No options were granted in 2009. The assumptions used in calculating the fair value of options granted in 2008 and 2007 are as follows:
| |
Year ended December 31, | |||||
|---|---|---|---|---|---|---|
| |
2009 | 2008 | 2007 | |||
Expected volatility |
— | 37.8% - 44.9% | 37.4% - 38.6% | |||
Expected dividend rate |
— | 0% | 0% | |||
Expected term (in years) |
— | 5.5 - 7.0 | 5.0 - 7.0 | |||
Risk-free interest rate |
— | 3.2% - 3.5% | 3.8% - 4.9% | |||
94
LECG CORPORATION AND SUBSIDIARIES
NOTES TO CONSOLIDATED FINANCIAL STATEMENTS (Continued)
12. Equity-based compensation (Continued)
The following table summarizes option activity for the three years ended December 31, 2009:
| |
Shares | Weighted average exercise price |
Weighted average remaining contractual term |
Aggregate intrinsic value |
|||||||||
|---|---|---|---|---|---|---|---|---|---|---|---|---|---|
Outstanding at December 31, 2006 |
5,294,990 | $ | 16.54 | ||||||||||
Granted |
315,375 | $ | 15.82 | ||||||||||
Exercised |
(406,815 | ) | $ | 5.11 | |||||||||
Forfeited or canceled |
(535,551 | ) | $ | 18.68 | |||||||||
Outstanding at December 31, 2007 |
4,667,999 | $ | 17.24 | ||||||||||
Granted |
60,625 | $ | 9.87 | ||||||||||
Exercised |
(14,805 | ) | $ | 3.07 | |||||||||
Forfeited or canceled |
(415,092 | ) | $ | 17.01 | |||||||||
Outstanding at December 31, 2008 |
4,298,727 | $ | 17.21 | ||||||||||
Granted |
— | ||||||||||||
Exercised |
— | ||||||||||||
Forfeited or canceled |
(1,978,521 | ) | $ | 15.98 | |||||||||
Outstanding at December 31, 2009 |
2,320,206 | $ | 18.26 | 4.51 | $ | 0 | |||||||
Exercisable at December 31, 2009 |
1,251,802 | $ | 15.96 | 4.30 | $ | 0 | |||||||
Vested or expected to vest at December 31, 2009 |
2,196,396 | $ | 18.10 | 4.50 | $ | 0 | |||||||
The weighted average grant-date fair value of options granted during the years ended December 31, 2009, 2008 and 2007 was $0, $4.49 and $7.33, respectively. The total intrinsic value of options exercised during the years ended December 31, 2009, 2008 and 2007 was $0 million, $0.1 million and $3.4 million, respectively.
As of December 31, 2009, total unrecognized compensation cost related to non-vested options granted under the Plan was approximately $7.1 million, which is expected to be recognized over a weighted average period of 3.0 years.
Cash received from the exercise of options was $0 million, $0.1 million and $2.1 million for 2009, 2008 and 2007, respectively. The actual income tax benefit realized for the tax deduction from the exercise of options was $0 million, $0.1 million and $1.4 million for the years 2009, 2008 and 2007, respectively.
Restricted stock
Restricted stock awards are nonvested stock awards that may include grants of restricted stock or grants of restricted stock units. Restricted stock awards are generally subject to forfeiture if employment terminates prior to the release of the restrictions. Such awards generally vest over three to seven years from the date of grant. During that period, ownership of the shares cannot be transferred. Restricted stock has the same voting rights as other common stock and is considered to be currently issued and outstanding. Restricted stock units do not have the voting rights of common stock, and the shares underlying the restricted stock units are not considered issued and outstanding. LECG expenses
95
LECG CORPORATION AND SUBSIDIARIES
NOTES TO CONSOLIDATED FINANCIAL STATEMENTS (Continued)
12. Equity-based compensation (Continued)
the fair market value of restricted stock awards, as determined on the date of grant, on a straight-line basis over the vesting period.
The following table summarizes the Company's restricted stock and restricted stock unit activity during the three years ended December 31, 2009, 2008 and 2007:
| |
Shares | Weighted average grant date fair value |
|||||
|---|---|---|---|---|---|---|---|
Outstanding at December 31, 2006 |
140,625 | $ | 14.40 | ||||
Awards issued |
125,505 | $ | 16.75 | ||||
Awards vested and released |
(112,500 | ) | $ | 14.40 | |||
Awards forfeited |
(8,000 | ) | $ | 18.47 | |||
Outstanding at December 31, 2007 |
145,630 | $ | 16.20 | ||||
Awards issued |
1,657,128 | $ | 10.73 | ||||
Awards vested and released |
(58,455 | ) | $ | 15.39 | |||
Awards forfeited |
(93,000 | ) | $ | 18.47 | |||
Outstanding at December 31, 2008 |
1,651,303 | $ | 13.57 | ||||
Awards issued |
771,652 | $ | 3.63 | ||||
Awards vested and released |
(376,781 | ) | $ | 14.15 | |||
Awards forfeited |
(270,615 | ) | $ | 10.93 | |||
Outstanding at December 31, 2009 |
1,775,559 | $ | 13.20 | ||||
As of December 31, 2009, total unrecognized compensation cost related to restricted stock and restricted stock unit awards was $10.1 million. The cost is expected to be recognized over a weighted average period of 3.0 years. The total fair value of shares vested during the years ended December 31, 2009, 2008 and 2007 was $1.1 million, $0.4 million and $1.6 million, respectively.
The income tax benefit realized from vesting of restricted stock was $0.4 million, $0.2 million and $0.6 in 2009, 2008 and 2007 respectively.
Restricted stock unit award with market conditions
Effective September 2, 2008, the compensation committee of the Company's board of directors approved the issuance of 80,000 shares of restricted stock units to an executive officer. The fair value of this award was estimated on the date of grant to be $0.2 million which was expensed ratably from September 2008 to July 2009. Monte Carlo simulation model was used to determine the grant date fair value of this award. The award provided that the restricted stock units would vest in four increments based on the sustained attainment of four specified stock price targets. Vesting was to occur upon the second business day following the attainment of each of the specified closing stock price targets for a period of 10 consecutive business days. None of the restricted stock units vested prior to the expiration of the agreement on July 31, 2009.
96
LECG CORPORATION AND SUBSIDIARIES
NOTES TO CONSOLIDATED FINANCIAL STATEMENTS (Continued)
13. Earnings per share
Basic earnings per common share is computed by dividing the net income (loss) attributable to common stockholders for the period by the weighted average number of common shares outstanding during the period. Diluted earnings per common share is computed by dividing the net income attributable to common stockholders for the period by the weighted average number of common and common equivalent shares outstanding during the period. Common equivalent shares as determined by the treasury stock method are included in the diluted earnings per common share calculation to the extent these shares are dilutive. If the Company has a net loss for the period, common equivalent shares are excluded from the denominator because their effect on net loss would be antidilutive.
The following is a reconciliation of net (loss) income and the number of shares used in the basic and diluted earnings per share computations (in thousands, except per share data):
| |
Year ended December 31, | ||||||||||
|---|---|---|---|---|---|---|---|---|---|---|---|
| |
2009 | 2008 | 2007 | ||||||||
(Loss) income from continuing operations |
$ | (74,119 | ) | $ | (86,687 | ) | $ | 12,801 | |||
Loss from discontinued operations |
— | — | (1,441 | ) | |||||||
Net (loss) income |
$ | (74,119 | ) | $ | (86,687 | ) | $ | 11,360 | |||
Weighted average shares outstanding |
|||||||||||
Basic |
25,583 | 25,330 | 25,117 | ||||||||
Effect of dilutive stock options and unvested restricted stock |
— | — | 382 | ||||||||
Diluted |
25,583 | $ | 25,330 | $ | 25,499 | ||||||
Basic earnings per share: |
|||||||||||
(Loss) income from continuing operations |
$ | (2.90 | ) | $ | (3.42 | ) | $ | 0.51 | |||
Loss from discontinued operations |
— | — | (0.06 | ) | |||||||
Basic earnings per share |
$ | (2.90 | ) | $ | (3.42 | ) | $ | 0.45 | |||
Diluted earnings per share: |
|||||||||||
(Loss) income from continuing operations |
$ | (2.90 | ) | $ | (3.42 | ) | $ | 0.51 | |||
Loss from discontinued operations |
— | — | (0.06 | ) | |||||||
Diluted earnings per share |
$ | (2.90 | ) | $ | (3.42 | ) | $ | 0.45 | |||
For the years ended December 31, 2009, 2008 and 2007, outstanding options and unvested restricted stock to purchase 4.7 million, 4.7 million and 4.2 million common shares, respectively, were excluded from the calculation of diluted earnings per share calculation, because the exercise price of the options or the quoted market price of the Company's stock at the grant date over the amount the employee must pay to acquire the stock was greater than the average price of the Company's common stock. The dilutive impact of the remaining options outstanding and unvested restricted stock in these years was included in the effect of dilutive securities.
97
LECG CORPORATION AND SUBSIDIARIES
NOTES TO CONSOLIDATED FINANCIAL STATEMENTS (Continued)
14. Restructuring, divestiture and other asset impairment charges
Restructuring charges
During the second and third quarters of 2009, the Company executed restructuring actions intended to further rationalize its cost structure with current business and market conditions. These actions included a workforce reduction of 133 billable headcount and 41 administrative staff, as well as an adjustment to the compensation structure of 81 billable headcount and 39 administrative staff. The workforce reduction was mostly composed of involuntary terminations, but also included voluntary terminations that were not replaced. The Company also reduced office space in four locations during the third quarter of 2009. Net restructuring charges in 2009 totaled $5.7 million.
In the fourth quarter of 2008, the Company executed a number of restructuring actions intended to rationalize its cost structure with current business and market conditions. These actions included a workforce reduction of 35 billable headcount and 37 administrative staff and the closure of two offices. Net restructuring charges in 2008 totaled $5.9 million.
In February 2007, the board of directors approved an action program ("value recovery plan") intended to increase profitability and stockholder value. This value recovery plan included headcount reductions, based on the analysis of practice group and individual expert contribution margins, staff leverage, and the Company's strategic direction; increased controls over general and administrative expenditures, including office closures, more stringent acquisition evaluation, and professional staff and administrative staff headcount reductions through both attrition and involuntary terminations.
In connection with this value recovery plan, the Company terminated 121 billable headcount and seven administrative staff during 2007. The Company also closed seven offices and a computer facility during this same period. In connection with the terminations and office closures, the Company recognized a restructuring charge totaling $10.7 million.
Restructuring charges reflected in the Consolidated Statements of Operations for the years ended December 31, 2009, 2008 and 2007 were as follows (in thousands):
| |
Year ended December 31, | |||||||||
|---|---|---|---|---|---|---|---|---|---|---|
| |
2009 | 2008 | 2007 | |||||||
One-time termination benefits |
$ | 2,496 | $ | 3,211 | $ | 1,700 | ||||
Write-off of unearned signing and performance bonuses(1) |
975 | 2,338 | 3,668 | |||||||
Write-off of expert advances paid in excess of expert fees earned(1) |
262 | — | 3,813 | |||||||
Lease buyout and rent payments for office closure and other costs(2) |
1,925 | 888 | 1,508 | |||||||
Restructuring charge recovery |
— | (500 | ) | — | ||||||
Total |
$ | 5,658 | $ | 5,937 | $ | 10,689 | ||||
- (1)
- Represents
non-cash charges.
- (2)
- Includes non-cash (benefit) charges of ($0.1) million, $0.1 million and $0.2 million in 2009, 2008 and 2007, respectively.
98
LECG CORPORATION AND SUBSIDIARIES
NOTES TO CONSOLIDATED FINANCIAL STATEMENTS (Continued)
14. Restructuring, divestiture and other asset impairment charges (Continued)
Restructuring liability activity for the year ended December 31, 2009 and 2008 was as follows (in thousands):
| |
One-time termination benefits |
Lease termination costs |
Asset impairments and other |
Total | |||||||||
|---|---|---|---|---|---|---|---|---|---|---|---|---|---|
Liability at December 31, 2007 |
$ | 436 | $ | 1,037 | $ | — | $ | 1,473 | |||||
Restructuring charge recovery |
— | (500 | ) | — | (500 | ) | |||||||
Restructuring charges |
3,211 | 785 | 2,441 | 6,437 | |||||||||
Cash payments |
(1,576 | ) | (709 | ) | — | (2,285 | ) | ||||||
Write-off of assets |
— | — | (2,441 | ) | (2,441 | ) | |||||||
Foreign exchange translation |
(13 | ) | — | — | (13 | ) | |||||||
Liability at December 31, 2008 |
2,058 | 613 | — | 2,671 | |||||||||
Restructuring charge recovery |
— | — | — | — | |||||||||
Restructuring charges |
2,496 | 1,883 | 1,279 | 5,658 | |||||||||
Cash payments |
(4,515 | ) | (1,069 | ) | — | (5,584 | ) | ||||||
Write-off of assets |
(39 | ) | 178 | (1,279 | ) | (1,140 | ) | ||||||
Foreign exchange translation |
— | — | — | — | |||||||||
Liability at December 31, 2009 |
$ | — | $ | 1,605 | $ | — | $ | 1,605 | |||||
The restructuring charge recovery in 2008 relates to the changes in estimated costs of rent payments for a facility vacated in 2007. In September 2008, the Company sublet this facility earlier and on more favorable terms than originally estimated. As a result, the Company reversed the remaining $0.5 million of this restructuring liability to general and administrative expenses in 2008.
The estimated future cash outlays related to the restructuring liability at December 31, 2009 totaled approximately $1.6 million, which is expected to be substantially paid by the end of 2010.
Divestiture charges
In 2009, divestiture charges of $1.8 million included a loss on divestiture of the Company's Canadian practice of $1.7 million and $0.1 million of transaction costs related to the February 2009 divestiture of a portion of its practice in Milan, Italy.
On May 31, 2009, the Company executed a sales agreement to transfer most of the assets of its Canadian subsidiary, net of certain liabilities totaling $1.7 million, to a former employee for $0.6 million in cash. The Company paid severance to terminated Canadian employees and transaction costs totaling $0.7 million during 2009 which was recorded as divestiture charges. The cash flows from its Canadian practice were not material to the Company's consolidated revenues, gross profit, or results of operations.
The Company recognized a charge to operations of $3.1 million in 2008 in connection with the divestiture of a portion of its practice in Milan, Italy. This practice did not meet the definition of a component under ASC 360 and thus did not qualify for discontinued operations treatment in the Consolidated Statements of Operations. The transaction to sell the practice was completed in February 2009, however, as all significant terms of the sale were agreed to in December 2008, the Company recognized the divestiture as of December 31, 2008. Assets and liabilities were recorded at fair value
99
LECG CORPORATION AND SUBSIDIARIES
NOTES TO CONSOLIDATED FINANCIAL STATEMENTS (Continued)
14. Restructuring, divestiture and other asset impairment charges (Continued)
less selling costs, which resulted in a charge to operations of approximately $3.1 million in the quarter ended December 31, 2008. Net assets of approximately $0.5 million were written-off and a $2.6 million liability associated with the divestiture was recorded in the Consolidated Balance Sheet at December 31, 2008.
Other impairment charges
The Company recognized other non-cash impairment charges totaling $10.1 million in 2009, consisting of $5.9 million related to the write-off of employee receivables, $2.0 million related to certain prepaid costs which it considered unrecoverable, $1.4 million of net charges related to the write-off of certain client receivables, and $0.8 million related to other asset write-offs. The $1.4 million charge related to two specific client receivables that have been the subject of arbitration proceedings. The Company determined that these receivables were impaired based primarily on the length of time these amounts have been outstanding and the lack of favorable developments in the arbitration proceedings. The impairment charge represents the gross amount of these receivables, less anticipated recoveries from the at-risk experts who originally worked on these matters. These impairment charges are reflected as Other impairments in the Consolidated Statements of Operations for the year ended December 31, 2009.
The Company recognized other impairment charges in 2008 totaling $5.4 million: $4.0 million of the impairment charge was in connection with the customer relationships intangible asset, $0.5 million was due to the discontinued use of trade name intangible asset, $0.7 million was related to the expensing of certain prepaid costs which the Company considered unrecoverable, and $0.2 million was related to other asset write-offs. These impairment charges are reflected as Other impairments in the Consolidated Statements of Operations for the year ended December 31, 2008.
15. Discontinued operations
On December 31, 2007, the Company completed the sale of its wholly-owned subsidiary Silicon Valley Expert Witness Group, Inc. ("SVEWG") to a privately held company owned by the former majority shareholder of SVEWG, for $7.0 million, as follows:
- (i)
- $2.0 million
received in cash on December 31, 2007,
- (ii)
- assumption
of LECG's $2.0 million guaranteed purchase price liability owed in connection with LECG's purchase of SVEWG in August 2004, which would
have been due on August 1, 2009, and
- (iii)
- $3.0 million, 5-year note receivable with interest at the rate of 5.5% per year, and monthly principal and interest payments of approximately $57,000 beginning February 1, 2008 and ending January 1, 2013.
The Company had purchased all of the outstanding shares of SVEWG on August 1, 2004 for $9.0 million, $3.0 million of which represented a guaranteed amount to be paid no later than August 1, 2009. As a result of specified performance targets being met, the Company paid $1.0 million in 2005, and the remaining $2.0 million liability was assumed by the buyer on December 31, 2007.
SVEWG's net assets on December 31, 2007 totaled $9.2 million, comprised of cash of $0.9 million, accounts receivable of $1.9 million, goodwill of $7.9 million, fixed assets other current assets of
100
LECG CORPORATION AND SUBSIDIARIES
NOTES TO CONSOLIDATED FINANCIAL STATEMENTS (Continued)
15. Discontinued operations (Continued)
$0.1 million, and accounts payable, accrued compensation and deferred revenue of $1.6 million. The Company recognized a loss on the sale of SVEWG of $2.2 million. The Company has recorded a valuation allowance against the tax benefit of this loss totaling $0.9 million as the Company's ability to realize the benefit of the loss, which is a capital loss, is limited to offsetting future gains from the sale of capital assets. It is uncertain that the Company will be able to utilize the tax benefit within the carryforward period.
Financial data of SVEWG included in income from operations of discontinued subsidiary for all periods presented, is as follows (in thousands):
| |
Year ended December 31, 2007 |
|||
|---|---|---|---|---|
Revenues |
$ | 10,958 | ||
Income from operations of discontinued subsidiary before income taxes |
$ | 1,313 | ||
Income tax expense |
535 | |||
Income from operations of discontinued subsidiary, net of income taxes |
$ | 778 | ||
16. Segment reporting
In 2008, the Company reorganized its historical practice groups and individual experts into two operating segments: Economics Services and Finance and Accounting Services. Below is a description of the two operating segments and their components:
- •
- Energy and environment—provides expertise in the regulated
energy, environment and natural resources industries.
- •
- Global competition—offers a complete range of services on
antitrust matters, including mergers and acquisitions, before courts and regulatory authorities around the world. The services involve the use of economic and statistical techniques to develop
independent and objective analyses concerning issues related to merger reviews, monopolization claims, cartels, and quantification of damages. Experts in this area frequently testify before courts and
appear before competition authorities in many jurisdictions around the world.
- •
- Labor and employment—provides litigation support, independent
expert testimony, and business advisory services, including issues of statistical liability in discrimination, wrongful termination, and wage and hour claims.
- •
- Regulated industries—provides expertise in a broad range of
regulated industries, such as telecommunications, transportation and financial claims.
- •
- Securities—specializes in the study of capital markets. These leading financial economists conduct independent analyses in disputes involving allegations of securities fraud, valuation of complex securities, and capital market transactions such as mergers and acquisitions.
Economics Services segment is composed of energy and environment, global competition, labor and employment, regulated industries, and securities sectors as follows:
101
LECG CORPORATION AND SUBSIDIARIES
NOTES TO CONSOLIDATED FINANCIAL STATEMENTS (Continued)
16. Segment reporting (Continued)
- •
- Electronic discovery—provides direct collaboration with
outside counsel, general counsel, corporate executives, bank examiners, bankruptcy trustees, forensic accountants, fraud examiners, and damages experts to deliver objective advice and testimony in all
phases of the electronic discovery process including litigation preparedness, computer forensics and data analytics.
- •
- Financial services—provides banking advisory services to
leading financial service firms world wide, addressing regulatory compliance, tax, and dispute resolution, and provides representation before applicable regulatory authorities and assists clients in
regulatory compliance and SEC investigations and litigation.
- •
- Forensic accounting—provides a broad range of expertise in
accounting, auditing, computer forensics, regulatory (SEC), valuation, tax, and securities litigation, and offers a comprehensive mix of forensic accounting services, including internal
investigations, fraud investigations, and when necessary, expert witness testimony.
- •
- Healthcare—provides analyses and insight to clients
confronting the uncertain healthcare environment by advising clients in the development of strategies, designing and understanding policies, and responding to legal and regulatory challenges, and
offers a broad range of litigation support, management advisory, compliance, and expert testimony services.
- •
- Higher education—provides strategic advice and management
consulting to companies, universities, governments, and non-profit organizations with a focus on research and development and higher education.
- •
- Intellectual property—provides expertise in areas such as
capturing value from technological innovation and knowledge assets, estimating damages due to infringement or misappropriation, definition of markets and analyses of non-infringing
alternatives, transfer pricing valuation studies, and valuation of businesses, opportunities, and intangible assets.
- •
- International finance and accounting services—provides expert finance and accounting services to clients outside the United States, with particular emphasis on investigations, damages analysis and expert testimony in international arbitrations.
Finance and Accounting Services segment is composed of electronic discovery, financial services, forensic accounting, healthcare, higher education, intellectual property, and international finance and accounting services sectors as follows:
All segment revenues are generated from external clients and there are no intersegment revenues or expenses. The Company does not allocate general and administrative operating expenses to its two segments.
The 2007 historical segment revenues, costs of services and other operational data presented in the table below have been recast as if the current management and reporting structure had been in place since the beginning of each period presented. Since the Company historically measured its business performance at a consolidated entity level and made resource allocations differently under that structure, the recasting of historical segment information is not intended to predict future results or to represent the actual results that would have been achieved if the Company's business had been managed under the current structure since the beginning of each period presented.
102
LECG CORPORATION AND SUBSIDIARIES
NOTES TO CONSOLIDATED FINANCIAL STATEMENTS (Continued)
16. Segment reporting (Continued)
Summarized financial information by segment for the 2009, 2008 and 2007 is as follows (in thousands, except percentages):
| |
Year ended December 31, | ||||||||||||||||||||||||||||
|---|---|---|---|---|---|---|---|---|---|---|---|---|---|---|---|---|---|---|---|---|---|---|---|---|---|---|---|---|---|
| |
2009 | 2008 | 2007 | ||||||||||||||||||||||||||
| |
Economics | Finance and Accounting |
Total | Economics | Finance and Accounting |
Total | Economics | Finance and Accounting |
Total | ||||||||||||||||||||
Fee-based revenues, net |
$ | 106,186 | $ | 147,190 | $ | 253,376 | $ | 142,295 | $ | 180,419 | $ | 322,714 | $ | 151,926 | $ | 199,618 | $ | 351,544 | |||||||||||
Reimbursable revenues |
3,223 | 6,597 | 9,820 | 4,490 | 8,475 | 12,965 | 5,985 | 12,900 | 18,885 | ||||||||||||||||||||
Revenues |
109,409 | 153,787 | 263,196 | 146,785 | 188,894 | 335,679 | 157,911 | 212,518 | 370,429 | ||||||||||||||||||||
Direct costs |
75,945 | 112,374 | 188,319 | 95,546 | 125,930 | 221,476 | 101,914 | 126,155 | 228,069 | ||||||||||||||||||||
Reimbursable costs |
3,390 | 6,773 | 10,163 | 4,970 | 8,369 | 13,339 | 5,853 | 12,704 | 18,557 | ||||||||||||||||||||
Cost of services |
79,335 | 119,147 | 198,482 | 100,516 | 134,299 | 234,815 | 107,767 | 138,859 | 246,626 | ||||||||||||||||||||
Gross profit |
$ | 30,074 | $ | 34,640 | 64,714 | $ | 46,269 | $ | 54,595 | 100,864 | $ | 50,144 | $ | 73,659 | 123,803 | ||||||||||||||
Gross margin |
27.5 | % | 22.5 | % | 24.6 | % | 31.5 | % | 28.9 | % | 30.0 | % | 31.8 | % | 34.7 | % | 33.4 | % | |||||||||||
Charges not allocated at the segment level: |
|||||||||||||||||||||||||||||
General and administrative expenses |
73,258 | 88,021 | 83,901 | ||||||||||||||||||||||||||
Depreciation and amortization |
4,997 | 5,939 | 7,284 | ||||||||||||||||||||||||||
Goodwill impairment |
— | 118,800 | — | ||||||||||||||||||||||||||
Other impairments |
10,071 | 5,358 | — | ||||||||||||||||||||||||||
Restructuring charges |
5,659 | 5,937 | 10,689 | ||||||||||||||||||||||||||
Divestiture charges |
1,800 | 3,136 | — | ||||||||||||||||||||||||||
Interest income |
(160 | ) | (445 | ) | (635 | ) | |||||||||||||||||||||||
Interest expense |
2,680 | 636 | 508 | ||||||||||||||||||||||||||
Other expense, net |
571 | 1,849 | 502 | ||||||||||||||||||||||||||
(Loss) income before income taxes |
$ | (34,162 | ) | $ | (128,367 | ) | $ | 21,554 | |||||||||||||||||||||
While the Company does not record assets at the segment level, realization allowance reserve charges and signing, retention and performance bonus amortization are included in the direct costs of each segment. As such, accounts receivable and signing, retention and performance bonus assets are reflected in segment assets in the table below. Goodwill is not used by management in assessing segment performance. Goodwill is assigned to each segment for impairment testing purposes only, and therefore is reflected in unallocated assets in the table below. See "Note 4—Goodwill" for a discussion of goodwill assignment for impairment testing purposes and reporting unit determination. The following table presents total assets by segment and reconciles these segment assets to total Company assets (in thousands):
| |
December 31, | |||||||
|---|---|---|---|---|---|---|---|---|
| |
2009 | 2008 | ||||||
Economics |
$ | 45,339 | $ | 62,178 | ||||
Finance and Accounting |
74,249 | 74,906 | ||||||
Unallocated assets |
71,223 | 119,123 | ||||||
Total assets |
$ | 190,811 | $ | 256,207 | ||||
103
LECG CORPORATION AND SUBSIDIARIES
NOTES TO CONSOLIDATED FINANCIAL STATEMENTS (Continued)
16. Segment reporting (Continued)
No single client generated more than 10% of the Company's consolidated revenues during 2009, 2008 and 2007. The Company's ten largest clients represented 14%, 13% and 18% of its revenues in 2009, 2008 and 2007, respectively. Revenues attributable to geographic location are as follows (in thousands):
| |
Year ended December 31, | ||||||||||
|---|---|---|---|---|---|---|---|---|---|---|---|
| |
2009 | 2008 | 2007 | ||||||||
United States |
$ | 213,276 | $ | 260,118 | $ | 306,999 | |||||
United Kingdom |
21,487 | 37,928 | 33,913 | ||||||||
All other foreign countries |
28,433 | 37,633 | 29,517 | ||||||||
Total revenues |
$ | 263,196 | $ | 335,679 | $ | 370,429 | |||||
The Company's accounts receivable base consists of a broad range of clients in a variety of industries located throughout the United States and in other countries. The Company has not required collateral or other security from its clients. At December 31, 2009 and 2008, no single client's total receivables balance represented more than 10% of the Company's total receivables balances.
Long-lived assets attributable to geographic location are as follows (in thousands):
| |
December 31, | |||||||
|---|---|---|---|---|---|---|---|---|
| |
2009 | 2008 | ||||||
United States |
$ | 48,528 | $ | 94,869 | ||||
All other foreign countries |
9,056 | 8,678 | ||||||
Total long-lived assets |
$ | 57,584 | $ | 103,547 | ||||
17. Related party transactions
In prior periods, the Company entered into expert agreements with David J. Teece, Vice Chairman and Richard Boulton, member of the Company's board of directors. Their tenure as board members expired on December 22, 2009. The following payments were made while these individuals were directors under their respective expert agreements during the years ended December 31, 2009, 2008 and 2007 (in thousands):
| |
Year ended December 31, | |||||||||
|---|---|---|---|---|---|---|---|---|---|---|
| |
2009 | 2008 | 2007 | |||||||
David J. Teece |
$ | 1,877 | $ | 9,471 | $ | 7,765 | ||||
Richard Boulton(1) |
2,582 | 1,544 | NA | |||||||
- (1)
- Elected to the Company's Board on October 27, 2008.
In November 2007, the Company entered into an employment agreement with Dr. Teece, under which the Company paid to Dr. Teece a retention bonus of $10.0 million ($5.0 million was paid in November 2007 and $5.0 million was paid in January 2008). In August 2009, the Company terminated Dr. Teece's employment with the Company as a result of good faith differences of opinion regarding business strategy and the future direction of the Company, which were unrelated to his performance as
104
LECG CORPORATION AND SUBSIDIARIES
NOTES TO CONSOLIDATED FINANCIAL STATEMENTS (Continued)
17. Related party transactions (Continued)
an expert. At the time the Company terminated Dr. Teece's employment, $7.6 million of the $10.0 million retention bonus had not been amortized. In January 2010, Dr. Teece and the Company entered a separation agreement and mutual release, and also entered into a non-exclusive independent contractor affiliate agreement that will allow Dr. Teece and the Company to continue working together on matters of shared interest. As part of this affiliate agreement, Dr. Teece agreed to engage the Company on projects that will provide the Company with $7.5 million of revenue over a five year period, with minimum agreed upon profit margins. To the extent the revenue and margin targets are not achieved within the five years, Dr. Teece will pay to the Company the amount of any margin shortfall. In connection with the settlement agreement and the affiliate agreement between the Company and Dr. Teece, the Company wrote off $4.6 million of the unamortized retention bonus as an Other impairment charge in the third quarter of 2009 and reclassified the remaining $3.0 million from Signing, retention and performance bonuses to Other assets.
18. Subsequent event—SMART merger and term loan facility
On March 10, 2010, the Company completed its merger with SMART Business Holdings, Inc. ("SMART"), a privately held provider of business advisory services (the "Merger"), and received a $25.0 million cash investment from SMART's majority shareholder, Great Hill Equity Partners III, LP. In the Merger transaction, LECG acquired 100% of SMART's outstanding stock, in exchange for which the Company issued 10,927,869 shares of LECG common stock, having an estimated value of approximately $33.3 million based on the March 10, 2010 closing stock price of $3.05, and assumed approximately $42.8 million of SMART debt. Simultaneously with the consummation of the Merger, SMART's majority shareholder, Great Hill Equity Partners III, LP, made a $25.0 million cash investment into LECG in exchange for 6,313,131 shares of Series A Convertible Redeemable Preferred Stock. This stock is convertible share-for-share into LECG's common stock (equivalent to a price of $3.96 per share), and provides a 7.5% dividend payable in cash or Series A Convertible Redeemable Preferred Stock at the Company's discretion. As a result of the issuance of the common stock and Series A Convertible Redeemable Preferred Stock, Great Hill Equity Partners III, LP owns approximately 40% of the Company's outstanding voting shares. The combined entity will operate under the LECG name and continue as a publicly-traded company.
The Merger will be accounted for under the purchase method of accounting. Assets acquired and liabilities assumed will be recorded at their fair values as of the closing date. The total estimated purchase price is $76.1 million, excluding the estimated acquisition-related transaction costs of approximately $6.0 million. Acquisition-related transaction costs include fees for legal, financial advisory, accounting, due diligence, tax, valuation, printing and other various services in connection with the transaction. Under the purchase method of accounting, the total estimated purchase price will be allocated to SMART's net tangible assets acquired and liabilities assumed and intangible assets based on their estimated fair values. The excess of the purchase price over the net tangible assets acquired and liabilities assumed and identifiable intangible assets will be recorded as goodwill. Due to the timing of the close of the transaction, the preparation of the final balance sheet and valuation work related to the identifiable intangible assets is currently in process, and consequently, the initial accounting for the assets acquired and liabilities assumed in the SMART acquisition is incomplete.
The following summarized pro forma consolidated revenues and net loss are presented as if the Merger with SMART had occurred on January 1, 2008 and 2009. The pro forma net loss does not reflect adjustments for SMART's historical intangible asset amortization, or the future intangible asset
105
LECG CORPORATION AND SUBSIDIARIES
NOTES TO CONSOLIDATED FINANCIAL STATEMENTS (Continued)
18. Subsequent event—SMART merger and term loan facility (Continued)
amortization, as the valuation work related to the acquired intangibles is incomplete. The unaudited results are not necessarily indicative of future earnings or earnings that would have been reported had the Merger been completed as presented (in thousands, except per share amounts):
| |
UNAUDITED Year ended December 31, |
||||||
|---|---|---|---|---|---|---|---|
| |
2009 | 2008 | |||||
Revenues—pro forma |
$ | 362,145 | $ | 439,469 | |||
Net loss—pro forma |
$ |
(80,923 |
) |
$ |
(137,957 |
) |
|
Term loan facility
Concurrent with the closing of the SMART Merger, the Company entered into a Sixth Amendment to Credit Agreement and Consent (the "Amendment") and became a co-borrower with SMART Business Advisory and Consulting, LLC under a Credit Agreement with the Bank of Montreal ("BMO") and the syndicate bank members. The Amendment provides for a $40.8 million term loan which is guaranteed by LECG Corporation and its domestic subsidiaries. The Amendment also allows us to seek up to an additional $10.0 million of subordinated debt, subject to certain repayment and maturity restrictions. The term loan matures on March 31, 2011 and required a $4.0 million principal payment at closing (March 10, 2010), and subsequent quarterly principal payments of $3.0 million beginning on June 30, 2010 through December 31, 2010. The remaining outstanding principal is due in full on March 31, 2011. Interest is payable quarterly at a rate consisting of the Base Rate plus 6.50%. The Base Rate is defined as the greater of (i) three percent, (ii) BMO's prevailing prime commercial rate, (iii) the Federal Funds rate plus 0.5%, or (iv) LIBOR plus 1.5%. The current interest rate in effect as of the date of the Amendment was 9.75%. The Company paid approximately $0.2 million in fees related to this Amendment, which will be amortized over the remaining term of the Amendment.
The Amendment contains non-financial and financial covenants, including a total funded debt to EBITDA ratio, a minimum fixed charge ratio, maximum rental and capital expenditures, and minimum quarterly EBITDA and cash balance requirements. Also, cash balances in excess of certain amounts at each quarter-end must be used to make additional principal payments. Maintaining compliance with the Company's debt covenants is critical to the Company's operations. The current economic downturn adds uncertainty to the Company's anticipated revenue levels, as seen by declines in the Company's revenue during the third and fourth quarters of 2008, and again in the first and third quarters of 2009. The Company has executed a number of restructuring actions in response to these revenue declines. Should revenue declines continue or other unforeseen adverse developments occur, the Company would seek to remain in compliance with the debt covenants through further restructuring actions.
106
LECG CORPORATION AND SUBSIDIARIES
FINANCIAL INFORMATION BY QUARTER
(UNAUDITED)
The following table presents unaudited quarterly Consolidated Statement of Operations data for the years ended December 31, 2009 and 2008. In management's opinion, this information has been prepared on the same basis as the audited consolidated financial statements and includes all adjustments, consisting only of normal recurring adjustments necessary for the fair statement of the unaudited information in the periods presented. This information should be read in conjunction with the consolidated financial statements and related notes included under this Item 8 and in conjunction with other financial information included elsewhere in this Annual Report on Form 10-K. The results of operations for any quarter are not necessarily indicative of results that may be expected for any future periods.
| |
Three months ended, | |||||||||||||
|---|---|---|---|---|---|---|---|---|---|---|---|---|---|---|
| |
March 31 | June 30 | September 30 | December 31 | ||||||||||
| |
(in thousands, except per share data) |
|||||||||||||
Fiscal year 2009 |
||||||||||||||
Revenues |
$ | 66,305 | $ | 67,869 | $ | 62,723 | $ | 66,299 | ||||||
Gross profit |
14,148 | 17,107 | 15,095 | 18,364 | ||||||||||
Operating loss(1) |
(6,077 | ) | (7,304 | ) | (16,524 | ) | (1,166 | ) | ||||||
Loss before income taxes(1) |
(6,434 | ) | (8,261 | ) | (17,286 | ) | (2,181 | ) | ||||||
Net (loss) income |
$ | (3,796 | ) | $ | (6,454 | ) | $ | (64,679 | ) | $ | 810 | |||
Earnings per share(3): |
||||||||||||||
Basic |
$ | (0.15 | ) | $ | (0.25 | ) | $ | (2.52 | ) | $ | 0.04 | |||
Diluted |
$ | (0.15 | ) | $ | (0.25 | ) | $ | (2.52 | ) | $ | 0.03 | |||
Fiscal year 2008 |
||||||||||||||
Revenues |
$ | 90,502 | $ | 89,079 | $ | 86,050 | $ | 70,048 | ||||||
Gross profit |
30,019 | 28,203 | 27,411 | 15,231 | ||||||||||
Operating income (loss)(2) |
7,183 | 4,612 | 4,082 | (142,204 | ) | |||||||||
Income (loss) from continuing operations before income taxes(2) |
6,709 | 4,395 | 3,357 | (142,828 | ) | |||||||||
Net income (loss) |
$ | 3,985 | $ | 2,611 | $ | 1,995 | $ | (95,278 | ) | |||||
Earnings per share(3): |
||||||||||||||
Basic |
$ | 0.16 | $ | 0.10 | $ | 0.08 | $ | (3.76 | ) | |||||
Diluted |
$ | 0.16 | $ | 0.10 | $ | 0.08 | $ | (3.76 | ) | |||||
- (1)
- The
Company's operating loss and loss before income taxes were reduced by other impairments of $1.2 million, $8.7 million, and
$0.2 million; restructuring charges of $1.5 million, $4.0 million and $0.2 million; and divestiture charges of $1.7 million, $0.1 million and $0 during the
second, third and fourth quarters of 2009, respectively.
- (2)
- The
Company's operating income (loss) and income (loss) before income taxes were reduced by goodwill impairment charges of $118.8 million, other
impairments of $5.4 million, restructuring charges of $6.4 million and divestiture charges of $3.1 million during the fourth quarter of 2008, and were increased by a
$0.5 million restructuring benefit recognized in the third quarter of 2008.
- (3)
- Quarterly earnings per share amounts may not total the full year earnings per share amounts due to rounding.
107
ITEM 9. CHANGES IN AND DISAGREEMENTS WITH ACCOUNTANTS ON ACCOUNTING AND FINANCIAL DISCLOSURE
None.
ITEM 9A. CONTROLS AND PROCEDURES
Evaluation of disclosure controls and procedures
Our management, with the participation of our Chief Executive Officer and our Chief Financial Officer, evaluated the effectiveness of our disclosure controls and procedures (as defined in Rule 13a-15(e) under the Securities Exchange Act of 1934) as of the end of the period covered by this Annual Report on Form 10-K. Disclosure controls and procedures are designed to reasonably assure that information required to be disclosed in our reports filed under the Exchange Act, such as this Form 10-K, is recorded, processed, summarized and reported within the time periods specified in the rules and forms of the U.S. Securities and Exchange Commission (SEC). Disclosure controls and procedures are also designed to reasonably assure that such information is accumulated and communicated to our management, including our Chief Executive Officer and Chief Financial Officer, as appropriate to allow timely decisions regarding required disclosure. Based on this evaluation, our Chief Executive Officer and our Chief Financial Officer concluded that as of December 31, 2009, our disclosure controls and procedures were effective.
It should be noted that any system of controls, however well designed and operated, can provide only reasonable, and not absolute, assurance that the objectives of the system will be met. In addition, the design of any control system is based in part upon certain assumptions about the likelihood of future events.
Quarterly evaluation of changes in internal controls over financial reporting
Our management, with the participation of our Chief Executive Officer and Chief Financial Officer, also conducted an evaluation of our internal control over financial reporting to determine whether any change occurred during the fourth quarter of 2009 that has materially affected, or is reasonably likely to materially affect, our internal control over financial reporting. Our management concluded that there was no such change in our internal control over financial reporting that occurred during the quarter ended December 31, 2009 that has materially affected, or is reasonably likely to materially affect, our internal control over financial reporting.
Management annual report on internal control over financial reporting
Our management is responsible for establishing and maintaining adequate internal control over financial reporting as defined in Rule 13a-15(f) under the Securities Exchange Act of 1934. The Company's internal control over financial reporting is designed to provide reasonable assurance regarding the reliability of financial reporting and the preparation of consolidated financial statements for external purposes in accordance with accounting principles generally accepted in the United States of America. Internal control over financial reporting includes those policies and procedures that (i) pertain to the maintenance of records that in reasonable detail accurately and fairly reflect the transactions and dispositions of the assets of the company; (ii) provide reasonable assurance that transactions are recorded as necessary to permit preparation of consolidated financial statements in accordance with generally accepted accounting principles, and that receipts and expenditures of the company are being made only in accordance with authorizations of management and directors of the company; and (iii) provide reasonable assurance regarding prevention or timely detection of unauthorized acquisition, use or disposition of the company's assets that could have a material effect on the consolidated financial statements.
An internal control system over financial reporting has inherent limitations and may not prevent or detect misstatements. Therefore, even those systems determined to be effective can provide only
108
reasonable assurance with respect to financial statement preparation and presentation. In addition, projections of any evaluation of effectiveness to future periods are subject to the risk that controls may become inadequate because of changes in conditions and that the degree of compliance with the policies or procedures may deteriorate.
The management of the Company, with the participation of our Chief Executive Officer and our Chief Financial Officer, evaluated the effectiveness of our internal control over financial reporting as of December 31, 2009. Management based its assessment on criteria established in Internal Control—Integrated Framework issued by the Committee of Sponsoring Organizations of the Treadway Commission. Management's assessment included evaluation of such elements as the design and operating effectiveness of key financial reporting controls, process documentation, accounting policies, and our overall control environment. This assessment is supported by testing and monitoring performed by members of our Accounting, Finance and Information Services organizations, assisted by outside consulting services specializing in internal control testing. Based on this assessment, our management concluded that our internal control over financial reporting was effective as of December 31, 2009.
Our internal control over financial reporting as of December 31, 2009 has also been audited by Deloitte & Touche LLP, an independent registered public accounting firm, and their opinion as to the effectiveness of our internal control over financial reporting is stated in their report which is included in Item 8 in this Annual Report on Form 10-K.
Annual Meeting Results
Our annual meeting of stockholders was held on December 22, 2009 to consider and vote upon several matters. The first matter related to the approval of Merger of SMART Business Holdings, Inc. with and into a wholly-owned subsidiary of LECG and the issuance of 10,927,869 shares of LECG common stock pursuant thereto. 16,361,834 votes were cast for ratification, 4,201,898 were cast against, and there were 4,140 abstentions.
The second matter related to the approval of the issuance to and purchase by the Great Hill Entities of 6,313,131 shares of LECG Series A Convertible Redeemable Preferred Stock pursuant to the Stock Purchase Agreement, dated as of August 17, 2009. 16,361,436 votes were cast for ratification, 4,202,038 were cast against, and there were 4,398 abstentions.
The third matter related to the approval of the Second Amended and Restated Certificate of Incorporation of LECG. 16,167,872 votes were cast for ratification, 4,395,798 were cast against, and there were 4,202 abstentions.
The fourth matter related to the election of seven director nominees, Garrett F. Bouton, Alison Davis, Ruth M. Richardson, Michaels E. Dunn, Christopher S, Gaffney, John G. Hayes and Steve Samek, to serve a one-year term or until their respective successors are duly elected and qualified. The votes cast and withheld for such nominees were as follows:
Name
|
For | Withheld | |||||
|---|---|---|---|---|---|---|---|
Garrett F. Bouton |
18,805,586 | 4,431,898 | |||||
Alison Davis |
18,756,399 | 4,481,085 | |||||
Ruth M. Richardson |
18,389,564 | 4,847,920 | |||||
Michael E. Dunn |
19,226,941 | 4,010,543 | |||||
Christopher S. Gaffney |
19,248,126 | 3,989,358 | |||||
John G. Hayes |
19,249,326 | 3,988,158 | |||||
Steve Samek |
19,240,599 | 3,996,885 | |||||
109